UNITED STATES
SECURITIES AND EXCHANGE COMMISSION
WASHINGTON, D.C. 20549
FORM 10-K
(Mark One)
☒ ANNUAL REPORT PURSUANT TO SECTION 13 OR 15(d) OF THE SECURITIES EXCHANGE ACT OF 1934
For the Fiscal Year Ended December 31, 2018
OR
☐ TRANSITION REPORT PURSUANT TO SECTION 13 OR 15(d) OF THE SECURITIES EXCHANGE ACT OF 1934
Commission File No. 001-38081
|
Liberty Oilfield Services Inc.
|
|
|
(Exact name of registrant as specified in its charter)
|
|
|
Delaware
|
81-4891595
|
|
(State or other jurisdiction of
incorporation or organization)
|
(I.R.S. Employer
Identification No.)
|
|
950 17
th
Street, Suite 2400
Denver, Colorado 80202
|
80202
|
|
(Address of Principal Executive Offices)
|
(Zip Code)
|
|
(303) 515-2800
(Registrant’s telephone number, including area code)
Securities registered pursuant to Section 12(b) of the Act:
|
|
|
Title of each class
Class A Common Stock, par value $0.01 per share
|
Name of each exchange on which registered
New York Stock Exchange
|
Securities registered pursuant to Section 12(g) of the Act: None
Indicate by check mark if the registrant is a well-known seasoned issuer, as defined in Rule 405 of the Securities Act.
☒ Yes
☐ No
Indicate by check mark if the registrant is not required to file reports pursuant to Section 13 or Section 15(d) of the Act. ☐ Yes
☒ No
Indicate by check mark whether the registrant (1) has filed all reports to be filed by Section 13 or 15(d) of the Securities Exchange Act of 1934 during the preceding 12 months (or for such shorter period that the registrant was required to file such reports), and (2) has been subject to such filing requirements for the past 90 days.
☒
Yes
☐
No
Indicate by check mark whether the registrant has submitted electronically, every Interactive Data File required to be submitted pursuant to Rule 405 of Regulation S-T (§232.405 of this Chapter) during the presiding 12 months (or for such shorter period that the registrant was required to submit and post such files).
☒
Yes
☐
No
Indicate by check mark if disclosure of delinquent filers pursuant to Item 405 of Regulation S-K is not contained herein, and will not be contained, to the best of Registrant’s knowledge, in definitive proxy or information statements incorporated by reference in Part III of this Form 10-K or any amendment to this Form 10-K.
☐
Indicate by check mark whether the registrant is a large accelerated filer, an accelerated filer, a non-accelerated filer, or a smaller reporting company. See the definitions of “large accelerated filer,” “accelerated filer” and “smaller reporting company” in Rule 12b-2 of the Exchange Act.
|
Large accelerated filer ☐
|
Accelerated filer ☐
|
Non-accelerated filer ☒
|
Smaller reporting company ☐
|
Emerging growth company ☐
(Do not check if a smaller reporting company)
If an emerging growth company, indicate by check mark if the registrant has elected not to use the extended transition period for complying with any new or revised financial accounting standards provided pursuant to Section 13(a) of the Exchange Act. ☐
Indicate by check mark whether the registrant is a shell company (as defined in Rule 12b-2 of the Act): ☐ Yes ☒ No
As of June 29, 2018, the last business day of the registrant
’
s most recently completed second fiscal quarter, the aggregate market value of voting and non-voting common stock held by non-affiliates of the registrant was approximately $780.0 million, determined using the per share closing price on the New York Stock Exchange on that date of $18.72. Shares of common stock held by each director and executive officer (and their respective affiliates) and each person who owns 10 percent or more of the outstanding common stock or who is otherwise believed by the registrant to be in a control position have been excluded. This determination of affiliate status is not necessarily a conclusive determination for other purposes.
At February 26, 2019, the Registrant had
68,741,273
shares of Class A Common Stock and
43,572,803
shares of Class B Common Stock outstanding.
Documents Incorporated by Reference: Part III of this Annual Report on Form 10-K incorporates certain information by reference from the registrant
’
s proxy statement for the 2019 annual meeting of stockholders to be filed no later than 120 days after the end of the registrant
’
s fiscal year.
TABLE OF CONTENTS
|
Page No.
|
||
|
Item 1.
|
||
|
Item 1A.
|
||
|
Item 1B.
|
||
|
Item 2.
|
||
|
Item 3.
|
||
|
Item 4.
|
||
|
Item 5.
|
||
|
Item 6.
|
||
|
Item 7.
|
||
|
Item 7A.
|
||
|
Item 8.
|
||
|
Item 9.
|
||
|
Item 9A.
|
||
|
Item 9B.
|
||
|
Item 10.
|
||
|
Item 11.
|
||
|
Item 12.
|
||
|
Item 13.
|
||
|
Item 14.
|
||
|
Item 15.
|
||
|
Item 16.
|
||
i
CAUTIONARY NOTE REGARDING FORWARD-LOOKING STATEMENTS
This Annual Report on Form 10-K and certain other communications made by us contain forward-looking statements within the meaning of Section 27A of the Securities Act of 1933, as amended (the “Securities Act”), and Section 21E of the Securities Exchange of 1934, as amended (the “Exchange Act”), including statements about our growth, future operating results, estimates, beliefs and expected performance. For this purpose, any statement that is not a statement of historical fact should be considered a forward-looking statement. We may use the words “believe,” “anticipate,” “plan,” “expect,” “intend,” “may,” “will,” “should” and similar expressions to help identify forward-looking statements. We cannot assure you that our assumptions and expectations will prove to be correct. Important factors could cause our actual results to differ materially from those indicated or implied by forward-looking statements. We undertake no intention or obligation to update or revise any forward-looking statements, whether as a result of new information, future events or otherwise and readers should not rely on the forward-looking statements as representing the Company’s views as of any date subsequent to the date of the filing of this Annual Report on Form 10-K. These forward-looking statements are based on management’s current belief, based on currently available information, as to the outcome and timing of future events.
Forward-looking statements may include statements about:
|
•
|
our business strategy;
|
|
•
|
our operating cash flows, the availability of capital and our liquidity;
|
|
•
|
our future revenue, income and operating performance;
|
|
•
|
our ability to sustain and improve our utilization, revenue and margins;
|
|
•
|
our ability to maintain acceptable pricing for our services;
|
|
•
|
our future capital expenditures;
|
|
•
|
our ability to finance equipment, working capital and capital expenditures;
|
|
•
|
competition and government regulations;
|
|
•
|
our ability to obtain permits and governmental approvals;
|
|
•
|
pending legal or environmental matters;
|
|
•
|
oil and natural gas prices;
|
|
•
|
acquisitions;
|
|
•
|
general economic conditions;
|
|
•
|
credit markets;
|
|
•
|
our ability to successfully develop our research and technology capabilities and implement technological developments and enhancements;
|
|
•
|
uncertainty regarding our future operating results;
|
|
•
|
return of capital to shareholders; and
|
|
•
|
plans, objectives, expectations and intentions contained in this Annual Report on Form 10-K that are not historical.
|
We caution you that these forward-looking statements are subject to all of the risks and uncertainties, most of which are difficult to predict and many of which are beyond our control. These risks include, but are not limited to, decline in demand for our services, the cyclical nature and volatility of the oil and natural gas industry, a decline in, or substantial volatility of, crude oil and natural gas commodity prices, environmental risks, regulatory changes, the inability to comply with the financial and other covenants and metrics in our Credit Facilities (as defined herein), cash flow and access to capital, the timing of development expenditures and the other risks described under “Risk Factors” in this Annual Report on Form 10-K.
All forward-looking statements, expressed or implied, included in this Annual Report on Form 10-K are expressly qualified in their entirety by this cautionary statement. This cautionary statement should also be considered in connection with any subsequent written or oral forward-looking statements that we or persons acting on our behalf may issue.
This Annual Report on Form 10-K includes market and industry data and certain other statistical information based on third-party sources including independent industry publications, government publications and other publish independent sources, such as content and estimates provided by Coras Research, LLC as of December 31, 2018. Coras Research, LLC is not a member of the FINRA or the SIPC and is not a registered broker dealer or investment advisor. Although we believe these third-party sources are reliable as of their respective dates, we have not independently verified the accuracy or completeness of this information. Some data is also based on our own good faith estimates, which are supported by our management's knowledge of and experience in the markets and business in which we operate.
ii
PART I
As used in this Annual Report on Form 10-K, unless the context otherwise requires, references to the term “Liberty Inc.” refers to Liberty Oilfield Services Inc. and references to the terms “Company,” “we,” “us” and “our” refer to, collectively, Liberty Oilfield Services LLC and LOS Acquisition Co I LLC and its subsidiaries (collectively, the “Predecessor”) for periods prior to the IPO (as defined herein), and, for periods as of and following the IPO, Liberty Inc. and its consolidated subsidiaries. References to “Liberty LLC” refer to Liberty Oilfield Services New HoldCo LLC. References to “Liberty Holdings” refer to Liberty Oilfield Services Holdings LLC.
Item 1. Business
Overview
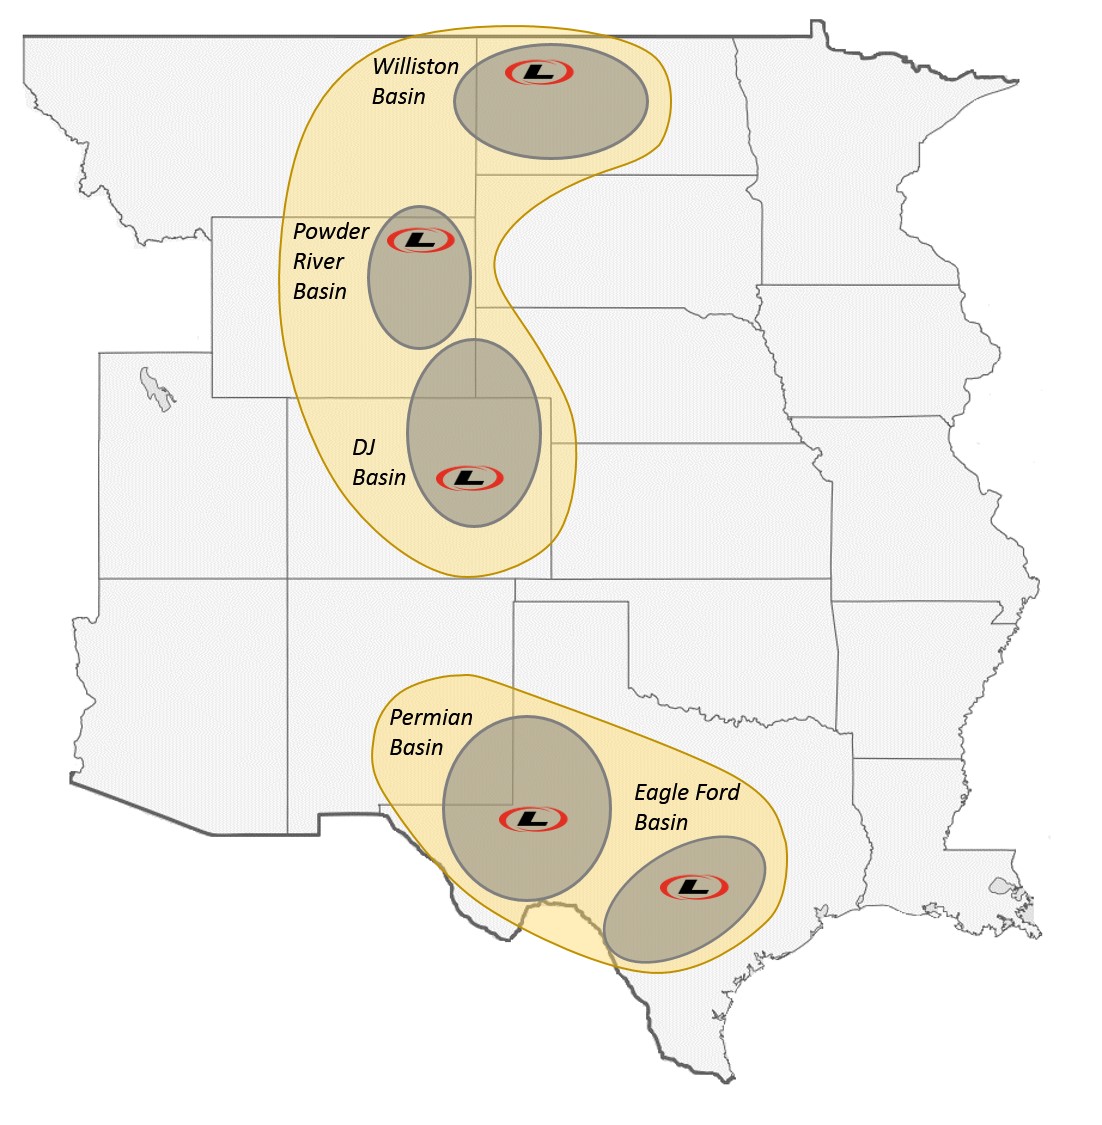
We are an independent provider of hydraulic fracturing services to onshore oil and natural gas exploration and production (“E&P”) companies in North America. We provide our services primarily in the Permian Basin, the Eagle Ford Shale, the Denver-Julesburg Basin (the “DJ Basin”), the Williston Basin and the Powder River Basin.
Initial Public Offering and Corporate Reorganization Transaction
Liberty Inc. was incorporated as a Delaware corporation on December 21, 2016, to become a holding corporation for Liberty LLC and its subsidiaries upon completion of a corporate reorganization (as detailed below, the “Corporate Reorganization”) and planned initial public offering of the Company (“IPO”). The Company has no material assets other than its ownership in Liberty LLC.
On January 17, 2018, we completed our IPO of
14,640,755
shares of our Class A common stock, par value $0.01 per share (the “Class A Common Stock”) at a public offering price of $17.00 per share, of which
14,340,214
shares were offered by us and
300,541
shares were offered by the selling shareholder. We received approximately
$220.0 million
in net proceeds after deducting approximately
$23.8 million
of underwriting discounts and commissions and other offering costs. We did not receive any proceeds from the sale of the shares of Class A Common Stock by the selling shareholder. We used approximately
$25.9 million
of net proceeds from the IPO to redeem ownership in us from certain Legacy Owners (as defined below) and contributed the remaining proceeds to Liberty LLC in exchange for units in Liberty LLC (the “Liberty LLC Units”). Liberty LLC used a portion of the net proceeds (i) to fully repay our outstanding borrowings and accrued interest under our ABL Facility (as defined herein), totaling approximately
$30.1 million
, (ii) to repay 35% of our outstanding borrowings, accrued interest and prepayment premium under our Term Loan Facility (as defined herein), totaling approximately
$62.5 million
and (iii) for general corporate purposes, including repayment of additional indebtedness and funding capital expenditures.
We are a holding company with no direct operations. In connection with the IPO, we completed the Corporate Reorganization, including the following series of transactions:
|
•
|
Liberty Holdings contributed all of its assets to Liberty LLC in exchange for Liberty LLC Units;
|
|
•
|
Liberty Holdings liquidated and distributed to its then-existing owners (the “Legacy Owners”) Liberty LLC Units pursuant to the terms of the limited liability company agreement of Liberty Holdings and the Master Reorganization Agreement dated as of January 11, 2018, by and among the Company, Liberty Holdings, Liberty LLC, and the other parties named therein (the “Master Reorganization Agreement”);
|
|
•
|
Certain of the Legacy Owners directly or indirectly contributed all or a portion of their Liberty LLC Units to Liberty Inc. in exchange for
55,685,027
shares of our Class A Common Stock, and
1,258,514
shares of restricted stock. Subsequent to the initial exchange,
1,609,122
shares of Class A Common Stock were redeemed for an aggregate purchase price of
$25.9 million
upon the exercise of the underwriters' overallotment option;
|
|
•
|
Liberty Inc. issued the Legacy Owners that continued to own Liberty LLC Units (the “Liberty Unit Holders”) an aggregate amount of
48,207,372
shares of our Class B common stock, par value $0.01 per share (the “Class B Common Stock” and, together with the Class A Common Stock, the “Common Stock”); and
|
|
•
|
Liberty Inc. contributed the net proceeds it received from the IPO to Liberty LLC in exchange for additional Liberty LLC Units such that Liberty Inc. held a total number of Liberty LLC Units equal to the number of shares of Class A Common Stock outstanding immediately following the IPO.
|
1
The below structure chart shows our organization upon the completion of our IPO. This chart is provided for illustrative purposes only and, does not represent all legal entities affiliated with us.
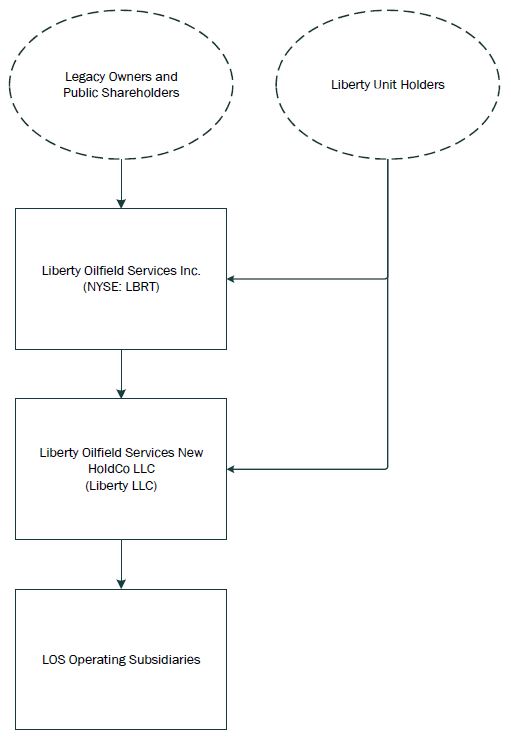
Each share of Class B Common Stock has no economic rights but entitles its holder to one vote on all matters to be voted on by shareholders generally. Holders of Class A Common Stock and Class B Common Stock will vote together as a single class on all matters presented to our shareholders for their vote or approval, except as otherwise required by applicable law or by our amended and restated certificate of incorporation. We do not intend to list our Class B Common Stock on any exchange.
Under the Second Amended and Restated Limited Liability Company Agreement of Liberty LLC (the “Liberty LLC Agreement”), each Liberty Unit Holder has, subject to certain limitations, the right (the “Redemption Right”) to cause Liberty LLC to acquire all or a portion of its Liberty LLC Units for, at Liberty LLC’s election, (i) shares of our Class A Common Stock at a redemption ratio of one share of Class A Common Stock for each Liberty LLC Unit redeemed, subject to conversion rate adjustments for stock splits, stock dividends and reclassification and other similar transactions or (ii) an equivalent amount of cash. Alternatively, upon the exercise of the Redemption Right, Liberty Inc. (instead of Liberty LLC) will have the right (the “Call Right”) to, for administrative convenience, acquire each tendered Liberty LLC Unit directly from the redeeming Liberty Unit Holder for, at its election, (x) one share of Class A Common Stock or (y) an equivalent amount of cash. In addition, upon a change of control of Liberty Inc., Liberty Inc. has the right to require each holder of Liberty LLC Units (other than Liberty Inc.) to exercise its Redemption Right with respect to some or all of such unit holder’s Liberty LLC Units. In connection with any redemption of Liberty LLC Units pursuant to the Redemption Right or the Call Right, the corresponding number of shares of Class B Common Stock will be canceled.
In connection with the IPO, Liberty Inc. entered into two tax receivable agreements, (the “TRAs”) with the Liberty Unit Holders and the selling shareholder (each such person and any permitted transferee, a “TRA Holder” and together, the “TRA Holders”).
The first of the TRAs, which Liberty Inc. entered into with the Liberty Unit Holders, generally provides for the payment by Liberty Inc. to such TRA Holders of 85% of the net cash savings, if any, in U.S. federal, state and local income and franchise tax (computed using simplifying assumptions to address the impact of state and local taxes) that Liberty Inc. actually realizes (or is deemed to realize in certain circumstances) in periods after the IPO as a result of, as applicable to each such TRA
2
Holder, (i) certain increases in tax basis that occur as a result of Liberty Inc.’s acquisition (or deemed acquisition for U.S. federal income tax purposes) of all or a portion of such TRA Holder’s Liberty LLC Units in connection with the IPO or pursuant to the exercise of the Redemption Right or Liberty Inc.’s Call Right and (ii) imputed interest deemed to be paid by Liberty Inc. as a result of, and additional tax basis arising from, any payments Liberty Inc. makes under such TRAs.
The second of the TRAs, which Liberty Inc. entered into with the selling shareholder, generally provides for the payment by Liberty Inc. to such TRA Holder of 85% of the net cash savings, if any, in U.S. federal, state and local income and franchise tax (computed using simplifying assumptions to address the impact of state and local taxes) that Liberty Inc. actually realizes (or is deemed to realize in certain circumstances) in periods after the IPO as a result of, as applicable to such TRA Holder, (i) any net operating losses available to Liberty Inc. as a result of the Corporate Reorganization and (ii) imputed interest deemed to be paid by Liberty Inc. as a result of any payments Liberty Inc. makes under such TRAs. For further discussion regarding the potential acceleration of payments under the TRAs and its potential impact, please read “Risk Factors—Risks Related to Our Class A Common Stock.”
Because Liberty Inc. is a holding company with no operations of its own, Liberty Inc.’s ability to make payments under the TRAs is dependent on the ability of Liberty LLC to make distributions to Liberty Inc. in an amount sufficient to cover its obligations under the TRAs. See “Risk Factors—Risks Related to Our Class A Common Stock—Liberty Inc. is a holding company. Liberty Inc.’s only material asset is its equity interest in Liberty LLC, and Liberty Inc. is accordingly dependent upon distributions from Liberty LLC to pay taxes, make payments under the TRAs and cover its corporate and other overhead expenses.” If Liberty Inc. experiences a change of control (as defined under the TRAs, which includes certain mergers, asset sales and other forms of business combinations) or the TRAs terminate early (at Liberty Inc.’s election or as a result of its breach), Liberty Inc. would be required to make a substantial, immediate lump-sum payment.
Our Company
We are an independent provider of hydraulic fracturing services to onshore oil and natural gas E&P companies in the United States. We have grown organically from one active hydraulic fracturing fleet in December 2011 to 22 active fleets in February 2019. We expect to take delivery of additional equipment in 2019. However, decisions whether or not to deploy these additional fleets in 2019 will be made considering customer demand, long term return profile and market conditions. We provide our services primarily in the Permian Basin, the Eagle Ford Shale, the DJ Basin, the Williston Basin and the Powder River Basin.
Our founders and existing management were pioneers in the development of data-driven hydraulic fracturing technologies for application in shale plays. Prior to founding Liberty Holdings, the majority of our management team founded and built Pinnacle Technologies, Inc. (“Pinnacle Technologies”) into a leading fracturing technology company. In 1992, Pinnacle Technologies developed the first commercial hydraulic fracture mapping technologies, analytical tools that played a major role in launching the shale revolution. Our extensive experience with fracture technologies and customized fracture design has enabled us to develop new technologies and processes that provide our customers with real time solutions that significantly enhance their completions. These technologies include hydraulic fracture propagation models, reservoir engineering tools, large, proprietary shale production databases and multi-variable statistical analysis techniques. Taken together, these technologies have enabled us to be a leader in hydraulic fracture design innovation and application.
We believe the following characteristics distinguish us from our competitors and are the foundations of our business: forming ongoing partnerships of trust and innovation with our customers; developing and utilizing technology to maximize well performance; and promoting a people-centered culture focused on our employees, customers and suppliers. We have developed strong relationships with our customers by investing significant time in fracture design collaboration, which substantially enhances their production economics. Our technological innovations have become even more critical as E&P companies have increased the completion complexity and fracture intensity of horizontal wells. We are proactive in developing innovative solutions to industry challenges, including developing: (i) our proprietary databases of U.S. unconventional wells to which we apply our proprietary multi-variable statistical analysis technologies to provide differential insight into fracture design optimization; (ii) our Liberty Quiet Fleet® design which significantly reduces noise levels compared to conventional hydraulic fracturing fleets; and (iii) hydraulic fracturing fluid systems tailored to the specific reservoir properties in the basins in which we operate. We foster a people-centered culture built around honoring our commitments to customers, partnering with our suppliers and hiring, training and retaining people that we believe to be the best talent in our field, enabling us to be one of the safest and most efficient hydraulic fracturing companies in the United States.
Recent Developments
On January 22, 2019, our board of directors (the “Board”) authorized a share repurchase plan to repurchase shares of our Class A Common Stock, par value $0.01 per share, in an amount not to exceed $100 million through January 31, 2021. This
3
program is in addition to the $100 million share repurchase program we previously announced on September 10, 2018, which has been substantially completed. We expect to fund repurchases made under this plan from existing cash on hand and future operating cash flow. The share repurchase program was approved by the Board who believe that a share repurchase program at this time is in the best interests of us and our shareholders and will not impact our ability to execute our growth plans.
We also announced on January 22, 2019 that the Board approved a quarterly cash dividend of $0.05 per share of Class A Common Stock, to be paid on March 20, 2019 to holders of record as of March 6, 2019. A distribution of $0.05 per unit has been approved for holders of units in Liberty LLC, which will use the same record and payment date.
Future declarations of dividends are subject to approval by the Board and to the Board’s continuing determination that the declarations of dividends are in the best interests of us and our stockholders. Future dividends may be adjusted at the Board’s discretion based on market conditions and capital availability.
Cyclical Nature of Industry
We operate in a highly cyclical industry. The key factor driving demand for our services is the level of drilling activity by E&P companies, which in turn depends largely on the current and anticipated economics of new well completions. Global supply and demand for oil and the domestic supply and demand for natural gas are critical in assessing industry outlook. Demand for oil and natural gas is cyclical and subject to large, rapid fluctuations. E&P companies tend to increase capital expenditures in response to increases in oil and natural gas prices, which generally results in greater revenues and profits for oilfield service companies such as ours. Increased capital expenditures also ultimately lead to greater production, which historically has resulted in increased supplies and reduced prices which in turn tend to reduce demand for oilfield services. For these reasons, the results of our operations may fluctuate from quarter to quarter and from year to year, and these fluctuations may distort comparisons of results across periods.
Seasonality
Our results of operations have historically reflected seasonal tendencies relating to holiday seasons, inclement weather and the conclusion of our customers’ annual drilling and completion capital expenditure budgets. Our most notable declines typically occur in the first and fourth quarters of the year for the reasons described above. Additionally, some of the areas in which we have operations, including the DJ Basin, Powder River Basin and Williston Basin, are adversely affected by seasonal weather conditions, primarily in the winter and spring. During periods of heavy snow, ice or rain and frost law enforcement, we may be unable to move our equipment between locations, thereby reducing our ability to provide services and generate revenues. The exploration activities of our customers may also be affected during such periods of adverse weather conditions. Additionally, extended drought conditions in our operating regions could impact our ability or our customers’ ability to source sufficient water or increase the cost for such water.
Intellectual Property
Over the last several years we have significantly invested in our research and technology capabilities. Our efforts to date have been focused on developing innovative, fit-for-purpose solutions designed to enhance our core service offerings, increase completion efficiencies, provide cost savings to our operations and add value for our customers.
As a result of these efforts, we introduced several new products and progressed on differentiating technologies that we believe will provide a competitive advantage as our customers focus on extracting oil and natural gas in the most economical and efficient ways possible, including, for example, our Liberty Quiet Fleet®, which materially reduces noise levels compared to conventional fracturing fleets. These investments are delivering value added products and services that support our customers and create increasing demand for our services.
We seek patent and trademark protections for our technology when we deem it prudent, and we aggressively pursue protection of these rights when warranted. We believe our patents, trademarks, and other protections for our proprietary technologies are adequate for the conduct of our business and that no single patent or trademark is critical to our business. In addition, we rely, to a great extent, on the technical expertise and know-how of our personnel to maintain our competitive position, and we take commercially reasonable measures to protect trade secrets and other confidential and/or proprietary information relating to the technologies we develop.
Risk Management and Insurance
Our operations are subject to significant hazards often found in the oil and natural gas industry, such as, but not limited to, accidents, blowouts, explosions, craterings, fires, natural gas leaks, oil and produced water spills and releases of hydraulic fracturing fluids or other well fluids into the environment. These conditions can cause:
4
|
•
|
disruption in operations;
|
|
•
|
substantial repair or remediation costs;
|
|
•
|
personal injury or loss of human life;
|
|
•
|
significant damage to or destruction of property and equipment;
|
|
•
|
environmental pollution, including groundwater contamination;
|
|
•
|
unusual or unexpected geological formations or pressures and industrial accidents;
|
|
•
|
impairment or suspension of operations; and
|
|
•
|
substantial revenue loss.
|
In addition, our operations are subject to, and exposed to, employee/employer liabilities and risks such as wrongful termination, discrimination, labor organizing, retaliation claims and general human resource related matters.
Claims for loss of oil and natural gas production and damage to formations can occur in the well services industry. Litigation arising from a catastrophic occurrence at a location where our equipment and services are being used may result in our being named as a defendant in lawsuits asserting large claims.
We do not have insurance against all foreseeable risks, either because insurance is not available or because of the high premium costs. The occurrence of an event not fully insured against or the failure of an insurer to meet its insurance obligations could result in substantial losses. In addition, we may not be able to maintain adequate insurance in the future at rates we consider reasonable. Insurance may not be available to cover any or all of the risks to which we are subject, or, even if available, it may be inadequate, or insurance premiums or other costs could rise significantly in the future so as to make such insurance prohibitively expensive.
We enter into Master Service Agreements (“MSAs”) with substantially all of our customers. Our MSAs delineate our and our customer’s respective indemnification obligations with respect to the services we provide. Generally, under our MSAs, including those relating to our hydraulic fracturing services, we assume responsibility for pollution or contamination originating above the surface from our equipment or handling. However, our customers assume responsibility for all other pollution or contamination that may occur during operations, including that which may result from seepage or any other uncontrolled flow of drilling and completion fluids. The assumed responsibilities include the control, removal and clean-up of any pollution or contamination. In such cases, we may be exposed to additional liability if we are grossly negligent or commit willful acts causing the pollution or contamination. Generally, our customers also agree to indemnify us against claims arising from their employees’ personal injury or death, in the case of our hydraulic fracturing operations, to the extent that their employees are injured by such operations, unless the loss is a result of our gross negligence or willful misconduct. Similarly, we generally agree to indemnify our customers for liabilities arising from personal injury to or death of any of our employees, unless resulting from the gross negligence or willful misconduct of our customer. The same principles apply to mutual indemnification for loss or destruction of customer-owned property or equipment. Losses due to catastrophic events, such as blowouts, are generally the responsibility of the customer. However, despite this general allocation of risk, we may be unsuccessful in enforcing contractual terms, incur an unforeseen liability that is not addressed by the scope of the contractual provisions or be required to enter into an MSA with terms that vary from our standard allocations of risk, as described above. Consequently, we may incur substantial losses that could materially and adversely affect our financial condition and results of operations.
Employees
As of December 31, 2018, we had 2,437 employees and no unionized labor. We believe we have good relations with our employees.
Our Services
We provide hydraulic fracturing services to E&P companies, particularly to those operating in unconventional oil and natural gas reservoirs and requiring technically and operationally advanced services. Hydraulic fracturing services are performed to enhance production of oil and natural gas from formations with low permeability and restricted flow of hydrocarbons. Our customers benefit from our expertise in fracturing horizontal wells in shales and other unconventional geological formations.
The process of hydraulic fracturing involves pumping a pressurized stream of fracturing fluid—typically a mixture of water, chemicals and proppant—into a well casing or tubing in order to cause the underground formation to fracture or crack. These fractures release trapped hydrocarbon particles and provide a conductive channel for the oil or natural gas to flow freely
5
to the wellbore for collection. The propping agent, or proppant,—typically sand—becomes lodged in the cracks created by the hydraulic fracturing process, “propping” them open to facilitate the flow of hydrocarbons from the reservoir to the well. The fracturing fluid is engineered to lose viscosity, or “break,” and is subsequently flowed back from the formation, leaving the proppant suspended in the mineral fractures. Once our customer has flushed the fracturing fluids from the well using a controlled flow-back process, the customer manages fluid and water recycling or disposal.
Our hydraulic fracturing fleets consist of mobile hydraulic fracturing units and other auxiliary heavy equipment to perform fracturing services. Our hydraulic fracturing units consist primarily of high-pressure hydraulic pumps, diesel engines, transmissions, radiators and other supporting equipment that are typically mounted on trailers. We refer to the group of units and other equipment, such as blenders, data vans, sand storage, tractors, manifolds and high pressure fracturing iron, which are necessary to perform a typical hydraulic fracturing job, as a “fleet,” and the personnel assigned to each fleet as a “crew.” As of February 2019, we had 22 active fleets.
An important element of our hydraulic fracturing services is our focus on providing custom-tailored completions solutions to our customers to maximize their well results. Our technologically innovative approach involves our review of a series of continually updated, proprietary databases of U.S. unconventional wells to which we apply our multi-variable data analysis, allowing us to gain differential insight into fracture design. The innovative completions solutions we provide to our customers help them complete more productive and cost efficient wells in shorter times with less environmental impact on their surroundings while increasing the useful lives of our equipment.
In addition to custom-tailored completions solutions, we also develop custom fluid systems, proppant logistics solutions, perforating strategies and pressure analysis techniques for our customers. An example of this is a hydraulic fracturing fluid that we developed for use in our DJ Basin operations called Liberty Spirit
™
, a specifically designed fracturing fluid system that enables material reductions in completion costs in the DJ Basin without compromising job execution or well results.
We provide our services in several of the most active basins in the United States, including the Permian Basin, the Eagle Ford Shale, the DJ Basin, the Williston Basin and the Powder River Basin. The map below represents our current areas of operations:
6
Properties and Equipment
Properties
Our corporate headquarters are located at 950 17
th
Street, Suite 2400, Denver, Colorado 80202. We lease our general office space at our corporate headquarters. The lease expires in December 2024. We currently own or lease the following additional principal properties:
|
District Facility Location
|
Size
|
Leased or Owned
|
Expiration of Lease
|
|||
|
Odessa, TX
|
77,500 sq. ft on 47 acres
|
Owned
|
N/A
|
|||
|
Henderson, CO
|
50,000 sq. ft on 13 acres
|
Leased
|
December 31, 2034
|
|||
|
Williston, ND
|
30,000 sq. ft on 15 acres
|
Owned
|
N/A
|
|||
|
Gillette, WY
|
32,757 sq. ft on 15 acres
|
Leased
|
December 31, 2034
|
|||
|
Cibolo, TX
|
90,000 sq. ft on 34 acres
|
Owned
|
N/A
|
|||
|
Sedalia, CO
|
11,805 sq. ft on 112 acres
|
Owned
|
N/A
|
|||
We also lease several smaller facilities, which leases generally have terms of one to three years. We believe that our existing facilities are adequate for our operations and their locations allow us to efficiently serve our customers. We do not believe that any single facility is material to our operations and, if necessary, we could readily obtain a replacement facility.
Equipment
We currently have 22 hydraulic fracturing fleets, and expect to take delivery of additional equipment in 2019. However, decisions whether or not to deploy these additional fleets in 2019 will be made considering customer demand, long term return profile and market conditions. Eight of our fleets currently utilize our Liberty Quiet Fleet® technology and approximately 40% of our capacity has dual fuel capability.
Our hydraulic fracturing fleets are comprised of high-quality, heavy-duty equipment designed to reduce operational downtime and maintenance costs, while enhancing our ability to provide reliable, consistent service. Each hydraulic fracturing fleet includes the necessary blending units, manifolds, data vans and other ancillary equipment needed to provide a high level of service to our customers.
Our newbuild fleets are manufactured to a custom Liberty specification that identifies the input components, including such key parts as engines, transmissions and pumps and control systems. These components have been selected with our lowest total cost of ownership philosophy in mind. We have built a strong partnership with each of the key component suppliers that we believe will help ensure timely access to necessary components, early opportunities to adopt the latest technology, and high-level technical support. For example, our close partnership with Caterpillar Inc. enabled us to have ready access to their technical team as we worked through the development of the Liberty Quiet Fleet® technology. This relationship ensured that the end product was delivered without compromise to engine performance, reliability or maintainability. We have also a built a strong relationship with the assembler of the core equipment for our fracturing fleets. We believe the collaborative partnerships we have developed with our vendors should give us ready access to sufficient fabrication capacity for our growth.
Our Acquisitions
On June 13, 2016, we acquired certain inventories and long-lived field service assets related to hydraulic fracturing from Sanjel Corporation for $69.0 million in cash (the “Sanjel Acquisition”). These assets were acquired from Sanjel Corporation as part of its bankruptcy proceeding. On February 22, 2017, we acquired all the membership interests of Titan Frac Services LLC, a wholly-owned subsidiary of TPIH Group Inc., for $65.0 million in cash.
Marketing and Customers
Our sales and marketing activities typically are performed through our local sales representatives in each geographic region, and are supported by our corporate headquarters. For the years ended
December 31, 2018
,
2017
and
2016
, our top five customers collectively accounted for approximately 42%, 53% and 59% of our revenues, respectively. Extraction Oil & Gas, Inc. accounted for more than 10% of our revenues for the year ended
December 31, 2018
. For the year ended
December 31, 2017
, Extraction Oil & Gas, Inc. and SM Energy Company each accounted for more than 10% of our revenues. Extraction Oil & Gas, Inc., SM Energy Company and Noble Energy, Inc. each accounted for more than 10% of our revenues for the year ended
December 31, 2016
.
7
Suppliers
We have a dedicated supply chain team that manages sourcing and logistics to ensure flexibility and continuity of supply in a cost effective manner across our areas of operation. We have built long-term relationships with multiple industry leading suppliers of proppant, chemicals and hydraulic fracturing equipment. For the years ended
December 31, 2018
,
2017
and
2016
none of our suppliers accounted for more than 10% of overall costs. For 2019, we do not expect any single proppant supplier to account for more than 20% of our total supply. In addition, we have built a strong relationship with the assembler of our custom-designed hydraulic fracturing fleets and believe we will continue to have timely access to new, high capability fleets as we continue to grow. Our purchases from that assembler accounted for more than 10% of our total capital expenditures for the year ended
December 31, 2018
.
We purchase a wide variety of raw materials, parts and components that are manufactured and supplied for our operations. We are not dependent on any single source of supply for those parts, supplies or materials. To date, we have generally been able to obtain the equipment, parts and supplies necessary to support our operations on a timely basis. While we believe that we will be able to make satisfactory alternative arrangements in the event of any interruption in the supply of these materials and/or products by one of our suppliers, we may not always be able to do so. In addition, certain materials for which we do not currently have long-term supply agreements could experience shortages and significant price increases in the future. As a result, we may be unable to mitigate any future supply shortages and our results of operations, prospects and financial condition could be adversely affected.
Competition
The markets in which we operate are highly competitive. We provide services in various geographic regions across the United States, and our competitors include many large and small oilfield service providers, including some of the largest integrated service companies. Our hydraulic fracturing services compete with large, integrated companies such as Halliburton Company and Schlumberger Limited as well as other companies including Basic Energy Services, Inc., BJ Services Company, C&J Energy Services, Inc., Calfrac Well Services Ltd., FTS International, Inc., Keane Group, Inc., Patterson-UTI Energy, Inc., ProPetro Services, Inc., RPC, Inc., Superior Energy Services, Inc. and U.S. Well Services, Inc. In addition, our industry is highly fragmented and we compete regionally with a significant number of smaller service providers.
We believe that the principal competitive factors in the markets we serve are technical expertise, equipment capacity, work force competency, efficiency, safety record, reputation, experience and price. Additionally, projects are often awarded on a bid basis, which tends to create a highly competitive environment. We seek to differentiate ourselves from our competitors by delivering the highest-quality services and equipment possible, coupled with superior execution and operating efficiency in a safe working environment.
Our operations are organized into a single business segment, which consists of hydraulic fracturing services, and we have one reportable geographical business segment, the United States. Operating segments are defined under generally accepted accounting principles in the United States of America (
“
GAAP
”
) as components of an enterprise that engage in activities (i) from which it may earn revenues and incur expenses and (ii) for which separate operational financial information is available and is regularly evaluated by the chief operating decision maker for the purpose of allocating resources and assessing performance.
8
Environmental and Occupational Safety and Health Matters
Our operations in support of oil and natural gas exploration, development and production activities pursued by our customers are subject to stringent federal, tribal, regional, state and local laws and regulations governing occupational safety and health, the discharge of materials into the environment and environmental protection. Numerous governmental entities, including the U.S. Environmental Protection Agency (“EPA”), the U.S. Occupational Safety and Health Administration (“OSHA”), and analogous state agencies have the power to enforce compliance with these laws and regulations and the permits issued under them, often requiring difficult and costly actions, including the incurrence of potentially significant capital or operating expenditures to mitigate or prevent the releases of materials from our equipment, facilities or from customer locations where we provide our services. These laws and regulations may, among other things (i) require the acquisition of permits or other authorizations for conducting regulated activities, (ii) limit or prohibit our operations on certain lands lying within wilderness, wetlands and other protected areas; (iii) require remedial measures to mitigate pollution from former and ongoing operations; (iv) impose restrictions on the types, quantities and concentrations of various substances that can be released into the environment or injected in formations in connection with oil and natural gas drilling and production activities; (v) impose specific safety and health criteria addressing worker protection; and (vi) impose substantial liabilities for pollution resulting from our operations. Any failure to comply with these laws and regulations may result in the assessment of sanctions, including administrative, civil and criminal penalties; the imposition of investigatory, remedial or corrective action obligations or the incurrence of capital expenditures; the occurrence of restrictions, delays or cancellations in the permitting, performance or development of projects or operations; and the issuance of orders enjoining performance of some or all of our operations in a particular area.
The trend in environmental regulation is to place more restrictions and limitations on activities that may adversely affect the environment, and thus any new laws and regulations, amendment of existing laws and regulations, reinterpretation of legal requirements or increased government enforcement with respect to environmental matters that result in more stringent and costly completion activities, pollution control equipment, waste handling, storage transport, disposal, or remediation requirements could have a material adverse effect on our financial position and results of operations. We may be unable to pass on such increased compliance costs to our customers. Moreover, accidental releases or spills may occur in the course of our operations, and we cannot assure you that we will not incur significant costs and liabilities as a result of such releases or spills, including any third-party claims for injuries to persons or damages to properties or natural resources. Our customers may also incur increased costs, or restrictions, delays or cancellations in permitting or operating activities as a result of more stringent environmental laws and regulations, which may result in a curtailment of exploration, development or production activities that would reduce the demand for our services. Historically, our worker health and safety as well as our environmental compliance costs have not had a material adverse effect on our results of operations; however, there can be no assurance that such costs will not be material in the future or that such future compliance will not have a material adverse effect on our business and operating results.
The following is a summary of the more significant existing environmental and occupational safety and health laws, as amended from time to time, to which our business is subject and for which compliance may have a material adverse impact on our capital expenditures, results of operations or financial position.
Worker Health and Safety
We are subject to the requirements of the federal Occupational Safety and Health Act, and comparable state statutes that regulate the protection of the health and safety of workers. In addition, the OSHA hazard communication standard, the EPA community right-to-know regulations under Title III of the federal Superfund Amendment and Reauthorization Act and comparable state statutes require that information be maintained about hazardous materials used or produced in our operations and that this information be provided to employees, state and local government authorities and the public. These worker health and safety laws and regulations are subject to amendment including, for example, rulemaking adopted by OSHA in 2016 imposing more stringent permissible exposure limits for worker exposure to respirable crystalline silica, and any failure to comply with these laws could lead to the assertion of third-party claims against us, civil or criminal fines and changes in the way we operate our facilities, any of which could have an adverse effect on our financial position.
9
Motor Carrier Operations
In connection with the services we provide, we operate as a motor carrier and therefore are subject to regulation by the U.S. Department of Transportation (“DOT”) and analogous state agencies. These regulatory authorities exercise broad powers, governing activities such as the authorization to engage in motor carrier operations; regulatory safety; hazardous materials labeling, placarding and marking; financial reporting; and certain mergers, consolidations and acquisitions. There are additional regulations specifically relating to the trucking industry, including testing and specification of equipment and product handling requirements. The trucking industry is subject to possible regulatory and legislative changes that may increase our costs as well as affect the economics of the industry by requiring changes in operating practices or by changing the demand for common or contract carrier services or the cost of providing truckload services. Some of these possible changes include increasingly stringent environmental regulations, changes in the hours of service regulations that govern the amount of time a driver may drive in any specific period and requiring onboard electronic logging devices or limits on vehicle weight and size.
Interstate motor carrier operations are subject to safety requirements prescribed by DOT. Intrastate motor carrier operations are subject to state safety regulations that often mirror federal regulations but may be more stringent. Such matters as weight and dimension of motor carrier-related equipment are also subject to federal and state regulations. DOT regulations also mandate drug testing of drivers. From time to time, various legislative proposals are introduced, including proposals to increase federal, state or local taxes, such as, for example, taxes on motor fuels, which may increase our costs or adversely impact the recruitment of drivers. We cannot predict whether, or in what form, any increase in such taxes applicable to us would be enacted.
Radioactive Materials
Certain of our operations utilize equipment that contains sealed, low-grade radioactive sources. Our activities involving the use of radioactive materials are regulated by the U.S. Nuclear Regulatory Commission (“NRC”) and state regulatory agencies under agreement with the NRC. Standards implemented by these regulatory agencies require us to obtain licenses or other approvals for the use of such radioactive materials. Additionally, these regulatory agencies impose certain requirements concerning worker protection with respect to radioactive sources and may otherwise issue regulations regarding the handling and storage of this equipment that may result in increased costs. The violation of these laws and regulations may result in the denial or revocation of licenses or other approvals, issuance of corrective action orders, injunctions prohibiting some or all of our operations in a particular area, and assessment of sanctions, including administrative, civil and criminal penalties.
Hazardous Substances and Wastes and Naturally Occurring Radioactive Materials
The federal Resource Conservation and Recovery Act (“RCRA”), and comparable state statutes, regulate the generation, treatment, storage, transportation, disposal and clean-up of hazardous and non-hazardous wastes. Pursuant to rules issued by the EPA, individual states administer some or all of the provisions of RCRA, sometimes in conjunction with their own, more stringent requirements. Drilling fluids, produced waters, and most of the other wastes associated with the exploration, development, and production of oil or natural gas, if properly handled, are currently exempt from regulation as hazardous waste under RCRA and, instead, are regulated under RCRA’s less stringent non-hazardous waste provisions, state laws or other federal laws. However, it is possible that certain oil and gas drilling and production wastes now classified as non-hazardous could be classified as hazardous wastes in the future. For example, pursuant to a consent decree issued by the U.S. District Court for the District of Columbia in 2016 the EPA is required to propose, no later than March 15, 2019, a rulemaking for revision of certain Subtitle D criteria regulations that could result in oil and natural gas exploration and production wastes being regulated as hazardous wastes, or sign a determination that revision of the regulations is unnecessary. If the EPA proposes a rulemaking for revised oil and natural gas waste regulations, the consent decree requires that the EPA take final action following notice and comment rulemaking no later than July 15, 2021. A loss of the RCRA exclusion for drilling fluids, produced waters and related wastes could result in an increase in our and the oil and natural gas exploration and production industry’s costs to manage and dispose of generated hazardous wastes, which could have a material adverse effect on our results of operations and financial position. Additionally, other wastes handled at exploration and production sites or generated in the course of providing well services may not fall within this exclusion. In the course of our operations, we generate some amounts of ordinary industrial wastes that may be regulated as hazardous wastes.
Moreover, there have been public concerns expressed about naturally occurring radioactive materials (“NORM”) being detected in flow back water resulting from hydraulic fracturing that may contaminate extraction and processing equipment used in the oil and natural gas industry. NORM is subject primarily to individual state radiation control regulations while NORM handling and management activities are governed by regulations promulgated by OSHA. These state and federal regulations impose certain requirements concerning worker protection with respect to NORM as well as the treatment, storage, and disposal of NORM and NORM waste, management of NORM-contaminated waste piles, containers and tanks, and limitations on the relinquishment of NORM contaminated land for unrestricted use under RCRA and state laws. Concern over NORM in
10
general, or NORM in groundwater in particular, could result in further regulation in the treatment, storage, handling and discharge of flow back water generated from oil and natural gas activities, including hydraulic fracturing, or handling of NORM-impacted equipment that, if implemented, could increase our or our customers’ costs or liabilities associated with elevated levels of NORM as well as limit drilling by our customers, which developments may reduce demand for our services.
The federal Comprehensive Environmental Response, Compensation, and Liability Act (“CERCLA”), also known as the “Superfund” law, and comparable state statutes impose liability, without regard to fault or legality of the original conduct, on classes of persons that are considered to have contributed to the release of a hazardous substance into the environment. Such classes of persons include the current and past owners or operators of sites where a hazardous substance was released, and anyone who disposed or arranged for the disposal of a hazardous substance released at the site. Under CERCLA, these persons may be subject to joint and several, strict liability for the costs of cleaning up the hazardous substances that have been released into the environment and for damages to natural resources even if the liability results from conduct that was lawful at the time it occurred or is due to the conduct, or conditions caused by, prior operators or third parties. In addition, it is not uncommon for neighboring landowners and other third parties to file claims for personal injury and property damage allegedly caused by the hazardous substances released into the environment. We own, lease, or operate numerous properties and facilities that for many years have been used for industrial activities, including oil and natural gas-related operations. Hazardous substances, wastes, or hydrocarbons may have been released on or under the properties owned or leased by us, or on or under other locations where such substances have been taken for recycling or disposal. In addition, some of these properties have been operated by third parties or by previous owners whose treatment and disposal or release of hazardous substances, wastes, or hydrocarbons, was not under our control. These properties and the substances disposed or released on them may be subject to CERCLA, RCRA and analogous state laws. Under such laws, we could be required to remove previously disposed substances and wastes and remediate contaminated property (including groundwater contamination), including instances where the prior owner or operator caused the contamination, or perform remedial plugging of disposal wells or waste pit closure operations to prevent future contamination.
Water Discharges and Discharges into Belowground Formations
The Federal Water Pollution Control Act, also known as the Clean Water Act (“CWA”) and analogous state laws, impose restrictions and strict controls with respect to the discharge of pollutants, including spills and leaks of oil and hazardous substances, into state waters and waters of the United States. The discharge of pollutants into regulated waters is prohibited, except in accordance with the terms of a permit issued by the EPA or an analogous state agency. Spill prevention, control and countermeasure plan requirements imposed under the CWA require appropriate containment berms and similar structures to help prevent the contamination of navigable waters in the event of a petroleum hydrocarbon tank spill, rupture or leak. In addition, the CWA and analogous state laws require individual permits or coverage under general permits for discharges of storm water runoff from certain types of facilities. The CWA also prohibits the discharge of dredge and fill material in regulated waters, including wetlands, unless authorized by a permit issued by the U.S. Army Corps of Engineers (“Corps”). The CWA and analogous state laws also may impose substantial civil and criminal penalties for non-compliance including spills and other non-authorized discharges.
In 2015, the EPA and the Corps published a final rule outlining their position on federal jurisdictional reach over waters of the United States, including wetlands, but legal challenges to this rule followed. Beginning in the first quarter of 2017, the EPA and the Corps agreed to reconsider the 2015 rule and, thereafter, the agencies (i) published a proposed rule in 2017 to rescind the 2015 rule and recodify the regulatory text that governed waters of the United States prior to promulgation of the 2015 rule, (ii) published a final rule in February 2018 adding a February 6, 2020 applicable date to the 2015 rule, and (iii) published a proposed rule in December 2018 re-defining the CWA’s jurisdiction over waters of the United States for which the agencies will seek public comment. The 2015 and February 2018 final rules are being challenged by various factions in the federal district court and implementation of the 2018 rule has been enjoined to twenty-eight states pending resolution of various federal district court challenges. As a result of these legal developments, future implementation of the 2015 rule is uncertain at this time. Any expansion of the CWA’s jurisdiction in areas where we or our customers operate, could impose additional permitting obligations on us and our customers.
The Oil Pollution Act of 1990 (“OPA”) amends the CWA and sets minimum standards for prevention, containment and cleanup of oil spills. OPA applies to vessels, offshore facilities, and onshore facilities, including exploration and production facilities that may affect waters of the United States. Under OPA, responsible parties including owners and operators of onshore facilities may be held strictly liable for oil cleanup costs and natural resource damages as well as a variety of public and private damages that may result from oil spills. The OPA also requires owners or operators of certain onshore facilities to prepare facility response plans for responding to a worst-case discharge of oil into waters of the United States.
Our oil and natural gas producing customers dispose of flowback and produced water or certain other oilfield fluids gathered from oil and natural gas producing operations in accordance with permits issued by government authorities overseeing
11
such disposal activities. While these permits are issued pursuant to existing laws and regulations, these legal requirements are subject to change based on concerns of the public or governmental authorities regarding such disposal activities. One such concern relates to seismic events near underground disposal wells used for the disposal by injection of flowback and produced water or certain other oilfield fluids resulting from oil and natural gas activities. In 2016, the United States Geological Survey identified six states with the most significant hazards from seismicity events suspected of having been induced by injection of oilfield fluids into underground disposal wells, including Oklahoma, Kansas, Texas, Colorado, New Mexico, and Arkansas. In response to concerns between use of underground disposal wells and the occurrence of seismic events, regulators in some states have imposed, or are considering imposing, additional requirements in the permitting of produced water disposal wells or otherwise to assess any relationship between seismicity and the use of such wells. For example, Texas and Oklahoma have issued rules for produced water disposal wells that impose certain permitting restrictions, operating restrictions and/or reporting requirements on disposal wells in proximity to faults. Additionally, from time to time, states may develop and implement plans directing certain wells where seismic incidents have occurred to restrict or suspend disposal well operations, as has occurred in Oklahoma. For example, in late 2016, the Oil and Gas Conservation Division of the Oklahoma Corporation Commission (“OCC”) and the Oklahoma Geological Survey released well completion seismicity guidance, which requires operators to take certain prescriptive actions, including an operator’s planned mitigation practices, following certain unusual seismic activity within 1.25 miles of hydraulic fracturing operations. In recent years, including during 2018, the OCC’s Oil and Gas Conservation Division has issued orders limiting future increases in the volume of oil and natural gas produced water injected belowground into the Arbuckle formation in an effort to reduce the number of earthquakes in the state. Another consequence of seismic events may be lawsuits alleging that disposal well operations have caused damage to neighboring properties or otherwise violated state and federal rules regulating waste disposal. These developments could result in additional regulation and restrictions on the use of injection wells by our customers to dispose of flowback and produced water and certain other oilfield fluids. Increased regulation and attention given to seismicity events suspected of having been induced by injection of oilfield fluids into underground disposal wells also could lead to greater opposition to, and litigation concerning, oil and natural gas activities utilizing injection wells for waste disposal. Any of these developments may result in our customers having to limit disposal well volumes, disposal rates or locations, or require our customers or third party disposal well operators that are used to dispose of customer produced water to shut down disposal wells, which developments could adversely affect our customers’ business and result in a corresponding decrease in the need for our services, which would could have a material adverse effect on our business, financial condition, and results of operations.
Air Emissions
Certain of our operations also result in emissions of regulated air pollutants. The federal Clean Air Act (“CAA”) and analogous state laws require permits for certain facilities that have the potential to emit substances into the atmosphere that could adversely affect environmental quality. These laws and their implementing regulations also impose generally applicable limitations on air emissions and require adherence to maintenance, work practice, reporting and record keeping, and other requirements. Failure to obtain a permit or to comply with permit or other regulatory requirements could result in the imposition of sanctions, including administrative, civil and criminal penalties. In addition, we or our customers could be required to shut down or retrofit existing equipment, leading to additional expenses and operational delays.
Many of these regulatory requirements, including New Source Performance Standards (“NSPS”) and Maximum Achievable Control Technology (“MACT”) standards, are expected to be made more stringent over time as a result of stricter ambient air quality standards and other air quality protection goals adopted by the EPA. Compliance with these or other new or amended regulations could, among other things, require installation of new emission controls on some of our equipment, result in longer permitting timelines, and significantly increase our capital expenditures and operating costs, which could adversely impact on our business. For example, in 2015, the EPA lowered the National Ambient Air Quality Standard, (“NAAQS”) for ozone from 75 to 70 parts per billion for both the 8-hour primary and secondary standards. In 2017 and 2018, the EPA issued area designations with respect to ground-level ozone as either “attainment/unclassifiable,” “unclassifiable” or “nonattainment.” Additionally, in November 2018, the EPA issued final requirements that apply to state, local, and tribal air agencies for implementing the 2015 NAAQS for ground-level ozone. Reclassification of areas or imposition of more stringent standards may make it more difficult to construct new or modified sources of air pollution in newly designated non-attainment areas. Additionally, states are expected to implement more stringent requirements as a result of the revised NAAQS for ozone, which could result in stricter permitting requirements, delay or prohibit our ability to obtain such permits, and result in increased expenditures for pollution control equipment, the costs of which could be significant. Compliance with this and other air pollution control and permitting requirements has the potential to delay the development of oil and natural gas projects and increase costs for us and our customers. Moreover, our business could be materially affected if our customers’ operations are significantly affected by these or other similar requirements. These requirements could increase the cost of doing business for us and our customers, reduce the demand for the oil and natural gas our customers produce, and thus have an adverse effect on the demand for our services.
12
Climate Change
Climate change continues to attract considerable public, governmental and scientific attention. As a result, numerous proposals have been made and are likely to continue to be made at the international, national, regional and state levels of government to monitor and limit emissions of greenhouse gases (“GHGs”). These efforts have included consideration of cap-and-trade programs, carbon taxes, GHG reporting and tracking programs and regulations that directly limit GHG emissions from certain sources. In the absence of federal GHG-limiting legislations, the EPA has determined that GHG emissions present a danger to public health and the environment and has adopted regulations that, among other things, restrict emissions of GHGs under existing provisions of the CAA and may require the installation of “best available control technology” to limit emissions of GHGs from any new or significantly modified facilities that we may seek to construct in the future if they would otherwise emit large volumes of GHGs together with other criteria pollutants. Also, the EPA has adopted rules requiring the monitoring and annual reporting of GHG emissions from oil and natural gas production, processing, transmission and storage facilities in the United States. In 2015, the EPA amended and expanded the GHG reporting requirements to all segments of the oil and natural gas industry, including gathering and boosting stations as well as completions and workovers from hydraulically fractured oil wells.
The EPA has also taken steps to limit methane emissions, a GHG, from certain new modified or reconstructed facilities in the oil and natural gas sector through the adoption of a final rule in 2016 establishing NSPS Subpart OOOOa standards for methane emissions. However, in June 2017, the EPA published a proposed rule to stay certain portions of these Subpart OOOOa standards for two years but the rule was not finalized. Rather, in February 2018, the EPA finalized amendments to certain requirements of the 2016 final rule, and in September 2018 the EPA proposed additional amendments, including rescission of certain requirements and revisions to other requirements, such as fugitive emission monitoring frequency. Further more, in late 2016, the federal Bureau of Land Management (“BLM”) published a final rule that established, among other things, requirements to reduce methane emissions by regulating venting, flaring and leaks from oil and natural gas production activities on onshore federal and Native American lands. However, in September 2018, the BLM published a final rule that rescinds most of the new requirements of the 2016 final rule and codifies the BLM's prior approach to venting and flaring but the rule rescinding the 2016 final rule has been challenged in federal court and remains pending. In the event that the EPA’s 2016 or the BLM’s 2016 rules should remain or be placed in effect, or should any other new methane emission standards be imposed on the oil and natural gas sector, such requirements could result in increased costs to our or our customers’ operations as well as result in restrictions, delays or cancellations in such operations, which costs, restrictions delays or cancellations could adversely affect our business.
Internationally, in April 2016, the United States joined other countries in entering into a United Nations-sponsored non-binding agreement negotiated in Paris, France (the “Paris Agreement”) for nations to limit their GHG emissions through individually determined reduction goals every five years beginning in 2020. However, in August 2017, the U.S. State Department informed the United Nations of the intent of the United States to withdraw from the Paris Agreement. The Paris Agreement provides for a four-year exit process beginning when it took effect in November 2016. The United States’ adherence to the exit process and/or the terms on which the United States may reenter the Paris Agreement or a separately negotiated agreement are unclear at this time. Substantial limitations on GHG emissions could adversely affect demand for the oil and natural gas our customers produce and lower the value of their reserves, which developments could reduce demand for our services and have a corresponding material adverse effect on our results of operations and financial position.
Notwithstanding potential risks related to climate change, the International Energy Agency estimates that oil and natural gas will continue to represent a major share of global energy use through 2040, and other studies by the private sector project continued growth in demand for the next two decades. However, recent activism directed at shifting funding away from companies with energy-related assets could result in limitations or restrictions on certain sources of funding for the energy sector. Ultimately this could make it more difficult to secure funding for exploration and production or midstream activities. Finally, increasing concentrations of GHGs in the Earth’s atmosphere may produce climate changes that have significant physical effects, such as increased frequency and severity of storms, floods and other climatic events. If any such effects were to occur, they could have an adverse effect on our operations.
Endangered Species
The federal Endangered Species Act (“ESA”) restricts activities that may affect endangered or threatened species or their habitats. Similar protections are offered to migratory birds under the federal Migratory Bird Treaty Act (“MBTA”). Customer oil and natural gas operations may be adversely affected by seasonal or permanent restrictions on drilling activities designed to protect various wildlife, which may limit their ability to operate in protected areas. Permanent restrictions imposed to protect endangered and threatened species could prohibit drilling in certain areas or require the implementation of expensive mitigation measures. Moreover, as a result of one or more settlements entered into by the U.S. Fish and Wildlife Service (“FWS”), that agency is required to consider listing numerous species as endangered or threatened under the Endangered Species Act by
13
specified timelines. Current ESA listings and the designation of previously unprotected species as threatened or endangered in areas where we or our customers operate could cause us or our customers to incur increased costs arising from species protection or mitigation measures and could result in restrictions, delays or cancellations in our or our customers’ performance of operations, which could adversely affect or reduce demand for our services.
Hydraulic Fracturing
We perform hydraulic fracturing services for our customers. Hydraulic fracturing is an important and common practice that is used to stimulate production of natural gas and/or oil from dense subsurface rock formations. The hydraulic fracturing process involves the injection of water, proppant and chemical additives under pressure into the formation to fracture the surrounding rock and stimulate production.
Hydraulic fracturing typically is regulated by state oil and natural gas commissions or similar agencies, but the EPA has conducted investigations or asserted federal regulatory authority pursuant to the federal Safe Drinking Water Act (“SDWA”) Underground Injection Control (“UIC”) program over certain aspects of the process. For example, in late 2016, the EPA released its final report on the potential impacts of hydraulic fracturing on drinking water resources, concluding that “water cycle” activities associated with hydraulic fracturing may impact drinking water resources under certain circumstances. Additionally, the EPA has asserted regulatory authority under the SDWA UIC program over hydraulic fracturing activities involving the use of diesel fuel and issued permitting guidance covering such activities, as well as published an Advanced Notice of Proposed Rulemaking regarding Toxic Substances Control Act reporting of the chemical substances and mixtures used in hydraulic fracturing. The EPA also published final CAA regulations in 2012 and 2016 governing performance standards, including standards for the capture of emissions released during oil and natural gas hydraulic fracturing. Moreover, in 2016, the EPA published an effluent limit guideline final rule prohibiting the discharge of produced water from onshore unconventional oil and natural gas extraction facilities to publicly owned wastewater treatment plants. The BLM published a final rule in 2015 that imposed new or more stringent standards for performing hydraulic fracturing on federal and Native American lands but the BLM rescinded the 2015 rule in later 2017; however, litigation challenging the BLM’s decisions to rescind the 2015 rule is pending in federal district court.
Additionally, various state and local governments have implemented, or are considering, increased regulatory oversight of hydraulic fracturing through additional permit requirements, operational restrictions, disclosure requirements, well construction and temporary or permanent bans on hydraulic fracturing in certain areas. For example, Texas, Colorado and North Dakota, among others, have adopted regulations that impose new or more stringent permitting, disclosure, disposal, and well construction requirements on hydraulic fracturing operations. States could also elect to prohibit high volume hydraulic fracturing altogether, following the approach taken by the State of New York. Local land use restrictions, such as city ordinances, may restrict drilling in general and/or hydraulic fracturing in particular. Also, non-governmental organizations may seek to restrict hydraulic fracturing, as has been the case in Colorado in recent years, when certain interest groups therein have unsuccessfully pursued ballot initiatives in recent general election cycles that, had they been successful, would have revised the state constitution or state statutes in a manner that would have made exploration and production activities in the state more difficult or costly in the future, for example, by increasing mandatory setback distances of oil and natural gas operations, including hydraulic fracturing, from specific occupied structures and/or certain environmentally sensitive or recreational areas.
If new federal, state or local laws, regulations or ballot initiatives that significantly restrict hydraulic fracturing are adopted, such legal requirements could result in delays, eliminate certain drilling and injection activities and make it more difficult or costly to perform hydraulic fracturing. Any such laws, regulations or ballot initiatives limiting or prohibiting hydraulic fracturing could result in decreased oil and natural gas exploration and production activities and, therefore, adversely affect demand for our services and our business. Such laws, regulations or ballot initiatives could also materially increase our costs of compliance and doing business.
Available Information
We file or furnish annual, quarterly and current reports, proxy statements and other documents with the SEC under the Exchange Act. The SEC also maintains an internet website at www.sec.gov that contains reports, proxy and information statements and other information regarding issuers, including us, that file electronically with the SEC.
Our Class A Common Stock is listed and traded on the New York Stock Exchange (“NYSE”) under the symbol “LBRT.” Our reports, proxy statements and other information filed with the SEC can also be inspected and copied at the offices of the NYSE, at 20 Broad Street, New York, New York 10005.
We also make available free of charge through our website, www.libertyfrac.com, electronic copies of certain documents that we file with the SEC, including our Annual Reports on Form 10-K, Quarterly Reports on Form 10-Q, Current Reports on
14
Form 8-K and amendments to those reports filed or furnished pursuant to Section 13(a) or 15(d) of the Exchange Act as soon as reasonably practicable after we electronically file such material with, or furnish it to, the SEC.
15
Item 1A. Risk Factors
Described below are certain risks that we believe apply to our business and the industry in which we operate. You should carefully consider each of the following risk factors in conjunction with other information provided in this Annual Report on Form 10-K and in our other public disclosures. The risks described below highlight potential events, trends or other circumstances that could adversely affect our business, financial condition, results of operations, cash flows, liquidity or access to sources of financing, and consequently, the market value of our Class A Common Stock. These risks could cause our future results to differ materially from historical results and from guidance we may provide regarding our expectations of future financial performance. The risks described below are those that we have identified as material and is not an exhaustive list of all the risks we face. There may be other risks that we have not identified or that we have deemed to be immaterial. Please refer to the explanation of the qualifications and limitation on forward-looking statements set forth on page ii hereof.
Risks Related to Our Business
Our business depends on domestic capital spending by the oil and natural gas industry, and reductions in capital spending could have a material adverse effect on our liquidity, results of operations and financial condition.
Our business is directly affected by our customers’ capital spending to explore for, develop and produce oil and natural gas in the United States. The significant decline in oil and natural gas prices that began in late 2014 caused a reduction in the exploration, development and production activities of most of our customers and their spending on our services. These cuts in spending curtailed drilling programs, which resulted in a reduction in the demand for our services, as well as the prices we can charge. These reductions negatively affected our revenue per average active fleet in 2015 and 2016. While industry conditions improved and activity levels increased during 2017 and part of 2018, there can be no assurance that these increased levels will be sustained. In addition, certain of our customers could become unable to pay their vendors and service providers, including us, as a result of a decline in commodity prices. Reduced discovery rates of new oil and natural gas reserves in our areas of operation as a result of decreased capital spending may also have a negative long-term impact on our business, even in an environment of stronger oil and natural gas prices. Any of these conditions or events could adversely affect our operating results. If the recent recovery and increased activity levels do not continue or our customers fail to further increase their capital spending, it could have a material adverse effect on our liquidity, results of operations and financial condition.
Industry conditions are influenced by numerous factors over which we have no control, including:
|
•
|
expected economic returns to E&P companies of new well completions;
|
|
•
|
domestic and foreign economic conditions and supply of and demand for oil and natural gas;
|
|
•
|
the level of prices, and expectations about future prices, of oil and natural gas;
|
|
•
|
the level of global oil and natural gas exploration and production;
|
|
•
|
the level of domestic and global oil and natural gas inventories;
|
|
•
|
the supply of and demand for hydraulic fracturing services and equipment in the United States;
|
|
•
|
federal, tribal, state and local laws, regulations and taxes, including the policies of governments regarding hydraulic fracturing and oil and natural gas exploration, development and production activities as well as non-U.S. governmental regulations and taxes;
|
|
•
|
governmental regulations, including the policies of governments regarding the exploration for and production and development of their oil and natural gas reserves;
|
|
•
|
political and economic conditions in oil and natural gas producing countries;
|
|
•
|
actions by the members of the Organization of Petroleum Exporting Countries with respect to oil production levels and potential changes in such levels, including the failure of such countries to comply with production cuts announced in December 2018, to take effect at the beginning of 2019 and to last for six months;
|
|
•
|
global weather conditions and natural disasters;
|
|
•
|
worldwide political, military and economic conditions;
|
|
•
|
the cost of producing and delivering oil and natural gas;
|
|
•
|
lead times associated with acquiring equipment and products and availability of qualified personnel;
|
16
|
•
|
the discovery rates of new oil and natural gas reserves;
|
|
•
|
stockholder activism or activities by non-governmental organizations to limit certain sources of funding for the energy sector or to restrict the exploration, development and production of oil and natural gas;
|
|
•
|
the availability of water resources, suitable proppant and chemical additives in sufficient quantities for use in hydraulic fracturing fluids;
|
|
•
|
advances in exploration, development and production technologies or in technologies affecting energy consumption;
|
|
•
|
the potential acceleration of development of alternative fuels; and
|
|
•
|
uncertainty in capital and commodities markets and the ability of oil and natural gas companies to raise equity capital and debt financing.
|
The volatility of oil and natural gas prices may adversely affect the demand for our hydraulic fracturing services and negatively impact our results of operations.
The demand for our hydraulic fracturing services is primarily determined by current and anticipated oil and natural gas prices and the related levels of capital spending and drilling activity in the areas in which we have operations. Volatility or weakness in oil prices or natural gas prices (or the perception that oil prices or natural gas prices will decrease) affects the spending patterns of our customers and may result in the drilling of fewer new wells. This, in turn, could lead to lower demand for our services and may cause lower utilization of our assets. We have experienced, and may in the future experience significant fluctuations in operating results as a result of the reactions of our customers to changes in oil and natural gas prices. For example, prolonged low commodity prices experienced by the oil and natural gas industry beginning in late 2014 and uncertainty about future prices even when prices increased, combined with adverse changes in the capital and credit markets, caused many E&P companies to significantly reduce their capital budgets and drilling activity. This resulted in a significant decline in demand for oilfield services and adversely impacted the prices oilfield services companies could charge for their services.
Prices for oil and natural gas historically have been extremely volatile and are expected to continue to be volatile. During the past four years, the posted West Texas Intermediate (“WTI”) price for oil has ranged from a low of $26.19 per barrel (“Bbl”) in February 2016 to a high of $77.41 per Bbl in June 2018. During 2018, WTI prices ranged from $44.48 to $77.41 per Bbl. If the prices of oil and natural gas continue to be volatile, our operations, financial condition, cash flows and level of expenditures may be materially and adversely affected.
We may be adversely affected by uncertainty in the global financial markets and the deterioration of the financial condition of our customers.
Our future results may be impacted by the uncertainty caused by an economic downturn, volatility or deterioration in the debt and equity capital markets, inflation, deflation or other adverse economic conditions that may negatively affect us or parties with whom we do business resulting in a reduction in our customers’ spending and their non-payment or inability to perform obligations owed to us, such as the failure of customers to honor their commitments or the failure of major suppliers to complete orders. Additionally, during times when the crude oil or natural gas markets weaken, our customers are more likely to experience financial difficulties, including being unable to access debt or equity financing, which could result in a reduction in our customers’ spending for our services. In addition, in the course of our business we hold accounts receivable from our customers. In the event of the financial distress or bankruptcy of a customer, we could lose all or a portion of such outstanding accounts receivable associated with that customer. Further, if a customer was to enter into bankruptcy, it could also result in the cancellation of all or a portion of our service contracts with such customer at significant expense or loss of expected revenues to us.
Our operations are subject to significant risks, some of which are beyond our control. These risks may be self-insured, or may not be fully covered under our insurance policies.
Our operations are subject to significant hazards often found in the oil and natural gas industry, such as, but not limited to, accidents, blowouts, explosions, craterings, fires, natural gas leaks, oil and produced water spills and releases of hydraulic fracturing fluids or other well fluids into the environment. These conditions can cause:
|
•
|
disruption in operations;
|
|
•
|
substantial repair or remediation costs;
|
|
•
|
personal injury or loss of human life;
|
17
|
•
|
significant damage to or destruction of property, and equipment;
|
|
•
|
environmental pollution, including groundwater contamination;
|
|
•
|
unusual or unexpected geological formations or pressures and industrial accidents;
|
|
•
|
impairment or suspension of operations; and
|
|
•
|
substantial revenue loss.
|
In addition, our operations are subject to, and exposed to, employee/employer liabilities and risks such as wrongful termination, discrimination, labor organizing, retaliation claims and general human resource related matters.
The occurrence of a significant event or adverse claim in excess of the insurance coverage that we maintain or that is not covered by insurance could have a material adverse effect on our liquidity, combined results of operations and combined financial condition. Claims for loss of oil and natural gas production and damage to formations can occur in the well services industry. Litigation arising from a catastrophic occurrence at a location where our equipment and services are being used may result in our being named as a defendant in lawsuits asserting large claims.
We do not have insurance against all foreseeable risks, either because insurance is not available or because of the high premium costs. The occurrence of an event not fully insured against or the failure of an insurer to meet its insurance obligations could result in substantial losses. In addition, we may not be able to maintain adequate insurance in the future at rates we consider reasonable. Insurance may not be available to cover any or all of the risks to which we are subject, or, even if available, it may be inadequate, or insurance premiums or other costs could rise significantly in the future so as to make such insurance prohibitively expensive.
Reliance upon a few large customers may adversely affect our revenue and operating results.
Our top five customers represented approximately 42%, 53%, and 59% of our consolidated and combined revenue for the years ended December 31, 2018, 2017 and 2016, respectively. It is likely that we will continue to derive a significant portion of our revenue from a relatively small number of customers in the future. If a major customer fails to pay us, revenue would be impacted and our operating results and financial condition could be materially harmed. Additionally, if we were to lose any material customer, we may not be able to redeploy our equipment at similar utilization or pricing levels or within a short period of time and such loss could have a material adverse effect on our business until the equipment is redeployed at similar utilization or pricing levels.
We are exposed to the credit risk of our customers, and any material nonpayment or nonperformance by our customers could adversely affect our financial results.
We are subject to the risk of loss resulting from nonpayment or nonperformance by our customers, many of whose operations are concentrated solely in the domestic E&P industry which, as described above, is subject to volatility and, therefore, credit risk. Our credit procedures and policies may not be adequate to fully reduce customer credit risk. If we are unable to adequately assess the creditworthiness of existing or future customers or unanticipated deterioration in their creditworthiness, any resulting increase in nonpayment or nonperformance by them and our inability to re-market or otherwise use our equipment could have a material adverse effect on our business, financial condition, prospects or results of operations.
We face intense competition that may cause us to lose market share and could negatively affect our ability to market our services and expand our operations.
The oilfield services business is highly competitive. Some of our competitors have a broader geographic scope, greater financial and other resources, or other cost efficiencies. Additionally, there may be new companies that enter our business, or re-enter our business with significantly reduced indebtedness following emergence from bankruptcy, or our existing and potential customers may develop their own hydraulic fracturing business, or direct source proppant, negatively affecting our revenue and potentially resulting in shortfall obligations under some of our supply agreements. Our ability to maintain current revenue and cash flows, and our ability to market our services and expand our operations, could be adversely affected by the activities of our competitors and our customers. If our competitors substantially increase the resources they devote to the development and marketing of competitive services or substantially decrease the prices at which they offer their services, we may be unable to effectively compete. All of these competitive pressures could have a material adverse effect on our business, results of operations and financial condition. Some of our larger competitors provide a broader range of services on a regional, national or worldwide basis. These companies may have a greater ability to continue oilfield service activities during periods of low commodity prices and to absorb the burden of present and future federal, tribal, state, local and other laws and regulations.
18
Any inability to compete effectively with larger companies could have a material adverse impact on our financial condition and results of operations.
Our assets require significant amounts of capital for maintenance, upgrades and refurbishment and may require significant capital expenditures for new equipment.
Our hydraulic fracturing fleets and other completion service-related equipment require significant capital investment in maintenance, upgrades and refurbishment to maintain their competitiveness. For example, since January 1, 2011, we have deployed 22 hydraulic fracturing fleets to service customers at a total cost to deploy of approximately $838.1 million. The costs of components and labor have increased in the past and may increase in the future with increases in demand, which will require us to incur additional costs to upgrade any fleets we may acquire in the future. Our fleets and other equipment typically do not generate revenue while they are undergoing maintenance, upgrades or refurbishment. Any maintenance, upgrade or refurbishment project for our assets could increase our indebtedness or reduce cash available for other opportunities. Furthermore, such projects may require proportionally greater capital investments as a percentage of total asset value, which may make such projects difficult to finance on acceptable terms. To the extent we are unable to fund such projects, we may have less equipment available for service or our equipment may not be attractive to potential or current customers. Additionally, competition or advances in technology within our industry may require us to update or replace existing fleets or build or acquire new fleets. Such demands on our capital or reductions in demand for our hydraulic fracturing fleets and the increase in cost of labor necessary for such maintenance and improvement, in each case, could have a material adverse effect on our business, liquidity position, financial condition, prospects and results of operations and may increase our costs.
We rely on a limited number of third parties for proppant and chemical additives, and delays in deliveries of such materials, increases in the cost of such materials or our contractual obligations to pay for materials that we ultimately do not require could harm our business, results of operations and financial condition.
We have established relationships with a limited number of suppliers of our raw materials (such as proppant and chemical additives). Should any of our current suppliers be unable to provide the necessary materials or otherwise fail to deliver the materials in a timely manner and in the quantities required, any resulting delays in the provision of services could have a material adverse effect on our business, results of operations and financial condition. Additionally, increasing costs of such materials may negatively impact demand for our services or the profitability of our business operations. In the past, our industry faced sporadic proppant shortages associated with hydraulic fracturing operations requiring work stoppages, which are believed to have adversely impacted the operating results of several competitors. We may not be able to mitigate any future shortages of materials, including proppant. Furthermore, to the extent our contracts require us to purchase more materials, including proppant, than we ultimately require, we may be forced to pay for the excess amount under “take or pay” contract provisions.
We currently rely on one assembler and a limited number of suppliers for major equipment to both build new fleets and upgrade any fleets we acquire to our custom design, and our reliance on these vendors exposes us to risks including price and timing of delivery.
We currently rely on one assembler and a limited number of suppliers for major equipment to both build our new fleets and upgrade any fleets we may acquire to our custom design. If demand for hydraulic fracturing fleets or the components necessary to build such fleets increases or these vendors face financial distress or bankruptcy, these vendors may not be able to provide the new or upgraded fleets on schedule or at the current price. If this were to occur, we could be required to seek another assembler or other suppliers for major equipment to build or upgrade our fleets, which may adversely affect our revenues or increase our costs.
Interruptions of service on the rail lines by which we receive proppant could adversely affect our results of operations.
We receive a significant portion of the proppant used in our hydraulic fracturing services by rail. Rail operations are subject to various risks that may result in a delay or lack of service, including lack of available capacity, mechanical problems, extreme weather conditions, work stoppages, labor strikes, terrorist attacks and operating hazards. Additionally, if we increase the amount of proppant we require for delivery of our services, we may face difficulty in securing rail transportation for such additional amount of proppant. Any delay or failure in the rail services on which we rely could have a material adverse effect on our financial condition and results of operations.
Delays or restrictions in obtaining permits by us for our operations or by our customers for their operations could impair our business.
In most states, our operations and the operations of our oil and natural gas producing customers require permits from one or more governmental agencies in order to perform drilling and completion activities, secure water rights, or other regulated activities. Such permits are typically issued by state agencies, but federal and local governmental permits may also be required.
19
The requirements for such permits vary depending on the location where such regulated activities will be conducted. As with all governmental permitting processes, there is a degree of uncertainty as to whether a permit will be granted, the time it will take for a permit to be issued, and the conditions that may be imposed in connection with the granting of the permit. In addition, some of our customers’ drilling and completion activities may take place on federal land or Native American lands, requiring leases and other approvals from the federal government or Native American tribes to conduct such drilling and completion activities or other regulated activities. Under certain circumstances, federal agencies may cancel proposed leases for federal lands and refuse to grant or delay required approvals. Therefore, our customers’ operations in certain areas of the United States may be interrupted or suspended for varying lengths of time, causing a loss of revenue to us and adversely affecting our results of operations in support of those customers.
Federal or state legislative and regulatory initiatives related to induced seismicity could result in operating restrictions or delays in the drilling and completion of oil and natural gas wells that may reduce demand for our services and could have a material adverse effect on our liquidity, combined results of operations and combined financial condition.
Our oil and natural gas producing customers dispose of flowback and produced water or certain other oilfield fluids gathered from oil and natural gas producing operations in accordance with permits issued by government authorities overseeing such disposal activities. While these permits are issued pursuant to existing laws and regulations, these legal requirements are subject to change based on concerns of the public or governmental authorities regarding such disposal activities. One such concern relates to seismic events near underground disposal wells used for the disposal by injection of flowback and produced water or certain other oilfield fluids resulting from oil and natural gas activities. In 2016, the United States Geological Survey identified six states with the most significant hazards from seismicity events suspected of having been induced by injection of oilfield fluids into underground disposal wells, including Oklahoma, Kansas, Texas, Colorado, New Mexico, and Arkansas. In response to concerns regarding the use of underground disposal wells and the occurrence of seismic events, regulators in some states have imposed, or are considering imposing, additional requirements in the permitting of produced water disposal wells or otherwise to assess any relationship between seismicity and the use of such wells. For example, Oklahoma has issued rules for produced water disposal wells that imposed certain permitting and operating restrictions and reporting requirements on disposal wells in proximity to faults and also, from time to time, has developed and implemented plans directing certain wells where seismic incidents have occurred to restrict or suspend disposal well operations. The Texas Railroad Commission has adopted similar rules. In late 2016, the Oil and Gas Conservation Division of the OCC and the Oklahoma Geological Survey released well completion seismicity guidance, which requires operators to take certain prescriptive actions, including an operator’s planned mitigation practices, following certain unusual seismic activity within 1.25 miles of hydraulic fracturing operations. In recent years, including during 2018, the OCC’s Oil and Gas Conservation Division issued orders limiting future increases in the volume of oil and natural gas produced water injected belowground into the Arbuckle formation in an effort to reduce the number of earthquakes in the state. Another consequence of seismic events may be lawsuits alleging that disposal well operations have caused damage to neighboring properties or otherwise violated state and federal rules regulating waste disposal. These developments could result in additional regulation and restrictions on the use of injection wells by our customers to dispose of flowback and produced water and certain other oilfield fluids. Increased regulation and attention given to seismicity events suspected of having been induced by injection of oilfield fluids into underground disposal wells also could lead to greater opposition to, and litigation concerning, oil and natural gas activities utilizing injection wells for waste disposal. Any of these developments may result in our customers having to limit disposal well volumes, disposal rates or locations, or require our customers or third party disposal well operators that are used to dispose of customers’ produced water to shut down disposal wells, which developments could adversely affect our customers’ business and result in a corresponding decrease in the need for our services, which could have a material adverse effect on our business, financial condition, and results of operations.
Federal, state and local legislative and regulatory initiatives relating to hydraulic fracturing as well as governmental reviews of such activities may serve to limit future oil and natural gas exploration and production activities and could have a material adverse effect on our results of operations and business.
Currently, hydraulic fracturing is generally exempt from regulation under the SDWA UIC program and is typically regulated by state oil and gas commissions or similar agencies. However, federal agencies have conducted investigations or asserted regulatory authority over certain aspects of the process. For example, in late 2016, the EPA released its final report on the potential impacts of hydraulic fracturing on drinking water resources, concluding that “water cycle” activities associated with hydraulic fracturing may impact drinking water resources under certain circumstances. Additionally, the EPA has asserted regulatory authority pursuant to the SDWA’s UIC program over hydraulic fracturing activities involving the use of diesel and issued guidance covering such activities, as well as published an Advance Notice of Proposed Rulemaking regarding Toxic Substances Control Act reporting of the chemical substances and mixtures used in hydraulic fracturing. The EPA also published final CAA regulations in 2012 and 2016 governing performance standards, including standards for the capture of emissions released during oil and natural gas hydraulic fracturing. Moreover, in 2016, the EPA published an effluent limit guideline final
20
rule prohibiting the discharge of produced water from onshore unconventional oil and natural gas extraction facilities to publicly owned wastewater treatment plants. The BLM published a final rule in 2015 that established new or more stringent standards relating to hydraulic fracturing on federal and Native American lands, but the BLM rescinded the 2015 rule in late 2017; however, litigation challenging the BLM’s decision to rescind the 2015 rule is pending in federal district court. From time to time, legislation has been introduced, but not enacted, in Congress to provide for federal regulation of hydraulic fracturing and to require disclosure of the chemicals used in the hydraulic fracturing process. In the event that new federal restrictions relating to the hydraulic fracturing process are adopted in areas where we or our customers conduct business, we or our customers may incur additional costs or permitting requirements to comply with such federal requirements that may be significant and, in the case of our customers, also could result in added restrictions, delays or curtailments in the pursuit of exploration, development, or production activities, which would in turn reduce the demand for our services.
Moreover, some states and local governments have adopted, and other governmental entities are considering adopting, regulations that could impose more stringent permitting, disclosure and well-construction requirements on hydraulic fracturing operations, including states where we or our customers operate. For example, Texas, Colorado and North Dakota among others have adopted regulations that impose new or more stringent permitting, disclosure, disposal, and well construction requirements on hydraulic fracturing operations. States could also elect to prohibit high volume hydraulic fracturing altogether, following the approach taken by the State of New York. Local land use restrictions, such as city ordinances, may also restrict drilling in general and/or hydraulic fracturing in particular.
Additionally, certain interest groups in Colorado opposed to oil and natural gas development generally, and hydraulic fracturing in particular, have from time to time advanced various options for ballot initiatives that, if approved, would revise either statutory law or the state constitution in a manner that would effectively prohibit or make such exploration and production activities in the state more difficult or expensive in the future. For example, in each of the November 2014, 2016 and 2018 general election cycles, ballot initiatives have been pursued, with the 2018 initiative making the November 2018 ballot, seeking to increase setback distances between new oil and natural gas development and specific occupied structures and/or certain environmentally sensitive or recreational areas that, if adopted, may have had significant adverse impacts on new oil and natural gas developments in the state. However, in each election cycle, the ballot initiative either did not secure a place on the general ballot or, as was the case in November 2018, was defeated. In the event that ballot initiatives or other regulatory programs arising out of protests or opposition by non-governmental organizations are adopted and result in more stringent limitations on the production and development of oil and natural gas in areas where we or our customers conduct operations, whether in Colorado or in another state, we may incur significant costs to comply with such requirements or our customers may experience restrictions, delays or curtailments in the permitting or pursuit of exploration, development, or production activities, which could reduce demand for our services. Such compliance costs or reduced demand for our services could have a material adverse effect on our business, prospects, results of operations, financial conditions, and liquidity.
Increased regulation and attention given to the hydraulic fracturing process could lead to greater opposition to, and litigation concerning, oil and natural gas production activities using hydraulic fracturing techniques. Additional legislation or regulation could also lead to operational delays for our customers or increased operating costs in the production of oil and natural gas, including from the developing shale plays, or could make it more difficult for us and our customers to perform hydraulic fracturing. The adoption of any federal, state or local laws or the implementation of regulations regarding hydraulic fracturing could potentially cause a decrease in the completion of new oil and natural gas wells and an associated decrease in demand for our services and increased compliance costs and time, which could have a material adverse effect on our liquidity, consolidated results of operations, and consolidated financial condition.
Changes in transportation regulations may increase our costs and negatively impact our results of operations.
We are subject to various transportation regulations including as a motor carrier by the DOT and by various federal, state and tribal agencies, whose regulations include certain permit requirements of highway and safety authorities. These regulatory authorities exercise broad powers over our trucking operations, generally governing such matters as the authorization to engage in motor carrier operations, safety, equipment testing, driver requirements and specifications and insurance requirements. The trucking industry is subject to possible regulatory and legislative changes that may impact our operations, such as changes in fuel emissions limits, hours of service regulations that govern the amount of time a driver may drive or work in any specific period and requiring onboard electronic logging devices or limits on vehicle weight and size. As the federal government continues to develop and propose regulations relating to fuel quality, engine efficiency and GHG emissions, we may experience an increase in costs related to truck purchases and maintenance, impairment of equipment productivity, a decrease in the residual value of vehicles, unpredictable fluctuations in fuel prices and an increase in operating expenses. Increased truck traffic may contribute to deteriorating road conditions in some areas where our operations are performed. Our operations, including routing and weight restrictions, could be affected by road construction, road repairs, detours and state and local regulations and ordinances restricting access to certain roads. Proposals to increase federal, state or local taxes, including taxes on motor fuels, are also made from time to time, and any such increase would increase our operating costs. Also, state and local regulation of permitted routes and times on specific roadways could adversely affect our operations. We cannot predict whether, or in what
21
form, any legislative or regulatory changes or municipal ordinances applicable to our logistics operations will be enacted and to what extent any such legislation or regulations could increase our costs or otherwise adversely affect our business or operations.
We are subject to environmental and occupational health and safety laws and regulations that may expose us to significant costs and liabilities.
Our operations and the operations of our customers are subject to numerous federal, tribal, regional, state and local laws and regulations relating to protection of the environment including natural resources, health and safety aspects of our operations and waste management, including the transportation and disposal of waste and other materials. These laws and regulations may impose numerous obligations on our operations and the operations of our customers, including the acquisition of permits or other approvals to conduct regulated activities, the imposition of restrictions on the types, quantities and concentrations of various substances that may be released into the environment or injected in non-productive formations below ground in connection with oil and natural gas drilling and production activities, the incurrence of capital expenditures to mitigate or prevent releases of materials from our equipment, facilities or from customer locations where we are providing services, the imposition of substantial liabilities for pollution resulting from our operations, and the application of specific health and safety criteria addressing worker protection. Any failure on our part or the part of our customers to comply with these laws and regulations could result in assessment of sanctions including administrative, civil and criminal penalties; imposition of investigatory, remedial or corrective action obligations or the incurrence of capital expenditures; the occurrence of restrictions, delays or cancellations in the permitting, performance or development of projects or operations; and the issuance of orders enjoining performance of some or all of our operations in a particular area.
Our business activities present risks of incurring significant environmental costs and liabilities, including costs and liabilities resulting from our handling of oilfield and other wastes, because of air emissions and wastewater discharges related to our operations, and due to historical oilfield industry operations and waste disposal practices. Moreover, accidental releases or spills may occur in the course of our operations or at facilities where our wastes are taken for reclamation or disposal, and we cannot assure you that we will not incur significant costs and liabilities as a result of such releases or spills, including any third-party claims for injuries to persons or damages to properties or natural resources. Some environmental laws and regulations may impose strict liability, which means that in some situations we could be exposed to liability as a result of our conduct that was lawful at the time it occurred or the conduct of, or conditions caused by, prior operators or other third parties. Remedial costs and other damages arising as a result of environmental laws and costs associated with changes in environmental laws and regulations could be significant and have a material adverse effect on our liquidity, combined results of operations and combined financial condition.
Laws and regulations protecting the environment generally have become more stringent in recent years and are expected to continue to do so, which could lead to material increases in costs for future environmental compliance and remediation. New laws and regulations, amendment of existing laws and regulations, reinterpretation of legal requirements or increased governmental enforcement with respect to environmental matters could restrict, delay or curtail exploratory or developmental drilling for oil and natural gas by our customers and could limit our well servicing opportunities. For example, in 2015 the EPA issued a final rule under the CAA, lowering the NAAQS for ground-level ozone from 75 parts per billion to 70 parts per billion under both the primary and secondary standards to provide requisite protection of public health and welfare, respectively. In 2017 and 2018, the EPA issued area designations with respect to ground-level ozone as either “attainment/unclassifiable,” “unclassifiable” or “nonattainment.” Additionally, in November 2018, the EPA issued final requirements that apply to state, local, and tribal air agencies for implementing the 2015 NAAQS for ground-level ozone. State implementation of the revised NAAQS could, among other things, require installation of new emission controls on some of our or our customer’s equipment, result in longer permitting timelines, and significantly increase our or our customers’ capital expenditures and operating costs. In another example, pursuant to a consent decree issued by the U.S. District Court for the District of Columbia in 2016, the EPA is required to propose no later than March 15, 2019, a rulemaking for revision of certain Subtitle D criteria regulations that could result in oil and natural gas exploration and production wastes being regulated as hazardous wastes, or sign a determination that revision of the regulations is necessary. If the EPA proposes a rulemaking for revised oil and natural gas wastes regulations, the consent decree requires that the EPA take final action following notice and comment rulemaking no later than July 15, 2021. We may not be able to recover some or any of our costs of compliance with these laws and regulations from insurance.
Silica-related legislation, health issues and litigation could have a material adverse effect on our business, reputation or results of operations.
We are subject to laws and regulations relating to human exposure to crystalline silica. For example, in 2016, OSHA published a final rule that established a more stringent permissible exposure limit for exposure to respirable crystalline silica and provided other provisions to protect employees, such as requirements for exposure assessments, methods for controlling exposure, respiratory protection, medical surveillance, hazard communication, and recording. Compliance with most aspects of the 2016 rule relating to hydraulic fracturing was required by June 2018, and the 2016 rule further requires compliance with
22
engineering control obligations to limit exposures to respirable crystalline silica in connection with hydraulic fracturing activities by June 2021. Historically, our environmental compliance costs with respect to existing crystalline silica requirements have not had a material adverse effect on our results of operations; however, federal regulatory authorities, including OSHA, and analogous state agencies may continue to propose changes in their regulations regarding workplace exposure to crystalline silica, such as permissible exposure limits and required controls and personal protective equipment. We may not be able to comply with any new laws and regulations that are adopted, and any new laws and regulations could have a material adverse effect on our operating results by requiring us to modify or cease our operations.
In addition, the inhalation of respirable crystalline silica is associated with the lung disease silicosis. There is evidence of an association between crystalline silica exposure or silicosis and lung cancer and a possible association with other diseases, including immune system disorders such as scleroderma. These health risks have been, and may continue to be, a significant issue confronting the hydraulic fracturing industry. Concerns over silicosis and other potential adverse health effects, as well as concerns regarding potential liability from the use of hydraulic fracture sand, may have the effect of discouraging our customers’ use of our hydraulic fracture sand. The actual or perceived health risks of handling hydraulic fracture sand could materially and adversely affect hydraulic fracturing service providers, including us, through reduced use of hydraulic fracture sand, the threat of product liability or employee lawsuits, increased scrutiny by federal, state and local regulatory authorities of us and our customers or reduced financing sources available to the hydraulic fracturing industry.
Anti-indemnity provisions enacted by many states may restrict or prohibit a party’s indemnification of us.
We typically enter into agreements with our customers governing the provision of our services, which usually include certain indemnification provisions for losses resulting from operations. Such agreements may require each party to indemnify the other against certain claims regardless of the negligence or other fault of the indemnified party; however, many states place limitations on contractual indemnity agreements, particularly agreements that indemnify a party against the consequences of its own negligence. Furthermore, certain states, including Texas, New Mexico and Wyoming, have enacted statutes generally referred to as “oilfield anti-indemnity acts” expressly prohibiting certain indemnity agreements contained in or related to oilfield services agreements. Such anti-indemnity acts may restrict or void a party’s indemnification of us, which could have a material adverse effect on our business, financial condition, prospects and results of operations.
Oil and natural gas companies’ operations using hydraulic fracturing are substantially dependent on the availability of water. Restrictions on the ability to obtain water for exploration and production activities and the disposal of flowback and produced water may impact their operations and have a corresponding adverse effect on our business, results of operations and financial condition.
Water is an essential component of shale oil and natural gas production during both the drilling and hydraulic fracturing processes. Our oil and natural gas producing customers’ access to water to be used in these processes may be adversely affected due to reasons such as periods of extended drought, privatization, third party competition for water in localized areas or the implementation of local or state governmental programs to monitor or restrict the beneficial use of water subject to their jurisdiction for hydraulic fracturing to assure adequate local water supplies. The occurrence of these or similar developments may result in limitations being placed on allocations of water due to needs by third party businesses with more senior contractual or permitting rights to the water. Our customers’ inability to locate or contractually acquire and sustain the receipt of sufficient amounts of water could adversely impact their exploration and production operations and have a corresponding adverse effect on our business, results of operations and financial condition.
Moreover, the imposition of new environmental regulations and other regulatory initiatives could include increased restrictions on our producing customers’ ability to dispose of flowback and produced water generated in hydraulic fracturing or other fluids resulting from exploration and production activities. Applicable laws, including the CWA, impose restrictions and strict controls regarding the discharge of pollutants into waters of the United States and require that permits or other approvals be obtained to discharge pollutants to such waters. In 2015, the EPA and the Corps released a final rule outlining their position on the federal jurisdictional reach over waters of the United States, including wetlands, but legal challenges to this rule followed. Beginning in the first quarter of 2017, the EPA and the Corps agreed to reconsider the 2015 rule and, thereafter, the agencies have (i) published a proposed rule in 2017 to rescind the 2015 rule and recodify the regulatory text that governed waters of the United States prior to promulgation of the 2015 rule, (ii) published a final rule in February 2018 adding a February 6, 2020 applicable date to the 2015 rule, and (iii) published a proposed rule in December 2018 re-defining the CWA’s jurisdiction over waters of the United States for which the agencies will seek public comment. The 2015 and February 2018 final rules are being challenged by various factions in the federal district court and implementation of the 2018 rule has been enjoined to twenty-eight states pending resolution of various federal district court challenges. As a result of these legal developments, future implementation of the 2015 rule is uncertain at this time. Any expansion of the CWA’s jurisdiction in areas where we or our customers operate, could impose additional permitting obligations on us and our customers.
23
Additionally, regulations implemented under the CWA and similar state laws prohibit the discharge of produced water and sand, drilling fluids, drill cuttings and certain other substances related to the natural gas and oil industry into coastal waters. In 2016, the EPA published final regulations concerning produced water discharges from hydraulic fracturing and certain other natural gas operations to publicly-owned wastewater treatment plants. The CWA and analogous state laws provide for civil, criminal and administrative penalties for any unauthorized discharges of pollutants and unauthorized discharges of reportable quantities of oil and hazardous substances. Compliance with current and future environmental regulations and permit requirements governing the withdrawal, storage and use of surface water or groundwater necessary for hydraulic fracturing of wells and any inability to secure transportation and access to disposal wells with sufficient capacity to accept all of our flowback and produced water on economic terms may increase our customers’ operating costs and could result in restrictions, delays, or cancellations of our customers’ operations, the extent of which cannot be predicted.
Our current and future indebtedness could adversely affect our financial condition.
As of February 28, 2019, we had $111.7 million outstanding under our Term Loan Facility and no borrowings outstanding under our ABL Facility (defined herein) with a borrowing base of $177.4 million, except for a letter of credit in the amount of $0.3 million. Please see “Management’s Discussion and Analysis of Financial Condition and Results of Operations—Debt Agreements.”
Moreover, subject to the limits contained in our ABL Facility and Term Loan Facility (collectively, the “Credit Facilities”), we may incur substantial additional debt from time to time. Any borrowings we may incur in the future would have several important consequences for our future operations, including that:
|
•
|
covenants contained in the documents governing such indebtedness may require us to meet or maintain certain financial tests, which may affect our flexibility in planning for, and reacting to, changes in our industry, such as being able to take advantage of acquisition opportunities when they arise;
|
|
•
|
our ability to obtain additional financing for working capital, capital expenditures, acquisitions, general corporate and other purposes may be limited;
|
|
•
|
we may be competitively disadvantaged to our competitors that are less leveraged or have greater access to capital resources; and
|
|
•
|
we may be more vulnerable to adverse economic and industry conditions.
|
If we incur indebtedness in the future, we may have significant principal payments due at specified future dates under the documents governing such indebtedness. Our ability to meet such principal obligations will be dependent upon future performance, which in turn will be subject to general economic conditions, industry cycles and financial, business and other factors affecting our operations, many of which are beyond our control. Our business may not continue to generate sufficient cash flow from operations to repay any incurred indebtedness. If we are unable to generate sufficient cash flow from operations, we may be required to sell assets, to refinance all or a portion of such indebtedness or to obtain additional financing.
Our Credit Facilities subject us to financial and other restrictive covenants. These restrictions may limit our operational or financial flexibility and could subject us to potential defaults under our Credit Facilities.
Our Credit Facilities subject us to restrictive covenants, including, but not limited to, restrictions on incurring additional debt and certain distributions. Our ability to comply with these financial condition tests can be affected by events beyond our control and we may not be able to do so.
The Credit Facilities are not subject to financial covenants unless our liquidity, as defined in the agreements governing the Credit Facilities, drops below a specified level, at which time we will be required to maintain certain fixed charge coverage ratios. Please see “Management’s Discussion and Analysis of Financial Condition and Results of Operations—Debt Agreements.”
If our liquidity falls below the prescribed level and we are unable to remain in compliance with the financial covenants of our Credit Facilities, then amounts outstanding thereunder may be accelerated and become due immediately. Any such acceleration could have a material adverse effect on our financial condition and results of operations.
Increases in interest rates could adversely impact the price of our shares, our ability to issue equity or incur debt for acquisitions or other purposes.
Interest rates on future borrowings, credit facilities and debt offerings could be higher than current levels, causing our financing costs to increase accordingly. Changes in interest rates, either positive or negative, may affect the yield requirements of investors who invest in our shares, and a rising interest rate environment could have an adverse impact on the price of our shares, our ability to issue equity or incur debt for acquisitions or other purposes.
24
Fuel conservation measures could reduce demand for oil and natural gas which would in turn reduce the demand for our services.
Fuel conservation measures, alternative fuel requirements and increasing consumer demand for alternatives to oil and natural gas could reduce demand for oil and natural gas. The impact of the changing demand for oil and natural gas may have a material adverse effect on our business, financial condition, prospects, results of operations and cash flows. Additionally, the increased competitiveness of alternative energy sources (such as wind, solar geothermal, tidal, and biofuels) could reduce demand for hydrocarbons and therefore for our services, which would lead to a reduction in our revenues.
Unsatisfactory safety performance may negatively affect our customer relationships and, to the extent we fail to retain existing customers or attract new customers, adversely impact our revenues.
Our ability to retain existing customers and attract new business is dependent on many factors, including our ability to demonstrate that we can reliably and safely operate our business in a manner that is consistent with applicable laws, rules and permits, which legal requirements are subject to change. Existing and potential customers consider the safety record of their third-party service providers to be of high importance in their decision to engage such providers. If one or more accidents were to occur at one of our operating sites, the affected customer may seek to terminate or cancel its use of our equipment or services and may be less likely to continue to use our services, which could cause us to lose substantial revenues. Furthermore, our ability to attract new customers may be impaired if they elect not to engage us because they view our safety record as unacceptable. In addition, it is possible that we will experience multiple or particularly severe accidents in the future, causing our safety record to deteriorate. This may be more likely as we continue to grow, if we experience high employee turnover or labor shortage, or hire inexperienced personnel to bolster our staffing needs.
Climate change legislation and regulations restricting or regulating emissions of greenhouse gases could result in increased operating and capital costs and reduced demand for our hydraulic fracturing services.
Climate change continues to attract considerable public, governmental and scientific attention. As a result, numerous proposals have been made and are likely to continue to be made at the international, national, regional and state levels of government to monitor and limit emissions of GHGs. These efforts have included consideration of cap-and-trade programs, carbon taxes, GHG reporting and tracking programs and regulations that directly limit GHG emissions from certain sources.
At the federal level, no comprehensive climate change legislation has been implemented to date. The EPA has, however, adopted rules under authority of the existing CAA that, among other things, establish Potential for Significant Deterioration (“PSD”) construction and Title V operating permit reviews for GHG emissions from certain large stationary sources that are also potential major sources of certain principal, or criteria, pollutant emissions, which reviews could require securing PSD permits at covered facilities emitting GHGs and meeting “best available control technology” standards for those GHG emissions. In addition, the EPA has adopted rules requiring the monitoring and annual reporting of GHG emissions from certain petroleum and natural gas system sources in the U.S., including, among others, onshore and offshore production facilities, which include certain of our producing customers’ operations. In 2015, the EPA amended and expanded the GHG reporting requirements to all segments of the oil and natural gas industry, including gathering and boosting facilities as well as completions and workovers from hydraulically fractured oil wells.
Federal agencies also have begun directly regulating emissions of methane, a GHG, from oil and natural gas operations. In 2016, the EPA published NSPS Subpart OOOOa, which requires certain new, modified or reconstructed equipment and processes in the oil and natural gas source category to reduce these methane gas and volatile organic compound (“VOC”) emissions. These Subpart OOOOa standards will expand previously issued NSPS Subpart OOOO published by the EPA in 2012 by using certain equipment-specific emissions control practices. However, in 2017, the EPA published a proposed rule to stay certain portions of these Subpart OOOOa standards for two years but the rule was not finalized. Rather, in February 2018, the EPA finalized amendments to certain requirements of the 2016 final rule, and in September 2018 the EPA proposed additional amendments, including rescission of certain requires and revisions to other requirements, such as fugitive emissions monitoring frequency. Furthermore, in late 2016, the BLM published a final rule that established, among other things, requirements to reduce methane emissions by regulating venting, flaring and leaks from oil and natural gas production activities on onshore federal and Native American lands. However, in September 2018, the BLM published a final rule that rescinds most of the new requirements of the 2016 final rule and codifies the BLM’s prior approach to venting and flaring but the rule rescinding the 2016 final rule has been challenged in federal court and remains pending. In the event that the EPA’s 2016 or the BLM’s 2016 rules should remain or be placed in effect, or should any other new methane emission standards be imposed on the oil and natural gas sector, such requirements could result in increased costs to our or our customers’ operations as well as result in restrictions, delays or curtailments in such operations, which costs, restrictions, delays or curtailments could adversely affect our business. In April 2016 the United States entered into the Paris Agreement to limit GHG emissions through individually determined reduction goals every five years beginning in 2020. However, in August 2017, the U.S. State Department informed
25
the United Nations of the intent of the United States to withdraw from the Paris Agreement. The Paris Agreement provides for a four-year exit process beginning when it took effect in November 2016, which would result in an effective exit date of November 2020. The United States’ adherence to the exit process and/or the terms on which the United States may reenter the Paris Agreement or a separately negotiated agreement are unclear at this time. The adoption and implementation of any international, federal or state legislation or regulations that require reporting of GHGs or otherwise restrict emissions of GHGs could result in increased compliance costs or additional operating restrictions, and could have a material adverse effect on our business, financial condition, demand for our services, results of operations, and cash flows.
Notwithstanding potential risks related to climate change, the International Energy Agency estimates that oil and natural gas will continue to represent a major share of global energy use through 2040, and other studies by the private sector project continued growth in demand for the next two decades. However, recent activism directed at shifting funding away from companies with energy-related assets could result in limitations or restrictions on certain sources of funding for the energy sector. Ultimately this could make it more difficult to secure funding for exploration and production or midstream activities. Finally, increasing concentrations of GHGs in the Earth’s atmosphere may produce climate changes that have significant physical effects, such as increased frequency and severity of storms, floods and other climatic events. If any such effects were to occur, they could have an adverse effect on our operations.
The Endangered Species Act and Migratory Bird Treaty Act and other restrictions intended to protect certain species of wildlife govern our and our oil and natural gas producing customers’ operations and additional restrictions may be imposed in the future, which constraints could have an adverse impact on our ability to expand some of our existing operations or limit our customers’ ability to develop new oil and natural gas wells.
Oil and natural gas operations in our operating areas can be adversely affected by seasonal or permanent restrictions on drilling activities designed to protect various wildlife, which may limit our ability to operate in protected areas. Permanent restrictions imposed to protect endangered or threatened species could prohibit drilling in certain areas or require the implementation of expensive mitigation measures.
For example, the ESA restricts activities that may affect endangered or threatened species or their habitats. Similar protections are offered to migratory birds under the MBTA. To the extent species that are listed under the ESA or similar state laws, or are protected under the MBTA, live in the areas where we or our oil and natural gas producing customers’ operate, our and our customers’ abilities to conduct or expand operations and construct facilities could be limited or be forced to incur material additional costs. Moreover, our customer’s drilling activities may be delayed, restricted or precluded in protected habitat areas or during certain seasons, such as breeding and nesting seasons. Some of our operations and the operations of our customers are located in areas that are designated as habitats for protected species.
Moreover, as a result of one or more settlements approved by the federal government, the FWS must make determinations on the listing of numerous species as endangered or threatened under the ESA pursuant to specific timelines. The designation of previously unidentified endangered or threatened species could indirectly cause us to incur additional costs, cause our or our oil and natural gas producing customers’ operations to become subject to operating restrictions or bans, and limit future development activity in affected areas. The FWS and similar state agencies may designate critical or suitable habitat areas that they believe are necessary for the survival of threatened or endangered species. Such a designation could materially restrict use of or access to federal, state and private lands.
We may have difficulty managing growth of our business, which could adversely affect our financial condition and results of operations.
As a recently formed company, growth of our business could place a significant strain on our financial, technical, operational and management resources. As we expand the scope of our activities and our geographic coverage through organic growth, there will be additional demands on our financial, technical, operational and management resources. The failure to continue to upgrade our technical, administrative, operating and financial control systems or the occurrences of unexpected expansion difficulties, including the failure to recruit and retain experienced managers, engineers and other professionals in the oilfield services industry, could have a material adverse effect on our business, financial condition, results of operations and our ability to successfully or timely execute our business plan.
26
We rely on a few key employees whose absence or loss could adversely affect our business.
Many key responsibilities within our business have been assigned to a small number of employees. The loss of their services could adversely affect our business. In particular, the loss of the services of one or more members of our executive team, including our chief executive officer, chief financial officer and president, could disrupt our operations. We do not have any written employment agreement with our executives at this time. Further, we do not maintain “key person” life insurance policies on any of our employees. As a result, we are not insured against any losses resulting from the death of any of our key employees.
We may be subject to risks in connection with acquisitions.
We have completed and may, in the future, pursue asset acquisitions or acquisitions of businesses. The process of upgrading acquired assets to our specifications and integrating acquired assets or businesses may involve unforeseen costs and delays or other operational, technical and financial difficulties and may require a significant amount time and resources. Our failure to incorporate acquired assets or businesses into our existing operations successfully or to minimize any unforeseen operational difficulties could have a material adverse effect on our financial condition and results of operations. Such events could also mean an acquisition that we expected to be accretive is not accretive and, in extreme cases, the asset is idle.
Our industry overall has experienced a high rate of employee turnover. Any difficulty we experience replacing or adding personnel could have a material adverse effect on our liquidity, results of operations and financial condition.
We are dependent upon the available labor pool of skilled employees and may not be able to find enough skilled labor to meet our needs, which could have a negative effect on our growth. We are also subject to the Fair Labor Standards Act, which governs such matters as minimum wage, overtime and other working conditions. Our services require skilled workers who can perform physically demanding work. As a result of our industry volatility, including pronounced declines in drilling activity, as well as the demanding nature of the work, many workers have left the hydraulic fracturing industry to pursue employment in different fields. Though our historical turnover rates have been significantly lower than those of our competitors, if we are unable to retain or meet growing demand for skilled technical personnel, our operating results and our ability to execute our growth strategies may be adversely affected.
Technology advancements in well service technologies, including those involving hydraulic fracturing, could have a material adverse effect on our business, financial condition and results of operations.
The hydraulic fracturing industry is characterized by rapid and significant technological advancements and introductions of new products and services using new technologies. As competitors and others use or develop new technologies or technologies comparable to ours in the future, we may lose market share or be placed at a competitive disadvantage. Further, we may face competitive pressure to implement or acquire certain new technologies at a substantial cost. Some of our competitors may have greater financial, technical and personnel resources than we do, which may allow them to gain technological advantages or implement new technologies before we can. Additionally, we may be unable to implement new technologies or services at all, on a timely basis or at an acceptable cost. New technology could also make it easier for our customers to vertically integrate their operations, thereby reducing or eliminating the need for our services. Limits on our ability to effectively use or implement new technologies may have a material adverse effect on our business, financial condition and results of operations.
We may be subject to claims for personal injury and property damage, which could materially adversely affect our financial condition, prospects and results of operations.
Our services are subject to inherent risks that can cause personal injury or loss of life, damage to or destruction of property, equipment or the environment or the suspension of our operations. Litigation arising from operations where our services are provided, may cause us to be named as a defendant in lawsuits asserting potentially large claims including claims for exemplary damages. We maintain what we believe is customary and reasonable insurance to protect our business against these potential losses, but such insurance may not be adequate to cover our liabilities, and we are not fully insured against all risks.
In addition, our customers assume responsibility for, including control and removal of, all other pollution or contamination which may occur during operations, including that which may result from seepage or any other uncontrolled flow of drilling and completion fluids. We may have liability in such cases if we are grossly negligent or commit willful acts. Our customers generally agree to indemnify us against claims arising from their employees’ personal injury or death to the extent that, in the case of our hydraulic fracturing operations, their employees are injured by such operations, unless resulting from our gross negligence or willful misconduct. Our customers also generally agree to indemnify us for loss or destruction of customer-owned property or equipment. In turn, we agree to indemnify our customers for loss or destruction of property or
27
equipment we own and for liabilities arising from personal injury to or death of any of our employees, unless resulting from gross negligence or willful misconduct of the customer. However, we might not succeed in enforcing such contractual liability allocation or might incur an unforeseen liability falling outside the scope of such allocation. As a result, we may incur substantial losses which could materially and adversely affect our financial condition and results of operation.
Seasonal weather conditions and natural disasters could severely disrupt normal operations and harm our business.
Our operations are located in different regions of the United States. Some of these areas, including the DJ Basin, Powder River Basin and Williston Basin, are adversely affected by seasonal weather conditions, primarily in the winter and spring. During periods of heavy snow, ice or rain, we may be unable to move our equipment between locations, thereby reducing our ability to provide services and generate revenues. The exploration activities of our customers may also be affected during such periods of adverse weather conditions. Additionally, extended drought conditions in our operating regions could impact our ability or our customers’ ability to source sufficient water or increase the cost for such water. As a result, a natural disaster or inclement weather conditions could severely disrupt the normal operation of our business and adversely impact our financial condition and results of operations.
If we are unable to fully protect our intellectual property rights, we may suffer a loss in our competitive advantage or market share.
We do not have patents or patent applications relating to many of our key processes and technology. If we are not able to maintain the confidentiality of our trade secrets, or if our competitors are able to replicate our technology or services, our competitive advantage would be diminished. We also cannot assure you that any patents we may obtain in the future would provide us with any significant commercial benefit or would allow us to prevent our competitors from employing comparable technologies or processes.
We may be adversely affected by disputes regarding intellectual property rights of third parties.
Third parties from time to time may initiate litigation against us by asserting that the conduct of our business infringes, misappropriates or otherwise violates intellectual property rights. We may not prevail in any such legal proceedings related to such claims, and our products and services may be found to infringe, impair, misappropriate, dilute or otherwise violate the intellectual property rights of others. If we are sued for infringement and lose, we could be required to pay substantial damages and/or be enjoined from using or selling the infringing products or technology. Any legal proceeding concerning intellectual property could be protracted and costly regardless of the merits of any claim and is inherently unpredictable and could have a material adverse effect on our financial condition, regardless of its outcome.
If we were to discover that our technologies or products infringe valid intellectual property rights of third parties, we may need to obtain licenses from these parties or substantially re-engineer our products in order to avoid infringement. We may not be able to obtain the necessary licenses on acceptable terms, or at all, or be able to re-engineer our products successfully. If our inability to obtain required licenses for our technologies or products prevents us from selling our products, that could adversely impact our financial condition and results of operations.
Additionally, we currently license certain third party intellectual property in connection with our business, and the loss of any such license could adversely impact our financial condition and results of operations.
We may be subject to interruptions or failures in our information technology systems.
We rely on sophisticated information technology systems and infrastructure to support our business, including process control technology. Any of these systems may be susceptible to outages due to fire, floods, power loss, telecommunications failures, usage errors by employees, computer viruses, cyber-attacks or other security breaches, or similar events. The failure of any of our information technology systems may cause disruptions in our operations, which could adversely affect our sales and profitability.
We are subject to cyber security risks. A cyber incident could occur and result in information theft, data corruption, operational disruption and/or financial loss.
The oil and natural gas industry has become increasingly dependent on digital technologies to conduct certain processing activities. For example, we depend on digital technologies to perform many of our services and to process and record financial and operating data. At the same time, cyber incidents, including deliberate attacks, have increased. The U.S. government has issued public warnings that indicate that energy assets might be specific targets of cyber security threats. Our technologies, systems and networks, and those of our vendors, suppliers and other business partners, may become the target of cyberattacks or information security breaches that could result in the unauthorized release, gathering, monitoring, misuse, loss or destruction of proprietary and other information, or other disruption of business operations. In addition, certain cyber incidents, such as
28
surveillance, may remain undetected for an extended period. Our systems and insurance coverage for protecting against cyber security risks may not be sufficient. As cyber incidents continue to evolve, we will likely be required to expend additional resources to continue to modify or enhance our protective measures or to investigate and remediate any vulnerability to cyber incidents. Our insurance coverage for cyberattacks may not be sufficient to cover all the losses we may experience as a result of such cyberattacks.
A terrorist attack or armed conflict could harm our business.
The occurrence or threat of terrorist attacks in the United States or other countries, anti-terrorist efforts and other armed conflicts involving the United States or other countries, including continued hostilities in the Middle East, may adversely affect the United States and global economies and could prevent us from meeting our financial and other obligations. If any of these events occur, the resulting political instability and societal disruption could reduce overall demand for oil and natural gas, potentially putting downward pressure on demand for our services and causing a reduction in our revenues. Oil and natural gas related facilities could be direct targets of terrorist attacks, and our operations could be adversely impacted if infrastructure integral to our customers’ operations is destroyed or damaged. Costs for insurance and other security may increase as a result of these threats, and some insurance coverage may become more difficult to obtain, if available at all.
We engage in transactions with related parties and such transactions present possible conflicts of interest that could have an adverse effect on us.
We have entered into a significant number of transactions with related parties. Related party transactions create the possibility of conflicts of interest with regard to our management, including that:
|
•
|
we may enter into contracts between us, on the one hand, and related parties, on the other, that are not the result of arm’s-length transactions;
|
|
•
|
our executive officers and directors that hold positions of responsibility with related parties may be aware of certain business opportunities that are appropriate for presentation to us as well as to such other related parties and may present such business opportunities to such other parties; and
|
|
•
|
our executive officers and directors that hold positions of responsibility with related parties may have significant duties with, and spend significant time serving, other entities and may have conflicts of interest in allocating time.
|
Such conflicts could cause an individual in our management to seek to advance his or her economic interests or the economic interests of certain related parties above ours. Further, the appearance of conflicts of interest created by related party transactions could impair the confidence of our investors. Our audit committee reviews these transactions. Notwithstanding this, it is possible that a conflict of interest could have a material adverse effect on our liquidity, results of operations and financial condition.
Our historical financial statements may not be indicative of future performance.
Due to the significant increase in our capacity, our movement into new basins and our acquisitions of certain assets, comparisons of our current and future operating results with prior periods are difficult. As a result, our limited historical financial performance as the owner of the acquired assets may make it difficult for stockholders to evaluate our business and results of operations to date and to assess our future prospects and viability. Furthermore, as a result of the volatility in the demand for well services and our future implementation of new business initiatives and strategies, our historical results of operations are not necessarily indicative of our ongoing operations and the operating results to be expected in the future.
We may record losses or impairment charges related to idle assets or assets that we sell.
Prolonged periods of low utilization, changes in technology or the sale of assets below their carrying value may cause us to experience losses. These events could result in the recognition of impairment charges that negatively impact our financial results. Significant impairment charges as a result of a decline in market conditions or otherwise could have a material adverse effect on our results of operations in future periods.
29
Risks Related to Our Class A Common Stock
Liberty Inc. is a holding company. Liberty Inc.’s only material asset is its equity interest in Liberty LLC, and Liberty Inc. is accordingly dependent upon distributions from Liberty LLC to pay taxes, make payments under the TRAs and cover its corporate and other overhead expenses.
Liberty Inc. is a holding company and has no material assets other than its equity interest in Liberty LLC. Please see “Item 1. Business—Initial Public Offering and Corporate Reorganization Transaction.” Liberty Inc. has no independent means of generating revenue. To the extent Liberty LLC has available cash, Liberty Inc. intends to cause Liberty LLC to make (i) generally pro rata distributions to its unit holders, including Liberty Inc., in an amount sufficient to allow Liberty Inc. to pay its taxes and to allow it to make payments under the TRAs and (ii) non-pro rata payments to Liberty Inc. to reimburse it for its corporate and other overhead expenses. To the extent that Liberty Inc. needs funds and Liberty LLC or its subsidiaries are restricted from making such distributions or payments under applicable law or regulation or under the terms of any future financing arrangements, or are otherwise unable to provide such funds, Liberty Inc.’s liquidity and financial condition could be materially adversely affected.
Moreover, because Liberty Inc. has no independent means of generating revenue, Liberty Inc.’s ability to make payments under the TRAs is dependent on the ability of Liberty LLC to make distributions to Liberty Inc. in an amount sufficient to cover its obligations under the TRAs. This ability, in turn, may depend on the ability of Liberty LLC’s subsidiaries to make distributions to it. The ability of Liberty LLC, its subsidiaries and other entities in which it directly or indirectly holds an equity interest to make such distributions will be subject to, among other things, (i) the applicable provisions of Delaware law (or other applicable jurisdiction) that may limit the amount of funds available for distribution and (ii) restrictions in relevant debt instruments issued by Liberty LLC or its subsidiaries and other entities in which it directly or indirectly holds an equity interest. To the extent that Liberty Inc. is unable to make payments under the TRAs for any reason, such payments will be deferred and will accrue interest until paid.
The requirements of being a public company, including compliance with the reporting requirements of the Exchange Act, and the requirements of the Sarbanes-Oxley Act, may strain our resources, increase our costs and distract management, and we may be unable to comply with these requirements in a timely or cost-effective manner.
As a public company, we need to comply with various laws, regulations and requirements, certain corporate governance provisions of the Sarbanes-Oxley Act, related regulations of the SEC and the requirements of the NYSE, which we were not required to comply with as a private company. Complying with these statutes, regulations and requirements will occupy a significant amount of time of the Board and management and will significantly increase our costs and expenses.
Furthermore, we are required to have our independent registered public accounting firm attest to the effectiveness of our internal controls, in accordance with Section 404 of the Sarbanes Oxley Act for our fiscal year ending December 31, 2019. Our independent registered public accounting firm may issue a report that is adverse in the event it is not satisfied with the level at which our controls are documented, designed, operated or reviewed. Compliance with these requirements may strain our resources, increase our costs and distract management, and we may be unable to comply with these requirements in a timely or cost-effective manner.
In addition, it is possible that being a public company subject to these rules and regulations may make it more difficult and more expensive for us to obtain director and officer liability insurance and we may be required to accept reduced policy limits and coverage or incur substantially higher costs to obtain the same or similar coverage. As a result, it may be more difficult for us to attract and retain qualified individuals to serve on the Board or as executive officers. We cannot predict or estimate the amount of additional costs we may incur or the timing of such costs.
If we fail to maintain an effective system of internal controls, we may not be able to accurately report our financial results or prevent fraud. As a result, current and potential stockholders could lose confidence in our financial reporting, which would harm our business and the trading price of our Class A Common Stock.
Effective internal controls are necessary for us to provide reliable financial reports, safeguard our assets, prevent fraud and operate successfully as a public company. If we cannot provide reliable financial reports, safeguard our assets, or prevent fraud, our reputation and operating results could be harmed. We cannot be certain that our efforts to develop and maintain our internal controls will be successful, that we will be able to maintain adequate controls over our financial processes and reporting in the future or that we will be able to comply with our obligations under Section 404 of the Sarbanes Oxley Act. Any failure to develop or maintain effective internal controls, or difficulties encountered in implementing or improving our existing internal controls, could harm our operating results or cause us to fail to meet our reporting obligations. An ineffective system of internal controls could also cause investors to lose confidence in our reported financial information, which would likely have a negative effect on the trading price of our Class A Common Stock.
30
We are subject to certain requirements of Section 404 of the Sarbanes-Oxley Act. If we are unable to timely comply with Section 404 or if the costs related to compliance are significant, our profitability, stock price, results of operations and financial condition could be materially adversely affected.
We are required to comply with certain provisions of Section 404 of the Sarbanes-Oxley Act of 2002. Section 404 requires that we document and test our internal control over financial reporting and issue management’s assessment of our internal control over financial reporting. During 2018, we evaluated our existing controls against the standards adopted by the Committee of Sponsoring Organizations of the Treadway Commission and concluded our internal control over financial reporting was effective as of December 31, 2018. As we are not an accelerated filer nor a large accelerated filer as defined in Rule 12b-2 under Section 404, our independent registered public accounting firm is not yet required to formally attest to the effectiveness of our internal control over financial reporting for the year ended December 31, 2018. During the course of our ongoing evaluation and integration of the internal control over financial reporting, we may identify areas requiring improvement, and we may have to design enhanced processes and controls to address issues identified through this review.
An active, liquid and orderly trading market for our Class A Common Stock may not be maintained, and our stock price may be volatile.
Prior to January 2018, our Class A Common Stock was not traded on any market. An active, liquid and orderly trading market for our Class A Common Stock may not be maintained. Active, liquid and orderly trading markets usually result in less price volatility and more efficiency in carrying out investors’ purchase and sale orders. The market price of our Class A Common Stock could vary significantly as a result of a number of factors, some of which are beyond our control. In the event of a drop in the market price of our Class A Common Stock, you could lose a substantial part or all of your investment in our Class A Common Stock.
The following factors could affect our stock price:
|
•
|
quarterly variations in our financial and operating results;
|
|
•
|
the public reaction to our press releases, our other public announcements and our filings with the SEC;
|
|
•
|
strategic actions by our competitors;
|
|
•
|
changes in revenue or earnings estimates, or changes in recommendations or withdrawal of research coverage, by equity research analysts;
|
|
•
|
speculation in the press or investment community;
|
|
•
|
the failure of specific research analysts to cover our Class A Common Stock;
|
|
•
|
sales of our Class A Common Stock by us or other stockholders, or the perception that such sales may occur;
|
|
•
|
changes in accounting principles, policies, guidance, interpretations or standards;
|
|
•
|
additions or departures of key management personnel;
|
|
•
|
actions by our stockholders;
|
|
•
|
general market conditions, including fluctuations in commodity prices;
|
|
•
|
domestic and international economic, legal and regulatory factors unrelated to our performance; and
|
|
•
|
the realization of any risks described under this “Risk Factors” section.
|
The stock markets in general have experienced extreme volatility that has often been unrelated to the operating performance of particular companies. These broad market fluctuations may adversely affect the trading price of our Class A Common Stock. Securities class action litigation has often been instituted against companies following periods of volatility in the overall market and in the market price of a company’s securities. Such litigation, if instituted against us, could result in very substantial costs, divert our management’s attention and resources and harm our business, operating results and financial condition.
31
We are a “controlled company” within the meaning of the NYSE rules and, as a result, qualify for and rely on exemptions from certain corporate governance requirements. As a result, our stockholders do not have the same protections afforded to stockholders of companies that cannot rely on such exemptions and are subject to such requirements.
Riverstone/Carlyle Energy Partners IV, L.P., R/C IV Liberty Holdings, L.P. and R/C Energy IV Direct Partnership, L.P. (collectively “Riverstone”) and certain of the Legacy Owners (with Riverstone, collectively, the “Principal Stockholders”) party to a stockholders’ agreement with us control a majority of the combined voting power of our Common Stock. As a result, we are a “controlled company” within the meaning of the NYSE corporate governance standards. Under these rules, a company of which more than 50% of the voting power is held by an individual, a group or another company is a “controlled company” and may elect not to comply with certain corporate governance requirements of the NYSE, including the requirement (1) that a majority of the board of directors consist of independent directors, (2) that we have a nominating and corporate governance committee composed entirely of independent directors with a written charter addressing the committee’s purpose and responsibilities, and (3) that we have a compensation committee composed entirely of independent directors with a written charter addressing the committee’s purpose and responsibilities. We intend to rely on some or all of these exemptions. As a result, we do not have a majority of independent directors or a nominating or governance committee, and our compensation committee does not consist entirely of independent directors. Accordingly, our stockholders do not have the same protections afforded to stockholders of companies subject to all of the corporate governance requirements of the NYSE.
The Principal Stockholders collectively hold a substantial majority of the voting power of our Common Stock
The Principal Stockholders hold over 50% of our Common Stock. As a result, such owners are able to control matters requiring stockholder approval, including the election of directors, changes to our organizational documents and significant corporate transactions. This concentration of ownership makes it unlikely that any other holder or group of holders of our Class A Common Stock will be able to affect the way we are managed or the direction of our business. The interests of the Principal Stockholders with respect to matters potentially or actually involving or affecting us, such as future acquisitions, financings and other corporate opportunities and attempts to acquire us, may conflict with the interests of our other stockholders.
For example, the Principal Stockholders may have different tax positions from us, especially in light of the TRAs, that could influence their decisions regarding whether and when to support the disposition of assets, the incurrence or refinancing of new or existing indebtedness, or the termination of the TRAs and acceleration of our obligations thereunder. In addition, the determination of future tax reporting positions, the structuring of future transactions and the handling of any challenge by any taxing authority to our tax reporting positions may take into consideration the Principal Stockholders tax position or other considerations which may differ from the considerations of us or our other stockholders. For further details of the TRAs, see Note 10, “Income Taxes” to the consolidated and combined financial statements included in “Item 8. Financial Statements and Supplementary Data.”
Given this concentrated ownership, the Principal Stockholders would have to approve any potential acquisition of us. Furthermore, in connection with the IPO, we entered into a stockholders’ agreement with the Principal Stockholders. The stockholders’ agreement provides Riverstone with the right to designate a certain number of nominees to the Board so long as Riverstone and its affiliates collectively beneficially own at least 10% of the outstanding shares of our Class A Common Stock. In addition, the stockholders’ agreement provides Riverstone the right to approve certain material transactions so long as Riverstone and its affiliates own at least 20% of the outstanding shares of our Class A Common Stock. The existence of significant stockholders may have the effect of deterring hostile takeovers, delaying or preventing changes in control or changes in management, or limiting the ability of our other stockholders to approve transactions that they may deem to be in the best interests of our company. Moreover, the Principal Stockholders concentration of stock ownership may adversely affect the trading price of our Class A Common Stock to the extent investors perceive a disadvantage in owning stock of a company with significant stockholders.
Certain of our executive officers and directors have significant duties with, and spend significant time serving, entities that may compete with us in seeking acquisitions and business opportunities and, accordingly, may have conflicts of interest in allocating time or pursuing business opportunities.
Certain of our executive officers and directors, who are responsible for managing the direction of our operations, hold positions of responsibility with other entities (including affiliated entities) that are in the oil and natural gas industry. For example, Christopher Wright, our Chairman and Chief Executive Officer, is the Executive Chairman of Liberty Resources LLC (“Liberty Resources”), an E&P company operating primarily in the Williston Basin, a position which may require a portion of his time. These executive officers and directors may become aware of business opportunities that may be appropriate for presentation to us as well as to the other entities with which they are or may become affiliated. Due to these existing and potential future affiliations, they may present potential business opportunities to other entities prior to presenting them to us, which could cause additional conflicts of interest. They may also decide that certain opportunities are more appropriate for
32
other entities with which they are affiliated, and as a result, they may elect not to present those opportunities to us. These conflicts may not be resolved in our favor.
Riverstone and its respective affiliates are not limited in their ability to compete with us, and the corporate opportunity provisions in our amended and restated certificate of incorporation could enable Riverstone to benefit from corporate opportunities that might otherwise be available to us.
Our governing documents provide that Riverstone and its respective affiliates (including portfolio investments of Riverstone and its affiliates) are not restricted from owning assets or engaging in businesses that compete directly or indirectly with us. In particular, subject to the limitations of applicable law, our amended and restated certificate of incorporation will, among other things:
|
•
|
permits Riverstone and its respective affiliates to conduct business that competes with us and to make investments in any kind of property in which we may make investments; and
|
|
•
|
provides that if Riverstone or its respective affiliates, or any employee, partner, member, manager, officer or director of Riverstone or its respective affiliates who is also one of our directors or officers, becomes aware of a potential business opportunity, transaction or other matter, they have no duty to communicate or offer that opportunity to us.
|
Riverstone or its respective affiliates may become aware, from time to time, of certain business opportunities (such as acquisition opportunities) and may direct such opportunities to other businesses in which they have invested, in which case we may not become aware of or otherwise have the ability to pursue such opportunity. Furthermore, such businesses may choose to compete with us for these opportunities, possibly causing these opportunities to not be available to us or causing them to be more expensive for us to pursue. In addition, Riverstone and its respective affiliates may dispose of oil and natural gas properties or other assets in the future, without any obligation to offer us the opportunity to purchase any of those assets. As a result, our renouncing our interest and expectancy in any business opportunity that may be from time to time presented to Riverstone and its respective affiliates could adversely impact our business or prospects if attractive business opportunities are procured by such parties for their own benefit rather than for ours.
Our amended and restated certificate of incorporation and amended and restated bylaws, as well as Delaware law, contain provisions that could discourage acquisition bids or merger proposals, which may adversely affect the market price of our Class A Common Stock and could deprive our investors of the opportunity to receive a premium for their shares.
Our amended and restated certificate of incorporation authorizes the Board to issue preferred stock without stockholder approval in one or more series, designate the number of shares constituting any series, and fix the rights, preferences, privileges and restrictions thereof, including dividend rights, voting rights, rights and terms of redemption, redemption price or prices and liquidation preferences of such series. If the Board elects to issue preferred stock, it could be more difficult for a third party to acquire us. In addition, some provisions of our amended and restated certificate of incorporation and amended and restated bylaws could make it more difficult for a third party to acquire control of us, even if the change of control would be beneficial to our stockholders. These provisions include:
|
•
|
after we cease to be a controlled company, dividing the Board into three classes of directors, with each class serving staggered three-year terms;
|
|
•
|
after we cease to be a controlled company, and subject to the terms of our stockholders’ agreement, providing that all vacancies, including newly created directorships, may, except as otherwise required by law or, if applicable, the rights of holders of a series of preferred stock, only be filled by the affirmative vote of a majority of directors then in office, even if less than a quorum (prior to such time, vacancies may also be filled by stockholders holding a majority of the outstanding Common Stock);
|
|
•
|
after we cease to be a controlled company, permitting any action by stockholders to be taken only at an annual meeting or special meeting rather than by a written consent of the stockholders, subject to the rights of any series of preferred stock with respect to such rights;
|
|
•
|
after we cease to be a controlled company, permitting special meetings of our stockholders to be called only by our Chief Executive Officer, the chairman of the Board and the Board pursuant to a resolution adopted by the affirmative vote of a majority of the total number of authorized directors whether or not there exist any vacancies in previously authorized directorships (prior to such time, a special meeting may also be called by our Corporate Secretary at the request of Riverstone);
|
|
•
|
after we cease to be a controlled company, and subject to the rights of the holders of shares of any series of our preferred stock and the terms of our stockholders’ agreement, requiring the affirmative vote of the holders of at least 66
2
⁄
3
% in voting power of all then outstanding Common Stock entitled to vote generally in the election of
|
33
directors, voting together as a single class, to remove any or all of the directors from office at any time, and directors will be removable only for “cause”;
|
•
|
prohibiting cumulative voting in the election of directors;
|
|
•
|
establishing advance notice provisions for stockholder proposals and nominations for elections to the board of directors to be acted upon at meetings of stockholders; and
|
|
•
|
providing that the board of directors is expressly authorized to adopt, or to alter or repeal our bylaws.
|
In addition, certain change of control events have the effect of accelerating the payments due under the TRAs, which could be substantial and accordingly serve as a disincentive to a potential acquirer of our Company. Please see “—In certain cases, payments under the TRAs may be accelerated and/or significantly exceed the actual benefits, if any, Liberty Inc. realizes in respect of the tax attributes subject to the TRAs.”
Our amended and restated certificate of incorporation designates the Court of Chancery of the State of Delaware as the sole and exclusive forum for certain types of actions and proceedings that may be initiated by our stockholders, which could limit our stockholders’ ability to obtain a favorable judicial forum for disputes with us or our directors, officers, employees or agents.
Our amended and restated certificate of incorporation provides that, unless we consent in writing to the selection of an alternative forum, the Court of Chancery of the State of Delaware will, to the fullest extent permitted by applicable law, be the sole and exclusive forum for (i) any derivative action or proceeding brought on our behalf, (ii) any action asserting a claim of breach of a fiduciary duty owed by any of our directors, officers, employees or agents to us or our stockholders, (iii) any action asserting a claim against us or any director or officer or other employee of ours arising pursuant to any provision of the Delaware General Corporation Law (the “DGCL”), our amended and restated certificate of incorporation or our bylaws, or (iv) any action asserting a claim against us or any director or officer or other employee of ours that is governed by the internal affairs doctrine, in each such case subject to such Court of Chancery having personal jurisdiction over the indispensable parties named as defendants therein. Any person or entity purchasing or otherwise acquiring any interest in shares of our Common Stock will be deemed to have notice of, and consented to, the provisions of our amended and restated certificate of incorporation described in the preceding sentence. This choice of forum provision may limit a stockholder’s ability to bring a claim in a judicial forum that it finds favorable for disputes with us or our directors, officers, employees or agents, which may discourage such lawsuits against us and such persons. Alternatively, if a court were to find these provisions of our amended and restated certificate of incorporation inapplicable to, or unenforceable in respect of, one or more of the specified types of actions or proceedings, we may incur additional costs associated with resolving such matters in other jurisdictions, which could adversely affect our business, financial condition or results of operations.
If a substantial number of shares of Class A Common Stock becomes available for sale and are sold in a short period of time, the market price of our Class A Common Stock could decline and our stockholders may be diluted.
If our Principal Stockholders sell substantial amounts of our Class A Common Stock in the public market, the market price of our Class A Common Stock could decrease. The perception in the public market that our Principal Stockholders might sell shares of our Class A Common Stock could also create a perceived overhang and depress our market price. Over 50% of our Class A Common Stock outstanding is held by our Legacy Owners. In addition, our Legacy Owners, which includes the Principal Stockholders, hold Liberty LLC Units and shares of our Class B Common Stock which were exchangeable for an additional 45,207,372 shares of Class A Common Stock as of December 31, 2018. In addition, our Principal Stockholders, will have substantial demand and incidental registration rights for their shares.
Future sales or issuances of our Class A Common Stock in the public market, or the perception that such sales may occur, could reduce our stock price, and any additional capital raised by us through the sale of equity or convertible securities may dilute your ownership in us.
We may sell additional shares of Class A Common Stock in subsequent public offerings. We may also issue additional shares of Class A Common Stock or convertible securities. We presently have
68,741,273
shares of Class A Common Stock issued and outstanding. The Liberty Unit Holders are party to a registration rights agreement, which requires us to effect the registration of any shares of Class A Common Stock that they receive in exchange for their Liberty LLC Units in certain circumstances.
We have 12,908,734 shares of our Class A Common Stock issued or reserved for issuance under our long term incentive plan. Subject to the satisfaction of vesting conditions and the requirements of Rule 144, shares registered under the registration statement on Form S-8 may be made available for resale immediately in the public market without restriction.
We cannot predict the size of future issuances of our Class A Common Stock or securities convertible into Class A Common Stock or the effect, if any, that future issuances and sales of shares of our Class A Common Stock will have on the
34
market price of our Class A Common Stock. Sales of substantial amounts of our Class A Common Stock (including shares issued in connection with an acquisition), or the perception that such sales could occur, may adversely affect prevailing market prices of our Class A Common Stock.
Liberty Inc. is required to make payments under the TRAs for certain tax benefits that it may claim, and the amounts of such payments could be significant.
The TRAs generally provide for the payment by Liberty Inc. to each TRA Holder of 85% of the net cash savings, if any, in U.S. federal, state and local income tax and franchise tax (computed using simplifying assumptions to address the impact of state and local taxes) that Liberty Inc. actually realizes (or is deemed to realize in certain circumstances) as a result of certain increases in tax basis, net operating losses available to Liberty Inc. as a result of the Corporate Reorganization, and certain benefits attributable to imputed interest. Liberty Inc. will retain the benefit of the remaining 15% of these cash savings.
The term of each of the TRAs continues until all tax benefits that are subject to such TRAs have been utilized or expired, unless Liberty Inc. experiences a change of control (as defined in the TRAs, which includes certain mergers, asset sales and other forms of business combinations) or the TRAs are terminated early (at Liberty Inc.’s election or as a result of its breach), and Liberty Inc. makes the termination payments specified in such TRAs. In addition, payments Liberty Inc. makes under the TRAs will be increased by any interest accrued from the due date (without extensions) of the corresponding tax return. In the event that the TRAs are not terminated, the payments under the TRAs are anticipated to commence in 2020 and to continue for 15 years after the date of the last redemption of the Liberty LLC Units.
The payment obligations under the TRAs are Liberty Inc.’s obligations and not obligations of Liberty LLC, and Liberty Inc. expects that the payments Liberty Inc. will be required to make under the TRAs will be substantial. Estimating the amount and timing of payments that may become due under the TRAs is by its nature imprecise. For purposes of the TRAs, cash savings in tax generally are calculated by comparing Liberty Inc.’s actual tax liability (determined by using the actual applicable U.S. federal income tax rate and an assumed combined state and local income tax rate) to the amount it would have been required to pay had it not been able to utilize any of the tax benefits subject to the TRAs. The amounts payable, as well as the timing of any payments, under the TRAs are dependent upon significant future events and assumptions, including the timing of the redemptions of Liberty LLC Units, the price of our Class A Common Stock at the time of each redemption, the extent to which such redemptions are taxable transactions, the amount of the redeeming unit holder’s tax basis in its Liberty LLC Units at the time of the relevant redemption, the depreciation and amortization periods that apply to the increase in tax basis, the amount of net operating losses available to Liberty Inc. as a result of the Corporate Reorganization, the amount and timing of taxable income Liberty Inc. generates in the future, the U.S. federal income tax rate then applicable, and the portion of Liberty Inc.’s payments under the TRAs that constitute imputed interest or give rise to depreciable or amortizable tax basis.
The payments under the TRAs will not be conditioned upon a holder of rights under each of the TRAs having a continued ownership interest in Liberty Inc. or Liberty LLC. For further details of the TRAs, see Note 10, “Income Taxes” to the consolidated and combined financial statements included in “Item 8. Financial Statements and Supplementary Data.”
In certain cases, payments under the TRAs may be accelerated and/or significantly exceed the actual benefits, if any, Liberty Inc. realizes in respect of the tax attributes subject to the TRAs.
If Liberty Inc. experiences a change of control (as defined under the TRAs, which includes certain mergers, asset sales and other forms of business combinations) or the TRAs terminate early (at Liberty Inc.’s election or as a result of its breach), Liberty Inc. would be required to make a substantial, immediate lump-sum payment. This payment would equal the present value of hypothetical future payments that could be required to be paid under the TRAs (determined by applying a discount rate equal to the long-term Treasury rate in effect on the applicable date plus 300 basis points). The calculation of hypothetical future payments will be based upon certain assumptions and deemed events set forth in the TRAs, including (i) that Liberty Inc. has sufficient taxable income to fully utilize the tax benefits covered by the TRAs, (ii) that any Liberty LLC Units (other than those held by Liberty Inc.) outstanding on the termination date are deemed to be redeemed on the termination date, and (iii) certain loss or credit carryovers will be utilized over five years beginning with the taxable year that includes the termination date. Any early termination payments may be made significantly in advance of, and may materially exceed, the actual realization, if any, of the future tax benefits to which the termination payments relate.
If Liberty Inc. experiences a change of control (as defined under the TRAs) or the TRAs otherwise terminate early, Liberty Inc.’s obligations under the TRAs could have a substantial negative impact on its liquidity and could have the effect of delaying, deferring or preventing certain mergers, asset sales, or other forms of business combinations or changes of control. For example, if the TRAs were terminated at December 31, 2018, the estimated termination payments would, in the aggregate, be approximately
$67.3 million
(calculated using a discount rate equal to the long-term Treasury rate in effect on the applicable date plus 300 basis points, applied against an undiscounted liability of
$110.0 million
). The foregoing number is merely an
35
estimate and the actual payment could differ materially. There can be no assurance that we will be able to finance our obligations under the TRAs.
For further details of the TRAs, see Note 10, “Income Taxes” to the consolidated and combined financial statements included in “Item 8. Financial Statements and Supplementary Data.”
In the event that Liberty Inc.
’
s payment obligations under the TRAs are accelerated upon certain mergers, other forms of business combinations or other changes of control, the consideration payable to holders of our Class A Common Stock could be substantially reduced.
If Liberty Inc. experiences a change of control (as defined under the TRAs, which includes certain mergers, asset sales and other forms of business combinations), Liberty Inc. would be obligated to make a substantial, immediate lump-sum payment, and such payment may be significantly in advance of, and may materially exceed, the actual realization, if any, of the future tax benefits to which the payment relates. As a result of this payment obligation, holders of our Class A Common Stock could receive substantially less consideration in connection with a change of control transaction than they would receive in the absence of such obligation. Further, our payment obligations under the TRAs will not be conditioned upon the TRA Holders’ having a continued interest in Liberty Inc. or Liberty LLC. Accordingly, the TRA Holders’ interests may conflict with those of the holders of our Class A Common Stock. Please read “Risk Factors—Risks Related to our Class A Common Stock—In certain cases, payments under the TRAs may be accelerated and/or significantly exceed the actual benefits Liberty Inc. realizes, if any, in respect of the tax attributes subject to the TRAs” and Note 10, “Income Taxes” to the consolidated and combined financial statements included in “Item 8. Financial Statements and Supplementary Data.”
We will not be reimbursed for any payments made under the TRAs in the event that any tax benefits are subsequently disallowed.
Payments under the TRAs are based on the tax reporting positions that we will determine. The TRA Holders will not reimburse us for any payments previously made under the TRAs if any tax benefits that have given rise to payments under the TRAs are subsequently disallowed, except that excess payments made to any TRA Holder will be netted against payments that would otherwise be made to such TRA Holder, if any, after our determination of such excess. As a result, in such circumstances, Liberty Inc. could make payments that are greater than its actual cash tax savings, if any, and may not be able to recoup those payments, which could adversely affect Liberty Inc.’s liquidity.
If Liberty LLC were to become a publicly traded partnership taxable as a corporation for U.S. federal income tax purposes, Liberty Inc. and Liberty LLC might be subject to potentially significant tax inefficiencies, and Liberty Inc. would not be able to recover payments previously made by it under the TRAs even if the corresponding tax benefits were subsequently determined to have been unavailable due to such status.
Liberty Inc. intends to operate such that Liberty LLC does not become a publicly traded partnership taxable as a corporation for U.S. federal income tax purposes. A “publicly traded partnership” is a partnership the interests of which are traded on an established securities market or are readily tradable on a secondary market or the substantial equivalent thereof. Under certain circumstances, redemptions of Liberty LLC Units pursuant to the Redemption Right, Liberty Inc.’s Call Right or other transfers of Liberty LLC Units could cause Liberty LLC to be treated as a publicly traded partnership. Applicable U.S. Treasury regulations provide for certain safe harbors from treatment as a publicly traded partnership, and Liberty Inc. intends to operate such that redemptions or other transfers of Liberty LLC Units qualify for one or more such safe harbors. For example, Liberty Inc. intends to limit the number of unit holders of Liberty LLC, and the Liberty LLC Agreement, which was entered into in connection with the closing of the IPO, provides for limitations on the ability of holders of Liberty LLC Units to transfer their Liberty LLC Units and provides Liberty Inc., as managing member of Liberty LLC, with the right to impose restrictions (in addition to those already in place) on the ability of holders of Liberty LLC Units to redeem their Liberty LLC Units pursuant to the Redemption Right to the extent Liberty Inc. believes it is necessary to ensure that Liberty LLC will continue to be treated as a partnership for U.S. federal income tax purposes.
If Liberty LLC were to become a publicly traded partnership, significant tax inefficiencies might result for Liberty Inc. and for Liberty LLC, including as a result of Liberty Inc.’s inability to file a consolidated U.S. federal income tax return with Liberty LLC. In addition, Liberty Inc. would no longer have the benefit of certain increases in tax basis covered under the TRAs, and Liberty Inc. would not be able to recover any payments previously made by it under the TRAs, even if the corresponding tax benefits (including any claimed increase in the tax basis of Liberty LLC’s assets) were subsequently determined to have been unavailable.
36
In certain circumstances, Liberty LLC is required to make tax distributions and tax advances to the Liberty Unit Holders, including us, and the tax distributions and tax advances that Liberty LLC is required to make may be substantial.
Pursuant to the Liberty LLC Agreement, Liberty LLC makes generally pro rata cash distributions, or tax distributions, to the holders of Liberty LLC Units, including Liberty Inc., in an amount sufficient to allow Liberty Inc. to pay its taxes and to allow it to make payments under the TRAs. In addition to these pro rata distributions, the Liberty Unit Holders are entitled to receive tax advances in an amount sufficient to allow each of the Liberty Unit Holders to pay its respective taxes on such holder’s allocable share of Liberty LLC’s taxable income. Any such tax advance is calculated after taking into account certain other distributions or payments received by the Liberty Unit Holders from Liberty LLC or Liberty Inc. Under the applicable tax rules, Liberty LLC is required to allocate net taxable income disproportionately to its members in certain circumstances. Tax advances are determined based on an assumed individual tax rate and are repaid upon exercise of the Redemption Right or the Call Right, as applicable.
Funds used by Liberty LLC to satisfy its tax distribution and tax advance obligations are not available for reinvestment in our business. Moreover, the tax distributions and tax advances Liberty LLC is required to make may be substantial, and is likely to exceed (as a percentage of Liberty LLC’s income) the overall effective tax rate applicable to a similarly situated corporate taxpayer. In addition, because these payments are calculated with reference to an assumed tax rate, and because of the disproportionate allocation of net taxable income, these payments may exceed the actual tax liability for some of the holders of Liberty LLC Units.
We may issue preferred stock whose terms could adversely affect the voting power or value of our Class A Common Stock.
Our amended and restated certificate of incorporation authorizes us to issue, without the approval of our stockholders, one or more classes or series of preferred stock having such designations, preferences, limitations and relative rights, including preferences over our Class A Common Stock respecting dividends and distributions, as the Board may determine. The terms of one or more classes or series of preferred stock could adversely impact the voting power or value of our Class A Common Stock. For example, we might grant holders of preferred stock the right to elect some number of our directors in all events or on the happening of specified events or the right to veto specified transactions. Similarly, the repurchase or redemption rights or liquidation preferences we might assign to holders of preferred stock could affect the residual value of the Class A Common Stock.
If securities or industry analysts do not publish research or reports about our business, if they adversely change their recommendations regarding our Class A Common Stock or if our operating results do not meet their expectations, our stock price could decline.
The trading market for our Class A Common Stock may be influenced by the research and reports that industry or securities analysts publish about us or our business. If one or more of these analysts cease coverage of the Company or fail to publish reports on us regularly, we could lose visibility in the financial markets, which in turn could cause our stock price or trading volume to decline. Moreover, if one or more of the analysts who cover the Company downgrades our Class A Common Stock or if our operating results do not meet their expectations, our stock price could decline.
37
Item 1B. Unresolved Staff Comments
None.
Item 2. Properties
Information regarding our properties is contained in “Item 1. Business” and is incorporated by reference herein.
Item 3. Legal Proceedings
On February 23, 2017, SandBox Logistics, LLC and Oren Technologies, LLC (collectively “Sandbox”) filed suit in the Houston Division of the U.S. District Court for the Southern District of Texas against Proppant Express Investments, LLC, Proppant Express Solutions, LLC, and Liberty Oilfield Services LLC (“LOS”). SandBox alleged that LOS willfully infringed multiple U.S. patents and breached an agreement between SandBox and LOS by “directing, controlling, and funding” inter partes review requests before the U.S. Patent and Trademark Office. In July 2018, SandBox requested permission from the court to allege additional breach of contract claims against LOS, including alleged breaches of a confidentiality agreement and an exclusive purchasing covenant. The court denied these requests in September 2018. On December 19, 2018, the U.S. District Court for the Southern District of Texas entered an order dismissing the claims against LOS with prejudice.
We are named defendants in certain lawsuits, investigations and claims arising in the ordinary course of conducting our business, including certain environmental claims and employee-related matters, and we expect that we will be named defendants in similar lawsuits, investigations and claims in the future. While the outcome of these lawsuits, investigations and claims cannot be predicted with certainty, we do not expect these matters to have a material adverse impact on our business, results of operations, cash flows or financial condition. We have not assumed any liabilities arising out of these existing lawsuits, investigations and claims.
Item 4. Mine Safety Disclosures
Not applicable.
38
PART II
Item 5. Market for Registrant's Common Equity, Related Stockholder Matters and Issuer Purchases of Equity Securities
Market Information
On January 17, 2018, we consummated an initial public offering of our Class A Common Stock at a price of $17.00 per share. Our Class A Common Stock is traded on the NYSE under the symbol “LBRT.” Prior to that time, there was no public market for our Class A Common Stock. There is no public market for our Class B Common Stock.
Holders of our Common Stock
As of February 26, 2019, there were 72 stockholders of record of our Class A Common Stock and 15 stockholders of record of our Class B Common Stock. The number of record holders is based upon the actual number of holders registered on the books of the Company at such date and does not include holders of shares in “street names” or persons, partnerships, associations, corporations or other entities identified in security position listings maintained by depositories.
Dividend Policy
The Company paid quarterly cash dividends of
$0.05
per share of Class A Common Stock on September 20 and December 20, 2018 to shareholders of record as of September 6 and December 6, 2018, respectively. The declaration of dividends is subject to approval by the Board and to the Board’s continuing determination that such declaration of dividends is in the best interests of the Company and its stockholders. Future dividends may be adjusted at the Board’s discretion based on market conditions and capital availability. We are not required to pay dividends, and our stockholders will not be guaranteed, or have contractual or other rights to receive, dividends.
Recent Sales of Unregistered Equity Securities
We had no sales of unregistered equity securities during the period covered by this Annual Report on Form 10-K that were not previously reported in a Current Report on Form 8-K.
Purchase of Equity Securities By the Issuer and Affiliated Purchasers
On September 10, 2018, the Board authorized a share repurchase plan to repurchase up to $100.0 million of the Company’s Class A Common Stock through September 30, 2019. During the quarter ended December 31, 2018, Liberty LLC redeemed and retired
1,750,490
Liberty LLC Units from the Company for $
29.0 million
, and the Company repurchased and retired
1,750,490
shares of Class A Common Stock for
$29.0 million
, or
$16.53
average price per share excluding commissions. The total remaining authorized amount available for future repurchases of Class A Common Stock under the share repurchase program was
$17.1 million
as of
December 31, 2018
.
|
Period
|
Total number of shares purchased
|
Average price paid per share
|
Total number of shares purchased as part of publicly announced plans or programs (1)
|
Approximate dollar value of shares that may yet be purchased under the plans or programs
|
||||||||||
|
October
|
—
|
|
$
|
—
|
|
—
|
|
$
|
—
|
|
||||
|
November
|
191,712
|
|
18.83
|
|
191,712
|
|
42,463,090
|
|
||||||
|
December
|
1,558,778
|
|
16.25
|
|
1,558,778
|
|
17,096,596
|
|
||||||
|
Total
|
1,750,490
|
|
$
|
16.53
|
|
1,750,490
|
|
$
|
17,096,596
|
|
||||
(1) All repurchases are made under the share repurchase plan approved on September 10, 2018 by the Board.
The Company accounts for the purchase price of repurchased Class A Common Stock in excess of par value ($0.01 per share of Class A Common Stock) as a reduction of additional paid-in capital, and will continue to do so until additional paid-in capital is reduced to zero. Thereafter, any excess purchase price will be recorded as a reduction to retained earnings.
39
Item 6. Selected Financial Data
The selected financial data set forth below was derived from our audited consolidated and combined financial statements and should be read in conjunction with “Item 1A. Risk Factors,” “Item 7. Management Discussion and Analysis of Financial Condition and Results of Operations” and our audited consolidated and combined financial statements included in “Item 8. Financial Statements and Supplementary Data.”
|
Years Ended
December 31,
|
|||||||||||||||
|
2018
|
2017
|
2016
|
2015
|
||||||||||||
|
(in thousands, except per share and fleet data)
|
|||||||||||||||
|
Statement of Operations Data:
|
|||||||||||||||
|
Revenue:
|
|||||||||||||||
|
Revenue
|
$
|
2,132,032
|
|
$
|
1,465,133
|
|
$
|
356,890
|
|
$
|
384,330
|
|
|||
|
Revenue—related parties
|
23,104
|
|
24,722
|
|
17,883
|
|
71,074
|
|
|||||||
|
Total revenue
|
2,155,136
|
|
1,489,855
|
|
374,773
|
|
455,404
|
|
|||||||
|
Operating costs and expenses:
|
|
|
|||||||||||||
|
Cost of services (exclusive of depreciation and amortization shown separately below)
|
1,628,753
|
|
1,147,008
|
|
354,729
|
|
393,340
|
|
|||||||
|
General and administrative
|
99,052
|
|
80,089
|
|
35,789
|
|
28,765
|
|
|||||||
|
Depreciation and amortization
|
125,110
|
|
81,473
|
|
41,362
|
|
36,436
|
|
|||||||
|
(Gain) loss on disposal of assets
|
(4,342
|
)
|
148
|
|
(2,673
|
)
|
423
|
|
|||||||
|
Total operating costs and expenses
|
1,848,573
|
|
1,308,718
|
|
429,207
|
|
458,964
|
|
|||||||
|
Operating income (loss)
|
306,563
|
|
181,137
|
|
(54,434
|
)
|
(3,560
|
)
|
|||||||
|
Other expense:
|
|||||||||||||||
|
Interest expense
|
(17,145
|
)
|
(11,875
|
)
|
(6,126
|
)
|
(5,501
|
)
|
|||||||
|
Interest expense—related party
|
—
|
|
(761
|
)
|
—
|
|
—
|
|
|||||||
|
Total interest expense
|
(17,145
|
)
|
(12,636
|
)
|
(6,126
|
)
|
(5,501
|
)
|
|||||||
|
Net income (loss) before income taxes
|
289,418
|
|
168,501
|
|
(60,560
|
)
|
(9,061
|
)
|
|||||||
|
Income tax expense
|
40,385
|
|
—
|
|
—
|
|
—
|
|
|||||||
|
Net income (loss)
|
249,033
|
|
168,501
|
|
(60,560
|
)
|
(9,061
|
)
|
|||||||
|
Less: Net income (loss) attributable to Predecessor, prior to Corporate Reorganization
|
8,705
|
|
168,501
|
|
(60,560
|
)
|
(9,061
|
)
|
|||||||
|
Less: Net income attributable to noncontrolling interests
|
113,979
|
|
—
|
|
—
|
|
—
|
|
|||||||
|
Net income attributable to Liberty Oilfield Services Inc. stockholders
|
$
|
126,349
|
|
$
|
—
|
|
$
|
—
|
|
$
|
—
|
|
|||
|
Net Income Per Share Data (1):
|
|||||||||||||||
|
Net income attributable to Liberty Oilfield Services Inc. stockholders per common share
|
|||||||||||||||
|
Basic
|
$
|
1.84
|
|
||||||||||||
|
Diluted
|
$
|
1.81
|
|
||||||||||||
|
Weighted average common shares outstanding
|
|||||||||||||||
|
Basic
|
68,838
|
|
|||||||||||||
|
Diluted
|
117,838
|
|
|||||||||||||
|
Statement of Cash Flows Data:
|
|||||||||||||||
|
Cash flows provided by (used in) operating activities
|
$
|
351,258
|
|
$
|
195,109
|
|
$
|
(40,708
|
)
|
$
|
6,119
|
|
|||
|
Cash flows used in investing activities
|
255,492
|
|
310,043
|
|
96,351
|
|
38,492
|
|
|||||||
|
Cash flows (used in) provided by financing activities
|
(8,775
|
)
|
119,771
|
|
148,543
|
|
21,485
|
|
|||||||
|
Other Financial Data:
|
|||||||||||||||
|
Capital expenditures
|
$
|
258,835
|
|
$
|
311,794
|
|
$
|
102,428
|
|
$
|
38,492
|
|
|||
|
EBITDA (2)
|
$
|
431,673
|
|
$
|
262,610
|
|
$
|
(13,072
|
)
|
$
|
32,876
|
|
|||
|
Adjusted EBITDA (2)
|
$
|
438,234
|
|
$
|
280,728
|
|
$
|
(5,588
|
)
|
$
|
41,213
|
|
|||
|
Total Fleets at beginning of period (3)
|
19
|
|
10
|
|
6
|
|
5
|
|
|||||||
|
Total Fleets at end of period (3)
|
22
|
|
19
|
|
10
|
|
6
|
|
|||||||
|
Average Active Fleets (4)
|
21.3
|
|
15.1
|
|
7.4
|
|
5.9
|
|
|||||||
|
Adjusted EBITDA per Average Active Fleet (5)
|
$
|
20,574
|
|
$
|
18,591
|
|
$
|
(755
|
)
|
$
|
6,985
|
|
|||
40
|
Balance Sheet Data (at end of period):
|
|
|
|
||||||||||||
|
Total assets
|
$
|
1,116,501
|
|
$
|
852,103
|
|
$
|
451,845
|
|
$
|
296,971
|
|
|||
|
Long-term debt (including current portion)
|
106,524
|
|
196,357
|
|
103,805
|
|
110,232
|
|
|||||||
|
Total liabilities
|
375,687
|
|
416,851
|
|
222,873
|
|
162,920
|
|
|||||||
|
Redeemable common units (6)
|
—
|
|
42,486
|
|
—
|
|
—
|
|
|||||||
|
Total equity or member equity
|
740,814
|
|
392,766
|
|
228,972
|
|
134,051
|
|
|||||||
|
(1)
|
Net Income Per Share Data above reflects the net income to Class A Common Stock and net income per share for the period indicated based on a weighted average number of Class A Common Stock outstanding for period subsequent to the Corporate Reorganization on January 17, 2018.
|
|
(2)
|
EBITDA and Adjusted EBITDA are non-GAAP financial measures. For definitions of EBITDA and Adjusted EBITDA and a reconciliation of each to our most directly comparable financial measure calculated and presented in accordance with accounting principles generally accepted in the United States of America (“GAAP”), please read “Item 7. Management's Discussion and Analysis of Financial Conditions and Results of Operations—Comparison of Non-GAAP Financial Measures.”
|
|
(3)
|
Total Fleets represents the number of deployed and active fleets as of the designated date.
|
|
(4)
|
Average Active Fleets is calculated as the daily average of the active fleets for the period presented.
|
|
(5)
|
Adjusted EBITDA per Average Active Fleet is calculated as Adjusted EBITDA for the period divided by the Average Active Fleets, as defined above.
|
|
(6)
|
The redeemable common units were deemed extinguished and satisfied in full in the Corporate Reorganization.
|
41
Item 7. Management's Discussion and Analysis of Financial Condition and Results of Operations
The following discussion and analysis of our financial condition and results of operations should be read in conjunction with “Item 6. Selected Financial Data” and our audited consolidated and combined financial statements and related notes appearing elsewhere in this Annual Report on Form 10-K. The following discussion contains “forward-looking statements” that reflect our future plans, estimates, beliefs and expected performance. Our actual results may differ materially from those anticipated in these forward-looking statements as a result of a variety of risks and uncertainties, including those described in this Annual Reporting on Form 10-K under “Cautionary Note Regarding Forward-Looking Statements” and “Item 1A. Risk Factors.” We assume no obligation to update any of these forward-looking statements.
Overview
We are an independent provider of hydraulic fracturing services to onshore oil and natural gas E&P companies in North America. We have grown from one active hydraulic fracturing fleet in December 2011 to 22 active fleets in February 2019. We added three fleets during the year ended December 31, 2018. We provide our services primarily in the Permian Basin, the Eagle Ford Shale, the DJ Basin, the Williston Basin and the Powder River Basin.
We believe the following characteristics both distinguish us from our competitors and are the foundations of our business: forming ongoing partnerships of trust and innovation with our customers; developing and utilizing technology to maximize well performance; and promoting a people-centered culture focused on our employees, customers and suppliers. We have developed strong relationships with our customers by investing significant time in fracture design collaboration, which substantially enhances their production economics. Our technological innovations have become even more critical as E&P companies have increased the completion complexity and fracture intensity of horizontal wells. We are proactive in developing innovative solutions to industry challenges, including developing: (i) our proprietary databases of U.S. unconventional wells to which we apply our proprietary multi-variable statistical analysis technologies to provide differential insight into fracture design optimization; (ii) our Liberty Quiet Fleet® design which significantly reduces noise levels compared to conventional hydraulic fracturing fleets; and (iii) hydraulic fracturing fluid systems tailored to the specific reservoir properties in the basins in which we operate. We foster a people-centered culture built around honoring our commitments to customers, partnering with our suppliers and hiring, training and retaining people that we believe to be the best talent in our field, enabling us to be one of the safest and most efficient hydraulic fracturing companies in the United States.
Recent Trends and Outlook
Demand for our hydraulic fracturing services is predominantly influenced by the level of drilling and completion by E&P companies, which, in turn, depends largely on the current and anticipated profitability of developing oil and natural gas reserves. More specifically, demand for our hydraulic fracturing services is driven by the completion of hydraulic fracturing stages in unconventional wells, which, in turn, is driven by several factors including rig count, well count, service intensity and the timing and style of well completions.
Macro Conditions
From the second half of 2016 and through the first half of 2018, we benefited from an upward trajectory in both crude oil prices and horizontal rig count, leading to price increases for our services, including increases in our revenue per average active fleet. The price of WTI crude oil averaged of $43.29, $50.80 and $65.23 during 2016, 2017 and 2018, respectively. According to a report by Baker Hughes, a GE company (“Baker Hughes”), the horizontal rig count in North America average 400, 737, and 900 during 2016, 2017 and 2018, respectively.
However, during the second half of 2018, the price of WTI crude oil decreased from an average of $70.98 in July 2018 to an average of $49.52 in December of 2018. Reductions in customer activity, in part due to the reduction in commodity prices, and an oversupply of staffed frac fleets led to a reduction in pricing for frac services in late 2018.
According to the U.S. Energy Information Administration Short-Term Energy Outlook released in January 2019, worldwide crude oil supply is expected to increase by 1.4 million barrels per day in 2019 led by production growth from the United States.
We expect to benefit from long-term macro industry trends that improve drilling economics such as (i) greater rig efficiencies that result in more wells drilled per rig in a given period and (ii) increased complexity and service intensity of well completions, including longer wellbore laterals, more and larger fracturing stages and higher proppant usage per well. We expect these industry trends to directly benefit hydraulic fracturing companies like us that have the expertise and technological ability to execute increasingly complex and intense well completions.
42
Although there is uncertainty in the market about the level of customers’ drilling and completion activity in 2019, we expect demand for Liberty Inc.’s high-efficiency frac fleets to remain strong during 2019 due to the diversity of Liberty Inc.’s operating footprint, conversations with our customers and other factors. However, we cannot predict with any certainty when pricing for our frac services will increase. Customer activity levels influenced by commodity prices and the level of frac service supply will continue to impact the prices we charge our customers for our services.
Increase in Drilling Efficiency and Service Intensity of Completions
Over the past decade, E&P companies have focused on exploiting the vast resource potential available across many of North America’s unconventional resource plays through the application of horizontal drilling and completion technologies, including the use of multi-stage hydraulic fracturing, in order to increase recovery of oil and natural gas. As E&P companies have improved drilling and completion techniques to maximize return and efficiency, we believe several long term trends have emerged which have materially increased the service intensity of current completions.
Improved drilling economics from horizontal drilling and greater rig efficiencies
. Unconventional resources are increasingly being targeted through the use of horizontal drilling. According to Baker Hughes, as reported on January 25, 2019, horizontal rigs accounted for approximately 88% of all rigs drilling in the United States, up from 74% as of December 31, 2014. Over the past several years, North American E&P companies have benefited from improved drilling economics driven by technologies that reduce the number of days, and the cost, of drilling wells. North American drilling rigs have incorporated newer technologies, which allow them to drill rock more effectively and quickly, meaning each rig can drill more wells in a given period. These include improved drilling technologies and the incorporation of geosteering techniques which allow better placement of the wellbore. Drilling rigs have also incorporated new technology which allows fully-assembled rigs to automatically “walk” from one location to the next without disassembling and reassembling the rig, greatly reducing the time it takes to move from one drilling location to the next. At the same time, E&P companies are shifting their development plans to incorporate multi-well pad development, which allows them to drill multiple horizontal wellbores from the same pad or location. The aggregate effect of these improved techniques and technologies have reduced the average days required to drill a well, which according to Coras Research, LLC (“Coras”), has dropped from 28 days in 2014 to 21 days in 2018.
Increased complexity and service intensity of horizontal well completions
. In addition to improved rig efficiencies discussed above, E&P companies are also improving the subsurface techniques and technologies used to exploit unconventional resources. These improvements have targeted increasing the exposure of each wellbore to the reservoir by drilling longer horizontal lateral sections of the wellbore. To complete the well, hydraulic fracturing is applied in stages along the wellbore to break-up the resource so that oil and gas can be produced. As wellbores have increased in length, the number of stages has also increased. From 2014 to 2018, the average stages per horizontal well have increased from 21 stages per well to 38 stages per well, according to Coras. Further, E&P companies have improved production from each stage by applying increasing amounts of proppant in each stage, which better connects the well to the resource. The aggregate effect of increased number of stages and the increasing amount of proppant in each stage has greatly increased the total amount of proppant used in each well, according to Coras, from six million pounds per well in 2014 to over 13 million pounds per well in 2018.
These industry trends will directly benefit hydraulic fracturing companies like us that have the expertise and technological innovations to effectively service today’s more efficient oilfield drilling activity and the increasing complexity and intensity of well completions. Given the expected returns that E&P companies have reported for new well development activities due to improved rig efficiencies and increasing well completion complexity and intensity, we expect these industry trends to continue.
How We Generate Revenue
We currently generate revenue through the provision of hydraulic fracturing services. These services are performed under a variety of contract structures, primarily master service agreements as supplemented by statements of work, pricing agreements and specific quotes. A portion of our statements of work, under master service agreements, include provisions that establish pricing arrangements for a period of up to one year in length. However, the majority of those agreements provide for pricing adjustments based on market conditions. The majority of our services are priced based on prevailing market conditions and changing input costs at the time the services are provided, giving consideration to the specific requirements of the customer.
Our hydraulic fracturing services are performed in sections, which we refer to as fracturing stages. The estimated number of fracturing stages to be completed for a particular horizontal well is determined by the customer’s well completion design. We recognize revenue for each fracturing stage completed, although our revenue per completed fracturing stage varies depending on the actual volumes and types of proppants, chemicals and fluid utilized for each fracturing stage. The number of
43
fracturing stages that we are able to complete in a period is directly related to the number and utilization of our deployed fleets and size of stages.
Costs of Conducting Our Business
The principal expenses involved in conducting our business are direct cost of personnel, services and materials used in the provision of services, general and administrative expenses, and depreciation and amortization. A large portion of the costs we incur in our business are variable based on the number of hydraulic fracturing jobs and the requirements of services provided to our customers. We manage the level of our fixed costs, except depreciation and amortization, based on several factors, including industry conditions and expected demand for our services.
How We Evaluate Our Operations
We use a variety of qualitative, operational and financial metrics to assess our performance. First and foremost of these is a qualitative assessment of customer satisfaction because ensuring we are a valuable partner to our customers is the key to achieving our quantitative business metrics. Among other measures, management considers each of the following:
Revenue;
Operating Income (Loss);
EBITDA;
Adjusted EBITDA;
Annualized Adjusted EBITDA per Average Active Fleet;
Net Income Before Taxes; and
Earnings per Share.
Revenue
We analyze our revenue by comparing actual monthly revenue to our internal projections for a given period and to prior periods to assess our performance. We also assess our revenue in relation to the number of fleets we have deployed (revenue per average active fleet) from period to period.
Operating Income (Loss)
We analyze our operating income (loss), which we define as revenues less direct operating expenses, depreciation and amortization and general and administrative expenses, to measure our financial performance. We believe operating income is a meaningful metric because it provides insight on profitability and true operating performance based on the historical cost basis of our assets. We also compare operating income to our internal projections for a given period and to prior periods.
EBITDA and Adjusted EBITDA
We view EBITDA and Adjusted EBITDA as important indicators of performance. We define EBITDA as net income (loss) before interest, income taxes, depreciation and amortization. We define Adjusted EBITDA as EBITDA adjusted to eliminate the effects of items such as new fleet or new basin start-up costs, costs of asset acquisition, gain or loss on the disposal of assets, asset impairment charges, bad debt reserves, and non-recurring expenses that management does not consider in assessing ongoing operating performance. Annualized Adjusted EBITDA per Average Active Fleet is calculated as Adjusted EBITDA annualized, divided by the Average Active Fleets for the same period. See “—Comparison of Non-GAAP Financial Measures” for more information and a reconciliation of EBITDA and Adjusted EBITDA to net income (loss), the most directly comparable financial measure calculated and presented in accordance with GAAP.
44
Results of Operations
Year Ended
December 31, 2018
, Compared to Year Ended
December 31, 2017
|
Years Ended December 31,
|
|||||||||||
|
Description
|
2018
|
2017
|
Change
|
||||||||
|
(in thousands)
|
|||||||||||
|
Revenue
|
$
|
2,155,136
|
|
$
|
1,489,855
|
|
$
|
665,281
|
|
||
|
Cost of services, excluding depreciation and amortization shown separately
|
1,628,753
|
|
1,147,008
|
|
481,745
|
|
|||||
|
General and administrative
|
99,052
|
|
80,089
|
|
18,963
|
|
|||||
|
Depreciation and amortization
|
125,110
|
|
81,473
|
|
43,637
|
|
|||||
|
(Gain) loss on disposal of assets
|
(4,342
|
)
|
148
|
|
(4,490
|
)
|
|||||
|
Operating income
|
306,563
|
|
181,137
|
|
125,426
|
|
|||||
|
Interest expense
|
(17,145
|
)
|
(12,636
|
)
|
(4,509
|
)
|
|||||
|
Net income before taxes
|
289,418
|
|
168,501
|
|
120,917
|
|
|||||
|
Income tax expense
|
40,385
|
|
—
|
|
40,385
|
|
|||||
|
Net income
|
249,033
|
|
168,501
|
|
80,532
|
|
|||||
|
Less: Net income attributable to Predecessor, prior to the Corporate Reorganization
|
8,705
|
|
168,501
|
|
(159,796
|
)
|
|||||
|
Less: Net income attributable to noncontrolling interests
|
113,979
|
|
—
|
|
113,979
|
|
|||||
|
Net income attributable to Liberty Oilfield Services Inc. stockholders
|
$
|
126,349
|
|
$
|
—
|
|
$
|
126,349
|
|
||
Revenue
Our revenue increased
$665.3 million
, or
44.7%
, to
$2.2 billion
for the year ended
December 31, 2018
compared to
$1.5 billion
for year ended
December 31, 2017
. The increase was due to the combined effect of a 41.1% increase in average active fleets deployed and a 2.5% increase in revenue per average active fleet. Our revenue per average active fleet increased to approximately
$101.2 million
for the year ended
December 31, 2018
as compared to approximately
$98.7 million
for the year ended
December 31, 2017
, based on 21.3 and 15.1 average active fleets during those respective periods. The increase in revenue per active fleet was due to improved pricing and throughput, compared to the prior year, in conjunction with increased demand for our services.
Cost of Services
Cost of services (excluding depreciation and amortization) increased
$481.7 million
, or
42.0%
, to
$1.6 billion
for the year ended
December 31, 2018
compared to
$1.1 billion
for the year ended
December 31, 2017
. The higher expense is due to an increase in services provided and reflects a
$280.0 million
increase attributable to materials, which was driven by a 34.8% increase in material volumes in the year ended
December 31, 2018
compared to the same period in
2017
. Additionally, the cost of components used in our repairs and maintenance operations increased by
$81.9 million
, offset by fuel costs which decreased across the same period by
$4.8 million
. Personnel costs increased by 39.4% to support the increased activity, including a
41.1%
increase in average active fleets deployed, for the year ended
December 31, 2018
as compared to the year ended
December 31, 2017
.
General and Administrative Expenses
General and administrative expenses increased by
$19.0 million
, or
23.7%
, to
$99.1 million
for the year ended
December 31, 2018
compared to
$80.1 million
for the year ended
December 31, 2017
. Payroll and benefits, related office expenses and finance expenses increased approximately $3.9 million, $2.7 million and $4.8 million, respectively, in connection with the increase in head count to support our expanded scope of operations, as well as increased finance and legal services associated with the IPO during the year ended
December 31, 2018
. In addition, non-cash stock based compensation expense of $4.3 million was recognized during the year ended December 31, 2018 compared to $0 during the prior year.
Depreciation and Amortization
Depreciation and amortization expense increased
$43.6 million
, or
53.6%
, to
$125.1 million
for the year ended
December 31, 2018
compared to
$81.5 million
for the year ended
December 31, 2017
, due to nine additional hydraulic fracturing fleets deployed during 2017 that were in service for all of 2018, as well as three additional fleets deployed during the year ended
December 31, 2018
.
45
(Gain) Loss on Disposal of Assets
(Gain) loss on disposal of assets in 2018 increased
$4.5 million
to a gain of
$4.3 million
for the year ended
December 31, 2018
compared to a loss of
$0.1 million
for the year ended
December 31, 2017
. The increase is primarily due to a
$11.5 million
gain recognized during the year ended
December 31, 2018
on insurance proceeds received in excess of losses incurred for damaged equipment resulting from an accidental fire in November 2018.
Operating Income
We realized operating income of
$306.6 million
for the year ended
December 31, 2018
compared to operating income of
$181.1 million
for the year ended
December 31, 2017
, primarily due to a
41.1%
increase in average active fleets deployed described above.
Interest Expense
The increase in interest expense of
$4.5 million
, or
35.7%
, to
$17.1 million
during the year ended
December 31, 2018
compared to
$12.6 million
during the year ended
December 31, 2017
, was primarily due to an increase of $5.8 million for interest expense on the term loan due to a higher weighted average interest rate on borrowings outstanding during the year ended
December 31, 2018
, as well as a $1.6 million increase from debt issuance costs amortization. This increase was offset by a $1.9 million decrease in interest expense on the outstanding borrowings under our ABL Facility that was paid in full in January 2018 with the proceeds from the IPO.
Net Income Before Taxes
We realized net income before taxes of
$289.4 million
for the year ended
December 31, 2018
compared to net income of $168.5 million for the year ended
December 31, 2017
. The increase in net income is primarily attributable to our expanded scope of operations from the 41.1% increase in average active fleets deployed during the year ended
December 31, 2018
.
Income Tax Expense
As a pass through entity prior to the IPO, the Predecessor was subject only to the Texas margin tax at a statutory rate of 1.0% and was not subject to U.S. federal income tax. Subsequent to the IPO, the pre-tax net income attributable to the Company is taxed at a combined U.S. federal and state tax rate of approximately 23.0%, while no tax is provided for the income attributable to the noncontrolling interests, which remains pass through income attributable to the holders of noncontrolling interests. We recognized
$40.4 million
of tax expense in the year ended
December 31, 2018
, an effective rate of
14.0%
, compared to
$0
recognized during the year ended
December 31, 2017
. This increase was attributable to our status as a corporation subject to U.S. federal income tax as well as a net increase in operating income, the components of which are discussed above.
Year Ended
December 31, 2017
, Compared to Year Ended
December 31, 2016
|
Years Ended December 31,
|
|||||||||||
|
Description
|
2017
|
2016
|
Change
|
||||||||
|
(in thousands)
|
|||||||||||
|
Revenue
|
$
|
1,489,855
|
|
$
|
374,773
|
|
$
|
1,115,082
|
|
||
|
Cost of services, excluding depreciation and amortization shown separately
|
1,147,008
|
|
354,729
|
|
792,279
|
|
|||||
|
General and administrative
|
80,089
|
|
35,789
|
|
44,300
|
|
|||||
|
Depreciation and amortization
|
81,473
|
|
41,362
|
|
40,111
|
|
|||||
|
Loss (gain) on disposal of assets
|
148
|
|
(2,673
|
)
|
2,821
|
|
|||||
|
Operating income (loss)
|
181,137
|
|
(54,434
|
)
|
235,571
|
|
|||||
|
Interest expense
|
(12,636
|
)
|
(6,126
|
)
|
(6,510
|
)
|
|||||
|
Net income (loss)
|
$
|
168,501
|
|
$
|
(60,560
|
)
|
$
|
229,061
|
|
||
Revenue
Our revenue increased
$1,115.1 million
, or
297.5%
, to
$1,489.9 million
for the year ended
December 31, 2017
compared to
$374.8 million
for the year ended
December 31, 2016
. The increase was due to the combined effect of a 104.0% increase in average active fleets deployed and a 94.8% increase in revenue per average active fleet. Our revenue per average active fleet increased to approximately
$98.7 million
for the year ended
December 31, 2017
as compared to approximately $50.6 million for the year ended
December 31, 2016
, based on
15.1
and 7.4 average active fleets deployed during those respective periods.
46
The increase in revenue per active fleet was due to improved pricing and throughput in conjunction with increased demand for our services.
Cost of Services
Cost of services (excluding depreciation and amortization) increased
$792.3 million
, or
223.3%
, to
$1,147.0 million
for the year ended
December 31, 2017
compared to
$354.7 million
for the year ended
December 31, 2016
. The higher expense is due to an increase in services provided and reflects a $488.4 million increase attributable to materials, which was driven by a 235.7% increase in material volumes in the year ended
December 31, 2017
compared to the same period in
2016
. Additionally, the cost of components used in our repairs and maintenance operations increased by $96.6 million and fuel costs increased by $52.0 million. Personnel costs increased by 163.7% to support the increased activity, including a 104.0% increase in average active fleets deployed, for the year ended
December 31, 2017
as compared to the year ended
December 31, 2016
.
General and Administrative Expenses
General and administrative expenses increased by
$44.3 million
, or
123.8%
, to
$80.1 million
for the year ended
December 31, 2017
compared to
$35.8 million
for the year ended
December 31, 2016
. Payroll and benefits, related office expenses and fleet start-up expenses increased approximately $26.2 million, $5.4 million and $9.7 million, respectively, in connection with the increase in head count to support our expanded scope of operations and the nine fleets deployed during the year ended
December 31, 2017
. Additionally, other general and administrative expenses increased $3.1 million, primarily driven by a $1.1 million increase in management fees owed to Riverstone/Carlyle Energy Partners IV, L.P.
Depreciation and Amortization
Depreciation and amortization expense increased
$40.1 million
, or
97.0%
, to
$81.5 million
for the year ended
December 31, 2017
compared to
$41.4 million
for the year ended
December 31, 2016
, due to four additional hydraulic fracturing fleets deployed during 2016 that were in service for all of 2017, as well as nine additional fleets deployed during the year ended December 31,
2017
.
Operating Income (Loss)
We realized operating income of
$181.1 million
for the year ended
December 31, 2017
compared to an operating loss of
$54.4 million
for the year ended
December 31, 2016
, primarily due to the increased number of hydraulic fracturing fleets deployed and the higher revenue per average active fleet in response to increased demand for our services.
Interest Expense
Interest expense increased
$6.5 million
, or
106.3%
, to
$12.6 million
during the year ended
December 31, 2017
compared to
$6.1 million
during the year ended
December 31, 2016
, primarily due to $1.2 million of deferred financing costs written off in connection with the termination of previously outstanding debt and a $4.2 million increase in interest expense due to the increased average borrowings outstanding during the year ended December 31, 2017 compared to the same period in 2016. Additionally, we incurred $0.8 million of interest on a $60.0 million related party bridge loan that was outstanding during a portion of the three months ended June 30, 2017.
Net Income (Loss)
We realized net income of
$168.5 million
for the year ended December 31, 2017 compared to a net loss of
$60.6 million
for the year ended
December 31, 2016
. Our net loss for the year ended December 31, 2016 resulted from the significant decrease in pricing for our hydraulic fracturing services following the dramatic decrease in drilling activity by E&P companies during the industry downturn from late 2014 through the first half of 2016. Our net income for the year ended December 31, 2017 was driven by recovery of the oil and gas industry beginning in the third quarter of 2016, as well as our expanded scope of operations following deployment of nine additional hydraulic fracturing fleets during the year ended December 31, 2017.
Comparison of Non-GAAP Financial Measures
We view EBITDA and Adjusted EBITDA as important indicators of performance. We define EBITDA as net income (loss) before interest, income taxes, depreciation and amortization. We define Adjusted EBITDA as EBITDA adjusted to eliminate the effects of items such as new fleet or new basin start-up costs, costs of asset acquisitions, gain or loss on the disposal of assets, asset impairment charges, bad debt reserves and non-recurring expenses that management does not consider in assessing ongoing performance.
47
Our board of directors, management, investors and lenders use EBITDA and Adjusted EBITDA to assess our financial performance because it allows them to compare our operating performance on a consistent basis across periods by removing the effects of our capital structure (such as varying levels of interest expense), asset base (such as depreciation and amortization) and other items that impact the comparability of financial results from period to period. We present EBITDA and Adjusted EBITDA because we believe they provide useful information regarding the factors and trends affecting our business in addition to measures calculated under GAAP. Additionally, the calculation of Adjusted EBITDA complies with the definition of Consolidated EBITDA, as defined in our Credit Facilities. See “—Liquidity and Capital Resources—Debt Agreements.”
Note Regarding Non-GAAP Financial Measures
EBITDA and Adjusted EBITDA are not financial measures presented in accordance with GAAP. We believe that the presentation of these non-GAAP financial measures will provide useful information to investors in assessing our financial performance and results of operations. Net income (loss) is the GAAP measure most directly comparable to EBITDA and Adjusted EBITDA. Our non-GAAP financial measures should not be considered as alternatives to the most directly comparable GAAP financial measure. Each of these non-GAAP financial measures has important limitations as an analytical tool due to exclusion of some but not all items that affect the most directly comparable GAAP financial measures. You should not consider EBITDA or Adjusted EBITDA in isolation or as substitutes for an analysis of our results as reported under GAAP. Because EBITDA and Adjusted EBITDA may be defined differently by other companies in our industry, our definitions of these non-GAAP financial measures may not be comparable to similarly titled measures of other companies, thereby diminishing their utility.
The following tables present a reconciliation of EBITDA and Adjusted EBITDA to our net income (loss), which is the most directly comparable GAAP measure for the periods presented:
Year Ended
December 31, 2018
Compared to Year Ended
December 31, 2017
: EBITDA and Adjusted EBITDA
|
Years Ended
December 31, |
|||||||||||
|
Description
|
2018
|
2017
|
Change
|
||||||||
|
(in thousands)
|
|||||||||||
|
Net income
|
$
|
249,033
|
|
$
|
168,501
|
|
$
|
80,532
|
|
||
|
Depreciation and amortization
|
125,110
|
|
81,473
|
|
43,637
|
|
|||||
|
Interest expense
|
17,145
|
|
12,636
|
|
4,509
|
|
|||||
|
Income tax expense
|
40,385
|
|
—
|
|
40,385
|
|
|||||
|
EBITDA
|
$
|
431,673
|
|
$
|
262,610
|
|
$
|
169,063
|
|
||
|
Fleet start-up costs
|
10,069
|
|
13,955
|
|
(3,886
|
)
|
|||||
|
Asset acquisition costs
|
632
|
|
2,470
|
|
(1,838
|
)
|
|||||
|
(Gain) loss on disposal of assets
|
(4,342
|
)
|
148
|
|
(4,490
|
)
|
|||||
|
Advisory services fees
|
202
|
|
1,545
|
|
(1,343
|
)
|
|||||
|
Adjusted EBITDA
|
$
|
438,234
|
|
$
|
280,728
|
|
$
|
157,506
|
|
||
EBITDA was
$431.7 million
for the year ended
December 31, 2018
compared to
$262.6 million
for the year ended
December 31, 2017
. Adjusted EBITDA was
$438.2 million
for the year ended
December 31, 2018
compared to
$280.7 million
for the year ended
December 31, 2017
. The increases in EBITDA and Adjusted EBITDA resulted from the increased revenue and other factors described above under the captions
Revenue
,
Cost of Services
and
General and Administrative Expenses
above.
48
Year Ended
December 31, 2017
, Compared to Year Ended
December 31, 2016
: EBITDA and Adjusted EBITDA
|
Years Ended December 31,
|
|||||||||||
|
Description
|
2017
|
2016
|
Change
|
||||||||
|
(in thousands)
|
|||||||||||
|
Net income (loss)
|
$
|
168,501
|
|
$
|
(60,560
|
)
|
$
|
229,061
|
|
||
|
Depreciation and amortization
|
81,473
|
|
41,362
|
|
40,111
|
|
|||||
|
Interest expense
|
12,636
|
|
6,126
|
|
6,510
|
|
|||||
|
EBITDA
|
$
|
262,610
|
|
$
|
(13,072
|
)
|
$
|
275,682
|
|
||
|
Fleet start-up costs
|
13,955
|
|
4,280
|
|
9,675
|
|
|||||
|
Asset acquisition costs
|
2,470
|
|
5,420
|
|
(2,950
|
)
|
|||||
|
Loss (gain) on disposal of assets
|
148
|
|
(2,673
|
)
|
2,821
|
|
|||||
|
Advisory services fees
|
1,545
|
|
457
|
|
1,088
|
|
|||||
|
Adjusted EBITDA
|
$
|
280,728
|
|
$
|
(5,588
|
)
|
$
|
286,316
|
|
||
EBITDA was
$262.6 million
for the year ended
December 31, 2017
compared to
$(13.1) million
for the year ended
December 31, 2016
. Adjusted EBITDA was
$280.7 million
for the year ended December 31, 2017 compared to
$(5.6) million
for the year ended
December 31, 2016
. The increases in EBITDA and Adjusted EBITDA resulted from the increased revenue and other factors described above under the captions
Revenue
,
Cost of Services
and
General and Administrative Expenses
above.
Liquidity and Capital Resources
Overview
Historically, our primary sources of liquidity to date have been cash flows from operations, capital contributions from our owners and borrowings under our Credit Facilities. We expect to fund operations and organic growth with the proceeds from our IPO and cash flows from operations. Our primary uses of capital have been capital expenditures to support organic growth and funding ongoing operations, including maintenance and fleet upgrades.
On January 17, 2018, we completed our IPO of
14,640,755
shares of our Class A Common Stock at a public offering price of $17.00 per share, of which
14,340,214
shares were offered by us and
300,541
shares were offered by the selling shareholder. We received approximately
$220.0 million
in net proceeds after deducting approximately
$23.8 million
of underwriting discounts and commissions and other offering costs. We did not receive any proceeds from the sale of the shares of Class A Common Stock by the selling shareholder. We used approximately
$25.9 million
of net proceeds from the IPO to redeem ownership in us from certain Legacy Owners and contributed the remaining proceeds to Liberty LLC in exchange for Liberty LLC Units. Liberty LLC used a portion of the net proceeds (i) to fully repay our outstanding borrowings and accrued interest under our ABL Facility (as defined herein), totaling approximately
$30.1 million
, (ii) to repay 35% of our outstanding borrowings, accrued interest and prepayment premium under our Term Loan Facility (as defined herein), totaling approximately
$62.5 million
and (iii) for general corporate purposes, including repayment of additional indebtedness and funding capital expenditures.
Cash and cash equivalents increased by $87.0 million to $103.3 million as of
December 31, 2018
compared to $16.3 million as of December 31, 2017, primarily attributable to net proceeds from the IPO. Going forward, we intend to finance the majority of our capital expenditures, contractual obligations and working capital needs with proceeds from the IPO and operating cash flows. We believe that our operating cash flow and available borrowings under our Credit Facilities will be sufficient to fund our operations for at least the next twelve months.
Cash Flows
The following table summarizes our cash flows for the periods indicated:
|
Years Ended December 31,
|
|||||||||||
|
Description
|
2018
|
2017
|
Change
|
||||||||
|
(in thousands)
|
|||||||||||
|
Net cash provided by operating activities
|
$
|
351,258
|
|
$
|
195,109
|
|
$
|
156,149
|
|
||
|
Net cash used in investing activities
|
(255,492
|
)
|
(310,043
|
)
|
54,551
|
|
|||||
|
Net cash (used in) provided by financing activities
|
(8,775
|
)
|
119,771
|
|
(128,546
|
)
|
|||||
|
Net increase in cash and cash equivalents
|
$
|
86,991
|
|
$
|
4,837
|
|
$
|
82,154
|
|
||
49
Analysis of Cash Flow Changes Between the Years Ended
December 31, 2018
and
2017
Operating Activities
. Net cash provided by operating activities was
$351.3 million
for the year ended
December 31, 2018
, compared to net cash provided by operating activities of
$195.1 million
for the year ended
December 31, 2017
. The
$156.1 million
increase in cash from operating activities was primarily attributable to a
$665.3 million
increase in revenues, offset by a
$495.4 million
increase in cash based operating expenses, both resulting from the increase in average active fleets from
15.1
in 2017 to
21.3
in 2018. Further, cash provided by operating activities during 2018 was reduced by
$27.3 million
cash paid for income taxes, and a $13.0 million decrease in funds used to satisfy working capital obligations.
Investing Activities
. Net cash used in investing activities was
$255.5 million
for the year ended
December 31, 2018
, compared to
$310.0 million
for the year ended
December 31, 2017
. The
$54.6 million
decrease in net cash used in investing activities was primarily due to the acquisition of Titan Frac Services LLC and Texas real estate properties during the year ended December 31, 2017.
Financing Activities
. Net cash used in financing activities was
$8.8 million
for the year ended
December 31, 2018
, compared to net cash provided by financing activities of
$119.8 million
for the year ended
December 31, 2017
. The
$128.5 million
decrease in cash provided by financing activities was primarily due to net repayment on debt of $92.8 million, equity repurchases of $82.9 million, distributions for taxes and advances to noncontrolling interest owners of $21.3 million, and dividend and distributions paid of $11.6 million during the year ended December 31, 2018, offset by $198.0 million net proceeds from the IPO, compared to net borrowings of $156.1 million, net payments of $23.0 million from the issuance and redemption of redeemable common units, and $13.2 million of payments for debt issuance and equity offering costs during the year ended December 31, 2017.
The following table summarizes our cash flows for the periods indicated:
|
Years Ended December 31,
|
|||||||||||
|
Description
|
2017
|
2016
|
Change
|
||||||||
|
(in thousands)
|
|||||||||||
|
Net cash provided by (used in) operating activities
|
$
|
195,109
|
|
$
|
(40,708
|
)
|
$
|
235,817
|
|
||
|
Net cash used in investing activities
|
(310,043
|
)
|
(96,351
|
)
|
(213,692
|
)
|
|||||
|
Net cash provided by financing activities
|
119,771
|
|
148,543
|
|
(28,772
|
)
|
|||||
|
Net increase in cash and cash equivalents
|
$
|
4,837
|
|
$
|
11,484
|
|
$
|
(6,647
|
)
|
||
Analysis of Cash Flow Changes Between the Years Ended
December 31, 2017
and
2016
Operating Activities
. Net cash provided by operating activities was
$195.1 million
for the year ended
December 31, 2017
, compared to cash used in operating activities of
$40.7 million
for the year ended
December 31, 2016
. The
$235.8 million
increase in cash from operating activities was attributable to the net impact of the increase in cash receipts for hydraulic fracturing services due to the combined effect of a 104.0% increase in average active fleets and 94.8% increase in revenue per active fleet, partially offset by the increased costs of those services and increased general and administrative expenses, and the changes in related working capital items.
Investing Activities
. Net cash used in investing activities was
$310.0 million
for the year ended
December 31, 2017
, compared to
$96.4 million
for the year ended
December 31, 2016
. The
$213.7 million
increase in net cash used in investing activities was primarily due to the purchase of, and upgrades to, our hydraulic fracturing fleets, the acquisition of Titan Frac Services LLC, and real estate acquisitions in Texas.
Financing Activities
. Net cash provided by financing activities was
$119.8 million
for the year ended
December 31, 2017
, compared to
$148.5 million
for the year ended
December 31, 2016
. The
$28.8 million
decrease in cash provided by financing activities was primarily due to a $155.5 million decrease in member contributions, offset by a $97.1 million increase in net debt borrowings and repayments, $60.0 million in proceeds from related party bridge loans and $39.8 million in proceeds from issuance of redeemable common units. Additionally, during the year ended December 31, 2017, the Company redeemed $62.7 million of redeemable common units and paid $13.2 million in debt and equity issuance costs.
50
Debt Agreements
On September 19, 2017, the Company entered into two new credit agreements for a revolving line of credit up to $250.0 million (the “ABL Facility”) and a $175.0 million term loan (the “Term Loan Facility”, and together with the ABL Facility the “Credit Facilities”). Following is a description of the ABL Facility and the Term Loan Facility.
ABL Facility
Under the terms of the ABL Facility, up to $250.0 million may be borrowed, subject to certain borrowing base limitations based on a percentage of eligible accounts receivable and inventory. As of
December 31, 2018
, the borrowing base was calculated to be $224.6 million, and the Company had no borrowings outstanding, except for a letter of credit in the amount of $0.3 million, with $224.3 million of remaining availability. Borrowings under the ABL Facility bear interest at LIBOR or a base rate, plus an applicable LIBOR margin of 1.5% to 2.0% or base rate margin of 0.5% to 1.0%, as defined in the ABL Facility credit agreement. The unused commitment is subject to an unused commitment fee of 0.375% to 0.5%. Interest and fees are payable in arrears at the end of each month, or, in the case of LIBOR loans, at the end of each interest period. The ABL Facility matures on the earlier of (i) September 19, 2022 and (ii) to the extent the debt under the Term Loan Facility remains outstanding, 90 days prior to the final maturity of the Term Loan Facility, which matures on September 19, 2022. Borrowings under the ABL Facility are collateralized by accounts receivable and inventory, and further secured by the Company, Liberty LLC and R/C IV Non-U.S. LOS Corp., a Delaware corporation (“R/C IV”) and a subsidiary of the Company, as parent guarantors.
Term Loan Facility
The Term Loan Facility provides for a $175.0 million term loan, of which $111.7 million remained outstanding as of
December 31, 2018
. Amounts outstanding bear interest at LIBOR or a base rate, plus an applicable margin of 7.625% or 6.625%, respectively, and the weighted average rate on borrowings was 10.1% as of
December 31, 2018
. The Company is required to make quarterly principal payments of 1% per annum of the initial principal balance, commencing on December 31, 2017, with final payment due at maturity on September 19, 2022. The Term Loan Facility is collateralized by the fixed assets of LOS and its subsidiaries, and is further secured by the Company, Liberty LLC and R/C IV, as parent guarantors.
The Credit Facilities include certain non-financial covenants, including but not limited to restrictions on incurring additional debt and certain distributions. Moreover, the ability of the Company to incur additional debt and to make distributions is dependent on maintaining a maximum leverage ratio. The Term Loan Facility requires mandatory prepayments upon certain dispositions of property or issuance of other indebtedness, as defined, and annually a percentage of excess cash flow (25% to 50%, depending on leverage ratio, of consolidated net income less capital expenditures and other permitted payments, commencing with the year ending December 31, 2018). Certain mandatory prepayments and optional prepayments are subject to a prepayment premium of 3% of the prepaid principal declining annually to 1% during the first three years of the term of the Term Loan Facility.
The Credit Facilities are not subject to financial covenants unless liquidity, as defined in the respective credit agreements, drops below a specified level. Under the ABL Facility, the Company is required to maintain a minimum fixed charge coverage ratio, as defined in the credit agreement governing the ABL Facility, of 1.0 to 1.0 for each period if excess availability is less than 10% of the borrowing base or $12.5 million, whichever is greater. Under the Term Loan Facility, the Company is required to maintain a minimum fixed charge coverage ratio, as defined, of 1.2 to 1.0 for each trailing twelve-month period if the Company’s liquidity, as defined, is less than $25.0 million for at least five consecutive business days. The Company was in compliance with these covenants as of
December 31, 2018
.
51
Contractual Obligations
The table below provides estimates of the timing of future payments that we are contractually obligated to make based on agreements in place at
December 31, 2018
.
|
Payments Due by Period
|
||||||||||||||||||||
|
(dollars in thousands)
|
||||||||||||||||||||
|
Total
|
Less than 1
year
|
1 – 3 years
|
4 – 5 years
|
More than 5 years
|
||||||||||||||||
|
ABL Facility
(1)
|
$
|
—
|
|
$
|
—
|
|
$
|
—
|
|
$
|
—
|
|
$
|
—
|
|
|||||
|
Term Loan Facility
(1)
|
111,715
|
|
1,750
|
|
3,500
|
|
106,465
|
|
—
|
|
||||||||||
|
Estimated interest payments
(2)
|
41,533
|
|
11,407
|
|
22,307
|
|
7,819
|
|
—
|
|
||||||||||
|
Operating lease obligations
(3)
|
153,930
|
|
42,717
|
|
81,075
|
|
10,396
|
|
19,742
|
|
||||||||||
|
Purchase commitments
(4)
|
690,862
|
|
341,970
|
|
344,947
|
|
3,945
|
|
—
|
|
||||||||||
|
Obligations under the TRAs(5)
|
16,818
|
|
—
|
|
5
|
|
3,994
|
|
1,947
|
|
10,877
|
|
||||||||
|
Total
|
$
|
1,014,858
|
|
$
|
397,844
|
|
$
|
455,823
|
|
$
|
130,572
|
|
$
|
30,619
|
|
|||||
|
(1)
|
Payments on our ABL Facility and Term Loan Facility exclude interest payments. Payments are based on debt balances as of December 31, 2018.
|
|
(2)
|
Estimated interest payments are based on debt balances as of
December 31, 2018
. Interest rates applied are based on the weighted average rate as of
December 31, 2018
.
|
|
(3)
|
Operating lease obligations include payments for leased facilities, equipment and vehicles.
|
|
(4)
|
Purchase commitments represent payments under supply agreements for the purchase and transportation of proppants. The agreements include minimum monthly purchase commitments, including agreements under which a shortfall fee may be applied. The shortfall fee may be offset by purchases in excess of the minimum requirement during future periods, as allowed for by each agreement.
|
|
(5)
|
The timing and amount(s) of the aggregate payments due under the TRAs may vary based on a number of factors, including the timing and amount of the taxable income we generate each year and the tax rate then applicable.
|
Tax Receivable Agreements
In connection with the IPO, on January 17, 2018, the Company entered into two TRAs with the TRA Holders. The TRAs generally provide for the payment by the Company of 85% of the net cash savings, if any, in U.S. federal, state, and local income tax and franchise tax (computed using simplifying assumptions to address the impact of state and local taxes) that the Company actually realizes (or is deemed to realize in certain circumstances) in periods after the IPO as a result, as applicable to each of the TRA Holders, of (i) certain increases in tax basis that occur as a result of the Company’s acquisition (or deemed acquisition for U.S. federal income tax purposes) of all or a portion of such TRA Holders’ Liberty LLC Units in connection with the IPO or pursuant to the exercise of the Redemption Right or the Company’s Call Right, (ii) any net operating losses available to the Company as a result of the Corporate Reorganization, and (iii) imputed interest deemed to be paid by the Company as a result of, and additional tax basis arising from, any payments the Company makes under the TRAs.
With respect to obligations the Company expects to incur under the TRAs (except in cases where the Company elects to terminate the TRAs early, the TRAs are terminated early due to certain mergers, asset sales, or other changes of control or the Company has available cash but fails to make payments when due), generally the Company may elect to defer payments due under the TRAs if the Company does not have available cash to satisfy its payment obligations under the TRAs or if its contractual obligations limit its ability to make such payments. Any such deferred payments under the TRAs generally will accrue interest. In certain cases, payments under the TRAs may be accelerated and/or significantly exceed the actual benefits, if any, the Company realizes in respect of the tax attributes subject to the TRAs. The Company accounts for amounts payable under the TRAs in accordance with ASC Topic 450, Contingencies.
If the Company experiences a change of control (as defined under the TRAs) or the TRAs otherwise terminate early, the Company’s obligations under the TRAs could have a substantial negative impact on its liquidity and could have the effect of delaying, deferring or preventing certain mergers, asset sales, or other forms of business combinations or changes of control. There can be no assurance that we will be able to finance our obligations under the TRAs.
52
Income Taxes
Following the IPO, the Company is a corporation and is subject to U.S. federal, state and local income tax on its share of Liberty LLC’s taxable income. As a result of the IPO and Corporate Reorganization, the Company recorded deferred tax assets and liabilities for the difference between the book value of assets and liabilities for financial reporting purposes and those amounts applicable for income tax purposes. Deferred tax assets have been recorded for tax attributes contributed to the Company as part of the reorganization. Deferred tax liabilities of $29.3 million have been recorded relating to the Liberty LLC Units acquired through the Corporate Reorganization.
The effective combined U.S. federal and state income tax rate applicable to the Company for the year ended December 31, 2018 was
14.0%
. The Company’s effective tax rate is significantly less than the federal statutory income tax rate of 21.0% primarily because no taxes are payable by the Company for the noncontrolling interest’s share of Liberty LLC’s pass-through income for federal, state and local income tax reporting. The Company recognized income tax expense of $40.4 million for the
twelve
months ended
December 31, 2018
.
Critical Accounting Policies and Estimates
The preparation of financial statements requires the use of judgments and estimates. Our critical accounting policies are described below to provide a better understanding of how we develop our assumptions and judgments about future events and related estimates and how they can impact our financial statements. A critical accounting estimate is one that requires our most difficult, subjective or complex estimates and assessments and is fundamental to our results of operations.
We base our estimates on historical experience and on various other assumptions we believe to be reasonable according to the current facts and circumstances, the results of which form the basis for making judgments about the carrying values of assets and liabilities that are not readily apparent from other sources. We believe the following are the critical accounting policies used in the preparation of our combined financial statements, as well as the significant estimates and judgments affecting the application of these policies. This discussion and analysis should be read in conjunction with our combined financial statements and related notes included in “Item 8. Financial Statements and Supplementary Data.
”
Revenue Recognition:
Revenue from hydraulic fracturing services is recognized as specific services are provided in accordance with contractual arrangements. If our assessment of performance under a particular contract changes, our revenue and / or costs under that contract may change.
Accounts Receivable:
We analyze the need for an allowance for doubtful accounts for estimated losses related to potentially uncollectible accounts receivable on a case-by-case basis throughout the year. We reserve amounts based on specific identification after considering each customer’s situation, including payment patterns, current financial condition as well as general economic conditions. It is reasonably possible that our estimates of the allowance for doubtful accounts will change and that losses ultimately incurred could differ materially from the amounts estimated in determining the allowance.
Inventory:
Inventory consists of raw materials used in the hydraulic fracturing process, such as proppants, chemicals and field service equipment maintenance parts, and is stated at the lower of cost or net realizable value, determined using the weighted average cost method. Net realizable value is determined based on our estimates of selling prices in the ordinary course of business, less reasonably predictable cost of completion, disposal, and transportation, each of which require us to apply judgment.
Property and Equipment:
We calculate depreciation and amortization on our assets based on the estimated useful lives and estimated salvage values that we believe are reasonable. The estimated useful lives and salvage values are subject to key assumptions such as maintenance, utilization and job variation. These estimates may change due to a number of factors such as changes in operating conditions or advances in technology.
We incur maintenance costs on our major equipment. The determination of whether an expenditure should be capitalized or expensed requires management judgment in the application of how the costs benefit future periods, relative to our capitalization policy. Costs that either establish or increase the efficiency, productivity, functionality or life of a fixed asset are capitalized and depreciated over the remaining useful life of the asset.
Impairment of long-lived and other intangible assets:
Long-lived assets, such as property and equipment and finite-lived intangible assets, are evaluated for impairment whenever events or changes in circumstances indicate that their carrying value may not be recoverable. Recoverability is assessed using undiscounted future net cash flows of assets grouped at the lowest level for which there are identifiable cash flows independent of the cash flows of other groups of assets. When alternative
53
courses of action to recover the carrying amount of the asset group are under consideration, estimates of future undiscounted cash flows take into account possible outcomes and probabilities of their occurrence, which require us to apply judgment. If the carrying amount of the asset is not recoverable based on its estimated undiscounted cash flows expected to result from the use and eventual disposition, an impairment loss is recognized in an amount by which its carrying amount exceeds its estimated fair value. The inputs used to determine such fair value are primarily based upon internally developed cash flow models. Our cash flow models are based on a number of estimates regarding future operations that may be subject to significant variability, are sensitive to changes in market conditions, and are reasonably likely to change in the future. No events or changes in circumstances occurred that would indicate a potential impairment of property and equipment as of
December 31, 2018
and
2017
. No impairment was recognized during the years ended
December 31, 2018
,
2017
and
2016
.
Tax Receivable Agreements:
In connection with the IPO, on January 17, 2018, the Company entered into two TRAs with the TRA Holders. The TRAs generally provide for the payment by the Company of 85% of the net cash savings, if any, in U.S. federal, state, and local income tax and franchise tax that the Company actually realizes in periods after the IPO as a result of certain tax attributes applicable to each TRA Holder. The Company accounts for amounts payable under the TRAs in accordance with ASC Topic 450, Contingencies.
Recent Accounting Pronouncements
See Note 2, “Significant Accounting Policies—Recently Issued Accounting Standards” and Note 2, “Significant Accounting Policies—Recently Adopted Accounting Standards” to the consolidated and combined financial statements included in “Item 8. Financial Statements and Supplementary Data” for a discussion of recent accounting pronouncements.
Off Balance Sheet Arrangements
We have no material off balance sheet arrangements as of
December 31, 2018
, except for the operating leases and purchase commitments under supply agreements as disclosed above under “—Contractual Obligations.” As such, we are not materially exposed to any other financing, liquidity, market or credit risk that could arise if we had engaged in such financing arrangements.
54
Item 7A. Quantitative and Qualitative Disclosure about Market Risk
Industry Risk
The demand, pricing and terms for hydraulic fracturing services provided by us are largely dependent upon the level of drilling activity in the U.S. oil and natural gas industry, as well as the available supply of hydraulic fracturing equipment. These activity levels are influenced by numerous factors over which we have no control, including, but not limited to: the supply of and demand for oil and natural gas; the level of prices, and expectations about future prices of oil and natural gas; the cost of exploring for, developing, producing and delivering oil and natural gas; the expected rates of declining current production; the discovery rates of new oil and natural gas reserves; available rail and other transportation capacity; weather conditions; domestic and worldwide economic conditions; political instability in oil-producing countries; environmental regulations; technical advances affecting energy consumption; the price and availability of alternative fuels; the ability of E&P companies to raise equity capital and debt financing; and merger and divestiture activity among E&P companies.
The level of U.S. oil and natural gas drilling is volatile. Expected trends in oil and natural gas production activities may not materialize and demand for our services may not reflect the level of activity in the industry. Any prolonged and substantial reduction in oil and natural gas prices would likely affect oil and natural gas production levels and therefore affect demand for our services. A material decline in oil and natural gas prices or U.S. activity levels could have a material adverse effect on our business, financial condition, results of operations and cash flows.
Interest Rate Risk
At
December 31, 2018
, we had
$111.7 million
of debt outstanding, with a weighted average interest rate of 10.1%. Interest is calculated under the terms of our Credit Facilities based on our selection, from time to time, of one of the index rates available to us plus an applicable margin that varies based on certain factors. See “Item 7. Management's Discussion and Analysis of Financial Condition and Results of Operations—Debt Agreements.” Assuming no change in the amount outstanding, the impact on interest expense of a 1% increase or decrease in the weighted average interest rate would be approximately $1.1 million per year. We do not currently have or intend to enter into any derivative arrangements to protect against fluctuations in interest rates applicable to our outstanding indebtedness.
Commodity Price Risk
Our material and fuel purchases expose us to commodity price risk. Material costs primarily include inventory consumed while performing hydraulic fracturing services. Fuel costs consist of diesel fuel used by trucks and other motorized equipment used for hydraulic fracturing services. We have been able to pass along price increases for material costs and fuel costs to customers, depending on market conditions. Further, we have purchase commitments with certain vendors to supply proppant inventory used in our operations at a fixed purchase price, including certain commitments which include minimum purchase obligations. Refer to Note 13 “Commitments and Contingencies” included in “Item 8. Financial Statements and Supplementary Data” for further discussion regarding purchase commitments.
55
Item 8. Financial Statements and Supplementary Data
Our financial statements and supplementary data are included in this Annual Report on Form 10-K beginning on page F-1 and incorporated by reference herein.
Item 9. Changes in and Disagreements With Accountants on Accounting and Financial Disclosure
None.
Item 9A. Controls and Procedures
Evaluation of Disclosure Controls and Procedures
As required by Rule 13a-15(b) under the Exchange Act, we have evaluated, under the supervision and with the participation of our management, including our principal executive officer, principal financial officer and principal accounting officer, the effectiveness of the design and operation of our disclosure controls and procedures (as defined in Rules 13a-15(e) and 15d-15(e) under the Exchange Act) as of the end of the period covered by this Annual Report on Form 10-K. Our disclosure controls and procedures are designed to provide reasonable assurance that information required to be disclosed in the reports we file or submit under the Exchange Act is recorded, processed, summarized and reported within the time periods specified in the Security and Exchange Commission (the “SEC”) rules and forms and that such information is accumulated and communicated to management, including our principal executive officer, principal financial officer and principal accounting officer, to allow timely decisions regarding required disclosure. Based upon that evaluation, our principal executive officer, principal financial officer and principal accounting officer concluded that our disclosure controls and procedures were effective at the reasonable assurance level as of December 31, 2018.
Management
’
s Annual Report on Internal Control Over Financial Reporting
During the year ended December 31, 2017, we were an “emerging growth company” as defined in the Jumpstart Our Business Startups Act of 2012 (the “JOBS Act”) and were not required to comply with certain requirements that were applicable to other public companies that are not “emerging growth companies.”
Effective as of January 17, 2018, we no longer qualify as an “emerging growth company” as defined in the JOBS Act. However, in accordance with Section 13(a) and 15(d) of the Exchange Act, a company is required to have been subject to the SEC’s requirements for a period of at least 12 calendar months in order to be designated as a large accelerated filer or an accelerated filer. We completed our IPO on January 17, 2018, and therefore do not meet the requirements to be designated as a large accelerated filer or an accelerated filer as of December 31, 2018. Section 404(c) of the Sarbanes-Oxley Act of 2002 (the “Sarbanes-Oxley Act”) provides that Section 404(b) of the Sarbanes-Oxley Act shall not apply with respect to any audit report prepared for an issuer that is neither an accelerated filer nor a large accelerated filer as defined in Rule 12b-2 under the Exchange Act. Accordingly, our independent registered public accounting firm is not yet required to formally attest to the effectiveness of our internal control over financial reporting for the year ended December 31, 2018.
Our management, including our principal executive officer and principal financial officer, is responsible for establishing and maintaining adequate internal control over financial reporting for us as defined in Rules 13a-15(f) and 15d-15(f) of the Exchange Act. This system is designed to provide reasonable assurance regarding the reliability of financial reporting and the preparation of financial statements for external purposes in accordance with GAAP.
Our internal control over financial reporting includes those policies and procedures that:
|
i.
|
pertain to the maintenance of records that, in reasonable detail, accurately and fairly reflect our transactions and dispositions of the assets;
|
|
ii.
|
provide reasonable assurance that transactions are recorded as necessary to permit preparation of financial statements in accordance with GAAP, and that our receipts and expenditures are being made only in accordance with authorizations of our management and directors; and
|
|
iii.
|
provide reasonable assurance regarding prevention or timely detection of unauthorized acquisition, use, or disposition of our assets that could have a material effect on the financial statements.
|
Because of its inherent limitations, a system of internal control over financial reporting can provide only reasonable assurance and may not prevent or detect misstatements. Further, because of changes in conditions, effectiveness of internal controls over financial reporting may vary over time.
Under the supervision of, and with the participation of our management, including our principal executive officer and principal financial officer, we conducted an evaluation of the effectiveness of our internal control over financial reporting based
56
on the framework and criteria established in
Internal Control-Integrated Framework (2013)
, issued by the Committee of Sponsoring Organizations of the Treadway Commission. Based on this evaluation, management concluded that our internal control over financial reporting was effective as of
December 31, 2018
.
Changes in Internal Control Over Financial Reporting
During the quarter ended
December 31, 2018
, we developed and implemented new controls and took additional actions to address a previously identified material weakness in our internal control over financial reporting as of December 31, 2017 related to segregation of duties, including internal controls over journal entries. The new internal controls and additional actions included, among other things, hiring additional personnel, engaging a third party to assist in the documentation, implementation and testing of internal controls, and developing and implementing improved policies, processes and procedures to ensure proper segregation of duties are followed. After completion of the testing of the design and operating effectiveness of these new internal controls, we concluded that we had remediated the previously identified material weakness as of December 31, 2018. Other than the internal controls implemented to address the previously identified material weakness, there were no changes in our internal control over financial reporting (as defined in Rule 13a-15(f) and 15d-15(f) under the Exchange Act) during the quarter ended
December 31, 2018
that have materially affected, or are reasonably likely to materially affect, our internal control over financial reporting.
Attestation Report of the Registered Public Accounting Firm
Management’s report was not subject to attestation by our independent registered public accounting firm, pursuant to Rule 12b-2 of the Exchange Act, that permits us to provide only management’s report in this Annual Report on Form 10-K. Therefore, this Annual Report on Form 10-K does not include such an attestation.
Item 9B. Other Information
None.
57
PART III
Item 10. Directors, Executive Officers and Corporate Governance
The information required by this item concerning our executive officers, directors and corporate governance is incorporated herein by reference to our definitive proxy statement for our 2019 annual meeting of shareholders, which will be filed with the SEC no later than 120 days after December 31, 2018.
Item 11. Executive Compensation
The information required by this item concerning executive compensation is incorporated herein by reference to our definitive proxy statement for our 2019 annual meeting of shareholders, which will be filed with the SEC no later than 120 days after December 31, 2018.
Item 12. Security Ownership of Certain Beneficial Owners and Management and Related Stockholder Matters
The information required by this item concerning the security ownership of certain beneficial owners and management and related stockholder matters are incorporated herein by reference to our definitive proxy statement for our 2019 annual meeting of shareholders, which will be filed with the SEC no later than 120 days after December 31, 2018.
Item 13. Certain Relationships and Related Transactions, and Director Independence
The information required by this item concerning certain relationships and related person transactions and director independence is incorporated herein by reference to our definitive proxy statement for our 2019 annual meeting of shareholders, which will be filed with the SEC no later than 120 days after December 31, 2018.
Item 14. Principal Accountant Fees and Services
The information required by this item concerning principal accounting fees and services is incorporated herein by reference to our definitive proxy statement for our 2019 annual meeting of shareholders, which will be filed with the SEC no later than 120 days after December 31, 2018.
58
PART IV
Item 15. Exhibits, Financial Statement Schedules
(a) Financial Statements and Financial Statement Schedules
Refer to Index to Financial Statements on page 65.
All schedules are omitted as information required is inapplicable or the information is presented in the consolidated and combined financial statements and the related notes.
(b) Exhibits
The documents listed in the Index to Exhibits are filed, furnished or incorporated by reference as part of this Annual Report on Form 10-K, and such Index to Exhibits are incorporated herein by reference.
59
LIBERTY OILFIELD SERVICES INC.
Notes to Consolidated and Combined Financial Statements
Item 16. Form 10-K Summary
None.
60
INDEX TO EXHIBITS
|
Exhibit
Number
|
Description
|
||
|
1.1
|
|
||
|
2.1
|
|
||
|
3.1
|
|
||
|
3.2
|
|
||
|
4.1
|
|
||
|
10.1
|
|
||
|
10.2
|
|
||
|
10.3
|
|
||
|
10.4
|
|
||
|
10.5
|
|
||
|
10.6
|
|
||
|
10.7
|
|
||
|
10.8
|
|
||
|
10.9
|
|
||
|
10.10
|
|
||
|
10.11
|
|
||
|
10.12
|
|
||
|
10.13
|
|
||
|
10.14
|
|
||
61
|
10.15
|
|
||
|
10.16
|
|
||
|
10.17
|
|
||
|
10.18
|
|
||
|
10.19
|
|
||
|
10.20
|
|
||
|
10.21
|
|
||
|
10.22
|
|
||
|
10.23
|
|
||
|
10.24
|
|
||
|
10.25
|
|
||
|
10.26
|
|
||
|
10.27
|
|
||
|
10.28
|
|
||
|
21.1
|
|
||
|
23.1
|
|
||
|
31.1
|
|
||
|
31.2
|
|
||
|
32.1
|
|
||
|
32.2
|
|
||
|
101.INS
|
|
XBRL Instance Document *
|
|
|
101.SCH
|
|
XBRL Taxonomy Extension Schema Document *
|
|
|
101.CAL
|
|
XBRL Taxonomy Extension Calculation Linkbase Document *
|
|
|
101.DEF
|
|
XBRL Taxonomy Extension Definition Linkbase Document *
|
|
|
101.LAB
|
|
XBRL Taxonomy Extension Label Linkbase Document *
|
|
|
101.PRE
|
|
XBRL Taxonomy Extension Presentation Linkbase Document *
|
|
|
(1)
|
Incorporated by reference to the exhibits to the registrant’s Registration Statement on Form S-1, as amended (SEC File 333-216050).
|
||
|
(2)
|
Incorporated by reference to the exhibits to the registrant’s Current Report on Form 8-K, filed on January 18, 2018.
|
||
|
(3)
|
Incorporated by reference to the exhibits to the registrant’s Amendment No. 1 to the Current Report on Form 8-K/A, filed on January 22, 2018.
|
||
|
(4)
|
Incorporated by reference to the exhibits to the registrant’s Annual Report on Form 10-K, filed on March 23, 2018.
|
||
62
|
(5)
|
Incorporated by reference to the exhibits to the registrant’s Registration Statement on Form S-8, filed on June 28, 2018 (SEC File 333-225948).
|
||
|
(6)
|
Incorporated by reference to the exhibits to the registrant’s Current Report on Form 8-K, filed on September 17, 2018.
|
||
|
(7)
|
Incorporated by reference to the exhibits to the registrant’s Quarterly Report on Form 10-Q, filed on May 10, 2018.
|
||
|
*
|
Filed herewith.
|
||
|
**
|
Furnished herewith.
|
||
|
†
|
Denotes a management contract or compensatory plan or arrangement.
|
||
63
SIGNATURES
Pursuant to the requirements of Section 13 or 15(d) of the Securities Exchange Act of 1934, the registrant has duly caused this report to be signed on its behalf by the undersigned, thereunto duly authorized.
|
|
|
|
|
LIBERTY OILFIELD SERVICES INC.
/s/ Christopher A. Wright
|
|
Date:
|
February 28, 2019
|
By:
|
|
Christopher A. Wright
Chief Executive Officer
|
Pursuant to the requirements of the Securities Exchange Act of 1934, this report has been signed below by the following persons on behalf of the registrant and in the capacities and on the dates indicated.
|
Signature
|
|
Title
|
|
Date
|
|
/s/ Christopher A. Wright
|
|
Chief Executive Officer and Director
(Principal Executive Officer)
|
|
February 28, 2019
|
|
Christopher A. Wright
|
|
|
|
|
|
|
|
|
|
|
|
/s/ Michael Stock
|
|
Chief Financial Officer
(Principal Financial Officer)
|
|
February 28, 2019
|
|
Michael Stock
|
|
|
|
|
|
|
|
|
|
|
|
/s/ Ryan T. Gosney
|
Chief Accounting Officer
|
February 28, 2019
|
||
|
Ryan T. Gosney
|
(Principal Accounting Officer)
|
|||
|
/s/ Cary D. Steinbeck
|
|
Director
|
|
February 28, 2019
|
|
Cary D. Steinbeck
|
|
|
|
|
|
|
|
|
|
|
|
/s/ N. John Lancaster, Jr.
|
|
Director
|
|
February 28, 2019
|
|
N. John Lancaster, Jr.
|
|
|
|
|
|
|
|
|
|
|
|
/s/ Brett Staffieri
|
|
Director
|
|
February 28, 2019
|
|
Brett Staffieri
|
|
|
|
|
|
|
|
|
|
|
|
/s/ William F. Kimble
|
|
Director
|
|
February 28, 2019
|
|
William F. Kimble
|
|
|
|
|
|
|
|
|
|
|
|
/s/ Peter A. Dea
|
|
Director
|
|
February 28, 2019
|
|
Peter A. Dea
|
|
|
|
|
|
|
|
|
|
|
|
/s/ Ken Babcock
|
|
Director
|
|
February 28, 2019
|
|
Ken Babcock
|
|
|
|
|
|
|
|
|
|
|
|
/s/ Jesal Shah
|
|
Director
|
|
February 28, 2019
|
|
Jesal Shah
|
|
|
|
|
64
Index to Financial Statements
|
Liberty Oilfield Services Inc.
|
|
65
REPORT OF INDEPENDENT REGISTERED PUBLIC ACCOUNTING FIRM
To the Stockholders and the Board of Directors of Liberty Oilfield Services Inc.
Opinion on the Financial Statements
We have audited the accompanying consolidated and combined balance sheets of Liberty Oilfield Services Inc. and its subsidiaries (the “Company”) as of December 31, 2018 and 2017, the related consolidated and combined statements of operations, changes in equity, and cash flows, for each of the three years in the period ended December 31, 2018, and the related notes (collectively referred to as the “financial statements”). In our opinion, the financial statements present fairly, in all material respects, the financial position of the Company as of December 31, 2018 and 2017, and the results of its operations and its cash flows for each of the three years in the period ended December 31, 2018, in conformity with accounting principles generally accepted in the United States of America.
Basis for Opinion
These financial statements are the responsibility of the Company's management. Our responsibility is to express an opinion on the Company's financial statements based on our audits. We are a public accounting firm registered with the Public Company Accounting Oversight Board (United States) (PCAOB) and are required to be independent with respect to the Company in accordance with the U.S. federal securities laws and the applicable rules and regulations of the Securities and Exchange Commission and the PCAOB.
We conducted our audits in accordance with the standards of the PCAOB. Those standards require that we plan and perform the audit to obtain reasonable assurance about whether the financial statements are free of material misstatement, whether due to error or fraud. The Company is not required to have, nor were we engaged to perform, an audit of its internal control over financial reporting. As part of our audits, we are required to obtain an understanding of internal control over financial reporting but not for the purpose of expressing an opinion on the effectiveness of the Company’s internal control over financial reporting. Accordingly, we express no such opinion.
Our audits included performing procedures to assess the risks of material misstatement of the financial statements, whether due to error or fraud, and performing procedures that respond to those risks. Such procedures included examining, on a test basis, evidence regarding the amounts and disclosures in the financial statements. Our audits also included evaluating the accounting principles used and significant estimates made by management, as well as evaluating the overall presentation of the financial statements. We believe that our audits provide a reasonable basis for our opinion.
/s/ DELOITTE & TOUCHE LLP
Denver, Colorado
February 28, 2019
We have served as the Company's auditor since 2016.
F- 1
LIBERTY OILFIELD SERVICES INC.
Consolidated and Combined Balance Sheets
As of December 31, 2018 and 2017
(Dollars in thousands, except share data)
|
2018
|
2017
|
||||||
|
Assets
|
|||||||
|
Current assets:
|
|||||||
|
Cash and cash equivalents
|
$
|
103,312
|
|
$
|
16,321
|
|
|
|
Accounts receivable—trade
|
153,589
|
|
195,961
|
|
|||
|
Accounts receivable—related party
|
15,139
|
|
3,984
|
|
|||
|
Unbilled revenue
|
79,233
|
|
58,784
|
|
|||
|
Unbilled revenue—related party
|
—
|
|
59
|
|
|||
|
Inventories
|
60,024
|
|
55,524
|
|
|||
|
Prepaid and other current assets
|
49,924
|
|
21,396
|
|
|||
|
Total current assets
|
461,221
|
|
352,029
|
|
|||
|
Property and equipment, net
|
627,053
|
|
494,776
|
|
|||
|
Other assets
|
28,227
|
|
5,298
|
|
|||
|
Total assets
|
$
|
1,116,501
|
|
$
|
852,103
|
|
|
|
Liabilities and Equity
|
|||||||
|
Current liabilities:
|
|||||||
|
Accounts payable
|
$
|
80,490
|
|
$
|
66,846
|
|
|
|
Accrued liabilities:
|
|
|
|||||
|
Accrued vendor invoices
|
67,771
|
|
78,646
|
|
|||
|
Operational accruals
|
36,414
|
|
32,208
|
|
|||
|
Accrued salaries and benefits
|
22,791
|
|
24,990
|
|
|||
|
Deferred revenue
|
—
|
|
9,231
|
|
|||
|
Accrued interest and other
|
9,585
|
|
6,573
|
|
|||
|
Accrued liabilities—related party
|
2,300
|
|
2,000
|
|
|||
|
Current portion of long-term debt, net of discount of $1,365 and $1,739, respectively
|
385
|
|
11
|
|
|||
|
Total current liabilities
|
219,736
|
|
220,505
|
|
|||
|
Long-term debt, net of discount of $3,826 and $6,466, respectively, less current portion
|
106,139
|
|
196,346
|
|
|||
|
Deferred tax liability
|
32,994
|
|
—
|
|
|||
|
Payable pursuant to tax receivable agreements
|
16,818
|
|
—
|
|
|||
|
Total liabilities
|
375,687
|
|
416,851
|
|
|||
|
Commitments & contingencies (Note 13)
|
|
|
|||||
|
Redeemable common units
|
—
|
|
42,486
|
|
|||
|
Members’ equity:
|
|||||||
|
Members’ equity
|
—
|
|
392,766
|
|
|||
|
Stockholders’ equity:
|
|||||||
|
Preferred Stock, $0.01 par value, 10,000 shares authorized and none issued and outstanding
|
—
|
|
—
|
|
|||
|
Common Stock:
|
|||||||
|
Class A, $0.01 par value, 400,000,000 shares authorized and 68,359,871 issued and outstanding as of December 31, 2018 and none issued and outstanding as of December 31, 2017
|
684
|
|
—
|
|
|||
|
Class B, $0.01 par value, 400,000,000 shares authorized and 45,207,372 issued and outstanding as of December 31, 2018 and none issued and outstanding as of December 31, 2017
|
452
|
|
—
|
|
|||
|
Additional paid in capital
|
312,659
|
|
—
|
|
|||
|
Retained earnings
|
119,274
|
|
—
|
|
|||
|
Total stockholders’ equity
|
433,069
|
|
—
|
|
|||
|
Noncontrolling interest
|
307,745
|
|
—
|
|
|||
|
Total equity
|
740,814
|
|
392,766
|
|
|||
|
Total liabilities and equity
|
$
|
1,116,501
|
|
$
|
852,103
|
|
|
See Notes to Consolidated and Combined Financial Statements.
F- 2
LIBERTY OILFIELD SERVICES INC.
Consolidated and Combined Statements of Operations
For the Years Ended
December 31, 2018
,
2017
and
2016
(In thousands, except per share data)
|
2018
|
2017
|
2016
|
|||||||||
|
Revenue:
|
|||||||||||
|
Revenue
|
$
|
2,132,032
|
|
$
|
1,465,133
|
|
$
|
356,890
|
|
||
|
Revenue—related parties
|
23,104
|
|
24,722
|
|
17,883
|
|
|||||
|
Total revenue
|
2,155,136
|
|
1,489,855
|
|
374,773
|
|
|||||
|
Operating costs and expenses:
|
|
||||||||||
|
Cost of services (exclusive of depreciation and amortization shown separately below)
|
1,628,753
|
|
1,147,008
|
|
354,729
|
|
|||||
|
General and administrative
|
99,052
|
|
80,089
|
|
35,789
|
|
|||||
|
Depreciation and amortization
|
125,110
|
|
81,473
|
|
41,362
|
|
|||||
|
(Gain) loss on disposal of assets
|
(4,342
|
)
|
148
|
|
(2,673
|
)
|
|||||
|
Total operating costs and expenses
|
1,848,573
|
|
1,308,718
|
|
429,207
|
|
|||||
|
Operating income (loss)
|
306,563
|
|
181,137
|
|
(54,434
|
)
|
|||||
|
Other expense:
|
|
||||||||||
|
Interest expense
|
(17,145
|
)
|
(11,875
|
)
|
(6,126
|
)
|
|||||
|
Interest expense related party
|
—
|
|
(761
|
)
|
—
|
|
|||||
|
Total interest expense
|
(17,145
|
)
|
(12,636
|
)
|
(6,126
|
)
|
|||||
|
Net income (loss) before income taxes
|
289,418
|
|
168,501
|
|
(60,560
|
)
|
|||||
|
Income tax expense
|
40,385
|
|
—
|
|
|
—
|
|
||||
|
Net income (loss)
|
249,033
|
|
168,501
|
|
(60,560
|
)
|
|||||
|
Less: Net income (loss) attributable to Predecessor, prior to Corporate Reorganization
|
8,705
|
|
168,501
|
|
(60,560
|
)
|
|||||
|
Less: Net income attributable to noncontrolling interests
|
113,979
|
|
—
|
|
—
|
|
|||||
|
Net income attributable to Liberty Oilfield Services Inc. stockholders
|
$
|
126,349
|
|
$
|
—
|
|
$
|
—
|
|
||
|
|
|
||||||||||
|
Net income attributable to Liberty Oilfield Services Inc. stockholders per common share:
|
|
|
|||||||||
|
Basic
|
$
|
1.84
|
|
||||||||
|
Diluted
|
$
|
1.81
|
|
||||||||
|
Weighted average common shares outstanding:
|
|
|
|||||||||
|
Basic
|
68,838
|
|
|||||||||
|
Diluted
|
117,838
|
|
|||||||||
See Notes to Consolidated and Combined Financial Statements.
F- 3
LIBERTY OILFIELD SERVICES INC.
Consolidated and Combined Statements of Changes in Equity
For the Years Ended
December 31, 2018
,
2017
and
2016
(Amounts in thousands)
|
Members
’
Equity
|
Shares of Class A Common Stock
|
Shares of Class B Common Stock
|
Class A Common Stock, Par Value
|
Class B Common Stock, Par Value
|
Additional Paid in Capital
|
Retained Earnings
|
Total Stockholders
’
equity
|
Noncontrolling Interest
|
Total Equity
|
||||||||||||||||||||||||||||
|
Balance—December 31, 2016
|
$
|
228,972
|
|
—
|
|
—
|
|
—
|
|
—
|
|
—
|
|
—
|
|
—
|
|
—
|
|
$
|
228,972
|
|
|||||||||||||||
|
Return on redeemable common units
|
(4,707
|
)
|
—
|
|
—
|
|
—
|
|
—
|
|
—
|
|
—
|
|
—
|
|
—
|
|
(4,707
|
)
|
|||||||||||||||||
|
Net income
|
168,501
|
|
—
|
|
—
|
|
—
|
|
—
|
|
—
|
|
—
|
|
—
|
|
—
|
|
168,501
|
|
|||||||||||||||||
|
Balance—December 31, 2017
|
$
|
392,766
|
|
—
|
|
—
|
|
$
|
—
|
|
$
|
—
|
|
$
|
—
|
|
$
|
—
|
|
$
|
—
|
|
$
|
—
|
|
$
|
392,766
|
|
|||||||||
|
Return on redeemable common units
|
(149
|
)
|
—
|
|
—
|
|
—
|
|
—
|
|
—
|
|
—
|
|
—
|
|
—
|
|
(149
|
)
|
|||||||||||||||||
|
Net income prior to Corporate Reorganization
|
8,705
|
|
—
|
|
—
|
|
—
|
|
—
|
|
—
|
|
—
|
|
—
|
|
—
|
|
8,705
|
|
|||||||||||||||||
|
Balance prior to Corporate Reorganization
|
$
|
401,322
|
|
—
|
|
—
|
|
$
|
—
|
|
$
|
—
|
|
$
|
—
|
|
$
|
—
|
|
$
|
—
|
|
$
|
—
|
|
401,322
|
|
||||||||||
|
Corporate Reorganization
|
|||||||||||||||||||||||||||||||||||||
|
Exchange of Liberty LLC Units for Class A Common Stock and Class B Common Stock and extinguishment of redeemable common units
|
(401,322
|
)
|
55,986
|
|
48,207
|
|
560
|
|
482
|
|
444,824
|
|
—
|
|
445,866
|
|
—
|
|
44,544
|
|
|||||||||||||||||
|
Net deferred tax liability due to Corporate Reorganization
|
—
|
|
—
|
|
—
|
|
—
|
|
—
|
|
(29,287
|
)
|
—
|
|
(29,287
|
)
|
—
|
|
(29,287
|
)
|
|||||||||||||||||
|
Initial Public Offering
|
|||||||||||||||||||||||||||||||||||||
|
Issuance of Class A Common Stock, net of underwriter discount and offering costs
|
—
|
|
14,340
|
|
—
|
|
143
|
|
—
|
|
219,847
|
|
—
|
|
219,990
|
|
—
|
|
219,990
|
|
|||||||||||||||||
|
Redemption of Legacy Ownership, net of underwriter discount
|
—
|
|
(1,609
|
)
|
—
|
|
-
|
(16
|
)
|
—
|
|
(25,881
|
)
|
—
|
|
(25,897
|
)
|
—
|
|
(25,897
|
)
|
||||||||||||||||
|
Issuance of restricted stock
|
—
|
|
1,259
|
|
—
|
|
13
|
|
—
|
|
(13
|
)
|
—
|
|
—
|
|
—
|
|
—
|
|
|||||||||||||||||
|
Liability due to tax receivable agreements
|
—
|
|
—
|
|
—
|
|
—
|
|
—
|
|
(2,291
|
)
|
—
|
|
(2,291
|
)
|
—
|
|
(2,291
|
)
|
|||||||||||||||||
|
Initial allocation of noncontrolling interest of Liberty LLC effective on the date of the IPO
|
—
|
|
—
|
|
—
|
|
—
|
|
—
|
|
(261,048
|
)
|
—
|
|
(261,048
|
)
|
261,048
|
|
—
|
|
|||||||||||||||||
|
Results Subsequent to Initial Public Offering
|
|||||||||||||||||||||||||||||||||||||
|
Distributions and advances paid to noncontrolling interest unitholders
|
—
|
|
—
|
|
—
|
|
—
|
|
—
|
|
—
|
|
—
|
|
—
|
|
(21,288
|
)
|
(21,288
|
)
|
|||||||||||||||||
|
Exchange of Class B Common Stock for Class A Common Stock
|
—
|
|
3,000
|
|
(3,000
|
)
|
30
|
|
(30
|
)
|
20,534
|
|
—
|
|
20,534
|
|
(20,534
|
)
|
—
|
|
|||||||||||||||||
|
Effect of exchange on deferred tax asset, net of liability under tax receivable agreements
|
—
|
|
—
|
|
—
|
|
—
|
|
—
|
|
2,592
|
|
—
|
|
2,592
|
|
—
|
|
2,592
|
|
|||||||||||||||||
|
Restricted stock forfeited
|
—
|
|
(22
|
)
|
—
|
|
—
|
|
—
|
|
—
|
|
—
|
|
—
|
|
—
|
|
—
|
|
|||||||||||||||||
|
Stock based compensation expense
|
—
|
|
—
|
|
—
|
|
—
|
|
—
|
|
5,450
|
|
—
|
|
5,450
|
|
—
|
|
5,450
|
|
|||||||||||||||||
|
Regular cash dividends declared and distributions paid
|
—
|
|
—
|
|
—
|
|
—
|
|
—
|
|
—
|
|
(7,075
|
)
|
(7,075
|
)
|
(4,671
|
)
|
(11,746
|
)
|
|||||||||||||||||
|
Share repurchases
|
—
|
|
(4,594
|
)
|
—
|
|
(46
|
)
|
—
|
|
(62,068
|
)
|
—
|
|
(62,114
|
)
|
(20,789
|
)
|
(82,903
|
)
|
|||||||||||||||||
|
Net income subsequent to Corporate Reorganization and IPO
|
—
|
|
—
|
|
—
|
|
—
|
|
—
|
|
—
|
|
126,349
|
|
126,349
|
|
113,979
|
|
240,328
|
|
|||||||||||||||||
|
Balance—December 31, 2018
|
$
|
—
|
|
68,360
|
|
45,207
|
|
$
|
684
|
|
$
|
452
|
|
$
|
312,659
|
|
$
|
119,274
|
|
$
|
433,069
|
|
$
|
307,745
|
|
$
|
740,814
|
|
|||||||||
See Notes to Consolidated and Combined Financial Statements.
F- 4
LIBERTY OILFIELD SERVICES INC.
Consolidated and Combined Statements of Cash Flows
For the Years Ended
December 31, 2018
,
2017
and
2016
(Dollars in thousands)
|
2018
|
2017
|
2016
|
|||||||||
|
Cash flows from operating activities:
|
|||||||||||
|
Net income (loss)
|
$
|
249,033
|
|
$
|
168,501
|
|
$
|
(60,560
|
)
|
||
|
Adjustments to reconcile net income (loss) to net cash provided by (used in) operating activities:
|
|||||||||||
|
Depreciation and amortization
|
125,110
|
|
81,473
|
|
41,362
|
|
|||||
|
(Gain) loss on disposal of assets
|
(4,342
|
)
|
148
|
|
(2,673
|
)
|
|||||
|
Amortization of debt issuance costs
|
4,031
|
|
2,311
|
|
630
|
|
|||||
|
Inventory write down
|
3,389
|
|
259
|
|
—
|
|
|||||
|
Stock based compensation expense
|
5,450
|
|
|||||||||
|
Deferred tax expense
|
20,488
|
|
|||||||||
|
Changes in operating assets and liabilities:
|
|||||||||||
|
Accounts receivable and unbilled revenue
|
23,074
|
|
(133,689
|
)
|
(41,023
|
)
|
|||||
|
Accounts receivable and unbilled revenue—related party
|
(11,096
|
)
|
3,460
|
|
(1,942
|
)
|
|||||
|
Inventories
|
(4,610
|
)
|
(27,639
|
)
|
(11,687
|
)
|
|||||
|
Prepaids and other current assets
|
(32,771
|
)
|
(12,611
|
)
|
(3,388
|
)
|
|||||
|
Accounts payable and accrued liabilities
|
(26,798
|
)
|
111,352
|
|
38,563
|
|
|||||
|
Accounts payable and accrued liabilities—related party
|
300
|
|
1,544
|
|
10
|
|
|||||
|
Net cash provided by (used in) operating activities
|
351,258
|
|
195,109
|
|
(40,708
|
)
|
|||||
|
Cash flows from investing activities:
|
|||||||||||
|
Capital expenditures
|
(258,835
|
)
|
(311,794
|
)
|
(102,428
|
)
|
|||||
|
Proceeds from disposal of assets
|
3,343
|
|
1,751
|
|
6,077
|
|
|||||
|
Net cash used in investing activities
|
(255,492
|
)
|
(310,043
|
)
|
(96,351
|
)
|
|||||
|
Cash flows from financing activities:
|
|||||||||||
|
Proceeds from issuance of Class A Common Stock, net of underwriter discount
|
230,174
|
|
—
|
|
—
|
|
|||||
|
Redemption of LLC Units from Legacy Owners
|
(25,897
|
)
|
—
|
|
—
|
|
|||||
|
Proceeds from borrowings on term loan, net of discount
|
—
|
|
171,500
|
|
—
|
|
|||||
|
Repayments of borrowings on term loan
|
(62,847
|
)
|
(57,438
|
)
|
(49,000
|
)
|
|||||
|
Proceeds from borrowings on line-of-credit
|
—
|
|
140,559
|
|
84,700
|
|
|||||
|
Repayments of borrowings on line-of-credit
|
(30,000
|
)
|
(158,559
|
)
|
(36,700
|
)
|
|||||
|
Proceeds from Liberty Oilfield Services Holdings LLC
|
2,115
|
|
—
|
|
—
|
|
|||||
|
Distributions and dividends paid to noncontrolling interest unitholders and Class A Common Stock shareholders
|
(11,578
|
)
|
—
|
|
—
|
|
|||||
|
Share Repurchase
|
(82,903
|
)
|
—
|
|
—
|
|
|||||
|
Proceeds from related party bridge loans
|
—
|
|
60,000
|
|
—
|
|
|||||
|
Payments on capital lease obligations
|
—
|
|
(119
|
)
|
(5,525
|
)
|
|||||
|
Payments of debt issuance costs
|
(315
|
)
|
(9,036
|
)
|
(413
|
)
|
|||||
|
Proceeds from issuance of redeemable common units
|
—
|
|
39,794
|
|
—
|
|
|||||
|
Payments for redemption of redeemable common units
|
—
|
|
(62,739
|
)
|
—
|
|
|||||
|
Member contributions
|
—
|
|
—
|
|
155,481
|
|
|||||
|
Distributions paid to noncontrolling interest unitholders
|
(21,288
|
)
|
—
|
|
—
|
|
|||||
|
Payment of deferred equity offering costs
|
(6,236
|
)
|
(4,191
|
)
|
—
|
|
|||||
|
Net cash (used in) provided by financing activities
|
(8,775
|
)
|
119,771
|
|
148,543
|
|
|||||
|
Net increase in cash and cash equivalents
|
86,991
|
|
4,837
|
|
11,484
|
|
|||||
|
Cash and cash equivalents—beginning of period
|
16,321
|
|
11,484
|
|
—
|
|
|||||
|
Cash and cash equivalents—end of period
|
$
|
103,312
|
|
$
|
16,321
|
|
$
|
11,484
|
|
||
|
Supplemental disclosure of cash flow information:
|
|||||||||||
|
Cash paid for income taxes
|
$
|
27,263
|
|
$
|
—
|
|
$
|
—
|
|
||
|
Cash paid for interest
|
$
|
13,957
|
|
$
|
9,766
|
|
$
|
4,725
|
|
||
|
Non-cash investing and financing activities:
|
|||||||||||
|
Capital expenditures included in accounts payable and accrued liabilities
|
$
|
45,703
|
|
$
|
18,687
|
|
$
|
29,688
|
|
||
|
Related party bridge loans exchanged for Redeemable Class 2 Common Units
|
$
|
—
|
|
$
|
60,679
|
|
$
|
—
|
|
||
See Notes to Consolidated and Combined Financial Statements.
F- 5
LIBERTY OILFIELD SERVICES INC.
Notes to Consolidated and Combined Financial Statements
Note 1—Organization and Basis of Presentation
Organization
Liberty Oilfield Services Inc. (the “Company”) was incorporated as a Delaware corporation on December 21, 2016, to become a holding corporation for Liberty Oilfield Services New HoldCo LLC (“Liberty LLC”) and its subsidiaries upon completion of a corporate reorganization (as detailed below, the “Corporate Reorganization”) and planned initial public offering of the Company (“IPO”). The Company has no material assets other than its ownership in Liberty LLC.
Prior to the Corporate Reorganization, Liberty Oilfield Services Holdings LLC (“Liberty Holdings”) wholly owned Liberty Oilfield Services LLC (“LOS”) and LOS Acquisition CO I LLC (“ACQI” and, together with LOS, the “Predecessor”), which includes the assets and liabilities of LOS Odessa RE Investments, LLC (“Odessa”) and LOS Cibolo RE Investments, LLC (“Cibolo”). Following the Corporate Reorganization, Liberty LLC wholly owns the Predecessor. Effective March 22, 2018, the assets of ACQI were contributed into LOS and ACQI was dissolved.
The Company, together with its subsidiaries, is a multi-basin provider of hydraulic fracturing services, with a focus on deploying the latest technologies in the technically demanding oil and gas reservoirs in which it operates, principally in North Dakota, Colorado, Wyoming and Texas.
Corporate Reorganization
In connection with the IPO, the Company completed the Corporate Reorganization, including the following series of transactions:
|
•
|
Liberty Holdings contributed all of its assets to Liberty LLC in exchange for Liberty LLC Units (as defined below);
|
|
•
|
Liberty Holdings liquidated and distributed to its then-existing owners (the “Legacy Owners”) Liberty LLC Units pursuant to the terms of the limited liability company agreement of Liberty Holdings and the Master Reorganization Agreement dated as of January 11, 2018, by and among the Company, Liberty Holdings, Liberty LLC, and the other parties named therein (the “Master Reorganization Agreement”);
|
|
•
|
Certain of the Legacy Owners directly or indirectly contributed all or a portion of their Liberty LLC Units to the Company in exchange for
55,685,027
shares of our Class A common stock, par value
$0.01
per share (the “Class A Common Stock”), and
1,258,514
restricted shares of Class A Common Stock. Subsequent to the initial exchange,
1,609,122
shares of Class A Common Stock were redeemed for an aggregate price of
$25.9 million
, upon the exercise of the underwriters’ overallotment option;
|
|
•
|
the Company issued, at par, the Legacy Owners that continued to own Liberty LLC Units (the “Liberty Unit Holders”) an aggregate amount of
48,207,372
shares of our Class B common stock, par value
$0.01
per share (the “Class B Common Stock”); and
|
|
•
|
the Company contributed the net proceeds it received from the IPO to Liberty LLC in exchange for additional Liberty LLC Units such that the Company held a total number of Liberty LLC Units equal to the number of shares of Class A Common Stock outstanding immediately following the IPO.
|
Initial Public Offering
On January 17, 2018, the Company completed its IPO of
14,640,755
shares of its Class A Common Stock, par value
$0.01
per share (the “Class A Common Stock”) at a public offering price of
$17.00
per share, of which
14,340,214
shares were offered by the Company and
300,541
were offered by the selling shareholder. The Company received $
220.0 million
net proceeds from the IPO, after deducting approximately $
13.4 million
in underwriting discounts and commissions and $
10.4 million
in other offering costs. The Company did not receive any proceeds from the sale of the shares of Class A Common Stock by the selling shareholder. The Company used
$25.9
million of net proceeds to redeem ownership interests in Liberty LLC from the Legacy Owners. The Company contributed the remaining net proceeds to Liberty LLC in exchange for units in Liberty LLC (the “Liberty LLC Units”). Liberty LLC used a portion of these net proceeds (i) to repay outstanding borrowings and accrued interest under the Predecessor’s ABL Facility (as defined herein), totaling approximately
$30.1
million, (ii) to repay
35%
of the Predecessor’s outstanding borrowings, accrued interest and prepayment premium under the Term Loan Facility (as defined herein), totaling approximately
$62.5
million and (iii) for general corporate purposes, including repayment
F- 6
LIBERTY OILFIELD SERVICES INC.
Notes to Consolidated and Combined Financial Statements
of additional indebtedness and funding capital expenditures. As of
December 31, 2018
, the Company owned
60.2%
of Liberty LLC.
Basis of Presentation
The accompanying consolidated and combined financial statements were prepared using generally accepted accounting principles in the United States of America (“GAAP”) and the instructions to Form 10-K, Regulation S-X and the rules and regulations of the Securities and Exchange Commission.
The accompanying consolidated and combined financial statements and related notes present the consolidated financial position, results of operations, cash flows, and equity of the Company as of and for the year ended December 31, 2018 and the combined financial position of the Predecessor as of December 31, 2017, and the combined results of operations, cash flows, and equity of the Predecessor for the years ended December 31, 2017 and 2016.
All intercompany amounts have been eliminated in the presentation of the consolidated financial statements of the Company and the combined financial statements of the Predecessor. Comprehensive income is not reported due to the absence of items of other comprehensive income or loss during the periods presented. The consolidated and combined financial statements include financial data at historical cost as the contribution of assets is considered to be a reorganization of entities under common control. The consolidated and combined financial statements may not be indicative of the actual level of assets, liabilities and costs that would have been incurred by the Predecessor if it had operated as an independent, publicly-traded company during the periods prior to the IPO or of the costs expected to be incurred in the future.
The consolidated and combined financial statements for periods prior to January 17, 2018, reflect the historical results of the Predecessor. The consolidated financial statements include the amounts of the Company and all majority owned subsidiaries where the Company has the ability to exercise control.
The Company’s operations are organized into a single reportable segment, which consists of hydraulic fracturing services.
Note 2—Significant Accounting Policies
Use of Estimates
The preparation of consolidated and combined financial statements in conformity with GAAP requires management to make estimates and assumptions that affect the reported amounts of assets and liabilities and disclosures of contingent assets and liabilities at the date of the consolidated and combined financial statements and the reported amounts of revenues and expenses during the reporting period. Actual results could differ from those estimates.
The consolidated and combined financial statements include certain amounts that are based on management’s best estimates and judgments. The most significant estimates relate to the collectibility of accounts receivable and estimates of allowance for doubtful accounts, the useful lives and salvage values of long-lived assets, future cash flows associated with long-lived assets, net realizable value of inventory, and equity unit valuation. These estimates may be adjusted as more current information becomes available.
Cash and Cash Equivalents
The Company considers all highly liquid instruments purchased with an original maturity of three months or less to be cash equivalents. The Company continually monitors its positions with, and the credit quality of, the financial institutions with which it has banking relationships. As of the balance sheet date, and periodically throughout the year, the Company has maintained balances in various operating accounts in excess of federally insured limits.
Accounts Receivable
The Company analyzes the need for an allowance for doubtful accounts for estimated losses related to potentially uncollectible accounts receivable on a case-by-case basis throughout the year. In establishing the required allowance, management considers historical losses adjusted to take into account current market conditions and the customers’ financial condition, the amount of receivables, the current receivables aging and current payment patterns. The Company reserves amounts based on specific identification. Account balances are charged to the allowance after all means of collection have been exhausted and the potential for recovery is considered remote. It is reasonably possible that the Company’s estimate of the allowance for doubtful accounts will change and that losses ultimately incurred could differ materially from the amounts estimated in determining the allowance.
F- 7
LIBERTY OILFIELD SERVICES INC.
Notes to Consolidated and Combined Financial Statements
Inventories
Inventories consist of raw materials used in the hydraulic fracturing process, such as proppants, chemicals, and field service equipment maintenance parts and are stated at the lower of cost, determined using the weighted average cost method, or net realizable value. Inventories are charged to cost of services as used when providing hydraulic fracturing services. Net realizable value is the estimated selling prices in the ordinary course of business, less reasonably predictable cost of completion, disposal, and transportation.
Property and Equipment
Property and equipment are stated at cost. Depreciation and amortization expense is recognized on property and equipment, excluding land, utilizing the straight-line method over the estimated useful lives, ranging from
two
to
30
years. The Company estimates salvage values that it does not depreciate.
Construction in-progress, a component of property and equipment, represents long-lived assets being developed by the Company. These assets are not subject to depreciation until they are completed and ready for their intended use, at which point the Company reclassifies them to field services equipment or vehicles, as appropriate.
The Company assesses its long-lived assets for impairment whenever events or changes in circumstances indicate that the carrying amount of an asset may not be recoverable. Recoverability is assessed using undiscounted future net cash flows of assets grouped at the lowest level for which there are identifiable cash flows independent of the cash flows of other groups of assets. The Company determined the lowest level of identifiable cash flows to be at the asset group, which is the aggregate of the Company’s hydraulic fracturing fleets that are in service. A long-lived asset is not recoverable if its carrying amount exceeds the sum of estimated undiscounted cash flows expected to result from the use and eventual disposition. When alternative courses of action to recover the carrying amount of the asset group are under consideration, estimates of future undiscounted cash flows take into account possible outcomes and probabilities of their occurrence. If the carrying amount of the asset is not recoverable, an impairment loss is recognized in an amount by which its carrying amount exceeds its estimated fair value, such that its carrying amount is adjusted to its estimated fair value, with an offsetting charge to impairment expense.
The Company measures the fair value of its property and equipment using the discounted cash flow method. The expected future cash flows used for impairment reviews and related fair value calculations are based on judgmental assessments of projected revenue growth, fleet count, utilization, gross margin rates, selling, general and administrative rates, working capital fluctuations, capital expenditures, discount rates and terminal growth rates.
During
2018
,
2017
and
2016
, the Company did not test its long-lived assets for recoverability as there were no triggering events. No impairment was recognized during the years ended
December 31, 2018
,
2017
and
2016
.
Major Maintenance Activities
The Company incurs maintenance costs on its major equipment. The determination of whether an expenditure should be capitalized or expensed requires management judgment in the application of how the costs incurred benefit future periods, relative to the Company’s capitalization policy. Costs that either establish or increase the efficiency, productivity, functionality or life of a fixed asset are capitalized and depreciated over the remaining useful life of the asset.
Deferred Financing Costs
Costs associated with obtaining debt financing are deferred and amortized to interest expense using the effective interest method. In accordance with Accounting Standards Update (“ASU”) No. 2015-03 and 2015-15, for all periods the Company has reflected deferred financing costs related to term loan debt as a direct deduction from the carrying amount, and costs associated with line-of-credit arrangements as other assets.
Income Taxes
Following the IPO, the Company is a corporation and is subject to U.S. federal, state and local income tax on its share of Liberty LLC’s taxable income. As a result of the IPO and Corporate Reorganization, the Company recorded deferred tax assets and liabilities for the difference between the book value of assets and liabilities for financial reporting purposes and those amounts applicable for income tax purposes.
Deferred income taxes are computed using the asset and liability method, which requires the recognition of deferred tax assets and liabilities for the expected future tax consequences of events that have been included in the consolidated financial statements. Deferred tax assets and liabilities are calculated using the enacted tax rates in effect for the year in which the deferred tax asset or liability is expected to reverse. The Company classifies all deferred tax assets and liabilities as non-current.
The Company recognizes the financial statement effects of a tax position when it is more-likely-than-not, based on the technical merits, that the position will be sustained upon examination. A tax position that meets the more-likely-than-not
F- 8
LIBERTY OILFIELD SERVICES INC.
Notes to Consolidated and Combined Financial Statements
recognition threshold is measured as the largest amount of tax benefit that is greater than 50% likely of being realized upon ultimate settlement with a taxing authority. Previously recognized tax positions are reversed in the first period in which it is no longer more-likely-than-not that the tax position would be sustained upon examination. Income tax related interest and penalties, if applicable, are recorded as a component of the provision for income tax expense.
Tax Receivable Agreements
In connection with the IPO, on January 17, 2018, the Company entered into
two
Tax Receivable Agreements (the “TRAs”) with the R/C Energy IV Direct Partnership, L.P. and the Legacy Owners that continued to own Liberty LLC Units (each such person and any permitted transferee, a “Tax Receivable Agreement Holder” and together, the “Tax Receivable Agreement Holders”). The TRAs generally provide for the payment by the Company of 85% of the net cash savings, if any, in U.S. federal, state, and local income tax and franchise tax (computed using simplifying assumptions to address the impact of state and local taxes) that the Company actually realizes (or is deemed to realize in certain circumstances) in periods after the IPO as a result, as applicable to each Tax Receivable Agreement Holder, of (i) certain increases in tax basis that occur as a result of the Company’s acquisition (or deemed acquisition for U.S. federal income tax purposes) of all or a portion of such Tax Receivable Agreement Holder’s Liberty LLC Units in connection with the IPO or pursuant to the exercise of the right (the “Redemption Right”) or the Company’s right (the “Call Right”), (ii) any net operating losses available to the Company as a result of the Corporate Reorganization, and (iii) imputed interest deemed to be paid by the Company as a result of, and additional tax basis arising from, any payments the Company makes under the TRAs.
With respect to obligations the Company expects to incur under the TRAs (except in cases where the Company elects to terminate the TRAs early, the TRAs are terminated early due to certain mergers, asset sales, or other changes of control or the Company has available cash but fails to make payments when due), generally the Company may elect to defer payments due under the TRAs if the Company does not have available cash to satisfy its payment obligations under the TRAs or if its contractual obligations limit its ability to make such payments. Any such deferred payments under the TRAs generally will accrue interest. In certain cases, payments under the TRAs may be accelerated and/or significantly exceed the actual benefits, if any, the Company realizes in respect of the tax attributes subject to the TRAs. The Company accounts for amounts payable under the TRAs in accordance with Accounting Standards Codification (“ASC”) Topic 450, Contingencies.
If the Company experiences a change of control (as defined under the TRAs) or the TRAs otherwise terminate early, the Company’s obligations under the TRAs could have a substantial negative impact on its liquidity and could have the effect of delaying, deferring or preventing certain mergers, asset sales, or other forms of business combinations or changes of control.
Revenue Recognition
Effective January 1, 2018, the Company adopted a comprehensive new revenue recognition standard, ASC Topic 606-Revenue from Contracts with Customers. The details of the significant changes to accounting policies resulting from the adoption of the new standard are set out below. The Company adopted the standard using a modified retrospective method; accordingly, the comparative information for the years ended December 31, 2017 and 2016 has not been adjusted and continues to be reported under the previous revenue standard. The adoption of this standard did not have a material impact to the consolidated financial position, reported revenue, results of operations or cash flows as of and for the year ended December 31, 2018.
Under the new standard, revenue recognition is based on the transfer of control, or the customer’s ability to benefit from the services and products in an amount that reflects the consideration expected to be received in exchange for those services and products. In recognizing revenue for services and products, the transaction price is determined from sales orders or contracts with customers. Revenue is recognized at the completion of each fracturing stage, and in most cases the price at the end of each stage is fixed, however, in limited circumstances contracts may contain variable consideration.
Variable consideration typically may relate to discounts, price concessions and incentives. We estimate variable consideration based on the amount of consideration we expect to receive. The Company accrues revenue on an ongoing basis to reflect updated information for variable consideration as performance obligations are met.
The Company also assesses customers’ ability and intention to pay, which is based on a variety of factors including historical payment experience and financial condition. Payment terms and conditions vary by contract type, although terms generally include a requirement of payment within
30
to
45
days.
Deferred Revenue
From time to time, the Company may require partial payment in advance from new customers to secure credit or from existing customers in order to secure additional hydraulic fracturing services. Initially, such payments are recorded in the accompanying consolidated and combined financial statements as deferred revenue, and upon performance of the agreed
F- 9
LIBERTY OILFIELD SERVICES INC.
Notes to Consolidated and Combined Financial Statements
services, the Company recognizes revenue consistent with its revenue recognition policy described above. As of
December 31, 2017
, the Company had
$9.2 million
recorded as deferred revenue related to the unearned portion of a prepayment from an existing customer to secure additional services from a new fleet by the end of 2017. The new fleet commenced services in December 2017, and the Company applied the prepayment in accordance with the customer agreement as services were performed. During the year ended
December 31, 2018
, the Company recognized
$9.2 million
of the prepayment to revenue.
Fleet Start-up Costs
The Company incurs start-up costs to commission a new fleet or district. These costs include hiring and training of personnel, and acquisition of consumable parts and tools. Start-up costs are expensed as incurred, and are reflected in general and administrative expense in the consolidated and combined statement of operations. Start-up costs for the years ended
December 31, 2018
,
2017
and
2016
, were
$10.1
million,
$14.0
million and
$4.3
million, respectively. Start-up costs incurred during the years ended
December 31, 2018
,
2017
and
2016
related to the establishment of three,
nine
, and
two
new fleets, respectively.
The terms and conditions of the Credit Facilities between the Company and its lenders provides for the add-back of costs or expenses incurred in connection with the acquisition, deployment and opening of any new hydraulic fracturing fleet or district in the computation of certain financial covenants. (See Note 5—Debt).
Recently Adopted Accounting Standards
In August 2018, the Financial Accounting Standards Board (“FASB”) issued ASU 2018-15, “Intangibles-Goodwill and Other-Internal-Use Software (Subtopic 350-40),” which amends ASC 350-40 to address a customer's accounting for implementation costs incurred in a cloud computing arrangement (“CCA”) that is a service contract. ASU 2018-15 aligns the accounting for costs incurred to implement a CCA that is a service arrangement with the guidance on capitalizing costs associated with developing or obtaining internal-use software. Specifically, ASU 2018-15 amends ASC 350-40 to include in its scope implementation costs of a CCA that is a service contract and clarifies that a customer should apply ASC 350-40 to determine which implementation costs should be capitalized. The update is effective for fiscal years beginning after December 15, 2019, and early adoption is permitted. The Company adopted this standard for the September 30, 2018 reporting period using the prospective approach. The adoption of this standard did not materially impact the consolidated financial statements as of and for the year ended December 31, 2018.
In May 2014, the FASB issued ASU 2014-09, “Revenue from Contracts with Customers (Topic 606),” which outlines a single comprehensive model for entities to use in accounting for revenue arising from contracts with customers. This ASU sets forth a five-step model for determining when and how revenue is recognized. Under the model, an entity is required to recognize revenue to depict the transfer of goods or services to a customer at an amount reflecting the consideration it expects to receive in exchange for those goods or services. Additional disclosures are required to describe the nature, amount, timing and uncertainty of revenue and cash flows arising from customer contracts (see “
Revenue Recognition
” above). The Company adopted this standard on January 1, 2018 using the modified retrospective method. The Company did not record a cumulative effect adjustment to the opening balance of retained earnings, as no adjustment was necessary. The adoption of this standard did not impact the Company’s reported revenue, net income or cash flows.
In May 2017, the FASB issued ASU 2017-09, “Compensation-Stock Compensation (Topic 718): Scope of Modification Accounting”, which provides guidance to increase clarity and reduce both diversity in practice and cost and complexity when applying the existing accounting guidance on changes to the terms or conditions of a share-based payment award. The amendments in ASU 2017-09 require an entity to account for the effects of a modification unless all the following conditions are met: (i) the fair value of the modified award is the same as the fair value of the original award immediately before the original award is modified; (ii) the vesting conditions of the modified award are the same as the vesting conditions of the original award immediately before the original award is modified; and (iii) the classification of the modified award as an equity instrument or a liability instrument is the same as the classification of the original award immediately before the original award is modified. The guidance in ASU 2017-09 is applied prospectively. The amendments in ASU 2017-09 are effective for annual periods beginning after December 15, 2017, including interim periods within those annual periods. The Company’s adoption of this guidance effective January 1, 2018, did not materially impact its consolidated and combined financial statements.
In January 2016, the FASB issued ASU 2016-01, “Financial Instruments-Overall (Subtopic 825-10): Recognition and Measurement of Financial Assets and Financial Liabilities,” which requires equity investments (except those accounted for under the equity method of accounting, or those that result in consolidation of the investee) to be measured at fair value with changes in fair value recognized in net income, requires public business entities to use the exit price notion when measuring the fair value of financial instruments for disclosure purposes, requires separate presentation of financial assets and financial liabilities by measurement category and form of financial asset, and eliminates the requirement for public business entities to disclose the method(s) and significant assumptions used to estimate the fair value that is required to be disclosed for financial
F- 10
LIBERTY OILFIELD SERVICES INC.
Notes to Consolidated and Combined Financial Statements
instruments measured at amortized cost. The ASU is effective for annual periods beginning after December 15, 2017 and was prospectively adopted on January 1, 2018. The adoption of ASU 2016-01 did not have a material impact on the consolidated financial statements of the Company.
In August 2016, the FASB issued ASU 2016-15, “Statement of Cash Flows (Topic 230): Classification of Certain Cash Receipts and Cash Payments,” which is effective for fiscal years and interim periods within fiscal years beginning after December 15, 2017, with a full retrospective approach to be used upon implementation and early adoption allowed. ASU 2016-15 provides guidance on eight different issues, intended to reduce diversity in practice on how certain cash receipts and cash payments are presented and classified in the statement of cash flows. The adoption of ASU 2016-15 on January 1, 2018 did not have a material impact on the consolidated and combined financial statements of the Company.
In October 2016, the FASB issued ASU 2016-16, “Income Taxes (Topic 740): Intra-Entity Transfers of Assets Other Than Inventory,” which requires entities to recognize the tax consequences of intercompany asset transfers in the period in which the transfer takes place, with the exception of inventory transfers. The ASU is effective for fiscal years and interim periods within fiscal years beginning after December 15, 2017. Entities must adopt the standard using a modified retrospective approach with a cumulative effect adjustment to accumulated earnings as of the beginning of the period of adoption. The cumulative effect adjustments may include recognition of the income tax consequences of intra-entity transfers of assets other than inventory that occur before the adoption date. Early adoption is permitted but only at the beginning of an annual period for which no financial statements (interim or annual) have already been issued or made available for issuance. The adoption of ASU 2016-16 on January 1, 2018 did not have a material impact on the consolidated and combined financial statements of the Company.
Recently Issued Accounting Standards
In June 2016, the FASB issued ASU 2016-13, “Financial Instruments-Credit Losses (Topic 326): Measurement of Credit Losses on Financial Instruments,” which is effective for fiscal years and interim periods within fiscal years beginning after December 15, 2019, with a modified-retrospective approach to be used for implementation. ASU 2016-13 changes the impairment model for most financial assets and certain other instruments. Specifically, this new guidance requires using a forward looking, expected loss model for trade and other receivables, held-to-maturity debt securities, loans and other instruments. This will replace the currently used model and may result in an earlier recognition of allowance for losses. The Company is currently evaluating the impact the adoption of this standard will have on its consolidated and combined financial statements.
In February 2016, the FASB established Topic 842, Leases, by issuing ASU No. 2016-02, “Leases (Topic 842),” which requires lessees to recognize leases on-balance sheet and disclose key information about leasing arrangements. Topic 842 was subsequently amended by ASU No. 2018-01, “Land Easement Practical Expedient for Transition to Topic 842”; ASU No. 2018-10, “Codification Improvements to Topic 842, Leases”; and ASU No. 2018-11, “Targeted Improvements.” The new standard establishes a right-of-use model (“ROU”) that requires a lessee to recognize a ROU asset and lease liability on the balance sheet for all leases with a term longer than 12 months. Leases will be classified as finance or operating, with classification affecting the pattern and classification of expense recognition in the income statement.
The new standard is effective for the Company on January 1, 2019, with early adoption permitted. A modified retrospective transition approach is required, applying the new standard to all leases existing at the date of initial application. An entity may choose to use either (1) its effective date or (2) the beginning of the earliest comparative period presented in the financial statements as its date of initial application. If an entity chooses the second option, the transition requirements for existing leases also apply to leases entered into between the date of initial application and the effective date. The entity must also recast its comparative period financial statements and provide the disclosures required by the new standard for the comparative periods. The Company adopted the new standard on January 1, 2019 and used the effective date as the date of initial application. Consequently, financial information will not be updated and the disclosures required under the new standard will not be provided for dates and periods before January 1, 2019.
The modified retrospective approach includes several practical expedients that entities may elect to apply upon transition. The Company has determined it will elect the package of practical expedients permitted under the transition guidance within the new standard, which allows a lessee to carryforward their population of existing leases, the classification of each lease, as well as the treatment of initial direct costs as of the period of adoption. In addition, the Company will elect the practical expedient related to lease and non-lease components, as an accounting policy for all asset classes, which allows a lessee to not separate non-lease from lease components and instead account for consideration paid in a contract as a single component. Furthermore, the Company has made the policy election to not recognize right-of-use assets and lease liabilities that arise from leases with an initial term of 12 months or less on the consolidated statements of financial position. Lastly, the Company has determined it will not elect the practical expedient related to hindsight in determining the lease term and in assessing impairment of right-of-use assets.
F- 11
LIBERTY OILFIELD SERVICES INC.
Notes to Consolidated and Combined Financial Statements
The Company has executed a comprehensive approach to identify arrangements that may contain a lease, has performed completeness assessments over the identified lease populations, and has implemented system solutions and processes to appropriately account for the lease right-of-use assets and lease liabilities upon transition and an ongoing basis.
The Company expects that this standard will have a material effect on its consolidated statements of financial position as the Company recognizes right-of-use assets and lease liabilities for the future minimum lease payments of the Company’s existing operating leases, with the exception of those with a term less than 12 months, included in Note 13—Commitments & Contingencies as of December 31, 2018, adjusted for an applied incremental borrowing rate, determined to be appropriate for each lease. The Company does not anticipate that the new standard will have a significant impact on the consolidated statements of operations or cash flows.
Note 3—Inventories
Inventories consist of the following:
|
December 31,
|
|||||||
|
($ in thousands)
|
2018
|
2017
|
|||||
|
Proppants
|
$
|
22,038
|
|
$
|
30,523
|
|
|
|
Chemicals
|
10,781
|
|
10,660
|
|
|||
|
Maintenance parts
|
27,205
|
|
14,341
|
|
|||
|
$
|
60,024
|
|
$
|
55,524
|
|
||
During the year ended December 31, 2018, the lower of cost or net realizable value analysis resulted in the Company recording a write-down to inventory carrying values of
$3.4 million
, included as a component in cost of services in the consolidated statement of income for the year ended
December 31, 2018
.
F- 12
LIBERTY OILFIELD SERVICES INC.
Notes to Consolidated and Combined Financial Statements
Note 4—Property and Equipment
Property and equipment consist of the following:
|
Estimated
useful lives (in years) |
December 31,
|
||||||||
|
2018
|
2017
|
||||||||
|
($ in thousands)
|
|||||||||
|
Land
|
N/A
|
$
|
5,400
|
|
$
|
4,495
|
|
||
|
Field services equipment
|
2-7
|
778,423
|
|
572,096
|
|
||||
|
Vehicles
|
4-7
|
59,807
|
|
60,815
|
|
||||
|
Buildings and facilities
|
5-30
|
27,795
|
|
24,260
|
|
||||
|
Office equipment and furniture
|
2-7
|
6,200
|
|
5,879
|
|
||||
|
877,625
|
|
667,545
|
|
||||||
|
Less accumulated depreciation and amortization
|
(307,277
|
)
|
(198,453
|
)
|
|||||
|
570,348
|
|
469,092
|
|
||||||
|
Construction in-progress
|
N/A
|
56,705
|
|
25,684
|
|
||||
|
$
|
627,053
|
|
$
|
494,776
|
|
||||
During the years ended December 31, 2018, 2017 and 2016, the Company recognized depreciation expense of
$124.9 million
,
81.5 million
and
41.4 million
respectively.
In November 2018, one of the Company’s hydraulic frac fleets was involved in an accidental fire, which resulted in damage to a portion of the equipment in that fleet. The Company accrued
$15.7 million
of insurance proceeds for replacement cost of the damaged equipment, which is presented in prepaid and other current assets on the accompanying consolidated balance sheets as of December 31, 2018. The accrued insurance proceeds offset the
$4.3 million
loss recognized on the damaged equipment. The resulting net gain of
$11.5 million
was recognized in (gain) loss on disposal of assets for the year ended December 31, 2018 in the accompanying consolidated statements of operations.
Note 5—Debt
The following is a summary of debt:
|
December 31,
|
|||||||
|
2018
|
2017
|
||||||
|
Term Loan Outstanding
|
$
|
111,715
|
|
$
|
174,562
|
|
|
|
Revolving Line of Credit
|
—
|
|
30,000
|
|
|||
|
Deferred financing costs and original issue discount
|
(5,191
|
)
|
(8,205
|
)
|
|||
|
Total debt, net of deferred financing costs and original issue discount
|
$
|
106,524
|
|
$
|
196,357
|
|
|
|
Current portion of long-term debt, net of discount
|
$
|
385
|
|
$
|
11
|
|
|
|
Long-term debt, net of discount and current portion
|
106,139
|
|
196,346
|
|
|||
|
$
|
106,524
|
|
$
|
196,357
|
|
||
On September 19, 2017, the Company entered into
two
new credit agreements for a revolving line of credit up to
$250.0 million
(the “ABL Facility”) and a
$175.0 million
term loan (the “Term Loan Facility”, and together with the ABL Facility the “Credit Facilities”).
ABL Facility
Under the terms of the ABL Facility, up to
$250.0 million
may be borrowed, subject to certain borrowing base limitations based on a percentage of eligible accounts receivable and inventory. As of
December 31, 2018
, the borrowing base was calculated to be
$224.6 million
, and the Company had no borrowings outstanding, except for a letter of credit in the amount of
$0.3 million
, with
$224.3 million
of remaining availability. Borrowings under the ABL Facility bear interest at LIBOR or a base rate, plus an applicable LIBOR margin of
1.5%
to
2.0%
or base rate margin of
0.5%
to
1.0%
, as defined in the ABL Facility credit agreement. The unused commitment is subject to an unused commitment fee of
0.375%
to
0.5%
. Interest and fees are payable in arrears at the end of each month, or, in the case of LIBOR loans, at the end of each interest period. The ABL Facility
F- 13
LIBERTY OILFIELD SERVICES INC.
Notes to Consolidated and Combined Financial Statements
matures on the earlier of (i) September 19, 2022, and (ii) to the extent the debt under the Term Loan Facility remains outstanding,
90
days prior to the final maturity of the Term Loan Facility, which matures on September 19, 2022. Borrowings under the ABL Facility are collateralized by accounts receivable and inventory, and further secured by the Company, Liberty LLC and R/C IV Non-U.S. LOS Corp., a Delaware corporation and a subsidiary of the Company, as parent guarantors.
Term Loan Facility
The Term Loan Facility provides for a
$175.0 million
term loan, of which
111.7 million
remained outstanding as of
December 31, 2018
. Amounts outstanding bear interest at LIBOR or a base rate, plus an applicable margin of
7.625%
or
6.625%
, respectively, and the weighted average rate on borrowings was
10.1%
as of
December 31, 2018
. The Company is required to make quarterly principal payments of
1%
per annum of the outstanding principal balance, commencing on December 31, 2017, with final payment due at maturity on September 19, 2022. The Term Loan Facility is collateralized by the fixed assets of LOS and its subsidiaries, and is further secured by the Company, Liberty LLC and R/C IV Non-U.S. LOS Corp., a Delaware corporation and a subsidiary of the Company, as parent guarantors.
The Credit Facilities include certain non-financial covenants, including but not limited to restrictions on incurring additional debt and certain distributions. Moreover, the ability of the Company to incur additional debt and to make distributions is dependent on maintaining a maximum leverage ratio. The Term Loan Facility requires mandatory prepayments upon certain dispositions of property or issuance of other indebtedness, as defined, and annually a percentage of excess cash flow (
25%
to
50%
, depending on leverage ratio, of consolidated net income less capital expenditures and other permitted payments, commencing with the year ending December 31, 2018). Certain mandatory prepayments and optional prepayments are subject to a prepayment premium of
3%
of the prepaid principal declining annually to
1%
during the first three years of the term of the Term Loan Facility.
The Credit Facilities are not subject to financial covenants unless liquidity, as defined in the respective credit agreements, drops below a specified level. Under the ABL Facility, the Company is required to maintain a minimum fixed charge coverage ratio, as defined in the credit agreement governing the ABL Facility, of
1.0
to 1.0 for each period if excess availability is less than
10%
of the borrowing base or
$12.5
million, whichever is greater. Under the Term Loan Facility, the Company is required to maintain a minimum fixed charge coverage ratio, as defined, of
1.2
to 1.0 for each trailing twelve-month report if the Company’s liquidity, as defined, is less than
$25.0
million for at least five consecutive business days.
The Company was in compliance with these covenants as of
December 31, 2018
.
Maturities of debt are as follows:
|
($ in thousands)
|
|||
|
Years Ending December 31,
|
|||
|
2019
|
$
|
1,750
|
|
|
2020
|
1,750
|
|
|
|
2021
|
1,750
|
|
|
|
2022
|
106,465
|
|
|
|
2023
|
—
|
|
|
|
$
|
111,715
|
|
|
Note 6—Redeemable Common Units
During February 2017, ACQI received
$39.8
million in cash from Liberty Holdings in exchange for
40,000,000
Redeemable Common Units of ACQI which accrue a return of
8%
per annum (the “Redeemable Common Units”). The Redeemable Common Units were redeemable at the option of the holder on the later of (A) the earlier of an initial public offering or March 23, 2020 and (B) the second business day after all principal and interest outstanding under the ABL Facility have been paid in full and commitments thereunder are terminated. In accordance with ASC 505, “Equity”, due to their conditional redemption feature, the Redeemable Common Units are classified as temporary equity in the accompanying combined balance sheet as of December 31, 2017.
The Redeemable Common Units were deemed extinguished and satisfied in full in connection with the Corporate Reorganization (see Note 1—Organization and Basis of Presentation).
F- 14
LIBERTY OILFIELD SERVICES INC.
Notes to Consolidated and Combined Financial Statements
Note 7—Fair Value Measurements and Financial Instruments
The fair values of the Company’s assets and liabilities represent the amounts that would be received to sell those assets or that would be paid to transfer those liabilities in an orderly transaction at the reporting date. These fair value measurements maximize the use of observable inputs. However, in situations where there is little, if any, market activity for the asset or liability at the measurement date, the fair value measurement reflects the Company’s own judgments about the assumptions that market participants would use in pricing the asset or liability. The Company discloses the fair values of its assets and liabilities according to the quality of valuation inputs under the following hierarchy:
|
•
|
Level 1 Inputs: Quoted prices (unadjusted) in an active market for identical assets or liabilities.
|
|
•
|
Level 2 Inputs: Inputs other than quoted prices that are directly or indirectly observable.
|
|
•
|
Level 3 Inputs: Unobservable inputs that are significant to the fair value of assets or liabilities.
|
The classification of an asset or liability is based on the lowest level of input significant to its fair value. Those that are initially classified as Level 3 are subsequently reported as Level 2 when the fair value derived from unobservable inputs is inconsequential to the overall fair value, or if corroborated market data becomes available. Assets and liabilities that are initially reported as Level 2 are subsequently reported as Level 3 if corroborated market data is no longer available. Transfers occur at the end of the reporting period. There were no transfers into or out of Levels 1, 2 and 3 during the years ended
December 31, 2018
and
2017
.
The Company’s financial instruments consist of cash and cash equivalents, accounts receivable, accounts payable, accrued liabilities and long-term debt. These financial instruments do not require disclosure by level. The carrying values of all the Company’s financial instruments included in the accompanying balance sheets approximated or equaled their fair values at
December 31, 2018
and
2017
.
|
•
|
The carrying values of cash and cash equivalents, accounts receivable and accounts payable (including accrued liabilities) approximated fair value at
December 31, 2018
and
2017
, due to their short-term nature.
|
|
•
|
The carrying value of amounts outstanding under long-term debt agreements with variable rates approximated fair value at
December 31, 2018
and
2017
, as the effective interest rates approximated market rates.
|
Nonfinancial assets
The Company estimates fair value to perform impairment tests as required on long-lived assets. The inputs used to determine such fair value are primarily based upon internally developed cash flow models and would generally be classified within Level 3 in the event that such assets were required to be measured and recorded at fair value within the consolidated and combined financial statements. There were no such measurements required as of
December 31, 2018
and
2017
.
Credit Risk
The Company’s financial instruments exposed to concentrations of credit risk consist primarily of cash and cash equivalents, and trade receivables.
The Company’s cash balances on deposit with financial institutions total
$103.3
million and
$16.3
million as of
December 31, 2018
and
2017
, respectively, which, as of certain dates, exceeded FDIC insured limits. The Company regularly monitors these institutions’ financial condition.
The majority of the Company’s customers have payment terms of
45
days or less. As of
December 31, 2018
and
2017
,
two
and
one
customers accounted for
28%
and
22%
, respectively, of total accounts receivable and unbilled revenue. The Company mitigates the associated credit risk by performing credit evaluations and monitoring the payment patterns of its customers. During the years
December 31, 2018
,
2017
and
2016
,
one
,
two
and
three
customers accounted for
11%
,
36%
and
45%
of total revenue, respectively.
As of
December 31, 2018
and
2017
, the Company had no provision for doubtful accounts, and the balance as of
December 31, 2016
represented one specific entity engaged in the business of oil and gas exploration and production that had filed for bankruptcy primarily as a result of the significant decline in the oil and gas industry.
F- 15
LIBERTY OILFIELD SERVICES INC.
Notes to Consolidated and Combined Financial Statements
|
($ in thousands)
|
2018
|
2017
|
2016
|
|||||||
|
Allowance for doubtful accounts, beginning of year
|
$
|
—
|
|
$
|
497
|
|
6,921
|
|
||
|
Bad debt expense:
|
||||||||||
|
Provision for doubtful accounts
|
—
|
|
—
|
|
—
|
|
||||
|
Write off of uncollectible accounts against reserve
|
—
|
|
(497
|
)
|
(6,424
|
)
|
||||
|
Allowance for doubtful accounts, end of year
|
$
|
—
|
|
$
|
—
|
|
497
|
|
||
Note 8—Equity
Preferred Stock
As of
December 31, 2018
the Company had
10,000
shares of preferred stock authorized, par value
$0.01
, with none issued and outstanding. If issued, each class or series of preferred stock will cover the number of shares and will have the powers, preferences, rights, qualifications, limitations and restrictions determined by the Company's board of directors, which may include, among others, dividend rights, liquidation preferences, voting rights, conversion rights, preemptive rights and redemption rights. Except as provided by law or in a preferred stock designation, the holders of preferred stock will not be entitled to vote at or receive notice of any meeting of shareholders.
Class A Common Stock
The Company had a total of
68,359,871
shares of Class A Common Stock outstanding as of
December 31, 2018
, which includes
634,653
shares of restricted stock. Holders of Class A Common Stock are entitled to one vote per share on all matters to be voted upon by the stockholders and are entitled to ratably receive dividends when and if declared by the Company’s board of directors.
Class B Common Stock
The Company had a total
45,207,372
shares of Class B Common Stock outstanding as of
December 31, 2018
. Holders of the Class B Common Stock are entitled to one vote per share on all matters to be voted upon by stockholders. Holders of Class A Common Stock and Class B Common Stock vote together as a single class on all matters presented to the Company’s stockholders for their vote or approval, except with respect to amendment of certain provisions of the Company’s certificate of incorporation that would alter or change the powers, preferences or special rights of the Class B Common Stock so as to affect them adversely, which amendments must be by a majority of the votes entitled to be cast by the holders of the shares affected by the amendment, voting as a separate class, or as otherwise required by applicable law.
Holders of Class B Common Stock do not have any right to receive dividends, unless the dividend consists of Class B Common Stock or of rights, options, warrants or other securities convertible or exercisable into or exchangeable for shares of Class B Common Stock paid proportionally with respect to each outstanding share of Class B Common Stock and a dividend consisting of shares of Class A Common Stock or of rights, options, warrants or other securities convertible or exercisable into or exchangeable for shares of Class A Common Stock on the same terms is simultaneously paid to the holders of Class A Common Stock. Holders of Class B Common Stock do not have any right to receive a distribution upon liquidation or winding up of the Company.
Under the Second Amended and Restated Limited Liability Company Agreement of Liberty LLC, each Liberty Unit Holder has, subject to certain limitations, the Redemption Right to cause Liberty LLC to acquire all or a portion of its Liberty LLC Units, for, at Liberty LLC’s election, (i) shares of Class A Common Stock at a redemption ratio of one share of Class A Common Stock for each Liberty LLC Unit redeemed, subject to conversion rate adjustments for stock splits, stock dividends and reclassification and other similar transactions or (ii) an equivalent amount of cash. Alternatively, upon the exercise of the Redemption Right, the Company (instead of Liberty LLC) will have the Call Right to, for administrative convenience, acquire each tendered Liberty LLC Unit directly from the redeeming Liberty Unit Holder for, at its election, (x) one share of Class A Common Stock or (y) an equivalent amount of cash. In addition, upon a change of control of the Company, the Company has the right to require each holder of Liberty LLC Units (other than the Company) to exercise its Redemption Right with respect to some or all of such unitholder’s Liberty LLC Units. In connection with any redemption of Liberty LLC Units pursuant to the Redemption Right or the Call Right, the corresponding number of shares of Class B Common Stock will be canceled.
F- 16
LIBERTY OILFIELD SERVICES INC.
Notes to Consolidated and Combined Financial Statements
LLC Interest Issuance
Prior to the IPO and Corporate Reorganization, as described in Note 1, Liberty Holdings issued membership interests to investors in exchange for cash consideration. Total member contributions as of December 31, 2017 were
$275.7 million
, net of commitment and issuance fees. On January 17, 2018, in connection with the Corporate Reorganization, these membership interests were exchanged for Liberty LLC Units. See Note 1 for additional information regarding the Corporate Reorganization.
Unit-Based Compensation
Prior to the IPO and Corporate Reorganization, Liberty Holdings issued Class B units of Liberty Holdings (“Legacy Units”) to certain eligible employees of the Company. The Legacy Units were non-voting, except with respect to such matters that units are entitled to vote as a matter of law. In such cases, each Legacy Unit entitled the holder to 1/1000th of one vote. Certain Legacy Units granted to eligible participants had an assigned benchmark value and were subject to vesting in accordance with the terms of each award letter. Upon termination of the holder’s employment for any reason, Liberty Holdings had the right, but not the obligation, to repurchase from the recipient those vested Legacy Units at fair value.
The Company recognizes compensation expense for equity-based Legacy Units issued to employees based on the grant-date fair value of the awards and each award’s requisite service period. With the assistance from a third-party valuation expert, the Predecessor determined that the Legacy Units issued to employees were deemed to have a de minimis grant-date fair value based on their assigned benchmark values. In connection with the Corporate Reorganization, the unvested Legacy Units were exchanged for
1,258,514
shares of restricted stock with the same terms and requisite vesting conditions as the Legacy Units.
Restricted Stock Awards
Restricted stock awards are awards of Class A Common Stock that are subject to restrictions on transfer and to a risk of forfeitures if the award recipient is no longer an employee or director of the Company for any reason prior to the lapse of the restrictions.
The following table summarizes the Company’s unvested restricted stock activity for the year ended
December 31, 2018
:
|
Number of Shares
|
Grant Date Fair Value per Share (1)
|
|||||
|
Shares of Restricted Stock Issued in Exchange for Legacy Units
|
1,258,514
|
|
—
|
|
||
|
Vested
|
(602,413
|
)
|
—
|
|
||
|
Forfeited
|
(21,448
|
)
|
—
|
|
||
|
Outstanding at December 31, 2018
|
634,653
|
|
$
|
—
|
|
|
(1) As discussed above, the shares of restricted stock retain the grant date fair value of the Legacy Units.
Long Term Incentive Plan
On January 11, 2018, the Company adopted the Long Term Incentive Plan (“LTIP”) to incentivize employees, officers, directors and other service providers of the Company and its affiliates. The LTIP provides for the grant, from time to time, at the discretion of the Company's board of directors or a committee thereof, of stock options, stock appreciation rights, restricted stock, restricted stock units, stock awards, dividend equivalents, other stock-based awards, cash awards, substitute awards and performance awards. Subject to adjustment in the event of certain transaction or changes of capitalization in accordance with the LTIP,
12,908,734
shares of Class A Common Stock have been reserved for issuance pursuant to awards under the LTIP. Class A Common stock subject to an award that expires or is canceled, forfeited, exchanged, settled in cash or otherwise terminated without delivery of shares and shares withheld to pay the exercise price of, or to satisfy the withholding obligations with respect to, an award will again be available for delivery pursuant to other awards under the LTIP.
F- 17
LIBERTY OILFIELD SERVICES INC.
Notes to Consolidated and Combined Financial Statements
Restricted Stock Units
Restricted stock units (“RSUs”) granted pursuant to the LTIP, if they vest, will be settled in shares of the Company’s Class A Common Stock. RSUs were granted with vesting terms up to
five
years. Changes in non-vested RSUs outstanding under the LTIP during the year ended
December 31, 2018
were as follows:
|
Number of Units
|
Weighted Average Grant Date Fair Value per Unit
|
|||||
|
Non-vested as of December 31, 2017
|
—
|
|
$
|
—
|
|
|
|
Granted
|
1,203,433
|
|
19.25
|
|
||
|
Vested
|
—
|
|
—
|
|
||
|
Forfeited
|
(9,750
|
)
|
20.07
|
|
||
|
Outstanding at December 31, 2018
|
1,193,683
|
|
$
|
19.24
|
|
|
Stock-based compensation is included in cost of services and general and administrative expenses in the Company’s consolidated and combined statements of operations. The Company recognized stock based compensation expense of
$5.4
million for the year ended
December 31, 2018
. The Company recognized no stock based compensation expense prior to the Corporate Reorganization. There was approximately
$17.5
million of unrecognized compensation expense relating to outstanding RSUs as of
December 31, 2018
. The unrecognized compensation expense will be recognized on a straight-line basis over the weighted average remaining vesting period of
2.1 years
.
Dividends
The Company paid quarterly cash dividends of
$0.05
per share of Class A Common Stock on September 20 and December 20, 2018 to shareholders of record as of September 6, and December 6, 2018, respectively. Liberty LLC paid distributions of
$11.6 million
, or
$0.05
per Liberty LLC Unit, to all Liberty LLC unitholders as of the dates above,
$7.0 million
of which was paid to the Company. The Company used the proceeds of the distributions to pay the dividends to all holders of Class A Common Stock as of September 6 and December 6, 2018, which totaled
$7.0 million
. Additionally, the Company accrued
$0.2 million
of dividends payable related to restricted stock and RSUs to be paid upon vesting. Dividends related to forfeited restricted stock and RSUs will be forfeited.
Share Repurchase Program
On September 10, 2018 the Company's board of directors authorized a share repurchase plan to repurchase up to
$100.0 million
of the Company's Class A Common Stock through September 30, 2019. During the year ended
December 31, 2018
, Liberty LLC redeemed and retired
4,593,855
Liberty LLC Units from the Company for
$82.9 million
, and the Company repurchased and retired
4,593,855
shares of Class A Common Stock for
82.9 million
, or
$18.05
average price per share including commissions. The total remaining authorized amount available for future repurchases of Class A Common Stock under the share repurchase program was
$17.1 million
as of
December 31, 2018
. Of the total amount of Class A Common Stock repurchased,
2,491,160
shares were repurchased pursuant to a Stock Purchase and Sale Agreement, dated as of September 14, 2018, by and among the Company, R/C Energy IV Direct Partnership, L.P., R/C IV Liberty Holdings, L.P. and Riverstone/Carlyle Energy Partners IV, L.P. (collectively, the “Riverstone Sellers”). For further details of this related party transaction see Note 12.
The Company accounts for the purchase price of repurchased common shares in excess of par value (
$0.01
per share of Class A Common Stock) as a reduction of additional paid-in capital, and will continue to do so until additional paid-in capital is reduced to zero. Thereafter, any excess purchase price will be recorded as a reduction to retained earnings.
F- 18
LIBERTY OILFIELD SERVICES INC.
Notes to Consolidated and Combined Financial Statements
Note 9—Net Income per Share
Basic net income per share measures the performance of an entity over the reporting period. Diluted net income per share measures the performance of an entity over the reporting period while giving effect to all potentially dilutive common shares that were outstanding during the period. The Company uses the “if-converted” method to determine the potential dilutive effect of its Class B Common Stock and the treasury stock method to determine the potential dilutive effect of outstanding restricted stock and RSUs.
The following table reflects the allocation of net income to common stockholders and net income per share computations for the periods indicated based on a weighted average number of common stock outstanding for the period subsequent to the Corporate Reorganization on January 17, 2018:
|
(In thousands, except per share data)
|
Year Ended December 31, 2018
|
|||
|
Basic Net Income Per Share
|
||||
|
Numerator:
|
||||
|
Net income attributable to Liberty Oilfield Services Inc. Stockholders
|
$
|
126,349
|
|
|
|
Denominator:
|
||||
|
Basic weighted average shares outstanding
|
68,838
|
|
||
|
Basic net income per share attributable to Liberty Oilfield Services Inc. Stockholders
|
$
|
1.84
|
|
|
|
Diluted Net Income Per Share
|
||||
|
Numerator:
|
||||
|
Net income attributable to Liberty Oilfield Services Inc. Stockholders
|
$
|
126,349
|
|
|
|
Effect of exchange of the shares of Class B Common stock for shares of Class A Common Stock
|
86,577
|
|
||
|
Diluted net income attributable to Liberty Oilfield Services Inc. Stockholders
|
$
|
212,926
|
|
|
|
Denominator:
|
||||
|
Basic weighted average shares outstanding
|
68,838
|
|
||
|
Effect of dilutive securities:
|
||||
|
Restricted stock
|
906
|
|
||
|
Restricted stock units
|
602
|
|
||
|
Class B Common Stock
|
47,492
|
|
||
|
Diluted weighted average shares outstanding
|
117,838
|
|
||
|
Diluted net income per share attributable to Liberty Oilfield Services Inc. Stockholders
|
$
|
1.81
|
|
|
Note 10—Income Taxes
Prior to the IPO, the Predecessor was treated as a partnership for U.S. federal, state and local income tax purposes. As such, any liability for federal income tax was the responsibility of the members of the Predecessor. Accordingly, no provision for U.S. federal, state and local income tax has been provided in the combined financial statements of the Company for periods ending prior to the IPO.
Following the IPO, the Company is a corporation and is subject to U.S. federal, state and local income tax on its share of Liberty LLC’s taxable income. Liberty LLC is treated as a partnership, and its income is passed through to its owners, for income tax purposes. Liberty LLC’s members, including the Company, are liable for federal, state and local income taxes based on their share of Liberty LLC’s pass-through taxable income. As of
December 31, 2018
, tax reporting by the Company's Predecessor for the years ended December 31,
2015
,
2016
, and
2017
is subject to examination by the tax authorities. With few exceptions, as of
December 31, 2018
, the Company is no longer subject to U.S. federal, state or local examinations by tax authorities for tax years ended before December 31, 2015.
F- 19
LIBERTY OILFIELD SERVICES INC.
Notes to Consolidated and Combined Financial Statements
Income tax expense reflected in the consolidated statement of operations consisted of:
|
($ in thousands)
|
Year Ended December 31, 2018
|
|||
|
Current:
|
||||
|
Federal
|
16,684
|
|
||
|
State
|
3,213
|
|
||
|
Total Current
|
$
|
19,897
|
|
|
|
Deferred:
|
|
|||
|
Federal
|
19,063
|
|
||
|
State
|
1,425
|
|
||
|
Total Deferred
|
$
|
20,488
|
|
|
|
Income tax expense
|
$
|
40,385
|
|
|
A reconciliation of the statutory U.S. federal income tax rate of 21.0% to the Company's effective income tax rate is as follows:
|
($ in thousands)
|
Year Ended December 31, 2018
|
|||
|
Federal income tax expense at statutory rate
|
$
|
60,778
|
|
|
|
State and local income tax expense, net
|
4,456
|
|
||
|
Pre-IPO income before income taxes attributable to the Predecessor
|
(1,958
|
)
|
||
|
Noncontrolling interest
|
(24,606
|
)
|
||
|
Other
|
1,715
|
|
||
|
Total income tax expense
|
$
|
40,385
|
|
|
The effective combined U.S. federal and state income tax rate applicable to the Company for the period commencing on January 17, 2018, the date of the Corporate Reorganization, through
December 31, 2018
was
14.0%
.
The Company recognized income tax expense of
$40.4 million
for the period commencing on January 17, 2018, the date of the Corporate Reorganization, through
December 31, 2018
. The Company’s effective tax rate is significantly less than the statutory federal income tax rate of 21.0% because no taxes are payable by the Company for the noncontrolling interest’s share of Liberty LLC’s pass-through income for federal, state and local income tax reporting and due to the shortened taxable period, as the Company was a pass-through entity prior to the IPO. During 2018, the noncontrolling interest effect resulted in a $
24.6 million
reduction in income tax expenses, while income before taxes and income attributable to the Predecessor resulted in a $
2.0 million
reduction in income tax expenses.
F- 20
LIBERTY OILFIELD SERVICES INC.
Notes to Consolidated and Combined Financial Statements
The tax effects of temporary differences that give rise to the deferred tax assets and deferred tax liabilities are presented below:
|
($ in thousands)
|
Year-Ended December 31, 2018
|
|||
|
Deferred tax assets:
|
||||
|
Federal net operating losses
|
$
|
1,638
|
|
|
|
State net operating losses
|
160
|
|
||
|
Realized tax benefit - TRAs
|
15,845
|
|
||
|
Total deferred tax assets
|
17,643
|
|
||
|
Deferred tax liabilities:
|
|
|
||
|
Investment in Liberty LLC
|
$
|
50,325
|
|
|
|
Other
|
312
|
|
||
|
Total deferred tax liabilities
|
50,637
|
|
||
|
Net deferred tax liability
|
$
|
32,994
|
|
|
As of
December 31, 2018
, the Company had significant deferred tax assets and liabilities. The deferred tax assets include U.S. federal and state net operating losses and the step up in basis of depreciable assets under Section 754 of the Internal Revenue Code of 1986, as amended. As a result of the IPO and Corporate Reorganization, the Company recorded a deferred tax asset and liability for the difference between the book value and the tax value of the Company's investment in Liberty LLC. The deferred tax assets have been recorded for tax attributes contributed to the Company as part of the Corporate Reorganization. Deferred tax liabilities of
$29.3 million
have been recorded in connection with the Liberty LLC Units acquired through reorganization. The initial deferred tax liability is recorded as a long term liability and additional paid in capital on the consolidated balance sheet as of
December 31, 2018
.
As of
December 31, 2018
, the Company has available U.S. federal net operating loss carryforwards to reduce future taxable income of
$4.5 million
, expiring in 2027.
Uncertain Tax Positions
The Company records uncertain tax positions on the basis of a two-step process in which (1) the Company determines whether it is more likely than not the tax positions will be sustained on the basis of the technical merits of the position and (2) for those tax positions meeting the more likely than not recognition threshold, the Company recognizes the largest amount of tax benefit that is more than 50% likely to be realized upon ultimate settlement with the related tax authority.
The Company determined that no liability for unrecognized tax benefits for uncertain tax positions was required at
December 31, 2018
. In addition, the Company does not believe that it has any tax positions for which it is reasonably possible that it will be required to record a significant liability for unrecognized tax benefits within the next twelve months. If the Company were to record an unrecognized tax benefit, the Company will recognize interest and penalties related to income tax matters in income tax expense.
Tax Distributions
Liberty LLC is treated as a partnership for income tax purposes. Federal, state and local taxes resulting from the pass-through taxable income of Liberty LLC are obligations of its members. Net profits and losses are generally allocated to the members of Liberty LLC (including the Company) in accordance with the number of Liberty LLC Units held by each member for tax purposes. The amended and restated operating agreement of Liberty LLC provides for cash distributions and advances to assist members (including the Company) in paying their income tax liabilities. Liberty LLC paid to noncontrolling interest holders tax distributions and advances of
$17.6 million
and
$3.7 million
, respectively, for the year ended December 31, 2018.
F- 21
LIBERTY OILFIELD SERVICES INC.
Notes to Consolidated and Combined Financial Statements
Tax Receivable Agreements
The term of each TRA commenced on January 17, 2018, and will continue until all such tax benefits that are subject to such TRA have been utilized or expired, unless the Company experiences a change of control (as defined in the TRAs, which includes certain mergers, asset sales and other forms of business combinations) or the TRAs are terminated early (at the Company’s election or as a result of its breach), and the Company makes the termination payments specified in such TRA.
The amounts payable, as well as the timing of any payments, under the TRAs are dependent upon significant future events and assumptions, including the timing of the redemptions of Liberty LLC Units, the price of our Class A Common Stock at the time of each redemption, the extent to which such redemptions are taxable transactions, the amount of the redeeming unit holder’s tax basis in its Liberty LLC Units at the time of the relevant redemption, the depreciation and amortization periods that apply to the increase in tax basis, the amount of net operating losses available to the Company as a result of the Corporate Reorganization, the amount and timing of taxable income the Company generates in the future, the U.S. federal income tax rate then applicable, and the portion of the Company’s payments under the TRAs that constitute imputed interest or give rise to depreciable or amortizable tax basis.
Prior to the Corporate Reorganization, one of the Legacy Owners distributed a portion of its member interest in Liberty Holdings to R/C IV Non-U.S. LOS Corp. (“R/C IV”). Subsequently, in conjunction with the Corporate Reorganization, R/C IV was contributed to the Company. At the time of the contribution, R/C IV had net operating loss carryforwards totaling
$10.9 million
for federal income tax purposes and
$10.9 million
for certain state income tax purposes, which became available for the Company's use as a result of the contribution. As a result of the Company being in a net income position and the expected utilization of deferred tax assets, the Company recognized a deferred tax asset of
$2.6 million
and a corresponding
$2.3 million
liability pursuant to the TRAs.
During the year ended
December 31, 2018
, exchanges of Liberty LLC Units and shares of Class B Common Stock resulted in an increase of
$14.5 million
in amounts payable under the TRAs, and a net increase of
$17.1 million
in deferred tax assets, all of which were recorded through equity. At
December 31, 2018
, the Company’s liability under the TRA was $
16.8 million
, all of which is presented as a component of long term liabilities, and the related deferred tax assets totaled
$19.7 million
.
Note 11—Defined Contribution Plan
The Company sponsors a 401(k) defined contribution retirement plan covering eligible employees. The Company makes matching contributions, which were temporarily suspended in May 2015, but were resumed in April 2017 at a rate of
$1.00
for each
$1.00
of employee contribution, subject to a cap of
3%
of the employee’s salary. In October 2017, the cap on these contributions was increased to
6%
of the employee’s base salary. Contributions made by the Company were
$13.8
million,
$5.1 million
and
$0
for the years ended
December 31, 2018
,
2017
and
2016
, respectively.
Note 12—Related Party Transactions
During September 2018, the Company repurchased
2,491,160
shares of Class A Common Stock from the Riverstone Sellers, at a weighted average purchase price of
$18.96
per share, pursuant to the share repurchase program (see Note 8—Equity -
Share
Repurchase Program
).
In connection with the Corporate Reorganization, the Company engaged in transactions with affiliates (see Note 1—Organization and Basis of Presentation) including entering into the TRAs with affiliates (see Note 10). Also in conjunction with the Corporate Reorganization, Liberty Holdings contributed
$2.1 million
of additional assets to Liberty LLC and Redeemable Common Units in the amount of
$42.6 million
were settled (see Note 6).
In September 2011, Liberty Resources LLC, an oil and gas exploration and production company, and its successor entity (collectively, the “Affiliate”) and LOS, companies with common ownership and management, entered into a services agreement (the “Services Agreement”) whereby the Affiliate is to provide certain administrative support functions to LOS and a master service agreement whereby LOS provides hydraulic fracturing services to the Affiliate at market service rates. The amounts incurred under the Services Agreement by LOS during the years ended
December 31, 2018
,
2017
and
2016
, were
$0.2 million
,
$0
and
$0.1 million
, respectively, and there was
no
outstanding balance for the respective periods. On June 14, 2018, the Services Agreement was formally terminated.
F- 22
LIBERTY OILFIELD SERVICES INC.
Notes to Consolidated and Combined Financial Statements
The amounts of the Company’s revenue related to hydraulic fracturing services provided to the Affiliate for the years ended
December 31, 2018
,
2017
and
2016
, were
$23.1 million
,
$24.7 million
and
$13.1 million
, respectively. As of
December 31, 2018
and
2017
,
$15.1 million
and
$4.0 million
, respectively, of the Company’s accounts receivable, and
$0
and
$0.1 million
, respectively, of the Company’s unbilled revenue was with the Affiliate.
Liberty Holdings entered into an advisory agreement, dated December 30, 2011, with Riverstone/Carlyle Energy Partners IV, L.P. (“R/C”), in which R/C agreed to provide certain administrative advisory services to Liberty Holdings. The service fees incurred to R/C for the years ended
December 31, 2018
,
2017
and
2016
were approximately
$0
,
$1.5 million
and
$0.5 million
, respectively. The advisory services agreement was terminated pursuant to an agreement effective as of January 11, 2018. On January 11, 2018, Liberty Holdings, R/C and other parties entered into a Master Reorganization Agreement that, among other things, crystallized the “waterfall” provisions of Article VI of the Third Amended and Restated Limited Liability Agreement of Liberty Holdings, dated October 11, 2016 (the “Holdings LLC Agreement”) in connection with the initial public offering of shares of Class A Common Stock. As part of this crystallization, R/C and affiliated entities (collectively, the “R/C Affiliates”) received shares of Class A Common Stock, including
117,647
shares of Class A Common Stock (such
117,647
referred to as the “Issued Shares”) to compensate R/C Affiliates for certain accrued preferred returns but which would not have been issued had the
$2.0 million
in fees owing under the advisory agreement been paid in cash. Had this fee been paid in cash on or prior to January 11, 2018, R/C and Liberty Holdings acknowledge that R/C Affiliates would not have received the Issued Shares in the crystallization pursuant to the provisions of the Holdings LLC Agreement. Subsequently, during the fourth quarter of 2018, R/C asserted that certain provisions of the termination of services agreement provided for R/C to receive
$2.0 million
in cash as payment of those accrued fees. To resolve this matter, the Company agreed to pay R/C Affiliates
$2.0 million
in cash in exchange for the purchase, at the IPO price, or return of the Issued Shares and
$0.3 million
for interest and the settlement of the matter. Accordingly,
$2.3 million
was recorded as accrued liabilities
-
related party in the accompanying consolidated balance sheet as of December 31, 2018 and subsequently paid in January 2019. The purchased and returned shares of Class A Common Stock were canceled and retired, and the Company does not expect to incur future expense related to the advisory agreement or termination thereof.
During 2016, Liberty Holdings entered into a future commitment to invest and become a non-controlling minority member in Proppant Express Investments, LLC (“PropX Investments”), the owner of Proppant Express Solutions, LLC (“PropX”), a provider of proppant logistics equipment. LOS is party to a services agreement (the “PropX Services Agreement”) whereby LOS is to provide certain administrative support functions to PropX, and LOS is to purchase and lease proppant logistics equipment from PropX. The PropX Services Agreement was terminated on May 29, 2018, the Company continues to purchase and lease equipment from PropX. For the years ended
December 31, 2018
and
2017
the Company purchased proppant logistics equipment of
$3.1 million
and
$9.9 million
and leased proppant logistics equipment during the years ended
December 31, 2018
,
2017
and
2016
for
$4.4 million
,
$3.7 million
and
$0
, respectively. During the three months ended March 31, 2018, in exchange for a
5%
discount, the Company made a prepayment to PropX for rented equipment in the amount of
$5.4 million
, all of which was recognized during the year ended December 31, 2018.
Receivables from PropX as of
December 31, 2018
and
2017
were
$0
. Payables to PropX as of
December 31, 2018
and
2017
were
$0.2 million
and
$0.7 million
, respectively.
Note 13—Commitments & Contingencies
Operating Leases
The Company leases office space, facilities, equipment, and vehicles under non-cancelable operating leases. Rent expense for the years ended
December 31, 2018
and
2017
, was
$40.9 million
and
$20.8 million
, respectively.
F- 23
LIBERTY OILFIELD SERVICES INC.
Notes to Consolidated and Combined Financial Statements
Future minimum lease payments are as follows:
|
($ in thousands)
|
|||
|
Years Ending December 31,
|
|||
|
2019
|
$
|
42,717
|
|
|
2020
|
48,685
|
|
|
|
2021
|
32,390
|
|
|
|
2022
|
6,093
|
|
|
|
2023
|
4,303
|
|
|
|
Thereafter
|
19,742
|
|
|
|
153,930
|
|
||
Purchase Commitments (tons, per ton, gallons, per gallon and per rail car prices are not in thousands)
The Company enters into purchase and supply agreements to secure supply and pricing of proppants and chemicals. As of
December 31, 2018
and
2017
, the agreements commit the Company to purchase
11,266,000
and
10,108,000
tons, respectively, of proppant through December 31, 2021. Amounts above also include commitments to pay for transport fees on minimum amounts of proppants or railcars.
Certain proppant supply agreements contain a clause whereby in the event that the Company fails to purchase minimum volumes, as defined in the agreement, during a specific time period, a shortfall fee may apply. There were
no
shortfalls as of
December 31, 2018
.
As of
December 31, 2018
and
2017
, the Company has commitments to purchase
18,852,000
and
27,278,000
gallons of chemicals through December 31, 2020.
Future proppant, chemical and rail car commitments are as follows:
|
Year ending December 31,
|
|||
|
2019
|
$
|
341,970
|
|
|
2020
|
247,989
|
|
|
|
2021
|
96,958
|
|
|
|
2022
|
3,945
|
|
|
|
2023
|
—
|
|
|
|
$
|
690,862
|
|
|
Litigation
From time to time, the Company is subject to legal and administrative proceedings, settlements, investigations, claims and actions. The Company’s assessment of the likely outcome of litigation matters is based on its judgment of a number of factors including experience with similar matters, past history, precedents, relevant financial and other evidence and facts specific to the matter. Notwithstanding the uncertainty as to the final outcome, based upon the information currently available, management does not believe any matters in aggregate will have a material adverse effect on its financial position or results of operations.
On February 23, 2017, SandBox Logistics and Oren Technologies, LLC (collectively, “Sandbox”) filed suit in the Houston Division of the U.S. District Court for the Southern District of Texas against PropX and LOS. SandBox alleged that LOS willfully infringed multiple U.S. patents and breached an agreement between SandBox and LOS by “directing, controlling, and funding” inter partes review requests before the U.S. Patent and Trademark Office. In July 2018, SandBox requested permission from the court to allege additional breach of contract claims against LOS, including alleged breaches of a confidentiality agreement and an exclusive purchasing covenant. The court denied these requests in September 2018. On December 19, 2018, the U.S. District Court for the Southern District of Texas entered an order dismissing the claims against LOS with prejudice.
F- 24
LIBERTY OILFIELD SERVICES INC.
Notes to Consolidated and Combined Financial Statements
Note 14—Selected Quarterly Financial Data (unaudited)
The following table sets forth certain unaudited financial and operating information for each quarter of the years ended
December 31, 2018
and
2017
. The unaudited quarterly information includes all adjustments that, in the opinion of management, are necessary for the fair presentation of information presented. Operating results for interim periods are not necessarily indicative of the results that may be expected for the full fiscal year.
|
($ in thousands)
|
Year Ended December 31, 2018
|
||||||||||||||
|
Selected Financial Data:
|
First Quarter
|
Second Quarter
|
Third Quarter
|
Fourth Quarter
|
|||||||||||
|
Revenue
|
$
|
495,160
|
|
$
|
628,084
|
|
$
|
558,777
|
|
$
|
473,115
|
|
|||
|
Operating costs and expenses:
|
|
|
|
|
|||||||||||
|
Cost of services (exclusive of depreciation and amortization shown separately below)
|
376,827
|
|
455,469
|
|
418,867
|
|
377,590
|
|
|||||||
|
General and administrative
|
21,677
|
|
27,313
|
|
24,659
|
|
25,403
|
|
|||||||
|
Depreciation and amortization
|
28,016
|
|
30,606
|
|
32,305
|
|
34,183
|
|
|||||||
|
Loss (gain) on disposal of assets
|
80
|
|
485
|
|
701
|
|
(5,608
|
)
|
|||||||
|
Total operating costs and expenses
|
426,600
|
|
513,873
|
|
476,532
|
|
431,568
|
|
|||||||
|
Operating income
|
68,560
|
|
114,211
|
|
82,245
|
|
41,547
|
|
|||||||
|
Other expense:
|
|
|
|
|
|||||||||||
|
Interest expense
|
(6,494
|
)
|
(3,540
|
)
|
(3,648
|
)
|
(3,463
|
)
|
|||||||
|
Net income before income taxes
|
62,066
|
|
110,671
|
|
78,597
|
|
38,084
|
|
|||||||
|
Income tax expense
|
8,079
|
|
15,930
|
|
12,229
|
|
4,147
|
|
|||||||
|
Net income
|
53,987
|
|
94,741
|
|
66,368
|
|
33,937
|
|
|||||||
|
Less: Net income attributable to Predecessor, prior to Corporate Reorganization
|
8,705
|
|
—
|
|
—
|
|
—
|
|
|||||||
|
Less: Net income attributable to noncontrolling interests
|
21,607
|
|
45,146
|
|
32,275
|
|
14,951
|
|
|||||||
|
Net income attributable to Liberty Oilfield Services Inc. stockholders
|
$
|
23,675
|
|
$
|
49,595
|
|
$
|
34,093
|
|
$
|
18,986
|
|
|||
|
($ in thousands)
|
Year ended December 31, 2017
|
||||||||||||||
|
Selected Financial Data:
|
First Quarter
|
Second Quarter
|
Third Quarter
|
Fourth Quarter
|
|||||||||||
|
Revenue
|
$
|
252,394
|
|
$
|
346,725
|
|
$
|
441,853
|
|
$
|
448,883
|
|
|||
|
Operating costs and expenses:
|
|
|
|
|
|||||||||||
|
Cost of services (exclusive of depreciation and amortization shown separately below)
|
211,633
|
|
267,626
|
|
328,434
|
|
339,315
|
|
|||||||
|
General and administrative
|
17,084
|
|
20,022
|
|
22,245
|
|
20,738
|
|
|||||||
|
Depreciation and amortization
|
14,146
|
|
17,521
|
|
24,164
|
|
25,642
|
|
|||||||
|
Loss (gain) on disposal of assets
|
(43
|
)
|
10
|
|
21
|
|
160
|
|
|||||||
|
Total operating costs and expenses
|
242,820
|
|
305,179
|
|
374,864
|
|
385,855
|
|
|||||||
|
Operating income
|
9,574
|
|
41,546
|
|
66,989
|
|
63,028
|
|
|||||||
|
Other expense:
|
|
|
|
|
|||||||||||
|
Interest expense
|
(1,452
|
)
|
(2,511
|
)
|
(3,326
|
)
|
(5,347
|
)
|
|||||||
|
Net income
|
$
|
8,122
|
|
$
|
39,035
|
|
$
|
63,663
|
|
$
|
57,681
|
|
|||
F- 25
LIBERTY OILFIELD SERVICES INC.
Notes to Consolidated and Combined Financial Statements
Note 15—Subsequent Events
In the month ended January 31, 2019, Liberty LLC purchased and retired
1,185,356
Liberty LLC Units from the Company for
17.1 million
, and the Company repurchased and retired
1,185,356
shares of Class A Common Stock for
17.1 million
, or
$14.42
average price per share. These repurchases completed the
$100.0 million
share repurchase plan previously announced on September 19, 2018.
On January 22, 2019, the Company announced that its Board of Directors has authorized the implementation of an additional share repurchase plan to repurchase shares of the Company’s Class A Common Stock, par value
$0.01
per share, in an amount not to exceed
$100.0 million
through January 31, 2021.
Subsequent to December 31, 2018, certain holders of Class B Common Stock exercised their Redemption Right and exchanged
1,634,569
Liberty LLC Units and
1,634,569
shares of Class B Common Stock for
1,634,569
shares of Class A Common Stock. The exchanged shares of Class B Common Stock were canceled and retired.
There were no significant subsequent events requiring disclosure or recognition other than those disclosed in these notes to the consolidated and combined financial statements.
F- 26
TABLE OF CONTENTS
Part IItem 1. BusinessItem 1A. Risk FactorsItem 1B. Unresolved Staff CommentsItem 2. PropertiesItem 3. Legal ProceedingsItem 4. Mine Safety DisclosuresPart IIItem 5. Market For Registrant's Common Equity, Related Stockholder Matters and Issuer Purchases Of Equity SecuritiesItem 6. Selected Financial DataItem 7. Management's Discussion and Analysis Of Financial Condition and Results Of OperationsItem 7A. Quantitative and Qualitative Disclosure About Market RiskItem 8. Financial Statements and Supplementary DataItem 9. Changes in and Disagreements with Accountants on Accounting and Financial DisclosureItem 9A. Controls and ProceduresItem 9B. Other InformationPart IIIItem 10. Directors, Executive Officers and Corporate GovernanceItem 11. Executive CompensationItem 12. Security Ownership Of Certain Beneficial Owners and Management and Related Stockholder MattersItem 13. Certain Relationships and Related Transactions, and Director IndependenceItem 14. Principal Accountant Fees and ServicesPart IVItem 15. Exhibits, Financial Statement SchedulesItem 16. Form 10-k SummaryNote 1 Organization and Basis Of PresentationNote 2 Significant Accounting PoliciesNote 3 InventoriesNote 4 Property and EquipmentNote 5 DebtNote 6 Redeemable Common UnitsNote 7 Fair Value Measurements and Financial InstrumentsNote 8 EquityNote 9 Net Income Per ShareNote 10 Income TaxesNote 11 Defined Contribution PlanNote 12 Related Party TransactionsNote 13 Commitments & ContingenciesNote 14 Selected Quarterly Financial Data (unaudited)Note 15 Subsequent Events