LIBERTY GLOBAL PLC
10-Ks and 10-Qs
|
|
|
|
|
|
|
|
|
|
|
|
|
|
|
|
|
|
|
|
|
|
|
|
|
|
|
|
|
|
|
|
|
|
|
|
|
|
|
|
|
|
|
|
|
|
|
UNITED STATES SECURITIES AND EXCHANGE COMMISSION
WASHINGTON, D.C. 20549
Form
10-K
|
þ
|
ANNUAL REPORT PURSUANT TO SECTION 13 OR 15(d) OF THE SECURITIES EXCHANGE ACT OF 1934
|
|
|
For the fiscal year ended December 31, 2016
|
||
OR
Commission file number 001-35961
|
¨
|
TRANSITION REPORT PURSUANT TO SECTION 13 OR 15(d) OF THE SECURITIES EXCHANGE ACT OF 1934
|
|
For the transition period from to
|
|

(Exact name of Registrant as specified in its charter)
|
England and Wales
|
|
98-1112770
|
|
(State or other jurisdiction of incorporation or organization)
|
|
(I.R.S. Employer Identification No.)
|
|
Griffin House, 161 Hammersmith Rd, London, United Kingdom
|
|
W6 8BS
|
|
(Address of principal executive offices)
|
|
(Zip Code)
|
Registrant’s telephone number, including area code: +44.208.483.6449 or 303.220.6600
Securities registered pursuant to Section 12(b) of the Act:
|
Title of Each Class
|
|
Name of Each Exchange on Which Registered
|
|
Liberty Global Class A Ordinary Share, nominal value $0.01 per share
|
|
NASDAQ Global Select Market
|
|
Liberty Global Class B Ordinary Shares, nominal value $0.01 per share
|
|
NASDAQ Global Select Market
|
|
Liberty Global Class C Ordinary Shares, nominal value $0.01 per share
|
|
NASDAQ Global Select Market
|
|
LiLAC Class A Ordinary Share, nominal value $0.01 per share
|
NASDAQ Global Select Market
|
|
|
LiLAC Class B Ordinary Shares, nominal value $0.01 per share
|
OTC Link
|
|
|
LiLAC Class C Ordinary Shares, nominal value $0.01 per share
|
NASDAQ Global Select Market
|
|
Securities registered pursuant to Section 12(g) of the Act: none
Indicate by check mark if the Registrant is a well-known seasoned issuer, as defined in Rule 405 of the Securities Act.
Yes
þ
No
¨
Indicate by check mark if the Registrant is not required to file reports pursuant to Section 13 or Section 15(d) of the Act. Yes
¨
No
þ
Indicate by check mark whether the Registrant (1) has filed all reports required to be filed by Section 13 or 15(d) of the Securities Exchange Act of 1934 during the preceding 12 months and (2) has been subject to such filing requirements for the past 90 days.
Yes
þ
No
¨
Indicate by check mark whether the Registrant has submitted electronically and posted on its corporate website, if any, every Interactive Data File required to be submitted and posted pursuant to Rule 405 of Regulation S-T during the preceding 12 months. Yes
þ
No
¨
Indicate by check mark if disclosure of delinquent filers pursuant to Item 405 of Regulation S-K is not contained herein, and will not be contained, to the best of registrant’s knowledge, in definitive proxy or information statements incorporated by reference in Part III of this Form 10-K or any amendment to this Form 10-K.
¨
Indicate by check mark whether the Registrant is a large accelerated filer, an accelerated filer, a non-accelerated filer or a smaller reporting company. See definition of “large accelerated filer, accelerated filer” and “smaller reporting company” in Rule 12b-2 of the Exchange Act. Check one:
|
Large Accelerated Filer
þ
|
Accelerated Filer
¨
|
Non-Accelerated Filer
¨
|
Smaller Reporting Company
¨
|
|||
Indicate by check mark whether the registrant is a shell company as defined in Rule 12b-2 of the Exchange Act. Yes
¨
No
þ
State the aggregate market value of the voting and non-voting common equity held by non-affiliates, computed by reference to the price at which the common equity was last sold, or the average bid and ask price of such common equity, as of the last business day of the registrant’s most recently completed second fiscal quarter:
$
27.6
billion
.
The number of outstanding ordinary shares of Liberty Global plc as of
February 10, 2017
was:
|
Class A
|
Class B
|
Class C
|
||||||
|
Liberty Global ordinary shares
|
|
|
|
|
|
|
||
|
LiLAC ordinary shares
|
|
|
|
|
|
|
||
DOCUMENTS INCORPORATED BY REFERENCE
Portions of the definitive proxy statement for the Registrant’s
2017
Annual General Meeting of Shareholders are incorporated by reference in Part III of this Form 10-K.
LIBERTY GLOBAL PLC
2016
ANNUAL REPORT ON FORM 10-K
TABLE OF CONTENTS
|
|
|
Page
Number
|
|
PART I
|
||
|
Item 1.
|
||
|
Item 1A.
|
||
|
Item 1B.
|
||
|
Item 2.
|
||
|
Item 3.
|
||
|
Item 4.
|
Mine Safety Disclosures
|
|
|
PART II
|
||
|
Item 5.
|
||
|
Item 6.
|
||
|
Item 7.
|
||
|
Item 7A.
|
||
|
Item 8.
|
||
|
Item 9.
|
||
|
Item 9A.
|
||
|
Item 9B.
|
||
|
PART III
|
||
|
Item 10.
|
||
|
Item 11.
|
||
|
Item 12.
|
||
|
Item 13.
|
||
|
Item 14.
|
||
|
PART IV
|
||
|
Item 15.
|
||
|
Item 16.
|
Form 10-K Summary
|
|
Who We Are
We are Liberty Global plc (
Liberty Global
), the world's largest international television and broadband company
—
investing, innovating and empowering our customers to be a part of the digital revolution. We are investing in the communication highways of our age. These investments include acquisitions, network extensions and expansion, technology upgrades and our initiatives to engage our people, our customers and the communities in which we operate. Our investments put us at the center of the digital revolution and allow us to drive global innovation through new products, opportunities and applications. We are innovating through technology by building a strong convergence of fixed and mobile communication opportunities reaching gigabit speeds. It is through our operations that we bring the benefits of our global innovation to life. We empower our customers with quality services and products that give them the freedom to connect, converse, work and be entertained anytime, anywhere they choose. We believe our enhanced digital products and services will deliver customer satisfaction, enhance our revenue streams and generate cost savings
—
the goals of our “Liberty GO” program. For further information on Liberty GO, see Item 7.
Management’s Discussion and Analysis of Financial Condition and Results of Operations-Overview
included in Part II of this Annual Report.
Liberty Global
has operations in more than
30
countries serving
24.7 million
customers at
December 31, 2016
. We consolidate these operations listed below, with the exception of
VodafoneZiggo
(defined below).
|
Brand
|
Entity
|
Location
|
Ownership
|
|||

|
Virgin Media
|
United Kingdom & Ireland
|
100.0%
|
|||

|
Unitymedia
|
Germany
|
100.0%
|
|||

|
Telenet
|
Belgium
|
57.4%
|
|||

|
UPC Holding
|
Switzerland, Austria, Poland, Hungary, Romania, Czech Republic, Slovakia
|
100.0%
|
|||

|
VodafoneZiggo
|
Netherlands
|
50.0%
|
|||

|
VTR
|
Chile
|
100.0%
|
|||

|
CWC
|
Caribbean, Latin America & Seychelles
|
100.0%*
|
|||

|
Liberty Puerto Rico
|
Puerto Rico
|
60.0%
|
|||
*
CWC’s operations are provided through various consolidated subsidiaries, including the following subsidiaries where we own less than 100%: Cable & Wireless Panama, SA (a 49.0%-owned entity that owns most of our operations in Panama), The Bahamas Telecommunications Company Limited (a 49.0%-owned entity that owns all of our operations in the Bahamas), Cable & Wireless Jamaica Limited (an 82.0%-owned entity that owns the majority of our operations in Jamaica) and Cable & Wireless Barbados Limited (an 81.1%-owned entity that owns the majority of our operations in Barbados).
I-1
General Development of Business
As a result of a series of mergers that were completed on June 7, 2013,
Liberty Global
became the publicly-held parent company of the successors by merger of Liberty Global, Inc. (the predecessor to
Liberty Global
) and
Virgin Media
Inc. (
Virgin Media
). In the following text, the terms “we”, “our”, “our company” and “us” may refer, as the context requires, to
Liberty Global
(or its predecessor) or collectively to
Liberty Global
(or its predecessor) and its subsidiaries. Unless otherwise indicated, convenience translations into United States (
U.S.
) dollars are calculated as of
December 31, 2016
, and operational data, including subscriber statistics and ownership percentages, are as of
December 31, 2016
.
On December 31, 2016, our company and Vodafone Group Plc (
Vodafone
) formed a 50:50 joint venture, called
VodafoneZiggo
Group Holding B.V. (
VodafoneZiggo
).
VodafoneZiggo
combined our subsidiary VodafoneZiggo Holding B.V., formerly known as Ziggo Group Holding B.V. (
Ziggo Group Holding
), with
Vodafone
’s mobile business in the Netherlands to create a national unified communications provider in the Netherlands with complementary strengths across video, broadband, mobile and business services. As a result of the formation of
VodafoneZiggo
, effective December 31, 2016,
we treat
VodafoneZiggo
as an equity method investment and no longer consolidate
Ziggo Group Holding
. For additional information on this transaction, see note 5 to our consolidated financial statements included in Part II of this Annual Report on Form 10-K.
Expansion and Acquisitions
We have expanded our broadband footprint through new build projects and strategically selected acquisitions. Our new build projects consist of network extension programs pursuant to which we connect additional homes and businesses to our broadband communications network (
Network Extensions
). Our investment in
Network Extensions
is critical not only for our business to grow, but also for the countries and communities in which we operate. The
Network Extensions
, together with upgrades to our existing networks and next generation customer premises equipment, provide our customers the means to enter the gigaworld society. During 2016, we initiated
Network Extensions
in the Germany, Chile, Central and Eastern Europe and certain other markets. During 2015 and 2016, we connected approximately 715,000 homes and commercial premises to Virgin Media’s two-way network (including technical upgrades in the United Kingdom (
U.K.
)). During 2016, we connected approximately 1.0 million homes and commercial premises (including upgrades in Germany and Chile) to our two-way networks in the other markets mentioned above. Pursuant to
Network Extensions
, in 2017, we expect to (1) connect approximately 1.4 million additional homes and commercial premises (excluding upgrades) to our two-way networks attributed to the “
Liberty Global Group
” (as defined and described below) and (2) connect or upgrade approximately 450,000 additional homes and commercial premises to our two-way networks attributed to the “
LiLAC Group
” (as defined and described below). Depending on a variety of factors, however, including the financial and operations results of the earlier phases of our new build programs, any
Network Extensions
may be continued, modified or cancelled at our discretion. For further information on
Network Extensions
, see Item 7.
Management’s Discussion and Analysis of Financial Condition and Results of Operations-Overview
included in Part II of this Annual Report.
Over the past decade, we have also completed several strategic acquisitions both in Europe and in Latin America. We made these acquisitions in order to deliver the scale that allows us to innovate effectively and invest in great content and the best products. This enables us to deliver quality services to our customers. Our significant acquisitions include:
|
•
|
On May 16, 2016, we acquired Cable & Wireless Communications Limited (
CWC
), a provider of telecommunication services, including mobile and high-speed broadband, focused in Latin America and the Caribbean (the
CWC Acquisition
).
|
|
•
|
On February 11, 2016, Telenet Group Holding N.V. (
Telenet
) acquired BASE Company N.V. (
BASE
), the third-largest mobile network operator in Belgium.
|
|
•
|
On June 3, 2015, we acquired, together with investment funds affiliated with Searchlight Capital Partners, L.P. (
Searchlight
), Choice Cable TV (
Choice
), a cable and broadband services provider in Puerto Rico, which was integrated into our Liberty Cablevision of Puerto Rico LLC (
Liberty Puerto Rico
) operations.
|
|
•
|
In November 2014, we gained control of Ziggo Holding B.V. (
Ziggo
), a provider of video, broadband internet, fixed-line telephony and mobile services in the Netherlands, and integrated
Ziggo
into our Netherlands broadband operations. This business was contributed to form
VodafoneZiggo
, a 50:50 joint venture, on December 31, 2016.
|
|
•
|
On November 8, 2012, we completed a series of transactions with
Searchlight
through which we acquired San Juan Cable LLC, dba OneLink Communications, a broadband communications operator in Puerto Rico.
|
I-2
|
•
|
On December 15, 2011, we acquired all of the outstanding shares of Kabel BW Musketeer GmbH, Germany’s third largest cable television operator based on number of subscribers, and integrated it into our Unitymedia GmbH (
Unitymedia
) operations.
|
|
•
|
On September 16, 2011, we acquired Aster Sp. Z.o.o., a broadband communications provider in Poland.
|
|
•
|
On January 28, 2010, we acquired
Unitymedia
, the second largest cable television provider in Germany based on the number of subscribers.
|
For additional information on our more recent acquisitions, including related financings, see notes 4 and 10 to our consolidated financial statements included in Part II of this Annual Report on Form 10-K. In addition, we have completed various other smaller acquisitions in the normal course of business.
Pending Acquisitions
Recently, we announced two additional acquisitions related to our operations in Europe:
|
•
|
In December 2016,
Telenet
reached an agreement to acquire from Coditel Brabant sprl, operating under the brand SFR and a subsidiary of Altice S.A., its broadband operations in Belgium and Luxembourg. Subject to customary closing conditions, including regulatory approvals, closing is expected during the second half of 2017.
|
|
•
|
In October 2016, through a subsidiary of UPC Holding B.V. (
UPC Holding
), we entered into an agreement to acquire the cable business of Multimedia Polska S.A., a broadband communications provider in Poland. Subject to customary closing conditions, including regulatory approvals, closing is expected in late 2017 or early 2018.
|
For additional information on the above proposed acquisitions, see note
4
to our consolidated financial statements included in Part II of this Annual Report on Form 10-K.
Dispositions
In addition to the contribution of
Ziggo Group Holding
and its subsidiaries to
VodafoneZiggo
, we completed the following dispositions:
|
•
|
On January 31, 2014, we sold substantially all of our programming interest held through Chellomedia B.V.
|
|
•
|
On July 11, 2011, we sold Austar United Communications Limited, a leading direct-to-home satellite (
DTH
) provider to regional and rural Australia and the capital cities of Hobart and Darwin.
|
|
•
|
On February 18, 2010, we sold our ownership interest in Jupiter Telecommunications Co. Ltd., dba J:COM, a leading broadband provider and the largest multiple-system operator in Japan based on homes passed and subscribers.
|
For additional information on the Chellomedia B.V. disposition, see note 5 to our consolidated financial statements included in Part II of this Annual Report on Form 10-K. We have also completed various other smaller dispositions in the normal course of business and as required by regulatory authorities in connection with approving the
BASE
and
Ziggo
acquisitions.
Tracking Shares
On July 1, 2015, we completed the approved steps of the “
LiLAC Transaction
” whereby we (1) reclassified our then outstanding Class A, Class B and Class C
Liberty Global
ordinary shares (collectively, the
Old Liberty Global Shares
) into corresponding classes of new
Liberty Global
ordinary shares (collectively, the
Liberty Global Shares
) and (2) capitalized a portion of our share premium account and distributed as a dividend (or a “bonus issue” under
U.K.
law) our LiLAC Class A, Class B and Class C ordinary shares (collectively, the
LiLAC Shares
). Pursuant to the
LiLAC Transaction
, each holder of Class A, Class B and Class C
Old Liberty Global Shares
remained a holder of the same amount and class of
Liberty Global Shares
and received one share of the corresponding class of
LiLAC Shares
for each 20
Old Liberty Global Shares
held as of the record date for such distribution and cash was issued in lieu of fractional
LiLAC Shares
.
The
Liberty Global Shares
and the
LiLAC Shares
are tracking shares. Tracking shares are intended by the issuing company to reflect or “track” the economic performance of a particular business or “group,” rather than the economic performance of the company as a whole. The
Liberty Global Shares
and the
LiLAC Shares
are intended to track the economic performance of the
Liberty Global Group
and the
LiLAC Group
, respectively (each as defined and described below). While
I-3
the
Liberty Global Group
and the
LiLAC Group
have separate collections of businesses, assets and liabilities attributed to them, neither group is a separate legal entity and therefore cannot own assets, issue securities or enter into legally binding agreements. Holders of tracking shares have no direct claim to the group’s assets and are not represented by separate boards of directors. Instead, holders of tracking shares are shareholders of the parent corporation, with a single board of directors, and are subject to all of the risks and liabilities of the parent corporation. We and our subsidiaries each continue to be responsible for our respective liabilities. Holders of
Liberty Global Shares
,
LiLAC Shares
and any other of our capital shares designated as ordinary shares from time to time will continue to be subject to risks associated with an investment in our company as a whole, even if a holder does not own both
Liberty Global Shares
and
LiLAC Shares
.
The
LiLAC Group
comprises our businesses, assets and liabilities in Latin America and the Caribbean and has attributed to it (1) LGE Coral Holdco Limited and its subsidiaries, which include
CWC
, (2) VTR Finance B.V. (
VTR Finance)
and its subsidiaries, which include VTR.com SpA (
VTR
), (3) Lila Chile Holding B.V., which is the parent entity of VTR Finance, (4) LiLAC Communications Inc., formerly known as LiLAC Holdings Inc. (
LiLAC Communications
), and its subsidiaries, which include
Liberty Puerto Rico
, and (5) prior to July 1, 2015, the costs associated with certain corporate employees of Liberty Global that are exclusively focused on the management of the
LiLAC Group
. Effective July 1, 2015, these corporate employees were transferred to
LiLAC Communications
. The Liberty Global Group comprises our businesses, assets and liabilities not attributed to the
LiLAC Group
, including
Virgin Media
,
Unitymedia
,
Telenet
and
UPC Holding
, including our
DTH
satellite operations based in Luxembourg, our corporate entities (excluding LiLAC Communications), our 50% interest in
VodafoneZiggo
and certain other less significant entities.
Equity Transactions
From time to time our board of directors authorize various shares repurchase programs. Under these programs, we receive authorization to acquire up to the specified amount of our ordinary shares or other authorized securities from time to time through open market or privately negotiated transactions, which may include derivative transactions. The timing of the repurchase of shares or other securities pursuant to our equity repurchase programs, which may be suspended or discontinued at any time, is dependent on a variety of factors, including market conditions. Pursuant to our share repurchase programs, during
2016
, we repurchased:
|
Title of Shares
|
Number of Shares
|
Weighted Average Price
|
Aggregate Purchase Price*
|
||||||||
|
in millions
|
|||||||||||
|
Liberty Global Class A
|
32,387,722
|
|
$
|
32.26
|
|
$
|
1,044.8
|
|
|||
|
Liberty Global Class C
|
31,557,089
|
|
$
|
32.43
|
|
$
|
1,023.2
|
|
|||
|
LiLAC Class A
|
720,800
|
|
$
|
20.65
|
|
$
|
14.8
|
|
|||
|
LiLAC Class C
|
313,647
|
|
$
|
21.19
|
|
$
|
6.7
|
|
|||
_______________
* Includes direct acquisition costs and the effects of derivative instruments.
At
December 31, 2016
, the remaining amount authorized for repurchases of
Liberty Global Shares
and
LiLAC Shares
was
$1,943.4 million
and
$278.6 million
, respectively. Subsequent to
December 31, 2016
, our board of directors increased the amount authorized under the share repurchase program for our
Liberty Global Shares
by
$1.0 billion
. For a further description of our share repurchases, see note
12
to our consolidated financial statements included in Part II of this Annual Report on Form 10-K.
Financial Information About Operating Segments
Financial information about our reportable segments is provided in note
18
to our consolidated financial statements included in Part II of this Annual Report on Form 10-K.
I-4
Forward Looking Statements
Certain statements in this Annual Report constitute forward-looking statements within the meaning of the Private Securities Litigation Reform Act of 1995. To the extent that statements in this Annual Report are not recitations of historical fact, such statements constitute forward-looking statements, which, by definition, involve risks and uncertainties that could cause actual results to differ materially from those expressed or implied by such statements. In particular, statements under Item 1.
Business
, Item 1A.
Risk Factors
, Item 2.
Properties
, Item 7.
Management’s Discussion and Analysis of Financial Condition and Results of Operations
and Item 7A.
Quantitative and Qualitative Disclosures About Market Risk
may contain forward-looking statements, including statements regarding our business, product, foreign currency and finance strategies in
2017
, our property and equipment additions in
2017
(including with respect to Network Extensions), subscriber growth and retention rates, competitive, regulatory and economic factors, the timing and impacts of proposed transactions, the maturity of our markets, the anticipated impacts of new legislation (or changes to existing rules and regulations), anticipated changes in our revenue, costs or growth rates, our liquidity, credit risks, foreign currency risks, target leverage levels, our future projected contractual commitments and cash flows and other information and statements that are not historical fact. Where, in any forward-looking statement, we express an expectation or belief as to future results or events, such expectation or belief is expressed in good faith and believed to have a reasonable basis, but there can be no assurance that the expectation or belief will result or be achieved or accomplished. In evaluating these statements, you should consider the risks and uncertainties discussed under Item 1A.
Risk Factors
and Item 7A.
Quantitative and Qualitative Disclosures About Market Risk
, as well as the following list of some but not all of the factors that could cause actual results or events to differ materially from anticipated results or events:
|
•
|
economic and business conditions and industry trends in the countries in which we operate;
|
|
•
|
the competitive environment in the industries in the countries in which we operate, including competitor responses to our products and services;
|
|
•
|
fluctuations in currency exchange rates and interest rates;
|
|
•
|
instability in global financial markets, including sovereign debt issues and related fiscal reforms;
|
|
•
|
consumer disposable income and spending levels, including the availability and amount of individual consumer debt;
|
|
•
|
changes in consumer television viewing preferences and habits;
|
|
•
|
consumer acceptance of our existing service offerings, including our cable television, broadband internet, fixed-line telephony, mobile and business service offerings, and of new technology, programming alternatives and other products and services that we may offer in the future;
|
|
•
|
our ability to manage rapid technological changes;
|
|
•
|
our ability to maintain or increase the number of subscriptions to our cable television, broadband internet, fixed-line telephony and mobile service offerings and our average revenue per household;
|
|
•
|
our ability to provide satisfactory customer service, including support for new and evolving products and services;
|
|
•
|
our ability to maintain or increase rates to our subscribers or to pass through increased costs to our subscribers;
|
|
•
|
the impact of our future financial performance, or market conditions generally, on the availability, terms and deployment of capital;
|
|
•
|
changes in, or failure or inability to comply with, government regulations in the countries in which we operate and adverse outcomes from regulatory proceedings;
|
|
•
|
government intervention that requires opening our broadband distribution networks to competitors, such as the obligations imposed in Belgium;
|
|
•
|
our ability to obtain regulatory approval and satisfy other conditions necessary to close acquisitions and dispositions and the impact of conditions imposed by competition and other regulatory authorities in connection with acquisitions;
|
|
•
|
our ability to successfully acquire new businesses and, if acquired, to integrate, realize anticipated efficiencies from, and implement our business plan with respect to, the businesses we have acquired, such as
Choice
, BASE and
CWC
, or that we expect to acquire;
|
I-5
|
•
|
changes in laws or treaties relating to taxation, or the interpretation thereof, in the
U.K.
, the
U.S.
or in other countries in which we operate;
|
|
•
|
changes in laws and government regulations that may impact the availability and cost of capital and the derivative instruments that hedge certain of our financial risks;
|
|
•
|
the ability of suppliers and vendors (including our third-party wireless network providers under our mobile virtual network operator (
MVNO
) arrangements) to timely deliver quality products, equipment, software, services and access;
|
|
•
|
the availability of attractive programming for our video services and the costs associated with such programming, including retransmission and copyright fees payable to public and private broadcasters;
|
|
•
|
uncertainties inherent in the development and integration of new business lines and business strategies;
|
|
•
|
our ability to adequately forecast and plan future network requirements, including the costs and benefits associated with the planned
Network Extensions
;
|
|
•
|
the availability of capital for the acquisition and/or development of telecommunications networks and services;
|
|
•
|
problems we may discover post-closing with the operations, including the internal controls and financial reporting process, of businesses we acquire;
|
|
•
|
the leakage of sensitive customer data;
|
|
•
|
the outcome of any pending or threatened litigation;
|
|
•
|
the loss of key employees and the availability of qualified personnel;
|
|
•
|
changes in the nature of key strategic relationships with partners and joint venturers;
|
|
•
|
our equity capital structure; and
|
|
•
|
events that are outside of our control, such as political unrest in international markets, terrorist attacks, malicious human acts, natural disasters, pandemics and other similar events.
|
The broadband distribution and mobile service industries are changing rapidly and, therefore, the forward-looking statements of expectations, plans and intent in this Annual Report are subject to a significant degree of risk. These forward-looking statements and the above-described risks, uncertainties and other factors speak only as of the date of this Annual Report, and we expressly disclaim any obligation or undertaking to disseminate any updates or revisions to any forward-looking statement contained herein, to reflect any change in our expectations with regard thereto, or any other change in events, conditions or circumstances on which any such statement is based. Readers are cautioned not to place undue reliance on any forward-looking statement.
I-6
Narrative Description of Business
We are a leading international telecommunications company with a commitment to providing our customers the “best in class” communications and entertainment services. These services are delivered to our residential and business customers over our networks and include video, broadband internet, telephony and mobile services. We also deliver mobile services through third-party networks as MVNOs. We design these services to enable our customers to access the digital world on their own terms and at their own pace. In most of our footprint, the core of our offer is “
triple-play
”, which we use to describe bundled services of digital video, internet and telephony in one subscription. We are enhancing this offer by expanding our services to include mobile services for a “
quad-play
” or fixed-mobile convergence service in most of our markets. Available service offerings depend on the bandwidth capacity of a particular system and whether it has been upgraded for two-way communications. In certain markets, we also offer video services through
DTH
and fiber-to-the-home and digital subscriber line (
DSL
) networks. In addition, in the Caribbean and certain markets in Latin America, we provide wholesale services over our sub-sea and terrestrial fiber optic cable networks.
Our operations are attributed to either our Liberty Global Group or our
LiLAC Group
. The Liberty Global Group includes our operations in the
U.K.
, Ireland, Germany, Belgium, Switzerland, Austria and Central and Eastern Europe. In terms of video subscribers, we operate the largest cable network in each of Austria, Belgium, the Czech Republic, Hungary, Ireland, Poland, Slovakia, Switzerland and the
U.K.
and the second largest
cable network in each of Germany and Romania. The Liberty Global Group also includes our investment in
VodafoneZiggo
, which operates the largest cable network in the Netherlands, and in various content businesses.
The
LiLAC Group
includes our operations in Chile and Puerto Rico and our
CWC
operations primarily in the Caribbean and Latin America, including sub-sea and terrestrial fiber optic cable networks connecting over 30 markets throughout the region. In terms of video subscribers, we operate the largest fixed network capable of delivering video services in each of Chile, Puerto Rico, Jamaica, Barbados, Trinidad and Tobago and five other Caribbean markets. In terms of fixed-line telephony subscribers, we operate the largest telephony network in each of Panama, Jamaica, Barbados, Bahamas and in almost all of our other Caribbean countries where we provide retail services.
In connecting our customers through our telecommunication services, we recognize that we are a global corporate citizen
—
that we play a role in addressing the environmental impacts generated through our business. By seeking to address these issues, we strengthen our company and positively influence the communities in which we operate. This includes enhancing the energy efficiency of all our operations, with a focus on energy use, carbon emissions and management of electronic waste. We also recognize that coding skills are essential to our industry and other technology-based jobs of the future. As a result, we have partnered with the CoderDojo Foundation, a global community of free coding clubs for children age 7-17. Our support for CoderDojo is enabling the next generation of creators, improving their long-term career prospects. Corporate responsibility is a key part of our business strategy.
I-7
Liberty Global Group Statistics
The following tables present certain operating data as of
December 31, 2016
, with respect to the networks of our consolidated subsidiaries attributed to the Liberty Global Group. The following tables reflect 100% of the data applicable to each of our subsidiaries regardless of our ownership percentage. Percentages are rounded to the nearest whole number.
Consolidated Operating Data -
December 31, 2016
|
|
Homes
Passed
(1)
|
Two-way
Homes
Passed
(2)
|
Customer
Relationships
(3)
|
Total
RGUs
(4)
|
Video
|
||||||||||||||||||||||||||||
|
Basic Video Subscribers
(5)
|
Enhanced Video
Subscribers
(6)
|
DTH
Subscribers
(7)
|
Total
Video
|
Internet Subscribers
(8)
|
Telephony Subscribers
(9)
|
Mobile Subscribers (10)
|
|||||||||||||||||||||||||||
|
Liberty Global Group:
|
|||||||||||||||||||||||||||||||||
|
United Kingdom
|
13,610,200
|
|
13,597,400
|
|
5,284,000
|
|
13,035,900
|
|
—
|
|
3,729,100
|
|
—
|
|
3,729,100
|
|
4,916,700
|
|
4,390,100
|
|
3,022,300
|
|
|||||||||||
|
Germany
|
12,894,500
|
|
12,767,100
|
|
7,162,200
|
|
12,839,000
|
|
4,822,900
|
|
1,582,800
|
|
—
|
|
6,405,700
|
|
3,325,600
|
|
3,107,700
|
|
353,100
|
|
|||||||||||
|
Belgium
|
2,987,600
|
|
2,987,600
|
|
2,149,300
|
|
4,874,600
|
|
284,600
|
|
1,732,900
|
|
—
|
|
2,017,500
|
|
1,601,700
|
|
1,255,400
|
|
2,991,900
|
|
|||||||||||
|
Switzerland (11)
|
2,236,800
|
|
2,236,800
|
|
1,294,700
|
|
2,513,400
|
|
576,500
|
|
675,200
|
|
—
|
|
1,251,700
|
|
749,800
|
|
511,900
|
|
80,300
|
|
|||||||||||
|
Austria
|
1,391,400
|
|
1,391,400
|
|
654,000
|
|
1,411,300
|
|
115,700
|
|
367,300
|
|
—
|
|
483,000
|
|
502,800
|
|
425,500
|
|
30,500
|
|
|||||||||||
|
Ireland
|
852,300
|
|
807,500
|
|
454,700
|
|
1,020,700
|
|
29,700
|
|
275,100
|
|
—
|
|
304,800
|
|
363,500
|
|
352,400
|
|
17,900
|
|
|||||||||||
|
Total Western Europe
|
33,972,800
|
|
33,787,800
|
|
16,998,900
|
|
35,694,900
|
|
5,829,400
|
|
8,362,400
|
|
—
|
|
14,191,800
|
|
11,460,100
|
|
10,043,000
|
|
6,496,000
|
|
|||||||||||
|
Poland
|
3,157,600
|
|
3,094,900
|
|
1,439,200
|
|
2,954,100
|
|
209,600
|
|
1,004,900
|
|
—
|
|
1,214,500
|
|
1,105,100
|
|
634,500
|
|
5,300
|
|
|||||||||||
|
Hungary
|
1,731,400
|
|
1,713,900
|
|
1,112,700
|
|
2,167,300
|
|
131,200
|
|
532,200
|
|
292,000
|
|
955,400
|
|
632,100
|
|
579,800
|
|
62,500
|
|
|||||||||||
|
Romania
|
2,887,700
|
|
2,838,400
|
|
1,296,000
|
|
2,273,600
|
|
263,400
|
|
640,400
|
|
363,500
|
|
1,267,300
|
|
535,400
|
|
470,900
|
|
—
|
|
|||||||||||
|
Czech Republic
|
1,480,000
|
|
1,446,700
|
|
714,000
|
|
1,233,000
|
|
143,400
|
|
354,800
|
|
111,500
|
|
609,700
|
|
473,900
|
|
149,400
|
|
—
|
|
|||||||||||
|
Slovakia
|
587,800
|
|
564,800
|
|
274,500
|
|
458,400
|
|
28,500
|
|
143,800
|
|
72,800
|
|
245,100
|
|
128,000
|
|
85,300
|
|
—
|
|
|||||||||||
|
Total Central and Eastern Europe
|
9,844,500
|
|
9,658,700
|
|
4,836,400
|
|
9,086,400
|
|
776,100
|
|
2,676,100
|
|
839,800
|
|
4,292,000
|
|
2,874,500
|
|
1,919,900
|
|
67,800
|
|
|||||||||||
|
Total Liberty Global Group
|
43,817,300
|
|
43,446,500
|
|
21,835,300
|
|
44,781,300
|
|
6,605,500
|
|
11,038,500
|
|
839,800
|
|
18,483,800
|
|
14,334,600
|
|
11,962,900
|
|
6,563,800
|
|
|||||||||||
I-8
__________________
|
(1)
|
Homes Passed are homes, residential multiple dwelling units or commercial units that can be connected to our networks without materially extending the distribution plant, except for
DTH
homes. Our Homes Passed counts are based on census data that can change based on either revisions to the data or from new census results. We do not count homes passed for
DTH
. Due to the fact that we do not own the partner networks (defined below) used in Switzerland (see note 11 below), we do not report homes passed for Switzerland’s partner networks.
|
|
(2)
|
Two-way Homes Passed are Homes Passed by those sections of our networks that are technologically capable of providing two-way services, including video, internet and telephony services.
|
|
(3)
|
Customer Relationships are the number of customers who receive at least one of our video, internet or telephony services that we count as Revenue Generating Units (
RGU
s
), without regard to which or to how many services they subscribe. To the extent that
RGU
counts include equivalent billing unit (
EBU
) adjustments, we reflect corresponding adjustments to our Customer Relationship counts. For further information regarding our
EBU
calculation, see
Additional General Notes to Tables
below. Customer Relationships generally are counted on a unique premises basis. Accordingly, if an individual receives our services in two premises (e.g., a primary home and a vacation home), that individual generally will count as two Customer Relationships. We exclude mobile-only customers from Customer Relationships.
|
|
(4)
|
RGU is separately a Basic Video Subscriber, Enhanced Video Subscriber,
DTH
Subscriber, Internet Subscriber or Telephony Subscriber (each as defined and described below). A home, residential multiple dwelling unit, or commercial unit may contain one or more
RGU
s. For example, if a residential customer in our Austrian market subscribed to our enhanced video service, fixed-line telephony service and broadband internet service, the customer would constitute three
RGU
s. Total
RGU
s is the sum of Basic Video, Enhanced Video,
DTH
, Internet and Telephony Subscribers.
RGU
s generally are counted on a unique premises basis such that a given premises does not count as more than one
RGU
for any given service. On the other hand, if an individual receives one of our services in two premises (e.g., a primary home and a vacation home), that individual will count as two
RGU
s for that service. Each bundled cable, internet or telephony service is counted as a separate
RGU
regardless of the nature of any bundling discount or promotion. Non-paying subscribers are counted as subscribers during their free promotional service period. Some of these subscribers may choose to disconnect after their free service period. Services offered without charge on a long-term basis (e.g., VIP subscribers, free service to employees) generally are not counted as
RGU
s. We do not include subscriptions to mobile services in our externally reported
RGU
counts. In this regard, our
December 31, 2016
RGU
counts exclude our separately reported postpaid and prepaid mobile subscribers.
|
|
(5)
|
Basic Video Subscriber is a home, residential multiple dwelling unit or commercial unit that receives our video service over our broadband network either via an analog video signal or via a digital video signal without subscribing to any recurring monthly service that requires the use of encryption-enabling technology. Encryption-enabling technology includes conditional access security cards or “
smart cards
”, or other integrated or virtual technologies that we use to provide our enhanced service offerings. With the exception of RGUs that we count on an EBU basis, we count RGUs on a unique premises basis. In other words, a subscriber with multiple outlets in one premises is counted as one RGU and a subscriber with two homes and a subscription to our video service at each home is counted as two RGUs. In Europe, we have approximately 164,900 “lifeline” customers that are counted on a per connection basis, representing the least expensive regulated tier of video cable service, with only a few channels.
|
|
(6)
|
Enhanced Video Subscriber is a home, residential multiple dwelling unit or commercial unit that receives our video service over our broadband network or through a partner network via a digital video signal while subscribing to any recurring monthly service that requires the use of encryption-enabling technology. Enhanced Video Subscribers that are not counted on an EBU basis are counted on a unique premises basis. For example, a subscriber with one or more set-top boxes that receives our video service in one premises is generally counted as just one subscriber. An Enhanced Video Subscriber is not counted as a Basic Video Subscriber. As we migrate customers from basic to enhanced video services, we report a decrease in our Basic Video Subscribers equal to the increase in our Enhanced Video Subscribers. Subscribers to enhanced video services provided by our operations in Switzerland over partner networks receive basic video services from the partner networks as opposed to our operations.
|
|
(7)
|
DTH
Subscriber is a home, residential multiple dwelling unit or commercial unit that receives our video programming broadcast directly via a geosynchronous satellite.
|
|
(8)
|
Internet Subscriber is a home, residential multiple dwelling unit or commercial unit that receives internet services over our networks, or that we service through a partner network. Our Internet Subscribers exclude 45,700 and 45,600
DSL
subscribers within Belgium and Austria, respectively, who are not serviced over our networks. Our Internet Subscribers do not include customers that receive services from dial-up connections. In Switzerland, we offer a 2 Mbps internet service to our Basic and Enhanced Video Subscribers without an incremental recurring fee. Our Internet Subscribers in Switzerland include 97,400 subscribers who have requested and received this service.
|
|
(9)
|
Telephony Subscriber is a home, residential multiple dwelling unit or commercial unit that receives voice services over our networks, or that we service through a partner network. Telephony Subscribers exclude mobile telephony subscribers. Our Telephony Subscribers exclude 34,900 subscribers within Austria that are not serviced over our networks. In Switzerland, we offer a basic phone service to our Basic and Enhanced Video Subscribers without an incremental recurring fee. Our Telephony Subscribers in Switzerland include 88,900 subscribers who have requested and received this service.
|
I-9
|
(10)
|
Mobile Subscriber is an active subscriber identification module (
SIM
) card in service rather than services provided. For example, if a Mobile Subscriber has both a data and voice plan on a smartphone this would equate to one Mobile Subscriber. Alternatively, a subscriber who has a voice and data plan for a mobile handset and a data plan for a laptop (via a dongle) would be counted as two Mobile Subscribers. Customers who do not pay a recurring monthly fee are excluded from our Mobile Subscriber counts after periods of inactivity ranging from 30 to 90 days, based on industry standards within the respective country.
|
|
(11)
|
Pursuant to service agreements, Switzerland offers enhanced video, broadband internet and telephony services over networks owned by third-party cable operators (
partner networks
). A partner network
RGU
is only recognized if there is a direct billing relationship with the customer. At
December 31, 2016
, Switzerland’s partner networks account for 138,600 Customer Relationships, 290,900
RGU
s, 106,300 Enhanced Video Subscribers, 108,500 Internet Subscribers and 76,100 Telephony Subscribers.
|
Additional General Notes to Table:
As a result of our decision to discontinue our Multi-channel Multipoint Distribution System (
MMDS
) service in Ireland, we have excluded subscribers to our MMDS service from our externally reported operating statistics effective January 1, 2016, which resulted in a reduction to Homes Passed, RGUs and Customer Relationships in Ireland and Slovakia of 22,000 and 500, respectively.
Most of our broadband communications subsidiaries provide telephony, broadband internet, data, video or other business services. Certain of our business service revenue is derived from small or home office (
SOHO
) subscribers that pay a premium price to receive enhanced service levels along with video, internet or fixed-line telephony services that are the same or similar to the mass marketed products offered to our residential subscribers. All mass marketed products provided to
SOHO
s, whether or not accompanied by enhanced service levels and/or premium prices, are included in the respective
RGU
and customer counts of our broadband communications operations, with only those services provided at premium prices considered to be “
SOHO
RGU
s” or “
SOHO
customers”. With the exception of our business
SOHO
subscribers, we generally do not count customers of business services as customers or
RGU
s for external reporting purposes.
Certain of our residential and commercial
RGU
s are counted on an
EBU
basis, including certain commercial and residential multiple dwelling units in Europe (with the exception of Germany and Belgium, where we do not count any
RGU
s on an
EBU
basis). Our
EBU
s are generally calculated by dividing the bulk price charged to accounts in an area by the most prevalent price charged to non-bulk residential customers in that market for the comparable tier of service. As such, we may experience variances in our
EBU
counts solely as a result of changes in rates. In Germany, homes passed reflect the footprint, and two-way homes passed reflect the technological capability of our network up to the street cabinet, with drops from the street cabinet to the building generally added, and in-home wiring generally upgraded, on an as needed or success-based basis. In Belgium,
Telenet
leases a portion of its network under a long-term capital lease arrangement. These tables include operating statistics for
Telenet
’s owned and leased networks.
While we take appropriate steps to ensure that subscriber statistics are presented on a consistent and accurate basis at any given balance sheet date, the variability from country to country in (1) the nature and pricing of products and services, (2) the distribution platform, (3) billing systems, (4) bad debt collection experience and (5) other factors add complexity to the subscriber counting process. We periodically review our subscriber counting policies and underlying systems to improve the accuracy and consistency of the data reported on a prospective basis. Accordingly, we may from time to time make appropriate adjustments to our subscriber statistics based on those reviews.
Subscriber information for acquired entities is preliminary and subject to adjustment until we have completed our review of such information and determined that it is presented in accordance with our policies.
I-10
Network & Product Penetration Data (%) -
December 31, 2016
|
U.K.
|
Germany
|
Belgium
|
Switzerland
|
Austria
|
Ireland
|
Poland
|
Hungary
|
Romania
|
Czech Republic
|
Slovakia
|
|||||||||||
|
Liberty Global Group Network Data:
|
|
||||||||||||||||||||
|
Two-way homes passed percentage (1)
|
100
|
99
|
100
|
100
|
100
|
95
|
98
|
99
|
98
|
98
|
96
|
||||||||||
|
Digital video availability percentage (2)
|
100
|
100
(9)
|
99
|
100
(9)
|
95
|
98
|
99
|
98
|
98
|
98
|
91
|
||||||||||
|
Broadband internet availability percentage (2)
|
100
|
99
(9)
|
99
|
100
(9)
|
100
|
95
|
98
|
99
|
98
|
98
|
88
|
||||||||||
|
Fixed-line telephony availability percentage (2)
|
100
|
99
(9)
|
99
|
100
(9)
|
100
|
94
|
98
|
99
|
98
|
98
|
88
|
||||||||||
|
Bandwidth percentage (3):
|
|||||||||||||||||||||
|
at least 860 MHz
|
25
|
99
|
21
|
100
|
86
|
63
|
100
|
43
|
97
|
99
|
97
|
||||||||||
|
750 MHz to 859 MHz
|
71
|
—
|
—
|
—
|
—
|
35
|
--
(10)
|
51
|
--
(10)
|
--
(10)
|
—
|
||||||||||
|
less than 750 MHz
|
4
|
1
|
79
|
—
|
14
|
2
|
--
(10)
|
6
|
3
|
1
|
3
|
||||||||||
|
|
|||||||||||||||||||||
|
Liberty Global Group Product Penetration:
|
|
|
|
|
|
|
|||||||||||||||
|
Cable television penetration (4)
|
27
|
50
|
68
|
56
|
35
|
36
|
38
|
38
|
31
|
34
|
29
|
||||||||||
|
Enhanced Video penetration (5)
|
100
|
25
|
86
|
54
|
76
|
90
|
83
|
80
|
71
|
71
|
83
|
||||||||||
|
Broadband internet penetration (6)
|
36
|
26
|
54
|
34
|
36
|
45
|
36
|
37
|
19
|
33
|
23
|
||||||||||
|
Fixed telephony penetration (6)
|
32
|
24
|
42
|
23
|
31
|
44
|
21
|
34
|
17
|
10
|
15
|
||||||||||
|
Double-play penetration (7)
|
20
|
12
|
21
|
18
|
21
|
34
|
27
|
11
|
11
|
45
|
14
|
||||||||||
|
Triple-play penetration (7)
|
64
|
34
|
53
|
38
|
48
|
45
|
39
|
42
|
32
|
14
|
27
|
||||||||||
|
Fixed-Mobile Convergence penetration (8)
|
20
|
6
|
38
|
8
|
3
|
3
|
--
(11)
|
--
(11)
|
—
|
—
|
—
|
||||||||||
I-11
__________________
|
(1)
|
Percentage of total homes passed that are two-way homes passed.
|
|
(2)
|
Percentage of total homes passed to which digital video, broadband internet or fixed-line telephony services, as applicable, are made available.
|
|
(3)
|
Percentage of total homes passed served by a network with the indicated bandwidth.
|
|
(4)
|
Percentage of total homes passed that subscribe to cable television services (Basic Video or Enhanced Video).
|
|
(5)
|
Percentage of cable television subscribers (Basic Video and Enhanced Video Subscribers) that are Enhanced Video Subscribers.
|
|
(6)
|
Percentage of two-way homes passed that subscribe to broadband internet or fixed-line telephony services, as applicable.
|
|
(7)
|
Percentage of total customers that subscribe to two services (
double-play
customers) or three services (triple-play customers) offered by our operations (video, broadband internet and fixed-line telephony).
|
|
(8)
|
Fixed-Mobile Convergence penetration represents the number of customers who subscribe to both our internet service and our postpaid mobile service, divided by the number of customers who subscribe to our internet service.
|
|
(9)
|
Assuming the contractual right to serve the building exists in the case of multiple dwelling units.
|
|
(10)
|
Less than 1%.
|
|
(11)
|
Fixed-Mobile Convergence penetration in these Central and Eastern Europe countries is 2% in the aggregate.
|
I-12
Video, Broadband Internet, Fixed-Line Telephony and Mobile Services -
December 31, 2016
|
U.K.
|
Germany
|
Belgium
|
Switzerland
|
Austria
|
Ireland
|
Poland
|
Hungary
|
Czech Republic
|
Romania
|
Slovakia
|
||||||||||||
|
Liberty Global Group:
|
||||||||||||||||||||||
|
Video services (excluding DTH):
|
||||||||||||||||||||||
|
Next Generation Video Platform
|
TiVo
|
Horizon
|
Digital TV
(5)
|
Horizon
|
Horizon
|
Horizon
|
Horizon
|
Horizon Lite
(5)
|
Horizon/Horizon Lite
(5)
|
Horizon Lite
(5)
|
Horizon Lite
(5)
|
|||||||||||
|
Number of Next Generation Video percentage
(1)
|
85
|
9
|
86
|
28
|
4
|
51
|
22
|
9
|
47
|
2
|
44
|
|||||||||||
|
Number of out-of-home channels available (second screen)
|
119
|
116
|
91
|
123
|
50
|
67
|
94
|
107
|
127
|
95
|
84
|
|||||||||||
|
Availability of Replay TV
|
—
|
—
|
X
|
X
|
—
|
X
|
—
|
X
|
X
|
X
|
X
|
|||||||||||
|
Number of channels in basic digital tier
|
78
|
92
|
85
|
90
|
110
|
72
|
105
|
107
|
105
|
117
|
110
|
|||||||||||
|
Broadband internet service:
|
||||||||||||||||||||||
|
Maximum download speed offered (Mbps)
|
200
(3)
|
400
|
200
(3)
|
500
|
250
|
360
(3)
|
250
(3)(6)
|
500
|
400
|
500
|
500
|
|||||||||||
|
Fixed-line telephony and mobile services:
|
||||||||||||||||||||||
|
VoIP Fixed-line
|
(4)
|
X
|
X
|
X
|
X
|
X
|
X
|
X
|
X
|
X
|
X
|
|||||||||||
|
Number of Mobile SIM cards (in 000’s)
(2)
|
3,022
|
353
|
2,992
|
80
|
31
|
18
|
5
(7)
|
63
|
—
|
—
|
—
|
|||||||||||
|
Prepaid
|
638
|
—
|
881
|
—
|
—
|
—
|
—
|
—
|
—
|
—
|
—
|
|||||||||||
|
Postpaid
|
2,384
|
353
|
2,111
|
80
|
31
|
18
|
5
|
63
|
—
|
—
|
—
|
|||||||||||
I-13
__________________
|
(1)
|
Percentage of total cable television subscribers that have next generation video.
|
|
(2)
|
Represents the number of active
SIM
cards in service. See note 10 to
Consolidated Operating Data
table above for how these are counted.
|
|
(3)
|
For business customers, speeds of up to: 300 Mbps in the
U.K.
, 240 Mbps in Belgium, 400 Mbps in Ireland and 600 Mbps in Poland, are available.
|
|
(4)
|
VoIP
services are available only to business customers.
|
|
(5)
|
Refers to an upgraded set-top box system that provides several features of Horizon TV (defined below) in the home.
|
|
(6)
|
Speeds of up to 600 Mbps available in limited areas.
|
|
(7)
|
Limited to legacy subscribers.
|
I-14
Liberty Global Group Products and Services
Video Services
Our video service is, and continues to be, one of the key foundations of our product offerings in our European markets. Our cable operations offer multiple tiers of digital video programming and audio services starting with a basic video service. Subscribers to our basic video service pay a fixed monthly fee and generally receive at least 60
digital or analog video channels (including a limited number of high definition (
HD
) channels) and several digital and analog radio channels. This service also includes video-on-demand (
VoD
) access and an electronic programming guide. In our markets where our basic digital service is unencrypted (Germany, Austria, Poland, Hungary, the Czech Republic and Romania), the cost of our digital service is the same cost as the monthly fee of our analog service. In the markets where we encrypt our basic digital service, our digital service is generally offered at an incremental cost equal to or slightly higher than the monthly fee for our basic analog service. We tailor our video services in each country of operation based on programming preferences, culture, demographics and local regulatory requirements. Our channel offerings include general entertainment, sports, movies, documentaries, lifestyles, news, adult, children and ethnic and foreign channels.
We also offer a variety of premium channel packages to meet the special interests of our subscribers. For an additional monthly charge, a subscriber may upgrade to one of our extended digital tier services and receive an increased number of video and radio channels, including the channels in the basic tier service and additional
HD
channels. Digital subscribers may also subscribe to one or more packages of premium channels for an additional monthly charge.
Subscribers to our digital services also receive the channels available through our analog service. We offer limited analog services in all of our broadband markets, except in the
U.K.
and Switzerland. In all of our broadband operations, we continue to upgrade our systems to expand our digital services and encourage our analog subscribers to convert to a digital or premium digital service.
Discounts to our monthly service fees are available to any subscriber who selects a bundle of two or more of our services (
bundled services
): video, internet, fixed-line telephony and, in certain markets, mobile services. Bundled services consist of double-play for two services, triple-play for three services and, where available, quad-play for four services.
To meet customer demands, we have enhanced our video services with various products that enable our customers to control when, where and how they watch their programming. These products range from digital video recorders (
DVRs
) to multimedia home gateway systems such as "
Horizon TV
", as well as various mobile applications (
apps
).
Horizon TV
is a next generation multimedia home gateway (decoder box) based on a digital television platform that is capable of distributing video, voice and data content throughout the home and to multiple devices. It has a sophisticated user interface that enables customers to view and share, across multiple devices, linear channels,
VoD
programming and personal media content and to pause, replay and record programming. The
Horizon TV
gateway can act as an internet router that allows access to digital video content available on the television via other devices, such as laptops, smart phones and tablets.
For our
Horizon TV
subscribers, we offer various features and functionalities, including over 330 television apps for various online services (such as YouTube, Netflix, social platforms, sports experience, music, news and games). In almost all of our operations, we also offer an online mobile app for viewing on a second screen called “
Horizon Go
”.
Horizon Go
is available on mobile devices (iOS, Android and Windows) and via an internet portal and allows video customers to view linear channels and
VoD
, with a substantial part of this content available outside of the home. For
Horizon TV
customers, when in the home the second screen device can act as a remote control. Through
Horizon Go
, customers have the ability to remotely schedule the recording of a television program on their
Horizon TV
box at home.
We offer
Horizon TV
in Germany, Switzerland, Austria, Ireland, Poland and the Czech Republic. In several of our other European operations, we provide a
Horizon TV
-like experience through a remote upgrade of the software on the customer’s set-top box. After the upgrade, these boxes offer several features of the
Horizon TV
product. We refer to this upgrade as “
Horizon Lite
”, although it is locally marketed as
Horizon TV
, except in Belgium where it is marketed as “Digital TV”. Some of the
Horizon TV
features are not available on our Horizon Lite systems, such as recommendation-based content and the ability to access video content on other devices in the home. We intend to (1) expand the availability of
Horizon TV
to other markets within our footprint and (2) continue to improve the
Horizon TV
user experience with new functionality and software updates.
In the
U.K.
, we offer a multimedia home gateway based on the TiVo platform under a strategic partnership agreement with TiVo Inc. The TiVo set-top boxes provide television and broadband internet capabilities. In late 2016, we launched a new set-top box in the
U.K.
called the Virgin Media V6 box. This device combines ultra high-definition 4K video with improved streaming functionalities and more processing power. The Virgin Media V6 box allows customers to record six channels simultaneously while watching a seventh. Customers can also start watching programming on one television and pick up where they left off on
I-15
other TiVo boxes in another room or through an app on their smart phones and tablets. A similar box will be rolled out in other markets in our footprint, where it will carry the next generation
Horizon TV
user interface and will be marketed under the respective local brand. In addition to the video service on their TiVo gateway device, our customers in the
U.K.
also have access to a comprehensive internet streaming video service called “Virgin TV Anywhere”. This service, which is available via a mobile app or an internet portal, allows our video customers to stream real-time TV channels and watch
VoD
content anywhere they have a broadband connection.
In Belgium, the digital video product offered by Telenet is based on system marketed as Digital TV platform. It functions similar to our Horizon Lite service and is available to Telenet's enhanced video subscribers for no additional charge. Digital TV set-top boxes offer a Horizon-like user interface that allows Telenet's enhanced video customers to remotely manage their DVR, view programs remotely (up to seven days after the original broadcast) and access VoD with a laptop, smart phone or tablet in or out of the home. Telenet also offers customers access to live TV streaming and various other content sources such as
VoD
via the “
Yelo Play
” app, which is available via iOS, Android and Windows smart phones and tablets.
One of our key video services is “
Replay TV
”. Replay TV records virtually all programs across numerous linear channels in the countries where this service is available. The recordings are available up to seven days after the original broadcast. This allows our customers to catch up on their favorite television shows without having to set their DVR or browse separate menus on their set-top boxes. Instead, customers can open the electronic programing guide, scroll back and replay linear programming instantly. Replay TV also allows our customers to replay a television program from the start even while the live broadcast is in progress. Replay TV is accessible in Switzerland, Belgium, Ireland, the Czech Republic, Hungary, Romania and Slovakia through
Horizon TV
or Horizon Lite, and in some of our European markets also via
Horizon Go
. At the 2016 Content Innovation Awards, Liberty Global, together with its former subsidiary
Ziggo Group Holding
(now part of VodafoneZiggo), received the Pay TV Initiative for the Year Award for its Replay TV service.
In most of our markets, we offer pay-per-view programming through
VoD
giving subscribers access to thousands of movies and television series. In several of our European markets, our subscription
VoD
service “
MyPrime
” is available for an additional fee with our basic video services and is included in our enhanced video services accessed through the
Horizon TV
platform. MyPrime is tailored to the specific market based on available content, consumer preferences and competitive offers. In Germany, subscription
VoD
is available through a partnership with Maxdome GmbH, and in Belgium, the service is marketed under “Play” and “Play More”. We continue to develop our
VoD
services to provide a growing collection of programming from local and international suppliers, such as ABC/Disney, A+E Networks, NBC/Universal, CBS/Paramount, the BBC, Warner TV and Sony, among others.
Our
VoD
services, including catch-up TV, are available on a subscription basis or a transaction basis, depending on the tier of enhanced video service selected by the subscriber. Customers who subscribe to an extended digital tier generally receive a
VoD
enabled set-top box without an additional monthly charge. The subscription-based
VoD
service includes various programming, such as music, kids, documentaries, adult, sports and television series.
Subscribers access our enhanced video service by renting a set-top box with a smart card from our operators, or without a set-top box if a subscriber is only using our basic video service. Where Horizon TV is available, a subscriber to our enhanced video services has the option, for an incremental monthly charge, to upgrade the standard digital set-top box to a
Horizon TV
box (which has
HD DVR
capabilities and other additional features). No set-top box or smart card, however, is required to receive our basic digital services in our unencrypted footprints. In addition, expanded channel packages and premium channels and services are available for an incremental monthly fee in all of our markets.
WiFi and Internet Services
Connectivity is a building block for vibrant communities. As the largest international cable company, our fiber-rich broadband network is the backbone of our business and the basis of our connectivity strategy. To meet our customers’ expectations to be seamlessly connected, we are investing in the expansion of our broadband network, mobile and WiFi solutions and customer premises equipment.
Internet speed is of crucial importance to our customers, as they spend more time streaming video and other bandwidth-heavy services on multiple devices. Our extensive broadband network enables us to deliver ultra high-speed internet service across our markets. Our residential subscribers in Europe access the internet via cable modems connected to their internet capable devices, or wirelessly via a WiFi gateway device. We offer multiple tiers of broadband internet service ranging from a basic service of 10 Mbps in Germany to an ultra high-speed internet service of 500 Mbps in Switzerland, Hungary, Romania and Slovakia. The speed of service depends on the location and the tier of service selected. In addition, by leveraging our existing fiber-rich broadband networks and our Network Extension programs, we are well positioned to deliver gigabit services in our European markets. To
I-16
this end, by deploying the next generation DOCSIS 3.1 technology, we have the potential to extend our download speeds to at least 1 Gbps when fully deployed. DOCSIS technology is an international standard that defines the requirements for data transmission over a cable system. Currently, our ultra high-speed internet service is based primarily on DOCSIS 3.0 technology.
Our internet service generally includes email, address book and parental controls. We offer value-added broadband services in certain of our markets for an incremental charge. These services include security (e.g., anti-virus, anti-spyware, firewall and spam protection) and online storage solutions and web spaces. In many of our markets, we offer mobile broadband services with internet access as described below. Subscribers to our internet service pay a monthly fee based on the tier of service selected. In addition to the monthly fee, customers pay an activation service fee upon subscribing to an internet service. This one-time fee may be waived for promotional reasons. We determine pricing for each different tier of internet service through an analysis of speed, market conditions and other factors.
In late 2015, we introduced the "
Connect Box
", a dedicated connectivity device that delivers superior in-home WiFi coverage. The Connect Box is our next generation WiFi and telephony gateway that enables us to maximize the impact of our ultrafast broadband networks by providing reliable wireless connectivity anywhere in the home. It has an automatic WiFi optimization function, which selects the best possible wireless frequency at any given time. This gateway can be self-installed and allows customers to customize their home WiFi service. Our Connect Box is available in all our European markets. Robust wireless connectivity is increasingly important with our customers spending more and more time using bandwidth-heavy services on multiple devices.
In almost all of our European markets, we have deployed community WiFi via routers in the home (the
Community WiFi
), which provides a secure access to the internet for our customers. Community WiFi is enabled by a cable modem WiFi access point (
WiFi modem
) in the Connect Box, the set-top box or the
Horizon TV
box of our internet customers. The Community WiFi is created through the sharing of access to the public channel of our customers’ home wireless routers. Use of the Community WiFi does not affect the internet speeds of our customers. The public channel is a separate network from the secure private network used by the customer within the home and is automatically enabled when the WiFi modem is installed. Access is free for our internet customers. At
December 31, 2016
, we had 5.3 million WiFi access points in our Liberty Global Group footprint. In addition, our internet customers continue to have access to the Community WiFi in the Netherlands. We continue to expand our Community WiFi service throughout our European markets.
In the
U.K.
,
Virgin Media
’s customers have access to an extensive network of public WiFi access points, including in the London underground train stations. Public WiFi access points (covering train stations, hotels, bars, restaurants and other public places) are also available to Unitymedia customers in Germany and to Telenet customers in Belgium. In Switzerland, Belgium, Hungary, Poland, Ireland and Romania, we are expanding our Community WiFi through access points covering public places. Our Community WiFi is branded as “Wi-Free” in most of our markets. Through an agreement with Comcast Corporation, our internet customers will also have access to millions of WiFi access points in the U.S. and across various European countries for no additional cost.
Mobile Services
Mobile services are another key building block for us to provide customers with seamless connectivity. We offer mobile services as an
MVNO
over third-party networks in the
U.K.
, Germany, Belgium, Switzerland, Austria, Ireland and Hungary. Following the February 2016 acquisition of
BASE
, Telenet became a mobile network provider in Belgium and plans to migrate its current and future mobile subscribers to the
BASE
network prior to the termination of its
MVNO
agreement with a third-party provider at the end of 2018. We plan to add
MVNO
arrangements and, where appropriate, acquire or partner with mobile service providers with their own networks in all our broadband communication markets.
In Switzerland, Austria, Ireland, Hungary and, through 2018, Belgium, we provide our mobile telephony services as full
MVNO
s through partnerships with a third-party mobile network operator in their respective footprints of our country operations. All of these operations lease the third-party’s radio access network and own the core network, including switching, backbone and interconnections. These arrangements permit us to offer our customers in these markets mobile services without having to build and operate a cellular radio tower network. Beginning in 2017, our mobile operations in the
U.K.
will move from a light
MVNO
to a full
MVNO
arrangement due to a revised agreement with the third-party network provider. In Germany, we provide mobile telephony as a light
MVNO
. In this case, we lease the core network as well as the radio access network from a mobile network operator. This arrangement permits our German customers to have access to the third-party mobile communications services while we maintain the customer relationship.
Where mobile services are available subscribers pay varying monthly fees depending on whether the mobile service is combined with our fixed-line telephony service or includes mobile data services via mobile phones, tablets or laptops. We offer our customers
I-17
the option to purchase mobile handsets and, in the
U.K.
, Belgium, Switzerland, Austria, Ireland and Hungary, make such purchase pursuant to a contract independent of their mobile services contract. We refer to these arrangements as split contracts.
We typically charge a one-time activation fee to our customers for each
SIM
card. Our mobile services typically include voice, short message service (or
SMS
) and internet access. Calls, both within and out of network, incur a charge or are covered under a postpaid monthly service plan. Our mobile services are primarily on a postpaid basis with customers subscribing to services for periods ranging from activation for a
SIM
-only contract to up to 24 months, with the latter often taken with a subsidized mobile handset. In Belgium, Switzerland and Austria, however, our postpaid service is offered without a minimum contract term. In the
U.K.
and Belgium, we also offer a prepaid service, where the customers pay in advance for a pre-determined amount of airtime or data and generally have no minimum contract term. In almost all of our markets, subscribers to a double-or triple-play bundle receive a discount on their mobile service fee.
Telephony Services
Multi-feature telephony services are available through voice-over-internet-protocol (
VoIP
) technology in most of our broadband communication markets. In the U.K. and Hungary, we also provide traditional circuit-switched telephony services. We pay interconnect fees to other telephony and internet providers when calls by our subscribers terminate on another network and receive similar fees from providers when calls by their users terminate on our network through interconnection points.
Our telephony service may be selected in several of our markets on a standalone basis and in all of our markets in combination with one or more of our other services. Our telephony service includes a basic fixed-line telephony product for line rental and various calling plans, which may consist of any of the following: unlimited network, national or international calling, unlimited off-peak calling and minute packages, including calls to fixed and mobile phones. We also offer value added services, such as a personal call manager, unified messaging and a second or third phone line at an incremental cost.
Multiple Dwelling Units and Partner Networks
Almost two-thirds
of
Unitymedia
’s video customers are in multiple dwelling units where
Unitymedia
has the billing relationship with the landlord or housing association or with a third-party (
Professional Operator
) that operates and administers the in-building network on behalf of housing associations. Many of these agreements allow
Unitymedia
to offer its digital video, broadband internet and fixed-line telephony services directly to the end customer.
Professional Operator
s may procure the basic video signals from
Unitymedia
at volume-based discounts and will generally resell them to housing associations with whom the operator maintains the customer relationship.
Unitymedia
has entered into agreements with
Professional Operator
s, such as Tele Columbus Multimedia GmbH, that allow
Unitymedia
to market its digital video, broadband internet and fixed-line telephony services directly to the
Professional Operator
’s subscriber base.
Pursuant to an agreement executed on June 28, 2008 (the
PICs Agreement
) with four associations of municipalities in Belgium (the pure intercommunales or
PICs
),
Telenet
leases the
PICs
broadband communications network and, accordingly, makes its services available to all of the homes passed by the cable network owned by the
PICs
.
Telenet
has a direct customer relationship with the basic and enhanced video subscribers on the
PICs
network. Pursuant to the
PICs Agreement
,
Telenet
has full rights to use substantially all of the
PICs
network under a long-term capital lease. Unless extended, the
PICs Agreement
will expire on September 23, 2046, and cannot be terminated earlier (except in the case of non-payment or bankruptcy of Telenet). For additional information on the
PICs Agreement
, see note 17 to our consolidated financial statements included in Part II of this Annual Report on Form 10-K.
For approximately two-thirds of the basic video subscribers in
UPC Holding
’s Switzerland operations (
UPC Switzerland
), UPC Switzerland maintains billing relationships with landlords or housing associations and provides basic video service to the tenants. The landlord or housing association administers the billing for the basic video service with their tenants and manages service terminations for their rental units. When tenants select triple-play bundles with or without mobile service from UPC Switzerland, they then migrate to a direct billing relationship with us.
UPC Switzerland offers enhanced video, broadband internet and telephony services directly to the video cable subscribers of those partner networks that enter into service operating contracts with UPC Switzerland. UPC Switzerland has the direct customer billing relationship with these subscribers. By permitting UPC Switzerland to offer some or all of its enhanced video, broadband internet and telephony products directly to those partner network subscribers, UPC Switzerland’s service operating contracts have expanded the addressable markets for UPC Switzerland’s digital products. In exchange for the right to provide digital products directly to the partner network subscribers, UPC Switzerland pays to the partner network a share of the revenue generated from those subscribers. UPC Switzerland also provides network maintenance services and engineering and construction services to its partner networks.
I-18
Business Services
In addition to our residential services, we offer business services in all of our European operations. For business and public sector organizations, we provide a range of voice, advanced data, video, wireless and cloud-based services, as well as mobile and converged fixed-mobile services. Our business customers include
SOHO
(generally up to five employees), small business and medium and large enterprises. We also provide business services on a wholesale basis to other operators.
Our business services are designed to meet the specific demands of our business customers with a wide range of services, including increased data transmission speeds and virtual private networks. These services fall into five broad categories:
|
•
|
VoIP
and circuit-switch telephony, hosted private branch exchange solutions and conferencing options;
|
|
•
|
data services for internet access, virtual private networks and high capacity point-to-point services;
|
|
•
|
wireless services for mobile voice and data, as well as managed WiFi networks;
|
|
•
|
video programming packages and select channel lineups for targeted industries; and
|
|
•
|
value added services, including webhosting, managed security systems and storage and cloud enabled software.
|
Our intermediate to long-term strategy is to enhance our capabilities and offerings in the business sector so we become a preferred provider in the business market. To execute this strategy, customer experience and strategic marketing play a key role.
Our business services are provided to customers at contractually established prices based on the size of the business, type of services received and the volume and duration of the service agreement. SOHO and small business customers pay business market prices on a monthly subscription basis to receive enhanced service levels and business features that support their needs. For more advanced business services, these customers generally enter into a service agreement. For medium to large business customers, we enter into individual agreements that address their needs. These agreements are generally for a period of at least one year.
Investments—VodafoneZiggo
We own a 50% interest in
VodafoneZiggo
, which has a nationwide integrated broadband and mobile network in the Netherlands. In connection with the formation of
VodafoneZiggo
, we entered into a shareholders agreement with
Vodafone
providing for the governance of
VodafoneZiggo
, including decision-making process, information access, dividend policy and non-compete provisions. It also provides for restrictions on transfer of interests in
VodafoneZiggo
and exit arrangements. Under the dividend policy,
VodafoneZiggo
is required to distribute all unrestricted cash to
Vodafone
and us, subject to minimum cash requirements and financing arrangements. We also entered into a framework agreement with
VodafoneZiggo
to provide access to each partner’s expertise in the telecommunications business. For additional information on the above agreements, see note 6 to our consolidated financial statements included in Part II of this Annual Report on Form 10-K.
The fiber-rich broadband network of
VodafoneZiggo
passes 7.1 million homes.
VodafoneZiggo
also offers nationwide mobile coverage. At December 31, 2016,
VodafoneZiggo
had nearly 14.8 million subscribers of which 4.0 million were video, 3.2 million were high-speed broadband, 2.5 million were fixed-line telephony and 5.1 million were mobile. In addition to its residential services,
VodafoneZiggo
offers extensive business services throughout the Netherlands. The operations of
VodafoneZiggo
are subject to various regulations, which are described below under
Regulatory Matters--Europe--The Netherlands
.
VodafoneZiggo
customers continue to have access to
Ziggo Group Holding
’s Horizon TV and its functionalities (marketed as Ziggo TV), including Replay TV, 300 Mbps nationwide broadband internet and an extensive WiFi Community network. They also have access to
Vodafone
’s nationwide long-term evolution wireless service, also called “4G” (referred to herein as
LTE
) services, under either a prepaid or postpaid service plan. With its mobile services,
VodafoneZiggo
is able to offer its customers quad-play bundles and plans to market converged services in 2017 to residential and business customers.
Digital subscribers of
VodafoneZiggo
may subscribe to premium channels and
VoD
services, including catch-up television, on a subscription or transaction basis. Its premium channels include sports channels from Ziggo Sport Totaal. It also owns the Ziggo Sport channel, which is available exclusively to
VodafoneZiggo
customers. In addition to Horizon TV,
VodafoneZiggo
also offers its customers a cloud-based interactive television service using existing set-top boxes. By combining IP protocol with the standard set-top box, devices without built-in hardware functionality for interactivity can make use of interactive services through the
VodafoneZiggo
cable network.
VodafoneZiggo
offers multiple tiers of broadband internet service ranging from a basic service of 40 Mbps to an ultra high-speed internet service of either 150 Mbps or 300 Mbps. The speed of service depends on the tier of service selected. Its internet service generally includes email, address book and parental controls. It also offers value-added broadband services, which include security (e.g., anti-virus, anti-spyware, firewall and spam protection) and online storage solutions and web spaces.
VodafoneZiggo
I-19
also offers mobile broadband services. Its customers have access to the Community WiFi in the Netherlands and in our European footprint.
VodafoneZiggo
also offers multi-feature telephony services. This service includes a basic fixed-line telephony product for line rental and various calling plans, which may consist of any of the following: unlimited network, national or international calling, unlimited off-peak calling and minute packages, including calls to fixed and mobile phones. In addition, value added services, such as a personal call manager, unified messaging and a second or third phone line, are available.
For all its services,
VodafoneZiggo
competes primarily with the provision of similar services from the incumbent telecommunications operator Koninklijke KPN N.V. (
KPN
). KPN offers (1) internet protocol television (
IPTV
) over fiber optic lines where the fiber is to the home, cabinet, or building or to the node networks (fiber-to-the-home/-cabinet/-building/-node is referred to herein as
FTTx
) networks and through broadband internet connections using
DSL
or very high-speed
DSL
technology (
VDSL
) or an enhancement to
VDSL
called “vectoring”, (2) digital terrestrial television (
DTT
), and (3)
LTE
services. Where KPN has enhanced its
VDSL
system, it offers broadband internet with download speeds of 100 Mbps or 200 Mbps and on its
FTTx
networks, it offers download speeds of up to 500 Mbps. Its ability to offer a bundled triple-play of video, broadband internet and telephony services and fixed-mobile convergence services, creates significant competitive pressure on
VodafoneZiggo
’s operations, including the pricing and bundling of its video products. KPN’s video services include many of the interactive features
VodafoneZiggo
offers its subscribers and KPN is currently testing a new set-top box that is expected to enhance the video experience for its customers. In addition, KPN has its own over-the-top (
OTT
) video service. Portions of
VodafoneZiggo
’s network have been overbuilt by KPN’s and other providers’
FTTx
networks and expansion of these networks is expected to continue.
I-20
LiLAC Group Statistics
The following tables present certain operating data as of
December 31, 2016
, with respect to the networks of our consolidated subsidiaries attributed to the LiLAC Group. The following tables reflect 100% of the data applicable to each of our subsidiaries regardless of our ownership percentage. Percentages are rounded to the nearest whole number.
Consolidated Operating Data -
December 31, 2016
|
|
Homes
Passed
(1)
|
Two-way
Homes
Passed
(2)
|
Customer
Relationships
(3)
|
Total
RGUs
(4)
|
Video
|
||||||||||||||||||||||||||||
|
Basic Video Subscribers
(5)
|
Enhanced Video
Subscribers
(6)
|
DTH
Subscribers
(7)
|
Total
Video
|
Internet Subscribers
(8)
|
Telephony Subscribers
(9)
|
Mobile Subscribers (10)
|
|||||||||||||||||||||||||||
|
LiLAC Group:
|
|||||||||||||||||||||||||||||||||
|
Chile
|
3,216,600
|
|
2,710,500
|
|
1,328,900
|
|
2,795,500
|
|
79,500
|
|
967,800
|
|
—
|
|
1,047,300
|
|
1,091,200
|
|
657,000
|
|
166,200
|
|
|||||||||||
|
CWC:
|
|||||||||||||||||||||||||||||||||
|
Panama
|
527,800
|
|
416,300
|
|
336,000
|
|
453,400
|
|
—
|
|
42,800
|
|
39,700
|
|
82,500
|
|
95,700
|
|
275,200
|
|
1,736,300
|
|
|||||||||||
|
Jamaica
|
424,300
|
|
424,300
|
|
295,900
|
|
496,000
|
|
—
|
|
102,500
|
|
—
|
|
102,500
|
|
172,300
|
|
221,200
|
|
944,800
|
|
|||||||||||
|
Trinidad & Tobago
|
310,500
|
|
310,500
|
|
166,400
|
|
271,400
|
|
—
|
|
117,200
|
|
—
|
|
117,200
|
|
123,500
|
|
30,700
|
|
—
|
|
|||||||||||
|
Barbados
|
121,800
|
|
121,800
|
|
92,200
|
|
162,500
|
|
—
|
|
18,400
|
|
—
|
|
18,400
|
|
62,500
|
|
81,600
|
|
131,500
|
|
|||||||||||
|
Bahamas
|
155,000
|
|
155,000
|
|
55,200
|
|
83,100
|
|
—
|
|
1,600
|
|
—
|
|
1,600
|
|
26,400
|
|
55,100
|
|
315,200
|
|
|||||||||||
|
Other
|
354,300
|
|
334,500
|
|
211,800
|
|
317,400
|
|
10,100
|
|
73,400
|
|
—
|
|
83,500
|
|
122,300
|
|
111,600
|
|
399,000
|
|
|||||||||||
|
Total CWC
|
1,893,700
|
|
1,762,400
|
|
1,157,500
|
|
1,783,800
|
|
10,100
|
|
355,900
|
|
39,700
|
|
405,700
|
|
602,700
|
|
775,400
|
|
3,526,800
|
|
|||||||||||
|
Puerto Rico
|
1,092,300
|
|
1,092,300
|
|
403,700
|
|
799,100
|
|
—
|
|
261,300
|
|
—
|
|
261,300
|
|
329,000
|
|
208,800
|
|
—
|
|
|||||||||||
|
Total LiLAC Group
|
6,202,600
|
|
5,565,200
|
|
2,890,100
|
|
5,378,400
|
|
89,600
|
|
1,585,000
|
|
39,700
|
|
1,714,300
|
|
2,022,900
|
|
1,641,200
|
|
3,693,000
|
|
|||||||||||
I-21
__________________
|
(1)
|
Homes Passed are homes, residential multiple dwelling units or commercial units that can be connected to our networks without materially extending the distribution plant, except for
DTH
homes. Our Homes Passed counts are based on census data that can change based on either revisions to the data or from new census results. We do not count home passed for
DTH
.
|
|
(2)
|
Two-way Homes Passed are Homes Passed by those sections of our networks that are technologically capable of providing two-way services, including video, internet and telephony services.
|
|
(3)
|
Customer Relationships are the number of customers who receive at least one of our video, internet or telephony services that we count as
RGU
s, without regard to which or to how many services they subscribe. To the extent that
RGU
counts include
EBU
adjustments, we reflect corresponding adjustments to our Customer Relationship counts. For further information regarding our
EBU
calculation, see
Additional General Notes to Tables
below. Customer Relationships generally are counted on a unique premises basis. Accordingly, if an individual receives our services in two premises (e.g., a primary home and a vacation home), that individual generally will count as two Customer Relationships. We exclude mobile-only customers from Customer Relationships.
|
|
(4)
|
RGU is separately a Basic Video Subscriber, Enhanced Video Subscriber,
DTH
Subscriber, Internet Subscriber or Telephony Subscriber (each as defined and described below). A home, residential multiple dwelling unit, or commercial unit may contain one or more
RGU
s. For example, if a residential customer in our Chilean market subscribed to our enhanced video service, fixed-line telephony service and broadband internet service, the customer would constitute three
RGU
s. Total
RGU
s is the sum of Basic Video, Enhanced Video,
DTH
, Internet and Telephony Subscribers.
RGU
s generally are counted on a unique premises basis such that a given premises does not count as more than one
RGU
for any given service. On the other hand, if an individual receives one of our services in two premises (e.g., a primary home and a vacation home), that individual will count as two
RGU
s for that service. Each bundled cable, internet or telephony service is counted as a separate
RGU
regardless of the nature of any bundling discount or promotion. Non-paying subscribers are counted as subscribers during their free promotional service period. Some of these subscribers may choose to disconnect after their free service period. Services offered without charge on a long-term basis (e.g., VIP subscribers, free service to employees) generally are not counted as
RGU
s. We do not include subscriptions to mobile services in our externally reported
RGU
counts. In this regard, our
December 31, 2016
RGU
counts exclude our separately reported postpaid and prepaid mobile subscribers.
|
|
(5)
|
Basic Video Subscriber is a home, residential multiple dwelling unit or commercial unit that receives our video service over our broadband network either via an analog video signal or via a digital video signal without subscribing to any recurring monthly service that requires the use of encryption-enabling technology. Encryption-enabling technology includes smart cards, or other integrated or virtual technologies that we use to provide our enhanced service offerings. With the exception of RGUs that we count on an EBU basis, we count RGUs on a unique premises basis. In other words, a subscriber with multiple outlets in one premises is counted as one RGU and a subscriber with two homes and a subscription to our video service at each home is counted as two RGUs.
|
|
(6)
|
Enhanced Video Subscriber is a home, residential multiple dwelling unit or commercial unit that receives our video service over our broadband network via a digital video signal while subscribing to any recurring monthly service that requires the use of encryption-enabling technology. Enhanced Video Subscribers that are not counted on an EBU basis are counted on a unique premises basis. For example, a subscriber with one or more set-top boxes that receives our video service in one premises is generally counted as just one subscriber. An Enhanced Video Subscriber is not counted as a Basic Video Subscriber. As we migrate customers from basic to enhanced video services, we report a decrease in our Basic Video Subscribers equal to the increase in our Enhanced Video Subscribers.
|
|
(7)
|
DTH
Subscriber is a home, residential multiple dwelling unit or commercial unit that receives our video programming broadcast directly via a geosynchronous satellite.
|
|
(8)
|
Internet Subscriber is a home, residential multiple dwelling unit or commercial unit that receives internet services over our networks. Our Internet Subscribers do not include customers that receive services from dial-up connections.
|
|
(9)
|
Telephony Subscriber is a home, residential multiple dwelling unit or commercial unit that receives voice services over our networks. Telephony Subscribers exclude mobile telephony subscribers.
|
|
(10)
|
Mobile Subscriber is an active
SIM
card in service rather than services provided. For example, if a Mobile Subscriber has both a data and voice plan on a smartphone this would equate to one Mobile Subscriber. Alternatively, a subscriber who has a voice and data plan for a mobile handset and a data plan for a laptop (via a dongle) would be counted as two Mobile Subscribers. Customers who do not pay a recurring monthly fee are excluded from our Mobile Subscriber counts after periods of inactivity ranging from 30 to 90 days, based on industry standards within the respective country.
|
Additional General Notes to Table:
Most of our broadband communications subsidiaries provide telephony, broadband internet, data, video or other business services. Certain of our business service revenue is derived from
SOHO
subscribers that pay a premium price to receive enhanced service levels along with video, internet or telephony services that are the same or similar to the mass marketed products offered to our residential subscribers. All mass marketed products provided to
SOHO
s, whether or not accompanied by enhanced service levels and/or premium prices, are included in the respective
RGU
and customer counts of our broadband communications operations, with only those services provided at premium prices considered to be “
SOHO
RGU
s” or “
SOHO
customers”.
SOHO
customers of
CWC
are not included in our
I-22
respective
RGU
and customer counts as of
December 31, 2016
. With the exception of our business
SOHO
subscribers, we generally do not count customers of business services as customers or
RGU
s for external reporting purposes.
Certain of our residential and commercial
RGU
s are counted on an
EBU
basis, including residential multiple dwelling units and commercial establishments, such as bars, hotels and hospitals, in Chile and Puerto Rico. Our
EBU
s are generally calculated by dividing the bulk price charged to accounts in an area by the most prevalent price charged to non-bulk residential customers in that market for the comparable tier of service. As such, we may experience variances in our
EBU
counts solely as a result of changes in rates.
While we take appropriate steps to ensure that subscriber statistics are presented on a consistent and accurate basis at any given balance sheet date, the variability from country to country in (1) the nature and pricing of products and services, (2) the distribution platform, (3) billing systems, (4) bad debt collection experience and (5) other factors add complexity to the subscriber counting process. We periodically review our subscriber counting policies and underlying systems to improve the accuracy and consistency of the data reported on a prospective basis. Accordingly, we may from time to time make appropriate adjustments to our subscriber statistics based on those reviews.
Subscriber information for acquired entities, including
CWC
, is preliminary and subject to adjustment until we have completed our review of such information and determined that it is presented in accordance with our policies.
I-23
Network & Product Penetration Data (%) -
December 31, 2016
|
Chile
|
Panama
|
Puerto Rico
|
Jamaica
|
Trinidad & Tobago
|
Barbados
|
Bahamas
|
Other CWC
|
|||||||||
|
LiLAC Group Network Data:
|
||||||||||||||||
|
Two-way homes passed percentage (1)
|
84
|
79
|
100
|
100
|
100
|
100
|
100
|
93
|
||||||||
|
Homes passed percentage
—
Cable (2)
|
100
|
42
|
100
|
64
|
100
|
—
|
—
|
52
|
||||||||
|
Homes passed percentage
—
FTTx (2)
|
—
|
—
|
—
|
—
|
—
|
100
|
17
|
5
|
||||||||
|
Homes passed percentage
—
(V)DSL (2)
|
—
|
58
|
—
|
36
|
—
|
—
|
83
|
43
|
||||||||
|
Digital video availability percentage (3)
|
91
|
54
|
100
|
71
|
57
|
61
|
78
|
70
|
||||||||
|
Broadband internet availability percentage (3)
|
84
|
48
|
100
|
31
|
72
|
87
|
88
|
70
|
||||||||
|
Fixed-line telephony availability percentage (3)
|
84
|
53
|
100
|
43
|
65
|
99
|
92
|
80
|
||||||||
|
LiLAC Group Product Penetration:
|
||||||||||||||||
|
Cable television penetration (4)
|
33
|
8
|
24
|
24
|
38
|
15
|
1
|
24
|
||||||||
|
Enhanced video penetration (5)
|
92
|
100
|
100
|
100
|
100
|
100
|
100
|
88
|
||||||||
|
Broadband internet penetration (6)
|
40
|
23
|
30
|
41
|
40
|
51
|
17
|
37
|
||||||||
|
Fixed telephony penetration (6)
|
24
|
66
|
19
|
52
|
10
|
67
|
36
|
33
|
||||||||
|
Double-play penetration (7)
|
27
|
17
|
14
|
37
|
33
|
46
|
44
|
41
|
||||||||
|
Triple-play penetration (7)
|
42
|
9
|
42
|
15
|
15
|
15
|
3
|
4
|
||||||||
I-24
__________________
|
(1)
|
Percentage of total homes passed that are two-way homes passed.
|
|
(2)
|
Percentage of total homes passed served by a cable,
FTTx
or DSL network.
|
|
(3)
|
Percentage of total homes passed to which digital video, broadband internet or fixed-line telephony services, as applicable, are made available.
|
|
(4)
|
Percentage of total homes passed that subscribe to cable television services (Basic Video or Enhanced Video).
|
|
(5)
|
Percentage of cable television subscribers (Basic Video and Enhanced Video Subscribers) that are Enhanced Video Subscribers.
|
|
(6)
|
Percentage of two-way homes passed that subscribe to broadband internet or fixed-line telephony services, as applicable.
|
|
(7)
|
Percentage of total customers that subscribe to two services (double-play customers) or three services (triple-play customers) offered by our operations (video, broadband internet and fixed-line telephony).
|
I-25
Video, Broadband Internet & Fixed-Line Telephony and Mobile Services -
December 31, 2016
|
Chile
|
Panama
|
Puerto Rico
|
Jamaica
|
Trinidad & Tobago
|
Barbados
|
Bahamas
|
Other CWC
|
||||||||||
|
LiLAC Group:
|
|||||||||||||||||
|
Video services:
|
|||||||||||||||||
|
Network System
(1)
|
HFC
|
(V)DSL/HFC
|
HFC
|
(V)DSL/HFC
|
HFC
|
(V)DSL/FTTx
|
(V)DSL/FTTx
|
HFC/ (V)DSL/FTTx
|
|||||||||
|
Broadband internet service:
|
|||||||||||||||||
|
Maximum download speed offered (Mbps)
|
160
|
300
|
300
(3)
|
100
|
240
(4)
|
1,000
|
100
|
480
(5)
|
|||||||||
|
Mobile systems:
|
|||||||||||||||||
|
Number of Mobile SIM cards (in 000’s)
(2)
|
166
|
1,736
|
945
|
132
|
315
|
399
|
|||||||||||
|
Prepaid
|
8
|
1,566
|
922
|
102
|
282
|
343
|
|||||||||||
|
Postpaid
|
158
|
170
|
23
|
30
|
33
|
56
|
|||||||||||
_________________
|
(1)
|
These are the primary systems used for delivery of services in the countries indicated. “HFC” refers hybrid fiber coaxial cable networks. “(V)DSL” refers to both our
|
DSL
and
VDSL
networks.
|
(2)
|
Represents the number of active
SIM
cards in service. See note 10 to
Consolidated Operating Data
table above for how these are counted.
|
|
(3)
|
In certain areas, speeds of up to 400 Mbps are available.
|
|
(4)
|
Speeds of up to 1 Gbps available in limited areas.
|
|
(5)
|
The majority of the “Other CWC” operations offer speeds of up to 100 Mbps.
|
I-26
LiLAC Group Products and Services
Our
LiLAC Group
has broadband operations predominately in Latin America and the Caribbean serving residential and business customers. Our sub-sea network, together with our fixed-line networks and mobile platforms, allow us to offer end-to-end communications to customers. In Puerto Rico, our network includes a fiber ring around the island that is over 400 miles long, which provides enhanced interconnectivity points to the island’s other local and international telecommunications companies. These communication networks enable us to offer business services and wholesale services throughout the Caribbean and in parts of Latin America. These networks also support our offers of video, broadband internet, fixed-line telephony and mobile in our residential markets. Our services are provided through VTR in Chile,
Liberty Puerto Rico
in Puerto Rico and
CWC
in the Caribbean and parts of Latin America and the Seychelles. The operations of
CWC
are provided through various consolidated subsidiaries, including the following subsidiaries where we own less than 100%: Cable & Wireless Panama, SA (a 49.0%-owned entity that owns most of our operations in Panama), the Bahamas Telecommunications Company Limited (a 49.0%-owned entity that owns all of our operations in the Bahamas), Cable & Wireless Jamaica Limited (an 82.0%-owned entity that owns the majority of our operations in Jamaica) and Cable & Wireless Barbados Limited (an 81.1%-owned entity that owns the majority of our operations in Barbados).
Residential Services
For our residential customers, we offer a comprehensive set of converged consumer mobile, fixed-line telephony, broadband and video services primarily across the Caribbean and Latin America regions as summarized in the table below:
|
Mobile
|
Internet
|
Video
|
Telephony
|
||||
|
Chile
|
X
|
X
|
X
|
X
|
|||
|
Panama
|
X
|
X
|
X
|
X
|
|||
|
Puerto Rico
|
X
|
X
|
X
|
||||
|
Jamaica
|
X
|
X
|
X
|
X
|
|||
|
Trinidad & Tobago
|
X
|
X
|
X
|
||||
|
Barbados
|
X
|
X
|
X
|
X
|
|||
|
The Bahamas
|
X
|
X
|
X
|
X
|
|||
|
Anguilla
|
X
|
X
|
X
|
X
|
|||
|
Antigua & Barbuda
|
X
|
X
|
X
|
||||
|
British Virgin Islands
|
X
|
X
|
X
|
||||
|
Cayman Islands
|
X
|
X
|
X
|
X
|
|||
|
Curaçao
|
X
|
X
|
X
|
||||
|
Dominica
|
X
|
X
|
X
|
||||
|
Grenada
|
X
|
X
|
X
|
X
|
|||
|
Montserrat
|
X
|
X
|
X
|
||||
|
Seychelles
|
X
|
X
|
X
|
X
|
|||
|
St Kitts & Nevis
|
X
|
X
|
X
|
||||
|
St Lucia
|
X
|
X
|
X
|
X
|
|||
|
St Vincent & the Grenadines
|
X
|
X
|
X
|
X
|
|||
|
Turks & Caicos
|
X
|
X
|
X
|
X
|
|||
We offer mobile services throughout most of our Latin America and Caribbean footprint and in the Seychelles. We are a mobile network provider in Panama and most of our Caribbean markets, including the Bahamas and Jamaica. As a mobile network provider, we are able to offer a full range of voice and data services, including value-added services such as SMS, mobile internet and email access. This also provides us with the basis to offer our customers extensive converged products where we also offer video, internet and fixed-line telephony giving customers connectivity in and out of the home. For these mobile services we hold spectrum licenses with terms ranging from 10 to 15 years. In Chile we provide mobile services as an
MVNO
where
VTR
leases a third-party's radio access network. This arrangement permits us to offer our customers in Chile mobile services without having to own and operate a cellular radio tower network.
I-27
Subscribers to our mobile services pay varying monthly fees depending on whether the mobile service is included with one of our other services or includes mobile data services via mobile phones, tablets or laptops. Our mobile services are available on a postpaid or prepaid basis with most customers purchasing a prepaid plan. We offer our customers the option to purchase mobile handsets with purchase terms typically related to whether the customer selects a prepaid or postpaid plan. Customers selecting a prepaid plan or service pay in advance for a pre-determined amount of airtime or data and generally do not enter into a minimum contract term. Customers subscribing to a postpaid plan generally enter into contracts ranging from 12 to 24 months. The long-term contracts are often taken with a subsidized mobile handset. For each
SIM
card, we typically charge a one-time activation fee to our prepaid customers. Calls within and out of network incur a separate charge if not covered within a prepaid plan or under a postpaid monthly service plan. Our mobile services include voice, SMS and internet access.
CWC
is the incumbent fixed-line telephony service provider in many of its Caribbean markets and in certain markets the sole fixed-line provider.
CWC
offers multi-feature telephony service over its various fixed networks, including cable,
DSL
,
FTTx
and copper networks. Depending on location, these services are provided via either circuit-switched telephony or
VoIP
technology. As the need arises, we are replacing obsolete switches with
VoIP
technology and older copper networks with modern fiber optics. In addition, we continue to develop and invest in new technologies that will enhance our customers’ experiences. These digital telephony services range from usage-based to unlimited international, local and domestic services.
We offer video services in Chile, Puerto Rico, and in most of our
CWC
residential markets, including Panama, Jamaica, Trinidad and Tobago, Barbados and the Bahamas. To meet the demands of our customers, we have enhanced our video services with next generation, market leading digital television platforms that enable our customers to control when and where they watch their programming. These advanced services are delivered over our
FTTx
and hybrid fiber coaxial cable networks and include an advanced electronic programming guide,
DVR
s and
VoD
. In certain of our markets, customers can pause their programming even while the live broadcast is in progress.
In most of our markets, customers have access to
VoD
, which offers thousands of movies and other video content, such as kids, documentaries, adult, sports and television series, as well as music channels. Our
VoD
service is available on a transaction basis with certain
VoD
content available only through premium packages for an additional monthly charge. Customers who subscribe to our video service receive a
VoD
enabled set-top box without an additional monthly charge. We tailor our
VoD
services to the specific market based on available content, consumer preferences and competitive offers. We continue to develop our
VoD
services to provide a growing collection of programming from local and international suppliers, such as ABC/Disney, A+E Networks, NBC/Universal, Discovery and Turner Broadcasting, among others.
In Chile, we recently launched
Horizon TV
through an advanced, cloud-based platform. For customers who take
Horizon TV
, we offer over 20 apps for various online services (such as YouTube, social platforms and games). In several of our Caribbean markets, we offer a comprehensive internet streaming video service (marketed as “
Flow ToGo
”) that allows our video customers to stream over 50 real-time video channels anywhere they have a broadband connection in and out of the home and on multiple devices. A video streaming service is also available in Puerto Rico where our video customers can stream over 45 real-time video channels.
Our operations offer multiple tiers of digital video programming and audio services starting with a basic video service. All digital video services are encrypted and require a set-top box provided by us. Subscribers to our basic video service pay a fixed monthly fee and generally receive at least 70 video channels, including a limited number of
HD
channels, and several digital and analog radio channels. This service includes
VoD
access and an electronic programming guide. We also offer a variety of premium channel packages, including
HD
channels, to meet the special interest of our subscribers. For an additional monthly charge, a subscriber may upgrade to one of our extended digital tier services and receive an increased number of video and radio channels, including channels in the basic tier of service and additional
HD
channels. Digital subscribers may also subscribe to one or more packages of premium channels for an additional monthly charge. In markets where our analog service is available, subscribers to such video service typically receive fewer channels than subscribers to our basic video service, with the number of channels dependent on their location. Subscribers to our digital services also receive the channels available through our analog service.
We tailor our video services in each country of operation based on the programing preferences, culture, demographics and local regulatory requirements. Our channel offerings include general entertainment, sports, movies, documentaries, life styles, news, adult, children, ethnic and foreign channels. In all of our broadband operations, we continue to upgrade our systems to expand our digital services and encourage our analog subscribers to convert to a digital or premium digital service. Discounts to our monthly service fees are available to any subscriber who selects a bundled service of at least any two of the following: video, internet, fixed-line telephony and mobile. In Chile, we do not bundle our mobile services due to regulatory constraints.
Our customers are increasingly using online communications. To support our customers’ expectations for seamless connectivity, we are expanding our networks to make ultrafast broadband available to more people. This includes investment in
I-28
the convergence of our fixed and mobile data systems and making wireless systems available in the home. In 2016, we improved the connectivity of over 350,000 homes in Chile, Puerto Rico, Panama and other
CWC
markets through network extensions and upgrade projects. In 2017, we intend to improve connectivity to approximately 450,000 homes through network extensions and upgrades, including migrating customers from legacy copper networks to cable or fiber networks. In addition, in 2016, we deployed the Connect Box to our subscribers in Chile and Puerto Rico. Connect Box is a dedicated connectivity device that delivers superior in-home WiFi coverage. We plan to expand the availability of this WiFi and telephony gateway to our
CWC
markets beginning in 2017.
The internet speeds we offer is one of our differentiators, as customers spend more time streaming video and other bandwidth-heavy services on multiple devices. As a result, we are continuing to invest in additional bandwidth and technologies to increase internet speeds throughout our Latin America and Caribbean footprint. In 2016, we increased the top tier internet speed for our customers in Chile to 160 Mbps and in Puerto Rico to 300 Mbps. In certain areas of Puerto Rico, download speeds of up to 400 Mbps are available. We also increased our broadband internet speeds in the
CWC
footprint following the deployment of
FTTx
in Barbados and upgrades to our networks in Panama and Jamaica. As stated above, we plan to continue the upgrade and expansion of our fixed networks so that we can deploy high-speed internet service to additional customers in the coming years.
Our residential subscribers access the internet via
DSL
over our fixed-line telephony networks or via cable modems connected to their internet capable devices, including personal computers, or wirelessly via the Connect Box. In each of our markets, we offer multiple tiers of internet service. The speed of service depends on location and the tier of service selected by our subscriber. For example, our tiers of service range from 4 Mbps to 300 Mbps in Panama and from 20 Mbps to 100 Mbps in Jamaica and several of our other Caribbean markets. Higher speeds are available in certain other markets, including up to 1 Gbps in Barbados and in limited areas of Trinidad & Tobago.
Our internet service generally includes email, address book and parental controls with value-added services available for additional incremental charges. Our value-added services include security measures and online storage. Mobile broadband internet services are also available through our mobile services described above. Subscribers to our internet service pay a monthly fee based on the tier of service selected. In addition to the monthly fee, customers pay an activation service fee upon subscribing to an internet service. This one-time fee may be waived for promotional reasons. We determine pricing for each different tier of internet service through an analysis of speed, market conditions and other factors.
Business Services
Our business services represent a significant portion of
CWC
’s revenue, where it is one of the largest business service providers in the markets in which it operates. We also are one of the largest business service providers in Puerto Rico. We offer connectivity and wholesale solutions to carriers and businesses throughout the Caribbean and in parts of Latin America. Our sub-sea and terrestrial fiber optic cable networks include long-haul terrestrial backbone and metro fiber networks that provide access to major commercial zones, wireless carrier cell sites and customers in key markets within our operating footprint.
I-29
Below is a map of our sub-sea fiber network.
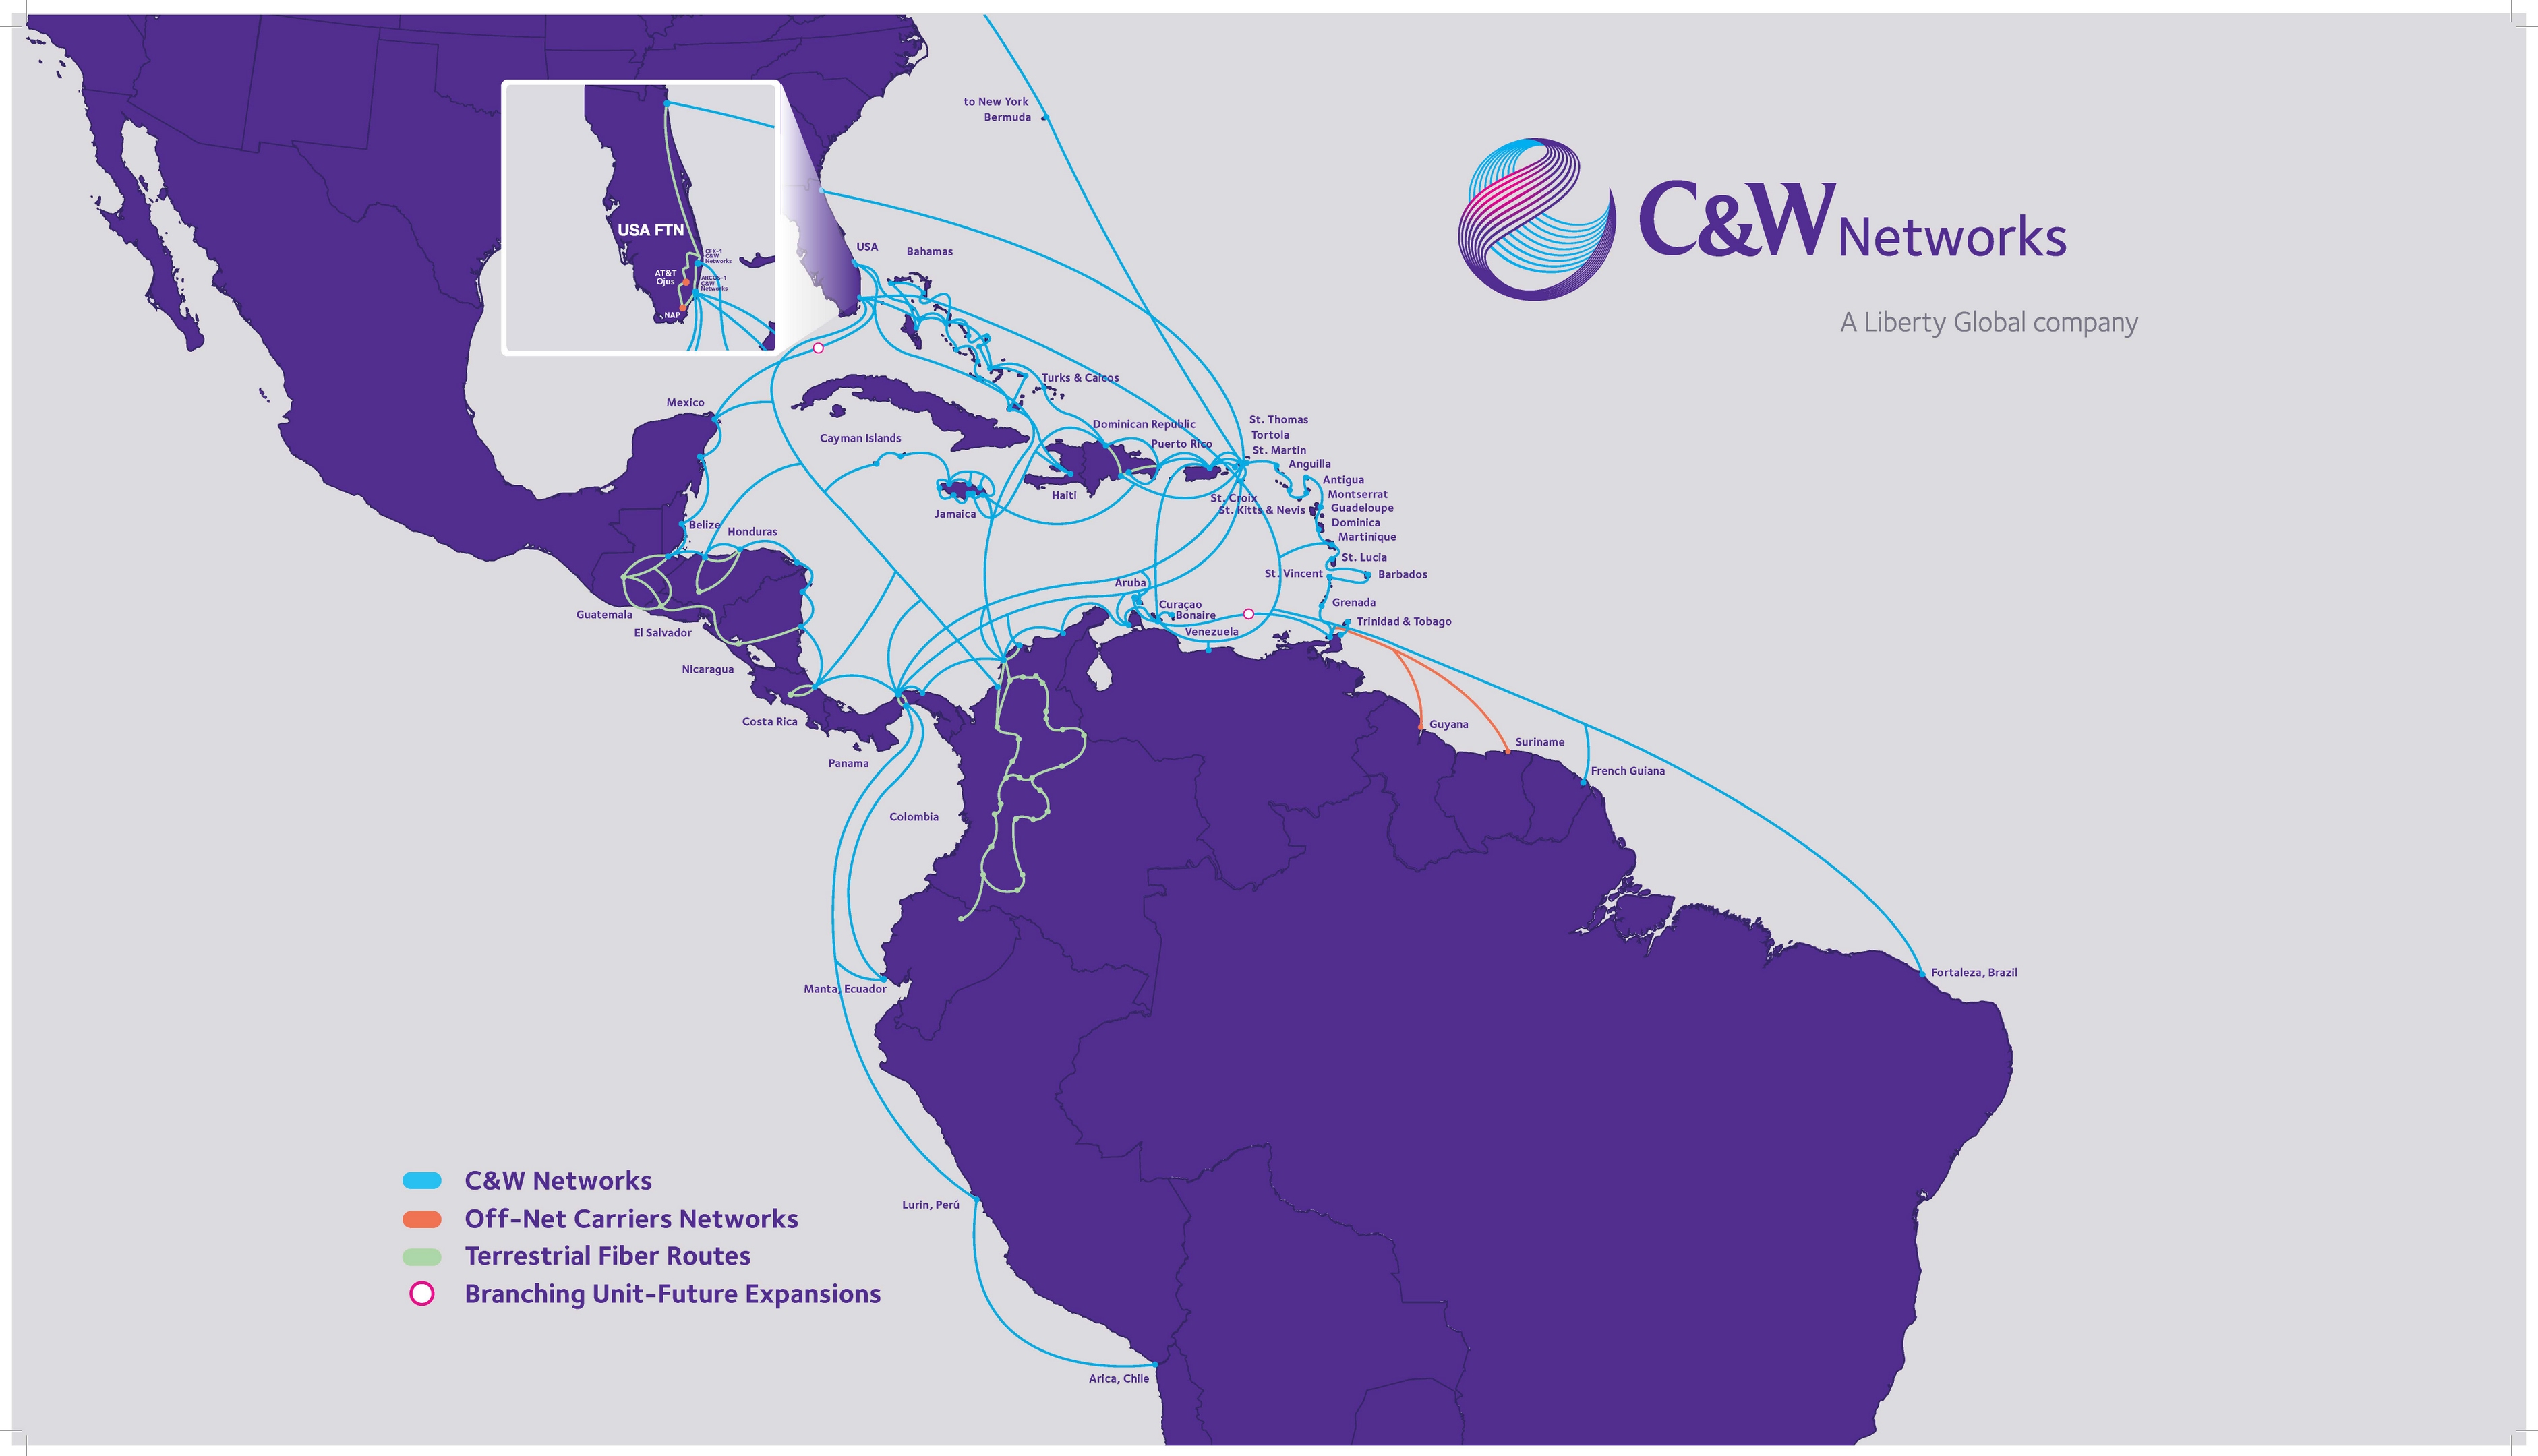
With over 48,000 km of fiber optic cable, and a current capacity of 2.0 Tbps (terabytes per second),
CWC
is able to carry large volumes of voice and data traffic on behalf of its customers, businesses and carriers. The networks also allow
CWC
to provide point-to-point, clear channel wholesale broadband capacity services, superior switching and routing capabilities and local network services to telecommunications carriers, internet service providers (
ISPs
) and large corporations. In case of outages on portions of the cable systems, the network provides inbuilt resiliency due to the capability of re-routing traffic.
CWC
is highly regarded for its wholesale services. In 2016, it was recognized for its innovation and excellence in wholesale services at the 2016 Global Carrier Awards where it received the Best Caribbean Wholesale Carrier Award for the fourth consecutive year. At the 2016 MEF Excellence Awards,
CWC
received the Wholesale Service Provider of the Year Award and the Service Innovation of the Year Award.
Our business operations focus on sales to small, medium and international companies and governmental agencies. Within the business community, we target specific industry segments, such as financial institutions, the hospitality sector, healthcare facilities, education institutions and government offices. We offer tailored solutions that combine our standard services with value added features, such as dedicated customer care and enhanced service performance monitoring. Our business products and services include voice, broadband, enterprise-grade connectivity, data center, hosting and managed solutions, as well as IT solutions. We also offer a range of data, voice and internet services to carriers, ISPs and mobile operators. Our extensive fiber optic cable networks allow us to deliver redundant, end-to-end connectivity. It also allows us to provide business customers our services over dedicated fiber lines and local networks; thereby, seamlessly connecting businesses anywhere in the region.
Our business services fall into five broad categories:
|
•
|
VoIP
and circuit-switch telephony, hosted private branch exchange solutions and conferencing options;
|
|
•
|
data services for internet access, virtual private networks and high capacity point-to-point services;
|
|
•
|
wireless services for mobile voice and data, as well as WiFi networks;
|
|
•
|
video programming packages and select channel lineups for targeted industries; and
|
|
•
|
value added services, including webhosting, managed security systems and storage and cloud enabled software.
|
I-30
We offer a comprehensive range of information and communication technology solutions to businesses and governmental agencies, including a full suite of cloud-based services, as well as a suite of commercial grade triple-play services. Our telephony and telecommunication services include flexible call handling, teleconferencing, voice mail and other premium calling features, as well as security, surveillance and backup services.
We work with businesses to customize their IT services based on the needs of the business. For these tailored services we enter into individual long-term agreements. For SOHO and small business customers, we generally enter into standard service agreements with contractually established prices based on the size of the business, the services received and the volume and duration of the services. We also have agreements to provide our services to our business customers over dedicated fiber lines and third-party fiber networks. Our intermediate to long-term strategy is to enhance our capabilities and offerings in the business sector so we become a preferred provider in the business market. To execute this strategy successfully, customer care is a key driver.
I-31
Additional Business Information
Technology
In most of our markets, our video, broadband internet and fixed-line telephony services are transmitted over a hybrid fiber coaxial cable network. This network is composed primarily of national and regional fiber networks, which are connected to the home over the last few hundred meters by coaxial cable. In several of our Caribbean markets, these services are transmitted over a fixed network consisting of
FTTx
,
DSL
or copper lines. Approximately 98%
of our network allows for two-way communications and is flexible enough to support our current services as well as new services.
We closely monitor our network capacity and customer usage. Where necessary, we increase our capacity incrementally, for instance by splitting nodes in our cable network. We also continue to explore improvements to our services and new technologies that will enhance our customer’s connected entertainment experience. These actions include:
|
•
|
recapturing bandwidth and optimizing our networks by:
|
|
◦
|
increasing the number of nodes in our markets;
|
|
◦
|
increasing the bandwidth of our hybrid fiber coaxial cable network to 1 GHz;
|
|
◦
|
converting analog channels to digital;
|
|
◦
|
bonding additional DOCSIS 3.0 channels;
|
|
◦
|
deploying
VDSL
over our fixed telephony network;
|
|
◦
|
replacing copper lines with modern optic fibers; and
|
|
◦
|
using digital compression technologies.
|
|
•
|
freeing spectrum for high-speed internet,
VoD
and other services by encouraging customers to move from analog to digital services;
|
|
•
|
increasing the efficiency of our networks by moving headend functions (encoding, transcoding and multiplexing) to cloud storage systems;
|
|
•
|
enhancing our network to accommodate business services;
|
|
•
|
using wireless technologies to extend our services outside of the home;
|
|
•
|
offering remote access to our video services through laptops, smart phones and tablets;
|
|
•
|
expanding the availability of
Horizon TV
and related products and developing and introducing online media sharing and streaming or cloud-based video; and
|
|
•
|
testing new technologies.
|
As stated under
General Development of Business—Expansion and Acquisitions
above, we are expanding our hybrid fiber coaxial cable network through our Network Extension programs. For our mobile network operations in the Caribbean and Latin America, we are acquiring additional spectrum, enabling us to expand our
LTE
service in the region. In addition, we are seeking mobile service opportunities where we have established cable networks and expanding our fixed-line networks where we have a strong mobile offering. This will allow us to offer converged fixed-line and mobile services to our customers.
We deliver high-speed data and fixed-line telephony over our broadband network in our European markets and most of our Latin America and Caribbean markets. The cable networks of our operations in Europe are connected to our “Aorta” backbone. The Aorta backbone is recognized as a Tier 1 Carrier, which permits us to serve our customers through settlement free collaboration with other carriers without the cost of using a third-party network. For our operations in Latin America and the Caribbean, we deliver our high-speed data and fixed-line telephony over our various fixed networks, including cable,
DSL
, FTTx and copper networks. These networks are further connected via our sub-sea and terrestrial fiber optic cable network that provide connectivity within and outside the region.
In support of our connectivity strategy, we are moving our customers into a gigabit society. A majority of our broadband networks are already capable of supporting the next generation of ultra high-speed internet service at gigabit speeds. To provide these speeds to our subscribers, we are launching our next generation gateways that will enable DOCSIS 3.1 technology throughout our footprint. The launch of DOCSIS 3.1 technology will allow us to offer faster speeds, in-home WiFi and better services. Our Unitymedia operations have already demonstrated that download speeds of 2 Gbps can be achieved on our network. The new gateways and the continued upgrades to our network in the coming years will allow us to maximize high-speed connectivity over
I-32
our broadband networks and deliver gigabit services in a cost-effective manner. It will also allow us to meet the expectations of our customers for high-speed internet access both in cities and rural areas of our footprint.
Supply Sources
Content
. With telecommunication companies increasingly offering similar services, content is one of the deciding factors for customers in selecting a video services provider. Therefore, in addition to providing services that allow our customers to view programming when and where they want, we are investing in content that customers want. Our content strategy is based on:
|
•
|
proposition (exceeding our customers' entertainment desires and expectations);
|
|
•
|
product (delivering the best content available);
|
|
•
|
procurement (investment in the best brands, shows and sports); and
|
|
•
|
partnering (strategic alignment, acquisitions and growth opportunities).
|
We license almost all of our programming and on-demand offerings from content providers and third-party rights holders, including broadcasters and cable programming networks. For such licenses, we generally pay a monthly fee on a per channel or per subscriber basis, with minimum pay guarantees in certain cases. We generally enter into long-term programming licenses with volume discounts and marketing support. For on-demand programming and streaming services, we generally enter into shorter-term agreements. For our distribution agreements, we seek to include the rights to offer the licensed programming to our customers through multiple delivery platforms and through our apps for smart phones and tablets.
In seeking licenses for content, our primary focus is on partnering with leading international providers, such as Disney, Time Warner (including HBO), Fox, the BBC and Discovery. We also seek to carry in each of our markets key public and private broadcasters and in some markets we acquire local premium programing through select relationships with companies such as Sky plc (
Sky
) (U.K., Ireland, Germany and Austria) and British Telecom (
BT
). For our
VoD
services, we license a variety of programming, including box sets of television series, movies, music, kids and documentaries. In addition, we have entered into a multi-year revenue sharing arrangement with Netflix Inc. (
Netflix
) to provide our customers with premium OTT services. The partnership will result in Netflix's content being available via set-top boxes to our video customers across all of our markets in Europe, Latin America and the Caribbean. The Netflix app is already available to our customers in the U.K., Ireland and Switzerland and we plan to deploy the service in the rest of our operations via
Horizon TV
over the course of 2017 and 2018. It is also available to VodafoneZiggo customers.
Exclusive content is another element of our content strategy. To support this approach, we are investing in content assets. We have invested in various content companies, including ITV plc, All3Media Ltd., LionsGate Entertainment, TV3 Group (Ireland) and De Vijver Media. We are also investing in sports, both as a broadcaster and as a rights owner. In addition, we operate the leading Caribbean sports network
Flow Sports
, which provides exclusive full coverage of the English Premier League and other leading sporting events. We have also launched our own exclusive sports channels,
Play Sports
in Belgium, and announced the launch of
MySports
in Switzerland in 2017.
In addition, we are commissioning our own dramas. We created the Swiss sitcom
Fassler-Kunz
, the Swiss series
Im Heimatland
and the original Belgium series
Chaussee d'Amour
. In August 2016, we announced that we are teaming up with All3Media, which we own jointly with Discovery Communications, Inc., to co-produce four high-end drama series over the next two years. This exclusive content will be available on demand to our customers.
Customer Premises Equipment
. We purchase each type of customer premises equipment from a number of different suppliers with at least two or more suppliers providing our high-volume products. Customer premises equipment includes set-top boxes, modems, WiFi routers,
DVR
s, tuners and similar devices. For each type of equipment, we retain specialists to provide customer support. For our broadband services, we use a variety of suppliers for our network equipment and the various services we offer. Similarly, we use a variety of suppliers for mobile handsets to offer our customers mobile services.
Software Licenses
. We license software products, including email and security software, and content, such as news feeds, from several suppliers for our internet services. The agreements for these products require us to pay a per subscriber fee for software licenses and a share of advertising revenue for content licenses. For our TiVo service in the
U.K.
, we have a partnership arrangement where TiVo is the exclusive provider of the user interface software for our next generation set-top boxes, which provides converged television and broadband internet capabilities, and we are the exclusive distributor of the TiVo services and technology in the
U.K.
For our mobile network operations and our fixed-line telephony services, we license software products, such as voicemail, text messaging and caller ID, from a variety of suppliers. For these licenses we seek to enter into long-term contracts, which generally require us to pay based on usage of the services.
I-33
Access Arrangements
. Through
Unitymedia
, we have entered into various long-term agreements with the incumbent telecommunications operator, Deutsche Telekom AG (
Deutsche Telekom
), for the lease of cable duct space and hubs, as well as use of fiber optic transmission systems, towers and facility space. In addition,
Unitymedia
purchases a portion of the electricity required for the operation of its networks through
Deutsche Telekom
under such agreements.
Unitymedia
’s ability to offer its broadband communications services to customers is dependent on the agreements with
Deutsche Telekom
. These agreements are long-term and may only be terminated under certain limited exceptions. Any termination, however, would have a material adverse effect on the operations of
Unitymedia
. For information on a legal action that
Unitymedia
commenced against
Deutsche Telekom
in December 2012 regarding these agreements, see note 17 to our consolidated financial statements included in Part II of this Annual Report on Form 10-K.
For our mobile services provided through
MVNO
arrangements, we are dependent on third-party wireless network providers. Each of our
MVNO
operations has an agreement with such a provider to carry the mobile communications traffic of our customers. We seek to enter into medium to long-term arrangements for these services. Any termination of these arrangements could significantly impact our mobile services.
Competition
All of our businesses operate in highly competitive and rapidly evolving markets. Technological advances and product innovations have increased and are likely to continue to increase giving customers several options for the provision of their telecommunications services. Our customers want access to high quality telecommunication services that allow for seamless connectivity. Accordingly, our ability to offer converged services (video, internet, fixed telephony and mobile) is a key component of our strategy. In many of our markets, we compete with companies that provide fixed-mobile convergence bundles, as well as companies that are established in one or more communication products and services. Consequently, our businesses face significant competition. In all markets, we seek to differentiate our telecommunication services by focusing on customer service, competitive pricing and offering quality high-speed internet. In this section, we begin with an overview on the competitive nature of the video, broadband internet, and mobile and fixed-line telephony services in our markets, and then provide more detail on the competitive landscape in our more material markets.
Video Distribution
Our video services compete primarily with traditional free-to-air (
FTA
) broadcast television services,
DTH
satellite service providers and other fixed-line telecommunications carriers and broadband providers, including incumbent telephony operations offering (1)
DTH
satellite services, (2) IPTV over broadband internet connections using asymmetric
DSL
or
VDSL
or an enhancement to
VDSL
called "vectoring", (3) IPTV over
FTTx
networks, or (4)
LTE
Services. Many of these competitors have a national footprint and offer features, pricing and video services individually and in bundles comparable to what we offer. In certain markets, we also compete with other cable providers who have overbuilt portions of our systems.
OTT video content aggregators utilizing our or our competitors' high-speed internet connections are also a significant competitive factor as are other video service providers that overlap our service areas. The OTT video aggregators (such as HBO Go, Amazon Prime and Netflix) offer
VoD
service for television series and movies, catch-up television and linear channels from broadcasters. In some cases, these OTT services are provided free-of-charge. The content library of such services are offered on an unlimited basis for a monthly fee. Typically these services are available on multiple devices in and out of the home. To enhance our competitive position, we provide our subscribers with TV everywhere products and premium OTT video services through MyPrime or our arrangement with Netflix. Our businesses also compete to varying degrees with other sources of information and entertainment, such as online entertainment, newspapers, magazines, books, live entertainment/concerts and sporting events.
We believe that our deep-fiber access provides us with several competitive advantages. For instance, our cable networks allow us to concurrently deliver internet access, together with real-time television and
VoD
content, without impairing our high-speed internet service. In addition, our cable infrastructure allows us to provide triple-play bundled services of broadband internet, television and fixed-line telephony services without relying on a third-party service provider or network. Where mobile is available, our mobile networks, together with our fixed fiber-rich networks, allow us to provide a comprehensive set of converged mobile and fixed-line services. Our capacity is designed to support peak consumer demand. In serving the business market, many aspects of the network can be leveraged at very low incremental costs given that business demand peaks at a time when consumer demand is low, and peaks at lower levels than consumer demand. In response to the continued growth in OTT viewing, we have launched a number of innovative video services, including Horizon Go,
MyPrime
and Replay TV in our European markets, Play More in Belgium and Flow ToGo in several of the
CWC
markets, as well as access to Netflix content.
I-34
Our ability to continue to attract and retain customers depends on our continued ability to acquire appealing content and services on acceptable terms and to have such content available on multiple devices and outside the home. Some competitors, such as Swisscom AG (
Swisscom
) in Switzerland, have obtained long-term exclusive contracts for certain sports programs, which limits the opportunities for other providers to offer such programs. Other competitors also have obtained long-term exclusive contracts for programs, but our operations have limited access to certain of such programming through select contracts with these companies, including Sky Deutschland AG, a subsidiary of Sky, in Germany and Austria and Sky and BT in the
U.K.
and Ireland. If exclusive content offerings increase through other providers, programming options could be a deciding factor for subscribers on selecting a video service.
Liberty Global Group
In the European countries in which we operate, our principal competition in the provision of video services is from traditional
FTA
broadcasters;
DTH
satellite providers in many markets, such as the
U.K.
, Germany, Austria, Ireland, Poland, the Czech Republic and Slovakia, where we compete with long-established satellite platforms; incumbent telecommunications providers using fiber technology; and cable operators where portions of our systems have been overbuilt. In addition, in Belgium we are experiencing competition on our own network as a result of the Belgian Regulatory Authorities granting third-party operators (including the incumbent telephony operator) access to cable operators’ networks. See
Regulatory Matters—Liberty Global Group—Belgium
. Mobile broadband has gained a noticeable share of subscribers, which is another competitive factor.
Similar to our technological advances to enhance our video services, our competitors are also improving their video platforms with next generation set-top boxes, TV everywhere products and other interactive services. Similarly,
VDSL
, which is either provided directly by the owner of the network or by a third-party, is a significant part of the competitive environment in many of our markets as are
FTTx
networks. In all of our European markets, competitive video services are offered by the incumbent telecommunications operator, whose video strategies include
IPTV
over
DSL
,
VDSL
and
FTTx
networks and, in some cases,
DTH
and
DTT
. The ability of incumbent operators to offer the triple-play of video, broadband internet and fixed-line telephony services and, in most countries, a quad-play with mobile services, is exerting competitive pressure on our operations, including the pricing and bundling of our video products. In order to gain video market share, the incumbent operators and alternative service providers in a number of our larger European markets are pricing their
DTT
,
VDSL
or
DTH
video packages at a discount to the retail price of the comparable digital cable service and, in some cases, including
DVR
s as a standard feature.
Overall, we are experiencing increased convergence as customers look to receive all their media and communication services from one provider. In our largest European video markets, our key competitors for the the provision of converged services are: BT (U.K.),
Deutsche Telekom
(Germany),
Proximus
NV/SA (
Proximus
)
(Belgium) and Swisscom (Switzerland). Each of these competitors have extensive resources allowing them to offer competitively priced bundled services. As a result, our ability to offer triple-play or quad-play bundles and fixed-mobile convergence bundles is one of our key strategies to attract and retain customers. In each of these markets, we seek to distinguish ourselves through our multimedia gateway services, interactive services (such as Replay TV and MyPrime) and our download speeds.
Portions of our European systems have been overbuilt by
FTTx
networks and other cable operations. These systems are a significant competitive factor primarily for our Central and Eastern Europe operations. Based on research of various telecommunication publications, including by the Organization for Economic Cooperation and Development (
OECD
) and internal estimates, parts of our Central and Eastern Europe operations are overbuilt by
FTTx
networks, including almost all of our operations in Romania. Other cable operators have also overbuilt approximately half of our cable networks in Hungary and Poland. Although we have extensive
FTTx
overbuild in Switzerland, connectivity to the
FTTx
network is not available at all locations.
In addition, government and quasi-government entities in certain of the countries in which we operate in Europe continue to invest in
FTTx
networks, creating another source of competition. In order to achieve download speeds of up to 100 Mbps or greater for customers, incumbent telecommunications operators are adopting
VDSL
with vectoring and bonding technologies as a more cost efficient solution compared to
FTTx
initiatives. Our primary competitor in Germany, Deutsche Telekom, has implemented this technology in almost all of our footprint in Germany.
Swisscom
is also implementing vectoring in Switzerland. Vectoring is a transmission method that coordinates line signals to reduce crosstalk levels and improve performance. Bonding is a method of taking channels on either
DSL
or cable plant and bonding those channels together for a higher bandwidth throughput.
In most of our Central and Eastern European markets, we face intense competition from
DTH
services. These
DTH
companies offer aggressively-priced packages of video content and in some cases offer triple-play packages.
FTA
broadcasters are also significant competitors in the Central and Eastern Europe markets. To stay competitive,
UPC Holding
’s
DTH
operations offer advanced services and functionality, including
DVR
and premium content, in most of our Central and Eastern European markets. It has also expanded these services to include a triple-play offer in Hungary. Our cable operations stay competitive by offering enhanced digital services, such as
HD
channel offerings,
MyPrime
, Horizon Go and expanded
VoD
services. These operations have also increased broadband internet speeds in their triple-play bundles ranging from up to 250 Mbps in Poland to up to 500 Mbps in Hungary, Romania and Slovakia. Promotional discounts are available, particularly on bundled options.
I-35
We compete on value by offering advanced digital services, such as
DVR
functionality,
HD
,
VoD
, catch-up television, Replay TV, multiscreen services and multimedia gateways. We also compete by accelerating the migration of our customers from analog to digital services, offering advanced digital features and attractive content packages, as well as bundled services, at reasonable prices. In each of the countries in which we operate, we also tailor our packages to include attractive channel offerings and offer recurring discounts for bundled services and loyalty contracts. In addition, from time to time, we modify our digital channel offerings to improve the quality of our programming. Where mobile voice and data are available, we focus on our converged service offerings at attractive prices. In our other operations, we use the triple-play bundle as a means of driving video, as well as other products where convenience and price can be leveraged across the portfolio of services. We also continue to enhance our
Horizon TV
product to meet our customers desire to view programming anytime and anywhere, such as new applications and expanding its availability in our markets.
|
•
|
Virgin Media
.
Virgin Media
’s digital television services compete primarily with
FTA
television and with
Sky
, the primary pay satellite television provider.
Sky
offers competitively priced triple-play and quad-play services in the
U.K.
and Ireland. Other significant competitors are BT and
TalkTalk
Telecom Group plc (
TalkTalk
) in the
U.K.
and Eircom Limited in Ireland, each of which offer triple-play services, as well as
IPTV
video services. Each of these competitors have multimedia home gateways.
|
Sky
owns the
U.K.
rights to various entertainment, sports and movie programming content and channels.
Sky
is both a principal competitor in the pay-television market and an important supplier of content to us. Various
Sky
channels, including
Sky Sports
, are available over
Sky
’s satellite system and our cable networks, as well as via Sky’s apps and online players and other television platforms, and some of the channels are available on BT and
TalkTalk
platforms.
Virgin Media
distributes several basic and premium video channels supplied by
Sky
. BT is also both a principal competitor and an important supplier of content to us. BT owns premium BT Sport channels, providing a range of sports content, including football (soccer) from the English Premier League and exclusive rights to the UEFA Champions League and the UEFA Europa League. The BT Sport channels are available on our cable network as well as our competitors’ networks.
In this competitive market,
Virgin Media
is expanding its broadband network and recently launched its new 4K enabled Virgin Media V6 set-top box in the UK. In Ireland it offers Horizon TV and its functionalities (marketed as Virgin TV). The on-line streaming service Virgin TV Anywhere is available throughout the Virgin Media footprint. In addition,
Virgin Media
’s ability to include mobile for its
U.K.
and Ireland customers for a low incremental fee creating a fixed-mobile convergence bundle is a key market offer.
|
•
|
Unitymedia
.
Unitymedia
’s primary competition is from
FTA
television received via satellite.
Unitymedia
’s primary competitor for pay TV services is the
IPTV
services over
VDSL
and
FTTx
and
DTH
of the incumbent telecommunications operator,
Deutsche Telekom
.
Deutsche Telekom
has announced plans to cover approximately 80% of German homes with its
VDSL
network by 2018. Within its
VDSL
footprint,
Deutsche Telekom
is implementing vectoring technology to enhance maximum broadband speeds to up to 100 Mbps from the current speeds of up to 50 Mbps.
Deutsche Telekom
further announced its ambition to implement super vectoring technology across all cable network areas by 2018, enhancing broadband speeds in these areas to up to 250 Mbps.
|
Deutsche Telekom
offers competitively-priced bundles, including fixed-mobile convergence, and recently became more aggressive on price by launching double-play and triple-play promotional offers. In addition,
Vodafone
, also a competitor in Germany, bundles its
IPTV
service with its broadband offerings through
Deutsche Telekom
’s
DSL
network under a resell agreement making it a significant competitor in the double-play and triple-play market in our footprint. It also has expanded its bundle offers to include mobile products. These converged offerings may enable
Deutsche Telekom
and
Vodafone
to reduce churn and attract new customers.
Deutsche Telekom
and
Professional Operator
s compete with
Unitymedia
for housing association contracts.
Professional Operator
s typically procure the broadcast signals they distribute from
Unitymedia
or from
FTA
television received via satellite. Certain
Professional Operator
s may also use such opportunities to build their own distribution networks or to install their own head-ends for receiving satellite signals.
To enhance its competitive position,
Unitymedia
offers
Horizon TV
and the Horizon family of products, including Horizon Go. It also makes mobile available creating converged bundles. Mobile customers receive a discount when they also subscribe to certain bundles.
|
•
|
Telenet
.
Telenet
’s principal competitor is
Proximus
, the incumbent telecommunications operator, which has interactive digital television, replay television,
VoD
and
HD
service as part of its video offer, as well as a remote access service.
Proximus
offers competitively-priced bundles, including fixed-mobile convergence. Its
IPTV
services are delivered over its
DSL
and
VDSL
networks. Also,
Telenet
and other Belgian cable operators must give alternative providers access to
|
I-36
their cable networks. Consequently,
Telenet
faces increased competition from other providers of video services who may be able to offer triple- and quad-play services. For more information, see
Regulatory Matters—Liberty Global Group—Belgium.
In order to compete effectively against alternative providers,
Telenet
leverages its extensive cable network, the broad acceptance of its basic cable television services and Yelo Play and its additional features, such as
HD
and
DVR
functionality,
VoD
offerings and its
Play Sports
channel. It is also using mobile services to drive its other products through its all-in-one converged offering “WIGO”. In addition,
Telenet
continues to enhance its Yelo Play app and programming, including extending its rights to the English Premier League through 2019 and the addition of other sports rights. Further, with its pending acquisition of certain broadband operations from Coditel Brabant sprl, Telenet will extend its services to additional parts of Belgium and Luxembourg.
|
•
|
UPC Switzerland
.
Our main competitor in Switzerland is
Swisscom
, the incumbent telecommunications operator, which provides
IPTV
services over
DSL
,
VDSL
and
FTTx
networks.
Swisscom
offers
VoD
services,
DVR
and replay functionality and
HD
channels, as well as the functionality to allow remote access to its video services, and has exclusive rights to distribute certain sports programming.
Swisscom
’s internet speeds include up to 100 Mbps on its
VDSL
network and up to either 300 Mbps or 1 Gbps in areas served by its
FTTx
network.
Swisscom
continues to expand its
FTTx
network to Switzerland households in our footprint, as well as in our partner network footprints. It has built its fiber-to-the-home network in several cities in cooperation with municipality-owned utility companies and, where no cooperation agreement has been reached,
Swisscom
is building its own fiber-to-the-home network. With respect to subscribers on partner networks, UPC Switzerland competes with other service providers for the contracts to serve these subscribers.
|
To compete effectively in Switzerland, UPC Switzerland promotes
Horizon TV
and its family of products together with Replay TV and
MyPrime
, giving subscribers the ability to personalize their programming and viewing preferences. It also uses its high-speed internet of up to 200, 400 or 500 Mbps to promote its extended digital tier bundles.
LiLAC Group
In Latin America and the Caribbean, our primary competition in the provision of video services, depending on the market, is from traditional
FTA
broadcasters,
DTH
satellite providers, other pay television providers using fiber technology or cable operators whose networks overlap our systems. OTT viewing is also a significant competitive factor. To enhance our video offerings in this region, we are developing cloud-based, next generation user interfaces based on advanced technologies. This is demonstrated by our recent launch of
Horizon TV in Chile
and an advanced set-top box in most of
CWC
’s markets. Our competitors, however, are also improving their video services with interactive services and wireless connectivity. Many of our competitors offer competitively-priced packages of video content and, in some cases, offer double- and triple-play packages.
In this competitive environment, we enhance our offers with advanced digital services, such as DVR functionality,
HD
channels, VoD and multiscreen services. In addition, we offer attractive content packages tailored to the particular market and discounts for bundled services. To improve the quality of the programming in our packages, our operations periodically modify their digital channel offerings. Where mobile is available, we are focusing on our converged service offerings at attractive prices. We use these services, as well as bundles of our fixed-line services, as a means of driving video and other products where convenience and price can be leveraged across the portfolio of services.
|
•
|
VTR
.
VTR
competes primarily with
DTH
service providers, including the incumbent Chilean telecommunications operator Compañia de Telecomunicaciones de Chile SA using the brand name Movistar (
Movistar
), Claro Chile S.A., a subsidiary of América Móvil, S.A.B. de C.V. (
Claro
), and DIRECTV Latin America Holdings, Inc. (
DirecTV
). Movistar offers double-play and triple-play packages using
DTH
for video and
DSL
for internet and fixed-line telephony and offers mobile services. On a smaller scale, Movistar also offers
IPTV
services over
FTTx
networks in Chile.
Claro
offers triple-play packages using
DTH
and, in most major cities in Chile, through a hybrid fiber coaxial cable network. It also offers mobile services. To a lesser extent,
VTR
also competes with video services offered by or over networks of fixed-line telecommunication providers using
DSL
technology. To compete effectively,
VTR
focuses on enhancing its subscribers viewing options in and out of the home. It offers
VoD
, catch-up television,
DVR
functionality,
Horizon TV
and a variety of premium channels. These services and its variety of bundled options, including internet and telephony, enhance
VTR
’s competitive position.
|
|
•
|
CWC
.
CWC
competes with a variety of pay TV service providers in its various markets. Several of these competitors offer double-play and triple-play packages. Fixed-mobile convergence services are not yet a significant factor in most of
CWC
’s residential markets. In Panama,
CWC
competes primarily with Cable Onda S.A., which offers video, internet and fixed-line telephony over its cable network. The
DTH
services of Claro are also a competitive factor. In several of
CWC
’s other markets, including Jamaica, Trinidad & Tobago and Barbados, we are the largest or one of the largest video
|
I-37
service providers. In these markets,
CWC
’s primary competition is from
DTH
providers, such as DirecTV, and operators of IPTV services over
VDSL
and
FTTx
, such as Digicel Group Ltd. (
Digicel
). To compete effectively,
CWC
invests in leading mobile and fixed networks, and in content, where the Premier League is a main attraction for
Flow Sports
.
|
•
|
Liberty Puerto Rico
.
Liberty Puerto Rico
is the third largest provider of video services in Puerto Rico.
Liberty Puerto Rico
’s primary competition for video customers is from
DTH
satellite providers DirecTV and Dish Network Corporation (
Dish Network
). Dish Network is an aggressive competitor, offering low introductory offers, free
HD
channels and, in its top tier packages, a multi-room
DVR
service for free. DirecTV is also a significant competitor offering similar programming in Puerto Rico compared to Dish Network. In order to compete,
Liberty Puerto Rico
focuses on offering video packages with attractive programming, including
HD
and Spanish language channels. It also offers a specialty video package of Spanish-only channels that is gaining popularity. In addition,
Liberty Puerto Rico
uses its bundled offers that include high-speed internet with download speeds of up to 300 Mbps to drive its video services.
|
Internet
With respect to broadband internet services and online content, our businesses face competition in a rapidly evolving marketplace from incumbent and non-incumbent telecommunications companies, mobile operators and cable-based
ISP
s, many of which have substantial resources. The internet services offered by these competitors include both fixed-line broadband internet services using cable,
DSL
or
FTTx
networks and wireless broadband internet services. These competitors have a range of product offerings with varying speeds and pricing, as well as interactive services, data and other non-video services offered to homes and businesses. With the demand for mobile internet services increasing, competition from wireless services using various advanced technologies is a competitive factor. In several of our markets, competitors offer high-speed mobile data via
LTE
wireless networks. In addition, other wireless technologies, such as WiFi, are available in almost all of our markets. In this intense competitive environment, speed and pricing are key drivers for customers.
Our strategy is speed leadership. Our focus is on increasing the maximum speed of our connections as well as offering varying tiers of service, prices and a variety of bundled product offerings and a range of value added services. We update our bundles and packages on an ongoing basis to meet the needs of our customers. Our top download internet speeds in Europe range from up to 200 Mbps to speeds of up to 500 Mbps available in Switzerland, Hungary, Romania and Slovakia. Our top download speeds for our Latin American and Caribbean operations generally range from up to 100 Mbps to speeds of up to 350 Mbps. In Barbados, we also have speeds of up to 1 Gbps available and in Anguilla, we have speeds of up to 480 Mbps. In many of our LiLAC Group markets, we offer the highest download speeds available via our cable and
FTTx
networks. The focus is on high-end internet products to safeguard our high-end customer base and allow us to become more aggressive at the low- and medium-end of the internet market. By fully utilizing the technical capabilities of DOCSIS 3.0 technology on our cable systems, we can compete with local
FTTx
initiatives and create a competitive advantage compared to
DSL
infrastructures and
LTE
initiatives on a national level. With the commercial deployment of our next generation gateways that will enable DOCSIS 3.1 on our cable networks, we plan to further increase our high-speed internet offers.
Liberty Global Group
Across Europe, our key competition in this product market is from the offering of broadband internet products using various
DSL
-based technologies by the incumbent phone companies and third parties. The introduction of cheaper and ever faster fixed-line broadband offerings is further increasing the competitive pressure in this market. Wireless broadband services, such as
LTE
, are also significant competitors using high-speed mobile networks. We are expanding our ultra high-speed services and increasing our download speeds. In most of our markets, we offer our internet service on a standalone basis or through bundled offerings that include video, fixed-line telephony and mobile services. Mobile data is also increasingly important and we are addressing this through our wide range of mobile products, including expanding our
LTE
service area and offering
SIM
-only mobile products, as well as expanding our Community WiFi network.
|
•
|
Virgin Media
. In the
U.K.
, we have a number of significant competitors in the market for broadband internet services, including fixed-line incumbent telecommunications providers. Of these broadband internet providers, BT is the largest, which provides broadband internet access services over its own
VDSL
network. BT has announced its intention to rollout ultrafast speeds of up to 300 Mbps to 500 Mbps by the end of 2020 to up to 10.0 million premises using G-fast technology, a
DSL
standard designed for local loops less than 250 meters. This technology is also expected to eventually support a rollout of 1 Gbps service.
|
Operators such as Sky and TalkTalk deploy their own network access equipment in BT exchanges via a process known as local loop unbundling (
LLU
). This allows an operator to reduce the recurring operating costs charged by BT by reducing the proportion of traffic that must travel directly over BT’s network. LLU deployment requires a substantial capital investment to implement and requires a large customer base to deliver a return on investment. In addition to the competition
I-38
and pricing pressure in the broadband market arising from LLU, competition from mobile broadband developments, such as
LTE
mobile services and WiFi services, is significant. Mobile providers continue to gain market share from fixed-line providers. These providers offer a range of mobile services.
|
•
|
Unitymedia
. In Germany, the competition for broadband internet services is particularly intense. For broadband internet access,
DSL
is the dominant technology and
Deutsche Telekom
is the primary provider. Other major competitors to our services are resellers of
Deutsche Telekom
’s
DSL
and
VDSL
services. We also face increased competition from mobile broadband operators, including
Deutsche Telekom
, and other network providers, many of which offer mobile services through
LTE
wireless systems and are increasing their coverage areas.
Deutsche Telekom
is upgrading its
VDSL
network with vectoring technology to increase its speeds to up to 100 Mbps. It plans to have 80% of German households connected to this network by 2018. With its (vectored)
VDSL
expansion plan, competition from
Deutsche Telekom
will increase.
|
|
•
|
Telenet
. In the Flanders region of Belgium,
Telenet
is the leading provider of residential broadband internet services.
Telenet
’s primary competitor is the
DSL
service provider
Proximus
.
Proximus
is a well-established competitor offering quad-play bundles.
Proximus
’
DSL
and
VDSL
service provide download speeds up to 100 Mbps. Mobile internet use is increasing as well. Similar to its video services, Telenet faces competition in the provision of internet services from other providers who have access to
Telenet
’s cable network. In this competitive market, Telenet is using its fixed-mobile converged offer “WIGO” to promote its internet and other services.
|
|
•
|
UPC Switzerland
. In Switzerland,
Swisscom
is the largest provider of broadband internet services, and is our primary competitor.
Swisscom
internet customers have access to its basic video content free of charge through its internet portal. It is also expanding its
FTTx
network and rolling out G.fast technology. At year end 2016, it had 2.5 million new connections through these technologies. Swisscom offers download speeds ranging from 20 Mbps to up to 1 Gbps.
|
LiLAC Group
In several of our
CWC
markets, we are the incumbent phone company offering broadband internet products using various
DSL
-based technologies. In these markets and our other Latin American markets, our key competition for internet services is from cable and IPTV operators and mobile data service providers. Wireless broadband services are a significant competitor with their high-speed mobile networks. To compete effectively, we are expanding our
LTE
service areas and increasing our download speeds. In most of our markets, we offer our internet service through bundled offerings that include video and fixed-line telephony. We also offer a wide range of mobile products either on a prepaid or postpaid basis.
|
•
|
VTR
. In Chile, VTR faces competition primarily from non-cable-based ISPs, such as Movistar, and from other cable-based providers, such as
Claro
. Competition is particularly intense with each of these companies offering competitively priced services, including bundled offers with ultra high-speed internet services. Mobile broadband competition is significant as well. Both Movistar and
Claro
have launched an
LTE
network for high-speed mobile data. To compete effectively, VTR is expanding its two-way coverage and offering attractive bundling with fixed-line telephony and digital video service. In response to the availability of mobile data in Chile, VTR offers our high-speed internet with download speeds of up to 160 Mbps.
|
|
•
|
CWC
.
CWC
competes primarily with mobile broadband providers in the provision of internet services. Where
CWC
is the incumbent telecommunications provider, it also competes with cable operators, the largest of which is Cable Onda in Panama and Cable Bahamas in the Bahamas. To a lesser extent,
CWC
experiences competition from Digicel in certain of its markets. To distinguish itself from these competitors,
CWC
uses its bundled offers with video and telephony to promote its broadband internet services.
|
|
•
|
Liberty Puerto Rico
. In Puerto Rico,
Liberty Puerto Rico
competes primarily with mobile broadband providers. Most of these providers, including the incumbent telecommunications company, offer these services over their
LTE
networks. To compete with mobile broadband,
Liberty Puerto Rico
offers its high-speed internet with download speeds of up to 300 Mbps.
Liberty Puerto Rico
also competes with the
DSL
services of Claro in providing fixed-line internet services.
|
I-39
Mobile and Telephony Services
Consumers are increasingly moving to mobile services. In almost all of our Latin America and Caribbean markets we are either the leading or one of the leading mobile providers, except in Chile and certain other markets where we are a relatively new entrant in the provision of mobile services. In Belgium, we are one of the top three mobile providers and in the U.K., we are the fourth largest provider, in each case based on number of SIM cards. In our other European markets, however, we currently have minimal mobile presence. In the markets where we are one of the top mobile providers, we continue to seek additional bandwidth to deliver our wide range of services to our customers and increase our
LTE
services. Where we are a small mobile provider, we face significant competition from other mobile telephony providers, many of whom offer
LTE
services and are making significant advances in obtaining customers. In all of our markets competition is intense. We also offer various calling plans, such as unlimited network, national or international calling, unlimited off-peak calling and minute packages, including calls to fixed and mobile phones. In addition, we use our bundled offers with our video and ultra high-speed internet services to gain mobile subscribers. Our ability to offer fixed-mobile convergence services is a key driver. In several of our markets we provide converged services, including mobile, fixed-line, broadband and video. We are also exploring opportunities to offer mobile services in our other markets and mobility applications to our other services.
The market for fixed-line telephony services is mature in almost all of our markets. Changes in market share are driven by the combination of price and quality of services provided and the inclusion of telephony services in bundled offerings. In several of our
CWC
markets, we are the incumbent telecommunications provider with long established customer relationships. In our other markets, our fixed-line telephony services compete against the incumbent telecommunications operator in the applicable market. In these markets, the operators have substantially more experience in providing fixed-line telephony and mobile services, greater resources to devote to the provision of fixed-line telephony services and long-standing customer relationships. In all of our markets, we also compete with other
VoIP
operators offering service across broadband lines. OTT telephony is also a competitive factor. In many countries, our businesses also face competition from other cable telephony providers,
FTTx
-based providers or other indirect access providers.
Competition in both the residential and business fixed-line telephony markets is extremely competitive due to market trends, the offering of carrier pre-select services, number portability, the replacement of fixed-line with mobile telephony and the growth of
VoIP
services, as well as continued deregulation of telephony markets and other regulatory action, such as general price competition. Carrier pre-select allows the end user to choose the voice services of operators other than the incumbent while using the incumbent’s network. Our fixed-line telephony strategy is focused around value leadership, and we position our services as “anytime” or “any destination”. Our portfolio of calling plans include a variety of innovative calling options designed to meet the needs of our subscribers. In many of our markets, we provide product innovation, such as telephone apps that allow customers to make and receive calls from their fixed-line call packages on smart phones. In addition, we offer varying plans to meet customer needs and, similar to our mobile services, we use our telephony bundle options with our digital video and internet services to help promote our telephony services and flat rate offers are standard.
Liberty Global Group
Across Europe, our fixed-line and mobile telephony businesses are generally small compared to the existing business of the incumbent telephone companies. The incumbent telecommunication companies remain our key competitors but mobile operators and other
VoIP
operators, including ISPs, offering service across broadband lines are also significant competitors in these markets. Generally, we expect telephony markets to remain extremely competitive.
Due to the maturity of the telephony market, competition is particularly intense in all our markets with price often the deciding factor. To maintain or increase market share, we and our competitors focus on bundling telephony services with quality broadband offerings and other services. In each of our markets, we face competition with a dominant fixed-line telephony provider, most of which also have competitive mobile offers based on
LTE
services. In our largest markets, the key dominant telephony providers are BT (UK),
Deutsche Telekom
(Germany),
Proximus
(Belgium) and Swisscom (Switzerland). These telephony competitors are also the largest mobile operators in these markets based on number of
SIM
cards, except in Germany where Telefonica O2 is the largest.
LiLAC Group
In our Latin American and Caribbean markets, competition in the telephony and mobile services markets is also intense. In Chile,
VTR
faces competition from the incumbent telecommunications operator, Movistar, and other telecommunications operators. Movistar has substantial experience in providing telephony services, resources to devote to the provision of telephony services and long-standing customer relationships. Price is a key factor as are bundles with quality services. We distinguish our services by delivering reliable market leading internet access speeds with attractive bundled offers.
I-40
Movistar,
Claro
and Entel PCS Telecommunications SA are the primary companies that offer mobile telephony in Chile. In mid-2015, WOM S.A. entered the mobile services market through its acquisition of the Nextel Chile network. WOM S.A. is exerting significant competitive pressure in the mobile market with its very aggressive price offer. Such pricing is driving down sales and increasing churn in the mobile market. As an
MVNO
,
VTR
offers its mobile services on a standalone basis. To attract and retain customers,
VTR
focuses on its triple-play customer base, offering them postpaid mobile accounts at an attractive price.
With respect to mobile services, we face competition from Digicel in most of our
CWC
residential markets and Movistar and Claro in Panama. In addition, in the Bahamas, where
CWC
had previously been the only provider of mobile services, competition has increased significantly due to the commercial launch of mobile services by a competitor during the fourth quarter of 2016. We also face competition in the provision of broadband services from Cable Onda in Panama, Digicel in our Caribbean markets and Cable Bahamas in the Bahamas.
These companies all have competitive pricing on similar services and Digicel is also able to offer fixed-mobile convergence with its video, internet, mobile and telephony services. To attract and retain customers,
CWC
focuses on providing quality services and premium content, as well as converged services where customers can access content in and out-of-the home.
Regulatory Matters
Overview
Video distribution, broadband internet, fixed-line telephony and mobile businesses are regulated in each of the countries in which we operate. The scope of regulation varies from country to country, although in some significant respects regulation in European markets is harmonized under the regulatory structure of the European Union (
E.U.
).
Adverse regulatory developments could subject our businesses to a number of risks. Regulation, including conditions imposed on us by competition or other authorities as a requirement to close acquisitions or dispositions, could limit growth, revenue and the number and type of services offered and could lead to increased operating costs and property and equipment additions. In addition, regulation may restrict our operations and subject them to further competitive pressure, including pricing restrictions, interconnect and other access obligations, and restrictions or controls on content, including content provided by third parties. Failure to comply with current or future regulation could expose our businesses to various penalties.
Liberty Global Group
Austria, Belgium, Bulgaria, Croatia, Cyprus, the Czech Republic, Denmark, Estonia, Finland, France, Germany, Greece, Hungary, Ireland, Italy, Latvia, Lithuania, Luxembourg, Malta, the Netherlands, Poland, Portugal, Romania, Slovakia, Slovenia, Spain, Sweden and the
U.K.
are the Member States of the
E.U.
As such, these countries are required to harmonize certain of their laws with certain
E.U.
rules. In addition, other types of
E.U.
rules are directly enforceable in those countries without any implementation at the national level. Certain
E.U.
rules are also applicable across the European Economic Area, whose Member States are the
E.U.
Member States (excluding Croatia) as well as Iceland, Liechtenstein and Norway.
On June 23, 2016, the
U.K.
held a referendum in which voters approved, on an advisory basis, an exit from the
E.U.
commonly referred to as “
Brexit
”. The terms of any withdrawal are subject to a negotiation period that could last at least two years after the British government formally initiates a withdrawal process pursuant to Article 50 of the Treaty on Europe. The British government has indicated that it plans to trigger Article 50 and commence negotiations to determine the terms of the
U.K.
’s withdrawal from the
E.U.
by the end of March 2017. A withdrawal could, among other outcomes, disrupt the free movement of goods, services and people and capital between the
U.K.
and the
E.U.
, undermine bilateral cooperation in key geographic areas and significantly disrupt trade between the
U.K.
and the
E.U.
or other nations (including the U.S.) as the
U.K.
pursues independent trade relations. The initial impact of the announcement of
Brexit
caused significant volatility in global stock markets, including in the prices of our shares, as well as significant currency fluctuations that resulted in the strengthening of the U.S. dollar (our reporting currency) against foreign currencies in which we conduct business, namely the British pound sterling and the euro. The effects of
Brexit
could adversely affect our business, results of operations and financial condition.
In the broadcasting and communications sectors, there has been extensive
E.U.
-level legislative action. As a result, most of the markets in Europe in which our businesses operate have been significantly affected by the regulatory framework that has been developed by the
E.U.
Regulation in Switzerland, which is not a Member State of the
E.U.
and is not part of the European Economic Area, is discussed separately below, as well as regulation in certain Member States in which we face regulatory issues that may have a material impact on our business.
I-41
E.U. Communications Regulation
The body of
E.U.
law that deals with communications regulation consists of a variety of legal instruments and policies (collectively, the
Regulatory Framework
). The key elements of the
Regulatory Framework
are various legal measures and directives that require Member States to harmonize their laws, as well as certain other instruments and regulations that have direct effect without any specific adoption at the national level.
The
Regulatory Framework
primarily seeks open communication services in markets within Europe. It harmonizes the rules within the
E.U.
for the establishment and operation of electronic communication networks, including cable television and traditional telephony networks, and the offer of electronic communication services, such as telephony, internet and, to some degree, television services.
On December 18, 2009, the Official Journal of the
E.U.
published revisions to the
Regulatory Framework
. These revisions should have been transposed into the laws of the Member States before May 25, 2011, although in practice, this process is still ongoing in certain Member States.
Certain key provisions included in the current
Regulatory Framework
(including additional revisions since adoption) are set forth below. This description is not intended to be a comprehensive description of all regulation in this area.
|
•
|
Licensing and Exclusivity
.
The
Regulatory Framework
requires Member States to abolish exclusivities on communication networks and services in their territory and allow operators into their markets based on a simple registration. The
Regulatory Framework
sets forth an exhaustive list of conditions that may be imposed on communication networks and services. Possible obligations include, among other things, financial charges for universal service or for the costs of regulation, environmental requirements, data privacy and other consumer protection rules, “must carry” obligations, provision of customer information to law enforcement agencies and access obligations.
|
|
•
|
Significant Market Power
. Certain of the obligations allowed by the
Regulatory Framework
apply only to operators or service providers with “
Significant Market Power
” (defined below) in a relevant market. For example, the provisions of the Access Directive allow the National Regulatory Authority (
NRA
) in
E.U.
Member States to mandate certain access obligations only for those operators and service providers that are deemed to have
Significant Market Power
. For purposes of the
Regulatory Framework
, an operator or service provider will be deemed to have
Significant Market Power
where, either individually or jointly with others, it enjoys a position of significant economic strength affording it the power to behave to an appreciable extent independently of competitors, customers and consumers.
|
As part of the implementation of certain provisions of the
Regulatory Framework
, each Member State’s
NRA
is required to analyze certain markets predefined by the
E.U.
Commission to determine if any operator or service provider has
Significant Market Power
. Initially starting with 18 predefined markets, the
E.U.
Commission has currently recommended that there be four such predefined markets, which are subject to periodic review.
NRA
s may, however, continue to maintain their analysis of some of the markets from the previous list or perform analysis of markets not listed in the recommendation, which requires the
NRA
to prove that additional requirements, the so called three-criteria test, are met.
NRA
s might seek to define us as having
Significant Market Power
in any of these predefined markets or they may define and analyze additional markets. In the event that we are found to have
Significant Market Power
in any particular market, an
NRA
could impose certain conditions on us. Under the
Regulatory Framework
, the
E.U.
Commission has the power to veto a finding by an
NRA
of
Significant Market Power
(or the absence thereof), which power also applies with respect to market definition, in any market, regardless of whether it is a market predefined by the
E.U.
Commission or an additional market defined by an NRA. We have been found to have
Significant Market Power
in certain markets in which we operate and further findings of
Significant Market Power
are possible. In particular, we have been found to have
Significant Market Power
in the market for termination of calls on our network.
|
•
|
Video Services
.
The regulation of distribution, but not the content, of television services to the public is harmonized by the
Regulatory Framework
. Member States are allowed to impose on certain operators under their jurisdiction reasonable must carry obligations for the transmission of specified radio and television broadcast channels. Such obligations are required to be based on clearly defined general interest objectives, be proportionate and be transparent and subject to periodic review. We are subject to must carry regulations in all European markets in which we operate. Must carry regulations are significantly different among Member States. In some cases, these obligations go beyond what we believe is allowable under the
Regulatory Framework
. To date, however, the
E.U.
Commission has taken very limited steps to enforce
E.U.
law in this area, leaving must carry obligations intact in certain Member States. We do not expect the
E.U.
Commission or the Member States to curtail such obligations in the foreseeable future.
|
I-42
|
•
|
Net Neutrality/Traffic Management
.
In October 2015, the European Parliament adopted the regulation on the first E.U.-wide net neutrality regime. The regulation, which is directly applicable in all Member States, permits the provision of specialized services, optimized for specific content and subjects operators to reasonable traffic management requirements. The regulation also abolishes roaming tariffs beginning in June 2017.
|
On August 30, 2016, the Body of European Regulators for Electronic Communications (
BEREC
) issued guidelines for implementation of the regulation. Although the guidelines are non-binding, they represent the official base on which
NRA
s may interpret the regulation.
Regarding roaming, in order to ensure a smooth transition of the abolition of roaming surcharges in 2017, the regulation provided for a transition period beginning April 2016. During the transition period, surcharges are not to exceed the regulated maximum wholesale charges. In a simultaneous legislative process the
E.U.
Commission is expected to review the regulation on wholesale roaming charges in the first quarter of 2017.
On May 6, 2015, the
E.U.
Commission published its Digital Single Market strategy document. The strategy is an aggregation of many different policy areas with the purpose of creating a digital single market to expand jobs and stimulate growth. The strategy includes policy review in the areas of
E.U.
communications regulation, broadcasting law, copyright reform and anti-competitive geo-blocking practices.
On September 14, 2016, the
E.U.
Commission published a proposal for the European Electronic Communications Code, which would replace the Regulatory Framework. The proposal recognizes the need for greater incentives to boost private sector investment in very high capacity networks. The proposal maintains the key elements of the Regulatory Framework, notably market analysis with remedies only being imposed on operators with
Significant Market Power
. The proposal captures all types of services that are relevant to consumers, not only the traditional electronic communication services as captured under the Regulatory Framework but also OTT services. The proposal brings greater harmonization to the timetables for spectrum licensing and renewal that will encourage investment in mobile networks and will result in more advanced services. The adoption of the proposal for the European Electronic Communications Code and its implementation in to national laws by Member States is not expected before the third quarter of 2018.
Broadcasting Law
Although the distribution of video channels by a cable operator is within the scope of the
Regulatory Framework
, the activities of a broadcaster are harmonized by other elements of
E.U.
law, in particular the Audiovisual Media Services Directive (
AVMS
). Generally, broadcasts originating in and intended for reception within an
E.U.
Member State must respect the laws of that Member State. Pursuant to
AVMS
, however,
E.U.
Member States are required to allow broadcast signals of broadcasters established in another
E.U.
Member State to be freely transmitted within their territory, so long as the broadcaster complies with the law of their home state. This is referred to as the country of origin principle. Under
AVMS
, the country of origin principle applies also to non-linear services, such as
VoD
. Accordingly, we should be able, if we so elect, to offer our own
VoD
services across the European Economic Area based on the regulation of the country of origin. As a result, we could structure our business to have a single regulatory regime for all of our
VoD
services offered in Europe. In addition, when we offer third-party
VoD
services on our network, it should be the business of the third-party, in its capacity as provider of the services, and not us as the local distributor, that is regulated in respect of these services.
Although Member States were obligated to transpose the requirements of
AVMS
into national law, and this has generally been completed, the practical effect is still not clear. Uncertainty still remains about the proper treatment of
VoD
from a practical perspective. Thus, there can be no assurance that the requirements for
VoD
will operate in the manner described above in any individual Member State. As a result, we may face inconsistent and uncertain regulation of our
VoD
service in Europe.
AVMS
also establishes quotas for the transmission of European-produced programming and programs made by European producers who are independent of broadcasters.
As part of its Digital Single Market strategy, on May 25, 2016 the
E.U.
Commission published a proposal for the revision of the
AVMS
. The proposal maintains the key elements of
AVMS
- notably the country of origin principle and European works quota. The adoption of the proposal for the revision of the
AVMS
is expected in the second half of 2017. Once adopted, its implementation into national laws by Member States is proposed to take place no later than 12 months thereafter.
Under the Digital Single Market strategy, in December 2015, the
E.U.
Commission published a proposal for a regulation addressing the portability of online audiovisual content services. Under the proposal, providers of online audiovisual content services must allow subscribers who are temporarily present in any
E.U.
Member State to access and use those services. The intention of the proposed regulation is for subscribers to be able to enjoy the same out-of-home service in another Member State.
I-43
The adoption of the proposed regulation is not expected until the second half of 2017, and would become effective within 9 to12 months after adoption.
Other European Level Regulation
In addition to the industry-specific regimes discussed above, our European operating companies must comply with both specific and general legislation concerning, among other matters, data retention and electronic commerce. In December 2015, the
E.U.
approved the
E.U.
General Data Protection Regulation (
GDPR
) with respect to data protection and retention. The GDPR enhanced existing legal requirements through several new rules and includes stiff penalties for organizations that fail to comply. The GDPR will be directly applicable in all Member States commencing in 2018. In addition, following the adoption of the GDPR, the
E.U.
Commission published on January 11, 2017 a proposal for an e-Privacy regulation, replacing today’s e-Privacy Directive that regulates privacy related issues in the electronic communications sector. The adoption of this proposal is not expected before June 2018.
Our European operating companies are also subject to both national and European level regulations on competition and on consumer protection, which are broadly harmonized at the
E.U.
level. For example, while our operating companies may offer their services in bundled packages in European markets, they are sometimes not permitted to make a subscription to one service, such as cable television, conditional upon a subscription to another service, such as telephony. They may also face restrictions on the degree to which they may discount certain products included in the bundled packages.
The
E.U.
Commission is imposing more mandatory requirements and encouraging voluntary solutions regarding energy consumption of the telecommunications equipment we provide our customers. We have been participating in discussions and studies regarding energy consumption with the
E.U.
Commission and with experts working on their behalf. In addition, we are working with suppliers of our digital set-top boxes to lower power consumption, as well as looking at possibilities through software to lower the power consumption of the existing fleet of digital set-top boxes. We also worked with a large group of companies to create a voluntary agreement on set-top box power consumption as an alternative to regulation, which has been formally recognized by the
E.U.
Commission. Nevertheless, legislation in this area may be adopted that could adversely affect the cost and/or the functionality of equipment we deploy to customers.
Pursuant to a Regulation on standby power effective January 7, 2010 (the
Standby Regulation
), many devices are required to have either a low power standby mode or off mode, unless it is inappropriate to have either such mode on the device. For this purpose, our set-top boxes and certain other equipment are equipped with an off switch. Beginning in January 2013, the Standby Regulation imposed further requirements on power management on certain devices we purchase and/or develop. These devices, namely the
Horizon TV
set-top box and any future set-top boxes, must comply with such requirements, unless it can be argued such further requirements are inappropriate. These additional requirements have necessitated additional software developments for our equipment and reduces the functionality of our equipment, assuming the equipment’s default setting is maintained.
Furthermore in August 2013, the
E.U.
Commission issued an amendment to the Standby Regulation called Networked Standby (No 801/2013), which became effective as of January 1, 2015, with the aim of regulating, among others, the maximum power consumption of networked consumer equipment while in the so-called Networked Standby mode. These additional requirements may have an impact on our costs and the customer experience.
As part of the
E.U.
’s Radio Spectrum Policy Program, spectrum made available through the switch off of analog television has been approved for mobile broadband use beginning January 1, 2013. This spectrum, known as the “digital dividend”, is in the 700 - 862 MHz band. The terms under which this spectrum will become available will vary among the European countries in which we operate. Certain uses of this spectrum may interfere with services carried on our cable networks. If this occurs, we may need to: (1) avoid using certain frequencies on our cable networks for certain or all of our services, (2) make some changes to our networks, or (3) change the equipment that we deploy. In approving mobile broadband, however, the Radio Spectrum Policy Program states that the new mobile services must co-exist with existing services, such as cable and
DTT
, to avoid harmful interference. As a result, we are in ongoing discussions with relevant Member States and the
E.U.
Commission to be included in
LTE
mobile trials in order to develop mitigation techniques and to engage
NRA
s to launch regulatory dialog with equipment manufacturers and mobile operators to develop co-existing networks. We have also requested Member States and the
E.U.
Commission to prepare comprehensive national impact assessments when spectrum conditions are changed to ensure that the costs to prevent interference between the various services are balanced.
I-44
United Kingdom
In the
U.K.
, the Regulatory Framework is implemented through (1) the Communications Act 2003, which regulates all forms of communications technology, whether used for telecommunications or broadcasting, and (2) the Wireless Telegraphy Act 2006, which regulates radio communications in the
U.K.
(including spectrum, licensing arrangements, usage conditions and charges, license bidding and trading and enforcement and penalties). In addition, the Privacy and Electronic Communications Regulations 2003, as amended, implemented
E.U.
Directive 2002/58, which regulates the processing of personal data and the protection of privacy in the electronic communications sector.
Telecommunications companies in the
U.K.
, including
Virgin Media
, are also subject to regulation under the
U.K.
Broadcasting Acts 1990 and 1996 and other
U.K.
statutes and subordinate legislation, including the Competition Act 1998 and the Enterprise Act 2002. The
U.K.
Office of Communications (
Ofcom
) regulates both linear and on-demand programming, which is derived from the
E.U.
Audiovisual Media Services Directive.
Ofcom
is the key regulatory authority for the communications sector in which
Virgin Media
operates in the
U.K.
It is responsible for furthering the interests of citizens in relation to communications matters and furthering the interests of consumers in relevant markets where appropriate by promoting competition.
From 2017, Ofcom will also assume the responsibilities of regulating the BBC, a role currently undertaken by the BBC Trust.
The Competition and Markets Authority also has jurisdiction with respect to competition matters.
Broadband Expansion
. The
U.K.
government is attempting to drive the provision of super-fast broadband to at least 95% of the
U.K.
population by the end of 2017. To stimulate private investment in this endeavor, the
U.K.
government is using money from the publicly funded BBC license fee, under-spend from the Analogue TV Switch-Off Project and other sources of public investment. The state aid measure permitting this subsidy was renewed (and amended) in 2016 and is expected to result in up to an additional 1%-2% superfast coverage.
In the 2016 Autumn Statement, the
U.K.
government announced proposals for further funding, and other measures, targeted at supporting market rollout of full fiber and 5G services. Proposed measures include public funding for the creation of a match-funded “full fiber deployment” fund (indicative £400.0 million), business rate relief for the deployment of new full fiber networks from 2017 and public funding for a strategic program of full fiber and 5G trials (indicative £740.0 million). Little detail has been provided to date, but the government issued, on December 29, 2016, a call for input, seeking suggestions on how best to stimulate full fiber deployments, including, where appropriate, with the use of public funds.
In November 2015, the
U.K.
government announced that everyone will, by 2020, have a legal right to request a broadband connection of at least 10 Mbps regardless of where they live. The government intends to achieve this by introducing a broadband Universal Service Obligation (
USO
). The
USO
is aimed, in particular, at addressing the final 5% of the population in the
U.K.
without access to a broadband connection of a reasonable speed. The Department for Culture, Media & Sport commissioned
Ofcom
to undertake a detailed analysis of the key factors that will help inform the design of the
USO
. A report was issued to the
U.K.
government to this end on December 16, 2016. The
U.K.
government is considering the
Ofcom
report and is expected to set out its decision on the final USO structure and adopt legislation to implement the necessary legislation, in 2017.
Television and VoD Services
. In the
U.K.
,
Virgin Media
is required to hold individual licenses under the Broadcasting Acts 1990 and 1996 for any television channels (including barker channels and any electronic programme guides), which
Virgin Media
owns or operates and for the provision of certain other services on its cable television platform, such as electronic program guides. These television licensable content service (
TLCS
) licenses are granted and administered by
Ofcom
. Under these licenses, each covered service must comply with a number of
Ofcom
codes, including the Broadcasting Code, and with all directions issued by
Ofcom
. Breach of any of the terms of a TLCS license may result in the imposition of fines on the license holder and, ultimately, the license being revoked.
As a provider of an on-demand program service (
ODPS
),
Virgin Media
must comply with a number of statutory obligations in relation to “editorial content” and notify
Ofcom
of its intention to provide an ODPS. Failure to notify
Ofcom
or comply with the relevant statutory obligations may result in the imposition of fines or, ultimately, the prohibition on providing an ODPS.
Following a review by
Ofcom
, Sky’s wholesale must offer obligation, which regulates terms of the wholesale supply of Sky Sports 1 and 2 in standard definition and HD, was removed. The removal of this obligation was appealed by BT and on December 21, 2016, the Competition Appeal Tribunal issued a judgment denying BT’s appeal.
Strategic Review of Digital Communications
. In March 2015,
Ofcom
launched a strategic review of
U.K.
digital communications. A discussion document was published in July 2015, inviting stakeholder comment and input. Key focus areas for
Ofcom
were stated to be: investment and innovation, delivering widespread availability of services; sustainable competition;
I-45
empowering consumers; and, targeted regulation where necessary, deregulation elsewhere.
Virgin Media
responded to the discussion document emphasizing the importance of investment for competition, innovation and consumer interest. A key area of consideration is the future regulatory treatment of BT, in particular whether BT should be fully (structurally) separated, with the Openreach network division becoming a separate, independent company. Openreach is the operator of the backbone of Britain’s broadband internet network.
An “emerging thinking” document was published on February 25, 2016, setting out conclusions and
Ofcom
’s proposed policy position relating to a number of aspects of the
U.K.
regulatory regime. Key conclusions included: no structural separation of BT at the present time; an intention to improve quality of service across all providers; a requirement for BT to enhance its wholesale duct and pole access product; and an intention to advance further consumer protection measures. Later on July 26, 2016,
Ofcom
proposed a legal but not structural separation of Openreach. On November 29, 2016,
Ofcom
stated that it is proceeding with a formal notification to the
E.U.
Commission to require the legal separation of Openreach from BT. We expect this notification, preceded by a consultation, to be made in early 2017, unless
Ofcom
and BT otherwise reach agreement.
Regulation of Broadband Markets
. In 2017,
Ofcom
will commence its next triennial review of the Fixed Access markets, including the Wholesale Local Access market (incorporating physical or passive network access via methods such as LLU and duct access) and the Wholesale Broadband Access market (virtual or active network access via methods such as provision of wholesale managed service products). A key area of focus will be the regulation of BT’s FTTx based wholesale products (specifically the pricing thereof) and improving the existing physical infrastructure access (allowing third parties access to BT’s duct and pole estate). To this end, on December 6, 2016,
Ofcom
issued a consultation on making the physical infrastructure access more effective.
Ofcom
Review of Business Connectivity Markets
.
Ofcom
concluded its latest review of the
U.K.
business connectivity markets (leased lines and dedicated business connections, among others) in the spring of 2016.
Ofcom
found BT held
Significant Market Power
in certain markets and proposed consequential regulatory remedies. These remedies included an obligation on BT to provide access to its dark fiber. BT, CityFibre and TalkTalk have appealed
Ofcom
’s decision.
Virgin Media
has intervened in the appeal. This matter remains ongoing and a hearing is expected in 2017.
Mobile Service
. As an
MVNO
,
Virgin Media
is subject to
E.U.
regulations relating to retail prices for roaming services. These regulations: set limits on certain wholesale and retail tariffs for international mobile voice roaming,
SMS
tariffs and data roaming within the
E.U.
; provide for greater levels of transparency of retail pricing information; impose measures to guard against bill shock in respect of data roaming; and set maximum roaming rates within the
E.U.
A new regulation, effective June 2017, abolishes roaming tariffs in the
E.U.
(subject to addressing inconsistencies in underlying wholesale charges). Until then, roaming surcharges have been reduced significantly since April 2016.
Mobile termination charges applied by mobile network operators are regulated by
Ofcom
under a
Significant Market Power
charge control condition. Under
Virgin Media
’s
MVNO
agreement, these changes in mobile termination charges are passed on to
Virgin Media
.
Ofcom
has set mobile termination charges for the period of 2015-2018, with rates reducing to approximately half of their starting levels by the end of this period. As a result,
Virgin Media
has experienced a reduction in revenue from such charges, although with some off-setting reductions in cost.
Fixed voice termination
.
Virgin Media
has been designated as a provider with
Significant Market Power
on fixed voice termination. As a result, the rates that it charges other providers for termination on its network are subject to regulation. This requires, amongst other things, the provision of termination on fair and reasonable terms, conditions and charges - which must be no higher than BT’s regulated charges, unless certain conditions are met.
Germany
Germany has incorporated the
E.U.
laws into national laws, although under the German legal system competency is split between the Federal State (telecommunication law) and the German federal states (Bundesländer) (media law). The German Telecommunications Act broadly implemented the
Regulatory Framework
and covers the distribution of any signal by telecommunications networks encompassing television signals, internet data and telephony. The 2009 revisions to the
Regulatory Framework
by the
E.U.
were implemented by Germany in May 2012. The German Federal Network Agency (Bundesnetzagentur) is responsible
inter alia
for the regulation of the German telecommunications market. The Federal Cartel Office (the
FCO
), the national competition authority (Bundeskartellamt), plays an important role with respect to infrastructure and media regulation. The
FCO
has powers to address competition issues in all markets, although in some cases, competition issues will be addressed by the German Federal Network Agency.
Regulation of the media falls within the authority of the German federal states (Bundesländer). The media laws of all 16 federal states have been partially harmonized by the State Broadcasting Treaty (Rundfunkstaatsvertrag). The State Broadcasting Treaty establishes the main framework of the German regulation of broadcast. Nearly every German state has established its own
I-46
independent regulatory body, the state media authority (Landesmedienanstalt) for the regulation of the private broadcasting sector. The state media authorities are primarily responsible for licensing and supervision of commercial broadcasters and the allocation of transmission capacities for radio and television channels. They also have authority with respect to the regulation of channel carriage fees, conditional access systems, interfaces, the bundling of programs and price regulation.
The allocation and use of analog cable transmission capacities for both radio and television channels in Germany is governed by the must carry rules of the respective German federal states. The allocation of digital transmission capacities for digital television and radio channels is primarily governed by the must carry rules of the State Broadcasting Treaty. The media law in the states of Baden-Württemberg, North Rhine-Westphalia and Hesse where
Unitymedia
operates, require
Unitymedia
to carry at least 13, 23 and 24 analog channels, respectively, and also limits
Unitymedia
’s ability to convert these analog cable channels into digital channels.
The operation of conditional access systems for television services is governed by both the State Broadcasting Treaty and the German Telecommunications Act. Generally, operators must not unfairly obstruct or discriminate against broadcasters and other content providers through conditional access systems.
Unitymedia
has been declared an operator with
Significant Market Power
on the market for call termination on an individual fixed public telephone network. Since November 2013, reciprocal termination rates for exchanging calls via
Unitymedia
’s IP-interface have been imposed, which results in
Unitymedia
, like every other telecommunications provider in Germany, charging the interconnection rate of the incumbent telecommunications operator, Deutsche Telekom. The wholesale tariffs for call termination on the fixed public telephone networks is set at 0.0024 euro/minute, which rate expired on December 31, 2016. On December 7, 2016, the German Federal Network Agency published a draft decision regarding the wholesale tariffs for call termination on the public telephone network provided at a fixed location reducing such termination rates for Deutsche Telekom to 0.001 euro/minute effective January 1, 2017. Although
Unitymedia
is not regulated for interconnection via the SS7 interface, we expect the new level of termination rates will be applicable to
Unitymedia
in 2017 with respect to calls terminating on its NGN interface.
The Netherlands
The Netherlands’ electronic communications law broadly implements the
Regulatory Framework
. Pursuant to the electronic communications law, the Autoriteit Consument & Markt (
ACM
), the Netherlands
NRA
, performed a market analysis to determine which, if any, operator or service provider has
Significant Market Power
. In December 2011,
ACM
completed its analysis of the television market and concluded that there were no grounds for regulation of that market. As a result, no new regulations relating to the television market may be proposed without a new analysis.
On August 5, 2013,
ACM
published its latest market analysis decision on call termination, which combines both the fixed termination market and the mobile termination market. The new tariffs became effective September 1, 2013. The decision was appealed by various operators, including
Ziggo
, and on August 27, 2013, the Dutch Supreme Administrative Court decided in a preliminary decision that the decrease of cap charges should be less steep than
ACM
had initially determined. These revised tariffs apply until the Dutch Supreme Administrative Court arrives at a final decision in the appeal proceedings on the merits. The Dutch Supreme Administrative Court ruled on October 15, 2014 to pose prejudicial questions to the European Court of Justice. After an Advocate General opinion, the European Court of Justice ruled on September 15, 2016 that deviation from the European Commission’s 2009 Recommendation on Termination Rates is only possible if justified by national circumstances. The hearing at the Dutch Supreme Administrative Court was held on January 11, 2017, and we expect the ruling in the next few months.
On January 1, 2014, the revised must carry obligations became effective. The revised must carry obligations do not only apply to cable operators, as was previously the case, but also apply to all providers of analog and digital program packages based on the principle of technology neutrality. Providers of digital program packages with 100,000 or more subscribers are subject to the obligation to provide at least 30 television channels, including six public television broadcasting channels as a must carry obligation, a limited amount of regional and local television broadcasting channels and a number of digital radio broadcasting channels. In addition, all providers of analog program packages with 100,000 or more subscribers must include at least 15 television channels, including five public broadcasting channels as a must carry obligation, a limited amount of regional and local television broadcasting channels and some analog radio broadcasting channels. The Dutch Media Authority can grant a (conditional) exemption from the obligation if the must carry obligations listed above give rise to disproportionate costs for the network operator, an impediment to innovation or other unreasonable outcomes.
There is no regulated financing mechanism in place between network operators and broadcasters. Commercial and public program providers must negotiate with network operators regarding transmission fees.
I-47
In July 2015, the Dutch incumbent telecommunications operator filed an appeal against the
E.U.
Commission regarding its decision to approve the acquisition of Ziggo, which we completed in November 2014. We are not a party to the appeal and we do not expect that the filing of this appeal to have any impact on the development of our operations in the Netherlands, including our contribution of
Ziggo Group Holding
and its subsidiaries to VodafoneZiggo.
Following the
E.U.
Commission’s clearance of our acquisition of Ziggo, on October 31, 2014,
ACM
published as part of the fourth round of market analysis a draft of market analysis decision on LLU. Initially,
ACM
found a risk of joint dominance by KPN and Ziggo in the related retail broadband market. Later, after notification to the
E.U.
Commission and further consultations, ACM published its final decision on December 17, 2015. In the final decision,
ACM
no longer found a risk of joint dominance for KPN and Ziggo at the retail level but still concluded that there is a risk of consumer harm due to prices being set above the competitive equilibrium. At the wholesale level,
ACM
concluded that KPN is dominant on the wholesale market and imposed obligations on KPN.
ACM
concluded that Ziggo is not part of the relevant LLU market and that KPN is dominant on that market. As a result,
ACM
imposed obligations on KPN only.
ACM
has indicated that as a result of the formation of VodafoneZiggo, it will start working on a new analysis of the LLU market in 2017.
Belgium
Belgium has broadly transposed the
Regulatory Framework
into law. According to the electronic communications law of June 13, 2005, the Belgisch Instituut voor Post en Telecommunicate (the
BIPT
), the Belgian
NRA
, should perform a market analysis to determine which, if any, operator or service provider has
Significant Market Power
. In addition, the Federal Parliament prepared legislation to transpose the 2009 revisions to the
Regulatory Framework
, which became effective as of August 4, 2012.
Telenet
has been declared an operator with
Significant Market Power
on the market for call termination on an individual fixed public telephone network. Since April 1, 2012, reciprocal termination rates have been imposed, which results in
Telenet
charging the interconnection rate of the incumbent telecommunications operator,
Proximus
. On August 30, 2016, the
BIPT
published its final decision regarding the wholesale tariffs for call termination on the public telephone network provided at a fixed location. As of November 1, 2016, the wholesale tariffs for call termination on the fixed public telephone networks is set at 0,092 eurocent/minute. This decision has been appealed before the Court of Appeal in Brussels by
Proximus
and 3StarsNet and a judgment is expected during the first half of 2017.
Although no determination has been made on whether
Telenet
as an
MVNO
has
Significant Market Power
on the market for call termination on individual mobile networks, its rates have been affected by rate limitations implemented by
BIPT
. In June 2010,
BIPT
imposed a steep rate reduction that resulted in (1) an initial 45% decline effective August 1, 2010, over the then average rate and (2) a further decline in January 2013 that was approximately 79% less than the average rate implemented on August 1, 2010. As of January 1, 2013, mobile termination rates have been set by
BIPT
at €1.08 cents per minute, and to date, 2015 rates have not been set. On September 14, 2015,
BIPT
published its draft decision on the relevant market for “call termination on individual mobile networks”.
Telenet
, as an
MVNO
, has been designated in the draft decision as having
Significant Market Power
. Following its acquisition of BASE,
Telenet
will be designated as having a
Significant Market Power
by
BIPT
. In the draft decision,
BIPT
adopts a bottom-up long run incremental cost model to calculate tariffs for call termination on individual mobile networks, resulting in a nominal value of €0.81 per minute in 2015 and a declining glide path up and until 2020.
BIPT
organized public consultation on this draft decision, which was open until November 14, 2015. This draft decision has not yet been submitted to the
E.U.
Commission for notification. A final decision is expected during the first half of 2017.
In December 2010,
BIPT
and the regional regulators for the media sectors (together, the
Belgium Regulatory Authorities
) published their respective draft decisions reflecting the results of their joint analysis of the broadcasting market in Belgium. The Belgium Regulatory Authorities adopted a final decision on July 1, 2011 (the
July 2011 Decision
) with some minor revisions. The regulatory obligations imposed by the July 2011 Decision include (1) an obligation to make a resale offer at “retail minus’’ of the cable analog package available to third-party operators (including
Proximus
), (2) an obligation to grant third-party operators (except
Proximus
) access to digital television platforms (including the basic digital video package) at “retail minus”, and (3) an obligation to make a resale offer at “retail minus’’ of broadband internet access available to beneficiaries of the digital television access obligation that wish to offer bundles of digital video and broadband internet services to their customers (except
Proximus
).
In February 2012,
Telenet
submitted draft reference offers regarding the obligations described above, and the Belgium Regulatory Authorities published the final decision on September 9, 2013.
Telenet
has implemented the access obligations as described in its reference offers and, as of March 1, 2016,
Orange Belgium
NV (
Orange Belgium
), formerly known as Mobistar SA, launched a commercial offer combining a cable TV package and broadband internet access for certain of their mobile customers. In addition, as a result of the November 2014 decision by the Brussels Court of Appeal described below, on November 14, 2014,
Proximus
submitted a request to Telenet to commence access negotiations. Telenet contests this request and has asked the Belgium Regulatory Authorities to assess the reasonableness of the
Proximus
request. The timing for a decision regarding this assessment by the Belgium Regulatory Authorities is not known.
I-48
On December 14, 2015, the
Belgium Regulatory Authorities
published a draft decision, which amended previously-issued decisions, and sets forth the “retail minus” tariffs of minus 26% for basic television (basic analog and digital video package) and minus 18% for the bundle of basic television and broadband internet services during an initial two-year period. Following this two-year period, the tariffs would change to minus 15% and 7%, respectively. The draft decision was notified to the
E.U.
Commission and a final decision was adopted on February 19, 2016. A “retail minus” method of pricing involves a wholesale tariff calculated as the retail price for the offered service by
Telenet
, excluding value added tax (
VAT
) and copyrights, and further deducting the retail costs avoided by offering the wholesale service (such as costs for billing, franchise, consumer service, marketing and sales).
Telenet
filed an appeal against the July 2011 Decision with the Brussels Court of Appeal. On November 12, 2014, the Brussels Court of Appeal rejected
Telenet
’s appeal and accepted
Proximus
’s claim that
Proximus
should be allowed access to
Telenet
’s, among other operators, digital television platform and the resale of bundles of digital video and broadband internet services. On November 30, 2015,
Telenet
filed an appeal of this decision with the Belgian Supreme Court. In 2014,
Telenet
and wireless operator
Orange Belgium
each filed an appeal with the Brussels Court of Appeal against the initial retail minus decision. These appeals are still pending. On April 25, 2016,
Telenet
also filed an appeal with the Brussels Court of Appeals challenging the February 19, 2016 retail minus decision. There can be no certainty that
Telenet
’s appeals will be successful.
The July 2011 Decision aims to, and in its application may, strengthen
Telenet
’s competitors by granting them resale access to
Telenet
’s network to offer competing products and services notwithstanding
Telenet
’s substantial historical financial outlays in developing the infrastructure. In addition, any resale access granted to competitors could (1) limit the bandwidth available to
Telenet
to provide new or expanded products and services to the customers served by its network and (2) adversely impact
Telenet
’s ability to maintain or increase its revenue and cash flows. The extent of any such adverse impacts ultimately will be dependent on the extent that competitors take advantage of the resale access ultimately afforded to
Telenet
’s network and other competitive factors or market developments.
Switzerland
Switzerland has a regulatory system that partially reflects the principles of the
E.U.
, but otherwise is distinct from the European regulatory system of telecommunications. The Telecommunications Act (
Fernmeldegesetz
) regulates, in general, the transmission of information, including the transmission of radio and television signals. Most aspects of the distribution of radio and television, however, are regulated under the Radio and Television Act (
Bundesgesetz über
Radio und Fernsehen
). In addition, the Competition Act, the Date Protection Act and the Act on the Surveillance of Post and Telecommunications are potentially relevant to our business. With respect to energy consumption of electronic home devices, the Energy Act and the revised Energy Ordinance are applicable to set-top boxes as described below.
Under the Telecommunications Act, any provider of telecommunication services needs to register with the Federal Office of Communications. Dominant providers have to grant access to third parties, including LLU access; however, it is restricted to the copper wire network of the incumbent,
Swisscom
. Therefore, such unbundling obligations do not apply to our business in Switzerland and other cable operators. Also, any dominant provider has to grant access to its ducts, subject to sufficient capacity being available in the relevant duct. At this time, only
Swisscom
has been determined to be dominant in this regard. Dominant operators are obliged to provide interconnection and all providers of services forming part of the universal service in Switzerland have to ensure interoperability of services.
In regards to call termination as part of interconnection agreements, Swisscom as market dominant provider, must offer these services at cost-oriented prices and disclose the conditions and prices for their individual access services. In interconnection agreements with Swisscom, reciprocal termination rates are imposed. The Federal Council has suggested that the current Telecommunications Act be revised. The Federal Council plans to introduce measures to allow for easier access to the incumbent’s network, better consumer protection (decreasing roaming fees, unbundling of products, measures to prevent spoofing) and a change to the regulatory regime giving the Federal Communications Commission partial ex officio rights to impose obligations on market dominant providers. Further, the Federal Council will implement consumer and youth protection measures. The topic of regulated net neutrality may be introduced in the revision. In addition, it is expected that the conditions for a national broadband rollout will be improved by introducing access obligations to the ducts of local utilities. The proposal is expected by September 2017, but would not be legally binding prior to 2020.
Under the Radio and Television Act and the corresponding ordinance, cable network operators are obliged to distribute certain programs that contribute in a particular manner to media diversity. The Federal Government and the Federal Office of Communications can select up to 25 programs that have to be distributed without the cable operator being entitled to compensation. Since January 1, 2015, those programs must no longer be broadcasted in analog.
I-49
Effective August 1, 2016, the Federal Council adapted its regulation on imposing power thresholds for set-top boxes to
E.U.
-levels. As a result, Switzerland will have the same power thresholds as member countries of the
E.U.
In regards to lawful interception, the Federal Act on the Surveillance of Post and Telecommunications was finished in Swiss Parliament’s Spring Session 2016. Changes in the respective ordinance will be discussed in Parliament in Spring 2017. Relevant issues for us are automated information disclosure and identification of all clients by ID as this would mean mandatory changes of our ordering processes.
In September 2016, the Intelligence Agencies Act was approved by the Swiss population. For Telecommunications service providers, the Intelligence Agencies Act contemplates new obligations regulating cable traffic. The respective ordinance containing details of the implementation will be under consultation during the first quarter of 2017.
A revised version of the Data Protection Act is currently under public consultation until April 2017. The revised version foresees more transparency regarding the processing of data, for example by reinforcing the information duties when processing personal data. Furthermore, the new version follows the developments in the
E.U.
LiLAC Group
CWC
The video, broadband and telephony services provided by
CWC
are subject to regulation and enforcement by various governmental entities in each of the jurisdictions such services are provided. The scope and reach of these regulations are distinct in each market. Generally,
CWC
provides services in accordance with licenses and concessions granted by national authorities pursuant to national telecommunication legislation and associated regulations. Certain of these regulatory requirements are summarized below.
As the incumbent telecommunications provider in many of its jurisdictions,
CWC
is subject to significant regulatory oversight with respect to the provision of fixed-line and mobile telephony services. Generally, in these markets,
CWC
operates under a government issued license or concession that enables it to own and operate its telecommunication networks, including the establishment of wireless networks and the use of spectrum. These licenses and concessions are typically non-exclusive and have renewable multi-year terms that include competitive, qualitative and rate regulation. Licenses and concessions are scheduled to expire over the next two years in Jamaica, Cayman Islands and Barbados.
Rate regulation of
CWC
’s telephony services typically includes price caps that set the maximum rates CWC may charge to customers, or legislation that requires consent from a regulator prior to any price increases. In addition, all regulators determine and set the rates that may be charged by all telephony operators, including
CWC
, for interconnect charges, access charges between operators for calls originating on one network that are completed through connections with one or more networks of other providers, and charges for network unbundling services. In addition, in certain markets, regulators set, or are seeking to set, mobile roaming rates.
In recent years, a number of markets in which
CWC
operates have demonstrated an increased interest in regulating various aspects of broadband internet services due to the increasing importance and availability of high speed broadband. As broadband internet access has become a national priority for many of
CWC
’s markets, national regulators have demonstrated an increased focus on the issues of network resilience, broadband affordability and penetration, quality of services and consumer rights. Certain regulators are also seeking to mandate third-party access to
CWC
’s network infrastructure, including dark fibre and landing stations, as well as to regulate wholesale services and prices.
As an example, the Eastern Caribbean Telecommunications Authority (
ECTEL
), the regulatory body for telecommunications in five Eastern Caribbean States (Commonwealth of Dominica, Grenada, St. Kitts and Nevis, Saint Lucia, St. Vincent and the Grenadines), has adopted an Electronic Communications Bill that may have a material adverse impact on
CWC
’s operations in the ECTEL member states. The proposed Electronic Communications Bill includes provisions relating to:
|
•
|
net neutrality principles mandating equal access to all content and applications regardless of the source and without favoring, degrading, interrupting, intercepting, blocking access or throttling speeds;
|
|
•
|
subscription television rate regulation;
|
|
•
|
regulations implementing market dominance rules;
|
|
•
|
network unbundling at regulated rates; and
|
I-50
|
•
|
mandated unbundled access to all landing station network elements at cost-based rates.
|
We currently cannot determine the impact these provisions will have on our operations because national regulators are required to conduct extensive market reviews before adopting specific measures. Moreover, while we expect the legislation will be enacted during 2017, the bill will not become law in any individual ECTEL state until implementing legislation has been adopted by that state. As such, the timing and ultimate effect of the bill is unclear.
In Panama, as a result of a public consultation process, we expect the regulator to issue new guidelines for the Internet Public Service, establishing new quality goals for this service.
In addition to rate regulation, several markets in which CWC operates have imposed, or are considering imposing, regulation designed to further encourage competition, including introducing requirements related to unbundling, network access to third parties, and local number portability (
LNP
). LNP has been implemented in Panama, the Cayman Islands and Jamaica and is currently being contemplated or implemented in other jurisdictions, including Barbados, the Bahamas and Trinidad and Tobago.
The pay television service provided in certain
CWC
markets is subject to, among other things, subscriber privacy regulations and must-carry and retransmission consent rights of broadcast stations.
CWC
is subject to universal service obligations in a number of markets. These obligations vary in specificity and extent, but they are generally related to ensuring widespread geographic coverage of networks and that the populations of
CWC
’s individual markets have access to basic telecommunication services at minimum quality standards. In a number of cases,
CWC
is required to support universal access/service goals through contributions to universal service funds or participate in universal service related projects.
In addition to the industry-specific regimes discussed above,
CWC
’s operating companies must comply with both specific and general legislation concerning, among other matters, data retention, consumer protection and electronic commerce. These operating companies are also subject to national level regulations on competition and on consumer protection.
The
CWC Acquisition
triggered regulatory approval requirements in certain jurisdictions in which
CWC
operates. The regulatory authorities in certain of these jurisdictions, including the Bahamas, Jamaica, Trinidad and Tobago, the Seychelles and the Cayman Islands, have not completed their review of the
CWC Acquisition
or granted their approval. While we expect to receive all outstanding approvals, such approvals may include binding conditions or requirements that could have an adverse impact on
CWC
’s operations and financial condition.
In Trinidad and Tobago,
CWC
was required by Telecommunications Authority of Trinidad and Tobago (
TATT
), in connection with TATT’s approval of
CWC
’s acquisition of Columbus International, to dispose of its 49% shareholding in the Telecommunications Services of Trinidad and Tobago Limited (
TSTT
). The disposal of
CWC
’s stake in TSTT is not complete and the deadline set by TATT for such completion has been extended until the end of March 2017. We may not be able to complete the sale of TSTT or realize the full value of TSTT from our divestiture due to the circumstances of the sale. The stake in TSTT is currently held for sale.
Chile
VTR
is subject to regulation and enforcement by various governmental entities in Chile including the Chilean Antitrust Authority, the Ministry of Transportation and Telecommunications (the
Ministry
) through the Chilean Undersecretary of Telecommunications (
SubTel
), the National Television Council (
CNTV
) and the National Consumer Service (
Sernac
).
In addition to the specific regulations described below,
VTR
is subject to certain regulatory conditions which were imposed by the Chilean Antitrust Authority in connection with
VTR
’s combination with Metrópolis Intercom SA in April 2005. These conditions are indefinite and include, among others, (1) prohibiting
VTR
and its control group from participating, directly or indirectly through a related person, in Chilean satellite or microwave television businesses, (2) prohibiting
VTR
from obtaining exclusive broadcast rights, except for specific events, and (3) requiring
VTR
to offer its broadband capacity for resale of internet services on a wholesale basis.
Video
. The provision of pay television services requires a permit issued by the
Ministry
. Cable pay television permits are granted for an indefinite term and are non-exclusive. As such permits do not involve radio electric spectrum, they are granted without ongoing duties or royalties.
VTR
has permits to provide cable pay television services in the major cities, including Santiago, and in most of the medium-sized markets in Chile.
I-51
Cable television service providers in Chile are free to define the channels and content included in their services and are not required to carry any specific programming, except as described below. However,
CNTV
may impose sanctions on providers who are found to have run programming containing excessive violence, pornography or other objectionable content. Pay television operators are directly responsible for violation of such prohibitions. Additionally, the Television Act requires pay television operators to offer a certain quota of cultural content and to distribute public interest campaigns.
The Television Act establishes a retransmission consent regime between broadcast television concessionaires and pay television operators. This regime provides that once a broadcast operator achieves digital coverage of 85% of the population within its concession areas, the broadcast operator may require that pay television operators enter into an agreement for the retransmission of its digital signal. In addition, the Television Act requires that the technical or commercial conditions imposed by broadcast operators not discriminate among pay television operators. Also, the Television Act establishes a must carry regime requiring pay television operators to distribute up to four local broadcast television channels in each operating area. The channels that must be carried by any particular pay television operator are to be selected by
CNTV
. The full implementation of the retransmission and must carry regimes are still pending.
VTR
’s ability to change its channel lineup is restricted by an agreement reached with Sernac in July 2012 and the general regulation established by
SubTel
in February 2014 (by the Telecommunication Services General Rulemaking). This framework allows
VTR
to change one or more channels from its lineup after a 60-day notice period to its subscribers. In such cases,
VTR
shall offer a channel of similar content and quality or a proportional compensation. Despite this, after certain channel adjustments were applied in July 2016, the excluded programmers as well as social media have questioned
VTR
’s ability to unilaterally modify its channel grid, arguing that content and quality of new channels should be identical to the excluded channels. A final position on this issue is pending.
Internet
. A law on internet neutrality prohibits “arbitrary blockings” of legal content, applications or services and the provision of differentiated service conditions according to the origin or ownership of the content or service provided through the internet. Additionally, the law authorizes
ISP
s to take measures to ensure the privacy of their users and provide virus protection and safety processes over their network, as long as these measures do not infringe antitrust laws. Additional measures have been implemented, including obligations related to consumer information, traffic management policies, internet quality of service requirements and notices required by law concerning the effective maximum and minimum traffic speeds offered under internet access plans.
In order to protect the constitutional rights of privacy and safety of communications,
ISP
s are prohibited from undertaking surveillance measures over data content on their networks. Also, special summary proceedings have been created in order to safeguard intellectual property rights against violations committed through networks or digital systems. These proceedings include measures designed to withdraw, disqualify or block infringing content in the
ISP
’s network or systems. The law also provides for the right of intellectual property owners to judicially request from
ISP
s the delivery of necessary information to identify the provider of infringing content.
A bill is being discussed in the Congress, which would, if enacted, impose on fixed and mobile
ISP
s an obligation to guarantee a minimum broadband throughput based on the offered speed. The proposed bill would also require
ISP
s to provide its subscribers a certified measurement tool allowing them to verify this minimum service level and subject the
ISP
s to fines of penalties if the service level is not fulfilled. We expect this bill will be passed during the second quarter of 2017.
Fixed-Line Telephony and Mobile Services
. The provision of fixed-line telephony and mobile services requires a public telecommunications service concession. With respect to mobile services, in 2009,
SubTel
awarded
VTR
a license for 30 MHz of spectrum in the 1700/2100 MHz frequency band for the provision of wireless telephony services. The license has a 30-year renewable term. In 2012,
VTR
transferred this license to its affiliate VTR Wireless SpA (
VTR Wireless
), which is now a subsidiary of
VTR
known as
VTR
Comunicaciones SpA. On January 15, 2014,
SubTel
initiated a proceeding against
VTR Wireless
based on having allegedly “altered an essential element of its concession, particularly the type of service”. In this proceeding,
SubTel
asserted that
VTR Wireless
is not in compliance with the terms of such wireless license.
SubTel
alleged that the terms of the wireless license require
VTR Wireless
to comply with certain minimum network coverage and traffic levels.
VTR
disagreed with
SubTel
’s assertions regarding the terms of the wireless license and contested such assertions vigorously. The maximum possible sanctions include “the termination of the concession”. The final ruling regarding this case is still pending.
VTR
has concessions to provide fixed-line telephony in most major and medium-sized markets in Chile. Telephony concessions are non-exclusive and have renewable 30-year terms. The original term of
VTR
’s fixed-line telephony concessions expires in November 2025. Long distance telephony services are considered intermediate telecommunications services and, as such, are also regulated by the
Ministry
.
VTR
has concessions to provide this service, which is non-exclusive, for a 30-year renewable term expiring in September 2025.
I-52
There are no universal service obligations in Chile. However, local service concessionaires are obligated to provide telephony service to all customers that are within their service area or are willing to pay for an extension to receive service. All local service providers, including
VTR
, must give long distance telephony service providers equal access to their network connections at regulated prices and must interconnect with all other public service concessionaires whose systems are technically compatible.
As a general rule, fixed-line telephony service providers are free to establish the rates directly charged to their customers, unless the Chilean Antitrust Authority concludes that due to a lack of sufficient competition in the market, rates should be fixed by
SubTel
. However,
SubTel
sets the maximum rates that may be charged by each operator for interconnect charges, access charges between operators for calls originating on one network that are completed through connections with one or more networks of other providers, and charges for network unbundling services. Rate regulation on interconnection charges is applicable to all fixed-line and mobile telephony companies, including
VTR
. The determination of the maximum rates that may be charged by operators for their fixed-line or mobile services are made on a case-by-case basis by
SubTel
and are effective for five years. The next
VTR
tariff setting is in process, which will define some of
VTR
’s tariffs from June 2017 to June 2022.
Other Chilean Regulation
|
•
|
Price Increase
.
The Consumer Rights Protection Law contains provisions that require that any raise in rates exceeding inflation must be previously accepted and agreed to by subscribers. Although VTR disagrees with this interpretation, in July 2012, VTR reached an agreement with Sernac that permits VTR to make adjustments to its published prices twice per year to adjust for inflation, except those services that are subject to rate regulation. VTR is generally prohibited from increasing the rates over the inflation adjustment. VTR may, however, cancel a subscriber’s contract after 12 months and propose a new contract with new rate provisions. Once a year VTR may propose to its existing subscribers additional changes to their rates, which must be accepted by the subscriber for the rates to go into effect.
|
|
•
|
Bundling
.
On December 18, 2012, the Chilean Antitrust Authority issued its regulation governing the on-net/off-net pricing practice in the mobile industry and the offering of bundled telecommunication services. Pursuant to the terms of this regulation, as revised by the Chilean Supreme Court, mobile services may be sold jointly with fixed-line services. However, promotional discounts were not permitted for these double-play offers. As for traditional bundling over the same platform (
e.g.
, bundled fixed-line services such as our double- and triple-play packages, or bundled mobile services), this regulation provides that such services may be bundled, subject to certain price limitations. These limitations require that the total price for a bundle must be greater than the standalone price for the most expensive service included in the bundle. Also, when three or more services are bundled, the price for the bundle must be greater than the sum of the standalone prices for each service in the bundle, excluding the lowest priced service.
|
|
•
|
Telecommunication Services Proposal
.
In February 2014,
SubTel
published a General Telecommunication Services Ruling that regulates the offer of telecommunication services, including voice, internet access, and pay television, either alone or in bundles, from a consumer protection point of view. The regulation introduced service billing, significant changes in contracts with customers, requirements regarding compensation in case of service failure, and rules regarding treatment of customers’ personal information.
|
|
•
|
Minimum Standards on Quality of Service and Operation
. From August 5 to September 4, 2013,
SubTel
submitted for public comment a draft of the Technical Fundamental Plan on Maintenance and Public Service Telecommunications Network Managing. This draft seeks to impose minimum standards on quality of service and operation of telecommunications networks, in general, and in some particular services: voice services; text and multimedia messages services; data transmission services; minimum coverage for mobile services; and digital terrestrial television minimum coverage. We are uncertain when
SubTel
will publish the final version of the plan.
|
|
•
|
Consumer’s Rights Protection Law Amendment
. A bill is being discussed at Congress assigning significant new powers to Sernac, including a material increase of fines and compensations. The current law acknowledges that legal regulations imposed on specific business activities (such as the Telecommunications Act) must prevail over the Consumer’s Rights Protection law. However, it is still uncertain how or whether Sernac and
SubTel
will redefine their respective scope.
|
Puerto Rico
We are subject to regulation in Puerto Rico by various governmental entities at the Puerto Rico and the
U.S.
federal level, including the Federal Communications Commission (
FCC
). The Puerto Rico Telecommunications Regulatory Board (
TRB
), which was established in 1996, has primary regulatory jurisdiction in Puerto Rico at the local level and is responsible for awarding franchises to cable operators for the provision of cable service in Puerto Rico and regulating cable television and telecommunications services.
I-53
Our business in Puerto Rico is subject to comprehensive regulation under the United States Communications Act of 1934, as amended (the
Communications Act
), which regulates communication, telecommunication and cable television services. The Communications Act also provides the general legal framework for, among other things, the provision of telephone services, services related to interconnection between telephone carriers, and television, radio, cable television and direct broadcast satellite services.
The
FCC
and/or the TRB have the authority to impose sanctions, including warnings, fines, license revocations and, in certain specific cases, termination of the franchise, although license revocation and franchise termination are rare. The Communications Act specifies causes for the termination of
FCC
licenses, including, for example, the failure to comply with license requirements and conditions or to pay fines or fees in a timely manner. Such sanctions by the TRB and/or
FCC
can be appealed to, and reviewed by, Puerto Rican courts and
U.S.
federal courts.
In Puerto Rico, antitrust regulation is governed by the U.S. Sherman Act, other federal antitrust legislation, and the Puerto Rico Anti-Monopoly Law. In particular, the Sherman Act seeks to prevent anti-competitive practices in the marketplace and requires governmental review of certain business combinations, among other things. See note 17 to our consolidated financial statements included in Part II of this Annual Report on Form 10-K. The Puerto Rico Anti-Monopoly Law substantially parallels the Sherman Act and authorizes the Puerto Rico Department of Justice to investigate and impose competition-related conditions on transactions.
Puerto Rico Law 5 of 1973, as amended, created the Puerto Rico Department of Consumer Affairs, which regulates marketing campaigns, publicity, and breach of service contracts, and prohibits false advertising. The Puerto Rico Telecommunications Act of 1996 (
Law 213
), which created the TRB, requires that rates for telecommunication services be cost-based, forbids cross-subsidies and focuses on encouraging, preserving and enforcing competition in the cable and telecommunications markets. Although Law 213 does not require us to obtain any approval of rate increases for cable television or telecommunication services, any such increases must be in compliance with Law 213’s requirements, including prior notification to the TRB before such increases take effect.
The video, internet and fixed-line telephony services that we provide are all subject to regulation:
|
•
|
Video
.
The provision of cable television services requires a franchise issued by the TRB. Franchises are subject to termination proceedings in the event of a material breach or failure to comply with certain material provisions set forth in the franchise agreement governing a franchisee’s system operations, although such terminations are rare. In addition, franchises require payment of a franchise fee as a requirement to the grant of authority. Franchises establish comprehensive facilities and service requirements, as well as specific customer service standards and monetary penalties for non-compliance. Franchises are generally granted for fixed terms of up to ten years and must be periodically renewed.
|
Our pay television service is subject to, among other things, subscriber privacy regulations and must-carry and retransmission consent rights of broadcast stations. The Communications Act and FCC rules govern aspects of the carriage relationship between broadcast television stations and cable companies. To ensure that every qualifying local television station can be received in its local market without requiring a cable subscriber to switch between cable and off-air signals, the FCC allows every qualifying full-power television broadcast station to require that all local cable systems transmit that station’s primary digital channel to their subscribers within the station’s market (the “must-carry” rule) pursuant to the Cable Television Consumer Protection and Competition Act of 1992. Alternatively, a station may elect every three years to forego its must carry rights and seek a negotiated agreement to establish the terms of its carriage by a local cable system, referred to as retransmission consent.
|
•
|
Internet
.
We offer high-speed internet access throughout our entire footprint. In March 2015, the FCC issued an order classifying mass-market broadband internet access service as a “telecommunications service”, changing its long-standing treatment of this offering as an “information service”, which the FCC traditionally has subjected to limited regulation. The rules adopted by the FCC prohibit, among other things, broadband providers from: (1) blocking access to lawful content, applications, services or non-harmful devices; (2) impairing or degrading lawful internet traffic on the basis of content, applications, services or non-harmful devices; and (3) favoring some lawful internet traffic over other lawful internet traffic in exchange for consideration. In addition, the FCC prohibited broadband providers from unreasonably interfering with users’ ability to access lawful content or use devices that do not harm the network, or with edge providers’ ability to disseminate their content. The FCC also imposed more detailed disclosure obligations on broadband providers than were previously in place, which were approved by the Office of Management and Budget in late 2015. The FCC’s rules are in effect, and were upheld by the United States Court of Appeals for the District of Columbia Circuit. The impact of these revised rules on our business is unclear.
|
|
•
|
Fixed-Line Telephony Services
.
We offer fixed-line telephony services, including both circuit-switched telephony and VoIP. Our circuit-switched telephony services are subject to FCC and local regulations regarding the quality and technical
|
I-54
aspects of service. All local telecommunications providers, including us, are obligated to provide telephony service to all customers within the service area, subject to certain exceptions under FCC regulations, and must give long distance telephony service providers equal access to their network. Under the Communications Act, competitive local exchange carriers (
CLECs
), like us, may require interconnection with the incumbent local exchange carrier (
ILEC
), and the ILEC must negotiate a reasonable and nondiscriminatory interconnection agreement with the CLEC. Such arrangement requires the ILEC to interconnect with the CLEC at any technically feasible point within the ILEC’s network, provide access to unbundled network elements of the ILEC’s network, offer for resale at wholesale rates any telecommunication services the ILEC provides to its own retail clients, and allow physical collocation of the CLEC’s equipment in the ILEC’s facilities to permit interconnection or access to unbundled network element services. Therefore, we have the right to interconnect with the incumbent local exchange carrier (
PRT
). We have negotiated an interconnection agreement with PRT, and the physical interconnection between both companies has been activated.
All of our circuit-switched telephony and VoIP services are subject to a charge for the Federal Universal Service Fund (
USF
), which is a fund created under the Communications Act to subsidize telecommunication services in high-cost areas, to provide telecommunications services for low-income consumers, and to provide certain subsidies for schools, libraries and rural healthcare facilities. The FCC has redirected the focus of USF to support broadband deployment in high-cost areas. In addition, our circuit-switched telephony and VoIP services are subject to a charge for a local Puerto Rico Universal Service Fund, which was created by law to subsidize telecommunications services for low-income families under the Federal USF Lifeline and Link-Up programs.
The FCC has adopted other regulations for VoIP services, including the requirement that interconnected VoIP providers and facilities-based broadband internet access providers must comply with the Communications Assistance for Law Enforcement Act, which requires carriers to provide certain assistance to federal law enforcement authorities. VoIP providers are also required to offer basic and enhanced 911 emergency calling services, which requires disclosure to all VoIP customers. VoIP providers are also subject to federal customer proprietary network information rules related to customer privacy.
Employees
As of
December 31, 2016
, we, including our consolidated subsidiaries, had an aggregate of approximately 41,000
full-time equivalent employees, certain of whom belong to organized unions and works councils, and includes contractors and temporary employees. We believe that our employee relations are good.
Financial Information About Geographic Areas
Financial information related to the geographic areas in which we do business appears in note
18
to our consolidated financial statements included in Part II of this Annual Report on Form 10-K.
Available Information
All our filings with the SEC as well as amendments to such filings are available on our internet website free of charge generally within 24 hours after we file such material with the SEC. Our website address is
www.libertyglobal.com.
The information on our website is not part of this Annual Report and is not incorporated by reference herein.
In addition to the other information contained in this Annual Report, you should consider the following risk factors in evaluating our results of operations, financial condition, business and operations or an investment in the shares of our company.
The risk factors described in this section have been separated into five groups:
|
•
|
risks that relate to the competition we face and the technology used in our businesses;
|
|
•
|
risks that relate to our operating in overseas markets and being subject to foreign regulation;
|
|
•
|
risks that relate to certain financial matters;
|
|
•
|
risks relating to our equity capital structure; and
|
|
•
|
other risks, including risks that, among other things, relate to the obstacles that may be faced by anyone who may seek to acquire us.
|
I-55
Although we describe below and elsewhere in this Annual Report the risks we consider to be the most material, there may be other unknown or unpredictable economic, business, competitive, regulatory or other factors that also could have material adverse effects on our results of operations, financial condition, business or operations in the future. In addition, past financial performance may not be a reliable indicator of future performance and historical trends should not be used to anticipate results or trends in future periods.
If any of the events described below, individually or in combination, were to occur, our businesses, prospects, financial condition, results of operations and/or cash flows could be materially adversely affected.
Factors Relating to Competition and Technology
We operate in increasingly competitive markets, and there is a risk that we will not be able to effectively compete with other service providers.
The markets for cable television, broadband internet, telephony and mobile services are highly competitive. In the provision of video services, we face competition from
FTA
and
DTT
broadcasters, video provided via satellite platforms, networks using
DSL
,
VDSL
or vectoring technology,
MMDS
operators,
FTTx
networks, OTT video content aggregators, and, in some countries where parts of our systems are overbuilt, cable networks, among others. Our operating businesses are facing increasing competition from video services provided by, or over the networks of, incumbent telecommunications operators and other service providers. As the availability and speed of broadband internet increases, we also face competition from OTT video content providers utilizing our or our competitors’ high-speed internet connections. In the provision of telephony and broadband internet services, we are experiencing increasing competition from the incumbent telecommunications operators and other service providers in each country in which we operate, as well as mobile providers of voice and data. The incumbent telecommunications operators typically dominate the market for these services and have the advantage of nationwide networks and greater resources than we have to devote to the provision of these services. Many of the incumbent operators offer double-play, triple-play and quadruple-play bundles of services. In many countries, we also compete with other operators using LLU to provide these services, other facilities-based operators and wireless providers. Developments in the
DSL
and other technology used by the incumbent telecommunications operators and alternative providers have improved the attractiveness of our competitors’ products and services and strengthened their competitive position. Developments in wireless technologies, such as
LTE
(the next generation of ultra high-speed mobile data) and WiFi, are creating additional competitive challenges.
In some of our markets, national and local government agencies may seek to become involved, either directly or indirectly, in the establishment of
FTTx
networks,
DTT
systems or other communications systems. We intend to pursue available options to restrict such involvement or to ensure that such involvement is on commercially reasonable terms. There can be no assurance, however, that we will be successful in these pursuits. As a result, we may face competition from entities not requiring a normal commercial return on their investments. In addition, we may face more vigorous competition than would have been the case if there were no government involvement.
We expect the level and intensity of competition to continue to increase from both existing competitors and new market entrants as a result of changes in the regulatory framework of the industries in which we operate, advances in technology, the influx of new market entrants and strategic alliances and cooperative relationships among industry participants. Increased competition could result in increased customer churn, reductions of customer acquisition rates for some products and services and significant price and promotional competition in most of our markets. In combination with difficult economic environments, these competitive pressures could adversely impact our ability to increase or, in certain cases, maintain the revenue, revenue per average cable
RGU
or mobile subscriber, as applicable (
ARPU
),
RGU
s, mobile subscribers, adjusted operating income before depreciation and amortization (
Adjusted OIBDA
),
Adjusted OIBDA
margins and liquidity of our operating segments.
Changes in technology may limit the competitiveness of and demand for our services.
Technology in the video, telecommunications and data services industries is changing rapidly, including advances in current technologies and the emergence of new technologies. New technologies, products and services may impact consumer behavior and therefore demand for our products and services. The ability to anticipate changes in technology and consumer tastes and to develop and introduce new and enhanced products and services on a timely basis will affect our ability to continue to grow, increase our revenue and number of subscribers and remain competitive. New products and services, once marketed, may not meet consumer expectations or demand, can be subject to delays in development and may fail to operate as intended. A lack of market acceptance of new products and services that we may offer, or the development of significant competitive products or services by others, could have a material adverse impact on our revenue and
Adjusted OIBDA
.
Our significant property and equipment additions, namely in connection with our Network Extensions, may not generate a positive return.
The video, broadband internet, telephony and mobile businesses in which we operate are capital intensive. Significant additions to our property and equipment are required to add customers to our networks and to upgrade or expand our broadband communications networks and upgrade customer premises equipment to enhance our service offerings and improve the customer experience. Of note, since 2015, we have undertaken our
Network Extensions
to connect additional homes and
I-56
businesses to our networks (see Item 7.
Management’s Discussion and Analysis of Financial Condition and Results of Operations - Overview
). Additions to our property and equipment, including in connection with our Network Extensions, require significant capital expenditures for equipment and associated labor costs to build out and/or upgrade our networks as well as for related customer premises equipment. Additionally, significant competition, the introduction of new technologies, the expansion of existing technologies, such as
FTTx
and advanced
DSL
technologies, or adverse regulatory developments could cause us to decide to undertake previously unplanned upgrades of our networks and customer premises equipment in the impacted markets. No assurance can be given that any upgrades or extensions of our network (including the
Network Extensions
) will increase penetration rates, increase ARPU or otherwise generate positive returns as anticipated, or that we will have adequate capital available to finance such upgrades or extensions. Additionally, costs related to our property and equipment additions, including with respect to our Network Extensions, could end up being be greater than originally anticipated or planned. If we are unable to, or elect not to, pay for costs associated with adding new customers, expanding, extending or upgrading our networks or making our other planned or unplanned additions to our property and equipment, our growth could be limited and our competitive position could be harmed.
We depend almost exclusively on our relationships with third-party programming providers and broadcasters for programming content, and a failure to acquire a wide selection of popular programming on acceptable terms could adversely affect our business.
The success of our video subscription business depends, in large part, on our ability to provide a wide selection of popular programming to our subscribers. We generally do not produce our own content and we depend on our agreements, relationships and cooperation with public and private broadcasters and collective rights associations to obtain such content. If we fail to obtain a diverse array of popular programming for our pay television services, including a sufficient selection of
HD
channels as well as non-linear content (such as a selection of attractive
VoD
content and rights for ancillary services such as
DVR
and catch up or 'Replay' services), on satisfactory terms, we may not be able to offer a compelling video product to our customers at a price they are willing to pay. Additionally, we are frequently negotiating and renegotiating programming agreements and our annual costs for programming can vary. There can be no assurance that we will be able to renegotiate or renew the terms of our programming agreements on acceptable terms or at all. We expect that programming and copyright costs will continue to rise in future periods as a result of (i) higher costs associated with the expansion of our digital video content, including rights associated with ancillary product offerings and rights that provide for the broadcast of live sporting events, (ii) rate increases and (iii) growth in the number of our enhanced video subscribers.
If we are unable to obtain or retain attractively priced competitive content, demand for our existing and future television services could decrease, thereby limiting our ability to attract new customers, maintain existing customers and/or migrate customers from lower tier programming to higher tier programming, thereby inhibiting our ability to execute our business plans. Furthermore, we may be placed at a competitive disadvantage if certain of our competitors obtain exclusive programming rights, particularly with respect to popular sports and movie programming, and as certain entrants in the OTT market, for example Netflix and Amazon, increasingly produce their own exclusive content.
We depend on third-party suppliers and licensors to supply necessary equipment, software and certain services required for our businesses.
We rely on third-party vendors for the equipment, software and services that we require in order to provide services to our customers. Our suppliers often conduct business worldwide and their ability to meet our needs is subject to various risks, including political and economic instability, natural calamities, interruptions in transportation systems, terrorism and labor issues. As a result, we may not be able to obtain the equipment, software and services required for our businesses on a timely basis or on satisfactory terms. Any shortfall in customer premises equipment could lead to delays in completing extensions to our networks and in connecting customers to our services and, accordingly, could adversely impact our ability to maintain or increase our
RGU
s, revenue and cash flows. Also, if demand exceeds the suppliers’ and licensors’ capacity or if they experience financial difficulties, the ability of our businesses to provide some services may be materially adversely affected, which in turn could affect our businesses’ ability to attract and retain customers. Although we actively monitor the creditworthiness of our key third-party suppliers and licensors, the financial failure of a key third-party supplier or licensor could disrupt our operations and have an adverse impact on our revenue and cash flows. We rely upon intellectual property that is owned or licensed by us to use various technologies, conduct our operations and sell our products and services. Legal challenges could be made against our use of our or our licensed intellectual property rights (such as trademarks, patents and trade secrets) and we may be required to enter into licensing arrangements on unfavorable terms, incur monetary damages or be enjoined from use of the intellectual property rights in question.
Certain of our businesses that offer mobile telephony and data services rely on the radio access networks of third-party wireless network providers to carry our mobile communications traffic.
Our services to mobile customers in many jurisdictions in which we operate rely on the use of
MVNO
arrangements in which we utilize the radio access networks of third-party wireless network providers to carry our mobile communications traffic. If any of our
MVNO
arrangements are terminated, or if the respective third-party wireless network provider fails to provide the services required under an
MVNO
arrangement, or if a third-party wireless network provider fails to deploy and maintain its network, and we are unable to find a replacement network operator on a timely and commercially reasonable basis or at all, we could be prevented from continuing the mobile services relying on such
MVNO
I-57
arrangement. Additionally, as our
MVNO
arrangements come to term, we may not be able to renegotiate renewal or replacement
MVNO
arrangements on the same or more favorable terms.
Failure in our technology or telecommunications systems or leakage of sensitive customer data could significantly disrupt our operations, which could reduce our customer base and result in lost revenue.
Our success depends, in part, on the continued and uninterrupted performance of our information technology and network systems as well as our customer service centers. The hardware supporting a large number of critical systems for our cable network in a particular country or geographic region is housed in a relatively small number of locations. Our systems and equipment (including our routers and set-top boxes) are vulnerable to damage or security breach from a variety of sources, including telecommunications failures, power loss, malicious human acts, security flaws, and natural disasters. For example, in early October 2016, our fixed-line and mobile networks in the Bahamas suffered extensive damage as a result of Hurricane Matthew, which caused our customers to experience significant outages (see Item 7.
Management’s Discussion and Analysis of Financial Condition and Results of Operations - Overview
). Moreover, despite security measures, our servers, systems and equipment are potentially vulnerable to physical or electronic break-ins, computer viruses, worms, phishing attacks and similar disruptive actions. Furthermore, our operating activities could be subject to risks caused by misappropriation, misuse, leakage, falsification or accidental release or loss of information maintained in our information technology systems and networks and those of our third-party vendors, including customer, personnel and vendor data. As a result of the increasing awareness concerning the importance of safeguarding personal information, the potential misuse of such information and legislation that has been adopted or is being considered across all of our markets regarding the protection, privacy and security of personal information, information-related risks are increasing, particularly for businesses like ours that handle a large amount of personal customer data. Failure to comply with these data protection laws may result in, among other consequences, fines.
Despite the precautions we have taken, unanticipated problems affecting our systems could cause failures in our information technology systems or disruption in the transmission of signals over our networks or similar problems. Any disruptive situation that causes loss, misappropriation, misuse or leakage of data could damage our reputation and the credibility of our operations. Further, sustained or repeated system failures that interrupt our ability to provide service to our customers or otherwise meet our business obligations in a timely manner could adversely affect our reputation and result in a loss of customers and an adverse impact on revenue.
The “Virgin” brand is used by our subsidiary
Virgin Media
under licenses from Virgin Enterprises Limited and is not under the control of
Virgin Media
. The activities of the group of companies utilizing the “Virgin” brand and other licensees could have a material adverse effect on the goodwill of customers towards
Virgin Media
as a licensee and the licenses from Virgin Enterprises Limited can be terminated in certain circumstances.
The “Virgin” brand is integral to
Virgin Media
’s corporate identity.
Virgin Media
is reliant on the general goodwill of consumers towards the Virgin brand. Consequently, adverse publicity in relation to the group of companies utilizing the “Virgin” brand or its principals, particularly Sir Richard Branson, who is closely associated with the brand, or in relation to another licensee of the “Virgin” name and logo (particularly in the
U.K.
, where
Virgin Media
does business) could have a material adverse effect on
Virgin Media
’s reputation and on
Virgin Media
’s and our business and results of operations. In addition, the licenses from Virgin Enterprises Limited can be terminated in certain circumstances. For example, Virgin Enterprises Limited can terminate the licenses, after providing
Virgin Media
with an opportunity to cure, (1) if
Virgin Media
or any of its affiliates commits persistent and material breaches or a flagrant and material breach of the licenses, (2) if Virgin Enterprises Limited has reasonable grounds to believe that the use (or lack of use) of the licensed trademarks by
Virgin Media
has been or is likely to result in a long-term and material diminution in the value of the “Virgin” brand, or (3) if a third-party who is not (or one of whose directors is not) a “fit and proper person”, such as a legally disqualified director or a bankrupt entity, acquires “control” of
Liberty Global
. Such a termination could have a material adverse effect on
Virgin Media
’s and our business and results of operations.
Factors Relating to Overseas Operations and Foreign Regulation
Our businesses are conducted almost exclusively outside of the
U.S.
, which gives rise to numerous operational risks.
Our businesses operate almost exclusively in countries outside the U.S. and are thereby subject to the following inherent risks:
|
•
|
fluctuations in foreign currency exchange rates;
|
|
•
|
difficulties in staffing and managing international operations;
|
|
•
|
potentially adverse tax consequences;
|
|
•
|
export and import restrictions, custom duties, tariffs and other trade barriers;
|
|
•
|
increases in taxes and governmental fees;
|
I-58
|
•
|
economic and political instability; and
|
|
•
|
changes in foreign and domestic laws and policies that govern operations of foreign-based companies.
|
Operational risks that we may experience in certain countries include disruptions of services or loss of property or equipment that are critical to overseas businesses due to expropriation, nationalization, war, insurrection, terrorism or general social or political unrest.
We are exposed to foreign currency exchange rate risk.
We are exposed to foreign currency exchange rate risk with respect to our consolidated debt in situations where our debt is denominated in a currency other than the functional currency of the operations whose cash flows support our ability to repay or refinance such debt. Although we generally seek to match the denomination of our and our subsidiaries’ borrowings with the functional currency of the operations that are supporting the respective borrowings, market conditions or other factors may cause us to enter into borrowing arrangements that are not denominated in the functional currency of the underlying operations (unmatched debt). In these cases, our policy is to provide for an economic hedge against foreign currency exchange rate movements by using derivative instruments to synthetically convert unmatched debt into the applicable underlying currency. At
December 31, 2016
, substantially all of our debt was either directly or synthetically matched to the applicable functional currencies of the underlying operations.
In addition to the exposure that results from the mismatch of our borrowings and underlying functional currencies, we are exposed to foreign currency risk to the extent that we enter into transactions denominated in currencies other than our or our subsidiaries’ respective functional currencies (non-functional currency risk), such as equipment purchases, programming contracts, notes payable and notes receivable (including intercompany amounts). Changes in exchange rates with respect to amounts recorded in our consolidated balance sheets related to these items will result in unrealized (based upon period-end exchange rates) or realized foreign currency transaction gains and losses upon settlement of the transactions. Moreover, to the extent that our revenue, costs and expenses are denominated in currencies other than our respective functional currencies, we will experience fluctuations in our revenue, costs and expenses solely as a result of changes in foreign currency exchange rates.
In this regard, excluding CWC, we currently expect that during
2017
, (1)
less than 1% of our revenue,
(2)
approximately 1% to 3% of our direct costs of services and our other operating and SG&A expenses (exclusive of share-based compensation expense) and
(3)
approximately 10% to 12% of our property and equipment additions will be denominated in non-functional currencies, including amounts denominated in U.S. dollars, euros and British pound sterling.
Our expectations with respect to our non-functional currency transactions in 2017 may differ from actual results.
Generally, we will consider hedging non-functional currency risks when the risks arise from agreements with third parties that involve the future payment or receipt of cash or other monetary items to the extent that we can reasonably predict the timing and amount of such payments or receipts and the payments or receipts are not otherwise hedged. In this regard, we have entered into foreign currency forward contracts to hedge certain of these risks. Certain non-functional currency risks related to our revenue, direct costs of services and other operating and SG&A expenses and property and equipment additions were not hedged as of
December 31, 2016
. For additional information concerning our foreign currency forward contracts, see note
7
to our consolidated financial statements included in Part II of this Annual Report on Form 10-K.
We also are exposed to unfavorable and potentially volatile fluctuations of the
U.S.
dollar (our reporting currency) against the currencies of our operating subsidiaries when their respective financial statements are translated into
U.S.
dollars for inclusion in our consolidated financial statements. Cumulative translation adjustments are recorded in accumulated other comprehensive earnings or loss as a separate component of equity. Any increase (decrease) in the value of the
U.S.
dollar against any foreign currency that is the functional currency of one of our operating subsidiaries will cause us to experience unrealized foreign currency translation losses (gains) with respect to amounts already invested in such foreign currencies. Accordingly, we may experience a negative impact on our comprehensive earnings or loss and equity with respect to our holdings solely as a result of foreign currency translation. Our primary exposure to foreign currency translation risk
during the three months ended December 31, 2016 was to the euro and British pound sterling as 43.2% and 27.5% of our reported revenue during the period was derived from subsidiaries whose functional currencies are the euro and British pound sterling, respectively.
In addition, our reported operating results are impacted by changes in the exchange rates for the Swiss franc, the Chilean peso and other local currencies in Europe. We generally do not hedge against the risk that we may incur non-cash losses upon the translation of the financial statements of our subsidiaries and affiliates into
U.S.
dollars.
Our businesses are subject to risks of adverse regulation.
Our businesses are subject to the unique regulatory regimes of the countries in which they operate. Notably, with the acquisition of CWC, the number of countries in which we operate, and therefore the number of regulatory regimes to which we are subject, increased significantly. Video distribution, broadband internet, telephony and mobile businesses are subject to licensing or registration eligibility rules and regulations, which vary by country. The provision of electronic communications networks and services requires our licensing from, or registration with, the appropriate regulatory authorities and, for telephony services, entrance into interconnection arrangements with other phone companies, including the incumbent phone company. It is possible that countries in which we operate may adopt laws and regulations regarding electronic commerce, which could dampen the growth of the internet services being offered and developed by these businesses. In a number
I-59
of countries, our ability to increase the prices we charge for our cable television service or make changes to the programming packages we offer is limited by regulation or conditions imposed by competition authorities or is subject to review by regulatory authorities or is subject to termination rights of customers. In addition, regulatory authorities may grant new licenses to third parties and, in any event, in most of our markets new entry is possible without a license, although there may be registration eligibility rules and regulations, resulting in greater competition in territories where our businesses may already be active. More significantly, regulatory authorities may require us to grant third parties access to our bandwidth, frequency capacity, facilities or services to distribute their own services or resell our services to end customers. Consequently, our businesses must adapt their ownership and organizational structure as well as their pricing and service offerings to satisfy the rules and regulations to which they are subject. A failure to comply with applicable rules and regulations could result in penalties, restrictions on our business or loss of required licenses or other adverse conditions.
Adverse changes in rules and regulations could:
|
•
|
impair our ability to use our bandwidth in ways that would generate maximum revenue and
Adjusted OIBDA
;
|
|
•
|
create a shortage of capacity on our networks, which could limit the types and variety of services we seek to provide our customers;
|
|
•
|
impact our ability to access spectrum for our mobile services;
|
|
•
|
strengthen our competitors by granting them access and lowering their costs to enter into our markets; and
|
|
•
|
have a significant adverse impact on our results of operations.
|
Businesses, including ours, that offer multiple services, such as video distribution as well as internet, telephony, and/or mobile services, or that are vertically integrated and offer both video distribution and programming content, often face close regulatory scrutiny from competition authorities in several countries in which they operate. This is particularly the case with respect to any proposed business combinations, which will often require clearance from national competition authorities. The regulatory authorities in several countries in which we do business have considered from time to time what access rights, if any, should be afforded to third parties for use of existing cable television networks and have imposed access obligations in certain countries. This has resulted, for example, in obligations with respect to call termination for our telephony business in Europe, video must carry obligations in many markets in which we operate and video and broadband internet access obligations in Belgium.
When we acquire additional communications companies, these acquisitions may require the approval of governmental authorities (either at country or, in the case of the
E.U.
, European level), which can block, impose conditions on, or delay an acquisition, thus hampering our opportunities for growth. In the event conditions are imposed and we fail to meet them in a timely manner, the governmental authority may impose fines and, if in connection with a merger transaction, may require restorative measures, such as mandatory disposition of assets or divestiture of operations. Most recently, the
CWC Acquisition
triggered regulatory approval requirements in certain jurisdictions in which
CWC
operates. The regulatory authorities in certain of these jurisdictions, including the Bahamas, Jamaica, Trinidad and Tobago, the Seychelles and the Cayman Islands, have not completed their review of the
CWC Acquisition
or granted their approval. While we expect to receive all outstanding approvals, such approvals may include binding conditions or requirements that could have an adverse impact on
CWC
’s operations and financial condition.
Moreover, in several of CWC’s key markets, including Panama and the Bahamas, governments are CWC’s partners and co-owners. Consequently, we may not be able to fully utilize CWC’s contractual or legal rights or all options available, where to do so might conflict with broader regulatory or governmental considerations.
New legislation may significantly alter the regulatory regime applicable to us, which could adversely affect our competitive position and profitability, and we may become subject to more extensive regulation if we are deemed to possess significant market power in any of the markets in which we operate.
Significant changes to the existing regulatory regime applicable to the provision of cable television, telephony, internet and mobile services have been and are still being introduced. For example, in the
E.U.
a large element of regulation affecting our business derives from a number of Directives that are the basis of the regulatory regime concerning many of the services we offer across the
E.U.
The various Directives require Member States to harmonize their laws on communications and cover issues such as access, user rights, privacy and competition. These Directives are reviewed by the
E.U.
from time to time and any changes to them could lead to substantial changes in the way in which our businesses are regulated and to which we would have to adapt. In addition, we are subject to review by competition or national regulatory authorities in certain countries concerning whether we exhibit
Significant Market Power
. A finding of
Significant Market Power
can result in our company becoming subject to pricing, open access, unbundling and other requirements that could provide a more favorable operating environment for existing and potential competitors.
I-60
The
U.K.
referendum advising for the exit of the
U.K.
from the
E.U.
could have a material adverse effect on our business, financial condition, results of operations or liquidity.
On June 23, 2016, the
U.K.
held a referendum in which voters approved, on an advisory basis, an exit from the
E.U.
, commonly referred to as “
Brexit
”. The terms of any withdrawal are subject to a negotiation period that could last at least two years after the British government formally initiates a withdrawal process pursuant to Article 50 of the Treaty on Europe. The British government has indicated that it plans to trigger Article 50 and commence negotiations to determine the terms of the
U.K.
’s withdrawal from the
E.U.
by the end of March 2017. A withdrawal could, among other outcomes, disrupt the free movement of goods, services, people and capital between the
U.K.
and the
E.U.
, undermine bilateral cooperation in key geographic areas and significantly disrupt trade between the
U.K.
and the
E.U.
or other nations (including the
U.S.
) as the
U.K.
pursues independent trade relations. The initial impact of the announcement of
Brexit
caused significant volatility in global stock markets, including in the prices of our shares, as well as significant currency fluctuations that resulted in the strengthening of the
U.S.
dollar (our reporting currency) against foreign currencies in which we conduct business, namely the British pound sterling and the euro.
The potential impacts, if any, of the uncertainty relating to
Brexit
or the resulting terms of the withdrawal of the
U.K.
from the
E.U.
on customer behavior, economic conditions, interest rates, currency exchange rates, availability of capital or other matters are unclear. Examples of the impact
Brexit
could have on our business, financial condition or results of operations include:
|
•
|
changes in foreign currency exchange rates and disruptions in the capital markets. For example, a sustained period of weakness in the British pound sterling or the euro could have an adverse impact on our liquidity, including our ability to fund repurchases of our equity securities and other
U.S.
dollar-denominated liquidity requirements;
|
|
•
|
legal uncertainty and potentially divergent national laws and regulations as the
U.K.
determines which
E.U.
laws and directives to replace or replicate, or where previously implemented by enactment of
U.K.
laws or regulations, to retain, amend or repeal;
|
|
•
|
uncertainty as to the terms of the
U.K.
’s withdrawal from, and future relationship with, the
E.U.
in terms of the impact on the free movement of our services, capital and employees;
|
|
•
|
global economic uncertainty, which may cause our customers to reevaluate what they are willing to spend on our products and services; and
|
|
•
|
various geopolitical forces may impact the global economy and our business, including, for example, other
E.U.
member states (in particular those member states where we have operations) proposing referendums to, or electing to, exit the
E.U.
|
We cannot be certain that we will be successful in acquiring new businesses or integrating acquired businesses with our existing operations, or that we will achieve the expected returns on our acquisitions.
Historically, our businesses have grown, in part, through selective acquisitions that enabled them to take advantage of existing networks, local service offerings and region-specific management expertise. We expect to seek to continue growing our businesses through acquisitions in selected markets, such as the acquisition of
Choice
in June 2015, the BASE acquisition in February 2016, the
CWC Acquisition
in May 2016, and the pending acquisitions of Multimedia Polska S.A. (
Multimedia
) and Coditel Brabant sprl, operating under the SFR brand (
SFR BeLux
). Our ability to acquire new businesses may be limited by many factors, including availability of financing, debt covenants, the prevalence of complex ownership structures among potential targets, government regulation and competition from other potential acquirers, including private equity funds. Even if we are successful in acquiring new businesses, the integration of these businesses, such as
Choice
, BASE,
CWC
,
Multimedia
and
SFR BeLux
may present significant costs and challenges associated with: realizing economies of scale in interconnection, programming and network operations; eliminating duplicative overheads; integrating personnel, networks, financial systems and operational systems; greater than anticipated expenditures required for compliance with regulatory standards or for investments to improve operating results, and failure to achieve the business plan with respect to any such acquisition. We cannot be assured that we will be successful in acquiring new businesses or realizing the anticipated benefits of any completed acquisition, including, for example, the acquisitions of
Choice
, BASE and
CWC
, and the pending acquisitions of
Multimedia
and
SFR BeLux
.
In addition, we anticipate that most, if not all, companies acquired by us will be located outside the U.S. Foreign companies may not have disclosure controls and procedures or internal controls over financial reporting that are as thorough or effective as those required by
U.S.
securities laws. While we intend to conduct appropriate due diligence and to implement appropriate controls and procedures as we integrate acquired companies, we may not be able to certify as to the effectiveness of these companies’ disclosure controls and procedures or internal controls over financial reporting until we have fully integrated them.
We may have exposure to additional tax liabilities.
We are subject to income taxes as well as non-income based taxes, such as value added tax, or VAT, in the
U.K.
, the
U.S.
and many other jurisdictions around the world. In addition, most tax jurisdictions
I-61
that we operate in have complex and subjective rules regarding the valuation of intercompany services, cross-border payments between affiliated companies and the related effects on income tax, VAT and transfer tax. Significant judgment is required in determining our worldwide provision for income taxes and other tax liabilities. In the ordinary course of our business, there are many transactions and calculations where the ultimate tax determination is uncertain. We are regularly under audit by tax authorities in many of the jurisdictions in which we operate. Although we believe that our tax estimates are reasonable, any material differences as a result of final determinations of tax audits or tax disputes could have an adverse effect on our financial position and results of operations in the period or periods for which determination is made.
Because the majority of our subsidiaries have some or all of their ownership through
U.S.
corporations, our worldwide effective tax rate is subject to provisions of
U.S.
tax law that defer the imposition of
U.S.
tax on certain foreign active income until that income is repatriated to the U.S. Any repatriation, through our
U.S.
ownership structure, of assets currently held by subsidiaries in foreign jurisdictions or recognition of income that fails to meet the
U.S.
tax requirements related to deferral of
U.S.
income tax, may result in a higher effective tax rate for our company. While the company may mitigate this increase in its effective tax rate through claiming a foreign tax credit against its
U.S.
federal income taxes or potentially have foreign or
U.S.
taxes reduced under applicable income tax treaties, we are subject to various limitations.
We are subject to changing tax laws, treaties and regulations in and between countries in which we operate, including treaties between the
U.K.
, the
U.S.
and many other jurisdictions in which we have a presence. Also, various income tax proposals in the jurisdictions in which we operate could result in changes to the existing laws on which our deferred taxes are calculated. A change in these tax laws, treaties or regulations, or in the interpretation thereof, could result in a materially higher income or non-income tax expense. Any such material changes could cause a material change in our effective tax rate, such as the
U.K.
’s new corporate rate to take effect in each of April 2017 and April 2020, as more fully described in note 11 to our consolidated financial statements included in Part II of this Annual Report on Form 10-K.
Further changes in the tax laws of the foreign jurisdictions in which we operate could arise as a result of the base erosion and profit shifting (
BEPS
) project being undertaken by the OECD or the European Commission Anti-Tax Avoidance Package. The OECD, which represents a coalition of member countries that encompass most of the jurisdictions in which we operate, and the European Commission have undertaken studies and are publishing action plans that include recommendations aimed at addressing what they believe are issues within tax systems that may lead to tax avoidance by companies. It is possible that jurisdictions in which we do business could react to these initiatives or their own concerns by enacting tax legislation that could adversely affect us or our shareholders through increasing our tax liabilities.
Factors Relating to Certain Financial Matters
Our substantial leverage could limit our ability to obtain additional financing and have other adverse effects.
We seek to maintain our debt at levels that provide for attractive equity returns without assuming undue risk. In this regard, we generally seek to cause our operating subsidiaries to maintain their debt at levels that result in a consolidated debt balance that is between four and five times our consolidated
Adjusted OIBDA
. As a result, we are highly leveraged. At
December 31, 2016
, the outstanding principal amount of our consolidated debt, together with our capital lease obligations aggregated
$43.6 billion
, including
$2,775.1 million
that is classified as current in our consolidated balance sheet and
$38.5 billion
that is not due until
2021
or thereafter. We believe that we have sufficient resources to repay or refinance the current portion of our debt and capital lease obligations and to fund our foreseeable liquidity requirements during the next 12 months. As our debt maturities grow in later years, however, we anticipate that we will seek to refinance or otherwise extend our debt maturities. In this regard, we completed refinancing transactions in 2016 that, among other things, resulted in the extension of certain of our subsidiaries’ debt maturities. No assurance can be given that we will be able to complete additional refinancing transactions or otherwise extend our debt maturities. In this regard, it is difficult to predict how political and economic conditions, sovereign debt concerns or any adverse regulatory developments will impact the credit and equity markets we access and our future financial position.
Our ability to service or refinance our debt and to maintain compliance with the leverage covenants in the credit agreements and indentures of our borrowing groups is dependent primarily on our ability to maintain or increase the
Adjusted OIBDA
of our operating subsidiaries and to achieve adequate returns on our property and equipment additions and acquisitions. For example, if the
Adjusted OIBDA
of our subsidiary,
UPC Broadband Holding
, were to decline, we could be required to partially repay or limit our borrowings under the
UPC Broadband Holding Bank Facility
in order to maintain compliance with applicable covenants. Accordingly, if our cash provided by operations declines or we encounter other material liquidity requirements, we may be required to seek additional debt or equity financing in order to meet our debt obligations and other liquidity requirements as they come due. In addition, our current debt levels may limit our ability to incur additional debt financing to fund working capital needs, acquisitions, property and equipment additions, or other general corporate requirements. We can give no assurance that any additional debt or equity financing will be available on terms that are as favorable as the terms of our existing debt or at all. Further, our board of directors has approved share repurchase programs for our
Liberty Global Shares
and our
LiLAC Shares
. Any cash
I-62
used by our company in connection with any future purchases of our ordinary shares would not be available for other purposes, including the repayment of debt. For additional information concerning our share repurchase programs, see note 12 to our consolidated financial statements included in Part II of this Annual Report on Form 10-K.
Certain of our subsidiaries are subject to various debt instruments that contain restrictions on how we finance our operations and operate our businesses, which could impede our ability to engage in beneficial transactions.
Certain of our subsidiaries are subject to significant financial and operating restrictions contained in outstanding credit agreements, indentures and similar instruments of indebtedness. These restrictions will affect, and in some cases significantly limit or prohibit, among other things, the ability of those subsidiaries to:
|
•
|
incur or guarantee additional indebtedness;
|
|
•
|
pay dividends or make other upstream distributions;
|
|
•
|
make investments;
|
|
•
|
transfer, sell or dispose of certain assets, including subsidiary stock;
|
|
•
|
merge or consolidate with other entities;
|
|
•
|
engage in transactions with us or other affiliates; or
|
|
•
|
create liens on their assets.
|
As a result of restrictions contained in these debt instruments, the companies party thereto, and their subsidiaries, could be unable to obtain additional capital in the future to:
|
•
|
fund property and equipment additions or acquisitions that could improve their value;
|
|
•
|
meet their loan and capital commitments to their business affiliates;
|
|
•
|
invest in companies in which they would otherwise invest;
|
|
•
|
fund any operating losses or future development of their business affiliates;
|
|
•
|
obtain lower borrowing costs that are available from secured lenders or engage in advantageous transactions that monetize their assets; or
|
|
•
|
conduct other necessary or prudent corporate activities.
|
In addition, most of the credit agreements to which these subsidiaries are parties include financial covenants that require them to maintain certain financial ratios, including ratios of total debt to
Adjusted OIBDA
and
Adjusted OIBDA
to interest expense. Their ability to meet these financial covenants may be affected by adverse economic, competitive, or regulatory developments and other events beyond their control, and we cannot assure you that these financial covenants will be met. In the event of a default under such subsidiaries’ credit agreements or indentures, the lenders may accelerate the maturity of the indebtedness under those agreements or indentures, which could result in a default under other outstanding credit facilities or indentures. We cannot assure you that any of these subsidiaries will have sufficient assets to pay indebtedness outstanding under their credit agreements and indentures. Any refinancing of this indebtedness is likely to contain similar restrictive covenants.
We are exposed to interest rate risks. Shifts in such rates may adversely affect the debt service obligation of our subsidiaries.
We are exposed to the risk of fluctuations in interest rates, primarily through the credit facilities of certain of our subsidiaries, which are indexed to EURIBOR, LIBOR or other base rates. Although we enter into various derivative transactions to manage exposure to movements in interest rates, there can be no assurance that we will be able to continue to do so at a reasonable cost or at all. If we are unable to effectively manage our interest rate exposure through derivative transactions, any increase in market interest rates would increase our interest rate exposure and debt service obligations, which would exacerbate the risks associated with our leveraged capital structure.
We are subject to increasing operating costs and inflation risks, which may adversely affect our results of operations.
While our operations attempt to increase our subscription rates to offset increases in programming and operating costs, there is no assurance that they will be able to do so. In certain countries in which we operate, our ability to increase subscription rates is subject to regulatory controls. Also, our ability to increase subscription rates may be constrained by competitive pressures. Therefore, operating costs may rise faster than associated revenue, resulting in a material negative impact on our cash flow and
I-63
net earnings (loss). We are also impacted by inflationary increases in salaries, wages, benefits and other administrative costs in certain of our markets.
Continuing uncertainties and challenging conditions in the global economy and in the countries in which we operate may adversely impact our business, financial condition and results of operations.
The current macroeconomic environment is highly volatile, and continuing instability in global markets, including the ongoing struggles in Europe related to sovereign debt issues, the risk of deflation and the stability of the British pound sterling and the euro, has contributed to a challenging global economic environment. Future developments are dependent upon a number of political and economic factors, including the effectiveness of measures by the
E.U.
Commission to address debt burdens of certain countries in Europe and the overall stability of the eurozone. As a result, we cannot predict how long challenging conditions will exist or the extent to which the markets in which we operate may deteriorate. Additional risks arising from the ongoing economic challenges in Europe are described below under the Risk Factor titled:
We are exposed to sovereign debt and currency instability risks in Europe that could have an adverse impact on our liquidity, financial condition and cash flows.
Unfavorable economic conditions may impact a significant number of our subscribers and/or the prices we are able to charge for our products and services, and, as a result, it may be (1) more difficult for us to attract new subscribers, (2) more likely that subscribers will downgrade or disconnect their services and (3) more difficult for us to maintain
ARPU
s at existing levels. Countries may also seek new or increased revenue sources due to fiscal deficits. Such actions may further adversely affect our company. Accordingly, our ability to increase, or, in certain cases, maintain, the revenue,
ARPU
s,
RGU
s, mobile subscribers,
Adjusted OIBDA
,
Adjusted OIBDA
margins and liquidity of our operating segments could be adversely affected if the macroeconomic environment remains uncertain or declines further. We are currently unable to predict the extent of any of these potential adverse effects.
We are exposed to sovereign debt and currency instability risks that could have an adverse impact on our liquidity, financial condition and cash flows.
Our operations are subject to
macroeconomic and political risks that are outside of our control. For example, high levels of sovereign debt in the
U.S.
and several countries in which we operate, combined with weak growth and high unemployment, could potentially lead to fiscal reforms (including austerity measures), tax increases, sovereign debt restructurings, currency instability, increased counterparty credit risk, high levels of volatility and disruptions in the credit and equity markets, as well as other outcomes that might adversely impact our company. With regard to currency instability issues, concerns exist in the eurozone with respect to
individual macro-fundamentals on a country-by-country basis, as well as with
respect to the overall stability of the European monetary union and the suitability of a single currency to appropriately deal with specific fiscal management
and
sovereign debt issues in individual eurozone countries. The realization of these concerns could lead to the exit of one or more countries from the European monetary union and the re-introduction of individual currencies in these countries, or, in more extreme circumstances, the possible dissolution of the European monetary union entirely, which could result in the redenomination of a portion or, in the extreme case, all of our euro-denominated assets, liabilities and cash flows to the new currency of the country in which they originated. This could result in a mismatch in the currencies of our assets, liabilities and cash flows. Any such mismatch, together with the capital market disruption that would likely accompany any such redenomination event, could have a material adverse impact on our liquidity and financial condition. Furthermore, any redenomination event would likely be accompanied by significant economic dislocation, particularly within the eurozone countries, which in turn could have an adverse impact on demand for our products and services, and accordingly, on our revenue and cash flows. Moreover, any changes from euro to non-euro currencies within the countries in which we operate would require us to modify our billing and other financial systems. No assurance can be given that any required modifications could be made within a time frame that would allow us to timely bill our customers or prepare and file required financial reports. In light of the significant exposure that we have to the euro through our euro-denominated borrowings, derivative instruments, cash balances and cash flows, a
redenomination event could have a material adverse impact on our company.
Additionally, we are facing a challenging economic environment in Puerto Rico due in part to the government’s liquidity issues. In this regard, the Puerto Rico government has failed to make significant portions of its scheduled debt payments during 2016. Although the Puerto Rico government has implemented tax increases and other measures to improve its solvency and the U.S. has implemented legislation designed to help manage Puerto Rico’s debt crisis, it remains possible, if not likely, that Puerto Rico will be required to restructure its debt obligations. If the fiscal and economic conditions in Puerto Rico were to worsen, the population of Puerto Rico could continue to decline and the demand and ability of customers to pay for
Liberty Puerto Rico
’s services could be impaired, both of which could have a negative impact on
Liberty Puerto Rico
’s results of operations, cash flows and financial condition.
We may not freely access the cash of our operating companies.
Our operations are conducted through our subsidiaries. Our current sources of corporate liquidity include (1) our cash and cash equivalents and (2) interest and dividend income received on our cash and cash equivalents and investments. From time to time, we also receive (1) proceeds in the form of distributions or loan repayments from our subsidiaries or affiliates, (2) proceeds upon the disposition of investments and other assets and
I-64
(3) proceeds in connection with the incurrence of debt or the issuance of equity securities. The ability of our operating subsidiaries to pay dividends or to make other payments or advances to us depends on their individual operating results and any statutory, regulatory or contractual restrictions to which they may be or may become subject and in some cases our receipt of such payments or advances may be limited due to tax considerations or the presence of noncontrolling interests. Most of our operating subsidiaries are subject to credit agreements or indentures that restrict sales of assets and prohibit or limit the payment of dividends or the making of distributions, loans or advances to shareholders and partners, including us. In addition, because these subsidiaries are separate and distinct legal entities they have no obligation to provide us funds for payment obligations, whether by dividends, distributions, loans or other payments.
We are exposed to the risk of default by the counterparties to our derivative and other financial instruments, undrawn debt facilities and cash investments.
Although we seek to manage the credit risks associated with our derivative and other financial instruments, cash investments and undrawn debt facilities, we are exposed to the risk that our counterparties could default on their obligations to us. Also, even though we regularly review our credit exposures, defaults may arise from events or circumstances that are difficult to detect or foresee. At
December 31, 2016
, our exposure to counterparty credit risk included (1) derivative assets with an aggregate fair value of
$2,424.6 million
, (2) cash and cash equivalent and restricted cash balances of
$1,668.3 million
and (3) aggregate undrawn debt facilities of
$3,969.2 million
. While we currently have no specific concerns about the creditworthiness of any counterparty for which we have material credit risk exposures, the current economic conditions and uncertainties in global financial markets have increased the credit risk of our counterparties and we cannot rule out the possibility that one or more of our counterparties could fail or otherwise be unable to meet its obligations to us. Any such instance could have an adverse effect on our cash flows, results of operations, financial condition and/or liquidity. In this regard, (1) the financial failure of any of our counterparties could reduce amounts available under committed credit facilities and adversely impact our ability to access cash deposited with any failed financial institution, thereby causing a default under one or more derivative contracts, and (2) tightening of the credit markets could adversely impact our ability to access debt financing on favorable terms, or at all. For additional information on our derivative contracts, see note 7 to our consolidated financial statements included in Part II of this Annual Report on Form 10-K.
The risks we would face in the event of a default by a counterparty to one of our derivative instruments might be eliminated or substantially mitigated if we were able to novate the relevant derivative contracts to a new counterparty following the default of our counterparty. While we anticipate that, in the event of the insolvency of one of our derivative counterparties, we would seek to effect such novations, no assurance can be given that we would obtain the necessary consents to do so or that we would be able to do so on terms or pricing that would be acceptable to us or that any such novation would not result in substantial costs to us. Furthermore, the underlying risks that are the subject of the relevant derivative contracts would no longer be effectively hedged due to the insolvency of our counterparty, unless and until we novate or replace the derivative contract.
The liquidity and value of our interests in certain of our non-wholly owned subsidiaries, as well as the ability to make decisions related to their operations, may be adversely affected by shareholder agreements and similar agreements to which we are a party.
We indirectly own equity interests in a variety of international video, broadband internet, telephony, mobile and other communications businesses. Certain of these equity interests, such as our interests in our consolidated subsidiaries,
Liberty Puerto Rico
,
CWC Panama
and
CWC BTC
, and our non-controlling interest in the
Dutch JV
, are held pursuant to shareholder agreements, partnership agreements, joint venture agreements and other instruments and agreements that provide the terms of the governance of the subsidiaries as well as the ownership of such interests. These agreements contain provisions that affect the liquidity, and therefore the realizable value, of those interests by subjecting the transfer of such equity interests to consent rights or rights of first refusal of the other shareholders or partners or similar restrictions on transfer. In certain cases, a change in control of the subsidiary holding the equity interest will give rise to rights or remedies exercisable by other shareholders or partners. All of these provisions will restrict the ability to sell those equity interests and may adversely affect the prices at which those interests may be sold. Additionally, these agreements contain provisions granting us and the other shareholders or partners certain liquidity rights as well as certain governance rights, for example, with respect to material matters, including but not limited to acquisitions, mergers, dispositions, shareholder distributions, incurrence of debt, large expenditures and issuances of equity interests, which may prevent the respective subsidiary from making decisions or taking actions that would protect or advance the interests of our company, and could even result in such subsidiary making decisions or taking actions that adversely impact our company. For instance, we and
Searchlight
each have certain liquidity rights in relation to
Liberty Puerto Rico
, including
Searchlight
’s ability, after September 24, 2017 and so long as
Searchlight
owns at least 20% of
Liberty Puerto Rico
’s parent entities, to force a sale of
Liberty Puerto Rico
or its parent entities, subject to certain conditions, including among others, our right of first offer and our ability to stop a forced sale and instead conduce a dividend recapitalization in which Searchlight would receive cash. Furthermore, our ability to access the cash of these non-wholly owned subsidiaries may be restricted in certain circumstances under the respective shareholder, joint venture, partnership or similar agreements (see Item 1A. Risk Factors,
We may not freely access the cash of our operating companies
).
I-65
We may not report net earnings.
While we reported net earnings from continuing operations during 2016, we reported losses from continuing operations of
$1,049.5 million
and
$980.9 million
during
2015
and
2014
, respectively. In light of our historical financial performance, we cannot assure you that we will report net earnings in the near future.
Risks Related to Our Equity Capital Structure
Holders of
LiLAC Shares
and
Liberty Global Shares
are shareholders of Liberty Global and are, therefore, subject to risks associated with an investment in our company as a whole, even if a holder does not own both
LiLAC Shares
and
Liberty Global Shares
.
Even though we have attributed, for financial reporting purposes, all of our consolidated assets, liabilities, revenue, expenses and cash flows to either the
LiLAC Group
or the
Liberty Global
Group in order to prepare the attributed financial information for each of those groups, we retain legal title to all of our assets and our capitalization does not limit our legal responsibility, or that of our subsidiaries, for the liabilities included in any set of financial statement schedules. Holders of
LiLAC Shares
and
Liberty Global Shares
do not have any legal rights related to specific assets attributed to either group and, in any liquidation, holders of
LiLAC Shares
and
Liberty Global Shares
will be entitled to receive a pro rata share of our available net assets based on their respective numbers of liquidation units.
Our board of directors’ ability to reattribute businesses, assets and liabilities between the Liberty Global Group and the
LiLAC Group
may make it difficult to assess the future prospects of the
LiLAC Group
and/or the Liberty Global Group based on past performance.
Our board of directors is vested with discretion to reattribute businesses, assets and liabilities that are attributed to either the
Liberty Global
Group or the
LiLAC Group
to the other group, without the approval of any of our shareholders. Any such reattribution made by our board of directors, as well as the existence of the right in and of itself to effect a reattribution, may impact the ability of investors to assess the future prospects of either group, including liquidity and capital resource needs, based on past performance. Shareholders may also have difficulty evaluating the liquidity and capital resources of one group based on past performance, as our board of directors may use the other group’s liquidity to fund such group’s liquidity and capital expenditure requirements through the use of inter-group loans or other inter-group arrangements.
We could be required to use assets attributed to one group to satisfy liabilities attributed to the other group.
The assets attributed to the
LiLAC Group
are potentially subject to the liabilities attributed to the
Liberty Global
Group, even if those liabilities arise from lawsuits, contracts or indebtedness that are attributed to the
Liberty Global
Group. While our proposed management and allocation policies provide that reattributions of assets between groups will result in the creation of an inter-group loan or an inter-group interest or an offsetting reattribution of cash or other assets, no provision of our articles of association prevents us from satisfying liabilities of the
Liberty Global
Group with assets of the
LiLAC Group
, and our creditors will not in any way be limited by our equity capital structure from proceeding against any assets they could have proceeded against if we did not have such a structure. Holders of
Liberty Global Shares
may face similar considerations in that assets attributed to the
Liberty Global
Group may be required to be used to satisfy liabilities attributed to the
LiLAC Group
.
The market price of the ordinary shares of each group may not reflect the performance of the respective group.
We cannot assure you that the market price of the
LiLAC Shares
will, in fact, reflect the performance of the group of businesses, assets and liabilities attributed to the
LiLAC Group
. Holders of
LiLAC Shares
are ordinary shareholders of our company as a whole and, as such, are subject to all risks (and many of the corresponding benefits) associated with an investment in our company and all of our businesses, assets and liabilities. As a result, the market price of each class of
LiLAC Shares
may be affected by the performance or financial condition of our company as a whole. An adverse market reaction to events relating to the assets and businesses attributed to the
Liberty Global
Group, such as earnings announcements or announcements of new products or services, acquisitions or dispositions that the market does not view favorably, may have an adverse effect on the market price of
LiLAC Shares
. Holders of
Liberty Global Shares
may face similar considerations in that the price of the
Liberty Global Shares
may not reflect the performance of the
Liberty Global
Group alone and may reflect the performance or financial condition of our company as a whole.
The market price of
LiLAC Shares
may be volatile, could fluctuate substantially and could be affected by factors that do not affect traditional ordinary shares.
To the extent the market price of
LiLAC Shares
tracks the performance of more focused groups of businesses, assets and liabilities than the Old
Liberty Global Shares
did prior to the
LiLAC
Transaction, the market prices of any class of
LiLAC Shares
may be more volatile than the market price of Old
Liberty Global
Shares historically was. The market price of
LiLAC Shares
could also be more sensitive to events or developments that are material only for the
LiLAC Group
but would not be material for our company as a whole. The market price of
LiLAC Shares
may be materially affected by, among other things:
|
•
|
a potential discount that investors may apply because the
LiLAC Shares
are issued by a common enterprise, rather than a standalone company;
|
|
•
|
actual or anticipated fluctuations in the
LiLAC Group
’s operating results or in the operating results of particular companies attributable to the group;
|
I-66
|
•
|
events or developments affecting the countries or regions in which the businesses attributed to the
LiLAC Group
operate;
|
|
•
|
potential acquisition activity in the
LiLAC Group
;
|
|
•
|
issuances of debt or equity securities to raise capital by us or the companies in which we invest and the manner in which that debt or the proceeds of an equity issuance are attributed to the
LiLAC Group
;
|
|
•
|
changes in financial estimates by securities analysts regarding the
LiLAC Shares
or the businesses attributed to the
LiLAC Group
;
|
|
•
|
the complex nature and the potential difficulties investors may have in understanding the terms of the
LiLAC Shares
, as well as concerns regarding the possible effect of certain of those terms on an investment in our shares;
|
|
•
|
the lack of market familiarity with tracking shares issued by an English publicly-traded company and of directly applicable legal precedent, given we are not aware of any other English publicly-traded company that has issued such shares; and
|
|
•
|
general market conditions.
|
We have not historically paid any cash dividends, and we may not pay dividends equally or at all on any class of our ordinary shares.
We do not presently intend to pay cash dividends on any class of our ordinary shares for the foreseeable future. However, we have the right to pay dividends, effect securities distributions or make bonus issues on the shares of each of the
Liberty Global
Group and the
LiLAC Group
in equal or unequal amounts, and we may pay dividends, effect securities distributions or make bonus issues on the shares of one group and not pay dividends, effect securities distributions or make bonus issues on shares of the other group. In addition, any dividends or distributions on, or repurchases of, shares relating to either group will reduce our “distributable reserves” (defined as our accumulated, realized profits less accumulated, realized losses, as measured for U.K. statutory purposes) legally available to be paid as dividends by our company under English law on any of our ordinary shares, including on the ordinary shares relating to the other group.
The fiduciary requirements on our board of directors may in certain circumstances mean that our board of directors makes decisions that could adversely affect only some holders of our shares or that have a disparate impact on holders of any of our shares.
Our equity capital structure could give rise to occasions when the interests of holders of
Liberty Global Shares
might diverge or appear to diverge from the interests of holders of
LiLAC Shares
. The
Liberty Global
Group and the
LiLAC Group
are not separate entities and thus holders of
Liberty Global Shares
and
LiLAC Shares
do not have the right to elect separate boards of directors. As a result, our company’s directors owe fiduciary duties under English law to our company as a whole as opposed to only particular shareholders or groups of shareholders, provided that the board’s actions are not found to be unfairly prejudicial to a shareholder’s interests. Decisions deemed to promote the success of the company for the benefit of its shareholders as a whole or otherwise deemed to be in the best interest of our company and all of our shareholders could be viewed as not being in the best interest of particular shareholders or groups of shareholders when considered independently. Examples include:
|
•
|
decisions as to the terms of any business relationships that may be created between the
Liberty Global
Group and the
LiLAC Group
or the terms of any reattributions of businesses, assets and liabilities between the groups;
|
|
•
|
decisions as to the allocation of consideration among the holders of
Liberty Global Shares
and
LiLAC Shares
, or among the classes of shares relating to either of our groups, to be received in connection with a scheme of arrangement involving our company;
|
|
•
|
decisions as to the allocation of corporate opportunities between the groups, especially where the opportunities might meet the strategic business objectives of both groups;
|
|
•
|
decisions as to operational and financial matters that could be considered detrimental to one group but beneficial to the other;
|
|
•
|
decisions resulting in the redesignation, or conversion, of
LiLAC Shares
into
Liberty Global Shares
or deferred shares;
|
I-67
|
•
|
decisions regarding the creation of, and, if created, the subsequent increase or decrease of any inter-group interest or loan that one group may have in or to the other group;
|
|
•
|
decisions as to the internal or external financing attributable to businesses or assets attributed to either of our groups;
|
|
•
|
decisions as to the dispositions of assets of either of our groups; and
|
|
•
|
decisions as to the payment of dividends on the shares or share buybacks relating to either of our groups.
|
Our directors’ or officers’ ownership of
LiLAC Shares
and
Liberty Global Shares
may create or appear to create conflicts of interest.
If our directors or officers own disproportionate interests (in percentage or value terms) in
LiLAC Shares
or
Liberty Global Shares
, that disparity could create or appear to create conflicts of interest when they are faced with decisions that could have different implications for the holders of
LiLAC Shares
or
Liberty Global Shares
.
Our management and allocation policies give our board of directors significant discretion.
Our board of directors has adopted, after shareholder approval, certain management and allocation policies to serve as guidelines in making decisions regarding the relationships between the
Liberty Global
Group and the
LiLAC Group
with respect to matters such as tax liabilities and benefits, inter-group loans, inter-group interests, attribution of assets, financing alternatives, corporate opportunities, payment of dividends and similar items. Our management and allocation policies give our board of directors significant discretion and are subject to change by the board of directors without further shareholder approval. Under these policies, the board of directors has discretion with respect to the recognition or adjustment of inter-group interests that the
Liberty Global
Group may be treated as holding in the
LiLAC Group
. The board’s discretion also extends to determining if, how and to what extent such inter-group interests will be taken into account in connection with any dividend or other distribution on the
LiLAC Shares
, redesignation, or conversion, of
LiLAC Shares
or any other transaction affecting the
LiLAC Shares
. In making such determination, our board of directors may consider any factor that it deems appropriate, including without limitation, the tax effects of any event or transaction or the use of tax benefits. All determinations made by our board of directors in this regard will be final and binding on all holders of our ordinary shares. The broad discretion that these policies accord our board of directors also extends to other matters, including how future corporate opportunities that may present themselves in Latin America, the Caribbean, Europe or elsewhere will be allocated between the
LiLAC Group
and the
Liberty Global
Group.
Our board of directors may, in its sole discretion, elect to redesignate, or convert, all of the
LiLAC Shares
into
Liberty Global Shares
, thereby changing the nature of the investment of holders of
LiLAC Shares
and possibly diluting their economic interest in our company, which could result in a loss of value to them.
Our articles of association permit our board of directors, in its sole discretion, to redesignate, or convert, all of the
LiLAC Shares
into
Liberty Global Shares
. There is no current plan or intention to redesignate, or convert, the
LiLAC Shares
into
Liberty Global Shares
. Our board of directors may elect to exercise this authority at any time if it determines that such redesignation is in the best interests of the company and all of our shareholders. This could occur, for example, if our board of directors determines that the aggregate equity valuation of our company would be increased by eliminating the separate
LiLAC Shares
, or in connection with a sale or other strategic transaction. In addition, our board may determine to effect such redesignation in connection with the sale of all or substantially all of the assets of the
LiLAC Group
. A redesignation would preclude the holders of
LiLAC Shares
from retaining their investment in a security that is intended to reflect separately the performance of the
LiLAC Group
, and result in holders of
Liberty Global Shares
having an investment that includes businesses, assets and liabilities that may not fit their investment objectives. We cannot predict the impact on the market value of our shares of (1) our board of directors’ ability to effect any such redesignation or (2) the exercise of this redesignation right by our board of directors. In addition, our board of directors may effect such a redesignation at a time when the market value of our shares could cause the holders of the
LiLAC Shares
to be disadvantaged.
Under certain circumstances, including in connection with a distribution to holders of
LiLAC Shares
of securities of another corporation, we may reduce the number of
LiLAC Shares
proportionally, thereby reducing the voting power and liquidity of such shares.
Our articles of association permit us to reduce the number of
LiLAC Shares
in connection with certain transactions, including a distribution to holders of
LiLAC Shares
of securities of another corporation or a distribution to holders of
LiLAC Shares
following a disposition of the
LiLAC Group
. We expect that our board of directors would exercise this authority, in its discretion, in
connection with a distribution to holders of
LiLAC Shares
that would materially reduce the amount of assets attributed to the
LiLAC Group
. The purpose of reducing the number of
LiLAC Shares
in this case would be to readjust the per share valuation and the aggregate voting power of the
LiLAC Shares
to reflect the
value of the assets attributed to the
LiLAC Group
following such transaction. Such reduction would further decrease the aggregate voting
power of the
LiLAC Shares
as compared to the
Liberty Global Shares
. We cannot predict the
impact on the market value of
LiLAC Shares
of the possibility of any such reduction in the number of such shares, including any potential effects resulting from reduced liquidity of the remaining
LiLAC Shares
.
I-68
A third-party could acquire control of our company pursuant to an offer to acquire some or all of the
Liberty Global Shares
only, leaving holders of
LiLAC Shares
as minority shareholders.
An offer to acquire shares in our company may be structured such that the offer is made to acquire only the
Liberty Global Shares
. If such an acquisition of
Liberty Global Shares
is successful, this would result
in the holders of the
LiLAC Shares
not sharing in any control premium paid to holders of the
Liberty Global Shares
. In that case, holders of
LiLAC Shares
would continue to be minority shareholders of a company with a third-party majority shareholder, with no ability to vote against such a change, participate in such offer or otherwise realize any control premium.
Holders of
Liberty Global Shares
or
LiLAC Shares
may receive less consideration upon a sale of all or substantially all of the assets attributed to that group than if that group were a separate company.
We cannot assure you whether the per share consideration to be paid to holders of
Liberty Global Shares
or
LiLAC Shares
in connection with a sale of all or substantially all of the assets of the
Liberty Global
Group or the
LiLAC Group
, as applicable, will be equal to or more than the per share value of that share prior to or after the announcement of such a sale. In addition, if the
Liberty Global
Group or the
LiLAC Group
were a separate, independent company and its shares were acquired by another person, certain costs of that sale, including corporate level or withholding or other cross-border taxes, might not be payable in connection with that acquisition. As a result, shareholders of a separate, independent company with the same assets might receive a greater amount of proceeds than the holders of
Liberty Global Shares
or
LiLAC Shares
, as applicable, would receive upon a sale of all or substantially all of the assets attributed to such group. Further, there is no requirement that the consideration paid be tax-free to the holders of the shares relating to that group. Accordingly, if we sell all or substantially all of the assets attributed to the
Liberty Global
Group or the
LiLAC Group
, the holders of the
Liberty Global Shares
or
LiLAC Shares
, as applicable, could suffer a loss in the value of their investment in our company.
Certain protections that our articles of association provide to holders of
LiLAC Shares
in connection with a sale of not less than 80% of the fair value of the assets of, or equity interests in, the
LiLAC Group
may not apply if we do not have sufficient distributable reserves or share premium available following such disposition.
Our articles of association provide that in connection with a disposition of not less than 80% of the fair value of the assets of, or equity interests in, the
LiLAC Group
, subject to certain exempt dispositions, our board of directors will be required to distribute cash or other assets with a fair value equal to the available net proceeds of such disposition to holders of
LiLAC Shares
(with or without a concurrent proportional reduction in the number of outstanding
LiLAC Shares
), redesignate, or convert, a portion of
LiLAC Shares
into Liberty Global Shares at a 10% premium, or do a combination of the foregoing. However, our company’s ability to take any of such actions at the time may depend (and in the case of a dividend or other distribution, will depend) on the availability of sufficient distributable reserves for the payment of a dividend or other distribution or sufficient share premium required for the creation of additional shares. If sufficient distributable reserves or share premium are not available at the time of the disposition, our board of directors will be permitted to effect the disposition without distributing an amount equal to the net proceeds of such disposition to holders of
LiLAC Shares
or redesignating
LiLAC Shares
into
Liberty Global Shares
, subject to the board’s fiduciary duties.
In the event of a liquidation of Liberty Global, neither holders of
Liberty Global Shares
nor holders of
LiLAC Shares
will have priority with respect to the assets attributed to the respective group remaining for distribution to shareholders.
Under our articles of association, upon
Liberty Global
’s liquidation, dissolution or winding up, holders of the
LiLAC Shares
will be entitled to receive, in respect of their respective shares, their proportionate interest in all of Liberty Global’s assets, if any, remaining for distribution to holders of ordinary shares in proportion to their respective number of “liquidation units.” Pursuant to the terms of our articles of association, the liquidation units for each Liberty Global Share and each
LiLAC
Share are
1
and
0.94893
, respectively. Hence, the assets to be distributed to a holder of
LiLAC Shares
upon a liquidation, dissolution or winding up of
Liberty Global
will not directly relate to the value of the assets attributed to the
LiLAC Group
and will not reflect changes in the relative value of the
Liberty Global
Group and the
LiLAC Group
over time. Holders of the
Liberty Global Shares
may face similar considerations in the event of a liquidation in that any distribution to them upon a liquidation, dissolution or winding up may not directly relate to the value of the assets attributed to the Liberty Global Group and will not reflect changes to the relative values of the groups over time.
Holders of
LiLAC Shares
have separate voting rights only on a limited set of matters and could be outvoted by holders of
Liberty Global Shares
on all other matters.
Holders of
Liberty Global Shares
and
LiLAC Shares
vote together as a single class, except in certain limited circumstances prescribed by our articles of association or as required by English law. Each Class B ordinary share of each group has ten votes, and each Class A ordinary share of each group has one vote. Holders of Class C ordinary shares of each group have no voting rights at general meetings of the company or meetings of all of the shares relating to one group. When holders of
Liberty Global Shares
and
LiLAC Shares
vote together as a single class, holders having a majority of the votes (or 75%, in the case of a vote requiring a special resolution) present and voting will be in a position to control the outcome of the vote even if the matter involves a conflict of interest among our shareholders or has a greater impact on one group than the other. As of February 10, 2017, holders of
Liberty Global Shares
collectively directed approximately 84.0% of the aggregate voting power in our company, and holders of
LiLAC Shares
collectively directed approximately 16.0% of the aggregate voting power in our company.
I-69
Our equity capital structure, as well as the fact that the
LiLAC Group
and the Liberty Global Group are not independent companies, may inhibit or prevent acquisition bids for either group and may make it difficult for a third-party to acquire us, even if doing so may be beneficial to our shareholders.
If the
LiLAC Group
and the
Liberty Global
Group were separate independent companies, any person interested in acquiring the
LiLAC Group
or the
Liberty Global
Group without negotiating with management could seek control of that group by obtaining control of its outstanding voting shares, by means of a tender offer, or by means of a scheme of arrangement. Although we intend for the
LiLAC Shares
to reflect the separate economic performance of the
LiLAC Group
, neither the
LiLAC Group
nor the
Liberty Global
Group are separate entities, and a person interested in acquiring only one group without negotiating with our management could obtain control of that group only by obtaining control of a majority in voting power of all of the outstanding voting shares of our company. The existence of shares, and different classes of shares, relating to different groups could present complexities and in certain circumstances pose obstacles, financial and otherwise, to an acquiring person that are not present in companies that do not have capital structures similar to ours.
Other Factors
The loss of certain key personnel could harm our business.
We have experienced employees at both the corporate and operational levels who possess substantial knowledge of our business and operations. We cannot assure you that we will be successful in retaining their services or that we would be successful in hiring and training suitable replacements without undue costs or delays. As a result, the loss of any of these key employees could cause significant disruptions in our business operations, which could materially adversely affect our results of operations.
John C. Malone has significant voting power with respect to corporate matters considered by our shareholders.
John C. Malone beneficially owns outstanding ordinary shares of
Liberty Global
representing 25.4% of our aggregate voting power as of February 10, 2017. By virtue of Mr. Malone’s voting power in our company, as well as his position as Chairman of our board of directors, Mr. Malone may have significant influence over the outcome of any corporate transaction or other matters submitted to our shareholders for approval. For example, under English law and our articles of association, certain matters (including amendments to the articles of association) require the approval of 75% of the shareholders who vote (in person or by proxy) on the relevant resolution, and other certain corporate transactions or matters may require the approval of at least 75% of the outstanding shares of each class of our ordinary shares. Because Mr. Malone beneficially owns approximately 25.4% of our aggregate voting power and more than 75% of the outstanding Class B ordinary shares of each of the Liberty Global Group and the
LiLAC Group
, he has the ability to prevent the requisite approval threshold from being met even though the other shareholders may determine that such action or transaction is beneficial for the Company. Mr. Malone’s rights to vote or dispose of his equity interests in our company are not subject to any restrictions in favor of us other than as may be required by applicable law and except for customary transfer restrictions pursuant to equity award agreements.
It may be difficult for a third-party to acquire us, even if doing so may be beneficial to our shareholders.
Certain provisions of our articles of association and of English law may discourage, delay, or prevent a change in control of our company that a shareholder may consider favorable. These provisions include the following:
|
•
|
authorizing a capital structure with multiple classes of ordinary shares; two tracking groups, each with a Class B that entitles the holders to 10 votes per share; a Class A that entitles the holders to one vote per share; and a Class C that, except as otherwise required by applicable law, entitles the holders to no voting rights;
|
|
•
|
authorizing the issuance of “blank check” shares (both ordinary and preference), which could be issued by our board of directors to increase the number of outstanding shares and thwart a takeover attempt;
|
|
•
|
classifying our board of directors with staggered three-year terms, which may lengthen the time required to gain control of our board of directors, although under English law, shareholders of our company can remove a director without cause by ordinary resolution;
|
|
•
|
prohibiting shareholder action by written resolution, thereby requiring all shareholder actions to be taken at a meeting of the shareholders;
|
|
•
|
requiring the approval of 75% in value of the shareholders (or class of shareholders) and/or English court approval for certain statutory mergers or schemes of arrangements;
and
|
|
•
|
establishing advance notice requirements for nominations of candidates for election to our board of directors or for proposing matters that can be acted upon by shareholders at shareholder meetings.
|
I-70
Change in control provisions in our incentive plans and related award agreements or in executive employment agreements may also discourage, delay, or prevent a change in control of our company, even if such change of control would be in the best interests of our shareholders.
The enforcement of civil liabilities against us may be more difficult.
Because we are a public limited company incorporated under the laws of England and Wales, investors could experience more difficulty enforcing judgments obtained against us in
U.S.
courts than would currently be the case for
U.S.
judgments obtained against a
U.S.
company. It may also be more difficult (or impossible) to bring some types of claims against us in courts sitting in England than it would be to bring similar claims against a
U.S.
company in a
U.S.
court. In particular, English law significantly limits the circumstances under which shareholders of English companies may bring derivative actions. Under English law generally, only the Company can be the proper plaintiff in proceedings in respect of wrongful acts committed against us. Our articles of association provide for the exclusive jurisdiction of the English courts for shareholder lawsuits against us or our directors.
None.
During
2016
, we leased our corporate offices in London,
U.K.
, in Denver, Colorado, U.S. and in Amsterdam, the Netherlands. We also own our sub-sea network in the Caribbean. All of our other real or personal property is owned or leased by our subsidiaries and affiliates.
Our subsidiaries and affiliates own or lease the fixed assets necessary for the operation of their respective businesses, including office space, transponder space, headend facilities, rights of way, cable television and telecommunications distribution equipment, telecommunications switches, base stations, cell towers and customer premises equipment and other property necessary for their operations. The physical components of their broadband networks require maintenance and periodic upgrades to support the new services and products they introduce. Subject to these maintenance and upgrade activities, our management believes that our current facilities are suitable and adequate for our business operations for the foreseeable future.
From time to time, our subsidiaries and affiliates have become involved in litigation relating to claims arising out of their operations in the normal course of business. For additional information, see note
17
to our consolidated financial statements in Part II of this Annual Report on Form 10-K.
Not applicable.
I-71
|
Item 5.
|
MARKET FOR REGISTRANT’S COMMON EQUITY, RELATED SHAREHOLDER MATTERS AND ISSUER PURCHASES OF EQUITY SECURITIES
|
General
The capitalized terms used in Part II of this Annual Report on Form 10-K are defined in the notes to our consolidated financial statements. In the following text, the terms “we,” “our,” “our company” and “us” may refer, as the context requires, to
Liberty Global
or collectively to
Liberty Global
and its subsidiaries.
Market Information
Our share capital comprises
Liberty Global
Class A, Class B and Class C ordinary shares and
LiLAC
Class A, Class B and Class C ordinary shares. Our
Liberty Global
Class A, Class B and Class C and
LiLAC
Class A and Class C ordinary shares trade on the NASDAQ Global Select Market under the symbols “LBTYA,” “LBTYB,” “LBTYK,” “LILA” and “LILAK,” respectively, and our
LiLAC
Class B ordinary shares trade on the OTC Link under the symbol “LILAB.” The following table sets forth the range of high and low sales prices of
Liberty Global
Class A, Class B and Class C and
LiLAC
Class A, Class B and Class C ordinary shares for the periods indicated.
|
|
Class A
|
Class B
|
Class C
|
|||||||||||||||||||||
|
|
High
|
Low
|
High
|
Low
|
High
|
Low
|
||||||||||||||||||
|
Liberty Global Shares / Old Liberty Global Shares (a) (b):
|
||||||||||||||||||||||||
|
Year ended December 31, 2016
|
||||||||||||||||||||||||
|
First quarter
|
$
|
33.66
|
|
$
|
27.39
|
|
$
|
43.54
|
|
$
|
31.34
|
|
$
|
35.18
|
|
$
|
26.51
|
|
||||||
|
Second quarter
|
$
|
34.69
|
|
$
|
26.99
|
|
$
|
40.42
|
|
$
|
27.62
|
|
$
|
33.69
|
|
$
|
26.71
|
|
||||||
|
Third quarter
|
$
|
34.43
|
|
$
|
27.49
|
|
$
|
36.51
|
|
$
|
27.66
|
|
$
|
33.40
|
|
$
|
27.01
|
|
||||||
|
Fourth quarter
|
$
|
34.19
|
|
$
|
29.55
|
|
$
|
37.52
|
|
$
|
29.95
|
|
$
|
33.06
|
|
$
|
28.47
|
|
||||||
|
Year ended December 31, 2015
|
||||||||||||||||||||||||
|
First quarter
|
$
|
55.63
|
|
$
|
46.40
|
|
$
|
54.85
|
|
$
|
45.42
|
|
$
|
53.38
|
|
$
|
45.08
|
|
||||||
|
Second quarter
|
$
|
58.48
|
|
$
|
50.23
|
|
$
|
56.81
|
|
$
|
50.25
|
|
$
|
54.41
|
|
$
|
48.22
|
|
||||||
|
Third quarter
|
$
|
54.47
|
|
$
|
42.49
|
|
$
|
56.70
|
|
$
|
47.50
|
|
$
|
51.10
|
|
$
|
40.70
|
|
||||||
|
Fourth quarter
|
$
|
46.40
|
|
$
|
38.86
|
|
$
|
47.09
|
|
$
|
40.65
|
|
$
|
44.54
|
|
$
|
37.50
|
|
||||||
|
LiLAC Shares (a) (b):
|
||||||||||||||||||||||||
|
Year ended December 31, 2016
|
||||||||||||||||||||||||
|
First quarter
|
$
|
39.10
|
|
$
|
32.01
|
|
$
|
39.98
|
|
$
|
39.98
|
|
$
|
41.30
|
|
$
|
34.22
|
|
||||||
|
Second quarter
|
$
|
41.17
|
|
$
|
32.06
|
|
$
|
55.00
|
|
$
|
35.62
|
|
$
|
42.98
|
|
$
|
32.07
|
|
||||||
|
Third quarter
|
$
|
36.27
|
|
$
|
26.54
|
|
$
|
35.62
|
|
$
|
27.01
|
|
$
|
36.67
|
|
$
|
27.23
|
|
||||||
|
Fourth quarter
|
$
|
28.38
|
|
$
|
19.10
|
|
$
|
28.80
|
|
$
|
20.48
|
|
$
|
28.74
|
|
$
|
19.37
|
|
||||||
|
Year ended December 31, 2015
|
||||||||||||||||||||||||
|
Third quarter
|
$
|
50.00
|
|
$
|
32.25
|
|
$
|
48.80
|
|
$
|
34.00
|
|
$
|
48.90
|
|
$
|
32.25
|
|
||||||
|
Fourth quarter
|
$
|
41.37
|
|
$
|
33.00
|
|
$
|
39.98
|
|
$
|
34.38
|
|
$
|
43.00
|
|
$
|
33.83
|
|
||||||
_______________
|
(a)
|
On July 1, 2015, in connection with the issuance of LiLAC Shares pursuant to the
LiLAC Transaction
, we reclassified our then outstanding
Old Liberty Global Shares
into corresponding classes of
Liberty Global Shares
. Consistent with the treatment of the
LiLAC Transaction
in our consolidated financial statements, the share price information of
Old Liberty Global Shares
for periods prior to July 1, 2015 has not been retroactively revised.
|
|
(b)
|
On July 1, 2016, we completed the
LiLAC Distribution
. The share price information presented herein for periods prior to July 1, 2016 has not been retroactively revised. Prices for LiLAC Class B ordinary shares reflect inter-dealer prices without retail mark-up, mark-down or actual transactions
|
II-1
Holders
The numbers of record holders of our ordinary shares as of
February 10, 2017
are set forth below:
|
Record Holders (a)
|
||||||||
|
Class A
|
Class B
|
Class C
|
||||||
|
Liberty Global Shares
|
580
|
|
9
|
|
667
|
|
||
|
LiLAC Shares
|
317
|
|
5
|
|
499
|
|
||
_______________
|
(a)
|
Amounts do not include the number of shareholders whose shares are nominally held by banks, brokerage houses or other institutions, but include each such institution as one record holder.
|
Dividends
We have not paid any cash dividends on any of our ordinary shares, and we have no present intention of doing so. Any future payment of cash dividends will be determined by our board of directors in light of our earnings, financial condition and other relevant considerations including applicable laws in England and Wales. Except as noted below, there are currently no contractual restrictions on our ability to pay dividends in cash or shares. The credit facilities to which certain of our subsidiaries are parties restrict our ability to access their cash for, among other things, our payment of cash dividends.
Recent Sales of Unregistered Securities; Use of Proceeds from Registered Securities
None.
II-2
Issuer Purchase of Equity Securities
The following table sets forth information regarding our company’s purchase of its own equity securities during the three months ended
December 31, 2016
:
|
Total number of
shares repurchased
|
Average price
paid per share (a)
|
Total number of shares
repurchased as part of
publicly-announced
programs
|
Value
of shares
that may
yet be
repurchased
under the
programs
|
|||||||||||||||
|
Liberty Global Shares:
|
||||||||||||||||||
|
October 1, 2016 through October 31, 2016
|
Class A:
|
3,067,300
|
|
Class A:
|
$
|
32.11
|
|
Class A:
|
3,067,300
|
|
(b)
|
|||||||
|
Class C:
|
1,099,100
|
|
Class C:
|
$
|
32.58
|
|
Class C:
|
1,099,100
|
|
(b)
|
||||||||
|
|
|
|||||||||||||||||
|
November 1, 2016 through November 30, 2016
|
Class A:
|
2,846,800
|
|
Class A:
|
$
|
31.99
|
|
Class A:
|
2,846,800
|
|
(b)
|
|||||||
|
Class C:
|
1,572,300
|
|
Class C:
|
$
|
31.49
|
|
Class C:
|
1,572,300
|
|
(b)
|
||||||||
|
|
|
|||||||||||||||||
|
December 1, 2016 through December 31, 2016
|
Class A:
|
786,800
|
|
Class A:
|
$
|
30.41
|
|
Class A:
|
786,800
|
|
(b)
|
|||||||
|
Class C:
|
5,184,900
|
|
Class C:
|
$
|
29.63
|
|
Class C:
|
5,184,900
|
|
(b)
|
||||||||
|
Total Liberty Global Shares — October 1, 2016 through December 31, 2016
|
Class A:
|
6,700,900
|
|
Class A:
|
$
|
31.86
|
|
Class A:
|
6,700,900
|
|
(b)
|
|||||||
|
Class C:
|
7,856,300
|
|
Class C:
|
$
|
30.41
|
|
Class C:
|
7,856,300
|
|
(b)
|
||||||||
|
LiLAC Shares:
|
|
|
||||||||||||||||
|
November 1, 2016 through November 30, 2016
|
Class A:
|
669,000
|
|
Class A:
|
$
|
20.61
|
|
Class A:
|
669,000
|
|
(c)
|
|||||||
|
Class C:
|
—
|
|
Class C:
|
$
|
—
|
|
Class C:
|
—
|
|
(c)
|
||||||||
|
|
|
|||||||||||||||||
|
December 1, 2016 through December 31, 2016
|
Class A:
|
51,800
|
|
Class A:
|
$
|
21.17
|
|
Class A:
|
51,800
|
|
(c)
|
|||||||
|
Class C:
|
313,647
|
|
Class C:
|
$
|
21.19
|
|
Class C:
|
313,647
|
|
(c)
|
||||||||
|
|
|
|||||||||||||||||
|
Total LiLAC Shares — October 1, 2016 through December 31, 2016
|
Class A:
|
720,800
|
|
Class A:
|
$
|
20.65
|
|
Class A:
|
720,800
|
|
(c)
|
|||||||
|
Class C:
|
313,647
|
|
Class C:
|
$
|
21.19
|
|
Class C:
|
313,647
|
|
(c)
|
||||||||
_______________
|
(a)
|
Average price paid per share includes direct acquisition costs.
|
|
(b)
|
As of
December 31, 2016
, the remaining amount authorized for repurchases of
Liberty Global Shares
was
$1,943.4 million
. Subsequent to
December 31, 2016
, our board of directors increased the amount authorized under the share repurchase program for our
Liberty Global Shares
by
$1.0 billion
.
|
|
(c)
|
As of
December 31, 2016
, the remaining amount authorized for repurchases of
LiLAC Shares
was
$278.6 million
.
|
II-3
Stock Performance Graphs
The following graph compares the changes in the cumulative total shareholder return on our Liberty Global Class A, Class B and Class C ordinary shares from January 1, 2012 to December 31, 2016, to the change in the cumulative total return on the ICB 6500 Telecommunications and the Nasdaq US Benchmark TR Index (assuming reinvestment of dividends, where applicable). The performance presented below includes (i) the share prices of Liberty Global Inc’s Series A, Series B and Series C common stock prior to the June 7, 2013 acquisition of
Virgin Media
and (ii) the retrospective impact of the July 1, 2015
LiLAC Transaction
. The performance presented below for periods prior to July 1, 2016 has not been retroactively revised for the
LiLAC Distribution
. The graph assumes that $100 was invested on January 1, 2012.
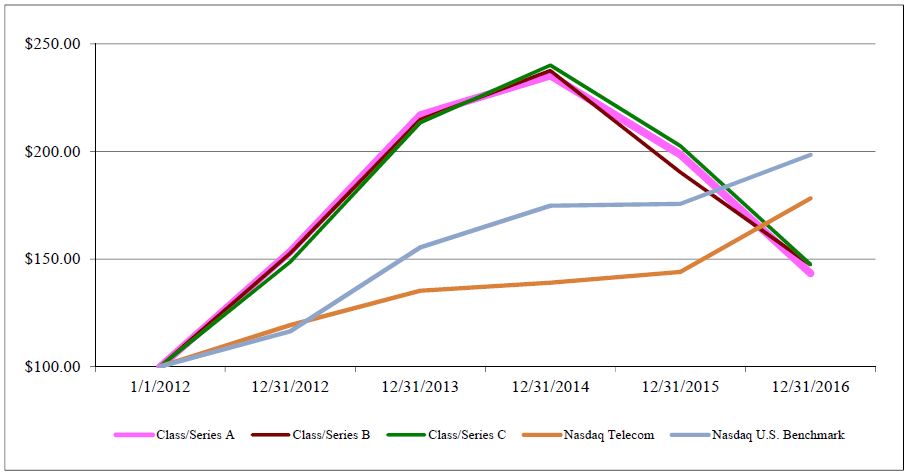
|
|
December 31,
|
||||||||||||||||||
|
|
2012
|
2013
|
2014
|
2015
|
2016
|
||||||||||||||
|
Liberty Global Shares - Class/Series A
|
$
|
153.45
|
|
$
|
216.91
|
|
$
|
235.36
|
|
$
|
198.58
|
|
$
|
143.40
|
|
||||
|
Liberty Global Shares - Class/Series B
|
$
|
152.80
|
|
$
|
214.74
|
|
$
|
237.59
|
|
$
|
190.38
|
|
$
|
147.29
|
|
||||
|
Liberty Global Shares - Class/Series C
|
$
|
148.66
|
|
$
|
213.36
|
|
$
|
240.06
|
|
$
|
202.59
|
|
$
|
147.59
|
|
||||
|
ICB 6500 Telecommunications
|
$
|
119.30
|
|
$
|
135.29
|
|
$
|
138.98
|
|
$
|
143.98
|
|
$
|
178.20
|
|
||||
|
Nasdaq US Benchmark TR Index
|
$
|
116.43
|
|
$
|
155.41
|
|
$
|
174.78
|
|
$
|
175.62
|
|
$
|
198.47
|
|
||||
II-4
The following graph compares the changes in the cumulative total shareholder return on our LiLAC Class A, Class B and Class C ordinary shares from July 2, 2015 (the day following the creation of the
LiLAC Group
tracking shares) to December 31, 2016, to the change in the cumulative total return on the ICB 6500 Telecommunications and the Nasdaq US Benchmark TR Index (assuming reinvestment of dividends, where applicable). The performance presented below for periods prior to July 1, 2016 has not been retroactively revised for the
LiLAC Distribution
. The graph assumes that $100 was invested on July 2, 2015.
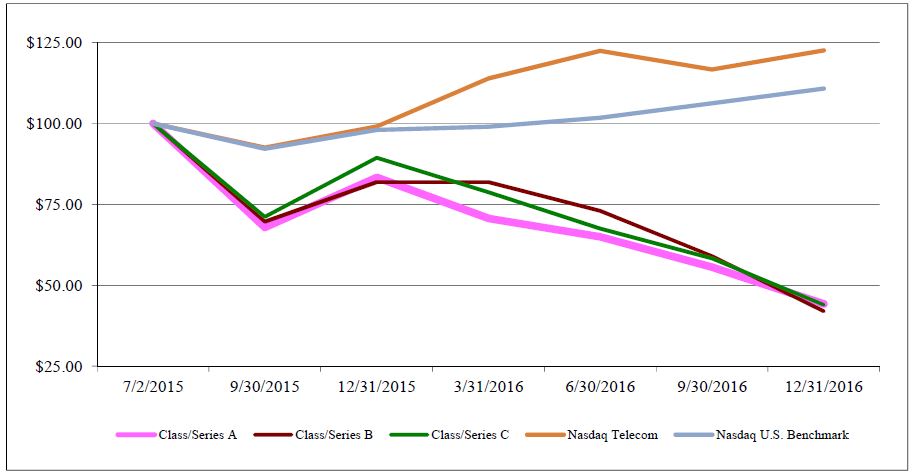
|
|
September 30, 2015
|
December 31, 2015
|
March 31, 2016
|
June 30, 2016
|
September 30, 2016
|
December 31, 2016
|
||||||||||||||||||
|
LiLAC Shares - Class A
|
$
|
67.91
|
|
$
|
83.29
|
|
$
|
70.67
|
|
$
|
65.03
|
|
$
|
55.61
|
|
$
|
44.27
|
|
||||||
|
LiLAC Shares - Class B
|
$
|
69.67
|
|
$
|
81.93
|
|
$
|
81.93
|
|
$
|
72.99
|
|
$
|
59.02
|
|
$
|
41.97
|
|
||||||
|
LiLAC Shares - Class C
|
$
|
71.19
|
|
$
|
89.40
|
|
$
|
78.75
|
|
$
|
67.55
|
|
$
|
58.32
|
|
$
|
44.01
|
|
||||||
|
ICB 6500 Telecommunications
|
$
|
92.58
|
|
$
|
99.06
|
|
$
|
113.94
|
|
$
|
122.43
|
|
$
|
116.70
|
|
$
|
122.61
|
|
||||||
|
Nasdaq US Benchmark TR Index
|
$
|
92.22
|
|
$
|
98.05
|
|
$
|
99.02
|
|
$
|
101.76
|
|
$
|
106.27
|
|
$
|
110.81
|
|
||||||
II-5
The following tables present selected historical financial information of
Liberty Global
and its consolidated subsidiaries. The following selected financial data was derived from our consolidated financial statements as of and for the years ended
December 31, 2016
,
2015
,
2014
,
2013
and
2012
. This information is only a summary and should be read together with our
Management’s Discussion and Analysis of Financial Condition and Results of Operations
and consolidated financial statements included elsewhere herein.
|
|
December 31,
|
|||||||||||||||||||
|
|
2016
|
2015
|
2014
|
2013
|
2012
|
|||||||||||||||
|
|
in millions
|
|||||||||||||||||||
|
Summary Balance Sheet Data (a):
|
||||||||||||||||||||
|
Investments
|
$
|
6,483.7
|
|
$
|
2,839.6
|
|
$
|
1,808.2
|
|
$
|
3,491.2
|
|
$
|
950.1
|
|
|||||
|
Property and equipment, net
|
$
|
21,110.2
|
|
$
|
21,684.0
|
|
$
|
23,840.6
|
|
$
|
23,974.9
|
|
$
|
13,437.6
|
|
|||||
|
Goodwill
|
$
|
23,366.3
|
|
$
|
27,020.4
|
|
$
|
29,001.6
|
|
$
|
23,748.8
|
|
$
|
13,877.6
|
|
|||||
|
Total assets
|
$
|
68,684.1
|
|
$
|
67,559.0
|
|
$
|
72,496.4
|
|
$
|
67,321.5
|
|
$
|
38,046.1
|
|
|||||
|
Debt and capital lease obligations, including current portion
|
$
|
43,558.7
|
|
$
|
46,749.1
|
|
$
|
45,813.5
|
|
$
|
44,311.5
|
|
$
|
27,262.9
|
|
|||||
|
Total equity
|
$
|
14,732.0
|
|
$
|
10,174.3
|
|
$
|
14,116.0
|
|
$
|
11,541.5
|
|
$
|
2,085.1
|
|
|||||
|
|
Year ended December 31,
|
|||||||||||||||||||
|
|
2016
|
2015
|
2014
|
2013
|
2012
|
|||||||||||||||
|
|
in millions, except per share amounts
|
|||||||||||||||||||
|
Summary Statement of Operations Data (a):
|
||||||||||||||||||||
|
Revenue
|
$
|
20,008.8
|
|
$
|
18,280.0
|
|
$
|
18,248.3
|
|
$
|
14,474.2
|
|
$
|
9,930.8
|
|
|||||
|
Operating income
|
$
|
2,801.3
|
|
$
|
2,349.2
|
|
$
|
2,228.2
|
|
$
|
2,012.1
|
|
$
|
1,983.1
|
|
|||||
|
Earnings (loss) from continuing operations (b)
|
$
|
1,767.3
|
|
$
|
(1,049.5
|
)
|
$
|
(980.9
|
)
|
$
|
(882.0
|
)
|
$
|
(583.9
|
)
|
|||||
|
Earnings (loss) from continuing operations attributable to Liberty Global shareholders
|
$
|
1,705.3
|
|
$
|
(1,152.5
|
)
|
$
|
(1,028.5
|
)
|
$
|
(937.6
|
)
|
$
|
(623.7
|
)
|
|||||
|
Basic earnings (loss) from continuing operations attributable to Liberty Global shareholders per share:
|
||||||||||||||||||||
|
Liberty Global Shares (c)
|
$
|
2.18
|
|
$
|
(0.19
|
)
|
||||||||||||||
|
LiLAC Shares (c)
|
$
|
(2.13
|
)
|
$
|
0.39
|
|
||||||||||||||
|
Old Liberty Global Shares (d)
|
$
|
(1.13
|
)
|
$
|
(1.29
|
)
|
$
|
(1.39
|
)
|
$
|
(1.17
|
)
|
||||||||
|
Diluted earnings (loss) from continuing operations attributable to Liberty Global shareholders per share:
|
||||||||||||||||||||
|
Liberty Global Shares (c)
|
$
|
2.16
|
|
$
|
(0.19
|
)
|
||||||||||||||
|
LiLAC Shares (c)
|
$
|
(2.13
|
)
|
$
|
0.39
|
|
||||||||||||||
|
Old Liberty Global Shares (d)
|
$
|
(1.13
|
)
|
$
|
(1.29
|
)
|
$
|
(1.39
|
)
|
$
|
(1.17
|
)
|
||||||||
_______________
|
(a)
|
We acquired
CWC
on May 16, 2016,
BASE
on February 11, 2016,
Choice
on June 3, 2015,
Ziggo
on November 11, 2014,
Virgin Media
on June 7, 2013 and
OneLink
on November 8, 2012. We also completed a number of less significant acquisitions during the years presented. On December 31, 2016, we completed the
Dutch JV Transaction
, pursuant to which we contributed
Ziggo Group Holding
to the
Dutch JV
. We sold the
Chellomedia Disposal Group
on January 31, 2014 and Austar United Communications Limited (
Austar
) on May 23, 2012. Accordingly, our summary statement of operations data presents the
Chellomedia Disposal Group
and
Austar
as discontinued operations during the applicable periods. For information regarding (i) our acquisitions and (ii) the
Dutch JV Transaction
and our discontinued operation during the past three years, see notes
4
and
5
, respectively, to our consolidated financial statements.
|
II-6
|
(b)
|
Includes earnings from continuing operations attributable to noncontrolling interests of
$62.0 million
,
$103.0 million
,
$47.6 million
,
$55.6 million
and
$39.8 million
, respectively.
|
|
(c)
|
The amounts presented for 2015 relate to the period from July 1, 2015 through December 31, 2015.
|
|
(d)
|
The amount presented for 2015 relates to the period from January 1, 2015 through June 30, 2015.
|
II-7
|
Item 7.
|
MANAGEMENT’S DISCUSSION AND ANALYSIS OF FINANCIAL CONDITION AND RESULTS OF OPERATIONS
|
The following discussion and analysis, which should be read in conjunction with our consolidated financial statements, is intended to assist in providing an understanding of our results of operations and financial condition and is organized as follows:
|
•
|
Overview.
This section provides a general description of our business and recent events.
|
|
•
|
Results of Operations.
This section provides an analysis of our results of operations for the years ended
December 31, 2016
,
2015
and
2014
.
|
|
•
|
Liquidity and Capital Resources.
This section provides an analysis of our corporate and subsidiary liquidity, consolidated statements of cash flows and contractual commitments.
|
|
•
|
Critical Accounting Policies, Judgments and Estimates.
This section discusses those material accounting policies that involve uncertainties and require significant judgment in their application.
|
|
•
|
Quantitative and Qualitative Disclosures about Market Risk.
This section provides discussion and analysis of the foreign currency, interest rate and other market risk that our company faces.
|
Unless otherwise indicated, convenience translations into
U.S.
dollars are calculated, and operational data (including subscriber statistics) is presented, as of
December 31, 2016
.
Overview
General
We are an international provider of video, broadband internet, fixed-line telephony and mobile services, with consolidated operations at
December 31, 2016
in more than
30
countries. We provide residential and
B2B
services in (i) the
U.K.
and Ireland through
Virgin Media
, (ii) Germany through
Unitymedia
, (iii) Belgium through
Telenet
and (iv)
seven
other European countries through
UPC Holding
. In addition, through the December 31, 2016 completion of the
Dutch JV Transaction
, we provided residential and B2B services in the Netherlands through
Ziggo Group Holding
. The operations of
Virgin Media
,
Unitymedia
,
Telenet
,
UPC Holding
and, through December 31, 2016,
Ziggo Group Holding
are collectively referred to herein as the “
European Division
.” In addition, we provide residential and B2B services in (a)
18
countries, predominantly in Latin America and the Caribbean, through
CWC
, (b) Chile through
VTR
and (c) Puerto Rico through
Liberty Puerto Rico
.
CWC
also provides (1) B2B services in certain other countries in Latin America and the Caribbean and (2) wholesale services over its sub-sea and terrestrial networks that connect over
30
markets in that region. The operations of
CWC
,
VTR
and
Liberty Puerto Rico
are collectively referred to herein as the “
LiLAC Division
.” In the following discussion and analysis, the term “
LiLAC Group
” refers to our operations in Latin American and the Caribbean, and the term “
Liberty Global Group
” refers to our operations not attributed to the
LiLAC Group
. For additional information regarding the
Liberty Global Group
and the
LiLAC Group
, see note
1
to our consolidated financial statements.
Operations
At
December 31, 2016
, we owned and operated networks that passed
50,019,900
homes and served
50,159,700
revenue generating units (
RGU
s
), consisting of
20,198,100
video subscribers,
16,357,500
broadband internet subscribers and
13,604,100
fixed-line telephony subscribers. In addition, at
December 31, 2016
, we serve
d
10,256,800
mobile subscribers.
II-8
The following table provides details of our organic RGU and mobile subscriber changes for the years indicated. The subscriber data provided below excludes the effect of acquisitions (
RGU
s and mobile subscribers added on the acquisition date) and other non-organic adjustments, but includes post-acquisition date
RGU
and mobile subscriber additions or losses.
|
Year ended December 31,
|
|||||||||
|
2016 (a)
|
2015
|
2014
|
|||||||
|
Organic RGU additions (losses):
|
|||||||||
|
Video:
|
|||||||||
|
Basic
|
(511,600
|
)
|
(606,100
|
)
|
(674,100
|
)
|
|||
|
Enhanced
|
233,000
|
|
175,700
|
|
454,600
|
|
|||
|
DTH
|
13,300
|
|
46,100
|
|
4,400
|
|
|||
|
Total video
|
(265,300
|
)
|
(384,300
|
)
|
(215,100
|
)
|
|||
|
Broadband internet
|
821,800
|
|
734,000
|
|
905,000
|
|
|||
|
Fixed-line telephony
|
483,600
|
|
528,300
|
|
597,300
|
|
|||
|
Total organic RGU additions
|
1,040,100
|
|
878,000
|
|
1,287,200
|
|
|||
|
Organic mobile subscriber additions (losses):
|
|||||||||
|
Prepaid
|
(230,900
|
)
|
464,300
|
|
(173,700
|
)
|
|||
|
Postpaid
|
435,200
|
|
(196,700
|
)
|
510,200
|
|
|||
|
Total organic mobile subscriber additions
|
204,300
|
|
267,600
|
|
336,500
|
|
|||
_______________
|
(a)
|
Includes organic changes of
Ziggo Group Holding
through the December 31, 2016 completion of the
Dutch JV Transaction
.
|
Video services.
We provide video services in most of our residential markets and, for most of our customers, we have enhanced our video offerings with various products that enable such customers to control when they watch their programming. These products range from digital video recorders to multimedia home gateway systems capable of distributing video, voice and data content throughout the home and to multiple devices.
Broadband internet services.
In all of our broadband communications markets, we offer multiple tiers of broadband internet service with available maximum download speeds as high as 500 Mbps or more depending on location.
We continue to invest in new technologies that allow us to increase the internet speeds we offer to our customers.
Fixed-line telephony services.
We offer fixed-line telephony services in substantially all of our broadband communications markets, via either voice-over-internet-protocol or “
VoIP
” technology or circuit-switched telephony, depending on location.
Mobile services.
We offer voice and data mobile services through
MVNO
networks or our own networks in most of our broadband communications markets. We offer mobile services as an
MVNO
over third-party networks in the
U.K.
, Germany, Belgium, Switzerland, Austria, Ireland, Hungary and Chile. Following the February 2016 acquisition of
BASE
, Telenet became a mobile network provider in Belgium and plans to migrate its mobile subscribers to the
BASE
network prior to the termination of its
MVNO
agreement at the end of 2018. We are a mobile network provider in Panama and many Caribbean markets, including the Bahamas and Jamaica.
B2B
services.
Most of our operations also provide
B2B
services, including voice, broadband internet, data, video, wireless and cloud services.
For additional information regarding the details of our products and services, see
Item 1. Business
included in Part I of this Annual Report on Form 10-K.
Strategy and management focus
From a strategic perspective, we are seeking to build broadband communications and mobile businesses that have strong prospects for future growth. As discussed further under
Liquidity and Capital Resources — Capitalization
below, we also seek to maintain our debt at levels that provide for attractive equity returns without assuming undue risk.
II-9
We strive to achieve organic revenue and customer growth in our operations by developing and marketing bundled entertainment and information and communications services, and extending and upgrading the quality of our networks where appropriate. As we use the term, organic growth excludes foreign currency translation effects (
FX
) and the estimated impact of acquisitions. While we seek to increase our customer base, we also seek to maximize the average revenue we receive from each household by increasing the penetration of our digital video, broadband internet, fixed-line telephony and mobile services with existing customers through product bundling and upselling.
During 2015, we initiated a network extension program in the
U.K.
, which was subsequently expanded to include Ireland. During 2016, we initiated network extension programs in Central and Eastern Europe, Germany, Chile and certain other markets. We collectively refer to these network extension programs as the “
Network Extensions
.”
The
Network Extensions
will be completed in phases with priority given to the most accretive expansion opportunities. During 2015 and 2016, we connected approximately 715,000 homes and commercial premises to Virgin Media’s two-way network (including technical upgrades in the
U.K.
). During 2016, we connected approximately one million homes and commercial premises (including upgrades in Germany and Chile) to our two-way networks in the other markets mentioned above. Pursuant to the
Network Extensions
, we expect in 2017 to (i) connect approximately 1.4 million additional homes and commercial premises (excluding upgrades) to our two-way networks attributed to the
Liberty Global Group
and (ii) connect or upgrade approximately 450,000 additional homes and commercial premises to our two-way networks attributed to the
LiLAC Group
. Depending on a variety of factors, including the financial and operational results of the programs, the
Network Extensions
may be continued, modified or cancelled at our discretion.
The capital costs associated with the
Network Extensions
, which include the costs to build out the networks and the purchase and installation of related customer premises equipment, are expected to be significant. For information regarding our expectations with regard to the percentage of revenue represented by the property and equipment additions of the
Liberty Global Group
and the
LiLAC Group
during 2017, see
Liquidity and Capital Resources — Consolidated Statements of Cash Flows
below.
During 2015, we initiated our “
Liberty Go
” program, which is a comprehensive plan to drive top-line growth while maintaining tight cost controls. The
Liberty Go
program seeks to capitalize on revenue opportunities associated with the
Network Extensions
, mobile and
B2B
, together with the realization of greater efficiencies by leveraging our scale more effectively. Underpinning this program is a commitment to customer centricity, which we believe is key to succeeding in an ever more demanding consumer market. We expect this program to continue through 2018 and that the successful implementation of
Liberty Go
will lead to consolidated organic growth rates for revenue and
Adjusted OIBDA
that are meaningfully higher than our recent consolidated organic growth rates.
Our assessment of the impacts of the
Liberty Go
program and the
Network Extensions
are subject to competitive, economic, regulatory and other factors outside of our control and no assurance can be given that we will be successful in delivering growth rates that are meaningfully higher than our recent consolidated organic growth rates for revenue and
Adjusted OIBDA
.
Competition and other external factors
We are experiencing significant competition from incumbent telecommunications operators,
DTH
operators and/or other providers in all of our markets. In the Bahamas, where
CWC
previously was the only provider of mobile services, competition has increased significantly due to the commercial launch of mobile services by a competitor during the fourth quarter of 2016.
In addition, two new fixed-line competitors have entered the market in Trinidad and Tobago. In certain of its markets,
CWC
is also experiencing increased regulatory intervention that would, if implemented, facilitate increased competition.
For additional information regarding the competition we face, see
Item 1. Business - Competition
and
- Regulatory Matters
included in Part I of this Annual Report on Form 10-K. This significant competition, together with macroeconomic factors, has adversely impacted our revenue,
RGU
s and/or average monthly subscription revenue per average cable
RGU
or mobile subscriber, as applicable (
ARPU
), particularly in the Netherlands, Barbados, the Bahamas and Trinidad and Tobago. For additional information regarding the revenue impact of changes in the
RGU
s and
ARPU
of our reportable segments, see
Discussion and Analysis of our Reportable Segments
below
.
In addition to competition, our operations are subject to macroeconomic, political and other risks that are outside of our control. On June 23, 2016, the
U.K.
held a referendum in which
U.K.
citizens voted in favor of, on an advisory basis, an exit from the
E.U.
commonly referred to as “
Brexit
.” The terms of any withdrawal are subject to a negotiation period that could last at least two years after the British government formally initiates a withdrawal process pursuant to Article 50 of the Treaty on Europe. The British government has indicated that it plans to commence negotiations to determine the terms of the
U.K.
’s withdrawal from the
E.U.
by the end of March 2017. A withdrawal could, among other outcomes, disrupt the free movement of goods, services, people and capital between the
U.K.
and the
E.U.
, undermine bilateral cooperation in key geographic areas and significantly disrupt trade between the
U.K.
and the
E.U.
or other nations (including the U.S.) as the
U.K.
pursues independent trade relations. The initial impact of the announcement of
Brexit
caused significant volatility in global stock markets, including in the prices of our
II-10
shares. In addition, the U.S. dollar has significantly strengthened against the British pound sterling during the period following
Brexit
. The effects of
Brexit
could adversely affect our business, results of operations, financial condition and liquidity.
In early October 2016, our fixed-line and mobile networks in the Bahamas suffered extensive damage as a result of Hurricane Matthew. Although many of our customers experienced significant outages as a result of Hurricane Matthew, service to the majority of our fixed-line and mobile subscribers has now been restored. We estimate that Hurricane Matthew resulted in reductions to our revenue and Adjusted OIBDA in the Bahamas during the fourth quarter of 2016 of $2 million and $4 million, respectively. In addition, we estimate that property and equipment additions required to repair our fixed-line and mobile networks in the Bahamas will aggregate up to $40 million, of which $22 million was incurred during the fourth quarter of 2016. Although we expect the adverse impacts on our revenue and Adjusted OIBDA from Hurricane Matthew to continue during 2017, we expect these impacts to progressively decline over the course of the year. Although we have property and business interruption insurance that we expect will cover a significant portion of our Hurricane Matthew losses, no assurance can be given as to the amount and timing of the insurance proceeds that we will ultimately recover.
We are facing a challenging economic environment in Puerto Rico due in part to the government’s liquidity issues. In this regard, the Puerto Rico government failed to make significant portions of its scheduled debt payments during 2016. Although the Puerto Rico government has implemented tax increases and other measures to improve its solvency and the U.S. has implemented legislation designed to help manage Puerto Rico’s debt crisis, it remains possible, if not likely, that Puerto Rico will be required to restructure its debt obligations. If the fiscal and economic conditions in Puerto Rico were to worsen, the population of Puerto Rico could continue to decline and the demand and ability of customers to pay for Liberty Puerto Rico’s services could be impaired, both of which could have a negative impact on Liberty Puerto Rico’s results of operations, cash flows and financial condition.
In addition, high levels of sovereign debt in the
U.S.
and several countries in which we operate, combined with weak growth and high unemployment, could potentially lead to fiscal reforms (including austerity measures), tax increases, sovereign debt restructurings, currency instability, increased counterparty credit risk, high levels of volatility and disruptions in the credit and equity markets, as well as other outcomes that might adversely impact our company. The occurrence of any of these events, especially within the eurozone countries given our significant exposure to the euro and pound sterling, could have an adverse impact on, among other matters, our liquidity and cash flows.
Results of Operations
We have completed a number of transactions that impact the comparability of our
2016
,
2015
and
2014
results of operations, including the
CWC Acquisition
on May 16, 2016, the
BASE Acquisition
on February 11, 2016, the
Choice Acquisition
on June 3, 2015, the
Ziggo Acquisition
on November 11, 2014 and a number of less significant acquisitions during
2016
,
2015
and
2014
.
On December 31, 2016, we completed the
Dutch JV Transaction
, whereby we contributed
Ziggo Group Holding
and its subsidiaries (including
Ziggo Sport
) to the
Dutch JV
. Accordingly, our results of operations include the operations of
Ziggo Group Holding
and its subsidiaries for all periods presented while our December 31, 2016 consolidated balance sheet excludes such entities. In our segment presentation,
Ziggo Group Holding
(exclusive of
Ziggo Sport
, which became a subsidiary of
Ziggo Group Holding
in October 2016) is separately reported as “
The Netherlands
” and
Ziggo Sport
is included in our “
Corporate and Other
” category.
For additional information regarding the
Dutch JV Transaction
, see note
5
to our consolidated financial statements.
For further information regarding our pending and completed acquisitions, see note
4
to our consolidated financial statements.
In the following discussion, we quantify the estimated impact of acquisitions (the
Acquisition Impact
) on our operating results. The
Acquisition Impact
represents our estimate of the difference between the operating results of the periods under comparison that is attributable to an acquisition. In general, we base our estimate of the
Acquisition Impact
on an acquired entity’s operating results during the first three to six months following the acquisition date, as adjusted to remove integration costs and any other material unusual or nonoperational items, such that changes from those operating results in subsequent periods are considered to be organic changes. Accordingly, in the following discussion, (i) variances attributed to an acquired entity during the first 12 months following the acquisition date represent differences between the
Acquisition Impact
and the actual results and (ii) the calculation of our organic growth percentages includes the organic growth of an acquired entity relative to the
Acquisition Impact
of such entity. During 2016, we changed how we calculate our organic growth percentages to include the
Acquisition Impact
in the denominator of the calculation, as this methodology takes into account the size of the acquired entity's operations relative to our existing operations. This change has been reflected retroactively for all periods presented herein. Notwithstanding the above and due largely to the fact that
CWC
represents a new reportable segment, we have excluded all of
CWC
’s operating results (excluding $9.9 million of integration costs that are included in the organic change for SG&A expenses and
Adjusted OIBDA
) for the period from the May 16, 2016 acquisition date through December 31, 2016 from the calculation of organic growth.
II-11
Changes in foreign currency exchange rates have a significant impact on our reported operating results as all of our operating segments, except for
CWC
and Puerto Rico, have functional currencies other than the U.S. dollar. Our primary exposure to FX risk
during the three months ended December 31, 2016 was to the euro and British pound sterling as 43.2% and 27.5% of our reported revenue during the period was derived from subsidiaries whose functional currencies are the euro and British pound sterling, respectively.
In addition, our reported operating results are impacted by changes in the exchange rates for other local currencies in Europe, the Caribbean and Latin America. The portions of the changes
in the various components of our results of operations that are attributable to changes in
FX
are highlighted under
Discussion and Analysis of our Reportable Segments
and
Discussion and Analysis of our Consolidated Operating Results
below. For information concerning our foreign currency risks and the applicable foreign currency exchange rates in effect for the periods covered by this Annual Report on Form 10-K, see
Quantitative and Qualitative Disclosures about Market Risk — Foreign Currency Risk
below.
The amounts presented and discussed below represen
t 100% of each reportable segment’s revenue and
Adjusted OIBDA
. As we have the ability to control
Telenet
,
Liberty Puerto Rico
and certain subsidiaries of
CWC
that are not wholly owned, we consolidate 100% of the revenue and expenses of these entities in our consolidated statements of operations despite the fact that third parties own significant interests in these entities. The noncontrolling owners’ interests in the operating results of
Telenet
,
Liberty Puerto Rico
, certain subsidiaries of
CWC
and othe
r less significant majority-owned subsidiaries are reflected in net earnings or loss attributable to noncontrolling interests in our consolidated statements of operations.
II-12
Discussion and Analysis of our Reportable Segments
General
All of the reportable segments set forth below de
rive their revenue primarily from (i) broadband communications services, including video, broadband internet and fixed-line telephony services, (ii)
B2B
services and (iii) with the exception of Puerto Rico, mobile services. For detailed information regarding the composition of our reportable segments, see note
18
to our consolidated financial statements.
The tables presented below in this section provide a separate analysis of each of the line items that comprise
Adjusted OIBDA
, as further discussed in note
18
to our consolidated financial statements, as well as an analysis of
Adjusted OIBDA
by reportable segment for (i)
2016
, as compared to
2015
, and (ii)
2015
, as compared to
2014
. These tables present (a) the amounts reported by each of our reportable segments for the current and comparative periods, (b) the reported
U.S.
dollar change and percentage change from period to period and (c) the organic
U.S.
dollar change and percentage change from period to period (percentage change after removing
FX
and the estimated impacts of acquisitions and dispositions). The comparisons that exclude
FX
assume that exchange rates remained constant at the prior year rate during the comparative periods that are included in each table. As discussed under
Quantitative and Qualitative Disclosures about Market Risk
— Foreign Currency Risk
below, we have significant exposure to movements in foreign currency exchange rates. We also provide a table showing the
Adjusted OIBDA
margins of our reportable segments for
2016
,
2015
and
2014
at the end of this section.
The revenue of our reportable segments includes revenue earned from (i) subscribers to our broadband communication and other fixed-line and DTH services (collectively referred to herein as “
cable subscription revenue
”) and our mobile services and (ii)
B2B
services,
interconnect fees, mobile handset sales,
channel carriage fees,
installation fees, late fees and advertising revenue. Consistent with the presentation of our revenue categories in note
18
to our consolidated financial statements, we use the term “subscription revenue” in the following discussion to refer to amounts received from subscribers for ongoing services, excluding installation fees and late fees. In the following tables, mobile subscription revenue excludes the related interconnect revenue.
Most of our revenue is derived from jurisdictions that administer
VAT
or similar revenue-based taxes. Any increases in these taxes could have an adverse impact on our ability to maintain or increase our revenue to the extent that we are unable to pass such tax increases on to our customers. In the case of revenue-based taxes for which we are the ultimate taxpayer, we will also experience increases in our operating costs and expenses and corresponding declines in our
Adjusted OIBDA
and
Adjusted OIBDA
margins to the extent of any such tax increases.
We pay interconnection fees to other telephony providers when calls or text messages from our subscribers terminate on another network, and we receive similar fees from such providers when calls or text messages from their customers terminate on our networks or networks that we access through
MVNO
or other arrangements. The amounts we charge and incur with respect to fixed-line telephony and mobile interconnection fees are subject to reg
ulatory oversight in many of our markets. To the extent that regulatory authorities introduce fixed-line or mobile termination rate changes, we would experience prospective changes and, in very limited cases, we could experience retroactive changes in our interconnect revenue and/or costs. The ultimate impact of any such changes in termination rates on our
Adjusted OIBDA
would be dependent on the call or text messaging patterns that are subject to the changed termination rates.
II-13
Revenue of our Reportable Segments
Revenue —
2016
compared to
2015
|
|
Year ended December 31,
|
Increase (decrease)
|
Organic
increase (decrease)
|
||||||||||||||||||
|
|
2016
|
2015
|
$
|
%
|
$
|
%
|
|||||||||||||||
|
|
in millions, except percentages
|
||||||||||||||||||||
|
Liberty Global Group:
|
|||||||||||||||||||||
|
European Division:
|
|||||||||||||||||||||
|
U.K./Ireland
|
$
|
6,508.8
|
|
$
|
7,058.7
|
|
$
|
(549.9
|
)
|
(7.8
|
)
|
$
|
195.5
|
|
2.8
|
|
|||||
|
Belgium (a)
|
2,691.1
|
|
2,021.0
|
|
670.1
|
|
33.2
|
|
97.8
|
|
3.8
|
|
|||||||||
|
The Netherlands
|
2,690.8
|
|
2,745.3
|
|
(54.5
|
)
|
(2.0
|
)
|
(45.9
|
)
|
(1.7
|
)
|
|||||||||
|
Germany
|
2,539.7
|
|
2,399.5
|
|
140.2
|
|
5.8
|
|
148.4
|
|
6.2
|
|
|||||||||
|
Switzerland/Austria
|
1,755.6
|
|
1,758.2
|
|
(2.6
|
)
|
(0.1
|
)
|
29.1
|
|
1.7
|
|
|||||||||
|
Total Western Europe
|
16,186.0
|
|
15,982.7
|
|
203.3
|
|
1.3
|
|
424.9
|
|
2.6
|
|
|||||||||
|
Central and Eastern Europe
|
1,088.4
|
|
1,066.6
|
|
21.8
|
|
2.0
|
|
40.2
|
|
3.8
|
|
|||||||||
|
Central and other
|
(8.0
|
)
|
(5.4
|
)
|
(2.6
|
)
|
(48.1
|
)
|
(2.9
|
)
|
(53.4
|
)
|
|||||||||
|
Total European Division
|
17,266.4
|
|
17,043.9
|
|
222.5
|
|
1.3
|
|
462.2
|
|
2.6
|
|
|||||||||
|
Corporate and other
|
66.7
|
|
42.3
|
|
24.4
|
|
N.M.
|
|
36.9
|
|
N.M.
|
|
|||||||||
|
Intersegment eliminations
|
(48.1
|
)
|
(23.5
|
)
|
(24.6
|
)
|
N.M.
|
|
(24.8
|
)
|
N.M.
|
|
|||||||||
|
Total Liberty Global Group
|
17,285.0
|
|
17,062.7
|
|
222.3
|
|
1.3
|
|
474.3
|
|
2.7
|
|
|||||||||
|
LiLAC Group:
|
|||||||||||||||||||||
|
LiLAC Division:
|
|||||||||||||||||||||
|
CWC (b)
|
1,444.8
|
|
—
|
|
1,444.8
|
|
N.M.
|
|
—
|
|
—
|
|
|||||||||
|
Chile
|
859.5
|
|
838.1
|
|
21.4
|
|
2.6
|
|
50.6
|
|
6.0
|
|
|||||||||
|
Puerto Rico (c)
|
420.8
|
|
379.2
|
|
41.6
|
|
11.0
|
|
4.0
|
|
1.0
|
|
|||||||||
|
Total LiLAC Division
|
2,725.1
|
|
1,217.3
|
|
1,507.8
|
|
123.9
|
|
54.6
|
|
2.0
|
|
|||||||||
|
Intersegment eliminations
|
(1.3
|
)
|
—
|
|
(1.3
|
)
|
N.M.
|
|
(1.3
|
)
|
N.M.
|
|
|||||||||
|
Total LiLAC Group
|
2,723.8
|
|
1,217.3
|
|
1,506.5
|
|
123.8
|
|
53.3
|
|
2.0
|
|
|||||||||
|
Total
|
$
|
20,008.8
|
|
$
|
18,280.0
|
|
$
|
1,728.8
|
|
9.5
|
|
$
|
527.6
|
|
2.6
|
|
|||||
_______________
|
(a)
|
The amount presented for 2016 includes the post-acquisition revenue of
BASE
, which was acquired on February 11, 2016.
|
|
(b)
|
The amount presented for 2016 reflects the post-acquisition revenue of
CWC
, which was acquired on May 16, 2016.
|
|
(c)
|
The amount presented for 2015 excludes the pre-acquisition revenue of
Choice
, which was acquired on June 3, 2015.
|
N.M. — Not Meaningful.
General.
While not specifically discussed in the below explanations of the changes in the revenue of our reportable segments, we are experiencing significant competition in all of our markets. This competition has an adverse impact on our ability to increase or maintain our
RGU
s and/or
ARPU
.
Variances in the subscription revenue that we receive from our customers are a function of (i) changes in the number of
RGU
s or mobile subscribers outstanding during the period and (ii) changes in
ARPU
. Changes in
ARPU
can be attributable to (a) changes in prices, (b) changes in bundling or promotional discounts, (c) changes in the tier of services selected, (d) variances in subscriber usage patterns and (e) the overall mix of cable and mobile products during the period. In the following discussion, we discuss ARPU changes in terms of the net impact of the above factors on the
ARPU
that is derived from our video, broadband internet, fixed-line telephony and mobile products.
II-14
U.K./Ireland
.
The decrease
in
U.K./Ireland
’s revenue during
2016
, as compared to
2015
, includes (i) an organic increase of
$195.5 million
or
2.8%
, (ii) the impact of acquisitions, (iii) the impact of disposals and (iv) the impact of
FX
, as set f
orth below:
|
Subscription
revenue
|
Non-subscription
revenue
|
Total
|
|||||||||
|
in millions
|
|||||||||||
|
Increase in cable subscription revenue due to change in:
|
|||||||||||
|
Average number of RGUs (a)
|
$
|
105.0
|
|
$
|
—
|
|
$
|
105.0
|
|
||
|
ARPU (b)
|
70.0
|
|
—
|
|
70.0
|
|
|||||
|
Total increase in cable subscription revenue
|
175.0
|
|
—
|
|
175.0
|
|
|||||
|
Decrease in mobile subscription revenue (c)
|
(68.0
|
)
|
—
|
|
(68.0
|
)
|
|||||
|
Total increase in subscription revenue
|
107.0
|
|
—
|
|
107.0
|
|
|||||
|
Increase in B2B revenue (d)
|
—
|
|
16.4
|
|
16.4
|
|
|||||
|
Increase in other revenue (e)
|
—
|
|
72.1
|
|
72.1
|
|
|||||
|
Total organic increase
|
107.0
|
|
88.5
|
|
195.5
|
|
|||||
|
Impact of acquisitions
|
—
|
|
50.6
|
|
50.6
|
|
|||||
|
Impact of disposals (f)
|
(11.8
|
)
|
(5.8
|
)
|
(17.6
|
)
|
|||||
|
Impact of FX
|
(616.7
|
)
|
(161.7
|
)
|
(778.4
|
)
|
|||||
|
Total
|
$
|
(521.5
|
)
|
$
|
(28.4
|
)
|
$
|
(549.9
|
)
|
||
_______________
|
(a)
|
The increase in cable subscription revenue related
to a change in the average number of
RGU
s is attributable to the net effect of (i) an increase in the average number of broadband internet
RGU
s in the
U.K.
, (ii) an increase in the average number of fixed-line telephony
RGU
s and (iii) declines in the average number of enhanced video
RGU
s and, to a much lesser extent, the average number of basic
video
RGU
s in
Ireland.
|
|
(b)
|
The increase in cable subscripti
on revenue related to a change in
ARPU
is primarily attributable to the net effect of (i) a net increase primarily due to (a) higher
ARPU
from broadband internet services, (b) lower
ARPU
from fixed-line telephony services in the
U.K.
, (c) lower
ARPU
resulting from the impact of a change in the regulations governing payment handling fees that Virgin Media charges to its customers in the
U.K.
, which reduced revenue by $29.4 million, and (d) higher
ARPU
from video services, as an increase in the
U.K.
was only partially offset by a decrease in Ireland, and (ii) an adverse change in
RGU
mix.
|
|
(c)
|
The decrease in mobile subscription revenue relates to the net effect of (i) lower
ARPU
in the
U.K.
, including a decline of $105.3 million in postpaid mobile services revenue associated with the
U.K.
Split-contract Program
, (ii) an increase in the
average number of mobile subscribers, as an increase in the average number of postpaid mobile subscribers more than offset the decrease in the average number of prepaid mobile subscribers in the
U.K.
,
and (iii) a decrease in revenue due to the impact of a $4.2 million favorable adjustment to
VAT
recorded during the fourth quarter of 2015. For additional information regarding
Split-contract Program
s, see note
3
to our consolidated financial statements.
|
|
(d)
|
The increase in
B2B
revenue is primarily due to the net effect of (i) an increase in data revenue, primarily attributable to (a) higher volumes and (b) an increase of $13.1 million in the
U.K.
’s amortization of deferred upfront fees on
B2B
contracts, (ii) lower voice revenue in the
U.K.
, primarily attributable to (1) a decrease in revenue due to the impact of a $17.4 million favorable adjustment recorded during the fourth quarter of 2015 related to the settlement of disputes with mobile operators over amounts charged for voice traffic, including $15.6 million related to years prior to 2015, (2) a decline in usage and (3) lower wholesale revenue, and (iii) an increase in low-margin equipment sales in the
U.K.
|
|
(e)
|
The increase in other revenue is primarily due to the net effect of (i) an increase in mobile handset sales, primarily attributable to an increase of $63.5 million associated with the
U.K.
Split-contract Program
, (ii) a decrease in interconnect revenue in the
U.K.
of $17.0 million, primarily due to (a) a decline in mobile short message service (
SMS
) termination volumes and (b) lower fixed-line telephony termination volumes, (iii) an increase in broadcasting revenue in Ireland and (iv) an increase in installation revenue in the
U.K.
The increase in revenue from the
U.K.
Split-contract Program
is due to the net effect of (1) increased volume and (2) lower average revenue per handset sold.
|
II-15
|
(f)
|
Represents the estimated impact of
(i) the
multi-channel multi-point (microwave) distribution system subscribers in Ireland that have disconnected since we announced the switch-off of this service effective April 2016 and (ii)
the non-cable subscribers in the
U.K.
that we sold in the fourth quarter of 2014 (the
U.K. Non-Cable Disposal
). The non-cable subscribers were migrated to a third party during the first nine months of 2015.
|
For information concerning certain regulatory developments that could have an adverse impact on our revenue in the
U.K.
, see note
17
to our consolidated financial statements.
Belgium.
The increase in Belgium’s revenue during
2016
, as compared to
2015
, includes (i) an organic increase of
$97.8 million
or
3.8%
, (ii) the impact of the
BASE Acquisition
and (iii) the impact of
FX
, as set forth below:
|
Subscription
revenue
|
Non-subscription
revenue
|
Total
|
|||||||||
|
in millions
|
|||||||||||
|
Increase in cable subscription revenue due to change in:
|
|||||||||||
|
Average number of RGUs (a)
|
$
|
19.5
|
|
$
|
—
|
|
$
|
19.5
|
|
||
|
ARPU (b)
|
44.1
|
|
—
|
|
44.1
|
|
|||||
|
Total increase in cable subscription revenue
|
63.6
|
|
—
|
|
63.6
|
|
|||||
|
Increase in mobile subscription revenue (c)
|
14.4
|
|
—
|
|
14.4
|
|
|||||
|
Total increase in subscription revenue
|
78.0
|
|
—
|
|
78.0
|
|
|||||
|
Increase in B2B revenue (d)
|
—
|
|
6.7
|
|
6.7
|
|
|||||
|
Increase in other revenue (e)
|
—
|
|
13.1
|
|
13.1
|
|
|||||
|
Total organic increase
|
78.0
|
|
19.8
|
|
97.8
|
|
|||||
|
Impact of the BASE Acquisition
|
348.8
|
|
230.7
|
|
579.5
|
|
|||||
|
Impact of FX
|
(5.6
|
)
|
(1.6
|
)
|
(7.2
|
)
|
|||||
|
Total
|
$
|
421.2
|
|
$
|
248.9
|
|
$
|
670.1
|
|
||
_______________
|
(a)
|
The increase in cable subscription revenue related to a change in the average number of
RGU
s is attributable to increases in the average numbers of fixed-line telephony, broadband internet and enhanced video
RGU
s that were only partially offset by a decline in the average number of basic video
RGU
s.
|
|
(b)
|
The increase in cable subscription revenue related to a change in
ARPU
is attributable to (i) higher
ARPU
from video, broadband internet and fixed-line telephony services and (ii) an improvement in
RGU
mix.
|
|
(c)
|
The increase in mobile subscription revenue is due to the net effect of (i) an increase in the average number of postpaid mobile subscribers and (ii) lower
ARPU
, primarily due to (a) a decline of $12.4 million in mobile services revenue due to the June 2015 introduction of a
Split-contract Program
and (b) a decline in usage.
|
|
(d)
|
The increase in
B2B
revenue is largely due to the net impact of (i) higher revenue from information technology security services and related equipment sales, (ii) lower revenue from mobile services and (iii) higher revenue from data services.
|
|
(e)
|
The increase in other revenue is primarily due to (i) an increase of $6.5 million in mobile handset sales, (ii) an increase in set-top box sales, (iii) an increase in tablet sales and (iv) an increase in mobile interconnect revenue due to the net effect of (a) growth in mobile call volumes and (b) lower
SMS
usage. The increase in Belgium’s mobile handset sales, which typically generate relatively low or negative margins, include the net impact of (1) an increase of $11.4 million in non-subsidized handset sales, including an increase of $5.3 million associated with the June 2015 introduction of a
Split-contract Program
, and (2) a net decrease of $4.9 million in other handset sales.
|
Certain recent governmental actions in Belgium require that purchasers of prepaid mobile cards identify themselves. This requirement may have an adverse impact on our prepaid mobile subscriber base and revenue in Belgium. For information concerning another regulatory development that could have an adverse impact on our revenue in Belgium, see note
17
to our consolidated financial statements.
II-16
The Netherlands.
The decre
ase in the Netherlands’ revenue during
2016
, as compared to
2015
,
includes (i) an organic decrease of
$45.9 million
or
1.7%
and (ii) the impact of
FX
, as set f
orth below:
|
Subscription
revenue
|
Non-subscription
revenue
|
Total
|
|||||||||
|
in millions
|
|||||||||||
|
Decrease in cable subscription revenue due to change in:
|
|||||||||||
|
Average number of RGUs (a)
|
$
|
(35.6
|
)
|
$
|
—
|
|
$
|
(35.6
|
)
|
||
|
ARPU (b)
|
(14.7
|
)
|
—
|
|
(14.7
|
)
|
|||||
|
Total decrease in cable subscription revenue
|
(50.3
|
)
|
—
|
|
(50.3
|
)
|
|||||
|
Increase in mobile subscription revenue (c)
|
3.7
|
|
—
|
|
3.7
|
|
|||||
|
Total decrease in subscription revenue
|
(46.6
|
)
|
—
|
|
(46.6
|
)
|
|||||
|
Decrease in B2B revenue (d)
|
—
|
|
(1.0
|
)
|
(1.0
|
)
|
|||||
|
Increase in other revenue (e)
|
—
|
|
1.7
|
|
1.7
|
|
|||||
|
Total organic increase (decrease)
|
(46.6
|
)
|
0.7
|
|
(45.9
|
)
|
|||||
|
Impact of FX
|
(8.0
|
)
|
(0.6
|
)
|
(8.6
|
)
|
|||||
|
Total
|
$
|
(54.6
|
)
|
$
|
0.1
|
|
$
|
(54.5
|
)
|
||
_______________
|
(a)
|
The decrease in cable subscription revenue related to a change in the average num
ber of
RGU
s is attributable to declines in the average numbers of basic video, enhanced video and fixed-line telephony
RGU
s that were only partially offset by an increase in the average number of broadband internet
RGU
s.
|
|
(b)
|
The decrease in cable subscription revenue related to a change in
ARPU
is attributable to the net effect of (i) a net decrease due to (a) lower
ARPU
from fixed-line telephony and broadband internet services and (b) higher
ARPU
from video services and (ii) an improvement in
RGU
mix.
|
|
(c)
|
The increase in mobile subscription revenue is due to the net effect of (i) an increase in the average number of mobile subscribers and (ii) lower
ARPU
.
|
|
(d)
|
The decrease in
B2B
revenue is primarily due to the net effect of (i) lower revenue from voice services and (ii) higher revenue from data services.
|
|
(e)
|
The increase in other revenue includes the net effect of (i) a $3.3 million increase due to the favorable settlement of prior period amounts that were recorded during the first quarter of 2016 and (ii) a decrease in revenue of $1.6 million resulting from the termination of a partner network agreement in the Netherlands shortly after the November 2014 acquisition of
Ziggo
.
|
II-17
Germany.
The increase in Germany’s revenue during
2016
, as compared to
2015
, includes (i) an organic increase of
$148.4 million
or
6.2%
and (ii) the impact of
FX
, as set forth below:
|
Subscription
revenue (a)
|
Non-subscription
revenue
|
Total
|
|||||||||
|
in millions
|
|||||||||||
|
Increase in cable subscription revenue due to change in:
|
|||||||||||
|
Average number of RGUs (b)
|
$
|
58.2
|
|
$
|
—
|
|
$
|
58.2
|
|
||
|
ARPU (c)
|
75.9
|
|
—
|
|
75.9
|
|
|||||
|
Total increase in cable subscription revenue
|
134.1
|
|
—
|
|
134.1
|
|
|||||
|
Increase in mobile subscription revenue
|
1.7
|
|
—
|
|
1.7
|
|
|||||
|
Total increase in subscription revenue
|
135.8
|
|
—
|
|
135.8
|
|
|||||
|
Increase in B2B revenue
|
—
|
|
3.3
|
|
3.3
|
|
|||||
|
Increase in other revenue (d) (e)
|
—
|
|
9.3
|
|
9.3
|
|
|||||
|
Total organic increase
|
135.8
|
|
12.6
|
|
148.4
|
|
|||||
|
Impact of FX
|
(6.7
|
)
|
(1.5
|
)
|
(8.2
|
)
|
|||||
|
Total
|
$
|
129.1
|
|
$
|
11.1
|
|
$
|
140.2
|
|
||
_______________
|
(a)
|
Subscription revenue includes revenue from multi-year bulk agreements with landlords or housing associations or with third parties that operate and administer the in-building networks on behalf of housing associations. These bulk agreements, which generally allow for the procurement of the basic video signals at volume-based discounts, provide access to approximately two-thirds of Germany’s video subscribers. Germany’s bulk agreements are, to a significant extent, medium- and long-term contracts. As of
December 31, 2016
, bulk agreements covering approximately 31% of the video subscribers that Germany serves expire by the end of 2017 or are terminable on 30-days notice. During the three months ended
December 31, 2016
, Germany’s 20 largest bulk agreement accounts generated approximately 8% of its total revenue (including estimated amounts billed directly to the building occupants for digital video, broadband internet and fixed-line telephony services). No assurance can be given that Germany’s bulk agreements will be renewed or extended on financially equivalent terms, or at all.
|
|
(b)
|
The increase in cable subscription revenue related to a change in the average number of
RGU
s is attributable to increases in the average numbers of broadband internet, fixed-line telephony and enhanced video
RGU
s that were only partially offset by a decline in the average number of basic video
RGU
s.
|
|
(c)
|
The increase in cable subscription revenue related to a change in
ARPU
is attributable to (i) a net increase due to (a) higher
ARPU
from broadband internet and video services and (b) lower
ARPU
from fixed-line telephony services and (ii) an improvement in
RGU
mix.
|
|
(d)
|
Other revenue includes fees received for the carriage of certain channels included in Germany’s basic and enhanced video offerings. This channel carriage fee revenue is subject to contracts that expire or are otherwise terminable by either party on various dates ranging from 2017 through 2020. The aggregate amount of revenue related to these channel carriage contracts represented approximately 4% of Germany’s total revenue during the three months ended
December 31, 2016
. No assurance can be given that these contracts will be renewed or extended on financially equivalent terms, or at all. In June 2017, we plan to discontinue our analog video service in Germany. We estimate that the discontinuance of this service will reduce Germany’s channel carriage revenue and operating income by approximately €30 million ($32 million) annually.
|
|
(e)
|
The increase in other revenue is primarily due to the net effect of (i) an increase of $11.5 million in mobile handset sales, which typically generate relatively low or no margins, associated with the October 2016 launch of a wholesale handset program, (ii) an increase in installation revenue and (iii) a decrease due to legislative developments that have reduced the fees Germany can charge late-paying customers.
|
II-18
Switzerland/Austria
.
The decrease in
Switzerland/Austria
’s revenue during
2016
, as compared to
2015
, includes (i) an organic increase of
$29.1 million
or
1.7%
, (ii) the impact of an acquisition and (iii) the impact of
FX
, as set forth below:
|
Subscription
revenue
|
Non-subscription
revenue
|
Total
|
|||||||||
|
in millions
|
|||||||||||
|
Increase (decrease) in cable subscription revenue due to change in:
|
|||||||||||
|
Average number of RGUs (a)
|
$
|
(6.4
|
)
|
$
|
—
|
|
$
|
(6.4
|
)
|
||
|
ARPU (b)
|
9.4
|
|
—
|
|
9.4
|
|
|||||
|
Total increase in cable subscription revenue
|
3.0
|
|
—
|
|
3.0
|
|
|||||
|
Increase in mobile subscription revenue (c)
|
16.7
|
|
—
|
|
16.7
|
|
|||||
|
Total increase in subscription revenue
|
19.7
|
|
—
|
|
19.7
|
|
|||||
|
Increase in B2B revenue
|
—
|
|
4.5
|
|
4.5
|
|
|||||
|
Increase in other revenue (d)
|
—
|
|
4.9
|
|
4.9
|
|
|||||
|
Total organic increase
|
19.7
|
|
9.4
|
|
29.1
|
|
|||||
|
Impact of an acquisition
|
—
|
|
1.6
|
|
1.6
|
|
|||||
|
Impact of FX
|
(27.8
|
)
|
(5.5
|
)
|
(33.3
|
)
|
|||||
|
Total
|
$
|
(8.1
|
)
|
$
|
5.5
|
|
$
|
(2.6
|
)
|
||
_______________
|
(a)
|
The decrease in cable subscription revenue related to a change in the average number of
RGU
s is primarily attributable to declines in the average numbers of basic video
RGU
s and, to a much lesser extent, enhanced video
RGU
s in Switzerland that were mostly offset by increases in the average numbers of fixed-line telephony and broadband internet
RGU
s.
|
|
(b)
|
The increase in cable subscription revenue related to a change in
ARPU
is attributable to the net effect of (i) a net increase due to (a) higher
ARPU
from video and broadband internet services and (b) lower
ARPU
from fixed-line telephony services and (ii) a slight adverse change in
RGU
mix, as an adverse change in Austria was mostly offset by an improvement in Switzerland.
|
|
(c)
|
The increase in mobile subscription revenue is due to the net effect of (i) an increase in the average number of mobile subscribers and (ii) lower
ARPU
primarily due to a decline of $1.6 million in mobile services revenue due to the September 2015 introduction of a
Split-contract Program
in Switzerland.
|
|
(d)
|
The increase in other revenue is due to the net effect of (i) an increase of $7.5 million in mobile handset sales, which typically generate relatively low or no margins, including an increase of $1.7 million associated with the September 2015 introduction of a
Split-contract Program
in Switzerland, (ii) an increase in mobile interconnect revenue and (iii) a net decrease resulting from individually insignificant changes in other non-subscription revenue categories.
|
II-19
Central and Eastern Europe.
The increase in Central and Eastern Europe’s revenue during
2016
, as compared to
2015
, includes (i) an organic increase of
$40.2 million
or
3.8%
, (ii) the impact of an acquisition and (iii) the impact of
FX
, as set forth below:
|
Subscription
revenue
|
Non-subscription
revenue
|
Total
|
|||||||||
|
in millions
|
|||||||||||
|
Increase (decrease) in cable subscription revenue due to change in:
|
|||||||||||
|
Average number of RGUs (a)
|
$
|
49.1
|
|
$
|
—
|
|
$
|
49.1
|
|
||
|
ARPU (b)
|
(22.3
|
)
|
—
|
|
(22.3
|
)
|
|||||
|
Total increase in cable subscription revenue
|
26.8
|
|
—
|
|
26.8
|
|
|||||
|
Increase in mobile subscription revenue
|
4.1
|
|
—
|
|
4.1
|
|
|||||
|
Total increase in subscription revenue
|
30.9
|
|
—
|
|
30.9
|
|
|||||
|
Increase in B2B revenue
|
—
|
|
4.3
|
|
4.3
|
|
|||||
|
Increase in other revenue
|
—
|
|
5.0
|
|
5.0
|
|
|||||
|
Total organic increase
|
30.9
|
|
9.3
|
|
40.2
|
|
|||||
|
Impact of an acquisition
|
3.1
|
|
0.3
|
|
3.4
|
|
|||||
|
Impact of FX
|
(19.5
|
)
|
(2.3
|
)
|
(21.8
|
)
|
|||||
|
Total
|
$
|
14.5
|
|
$
|
7.3
|
|
$
|
21.8
|
|
||
_______________
|
(a)
|
The increase in cable subscription revenue related to a change in the average number of
RGU
s is primarily attributable to the net effect of (i) increases in the average numbers of fixed-line telephony, broadband internet and enhanced video
RGU
s in Romania, Hungary, Poland and Slovakia, (ii) a decline in the average number of basic video
RGU
s in Hungary, Poland, Romania and Slovakia, (iii) increases in the average numbers of basic video and broadband internet
RGU
s in the Czech Republic, (iv) an increase in the average number of
DTH
RGU
s and (v) declines in the average numbers of fixed-line telephony and enhanced video
RGU
s in the Czech Republic.
|
|
(b)
|
The decrease in cable subscription revenue related to a change in
ARPU
is attributable to (i) a net decrease due to (a) lower
ARPU
from fixed-line telephony and broadband internet services and (b) higher
ARPU
from video services, primarily in Poland, and (ii) an adverse change in
RGU
mix, as adverse changes in Romania and the Czech Republic were largely offset by an improvement in Hungary.
|
CWC
.
The increase in
CWC
’s revenue during
2016
, as compared to
2015
, is entirely attributable to the May 16, 2016
CWC Acquisition
. Accordingly, we do not separately discuss the changes in the revenue for the
CWC
segment. As further discussed under
Overview
above,
CWC
is experiencing significant competition in all of its markets.
Effective April 1, 2016,
CWC
began recognizing revenue on a cash, rather than accrual, basis with respect to two of its more significant
B2B
customers due primarily to unfavorable collection experience and unfavorable macroeconomic factors. The aggregate amount billed, but not recognized, with respect to these customers during the nine months ended December 31, 2016 was $11.0 million.
II-20
Chile.
The increase in Chile’s revenue during
2016
, as compared to
2015
, includes (i) an organic increase of
$50.6 million
or
6.0%
and (ii) the impact of
FX
, as set forth below:
|
Subscription
revenue
|
Non-subscription
revenue
|
Total
|
|||||||||
|
in millions
|
|||||||||||
|
Increase in cable subscription revenue due to change in:
|
|||||||||||
|
Average number of RGUs (a)
|
$
|
21.0
|
|
$
|
—
|
|
$
|
21.0
|
|
||
|
ARPU (b)
|
24.4
|
|
—
|
|
24.4
|
|
|||||
|
Total increase in cable subscription revenue
|
45.4
|
|
—
|
|
45.4
|
|
|||||
|
Increase in mobile subscription revenue (c)
|
6.8
|
|
—
|
|
6.8
|
|
|||||
|
Total increase in subscription revenue
|
52.2
|
|
—
|
|
52.2
|
|
|||||
|
Decrease in other revenue (d)
|
—
|
|
(1.6
|
)
|
(1.6
|
)
|
|||||
|
Total organic increase (decrease)
|
52.2
|
|
(1.6
|
)
|
50.6
|
|
|||||
|
Impact of FX
|
(27.6
|
)
|
(1.6
|
)
|
(29.2
|
)
|
|||||
|
Total
|
$
|
24.6
|
|
$
|
(3.2
|
)
|
$
|
21.4
|
|
||
_______________
|
(a)
|
The increase in cable subscription revenue related to a change in the average number of
RGU
s is attributable to increases in the average numbers of broadband internet and enhanced video
RGU
s that were only partially offset by declines in the average numbers of fixed-line telephony and basic video
RGU
s.
|
|
(b)
|
The increase in cable subscription revenue related to a change in
ARPU
is attributable to (i) a net increase due to (a) higher
ARPU
from video and broadband internet services and (b) lower
ARPU
from fixed-line telephony services and (ii) an improvement in
RGU
mix. In addition, the increase in Chile’s cable subscription revenue includes adjustments to reflect the retroactive application of a tariff on ancillary services provided directly to customers for the period from July 2013 through February 2014, including (1) a decrease of $4.2 million due to the impact of unfavorable adjustments recorded during the first and second quarters of 2016 and (2) an increase of $2.2 million due to the impact of an unfavorable adjustment recorded during the first quarter of 2015.
|
|
(c)
|
The increase in mobile subscription revenue is due to (i)
an increase in the average number of mobile subscribers, as an increase in the average number of postpaid mobile subscribers more than offset the decrease in the average number of prepaid mobile subscribers,
and (ii)
higher
ARPU
primarily due to a higher proportion of mobile subscribers on postpaid plans, which generate higher ARPU than prepaid plans
.
|
|
(d)
|
The decrease in other revenue is primarily due to the net effect of (i) a decrease in advertising revenue and (ii) an increase of $2.7 million in interconnect revenue due to the impacts of unfavorable adjustments recorded during the first and third quarters of 2015 to reflect the retroactive application of a tariff reduction to June 2012.
|
II-21
Puerto Rico.
The increase in Puerto Rico’s revenue during
2016
, as compared to
2015
, includes (i) an organic increase of
$4.0 million
or
1.0%
and (ii) the impact of the
Choice Acquisition
, as set forth below:
|
Subscription
revenue
|
Non-subscription
revenue
|
Total
|
|||||||||
|
in millions
|
|||||||||||
|
Increase (decrease) in cable subscription revenue due to change in:
|
|||||||||||
|
Average number of RGUs (a)
|
$
|
2.7
|
|
$
|
—
|
|
$
|
2.7
|
|
||
|
ARPU (b)
|
(3.8
|
)
|
—
|
|
(3.8
|
)
|
|||||
|
Total decrease in cable subscription revenue
|
(1.1
|
)
|
—
|
|
(1.1
|
)
|
|||||
|
Increase in B2B revenue (c)
|
—
|
|
5.5
|
|
5.5
|
|
|||||
|
Decrease in other revenue
|
—
|
|
(0.4
|
)
|
(0.4
|
)
|
|||||
|
Total organic increase (decrease)
|
(1.1
|
)
|
5.1
|
|
4.0
|
|
|||||
|
Impact of the Choice Acquisition
|
33.7
|
|
3.9
|
|
37.6
|
|
|||||
|
Total
|
$
|
32.6
|
|
$
|
9.0
|
|
$
|
41.6
|
|
||
_______________
|
(a)
|
The increase in cable subscription revenue related to a change in the average number of
RGU
s is attributable to increases in the average numbers of fixed-line telephony and broadband internet
RGU
s that were only partially offset by a decline in the average number of enhanced video
RGU
s.
|
|
(b)
|
The decrease in cable subscription revenue related to a change in
ARPU
is attributable to the net effect of (i) an adverse change in
RGU
mix and (ii) a net increase due to (a) higher
ARPU
from broadband internet services and (b) lower
ARPU
from fixed-line telephony and video services.
|
|
(c)
|
The increase in
B2B
revenue is largely due to higher revenue from data services.
|
II-22
Revenue —
2015
compared to
2014
|
|
Year ended December 31,
|
Increase (decrease)
|
Organic
increase (decrease)
|
||||||||||||||||||
|
|
2015
|
2014
|
$
|
%
|
$
|
%
|
|||||||||||||||
|
|
in millions, except percentages
|
||||||||||||||||||||
|
Liberty Global Group:
|
|||||||||||||||||||||
|
European Division:
|
|||||||||||||||||||||
|
U.K./Ireland
|
$
|
7,058.7
|
|
$
|
7,409.9
|
|
$
|
(351.2
|
)
|
(4.7
|
)
|
$
|
287.9
|
|
3.9
|
|
|||||
|
Belgium
|
2,021.0
|
|
2,279.4
|
|
(258.4
|
)
|
(11.3
|
)
|
138.7
|
|
6.1
|
|
|||||||||
|
The Netherlands (a)
|
2,745.3
|
|
1,498.5
|
|
1,246.8
|
|
83.2
|
|
(69.1
|
)
|
(2.1
|
)
|
|||||||||
|
Germany
|
2,399.5
|
|
2,711.5
|
|
(312.0
|
)
|
(11.5
|
)
|
159.4
|
|
5.9
|
|
|||||||||
|
Switzerland/Austria
|
1,758.2
|
|
1,846.1
|
|
(87.9
|
)
|
(4.8
|
)
|
52.3
|
|
2.8
|
|
|||||||||
|
Total Western Europe
|
15,982.7
|
|
15,745.4
|
|
237.3
|
|
1.5
|
|
569.2
|
|
3.2
|
|
|||||||||
|
Central and Eastern Europe
|
1,066.6
|
|
1,259.5
|
|
(192.9
|
)
|
(15.3
|
)
|
16.1
|
|
1.3
|
|
|||||||||
|
Central and other
|
(5.4
|
)
|
(7.1
|
)
|
1.7
|
|
(23.9
|
)
|
(2.0
|
)
|
(27.6
|
)
|
|||||||||
|
Total European Division
|
17,043.9
|
|
16,997.8
|
|
46.1
|
|
0.3
|
|
583.3
|
|
3.1
|
|
|||||||||
|
Corporate and other
|
42.3
|
|
70.8
|
|
(28.5
|
)
|
(40.3
|
)
|
(7.5
|
)
|
(13.0
|
)
|
|||||||||
|
Intersegment eliminations
|
(23.5
|
)
|
(24.9
|
)
|
1.4
|
|
N.M.
|
|
0.7
|
|
N.M.
|
|
|||||||||
|
Total Liberty Global Group
|
17,062.7
|
|
17,043.7
|
|
19.0
|
|
0.1
|
|
576.5
|
|
3.1
|
|
|||||||||
|
LiLAC Group:
|
|||||||||||||||||||||
|
Chile
|
838.1
|
|
898.5
|
|
(60.4
|
)
|
(6.7
|
)
|
61.5
|
|
6.9
|
|
|||||||||
|
Puerto Rico (b)
|
379.2
|
|
306.1
|
|
73.1
|
|
23.9
|
|
20.5
|
|
5.7
|
|
|||||||||
|
Total LiLAC Group
|
1,217.3
|
|
1,204.6
|
|
12.7
|
|
1.1
|
|
82.0
|
|
6.5
|
|
|||||||||
|
Total
|
$
|
18,280.0
|
|
$
|
18,248.3
|
|
|
$
|
31.7
|
|
0.2
|
|
$
|
658.5
|
|
3.3
|
|
||||
_______________
|
(a)
|
The amount presented for 2014 excludes the pre-acquisition revenue of
Ziggo
, which was acquired on November 11, 2014.
|
|
(b)
|
The amount presented for 2015 includes the post-acquisition revenue of
Choice
, which was acquired on June 3, 2015.
|
N.M. — Not Meaningful.
II-23
U.K./Ireland
.
The decrease
in
U.K./Ireland
’s revenue during
2015
, as compared to
2014
, includes (i) an organic increase of
$287.9 million
or
3.9%
, (ii) the impact of acquisitions, (iii) the impact of a disposal and (iv) the impact of
FX
, as set f
orth below:
|
Subscription
revenue
|
Non-subscription
revenue
|
Total
|
|||||||||
|
in millions
|
|||||||||||
|
Increase in cable subscription revenue due to change in:
|
|||||||||||
|
Average number of RGUs (a)
|
$
|
84.1
|
|
$
|
—
|
|
$
|
84.1
|
|
||
|
ARPU (b)
|
57.7
|
|
—
|
|
57.7
|
|
|||||
|
Total increase in cable subscription revenue
|
141.8
|
|
—
|
|
141.8
|
|
|||||
|
Decrease in mobile subscription revenue (c)
|
(24.4
|
)
|
—
|
|
(24.4
|
)
|
|||||
|
Total increase in subscription revenue
|
117.4
|
|
—
|
|
117.4
|
|
|||||
|
Increase in B2B revenue (d)
|
—
|
|
64.7
|
|
64.7
|
|
|||||
|
Increase in other revenue (e)
|
—
|
|
105.8
|
|
105.8
|
|
|||||
|
Total organic increase
|
117.4
|
|
170.5
|
|
287.9
|
|
|||||
|
Impact of acquisitions
|
0.4
|
|
8.6
|
|
9.0
|
|
|||||
|
Impact of a disposal
(f)
|
—
|
|
(50.0
|
)
|
(50.0
|
)
|
|||||
|
Impact of FX
|
(483.7
|
)
|
(114.4
|
)
|
(598.1
|
)
|
|||||
|
Total
|
$
|
(365.9
|
)
|
$
|
14.7
|
|
$
|
(351.2
|
)
|
||
_______________
|
(a)
|
The increase in cable subscription revenue related
to a change in the average number of
RGU
s is attributable to increases in the average numbers of broadband internet and fixed-line telephony
RGU
s that were only partially offset by declines in (i) the average number of enhanced video
RGU
s and (ii) the average number of basic and multi-channel multi-point (microwave) distribution system video
RGU
s in
Ireland.
|
|
(b)
|
The increase in cable subscripti
on revenue related to a change in
ARPU
is primarily attributable to the net effect of (i) a net increase primarily due to (a) higher ARPU from broadband internet services in the
U.K.
, (b) lower ARPU from fixed-line telephony services and (c) higher ARPU from video services and (ii) an adverse change in
RGU
mix
in Ireland. In addition, the growth in
ARPU
was partially offset by (1) the impact of a January 1, 2015 change in how
VAT
is applied to certain components of our U.K. operations, which reduced revenue by $49.9 million, and (2) a May 1, 2014 change in legislation in the
U.K.
with respect to the charging of
VAT
in connection with prompt payment discounts, as discussed below, which reduced revenue by
$24.0 million
.
|
|
(c)
|
The decrease in mobile subscription revenue relates to the
U.K.
and is due to (i) lower
ARPU
, including the net impact of (a) a decline of $41.6 million in postpaid mobile services revenue due to the November 2014 introduction of a
Split-contract Program
, (b) a decrease of $11.2 million related to the above-described January 1, 2015 change in how
VAT
is applied and (c) an increase in revenue due to the favorable impact of a $4.4 million adjustment to
VAT
recorded during the fourth quarter of 2015, and (ii) a decrease in the
average number of subscribers, as a decrease in the average number of prepaid subscribers more than offset the increase in the average number of postpaid subscribers
.
|
|
(d)
|
The increase in
B2B
revenue is primarily due to
(i) an increase in data revenue, primarily attributable to (a) higher volumes and (b) an increase of $22.7 million in the
U.K.
’s amortization of deferred upfront fees on
B2B
contracts, (ii) an increase in low-margin equipment sales in the
U.K.
and (iii) an increase in voice revenue, largely attributable to the net effect of (1) an $18.2 million increase recorded in the
U.K.
during the fourth quarter of 2015 related to the settlement of disputes with mobile operators over amounts charged for voice traffic, including $16.3 million related to years prior to 2015, and (2) a decline in usage.
|
|
(e)
|
The increase in other revenue is primarily due to the net effect of (i) an increase in mobile handset sales, primarily attributable to a $144.6 million increase associated with the November 2014 introduction of a
Split-contract Program
, (ii) a decrease in interconnect revenue of $23.4 million, primarily due to a decline in
SMS
termination volumes in the
U.K.
, and (iii) a decrease in installation revenue of $12.6 million.
|
|
(f)
|
Represents the estimated impact of the
U.K. Non-Cable Disposal
. These non-cable subscribers were migrated to a third party during the first nine months of 2015.
|
II-24
On March 19, 2014, the
U.K.
government announced a change in legislation with respect to the charging of
VAT
in connection with prompt payment discounts such as those that
Virgin Media
offers to its fixed-line telephony customers. This change, which took effect on May 1, 2014, impacted
Virgin Media
and some of its competitors. For additional information regarding a challenge
from the
U.K.
government regarding
Virgin Media
’s application of the prompt payment discount rules prior to the May 1, 2014
change in legislation, see note
17
to our consolidated financial statements.
Belgium.
The decrease in Belgium’s revenue during
2015
, as compared to
2014
, includes (i) an organic increase of
$138.7 million
or
6.1%
and (ii) the impact of
FX
, as set forth below:
|
Subscription
revenue
|
Non-subscription
revenue
|
Total
|
|||||||||
|
in millions
|
|||||||||||
|
Increase in cable subscription revenue due to change in:
|
|||||||||||
|
Average number of RGUs (a)
|
$
|
38.1
|
|
$
|
—
|
|
$
|
38.1
|
|
||
|
ARPU (b)
|
37.7
|
|
—
|
|
37.7
|
|
|||||
|
Total increase in cable subscription revenue
|
75.8
|
|
—
|
|
75.8
|
|
|||||
|
Increase in mobile subscription revenue (c)
|
29.6
|
|
—
|
|
29.6
|
|
|||||
|
Total increase in subscription revenue
|
105.4
|
|
—
|
|
105.4
|
|
|||||
|
Increase in B2B revenue (d)
|
—
|
|
16.7
|
|
16.7
|
|
|||||
|
Increase in other revenue (e)
|
—
|
|
16.6
|
|
16.6
|
|
|||||
|
Total organic increase
|
105.4
|
|
33.3
|
|
138.7
|
|
|||||
|
Impact of FX
|
(333.6
|
)
|
(63.5
|
)
|
(397.1
|
)
|
|||||
|
Total
|
$
|
(228.2
|
)
|
$
|
(30.2
|
)
|
$
|
(258.4
|
)
|
||
_______________
|
(a)
|
The increase in cable subscription revenue related to a change in the average number of
RGU
s is attributable to increases in the average numbers of fixed-line telephony, broadband internet and enhanced video
RGU
s that were only partially offset by a decline in the average number of basic video
RGU
s.
|
|
(b)
|
The increase in cable subscription revenue related to a change in
ARPU
is attributable to (i) higher
ARPU
from broadband internet, video and fixed-line telephony services and (ii) an improvement in
RGU
mix.
|
|
(c)
|
The increase in mobile subscription revenue is due to the net effect of (i) an increase in the average number of mobile subscribers and (ii) lower
ARPU
.
|
|
(d)
|
The increase in
B2B
revenue is primarily due to higher revenue from (i) information technology security services and related equipment sales, (ii) data services and (iii) voice services.
|
|
(e)
|
The increase in other revenue is primarily due to the net effect of
(i) an increase in mobile handset sales of $11.6 million,
(ii) an increase in interconnect revenue of $9.2 million, primarily attributable to the net effect of (a) growth in mobile call volumes and (b) lower
SMS
usage, and (iii) a decrease in set-top box sales of $7.4 million, primarily due to a digital cable migration completed during the third quarter of 2014. The increase in Belgium’s mobile handset sales, which typically generate relatively low margins, is primarily due to the net effect of (1) an increase of $12.5 million associated with the June 2015 introduction of a
Split-contract Program
, (2) a decrease in subsidized handset sales and (3) higher revenue from contract termination fees applicable to subsidized handsets.
|
The Netherlands.
The incre
ase in the Netherlands’ revenue during
2015
, as compared to
2014
, is primarily due to the
Ziggo Acquisition
. Due to the size of the
Ziggo Acquisition
and the resulting impact on the organic growth rate of the Netherlands, the below discussion and analysis of the Netherlands’ revenue is presented on a pro forma basis as if the results of
Ziggo
were included along with those of
Ziggo Services B.V. (
Ziggo Services
) for
2014
. The pro forma revenue amount for
Ziggo
is based on
Ziggo
’s publicly-reported results for
2014
, as adjusted to (i) convert
Ziggo
’s publicly-reported results from International Financial Reporting Standards, as adopted by the
E.U.
, to
U.S. GAAP
, (ii) conform one of
Ziggo
’s accounting policies to the corresponding
Liberty Global
accounting policy and (iii) reflect the impact of the acquisition accounting applied to the
Ziggo Acquisition
. We believe this pro forma revenue analysis provides the most meaningful comparison of the Netherlands’ revenue.
II-25
On a pro forma basis, the Netherlands’ revenue decreased
$618.1 million
or 18.4% during
2015
, as compared to
2014
. This decrease includes (i) a pro forma organic decrease of
$82.7 million
or 2.5
%
and (ii) the impact of
FX
, as set forth below:
|
Subscription
revenue
|
Non-subscription
revenue
|
Total
|
|||||||||
|
in millions
|
|||||||||||
|
Pro forma decrease in cable subscription revenue due to change in:
|
|||||||||||
|
Average number of RGUs (a)
|
$
|
(36.4
|
)
|
$
|
—
|
|
$
|
(36.4
|
)
|
||
|
ARPU (b)
|
(7.9
|
)
|
—
|
|
(7.9
|
)
|
|||||
|
Total pro forma decrease in cable subscription revenue
|
(44.3
|
)
|
—
|
|
(44.3
|
)
|
|||||
|
Pro forma increase in mobile subscription revenue (c)
|
18.7
|
|
—
|
|
18.7
|
|
|||||
|
Total pro forma decrease in subscription revenue
|
(25.6
|
)
|
—
|
|
(25.6
|
)
|
|||||
|
Pro forma decrease in B2B revenue
|
—
|
|
(4.8
|
)
|
(4.8
|
)
|
|||||
|
Pro forma decrease in other revenue (d)
|
—
|
|
(52.3
|
)
|
(52.3
|
)
|
|||||
|
Total pro forma organic decrease
|
(25.6
|
)
|
(57.1
|
)
|
(82.7
|
)
|
|||||
|
Pro forma impact of FX
|
(491.8
|
)
|
(43.6
|
)
|
(535.4
|
)
|
|||||
|
Total
|
$
|
(517.4
|
)
|
$
|
(100.7
|
)
|
$
|
(618.1
|
)
|
||
_______________
|
(a)
|
The pro forma decrease in cable subscription revenue related to a change in the average num
ber of
RGU
s is attributable to declines in the average numbers of basic video, enhanced video and fixed-line telephony
RGU
s that were only partially offset by an increase in the average number of broadband internet
RGU
s.
|
|
(b)
|
The pro forma decrease in cable subscription revenue related to a change in
ARPU
is attributable to the net effect of (i) a net decrease due to (a) lower
ARPU
from video and fixed-line telephony services and (b) higher
ARPU
from broadband internet services and (ii) an improvement in
RGU
mix.
|
|
(c)
|
The pro forma increase in mobile subscription revenue is primarily due to an increase in the average number of mobile subscribers.
|
|
(d)
|
The pro forma decrease in other revenue is primarily due to (i) a decrease in revenue of $26.9 million resulting from the termination of a
Ziggo
partner network agreement shortly after the
Ziggo Acquisition
, (ii) a decrease in installation revenue and (iii) lower revenue from set-top box sales due to the fact that we stopped selling set-top boxes in the Netherlands during the first quarter of 2015.
|
II-26
Germany.
The decrease in Germany’s revenue during
2015
, as compared to
2014
, includes (i) an organic increase of
$159.4 million
or
5.9%
and (ii) the impact of
FX
, as set forth below:
|
Subscription
revenue
|
Non-subscription
revenue
|
Total
|
|||||||||
|
in millions
|
|||||||||||
|
Increase in cable subscription revenue due to change in:
|
|||||||||||
|
Average number of RGUs (a)
|
$
|
82.5
|
|
$
|
—
|
|
$
|
82.5
|
|
||
|
ARPU (b)
|
95.9
|
|
—
|
|
95.9
|
|
|||||
|
Total increase in cable subscription revenue
|
178.4
|
|
—
|
|
178.4
|
|
|||||
|
Decrease in mobile subscription revenue
|
(0.8
|
)
|
—
|
|
(0.8
|
)
|
|||||
|
Total increase in subscription revenue
|
177.6
|
|
—
|
|
177.6
|
|
|||||
|
Increase in B2B revenue (c)
|
—
|
|
6.3
|
|
6.3
|
|
|||||
|
Decrease in other revenue (d)
|
—
|
|
(24.5
|
)
|
(24.5
|
)
|
|||||
|
Total organic increase (decrease)
|
177.6
|
|
(18.2
|
)
|
159.4
|
|
|||||
|
Impact of FX
|
(432.0
|
)
|
(39.4
|
)
|
(471.4
|
)
|
|||||
|
Total
|
$
|
(254.4
|
)
|
$
|
(57.6
|
)
|
$
|
(312.0
|
)
|
||
_______________
|
(a)
|
The increase in cable subscription revenue related to a change in the average number of
RGU
s is attributable to increases in the average numbers of broadband internet, fixed-line telephony and enhanced video
RGU
s that were only partially offset by a decline in the average number of basic video
RGU
s.
|
|
(b)
|
The increase in cable subscription revenue related to a change in
ARPU
is attributable to (i) higher
ARPU
from broadband internet, video and fixed-line telephony services and (ii) an improvement in
RGU
mix.
|
|
(c)
|
The increase in
B2B
revenue is due to higher revenue from data and voice services.
|
|
(d)
|
The decrease in other revenue is primarily due to (i) a decrease from the unfavorable impact of $11.9 million of network usage revenue that Germany recorded during the first quarter of 2014 following the settlement of prior period amounts, (ii) a decrease in channel carriage fee revenue of $4.9 million and (iii) a decrease in interconnect revenue of $4.8 million.
|
Switzerland/Austria
.
The decrease in
Switzerland/Austria
’s revenue during
2015
, as compared to
2014
, includes (i) an organic increase of
$52.3 million
or
2.8%
, (ii) the impact of an acquisition and (iii) the impact of
FX
, as set forth below:
|
Subscription
revenue
|
Non-subscription
revenue
|
Total
|
|||||||||
|
in millions
|
|||||||||||
|
Increase in cable subscription revenue due to change in:
|
|||||||||||
|
Average number of RGUs (a)
|
$
|
7.5
|
|
$
|
—
|
|
$
|
7.5
|
|
||
|
ARPU (b)
|
17.0
|
|
—
|
|
17.0
|
|
|||||
|
Total increase in cable subscription revenue
|
24.5
|
|
—
|
|
24.5
|
|
|||||
|
Increase in mobile subscription revenue (c)
|
8.8
|
|
—
|
|
8.8
|
|
|||||
|
Total increase in subscription revenue
|
33.3
|
|
—
|
|
33.3
|
|
|||||
|
Increase in B2B revenue (d)
|
—
|
|
9.6
|
|
9.6
|
|
|||||
|
Increase in other revenue (e)
|
—
|
|
9.4
|
|
9.4
|
|
|||||
|
Total organic increase
|
33.3
|
|
19.0
|
|
52.3
|
|
|||||
|
Impact of an acquisition
|
5.7
|
|
(0.4
|
)
|
5.3
|
|
|||||
|
Impact of FX
|
(117.5
|
)
|
(28.0
|
)
|
(145.5
|
)
|
|||||
|
Total
|
$
|
(78.5
|
)
|
$
|
(9.4
|
)
|
$
|
(87.9
|
)
|
||
II-27
_______________
|
(a)
|
The increase in cable subscription revenue related to a change in the average number of
RGU
s is attributable to increases in the average numbers of broadband internet, fixed-line telephony and enhanced video
RGU
s that were primarily offset by a decline in the average number of basic video
RGU
s.
|
|
(b)
|
The increase in cable subscription revenue related to a change in
ARPU
is due to an increase in both Switzerland and Austria. The increase in
ARPU
in Switzerland is attributable to (i) an improvement in
RGU
mix and (ii) a net increase due to (a) higher
ARPU
from video services and (b) lower
ARPU
from fixed-line telephony and broadband internet services. The increase in
ARPU
in Austria is attributable to the net effect of (1) a net increase due to (I) higher
ARPU
from video and broadband internet services and (II) lower
ARPU
from fixed-line telephony services and (2) an adverse change in
RGU
mix.
|
|
(c)
|
The increase in mobile subscription revenue is primarily due to an increase in the average number of mobile subscribers in Switzerland. Switzerland’s mobile services were launched during the second quarter of 2014.
|
|
(d)
|
The increase in
B2B
revenue is primarily due to a net increase in Switzerland from (i) higher revenue from voice and data services and (ii) lower revenue from construction services and equipment sales.
|
|
(e)
|
The increase in other revenue is due to the net effect of (i) an increase in mobile handset sales, which typically generate relatively low margins, (ii) a decrease in revenue from Austria’s non-cable subscriber base and (iii) a net increase resulting from individually insignificant changes in other non-subscription revenue categories.
|
Central and Eastern Europe.
The decrease in Central and Eastern Europe’s revenue during
2015
, as compared to
2014
, includes (i) an organic increase of
$16.1 million
or
1.3%
and (ii) the impact of
FX
, as set forth below:
|
Subscription
revenue
|
Non-subscription
revenue
|
Total
|
|||||||||
|
in millions
|
|||||||||||
|
Increase (decrease) in cable subscription revenue due to change in:
|
|||||||||||
|
Average number of RGUs (a)
|
$
|
37.5
|
|
$
|
—
|
|
$
|
37.5
|
|
||
|
ARPU (b)
|
(28.7
|
)
|
—
|
|
(28.7
|
)
|
|||||
|
Total increase in cable subscription revenue
|
8.8
|
|
—
|
|
8.8
|
|
|||||
|
Increase in mobile subscription revenue
|
2.0
|
|
—
|
|
2.0
|
|
|||||
|
Total increase in subscription revenue
|
10.8
|
|
—
|
|
10.8
|
|
|||||
|
Increase in B2B revenue
|
—
|
|
4.2
|
|
4.2
|
|
|||||
|
Increase in other revenue
|
—
|
|
1.1
|
|
1.1
|
|
|||||
|
Total organic increase
|
10.8
|
|
5.3
|
|
16.1
|
|
|||||
|
Impact of FX
|
(191.1
|
)
|
(17.9
|
)
|
(209.0
|
)
|
|||||
|
Total
|
$
|
(180.3
|
)
|
$
|
(12.6
|
)
|
$
|
(192.9
|
)
|
||
_______________
|
(a)
|
The increase in cable subscription revenue related to a change in the average number of
RGU
s is attributable to the net effect of (i) increases in the average numbers of enhanced video, broadband internet and fixed-line telephony
RGU
s in Romania, Poland, Hungary and Slovakia, (ii) a decline in the average number of basic video
RGU
s in Poland, Hungary, Romania and Slovakia, (iii) an increase in the average number of
DTH
RGU
s, (iv) declines in the average numbers of fixed-line telephony and enhanced video
RGU
s in the Czech Republic and
(v) increases in the average numbers of basic video and broadband internet
RGU
s in the Czech Republic.
|
|
(b)
|
The decrease in cable subscription revenue related to a change in
ARPU
is attributable to the net effect of (i) a net decrease due to (a) lower
ARPU
from fixed-line telephony services, (b) lower ARPU from broadband internet services, primarily in Poland, and (c) higher
ARPU
from video services, primarily in Poland and Romania,
and (ii) an improvement in
RGU
mix. In addition, the decline in
ARPU
includes the impact of a January 1, 2015 change in how
VAT
is calculated for
UPC DTH
’s operations in Hungary, the Czech Republic and Slovakia, which reduced
UPC DTH
’s revenue by $16.4 million.
|
II-28
Chile.
The decrease in Chile’s revenue during
2015
, as compared to
2014
, includes (i) an organic increase of
$61.5 million
or
6.9%
and (ii) the impact of
FX
, as set forth below:
|
Subscription
revenue
|
Non-subscription
revenue
|
Total
|
|||||||||
|
in millions
|
|||||||||||
|
Increase in cable subscription revenue due to change in:
|
|||||||||||
|
Average number of RGUs (a)
|
$
|
23.0
|
|
$
|
—
|
|
$
|
23.0
|
|
||
|
ARPU (b)
|
20.4
|
|
—
|
|
20.4
|
|
|||||
|
Total increase in cable subscription revenue
|
43.4
|
|
—
|
|
43.4
|
|
|||||
|
Increase in mobile subscription revenue (c)
|
16.3
|
|
—
|
|
16.3
|
|
|||||
|
Total increase in subscription revenue
|
59.7
|
|
—
|
|
59.7
|
|
|||||
|
Increase in other revenue (d)
|
—
|
|
1.8
|
|
1.8
|
|
|||||
|
Total organic increase
|
59.7
|
|
1.8
|
|
61.5
|
|
|||||
|
Impact of FX
|
(114.4
|
)
|
(7.5
|
)
|
(121.9
|
)
|
|||||
|
Total
|
$
|
(54.7
|
)
|
$
|
(5.7
|
)
|
$
|
(60.4
|
)
|
||
_______________
|
(a)
|
The increase in cable subscription revenue related to a change in the average number of
RGU
s is attributable to increases in the average numbers of broadband internet and enhanced video
RGU
s that were only partially offset by declines in the average numbers of basic video and fixed-line telephony
RGU
s.
|
|
(b)
|
The increase in cable subscription revenue related to a change in
ARPU
is attributable to (i) a net increase due to (a) higher
ARPU
from video and broadband internet services and (b) lower
ARPU
from fixed-line telephony services and (ii) an improvement in
RGU
mix. In addition, the growth in
ARPU
was partially offset by a decrease in revenue due to the impact of a $2.5 million adjustment recorded during the first quarter of 2015 to reflect the retroactive application of a proposed tariff on ancillary services provided directly to customers for the period from July 2013 through February 2014.
|
|
(c)
|
The increase in mobile subscription revenue is due to (i)
an increase in the average number of subscribers, as an increase in the average number of postpaid subscribers more than offset the decrease in the average number of prepaid subscribers,
and (ii)
higher
ARPU
, primarily due to a higher proportion of mobile subscribers on postpaid plans, which generate higher
ARPU
than prepaid plans
.
|
|
(d)
|
The increase in other revenue is due to the net effect of (i) a decrease in interconnect revenue, (ii) an increase in installation revenue, (iii) an increase in advertising revenue and (iv) a net increase resulting from individually insignificant changes in other non-subscription revenue categories. The decrease in interconnect revenue is primarily due to (a) lower rates and (b) a decrease of $3.0 million related to the impact of adjustments recorded during the first and third quarters of 2015 to reflect the retroactive application of a tariff reduction to June 2012.
|
II-29
Puerto Rico.
The increase in Puerto Rico’s revenue during
2015
, as compared to
2014
, includes (i) an organic increase of
$20.5 million
or
5.7%
and (ii) the impact of the
Choice Acquisition
, as set forth below:
|
Subscription
revenue
|
Non-subscription
revenue
|
Total
|
|||||||||
|
in millions
|
|||||||||||
|
Increase (decrease) in cable subscription revenue due to change in:
|
|||||||||||
|
Average number of RGUs (a)
|
$
|
20.8
|
|
$
|
—
|
|
$
|
20.8
|
|
||
|
ARPU (b)
|
(5.7
|
)
|
—
|
|
(5.7
|
)
|
|||||
|
Total increase in cable subscription revenue
|
15.1
|
|
—
|
|
15.1
|
|
|||||
|
Increase in B2B revenue
|
—
|
|
4.6
|
|
4.6
|
|
|||||
|
Increase in other revenue
|
—
|
|
0.8
|
|
0.8
|
|
|||||
|
Total organic increase
|
15.1
|
|
5.4
|
|
20.5
|
|
|||||
|
Impact of the Choice Acquisition
|
47.2
|
|
5.4
|
|
52.6
|
|
|||||
|
Total
|
$
|
62.3
|
|
$
|
10.8
|
|
$
|
73.1
|
|
||
_______________
|
(a)
|
The
increase
in cable subscription revenue related to a change in the average number of
RGU
s is attributable to increases in the average numbers of fixed-line telephony, broadband internet and enhanced video
RGU
s.
|
|
(b)
|
The decrease in cable subscription revenue related to a change in
ARPU
is primarily due to an adverse change in
RGU
mix. Excluding the impact of RGU mix,
ARPU
was relatively unchanged due to the net effect of (i) higher
ARPU
from video and broadband internet services and (ii) lower
ARPU
from fixed-line telephony services.
|
II-30
Programming and Other Direct Costs of Services of our Reportable Segments
Programming and other direct costs of services —
2016
compared to
2015
General.
Programming and other direct costs of services include programming and copyright costs, mobile access and interconnect costs, mobile handset and other equipment cost of goods sold and other direct costs related to our operations. Programming and copyright costs, which represent a significant portion of our operating costs, are expected to rise in future periods as a result of (i) higher costs associated with the expansion of our digital video content, including rights associated with ancillary product offerings and rights that provide for the broadcast of live sporting events, (ii) rate increases and (iii) growth in the number of our enhanced video subscribers. In addition, we are subject to inflationary pressures with respect to certain costs and foreign currency exchange risk with respect to costs and expenses that are denominated in currencies other than the respective functional currencies of our operating segments (
non-functional currency expenses
). Any cost increases that we are not able to pass on to our subscribers through rate increases would result in increased pressure on our operating margins. For additional information concerning our foreign currency exchange risks see
Quantitative and Qualitative Disclosures about Market Risk — Foreign Currency Risk
below.
|
|
Year ended December 31,
|
Increase (decrease)
|
Organic
increase (decrease)
|
||||||||||||||||||
|
|
2016
|
2015
|
$
|
%
|
$
|
%
|
|||||||||||||||
|
|
in millions, except percentages
|
||||||||||||||||||||
|
Liberty Global Group:
|
|||||||||||||||||||||
|
European Division:
|
|||||||||||||||||||||
|
U.K./Ireland
|
$
|
1,946.4
|
|
$
|
2,070.7
|
|
$
|
(124.3
|
)
|
(6.0
|
)
|
$
|
86.1
|
|
4.1
|
|
|||||
|
Belgium (a)
|
734.9
|
|
526.8
|
|
208.1
|
|
39.5
|
|
4.0
|
|
0.5
|
|
|||||||||
|
The Netherlands
|
509.1
|
|
468.6
|
|
40.5
|
|
8.6
|
|
42.3
|
|
9.0
|
|
|||||||||
|
Germany
|
228.7
|
|
203.5
|
|
25.2
|
|
12.4
|
|
25.9
|
|
12.7
|
|
|||||||||
|
Switzerland/Austria
|
245.4
|
|
236.9
|
|
8.5
|
|
3.6
|
|
12.8
|
|
5.4
|
|
|||||||||
|
Total Western Europe
|
3,664.5
|
|
3,506.5
|
|
158.0
|
|
4.5
|
|
171.1
|
|
4.6
|
|
|||||||||
|
Central and Eastern Europe
|
254.8
|
|
234.1
|
|
20.7
|
|
8.8
|
|
24.8
|
|
10.5
|
|
|||||||||
|
Central and other
|
(6.1
|
)
|
(2.4
|
)
|
(3.7
|
)
|
N.M.
|
|
(3.8
|
)
|
N.M.
|
|
|||||||||
|
Total European Division
|
3,913.2
|
|
3,738.2
|
|
175.0
|
|
4.7
|
|
192.1
|
|
4.8
|
|
|||||||||
|
Corporate and other
|
64.1
|
|
51.3
|
|
12.8
|
|
25.0
|
|
26.6
|
|
70.4
|
|
|||||||||
|
Intersegment eliminations
|
(48.3
|
)
|
(23.2
|
)
|
(25.1
|
)
|
N.M.
|
|
(24.6
|
)
|
N.M.
|
|
|||||||||
|
Total Liberty Global Group
|
3,929.0
|
|
3,766.3
|
|
162.7
|
|
4.3
|
|
194.1
|
|
4.9
|
|
|||||||||
|
LiLAC Group:
|
|||||||||||||||||||||
|
LiLAC Division:
|
|||||||||||||||||||||
|
CWC (b)
|
327.6
|
|
—
|
|
327.6
|
|
N.M.
|
|
—
|
|
—
|
|
|||||||||
|
Chile
|
237.6
|
|
227.9
|
|
9.7
|
|
4.3
|
|
17.7
|
|
7.8
|
|
|||||||||
|
Puerto Rico (c)
|
113.3
|
|
110.3
|
|
3.0
|
|
2.7
|
|
(7.4
|
)
|
(6.1
|
)
|
|||||||||
|
Total LiLAC Division
|
678.5
|
|
338.2
|
|
340.3
|
|
100.6
|
|
10.3
|
|
1.5
|
|
|||||||||
|
Intersegment eliminations
|
(1.3
|
)
|
(0.5
|
)
|
(0.8
|
)
|
N.M.
|
|
(0.8
|
)
|
N.M.
|
|
|||||||||
|
Total LiLAC Group
|
677.2
|
|
337.7
|
|
339.5
|
|
100.5
|
|
9.5
|
|
1.4
|
|
|||||||||
|
Total
|
$
|
4,606.2
|
|
$
|
4,104.0
|
|
$
|
502.2
|
|
12.2
|
|
$
|
203.5
|
|
4.4
|
|
|||||
_______________
|
(a)
|
The amount presented for 2016 includes the post-acquisition programming and other direct costs of services of BASE, which was acquired on February 11, 2016.
|
|
(b)
|
The amount presented for 2016 reflects the post-acquisition programming and other direct costs of services of CWC, which was acquired on May 16, 2016.
|
II-31
|
(c)
|
The amount presented for 2015 excludes the pre-acquisition programming and other direct costs of services of
Choice
, which was acquired on June 3, 2015.
|
N.M. — Not Meaningful.
European Division
.
The
European Division
’s programming and other direct costs of services increased
$175.0 million
or
4.7%
during
2016, as compared to 2015
. This increase includes (i) an increase of
$241.1 million
attributable to the impact of the
BASE Acquisition
and other less significant acquisitions and (ii) a decrease of
$8.1 million
attributable to the
U.K. Non-Cable Disposal
and another less significant disposition. Excluding the effects of acquisitions, dispositions and
FX
, the
European Division
’s programming and other direct costs of services increased
$192.1 million
or
4.8%
. This increase includes the following factors:
|
•
|
An increase in programming and copyright costs of $207.5 million or 9.9%, primarily due to increases in
U.K./Ireland
and the Netherlands and, to a lesser extent, Belgium and Germany. These increases are primarily attributable to higher costs for certain premium and/or basic content, including increases of (i) $55.1 million associated with a sports programming contract entered into in August 2015 in
U.K./Ireland
and (ii) $19.2 million associated with a new Europe-wide programming contract that was entered into in June 2016 with retrospective impact to January 1, 2016. The increase in programming and copyright costs also includes the net effect of (a) an increase of $5.6 million in the Netherlands resulting from adjustments related to the settlement of operational contingencies recorded during the third and fourth quarters of 2015 and (b) a decrease of $3.5 million in
U.K./Ireland
associated with the reassessment of an accrual during the fourth quarter of 2016. In addition, growth in the number of enhanced video subscribers contributed to the increases in Germany and Belgium;
|
|
•
|
A decrease in mobile access and interconnect costs of $53.1 million or 4.8%, primarily due to the net effect of (i) a decline resulting from lower rates, primarily in
U.K./Ireland
, (ii) lower fixed-line telephony call volumes in
U.K./Ireland
and, to a lesser extent, the Netherlands, Belgium and Germany, (iii) higher mobile usage in
U.K./Ireland
and, to a lesser extent, Switzerland/Austria and Belgium, (iv) a $6.6 million decrease in Belgium due to the release of an accrual during the second quarter of 2016 as a result of the settlement of an operational contingency, (v) a decrease of $4.2 million in
U.K./Ireland
related to the settlement of disputes with mobile operators over amounts charged for voice traffic during the fourth quarter of 2015 and (vi) an increase of $3.9 million in Switzerland/Austria related to the settlement of an operational contingency during the third quarter of 2015; and
|
|
•
|
An increase in mobile handset costs of $11.3 million, primarily due to the net effect of (i) higher mobile handset sales volumes, as increases in
U.K./Ireland
and, to a lesser extent, Germany and Switzerland/Austria were only partially offset by lower handset sales in Belgium and (ii) a lower average cost per handset sold in
U.K./Ireland
. The lower number of handsets sold in Belgium is primarily attributable to a reduction in subsidized handset promotions.
|
LiLAC Division
.
The
LiLAC Division
’s programming and other direct costs of services increased
$340.3 million
or
100.6%
during
2016, as compared to 2015
. This increase includes an increase of
$337.9 million
attributable to the impact of the CWC Acquisition and the
Choice Acquisition
. Excluding the effects of acquisitions and
FX
, the
LiLAC Division
’s programming and other direct costs of services increased
$10.3 million
or
1.5%
. This increase includes the following factors:
|
•
|
An increase in programming and copyright costs of $10.9 million or 4.4%, primarily associated with the net effect of (i) growth in the number of enhanced video subscribers in Chile, (ii) decreased costs for certain premium content in Puerto Rico and (iii) an increase arising from foreign currency exchange rate fluctuations, after giving effect to derivative instruments that hedge the currency exposure associated with Chile’s U.S. dollar denominated programming contracts. A significant portion of Chile’s programming contracts are denominated in
U.S.
dollars. During 2016,
CWC
began broadcasting live Premier League games in a number of its markets pursuant to a new multi-year agreement. The cost of the rights to broadcast these games, which are excluded from the calculation of organic growth, will continue to result in significant increases to
CWC
’s programming costs;
|
|
•
|
An increase in mobile handset costs of $3.7 million, primarily due to higher mobile handset sales in Chile; and
|
|
•
|
A decrease in mobile access and interconnect costs of $1.7 million or 5.1%, primarily attributable to the net effect of (i) lower mobile access charges and, to a lesser extent, lower mobile usage in Chile and (ii) a $2.3 million increase in Chile related to an adjustment that was recorded in the first quarter of 2015 to reflect a February 2015 tariff decline that was retroactive to May 2014.
|
II-32
Programming and other direct costs of services —
2015
compared to
2014
|
|
Year ended December 31,
|
Increase (decrease)
|
Organic
increase (decrease)
|
||||||||||||||||||
|
|
2015
|
2014
|
$
|
%
|
$
|
%
|
|||||||||||||||
|
|
in millions, except percentages
|
||||||||||||||||||||
|
Liberty Global Group:
|
|||||||||||||||||||||
|
European Division:
|
|||||||||||||||||||||
|
U.K./Ireland
|
$
|
2,070.7
|
|
$
|
2,109.8
|
|
$
|
(39.1
|
)
|
(1.9
|
)
|
$
|
167.3
|
|
8.1
|
|
|||||
|
Belgium
|
526.8
|
|
586.7
|
|
(59.9
|
)
|
(10.2
|
)
|
41.0
|
|
7.0
|
|
|||||||||
|
The Netherlands (a)
|
468.6
|
|
256.2
|
|
212.4
|
|
82.9
|
|
(41.3
|
)
|
(6.9
|
)
|
|||||||||
|
Germany
|
203.5
|
|
237.3
|
|
(33.8
|
)
|
(14.2
|
)
|
6.2
|
|
2.6
|
|
|||||||||
|
Switzerland/Austria
|
236.9
|
|
246.7
|
|
(9.8
|
)
|
(4.0
|
)
|
9.6
|
|
3.9
|
|
|||||||||
|
Total Western Europe
|
3,506.5
|
|
3,436.7
|
|
69.8
|
|
2.0
|
|
182.8
|
|
4.9
|
|
|||||||||
|
Central and Eastern Europe
|
234.1
|
|
251.7
|
|
(17.6
|
)
|
(7.0
|
)
|
27.7
|
|
11.0
|
|
|||||||||
|
Central and other
|
(2.4
|
)
|
(1.3
|
)
|
(1.1
|
)
|
N.M.
|
|
(1.5
|
)
|
N.M.
|
|
|||||||||
|
Total European Division
|
3,738.2
|
|
3,687.1
|
|
51.1
|
|
1.4
|
|
209.0
|
|
5.2
|
|
|||||||||
|
Corporate and other
|
51.3
|
|
60.3
|
|
(9.0
|
)
|
(14.9
|
)
|
12.6
|
|
26.4
|
|
|||||||||
|
Intersegment eliminations
|
(23.2
|
)
|
(28.6
|
)
|
5.4
|
|
N.M.
|
|
0.3
|
|
N.M.
|
|
|||||||||
|
Total Liberty Global Group
|
3,766.3
|
|
3,718.8
|
|
47.5
|
|
1.3
|
|
221.9
|
|
5.5
|
|
|||||||||
|
LiLAC Group:
|
|||||||||||||||||||||
|
Chile
|
227.9
|
|
233.7
|
|
(5.8
|
)
|
(2.5
|
)
|
27.6
|
|
11.8
|
|
|||||||||
|
Puerto Rico (b)
|
110.3
|
|
90.6
|
|
19.7
|
|
21.7
|
|
5.2
|
|
4.9
|
|
|||||||||
|
Total LiLAC Division
|
338.2
|
|
324.3
|
|
13.9
|
|
4.3
|
|
32.8
|
|
9.7
|
|
|||||||||
|
Corporate
|
(0.5
|
)
|
—
|
|
(0.5
|
)
|
N.M.
|
|
(0.5
|
)
|
N.M.
|
|
|||||||||
|
Total LiLAC Group
|
337.7
|
|
324.3
|
|
13.4
|
|
4.1
|
|
32.3
|
|
9.5
|
|
|||||||||
|
Total
|
$
|
4,104.0
|
|
$
|
4,043.1
|
|
$
|
60.9
|
|
1.5
|
|
$
|
254.2
|
|
5.8
|
|
|||||
_______________
|
(a)
|
The amount presented for 2014 excludes the pre-acquisition programming and other direct costs of services of
Ziggo
, which was acquired on November 11, 2014.
|
|
(b)
|
The amount presented for 2015 includes the post-acquisition programming and other direct costs of services of
Choice
, which was acquired on June 3, 2015.
|
N.M. — Not Meaningful.
European Division
.
The
European Division
’s programming and other direct costs of services increased
$51.1 million
or
1.4%
during
2015
, as compared to
2014
. This increase includes (i) an increase of
$342.4 million
attributable to the impact of the
Ziggo Acquisition
and other less significant acquisitions and (ii) a decrease of
$38.1 million
attributable to the U.K. Non-Cable Disposal. Excluding the effects of acquisitions, the U.K. Non-Cable Disposal and
FX
, the
European Division
’s programming and other direct costs of services increased
$209.0 million
or
5.2%
. This increase includes the following factors:
|
•
|
An increase in programming and copyright costs of $193.7 million or 9.9%, primarily due to increases in
U.K./Ireland
and, to a lesser extent, Belgium.
The increased costs in (i)
U.K./Ireland
are primarily due to higher costs for certain premium and basic content, due in part to a new sports programming contract entered into in August 2015, and (ii) Belgium are primarily due to (a) higher costs for certain premium content and (b) growth in the number of enhanced video subscribers. The increase in programming and copyright costs also includes a $29.4 million net increase resulting from the impact of certain adjustments related to the settlement or reassessment of operational contingencies. The adjustments recorded during 2015 resulted in lower costs of $10.4 million, including a $6.5 million benefit in the Netherlands that we recorded during the third and fourth quarters of 2015 and a $3.9 million benefit in Germany that we recorded during the fourth quarter of 2015. The adjustments recorded during 2014 resulted in lower costs of $39.8 million, including (1)
|
II-33
a $17.5 million benefit in Belgium and a $7.3 million benefit in Poland that we recorded during the first quarter of 2014 and (2) an $11.6 million benefit in
U.K./Ireland
that we recorded during the second quarter of 2014;
|
•
|
An increase in mobile handset costs of $42.1 million, largely due to the net impact of (i) an increase in the proportion of higher-value handsets sold in
U.K./Ireland
and, to a lesser extent, increased mobile handset costs in Belgium, due in part to the impact of a Split-contract Program implemented in the
U.K.
in November 2014 and in Belgium in June 2015, (ii) a decrease in costs as a result of continued growth of subscriber identification module or “SIM”-only contracts in
U.K./Ireland
and (iii) a decrease in costs associated with the impact of subscriber promotions involving free or heavily-discounted handsets that were offered in Belgium during 2014; and
|
|
•
|
An increase in mobile access and interconnect costs of $1.7 million or 0.1%, primarily due to the net effect of (i)
increased costs, primarily in
U.K./Ireland
and Belgium, attributable to higher mobile usage and, in the case of Belgium, mobile subscriber growth, (ii) a decline resulting from lower rates, primarily in
U.K./Ireland
and Germany,
(iii) lower fixed-line telephony call volumes, primarily related to the net impact of declines in
U.K./Ireland
and the Netherlands and increases in Switzerland/Austria, (iv) increased costs associated with B2B services in
U.K./Ireland
, (v) an increase of $4.4 million in
U.K./Ireland
related to the settlement of disputes with mobile operators over amounts charged for voice traffic during the fourth quarter of 2015 and (vi) a decrease of $4.2 million in Switzerland/Austria related to the settlement of an operational contingency during the third quarter of 2015.
|
LiLAC Division
.
The
LiLAC Division
’s programming and other direct costs of services increased
$13.9 million
or
4.3%
during
2015
, as compared to
2014
. This increase includes an increase of
$14.5 million
attributable to the impact of the
Choice Acquisition
. Excluding the effects of this acquisition and
FX
, the
LiLAC Division
’s programming and other direct costs of services increased
$32.8 million
or
9.7%
. This increase includes the following factors:
|
•
|
An increase in programming and copyright costs of $24.9 million or 10.7%, primarily associated with (i) increases in Chile and, to a lesser extent, Puerto Rico, due to growth in the numbers of enhanced video subscribers and, in the case of Puerto Rico, increased costs for certain content, and (ii) an increase of $5.6 million arising from foreign currency exchange rate fluctuations with respect to Chile’s U.S. dollar denominated programming contracts. A significant portion of Chile’s programming contracts are denominated in
U.S.
dollars; and
|
|
•
|
An increase in mobile access and interconnect costs of $6.1 million or 8.1%, primarily attributable to the net effect of (i) an increase in Chile related to (a) higher roaming costs due to the impact of increased volumes and (b) higher interconnect costs resulting from the net effect of increased call volumes and lower rates, (ii) a decrease of $5.1 million in mobile access charges in Chile due to a February 2015 tariff decline that was retroactive to May 2014, including a decrease of $2.5 million related to 2014 access charges, and (iii) an increase in Puerto Rico related to additional capacity agreements with third-party internet providers.
|
II-34
Other Operating Expenses of our Reportable Segments
Other operating expenses —
2016
compared to
2015
General.
Other operating expenses include network operations, customer operations, customer care, share-based compensation and other costs related to our operations. We do not include share-based compensation in the following discussion and analysis of the other operating expenses of our reportable segments as share-based compensation expense is not included in the performance measures of our reportable segments. Share-based compensation expense is discussed under
Discussion and Analysis of our Consolidated Operating Results
below. We are subject to inflationary pressures with respect to our labor and certain other costs and foreign currency exchange risk with respect to
non-functional currency expenses
. Any cost increases that we are not able to pass on to our subscribers through rate increases would result in increased pressure on our operating margins. For additional information concerning our foreign currency exchange risks see
Quantitative and Qualitative Disclosures about Market Risk — Foreign Currency Risk
below.
|
|
Year ended December 31,
|
Increase (decrease)
|
Organic
increase (decrease)
|
||||||||||||||||||
|
|
2016
|
2015
|
$
|
%
|
$
|
%
|
|||||||||||||||
|
|
in millions, except percentages
|
||||||||||||||||||||
|
Liberty Global Group:
|
|||||||||||||||||||||
|
European Division:
|
|||||||||||||||||||||
|
U.K./Ireland
|
$
|
836.9
|
|
$
|
961.7
|
|
$
|
(124.8
|
)
|
(13.0
|
)
|
$
|
(39.1
|
)
|
(4.0
|
)
|
|||||
|
Belgium (a)
|
360.4
|
|
244.3
|
|
116.1
|
|
47.5
|
|
18.9
|
|
5.5
|
|
|||||||||
|
The Netherlands
|
346.9
|
|
373.9
|
|
(27.0
|
)
|
(7.2
|
)
|
(26.2
|
)
|
(7.0
|
)
|
|||||||||
|
Germany
|
342.5
|
|
339.6
|
|
2.9
|
|
0.9
|
|
4.6
|
|
1.4
|
|
|||||||||
|
Switzerland/Austria
|
225.1
|
|
252.8
|
|
(27.7
|
)
|
(11.0
|
)
|
(24.2
|
)
|
(9.6
|
)
|
|||||||||
|
Total Western Europe
|
2,111.8
|
|
2,172.3
|
|
(60.5
|
)
|
(2.8
|
)
|
(66.0
|
)
|
(2.9
|
)
|
|||||||||
|
Central and Eastern Europe
|
195.5
|
|
195.6
|
|
(0.1
|
)
|
(0.1
|
)
|
2.5
|
|
1.3
|
|
|||||||||
|
Central and other
|
130.6
|
|
99.6
|
|
31.0
|
|
31.1
|
|
31.1
|
|
31.2
|
|
|||||||||
|
Total European Division
|
2,437.9
|
|
2,467.5
|
|
(29.6
|
)
|
(1.2
|
)
|
(32.4
|
)
|
(1.3
|
)
|
|||||||||
|
Corporate and other
|
4.3
|
|
0.8
|
|
3.5
|
|
N.M.
|
|
3.6
|
|
N.M.
|
|
|||||||||
|
Intersegment eliminations
|
0.6
|
|
(0.7
|
)
|
1.3
|
|
N.M.
|
|
0.8
|
|
N.M.
|
|
|||||||||
|
Total Liberty Global Group
|
2,442.8
|
|
2,467.6
|
|
(24.8
|
)
|
(1.0
|
)
|
(28.0
|
)
|
(1.1
|
)
|
|||||||||
|
LiLAC Group:
|
|||||||||||||||||||||
|
LiLAC Division:
|
|||||||||||||||||||||
|
CWC (b)
|
249.6
|
|
—
|
|
249.6
|
|
N.M.
|
|
—
|
|
—
|
|
|||||||||
|
Chile
|
129.5
|
|
128.4
|
|
1.1
|
|
0.9
|
|
6.2
|
|
4.8
|
|
|||||||||
|
Puerto Rico (c)
|
58.3
|
|
55.3
|
|
3.0
|
|
5.4
|
|
(3.3
|
)
|
(5.4
|
)
|
|||||||||
|
Total LiLAC Division
|
437.4
|
|
183.7
|
|
253.7
|
|
138.1
|
|
2.9
|
|
0.7
|
|
|||||||||
|
Intersegment eliminations
|
(0.1
|
)
|
0.5
|
|
(0.6
|
)
|
N.M.
|
|
(0.6
|
)
|
N.M.
|
|
|||||||||
|
Total LiLAC Group
|
437.3
|
|
184.2
|
|
253.1
|
|
137.4
|
|
2.3
|
|
0.5
|
|
|||||||||
|
Total other operating expenses excluding share-based compensation expense
|
2,880.1
|
|
2,651.8
|
|
228.3
|
|
8.6
|
|
$
|
(25.7
|
)
|
(0.9
|
)
|
||||||||
|
Share-based compensation expense
|
4.7
|
|
3.4
|
|
1.3
|
|
38.2
|
|
|||||||||||||
|
Total
|
$
|
2,884.8
|
|
$
|
2,655.2
|
|
$
|
229.6
|
|
8.6
|
|
||||||||||
_______________
|
(a)
|
The amount presented for 2016 includes the post-acquisition other operating expenses of BASE, which was acquired on February 11, 2016.
|
|
(b)
|
The amount presented for 2016 reflects the post-acquisition other operating expenses of CWC, which was acquired on May 16, 2016.
|
II-35
|
(c)
|
The amount presented for 2015 excludes the pre-acquisition other operating expenses of
Choice
, which was acquired on June 3, 2015.
|
N.M. — Not Meaningful.
European Division
.
The
European Division
’s other operating expenses (exclusive of share-based compensation expense) decreased
$29.6 million
or
1.2%
during
2016, as compared to 2015
. This decrease includes (i) an increase of
$109.6 million
attributable to the impact of the
BASE Acquisition
and other less significant acquisitions and (ii) a decrease of
$1.0 million
attributable to the
U.K. Non-Cable Disposal
and another less significant disposition. Excluding the effects of acquisitions, dispositions and
FX
, the
European Division
’s other operating expenses decreased
$32.4 million
or
1.3%
. This decrease includes the following factors:
|
•
|
A decrease in personnel costs of $29.0 million or 3.2%, due primarily to the net effect of (i) decreased staffing levels, as decreases in
U.K./Ireland
, Switzerland/Austria and the Netherlands were only partially offset by increases in the
European Division
’s central operations and Belgium, (ii) annual wage increases, (iii) decreased costs in
U.K./Ireland
resulting from higher proportions of capitalized labor costs associated with the
Network Extensions
, (iv) lower costs related to certain employee benefits in
U.K./Ireland
and the
European Division
’s central operations and (v) lower incentive compensation costs, primarily in
U.K./Ireland
;
|
|
•
|
An increase in network-related expenses of $15.5 million or 2.2%. This increase is primarily due to the net effect of (i) an $18.1 million increase resulting from retroactive adjustments recorded during the first and second quarters of 2015 to reflect lower local authority charges for certain elements of network infrastructure in the
U.K.
, (ii) higher network maintenance costs, as increases in Belgium,
U.K./Ireland
, Hungary
and Poland were only partially offset by decreases in the Netherlands and Switzerland/Austria, (iii) lower outsourced labor costs primarily associated with customer-facing activities in Germany and
U.K./Ireland
,
(iv) a $6.2 million decrease in
U.K./Ireland
associated with the settlement of an operational contingency during the first quarter of 2016, (v) higher energy costs, as increases in Belgium, the Netherlands and Germany were only partially offset by lower costs in
U.K./Ireland
, (vi) a net decrease of $5.5 million in Germany associated with certain reassessments of an accrual during 2016 and 2015 and (vii) a decrease of $2.5 million as a result of costs incurred during the first half of 2015 associated with network harmonization activities following the
Ziggo Acquisition
. For information regarding increased charges for network infrastructure in the
U.K.
that are expected to become effective April 1, 2017, see note
17
to our consolidated financial statements;
|
|
•
|
A decrease in bad debt and collection expenses of $11.2 million or 8.3%, primarily related to declines in
U.K./Ireland
, the Netherlands, Hungary and Switzerland/Austria that were only partially offset by increases in Germany and Poland;
|
|
•
|
An increase in outsourced labor and professional fees of $10.5 million or 2.9%, primarily due to (i) an increase in call center costs, as higher costs in
U.K./Ireland
were only partially offset by lower costs in Switzerland/Austria and the Netherlands and (ii) higher consulting costs, as increases in the
European Division
’s central operations, Switzerland/Austria and the Netherlands were only partially offset by decreases in Belgium and
U.K./Ireland
. The lower call center costs in the Netherlands are attributable to a decrease of $12.7 million associated with third-party costs related to network and product harmonization activities and certain other third-party customer care costs following the
Ziggo Acquisition
;
|
|
•
|
An increase in information technology-related expenses of $9.0 million or 9.6%, as higher software and other information technology-related service and maintenance costs in the
European Division
’s central operations, Germany and the Netherlands were only partially offset by a decrease in
U.K./Ireland
;
|
|
•
|
A decrease in
facilities expenses of $7.5 million or 12.7%, primarily due to lower costs in
U.K./Ireland
and the Netherlands;
|
|
•
|
A decrease in vehicle expenses of $4.8 million or 10.7%, primarily related to lower costs for company vehicles in
U.K./Ireland
, the Netherlands, Switzerland/Austria and Hungary due largely to fewer vehicles and the impact of the conversion of certain operating leases to capital leases; and
|
|
•
|
A net decrease resulting from individually insignificant changes in other operating expense categories.
|
During the fourth quarter of 2016, we settled certain pylon tax disputes between
BASE
and certain local authorities in Belgium. In connection with this settlement, we reversed $8.1 million of the pylon tax provisions that
BASE
had recorded since we acquired
BASE
in February 2016. The effect of the originally recorded provisions and the reversal is included in our acquisition effect for
BASE
and accordingly does not impact the organic changes in Telenet's other operating expenses.
II-36
LiLAC Division
.
The
LiLAC Division
’s other operating expenses (exclusive of share-based compensation expense) increased
$253.7 million
or
138.1%
during
2016, as compared to 2015
. This increase includes an increase of
$255.8 million
attributable to the impact of the CWC Acquisition and the
Choice Acquisition
. Excluding the effects of acquisitions and
FX
, the
LiLAC Division
’s other operating expenses increased
$2.9 million
or
0.7%
. This increase includes the following factors:
|
•
|
An increase in outsourced labor and professional fees of $4.6 million or 14.1%, primarily due to higher call center costs in Chile;
|
|
•
|
A decrease in personnel costs of $2.0 million or 10.7%, primarily due to (i) annual wage decreases in Chile and (ii) lower staffing levels in Puerto Rico;
|
|
•
|
A decrease in bad debt and collection expenses of $1.2 million or 2.9%, predominantly in Puerto Rico;
|
|
•
|
An increase in network-related expenses of $1.0 million or 2.1%, primarily due to the net effect of (i) higher energy costs in Chile and (ii) lower outsourced labor costs associated with customer-facing activities in Puerto Rico; and
|
|
•
|
An increase resulting from individually insignificant changes in other
operating expense categories
.
|
II-37
Other operating expenses —
2015
compared to
2014
|
|
Year ended December 31,
|
Increase (decrease)
|
Organic
increase (decrease)
|
||||||||||||||||||
|
|
2015
|
2014
|
$
|
%
|
$
|
%
|
|||||||||||||||
|
|
in millions, except percentages
|
||||||||||||||||||||
|
Liberty Global Group:
|
|||||||||||||||||||||
|
European Division:
|
|||||||||||||||||||||
|
U.K./Ireland
|
$
|
961.7
|
|
$
|
1,112.7
|
|
$
|
(151.0
|
)
|
(13.6
|
)
|
$
|
(65.1
|
)
|
(5.9
|
)
|
|||||
|
Belgium
|
244.3
|
|
279.8
|
|
(35.5
|
)
|
(12.7
|
)
|
12.7
|
|
4.5
|
|
|||||||||
|
The Netherlands (a)
|
373.9
|
|
188.7
|
|
185.2
|
|
98.1
|
|
18.7
|
|
4.4
|
|
|||||||||
|
Germany
|
339.6
|
|
377.7
|
|
(38.1
|
)
|
(10.1
|
)
|
28.7
|
|
7.6
|
|
|||||||||
|
Switzerland/Austria
|
252.8
|
|
292.9
|
|
(40.1
|
)
|
(13.7
|
)
|
(17.8
|
)
|
(6.1
|
)
|
|||||||||
|
Total Western Europe
|
2,172.3
|
|
2,251.8
|
|
(79.5
|
)
|
(3.5
|
)
|
(22.8
|
)
|
(0.9
|
)
|
|||||||||
|
Central and Eastern Europe
|
195.6
|
|
248.3
|
|
(52.7
|
)
|
(21.2
|
)
|
(14.2
|
)
|
(5.7
|
)
|
|||||||||
|
Central and other
|
99.6
|
|
78.5
|
|
21.1
|
|
26.9
|
|
37.7
|
|
48.0
|
|
|||||||||
|
Total European Division
|
2,467.5
|
|
2,578.6
|
|
(111.1
|
)
|
(4.3
|
)
|
0.7
|
|
—
|
|
|||||||||
|
Corporate and other
|
0.8
|
|
1.3
|
|
(0.5
|
)
|
N.M.
|
|
0.8
|
|
N.M.
|
|
|||||||||
|
Intersegment eliminations
|
(0.7
|
)
|
—
|
|
(0.7
|
)
|
N.M.
|
|
—
|
|
N.M.
|
|
|||||||||
|
Total Liberty Global Group
|
2,467.6
|
|
2,579.9
|
|
(112.3
|
)
|
(4.4
|
)
|
1.5
|
|
0.1
|
|
|||||||||
|
LiLAC Group:
|
|||||||||||||||||||||
|
Chile
|
128.4
|
|
143.6
|
|
(15.2
|
)
|
(10.6
|
)
|
3.3
|
|
2.3
|
|
|||||||||
|
Puerto Rico (b)
|
55.3
|
|
44.7
|
|
10.6
|
|
23.7
|
|
1.7
|
|
3.2
|
|
|||||||||
|
Total LiLAC Division
|
183.7
|
|
188.3
|
|
(4.6
|
)
|
(2.4
|
)
|
5.0
|
|
2.5
|
|
|||||||||
|
Corporate
|
0.5
|
|
—
|
|
0.5
|
|
N.M.
|
|
0.5
|
|
N.M.
|
|
|||||||||
|
Total LiLAC Group
|
184.2
|
|
188.3
|
|
(4.1
|
)
|
(2.2
|
)
|
5.5
|
|
2.8
|
|
|||||||||
|
Total other operating expenses excluding share-based compensation expense
|
2,651.8
|
|
2,768.2
|
|
(116.4
|
)
|
(4.2
|
)
|
$
|
7.0
|
|
0.2
|
|
||||||||
|
Share-based compensation expense
|
3.4
|
|
7.6
|
|
(4.2
|
)
|
(55.3
|
)
|
|||||||||||||
|
Total
|
$
|
2,655.2
|
|
$
|
2,775.8
|
|
$
|
(120.6
|
)
|
(4.3
|
)
|
||||||||||
_______________
|
(a)
|
The amount presented for 2014 excludes the pre-acquisition other operating expenses of
Ziggo
, which was acquired on November 11, 2014.
|
|
(b)
|
The amount presented for 2015 includes the post-acquisition other operating expenses of
Choice
, which was acquired on June 3, 2015.
|
N.M. — Not Meaningful.
II-38
European Division
.
The
European Division
’s other operating expenses (exclusive of share-based compensation expense) decreased
$111.1 million
or
4.3%
during
2015
, as compared to
2014
. This decrease includes (i) an increase of
$236.1 million
attributable to the impact of the
Ziggo Acquisition
and other less significant acquisitions and (ii) a decrease of
$3.6 million
attributable to the U.K. Non-Cable Disposal. Excluding the effects of acquisitions, the U.K. Non-Cable Disposal and
FX
, the
European Division
’s other operating expenses increased
$0.7 million
or
0.0%
. This increase includes the following factors:
|
•
|
An increase in information technology-related expenses of $29.1 million or 40.2%, primarily due to higher software and other information technology-related service and maintenance costs, primarily in
U.K./Ireland
, the
European Division
’s central operations and Belgium;
|
|
•
|
A decrease in personnel costs of $17.6 million or 1.9%, due primarily to the net effect of (i) lower incentive compensation costs, predominantly in
U.K./Ireland
, (ii) increased staffing levels, primarily in the
European Division
’s central operations, (iii) decreased costs in
U.K./Ireland
due to higher capitalized labor costs associated with the
Network Extensions
, (iv) annual wage increases, largely in
U.K./Ireland
, and (v) lower costs related to certain employee benefits in the Netherlands;
|
|
•
|
An increase in outsourced labor and professional fees of $15.8 million or 4.4%, primarily due to the net effect of (i) higher call center costs in the Netherlands and
U.K./Ireland
and (ii) lower consulting costs, as a decrease in the
European Division
’s central operations was only partially offset by increases in Belgium and the Netherlands. The higher call center costs in the Netherlands represent third-party costs that are primarily related to network and product harmonization activities following the
Ziggo Acquisition
that, together with certain other third-party customer care costs, accounted for an increase of $17.3 million; and
|
|
•
|
A decrease in network-related expenses of $9.6 million or 1.2%. This decrease includes (i) lower outsourced labor costs associated with customer-facing activities in
U.K./Ireland
, (ii) lower costs of $8.6 million in
U.K./Ireland
associated with the reassessment of accruals or operational contingencies in 2015, (iii) an increase in third-party costs incurred in the Netherlands of $2.8 million related to the harmonization of the Ziggo and
Ziggo Services
networks following the
Ziggo Acquisition
and (iv) a decrease in network maintenance costs, as decreases in
U.K./Ireland
and Switzerland/Austria were largely offset by increases in the Netherlands, Germany and Belgium.
The decrease in network-related expense also includes the impact of reductions in local authority charges for certain elements of network infrastructure in the
U.K.
arising from successful appeals during the last half of 2014 and the first half of 2015. As compared to 2014, these reductions in local authority charges resulted in an increase in
U.K./Ireland
’s network-related expenses of $8.6 million.
|
LiLAC Division
.
The
LiLAC Division
’s other operating expenses (exclusive of share-based compensation expense) decreased
$4.6 million
or
2.4%
during
2015
, as compared to
2014
. This decrease includes an increase of
$8.9 million
attributable to the impact of the
Choice Acquisition
. Excluding the effects of this acquisition and
FX
, the
LiLAC Division
’s other operating expenses increased
$5.0 million
or
2.5%
. This increase includes the following factors:
|
•
|
A decrease in personnel costs of $7.1 million or 12.7%, largely due to (i) lower incentive compensation costs in Chile and (ii) decreased costs related to higher proportions of employees devoted to the development of new billing and customer care systems and other capitalizable activities in Chile;
|
|
•
|
An increase in network-related expenses of $4.4 million or 10.3%, primarily due to an increase in network maintenance costs in Chile;
|
|
•
|
An increase of $4.1 million due to the impact of favorable adjustments recorded in Chile during the fourth quarter of 2014 related to the reassessment of certain accrued liabilities; and
|
|
•
|
An increase in outsourced labor and professional fees of $3.2 million or 9.5%, primarily due to higher call center costs in Chile.
|
II-39
SG&A Expenses of our Reportable Segments
SG&A expenses —
2016
compared to
2015
General.
SG&A expenses include human resources, information technology, general services, management, finance, legal, external sales and marketing costs, share-based compensation and other general expenses. We do not include share-based compensation in the following discussion and analysis of the SG&A expenses of our reportable segments as share-based compensation expense is not included in the performance measures of our reportable segments. Share-based compensation expense is discussed under
Discussion and Analysis of our Consolidated Operating Results
below. We are subject to inflationary pressures with respect to our labor and certain other costs and foreign currency exchange risk with respect to
non-functional currency expenses
. For additional information concerning our foreign currency exchange risks see
Quantitative and Qualitative Disclosures about Market Risk — Foreign Currency Risk
below.
|
|
Year ended December 31,
|
Increase (decrease)
|
Organic
increase (decrease)
|
||||||||||||||||||
|
|
2016
|
2015
|
$
|
%
|
$
|
%
|
|||||||||||||||
|
|
in millions, except percentages
|
||||||||||||||||||||
|
Liberty Global Group:
|
|||||||||||||||||||||
|
European Division:
|
|||||||||||||||||||||
|
U.K./Ireland
|
$
|
794.6
|
|
$
|
864.2
|
|
$
|
(69.6
|
)
|
(8.1
|
)
|
$
|
10.0
|
|
1.1
|
|
|||||
|
Belgium (a)
|
422.4
|
|
259.6
|
|
162.8
|
|
62.7
|
|
25.6
|
|
6.4
|
|
|||||||||
|
The Netherlands
|
362.1
|
|
383.3
|
|
(21.2
|
)
|
(5.5
|
)
|
(19.9
|
)
|
(5.2
|
)
|
|||||||||
|
Germany
|
382.1
|
|
354.3
|
|
27.8
|
|
7.8
|
|
28.9
|
|
8.2
|
|
|||||||||
|
Switzerland/Austria
|
215.8
|
|
228.4
|
|
(12.6
|
)
|
(5.5
|
)
|
(9.5
|
)
|
(4.2
|
)
|
|||||||||
|
Total Western Europe
|
2,177.0
|
|
2,089.8
|
|
87.2
|
|
4.2
|
|
35.1
|
|
1.6
|
|
|||||||||
|
Central and Eastern Europe
|
166.6
|
|
162.9
|
|
3.7
|
|
2.3
|
|
6.2
|
|
3.8
|
|
|||||||||
|
Central and other
|
194.7
|
|
186.6
|
|
8.1
|
|
4.3
|
|
8.1
|
|
4.3
|
|
|||||||||
|
Total European Division
|
2,538.3
|
|
2,439.3
|
|
99.0
|
|
4.1
|
|
49.4
|
|
1.9
|
|
|||||||||
|
Corporate and other
|
211.6
|
|
212.8
|
|
(1.2
|
)
|
(0.6
|
)
|
3.6
|
|
1.7
|
|
|||||||||
|
Intersegment eliminations
|
(0.4
|
)
|
0.4
|
|
(0.8
|
)
|
N.M.
|
|
—
|
|
N.M.
|
|
|||||||||
|
Total Liberty Global Group
|
2,749.5
|
|
2,652.5
|
|
97.0
|
|
3.7
|
|
53.0
|
|
1.9
|
|
|||||||||
|
LiLAC Group:
|
|||||||||||||||||||||
|
LiLAC Division:
|
|||||||||||||||||||||
|
CWC (b)
|
325.7
|
|
—
|
|
325.7
|
|
N.M.
|
|
9.9
|
|
3.1
|
|
|||||||||
|
Chile
|
153.1
|
|
153.7
|
|
(0.6
|
)
|
(0.4
|
)
|
4.4
|
|
2.9
|
|
|||||||||
|
Puerto Rico (c)
|
37.4
|
|
46.4
|
|
(9.0
|
)
|
(19.4
|
)
|
(14.6
|
)
|
(28.1
|
)
|
|||||||||
|
Total LiLAC Division
|
516.2
|
|
200.1
|
|
316.1
|
|
158.0
|
|
(0.3
|
)
|
—
|
|
|||||||||
|
Corporate
|
8.9
|
|
4.3
|
|
4.6
|
|
N.M.
|
|
4.6
|
|
N.M.
|
|
|||||||||
|
Intersegment eliminations
|
0.1
|
|
—
|
|
0.1
|
|
N.M.
|
|
0.1
|
|
N.M.
|
|
|||||||||
|
Total LiLAC Group
|
525.2
|
|
204.4
|
|
320.8
|
|
156.9
|
|
4.4
|
|
0.8
|
|
|||||||||
|
Total SG&A expenses excluding share-based compensation expense
|
3,274.7
|
|
2,856.9
|
|
417.8
|
|
14.6
|
|
$
|
57.4
|
|
1.7
|
|
||||||||
|
Share-based compensation expense
|
292.2
|
|
314.8
|
|
(22.6
|
)
|
(7.2
|
)
|
|||||||||||||
|
Total
|
$
|
3,566.9
|
|
$
|
3,171.7
|
|
$
|
395.2
|
|
12.5
|
|
||||||||||
______________
|
(a)
|
The amount presented for 2016 includes the post-acquisition SG&A expenses of BASE, which was acquired on February 11, 2016.
|
|
(b)
|
The amount presented for 2016 reflects the post-acquisition SG&A expenses of CWC, which was acquired on May 16, 2016.
|
II-40
|
(c)
|
The amount presented for 2015 excludes the pre-acquisition SG&A expenses of
Choice
, which was acquired on June 3, 2015.
|
N.M. — Not Meaningful.
Supplemental SG&A expense information:
|
|
Year ended December 31,
|
Increase (decrease)
|
Organic
increase (decrease)
|
||||||||||||||||||
|
|
2016
|
2015
|
$
|
%
|
$
|
%
|
|||||||||||||||
|
|
in millions, except percentages
|
||||||||||||||||||||
|
Liberty Global Group:
|
|||||||||||||||||||||
|
General and administrative (a)
|
$
|
1,932.1
|
|
$
|
1,808.4
|
|
$
|
123.7
|
|
6.8
|
|
$
|
70.3
|
|
3.6
|
|
|||||
|
External sales and marketing
|
817.4
|
|
844.1
|
|
(26.7
|
)
|
(3.2
|
)
|
(17.3
|
)
|
(2.0
|
)
|
|||||||||
|
2,749.5
|
|
2,652.5
|
|
97.0
|
|
3.7
|
|
53.0
|
|
1.9
|
|
||||||||||
|
LiLAC Group:
|
|||||||||||||||||||||
|
General and administrative (a)
|
430.4
|
|
147.4
|
|
283.0
|
|
192.0
|
|
3.0
|
|
0.7
|
|
|||||||||
|
External sales and marketing
|
94.8
|
|
57.0
|
|
37.8
|
|
66.3
|
|
1.4
|
|
1.5
|
|
|||||||||
|
525.2
|
|
204.4
|
|
320.8
|
|
156.9
|
|
4.4
|
|
0.8
|
|
||||||||||
|
Total:
|
|||||||||||||||||||||
|
General and administrative (a)
|
2,362.5
|
|
1,955.8
|
|
406.7
|
|
20.8
|
|
73.3
|
|
3.1
|
|
|||||||||
|
External sales and marketing
|
912.2
|
|
901.1
|
|
11.1
|
|
1.2
|
|
(15.9
|
)
|
(1.6
|
)
|
|||||||||
|
Total
|
$
|
3,274.7
|
|
$
|
2,856.9
|
|
$
|
417.8
|
|
14.6
|
|
$
|
57.4
|
|
1.7
|
|
|||||
______________
|
(a)
|
General and administrative expenses include all personnel-related costs within our SG&A expenses, including personnel-related costs associated with our sales and marketing function.
|
European Division
.
The
European Division
’s SG&A expenses (exclusive of share-based compensation expense) increased
$99.0 million
or
4.1%
during
2016, as compared to 2015
. This increase includes
$152.7 million
attributable to the impact of the BASE Acquisition and other less significant acquisitions. Excluding the effects of acquisitions and
FX
, the
European Division
’s SG&A expenses increased
$49.4 million
or
1.9%
. This increase includes the following factors:
|
•
|
An increase in personnel costs of $49.6 million or 5.0%, primarily due to (i) increased staffing levels, as increases in
U.K./Ireland
, the
European Division
’s central operations, Germany and, to a lesser extent, Switzerland/Austria, were only partially offset by decreased staffing levels in the Netherlands and (ii) annual wage increases;
|
|
•
|
A decrease in external sales and marketing costs of $15.1 million or 1.8%, primarily due to the net effect of (i) lower costs associated with advertising campaigns, as decreases in
U.K./Ireland
, the Netherlands and Switzerland/Austria were only partially offset by higher costs in Belgium,
(ii) higher third-party sales commissions, as increases in Germany and
U.K./Ireland
were only partially offset by a decline in the Netherlands, (iii) lower third-party costs in the Netherlands of $4.0 million related to the impact of rebranding costs incurred during the 2015 period following the
Ziggo Acquisition
and (iv) a net increase of $0.3 million in Germany, as the reassessments of accruals led to offsetting reductions of $3.7 million and $4.0 million during 2016 and 2015, respectively;
|
|
•
|
An increase in facilities expenses of $9.3 million or 4.6%, primarily due to higher rent and other facilities-related expenses in the
European Division
’s central operations, Germany, Belgium, the Netherlands and
U.K./Ireland
;
|
|
•
|
An increase of $8.4 million due to the impact of an accrual release during the second quarter of 2015 related to the resolution of a contingency associated with universal service obligations in Belgium;
|
|
•
|
A decrease in outsourced labor and professional fees of $5.2 million or 3.1%, due to the net effect of (i) increased legal costs in the
European Division
’s central operations and Belgium, (ii) a decrease in consulting costs, as decreases in the
European Division
’s central operations and
U.K./Ireland
were only partially offset by increases in Belgium and the Netherlands, and (iii) a net decrease resulting from other individually insignificant changes. The decrease in consulting
|
II-41
costs includes (a) a decrease of $4.8 million associated with integration costs incurred in connection with the
Ziggo Acquisition
, (b)
a $3.5 million decrease in integration costs in Belgium as the costs incurred in 2015 to prepare for the integration of BASE into Telenet’s operations exceeded the integration costs incurred in 2016 and (c) a decrease of $2.6 million in
U.K./Ireland
associated with consulting fees incurred during the fourth quarter of 2015 in connection with the settlement of disputes with mobile operators over amounts charged for voice traffic;
|
•
|
An increase in outsourced call center expenses of $5.1 million of 12.3%, primarily due to increases in the Netherlands and
U.K./Ireland
; and
|
|
•
|
An increase in information technology-related expenses of $2.6 million or 2.4%, primarily due to higher software and other information technology-related maintenance costs in the
European Division
’s central operations and Belgium that were only partially offset by a decrease in these costs in the Netherlands.
|
LiLAC Division
.
The
LiLAC Division
’s SG&A expenses (exclusive of share-based compensation expense)
increased
$316.1 million
or
158.0%
during
2016, as compared to 2015
. This increase includes an increase of
$321.3 million
attributable to the impact of the
CWC Acquisition
and the
Choice Acquisition
. Excluding the effects of acquisitions and
FX
, the
LiLAC Division
’s SG&A expenses decreased
$0.3 million
or
0.0%
. This decrease includes the following factors:
|
•
|
A $12.6 million decrease associated with the effective settlement of the
PRTC Claim
including (i) a $5.1 million reduction that represents the net impact of the reversal of the provision and related indemnification asset associated with the
PRTC Claim
that were originally recorded in connection with the
OneLink Acquisition
and (ii) the receipt of $7.5 million of indemnification proceeds from the former owners of
OneLink
. For additional information, see note
17
to our consolidated financial statements;
|
|
•
|
An increase of $9.9 million associated with integration costs incurred during 2016 to integrate
Columbus
(acquired by
CWC
on March 31, 2015) with
CWC
’s operations and
CWC
’s operations with
Liberty Global
and the
LiLAC Division
.
These costs are excluded from the
Acquisition Impact
for
CWC
and, accordingly, are included in the calculation of organic growth;
|
|
•
|
An increase in personnel costs of $2.3 million or 3.5%, primarily in Chile, as increases in staffing levels and higher incentive compensation costs were only partially offset by lower severance costs; and
|
|
•
|
A decrease in facilities expenses of $2.2 million or 6.2%, primarily due to lower facilities maintenance and utility costs in Chile.
|
II-42
SG&A expenses —
2015
compared to
2014
|
|
Year ended December 31,
|
Increase (decrease)
|
Organic
increase (decrease)
|
||||||||||||||||||
|
|
2015
|
2014
|
$
|
%
|
$
|
%
|
|||||||||||||||
|
|
in millions, except percentages
|
||||||||||||||||||||
|
Liberty Global Group:
|
|||||||||||||||||||||
|
European Division:
|
|||||||||||||||||||||
|
U.K./Ireland
|
$
|
864.2
|
|
$
|
951.7
|
|
$
|
(87.5
|
)
|
(9.2
|
)
|
$
|
(14.3
|
)
|
(1.5
|
)
|
|||||
|
Belgium
|
259.6
|
|
287.9
|
|
(28.3
|
)
|
(9.8
|
)
|
22.4
|
|
7.8
|
|
|||||||||
|
The Netherlands (a)
|
383.3
|
|
195.7
|
|
187.6
|
|
95.9
|
|
(29.3
|
)
|
(6.1
|
)
|
|||||||||
|
Germany
|
354.3
|
|
418.3
|
|
(64.0
|
)
|
(15.3
|
)
|
5.0
|
|
1.2
|
|
|||||||||
|
Switzerland/Austria
|
228.4
|
|
250.1
|
|
(21.7
|
)
|
(8.7
|
)
|
(2.8
|
)
|
(1.1
|
)
|
|||||||||
|
Total Western Europe
|
2,089.8
|
|
2,103.7
|
|
(13.9
|
)
|
(0.7
|
)
|
(19.0
|
)
|
(0.8
|
)
|
|||||||||
|
Central and Eastern Europe
|
162.9
|
|
176.5
|
|
(13.6
|
)
|
(7.7
|
)
|
18.2
|
|
10.3
|
|
|||||||||
|
Central and other
|
186.6
|
|
198.4
|
|
(11.8
|
)
|
(5.9
|
)
|
25.5
|
|
12.9
|
|
|||||||||
|
Total European Division
|
2,439.3
|
|
2,478.6
|
|
(39.3
|
)
|
(1.6
|
)
|
24.7
|
|
0.9
|
|
|||||||||
|
Corporate and other
|
212.8
|
|
221.2
|
|
(8.4
|
)
|
(3.8
|
)
|
4.5
|
|
2.0
|
|
|||||||||
|
Intersegment eliminations
|
0.4
|
|
(0.3
|
)
|
0.7
|
|
N.M.
|
|
0.3
|
|
N.M.
|
|
|||||||||
|
Total Liberty Global Group
|
2,652.5
|
|
2,699.5
|
|
(47.0
|
)
|
(1.7
|
)
|
29.5
|
|
1.0
|
|
|||||||||
|
LiLAC Group:
|
|||||||||||||||||||||
|
LiLAC Division:
|
|||||||||||||||||||||
|
Chile
|
153.7
|
|
170.2
|
|
(16.5
|
)
|
(9.7
|
)
|
6.2
|
|
3.6
|
|
|||||||||
|
Puerto Rico (b)
|
46.4
|
|
41.9
|
|
4.5
|
|
10.7
|
|
(3.2
|
)
|
(6.6
|
)
|
|||||||||
|
Total LiLAC Division
|
200.1
|
|
212.1
|
|
(12.0
|
)
|
(5.7
|
)
|
3.0
|
|
1.4
|
|
|||||||||
|
Corporate
|
4.3
|
|
3.1
|
|
1.2
|
|
38.7
|
|
1.2
|
|
38.7
|
|
|||||||||
|
Total LiLAC Group
|
204.4
|
|
215.2
|
|
(10.8
|
)
|
(5.0
|
)
|
4.2
|
|
1.9
|
|
|||||||||
|
Total SG&A expenses excluding share-based compensation expense
|
2,856.9
|
|
2,914.7
|
|
(57.8
|
)
|
(2.0
|
)
|
$
|
33.7
|
|
1.1
|
|
||||||||
|
Share-based compensation expense
|
314.8
|
|
249.6
|
|
65.2
|
|
26.1
|
|
|||||||||||||
|
Total
|
$
|
3,171.7
|
|
$
|
3,164.3
|
|
$
|
7.4
|
|
0.2
|
|
||||||||||
______________
|
(a)
|
The amount presented for 2014 excludes the pre-acquisition SG&A expenses of
Ziggo
, which was acquired on November 11, 2014.
|
|
(b)
|
The amount presented for 2015 includes the post-acquisition SG&A expenses of
Choice
, which was acquired on June 3, 2015.
|
N.M. — Not Meaningful.
II-43
Supplemental SG&A expense information:
|
|
Year ended December 31,
|
Decrease
|
Organic
increase (decrease)
|
||||||||||||||||||
|
|
2015
|
2014
|
$
|
%
|
$
|
%
|
|||||||||||||||
|
|
in millions, except percentages
|
||||||||||||||||||||
|
Liberty Global Group:
|
|||||||||||||||||||||
|
General and administrative (a)
|
$
|
1,808.4
|
|
$
|
1,828.0
|
|
$
|
(19.6
|
)
|
(1.1
|
)
|
$
|
35.1
|
|
1.7
|
|
|||||
|
External sales and marketing
|
844.1
|
|
871.5
|
|
(27.4
|
)
|
(3.1
|
)
|
(5.6
|
)
|
(0.6
|
)
|
|||||||||
|
2,652.5
|
|
2,699.5
|
|
(47.0
|
)
|
(1.7
|
)
|
29.5
|
|
1.0
|
|
||||||||||
|
LiLAC Group:
|
|||||||||||||||||||||
|
General and administrative (a)
|
147.4
|
|
155.9
|
|
(8.5
|
)
|
(5.5
|
)
|
(0.2
|
)
|
(0.1
|
)
|
|||||||||
|
External sales and marketing
|
57.0
|
|
59.3
|
|
(2.3
|
)
|
(3.9
|
)
|
4.4
|
|
7.4
|
|
|||||||||
|
204.4
|
|
215.2
|
|
(10.8
|
)
|
(5.0
|
)
|
4.2
|
|
1.9
|
|
||||||||||
|
Total:
|
|||||||||||||||||||||
|
General and administrative (a)
|
1,955.8
|
|
1,983.9
|
|
(28.1
|
)
|
(1.4
|
)
|
34.9
|
|
1.6
|
|
|||||||||
|
External sales and marketing
|
901.1
|
|
930.8
|
|
(29.7
|
)
|
(3.2
|
)
|
(1.2
|
)
|
(0.1
|
)
|
|||||||||
|
Total
|
$
|
2,856.9
|
|
$
|
2,914.7
|
|
$
|
(57.8
|
)
|
(2.0
|
)
|
$
|
33.7
|
|
1.1
|
|
|||||
______________
|
(a)
|
General and administrative expenses include all personnel-related costs within our SG&A expenses, including personnel-related costs associated with our sales and marketing function.
|
European Division
.
The
European Division
’s SG&A expenses (exclusive of share-based compensation expense) decreased
$39.3 million
or
1.6%
during
2015
, as compared to
2014
. This decrease includes
$286.7 million
attributable to the impact of the
Ziggo Acquisition
and other less significant acquisitions. Excluding the effects of acquisitions and
FX
, the
European Division
’s SG&A expenses increased
$24.7 million
or
0.9%
. This increase includes the following factors:
|
•
|
An increase in outsourced labor and professional fees of $22.4 million or 13.5%, primarily due to the net effect of (i)
increased consulting costs associated with (a) strategic initiatives in
U.K./Ireland
and (b) scale initiatives in the areas of information technology and finance in the European Division’s central operations, (ii) the positive impact of a $7.8 million increase associated with consulting fees incurred during the third quarter of 2014 in connection with the reduction in local authority charges for certain elements of network infrastructure in the U.K., as discussed under
Other Operating Expenses of our Reportable Segments
above,
(iii) increased consulting costs related to integration activities in (1) Belgium of $9.0 million and
(2) the Netherlands and the
European Division
’s central operations of $1.6 million, (iv) decreased consulting costs related to strategic initiatives in Germany, (v) decreased legal costs in
U.K./Ireland
and (vi) an increase of $2.7 million in
U.K./Ireland
associated with consulting fees incurred during the fourth quarter of 2015 in connection with the settlement of disputes with mobile operators over amounts charged for voice traffic;
|
|
•
|
An increase in personnel costs of $16.9 million or 1.7%, primarily due to the net effect of (i) increased staffing levels, primarily in the European Division’s central operations, Germany and
U.K./Ireland
,
(ii) lower incentive compensation costs, as decreases in
U.K./Ireland
and the Netherlands were only partially offset by an increase in Belgium,
(iii) annual wage increases, largely in
U.K./Ireland
, (iv) lower costs related to certain employee benefits in the Netherlands,
(v) decreased costs in
U.K./Ireland
due to higher capitalized labor costs associated with the
Network Extensions
, (vi) a $3.2 million increase in the European Division’s central operations due to the impact of an accrual release recorded in the fourth quarter of 2014 associated with the settlement of an operational contingency and
(vii) higher temporary personnel costs in the Netherlands of $2.0 million related to integration activities in connection with the
Ziggo Acquisition
;
|
|
•
|
A decrease of $10.4 million due to an accrual release recorded during the second quarter of 2015 related to the resolution of a contingency associated with universal service obligations in Belgium;
|
|
•
|
A decrease in external sales and marketing costs of $9.2 million or 1.1%, primarily due to the net effect of (i) higher third-party sales commissions, as an increase in Germany was only partially offset by a decline in
U.K./Ireland
, (ii) lower costs associated with advertising campaigns, as decreases in the Netherlands, Germany and
U.K./Ireland
were only partially offset by an increase in Belgium, (iii) a decrease of $4.7 million in Germany due to the impact of accrual releases
|
II-44
in the third and fourth quarters of 2015 associated with the reassessment of an accrual and (iv) a $3.8 million increase in third-party costs in the Netherlands and the European Division’s central operations related to rebranding activities following the
Ziggo Acquisition
; and
|
•
|
A decrease in information technology-related expenses of $1.6 million or 1.5%, primarily due to lower software and information technology-related maintenance costs, as decreases in Germany and
U.K./Ireland
were only partially offset higher costs in the European Division’s central operations.
|
LiLAC Division
.
The
LiLAC Division
’s SG&A expenses (exclusive of share-based compensation expense) decreased
$12.0 million
or
5.7%
, during
2015
, as compared to
2014
. This decrease includes an increase of
$7.8 million
attributable to the impact of the
Choice Acquisition
. Excluding the effects of this acquisition and
FX
, the
LiLAC Division
’s SG&A expenses increased
$3.0 million
or
1.4%
. This increase includes the following factors:
|
•
|
An increase in external sales and marketing costs of $4.4 million or 7.4%, primarily due to higher third-party sales commissions in Chile;
|
|
•
|
A decrease of
$2.2 million, due to lower costs associated with the national gross receipts tax that was implemented in Puerto Rico in July 2014. In 2015, it was determined that the tax would not be continued beyond 2014;
|
|
•
|
An increase in facilities expenses of $2.0 million or 7.7%, primarily due to higher rental and utility costs in Chile;
|
|
•
|
A decrease in outsourced labor and professional fees of $1.8 million or 13.5%
,
primarily due to lower fees associated with legal proceedings in Puerto Rico;
|
|
•
|
An increase of $1.6 million due to the impact of favorable adjustments that were recorded in Chile during the fourth quarter of 2014 related to the reassessment of certain accrued liabilities;
|
|
•
|
A decrease in personnel costs of $1.3 million or 1.8%,
primarily due to the net effect of (i) a decrease in Chile due to lower incentive compensation and severance costs and (ii) annual wage increases; and
|
|
•
|
A net increase resulting from individually insignificant changes in other SG&A expense categories.
|
II-45
Adjusted OIBDA
of our Reportable Segments
Adjusted OIBDA
is the primary measure used by our chief operating decision maker to evaluate segment operating performance. For the definition of this performance measure and for a reconciliation of total segment
Adjusted OIBDA
to our earnings (loss) from continuing operations before income taxes, see note
18
to our consolidated financial statements.
Adjusted OIBDA
—
2016
compared to
2015
|
|
Year ended December 31,
|
Increase (decrease)
|
Organic
increase (decrease)
|
||||||||||||||||||
|
|
2016
|
2015
|
$
|
%
|
$
|
%
|
|||||||||||||||
|
|
in millions, except percentages
|
||||||||||||||||||||
|
Liberty Global Group:
|
|||||||||||||||||||||
|
European Division:
|
|||||||||||||||||||||
|
U.K./Ireland
|
$
|
2,930.9
|
|
$
|
3,162.1
|
|
$
|
(231.2
|
)
|
(7.3
|
)
|
$
|
138.5
|
|
4.4
|
|
|||||
|
Belgium (a)
|
1,173.4
|
|
990.3
|
|
183.1
|
|
18.5
|
|
49.3
|
|
4.4
|
|
|||||||||
|
The Netherlands
|
1,472.7
|
|
1,519.5
|
|
(46.8
|
)
|
(3.1
|
)
|
(42.1
|
)
|
(2.8
|
)
|
|||||||||
|
Germany
|
1,586.4
|
|
1,502.1
|
|
84.3
|
|
5.6
|
|
89.0
|
|
5.9
|
|
|||||||||
|
Switzerland/Austria
|
1,069.3
|
|
1,040.1
|
|
29.2
|
|
2.8
|
|
50.0
|
|
4.8
|
|
|||||||||
|
Total Western Europe
|
8,232.7
|
|
8,214.1
|
|
18.6
|
|
0.2
|
|
284.7
|
|
3.4
|
|
|||||||||
|
Central and Eastern Europe
|
471.5
|
|
474.0
|
|
(2.5
|
)
|
(0.5
|
)
|
6.7
|
|
1.4
|
|
|||||||||
|
Central and other
|
(327.2
|
)
|
(289.2
|
)
|
(38.0
|
)
|
(13.1
|
)
|
(38.3
|
)
|
(13.2
|
)
|
|||||||||
|
Total European Division
|
8,377.0
|
|
8,398.9
|
|
(21.9
|
)
|
(0.3
|
)
|
253.1
|
|
3.0
|
|
|||||||||
|
Corporate and other
|
(213.3
|
)
|
(222.6
|
)
|
9.3
|
|
4.2
|
|
3.1
|
|
1.4
|
|
|||||||||
|
Total Liberty Global Group
|
8,163.7
|
|
8,176.3
|
|
(12.6
|
)
|
(0.2
|
)
|
256.2
|
|
3.1
|
|
|||||||||
|
LiLAC Group:
|
|||||||||||||||||||||
|
LiLAC Division:
|
|||||||||||||||||||||
|
CWC (b)
|
541.9
|
|
—
|
|
541.9
|
|
N.M.
|
|
(9.9
|
)
|
(1.8
|
)
|
|||||||||
|
Chile
|
339.3
|
|
328.1
|
|
11.2
|
|
3.4
|
|
22.3
|
|
6.8
|
|
|||||||||
|
Puerto Rico (c)
|
211.8
|
|
167.2
|
|
44.6
|
|
26.7
|
|
29.3
|
|
16.1
|
|
|||||||||
|
Total LiLAC Division
|
1,093.0
|
|
495.3
|
|
597.7
|
|
120.7
|
|
41.7
|
|
3.9
|
|
|||||||||
|
Corporate
|
(8.9
|
)
|
(4.3
|
)
|
(4.6
|
)
|
N.M.
|
|
(4.6
|
)
|
N.M.
|
|
|||||||||
|
Total LiLAC Group
|
1,084.1
|
|
491.0
|
|
593.1
|
|
120.8
|
|
37.1
|
|
3.5
|
|
|||||||||
|
Total
|
$
|
9,247.8
|
|
$
|
8,667.3
|
|
$
|
580.5
|
|
6.7
|
|
$
|
293.3
|
|
3.1
|
|
|||||
______________
|
(a)
|
The amount presented for 2016 includes the post-acquisition
Adjusted OIBDA
of BASE, which was acquired on February 11, 2016.
|
|
(b)
|
The amount presented for 2016 reflects the post-acquisition
Adjusted OIBDA
of CWC, which was acquired on May 16, 2016.
|
|
(c)
|
The amount presented for 2015 excludes the pre-acquisition
Adjusted OIBDA
of
Choice
, which was acquired on June 3, 2015.
|
N.M. — Not Meaningful.
II-46
Adjusted OIBDA
—
2015
compared to
2014
|
|
Year ended December 31,
|
Increase (decrease)
|
Organic
increase (decrease)
|
||||||||||||||||||
|
|
2015
|
2014
|
$
|
%
|
$
|
%
|
|||||||||||||||
|
|
in millions, except percentages
|
||||||||||||||||||||
|
Liberty Global Group:
|
|||||||||||||||||||||
|
European Division:
|
|||||||||||||||||||||
|
U.K./Ireland
|
$
|
3,162.1
|
|
$
|
3,235.7
|
|
$
|
(73.6
|
)
|
(2.3
|
)
|
$
|
200.0
|
|
6.2
|
|
|||||
|
Belgium
|
990.3
|
|
1,125.0
|
|
(134.7
|
)
|
(12.0
|
)
|
62.6
|
|
5.6
|
|
|||||||||
|
The Netherlands (a)
|
1,519.5
|
|
857.9
|
|
661.6
|
|
77.1
|
|
(17.2
|
)
|
(0.9
|
)
|
|||||||||
|
Germany
|
1,502.1
|
|
1,678.2
|
|
(176.1
|
)
|
(10.5
|
)
|
119.5
|
|
7.1
|
|
|||||||||
|
Switzerland/Austria
|
1,040.1
|
|
1,056.4
|
|
(16.3
|
)
|
(1.5
|
)
|
63.3
|
|
6.0
|
|
|||||||||
|
Total Western Europe
|
8,214.1
|
|
7,953.2
|
|
260.9
|
|
3.3
|
|
428.2
|
|
4.8
|
|
|||||||||
|
Central and Eastern Europe
|
474.0
|
|
583.0
|
|
(109.0
|
)
|
(18.7
|
)
|
(15.6
|
)
|
(2.7
|
)
|
|||||||||
|
Central and other
|
(289.2
|
)
|
(282.7
|
)
|
(6.5
|
)
|
(2.3
|
)
|
(63.7
|
)
|
(22.5
|
)
|
|||||||||
|
Total European Division
|
8,398.9
|
|
8,253.5
|
|
145.4
|
|
1.8
|
|
348.9
|
|
3.8
|
|
|||||||||
|
Corporate and other
|
(222.6
|
)
|
(212.0
|
)
|
(10.6
|
)
|
(5.0
|
)
|
(25.4
|
)
|
(12.0
|
)
|
|||||||||
|
Intersegment eliminations
|
—
|
|
4.0
|
|
(4.0
|
)
|
N.M.
|
|
0.1
|
|
N.M.
|
|
|||||||||
|
Total Liberty Global Group
|
8,176.3
|
|
8,045.5
|
|
130.8
|
|
1.6
|
|
323.6
|
|
3.6
|
|
|||||||||
|
LiLAC Group:
|
|||||||||||||||||||||
|
LiLAC Division:
|
|||||||||||||||||||||
|
Chile
|
328.1
|
|
351.0
|
|
(22.9
|
)
|
(6.5
|
)
|
24.4
|
|
7.0
|
|
|||||||||
|
Puerto Rico (b)
|
167.2
|
|
128.9
|
|
38.3
|
|
29.7
|
|
16.8
|
|
11.2
|
|
|||||||||
|
Total LiLAC Division
|
495.3
|
|
479.9
|
|
15.4
|
|
3.2
|
|
41.2
|
|
8.2
|
|
|||||||||
|
Corporate
|
(4.3
|
)
|
(3.1
|
)
|
(1.2
|
)
|
(38.7
|
)
|
(1.2
|
)
|
(38.7
|
)
|
|||||||||
|
Total LiLAC Group
|
491.0
|
|
476.8
|
|
14.2
|
|
3.0
|
|
40.0
|
|
8.0
|
|
|||||||||
|
Total
|
$
|
8,667.3
|
|
$
|
8,522.3
|
|
$
|
145.0
|
|
1.7
|
|
$
|
363.6
|
|
3.8
|
|
|||||
_______________
|
(a)
|
The amount presented for 2014 excludes the pre-acquisition
Adjusted OIBDA
of
Ziggo
, which was acquired on November 11, 2014.
|
|
(b)
|
The amount presented for 2015 includes the post-acquisition
Adjusted OIBDA
of
Choice
, which was acquired on June 3, 2015.
|
N.M. — Not Meaningful.
II-47
Adjusted OIBDA
Margin —
2016
,
2015
and
2014
The following table sets forth the
Adjusted OIBDA
margins (
Adjusted OIBDA
divided by revenue) of each of our reportable segments:
|
|
Year ended December 31,
|
||||
|
|
2016
|
2015
|
2014
|
||
|
|
%
|
||||
|
Liberty Global Group:
|
|||||
|
European Division:
|
|||||
|
U.K./Ireland
|
45.0
|
44.8
|
43.7
|
||
|
Belgium
|
43.6
|
49.0
|
49.4
|
||
|
The Netherlands
|
54.7
|
55.3
|
57.3
|
||
|
Germany
|
62.5
|
62.6
|
61.9
|
||
|
Switzerland/Austria
|
60.9
|
59.2
|
57.2
|
||
|
Total Western Europe
|
50.9
|
51.4
|
50.5
|
||
|
Central and Eastern Europe
|
43.3
|
44.4
|
46.3
|
||
|
Total European Division
|
48.5
|
49.3
|
48.6
|
||
|
LiLAC Group:
|
|||||
|
LiLAC Division:
|
|||||
|
CWC
|
37.5
|
N.M.
|
N.M.
|
||
|
Chile
|
39.5
|
39.1
|
39.1
|
||
|
Puerto Rico
|
50.3
|
44.1
|
42.1
|
||
|
Total LiLAC Division
|
40.1
|
40.7
|
39.8
|
||
_______________
N.M. — Not Meaningful.
In addition to organic changes in the revenue, programming and other direct costs of services, other operating expenses and SG&A expenses of our reportable segments, the
Adjusted OIBDA
margins presented above include the impact of acquisitions, the most significant of which are the
CWC Acquisition
, the
BASE Acquisition
, the
Choice Acquisition
and the
Ziggo Acquisition
. In this regard, the
Adjusted OIBDA
margin of Belgium during 2016 was adversely impacted by the inclusion of
BASE
, while the 2016 Adjusted OIBDA margin of Puerto Rico was positively impacted by the realized synergies with respect to the
Choice Acquisition
. During 2015, as compared to 2014, the
Adjusted OIBDA
margins of the Netherlands and Puerto Rico were adversely impacted by the inclusion of
Ziggo
and
Choice
, respectively, each of which generated relatively lower
Adjusted OIBDA
margins than the respective legacy operations. For discussion of the factors contributing to other changes in the
Adjusted OIBDA
margins of our reportable segments, see the above analyses of the revenue and expenses of our reportable segments.
II-48
Discussion and Analysis of our Consolidated Operating Results
General
For more detailed explanations of the changes in our revenue and operating (including direct costs of services and other operating costs) and SG&A expenses, see
Discussion and Analysis of our Reportable Segments
above.
2016
compared to
2015
Revenue
Our revenue by major category is set forth below:
|
|
Year ended December 31,
|
Increase (decrease)
|
Organic
increase (decrease)
|
||||||||||||||||||
|
|
2016
|
2015
|
$
|
%
|
$
|
%
|
|||||||||||||||
|
|
in millions, except percentages
|
||||||||||||||||||||
|
Subscription revenue (a):
|
|||||||||||||||||||||
|
Video
|
$
|
6,378.0
|
|
$
|
6,380.1
|
|
$
|
(2.1
|
)
|
—
|
|
$
|
103.7
|
|
1.6
|
|
|||||
|
Broadband internet
|
5,309.4
|
|
5,073.4
|
|
236.0
|
|
4.7
|
|
345.9
|
|
6.6
|
|
|||||||||
|
Fixed-line telephony
|
3,018.6
|
|
3,160.9
|
|
(142.3
|
)
|
(4.5
|
)
|
(53.4
|
)
|
(1.6
|
)
|
|||||||||
|
Cable subscription revenue
|
14,706.0
|
|
14,614.4
|
|
91.6
|
|
0.6
|
|
396.2
|
|
2.7
|
|
|||||||||
|
Mobile (b)
|
1,706.4
|
|
1,037.3
|
|
669.1
|
|
64.5
|
|
(20.9
|
)
|
(1.2
|
)
|
|||||||||
|
Total subscription revenue
|
16,412.4
|
|
15,651.7
|
|
760.7
|
|
4.9
|
|
375.3
|
|
2.2
|
|
|||||||||
|
B2B revenue (c)
|
2,156.3
|
|
1,580.2
|
|
576.1
|
|
36.5
|
|
39.8
|
|
1.8
|
|
|||||||||
|
Other revenue (b) (d)
|
1,440.1
|
|
1,048.1
|
|
392.0
|
|
37.4
|
|
112.5
|
|
8.2
|
|
|||||||||
|
Total
|
$
|
20,008.8
|
|
$
|
18,280.0
|
|
$
|
1,728.8
|
|
9.5
|
|
$
|
527.6
|
|
2.6
|
|
|||||
_______________
|
(a)
|
Subscription revenue includes amounts received from subscribers for ongoing services, excluding installation fees and late fees. Subscription revenue from subscribers who purchase bundled services at a discounted rate is generally allocated proportionally to each service based on the standalone price for each individual service. As a result, changes in the standalone pricing of our cable and mobile products or the composition of bundles can contribute to changes in our product revenue categories from period to period.
|
|
(b)
|
Mobile subscription revenue excludes mobile interconnect revenue of
$313.4 million
and
$212.7 million
during
2016
and
2015
, respectively. Mobile interconnect revenue and revenue from mobile handset sales are included in other revenue.
|
|
(c)
|
B2B
revenue includes revenue from business broadband internet, video, voice, mobile and data services offered to medium to large enterprises and, on a wholesale basis, to other operators. We also provide services to certain
SOHO
subscribers.
SOHO
subscribers pay a premium price to receive expanded service levels along with video, broadband internet, fixed-line telephony or mobile services that are the same or similar to the mass marketed products offered to our residential subscribers. Revenue from
SOHO
subscribers, which is included in subscription revenue, aggregated
$491.8 million
and
$319.2 million
during
2016
and
2015
, respectively. On an organic basis, our total
B2B
revenue, including revenue from
SOHO
subscribers, increased 5.4% during
2016
, as compared to
2015
. A portion of the increase in our
SOHO
revenue is attributable to the conversion of our residential subscribers to
SOHO
subscribers.
|
|
(d)
|
Other revenue includes, among other items,
interconnect fees, mobile handset sales, channel carriage fees and installation fees
.
|
Total revenue.
Our consolidated revenue increased
$1,728.8 million
during
2016
, as compared to
2015
. This increase includes (i) an increase of $2,117.4 million attributable to the impact of acquisitions and (ii) a decrease of $29.5 million attributable to the impact of dispositions. Excluding the effects of acquisitions, dispositions and
FX
, our consolidated revenue increased
$527.6 million
or
2.6%
.
II-49
Subscription revenue.
The details of the change in our consolidated subscription revenue for
2016
, as compared to
2015
, are as follows (in millions):
|
Increase in cable subscription revenue due to change in:
|
|||
|
Average number of RGUs
|
$
|
266.9
|
|
|
ARPU
|
129.3
|
|
|
|
Total increase in cable subscription revenue
|
396.2
|
|
|
|
Decrease in mobile subscription revenue
|
(20.9
|
)
|
|
|
Total organic increase in subscription revenue
|
375.3
|
|
|
|
Impact of acquisitions
|
1,109.3
|
|
|
|
Impact of a disposal
|
(11.8
|
)
|
|
|
Impact of FX
|
(712.1
|
)
|
|
|
Total
|
$
|
760.7
|
|
Excluding the effects of acquisitions, dispositions and
FX
, our consolidated cable subscription revenue increased
$396.2 million
or
2.7%
during
2016
, as compared to
2015
. This increase is due to the net effect of (i) an increase from broadband internet services of
$345.9 million
or
6.6%
, attributable to an increase in the average number of broadband internet
RGU
s and higher
ARPU
from broadband internet services, (ii) an increase from video services of
$103.7 million
or
1.6%
, attributable to the net effect of (a) higher
ARPU
from video services and (b) a decline in the average number of video
RGU
s, and (iii) a decrease from fixed-line telephony services of
$53.4 million
or
1.6%
, attributable to the net effect of (1) lower
ARPU
from fixed-line telephony services and (2) an increase in the average number of fixed-line telephony
RGU
s.
Excluding the effects of acquisitions and
FX
, our consolidated mobile subscription revenue decreased
$20.9 million
or
1.2%
during
2016
, as compared to
2015
. This decrease is largely due to the net effect of (i) a decline in the
U.K.
, largely associated with the
U.K.
Split-contract Program
, and (ii) increases in Belgium, Switzerland and Chile.
B2B
revenue.
Excluding the effects of acquisitions and
FX
, our consolidated
B2B
revenue increased
$39.8 million
or
1.8%
during
2016
, as compared to
2015
. This increase is largely due to increases in the
U.K.
and Belgium.
Other revenue.
Excluding the effects of acquisitions, dispositions and
FX
, our consolidated other revenue increased
$112.5 million
or
8.2%
during
2016
, as compared to
2015
. This increase is primarily attributable to an increase in mobile handset sales, mainly associated with
Split-contract Program
s, primarily in the
U.K.
For additional information concerning the changes in our subscription,
B2B
and other revenue, see
Discussion and Analysis of our Reportable Segments — Revenue —
2016
compared to
2015
above. For information regarding the competitive environment in certain of our markets, see
Overview
above.
II-50
Supplemental revenue information
Our revenue by major category for the
Liberty Global Group
is set forth below:
|
|
Year ended December 31,
|
Increase (decrease)
|
Organic
increase (decrease)
|
||||||||||||||||||
|
|
2016
|
2015
|
$
|
%
|
$
|
%
|
|||||||||||||||
|
|
in millions, except percentages
|
||||||||||||||||||||
|
Liberty Global Group:
|
|||||||||||||||||||||
|
Subscription revenue:
|
|||||||||||||||||||||
|
Video
|
$
|
5,730.4
|
|
$
|
5,853.8
|
|
$
|
(123.4
|
)
|
(2.1
|
)
|
$
|
88.1
|
|
1.5
|
|
|||||
|
Broadband internet
|
4,731.2
|
|
4,669.9
|
|
61.3
|
|
1.3
|
|
303.6
|
|
6.5
|
|
|||||||||
|
Fixed-line telephony
|
2,790.4
|
|
2,996.0
|
|
(205.6
|
)
|
(6.9
|
)
|
(39.8
|
)
|
(1.3
|
)
|
|||||||||
|
Cable subscription revenue
|
13,252.0
|
|
13,519.7
|
|
(267.7
|
)
|
(2.0
|
)
|
351.9
|
|
2.6
|
|
|||||||||
|
Mobile (a)
|
1,249.3
|
|
1,001.7
|
|
247.6
|
|
24.7
|
|
(27.5
|
)
|
(2.0
|
)
|
|||||||||
|
Total subscription revenue
|
14,501.3
|
|
14,521.4
|
|
(20.1
|
)
|
(0.1
|
)
|
324.4
|
|
2.2
|
|
|||||||||
|
B2B revenue (b)
|
1,538.8
|
|
1,564.6
|
|
(25.8
|
)
|
(1.6
|
)
|
34.3
|
|
2.1
|
|
|||||||||
|
Other revenue
|
1,244.9
|
|
976.7
|
|
268.2
|
|
27.5
|
|
115.6
|
|
9.8
|
|
|||||||||
|
Total Liberty Global Group
|
$
|
17,285.0
|
|
$
|
17,062.7
|
|
$
|
222.3
|
|
1.3
|
|
$
|
474.3
|
|
2.7
|
|
|||||
|
(a)
|
Mobile subscription revenue excludes mobile interconnect revenue of
$281.9 million
and
$209.2 million
during
2016
and
2015
, respectively. Mobile interconnect revenue and revenue from mobile handset sales are included in other revenue.
|
|
(b)
|
Revenue from
SOHO
subscribers, which is included in subscription revenue, aggregated
$466.0 million
and
$298.6 million
during
2016
and
2015
, respectively. On an organic basis, the
Liberty Global Group
’s total
B2B
revenue, including revenue from
SOHO
subscribers, increased 6.7% during
2016
, as compared to
2015
.
|
Our revenue by major category for the
LiLAC Group
is set forth below:
|
|
Year ended December 31,
|
Increase
|
Organic
increase (decrease)
|
|||||||||||||||||
|
|
2016
|
2015
|
$
|
%
|
$
|
%
|
||||||||||||||
|
|
in millions, except percentages
|
|||||||||||||||||||
|
LiLAC Group:
|
||||||||||||||||||||
|
Subscription revenue:
|
||||||||||||||||||||
|
Video
|
$
|
647.6
|
|
$
|
526.3
|
|
$
|
121.3
|
|
23.0
|
$
|
15.6
|
|
2.4
|
|
|||||
|
Broadband internet
|
578.2
|
|
403.5
|
|
174.7
|
|
43.3
|
42.3
|
|
7.7
|
|
|||||||||
|
Fixed-line telephony
|
228.2
|
|
164.9
|
|
63.3
|
|
38.4
|
(13.6
|
)
|
(5.5
|
)
|
|||||||||
|
Cable subscription revenue
|
1,454.0
|
|
1,094.7
|
|
359.3
|
|
32.8
|
44.3
|
|
3.1
|
|
|||||||||
|
Mobile (a)
|
457.1
|
|
35.6
|
|
421.5
|
|
1,184.0
|
6.6
|
|
1.5
|
|
|||||||||
|
Total subscription revenue
|
1,911.1
|
|
1,130.3
|
|
780.8
|
|
69.1
|
50.9
|
|
2.7
|
|
|||||||||
|
B2B revenue (b)
|
617.5
|
|
15.6
|
|
601.9
|
|
3,858.3
|
5.5
|
|
0.9
|
|
|||||||||
|
Other revenue
|
195.2
|
|
71.4
|
|
123.8
|
|
173.4
|
(3.1
|
)
|
(1.5
|
)
|
|||||||||
|
Total LiLAC Group
|
$
|
2,723.8
|
|
$
|
1,217.3
|
|
$
|
1,506.5
|
|
123.8
|
$
|
53.3
|
|
2.0
|
|
|||||
|
(a)
|
Mobile subscription revenue excludes mobile interconnect revenue of
$31.5 million
and
$3.5 million
during
2016
and
2015
, respectively. Mobile interconnect revenue and revenue from mobile handset sales are included in other revenue.
|
|
(b)
|
Revenue from
SOHO
subscribers, which is included in subscription revenue, aggregated
$25.8 million
and
$20.6 million
during
2016
and
2015
, respectively. On an organic basis, the
LiLAC Group
’s total
B2B
revenue, including revenue from
SOHO
subscribers, increased 1.3%
during
2016
, as compared to
2015
.
|
II-51
Programming and other direct costs of services
Our programming and other direct costs of services increased
$502.2 million
during
2016
, as compared to
2015
. This increase includes (i) an increase of
$579.0 million
attributable to the impact of the
CWC Acquisition
, the
BASE Acquisition
, the
Choice Acquisition
and other less significant acquisitions and (ii) a
decrease of
$21.6 million
attributable to the
U.K. Non-Cable Disposal
and other less significant dispositions.
Excluding the effects of acquisitions, dispositions and
FX
, our programming and other direct costs of services increased
$203.5 million
or
4.4%
during
2016
, as compared to
2015
. This increase is primarily attributable to the net effect of (a) an increase in programming and copyright costs, (b) a decrease in mobile access and interconnect costs and (c) an increase in mobile handset costs.
For additional information regarding the changes in our programming and other direct costs of services, see
Discussion and Analysis of our Reportable Segments — Programming and Other Direct Costs of Services of our Reportable Segments
above.
Other operating expenses
Our other operating expenses increased
$229.6 million
during
2016
, as compared to
2015
. This increase includes (i) an increase of
$365.6 million
attributable to the impact of the
CWC Acquisition
, the
BASE Acquisition
, the
Choice Acquisition
and other less significant acquisitions and (ii) a
decrease of
$2.2 million
attributable to the
U.K. Non-Cable Disposal
and other less significant dispositions.
Our other operating expenses include share-based compensation expense, which increased
$1.3 million
during
2016
. For additional information, see the discussion under
Share-based compensation expense
below. Excluding the effects of acquisitions, dispositions,
FX
and share-based compensation expense, our other operating expenses decreased
$25.7 million
or
0.9%
during
2016
, as compared to
2015
. This decrease is primarily attributable to the net effect of (a) a decrease in personnel costs, (b) an increase in network-related expenses, (c) an increase in outsourced labor and professional fees, (d) an increase in information technology-related costs and (e) a decrease in bad debt and collection expenses.
Certain of these changes include an aggregate decrease in integration-related costs in the Netherlands of $15.2 million. For additional information regarding the changes in our operating expenses, see
Discussion and Analysis of our Reportable Segments — Other Operating Expenses of our Reportable Segments
above.
SG&A expenses
Our SG&A expenses increased
$395.2 million
during
2016
, as compared to
2015
. This increase
includes
$474.0 million
attributable to the impact of the
CWC Acquisition
, the
BASE Acquisition
, the
Choice Acquisition
and other less significant acquisitions. Our SG&A expenses include share-based compensation expense, which decreased
$22.6 million
during
2016
. For additional information, see the discussion under
Share-based compensation expense
below. Excluding the effects of acquisitions,
FX
and share-based compensation expense, our SG&A expenses increased
$57.4 million
or
1.7%
during
2016
, as compared to
2015
. This increase is primarily due to the net effect of (i) an increase in personnel costs, (ii) a decrease in external sales and marketing costs, (iii) an increase in outsourced labor and professional fees,
(iv) an increase in outsourced call center costs and (v) an increase in facilities expenses.
Certain of these changes include (a) an aggregate decrease in integration-related costs in the Netherlands of $10.9 million, (b) an aggregate decrease in integration-related costs in Belgium of $3.7 million and (c) an aggregate increase in integration-related costs related to CWC of $13.3 million, including $9.9 million incurred by CWC in connection with the integration of Columbus with CWC’s operations and CWC’s operations with Liberty Global and the LiLAC Division. For additional information regarding the changes in our SG&A expenses, see
Discussion and Analysis of our Reportable Segments — SG&A Expenses of our Reportable Segments
above
.
II-52
Share-based compensation expense (included in other operating and SG&A expenses)
Our share-based compensation expense primarily relates to the share-based incentive awards issued by
Liberty Global
to its employees and employees of its subsidiaries. A summary of the aggregate share-based compensation expense that is included in our
other operating
and SG&A expenses is set forth below:
|
|
Year ended December 31,
|
||||||
|
|
2016
|
2015
|
|||||
|
|
in millions
|
||||||
|
Liberty Global shares:
|
|||||||
|
Performance-based incentive awards (a)
|
$
|
162.7
|
|
$
|
157.1
|
|
|
|
Other share-based incentive awards
|
114.9
|
|
149.6
|
|
|||
|
Total Liberty Global shares (b)
|
277.6
|
|
306.7
|
|
|||
|
Telenet share-based incentive awards (c)
|
12.2
|
|
9.2
|
|
|||
|
Other
|
7.1
|
|
2.3
|
|
|||
|
Total
|
$
|
296.9
|
|
$
|
318.2
|
|
|
|
Included in:
|
|||||||
|
Other operating expense:
|
|||||||
|
Liberty Global Group
|
$
|
3.3
|
|
$
|
3.1
|
|
|
|
LiLAC Group
|
1.4
|
|
0.3
|
|
|||
|
Total other operating expense
|
4.7
|
|
3.4
|
|
|||
|
SG&A expense:
|
|||||||
|
Liberty Global Group
|
278.2
|
|
312.7
|
|
|||
|
LiLAC Group
|
14.0
|
|
2.1
|
|
|||
|
Total SG&A expense
|
292.2
|
|
314.8
|
|
|||
|
Total
|
$
|
296.9
|
|
$
|
318.2
|
|
|
_______________
|
(a)
|
Includes share-based compensation expense related to (i)
Liberty Global
PSU
s, (ii) the
Challenge Performance Awards
and (iii) the
PGUs
.
|
|
(b)
|
In connection with the
LiLAC Transaction
, our compensation committee approved the
2015 Award Modifications
(as defined and described in note
13
to our consolidated financial statements) in accordance with the underlying share-based incentive plans. As a result of the
2015 Award Modifications
, we recognized
$16.1 million
and
$69.3 million
of incremental expense during 2016 and 2015, respectively.
|
|
(c)
|
Represents the share-based compensation expense associated with
Telenet
’s share-based incentive awards, which, at
December 31, 2016
, included (i) warrants and employee stock options (
2,473,404
awards outstanding at a weighted average exercise price of
€43.70
(
$46.09
)), (ii) performance-based specific stock option plans for the Chief Executive Officer (
745,000
awards outstanding at a weighted average exercise price of
€40.60
(
$42.82
)), (iii) performance-based share awards (
173,640
awards outstanding) and (iv) performance-based specific stock option plans for employees (
18,750
awards outstanding at a weighted average exercise price of
€48.83
(
$51.50
)).
|
For additional information concerning our share-based compensation, see note
13
to our consolidated financial statements.
II-53
Depreciation and amortization expense
The details of our depreciation and amortization expense are as follows:
|
|
Year ended December 31,
|
Increase (decrease)
|
||||||||||||
|
|
2016
|
2015
|
$
|
%
|
||||||||||
|
|
in millions
|
|
||||||||||||
|
Liberty Global Group
|
$
|
5,213.8
|
|
$
|
5,609.4
|
|
$
|
(395.6
|
)
|
(7.1
|
)
|
|||
|
LiLAC Group
|
587.3
|
|
216.4
|
|
370.9
|
|
171.4
|
|
||||||
|
Total
|
$
|
5,801.1
|
|
$
|
5,825.8
|
|
$
|
(24.7
|
)
|
(0.4
|
)
|
|||
Excluding the effects of
FX
, depreciation and amortization expense increased
$277.3 million or 4.8% during
2016
, as compared to
2015
. This increase is primarily due to the net effect of (i)
an increase associated with property and equipment additions related to the installation of customer premises equipment, the expansion and upgrade of our networks and other capital initiatives, (ii) a decrease associated with certain assets becoming fully depreciated, primarily in
U.K./Ireland
, the Netherlands and, to a lesser extent, Chile, Switzerland/Austria, Belgium and Germany,
(iii) an increase associated with acquisitions,
primarily as a result of the
CWC Acquisition
and
BASE Acquisition
, and (iv) a decrease in the Netherlands as a result of the held-for-sale presentation of
Ziggo Group Holding
and
Ziggo Sport
from August 3, 2016 through the December 31, 2016 completion of the
Dutch JV Transaction
.
Impairment, restructuring and other operating items, net
The details of our impairment, restructuring and other operating items, net, are as follows:
|
|
Year ended December 31,
|
||||||
|
|
2016
|
2015
|
|||||
|
|
in millions
|
||||||
|
Liberty Global Group
|
$
|
194.7
|
|
$
|
154.3
|
|
|
|
LiLAC Group
|
153.8
|
|
19.8
|
|
|||
|
Total
|
$
|
348.5
|
|
$
|
174.1
|
|
|
The total for
2016
includes (i) direct acquisition costs of
$164.0 million
, primarily related to the CWC Acquisition and, to a lesser extent, the
Dutch JV Transaction
and the BASE Acquisition, and (ii) restructuring charges of
$189.1 million
, including (a)
$144.4 million
of employee severance and termination costs related to certain reorganization activities, primarily in Germany, U.K./Ireland, the
European Division
’s central operations, Chile and the Netherlands, and (b)
$41.3 million
of contract termination and other costs related to (1) contract termination charges, primarily in the
European Division
’s central operations, the corporate and other category and Chile, and (2) the write-off of a prepaid indefeasible right of use for telecommunications capacity by
Liberty Puerto Rico
due to the abandonment of this capacity in favor of capacity on
CWC
’s network. The direct acquisition costs incurred during 2016 include transfer and stamp taxes as well as investment banking and other advisory fees.
Based on the results of our October 1, 2016 goodwill impairment test, a hypothetical decline of 20% or more in the fair value of any of CWC’s reporting units could result in the need to record a goodwill impairment charge. At December 31, 2016, the aggregate goodwill associated with the CWC reporting units was
$5.5 billion
. If, among other factors, (i) the equity values of the
LiLAC Group
were to remain depressed or decline further or (ii) the adverse impacts of economic, competitive, regulatory or other factors were to cause our results of operations or cash flows to be worse than anticipated, we could conclude in future periods that impairment charges are required in order to reduce the carrying values of our goodwill and, to a lesser extent, other long-lived assets. Any such impairment charges could be significant.
The total for
2015
includes (i) restructuring charges of
$103.8 million
, including (a)
$102.3 million
of employee severance and termination costs related to certain reorganization activities, primarily in the Netherlands, U.K./Ireland, Germany, Switzerland/Austria and Puerto Rico, (b) contract termination charges of
$19.3 million
, primarily in Belgium, Chile and Puerto Rico, and (c) a credit of
$17.0 million
recorded by Telenet during the fourth quarter following the settlement of its
DTT
capacity contract obligations, the fair value of which were originally recorded during 2014 when Telenet discontinued the provision of
DTT
services, (ii) direct acquisition costs of
$49.8 million
, primarily related to our acquisition of
CWC
,
Telenet
’s acquisition of
BASE
, our acquisition of additional shares of
ITV
, the
Choice Acquisition
and the
Ziggo Acquisition
, (iii) impairment charges of $24.8 million,
II-54
primarily in U.K./Ireland, the Netherlands and Switzerland/Austria, and (iv) a
$23.1 million
loss on the divestiture of our Film1 channels.
For information regarding our acquisitions, see note
4
to our consolidated financial statements. For information regarding the
Dutch JV Transaction
, see note
5
to our consolidated financial statements.
For additional information regarding our restructuring charges, see note
14
to our consolidated financial statements. For additional information regarding our impairments, see
Critical Accounting Policies, Judgments and Estimates — Impairment of Property and Equipment and Intangible Assets
below.
Interest expense
The details of our interest expense are as follows:
|
|
Year ended December 31,
|
Increase
|
|||||||||||
|
|
2016
|
2015
|
$
|
%
|
|||||||||
|
|
in millions
|
|
|||||||||||
|
Liberty Global Group
|
$
|
2,324.4
|
|
$
|
2,284.1
|
|
$
|
40.3
|
|
1.8
|
|||
|
LiLAC Group
|
314.4
|
|
157.9
|
|
156.5
|
|
99.1
|
||||||
|
Inter-group eliminations
|
(0.4
|
)
|
(0.6
|
)
|
0.2
|
|
N.M.
|
||||||
|
Total
|
$
|
2,638.4
|
|
$
|
2,441.4
|
|
$
|
197.0
|
|
8.1
|
|||
_______________
N.M. — Not Meaningful.
Excluding the effects of
FX
, interest expense increased $145.6 million or 6.0% during
2016
, as compared to
2015
. This increase is primarily attributable to the net effect of (i) higher average outstanding debt balances, largely due to debt incurred in connection with the
CWC Acquisition
, the
BASE Acquisition
and debt issued by
Ziggo Group Holding
in advance of the closing of the
Dutch JV Transaction
and (ii)
lower weighted average interest rates related to the completion of certain financing transactions that resulted in extended maturities and decreases to certain of our interest rates. For additional information regarding our outstanding indebtedness, see note
10
to our consolidated financial statements.
It is possible that the interest rates on (i) any new borrowings could be higher than the current interest rates on our existing indebtedness and (ii) our variable-rate indebtedness could increase in future periods. As further discussed in note
7
to our consolidated financial statements and under
Qualitative and Quantitative Disclosures about Market Risk
below, we use derivative instruments to manage our interest rate risks.
II-55
Realized and unrealized gains on derivative instruments, net
Our realized and unrealized gains or losses on derivative instruments include (i) unrealized changes in the fair values of our derivative instruments that are non-cash in nature until such time as the derivative contracts are fully or partially settled and (ii) realized gains or losses upon the full or partial settlement of the derivative contracts. The details of our realized and unrealized gains on derivative instruments, net, are as follows:
|
|
Year ended December 31,
|
||||||
|
|
2016
|
2015
|
|||||
|
|
in millions
|
||||||
|
Cross-currency and interest rate derivative contracts:
|
|||||||
|
Liberty Global Group
|
$
|
716.2
|
|
$
|
855.7
|
|
|
|
LiLAC Group
|
(216.8
|
)
|
217.0
|
|
|||
|
Total cross-currency and interest rate derivative contracts (a)
|
499.4
|
|
1,072.7
|
|
|||
|
Equity-related derivative instruments - Liberty Global Group:
|
|||||||
|
ITV Collar
|
351.5
|
|
(222.6
|
)
|
|||
|
Sumitomo Collar
|
(25.6
|
)
|
(20.3
|
)
|
|||
|
Lionsgate Forward
|
10.1
|
|
14.5
|
|
|||
|
Other
|
1.6
|
|
0.7
|
|
|||
|
Total equity-related derivative instruments (b)
|
337.6
|
|
(227.7
|
)
|
|||
|
Foreign currency forward and option contracts:
|
|||||||
|
Liberty Global Group
|
18.1
|
|
(9.0
|
)
|
|||
|
LiLAC Group
|
(9.1
|
)
|
10.3
|
|
|||
|
Total foreign currency forward contracts
|
9.0
|
|
1.3
|
|
|||
|
Other - Liberty Global Group
|
(0.9
|
)
|
0.9
|
|
|||
|
Total Liberty Global Group
|
1,071.0
|
|
619.9
|
|
|||
|
Total LiLAC Group
|
(225.9
|
)
|
227.3
|
|
|||
|
Total
|
$
|
845.1
|
|
$
|
847.2
|
|
|
_______________
|
(a)
|
The gain during
2016
is primarily attributable to the net effect of (i) gains associated with decreases in the values of the British pound sterling and euro relative to the U.S. dollar, (ii) losses associated with decreases in market interest rates in the British pound sterling, euro and Chilean peso markets, (iii) losses associated with increases in market interest rates in the U.S. dollar market, (iv) losses associated with an increase in the value of the Chilean peso relative to the U.S. dollar, and (v) gains associated with increases in market interest rates in the Swiss franc and Polish zloty markets. In addition, the gain during 2016 includes a net loss of
$16.4 million
resulting from changes in our credit risk valuation adjustments. The gain during 2015 is primarily attributable to the net effect of (a) gains associated with decreases in the values of the euro, British pound sterling and Chilean peso relative to the U.S. dollar, (b) losses associated with an increase in the value of the Swiss franc relative to the euro and (c) gains associated with increases in market interest rates in the Chilean peso market. In addition, the gain during 2015 includes a net loss of
$9.3 million
resulting from changes in our credit risk valuation adjustments.
|
|
(b)
|
For information concerning the factors that impact the valuations of our equity-related derivative instruments, see note
8
to our consolidated financial statements.
|
For additional information concerning our derivative instruments, see notes
7
and
8
to our consolidated financial statements and
Quantitative and Qualitative Disclosures about Market Risk
below.
II-56
Foreign currency transaction losses, net
Our foreign currency transaction gains or losses primarily result from the remeasurement of monetary assets and liabilities that are denominated in currencies other than the underlying functional currency of the applicable entity. Unrealized foreign currency transaction gains or losses are computed based on period-end exchange rates and are non-cash in nature until such time as the amounts are settled. The details of our foreign currency transaction losses, net, are as follows:
|
|
Year ended December 31,
|
||||||
|
|
2016
|
2015
|
|||||
|
|
in millions
|
||||||
|
Liberty Global Group:
|
|||||||
|
U.S. dollar denominated debt issued by British pound sterling functional currency entities
|
$
|
(954.4
|
)
|
$
|
(210.0
|
)
|
|
|
Intercompany payables and receivables denominated in a currency other than the entity’s functional currency (a)
|
731.6
|
|
(98.4
|
)
|
|||
|
U.S. dollar denominated debt issued by euro functional currency entities
|
(481.6
|
)
|
(715.7
|
)
|
|||
|
British pound sterling denominated debt issued by a U.S. dollar functional currency entity
|
251.2
|
|
89.6
|
|
|||
|
Cash and restricted cash denominated in a currency other than the entity’s functional currency
|
203.5
|
|
22.9
|
|
|||
|
Euro denominated debt issued by British pound sterling functional currency entities
|
(75.7
|
)
|
8.1
|
|
|||
|
Yen denominated debt issued by a U.S. dollar functional currency entity
|
(40.3
|
)
|
2.0
|
|
|||
|
Other
|
(34.4
|
)
|
(24.3
|
)
|
|||
|
Total Liberty Global Group
|
(400.1
|
)
|
(925.8
|
)
|
|||
|
LiLAC Group:
|
|||||||
|
U.S. dollar denominated debt issued by a Chilean peso functional currency entity
|
82.8
|
|
(215.8
|
)
|
|||
|
British pound sterling denominated debt issued by a U.S. dollar functional currency entity
|
32.1
|
|
—
|
|
|||
|
Other
|
(4.8
|
)
|
(7.6
|
)
|
|||
|
Total LiLAC Group
|
110.1
|
|
(223.4
|
)
|
|||
|
Total
|
$
|
(290.0
|
)
|
$
|
(1,149.2
|
)
|
|
_______________
|
(a)
|
Amounts primarily relate to (i) loans between certain of our non-operating and operating subsidiaries in Europe, which generally are denominated in the currency of the applicable operating subsidiary, and (ii) loans between certain of our non-operating subsidiaries in the U.S. and Europe.
|
For information regarding how we manage our exposure to foreign currency risk, see
Quantitative and Qualitative Disclosures about Market Risk — Foreign Currency Risk
below.
II-57
Realized and unrealized gains (losses) due to changes in fair values of certain investments and debt, net
Our realized and unrealized gains or losses due to changes in fair values of certain investments and debt include unrealized gains or losses associated with changes in fair values that are non-cash in nature until such time as these gains or losses are realized through cash transactions. For additional information regarding our investments, fair value measurements and debt, see notes
6
,
8
and
10
, respectively, to our consolidated financial statements. All of our investments and debt that we account for using the fair value method are attributed to the Liberty Global Group. The details of our realized and unrealized gains (losses) due to changes in fair values of certain investments and debt, net, are as follows:
|
|
Year ended December 31,
|
||||||
|
|
2016
|
2015
|
|||||
|
|
in millions
|
||||||
|
Investments:
|
|||||||
|
ITV
|
$
|
(608.6
|
)
|
$
|
165.6
|
|
|
|
Sumitomo
|
67.2
|
|
(2.0
|
)
|
|||
|
Lionsgate
|
(33.4
|
)
|
(33.2
|
)
|
|||
|
ITI Neovision
|
16.0
|
|
(17.0
|
)
|
|||
|
Other, net (a)
|
119.9
|
|
11.1
|
|
|||
|
Total investments
|
(438.9
|
)
|
124.5
|
|
|||
|
Debt
|
(22.6
|
)
|
—
|
|
|||
|
Total
|
$
|
(461.5
|
)
|
$
|
124.5
|
|
|
_______________
|
(a)
|
The amount for
2016
includes a gain of $84.4 million related to an investment that was sold during the third quarter of 2016.
|
Losses on debt modification and extinguishment, net
The details of our net losses on debt modification and extinguishment are as follows:
|
|
Year ended December 31,
|
||||||
|
|
2016
|
2015
|
|||||
|
|
in millions
|
||||||
|
Liberty Global Group
|
$
|
(238.1
|
)
|
$
|
(388.0
|
)
|
|
|
LiLAC Group
|
0.9
|
|
—
|
|
|||
|
Total
|
$
|
(237.2
|
)
|
$
|
(388.0
|
)
|
|
The net loss during
2016
is attributable to (i) the payment of
$150.3 million
of redemption premiums, (ii) the write-off of
$82.0 million
of deferred financing costs, (iii) a loss of
$9.6 million
related to the settlement of portions of the
Sumitomo Collar
and the
Sumitomo Collar Loan
and (iv) the write-off of
$4.7 million
of net unamortized premiums.
The loss during
2015
is attributable to (i) the payment of
$310.8 million
of redemption premiums, (ii) the write-off of
$66.1 million
of deferred financing costs, (iii) the write-off of
$10.3 million
of net unamortized discounts and (iv) the payment of
$0.8 million
of third-party costs.
For additional information concerning our losses on debt modification and extinguishment, net, see note
10
to our consolidated financial statements.
Gain on
Dutch JV Transaction
In connection with the
Dutch JV Transaction
, we recognized a pre-tax gain of
$520.8 million
, net of the recognition of a cumulative foreign currency translation loss of
$714.5 million
. For additional information, see note
5
to our consolidated financial statements.
II-58
Other income (expense), net
The details of our other income (expense), net are as follows:
|
|
Year ended December 31,
|
||||||
|
|
2016
|
2015
|
|||||
|
|
in millions
|
||||||
|
Liberty Global Group
|
$
|
(2.4
|
)
|
$
|
(24.5
|
)
|
|
|
LiLAC Group
|
12.1
|
|
(1.8
|
)
|
|||
|
Inter-group eliminations
|
(0.4
|
)
|
(0.6
|
)
|
|||
|
Total
|
$
|
9.3
|
|
$
|
(26.9
|
)
|
|
The total
2016
and
2015
amounts include (i) expense of $111.2 million and $56.8 million, respectively, representing our share of the results of affiliates and (ii) interest and dividend income of $46.9 million and $35.9 million, respectively. In addition, the 2016 amount includes income of
$69.8 million
, representing our share of the settlement of certain litigation. For additional information regarding our equity method investments, see note
6
to our consolidated financial statements.
Income tax benefit (expense)
The details of our income tax
benefit (expense) are as follows:
|
|
Year ended December 31,
|
||||||
|
|
2016
|
2015
|
|||||
|
|
in millions
|
||||||
|
Liberty Global Group
|
$
|
1,347.0
|
|
$
|
(324.3
|
)
|
|
|
LiLAC Group
|
(129.1
|
)
|
(40.6
|
)
|
|||
|
Total
|
$
|
1,217.9
|
|
$
|
(364.9
|
)
|
|
The income tax benefit during
2016
differs from the expected income tax expense of
$109.9 million
(based on the
U.K.
statutory income tax rate of
20.0%
), primarily due to the net positive impact of (i) a decrease in valuation allowances, including tax benefits of $1.1 billion recognized in the Netherlands upon the release of valuation allowances in the fourth quarter of 2016, (ii) the recognition of previously unrecognized tax benefits, (iii) non-deductible or non-taxable foreign currency exchange results, (iv) the tax effect of intercompany financing and (v) statutory tax rates in certain jurisdictions in which we operate that are different than the
U.K.
statutory income tax rate. The release of valuation allowances in the Netherlands is attributable to a significant improvement in our forecast of taxable income in the Netherlands, due to, among other factors, the impacts of contributing
Ziggo Group Holding
to the
Dutch JV
on December 31, 2016, as further described in note 5 to our consolidated financial statements. The net positive impact of these items was partially offset by the net negative impact of (a) certain permanent differences between the financial and tax accounting treatment of interest and other items and (b) a reduction in net deferred tax assets in the
U.K.
and other countries due to enacted changes in tax law.
The income tax expense during
2015
differs from the expected income tax benefit of
$136.9 million
(based on the
U.K.
statutory income tax rate of
20.0%
) primarily due to the net negative impact of (i) an increase in valuation allowances, (ii) a reduction in net deferred tax assets in the U.K. due to enacted changes in tax law and (iii) certain permanent differences between the financial and tax accounting treatment of items associated with investments in subsidiaries and affiliates. The net negative impact of these items was partially offset by the net positive impact of (a) the tax effect of intercompany financing and (b) statutory tax rates in certain jurisdictions in which we operate that are different than the
U.K.
statutory income tax rate.
For additional information concerning our income taxes, see note
11
to our consolidated financial statements.
II-59
Earnings (loss) from continuing operations
The details of our earnings (loss) from continuing operations is as follows:
|
|
Year ended December 31,
|
||||||
|
|
2016
|
2015
|
|||||
|
|
in millions
|
||||||
|
Liberty Global Group
|
$
|
1,994.5
|
|
$
|
(1,101.2
|
)
|
|
|
LiLAC Group
|
(227.2
|
)
|
51.7
|
|
|||
|
Total
|
$
|
1,767.3
|
|
$
|
(1,049.5
|
)
|
|
Our earnings (loss) from continuing operations consists of (i) operating income of
$2,801.3 million
and
$2,349.2 million
, respectively, (ii) net non-operating expense of
$2,251.9 million
and
$3,033.8 million
, respectively, and (iii) income tax benefit (expense) of
$1,217.9 million
and (
$364.9 million
), respectively.
Gains or losses associated with (i) changes in the fair values of derivative instruments, (ii) movements in foreign currency exchange rates and (iii) the disposition of assets and changes in ownership are subject to a high degree of volatility and, as such, any gains from these sources do not represent a reliable source of income. In the absence of significant gains in the future from these sources or from other non-operating items, our ability to achieve earnings from continuing operations is largely dependent on our ability to increase our aggregate Adjusted OIBDA to a level that more than offsets the aggregate amount of our (a) share-based compensation expense, (b) depreciation and amortization, (c) impairment, restructuring and other operating items, (d) interest expense, (e) other non-operating expenses and (f) income tax expenses.
Due largely to the fact that we seek to maintain our debt at levels that provide for attractive equity returns, as discussed under
Liquidity and Capital Resources — Capitalization
below, we expect that we will continue to report significant levels of interest expense for the foreseeable future. For information concerning our expectations with respect to trends that may affect certain aspects of our operating results in future periods, see the discussion under
Overview
above. For information concerning the reasons for changes in specific line items in our consolidated statements of operations, see the discussion under
Discussion and Analysis of our Reportable Segments
and
Discussion and Analysis of our Consolidated Operating Results
above.
Net earnings attributable to noncontrolling interests
The details of our net earnings attributable to noncontrolling interests are as follows:
|
|
Year ended December 31,
|
||||||||||
|
|
2016
|
2015
|
Increase (decrease)
|
||||||||
|
|
in millions
|
||||||||||
|
Liberty Global Group
|
$
|
33.7
|
|
$
|
95.2
|
|
$
|
(61.5
|
)
|
||
|
LiLAC Group
|
28.3
|
|
7.8
|
|
20.5
|
|
|||||
|
Total
|
$
|
62.0
|
|
$
|
103.0
|
|
$
|
(41.0
|
)
|
||
The decrease in net earnings attributable to noncontrolling interests during
2016, as compared to 2015
, is primarily attributable to the results of operations of (i)
Telenet
, (ii) certain
CWC
subsidiaries following the
CWC Acquisition
and (iii)
Liberty Puerto Rico
.
II-60
2015
compared to
2014
Revenue
Our revenue by major category is set forth below:
|
|
Year ended December 31,
|
Increase (decrease)
|
Organic
increase (decrease)
|
||||||||||||||||||
|
|
2015
|
2014
|
$
|
%
|
$
|
%
|
|||||||||||||||
|
|
in millions, except percentages
|
||||||||||||||||||||
|
Subscription revenue (a):
|
|||||||||||||||||||||
|
Video
|
$
|
6,380.1
|
|
$
|
6,535.7
|
|
$
|
(155.6
|
)
|
(2.4
|
)
|
$
|
27.4
|
|
0.4
|
|
|||||
|
Broadband internet
|
5,073.4
|
|
4,713.6
|
|
359.8
|
|
7.6
|
|
441.2
|
|
8.3
|
|
|||||||||
|
Fixed-line telephony
|
3,160.9
|
|
3,258.9
|
|
(98.0
|
)
|
(3.0
|
)
|
(25.9
|
)
|
(0.7
|
)
|
|||||||||
|
Cable subscription revenue
|
14,614.4
|
|
14,508.2
|
|
106.2
|
|
0.7
|
|
442.7
|
|
2.7
|
|
|||||||||
|
Mobile (b)
|
1,037.3
|
|
1,085.6
|
|
(48.3
|
)
|
(4.4
|
)
|
39.5
|
|
3.6
|
|
|||||||||
|
Total subscription revenue
|
15,651.7
|
|
15,593.8
|
|
57.9
|
|
0.4
|
|
482.2
|
|
2.8
|
|
|||||||||
|
B2B revenue (c)
|
1,580.2
|
|
1,515.9
|
|
64.3
|
|
4.2
|
|
101.4
|
|
6.2
|
|
|||||||||
|
Other revenue (b) (d)
|
1,048.1
|
|
1,138.6
|
|
(90.5
|
)
|
(7.9
|
)
|
74.9
|
|
6.7
|
|
|||||||||
|
Total
|
$
|
18,280.0
|
|
$
|
18,248.3
|
|
$
|
31.7
|
|
0.2
|
|
$
|
658.5
|
|
3.3
|
|
|||||
_________________
|
(a)
|
Subscription revenue includes amounts received from subscribers for ongoing services, excluding installation fees and late fees. Subscription revenue from subscribers who purchase bundled services at a discounted rate is generally allocated proportionally to each service based on the standalone price for each individual service. As a result, changes in the standalone pricing of our cable and mobile products or the composition of bundles can contribute to changes in our product revenue categories from period to period.
|
|
(b)
|
Mobile subscription revenue excludes mobile interconnect revenue of
$212.7 million
and
$245.0 million
during
2015
and
2014
, respectively. Mobile interconnect revenue and revenue from mobile handset sales are included in other revenue.
|
|
(c)
|
B2B
revenue includes revenue from business broadband internet, video, voice, mobile and data services offered to medium to large enterprises and, on a wholesale basis, to other operators. We also provide services to certain
SOHO
subscribers.
SOHO
subscribers pay a premium price to receive expanded service levels along with video, broadband internet, fixed-line telephony or mobile services that are the same or similar to the mass marketed products offered to our residential subscribers. Revenue from
SOHO
subscribers, which is included in subscription revenue, aggregated
$319.2 million
and
$216.5 million
during
2015
and
2014
, respectively. On an organic basis, our total
B2B
revenue, including revenue from
SOHO
subscribers, increased 10.7% during
2015
, as compared to
2014
. A portion of the increase in our
SOHO
revenue is attributable to the conversion of our residential subscribers to
SOHO
subscribers.
|
|
(d)
|
Other revenue includes, among other items, interconnect, mobile handset sales, channel carriage fee and installation revenue.
|
Total revenue.
Our consolidated revenue increased
$31.7 million
during
2015
, as compared to
2014
. This increase includes (i) an increase of $1,879.4 million attributable to the impact of acquisitions and (ii) a decrease
of $63.2 million
attributable to the
U.K. Non-Cable Disposal
and another less significant disposition. Excluding the effects of acquisitions, dispositions and FX, our consolidated revenue increased
$658.5 million
or
3.3%
.
II-61
Subscription revenue.
The details of the change in our consolidated subscription revenue for
2015
, as compared to
2014
, are as follows (in millions):
|
Increase in cable subscription revenue due to change in:
|
|||
|
Average number of RGUs
|
$
|
234.5
|
|
|
ARPU
|
208.2
|
|
|
|
Total increase in cable subscription revenue
|
442.7
|
|
|
|
Increase in mobile subscription revenue
|
39.5
|
|
|
|
Total organic increase in subscription revenue
|
482.2
|
|
|
|
Impact of acquisitions
|
1,701.2
|
|
|
|
Impact of FX
|
(2,125.5
|
)
|
|
|
Total
|
$
|
57.9
|
|
Excluding the effects of acquisitions and
FX
, our consolidated cable subscription revenue increased
$442.7 million
or
2.7%
during
2015
, as compared to
2014
. This increase is due to the net effect of (i) an increase from broadband internet services of
$441.2 million
or
8.3%
, attributable to an increase in the average number of broadband internet
RGU
s and higher
ARPU
from broadband internet services, (ii) an increase from video services of
$27.4 million
or
0.4%
, attributable to the net effect of (a) higher
ARPU
from video services and (b) a decline in the average number of video
RGU
s, and (iii) a decrease from fixed-line telephony services of
$25.9 million
or
0.7%
, attributable to the net effect of (1) lower
ARPU
from fixed-line telephony services and (2) an increase in the average number of fixed-line telephony
RGU
s.
Excluding the effects of acquisitions and
FX
, our consolidated mobile subscription revenue increased
$39.5 million
or
3.6%
during
2015
, as compared to
2014
. This increase is primarily due to the net effect of (i) increases in Belgium, Chile, Switzerland and the Netherlands and (ii) a decline in the
U.K.
B2B
revenue.
Excluding the effects of acquisitions and
FX
, our consolidated
B2B
revenue increased
$101.4 million
or
6.2%
during
2015
, as compared to
2014
. This increase is primarily due to the net effect of (i) increases in the
U.K.
, Switzerland, Belgium, Germany and Poland and (ii) a decrease in the Netherlands.
Other revenue.
Excluding the effects of acquisitions, dispositions and
FX
, our consolidated other revenue increased
$74.9 million
or
6.7%
during
2015
, as compared to
2014
. This increase is primarily attributable to the net effect of (i) an increase in mobile handset sales, primarily associated with the introduction of
Split-contract Program
s in the
U.K.
and Belgium, (ii) a decrease in fixed-line interconnect revenue, primarily in Chile, Germany and the
U.K.
, (iii) a decrease in installation revenue, primarily in the
U.K.
and the Netherlands, and (iv) a decrease in set-top box sales, primarily in Belgium and the Netherlands.
For additional information concerning the changes in our subscription, B2B and other revenue, see
Discussion and Analysis of our Reportable Segments — Revenue —
2015
compared to
2014
above.
II-62
Supplemental revenue information
Our revenue by major category for the Liberty Global Group is set forth below:
|
|
Year ended December 31,
|
Increase (decrease)
|
Organic
increase (decrease)
|
||||||||||||||||||
|
|
2015
|
2014
|
$
|
%
|
$
|
%
|
|||||||||||||||
|
|
in millions, except percentages
|
||||||||||||||||||||
|
Liberty Global Group:
|
|||||||||||||||||||||
|
Subscription revenue:
|
|||||||||||||||||||||
|
Video
|
$
|
5,853.8
|
|
$
|
6,005.8
|
|
$
|
(152.0
|
)
|
(2.5
|
)
|
$
|
(1.6
|
)
|
—
|
|
|||||
|
Broadband internet
|
4,669.9
|
|
4,333.5
|
|
336.4
|
|
7.8
|
|
405.7
|
|
8.3
|
|
|||||||||
|
Fixed-line telephony
|
2,996.0
|
|
3,070.5
|
|
(74.5
|
)
|
(2.4
|
)
|
(19.8
|
)
|
(0.6
|
)
|
|||||||||
|
Cable subscription revenue
|
13,519.7
|
|
13,409.8
|
|
109.9
|
|
0.8
|
|
384.3
|
|
2.6
|
|
|||||||||
|
Mobile (a)
|
1,001.7
|
|
1,061.2
|
|
(59.5
|
)
|
(5.6
|
)
|
23.2
|
|
2.1
|
|
|||||||||
|
Total subscription revenue
|
14,521.4
|
|
14,471.0
|
|
50.4
|
|
0.3
|
|
407.5
|
|
2.5
|
|
|||||||||
|
B2B revenue (b)
|
1,564.6
|
|
1,506.2
|
|
58.4
|
|
3.9
|
|
96.8
|
|
5.9
|
|
|||||||||
|
Other revenue
|
976.7
|
|
1,066.5
|
|
(89.8
|
)
|
(8.4
|
)
|
72.2
|
|
6.9
|
|
|||||||||
|
Total Liberty Global Group
|
$
|
17,062.7
|
|
$
|
17,043.7
|
|
$
|
19.0
|
|
0.1
|
|
$
|
576.5
|
|
3.1
|
|
|||||
|
(a)
|
Mobile subscription revenue excludes mobile interconnect revenue of
$209.2 million
and
$242.2 million
during
2015
and
2014
, respectively. Mobile interconnect revenue and revenue from mobile handset sales are included in other revenue.
|
|
(b)
|
Revenue from SOHO subscribers, which is included in subscription revenue, aggregated
$298.6 million
and
$199.2 million
during
2015
and
2014
, respectively. On an organic basis, the Liberty Global Group’s total B2B revenue, including revenue from SOHO subscribers, increased 10.6% during
2015
, as compared to
2014
.
|
Our revenue by major category for the LiLAC Group is set forth below:
|
|
Year ended December 31,
|
Increase (decrease)
|
Organic
increase (decrease)
|
||||||||||||||||||
|
|
2015
|
2014
|
$
|
%
|
$
|
%
|
|||||||||||||||
|
|
in millions, except percentages
|
||||||||||||||||||||
|
LiLAC Group:
|
|||||||||||||||||||||
|
Subscription revenue:
|
|||||||||||||||||||||
|
Video
|
$
|
526.3
|
|
$
|
529.9
|
|
$
|
(3.6
|
)
|
(0.7
|
)
|
$
|
29.0
|
|
5.3
|
|
|||||
|
Broadband internet
|
403.5
|
|
380.1
|
|
23.4
|
|
6.2
|
|
35.5
|
|
8.7
|
|
|||||||||
|
Fixed-line telephony
|
164.9
|
|
188.4
|
|
(23.5
|
)
|
(12.5
|
)
|
(6.1
|
)
|
(3.2
|
)
|
|||||||||
|
Cable subscription revenue
|
1,094.7
|
|
1,098.4
|
|
(3.7
|
)
|
(0.3
|
)
|
58.4
|
|
5.1
|
|
|||||||||
|
Mobile (a)
|
35.6
|
|
24.4
|
|
11.2
|
|
45.9
|
|
16.3
|
|
66.6
|
|
|||||||||
|
Total subscription revenue
|
1,130.3
|
|
1,122.8
|
|
7.5
|
|
0.7
|
|
74.7
|
|
6.4
|
|
|||||||||
|
B2B revenue (b)
|
15.6
|
|
9.7
|
|
5.9
|
|
60.8
|
|
4.6
|
|
41.6
|
|
|||||||||
|
Other revenue
|
71.4
|
|
72.1
|
|
(0.7
|
)
|
(1.0
|
)
|
2.7
|
|
3.5
|
|
|||||||||
|
Total LiLAC Group
|
$
|
1,217.3
|
|
$
|
1,204.6
|
|
$
|
12.7
|
|
1.1
|
|
$
|
82.0
|
|
6.5
|
|
|||||
|
(a)
|
Mobile subscription revenue excludes mobile interconnect revenue of
$3.5 million
and
$2.8 million
during
2015
and
2014
, respectively. Mobile interconnect revenue and revenue from mobile handset sales are included in other revenue.
|
|
(b)
|
Revenue from SOHO subscribers, which is included in subscription revenue, aggregated
$20.6 million
and
$17.3 million
during
2015
and
2014
, respectively. On an organic basis, the LiLAC Group’s total B2B revenue, including revenue from SOHO subscribers, increased 16.1% during
2015
, as compared to
2014
.
|
II-63
Programming and other direct costs of services
Our programming and other direct costs of services increased
$60.9 million
during
2015
, as compared to
2014
. This increase includes (i) an increase of
$356.9 million
attributable to the impact of the
Ziggo Acquisition
, the
Choice Acquisition
and other less significant acquisitions and (ii) a
decrease of
$50.5 million
attributable to the
U.K. Non-Cable Disposal
and another less significant disposition.
Excluding the effects of acquisitions, dispositions and
FX
, our programming and other direct costs of services increased
$254.2 million
or
5.8%
during
2015
, as compared to
2014
. This increase is primarily attributable to increases in (a) programming and copyright costs, (b) mobile handset costs and (c) mobile access and interconnect costs. For additional information regarding the changes in our programming and other direct costs of services, see
Discussion and Analysis of our Reportable Segments — Programming and Other Direct Costs of Services of our Reportable Segments
above.
Other operating expenses
Our other operating expenses decreased
$120.6 million
during
2015
, as compared to
2014
. This decrease includes (i) an increase of
$245.0 million
attributable to the impact of the
Ziggo Acquisition
, the
Choice Acquisition
and other less significant acquisitions and (ii) a
decrease of
$4.8 million
attributable to the
U.K. Non-Cable Disposal
and another less significant disposition.
Our other operating expenses include share-based compensation expense, which decreased
$4.2 million
during
2015
as compared to
2014
. For additional information, see the discussion under
Share-based compensation expense
below. Excluding the effects of acquisitions, dispositions,
FX
and share-based compensation expense, our other operating expenses increased
$7.0 million
or
0.2%
during
2015
, as compared to
2014
. This increase is primarily attributable to the net effect of (a) an increase in information technology-related costs, (b) a decrease in personnel costs, (c) an increase in outsourced labor and professional fees and (d) a decrease in network-related expenses. Certain of these changes include the impact of a $20.1 million increase in integration-related costs in the Netherlands. For additional information regarding the changes in our other operating expenses, see
Discussion and Analysis of our Reportable Segments — Other Operating Expenses of our Reportable Segments
above.
SG&A expenses
Our SG&A expenses increased
$7.4 million
during
2015
, as compared to
2014
. This increase
includes
$294.5 million
attributable to the impact of the
Ziggo Acquisition
, the
Choice Acquisition
and other less significant acquisitions. Our SG&A expenses include share-based compensation expense, which increased
$65.2 million
during
2015
as compared to
2014
. For additional information, see the discussion under
Share-based compensation expense
below. Excluding the effects of acquisitions,
FX
and share-based compensation expense, our SG&A expenses increased
$33.7 million
or
1.1%
during
2015
, as compared to
2014
. This increase is primarily due to the net effect of
(i) an increase in outsourced labor and professional fees, including an increase in corporate costs of $19.9 million associated with the Liberty 3.0 initiative, (ii) an increase in personnel costs, (iii) a decrease in external sales and marketing costs and (iv) a decrease in information technology-related expenses. Certain of these changes include the impact of a $9.6 million increase in integration-related costs, primarily in the Netherlands and Belgium. For additional information regarding the changes in our SG&A expenses, see
Discussion and Analysis of our Reportable Segments — SG&A Expenses of our Reportable Segments
above
.
II-64
Share-based compensation expense (included in other operating and SG&A expenses)
A summary of our aggregate share-based compensation expense is set forth below:
|
|
Year ended December 31,
|
||||||
|
|
2015
|
2014
|
|||||
|
|
in millions
|
||||||
|
Liberty Global shares:
|
|||||||
|
Performance-based incentive awards (a)
|
$
|
157.1
|
|
$
|
129.9
|
|
|
|
Other share-based incentive awards
|
149.6
|
|
99.7
|
|
|||
|
Total Liberty Global shares (b)
|
306.7
|
|
229.6
|
|
|||
|
Telenet share-based incentive awards (c)
|
9.2
|
|
14.6
|
|
|||
|
Other
|
2.3
|
|
13.0
|
|
|||
|
Total
|
$
|
318.2
|
|
$
|
257.2
|
|
|
|
Included in:
|
|||||||
|
Other operating expense:
|
|||||||
|
Liberty Global Group
|
$
|
3.1
|
|
$
|
4.8
|
|
|
|
LiLAC Group
|
0.3
|
|
2.8
|
|
|||
|
Total other operating expense
|
3.4
|
|
7.6
|
|
|||
|
SG&A expense:
|
|||||||
|
Liberty Global Group
|
312.7
|
|
240.8
|
|
|||
|
LiLAC Group (b) (d)
|
2.1
|
|
8.8
|
|
|||
|
Total SG&A expense
|
314.8
|
|
249.6
|
|
|||
|
Total
|
$
|
318.2
|
|
$
|
257.2
|
|
|
________________
|
(a)
|
Includes share-based compensation expense related to (i)
Liberty Global
PSU
s, (ii) the
Challenge Performance Awards
and (iii) the
PGUs
.
|
|
(b)
|
In connection with the
LiLAC Transaction
, our compensation committee approved the
2015 Award Modifications
(as defined and described in note
13
to our consolidated financial statements) in accordance with the underlying share-based incentive plans. As a result of the
2015 Award Modifications
, we recognized
$69.3 million
of incremental expense during 2015.
|
|
(c)
|
Represents the share-based compensation expense associated with
Telenet
’s share-based incentive awards.
|
|
(d)
|
The amount for 2015 includes the reversal of $1.8 million of share-based compensation expense, primarily related to forfeitures of unvested PSUs during the first quarter of 2015.
|
For additional information concerning our share-based compensation, see note
13
to our consolidated financial statements.
Depreciation and amortization expense
The details of our depreciation and amortization expense are as follows:
|
|
Year ended December 31,
|
Increase (decrease)
|
||||||||||||
|
|
2015
|
2014
|
$
|
%
|
||||||||||
|
|
in millions
|
|
||||||||||||
|
Liberty Global Group
|
$
|
5,609.4
|
|
$
|
5,283.4
|
|
$
|
326.0
|
|
6.2
|
|
|||
|
LiLAC Group
|
216.4
|
|
216.7
|
|
(0.3
|
)
|
(0.1
|
)
|
||||||
|
Total
|
$
|
5,825.8
|
|
$
|
5,500.1
|
|
$
|
325.7
|
|
5.9
|
|
|||
II-65
Excluding the effects of
FX
, depreciation and amortization expense increased
$1,117.8 million or 20.3% during
2015
, as compared to
2014
. This increase is primarily due to the impact of the
Ziggo Acquisition
.
In addition, a
net increase
resulted from (i) an increase associated with property and equipment additions related to the installation of customer premises equipment, the expansion and upgrade of our networks and other capital initiatives and
(ii) a decrease associated with certain assets becoming fully depreciated, primarily in
U.K./Ireland
and, to a lesser extent, the Netherlands, Belgium, Germany, Chile and Switzerland/Austria.
Impairment, restructuring and other operating items, net
The details of our impairment, restructuring and other operating items, net, are as follows:
|
|
Year ended December 31,
|
||||||
|
|
2015
|
2014
|
|||||
|
|
in millions
|
||||||
|
Liberty Global Group
|
$
|
154.3
|
|
$
|
516.7
|
|
|
|
LiLAC Group
|
19.8
|
|
20.1
|
|
|||
|
Total
|
$
|
174.1
|
|
$
|
536.8
|
|
|
The total for
2015
includes (i) restructuring charges of
$103.8 million
, including (a)
$102.3 million
of employee severance and termination costs related to certain reorganization activities, primarily in the Netherlands, U.K./Ireland, Germany, Switzerland/Austria and Puerto Rico, (b) contract termination charges of
$19.3 million
, primarily in Belgium, Chile and Puerto Rico, and (c) a credit of
$17.0 million
recorded by Telenet during the fourth quarter following the settlement of its
DTT
capacity contract obligations, the fair value of which were originally recorded during 2014 when Telenet discontinued the provision of
DTT
services, (ii) direct acquisition costs of
$49.8 million
, primarily related to our acquisition of
CWC
,
Telenet
’s acquisition of
BASE
, our acquisition of additional shares of
ITV
, the
Choice Acquisition
and the
Ziggo Acquisition
, (iii) impairment charges of $24.8 million, primarily in U.K./Ireland, the Netherlands and Switzerland/Austria, and (iv) a
$23.1 million
loss on the divestiture of our Film1 channels.
The total for
2014
includes (i) direct acquisition costs of $331.3 million, including (a) $222.0 million that was accrued during the fourth quarter in connection with the settlement of certain third-party appeals of the German competition authority’s 2011 decision to approve our acquisition of
KBW
and (b)
$84.1 million
associated with the
Ziggo Acquisition
, (ii) restructuring charges of
$166.9 million
, including (1) an $86.1 million charge to record the fair value of
Telenet
’s obligations under certain
DTT
capacity contracts following
Telenet
’s decision to discontinue the provision of
DTT
services on March 31, 2014 and (2)
$60.4 million
of employee severance and termination costs related to certain reorganization activities, primarily in
U.K./Ireland
, the Netherlands, Germany, Chile and the European Division’s central operations, and (iii) an impairment charge of
$68.7 million
that was recorded by
Ziggo
during the fourth quarter of 2014 to reduce the carrying amount of certain of
Ziggo
’s internal-use software assets to zero following our determination that these assets would have no future service potential for our combined operations in the Netherlands.
For additional information regarding our restructuring charges, see note
14
to our consolidated financial statements.
Interest expense
The details of our interest expense are as follows:
|
|
Year ended December 31,
|
Increase (decrease)
|
||||||||||||
|
|
2015
|
2014
|
$
|
%
|
||||||||||
|
|
in millions
|
|
||||||||||||
|
Liberty Global Group
|
$
|
2,284.1
|
|
$
|
2,405.1
|
|
$
|
(121.0
|
)
|
(5.0
|
)
|
|||
|
LiLAC Group
|
157.9
|
|
140.4
|
|
17.5
|
|
12.5
|
|
||||||
|
Inter-group eliminations
|
(0.6
|
)
|
(0.8
|
)
|
0.2
|
|
N.M.
|
|
||||||
|
Total
|
$
|
2,441.4
|
|
$
|
2,544.7
|
|
$
|
(103.3
|
)
|
(4.1
|
)
|
|||
_______________
N.M. — Not Meaningful.
II-66
Excluding the effects of
FX
, interest expense increased $228.5 million or 9.0% during
2015
, as compared to
2014
. This increase is primarily attributable to the net effect of (i) higher average outstanding debt balances, largely due to debt incurred in connection with the
Ziggo Acquisition
, and (ii) lower weighted average interest rates related to the completion of certain financing transactions that resulted in extended maturities and net decreases to certain of our interest rates. For additional information regarding our outstanding indebtedness, see note
10
to our consolidated financial statements.
Realized and unrealized gains on derivative instruments, net
The details of our realized and unrealized gains on derivative instruments, net, are as follows:
|
|
Year ended December 31,
|
||||||
|
|
2015
|
2014
|
|||||
|
|
in millions
|
||||||
|
Cross-currency and interest rate derivative contracts:
|
|||||||
|
Liberty Global Group
|
$
|
855.7
|
|
$
|
252.5
|
|
|
|
LiLAC Group
|
217.0
|
|
41.1
|
|
|||
|
Total cross-currency and interest rate derivative contracts (a)
|
1,072.7
|
|
293.6
|
|
|||
|
Equity-related derivative instruments - Liberty Global Group:
|
|||||||
|
ITV Collar
|
(222.6
|
)
|
(77.4
|
)
|
|||
|
Sumitomo Collar
|
(20.3
|
)
|
(46.0
|
)
|
|||
|
Lionsgate Forward
|
14.5
|
|
—
|
|
|||
|
Ziggo Collar (b)
|
—
|
|
(113.3
|
)
|
|||
|
Other
|
0.7
|
|
0.4
|
|
|||
|
Total equity-related derivative instruments (c)
|
(227.7
|
)
|
(236.3
|
)
|
|||
|
Foreign currency forward contracts:
|
|||||||
|
Liberty Global Group
|
(9.0
|
)
|
29.0
|
|
|||
|
LiLAC Group
|
10.3
|
|
2.6
|
|
|||
|
Total foreign currency forward contracts
|
1.3
|
|
31.6
|
|
|||
|
Other - Liberty Global Group
|
0.9
|
|
(0.1
|
)
|
|||
|
Total Liberty Global Group
|
619.9
|
|
45.1
|
|
|||
|
Total LiLAC Group
|
227.3
|
|
43.7
|
|
|||
|
Total
|
$
|
847.2
|
|
$
|
88.8
|
|
|
_______________
|
(a)
|
The gain during
2015
is primarily attributable to the net effect of (i) gains associated with decreases in the values of the euro, British pound sterling and Chilean peso relative to the
U.S.
dollar, (ii) losses associated with an increase in the value of the Swiss franc relative to the euro and (iii) gains associated with increases in market interest rates in the Chilean peso market. In addition, the gain during
2015
includes a net loss of
$9.3 million
resulting from changes in our credit risk valuation adjustments. The
gain
during
2014
is primarily attributable to the net effect of (a) gains associated with decreases in the values of the euro, British pound sterling, Chilean peso and Swiss franc relative to the
U.S.
dollar, (b) losses associated with decreases in market interest rates in the euro, British pound sterling, Swiss franc and Chilean peso markets and (c) gains associated with decreases in the values of the Hungarian forint and Polish zloty relative to the euro. In addition, the gain during
2014
includes a net loss
of
$120.9 million
resulting from changes in our credit risk valuation adjustments.
|
|
(b)
|
Upon completion of the
Ziggo Acquisition
, the
Ziggo Collar
was terminated.
|
|
(c)
|
For information concerning the factors that impact the valuations of our equity-related derivative instruments, see note
8
to our consolidated financial statements.
|
For additional information concerning our derivative instruments, see notes
7
and
8
to our consolidated financial statements and
Quantitative and Qualitative Disclosures about Market Risk
below.
II-67
Foreign currency transaction losses, net
The details of our foreign currency transaction losses, net, are as follows:
|
|
Year ended December 31,
|
||||||
|
|
2015
|
2014
|
|||||
|
|
in millions
|
||||||
|
Liberty Global Group:
|
|||||||
|
U.S. dollar denominated debt issued by euro functional currency entities
|
$
|
(715.7
|
)
|
$
|
(481.5
|
)
|
|
|
U.S. dollar denominated debt issued by a British pound sterling functional currency entity
|
(210.0
|
)
|
(175.1
|
)
|
|||
|
British pound sterling denominated debt issued by a U.S. dollar functional currency entity
|
89.6
|
|
59.6
|
|
|||
|
Intercompany payables and receivables denominated in a currency other than the entity’s functional currency (a)
|
(98.4
|
)
|
(358.8
|
)
|
|||
|
Euro denominated debt issued by a British pound sterling functional currency entity
|
8.1
|
|
—
|
|
|||
|
Cash and restricted cash denominated in a currency other than the entity’s functional currency
|
22.9
|
|
27.5
|
|
|||
|
Yen denominated debt issued by a U.S. dollar functional currency entity
|
2.0
|
|
109.2
|
|
|||
|
Euro denominated debt issued by a U.S. dollar functional currency entity
|
—
|
|
72.2
|
|
|||
|
Other
|
(24.3
|
)
|
8.3
|
|
|||
|
Total Liberty Global Group
|
(925.8
|
)
|
(738.6
|
)
|
|||
|
LiLAC Group:
|
|||||||
|
U.S. dollar denominated debt issued by a Chilean peso functional currency entity
|
(215.8
|
)
|
(137.1
|
)
|
|||
|
Intercompany payables and receivables denominated in a currency other than the entity’s functional currency (b)
|
0.9
|
|
47.2
|
|
|||
|
Other
|
(8.5
|
)
|
(8.0
|
)
|
|||
|
Total LiLAC Group
|
(223.4
|
)
|
(97.9
|
)
|
|||
|
Total
|
$
|
(1,149.2
|
)
|
$
|
(836.5
|
)
|
|
_______________
|
(a)
|
Amounts primarily relate to (i) loans between certain of our non-operating and operating subsidiaries in Europe, which generally are denominated in the currency of the applicable operating subsidiary, and (ii) loans between certain of our non-operating subsidiaries in the U.S. and Europe.
|
|
(b)
|
Amounts primarily relate to loans between certain of our subsidiaries in Europe and Chile.
|
For information regarding how we manage our exposure to foreign currency risk, see
Quantitative and Qualitative Disclosures about Market Risk — Foreign Currency Risk
below.
Realized and unrealized gains (losses) due to changes in fair values of certain investments and debt, net
All of our investments that we account for using the fair value method are attributed to the Liberty Global Group. The details of our realized and unrealized gains (losses) due to changes in fair values of certain investments and debt, net, are as follows:
|
|
Year ended December 31,
|
||||||
|
|
2015
|
2014
|
|||||
|
|
in millions
|
||||||
|
Investments (a):
|
|||||||
|
ITV
|
$
|
165.6
|
|
$
|
54.9
|
|
|
|
Lionsgate
|
(33.2
|
)
|
—
|
|
|||
|
ITI Neovision
|
(17.0
|
)
|
20.5
|
|
|||
|
Sumitomo
|
(2.0
|
)
|
(99.8
|
)
|
|||
|
Ziggo
|
—
|
|
224.0
|
|
|||
|
Other, net
|
11.1
|
|
5.6
|
|
|||
|
Total
|
$
|
124.5
|
|
$
|
205.2
|
|
|
II-68
_______________
|
(a)
|
For additional information regarding our investments and fair value measurements, see notes
6
and
8
, respectively, to our consolidated financial statements.
|
Losses on debt modification and extinguishment, net
The details of our losses on debt modification and extinguishment are as follows:
|
|
Year ended December 31,
|
||||||
|
|
2015
|
2014
|
|||||
|
|
in millions
|
||||||
|
Liberty Global Group
|
$
|
(388.0
|
)
|
$
|
(174.4
|
)
|
|
|
LiLAC Group
|
—
|
|
(11.8
|
)
|
|||
|
Total
|
$
|
(388.0
|
)
|
$
|
(186.2
|
)
|
|
The loss during
2015
is attributable to (i) the payment of
$310.8 million
of redemption premiums, (ii) the write-off of
$66.1 million
of deferred financing costs, (iii) the write-off of
$10.3 million
of net unamortized discounts and (iv) the payment of
$0.8 million
of third-party costs.
The loss during
2014
is attributable to (i) the payment of
$265.6 million
of redemption premiums, (ii) the write-off of
$146.9 million
of net unamortized premiums, (iii) the write-off of
$60.4 million
of deferred financing costs and (iv) the payment of
$7.1 million
of third-party costs.
For additional information concerning our losses on debt modification and extinguishment, net, see note
10
to our consolidated financial statements.
Other income (expense), net
The details of our other income (expense), net are as follows:
|
|
Year ended December 31,
|
||||||
|
|
2015
|
2014
|
|||||
|
|
in millions
|
||||||
|
Liberty Global Group
|
$
|
(24.5
|
)
|
$
|
(12.0
|
)
|
|
|
LiLAC Group
|
(1.8
|
)
|
2.1
|
|
|||
|
Inter-group eliminations
|
(0.6
|
)
|
(0.8
|
)
|
|||
|
Total
|
$
|
(26.9
|
)
|
$
|
(10.7
|
)
|
|
The total
2015
and
2014
amounts include (i) expense of $56.8 million and $28.1 million, respectively, representing our share of the results of affiliates and (ii) interest and dividend income of $35.9 million and $31.7 million, respectively. For additional information regarding our equity method investments, see note
6
to our consolidated financial statements.
Income tax benefit (expense)
The details of our income tax benefit (expense) are as follows:
|
|
Year ended December 31,
|
||||||
|
|
2015
|
2014
|
|||||
|
|
in millions
|
||||||
|
Liberty Global Group
|
$
|
(324.3
|
)
|
$
|
89.4
|
|
|
|
LiLAC Group
|
(40.6
|
)
|
(14.4
|
)
|
|||
|
Total
|
$
|
(364.9
|
)
|
$
|
75.0
|
|
|
II-69
The income tax expense during
2015
differs from the expected income tax benefit of
$136.9 million
(based on the
U.K.
statutory income tax rate of
20.0%
) primarily due to the net negative impact of
(i) an increase in valuation allowances, (ii) a reduction in net deferred tax assets in the U.K. due to enacted changes in tax law and (iii) certain permanent differences between the financial and tax accounting treatment of items associated with investments in subsidiaries and affiliates. The net negative impact of these items was partially offset by the net positive impact of (a) the tax effect of intercompany financing and (b) statutory tax rates in certain jurisdictions in which we operate that are different than the
U.K.
statutory income tax rate.
The income tax benefit during
2014
differs from the expected income tax benefit of
$221.7 million
(based on the
U.K.
statutory income tax rate of
21.0%
) primarily due to the net negative impact of (i) an increase in valuation allowances,
(ii) certain permanent differences between the financial and tax accounting treatment of interest and other items and (iii) certain permanent differences between the financial and tax accounting treatment of items associated with investments in subsidiaries. The net negative impact of these items was partially offset by the net positive impact of (a) statutory tax rates in certain jurisdictions in which we operate that are different than the
U.K.
statutory income tax rate, (b) the tax effect of intercompany financing, (c) non-deductible or non-taxable foreign currency exchange results and (d) the recognition of previously unrecognized tax benefits.
For additional information concerning our income taxes, see note
11
to our consolidated financial statements.
Earnings (loss) from continuing operations
The details of our earnings (loss) from continuing operations are as follows:
|
|
Year ended December 31,
|
||||||
|
|
2015
|
2014
|
|||||
|
|
in millions
|
||||||
|
Liberty Global Group
|
$
|
(1,101.2
|
)
|
$
|
(990.6
|
)
|
|
|
LiLAC Group
|
51.7
|
|
9.7
|
|
|||
|
Total
|
$
|
(1,049.5
|
)
|
$
|
(980.9
|
)
|
|
Our earnings (loss) from continuing operations consists of (i) operating income of
$2,349.2 million
and
$2,228.2 million
, respectively, (ii) net non-operating expense of
$3,033.8 million
and
$3,284.1 million
, respectively, and (iii) income tax benefit (expense) of (
$364.9 million
) and
$75.0 million
, respectively.
Discontinued operation
Our earnings
from discontinued operation, net of taxes, of
$0.8 million
during
2014
relate to the operations of the
Chellomedia Disposal Group
. In addition, we recognized an after-tax gain on the disposal of a discontinued operation of
$332.7 million
related to the January 31, 2014 completion of the
Chellomedia Transaction
. For additional information, see note
5
to our consolidated financial statements.
Net earnings attributable to noncontrolling interests
The details of our net earnings attributable to noncontrolling interests are as follows:
|
|
Year ended December 31,
|
||||||||||
|
|
2015
|
2014
|
Increase
|
||||||||
|
|
in millions
|
||||||||||
|
Liberty Global Group
|
$
|
95.2
|
|
$
|
49.9
|
|
$
|
45.3
|
|
||
|
LiLAC Group
|
7.8
|
|
(2.3
|
)
|
10.1
|
|
|||||
|
Total
|
$
|
103.0
|
|
$
|
47.6
|
|
$
|
55.4
|
|
||
The increase in net earnings attributable to noncontrolling interests during 2015, as compared to 2014, is primarily attributable to the results of operations of
Telenet
.
II-70
Liquidity and Capital Resources
Sources and Uses of Cash
We are a holding company that is dependent on the capital resources of our subsidiaries to satisfy our liquidity requirements at the corporate level. Each of our significant operating subsidiaries is included within one of our seven primary subsidiary “borrowing groups.” These borrowing groups include the respective restricted parent and subsidiary entities within
Virgin Media
,
Unitymedia
,
UPC Holding
,
Telenet
,
CWC
,
VTR Finance
and
Liberty Puerto Rico
. Our borrowing groups, which typically generate cash from operating activities, accounted for a significant portion of our consolidated cash and cash equivalents at
December 31, 2016
. The terms of the instruments governing the indebtedness of these borrowing groups may restrict our ability to access the liquidity of these subsidiaries. In addition, our ability to access the liquidity of these and other subsidiaries may be limited by tax and legal considerations, the presence of noncontrolling interests, foreign currency exchange restrictions with respect to certain
CWC
subsidiaries and other factors.
Cash and cash equivalents
The details of the
U.S.
dollar equivalent balances of our consolidated cash and cash equivalents at
December 31, 2016
are set forth in the following table (in millions):
|
Cash and cash equivalents held by:
|
|||
|
Liberty Global and unrestricted subsidiaries:
|
|||
|
Liberty Global (a)
|
$
|
58.9
|
|
|
Unrestricted subsidiaries:
|
|||
|
Liberty Global Group (b) (c)
|
854.9
|
|
|
|
LiLAC Group (d)
|
77.9
|
|
|
|
Total Liberty Global and unrestricted subsidiaries
|
991.7
|
|
|
|
Borrowing groups (e):
|
|||
|
CWC (f)
|
271.2
|
|
|
|
VTR Finance
|
125.0
|
|
|
|
Telenet
|
104.6
|
|
|
|
Liberty Puerto Rico
|
78.5
|
|
|
|
UPC Holding
|
28.2
|
|
|
|
Virgin Media (c)
|
27.1
|
|
|
|
Unitymedia
|
2.9
|
|
|
|
Total borrowing groups
|
637.5
|
|
|
|
Total cash and cash equivalents
|
$
|
1,629.2
|
|
|
Liberty Global Group
|
$
|
1,076.6
|
|
|
LiLAC Group
|
552.6
|
|
|
|
Total cash and cash equivalents
|
$
|
1,629.2
|
|
_______________
|
(a)
|
Represents the amount held by
Liberty Global
on a standalone basis, which is attributed to the
Liberty Global Group
.
|
|
(b)
|
Represents the aggregate amount held by subsidiaries attributed to the
Liberty Global Group
that are outside of our borrowing groups.
|
|
(c)
|
The Virgin Media borrowing group includes certain subsidiaries of
Virgin Media
, but excludes
Virgin Media
. The
$0.2 million
of cash and cash equivalents held by
Virgin Media
is included in the amount shown for the
Liberty Global Group
’s unrestricted subsidiaries.
|
|
(d)
|
Represents the aggregate amount held by subsidiaries attributed to the
LiLAC Group
that are outside of our borrowing groups.
|
II-71
|
(e)
|
Except as otherwise noted, represents the aggregate amounts held by the parent entity and restricted subsidiaries of our borrowing groups.
|
|
(f)
|
CWC
's subsidiaries hold substantially all of
CWC
's consolidated cash. The ability of certain of these subsidiaries to loan or distribute their cash to
CWC
is limited by foreign exchange restrictions, the existence of noncontrolling interests, tax considerations and restrictions contained within the debt agreements of certain
CWC
subsidiaries. As a result, a significant portion of the cash held by
CWC
subsidiaries is not considered to be an immediate source of corporate liquidity for
CWC
.
|
Liquidity of
Liberty Global
and its unrestricted subsidiaries
The
$58.9 million
of cash and cash equivalents held by
Liberty Global
and, subject to certain tax and legal considerations, the
$932.8 million
of aggregate cash and cash equivalents held by the unrestricted subsidiaries attributed to the
Liberty Global Group
and the
LiLAC Group
, represented available liquidity at the corporate level at
December 31, 2016
. Our remaining cash and cash equivalents of
$637.5 million
at
December 31, 2016
were held by our borrowing groups as set forth in the table above. As noted above, various factors may limit our ability to access the cash of our borrowing groups. For information regarding certain limitations imposed by our subsidiaries’ debt instruments at
December 31, 2016
, see note
10
to our consolidated financial statements.
Our current sources of corporate liquidity include (i) cash and cash equivalents held by
Liberty Global
and, subject to certain tax and legal considerations,
Liberty Global
’s unrestricted subsidiaries, and (ii) interest and dividend income received on our and, subject to certain tax and legal considerations, our unrestricted subsidiaries’ cash and cash equivalents and investments. In addition, our parent entity’s short-term liquidity is supplemented by interest payments that it receives on a note receivable from one of our unrestricted subsidiaries (outstanding principal of $9.6 billion
at
December 31, 2016
, all outstanding principal due in 2021).
From time to time,
Liberty Global
and its unrestricted subsidiaries may also receive (i) proceeds in the form of distributions or loan repayments from
Liberty Global
’s borrowing groups or affiliates (including amounts from the
Dutch JV
beginning in 2017) upon (a) the completion of recapitalizations, refinancings, asset sales or similar transactions by these entities or (b) the accumulation of excess cash from operations or other means, (ii) proceeds upon the disposition of investments and other assets of
Liberty Global
and its unrestricted subsidiaries and (iii) proceeds in connection with the incurrence of debt by
Liberty Global
or its unrestricted subsidiaries or the issuance of equity securities by
Liberty Global
, including equity securities issued to satisfy subsidiary obligations. No assurance can be given that any external funding would be available to
Liberty Global
or its unrestricted subsidiaries on favorable terms, or at all. On January 4, 2017, in connection with the completion of the
Dutch JV Transaction
, our company received cash of
€2.2 billion
(
$2.3 billion
at the transaction date). For additional information, see note
5
to our consolidated financial statements.
The amount of cash we receive from our subsidiaries to satisfy
U.S.
dollar-denominated liquidity requirements is impacted by fluctuations in exchange rates, particularly with regard to the translation of British pounds sterling and euros into
U.S.
dollars. In this regard, the strengthening (weakening) of the
U.S.
dollar against these currencies will result in decreases (increases) in the
U.S.
dollars received from the applicable subsidiaries to fund the repurchase of our equity securities and other
U.S.
dollar-denominated liquidity requirements. The
U.S.
dollar has significantly strengthened against the British pound sterling during the period following
Brexit
.
At
December 31, 2016
, our consolidated cash and cash equivalents balance includes
$1,548.1 million
held by entities that are domiciled outside of the
U.K.
Based on our assessment of our ability to access the liquidity of our subsidiaries on a tax efficient basis and our expectations with respect to our corporate liquidity requirements, we do not anticipate that tax considerations will adversely impact our corporate liquidity over the next 12 months. Our ability to access the liquidity of our subsidiaries on a tax efficient basis is a consideration in assessing the extent of our share repurchase programs.
Our corporate liquidity requirements include (i) corporate general and administrative expenses, (ii) interest payments on the
Sumitomo Collar Loan
and
Sumitomo Share Loan
and (iii) principal payments on the
ITV Collar Loan
, the
Sumitomo Collar Loan
, the
Sumitomo Share Loan
and the
Lionsgate Loan
to the extent not settled through the delivery of the underlying shares.
Liberty Global
and its unrestricted subsidiaries may also require cash in connection with (a) the repayment of third-party and intercompany debt, (b) the satisfaction of contingent liabilities, (c) acquisitions, (d) the repurchase of equity and debt securities, (e) other investment opportunities or (f) income tax payments. In addition, our parent entity uses available liquidity to make interest and principal payments on notes payable to certain of our unrestricted subsidiaries (aggregate outstanding principal of $
5,764.6 million
at
December 31, 2016
and no stated maturity). For information regarding our commitments and contingencies, see note
17
to our consolidated financial statements.
II-72
As a
U.K.
incorporated company, we may only elect to repurchase shares or pay dividends to the extent of our “Distributable Reserves.” Distributable Reserves, which are not linked to a
U.S. GAAP
reported amount, may be created through the earnings of the
U.K.
parent company and, among other methods, through a reduction in share premium approved by the English Companies Court. Based on the amounts set forth in our 2015
U.K.
Companies Act Report dated April 25, 2016, which are our most recent “Relevant Accounts” for the purposes of determining our Distributable Reserves under U.K. law, our Distributable Reserves were
$27.9 billion
as of December 31, 2015. This amount does not reflect earnings, share repurchases or other activity that occurred in
2016
, each of which impacts the amount of our Distributable Reserves.
During
2016
, we repurchased
Liberty Global Shares
and
LiLAC Shares
for an aggregate purchase price of
$2,068.0 million
and
$21.5 million
, respectively, including direct acquisition costs and the effects of derivative instruments. At
December 31, 2016
, the remaining amount authorized for repurchases of
Liberty Global Shares
and
LiLAC Shares
was
$1,943.4 million
and
$278.6 million
, respectively. Purchases of
Liberty Global Shares
and
LiLAC Shares
will be funded by the respective liquidity of the
Liberty Global Group
and the
LiLAC Group
. Subsequent to
December 31, 2016
, our board of directors increased the amount authorized under the share repurchase program for our
Liberty Global Shares
by
$1.0 billion
. For additional information regarding our share repurchase programs, see note 12 to our consolidated financial statements.
Liquidity of borrowing groups
The cash and cash equivalents of our borrowing groups are detailed in the table above. In addition to cash and cash equivalents, the primary sources of liquidity of our borrowing groups are cash provided by operations and borrowing availability under their respective debt instruments. For the details of the borrowing availability of such entities at
December 31, 2016
, see note
10
to our consolidated financial statements. The aforementioned sources of liquidity may be supplemented in certain cases by contributions and/or loans from
Liberty Global
and its unrestricted subsidiaries. The liquidity of our borrowing groups generally is used to fund property and equipment additions, debt service requirements and income tax payments. From time to time, our borrowing groups may also require liquidity in connection with (i) acquisitions and other investment opportunities, (ii) loans to
Liberty Global
, (iii) capital distributions to
Liberty Global
and other equity owners or (iv) the satisfaction of contingent liabilities. No assurance can be given that any external funding would be available to our borrowing groups on favorable terms, or at all. For information regarding our borrowing groups’ commitments and contingencies, see note
17
to our consolidated financial statements.
For additional information regarding our consolidated cash flows, see the discussion under
Consolidated Statements of Cash Flows
below.
Capitalization
We seek to maintain our debt at levels that provide for attractive equity returns without assuming undue risk. In this regard, we generally seek to cause our operating subsidiaries to maintain their debt at levels that result in a consolidated debt balance (excluding the
ITV Collar Loan
,
Sumitomo Collar Loan
, the
Sumitomo Share Loan
and the
Lionsgate Loan
and measured using subsidiary debt figures at swapped foreign currency exchange rates, consistent with the covenant calculation requirements of our subsidiary debt agreements) that is between four and five times our consolidated
Adjusted OIBDA
, although it should be noted that the timing of our acquisitions and financing transactions and the interplay of average and spot foreign currency rates may impact this ratio. The ratio of our
December 31, 2016
consolidated debt to our annualized consolidated
Adjusted OIBDA
for the quarter ended
December 31, 2016
was 4.8x. In addition, the ratio of our
December 31, 2016
consolidated net debt (debt, as defined above, less cash and cash equivalents) to our annualized consolidated
Adjusted OIBDA
for the quarter ended
December 31, 2016
was 4.6x. As adjusted for the cash we received on January 4, 2017 in connection with the completion of the
Dutch JV Transaction
, our consolidated net debt to our annualized consolidated
Adjusted OIBDA
for the quarter ended
December 31, 2016
would be 4.3x. The leverage ratios provided in this paragraph exclude the
Adjusted OIBDA
of
Ziggo Group Holding
, as our December 31, 2016 consolidated debt does not include the debt associated with this entity. For information on the formation of the
Dutch JV
, see note
5
.
When it is cost effective, we generally seek to match the denomination of the borrowings of our subsidiaries with the functional currency of the operations that support the respective borrowings. As further discussed under
Quantitative and Qualitative Disclosures about Market Risk
below and in note
7
to our consolidated financial statements, we also use derivative instruments to mitigate foreign currency and interest rate risk associated with our debt instruments.
Our ability to service or refinance our debt and to maintain compliance with the leverage covenants in the credit agreements and indentures of our borrowing groups is dependent primarily on our ability to maintain or increase the
Adjusted OIBDA
of our operating subsidiaries and to achieve adequate returns on our property and equipment additions and acquisitions. In addition, our ability to obtain additional debt financing is limited by the leverage covenants contained in the various debt instruments of our borrowing groups. For example, if the
Adjusted OIBDA
of
UPC Broadband Holding
were to decline, we could be required to
II-73
partially repay or limit our borrowings under the
UPC Broadband Holding Bank Facility
in order to maintain compliance with applicable covenants. No assurance can be given that we would have sufficient sources of liquidity, or that any external funding would be available on favorable terms, or at all, to fund any such required repayment. At
December 31, 2016
, each of our borrowing groups was in compliance with its debt covenants. In addition, we do not anticipate any instances of non-compliance with respect to the debt covenants of our borrowing groups that would have a material adverse impact on our liquidity during the next 12 months.
At
December 31, 2016
, the outstanding principal amount of our consolidated debt, together with our capital lease obligations, aggregated
$43.6 billion
, including
$2,775.1 million
that is classified as current in our consolidated balance sheet and
$38.5 billion
that is not due until
2021
or thereafter. For additional information concerning our debt maturities, see note
10
to our consolidated financial statements.
Notwithstanding our negative working capital position at
December 31, 2016
, we believe that we have sufficient resources to repay or refinance the current portion of our debt and capital lease obligations and to fund our foreseeable liquidity requirements during the next 12 months. However, as our maturing debt grows in later years, we anticipate that we will seek to refinance or otherwise extend our debt maturities. No assurance can be given that we will be able to complete these refinancing transactions or otherwise extend our debt maturities. In this regard, it is not possible to predict how political and economic conditions, sovereign debt concerns or any adverse regulatory developments could impact the credit and equity markets we access and, accordingly, our future liquidity and financial position. Our ability to access debt financing on favorable terms, or at all, could be adversely impacted by (i) the financial failure of any of our counterparties which could (a) reduce amounts available under committed credit facilities and (b) adversely impact our ability to access cash deposited with any failed financial institution and (ii) tightening of the credit markets. In addition, any weakness in the equity markets could make it less attractive to use our shares to satisfy contingent or other obligations, and sustained or increased competition, particularly in combination with adverse economic or regulatory developments, could have an unfavorable impact on our cash flows and liquidity.
All of our consolidated debt and capital lease obligations have been borrowed or incurred by our subsidiaries at
December 31, 2016
.
For additional information concerning our debt and capital lease obligations, see note
10
to our consolidated financial statements.
General.
Our cash flows are subject to significant variations due to
FX
. See related discussion under
Quantitative and Qualitative Disclosures about Market Risk
— Foreign Currency Risk
below.
Consolidated Statements of Cash Flows —
2016
compared to
2015
Summary.
Our consolidated statements of cash flows for
2016
and
2015
are summarized as follows:
|
Year ended December 31,
|
|||||||||||
|
2016
|
2015
|
Change
|
|||||||||
|
in millions
|
|||||||||||
|
Net cash provided by operating activities
|
$
|
5,935.5
|
|
$
|
5,705.8
|
|
$
|
229.7
|
|
||
|
Net cash used by investing activities
|
(3,917.7
|
)
|
(3,829.4
|
)
|
(88.3
|
)
|
|||||
|
Net cash used by financing activities
|
(1,385.7
|
)
|
(2,037.8
|
)
|
652.1
|
|
|||||
|
Effect of exchange rate changes on cash
|
15.0
|
|
(15.0
|
)
|
30.0
|
|
|||||
|
Net increase (decrease
)
in cash and cash equivalents
|
$
|
647.1
|
|
$
|
(176.4
|
)
|
$
|
823.5
|
|
||
II-74
Operating Activities.
Our net cash flows from operating activities are as follows:
|
Year ended December 31,
|
|||||||||||
|
|
2016
|
2015
|
Change
|
||||||||
|
|
in millions
|
||||||||||
|
Net cash provided by operating activities:
|
|||||||||||
|
Liberty Global Group
|
$
|
5,467.3
|
|
$
|
5,399.3
|
|
$
|
68.0
|
|
||
|
LiLAC Group
|
468.2
|
|
306.5
|
|
161.7
|
|
|||||
|
Total
|
$
|
5,935.5
|
|
$
|
5,705.8
|
|
$
|
229.7
|
|
||
The increase in total net cash provided by our operating activities is primarily attributable to the net effect of (i)
an increase in the cash provided by our Adjusted OIBDA and related working capital items, primarily due to the impact of the
CWC Acquisition
, (ii) a decrease in cash provided due to higher payments of interest, (iii) an increase in cash provided due to higher cash receipts related to derivative instruments and
(iv) a decrease in cash provided due to higher payments for taxes.
Investing Activities.
Our net cash flows from investing activities are as follows:
|
Year ended December 31,
|
|||||||||||
|
|
2016
|
2015
|
Change
|
||||||||
|
|
in millions
|
||||||||||
|
Net cash used by investing activities:
|
|||||||||||
|
Liberty Global Group
|
$
|
(3,475.2
|
)
|
$
|
(3,429.0
|
)
|
$
|
(46.2
|
)
|
||
|
LiLAC Group
|
(441.1
|
)
|
(490.6
|
)
|
49.5
|
|
|||||
|
Inter-group eliminations
|
(1.4
|
)
|
90.2
|
|
(91.6
|
)
|
|||||
|
Total
|
$
|
(3,917.7
|
)
|
$
|
(3,829.4
|
)
|
$
|
(88.3
|
)
|
||
The increase in total net cash used by our investing activities is primarily attributable to the
net effect of
(i) an increase in cash used of
$998.7 million
associated with higher cash paid in connection with acquisitions,
(ii) a decrease in cash used of
$858.7 million
associated with lower cash paid related to investments in and loans to affiliates and others,
(iii)
$147.3 million
of cash proceeds received from the sale of investments and (iv) an increase in cash used of
$144.8 million
due to higher capital expenditures. Capital expenditures increased from
$2,499.5 million
during
2015
to
$2,644.3 million
during
2016
due to the net effect of (a) an increase resulting from acquisitions,
(b) a decrease resulting from FX and (c) a net increase in the local currency capital expenditures of our subsidiaries, including a decrease associated with higher capital-related vendor financing.
II-75
The capital expenditures that we report in our consolidated statements of cash flows do not include amounts that are financed under capital-related vendor financing or capital lease arrangements. Instead, these amounts are reflected as non-cash additions to our property and equipment when the underlying assets are delivered and as repayments of debt when the principal is repaid. In this discussion, we refer to (i) our capital expenditures as reported in our consolidated statements of cash flows, which exclude amounts financed under capital-related vendor financing or capital lease arrangements, and (ii) our total property and equipment additions, which include our capital expenditures on an accrual basis and amounts financed under capital-related vendor financing or capital lease arrangements. For further details regarding our property and equipment additions, see note
18
to our consolidated financial statements. A reconciliation of our consolidated property and equipment additions to our consolidated capital expenditures, as reported in our consolidated statements of cash flows, is set forth below:
|
|
Year ended December 31,
|
||||||||||||||||||||||
|
|
2016
|
2015
|
|||||||||||||||||||||
|
|
Liberty Global Group
|
LiLAC Group
|
Total
|
Liberty Global Group
|
LiLAC Group
|
Total
|
|||||||||||||||||
|
in millions
|
|||||||||||||||||||||||
|
Property and equipment additions
|
$
|
4,638.6
|
|
$
|
568.2
|
|
$
|
5,206.8
|
|
$
|
3,910.2
|
|
$
|
227.1
|
|
$
|
4,137.3
|
|
|||||
|
Assets acquired under capital-related vendor financing arrangements
|
(2,018.7
|
)
|
(45.5
|
)
|
(2,064.2
|
)
|
(1,481.5
|
)
|
—
|
|
(1,481.5
|
)
|
|||||||||||
|
Assets acquired under capital leases
|
(104.2
|
)
|
(7.4
|
)
|
(111.6
|
)
|
(106.1
|
)
|
—
|
|
(106.1
|
)
|
|||||||||||
|
Changes in current liabilities related to capital expenditures
|
(361.8
|
)
|
(24.9
|
)
|
(386.7
|
)
|
(50.3
|
)
|
0.1
|
|
(50.2
|
)
|
|||||||||||
|
Capital expenditures
|
$
|
2,153.9
|
|
$
|
490.4
|
|
$
|
2,644.3
|
|
$
|
2,272.3
|
|
$
|
227.2
|
|
$
|
2,499.5
|
|
|||||
The property and equipment additions attributable to the
Liberty Global Group
are primarily related to the
European Division
, which accounted for
$4,619.1 million
and
$3,844.3 million
of
Liberty Global Group
’s property and equipment additions during
2016
and
2015
, respectively. The
increase in the
European Division
’s property and equipment additions is due to
the net effect of
(i) an increase in expenditures for new build and upgrade projects,
(ii) an increase in expenditures for support capital, such as information technology upgrades and general support systems, (iii) a decrease due to FX,
(
iv) an increase due to the impact of the
BASE Acquisition
and (v) an increase in expenditures for the purchase and installation of customer premises equipment.
During
2016
and
2015
, the
European Division
’s property and equipment additions represented
26.8%
and
22.6%
of its revenue, respectively.
Property and equipment additions attributable to the
LiLAC Group
increased
during
2016
as compared to
2015
, primarily due to
the net effect of (i) an increase due to the impact of the
CWC Acquisition
, (ii) an increase in expenditures for the purchase and installation of customer premises equipment, (iii) an increase in expenditures for new build and upgrade projects, (iv) an increase in expenditures for support capital, such as information technology upgrades and general support systems, and (v) a decrease due to FX. During
2016
and
2015
, the
LiLAC Group
’s property and equipment additions represented
20.9%
and
18.7%
of its revenue, respectively.
We expect the percentage of revenue represented by our aggregate
2017
property and equipment additions to range from 29% to 31% for the
Liberty Global Group
and 21% to 23% for the
LiLAC Group
.
The increases in these percentages, as compared to the corresponding 2016 percentages, are primarily attributable to anticipated increases in expenditures associated with the
Network Extensions
. For additional information regarding the
Network Extensions
, see
Overview
above. The actual amount of the
2017
property and equipment additions of the
Liberty Global Group
and the
LiLAC Group
may vary from expected amounts for a variety of reasons, including (a) changes in (1) the competitive or regulatory environment, (2) business plans, (3) our expected future operating results or (4) foreign currency exchange rates and (b) the availability of sufficient capital. Accordingly, no assurance can be given that our actual property and equipment additions will not vary materially from our expectations.
II-76
Financing Activities.
Our net cash flows from financing activities are as follows:
|
Year ended December 31,
|
|||||||||||
|
|
2016
|
2015
|
Change
|
||||||||
|
|
in millions
|
||||||||||
|
Net cash used by financing activities:
|
|||||||||||
|
Liberty Global Group
|
$
|
(1,634.4
|
)
|
$
|
(2,311.3
|
)
|
$
|
676.9
|
|
||
|
LiLAC Group
|
247.3
|
|
363.7
|
|
(116.4
|
)
|
|||||
|
Inter-group eliminations
|
1.4
|
|
(90.2
|
)
|
91.6
|
|
|||||
|
Total
|
$
|
(1,385.7
|
)
|
$
|
(2,037.8
|
)
|
$
|
652.1
|
|
||
The decrease in total net cash used by our financing activities is primarily attributable to the
net effect of (i)
a decrease in cash used of
$352.2 million
due to lower cash payments associated with the repurchase of Liberty Global ordinary shares,
(ii) an increase in cash used of
$212.6 million
related to lower net borrowings of debt, (iii) a decrease in cash used of
$169.4 million
due to lower payments for financing costs, debt premiums and exchange offer consideration,
(iv) a decrease in cash used of
$162.4 million
due to changes in cash collateral,
(v) a decrease in cash used of
$142.4 million
related to lower purchases of additional shares of our subsidiaries and (vi) a decrease in cash used of
$87.5 million
associated with call option contracts on Liberty Global ordinary shares.
Consolidated Statements of Cash Flows —
2015
compared to
2014
All of the cash flows discussed below are those of our continuing operations.
Summary.
Our consolidated statements of cash flows for
2015
and
2014
are summarized as follows:
|
Year ended December 31,
|
|||||||||||
|
2015
|
2014
|
Change
|
|||||||||
|
in millions
|
|||||||||||
|
Net cash provided by operating activities
|
$
|
5,705.8
|
|
$
|
5,612.8
|
|
$
|
93.0
|
|
||
|
Net cash used by investing activities
|
(3,829.4
|
)
|
(2,799.6
|
)
|
(1,029.8
|
)
|
|||||
|
Net cash used by financing activities
|
(2,037.8
|
)
|
(4,260.1
|
)
|
2,222.3
|
|
|||||
|
Effect of exchange rate changes on cash
|
(15.0
|
)
|
(81.9
|
)
|
66.9
|
|
|||||
|
Net decrease in cash and cash equivalents
|
$
|
(176.4
|
)
|
$
|
(1,528.8
|
)
|
$
|
1,352.4
|
|
||
Operating Activities.
Our net cash flows from operating activities are as follows:
|
Year ended December 31,
|
|||||||||||
|
|
2015
|
2014
|
Change
|
||||||||
|
|
in millions
|
||||||||||
|
Net cash provided by operating activities:
|
|||||||||||
|
Liberty Global Group
|
$
|
5,399.3
|
|
$
|
5,323.8
|
|
$
|
75.5
|
|
||
|
LiLAC Group
|
306.5
|
|
289.0
|
|
17.5
|
|
|||||
|
Total
|
$
|
5,705.8
|
|
$
|
5,612.8
|
|
$
|
93.0
|
|
||
The increase in total net cash provided by our operating activities is primarily attributable to the net effect of (i) an increase in the cash provided by our Adjusted OIBDA and related working capital items, largely due to the impact of the
Ziggo Acquisition
, (ii) a decrease in the reported net cash provided by operating activities due to FX, (iii) a decrease in cash provided due to higher cash payments for taxes, (iv) an increase in cash provided due to lower cash payments related to derivative instruments and (v) a decrease in cash provided due to higher cash payments for interest.
II-77
Investing Activities.
Our net cash flows from investing activities are as follows:
|
Year ended December 31,
|
|||||||||||
|
|
2015
|
2014
|
Change
|
||||||||
|
|
in millions
|
||||||||||
|
Net cash used by investing activities:
|
|||||||||||
|
Liberty Global Group
|
$
|
(3,429.0
|
)
|
$
|
(2,134.7
|
)
|
$
|
(1,294.3
|
)
|
||
|
LiLAC Group
|
(490.6
|
)
|
(232.2
|
)
|
(258.4
|
)
|
|||||
|
Inter-group eliminations
|
90.2
|
|
(432.7
|
)
|
522.9
|
|
|||||
|
Total
|
$
|
(3,829.4
|
)
|
$
|
(2,799.6
|
)
|
$
|
(1,029.8
|
)
|
||
The increase in total net cash used by our investing activities is primarily attributable to the net effect of
(i) a decrease in cash of
$988.5 million
associated with cash proceeds received during 2014 in connection with the Chellomedia Transaction,
(ii) an increase in cash used of
$312.5 million
associated with higher cash paid in connection with acquisitions and
(iii) a decrease in cash used of
$184.9 million
due to lower capital expenditures.
Capital expenditures decreased from
$2,684.4 million
during
2014
to
$2,499.5 million
during
2015
due to the net effect of (a) an increase related to the
Ziggo Acquisition
, (b) a decrease due to FX and (c) a net decrease in the local currency capital expenditures of our subsidiaries, primarily due to an increase in capital-related vendor financing during 2015 as compared to 2014.
A reconciliation of our consolidated property and equipment additions to our consolidated capital expenditures as reported in our consolidated statements of cash flows is set forth below:
|
|
Year ended December 31,
|
||||||||||||||||||||||
|
|
2015
|
2014
|
|||||||||||||||||||||
|
|
Liberty Global Group
|
LiLAC Group
|
Total
|
Liberty Global Group
|
LiLAC Group
|
Total
|
|||||||||||||||||
|
in millions
|
|||||||||||||||||||||||
|
Property and equipment additions
|
$
|
3,910.2
|
|
$
|
227.1
|
|
$
|
4,137.3
|
|
$
|
3,653.0
|
|
$
|
256.2
|
|
$
|
3,909.2
|
|
|||||
|
Assets acquired under capital-related vendor financing arrangements
|
(1,481.5
|
)
|
—
|
|
(1,481.5
|
)
|
(975.3
|
)
|
—
|
|
(975.3
|
)
|
|||||||||||
|
Assets acquired under capital leases
|
(106.1
|
)
|
—
|
|
(106.1
|
)
|
(127.2
|
)
|
—
|
|
(127.2
|
)
|
|||||||||||
|
Changes in current liabilities related to capital expenditures
|
(50.3
|
)
|
0.1
|
|
(50.2
|
)
|
(89.2
|
)
|
(33.1
|
)
|
(122.3
|
)
|
|||||||||||
|
Capital expenditures
|
$
|
2,272.3
|
|
$
|
227.2
|
|
$
|
2,499.5
|
|
$
|
2,461.3
|
|
$
|
223.1
|
|
$
|
2,684.4
|
|
|||||
The property and equipment additions attributable to the
Liberty Global Group
are primarily related to the
European Division
, which accounted for
$3,844.3 million
and
$3,648.0 million
of the
Liberty Global Group
’s property and equipment additions during
2015
and
2014
, respectively. The increase in the
European Division
’s property and equipment additions is due to the net effect of (i) a decrease due to FX, (ii) an increase due to the impact of the
Ziggo Acquisition
, (iii) an increase in expenditures for new build and upgrade projects to expand service, (iv) an increase in expenditures for support capital, such as information technology upgrades and general support systems, and (v) a decrease in expenditures for the purchase and installation of customer premises equipment. During
2015
and
2014
, the
European Division
’s property and equipment additions represented
22.6%
and
21.5%
of its revenue, respectively.
Property and equipment additions attributable to the
LiLAC Group
decreased during
2015
, as compared to
2014
, primarily due to the net effect of (i) a decrease due to FX, (ii) an increase due to the impact of the Choice Acquisition, (iii) a decrease in expenditures for support capital, such as information technology upgrades and general support systems, (iv) a decrease in expenditures for new build and upgrade projects to expand service and (v) a decrease in expenditures for the purchase and installation of customer premises equipment. During
2015
and
2014
, the
LiLAC Group
’s property and equipment additions represented
18.7%
and
21.3%
of its revenue, respectively.
II-78
Financing Activities.
Our net cash flows from financing activities are as follows:
|
Year ended December 31,
|
|||||||||||
|
|
2015
|
2014
|
Change
|
||||||||
|
|
in millions
|
||||||||||
|
Net cash used by financing activities:
|
|||||||||||
|
Liberty Global Group
|
$
|
(2,311.3
|
)
|
$
|
(4,574.8
|
)
|
$
|
2,263.5
|
|
||
|
LiLAC Group
|
363.7
|
|
(118.0
|
)
|
481.7
|
|
|||||
|
Inter-group eliminations
|
(90.2
|
)
|
432.7
|
|
(522.9
|
)
|
|||||
|
Total
|
$
|
(2,037.8
|
)
|
$
|
(4,260.1
|
)
|
$
|
2,222.3
|
|
||
The decrease in total net cash used by our financing activities is primarily attributable to the net effect of (i) a decrease in cash used of
$3,092.7 million
related to higher net borrowings of debt, (ii) an increase in cash used of
$735.6 million
due to higher cash payments associated with the repurchase of Liberty Global ordinary shares, (iii) a decrease in cash used of
$118.3 million
related to a decrease in purchases of additional shares of our subsidiaries, (iv) an increase in cash used of
$80.2 million
due to higher cash paid related to derivative instruments, (v) an increase in cash used of
$43.5 million
due to higher payments for financing costs, debt premiums and exchange offer consideration and (vi) an increase in cash used of
$36.6 million
associated with call option contracts on Liberty Global ordinary shares.
Adjusted Free Cash Flow
We define adjusted free cash flow as net cash provided by our operating activities, plus (i) excess tax benefits related to the exercise of share-based incentive awards, (ii) cash payments for third-party costs directly associated with successful and unsuccessful acquisitions and dispositions and (iii) expenses financed by an intermediary, less (a) capital expenditures, as reported in our consolidated statements of cash flows, (b) principal payments on amounts financed by vendors and intermediaries and (c) principal payments on capital leases (exclusive of the portions of the network lease in Belgium and the duct leases in Germany that we assumed in connection with certain acquisitions), with each item excluding any cash provided or used by our discontinued operations. We believe that our presentation of adjusted free cash flow provides useful information to our investors because this measure can be used to gauge our ability to service debt and fund new investment opportunities. Adjusted free cash flow should not be understood to represent our ability to fund discretionary amounts, as we have various mandatory and contractual obligations, including debt repayments, which are not deducted to arrive at this amount. Investors should view adjusted free cash flow as a supplement to, and not a substitute for,
U.S. GAAP
measures of liquidity included in our consolidated statements of cash flows.
II-79
The following table provides the details of our adjusted free cash flow:
|
|
Year ended December 31,
|
||||||||||||||||||||||||||||||||||
|
|
2016
|
2015
|
2014
|
||||||||||||||||||||||||||||||||
|
|
Liberty Global Group
|
LiLAC Group
|
Total
|
Liberty Global Group
|
LiLAC Group
|
Total
|
Liberty Global Group
|
LiLAC Group
|
Total
|
||||||||||||||||||||||||||
|
in millions
|
|||||||||||||||||||||||||||||||||||
|
Net cash provided by operating activities of our continuing operations
|
$
|
5,467.3
|
|
$
|
468.2
|
|
$
|
5,935.5
|
|
$
|
5,399.3
|
|
$
|
306.5
|
|
$
|
5,705.8
|
|
$
|
5,323.8
|
|
$
|
289.0
|
|
$
|
5,612.8
|
|
||||||||
|
Excess tax benefits from share-based compensation (a)
|
4.4
|
|
—
|
|
4.4
|
|
23.0
|
|
3.7
|
|
26.7
|
|
6.9
|
|
0.1
|
|
7.0
|
|
|||||||||||||||||
|
Cash payments (receipts) for direct acquisition and disposition costs
|
29.3
|
|
86.0
|
|
115.3
|
|
259.3
|
|
4.9
|
|
264.2
|
|
75.3
|
|
4.4
|
|
79.7
|
|
|||||||||||||||||
|
Expenses financed by an intermediary (b)
|
812.0
|
|
3.0
|
|
815.0
|
|
294.2
|
|
—
|
|
294.2
|
|
27.5
|
|
—
|
|
27.5
|
|
|||||||||||||||||
|
Capital expenditures
|
(2,153.9
|
)
|
(490.4
|
)
|
(2,644.3
|
)
|
(2,272.3
|
)
|
(227.2
|
)
|
(2,499.5
|
)
|
(2,461.3
|
)
|
(223.1
|
)
|
(2,684.4
|
)
|
|||||||||||||||||
|
Principal payments on amounts financed by vendors and intermediaries
|
(2,074.7
|
)
|
—
|
|
(2,074.7
|
)
|
(1,125.4
|
)
|
—
|
|
(1,125.4
|
)
|
(686.9
|
)
|
—
|
|
(686.9
|
)
|
|||||||||||||||||
|
Principal payments on certain capital leases
|
(105.5
|
)
|
(5.2
|
)
|
(110.7
|
)
|
(146.0
|
)
|
(0.8
|
)
|
(146.8
|
)
|
(182.5
|
)
|
(0.8
|
)
|
(183.3
|
)
|
|||||||||||||||||
|
Adjusted free cash flow
|
$
|
1,978.9
|
|
$
|
61.6
|
|
$
|
2,040.5
|
|
$
|
2,432.1
|
|
$
|
87.1
|
|
$
|
2,519.2
|
|
$
|
2,102.8
|
|
$
|
69.6
|
|
$
|
2,172.4
|
|
||||||||
_______________
|
(a)
|
Excess tax benefits from share-based compensation represent the excess of tax deductions over the related financial reporting share-based compensation expense. The hypothetical cash flows associated with these excess tax benefits are reported as an increase to cash flows from financing activities and a corresponding decrease to cash flows from operating activities in our consolidated statements of cash flows.
|
|
(b)
|
For purposes of our consolidated statements of cash flows, expenses financed by an intermediary are treated as hypothetical operating cash outflows and hypothetical financing cash inflows when the expenses are incurred. When we pay the financing intermediary, we record financing cash outflows in our consolidated statements of cash flows. For purposes of our adjusted free cash flow definition, we add back the hypothetical operating cash outflow when these financed expenses are incurred and deduct the financing cash outflows when we pay the financing intermediary.
|
II-80
Contractual Commitments
The following table sets forth the
U.S.
dollar equivalents of our commitments as of
December 31, 2016
:
|
|
Payments due during:
|
||||||||||||||||||||||||||
|
2017
|
2018
|
2019
|
2020
|
2021
|
Thereafter
|
Total
|
|||||||||||||||||||||
|
|
in millions
|
||||||||||||||||||||||||||
|
Debt (excluding interest)
|
$
|
2,969.4
|
|
$
|
1,169.5
|
|
$
|
556.0
|
|
$
|
201.4
|
|
$
|
3,530.9
|
|
$
|
34,105.0
|
|
$
|
42,532.2
|
|
||||||
|
Capital leases (excluding interest)
|
133.4
|
|
113.7
|
|
87.4
|
|
80.1
|
|
79.3
|
|
748.9
|
|
1,242.8
|
|
|||||||||||||
|
Network and connectivity commitments
|
738.8
|
|
386.9
|
|
308.9
|
|
257.4
|
|
240.6
|
|
868.2
|
|
2,800.8
|
|
|||||||||||||
|
Programming commitments
|
1,041.2
|
|
900.5
|
|
457.2
|
|
183.5
|
|
62.1
|
|
93.1
|
|
2,737.6
|
|
|||||||||||||
|
Purchase commitments
|
1,236.9
|
|
212.6
|
|
145.9
|
|
102.6
|
|
21.0
|
|
70.3
|
|
1,789.3
|
|
|||||||||||||
|
Operating leases
|
133.5
|
|
113.2
|
|
94.0
|
|
73.8
|
|
60.7
|
|
249.0
|
|
724.2
|
|
|||||||||||||
|
Other commitments
|
46.7
|
|
15.0
|
|
12.2
|
|
8.5
|
|
7.4
|
|
14.4
|
|
104.2
|
|
|||||||||||||
|
Total (a)
|
$
|
6,299.9
|
|
$
|
2,911.4
|
|
$
|
1,661.6
|
|
$
|
907.3
|
|
$
|
4,002.0
|
|
$
|
36,148.9
|
|
$
|
51,931.1
|
|
||||||
|
Projected cash interest payments on debt and capital lease obligations (b):
|
|||||||||||||||||||||||||||
|
Liberty Global Group
|
$
|
1,749.5
|
|
$
|
1,673.5
|
|
$
|
1,659.8
|
|
$
|
1,654.8
|
|
$
|
1,585.6
|
|
$
|
4,895.5
|
|
$
|
13,218.7
|
|
||||||
|
LiLAC Group
|
385.9
|
|
380.6
|
|
377.8
|
|
359.0
|
|
309.8
|
|
389.1
|
|
2,202.2
|
|
|||||||||||||
|
Total
|
$
|
2,135.4
|
|
$
|
2,054.1
|
|
$
|
2,037.6
|
|
$
|
2,013.8
|
|
$
|
1,895.4
|
|
$
|
5,284.6
|
|
$
|
15,420.9
|
|
||||||
_______________
|
(a)
|
The commitments included in this table do not reflect any liabilities that are included in our
December 31, 2016
consolidated balance sheet other than debt and capital lease obligations. Our liability for uncertain tax positions in the various jurisdictions in which we operate (
$358.9 million
at
December 31, 2016
) has been excluded from the table as the amount and timing of any related payments are not subject to reasonable estimation.
|
|
(b)
|
Amounts are based on interest rates, interest payment dates, commitment fees and contractual maturities in effect as of
December 31, 2016
. These amounts are presented for illustrative purposes only and will likely differ from the actual cash payments required in future periods. In addition, the amounts presented do not include the impact of our interest rate derivative contracts, deferred financing costs, original issue premiums or discounts.
|
For information concerning our debt and capital lease obligations, see note
10
to our consolidated financial statements. For information concerning our commitments, see note
17
to our consolidated financial statements.
In addition to the commitments set forth in the table above, we have significant commitments under (i) derivative instruments and (ii) defined benefit plans and similar agreements, pursuant to which we expect to make payments in future periods. For information regarding projected cash flows associated with these derivative instruments, see
Quantitative and Qualitative Disclosures about Market Risk — Projected Cash Flows Associated with Derivatives
below
.
For information regarding our derivative instruments, including the net cash paid or received in connection with these instruments during
2016
,
2015
and
2014
, see note
7
to our consolidated financial statements. For information concerning our defined benefit plans, see note
15
to our consolidated financial statements.
II-81
Critical Accounting Policies, Judgments and Estimates
In connection with the preparation of our consolidated financial statements, we make estimates and assumptions that affect the reported amounts of assets and liabilities, revenue and expenses and related disclosure of contingent assets and liabilities. Critical accounting policies are defined as those policies that are reflective of significant judgments, estimates and uncertainties, which would potentially result in materially different results under different assumptions and conditions. We believe the following accounting policies are critical in the preparation of our consolidated financial statements because of the judgment necessary to account for these matters and the significant estimates involved, which are susceptible to change:
|
•
|
Impairment of property and equipment and intangible assets (including goodwill);
|
|
•
|
Costs associated with construction and installation activities;
|
|
•
|
Useful lives of long-lived assets;
|
|
•
|
Fair value measurements; and
|
|
•
|
Income tax accounting.
|
We have discussed the selection of the aforementioned critical accounting policies with the audit committee of our board of directors. For additional information concerning our significant accounting policies, see note
3
to our consolidated financial statements.
Impairment of Property and Equipment and Intangible Assets
Carrying Value.
The aggregate carrying value of our property and equipment and intangible assets (including goodwill) that was held for use comprised
71.0%
of our total assets at
December 31, 2016
.
When circumstances warrant, we review the carrying amounts of our property and equipment and our intangible assets (other than goodwill and other indefinite-lived intangible assets) to determine whether such carrying amounts continue to be recoverable. Such changes in circumstance may include (i) an expectation of a sale or disposal of a long-lived asset or asset group, (ii) adverse changes in market or competitive conditions, (iii) an adverse change in legal factors or business climate in the markets in which we operate and (iv) operating or cash flow losses. For purposes of impairment testing, long-lived assets are grouped at the lowest level for which cash flows are largely independent of other assets and liabilities, generally at or below the reporting unit level (see below). If the carrying amount of the asset or asset group is greater than the expected undiscounted cash flows to be generated by such asset or asset group, an impairment adjustment is recognized. Such adjustment is measured by the amount that the carrying value of such asset or asset group exceeds its fair value. We generally measure fair value by considering (a) sale prices for similar assets, (b) discounted estimated future cash flows using an appropriate discount rate and/or (c) estimated replacement cost. Assets to be disposed of are recorded at the lower of their carrying amount or fair value less costs to sell.
We evaluate goodwill and other indefinite-lived intangible assets (primarily cable television franchise rights) for impairment at least annually on October 1 and whenever facts and circumstances indicate that their carrying amounts may not be recoverable. For impairment evaluations with respect to both goodwill and other indefinite-lived intangibles, we first make a qualitative assessment to determine if the goodwill or other indefinite-lived intangible may be impaired. In the case of goodwill, if it is more-likely-than-not that a reporting unit’s fair value is less than its carrying value, we then compare the fair value of the reporting unit to its respective carrying amount. A reporting unit is an operating segment or one level below an operating segment (referred to as a “component”). If the carrying value of a reporting unit were to exceed its fair value, we would then compare the implied fair value of the reporting unit’s goodwill to its carrying amount, and any excess of the carrying amount over the fair value would be charged to operations as an impairment loss. With respect to other indefinite-lived intangible assets, if it is more-likely-than-not that the fair value of an indefinite-lived intangible asset is less than its carrying value, we then estimate its fair value and any excess of the carrying value over the fair value is also charged to operations as an impairment loss.
When required, considerable management judgment is necessary to estimate the fair value of reporting units and underlying long-lived and indefinite-lived assets. The equity of one of our reporting units,
Telenet
, is publicly traded in an active market. For this reporting unit, our fair value determination is based on quoted market prices. For other reporting units, we typically determine fair value using an income-based approach (discounted cash flows) based on assumptions in our long-range business plans and, in some cases, a combination of an income-based approach and a market-based approach. With respect to our discounted cash flow analysis used in the income-based approach, the timing and amount of future cash flows under these business plans require estimates of, among other items, subscriber growth and retention rates, rates charged per product, expected gross margins and
Adjusted OIBDA
margins and expected property and equipment additions. The development of these cash flows, and the discount rate applied to the cash flows, is subject to inherent uncertainties, and actual results could vary significantly from such estimates.
II-82
Our determination of the discount rate is based on a weighted average cost of capital approach, which uses a market participant’s cost of equity and after-tax cost of debt and reflects the risks inherent in the cash flows. Based on the results of our
2016
qualitative assessment of our reporting unit carrying values, we determined that it was more-likely-than-not that fair value exceeded carrying value for all of our reporting units.
During the three years ended
December 31, 2016
, the most significant impairment charge that we recorded with respect to our property and equipment and intangible assets was the
$68.7 million
impairment charge that we recorded during the fourth quarter of 2014 to reduce the carrying amount of certain of
Ziggo
’s internal-use software assets. For additional information, see note
9
to our consolidated financial statements.
Based on the results of our October 1, 2016 goodwill impairment test, a hypothetical decline of 20% or more in the fair value of any of
CWC
’s reporting units could result in the need to record a goodwill impairment charge. At December 31, 2016, the aggregate goodwill associated with the
CWC
reporting units was
$5.5 billion
. If, among other factors, (i) the equity values of the
LiLAC Group
were to remain depressed or decline further or (ii) the adverse impacts of economic, competitive, regulatory or other factors were to cause our results of operations or cash flows to be worse than anticipated, we could conclude in future periods that impairment charges are required in order to reduce the carrying values of our goodwill and, to a lesser extent, other long-lived assets. Any such impairment charges could be significant.
Costs Associated with Construction and Installation Activities
We capitalize costs associated with the construction of new cable and mobile transmission and distribution facilities and the installation of new cable services. Installation activities that are capitalized include (i) the initial connection (or drop) from our cable system to a customer location, (ii) the replacement of a drop and (iii) the installation of equipment for additional services, such as digital cable, telephone or broadband internet service. The costs of other customer-facing activities, such as reconnecting customer locations where a drop already exists, disconnecting customer locations and repairing or maintaining drops, are expensed as incurred.
The nature and amount of labor and other costs to be capitalized with respect to construction and installation activities involves significant judgment. In addition to direct external and internal labor and materials, we also capitalize other costs directly attributable to our construction and installation activities, including dispatch costs, quality-control costs, vehicle-related costs and certain warehouse-related costs. The capitalization of these costs is based on time sheets, time studies, standard costs, call tracking systems and other verifiable means that directly link the costs incurred with the applicable capitalizable activity. We continuously monitor the appropriateness of our capitalization policies and update the policies when necessary to respond to changes in facts and circumstances, such as the development of new products and services and changes in the manner that installations or construction activities are performed.
Useful Lives of Long-Lived Assets
We depreciate our property and equipment on a straight-line basis over the estimated useful lives of the assets. The determination of the useful lives of property and equipment requires significant management judgment, based on factors such as the estimated physical lives of the assets, technological changes, changes in anticipated use, legal and economic factors, rebuild and equipment swap-out plans, and other factors. Our intangible assets with finite lives primarily consist of customer relationships. Customer relationship intangible assets are amortized on a straight-line basis over the estimated weighted average life of the customer relationships. The determination of the estimated useful life of customer relationship intangible assets requires significant management judgment and is primarily based on historical and forecasted subscriber disconnect rates, adjusted when necessary for risk associated with demand, competition, technological changes and other economic factors. We regularly review whether changes to estimated useful lives are required in order to accurately reflect the economic use of our property and equipment and intangible assets with finite lives. Any changes to estimated useful lives are reflected prospectively. Our depreciation and amortization expense during
2016
,
2015
and
2014
was
$5,801.1 million
,
$5,825.8 million
and
$5,500.1 million
, respectively. A 10% increase in the aggregate amount of our depreciation and amortization expense during
2016
would have resulted in a
$580.1 million
or
20.7%
decrease in our
2016
operating income.
Fair Value Measurements
U.S. GAAP
provides guidance with respect to the recurring and nonrecurring fair value measurements and for a fair value hierarchy that prioritizes the inputs to valuation techniques used to measure fair value into three broad levels. Level 1 inputs are quoted market prices in active markets for identical assets or liabilities that the reporting entity has the ability to access at the measurement date. Level 2 inputs are inputs other than quoted market prices included within Level 1 that are observable for the asset or liability, either directly or indirectly. Level 3 inputs are unobservable inputs for the asset or liability.
II-83
Recurring Valuations.
We perform recurring fair value measurements with respect to our derivative instruments, our fair value method investments and certain instruments that we classify as debt, each of which are carried at fair value. We use (i) cash flow valuation models to determine the fair values of our interest rate and foreign currency derivative instruments and (ii) a binomial option pricing model to determine the fair values of our equity-related derivative instruments. We use quoted market prices when available and, when not available, we use a combination of an income approach (discounted cash flows) and a market approach (market multiples of similar businesses) to determine the fair value of our fair value method investments. For a detailed discussion of the inputs we use to determine the fair value of our derivative instruments and fair value method investments, see note
8
to our consolidated financial statements. See also notes
6
and
7
to our consolidated financial statements for information concerning our fair value method investments and derivative instruments, respectively.
Changes in the fair values of our derivative instruments, fair value method investments and certain instruments that we classify as debt have had, and we believe will continue to have, a significant and volatile impact on our results of operations. During
2016
,
2015
and
2014
, we recognized net gains of
$383.6 million
,
$971.7 million
and
$294.0 million
, respectively, attributable to changes in the fair values of these items.
As further described in note
8
to our consolidated financial statements, actual amounts received or paid upon the settlement or disposition of these investments and instruments may differ materially from the recorded fair values at
December 31, 2016
.
For information concerning the sensitivity of the fair value of certain of our more significant derivative instruments to changes in market conditions, see
Quantitative and Qualitative Disclosures About Market Risk — Sensitivity Information
below.
Nonrecurring Valuations.
Our nonrecurring valuations are primarily associated with (i) the application of acquisition accounting and (ii) impairment assessments, both of which require that we make fair value determinations as of the applicable valuation date. In making these determinations, we are required to make estimates and assumptions that affect the recorded amounts, including, but not limited to, expected future cash flows, market comparables and discount rates, remaining useful lives of long-lived assets, replacement or reproduction costs of property and equipment and the amounts to be recovered in future periods from acquired net operating losses and other deferred tax assets. To assist us in making these fair value determinations, we may engage third-party valuation specialists. Our estimates in this area impact, among other items, the amount of depreciation and amortization, impairment charges and income tax expense or benefit that we report. Our estimates of fair value are based upon assumptions we believe to be reasonable, but which are inherently uncertain. A significant portion of our long-lived assets were initially recorded through the application of acquisition accounting and all of our long-lived assets are subject to impairment assessments. For additional information, including the specific weighted average discount rates that we used to complete certain nonrecurring valuations, see note
8
to our consolidated financial statements. For information regarding our acquisitions and long-lived assets, see notes
4
and
9
to our consolidated financial statements, respectively.
Income Tax Accounting
We are required to estimate the amount of tax payable or refundable for the current year and the deferred tax assets and liabilities for the future tax consequences attributable to differences between the financial statement carrying amounts and income tax basis of assets and liabilities and the expected benefits of utilizing net operating loss and tax credit carryforwards, using enacted tax rates in effect for each taxing jurisdiction in which we operate for the year in which those temporary differences are expected to be recovered or settled. This process requires our management to make assessments regarding the timing and probability of the ultimate tax impact of such items.
Net deferred tax assets are reduced by a valuation allowance if we believe it more-likely-than-not such net deferred tax assets will not be realized. Establishing or reducing a tax valuation allowance requires us to make assessments about the timing of future events, including the probability of expected future taxable income and available tax planning strategies. At
December 31, 2016
, the aggregate valuation allowance provided against deferred tax assets was
$6,015.4 million
. The actual amount of deferred income tax benefits realized in future periods will likely differ from the net deferred tax assets reflected in our
December 31, 2016
consolidated balance sheet due to, among other factors, possible future changes in income tax law or interpretations thereof in the jurisdictions in which we operate and differences between estimated and actual future taxable income. Any such factors could have a material effect on our current and deferred tax positions as reported in our consolidated financial statements. A high degree of judgment is required to assess the impact of possible future outcomes on our current and deferred tax positions.
Tax laws in jurisdictions in which we have a presence are subject to varied interpretation, and many tax positions we take are subject to significant uncertainty regarding whether the position will be ultimately sustained after review by the relevant tax authority. We recognize the financial statement effects of a tax position when it is more-likely-than-not, based on technical merits, that the position will be sustained upon examination. The determination of whether the tax position meets the more-likely-than-not threshold requires a facts-based judgment using all information available. In a number of cases, we have concluded that the
II-84
more-likely-than-not threshold is not met and, accordingly, the amount of tax benefit recognized in our consolidated financial statements is different than the amount taken or expected to be taken in our tax returns. As of
December 31, 2016
, the amount of unrecognized tax benefits for financial reporting purposes, but taken or expected to be taken in our tax returns, was
$501.1 million
, of which
$438.3 million
would have a favorable impact on our effective income tax rate if ultimately recognized, after considering amounts that we would expect to be offset by valuation allowances.
We are required to continually assess our tax positions, and the results of tax examinations or changes in judgment can result in substantial changes to our unrecognized tax benefits.
We have taxable outside basis differences on certain investments in non-
U.S.
subsidiaries. We do not recognize the deferred tax liabilities associated with these outside basis differences when the difference is considered essentially permanent in duration. In order to be considered essentially permanent in duration, sufficient evidence must indicate that the foreign subsidiary has invested or will invest its undistributed earnings indefinitely, or that earnings will be remitted in a tax-free liquidation. If circumstances change and it becomes apparent that some or all of the undistributed earnings will be remitted on a taxable basis in the foreseeable future, a net deferred tax liability must be recorded for some or all of the outside basis difference. The assessment of whether these outside basis differences are considered permanent in nature requires significant judgment and is based on management’s intentions to reinvest the earnings of a foreign subsidiary indefinitely in light of anticipated liquidity requirements and other relevant factors. At
December 31, 2016
, income and withholding taxes for which a net deferred tax liability might otherwise be required have not been provided on an estimated
$6.9 billion
of cumulative temporary differences on non-
U.S.
entities, including cumulative translation adjustments. If our plans or intentions change in the future due to liquidity or other relevant considerations, we could decide that it would be prudent to repatriate significant funds or other assets from one or more of our subsidiaries, even though we would incur a tax liability in connection with any such repatriation. If our plans or intentions were to change in this manner, the recognition of all or a part of these outside basis differences could have an adverse impact on our consolidated results of operations.
For additional information concerning our income taxes, see note
11
to our consolidated financial statements.
II-85
|
Item 7A
|
.
QUANTITATIVE AND QUALITATIVE DISCLOSURES ABOUT MARKET RISK
|
We are exposed to market risk in the normal course of our business operations due to our investments in various foreign countries and ongoing investing and financing activities. Market risk refers to the risk of loss arising from adverse changes in foreign currency exchange rates, interest rates and stock prices. The risk of loss can be assessed from the perspective of adverse changes in fair values, cash flows and future earnings. As further described below, we have established policies, procedures and processes governing our management of market risks and the use of derivative instruments to manage our exposure to such risks.
Cash and Investments
We invest our cash in highly liquid instruments that meet high credit quality standards. We are exposed to exchange rate risk to the extent that the denominations of our cash and cash equivalent balances, revolving lines of credit and other short-term sources of liquidity do not correspond to the denominations of our and our subsidiaries’ short-term liquidity requirements. In order to mitigate this risk, we actively manage the denominations of our cash balances in light of our and our subsidiaries’ forecasted liquidity requirements. At
December 31, 2016
,
$1,022.4 million
or
62.8%
,
$298.9 million
or
18.3%
, and
$268.2 million
or
16.5%
of our consolidated cash balances were denominated in
U.S. dollars
,
British pounds sterling
and
euros
, respectively.
We are exposed to market price fluctuations related to our investments in
ITV
,
Sumitomo
and
Lionsgate
shares. At
December 31, 2016
, the aggregate fair value of these investments was
$1,015.4 million
,
$538.4 million
and
$128.6 million
, respectively. All of our
ITV
shares are held through the
ITV Collar
, and a portion of our
Lionsgate
shares are held through the
Lionsgate Forward
. In addition, 60% of our
Sumitomo
shares are held through the
Sumitomo Collar
and 40% of our
Sumitomo
shares secure the
Sumitomo Share Loan
. For information concerning the terms of (i) the
ITV Collar
and
ITV Collar Loan
, (ii) the
Sumitomo Collar
,
Sumitomo Collar Loan
and
Sumitomo Share Loan
and (iii) the
Lionsgate Forward
and
Lionsgate Loan
, see note
7
to our consolidated financial statements. For those shares that are held through the
ITV Collar
, the
Sumitomo Collar
and the
Lionsgate Forward
and the Sumitomo shares that secure the
Sumitomo Share Loan
, our exposure to market risk is limited. For additional information concerning our investments in
ITV
,
Sumitomo
and
Lionsgate
shares, see note
6
to our consolidated financial statements.
Foreign Currency Risk
We are exposed to foreign currency exchange rate risk with respect to our consolidated debt in situations where our debt is denominated in a currency other than the functional currency of the operations whose cash flows support our ability to repay or refinance such debt. Although we generally seek to match the denomination of our and our subsidiaries’ borrowings with the functional currency of the operations that are supporting the respective borrowings, market conditions or other factors may cause us to enter into borrowing arrangements that are not denominated in the functional currency of the underlying operations (unmatched debt). In these cases, our policy is to provide for an economic hedge against foreign currency exchange rate movements by using derivative instruments to synthetically convert unmatched debt into the applicable underlying currency. At
December 31, 2016
, substantially all of our debt was either directly or synthetically matched to the applicable functional currencies of the underlying operations. For additional information concerning the terms of our derivative instruments, see note
7
to our consolidated financial statements.
In addition to the exposure that results from the mismatch of our borrowings and underlying functional currencies, we are exposed to foreign currency risk to the extent that we enter into transactions denominated in currencies other than our or our subsidiaries’ respective functional currencies (non-functional currency risk), such as equipment purchases, programming contracts, notes payable and notes receivable (including intercompany amounts). Changes in exchange rates with respect to amounts recorded in our consolidated balance sheets related to these items will result in unrealized (based upon period-end exchange rates) or realized foreign currency transaction gains and losses upon settlement of the transactions. Moreover, to the extent that our revenue, costs and expenses are denominated in currencies other than our respective functional currencies, we will experience fluctuations in our revenue, costs and expenses solely as a result of changes in foreign currency exchange rates.
In this regard, excluding CWC, we currently expect that during
2017
, (i)
less than 1% of our revenue,
(ii)
approximately 1% to 3% of our direct costs of services and our other operating and SG&A expenses (exclusive of share-based compensation expense) and
(iii)
approximately 10% to 12% of our property and equipment additions will be denominated in non-functional currencies, including amounts denominated in U.S. dollars, euros and British pound sterling.
Our expectations with respect to our non-functional currency transactions in 2017 may differ from actual results.
Generally, we will consider hedging non-functional currency risks when the risks arise from agreements with third parties that involve the future payment or receipt of cash or other monetary items to the extent that we can reasonably predict the timing and amount of such payments or receipts and the payments or receipts are not otherwise hedged. In this regard, we have entered into foreign currency forward contracts to hedge certain of these risks. Certain non-functional currency risks related to our revenue, direct costs of services and other operating and SG&A expenses and property and equipment additions were not hedged as of
December 31, 2016
. For additional information concerning our foreign currency forward contracts, see note
7
to our consolidated financial statements.
II-86
We also are exposed to unfavorable and potentially volatile fluctuations of the
U.S.
dollar (our reporting currency) against the currencies of our operating subsidiaries when their respective financial statements are translated into
U.S.
dollars for inclusion in our consolidated financial statements. Cumulative translation adjustments are recorded in accumulated other comprehensive earnings or loss
as a separate component of equity. Any increase (decrease) in the value of the
U.S.
dollar against any foreign currency that is the functional currency of one of our operating subsidiaries will cause us to experience unrealized foreign currency translation losses (gains) with respect to amounts already invested in such foreign currencies. Accordingly, we may experience a negative impact on our comprehensive earnings or loss and equity with respect to our holdings solely as a result of
FX
. Our primary exposure to FX risk
during the three months ended December 31, 2016 was to the euro and British pound sterling as 43.2% and 27.5% of our reported revenue during the period was derived from subsidiaries whose functional currencies are the euro and British pound sterling, respectively.
In addition, our reported operating results are impacted by changes in the exchange rates for the Swiss franc, the Chilean peso and other local currencies in Europe. We generally do not hedge against the risk that we may incur non-cash losses upon the translation of the financial statements of our subsidiaries and affiliates into
U.S.
dollars. For information regarding certain currency instability risks with respect to the British pound sterling and euro, see
Management’s Discussion and Analysis of Financial Condition and Results of Operations — Overview
above.
The relationship between (i) the euro, the British pound sterling, the Swiss franc, the Hungarian forint, the Polish zloty, the Czech koruna, the Romanian lei, the Chilean peso and the Jamaican dollar and (ii) the
U.S.
dollar, which is our reporting currency, is shown below, per one
U.S.
dollar:
|
As of December 31,
|
|||||
|
2016
|
2015
|
||||
|
Spot rates:
|
|||||
|
Euro
|
0.9481
|
|
0.9203
|
|
|
|
British pound sterling
|
0.8100
|
|
0.6787
|
|
|
|
Swiss franc
|
1.0172
|
|
0.9997
|
|
|
|
Hungarian forint
|
293.29
|
|
290.85
|
|
|
|
Polish zloty
|
4.1769
|
|
3.9286
|
|
|
|
Czech koruna
|
25.623
|
|
24.867
|
|
|
|
Romanian lei
|
4.3077
|
|
4.1604
|
|
|
|
Chilean peso
|
670.23
|
|
708.60
|
|
|
|
Jamaican dollar
|
128.77
|
|
119.95
|
|
|
|
|
Year ended December 31,
|
|||||||
|
|
2016
|
2015
|
2014
|
|||||
|
Average rates:
|
||||||||
|
Euro
|
0.9035
|
|
0.9009
|
|
0.7537
|
|
||
|
British pound sterling
|
0.7407
|
|
0.6545
|
|
0.6074
|
|
||
|
Swiss franc
|
0.9852
|
|
0.9630
|
|
0.9152
|
|
||
|
Hungarian forint
|
281.52
|
|
279.39
|
|
232.73
|
|
||
|
Polish zloty
|
3.9441
|
|
3.7717
|
|
3.1553
|
|
||
|
Czech koruna
|
24.437
|
|
24.593
|
|
20.758
|
|
||
|
Romanian lei
|
4.0594
|
|
4.0079
|
|
3.3494
|
|
||
|
Chilean peso
|
676.21
|
|
654.71
|
|
570.76
|
|
||
|
Jamaican dollar
|
125.13
|
|
116.52
|
|
110.91
|
|
||
Inflation and Foreign Investment Risk
We are subject to inflationary pressures with respect to labor, programming and other costs. While we attempt to increase our revenue to offset increases in costs, there is no assurance that we will be able to do so. Therefore, costs could rise faster than associated revenue, thereby resulting in a negative impact on our operating results, cash flows and liquidity. The economic environment in the respective countries in which we operate is a function of government, economic, fiscal and monetary policies
II-87
and various other factors beyond our control that could lead to inflation. We are unable to predict the extent that price levels might be impacted in future periods by the current state of the economies in the countries in which we operate.
Interest Rate Risks
We are exposed to changes in interest rates primarily as a result of our borrowing activities, which include fixed-rate and variable-rate borrowings by our borrowing groups. Our primary exposure to variable-rate debt is through the EURIBOR-indexed and LIBOR-indexed debt of
UPC Broadband Holding
,
Virgin Media
and
Telenet
, the EURIBOR-indexed debt of
Unitymedia
, the LIBOR-indexed debt of
CWC
and the variable-rate debt of certain of our other subsidiaries.
In general, we seek to enter into derivative instruments to protect against increases in the interest rates on our variable-rate debt. Accordingly, we have entered into various derivative transactions to reduce exposure to increases in interest rates. We use interest rate derivative contracts to exchange, at specified intervals, the difference between fixed and variable interest rates calculated by reference to an agreed-upon notional principal amount. We also use interest rate cap and collar agreements that lock in a maximum interest rate if variable rates rise, but also allow our company to benefit, to a limited extent in the case of collars, from declines in market rates. At
December 31, 2016
, we effectively paid a fixed interest rate on 96% of our total debt. The final maturity dates of our various portfolios of interest rate derivative instruments generally fall short of the respective maturities of the underlying variable-rate debt. In this regard, we use judgment to determine the appropriate maturity dates of our portfolios of interest rate derivative instruments, taking into account the relative costs and benefits of different maturity profiles in light of current and expected future market conditions, liquidity issues and other factors. For additional information concerning the terms of these interest rate derivative instruments, see note
7
to our consolidated financial statements.
Weighted Average Variable Interest Rate.
At
December 31, 2016
, the outstanding principal amount of our variable-rate indebtedness aggregated $15.0 billion, and the weighted average interest rate (including margin) on such variable-rate indebtedness was approximately 3.8%, excluding the effects of interest rate derivative contracts, deferred financing costs, original issue premiums or discounts and commitment fees, all of which affect our overall cost of borrowing. Assuming no change in the amount outstanding, and without giving effect to any interest rate derivative contracts, deferred financing costs, original issue premiums or discounts and commitment fees, a hypothetical 50 basis point (0.50%) increase (decrease) in our weighted average variable interest rate would increase (decrease) our annual consolidated interest expense and cash outflows by $75.0 million. As discussed above and in note
7
to our consolidated financial statements, we use interest rate derivative contracts to manage our exposure to increases in variable interest rates. In this regard, increases in the fair value of these contracts generally would be expected to offset most of the economic impact of increases in the variable interest rates applicable to our indebtedness to the extent and during the period that principal amounts are matched with interest rate derivative contracts.
Counterparty Credit Risk
We are exposed to the risk that the counterparties to the derivative instruments, undrawn debt facilities and cash investments of our subsidiary borrowing groups will default on their obligations to us. We manage these credit risks through the evaluation and monitoring of the creditworthiness of, and concentration of risk with, the respective counterparties. In this regard, credit risk associated with our derivative instruments and undrawn debt facilities is spread across a relatively broad counterparty base of banks and financial institutions. With the exception of a limited number of instances where we have required a counterparty to post collateral, neither party has posted collateral under the derivative instruments of our subsidiary borrowing groups. Collateral is generally not posted by either party under the derivative instruments of our subsidiary borrowing groups. Most of our cash currently is invested in either (i) AAA credit rated money market funds, including funds that invest in government obligations, or (ii) overnight deposits with banks having a minimum credit rating of A by Standard & Poor’s or an equivalent rating by Moody’s Investor Service. To date, neither the access to nor the value of our cash and cash equivalent balances have been adversely impacted by liquidity problems of financial institutions.
At
December 31, 2016
, our exposure to counterparty credit risk included (i) derivative assets with an aggregate fair value of
$2,424.6 million
, (ii) cash and cash equivalent and restricted cash balances of
$1,668.3 million
and (iii) aggregate undrawn debt facilities of
$3,969.2 million
.
Each of our subsidiary borrowing groups have entered into derivative instruments under master agreements with each counterparty that contain master netting arrangements that are applicable in the event of early termination by either party to such derivative instrument. The master netting arrangements under each of these master agreements are limited to the derivative instruments governed by the relevant master agreement within each individual borrowing group and are independent of similar arrangements of our other subsidiary borrowing groups.
II-88
Under our derivative contracts, it is generally only the non-defaulting party that has a contractual option to exercise early termination rights upon the default of the other counterparty and to set off other liabilities against sums due upon such termination. However, in an insolvency of a derivative counterparty, under the laws of certain jurisdictions, the defaulting counterparty or its insolvency representatives may be able to compel the termination of one or more derivative contracts and trigger early termination payment liabilities payable by us, reflecting any mark-to-market value of the contracts for the counterparty. Alternatively, or in addition, the insolvency laws of certain jurisdictions may require the mandatory set off of amounts due under such derivative contracts against present and future liabilities owed to us under other contracts between us and the relevant counterparty. Accordingly, it is possible that we may be subject to obligations to make payments, or may have present or future liabilities owed to us partially or fully discharged by set off as a result of such obligations, in the event of the insolvency of a derivative counterparty, even though it is the counterparty that is in default and not us. To the extent that we are required to make such payments, our ability to do so will depend on our liquidity and capital resources at the time. In an insolvency of a defaulting counterparty, we will be an unsecured creditor in respect of any amount owed to us by the defaulting counterparty, except to the extent of the value of any collateral we have obtained from that counterparty.
In addition, where a counterparty is in financial difficulty, under the laws of certain jurisdictions, the relevant regulators may be able to (i) compel the termination of one or more derivative instruments, determine the settlement amount and/or compel, without any payment, the partial or full discharge of liabilities arising from such early termination that are payable by the relevant counterparty or (ii) transfer the derivative instruments to an alternative counterparty.
While we currently have no specific concerns about the creditworthiness of any counterparty for which we have material credit risk exposures, the current economic conditions and uncertainties in global financial markets have increased the credit risk of our counterparties and we cannot rule out the possibility that one or more of our counterparties could fail or otherwise be unable to meet its obligations to us. Any such instance could have an adverse effect on our cash flows, results of operations, financial condition and/or liquidity.
Although we actively monitor the creditworthiness of our key vendors, the financial failure of a key vendor could disrupt our operations and have an adverse impact on our revenue and cash flows.
Sensitivity Information
Information concerning the sensitivity of the fair value of certain of our more significant derivative instruments to changes in market conditions is set forth below. The potential changes in fair value set forth below do not include any amounts associated with the remeasurement of the derivative asset or liability into the applicable functional currency. For additional information, see notes
7
and
8
to our consolidated financial statements.
Virgin Media
Cross-currency and Interest Rate Derivative Contracts
Holding all other factors constant, at
December 31, 2016
:
|
(i)
|
an instantaneous increase (decrease) of 10% in the value of the British pound sterling relative to the
U.S.
dollar would have decreased (increased) the aggregate fair value of the
Virgin Media
cross-currency and interest rate derivative contracts by approximately
£821 million
(
$1,014 million
);
|
|
(ii)
|
an instantaneous increase (decrease) in the relevant base rate of 50 basis points (0.50%) would have increased (decreased) the aggregate fair value of the
Virgin Media
cross-currency and interest rate derivative contracts by approximately
£120 million
(
$148 million
); and
|
|
(iii)
|
an instantaneous increase (decrease) of 10% in the value of the euro relative to the
U.S.
dollar would have decreased (increased) the aggregate fair value of the
Virgin Media
cross-currency derivative contracts by approximately
£38 million
(
$47 million
).
|
UPC Broadband Holding
Cross-currency and Interest Rate Derivative Contracts
Holding all other factors constant, at
December 31, 2016
:
|
(i)
|
an instantaneous increase (decrease) of 10% in the value of the Swiss franc, Polish zloty, Hungarian forint, Czech koruna and Romanian lei relative to the euro would have decreased (increased) the aggregate fair value of the
UPC Broadband Holding
cross-currency and interest rate derivative contracts by approximately
€511 million
(
$539 million
);
|
II-89
|
(ii)
|
an instantaneous increase (decrease) of 10% in the value of the euro relative to the
U.S.
dollar would have decreased (increased) the aggregate fair value of the
UPC Broadband Holding
cross-currency and interest rate derivative contracts by approximately
€241 million
(
$254 million
);
|
|
(iii)
|
an instantaneous increase (decrease) of 10% in the value of the Swiss franc relative to the
U.S.
dollar would have decreased (increased) the aggregate fair value of the
UPC Broadband Holding
cross-currency and interest rate derivative contracts by approximately
€76 million
(
$80 million
); and
|
|
(iv)
|
an instantaneous increase in the relevant base rate of 50 basis points (0.50%) would have increased the aggregate fair value of the
UPC Broadband Holding
cross-currency and interest rate derivative contracts by approximately
€43 million
(
$45 million
) and, conversely, a decrease of 50 basis points would have decreased the aggregate fair value by approximately
€49 million
(
$52 million
).
|
Unitymedia
Cross-currency and Interest Rate Derivative Contracts
Holding all other factors constant, at
December 31, 2016
, an instantaneous increase (decrease) of 10% in the value of the euro relative to the
U.S.
dollar would have decreased (increased) the aggregate value of the
Unitymedia
cross-currency derivative contracts by approximately
€241 million
(
$254 million
).
Telenet
Cross-currency and Interest Rate Derivative Contracts, Interest Rate Caps and Swaps
Holding all other factors constant, at
December 31, 2016
:
|
(i)
|
an instantaneous increase (decrease) of 10% in the value of the euro relative to the
U.S.
dollar would have decreased (increased) the aggregate fair value of the
Telenet
cross-currency derivative contracts by approximately
€170 million
(
$179 million
); and
|
|
(ii)
|
an instantaneous increase (decrease) in the relevant base rate of 50 basis points (0.50%) would have increased (decreased) the aggregate fair value of the
Telenet
cross currency, interest rate cap and swap contracts by approximately
€124 million
(
$131 million
).
|
CWC
Cross-currency Derivative Contracts
Holding all other factors constant, at
December 31, 2016
, an instantaneous increase (decrease) in the relevant base rate of 50 basis points (0.50%) would have increased (decreased) the aggregate fair value of the
CWC
cross-currency derivative contracts by approximately JMD
4.2 billion
(
$33 million
).
VTR
Cross-currency Derivative Contracts
Holding all other factors constant, at
December 31, 2016
, an instantaneous increase (decrease) of 10% in the value of the Chilean peso relative to the
U.S.
dollar would have decreased (increased) the aggregate fair value of the
VTR
cross-currency derivative contracts by approximately CLP
110.4 billion
(
$165 million
).
ITV Collar
Holding all other factors constant, at
December 31, 2016
, an instantaneous increase (decrease) of 10% in the per share market price of
ITV
’s ordinary shares would have decreased (increased) the fair value of the
ITV Collar
by approximately
£80 million
(
$99 million
).
Sumitomo Collar
Holding all other factors constant, at
December 31, 2016
, an instantaneous increase (decrease) of 10% in the per share market price of
Sumitomo
’s common stock would have decreased (increased) the fair value of the
Sumitomo Collar
by approximately
¥3.6 billion
(
$31 million
).
II-90
Projected Cash Flows Associated with Derivative Instruments
The following table provides information regarding the projected cash flows associated with our derivative instruments. The
U.S.
dollar equivalents presented below are based on interest rates and exchange rates that were in effect as of
December 31, 2016
. These amounts are presented for illustrative purposes only and will likely differ from the actual cash payments required in future periods. For additional information regarding our derivative instruments, see note
7
to our consolidated financial statements. For information concerning the counterparty credit risk associated with our derivative instruments, see the discussion under
Counterparty Credit Risk
above.
|
|
Payments (receipts) due during:
|
Total
|
|||||||||||||||||||||||||
|
|
2017
|
2018
|
2019
|
2020
|
2021
|
Thereafter
|
|||||||||||||||||||||
|
|
in millions
|
||||||||||||||||||||||||||
|
Projected derivative cash payments (receipts), net:
|
|||||||||||||||||||||||||||
|
Liberty Global Group:
|
|||||||||||||||||||||||||||
|
Interest-related (a)
|
$
|
(113.9
|
)
|
$
|
(40.2
|
)
|
$
|
(57.7
|
)
|
$
|
(70.0
|
)
|
$
|
(53.4
|
)
|
$
|
(35.2
|
)
|
$
|
(370.4
|
)
|
||||||
|
Principal-related (b)
|
31.0
|
|
—
|
|
5.5
|
|
161.6
|
|
(153.3
|
)
|
(2,262.4
|
)
|
(2,217.6
|
)
|
|||||||||||||
|
Other (c)
|
(139.9
|
)
|
(260.2
|
)
|
(71.9
|
)
|
(2.8
|
)
|
—
|
|
(6.2
|
)
|
(481.0
|
)
|
|||||||||||||
|
Total Liberty Global Group
|
(222.8
|
)
|
(300.4
|
)
|
(124.1
|
)
|
88.8
|
|
(206.7
|
)
|
(2,303.8
|
)
|
(3,069.0
|
)
|
|||||||||||||
|
LiLAC Group:
|
|||||||||||||||||||||||||||
|
Interest-related (a)
|
21.8
|
|
20.1
|
|
18.7
|
|
15.0
|
|
15.0
|
|
11.6
|
|
102.2
|
|
|||||||||||||
|
Principal-related (b)
|
—
|
|
—
|
|
13.2
|
|
—
|
|
—
|
|
18.5
|
|
31.7
|
|
|||||||||||||
|
Other (c)
|
5.8
|
|
—
|
|
—
|
|
—
|
|
—
|
|
—
|
|
5.8
|
|
|||||||||||||
|
Total LiLAC Group
|
27.6
|
|
20.1
|
|
31.9
|
|
15.0
|
|
15.0
|
|
30.1
|
|
139.7
|
|
|||||||||||||
|
Total
|
$
|
(195.2
|
)
|
$
|
(280.3
|
)
|
$
|
(92.2
|
)
|
$
|
103.8
|
|
$
|
(191.7
|
)
|
$
|
(2,273.7
|
)
|
$
|
(2,929.3
|
)
|
||||||
_______________
|
(a)
|
Includes (i) the cash flows of our interest rate cap, collar and swap contracts and (ii) the interest-related cash flows of our cross-currency and interest rate swap contracts.
|
|
(b)
|
Includes the principal-related cash flows of our cross-currency swap contracts.
|
|
(c)
|
Includes amounts related to our equity-related derivative instruments and foreign currency forward contracts. We may elect to use cash or the collective value of the related shares and equity-related derivative instrument to settle the
ITV Collar Loan
, the
Sumitomo Collar Loan
and the
Lionsgate Loan
.
|
II-91
The consolidated financial statements of Liberty Global are filed under this Item, beginning on page II-96. Financial statement schedules are filed under Item 15 of this Annual Report on Form 10-K.
|
Item 9.
|
CHANGES IN AND DISAGREEMENTS WITH ACCOUNTANTS ON ACCOUNTING AND FINANCIAL DISCLOSURE
|
None.
|
Item 9A.
|
CONTROLS AND PROCEDURES
|
Evaluation of disclosure controls and procedures
In accordance with Exchange Act Rule 13a-15, we carried out an evaluation, under the supervision and with the participation of management, including our chief executive officer and chief financial officer (the Executives), of the effectiveness of our disclosure controls and procedures as of
December 31, 2016
. In designing and evaluating the disclosure controls and procedures, the Executives recognize that any controls and procedures, no matter how well designed and operated, can provide only reasonable assurance of achieving the desired control objectives, and management is necessarily required to apply judgment in evaluating the cost-benefit relationship of possible controls and objectives. Based on that evaluation, the Executives concluded that our disclosure controls and procedures are effective as of
December 31, 2016
, in timely making known to them material information relating to us and our consolidated subsidiaries required to be disclosed in our reports filed or submitted under the Securities Exchange Act of 1934.
Internal control over financial reporting
(a) Management’s Annual Report on Internal Control over Financial Reporting
Management’s annual report on internal control over financial reporting is included herein on page II-93.
(b) Attestation Report of the Independent Registered Public Accounting Firm
The attestation report of KPMG LLP is included herein on page II-94.
(c) Changes in Internal Control over Financial Reporting
There have been no changes in our internal controls over financial reporting identified in connection with the evaluation described above that occurred during the fourth fiscal quarter covered by this Annual Report on Form 10-K that have materially affected, or are reasonably likely to materially affect, our internal control over financial reporting.
|
Item 9B.
|
OTHER INFORMATION
|
Not applicable.
II-92
Management’s Annual Report on Internal Control over Financial Reporting
Our management is responsible for establishing and maintaining adequate internal control over financial reporting, as such term is defined in Rule 13a-15(f) of the Securities Exchange Act of 1934. Our internal control over financial reporting is designed to provide reasonable assurance regarding the reliability of financial reporting and the preparation of financial statements for external purposes in accordance with accounting principles generally accepted in the United States of America. Because of its inherent limitations, internal control over financial reporting may not prevent or detect misstatements. Projections of any evaluation of effectiveness to future periods are subject to the risk that controls may become inadequate because of changes in conditions, or that the degree of compliance with the policies or procedures may deteriorate.
Our management assessed the effectiveness of internal control over financial reporting as of
December 31, 2016
, using the criteria in
Internal Control - Integrated Framework (2013)
issued by the Committee of Sponsoring Organizations of the Treadway Commission. Based on this evaluation, our management believes that our internal control over financial reporting was effective as of
December 31, 2016
. The effectiveness of our internal control over financial reporting has been audited by KPMG LLP, an independent registered public accounting firm, as stated in their report included herein. Our evaluation of internal control over financial reporting did not include the internal control of the following entities that we acquired in
2016
:
|
Total assets included in our consolidated financial statements as of December 31, 2016
|
Total revenue included in our consolidated financial statements for the year ended December 31, 2016
|
|||||||
|
in millions
|
||||||||
|
Cable & Wireless Communications Limited
|
$
|
10,934.7
|
|
$
|
1,443.6
|
|
||
|
Telenet Group BVBA
|
1,547.3
|
|
597.1
|
|
||||
|
$
|
12,482.0
|
|
$
|
2,040.7
|
|
|||
II-93
Report of Independent Registered Public Accounting Firm
The Board of Directors
Liberty Global plc:
We have audited Liberty Global plc and subsidiaries’ (the Company) internal control over financial reporting as of
December 31, 2016
, based on criteria established in
Internal Control — Integrated Framework (2013)
issued by the Committee of Sponsoring Organizations of the Treadway Commission
.
The Company’s management is responsible for maintaining effective internal control over financial reporting and for its assessment of the effectiveness of internal control over financial reporting, included in the accompanying Management’s Annual Report on Internal Control over Financial Reporting. Our responsibility is to express an opinion on the Company’s internal control over financial reporting based on our audit.
We conducted our audit in accordance with the standards of the Public Company Accounting Oversight Board (United States). Those standards require that we plan and perform the audit to obtain reasonable assurance about whether effective internal control over financial reporting was maintained in all material respects. Our audit included obtaining an understanding of internal control over financial reporting, assessing the risk that a material weakness exists, and testing and evaluating the design and operating effectiveness of internal control based on the assessed risk. Our audit also included performing such other procedures as we considered necessary in the circumstances. We believe that our audit provides a reasonable basis for our opinion.
A company’s internal control over financial reporting is a process designed to provide reasonable assurance regarding the reliability
of financial reporting and the preparation of financial statements for external purposes in accordance with generally accepted accounting principles. A company’s internal control over financial reporting includes those policies and procedures that (1) pertain to the maintenance of records that, in reasonable detail, accurately and fairly reflect the transactions and dispositions of the assets of the company; (2) provide reasonable assurance that transactions are recorded as necessary to permit preparation of financial statements in accordance with generally accepted accounting principles, and that receipts and expenditures of the company are being made only in accordance with authorizations of management and directors of the company; and (3) provide reasonable assurance regarding prevention or timely detection of unauthorized acquisition, use, or disposition of the company’s assets that could have a material effect on the financial statements.
Because of its inherent limitations, internal control over financial reporting may not prevent or detect misstatements. Also, projections of any evaluation of effectiveness to future periods are subject to the risk that controls may become inadequate because of changes in conditions, or that the degree of compliance with the policies or procedures may deteriorate.
In our opinion, the Company maintained, in all material respects, effective internal control over financial reporting as of
December 31, 2016
, based on criteria established in
Internal Control — Integrated Framework (2013)
issued by the Committee of Sponsoring Organizations of the Treadway Commission. Management’s evaluation of the effectiveness of the Company’s internal control over financial reporting as of
December 31, 2016
excluded the following entities that were acquired in
2016
:
|
Total assets included in the Company’s consolidated financial statements as of December 31, 2016
|
Total revenue included in the Company’s consolidated financial statements for the year ended December 31, 2016
|
|||||||
|
in millions
|
||||||||
|
Cable & Wireless Communications Limited
|
$
|
10,934.7
|
|
$
|
1,443.6
|
|
||
|
Telenet Group BVBA
|
1,547.3
|
|
597.1
|
|
||||
|
$
|
12,482.0
|
|
$
|
2,040.7
|
|
|||
II-94
We also have audited, in accordance with the standards of the Public Company Accounting Oversight Board (United States), the consolidated balance sheets of the Company as of
December 31, 2016
and
2015
, and the related consolidated statements of operations, comprehensive earnings (loss), equity, and cash flows for each of the years in the three-year period ended
December 31, 2016
, and the related financial statement schedules I and II, and our report dated
February 15, 2017
expressed an unqualified opinion on those consolidated financial statements.
/s/ KPMG LLP
Denver, Colorado
February 15, 2017
II-95
Report of Independent Registered Public Accounting Firm
The Board of Directors
Liberty Global plc:
We have audited the accompanying consolidated balance sheets of Liberty Global plc and subsidiaries (the Company) as of
December 31, 2016
and
2015
, and the related consolidated statements of operations, comprehensive earnings (loss), equity, and cash flows for each of the years in the three-year period ended
December 31, 2016
. In connection with our audits of the consolidated financial statements, we also have audited financial statement schedules I and II. These consolidated financial statements and financial statement schedules are the responsibility of the Company’s management. Our responsibility is to express an opinion on these consolidated financial statements and financial statement schedules based on our audits.
We conducted our audits in accordance with the standards of the Public Company Accounting Oversight Board (United States). Those standards require that we plan and perform the audit to obtain reasonable assurance about whether the financial statements are free of material misstatement. An audit includes examining, on a test basis, evidence supporting the amounts and disclosures in the financial statements. An audit also includes assessing the accounting principles used and significant estimates made by management, as well as evaluating the overall financial statement presentation. We believe that our audits provide a reasonable basis for our opinion.
In our opinion, the consolidated financial statements referred to above present fairly, in all material respects, the financial position of the Company as of
December 31, 2016
and
2015
, and the results of its operations and its cash flows for each of the years in the three-year period ended
December 31, 2016
, in conformity with U.S. generally accepted accounting principles. Also, in our opinion, the related financial statement schedules, when considered in relation to the basic consolidated financial statements taken as a whole, present fairly, in all material respects, the information set forth therein.
We also have audited, in accordance with the standards of the Public Company Accounting Oversight Board (United States), the Company’s internal control over financial reporting as of
December 31, 2016
, based on criteria established in
Internal Control — Integrated Framework (2013)
issued by the Committee of Sponsoring Organizations of the Treadway Commission, and our report dated
February 15, 2017
expressed an unqualified opinion on the effectiveness of the Company’s internal control over financial reporting.
/s/ KPMG LLP
Denver, Colorado
February 15, 2017
II-96
LIBERTY GLOBAL PLC
|
December 31,
|
|||||||
|
2016
|
2015
|
||||||
|
|
in millions
|
||||||
|
ASSETS
|
|||||||
|
Current assets:
|
|||||||
|
Cash and cash equivalents
|
$
|
|
|
$
|
|
|
|
|
Receivable from the Dutch JV (note 5)
|
|
|
|
|
|||
|
Trade receivables, net
|
|
|
|
|
|||
|
Derivative instruments (note 7)
|
|
|
|
|
|||
|
Prepaid expenses
|
|
|
|
|
|||
|
Other current assets
|
|
|
|
|
|||
|
Total current assets
|
|
|
|
|
|||
|
Investments (including $2,057.2 million and $2,591.8 million, respectively, measured at fair value on a recurring basis) (note 6)
|
|
|
|
|
|||
|
Property and equipment, net (note 9)
|
|
|
|
|
|||
|
Goodwill (note 9)
|
|
|
|
|
|||
|
Intangible assets subject to amortization, net (note 9)
|
|
|
|
|
|||
|
Other assets, net (notes 2, 7, 9 and 11)
|
|
|
|
|
|||
|
Total assets
|
$
|
|
|
$
|
|
|
|
The accompanying notes are an integral part of these consolidated financial statements.
II-97
LIBERTY GLOBAL PLC
CONSOLIDATED BALANCE SHEETS — (Continued)
|
December 31,
|
|||||||
|
2016
|
2015
|
||||||
|
|
in millions
|
||||||
|
LIABILITIES AND EQUITY
|
|||||||
|
Current liabilities:
|
|||||||
|
Accounts payable
|
$
|
|
|
$
|
|
|
|
|
Deferred revenue and advance payments from subscribers and others
|
|
|
|
|
|||
|
Current portion of debt and capital lease obligations (note 10)
|
|
|
|
|
|||
|
Accrued capital expenditures
|
|
|
|
|
|||
|
Accrued interest
|
|
|
|
|
|||
|
Accrued income taxes
|
|
|
|
|
|||
|
Other accrued and current liabilities (notes 7 and 14)
|
|
|
|
|
|||
|
Total current liabilities
|
|
|
|
|
|||
|
Long-term debt and capital lease obligations (note 10)
|
|
|
|
|
|||
|
Other long-term liabilities (notes 7, 11, 14 and 15)
|
|
|
|
|
|||
|
Total liabilities
|
|
|
|
|
|||
|
Commitments and contingencies (notes 4, 7, 10, 11, 15, 17 and 20)
|
|
|
|||||
|
Equity (note 12):
|
|||||||
|
Liberty Global shareholders:
|
|||||||
|
Liberty Global Shares — Class A, $0.01 nominal value. Issued and outstanding 253,827,604 and 252,766,455 shares, respectively
|
|
|
|
|
|||
|
Liberty Global Shares — Class B, $0.01 nominal value. Issued and outstanding 10,805,850 and 10,472,517 shares, respectively
|
|
|
|
|
|||
|
Liberty Global Shares — Class C, $0.01 nominal value. Issued and outstanding 634,391,072 and 584,044,394 shares, respectively
|
|
|
|
|
|||
|
LiLAC Shares — Class A, $0.01 nominal value. Issued and outstanding 50,317,930 and 12,630,580 shares, respectively
|
|
|
|
|
|||
|
LiLAC Shares — Class B, $0.01 nominal value. Issued and outstanding 1,888,323 and 523,423 shares, respectively
|
|
|
|
|
|||
|
LiLAC Shares — Class C, $0.01 nominal value. Issued and outstanding 120,889,034 and 30,772,874 shares, respectively
|
|
|
|
|
|||
|
Additional paid-in capital
|
|
|
|
|
|||
|
Accumulated deficit
|
(
|
)
|
(
|
)
|
|||
|
Accumulated other comprehensive earnings (loss), net of taxes
|
(
|
)
|
|
|
|||
|
Treasury shares, at cost
|
(
|
)
|
(
|
)
|
|||
|
Total Liberty Global shareholders
|
|
|
|
|
|||
|
Noncontrolling interests
|
|
|
(
|
)
|
|||
|
Total equity
|
|
|
|
|
|||
|
Total liabilities and equity
|
$
|
|
|
$
|
|
|
|
The accompanying notes are an integral part of these consolidated financial statements.
II-98
LIBERTY GLOBAL PLC
|
Year ended December 31,
|
|||||||||||
|
|
2016
|
2015
|
2014
|
||||||||
|
|
in millions, except per share amounts
|
||||||||||
|
Revenue (note 18)
|
$
|
|
|
$
|
|
|
$
|
|
|
||
|
Operating costs and expenses (exclusive of depreciation and amortization, shown separately below):
|
|||||||||||
|
Programming and other direct costs of services
|
|
|
|
|
|
|
|||||
|
Other operating (note 13)
|
|
|
|
|
|
|
|||||
|
Selling, general and administrative (
SG&A
) (notes 13 and 17)
|
|
|
|
|
|
|
|||||
|
Depreciation and amortization (note 9)
|
|
|
|
|
|
|
|||||
|
Impairment, restructuring and other operating items, net (notes 4, 9, 14 and 15)
|
|
|
|
|
|
|
|||||
|
|
|
|
|
|
|
||||||
|
Operating income
|
|
|
|
|
|
|
|||||
|
Non-operating income (expense):
|
|||||||||||
|
Interest expense
|
(
|
)
|
(
|
)
|
(
|
)
|
|||||
|
Realized and unrealized gains on derivative instruments, net (note 7)
|
|
|
|
|
|
|
|||||
|
Foreign currency transaction losses, net
|
(
|
)
|
(
|
)
|
(
|
)
|
|||||
|
Realized and unrealized
gains (losses)
due to changes in fair values of certain investments and debt, net (notes 6, 8 and 10)
|
(
|
)
|
|
|
|
|
|||||
|
Losses on debt modification and extinguishment, net (note 10)
|
(
|
)
|
(
|
)
|
(
|
)
|
|||||
|
Gain on Dutch JV Transaction (note 5)
|
|
|
|
|
|
|
|||||
|
Other income (expense), net
|
|
|
(
|
)
|
(
|
)
|
|||||
|
(
|
)
|
(
|
)
|
(
|
)
|
||||||
|
Earnings (loss) from continuing operations before income taxes
|
|
|
(
|
)
|
(
|
)
|
|||||
|
Income tax benefit (
expense)
(note 11)
|
|
|
(
|
)
|
|
|
|||||
|
Earnings (loss) from continuing operations
|
|
|
(
|
)
|
(
|
)
|
|||||
|
Discontinued operation (note 5):
|
|||||||||||
|
Earnings from discontinued operation, net of taxes
|
|
|
|
|
|
|
|||||
|
Gain on disposal of discontinued operation, net of taxes
|
|
|
|
|
|
|
|||||
|
|
|
|
|
|
|
||||||
|
Net earnings (loss)
|
|
|
(
|
)
|
(
|
)
|
|||||
|
Net earnings attributable to noncontrolling interests
|
(
|
)
|
(
|
)
|
(
|
)
|
|||||
|
Net earnings (loss) attributable to Liberty Global shareholders
|
$
|
|
|
$
|
(
|
)
|
$
|
(
|
)
|
||
|
Basic earnings (loss) attributable to Liberty Global shareholders per share (notes 1 and 3):
|
|||||||||||
|
Liberty Global Shares
|
$
|
|
|
$
|
(
|
)
|
|||||
|
LiLAC Shares
|
$
|
(
|
)
|
$
|
|
|
|||||
|
Old Liberty Global Shares:
|
|||||||||||
|
Continuing operations
|
$
|
(
|
)
|
$
|
(
|
)
|
|||||
|
Discontinued operation
|
|
|
|
|
|||||||
|
$
|
(
|
)
|
$
|
(
|
)
|
||||||
|
Diluted earnings (loss) attributable to Liberty Global shareholders per share (notes 1 and 3):
|
|||||||||||
|
Liberty Global Shares
|
$
|
|
|
$
|
(
|
)
|
|||||
|
LiLAC Shares
|
$
|
(
|
)
|
$
|
|
|
|||||
|
Old Liberty Global Shares:
|
|
||||||||||
|
Continuing operations
|
$
|
(
|
)
|
$
|
(
|
)
|
|||||
|
Discontinued operation
|
|
|
|
|
|||||||
|
|
$
|
(
|
)
|
|
$
|
(
|
)
|
||||
The accompanying notes are an integral part of these consolidated financial statements.
II-99
LIBERTY GLOBAL PLC
CONSOLIDATED STATEMENTS OF COMPREHENSIVE EARNINGS (LOSS)
|
Year ended December 31,
|
|||||||||||
|
|
2016
|
2015
|
2014
|
||||||||
|
|
in millions
|
||||||||||
|
Net earnings (loss)
|
$
|
|
|
$
|
(
|
)
|
$
|
(
|
)
|
||
|
Other comprehensive earnings (loss), net of taxes (note 16):
|
|||||||||||
|
Foreign currency translation adjustments
|
(
|
)
|
(
|
)
|
(
|
)
|
|||||
|
Reclassification adjustments included in net earnings (loss) (note 5)
|
|
|
|
|
|
|
|||||
|
Pension-related adjustments and other
|
(
|
)
|
(
|
)
|
(
|
)
|
|||||
|
Other comprehensive loss
|
(
|
)
|
(
|
)
|
(
|
)
|
|||||
|
Comprehensive earnings (loss)
|
|
|
(
|
)
|
(
|
)
|
|||||
|
Comprehensive earnings attributable to noncontrolling interests
|
(
|
)
|
(
|
)
|
(
|
)
|
|||||
|
Comprehensive earnings (loss) attributable to Liberty Global shareholders
|
$
|
|
|
$
|
(
|
)
|
$
|
(
|
)
|
||
The accompanying notes are an integral part of these consolidated financial statements.
II-100
LIBERTY GLOBAL PLC
CONSOLIDATED STATEMENTS OF EQUITY
|
|
Liberty Global shareholders
|
Non-controlling
interests
|
Total
equity
|
||||||||||||||||||||||||||||||||||||
|
|
Old Liberty Global Shares
|
Additional
paid-in
capital
|
Accumulated
deficit
|
Accumulated
other
comprehensive
earnings,
net of taxes
|
Treasury shares, at cost
|
Total Liberty Global
shareholders
|
|||||||||||||||||||||||||||||||||
|
|
Class A
|
Class B
|
Class C
|
||||||||||||||||||||||||||||||||||||
|
|
in millions
|
||||||||||||||||||||||||||||||||||||||
|
Balance at January 1, 2014
|
$
|
|
|
$
|
|
|
$
|
|
|
$
|
|
|
$
|
(
|
)
|
$
|
|
|
$
|
(
|
)
|
$
|
|
|
$
|
(
|
)
|
$
|
|
|
|||||||||
|
Net loss
|
—
|
|
—
|
|
—
|
|
—
|
|
(
|
)
|
—
|
|
—
|
|
(
|
)
|
|
|
(
|
)
|
|||||||||||||||||||
|
Other comprehensive loss, net of taxes (note 16)
|
—
|
|
—
|
|
—
|
|
—
|
|
—
|
|
(
|
)
|
—
|
|
(
|
)
|
(
|
)
|
(
|
)
|
|||||||||||||||||||
|
Repurchase and cancellation of Liberty Global ordinary shares (note 12)
|
—
|
|
—
|
|
(
|
)
|
(
|
)
|
—
|
|
—
|
|
—
|
|
(
|
)
|
—
|
|
(
|
)
|
|||||||||||||||||||
|
VTR NCI Acquisition (note 12)
|
—
|
|
—
|
|
|
|
|
|
—
|
|
—
|
|
—
|
|
|
|
(
|
)
|
|
|
|||||||||||||||||||
|
Shares issued in connection with the Ziggo Acquisition (note 4)
|
|
|
—
|
|
|
|
|
|
—
|
|
—
|
|
—
|
|
|
|
|
|
|
|
|||||||||||||||||||
|
Impact of Ziggo NCI Acquisition and Statutory Squeeze-out (note 4)
|
—
|
|
—
|
|
|
|
|
|
—
|
|
—
|
|
—
|
|
|
|
(
|
)
|
(
|
)
|
|||||||||||||||||||
|
Share-based compensation (note 13)
|
—
|
|
—
|
|
—
|
|
|
|
—
|
|
—
|
|
—
|
|
|
|
—
|
|
|
|
|||||||||||||||||||
|
Adjustments due to changes in subsidiaries’ equity and other, net
|
—
|
|
—
|
|
(
|
)
|
(
|
)
|
—
|
|
—
|
|
|
|
(
|
)
|
|
|
(
|
)
|
|||||||||||||||||||
|
Balance at December 31, 2014
|
$
|
|
|
|
$
|
|
|
|
$
|
|
|
|
$
|
|
|
|
$
|
(
|
)
|
|
$
|
|
|
|
$
|
(
|
)
|
|
$
|
|
|
|
$
|
(
|
)
|
|
$
|
|
|
The accompanying notes are an integral part of these consolidated financial statements.
II-101
LIBERTY GLOBAL PLC
CONSOLIDATED STATEMENTS OF EQUITY — (Continued)
|
|
Liberty Global shareholders
|
Non-controlling
interests
|
Total
equity
|
||||||||||||||||||||||||||||||||||||
|
|
Liberty Global Shares
|
LiLAC Shares
|
Old Liberty Global Shares
|
Additional
paid-in
capital
|
Accumulated
deficit
|
Accumulated
other
comprehensive
earnings,
net of taxes
|
Treasury shares, at cost
|
Total Liberty Global
shareholders
|
|||||||||||||||||||||||||||||||
|
|
in millions
|
||||||||||||||||||||||||||||||||||||||
|
Balance at January 1, 2015
|
$
|
|
|
$
|
|
|
$
|
|
|
$
|
|
|
$
|
(
|
)
|
$
|
|
|
$
|
(
|
)
|
$
|
|
|
$
|
(
|
)
|
$
|
|
|
|||||||||
|
Net loss
|
—
|
|
—
|
|
—
|
|
—
|
|
(
|
)
|
—
|
|
—
|
|
(
|
)
|
|
|
(
|
)
|
|||||||||||||||||||
|
Other comprehensive loss, net of taxes (note 16)
|
—
|
|
—
|
|
—
|
|
—
|
|
—
|
|
(
|
)
|
—
|
|
(
|
)
|
|
|
(
|
)
|
|||||||||||||||||||
|
Repurchase and cancellation of Liberty Global ordinary shares (note 12)
|
(
|
)
|
—
|
|
(
|
)
|
(
|
)
|
—
|
|
—
|
|
—
|
|
(
|
)
|
—
|
|
(
|
)
|
|||||||||||||||||||
|
Share-based compensation (note 13)
|
—
|
|
—
|
|
—
|
|
|
|
—
|
|
—
|
|
—
|
|
|
|
—
|
|
|
|
|||||||||||||||||||
|
Impact of the LiLAC Transaction
(note 1)
|
|
|
|
|
(
|
)
|
(
|
)
|
—
|
|
—
|
|
—
|
|
—
|
|
—
|
|
|
|
|||||||||||||||||||
|
Adjustments due to changes in subsidiaries’ equity and other, net (note 12)
|
(
|
)
|
—
|
|
(
|
)
|
(
|
)
|
—
|
|
—
|
|
|
|
(
|
)
|
|
|
(
|
)
|
|||||||||||||||||||
|
Balance at December 31, 2015
|
$
|
|
|
$
|
|
|
$
|
|
|
$
|
|
|
$
|
(
|
)
|
$
|
|
|
$
|
(
|
)
|
$
|
|
|
$
|
(
|
)
|
$
|
|
|
|||||||||
The accompanying notes are an integral part of these consolidated financial statements.
II-102
LIBERTY GLOBAL PLC
CONSOLIDATED STATEMENTS OF EQUITY — (Continued)
|
|
Liberty Global shareholders
|
Non-controlling
interests
|
Total
equity
|
||||||||||||||||||||||||||||||||
|
|
Liberty Global Shares
|
LiLAC Shares
|
Additional
paid-in
capital
|
Accumulated
deficit
|
Accumulated
other
comprehensive
earnings (loss),
net of taxes
|
Treasury shares, at cost
|
Total Liberty Global
shareholders
|
||||||||||||||||||||||||||||
|
|
in millions
|
||||||||||||||||||||||||||||||||||
|
Balance at January 1, 2016
|
$
|
|
|
$
|
|
|
$
|
|
|
$
|
(
|
)
|
$
|
|
|
$
|
(
|
)
|
$
|
|
|
$
|
(
|
)
|
$
|
|
|
||||||||
|
Net earnings
|
—
|
|
—
|
|
—
|
|
|
|
—
|
|
—
|
|
|
|
|
|
|
|
|||||||||||||||||
|
Other comprehensive loss, net of taxes (notes 5 and 16)
|
—
|
|
—
|
|
—
|
|
—
|
|
(
|
)
|
—
|
|
(
|
)
|
(
|
)
|
(
|
)
|
|||||||||||||||||
|
Impact of the CWC Acquisition (note 4)
|
|
|
|
|
|
|
—
|
|
—
|
|
—
|
|
|
|
|
|
|
|
|||||||||||||||||
|
Repurchase and cancellation of Liberty Global ordinary shares (note 12)
|
(
|
)
|
—
|
|
(
|
)
|
—
|
|
—
|
|
—
|
|
(
|
)
|
—
|
|
(
|
)
|
|||||||||||||||||
|
Share-based compensation (note 13)
|
—
|
|
—
|
|
|
|
—
|
|
—
|
|
—
|
|
|
|
—
|
|
|
|
|||||||||||||||||
|
Liberty Global call option contracts (note 12)
|
—
|
|
—
|
|
|
|
—
|
|
—
|
|
—
|
|
|
|
—
|
|
|
|
|||||||||||||||||
|
Impact of the LiLAC Distribution (note 4)
|
—
|
|
|
|
(
|
)
|
—
|
|
—
|
|
—
|
|
—
|
|
—
|
|
|
|
|||||||||||||||||
|
Adjustments due to changes in subsidiaries’ equity and other, net
|
(
|
)
|
—
|
|
(
|
)
|
—
|
|
—
|
|
|
|
(
|
)
|
(
|
)
|
(
|
)
|
|||||||||||||||||
|
Balance at December 31, 2016
|
$
|
|
|
$
|
|
|
$
|
|
|
$
|
(
|
)
|
$
|
(
|
)
|
$
|
(
|
)
|
$
|
|
|
$
|
|
|
$
|
|
|
||||||||
The accompanying notes are an integral part of these consolidated financial statements.
II-103
LIBERTY GLOBAL PLC
CONSOLIDATED STATEMENTS OF CASH FLOWS
|
|
Year ended December 31,
|
||||||||||
|
|
2016
|
2015
|
2014
|
||||||||
|
|
in millions
|
||||||||||
|
Cash flows from operating activities:
|
|||||||||||
|
Net earnings (loss)
|
$
|
|
|
$
|
(
|
)
|
$
|
(
|
)
|
||
|
Earnings from discontinued operation
|
|
|
|
|
(
|
)
|
|||||
|
Earnings (loss) from continuing operations
|
|
|
(
|
)
|
(
|
)
|
|||||
|
Adjustments to reconcile earnings (loss) from continuing operations to net cash provided by operating activities:
|
|||||||||||
|
Share-based compensation expense
|
|
|
|
|
|
|
|||||
|
Depreciation and amortization
|
|
|
|
|
|
|
|||||
|
Impairment, restructuring and other operating items, net
|
|
|
|
|
|
|
|||||
|
Amortization of deferred financing costs and non-cash interest
|
|
|
|
|
|
|
|||||
|
Realized and unrealized gains on derivative instruments, net
|
(
|
)
|
(
|
)
|
(
|
)
|
|||||
|
Foreign currency transaction losses, net
|
|
|
|
|
|
|
|||||
|
Realized and unrealized losses (gains) due to changes in fair values of certain investments and debt, including impact of dividends
|
|
|
(
|
)
|
(
|
)
|
|||||
|
Losses on debt modification and extinguishment, net
|
|
|
|
|
|
|
|||||
|
Gain on Dutch JV Transaction
|
(
|
)
|
|
|
|
|
|||||
|
Deferred income tax benefit
|
(
|
)
|
(
|
)
|
(
|
)
|
|||||
|
Excess tax benefits from share-based compensation
|
(
|
)
|
(
|
)
|
(
|
)
|
|||||
|
Changes in operating assets and liabilities, net of the effects of acquisitions and dispositions:
|
|||||||||||
|
Receivables and other operating assets
|
|
|
|
|
|
|
|||||
|
Payables and accruals
|
(
|
)
|
(
|
)
|
(
|
)
|
|||||
|
Net cash used by operating activities of discontinued operation
|
|
|
|
|
(
|
)
|
|||||
|
Net cash provided by operating activities
|
|
|
|
|
|
|
|||||
|
Cash flows from investing activities:
|
|||||||||||
|
Capital expenditures
|
(
|
)
|
(
|
)
|
(
|
)
|
|||||
|
Cash paid in connection with acquisitions, net of cash acquired
|
(
|
)
|
(
|
)
|
(
|
)
|
|||||
|
Sale of investments
|
|
|
|
|
|
|
|||||
|
Investments in and loans to affiliates and others
|
(
|
)
|
(
|
)
|
(
|
)
|
|||||
|
Proceeds received upon disposition of discontinued operation, net of disposal costs
|
|
|
|
|
|
|
|||||
|
Other investing activities, net
|
|
|
|
|
(
|
)
|
|||||
|
Net cash used by investing activities of discontinued operation, including deconsolidated cash
|
|
|
|
|
(
|
)
|
|||||
|
Net cash used by investing activities
|
$
|
(
|
)
|
$
|
(
|
)
|
$
|
(
|
)
|
||
The accompanying notes are an integral part of these consolidated financial statements.
II-104
LIBERTY GLOBAL PLC
CONSOLIDATED STATEMENTS OF CASH FLOWS — (Continued)
|
|
Year ended December 31,
|
||||||||||
|
|
2016
|
2015
|
2014
|
||||||||
|
in millions
|
|||||||||||
|
Cash flows from financing activities:
|
|||||||||||
|
Borrowings of debt
|
$
|
|
|
$
|
|
|
$
|
|
|
||
|
Repayments and repurchases of debt and capital lease obligations
|
(
|
)
|
(
|
)
|
(
|
)
|
|||||
|
Repurchase of Liberty Global ordinary shares
|
(
|
)
|
(
|
)
|
(
|
)
|
|||||
|
Payment of financing costs and debt premiums
|
(
|
)
|
(
|
)
|
(
|
)
|
|||||
|
Net cash paid related to derivative instruments
|
(
|
)
|
(
|
)
|
(
|
)
|
|||||
|
Change in cash collateral
|
|
|
(
|
)
|
(
|
)
|
|||||
|
Purchase of additional shares of subsidiaries
|
|
|
(
|
)
|
(
|
)
|
|||||
|
Other financing activities, net
|
(
|
)
|
(
|
)
|
(
|
)
|
|||||
|
Net cash used by financing activities of discontinued operation
|
|
|
|
|
(
|
)
|
|||||
|
Net cash
used
by financing activities
|
(
|
)
|
(
|
)
|
(
|
)
|
|||||
|
Effect of exchange rate changes on cash – continuing operations
|
|
|
(
|
)
|
(
|
)
|
|||||
|
Net increase (decrease) in cash and cash equivalents:
|
|||||||||||
|
Continuing operations
|
|
|
(
|
)
|
(
|
)
|
|||||
|
Discontinued operation
|
|
|
|
|
(
|
)
|
|||||
|
Net increase (decrease) in cash and cash equivalents
|
|
|
(
|
)
|
(
|
)
|
|||||
|
Cash and cash equivalents:
|
|||||||||||
|
Beginning of year
|
|
|
|
|
|
|
|||||
|
End of year
|
$
|
|
|
$
|
|
|
$
|
|
|
||
|
Cash paid for interest – continuing operations
|
$
|
|
|
$
|
|
|
$
|
|
|
||
|
Net cash paid for taxes:
|
|||||||||||
|
Continuing operations
|
$
|
|
|
$
|
|
|
$
|
|
|
||
|
Discontinued operation
|
|
|
|
|
|
|
|||||
|
Total
|
$
|
|
|
$
|
|
|
$
|
|
|
||
The accompanying notes are an integral part of these consolidated financial statements.
II-105
LIBERTY GLOBAL PLC
Notes to Consolidated Financial Statements
December 31, 2016
,
2015
and
2014
(
1
)
Basis of Presentation
Liberty Global plc (
Liberty Global
) is a public limited company organized under the laws of England and Wales. In these notes, the terms “we,” “our,” “our company” and “us” may refer, as the context requires, to
Liberty Global
or collectively to
Liberty Global
and its subsidiaries. We are an international provider of video, broadband internet, fixed-line telephony, mobile and other communications services to residential customers and businesses, with consolidated operations at
December 31, 2016
in more than
30
countries.
In Europe, we provide residential and business-to-business (
B2B
) services in (i) the United Kingdom (
U.K.
) and Ireland through Virgin Media Inc. (
Virgin Media
), (ii) Germany through Unitymedia GmbH (
Unitymedia
), (iii) Belgium through Telenet Group Holding N.V. (
Telenet
), a
57.4
%
-owned subsidiary, and (iv)
seven
other European countries through UPC Holding B.V. (
UPC Holding
). In addition, through the December 31, 2016 completion of the
Dutch JV Transaction
(as defined and described in note
5
), we provided residential and
B2B
services in the Netherlands through VodafoneZiggo Holding B.V., formerly known as Ziggo Group Holding B.V., which we refer to herein as “
Ziggo Group Holding
.”
Virgin Media
,
Unitymedia
and
UPC Holding
are each wholly-owned subsidiaries of
Liberty Global
. The operations of
Virgin Media
,
Unitymedia
,
Telenet
,
UPC Holding
and,
through December 31, 2016
,
Ziggo Group Holding
are collectively referred to herein as the “
European Division
.”
Outside of Europe, we provide residential and
B2B
services in (i)
18
countries, predominantly in Latin America and the Caribbean, through our wholly-owned subsidiary Cable & Wireless Communications Limited (formerly known as Cable & Wireless Communications Plc) (
CWC
), (ii) Chile through our wholly-owned subsidiary VTR.com SpA (
VTR
) and (iii) Puerto Rico through Liberty Cablevision of Puerto Rico LLC (
Liberty Puerto Rico
), an entity in which we hold a
60.0
%
ownership interest.
CWC
also provides (a)
B2B
services in certain other countries in Latin America and the Caribbean and (b) wholesale services over its sub-sea and terrestrial networks that connect over
30
markets in that region.
CWC
owns less than 100% of certain of its consolidated subsidiaries, including Cable & Wireless Panama, SA (
CWC Panama
) (a
49.0
%
-owned entity that owns most of our operations in Panama), The Bahamas Telecommunications Company Limited (
CWC BTC
) (a
49.0
%
-owned entity that owns all of our operations in the Bahamas), Cable & Wireless Jamaica Limited (
CWC Jamaica
) (an
82.0
%
-owned entity that owns the majority of our operations in Jamaica) and Cable & Wireless Barbados Limited (
CWC Barbados
) (an
81.1
%
-owned entity that owns the majority of our operations in Barbados). The operations of
CWC
,
VTR
and
Liberty Puerto Rico
are collectively referred to herein as the “
LiLAC Division
.”
On July 1, 2015, we completed the approved steps of the “
LiLAC Transaction
” whereby we (i) reclassified our then outstanding Class A, Class B and Class C
Liberty Global
ordinary shares into corresponding classes of new
Liberty Global
ordinary shares (collectively, the
Liberty Global Shares
) and (ii) capitalized a portion of our share premium account and distributed as a dividend (or a “bonus issue” under
U.K.
law) our LiLAC Class A, Class B and Class C ordinary shares (collectively, the
LiLAC Shares
). In these notes, the term “
Old Liberty Global Shares
” refers to our previously-outstanding Class A, Class B and Class C
Liberty Global
ordinary shares. Pursuant to the
LiLAC Transaction
, each holder of Class A, Class B and Class C
Old Liberty Global Shares
remained a holder of the same amount and class of
Liberty Global Shares
and received
one
share of the corresponding class of
LiLAC Shares
for each
20
Old Liberty Global Shares
held as of the record date for such distribution. Accordingly, we issued
12,625,362
Class A,
523,626
Class B and
30,776,883
Class C
LiLAC Shares
. Cash was issued in lieu of fractional
LiLAC Shares
. The impact of the
LiLAC Transaction
on our capitalization and earnings (loss) per share presentation has been reflected in these consolidated financial statements prospectively from July 1, 2015. Accordingly, (a) our net earnings (loss) attributed to
Liberty Global Shares
and
LiLAC Shares
relates to periods subsequent to July 1, 2015 and (b) our net loss attributed to
Old Liberty Global Shares
relates to periods prior to July 1, 2015.
The
Liberty Global Shares
and the
LiLAC Shares
are tracking shares. Tracking shares are intended by the issuing company to reflect or “track” the economic performance of a particular business or “group,” rather than the economic performance of the company as a whole. The
Liberty Global Shares
and the
LiLAC Shares
are intended to track the economic performance of the
Liberty Global Group
and the
LiLAC Group
, respectively (each as defined and described below). While the
Liberty Global Group
and the
LiLAC Group
have separate collections of businesses, assets and liabilities attributed to them, neither group is a separate legal entity and therefore cannot own assets, issue securities or enter into legally binding agreements. Holders of tracking shares have no direct claim to the group’s assets and are not represented by separate boards of directors. Instead, holders of tracking shares are shareholders of the parent corporation, with a single board of directors, and are subject to all of the risks and liabilities of the parent corporation. We and our subsidiaries each continue to be responsible for our respective liabilities. Holders of
Liberty Global Shares
,
LiLAC Shares
and any other of our capital shares designated as ordinary shares from time to time will continue to be subject to risks associated with an investment in our company as a whole, even if a holder does not own both
Liberty Global Shares
and
LiLAC Shares
.
II-106
LIBERTY GLOBAL PLC
Notes to Consolidated Financial Statements — (Continued)
December 31, 2016, 2015 and 2014
The “
LiLAC Group
” comprises our businesses, assets and liabilities in Latin America and the Caribbean and has attributed to it (i) LGE Coral Holdco Limited (
LGE Coral
) and its subsidiaries, which include
CWC
, (ii) VTR Finance B.V. (
VTR Finance
) and its subsidiaries, which include
VTR
, (iii) Lila Chile Holding B.V. (
Lila Chile Holding
), which is the parent entity of
VTR Finance
, (iv) LiLAC Communications Inc. (formerly known as LiLAC Holdings Inc.) (
LiLAC Communications
) and its subsidiaries, which include
Liberty Puerto Rico
, and (v) prior to July 1, 2015, the costs associated with certain corporate employees of
Liberty Global
that are exclusively focused on the management of the
LiLAC Group
(the
LiLAC Corporate Costs
). Effective July 1, 2015, these corporate employees were transferred to
LiLAC Communications
. The “
Liberty Global Group
” comprises our businesses, assets and liabilities not attributed to the
LiLAC Group
, including
Virgin Media
,
Ziggo Group Holding
(
through December 31, 2016
),
Unitymedia
,
Telenet
,
UPC Holding
, our corporate entities (excluding
LiLAC Communications
) and certain other less significant entities.
For additional information regarding our tracking share capital structure, including unaudited attributed financial information of the
Liberty Global Group
and the
LiLAC Group
, see Exhibit 99.1 to this Annual Report on Form 10-K.
On January 31, 2014, we completed the sale of substantially all of the assets (the
Chellomedia Disposal Group
) of Chellomedia B.V. (
Chellomedia
) (the
Chellomedia Transaction
).
Chellomedia
held certain of our programming interests in Europe and Latin America. We have accounted for the sale of the
Chellomedia Disposal Group
as a discontinued operation in our consolidated financial statements. For additional information regarding our discontinued operation, see note
5
.
(
2
)
Accounting Changes and Recent Accounting Pronouncements
In April 2015, the Financial Accounting Standards Board (
FASB
) issued Accounting Standards Update (
ASU
) No. 2015-03,
Simplifying the Presentation of Debt Issuance Costs
(
ASU 2015-03
), which requires debt issuance costs related to a recognized debt liability to be presented on the balance sheet as a reduction of debt, similar to the presentation of debt discounts. For public entities,
ASU 2015-03
was effective for annual reporting periods beginning after December 15, 2015. We adopted
ASU 2015-03
on January 1, 2016 and, accordingly, deferred financing costs are presented as a reduction of debt in our
December 31, 2016
and 2015 consolidated balance sheets. Prior to the adoption of
ASU 2015-03
, we presented deferred financing costs in other assets, net.
Recent Accounting Pronouncements
ASU 2014-09
In May 2014, the
FASB
issued
ASU
No. 2014-09,
Revenue from Contracts with Customers
(
ASU 2014-09
), which requires an entity to recognize the amount of revenue to which it expects to be entitled for the transfer of promised goods or services to customers.
ASU 2014-09
, as amended by
ASU
No. 2015-14, will replace existing revenue recognition guidance when it becomes effective for annual and interim reporting periods beginning after December 15, 2017. This new standard permits the use of either the retrospective or cumulative effect transition method. We will adopt
ASU 2014-09
effective January 1, 2018 using the cumulative effect transition method. While we are continuing to evaluate the effect that
ASU 2014-09
will have on our consolidated financial statements, we have identified a number of our current revenue recognition policies that will be impacted by
ASU 2014-09
, including the accounting for (i) time-limited discounts and free periods provided to our customers and (ii) certain up-front fees charged to our customers. These impacts are discussed below:
|
•
|
When we enter into contracts to provide services to our customers, we often provide time-limited discounts or free service periods. Under current accounting rules, we recognize revenue net of discounts during the promotional periods and do not recognize any revenue during free service periods. Under
ASU 2014-09
, revenue recognition will be accelerated for these contracts as the impact of the discount or free service period will be recognized uniformly over the total contractual period.
|
II-107
LIBERTY GLOBAL PLC
Notes to Consolidated Financial Statements — (Continued)
December 31, 2016, 2015 and 2014
|
•
|
When we enter into contracts to provide services to our customers, we often charge installation or other up-front fees. Under current accounting rules, installation fees related to services provided over our cable networks are recognized as revenue in the period during which the installation occurs to the extent these fees are equal to or less than direct selling costs. Under
ASU 2014-09
, these fees will generally be deferred and recognized as revenue over the contractual period, or longer if the up-front fee results in a material renewal right.
|
As the above revenue recognition changes have offsetting impacts and both result in a relatively minor shift in the timing of revenue recognition, we currently do not expect
ASU 2014-09
to have a material impact on our reported revenue.
ASU 2014-09
will also impact our accounting for certain upfront costs directly associated with obtaining and fulfilling customer contracts. Under our current policy, these costs are expensed as incurred unless the costs are in the scope of another accounting topic that allows for capitalization. Under
ASU 2014-09
, the upfront costs that are currently expensed as incurred will be recognized as assets and amortized to other operating expenses over a period that is consistent with the transfer to the customers of the goods or services to which the assets relate, which we have generally interpreted to be the expected customer life. The impact of the accounting change for these costs will be dependent on numerous factors, including the number of new subscriber contracts added in any given period, but we expect the adoption of this accounting change will initially result in the deferral of a significant amount of operating and selling costs.
The ultimate impact of adopting
ASU 2014-09
for both revenue recognition and costs to obtain and fulfill contracts will depend on the promotions and offers in place
during the period leading up to and after the adoption
of
ASU 2014-09
.
ASU 2016-02
In February 2016, the
FASB
issued
ASU
No. 2016-02,
Leases
(
ASU 2016-02
), which, for most leases, will result in lessees recognizing lease assets and lease liabilities on the balance sheet with additional disclosures about leasing arrangements.
ASU 2016-02
requires lessees and lessors to recognize and measure leases at the beginning of the earliest period presented using a modified retrospective approach. The modified retrospective approach also includes a number of optional practical expedients an entity may elect to apply.
ASU 2016-02
is effective for annual reporting periods beginning after December 15, 2018, including interim periods within those fiscal years, with early adoption permitted. Although we are currently evaluating the effect that
ASU 2016-02
will have on our consolidated financial statements, we expect the adoption of this standard will increase the number of leases to be accounted for as capital leases in our consolidated balance sheet.
ASU 2016-09
In March 2016, the
FASB
issued
ASU
No. 2016-09,
Compensation
—
Stock Compensation, Improvements to Employee Share-Based Payment Accounting
(
ASU 2016-09
), which simplifies several aspects of the accounting for share-based payment transactions, including income tax consequences, classification of awards as either equity or liabilities and classification within the statement of cash flows. ASU 2016-09 is effective for annual reporting periods beginning after December 15, 2016, including interim periods within those fiscal years, with early adoption permitted. ASU 2016-09 will result in, among other matters, the immediate recognition for financial reporting purposes of excess tax benefits that currently are not recognized until such time as these tax benefits can be realized as a reduction of income taxes payable.
ASU 2017-04
II-108
LIBERTY GLOBAL PLC
Notes to Consolidated Financial Statements — (Continued)
December 31, 2016, 2015 and 2014
(
3
)
Summary of Significant Accounting Policies
The preparation of financial statements in conformity with accounting principles generally accepted in the U.S. (
U.S. GAAP
) requires management to make estimates and assumptions that affect the reported amounts of assets and liabilities at the date of the financial statements and the reported amounts of revenue and expenses during the reporting period. Estimates and assumptions are used in accounting for, among other things, the valuation of acquisition-related assets and liabilities, allowances for uncollectible accounts, programming and copyright expenses, deferred income taxes and related valuation allowances, loss contingencies, fair value measurements, impairment assessments, capitalization of internal costs associated with construction and installation activities, useful lives of long-lived assets, share-based compensation and actuarial liabilities associated with certain benefit plans. Actual results could differ from those estimates.
Certain prior year amounts have been reclassified to conform to the current year presentation, including the reclassification of deferred financing costs from other long-term assets to long-term debt and capital lease obligations and the reclassification of certain costs between programming and other direct costs of services, other operating and SG&A expenses. For additional information regarding the change in the classification of deferred financing costs, see
“Accounting Changes”
in note
2
.
The accompanying consolidated financial statements include our accounts and the accounts of all voting interest entities where we exercise a controlling financial interest through the ownership of a direct or indirect controlling voting interest and variable interest entities for which our company is the primary beneficiary. All significant intercompany accounts and transactions have been eliminated in consolidation.
Cash equivalents consist of money market funds and other investments that are readily convertible into cash and have maturities of three months or less at the time of acquisition. We record money market funds at the net asset value reported by the investment manager as there are no restrictions on our ability, contractual or otherwise, to redeem our investments at the stated net asset value reported by the investment manager.
Restricted cash consists of cash held in restricted accounts, including cash held as collateral for debt and other compensating balances. Restricted cash amounts that are required to be used to purchase long-term assets or repay long-term debt are classified as long-term assets. All other cash that is restricted to a specific use is classified as current or long-term based on the expected timing of the disbursement. At
December 31, 2016
and
2015
, our current and long-term restricted cash balances aggregated
$
39.1
million
and
$
127.9
million
, respectively.
Our trade receivables are reported net of an allowance for doubtful accounts. Such allowance aggregated
$
193.4
million
and
$
115.7
million
at
December 31, 2016
and
2015
, respectively. The allowance for doubtful accounts is based upon our assessment of probable loss related to uncollectible accounts receivable. We use a number of factors in determining the allowance, including, among other things, collection trends, prevailing and anticipated economic conditions and specific customer credit risk. The allowance is maintained until either payment is received or the likelihood of collection is considered to be remote.
II-109
LIBERTY GLOBAL PLC
Notes to Consolidated Financial Statements — (Continued)
December 31, 2016, 2015 and 2014
We make elections, on an investment-by-investment basis, as to whether we measure our investments at fair value. Such elections are generally irrevocable. With the exception of those investments over which we exercise significant influence, we generally elect the fair value method. For those investments over which we exercise significant influence, we generally elect the equity method.
Under the fair value method, investments are recorded at fair value and any changes in fair value are reported in realized and unrealized gains or losses due to changes in fair values of certain investments and debt, net, in our consolidated statements of operations. All costs directly associated with the acquisition of an investment to be accounted for using the fair value method are expensed as incurred. Under the equity method of accounting, investments are recorded at cost and are subsequently increased or reduced to reflect our share of income or losses of the investee. All costs directly associated with the acquisition of an investment to be accounted for using the equity method are included in the carrying amount of the investment. For additional information regarding our fair value and equity method investments, see notes
6
and
8
.
Under the equity method, investments, originally recorded at cost, are adjusted to recognize our share of net earnings or losses of the affiliates as they occur rather than as dividends or other distributions are received, with our recognition of losses generally limited to the extent of our investment in, and advances and commitments to, the investee. The portion of the difference between our investment and our share of the net assets of the investee that represents goodwill is not amortized, but continues to be considered for impairment. Intercompany profits on transactions with equity affiliates for which assets remain on our or our investee’s balance sheet are eliminated to the extent of our ownership in the investee.
Dividends from publicly-traded investees that are not accounted for under the equity method are recognized when declared as dividend income in our consolidated statements of operations. Dividends from our equity method investees and all of our privately-held investees are reflected as reductions of the carrying values of the applicable investments. Dividends that are deemed to be (i) returns on our investments are included in cash flows from operating activities in our consolidated statements of cash flows and (ii) returns of our investments are included in cash flows from investing activities in our consolidated statements of cash flows.
We continually review all of our equity and cost method investments to determine whether a decline in fair value below the cost basis is other-than-temporary. The primary factors we consider in our determination are the extent and length of time that the fair value of the investment is below our company’s carrying value and the financial condition, operating performance and near-term prospects of the investee, changes in the stock price or valuation subsequent to the balance sheet date, and the impacts of exchange rates, if applicable. If the decline in fair value of an equity or cost method investment is deemed to be other-than-temporary, the cost basis of the security is written down to fair value.
Due to the short maturities of cash and cash equivalents, restricted cash, short-term liquid investments, trade and other receivables, other current assets, accounts payable, accrued liabilities and other accrued and current liabilities, their respective carrying values approximate their respective fair values. For information concerning the fair values of certain of our investments, derivatives and debt, see notes
6
,
7
and
10
, respectively. For information regarding how we arrive at certain of our fair value measurements, see note
8
.
All derivative instruments, whether designated as hedging relationships or not, are recorded on the balance sheet at fair value. If the derivative instrument is not designated as a hedge, changes in the fair value of the derivative instrument are recognized in earnings. If the derivative instrument is designated as a cash flow hedge, the effective portions of changes in the fair value of the derivative instrument are recorded in other comprehensive earnings or loss and subsequently reclassified into our consolidated statements of operations when the hedged forecasted transaction affects earnings. Ineffective portions of changes in the fair value of cash flow hedges are recognized in earnings. With the exception of a limited number of our foreign currency forward contracts, we do not apply hedge accounting to our derivative instruments.
II-110
LIBERTY GLOBAL PLC
Notes to Consolidated Financial Statements — (Continued)
December 31, 2016, 2015 and 2014
The net cash received or paid related to our derivative instruments is classified as an operating, investing or financing activity in our consolidated statements of cash flows based on the objective of the derivative instrument and the classification of the applicable underlying cash flows. For foreign currency forward contracts that are used to hedge capital expenditures, the net cash received or paid is classified as an adjustment to capital expenditures in our consolidated statements of cash flows. For derivative contracts that are terminated prior to maturity, the cash paid or received upon termination that relates to future periods is classified as a financing activity in our consolidated statement of cash flows.
Property and equipment are stated at cost less accumulated depreciation. We capitalize costs associated with the construction of new cable and mobile transmission and distribution facilities and the installation of new cable services. Capitalized construction and installation costs include materials, labor and other directly attributable costs. Installation activities that are capitalized include (i) the initial connection (or drop) from our cable system to a customer location, (ii) the replacement of a drop and (iii) the installation of equipment for additional services, such as digital cable, telephone or broadband internet service. The costs of other customer-facing activities, such as reconnecting customer locations where a drop already exists, disconnecting customer locations and repairing or maintaining drops, are expensed as incurred. Interest capitalized with respect to construction activities was not material during any of the periods presented.
Capitalized internal-use software is included as a component of property and equipment. We capitalize internal and external costs directly associated with the development of internal-use software. We also capitalize costs associated with the purchase of software licenses. Maintenance and training costs, as well as costs incurred during the preliminary stage of an internal-use software development project, are expensed as incurred.
Depreciation is computed using the straight-line method over the estimated useful life of the underlying asset. Equipment under capital leases is amortized on a straight-line basis over the shorter of the lease term or estimated useful life of the asset. Useful lives used to depreciate our property and equipment are assessed periodically and are adjusted when warranted. The useful lives of cable and mobile distribution systems that are undergoing a rebuild are adjusted such that property and equipment to be retired will be fully depreciated by the time the rebuild is completed. For additional information regarding the useful lives of our property and equipment, see note
9
.
Additions, replacements and improvements that extend the asset life are capitalized. Repairs and maintenance are charged to operations.
We recognize a liability for asset retirement obligations in the period in which it is incurred if sufficient information is available to make a reasonable estimate of fair values. Asset retirement obligations may arise from the loss of rights of way that we obtain from local municipalities or other relevant authorities. Under certain circumstances, the authorities could require us to remove our network equipment from an area if, for example, we were to discontinue using the equipment for an extended period of time or the authorities were to decide not to renew our access rights. However, because the rights of way are integral to our ability to deliver broadband communications services to our customers, we expect to conduct our business in a manner that will allow us to maintain these rights for the foreseeable future. In addition, we have no reason to believe that the authorities will not renew our rights of way and, historically, renewals have been granted. We also have obligations in lease agreements to restore the property to its original condition or remove our property at the end of the lease term. Sufficient information is not available to estimate the fair value of our asset retirement obligations in certain of our lease arrangements. This is the case for long-term lease arrangements in which the underlying leased property is integral to our operations, there is not an acceptable alternative to the leased property and we have the ability to indefinitely renew the lease. Accordingly, for most of our rights of way and certain lease agreements, the possibility is remote that we will incur significant removal costs in the foreseeable future and, as such, we do not have sufficient information to make a reasonable estimate of fair value for these asset retirement obligations.
As of
December 31, 2016
and
2015
, the recorded value of our asset retirement obligations was
$
96.3
million
and
$
63.9
million
, respectively.
II-111
LIBERTY GLOBAL PLC
Notes to Consolidated Financial Statements — (Continued)
December 31, 2016, 2015 and 2014
Our primary intangible assets relate to goodwill, customer relationships and cable television franchise rights. Goodwill represents the excess purchase price over the fair value of the identifiable net assets acquired in a business combination. Customer relationships and cable television franchise rights are initially recorded at their fair values in connection with business combinations.
Goodwill and other intangible assets with indefinite useful lives are not amortized, but instead are tested for impairment at least annually. Intangible assets with finite lives are amortized on a straight-line basis over their respective estimated useful lives to their estimated residual values, and reviewed for impairment.
When circumstances warrant, we review the carrying amounts of our property and equipment and our intangible assets (other than goodwill and other indefinite-lived intangible assets) to determine whether such carrying amounts continue to be recoverable. Such changes in circumstance may include (i) an expectation of a sale or disposal of a long-lived asset or asset group, (ii) adverse changes in market or competitive conditions, (iii) an adverse change in legal factors or business climate in the markets in which we operate and (iv) operating or cash flow losses. For purposes of impairment testing, long-lived assets are grouped at the lowest level for which cash flows are largely independent of other assets and liabilities, generally at or below the reporting unit level (see below). If the carrying amount of the asset or asset group is greater than the expected undiscounted cash flows to be generated by such asset or asset group, an impairment adjustment is recognized. Such adjustment is measured by the amount that the carrying value of such asset or asset group exceeds its fair value. We generally measure fair value by considering (a) sale prices for similar assets, (b) discounted estimated future cash flows using an appropriate discount rate and/or (c) estimated replacement cost. Assets to be disposed of are recorded at the lower of their carrying amount or fair value less costs to sell.
II-112
LIBERTY GLOBAL PLC
Notes to Consolidated Financial Statements — (Continued)
December 31, 2016, 2015 and 2014
Income taxes are accounted for under the asset and liability method. We recognize deferred tax assets and liabilities for the future tax consequences attributable to differences between the financial statement carrying amounts and income tax basis of assets and liabilities and the expected benefits of utilizing net operating loss and tax credit carryforwards, using enacted tax rates in effect for each taxing jurisdiction in which we operate for the year in which those temporary differences are expected to be recovered or settled. We recognize the financial statement effects of a tax position when it is more-likely-than-not, based on technical merits, that the position will be sustained upon examination. Net deferred tax assets are then reduced by a valuation allowance if we believe it is more-likely-than-not such net deferred tax assets will not be realized. Certain of our valuation allowances and tax uncertainties are associated with entities that we acquired in business combinations. The effect on deferred tax assets and liabilities of a change in tax rates is recognized in earnings in the period that includes the enactment date. Deferred tax liabilities related to investments in foreign subsidiaries and foreign corporate joint ventures that are essentially permanent in duration are not recognized until it becomes apparent that such amounts will reverse in the foreseeable future. In order to be considered essentially permanent in duration, sufficient evidence must indicate that the foreign subsidiary has invested or will invest its undistributed earnings indefinitely, or that earnings will be remitted in a tax-free liquidation. Interest and penalties related to income tax liabilities are included in income tax benefit or expense in our consolidated statements of operations. For additional information on our income taxes, see note
11
.
The reporting currency of our company is the
U.S.
dollar. The functional currency of our foreign operations generally is the applicable local currency for each foreign subsidiary and equity method investee. Assets and liabilities of foreign subsidiaries (including intercompany balances for which settlement is not anticipated in the foreseeable future) are translated at the spot rate in effect at the applicable reporting date. With the exception of certain material transactions, the amounts reported in our consolidated statements of operations are translated at the average exchange rates in effect during the applicable period. The resulting unrealized cumulative translation adjustment, net of applicable income taxes, is recorded as a component of accumulated other comprehensive earnings or loss in our consolidated statements of equity. With the exception of certain material transactions, the cash flows from our operations in foreign countries are translated at the average rate for the applicable period in our consolidated statements of cash flows. The impacts of material transactions generally are recorded at the applicable spot rates in our consolidated statements of operations and cash flows. The effect of exchange rates on cash balances held in foreign currencies are separately reported in our consolidated statements of cash flows.
Service Revenue — Cable Networks.
We recognize revenue from the provision of video, broadband internet and fixed-line telephony services over our cable network to customers in the period the related services are provided. Installation revenue (including reconnect fees) related to services provided over our cable network is recognized as revenue in the period during which the installation occurs to the extent these fees are equal to or less than direct selling costs, which costs are expensed as incurred. To the extent installation revenue exceeds direct selling costs, the excess revenue is deferred and amortized over the average expected subscriber life.
Sale of Multiple Products and Services.
We sell video, broadband internet, fixed-line telephony and, in most of our markets, mobile services to our customers in bundled packages at a rate lower than if the customer purchased each product on a standalone basis. Revenue from bundled packages generally is allocated proportionally to the individual services based on the relative standalone price for each respective service.
Mobile Revenue — General.
Consideration from mobile contracts is allocated to the airtime service element and the handset service element based on the relative standalone prices of each element. The amount of consideration allocated to the handset is limited to the amount that is not contingent upon the delivery of future airtime services. Certain of our operations that provide
II-113
LIBERTY GLOBAL PLC
Notes to Consolidated Financial Statements — (Continued)
December 31, 2016, 2015 and 2014
mobile services offer handsets under a subsidized contract model, whereby upfront revenue recognition is limited to the upfront cash collected from the customer as the remaining monthly fees to be received from the customer, including fees that may be associated with the handset, are contingent upon delivering future airtime services. At certain of our operations, mobile customers may choose to enter into two distinct contractual relationships: (i) a mobile handset contract and (ii) a mobile airtime services contract (a
Split-contract Program
). Under the mobile handset contract, the customer takes full title to the handset upon delivery and typically has the option to either (a) pay for the handset in cash upon delivery or (b) pay for the handset in installments over a contractual period. Under these arrangements, the handset installment payments are not contingent upon delivering future airtime services and the consideration allocated to the handset is not limited to the upfront cash collected.
Mobile Revenue — Airtime Services.
We recognize revenue from mobile services in the period the related services are provided. Revenue from pre-pay customers is recorded as deferred revenue prior to the commencement of services and revenue is recognized as the services are rendered or usage rights expire.
Mobile Revenue — Handset Revenue.
Arrangement consideration allocated to handsets is recognized as revenue when the goods have been delivered and title has passed. For customers under a mobile handset installment contract that is independent of a mobile airtime services contract, revenue is recognized upon delivery only if collectibility is reasonably assured. Our assessment of collectibility is based principally on internal and external credit assessments as well as historical collection information for similar customers. To the extent that collectibility of installment payments from the customer is not reasonably assured upon delivery of the handset, handset revenue is recognized on a cash basis as customer payments are received.
B2B
Revenue.
We defer upfront installation and certain nonrecurring fees received on
B2B
contracts where we maintain ownership of the installed equipment. The deferred fees are amortized into revenue on a straight-line basis over the term of the arrangement or the expected period of performance.
Promotional Discounts.
For subscriber promotions, such as discounted or free services during an introductory period, revenue is recognized only to the extent of the discounted monthly fees charged to the subscriber, if any.
Subscriber Advance Payments and Deposits.
Payments received in advance for the services we provide are deferred and recognized as revenue when the associated services are provided.
We recognize all share-based payments to employees, including grants of employee share-based incentive awards, based on their grant-date fair values and our estimates of forfeitures. We recognize the grant-date fair value of outstanding awards as a charge to operations over the vesting period. The cash benefits of tax deductions in excess of deferred taxes on recognized share-based compensation expense are reported as a financing cash flow. Payroll taxes incurred in connection with the vesting or exercise of our share-based incentive awards are recorded as a component of share-based compensation expense in our consolidated statements of operations.
We use the straight-line method to recognize share-based compensation expense for our outstanding share awards that do not contain a performance condition and the accelerated expense attribution method for our outstanding share awards that contain a performance condition and vest on a graded basis.
The grant date fair values for options, share appreciation rights (
SAR
s
) and performance-based share appreciation rights (
PSAR
s
) are estimated using the Black-Scholes option pricing model, and the grant date fair values for restricted share units (
RSU
s
) and performance-based restricted share units (
PSU
s)
are based upon the closing share price of
Liberty Global
ordinary shares on the date of grant. We calculate the expected life of options and
SAR
s granted by
Liberty Global
to employees based on historical exercise trends. The expected volatility for options and
SAR
s related to
Liberty Global Shares
is generally based on a combination of (i) historical volatilities of
Liberty Global Shares
for a period equal to the expected average life of the awards and (ii) volatilities implied from publicly-traded options for
Liberty Global Shares
. The expected volatility for options and SARs related to
LiLAC Shares
is generally based on a combination of (a) historical volatilities of
LiLAC Shares
for a period equal to the expected average life of the award and, if this data is unavailable, historical volatilities of ordinary shares of a relevant peer
II-114
LIBERTY GLOBAL PLC
Notes to Consolidated Financial Statements — (Continued)
December 31, 2016, 2015 and 2014
group for a period equal to the expected average life of the award, and (b) volatilities implied from publicly-traded options for
LiLAC Shares
where available.
We generally issue new
Liberty Global
ordinary shares when
Liberty Global
options or
SAR
s are exercised and when
RSU
s and
PSU
s vest. Although we repurchase
Liberty Global
ordinary shares from time to time, the parameters of our share purchase and redemption activities are not established solely with reference to the dilutive impact of our share-based compensation plans.
|
|
Year ended December 31,
|
||||||||||
|
|
2016
|
2015
|
2014
|
||||||||
|
|
in millions
|
||||||||||
|
Net earnings (loss) attributable to holders of:
|
|||||||||||
|
Liberty Global Shares (a)
|
$
|
|
|
$
|
(
|
)
|
$
|
|
|
||
|
LiLAC Shares (a)
|
(
|
)
|
|
|
|
|
|||||
|
Old Liberty Global Shares (b):
|
|||||||||||
|
Loss from continuing operations
|
|
|
(
|
)
|
(
|
)
|
|||||
|
Earnings from discontinued operation
|
|
|
|
|
|
|
|||||
|
|
|
(
|
)
|
(
|
)
|
||||||
|
Net earnings (loss)
attributable to Liberty Global shareholders
|
$
|
|
|
$
|
(
|
)
|
$
|
(
|
)
|
||
_______________
|
(a)
|
The amounts presented for the year ended December 31, 2015 relate to the period from July 1, 2015 through December 31, 2015.
|
|
(b)
|
|
II-115
LIBERTY GLOBAL PLC
Notes to Consolidated Financial Statements — (Continued)
December 31, 2016, 2015 and 2014
|
Year ended December 31,
|
||||||||
|
2016
|
2015
|
2014
|
||||||
|
Weighted average shares outstanding:
|
||||||||
|
Liberty Global Shares (a):
|
||||||||
|
Basic
|
|
|
|
|
||||
|
Diluted
|
|
|
|
|
||||
|
LiLAC Shares (a):
|
||||||||
|
Basic
|
|
|
|
|
||||
|
Diluted
|
|
|
|
|
||||
|
Old Liberty Global Shares — basic and diluted (b)
|
|
|
|
|
||||
_______________
|
(a)
|
The amounts presented for the year ended December 31, 2015 relate to the period from July 1, 2015 through December 31, 2015.
|
|
(b)
|
|
Liberty Global Shares
.
|
Numerator:
|
|||
|
Net earnings attributable to holders of Liberty Global Shares (basic EPS computation) (in millions)
|
$
|
|
|
|
Interest expense on Virgin Media’s 6.50% convertible senior notes
|
|
|
|
|
Net earnings attributable to holders of Liberty Global Shares (diluted EPS computation) (in millions)
|
$
|
|
|
|
Denominator:
|
|||
|
Weighted average ordinary shares (basic EPS computation)
|
|
|
|
|
Incremental shares attributable to the assumed exercise of outstanding options, SARs and PSARs and the release of share units upon vesting (treasury stock method)
|
|
|
|
|
Virgin Media’s 6.50% convertible senior notes
|
|
|
|
|
Weighted average ordinary shares (diluted EPS computation)
|
|
|
|
We reported a loss from continuing operations attributable to holders of
Liberty Global Shares
for the period from July 1, 2015 through
December 31, 2015
. Therefore, the potentially dilutive effect at
December 31, 2015
of the following items was not included in the computation of diluted loss per share attributable to holders of
Liberty Global Shares
because their inclusion would have been anti-dilutive to the computation or, in the case of certain
PSU
s and performance grant units (
PGUs
), because such awards had not yet met the applicable performance criteria: (i) the aggregate number of shares issuable pursuant to outstanding options,
SAR
s,
PSAR
s and
RSU
s of approximately
43.3
million
, (ii) the aggregate number of shares issuable pursuant to
PSU
s and
PGUs
of approximately
4.5
million
and (iii) the aggregate number of shares issuable pursuant to obligations that may be settled in cash or shares of approximately
2.7
million
.
LiLAC Shares
.
We reported a loss attributable to holders of
LiLAC Shares
during the year ended
December 31, 2016
. Therefore, the potentially dilutive effect at
December 31, 2016
of the following items was not included in the computation of diluted loss per share attributable to holders of
LiLAC Shares
because their inclusion would have been anti-dilutive to the computation or, in the case of certain
II-116
LIBERTY GLOBAL PLC
Notes to Consolidated Financial Statements — (Continued)
December 31, 2016, 2015 and 2014
PSU
s and
PGUs
, because such awards had not yet met the applicable performance criteria: (i) the aggregate number of shares issuable pursuant to outstanding options,
SAR
s,
PSAR
s and
RSU
s of approximately
7.5
million
and (ii) the aggregate number of shares issuable pursuant to outstanding
PSU
s and
PGUs
of approximately
1.1
million
.
|
Numerator:
|
|||
|
Net earnings attributable to holders of LiLAC Shares (basic and diluted EPS computation) (in millions)
|
$
|
|
|
|
Denominator:
|
|||
|
Weighted average ordinary shares (basic EPS computation)
|
|
|
|
|
Incremental shares attributable to the assumed exercise of outstanding options, SARs and PSARs and the release of share units upon vesting (treasury stock method)
|
|
|
|
|
Weighted average ordinary shares (diluted EPS computation)
|
|
|
|
Old Liberty Global Shares
(
4
)
Acquisitions
Pending Acquisitions
SFR BeLux
. On December 22, 2016, a subsidiary of
Telenet
entered into a definitive agreement to acquire Coditel Brabant sprl, operating under the SFR brand (
SFR BeLux
), for
€
400.0
million
(
$
421.9
million
)
on a cash and debt free basis.
SFR BeLux
provides cable services to households and businesses in Brussels, Wallonia and Luxembourg and offers mobile services in Belgium through a mobile virtual network operator (
MVNO
) agreement with
BASE
, as defined and described below.
Telenet
intends to finance the acquisition of
SFR BeLux
through a combination of existing cash and cash equivalents and available liquidity under its revolving credit facilities. The transaction is subject to customary closing conditions, including approval from the relevant competition authorities, and is expected to close during the second half of 2017.
Multimedia
. On October 18, 2016, our subsidiary UPC Polska SP Z.o.o. entered into a definitive agreement to acquire the cable business of Multimedia Polska S.A. (
Multimedia
), the third-largest cable operator in Poland, for cash consideration of PLN
3.0
billion
(
$
718.2
million
), which is equal to the enterprise value assigned to
Multimedia
for purposes of this transaction. We intend to finance the acquisition of
Multimedia
with existing liquidity. The final purchase price is subject to potential downward adjustments for the operational and financial performance of
Multimedia
prior to closing. The transaction is subject to customary closing conditions, including regulatory approval, and is expected to close in late 2017 or early 2018.
2016 Acquisitions
CWC
.
On
May 16, 2016
, we acquired
CWC
for shares of
Liberty Global
(the
CWC Acquisition
). Under the terms of the transaction,
CWC
shareholders received in the aggregate:
31,607,008
Class A
Liberty Global Shares
,
77,379,774
Class C
Liberty Global Shares
,
3,648,513
Class A
LiLAC Shares
and
8,939,316
Class C
LiLAC Shares
. Further, immediately prior to the acquisition,
CWC
declared a special cash dividend (the
Special Dividend
) to its shareholders in the amount of
£
0.03
(
$
0.04
at the transaction date) per
CWC
share. The
Special Dividend
was paid to
CWC
shareholders promptly following the closing and the payment,
II-117
LIBERTY GLOBAL PLC
Notes to Consolidated Financial Statements — (Continued)
December 31, 2016, 2015 and 2014
together with fees and expenses related to the acquisition, was funded with
CWC
liquidity, including incremental debt borrowings, and
LiLAC Group
corporate liquidity. We acquired
CWC
in order to achieve certain financial, operational and strategic benefits through the integration of
CWC
with our existing operations in the
LiLAC Group
.
The
CWC Acquisition
triggered regulatory approval requirements in certain jurisdictions in which
CWC
operates. The regulatory authorities in certain of these jurisdictions, including the Bahamas, Jamaica, Trinidad and Tobago, the Seychelles and the Cayman Islands, have not completed their review of the
CWC Acquisition
or granted their approval. While we expect to receive all outstanding approvals, such approvals may include binding conditions or requirements that could have an adverse impact on
CWC
’s operations and financial condition.
|
Class A Liberty Global Shares (a)
|
$
|
|
|
|
Class C Liberty Global Shares (a)
|
|
|
|
|
Class A LiLAC Shares (a)
|
|
|
|
|
Class C LiLAC Shares (a)
|
|
|
|
|
Special Dividend (b)
|
|
|
|
|
Total
|
$
|
|
|
_______________
|
(a)
|
Represents the fair value of the
|
|
(b)
|
|
II-118
LIBERTY GLOBAL PLC
Notes to Consolidated Financial Statements — (Continued)
December 31, 2016, 2015 and 2014
We have accounted for the
CWC Acquisition
using the acquisition method of accounting, whereby the total purchase price was allocated to the acquired identifiable net assets of
CWC
based on assessments of their respective fair values, and the excess of the purchase price over the fair values of these identifiable net assets was allocated to goodwill. The preliminary opening balance sheet is subject to adjustment based on our final assessment of the fair values of the acquired identifiable assets and liabilities. Although most items in the valuation process remain open, the items with the highest likelihood of changing upon finalization of the valuation process include
property and equipment, goodwill, customer relationships, trademarks, noncontrolling interests and income taxes.
A summary of the purchase price and the preliminary opening balance sheet of
CWC
at the
May 16, 2016
acquisition date is presented in the following table (in millions):
|
Cash and cash equivalents
|
$
|
|
|
|
Other current assets
|
|
|
|
|
Property and equipment, net
|
|
|
|
|
Goodwill (a)
|
|
|
|
|
Intangible assets subject to amortization, net (b)
|
|
|
|
|
Other assets, net
|
|
|
|
|
Current portion of debt and capital lease obligations
|
(
|
)
|
|
|
Other accrued and current liabilities
|
(
|
)
|
|
|
Long-term debt and capital lease obligations
|
(
|
)
|
|
|
Other long-term liabilities
|
(
|
)
|
|
|
Noncontrolling interests (c)
|
(
|
)
|
|
|
Total purchase price (d)
|
$
|
|
|
_______________
|
(a)
|
The goodwill recognized in connection with the
CWC Acquisition
is primarily attributable to (i) the ability to take advantage of
CWC
’s existing terrestrial and sub-sea networks to gain immediate access to potential customers and (ii) synergies that are expected to be achieved through the integration of
CWC
with other operations in the
LiLAC Group
.
|
|
(b)
|
Amount primarily includes intangible assets related to customer relationships. At
May 16, 2016
, the preliminary assessment of the weighted average useful life of
CWC
’s intangible assets was approximately
|
|
(c)
|
Represents the estimated aggregate fair value of the noncontrolling interests in
CWC
’s subsidiaries as of
May 16, 2016
.
|
|
(d)
|
|
Following completion of the
CWC Acquisition
, we attributed
CWC
to the
LiLAC Group
, with the
Liberty Global Group
being granted an inter-group interest in the
LiLAC Group
representing the fair value (as determined by our board of directors) of the
Liberty Global Shares
issued as part of the purchase consideration. On July 1, 2016, we distributed (as a bonus issue)
117,430,965
LiLAC Shares
to
Liberty Global Group
shareholders on a pro-rata basis (the
LiLAC Distribution
), thereby eliminating the
Liberty Global Group
's inter-group interest in the
LiLAC Group
. The
LiLAC Distribution
was accounted for prospectively effective July 1, 2016.
BASE
. On
February 11, 2016
,
Telenet
acquired Telenet Group BVBA, formerly known as BASE Company NV (
BASE
), for a cash purchase price of
€
1,318.9
million
(
$
1,494.3
million
at the transaction date) (the
BASE Acquisition
).
BASE
is the third-largest mobile network operator in Belgium. We expect that the
BASE Acquisition
will provide
Telenet
with cost-effective long-term mobile access to effectively compete for future growth opportunities in the Belgium mobile market. The
BASE Acquisition
was funded through a combination of
€
1.0
billion
(
$
1.1
billion
at the transaction date) of new debt facilities and existing liquidity of
Telenet
. The acquisition was approved by the European Commission subject to
Telenet
’s agreement to divest both the JIM Mobile prepaid customer base and
BASE
’s
50
%
stake in Viking Co NV (
Viking
) to MEDIALAAN NV. In February 2016,
Telenet
completed the sale of its stake in
Viking
. The divestiture of the JIM Mobile prepaid customer base is expected to occur during the third quarter of 2017.
II-119
LIBERTY GLOBAL PLC
Notes to Consolidated Financial Statements — (Continued)
December 31, 2016, 2015 and 2014
We have accounted for the
BASE Acquisition
using the acquisition method of accounting, whereby the total purchase price was allocated to the acquired identifiable net assets of
BASE
based on assessments of their respective fair values, and the excess of the purchase price over the fair values of these identifiable net assets was allocated to goodwill.
A summary of the purchase price and the opening balance sheet of
BASE
at the
February 11, 2016
acquisition date is presented in the following table. The opening balance sheet presented below reflects our final purchase price allocation (in millions):
|
Cash and cash equivalents
|
$
|
|
|
|
Other current assets
|
|
|
|
|
Property and equipment, net
|
|
|
|
|
Goodwill (a)
|
|
|
|
|
Intangible assets subject to amortization, net:
|
|||
|
Mobile spectrum (b)
|
|
|
|
|
Customer relationships (c)
|
|
|
|
|
Trademarks (d)
|
|
|
|
|
Other assets, net
|
|
|
|
|
Other accrued and current liabilities
|
(
|
)
|
|
|
Other long-term liabilities
|
(
|
)
|
|
|
Total purchase price (e)
|
$
|
|
|
_______________
|
(a)
|
The goodwill recognized in connection with the
BASE Acquisition
is primarily attributable to (i) the ability to take advantage of
BASE
’s existing mobile network to gain immediate access to potential customers and (ii) synergies that are expected to be achieved through the integration of
BASE
with
Telenet
.
|
|
(b)
|
As of
February 11, 2016
, the weighted average useful life of
BASE
’s mobile spectrum was approximately
|
|
(c)
|
As of
February 11, 2016
, the weighted average useful life of
BASE
’s customer relationships was approximately
|
|
(d)
|
As of
February 11, 2016
, the weighted average useful life of
BASE
’s trademarks was approximately
|
|
(e)
|
|
2015 Acquisition
On June 3, 2015, pursuant to a stock purchase agreement with the parent of Puerto Rico Cable Acquisition Company Inc., dba Choice Cable TV (
Choice
) and following regulatory approval, one of our subsidiaries, together with investment funds affiliated with Searchlight Capital Partners, L.P. (collectively,
Searchlight
), acquired
100
%
of
Choice
(the
Choice Acquisition
).
Choice
is a cable and broadband services provider in Puerto Rico. We acquired
Choice
in order to achieve certain financial, operational and strategic benefits through the integration of
Choice
with
Liberty Puerto Rico
. The combined business is
60.0
%
-owned by our company and
40.0
%
-owned by
Searchlight
.
The purchase price for
Choice
of
$
276.4
million
was funded through (i)
Liberty Puerto Rico
’s incremental debt borrowings, net of discount and fees, of
$
259.1
million
, (ii) cash of
$
10.5
million
and (iii) an equity contribution from
Searchlight
of
$
6.8
million
.
II-120
LIBERTY GLOBAL PLC
Notes to Consolidated Financial Statements — (Continued)
December 31, 2016, 2015 and 2014
We have accounted for the
Choice Acquisition
using the acquisition method of accounting, whereby the total purchase price was allocated to the acquired identifiable net assets of
Choice
based on assessments of their respective fair values, and the excess of the purchase price over the fair values of these identifiable net assets was allocated to goodwill. A summary of the purchase price and opening balance sheet of
Choice
at the June 3, 2015 acquisition date is presented in the following table.
The opening balance sheet presented below reflects our final purchase price allocation (in millions):
|
Cash and cash equivalents
|
$
|
|
|
|
Other current assets
|
|
|
|
|
Property and equipment, net
|
|
|
|
|
Goodwill (a)
|
|
|
|
|
Intangible assets subject to amortization, net (b)
|
|
|
|
|
Cable television franchise rights
|
|
|
|
|
Other assets, net
|
|
|
|
|
Other accrued and current liabilities
|
(
|
)
|
|
|
Non-current deferred tax liabilities
|
(
|
)
|
|
|
Total purchase price (c)
|
$
|
|
|
_______________
|
(a)
|
The goodwill recognized in connection with the
Choice Acquisition
is primarily attributable to (i) the ability to take advantage of
Choice
’s existing advanced broadband communications network to gain immediate access to potential customers and (ii) synergies that are expected to be achieved through the integration of
Choice
with
Liberty Puerto Rico
.
|
|
(b)
|
Amount primarily includes intangible assets related to customer relationships. As of June 3, 2015, the weighted average useful life of
Choice
’s intangible assets was approximately
|
|
(c)
|
|
2014 Acquisition
On November 11, 2014 (the
Ziggo Acquisition Date
), pursuant to a merger protocol (the
Ziggo Merger Protocol
) with respect to an offer to acquire all of the shares of Ziggo Holding B.V. (
Ziggo
) that we did not already own (the
Ziggo Offer
), we gained control of
Ziggo
through the acquisition of
136,603,794
additional
Ziggo
shares, which increased our ownership interest in
Ziggo
to
88.9
%
(the
Ziggo Acquisition
). From November 12, 2014 through November 19, 2014, we acquired
18,998,057
additional
Ziggo
shares, further increasing our ownership interest in
Ziggo
to
98.4
%
(the
Ziggo NCI Acquisition
).
Ziggo
is a provider of video, broadband internet, fixed-line telephony and mobile services in the Netherlands. We acquired
Ziggo
in order to achieve certain financial, operational and strategic benefits through the integration of
Ziggo
with with our then-existing operations in the Netherlands and our other European operations.
On December 31, 2016, our operations in the Netherlands were contributed to the
Dutch JV
, as defined and described in note
5
.
Pursuant to the
Ziggo Merger Protocol
,
Ziggo
shareholders who tendered their
Ziggo
shares received an offer price of (i)
0.2282
Class A
Old Liberty Global Shares
, (ii)
0.5630
Class C
Old Liberty Global Shares
and (iii)
€
11.00
(
$
13.71
at the applicable rates) in cash for each
Ziggo
share that they tendered. In connection with the completion of the
Ziggo Acquisition
and the
Ziggo NCI Acquisition
, we (a) issued an aggregate of
35,508,342
Class A and
87,603,842
Class C
Old Liberty Global Shares
and (b) paid aggregate cash consideration of
€
1,711.6
million
(
$
2,133.6
million
at the applicable rates) to holders of
Ziggo
ordinary shares.
On December 3, 2014, we initiated a statutory squeeze-out procedure in accordance with the Dutch Civil Code (the
Statutory Squeeze-out
) in order to acquire the remaining
3,162,605
Ziggo
shares not tendered through November 19, 2014. Under the
Statutory Squeeze-out
, which was completed during the second quarter of 2015,
Ziggo
shareholders other than
Liberty Global
received cash consideration of
€
39.78
(
$
44.91
at the applicable rates) per share, plus interest, for an aggregate of
€
125.9
million
(
$
142.2
million
at the applicable rates). This amount was approved in April 2015 by the Enterprise Court in the Netherlands.
II-121
LIBERTY GLOBAL PLC
Notes to Consolidated Financial Statements — (Continued)
December 31, 2016, 2015 and 2014
For accounting purposes, (i) the
Ziggo Acquisition
was treated as the acquisition of
Ziggo
by
Liberty Global
and (ii) the
Ziggo NCI Acquisition
and the
Statutory Squeeze-out
were treated as the acquisitions of a noncontrolling interest.
In July 2015, the Dutch incumbent telecommunications operator filed an appeal against the European Commission regarding its decision to approve the
Ziggo Acquisition
. We are not a party to the appeal and we do not expect that the filing of this appeal will have any impact on the ongoing integration and development of our operations in the Netherlands.
|
Class A Old Liberty Global Shares (a)
|
$
|
|
|
|
Class C Old Liberty Global Shares (a)
|
|
|
|
|
Cash (b)
|
|
|
|
|
Fair value of pre-existing investment in Ziggo (c)
|
|
|
|
|
Total
|
$
|
|
|
_______________
|
(a)
|
Represents the value assigned to the
|
|
(b)
|
Represents the cash consideration paid in connection with the
Ziggo Acquisition
.
|
|
(c)
|
|
We have accounted for the
Ziggo Acquisition
using the acquisition method of accounting, whereby the total purchase price was allocated to the acquired identifiable net assets of
Ziggo
based on assessments of their respective fair values, and the excess of the purchase price over the fair values of these identifiable net assets was allocated to goodwill.
A summary of the purchase price and the opening balance sheet for the
Ziggo Acquisition
as of the
Ziggo Acquisition Date
is presented in the following table. The opening balance sheet presented below reflects our final purchase price allocation (in millions):
|
Cash and cash equivalents (a)
|
$
|
|
|
|
Other current assets
|
|
|
|
|
Property and equipment, net
|
|
|
|
|
Goodwill (b)
|
|
|
|
|
Intangible assets subject to amortization, net (c)
|
|
|
|
|
Other assets, net
|
|
|
|
|
Current portion of debt and capital lease obligations
|
(
|
)
|
|
|
Other accrued and current liabilities
|
(
|
)
|
|
|
Long-term debt and capital lease obligations
|
(
|
)
|
|
|
Other long-term liabilities
|
(
|
)
|
|
|
Noncontrolling interest (d)
|
(
|
)
|
|
|
Total purchase price (e)
|
$
|
|
|
_______________
|
(a)
|
The
Ziggo Acquisition
resulted in
$
|
II-122
LIBERTY GLOBAL PLC
Notes to Consolidated Financial Statements — (Continued)
December 31, 2016, 2015 and 2014
|
(b)
|
The goodwill recognized in connection with the
Ziggo Acquisition
was primarily attributable to (i) the ability to take advantage of
Ziggo
’s existing advanced broadband communications network to gain immediate access to potential customers and (ii) synergies that were expected to be achieved through the integration of
Ziggo
with our then-existing operations in the Netherlands and our other European operations.
|
|
(c)
|
Amount primarily includes intangible assets related to customer relationships. As of the
Ziggo Acquisition Date
, the weighted average useful life of
Ziggo
’s intangible assets was approximately
|
|
(d)
|
Represents the fair value of the noncontrolling interest in
Ziggo
as of the
Ziggo Acquisition Date
.
|
|
(e)
|
|
|
Reduction of noncontrolling interests
|
$
|
|
|
|
Additional paid-in capital
|
|
|
|
|
Fair value of consideration paid (a)
|
$
|
|
|
_______________
|
(a)
|
|
The cash consideration paid in the
Ziggo Acquisition
and the
Ziggo NCI Acquisition
was funded with a combination of debt and our existing liquidity.
Pro Forma Information
In pro forma tables presented below, we present the revenue that is attributed to the
Liberty Global Group
and the
LiLAC Group
as if such revenue had been attributed to each group at the beginning of each period presented. However, our presentation of net earnings or loss and basic and diluted
earnings or loss
per share attributed to (i)
Liberty Global Shares
, (ii)
LiLAC Shares
and (iii)
Old Liberty Global Shares
only includes the results of operations for the periods during which these shares were outstanding. Accordingly, (a) our net earnings or loss attributed to
Liberty Global Shares
and
LiLAC Shares
relates to periods subsequent to July 1, 2015 and (b) our net loss attributed to
Old Liberty Global Shares
relates to periods prior to July 1, 2015.
II-123
LIBERTY GLOBAL PLC
Notes to Consolidated Financial Statements — (Continued)
December 31, 2016, 2015 and 2014
|
Year ended December 31,
|
|||||||
|
|
2016
|
2015
|
|||||
|
|
in millions, except per
share amounts
|
||||||
|
Revenue:
|
|||||||
|
Liberty Global Group
|
$
|
|
|
$
|
|
|
|
|
LiLAC Group
|
|
|
|
|
|||
|
Total
|
$
|
|
|
$
|
|
|
|
|
Net earnings (
loss)
attributable to Liberty Global shareholders:
|
|||||||
|
Liberty Global Shares
|
$
|
|
|
$
|
(
|
)
|
|
|
LiLAC Shares
|
|
|
(
|
)
|
|||
|
Old Liberty Global Shares
|
|
|
(
|
)
|
|||
|
Total
|
$
|
|
|
$
|
(
|
)
|
|
|
Basic and diluted earnings (loss)
attributable to Liberty Global shareholders per share:
|
|||||||
|
Liberty Global Shares
|
|||||||
|
Basic
|
$
|
|
|
$
|
(
|
)
|
|
|
Diluted
|
$
|
|
|
$
|
(
|
)
|
|
|
LiLAC Shares
|
|||||||
|
Basic and diluted
|
$
|
|
|
$
|
(
|
)
|
|
|
Old Liberty Global Shares
|
|||||||
|
Basic and diluted
|
$
|
(
|
)
|
||||
Our consolidated statement of operations for
2016
includes revenue and net loss
of
(i)
$
1,443.6
million
and
$
30.4
million
, respectively, attributable to
CWC
and (ii)
$
597.1
million
and
$
2.1
million
, respectively, attributable to
BASE
.
II-124
LIBERTY GLOBAL PLC
Notes to Consolidated Financial Statements — (Continued)
December 31, 2016, 2015 and 2014
The following unaudited pro forma consolidated operating results give effect to (i) the acquisition of
100
%
of
Ziggo
and (ii) the
Choice Acquisition
, as if they had been completed as of January 1,
2014
.
These pro forma amounts are not necessarily indicative of the operating results that would have occurred if these transactions had occurred on such date.
The pro forma adjustments are based on certain assumptions that we believe are reasonable.
|
|
Year ended December 31,
|
||||||
|
|
2015
|
2014
|
|||||
|
|
in millions, except per
share amounts
|
||||||
|
Revenue:
|
|||||||
|
Liberty Global Group:
|
|||||||
|
Continuing operations
|
$
|
|
|
$
|
|
|
|
|
Discontinued operation
|
|
|
|
|
|||
|
Total Liberty Global Group
|
|
|
|
|
|||
|
LiLAC Group
|
|
|
|
|
|||
|
Total
|
$
|
|
|
$
|
|
|
|
|
Net earnings (loss) attributable to Liberty Global shareholders:
|
|||||||
|
Liberty Global Shares
|
$
|
(
|
)
|
$
|
|
|
|
|
LiLAC Shares
|
|
|
|
|
|||
|
Old Liberty Global Shares
|
(
|
)
|
(
|
)
|
|||
|
Total
|
$
|
(
|
)
|
$
|
(
|
)
|
|
|
Basic and diluted earnings (loss)
attributable to Liberty Global shareholders per share:
|
|||||||
|
Liberty Global Shares
|
$
|
(
|
)
|
||||
|
LiLAC Shares
|
$
|
|
|
||||
|
Old Liberty Global Shares
|
$
|
(
|
)
|
$
|
(
|
)
|
|
(
5
)
Dutch JV Transaction
and Discontinued Operation
Dutch JV Transaction
On December 31, 2016, pursuant to a Contribution and Transfer Agreement with Vodafone Group plc (
Vodafone
) and one of its wholly-owned subsidiaries, we and Liberty Global Europe Holding B.V., our wholly-owned subsidiary, contributed
Ziggo Group Holding
and its subsidiaries (including Liberty Global Netherlands Content B.V., referred to herein as “
Ziggo Sport
”) to VodafoneZiggo Group Holding B.V., a newly-formed
50
:
50
joint venture (referred to herein as the “
Dutch JV
”).
Ziggo Sport
, which became a subsidiary of
Ziggo Group Holding
during the fourth quarter of 2016, operates premium sports channels in the Netherlands. The
Dutch JV
combined
Ziggo Group Holding
with
Vodafone
’s mobile businesses in the Netherlands (
Vodafone NL
) to create a national unified communications provider in the Netherlands with complementary strengths across video, broadband, mobile and
B2B
services (the
Dutch JV Transaction
). As a result of the
Dutch JV Transaction
, effective December 31, 2016 we no longer consolidate
Ziggo Group Holding
. For additional information regarding our investment in the
Dutch JV
, see note 6.
On January 4, 2017, in connection with the completion of the
Dutch JV Transaction
, our company received cash of
€
2.2
billion
(
$
2.3
billion
at the transaction date) comprising (i) our
50
%
share of the
€
2.8
billion
(
$
2.9
billion
at the transaction date) of net proceeds from the various debt financing arrangements entered into by certain subsidiaries of
Ziggo Group Holding
during the third quarter of 2016, which proceeds were held in escrow through December 31, 2016, and (ii) an equalization payment from
II-125
LIBERTY GLOBAL PLC
Notes to Consolidated Financial Statements — (Continued)
December 31, 2016, 2015 and 2014
Vodafone
of
€
802.9
million
(
$
840.8
million
at the transaction date) that is subject to post-closing adjustments. Our right to receive this cash is reflected in our
December 31, 2016
consolidated balance sheet as a current receivable from the
Dutch JV
.
In connection with the
Dutch JV Transaction
, we recognized a pre-tax gain of
$
520.8
million
, net of the recognition of a cumulative foreign currency translation loss of
$
714.5
million
. This gain, which was calculated by deducting the carrying value of
Ziggo Group Holding
(including the related foreign currency translation loss) from the sum of (i) the fair value assigned to our
50
%
interest in the
Dutch JV
and (ii) the cash received pursuant to the equalization payment, includes
$
260.4
million
related to the remeasurement of our retained investment in
Ziggo Group Holding
. For information regarding our approach to the valuation of our interest in the
Dutch JV
, see note
8
.
Our consolidated statements of operations include aggregate earnings (loss) before income taxes attributable to
Ziggo Group Holding
and
Ziggo Sport
of (
$
276.4
million
), (
$
534.5
million
) and
$
270.2
million
during
2016
,
2015
and
2014
, respectively.
The December 31, 2016 carrying amounts of the major classes of assets and liabilities associated with
Ziggo Group Holding
, which was contributed into the
Dutch JV
, are summarized below (in millions):
|
Assets:
|
|||
|
Cash and cash equivalents
|
$
|
|
|
|
Current restricted cash
|
|
|
|
|
Current assets other than cash
|
|
|
|
|
Property and equipment, net
|
|
|
|
|
Goodwill
|
|
|
|
|
Intangible assets subject to amortization, net
|
|
|
|
|
Other assets, net
|
|
|
|
|
Total assets
|
$
|
|
|
|
Liabilities:
|
|||
|
Current portion of debt and capital lease obligations
|
$
|
|
|
|
Other accrued and current liabilities
|
|
|
|
|
Long-term debt and capital lease obligations
|
|
|
|
|
Other long-term liabilities
|
|
|
|
|
Total liabilities
|
$
|
|
|
Discontinued Operation
On January 31, 2014, we completed the sale of the
Chellomedia Disposal Group
to AMC Networks Inc. for
€
750.0
million
(
$
1,013.1
million
at the applicable rate) in cash. Accordingly, the
Chellomedia Disposal Group
is reflected as a discontinued operation in our consolidated statements of operations and cash flows for 2014. The assets disposed of pursuant to the
Chellomedia Transaction
exclude
Chellomedia
’s premium sports and film channels in the Netherlands. In connection with the sale of the
Chellomedia Disposal Group
, we recognized a pre-tax gain of
$
342.2
million
. This pre-tax gain is net of a
$
64.0
million
cumulative foreign currency translation loss, which was reclassified to net loss from accumulated other comprehensive earnings. The associated income tax expense of
$
9.5
million
differs from the amount computed by applying the
U.K.
statutory income tax rate in effect at the time of
21.5
%
primarily due to the fact that (i) the transaction was not subject to taxation in the
U.K.
and (ii) most elements of the transaction were not subject to taxation in the Netherlands or the
U.S.
The net after-tax gain of
$
332.7
million
is included in gain on disposal of discontinued operation, net of taxes, in our consolidated statement of operations.
Certain of our broadband communications operations will continue to receive programming services from the
Chellomedia Disposal Group
through contracts that were negotiated as part of the disposal. As such,
Liberty Global
will have continuing cash outflows associated with the
Chellomedia Disposal Group
through at least 2017. However, our involvement as an ongoing customer of the
Chellomedia Disposal Group
does not disqualify discontinued operations classification because (i) the ongoing cash outflows are not considered significant to the
Chellomedia Disposal Group
and (ii)
Liberty Global
does not possess any rights within the ongoing contractual arrangements that would allow us to exert influence over the
Chellomedia Disposal Group
.
II-126
LIBERTY GLOBAL PLC
Notes to Consolidated Financial Statements — (Continued)
December 31, 2016, 2015 and 2014
|
Year ended
December 31, 2014 (a) (b)
|
|||
|
in millions
|
|||
|
Revenue
|
$
|
|
|
|
Operating income
|
$
|
|
|
|
Earnings before income taxes and noncontrolling interests
|
$
|
|
|
|
Income tax expense
|
$
|
(
|
)
|
|
Earnings from discontinued operation attributable to Liberty Global shareholders, net of taxes
|
$
|
|
|
_______________
|
(a)
|
Includes the operating results of the
Chellomedia Disposal Group
through January 31, 2014, the date the
Chellomedia Disposal Group
was sold.
|
|
(b)
|
|
(
6
)
Investments
|
December 31,
|
||||||||
|
Accounting Method
|
2016
|
2015
|
||||||
|
|
in millions
|
|||||||
|
Equity:
|
||||||||
|
Dutch JV (a)
|
$
|
|
|
$
|
|
|
||
|
Other
|
|
|
|
|
||||
|
Total — equity
|
|
|
|
|
||||
|
Fair value:
|
||||||||
|
ITV — subject to re-use rights
|
|
|
|
|
||||
|
Sumitomo
|
|
|
|
|
||||
|
ITI Neovision
|
|
|
|
|
||||
|
Lionsgate
|
|
|
|
|
||||
|
Other
|
|
|
|
|
||||
|
Total — fair value
|
|
|
|
|
||||
|
Cost
|
|
|
|
|
||||
|
Total
|
$
|
|
|
$
|
|
|
||
_______________
|
(a)
|
|
II-127
LIBERTY GLOBAL PLC
Notes to Consolidated Financial Statements — (Continued)
December 31, 2016, 2015 and 2014
Equity Method Investments
Dutch JV
.
On December 31, 2016, we completed the
Dutch JV Transaction
. Each of
Liberty Global
and
Vodafone
(each a “
Shareholder
”) holds
50
%
of the issued share capital of the
Dutch JV
. The
Shareholder
s intend for the
Dutch JV
to be funded solely from its net cash flow from operations and third-party financing. We account for our
50
%
interest in the
Dutch JV
, which has been attributed to the
Liberty Global Group
, as an equity method investment. We consider the
Dutch JV
to be a related party. For additional information regarding the formation of the
Dutch JV
, see note
5
.
In connection with the formation of the
Dutch JV
, the
Shareholder
s entered into a shareholders agreement (the
Shareholders Agreement
). The
Shareholders Agreement
contains customary provisions for the governance of a
50
:
50
joint venture that result in
Liberty Global
and
Vodafone
having joint control over decision making with respect to the
Dutch JV
.
The
Shareholders Agreement
also provides (i) for a dividend policy that requires the
Dutch JV
to distribute all unrestricted cash to the
Shareholder
s every
two months
(subject to the
Dutch JV
maintaining a minimum amount of cash and complying with the terms of its financing arrangements) and (ii) that the
Dutch JV
will be managed with a leverage ratio of between
4.5
and
5.0
times EBITDA (as calculated pursuant to its existing financing arrangements) with the
Dutch JV
undertaking periodic recapitalizations and/or refinancings accordingly.
Each
Shareholder
has the right to initiate an initial public offering (
IPO
) of the
Dutch JV
after the third anniversary of the closing, with the opportunity for the other
Shareholder
to sell shares in the IPO on a pro rata basis. Subject to certain exceptions, the
Shareholders Agreement
prohibits transfers of interests in the
Dutch JV
to third parties until the fourth anniversary of the closing. After the fourth anniversary, each
Shareholder
will be able to initiate a sale of all of its interest in the
Dutch JV
to a third party and, under certain circumstances, initiate a sale of the entire
Dutch JV
; subject, in each case, to a right of first offer in favor of the other
Shareholder
.
Pursuant to an agreement entered into in connection with the closing of the
Dutch JV
(the
Framework Agreement
),
Liberty Global
will provide certain services to the
Dutch JV
on a transitional or ongoing basis (collectively, the
Dutch JV Services
). Pursuant to the terms of the
Framework Agreement
, the ongoing services will be provided for a period of
four
to
six years
depending on the type of service, while transitional services will be provided for a period of not less than
12
months
after which both parties shall be entitled to terminate based on specified notice periods. The
Dutch JV Services
provided by
Liberty Global
will consist primarily of (i) technology and other services and (ii) capital-related expenditures for assets that will be used by or will otherwise benefit the
Dutch JV
.
Liberty Global
will charge both fixed and variable fees to the
Dutch JV
for the
Dutch JV Services
it provides during the term of the
Framework Agreement
, including estimated total fees of approximately
€
120
million
(
$
127
million
) during 2017 and minimum fees of approximately
€
100
million
(
$
105
million
) and
€
75
million
(
$
79
million
) during 2018 and 2019, respectively. The estimated fees for the
Dutch JV Services
during 2017 include approximately
€
23
million
(
$
24
million
) of costs that were related to goods and services that were centrally purchased by a
Liberty Global
corporate subsidiary and passed through to our Netherlands segment, which in turn reported these costs as operating expenses in 2016. Beginning in 2017, these costs will remain in
Liberty Global
's operating expenses and will therefore offset a portion of the fees for the
Dutch JV Services
. The charges for the
Dutch JV Services
will be included in revenue in our consolidated statement of operations.
|
Current assets
|
$
|
|
|
|
Long-term assets
|
|
|
|
|
Total assets
|
$
|
|
|
|
Current liabilities (a)
|
$
|
|
|
|
Long-term liabilities
|
|
|
|
|
Owners’ equity
|
|
|
|
|
Total liabilities and owners’ equity
|
$
|
|
|
_______________
|
(a)
|
|
II-128
LIBERTY GLOBAL PLC
Notes to Consolidated Financial Statements — (Continued)
December 31, 2016, 2015 and 2014
Fair Value Investments
ITV
. At December 31, 2016, we owned
398,515,510
shares of ITV plc (
ITV
), a commercial broadcaster in the
U.K.
Our
ITV
shares represented less than
10.0
%
of the total outstanding shares of
ITV
as of June 30, 2016, the most current publicly-available information. The aggregate purchase price paid to acquire our investment in
ITV
was financed through borrowings under secured borrowing agreements (the
ITV Collar Loan
). All of the
ITV
shares we hold are subject to a share collar (the
ITV Collar
) and pledged as collateral under the
ITV Collar Loan
. Under the terms of the
ITV Collar
, the counterparty has the right to re-use all of the pledged
ITV
shares. For additional information regarding the
ITV Collar
, see note
7
.
Sumitomo
. At
December 31, 2016
and
2015
, we owned
45,652,043
shares of Sumitomo Corporation (
Sumitomo
) common stock. Our
Sumitomo
shares represented less than
5
%
of
Sumitomo
’s outstanding common stock at September 30, 2016, the most current publicly-available information. These shares secure the
Sumitomo Collar Loan
and the
Sumitomo Share Loan
, each as defined and described in note
7
.
ITI Neovision
. At
December 31, 2016
and
2015
, we owned a
17.0
%
interest in ITI Neovision S.A. (
ITI Neovision
)
, a privately-held direct-to-home (
DTH
) operator in Poland.
(
7
)
Derivative Instruments
In general, we seek to enter into derivative instruments to protect against (i) increases in the interest rates on our variable-rate debt, (ii) foreign currency movements, particularly with respect to borrowings that are denominated in a currency other than the functional currency of the borrowing entity and (iii) decreases in the market prices of certain publicly traded securities that we own. In this regard, through our subsidiaries, we have entered into various derivative instruments to manage interest rate exposure and foreign currency exposure with respect to the
U.S.
dollar (
$
), the euro (
€
), the British pound sterling (
£
), the Swiss franc (
CHF
), the Chilean peso (
CLP
), the Czech koruna (
CZK
), the Hungarian forint (
HUF
), Indian rupee (
INR
), the Jamaican dollar (
JMD
), the Philippine peso (
PHP
), the the Polish zloty (
PLN
) and the Romanian lei (
RON
).
II-129
LIBERTY GLOBAL PLC
Notes to Consolidated Financial Statements — (Continued)
December 31, 2016, 2015 and 2014
|
|
December 31, 2016
|
December 31, 2015
|
|||||||||||||||||||||
|
|
Current (a)
|
Long-term (a)
|
Total
|
Current (a)
|
Long-term (a)
|
Total
|
|||||||||||||||||
|
|
in millions
|
||||||||||||||||||||||
|
Assets:
|
|||||||||||||||||||||||
|
Cross-currency and interest rate derivative contracts:
|
|||||||||||||||||||||||
|
Liberty Global Group
|
$
|
|
|
$
|
|
|
$
|
|
|
$
|
|
|
$
|
|
|
$
|
|
|
|||||
|
LiLAC Group
|
|
|
|
|
|
|
|
|
|
|
|
|
|||||||||||
|
Total cross-currency and interest rate derivative contracts (b)
|
|
|
|
|
|
|
|
|
|
|
|
|
|||||||||||
|
Equity-related derivative instruments - Liberty Global Group (c)
|
|
|
|
|
|
|
|
|
|
|
|
|
|||||||||||
|
Foreign currency forward and option contracts:
|
|||||||||||||||||||||||
|
Liberty Global Group
|
|
|
|
|
|
|
|
|
|
|
|
|
|||||||||||
|
LiLAC Group
|
|
|
|
|
|
|
|
|
|
|
|
|
|||||||||||
|
Total foreign currency forward and option contracts
|
|
|
|
|
|
|
|
|
|
|
|
|
|||||||||||
|
Other - Liberty Global Group
|
|
|
|
|
|
|
|
|
|
|
|
|
|||||||||||
|
Total assets:
|
|||||||||||||||||||||||
|
Liberty Global Group
|
|
|
|
|
|
|
|
|
|
|
|
|
|||||||||||
|
LiLAC Group
|
|
|
|
|
|
|
|
|
|
|
|
|
|||||||||||
|
Total
|
$
|
|
|
$
|
|
|
$
|
|
|
$
|
|
|
$
|
|
|
$
|
|
|
|||||
|
Liabilities:
|
|||||||||||||||||||||||
|
Cross-currency and interest rate derivative contracts:
|
|||||||||||||||||||||||
|
Liberty Global Group
|
$
|
|
|
$
|
|
|
$
|
|
|
$
|
|
|
$
|
|
|
$
|
|
|
|||||
|
LiLAC Group
|
|
|
|
|
|
|
|
|
|
|
|
|
|||||||||||
|
Total cross-currency and interest rate derivative contracts (b)
|
|
|
|
|
|
|
|
|
|
|
|
|
|||||||||||
|
Equity-related derivative instruments - Liberty Global Group (c)
|
|
|
|
|
|
|
|
|
|
|
|
|
|||||||||||
|
Foreign currency forward contracts:
|
|||||||||||||||||||||||
|
Liberty Global Group
|
|
|
|
|
|
|
|
|
|
|
|
|
|||||||||||
|
LiLAC Group
|
|
|
|
|
|
|
|
|
|
|
|
|
|||||||||||
|
Total foreign currency forward and option contracts
|
|
|
|
|
|
|
|
|
|
|
|
|
|||||||||||
|
Other - Liberty Global Group
|
|
|
|
|
|
|
|
|
|
|
|
|
|||||||||||
|
Total liabilities:
|
|||||||||||||||||||||||
|
Liberty Global Group
|
|
|
|
|
|
|
|
|
|
|
|
|
|||||||||||
|
LiLAC Group
|
|
|
|
|
|
|
|
|
|
|
|
|
|||||||||||
|
Total
|
$
|
|
|
$
|
|
|
$
|
|
|
$
|
|
|
$
|
|
|
$
|
|
|
|||||
II-130
LIBERTY GLOBAL PLC
Notes to Consolidated Financial Statements — (Continued)
December 31, 2016, 2015 and 2014
_______________
|
(a)
|
Our current derivative liabilities, long-term derivative assets and long-term derivative liabilities are included in other current and accrued liabilities, other assets, net, and other long-term liabilities, respectively, in our consolidated balance sheets.
|
|
(b)
|
We consider credit risk in our fair value assessments. As of
December 31, 2016
and
2015
, (i) the fair values of our cross-currency and interest rate derivative contracts that represented assets have been reduced by credit risk valuation adjustments aggregating
$
|
|
(c)
|
Our equity-related derivative instruments primarily include the fair value of (i) the
ITV Collar
(ii) the share collar with respect to the shares of
Sumitomo
held by our company (the
Sumitomo Collar
), (iii) the
Lionsgate Forward
and (iv) at December 31, 2015,
Virgin Media
’s conversion hedges with respect to
Virgin Media
’s
|
II-131
LIBERTY GLOBAL PLC
Notes to Consolidated Financial Statements — (Continued)
December 31, 2016, 2015 and 2014
|
|
Year ended December 31,
|
||||||||||
|
|
2016
|
2015
|
2014
|
||||||||
|
|
in millions
|
||||||||||
|
Cross-currency and interest rate derivative contracts:
|
|||||||||||
|
Liberty Global Group
|
$
|
|
|
$
|
|
|
$
|
|
|
||
|
LiLAC Group
|
(
|
)
|
|
|
|
|
|||||
|
Total cross-currency and interest rate derivative contracts
|
|
|
|
|
|
|
|||||
|
Equity-related derivative instruments - Liberty Global Group:
|
|||||||||||
|
ITV Collar
|
|
|
(
|
)
|
(
|
)
|
|||||
|
Sumitomo Collar
|
(
|
)
|
(
|
)
|
(
|
)
|
|||||
|
Lionsgate Forward
|
|
|
|
|
|
|
|||||
|
Ziggo Collar (a)
|
|
|
|
|
(
|
)
|
|||||
|
Other
|
|
|
|
|
|
|
|||||
|
Total equity-related derivative instruments
|
|
|
(
|
)
|
(
|
)
|
|||||
|
Foreign currency forward and option contracts:
|
|||||||||||
|
Liberty Global Group
|
|
|
(
|
)
|
|
|
|||||
|
LiLAC Group
|
(
|
)
|
|
|
|
|
|||||
|
Total foreign currency forward contracts
|
|
|
|
|
|
|
|||||
|
Other - Liberty Global Group
|
(
|
)
|
|
|
(
|
)
|
|||||
|
Total Liberty Global Group
|
|
|
|
|
|
|
|||||
|
Total LiLAC Group
|
(
|
)
|
|
|
|
|
|||||
|
Total
|
$
|
|
|
$
|
|
|
$
|
|
|
||
_______________
|
(a)
|
|
II-132
LIBERTY GLOBAL PLC
Notes to Consolidated Financial Statements — (Continued)
December 31, 2016, 2015 and 2014
|
|
Year ended December 31,
|
||||||||||
|
|
2016
|
2015
|
2014
|
||||||||
|
|
in millions
|
||||||||||
|
Operating activities:
|
|||||||||||
|
Liberty Global Group
|
$
|
|
|
$
|
(
|
)
|
$
|
(
|
)
|
||
|
LiLAC Group
|
(
|
)
|
(
|
)
|
(
|
)
|
|||||
|
Total operating activities
|
|
|
(
|
)
|
(
|
)
|
|||||
|
Investing activities:
|
|||||||||||
|
Liberty Global Group
|
(
|
)
|
|
|
(
|
)
|
|||||
|
LiLAC Group
|
(
|
)
|
|
|
|
|
|||||
|
Total investing activities
|
(
|
)
|
|
|
(
|
)
|
|||||
|
Financing activities:
|
|||||||||||
|
Liberty Global Group
|
(
|
)
|
(
|
)
|
(
|
)
|
|||||
|
LiLAC Group
|
|
|
|
|
(
|
)
|
|||||
|
Total financing activities
|
(
|
)
|
(
|
)
|
(
|
)
|
|||||
|
Total cash outflows:
|
|||||||||||
|
Liberty Global Group
|
(
|
)
|
(
|
)
|
(
|
)
|
|||||
|
LiLAC Group
|
(
|
)
|
(
|
)
|
(
|
)
|
|||||
|
Total
|
$
|
(
|
)
|
$
|
(
|
)
|
$
|
(
|
)
|
||
Counterparty Credit Risk
We are exposed to the risk that the counterparties to the derivative instruments of our subsidiary borrowing groups will default on their obligations to us. We manage these credit risks through the evaluation and monitoring of the creditworthiness of, and concentration of risk with, the respective counterparties. In this regard, credit risk associated with our derivative instruments is spread across a relatively broad counterparty base of banks and financial institutions. With the exception of a limited number of instances where we have required a counterparty to post collateral, neither party has posted collateral under the derivative instruments of our subsidiary borrowing groups. At
December 31, 2016
, our exposure to counterparty credit risk included derivative assets with an aggregate fair value of
$
2,424.6
million
.
Each of our subsidiary borrowing groups have entered into derivative instruments under master agreements with each counterparty that contain master netting arrangements that are applicable in the event of early termination by either party to such derivative instrument. The master netting arrangements under each of these master agreements are limited to the derivative instruments governed by the relevant master agreement within each individual borrowing group and are independent of similar arrangements of our other subsidiary borrowing groups.
Under our derivative contracts, it is generally only the non-defaulting party that has a contractual option to exercise early termination rights upon the default of the other counterparty and to set off other liabilities against sums due upon such termination. However, in an insolvency of a derivative counterparty, under the laws of certain jurisdictions, the defaulting counterparty or its insolvency representatives may be able to compel the termination of one or more derivative contracts and trigger early termination payment liabilities payable by us, reflecting any mark-to-market value of the contracts for the counterparty. Alternatively, or in addition, the insolvency laws of certain jurisdictions may require the mandatory set off of amounts due under such derivative contracts against present and future liabilities owed to us under other contracts between us and the relevant counterparty. Accordingly, it is possible that we may be subject to obligations to make payments, or may have present or future liabilities owed to us partially or fully discharged by set off as a result of such obligations, in the event of the insolvency of a derivative counterparty, even though it is the counterparty that is in default and not us. To the extent that we are required to make such payments, our ability to do so will depend on our liquidity and capital resources at the time. In an insolvency of a defaulting counterparty, we will be an unsecured creditor in respect of any amount owed to us by the defaulting counterparty, except to the extent of the value of any collateral we have obtained from that counterparty.
II-133
LIBERTY GLOBAL PLC
Notes to Consolidated Financial Statements — (Continued)
December 31, 2016, 2015 and 2014
In addition, where a counterparty is in financial difficulty, under the laws of certain jurisdictions, the relevant regulators may be able to (i) compel the termination of one or more derivative instruments, determine the settlement amount and/or compel, without any payment, the partial or full discharge of liabilities arising from such early termination that are payable by the relevant counterparty or (ii) transfer the derivative instruments to an alternative counterparty.
Details of our Derivative Instruments
In the following tables, we present the details of the various categories of our subsidiaries’ derivative instruments. For each subsidiary with multiple derivative instruments that mature within the same calendar month, the notional amounts are shown in the aggregate, and interest rates are presented on a weighted average basis. In addition, for derivative instruments that were in effect as of
December 31, 2016
, we present a single date that represents the applicable final maturity date. For derivative instruments that become effective subsequent to
December 31, 2016
, we present a range of dates that represents the period covered by the applicable derivative instruments.
Cross-currency and Interest Rate Derivative Contracts
Cross-currency Swaps:
II-134
LIBERTY GLOBAL PLC
Notes to Consolidated Financial Statements — (Continued)
December 31, 2016, 2015 and 2014
II-135
LIBERTY GLOBAL PLC
Notes to Consolidated Financial Statements — (Continued)
December 31, 2016, 2015 and 2014
|
Subsidiary /
F
inal maturity date
|
Notional
amount
due from
counterparty
|
Notional
amount
due to
counterparty
|
Interest rate
due from counterparty |
Interest rate
due to (from) counterparty |
||||||||
|
|
in millions
|
|
|
|||||||||
|
Virgin Media Investment Holdings Limited (
VMIH
), a subsidiary of Virgin Media:
|
||||||||||||
|
January 2023
|
$
|
|
|
€
|
|
|
|
|
||||
|
January 2025
|
$
|
|
|
£
|
|
|
6 mo. LIBOR + 2.75%
|
6 mo. GBP LIBOR + 3.27%
|
||||
|
January 2023
|
$
|
|
|
£
|
|
|
|
|
||||
|
January 2025
|
$
|
|
|
£
|
|
|
6 mo. LIBOR + 2.75%
|
|
||||
|
August 2024
|
$
|
|
|
£
|
|
|
|
|
||||
|
February 2022 (a)
|
$
|
|
|
£
|
|
|
|
|
||||
|
April 2023 (a)
|
$
|
|
|
£
|
|
|
|
|
||||
|
February 2022 - April 2023
|
$
|
|
|
£
|
|
|
|
|
||||
|
October 2022
|
$
|
|
|
£
|
|
|
|
|
||||
|
January 2021
|
$
|
|
|
£
|
|
|
|
6 mo. GBP LIBOR + 2.06%
|
||||
|
January 2022 - January 2025
|
$
|
|
|
£
|
|
|
3 mo. LIBOR
|
|
||||
|
January 2022
|
$
|
|
|
£
|
|
|
|
|
||||
|
January 2025
|
$
|
|
|
£
|
|
|
6 mo. LIBOR + 2.75%
|
|
||||
|
April 2019
|
$
|
|
|
£
|
|
|
6 mo. LIBOR + 2.75%
|
|
||||
|
April 2019 - January 2025
|
$
|
|
|
£
|
|
|
6 mo. LIBOR + 2.75%
|
|
||||
|
October 2019
|
$
|
|
|
£
|
|
|
7.19%
|
|
||||
|
October 2019 - October 2022
|
$
|
|
|
£
|
|
|
|
|
||||
|
October 2019 - April 2023
|
$
|
|
|
£
|
|
|
|
|
||||
|
Subsidiary /
F
inal maturity date
|
Notional
amount
due from
counterparty
|
Notional
amount
due to
counterparty
|
Interest rate
due from counterparty |
Interest rate
due to (from) counterparty |
||||||||
|
|
in millions
|
|
|
|||||||||
|
October 2019 (a)
|
£
|
|
|
$
|
|
|
|
|
||||
|
UPC Broadband Holding B.V. (
UPC Broadband Holding
), a subsidiary of UPC Holding:
|
||||||||||||
|
January 2023
|
$
|
|
|
€
|
|
|
|
|
||||
|
August 2024
|
$
|
|
|
€
|
|
|
6 mo. LIBOR + 3.00%
|
6 mo. EURIBOR + 3.36%
|
||||
|
August 2024
|
$
|
|
|
€
|
|
|
6 mo. LIBOR + 3.00%
|
|
||||
|
January 2017 - August 2024
|
$
|
|
|
€
|
|
|
6 mo. LIBOR + 3.00%
|
6 mo. EURIBOR + 3.13%
|
||||
|
August 2024
|
$
|
|
|
€
|
|
|
|
|
||||
|
August 2024
|
$
|
|
|
CHF
|
|
|
6 mo. LIBOR + 3.00%
|
|
||||
|
August 2024
|
$
|
|
|
CHF
|
|
|
6 mo. LIBOR + 3.00%
|
6 mo. CHF LIBOR + 3.05%
|
||||
|
January 2017 - July 2023
|
$
|
|
|
CHF
|
|
|
6 mo. LIBOR + 2.50%
|
6 mo. CHF LIBOR + 2.48%
|
||||
|
August 2024
|
$
|
|
|
CHF
|
|
|
|
6 mo. CHF LIBOR + 5.01%
|
||||
|
January 2017 - July 2021
|
$
|
|
|
CHF
|
|
|
6 mo. LIBOR + 2.50%
|
6 mo. CHF LIBOR + 2.49%
|
||||
|
July 2021 - August 2024
|
$
|
|
|
CHF
|
|
|
6 mo. LIBOR + 3.00%
|
6 mo. CHF LIBOR + 2.48%
|
||||
|
August 2024 (a)
|
€
|
|
|
$
|
|
|
|
|
||||
|
September 2022
|
€
|
|
|
CHF
|
|
|
6 mo. EURIBOR + 2.59%
|
6 mo. CHF LIBOR + 2.71%
|
||||
|
January 2020
|
€
|
|
|
CHF
|
|
|
|
|
||||
|
July 2023
|
€
|
|
|
CHF
|
|
|
|
(
|
||||
|
January 2017 - August 2024
|
€
|
|
|
CHF
|
|
|
6 mo. EURIBOR + 2.00%
|
6 mo. CHF LIBOR + 2.27%
|
||||
|
January 2021
|
€
|
|
|
CHF
|
|
|
|
|
||||
|
January 2020
|
€
|
|
|
CHF
|
|
|
6 mo. EURIBOR + 3.75%
|
6 mo. CHF LIBOR + 2.88%
|
||||
|
August 2024
|
€
|
|
|
CHF
|
|
|
6 mo. EURIBOR + 2.50%
|
6 mo. CHF LIBOR + 3.07%
|
||||
|
July 2023
|
€
|
|
|
CHF
|
|
|
6 mo. EURIBOR + 2.21%
|
6 mo. CHF LIBOR + 2.65%
|
||||
|
January 2020
|
€
|
|
|
CZK
|
|
|
|
|
||||
|
January 2022
|
€
|
|
|
CZK
|
|
|
|
|
||||
|
December 2021
|
€
|
|
|
HUF
|
|
|
|
|
||||
|
January 2022
|
€
|
|
|
PLN
|
|
|
|
|
||||
|
January 2020
|
€
|
|
|
PLN
|
|
|
|
|
||||
|
January 2022
|
€
|
|
|
RON
|
|
|
|
|
||||
|
Unitymedia Hessen GmbH & Co. KG (
Unitymedia Hessen
), a subsidiary of Unitymedia:
|
||||||||||||
|
January 2023
|
$
|
|
|
€
|
|
|
|
|
||||
|
Telenet International Finance S.a.r.l (
Telenet International
), a subsidiary of Telenet:
|
||||||||||||
|
June 2024
|
$
|
|
|
€
|
|
|
3 mo. LIBOR + 3.50%
|
|
||||
|
Subsidiary /
F
inal maturity date
|
Notional
amount
due from
counterparty
|
Notional
amount
due to
counterparty
|
Interest rate
due from counterparty |
Interest rate
due to (from) counterparty |
||||||||
|
|
in millions
|
|
|
|||||||||
|
January 2025
|
$
|
|
|
€
|
|
|
3 mo. LIBOR + 3.00%
|
|
||||
|
June 2024
|
€
|
|
|
$
|
|
|
|
|
||||
|
Sable International Finance Limited (
Sable
), a subsidiary of CWC:
|
||||||||||||
|
December 2022
|
$
|
|
|
JMD
|
|
|
|
|
||||
|
March 2019
|
£
|
|
|
$
|
|
|
|
|
||||
|
VTR:
|
||||||||||||
|
January 2022
|
$
|
|
|
CLP
|
|
|
|
|
||||
_______________
|
(a)
|
|
Interest Rate Swaps:
II-136
LIBERTY GLOBAL PLC
Notes to Consolidated Financial Statements — (Continued)
December 31, 2016, 2015 and 2014
|
Subsidiary / Final maturity date
|
Notional amount
|
Interest rate due from
counterparty |
Interest rate due to (from)
counterparty |
|||||
|
|
in millions
|
|
|
|||||
|
VMIH:
|
||||||||
|
October 2017
|
$
|
|
|
1 mo. LIBOR + 2.75%
|
6 mo. LIBOR + 2.47%
|
|||
|
October 2018
|
£
|
|
|
6 mo. GBP LIBOR
|
|
|||
|
January 2021
|
£
|
|
|
6 mo. GBP LIBOR + 0.71%
|
|
|||
|
October 2018 - January 2025
|
£
|
|
|
6 mo. GBP LIBOR
|
|
|||
|
June 2023
|
£
|
|
|
6 mo. GBP LIBOR
|
|
|||
|
January 2021
|
£
|
|
|
|
6 mo. GBP LIBOR + 1.84%
|
|||
|
October 2018 - June 2023
|
£
|
|
|
6 mo. GBP LIBOR
|
|
|||
|
April 2023
|
£
|
|
|
|
6 mo. GBP LIBOR + 5.62%
|
|||
|
October 2022
|
£
|
|
|
|
6 mo. GBP LIBOR + 5.23%
|
|||
|
January 2025
|
£
|
|
|
6 mo. GBP LIBOR
|
|
|||
|
UPC Broadband Holding:
|
||||||||
|
January 2017 - January 2018
|
$
|
|
|
1 mo. LIBOR + 3.00%
|
6 mo. LIBOR + 2.56%
|
|||
|
August 2024
|
$
|
|
|
6 mo. LIBOR + 5.76%
|
|
|||
|
September 2022
|
€
|
|
|
|
6 mo. EURIBOR + 4.14%
|
|||
|
January 2026 (a)
|
€
|
|
|
6 mo. EURIBOR
|
|
|||
|
September 2022
|
CHF
|
|
|
6 mo. CHF LIBOR
|
|
|||
|
August 2024
|
CHF
|
|
|
6 mo. CHF LIBOR
|
|
|||
|
July 2021 - August 2024
|
CHF
|
|
|
6 mo. CHF LIBOR
|
|
|||
|
July 2021
|
CHF
|
|
|
6 mo. CHF LIBOR
|
|
|||
|
August 2024
|
CHF
|
|
|
6 mo. CHF LIBOR + 2.85%
|
|
|||
|
January 2020
|
CHF
|
|
|
6 mo. CHF LIBOR
|
(
|
|||
|
Subsidiary / Final maturity date
|
Notional amount
|
Interest rate due from
counterparty |
Interest rate due to (from)
counterparty |
|||||
|
|
in millions
|
|
|
|||||
|
Unitymedia Hessen:
|
||||||||
|
January 2023
|
€
|
|
|
6 mo. EURIBOR + 4.82%
|
|
|||
|
January 2023
|
€
|
|
|
|
6 mo. EURIBOR + 4.82%
|
|||
|
Telenet International:
|
||||||||
|
December 2017 (a)
|
$
|
|
|
1 mo. LIBOR + 3.00%
|
3 mo. LIBOR + 2.83%
|
|||
|
June 2023
|
€
|
|
|
3 mo. EURIBOR
|
|
|||
|
June 2023 - January 2025
|
€
|
|
|
3 mo. EURIBOR
|
|
|||
|
July 2017
|
€
|
|
|
3 mo. EURIBOR
|
(
|
|||
|
June 2023
|
€
|
|
|
|
3 mo. EURIBOR
|
|||
|
June 2022 - January 2025
|
€
|
|
|
3 mo. EURIBOR
|
|
|||
|
July 2017 - June 2022
|
€
|
|
|
3 mo. EURIBOR
|
|
|||
|
July 2017 - June 2023
|
€
|
|
|
3 mo. EURIBOR
|
|
|||
|
June 2022
|
€
|
|
|
3 mo. EURIBOR
|
|
|||
|
June 2023 - January 2025
|
€
|
|
|
3 mo. EURIBOR
|
|
|||
|
Sable:
|
||||||||
|
December 2017 (a)
|
$
|
|
|
1 mo. LIBOR + 4.75%
|
3 mo. LIBOR + 4.68%
|
|||
|
December 2022
|
$
|
|
|
3 mo. LIBOR
|
|
|||
|
Liberty Puerto Rico:
|
||||||||
|
January 2022
|
$
|
|
|
3 mo. LIBOR
|
|
|||
|
January 2019
|
$
|
|
|
3 mo. LIBOR
|
|
|||
_______________
|
(a)
|
|
II-137
LIBERTY GLOBAL PLC
Notes to Consolidated Financial Statements — (Continued)
December 31, 2016, 2015 and 2014
Interest Rate Caps
|
|
December 31, 2016
|
|||||
|
Subsidiary / Final maturity date
|
Notional amount
|
EURIBOR cap rate
|
||||
|
|
in millions
|
|
||||
|
Interest rate caps purchased:
|
||||||
|
Virgin Media Receivables Financing PLC (a):
|
||||||
|
October 2020
|
£
|
|
|
|
||
|
Liberty Global Europe Financing B.V. (
LGE Financing
), the immediate parent of UPC Holding (b):
|
||||||
|
January 2020
|
€
|
|
|
|
||
|
Telenet International (b):
|
||||||
|
June 2017
|
€
|
|
|
|
||
|
Telenet N.V., a subsidiary of Telenet (b):
|
||||||
|
December 2017
|
€
|
|
|
|
||
|
December 2017
|
€
|
|
|
|
||
|
Liberty Puerto Rico (a):
|
||||||
|
January 2022
|
$
|
|
|
|
||
|
January 2019 - July 2023
|
$
|
|
|
|
||
|
Interest rate cap sold (c):
|
||||||
|
UPC Broadband Holding:
|
||||||
|
January 2020
|
€
|
|
|
|
||
_______________
|
(a)
|
These purchased interest rate caps entitle us to receive payments from the counterparty when the relevant
LIBOR
exceeds the
LIBOR
cap rate during the specified observation periods.
|
|
(b)
|
These purchased interest rate caps entitle us to receive payments from the counterparty when the relevant
EURIBOR
exceeds the
EURIBOR
cap rate during the specified observation periods.
|
|
(c)
|
|
Interest Rate Collars
|
|
December 31, 2016
|
|||||||
|
Subsidiary / Final maturity date
|
Notional
amount
|
EURIBOR floor rate (a)
|
EURIBOR cap rate (b)
|
|||||
|
|
in millions
|
|
||||||
|
UPC Broadband Holding:
|
||||||||
|
July 2017 - January 2020
|
€
|
|
|
|
|
|||
_______________
|
(a)
|
We make payments to the counterparty when the relevant EURIBOR is less than the EURIBOR floor rate during the specified observation periods.
|
II-138
LIBERTY GLOBAL PLC
Notes to Consolidated Financial Statements — (Continued)
December 31, 2016, 2015 and 2014
|
(b)
|
|
Equity-related Derivative Instruments
ITV Collar
and Secured Borrowing
. The
ITV Collar
comprises (i) purchased put options exercisable by Liberty Global Incorporated Limited (
Liberty Global Limited
), our wholly-owned subsidiary, and (ii) written call options exercisable by the counterparty. The
ITV Collar
effectively hedges the value of our investment in
ITV
shares from losses due to market price decreases below the put option price while retaining
a portion of the gains from market price increases up to the call option price. The fair value of the
ITV Collar
as of
December 31, 2016
was a net asset of
$
311.9
million
, which is classified as non-current in our consolidated balance sheet. For additional information regarding our investment in
ITV
, see note
6
. The
ITV Collar
has settlement dates ranging from October 2017 through May 2019.
The
ITV Collar
and related agreements also provide
Liberty Global Limited
with the ability to effectively finance the purchase of its
ITV
shares pursuant to the
ITV Collar Loan
. In July 2014 and in connection with our initial investment in
ITV
,
Liberty Global Limited
borrowed
£
446.9
million
(
$
764.5
million
at the transaction date) under the
ITV Collar Loan
. In July 2015 and in connection with an additional investment in ITV (the
Additional ITV Investment
),
Liberty Global Limited
(i) modified the purchased put option and written call option strike prices within the
ITV Collar
and (ii) increased its borrowings under the
ITV Collar Loan
, resulting in net cash received of
$
92.0
million
. The amount received in connection with the
Additional ITV Investment
includes
$
77.5
million
of cash borrowings under the
ITV Collar Loan
that were not required to fund the
Additional ITV Investment
and
$
14.5
million
related to the
ITV Collar Loan
modifications. Immediately prior to the completion of these modifications, the fair value of the
ITV Collar
was a
$
270.5
million
liability. In connection with the
ITV Collar
modifications, this liability was effectively transferred on a non-cash basis to the principal amount of the
ITV Collar Loan
.
At
December 31, 2016
, borrowings under the
ITV Collar Loan
were secured by all
398,515,510
of our
ITV
shares, which have been placed into a custody account. The
ITV Collar Loan
was issued at a discount with a
zero
coupon rate and has an average implied yield of 139 basis points (
1.39
%
). The
ITV Collar Loan
, which has maturity dates consistent with the
ITV Collar
and contains no financial covenants, provides for customary representations and warranties, events of default and certain adjustment and termination events. Under the terms of the
ITV Collar
, the counterparty has the right to re-use the pledged
ITV
shares held in the custody account, but we have the right to recall the shares that are re-used by the counterparty subject to certain costs. In addition, the counterparty retains dividends on the
ITV
shares that the counterparty would need to borrow from the custody account to hedge its exposure under the
ITV Collar
(an estimated
390
million
shares at
December 31, 2016
).
Sumitomo Collar
and Secured Borrowing.
The
Sumitomo Collar
comprises purchased put options exercisable by Liberty Programming Japan LLC (
Liberty Programming Japan
), our wholly-owned subsidiary, and written call options exercisable by the counterparty with respect to a portion of the
Sumitomo
shares owned by
Liberty Programming Japan
. At
December 31, 2016
, the
Sumitomo Collar
effectively hedges the value of
27,391,305
, or
60
%
, of our
Sumitomo
shares from losses due to market price decreases below the put strike price. The
Sumitomo Collar
provides for a projected gross cash ordinary dividend to be paid per
Sumitomo
share during the term of the
Sumitomo Collar
. If the actual dividend paid does not exactly match the projected dividend, then an adjustment amount shall be payable between the parties to the
Sumitomo Collar
depending on the dividend actually paid by
Sumitomo
. The Sumitomo Collar may, at the option of
Liberty Programming Japan
, be settled in
Sumitomo
shares or in cash. The
Sumitomo Collar
also includes a purchased fair value put option, which effectively provides
Liberty Programming Japan
with the ability to sell the
Sumitomo
shares when the market price is trading between the put and call strike prices. The fair value of the
Sumitomo Collar
as of
December 31, 2016
was a net asset of
$
179.9
million
, which is classified as non-current in our consolidated balance sheet.
The
Sumitomo Collar
and related agreements also provide
Liberty Programming Japan
with the ability to borrow funds on a secured basis. Borrowings under these agreements (the
Sumitomo Collar Loan
) are secured by
60
%
of our Sumitomo shares and bear interest at
1.883
%
. The pledge arrangement entered into by
Liberty Programming Japan
provides that
Liberty Programming Japan
will be able to exercise all voting and consensual rights and, subject to the terms of the
Sumitomo Collar
, receive dividends on the
Sumitomo
shares. Borrowings under the
Sumitomo Collar Loan
are included in our long-term debt and capital lease obligations in our consolidated balance sheets. For additional information, see note 10.
The
Sumitomo Collar
and the
Sumitomo Collar Loan
each mature in
five
equal semi-annual installments, the first and second of which became due on May 22, 2016 and November 22, 2016. In May and November 2016,
Liberty Programming Japan
borrowed
II-139
LIBERTY GLOBAL PLC
Notes to Consolidated Financial Statements — (Continued)
December 31, 2016, 2015 and 2014
shares of
Sumitomo
pursuant to a securities lending arrangement (the
Sumitomo Share Loan
) to settle the first and second installments due on the
Sumitomo Collar Loan
. The
Sumitomo Share Loan
, which we have elected to account for at fair value, bears interest at
1.10
%
and matures on the fifth anniversary of the respective borrowing dates. The
Sumitomo Share Loan
, together with the Sumitomo Collar, effectively hedge
100
%
of our Sumitomo shares from losses due to market price decreases. The
Sumitomo Share Loan
is secured by
40
%
of our
Sumitomo
shares. These shares were released from the
Sumitomo Collar Loan
after settlement of the first and second installments.
Lionsgate Forward
and Secured Borrowing.
The
Lionsgate Forward
has the economic equivalent of (i) purchased put options exercisable by
Liberty Global Limited
and (ii) written call options exercisable by the counterparty. The
Lionsgate Forward
effectively hedges the value of
2.5
million
of our
Lionsgate
shares from losses due to market price decreases below the put option price while retaining a portion of the gains from market price increases up to the call option price. The fair value of the
Lionsgate Forward
as of
December 31, 2016
was a net asset of
$
23.6
million
, which is classified as non-current in our consolidated balance sheet. For additional information regarding our investment in
Lionsgate
, see note
6
. The
Lionsgate Forward
has settlement dates ranging from July 2019 through March 2022.
The
Lionsgate Forward
and related agreements also provide
Liberty Global Limited
with the ability to effectively finance a portion of the purchase of its
Lionsgate
shares pursuant to the
Lionsgate Loan
. In November 2015,
Liberty Global Limited
borrowed
$
69.7
million
under the
Lionsgate Loan
. At
December 31, 2016
, borrowings under the
Lionsgate Loan
were secured by
2.5
million
of our
Lionsgate
shares, which have been placed into a custody account. The
Lionsgate Loan
was issued at a discount with a
zero
coupon rate and an average implied yield of 350 basis points (
3.5
%
). The
Lionsgate Loan
, which has maturity dates consistent with the
Lionsgate Forward
and contains no financial covenants, provides for customary representations and warranties, events of default and certain adjustment and termination events. Under the terms of the
Lionsgate Forward
, the counterparty does not have the right to re-use the pledged
Lionsgate
shares without permission from
Liberty Global
. In addition,
Liberty Global Limited
is obligated to share with the counterparty the economic benefit of any dividends paid during the term of the pledge based on a formula that takes into account a theoretical hedging position by the counterparty under the
Lionsgate Forward
(an estimated
1.7
million
shares at
December 31, 2016
).
Ziggo Collar
and Secured Borrowing
. During 2013,
Liberty Global Limited
entered into a share collar (the
Ziggo Collar
) and secured borrowing arrangement (the
Ziggo Collar Loan
) with respect to the then owned
24,957,000
Ziggo
shares. The
Ziggo Collar
was comprised of (i) purchased put options exercisable by
Liberty Global Limited
and (ii) sold call options exercisable by the counterparty. Prior to the
Ziggo Acquisition
, the
Ziggo Collar
effectively hedged the value of a portion of our investment in
Ziggo
shares from significant losses due to market price decreases below the put option price while retaining a portion of the gains from market price increases up to the call option price. The
Ziggo Collar
and related agreements also provided
Liberty Global Limited
with the ability to effectively finance the purchase of certain of its
Ziggo
shares pursuant to the
Ziggo Collar Loan
. Upon completion of the
Ziggo Acquisition
(see note
4
), the
Ziggo Collar
was terminated and the
Ziggo Collar Loan
was settled.
Virgin Media Capped Calls
.
During 2010,
Virgin Media
entered into the
Virgin Media Capped Calls
in order to offset a portion of the dilutive effects associated with the exchange of certain exchangeable notes of
Virgin Media
. During 2013, and in connection with the exchange of certain exchangeable notes of
Virgin Media
, we settled
93.8
%
of the notional amount of the
Virgin Media Capped Calls
. During 2016, the remaining outstanding notional amount of the
Virgin Media Capped Calls
was settled for cash proceeds of
$
36.2
million
.
II-140
LIBERTY GLOBAL PLC
Notes to Consolidated Financial Statements — (Continued)
December 31, 2016, 2015 and 2014
Foreign Currency Forwards
|
Subsidiary
|
Currency
purchased
forward
|
Currency
sold
forward
|
Maturity dates
|
|||||||
|
|
in millions
|
|
||||||||
|
LGE Financing
|
$
|
|
|
€
|
|
|
January 2017 - October 2018
|
|||
|
LGE Financing
|
$
|
|
|
£
|
|
|
January 2017 - February 2019
|
|||
|
LGE Financing
|
€
|
|
|
£
|
|
|
January 2017 - December 2018
|
|||
|
LGE Financing
|
£
|
|
|
€
|
|
|
April 2017 - December 2017
|
|||
|
UPC Broadband Holding
|
$
|
|
|
CZK
|
|
|
January 2017 - December 2017
|
|||
|
UPC Broadband Holding
|
€
|
|
|
CHF
|
|
|
January 2017 - June 2017
|
|||
|
UPC Broadband Holding
|
€
|
|
|
CZK
|
|
|
January 2017 - December 2017
|
|||
|
UPC Broadband Holding
|
€
|
|
|
HUF
|
|
|
January 2017 - December 2017
|
|||
|
UPC Broadband Holding
|
€
|
|
|
PLN
|
|
|
January 2017 - December 2017
|
|||
|
UPC Broadband Holding
|
£
|
|
|
€
|
|
|
January 2017 - March 2017
|
|||
|
Telenet N.V.
|
$
|
|
|
€
|
|
|
January 2017 - November 2017
|
|||
|
VTR
|
$
|
|
|
CLP
|
|
|
January 2017 - December 2017
|
|||
Foreign Currency Forward Options
|
Subsidiary
|
Notional
|
Exchange Currency
|
Weighted Average Strike Price
|
Maturity dates
|
||||||||
|
|
in millions
|
|
||||||||||
|
VMIH (a)
|
£
|
|
|
Indian rupee
|
INR
|
|
|
January 2017 - March 2018
|
||||
|
VMIH (a)
|
£
|
|
|
Philippine peso
|
PHP
|
|
|
January 2017 - September 2017
|
||||
|
UPC Broadband Holding
|
€
|
|
|
Polish zloty
|
PLN
|
|
|
April 2018
|
||||
_______________
|
(a)
|
|
(
8
)
Fair Value Measurements
We use the fair value method to account for (i) certain of our investments, (ii) our derivative instruments, (iii) certain instruments that we classify as debt and (iv) the
Sumitomo Share Loan
. The reported fair values of these investments and instruments as of
December 31, 2016
likely will not represent the value that will be paid or received upon the ultimate settlement or disposition of these assets and liabilities. In the case of the investments that we account for using the fair value method, the values we realize upon disposition will be dependent upon, among other factors, market conditions and the forecasted financial performance of the investees at the time of any such disposition. With respect to our derivative and certain debt instruments, we expect that the values realized generally will be based on market conditions at the time of settlement, which may occur at the maturity of the derivative instrument or at the time of the repayment or refinancing of the underlying debt instrument.
U.S. GAAP
provides for a fair value hierarchy that prioritizes the inputs to valuation techniques used to measure fair value into three broad levels. Level 1 inputs are quoted market prices in active markets for identical assets or liabilities that the reporting entity has the ability to access at the measurement date. Level 2 inputs are inputs other than quoted market prices included within
II-141
LIBERTY GLOBAL PLC
Notes to Consolidated Financial Statements — (Continued)
December 31, 2016, 2015 and 2014
Level 1 that are observable for the asset or liability, either directly or indirectly. Level 3 inputs are unobservable inputs for the asset or liability. We record transfers of assets or liabilities into or out of Levels 1, 2 or 3 at the beginning of the quarter during which the transfer occurred. During
2016
, no such transfers were made.
All of our Level 2 inputs (interest rate futures, swap rates and certain of the inputs for our weighted average cost of capital calculations) and certain of our Level 3 inputs (forecasted volatilities and credit spreads) are obtained from pricing services. These inputs, or interpolations or extrapolations thereof, are used in our internal models to calculate, among other items, yield curves, forward interest and currency rates and weighted average cost of capital rates. In the normal course of business, we receive market value assessments from the counterparties to our derivative contracts. Although we compare these assessments to our internal valuations and investigate unexpected differences, we do not otherwise rely on counterparty quotes to determine the fair values of our derivative instruments. The midpoints of applicable bid and ask ranges generally are used as inputs for our internal valuations.
For our investments in
ITV
,
Sumitomo
and
Lionsgate
, the recurring fair value measurements are based on the quoted closing price of the respective shares at each reporting date. Accordingly, the valuations of these investments fall under Level 1 of the fair value hierarchy. Our other investments that we account for at fair value are privately-held companies, and therefore, quoted market prices are unavailable. The valuation technique we use for such investments is a combination of an income approach (discounted cash flow model based on forecasts) and a market approach (market multiples of similar businesses). With the exception of certain inputs for our weighted average cost of capital calculations that are derived from pricing services, the inputs used to value these investments are based on unobservable inputs derived from our assumptions. Therefore, the valuation of our privately-held investments falls under Level 3 of the fair value hierarchy. Any reasonably foreseeable changes in assumed levels of unobservable inputs for the valuations of our Level 3 investments would not be expected to have a material impact on our financial position or results of operations.
During the second quarter of 2016, we entered into the
Sumitomo Share Loan
. As the primary input for this recurring fair value measurement is the quoted market price of the borrowed shares of
Sumitomo
, we believe this valuation falls under Level 1 of the fair value hierarchy.
The recurring fair value measurement of our equity-related derivative instruments are based on binomial option pricing models, which require the input of observable and unobservable variables such as exchange-traded equity prices, risk-free interest rates, dividend yields and forecasted volatilities of the underlying equity securities. The valuations of our equity-related derivative instruments are based on a combination of Level 1 inputs (exchange traded equity prices), Level 2 inputs (interest rate futures and swap rates) and Level 3 inputs (forecasted volatilities). As changes in volatilities could have a significant impact on the overall valuations over the terms of the derivative instruments, we have determined that these valuations fall under Level 3 of the fair value hierarchy. At
December 31, 2016
, the valuations of the
ITV Collar
, the
Sumitomo Collar
and the
Lionsgate Forward
were not significantly impacted by forecasted volatilities.
In order to manage our interest rate and foreign currency exchange risk, we have entered into (i) various derivative instruments and (ii) certain instruments that we classify as debt, as further described in notes
7
and
10
, respectively. The recurring fair value measurements of these instruments are determined using discounted cash flow models. With the exception of the inputs for the
U.S.
dollar to Jamaican dollar cross-currency swaps (the
Sable Currency Swap
) held by
Sable
, most of the inputs to these discounted cash flow models consist of, or are derived from, observable Level 2 data for substantially the full term of these instruments. This observable data mostly includes interest rate futures and swap rates, which are retrieved or derived from available market data. Although we may extrapolate or interpolate this data, we do not otherwise alter this data in performing our valuations. We incorporate a credit risk valuation adjustment in our fair value measurements to estimate the impact of both our own nonperformance risk and the nonperformance risk of our counterparties. Our and our counterparties’ credit spreads represent our most significant Level 3 inputs, and these inputs are used to derive the credit risk valuation adjustments with respect to these instruments. As we would not expect changes in our or our counterparties’ credit spreads to have a significant impact on the valuations of these instruments, we have determined that these valuations (other than the
Sable Currency Swap
valuation) fall under Level 2 of the fair value hierarchy. Due to the lack of Level 2 inputs for the
Sable Currency Swap
valuation, we believe this valuation falls under Level 3 of the fair value hierarchy. Our credit risk valuation adjustments with respect to our cross-currency and interest rate swaps are quantified and further explained in note
7
.
Fair value measurements are also used in connection with nonrecurring valuations performed in connection with impairment assessments, acquisition accounting and the accounting for our initial investment in the
Dutch JV
. These nonrecurring valuations include the valuation of reporting units, customer relationship and other intangible assets, property and equipment, the implied
II-142
LIBERTY GLOBAL PLC
Notes to Consolidated Financial Statements — (Continued)
December 31, 2016, 2015 and 2014
value of goodwill and the valuation of our initial investment in the
Dutch JV
. The valuation of private reporting units and our initial investment in the
Dutch JV
is based at least in part on discounted cash flow analyses. With the exception of certain inputs for our weighted average cost of capital and discount rate calculations that are derived from pricing services, the inputs used in our discounted cash flow analyses, such as forecasts of future cash flows, are based on our assumptions. The valuation of customer relationships is primarily based on an excess earnings methodology, which is a form of a discounted cash flow analysis. The excess earnings methodology requires us to estimate the specific cash flows expected from the customer relationship, considering such factors as estimated customer life, the revenue expected to be generated over the life of the customer relationship, contributory asset charges and other factors. Tangible assets are typically valued using a replacement or reproduction cost approach, considering factors such as current prices of the same or similar equipment, the age of the equipment and economic obsolescence. The implied value of goodwill is determined by allocating the fair value of a reporting unit to all of the assets and liabilities of that unit as if the reporting unit had been acquired in a business combination, with the residual amount allocated to goodwill. All of our nonrecurring valuations use significant unobservable inputs and therefore fall under Level 3 of the fair value hierarchy. During
2016
,
2015
and
2014
, we performed nonrecurring valuations for the purpose of determining (i) the acquisition accounting for the
CWC Acquisition
, the
BASE Acquisition
, the
Choice Acquisition
and the
Ziggo Acquisition
and (ii) the valuation of our initial investment in the
Dutch JV
. The weighted average discount rates used in the preliminary valuation of the customer relationships acquired as a result of the
CWC Acquisition
ranged from
8.8
%
to
12.8
%
. None of the valuations for the
BASE Acquisition
had a significant impact on our consolidated balance sheet. We used discount rates of (a)
11.75
%
and
12.25
%
for our respective valuations of the customer relationships and cable television franchise rights acquired as a result of the
Choice Acquisition
and (b)
8.50
%
for our valuation of the customer relationships acquired as a result of the the
Ziggo Acquisition
. The weighted average cost of capital used to value our initial investment in the
Dutch JV
was
7.0
%
.
For information regarding our acquisitions, see note
4
. For information regarding our investment in the
Dutch JV
, see note
6
.
|
|
|
Fair value measurements at December 31, 2016 using:
|
||||||||||||||
|
Description
|
December 31,
2016 |
Quoted prices
in active
markets for
identical assets
(Level 1)
|
Significant
other
observable
inputs
(Level 2)
|
Significant
unobservable
inputs
(Level 3)
|
||||||||||||
|
|
in millions
|
|||||||||||||||
|
Assets:
|
||||||||||||||||
|
Derivative instruments:
|
||||||||||||||||
|
Cross-currency and interest rate derivative contracts
|
$
|
|
|
$
|
|
|
$
|
|
|
$
|
|
|
||||
|
Equity-related derivative instruments
|
|
|
|
|
|
|
|
|
||||||||
|
Foreign currency forward and option contracts
|
|
|
|
|
|
|
|
|
||||||||
|
Other
|
|
|
|
|
|
|
|
|
||||||||
|
Total derivative instruments
|
|
|
|
|
|
|
|
|
||||||||
|
Investments
|
|
|
|
|
|
|
|
|
||||||||
|
Total assets
|
$
|
|
|
$
|
|
|
$
|
|
|
$
|
|
|
||||
|
Liabilities:
|
||||||||||||||||
|
Derivative instruments:
|
||||||||||||||||
|
Cross-currency and interest rate derivative contracts
|
$
|
|
|
$
|
|
|
$
|
|
|
$
|
|
|
||||
|
Equity-related derivative instruments
|
|
|
|
|
|
|
|
|
||||||||
|
Foreign currency forward and option contracts
|
|
|
|
|
|
|
|
|
||||||||
|
Other
|
|
|
|
|
|
|
|
|
||||||||
|
Total derivative liabilities
|
|
|
|
|
|
|
|
|
||||||||
|
Debt
|
|
|
|
|
|
|
|
|
||||||||
|
Total liabilities
|
$
|
|
|
$
|
|
|
$
|
|
|
$
|
|
|
||||
II-143
LIBERTY GLOBAL PLC
Notes to Consolidated Financial Statements — (Continued)
December 31, 2016, 2015 and 2014
|
|
|
Fair value measurements
at December 31, 2015 using:
|
||||||||||||||
|
Description
|
December 31,
2015 |
Quoted prices
in active
markets for
identical assets
(Level 1)
|
Significant
other
observable
inputs
(Level 2)
|
Significant
unobservable
inputs
(Level 3)
|
||||||||||||
|
|
in millions
|
|||||||||||||||
|
Assets:
|
||||||||||||||||
|
Derivative instruments:
|
||||||||||||||||
|
Cross-currency and interest rate derivative contracts
|
$
|
|
|
$
|
|
|
$
|
|
|
$
|
|
|
||||
|
Equity-related derivative instruments
|
|
|
|
|
|
|
|
|
||||||||
|
Foreign currency forward contracts
|
|
|
|
|
|
|
|
|
||||||||
|
Other
|
|
|
|
|
|
|
|
|
||||||||
|
Total derivative instruments
|
|
|
|
|
|
|
|
|
||||||||
|
Investments
|
|
|
|
|
|
|
|
|
||||||||
|
Total assets
|
$
|
|
|
$
|
|
|
$
|
|
|
$
|
|
|
||||
|
Liabilities - derivative instruments:
|
||||||||||||||||
|
Cross-currency and interest rate derivative contracts
|
$
|
|
|
$
|
|
|
$
|
|
|
$
|
|
|
||||
|
Equity-related derivative instruments
|
|
|
|
|
|
|
|
|
||||||||
|
Foreign currency forward contracts
|
|
|
|
|
|
|
|
|
||||||||
|
Other
|
|
|
|
|
|
|
|
|
||||||||
|
Total liabilities
|
$
|
|
|
$
|
|
|
$
|
|
|
$
|
|
|
||||
|
Investments
|
Cross-currency and interest rate derivative contracts
|
Equity-related
derivative
instruments
|
Total
|
||||||||||||
|
|
in millions
|
||||||||||||||
|
Balance of net assets at January 1, 2016
|
$
|
|
|
$
|
|
|
$
|
|
|
$
|
|
|
|||
|
Gains included in net earnings (a):
|
|||||||||||||||
|
Realized and unrealized gains (losses) on derivative instruments, net
|
—
|
|
(
|
)
|
|
|
|
|
|||||||
|
Realized and unrealized gains due to changes in fair values of certain investments, net
|
|
|
—
|
|
—
|
|
|
|
|||||||
|
Settlements (b)
|
|
|
|
|
(
|
)
|
(
|
)
|
|||||||
|
Dispositions
|
(
|
)
|
|
|
|
|
(
|
)
|
|||||||
|
Additions
|
|
|
|
|
|
|
|
|
|||||||
|
Foreign currency translation adjustments and other, net
|
(
|
)
|
|
|
|
|
(
|
)
|
|||||||
|
Balance of net assets at December 31, 2016
|
$
|
|
|
$
|
(
|
)
|
$
|
|
|
$
|
|
|
|||
_______________
|
(a)
|
Includes an aggregate net gain of
$
|
|
(b)
|
|
II-144
LIBERTY GLOBAL PLC
Notes to Consolidated Financial Statements — (Continued)
December 31, 2016, 2015 and 2014
(
9
)
Long-lived Assets
Property and Equipment, Net
|
Estimated useful
life at
December 31, 2016
|
December 31,
|
||||||||
|
2016
|
2015
|
||||||||
|
|
in millions
|
||||||||
|
Distribution systems:
|
3 to 30 years
|
||||||||
|
Liberty Global Group
|
$
|
|
|
$
|
|
|
|||
|
LiLAC Group
|
|
|
|
|
|||||
|
Total
|
|
|
|
|
|||||
|
Customer premises equipment:
|
3 to 5 years
|
||||||||
|
Liberty Global Group
|
|
|
|
|
|||||
|
LiLAC Group
|
|
|
|
|
|||||
|
Total
|
|
|
|
|
|||||
|
Support equipment, buildings and land:
|
3 to 50 years
|
||||||||
|
Liberty Global Group
|
|
|
|
|
|||||
|
LiLAC Group
|
|
|
|
|
|||||
|
Total
|
|
|
|
|
|||||
|
Total property and equipment, gross:
|
|||||||||
|
Liberty Global Group
|
|
|
|
|
|||||
|
LiLAC Group
|
|
|
|
|
|||||
|
Total
|
|
|
|
|
|||||
|
Accumulated depreciation:
|
|||||||||
|
Liberty Global Group
|
(
|
)
|
(
|
)
|
|||||
|
LiLAC Group
|
(
|
)
|
(
|
)
|
|||||
|
Total
|
(
|
)
|
(
|
)
|
|||||
|
Total property and equipment, net:
|
|||||||||
|
Liberty Global Group
|
|
|
|
|
|||||
|
LiLAC Group
|
|
|
|
|
|||||
|
Total
|
$
|
|
|
$
|
|
|
|||
Depreciation expense related to our property and equipment was
$
4,551.9
million
,
$
4,501.4
million
and
$
4,401.6
million
during
2016
,
2015
and
2014
, respectively.
At December 31,
2016
and
2015
, the amount of property and equipment, net, recorded under capital leases was
$
1,061.5
million
and
$
1,281.7
million
, respectively.
Most of these amounts relate to assets included in our distribution systems category. Depreciation of assets under capital leases is included in depreciation and amortization in our consolidated statements of operations.
During
2016
,
2015
and
2014
, we recorded non-cash increases to our property and equipment related to vendor financing arrangements of
$
2,064.2
million
,
$
1,481.5
million
and $
975.3
million
, respectively, which exclude related
VAT
of
$
277.9
million
,
$
189.3
million
and
$
114.9
million
, respectively, that was also financed by our vendors under these arrangements. In addition, during
2016
,
2015
and
2014
, we recorded non-cash increases to our property and equipment related to assets acquired under capital leases of
$
111.6
million
,
$
106.1
million
and
$
127.2
million
, respectively.
II-145
LIBERTY GLOBAL PLC
Notes to Consolidated Financial Statements — (Continued)
December 31, 2016, 2015 and 2014
Most
of our property and equipment is pledged as security under our various debt instruments. For additional information, see note
10
.
During the fourth quarter of 2014, we recorded an impairment charge of
$
68.7
million
to reduce the carrying amount of certain of
Ziggo
’s internal-use software assets to zero following our determination that these assets would have no future service potential for our combined operations in the Netherlands.
Goodwill
|
January 1,
2016
|
Acquisitions
and related
adjustments
|
Disposition (a)
|
Foreign
currency
translation
adjustments and other
|
December 31,
2016 |
|||||||||||||||
|
|
in millions
|
||||||||||||||||||
|
Liberty Global Group:
|
|||||||||||||||||||
|
European Division:
|
|||||||||||||||||||
|
U.K./Ireland
|
$
|
|
|
$
|
|
|
$
|
|
|
$
|
(
|
)
|
$
|
|
|
||||
|
Belgium
|
|
|
|
|
|
|
(
|
)
|
|
|
|||||||||
|
The Netherlands
|
|
|
|
|
(
|
)
|
(
|
)
|
|
|
|||||||||
|
Germany
|
|
|
|
|
|
|
(
|
)
|
|
|
|||||||||
|
Switzerland/Austria
|
|
|
|
|
|
|
(
|
)
|
|
|
|||||||||
|
Total Western Europe
|
|
|
|
|
(
|
)
|
(
|
)
|
|
|
|||||||||
|
Central and Eastern Europe
|
|
|
|
|
|
|
(
|
)
|
|
|
|||||||||
|
Total European Division
|
|
|
|
|
(
|
)
|
(
|
)
|
|
|
|||||||||
|
Corporate and other
|
|
|
|
|
(
|
)
|
(
|
)
|
|
|
|||||||||
|
Total Liberty Global Group
|
|
|
|
|
(
|
)
|
(
|
)
|
|
|
|||||||||
|
LiLAC Group:
|
|||||||||||||||||||
|
LiLAC Division:
|
|||||||||||||||||||
|
CWC
|
|
|
|
|
|
|
(
|
)
|
|
|
|||||||||
|
Chile
|
|
|
|
|
|
|
|
|
|
|
|||||||||
|
Puerto Rico
|
|
|
|
|
|
|
|
|
|
|
|||||||||
|
Total LiLAC Division
|
|
|
|
|
|
|
(
|
)
|
|
|
|||||||||
|
Corporate and other (b)
|
|
|
|
|
|
|
|
|
|
|
|||||||||
|
Total LiLAC Group
|
|
|
|
|
|
|
(
|
)
|
|
|
|||||||||
|
Total
|
$
|
|
|
$
|
|
|
$
|
(
|
)
|
$
|
(
|
)
|
$
|
|
|
||||
_______________
|
(a)
|
Represents goodwill associated with
Ziggo Group Holding
, which was contributed to the
Dutch JV
on December 31, 2016. For additional information, see note
5
.
|
|
(b)
|
Represents enterprise-level goodwill that is allocated to our Puerto Rico segment for purposes of our impairment tests.
|
Based on the results of our October 1, 2016 goodwill impairment test, a hypothetical decline of 20% or more in the fair value of any of CWC’s reporting units could result in the need to record a goodwill impairment charge. At December 31, 2016, the aggregate goodwill associated with the CWC reporting units was
$
5.5
billion
. If, among other factors, (i) the equity values of the
LiLAC Group
were to remain depressed or decline further or (ii) the adverse impacts of economic, competitive, regulatory or other factors were to cause our results of operations or cash flows to be worse than anticipated, we could conclude in future periods
II-146
LIBERTY GLOBAL PLC
Notes to Consolidated Financial Statements — (Continued)
December 31, 2016, 2015 and 2014
that impairment charges are required in order to reduce the carrying values of our goodwill and, to a lesser extent, other long-lived assets. Any such impairment charges could be significant.
At
December 31, 2016
and
2015
and based on exchange rates as of those dates, our accumulated goodwill impairments were
$
180.4
million
and
$
186.8
million
, respectively. These amounts represent accumulated impairments related to our broadband communications operations in Romania, which operations are included within the
European Division
’s
Central and Eastern Europe
segment.
|
January 1,
2015
|
Acquisitions
and related
adjustments
|
Foreign
currency
translation
adjustments and other
|
December 31,
2015 |
||||||||||||
|
|
|
in millions
|
|
||||||||||||
|
Liberty Global Group:
|
|||||||||||||||
|
European Division:
|
|||||||||||||||
|
U.K./Ireland
|
$
|
|
|
$
|
|
|
$
|
(
|
)
|
$
|
|
|
|||
|
Belgium
|
|
|
|
|
(
|
)
|
|
|
|||||||
|
The Netherlands
|
|
|
|
|
(
|
)
|
|
|
|||||||
|
Germany
|
|
|
|
|
(
|
)
|
|
|
|||||||
|
Switzerland/Austria
|
|
|
|
|
(
|
)
|
|
|
|||||||
|
Total Western Europe
|
|
|
|
|
(
|
)
|
|
|
|||||||
|
Central and Eastern Europe
|
|
|
|
|
(
|
)
|
|
|
|||||||
|
Total European Division
|
|
|
|
|
(
|
)
|
|
|
|||||||
|
Corporate and other
|
|
|
|
|
(
|
)
|
|
|
|||||||
|
Total Liberty Global Group
|
|
|
|
|
(
|
)
|
|
|
|||||||
|
LiLAC Group:
|
|||||||||||||||
|
LiLAC Division:
|
|||||||||||||||
|
Chile
|
|
|
|
|
(
|
)
|
|
|
|||||||
|
Puerto Rico
|
|
|
|
|
|
|
|
|
|||||||
|
Total LiLAC Division
|
|
|
|
|
(
|
)
|
|
|
|||||||
|
Corporate and other (a)
|
|
|
|
|
|
|
|
|
|||||||
|
Total LiLAC Group
|
|
|
|
|
(
|
)
|
|
|
|||||||
|
Total
|
$
|
|
|
$
|
|
|
$
|
(
|
)
|
$
|
|
|
|||
_______________
|
(a)
|
Represents enterprise-level goodwill that is allocated to our Puerto Rico segment for purposes of our impairment tests.
|
II-147
LIBERTY GLOBAL PLC
Notes to Consolidated Financial Statements — (Continued)
December 31, 2016, 2015 and 2014
Intangible Assets Subject to Amortization, Net
|
Estimated useful life at December 31, 2016
|
December 31, 2016
|
December 31, 2015
|
|||||||||||||||||||||||
|
Gross carrying amount
|
Accumulated amortization
|
Net carrying amount
|
Gross carrying amount
|
Accumulated amortization
|
Net carrying amount
|
||||||||||||||||||||
|
|
in millions
|
||||||||||||||||||||||||
|
Customer relationships:
|
4 to 15 years
|
||||||||||||||||||||||||
|
Liberty Global Group
|
$
|
|
|
$
|
(
|
)
|
$
|
|
|
$
|
|
|
$
|
(
|
)
|
$
|
|
|
|||||||
|
LiLAC Group
|
|
|
(
|
)
|
|
|
|
|
(
|
)
|
|
|
|||||||||||||
|
Total
|
|
|
(
|
)
|
|
|
|
|
(
|
)
|
|
|
|||||||||||||
|
Other:
|
2 to 20 years
|
||||||||||||||||||||||||
|
Liberty Global Group
|
|
|
(
|
)
|
|
|
|
|
(
|
)
|
|
|
|||||||||||||
|
LiLAC Group
|
|
|
(
|
)
|
|
|
|
|
(
|
)
|
|
|
|||||||||||||
|
Total
|
|
|
(
|
)
|
|
|
|
|
(
|
)
|
|
|
|||||||||||||
|
Total intangible assets subject to amortization, net:
|
|||||||||||||||||||||||||
|
Liberty Global Group
|
|
|
(
|
)
|
|
|
|
|
(
|
)
|
|
|
|||||||||||||
|
LiLAC Group
|
|
|
(
|
)
|
|
|
|
|
(
|
)
|
|
|
|||||||||||||
|
Total
|
$
|
|
|
$
|
(
|
)
|
$
|
|
|
$
|
|
|
$
|
(
|
)
|
$
|
|
|
|||||||
Amortization expense related to intangible assets with finite useful lives was
$
1,249.2
million
,
$
1,324.4
million
and
$
1,098.5
million
during
2016
,
2015
and
2014
, respectively. Based on our amortizable intangible asset balances at
December 31, 2016
, we expect that amortization expense will be as follows for the next five years and thereafter.
The
U.S.
dollar equivalents of such amortization expense amounts as of
December 31, 2016
are presented below (in millions):
|
2017
|
$
|
|
|
|
2018
|
|
|
|
|
2019
|
|
|
|
|
2020
|
|
|
|
|
2021
|
|
|
|
|
Thereafter
|
|
|
|
|
Total
|
$
|
|
|
Other Indefinite-lived Intangible Assets
II-148
LIBERTY GLOBAL PLC
Notes to Consolidated Financial Statements — (Continued)
December 31, 2016, 2015 and 2014
(
10
)
Debt and Capital Lease Obligations
Debt
|
|
December 31, 2016
|
Estimated fair value (c)
|
Principal amount
|
|||||||||||||||||||||||
|
Weighted
average
interest
rate (a)
|
Unused borrowing capacity (b)
|
|||||||||||||||||||||||||
|
Borrowing currency
|
U.S. $
equivalent
|
December 31,
|
December 31,
|
|||||||||||||||||||||||
|
2016
|
2015
|
2016
|
2015
|
|||||||||||||||||||||||
|
in millions
|
||||||||||||||||||||||||||
|
Liberty Global Group:
|
||||||||||||||||||||||||||
|
VM Notes
|
|
%
|
|
|
$
|
|
|
$
|
|
|
$
|
|
|
$
|
|
|
$
|
|
|
|||||||
|
VM Credit Facilities
|
|
%
|
(d)
|
|
|
|
|
|
|
|
|
|
|
|||||||||||||
|
Unitymedia Notes
|
|
%
|
|
|
|
|
|
|
|
|
|
|
|
|
||||||||||||
|
Unitymedia Revolving Credit Facilities
|
|
|
€
|
|
|
|
|
|
|
|
|
|
|
|
|
|||||||||||
|
UPCB SPE Notes
|
|
%
|
|
|
|
|
|
|
|
|
|
|
|
|
||||||||||||
|
UPC Holding Senior Notes
|
|
%
|
|
|
|
|
|
|
|
|
|
|
|
|
||||||||||||
|
UPC Broadband Holding Bank Facility
|
|
%
|
€
|
|
|
|
|
|
|
|
|
|
|
|
|
|||||||||||
|
Telenet Credit Facility
|
|
%
|
€
|
|
|
|
|
|
|
|
|
|
|
|
|
|||||||||||
|
Telenet SPE Notes
|
|
%
|
|
|
|
|
|
|
|
|
|
|
|
|
||||||||||||
|
Vendor financing (e) (f)
|
|
%
|
|
|
|
|
|
|
|
|
|
|
|
|
||||||||||||
|
ITV Collar Loan
|
|
%
|
|
|
|
|
|
|
|
|
|
|
|
|
||||||||||||
|
Sumitomo Collar Loan (g)
|
|
%
|
|
|
|
|
|
|
|
|
|
|
|
|
||||||||||||
|
Derivative-related debt instruments (h)
|
|
%
|
|
|
|
|
|
|
|
|
|
|
|
|
||||||||||||
|
Ziggo Group Holding debt
|
|
|
(f)
|
(f)
|
(f)
|
|
|
(f)
|
|
|
||||||||||||||||
|
Other (i)
|
|
%
|
|
|
|
|
|
|
|
|
|
|
|
|
||||||||||||
|
Total Liberty Global Group
|
|
%
|
|
|
|
|
|
|
|
|
|
|
||||||||||||||
|
LiLAC Group:
|
||||||||||||||||||||||||||
|
CWC Notes
|
|
%
|
|
|
|
|
|
|
|
|
|
|
|
|
||||||||||||
|
CWC Credit Facilities
|
|
%
|
$
|
|
|
|
|
|
|
|
|
|
|
|
|
|||||||||||
|
VTR Finance Senior Secured Notes
|
|
%
|
|
|
|
|
|
|
|
|
|
|
|
|
||||||||||||
|
VTR Credit Facility
|
|
|
(j)
|
|
|
|
|
|
|
|
|
|
|
|||||||||||||
|
Liberty Puerto Rico Bank Facility
|
|
%
|
$
|
|
|
|
|
|
|
|
|
|
|
|
|
|||||||||||
|
Vendor Financing
|
|
%
|
|
|
|
|
|
|
|
|
|
|
|
|
||||||||||||
|
Total LiLAC Group
|
|
%
|
|
|
|
|
|
|
|
|
|
|
||||||||||||||
|
Total debt before unamortized premiums, discounts and deferred financing costs
|
|
%
|
$
|
|
|
$
|
|
|
$
|
|
|
$
|
|
|
$
|
|
|
|||||||||
II-149
LIBERTY GLOBAL PLC
Notes to Consolidated Financial Statements — (Continued)
December 31, 2016, 2015 and 2014
The following table provides a reconciliation of total debt before unamortized premiums, discounts and deferred financing costs to total debt and capital lease obligations:
|
December 31,
|
||||||||||||||||
|
2016
|
2015
|
|||||||||||||||
|
in millions
|
||||||||||||||||
|
Total debt before unamortized premiums, discounts and deferred financing costs
|
$
|
|
|
$
|
|
|
||||||||||
|
Unamortized premiums (discounts), net
|
|
|
(
|
)
|
||||||||||||
|
Unamortized deferred financing costs
|
(
|
)
|
(
|
)
|
||||||||||||
|
Total carrying amount of debt
|
|
|
|
|
||||||||||||
|
Capital lease obligations (h) (k)
|
|
|
|
|
||||||||||||
|
Total debt and capital lease obligations
|
|
|
|
|
||||||||||||
|
Current maturities of debt and capital lease obligations
|
(
|
)
|
(
|
)
|
||||||||||||
|
Long-term debt and capital lease obligations
|
$
|
|
|
$
|
|
|
||||||||||
_______________
|
(a)
|
Represents the weighted average interest rate in effect at
December 31, 2016
for all borrowings outstanding pursuant to each debt instrument, including any applicable margin. The interest rates presented represent stated rates and do not include the impact of derivative instruments, deferred financing costs, original issue premiums or discounts and commitment fees, all of which affect our overall cost of borrowing. Including the effects of derivative instruments, original issue premiums or discounts and commitment fees, but excluding the impact of financing costs, our weighted average interest rate on our aggregate variable- and fixed-rate indebtedness was
|
II-150
LIBERTY GLOBAL PLC
Notes to Consolidated Financial Statements — (Continued)
December 31, 2016, 2015 and 2014
|
(b)
|
Unused borrowing capacity represents the maximum availability under the applicable facility at
December 31, 2016
without regard to covenant compliance calculations or other conditions precedent to borrowing. At
December 31, 2016
, based on the applicable leverage covenants, the full amount of unused borrowing capacity was available to be borrowed under each of the respective subsidiary facilities and there were no restrictions on the respective subsidiary's ability to make loans or distributions from this availability to
Liberty Global
or its subsidiaries or other equity holders, except as shown in the table below. In the following table, for each facility that is subject to limitations on borrowing availability, we present (i) the actual borrowing availability under the respective facility and (ii) for each subsidiary where the ability to make loans or distributions from this availability is limited, the amount that can be loaned or distributed to
Liberty Global
or its subsidiaries or other equity holders.
|
|
December 31, 2016
|
Upon completion of relevant December 31, 2016 compliance reporting requirements
|
|||||||||||||||
|
Borrowing currency
|
U.S. $ equivalent
|
Borrowing currency
|
U.S. $ equivalent
|
|||||||||||||
|
in millions
|
||||||||||||||||
|
Limitation on availability to be borrowed under:
|
||||||||||||||||
|
Unitymedia Revolving Credit Facilities
|
€
|
|
|
$
|
|
|
€
|
|
|
$
|
|
|
||||
|
UPC Broadband Holding Bank Facility
|
€
|
|
|
$
|
|
|
€
|
|
|
$
|
|
|
||||
|
CWC Credit Facilities
|
$
|
|
|
$
|
|
|
$
|
|
|
$
|
|
|
||||
|
Limitation on availability to be loaned or distributed by:
|
||||||||||||||||
|
Virgin Media
|
£
|
|
|
$
|
|
|
£
|
|
|
$
|
|
|
||||
|
Unitymedia
|
€
|
|
|
$
|
|
|
€
|
|
|
$
|
|
|
||||
|
(c)
|
The estimated fair values of our debt instruments are determined using the average of applicable bid and ask prices (mostly Level 1 of the fair value hierarchy) or, when quoted market prices are unavailable or not considered indicative of fair value, discounted cash flow models (mostly Level 2 of the fair value hierarchy). The discount rates used in the cash flow models are based on the market interest rates and estimated credit spreads of the applicable entity, to the extent available, and other relevant factors. For additional information regarding fair value hierarchies, see note
8
.
|
|
(d)
|
The
VM Revolving Facility
(as defined and described under
VM Credit Facilities
below) is a multi-currency revolving facility with maximum borrowing capacity equivalent to
£
|
|
(e)
|
Represents amounts owed pursuant to interest-bearing vendor financing arrangements that are used to finance certain of our property and equipment additions and, to a lesser extent, certain of our operating expenses, including amounts associated with
Ziggo Group Holding
at
December 31, 2015
. These obligations are generally due within
one
year and include
VAT
that was paid on our behalf by the vendor. Repayments of vendor financing obligations are included in repayments and repurchases of debt and capital lease obligations in our consolidated statements of cash flows.
|
|
(f)
|
On December 31, 2016, we completed the
Dutch JV Transaction
. For additional information, see note
5
.
|
|
(g)
|
During
2016
, the first two tranches of the
Sumitomo Collar Loan
were settled, resulting in a loss on debt modification and extinguishment, net, of
$
|
|
(h)
|
Represents amounts associated with certain derivative-related borrowing instruments, including
$
|
|
(i)
|
The
December 31, 2016
balance includes (i)
$
|
II-151
LIBERTY GLOBAL PLC
Notes to Consolidated Financial Statements — (Continued)
December 31, 2016, 2015 and 2014
regarding fair value hierarchies, see note
8
.
|
(j)
|
The
VTR Credit Facility
is the senior secured credit facility of
VTR
and certain of its subsidiaries and comprises a
$
|
(k)
The
U.S.
dollar equivalents of our consolidated capital lease obligations are as follows:
|
December 31,
|
|||||||
|
2016
|
2015
|
||||||
|
in millions
|
|||||||
|
Liberty Global Group:
|
|||||||
|
Unitymedia (1)
|
$
|
|
|
$
|
|
|
|
|
Telenet (2)
|
|
|
|
|
|||
|
Virgin Media
|
|
|
|
|
|||
|
Other subsidiaries
|
|
|
|
|
|||
|
Total
—
Liberty Global Group
|
|
|
|
|
|||
|
LiLAC Group:
|
|||||||
|
CWC
|
|
|
|
|
|||
|
VTR
|
|
|
|
|
|||
|
Liberty Puerto Rico
|
|
|
|
|
|||
|
Total
—
LiLAC Group
|
|
|
|
|
|||
|
Total
|
$
|
|
|
$
|
|
|
|
_______________
|
(1)
|
Primarily represents
Unitymedia
’s obligations under duct network lease agreements with Telekom Deutschland GmbH (
Deutsche Telekom
), an operating subsidiary of Deutsche Telekom AG, as the lessor. The original contracts were concluded in 2000 and 2001 and have indefinite terms, subject to certain mandatory statutory termination rights for either party after a term of
|
|
(2)
|
|
General Information
At
December 31, 2016
, most of our outstanding debt had been incurred by one of our
seven
primary "borrowing groups." These borrowing groups include the respective restricted parent and subsidiary entities within
Virgin Media
,
Unitymedia
,
UPC Holding
,
Telenet
,
CWC
,
VTR Finance
and
Liberty Puerto Rico
.
Credit Facilities.
Each of our borrowing groups has entered into one or more credit facility agreements with certain financial institutions. Each of these credit facilities contain certain covenants, the more notable of which are as follows:
II-152
LIBERTY GLOBAL PLC
Notes to Consolidated Financial Statements — (Continued)
December 31, 2016, 2015 and 2014
|
•
|
Our credit facilities contain certain consolidated net leverage ratios, as specified in the relevant credit facility, which are required to be complied with on an incurrence and/or maintenance basis;
|
|
•
|
Our credit facilities contain certain restrictions which, among other things, restrict the ability of the members of the relevant borrowing group to (i) incur or guarantee certain financial indebtedness, (ii) make certain disposals and acquisitions, (iii) create certain security interests over their assets, in each case, subject to certain customary and agreed exceptions and (iv) make certain restricted payments to their direct and/or indirect parent companies (and indirectly to
Liberty Global
) through dividends, loans or other distributions, subject to compliance with applicable covenants;
|
|
•
|
Our credit facilities require that certain members of the relevant borrowing group guarantee the payment of all sums payable under the relevant credit facility and such group members are required to grant first-ranking security over their shares or, in certain borrowing groups, over substantially all of their assets to secure the payment of all sums payable thereunder;
|
|
•
|
In addition to certain mandatory prepayment events, the instructing group of lenders under the relevant credit facility may cancel the commitments thereunder and declare the loans thereunder due and payable after the applicable notice period following the occurrence of a change of control (as specified in the relevant credit facility);
|
|
•
|
Our credit facilities contain certain customary events of default, the occurrence of which, subject to certain exceptions and materiality qualifications, would allow the instructing group of lenders to (i) cancel the total commitments, (ii) accelerate all outstanding loans and terminate their commitments thereunder and/or (iii) declare that all or part of the loans be payable on demand;
|
|
•
|
Our credit facilities require members of the relevant borrowing group to observe certain affirmative and negative undertakings and covenants, which are subject to certain materiality qualifications and other customary and agreed exceptions; and
|
|
•
|
In addition to customary default provisions, our credit facilities generally include certain cross-default and cross-acceleration provisions with respect to other indebtedness of members of the relevant borrowing group, subject to agreed minimum thresholds and other customary and agreed exceptions.
|
Senior and Senior Secured Notes.
Certain
of our borrowing groups have issued senior and/or senior secured notes. In general, our senior and senior secured notes (i) are senior obligations of each respective issuer within the relevant borrowing group that rank equally with all of the existing and future senior debt of such issuer and are senior to all existing and future subordinated debt of each respective issuer within the relevant borrowing group, (ii) contain, in most instances, certain guarantees from other members of the relevant borrowing group (as specified in the applicable indenture) and (iii) with respect to our senior secured notes, are secured by certain pledges or liens over the assets and/or shares of certain members of the relevant borrowing group. In addition, the indentures governing our senior and senior secured notes contain certain covenants, the more notable of which are as follows:
|
•
|
Our notes contain certain customary incurrence-based covenants. In addition, our notes provide that any failure to pay principal prior to expiration of any applicable grace period, or any acceleration with respect to other indebtedness of the issuer or certain subsidiaries, over agreed minimum thresholds (as specified under the applicable indenture), is an event of default under the respective notes;
|
|
•
|
Our notes contain certain restrictions that, among other things, restrict the ability of the members of the relevant borrowing group to (i) incur or guarantee certain financial indebtedness, (ii) make certain disposals and acquisitions, (iii) create certain security interests over their assets, in each case, subject to certain customary and agreed exceptions and (iv) make certain restricted payments to its direct and/or indirect parent companies (and indirectly to
Liberty Global
) through dividends, loans or other distributions, subject to compliance with applicable covenants;
|
|
•
|
If the relevant issuer or certain of its subsidiaries (as specified in the applicable indenture) sell certain assets, such issuer must offer to repurchase the applicable notes at par, or if a change of control (as specified in the applicable indenture) occurs, such issuer must offer to repurchase all of the relevant notes at a redemption price of
|
II-153
LIBERTY GLOBAL PLC
Notes to Consolidated Financial Statements — (Continued)
December 31, 2016, 2015 and 2014
|
•
|
Our senior secured notes contain certain early redemption provisions including the ability to, during each
|
SPE Notes
.
From time to time, we create special purpose financing entities (
SPEs
), which are
100
%
owned by third parties, for the primary purpose of facilitating the offering of senior and senior secured notes, which we collectively refer to as the "
SPE Notes
." In this regard,
SPE Notes
have been issued, and are outstanding at
December 31, 2016
, by UPCB Finance IV Limited (
UPCB Finance IV
, the
UPCB SPE
), and Telenet Finance V Luxembourg S.C.A. (
Telenet Finance V
) and Telenet Finance VI Luxembourg S.C.A. (
Telenet Finance VI
), collectively the "
Telenet SPE
s
."
The
SPEs
used the proceeds from the issuance of
SPE Notes
to fund term loan facilities under their respective borrowing group (as further described below), each a “
Funded Facility
” and collectively the “
Funded Facilities
.” Each
SPE
is dependent on payments from the relevant borrower under the applicable
Funded Facility
in order to service its payment obligations under each respective
SPE Note
. Although none of the respective borrowing entities under the
Funded Facilities
have any equity or voting interest in any of the relevant
SPEs
, each of the
Funded Facility
term loans creates a variable interest in the respective
SPE
for which the relevant borrowing entity is the primary beneficiary. As such, each borrowing entity under the relevant
Funded Facility
and its parent entities, including
Liberty Global
, are required to consolidate the relevant
SPEs
. As a result, the amounts outstanding under the
Funded Facilities
are eliminated in the respective borrowing group’s and
Liberty Global
’s consolidated financial statements.
Pursuant to the respective indentures for the
SPE Notes
(the
SPE Indentures
) and the respective accession agreements for the
Funded Facilities
, the call provisions, maturity and applicable interest rate for each
Funded Facility
are the same as those of the related
SPE Notes
. The
SPEs
, as lenders under the relevant credit facility for each respective borrowing group, are treated the same as the other lenders under the respective credit facility, with benefits, rights and protections similar to those afforded to the other lenders. Through the covenants in the applicable
SPE Indentures
and the applicable security interests over (i) all of the issued shares of the relevant
SPE
and (ii) the relevant
SPE
’s rights under the applicable
Funded Facility
granted to secure the relevant
SPE
’s obligations under the relevant
SPE Notes
, the holders of the
SPE Notes
are provided indirectly with the benefits, rights, protections and covenants granted to the
SPEs
as lenders under the respective credit facility. The
SPEs
are prohibited from incurring any additional indebtedness, subject to certain exceptions under the
SPE Indentures
.
II-154
LIBERTY GLOBAL PLC
Notes to Consolidated Financial Statements — (Continued)
December 31, 2016, 2015 and 2014
VM Notes
|
|
|
|
Original issue amount
|
Outstanding principal
amount |
Estimated
fair value |
Carrying
value (a) |
||||||||||||||||||
|
VM Notes
|
Maturity
|
Interest
rate |
Borrowing
currency |
U.S. $
equivalent |
||||||||||||||||||||
|
|
|
|
in millions
|
|||||||||||||||||||||
|
VM Senior Notes (b):
|
||||||||||||||||||||||||
|
2022 VM Senior Notes:
|
||||||||||||||||||||||||
|
2022 VM 4.875% Dollar Senior Notes
|
February 15, 2022
|
|
$
|
|
|
$
|
|
|
$
|
|
|
$
|
|
|
$
|
|
|
|||||||
|
2022 VM 5.25% Dollar Senior Notes
|
February 15, 2022
|
|
$
|
|
|
$
|
|
|
|
|
|
|
|
|
||||||||||
|
2022 VM Sterling Senior Notes
|
February 15, 2022
|
|
£
|
|
|
£
|
|
|
|
|
|
|
|
|
||||||||||
|
2023 VM Senior Notes:
|
||||||||||||||||||||||||
|
2023 VM Dollar Senior Notes
|
April 15, 2023
|
|
$
|
|
|
$
|
|
|
|
|
|
|
|
|
||||||||||
|
2023 VM Sterling Senior Notes
|
April 15, 2023
|
|
£
|
|
|
£
|
|
|
|
|
|
|
|
|
||||||||||
|
2024 VM Senior Notes:
|
||||||||||||||||||||||||
|
2024 VM Dollar Senior Notes
|
October 15, 2024
|
|
$
|
|
|
$
|
|
|
|
|
|
|
|
|
||||||||||
|
2024 VM Sterling Senior Notes
|
October 15, 2024
|
|
£
|
|
|
£
|
|
|
|
|
|
|
|
|
||||||||||
|
2025 VM Senior Notes:
|
||||||||||||||||||||||||
|
2025 VM Euro Senior Notes
|
January 15, 2025
|
|
€
|
|
|
€
|
|
|
|
|
|
|
|
|
||||||||||
|
2025 VM Dollar Senior Notes
|
January 15, 2025
|
|
$
|
|
|
$
|
|
|
|
|
|
|
|
|
||||||||||
|
VM Senior Secured Notes (c):
|
||||||||||||||||||||||||
|
January 2021 VM Senior Secured Notes:
|
||||||||||||||||||||||||
|
January 2021 VM Sterling Senior Secured Notes
|
January 15, 2021
|
|
£
|
|
|
£
|
|
|
|
|
|
|
|
|
||||||||||
|
January 2021 VM Dollar Senior Secured Notes
|
January 15, 2021
|
|
$
|
|
|
$
|
|
|
|
|
|
|
|
|
||||||||||
|
April 2021 VM Sterling Senior Secured Notes
|
April 15, 2021
|
|
£
|
|
|
£
|
|
|
|
|
|
|
|
|
||||||||||
|
2025 VM Senior Secured Notes:
|
||||||||||||||||||||||||
|
2025 VM 5.5% Sterling Senior Secured Notes
|
January 15, 2025
|
|
£
|
|
|
£
|
|
|
|
|
|
|
|
|
||||||||||
|
2025 VM 5.125% Sterling Senior Secured Notes
|
January 15, 2025
|
|
£
|
|
|
£
|
|
|
|
|
|
|
|
|
||||||||||
|
2025 VM Dollar Senior Secured Notes
|
January 15, 2025
|
|
$
|
|
|
$
|
|
|
|
|
|
|
|
|
||||||||||
|
2026 VM Senior Secured Notes:
|
||||||||||||||||||||||||
|
2026 VM 5.25% Dollar Senior Secured Notes
|
January 15, 2026
|
|
$
|
|
|
$
|
|
|
|
|
|
|
|
|
||||||||||
|
2026 VM 5.5% Dollar Senior Secured Notes
|
August 15, 2026
|
|
$
|
|
|
$
|
|
|
|
|
|
|
|
|
||||||||||
|
2027 VM Senior Secured Notes
|
January 15, 2027
|
|
£
|
|
|
£
|
|
|
|
|
|
|
|
|
||||||||||
|
2029 VM Senior Secured Notes
|
March 28, 2029
|
|
£
|
|
|
£
|
|
|
|
|
|
|
|
|
||||||||||
|
Total
|
$
|
|
|
$
|
|
|
$
|
|
|
|||||||||||||||
II-155
LIBERTY GLOBAL PLC
Notes to Consolidated Financial Statements — (Continued)
December 31, 2016, 2015 and 2014
_______________
|
(a)
|
Amounts include the impact of premiums, including amounts recorded in connection with the acquisition accounting for
Virgin Media
, and deferred financing costs, where applicable.
|
|
(b)
|
The
VM Senior Notes
were issued by Virgin Media Finance PLC (
Virgin Media Finance
), a wholly-owned subsidiary of
Virgin Media
.
|
|
(c)
|
The
VM Senior Secured Notes
were issued by Virgin Media Secured Finance PLC (
Virgin Media Secured Finance
), a wholly-owned subsidiary of
Virgin Media
.
|
|
VM Notes
|
VM Call Date
|
|
|
2022 VM Senior Notes
|
(a)
|
|
|
2023 VM Senior Notes
|
April 15, 2018
|
|
|
2024 VM Senior Notes
|
October 15, 2019
|
|
|
2025 VM Senior Notes
|
January 15, 2020
|
|
|
January 2021 VM Senior Secured Notes
|
(a)
|
|
|
April 2021 VM Sterling Senior Secured Notes
|
April 15, 2017
|
|
|
2025 VM 5.5% Sterling Senior Secured Notes
|
January 15, 2019
|
|
|
2025 VM Dollar Senior Secured Notes
|
January 15, 2019
|
|
|
2025 VM 5.125% Sterling Senior Secured Notes
|
January 15, 2020
|
|
|
2026 VM 5.25% Dollar Senior Secured Notes
|
January 15, 2020
|
|
|
2026 VM 5.5% Dollar Senior Secured Notes
|
August 15, 2021
|
|
|
2027 VM Senior Secured Notes
|
January 15, 2021
|
|
|
2029 VM Senior Secured Notes
|
January 15, 2021
|
|
_______________
|
(a)
|
The
2022 VM Senior Notes
and the
January 2021 VM Senior Secured Notes
are non-callable. At any time prior to maturity, some or all of these notes may be redeemed by paying a “make-whole” premium, which is the present value of all remaining scheduled interest payments to the respective maturity date.
|
II-156
LIBERTY GLOBAL PLC
Notes to Consolidated Financial Statements — (Continued)
December 31, 2016, 2015 and 2014
Virgin Media Finance
or
Virgin Media Secured Finance
(as applicable) may redeem some or all of the
VM Senior Notes
and the
VM Senior Secured Notes
(with the exception of the
2022 VM Senior Notes
and the
January 2021 VM Senior Secured Notes
) at the following redemption prices (expressed as a percentage of the principal amount) plus accrued and unpaid interest and additional amounts (as specified in the applicable indenture), if any, to the applicable redemption date, as set forth below:
|
Redemption price
|
|||||||||||||||
|
2023 VM Dollar Senior Notes
|
2023 VM Sterling Senior Notes
|
2024 VM Dollar Senior Notes
|
2024 VM Sterling Senior Notes
|
2025 VM Dollar Senior Notes
|
2025 VM Euro Senior Notes
|
April 2021 VM Dollar Senior Secured Notes
|
|||||||||
|
12-month period commencing
|
April 15
|
April 15
|
October 15
|
October 15
|
January 15
|
January 15
|
April 15
|
||||||||
|
2017
|
N.A.
|
N.A.
|
N.A.
|
N.A.
|
N.A
|
N.A
|
|
||||||||
|
2018
|
|
|
N.A.
|
N.A.
|
N.A
|
N.A
|
|
||||||||
|
2019
|
|
|
|
|
N.A
|
N.A
|
|
||||||||
|
2020
|
|
|
|
|
|
|
|
||||||||
|
2021
|
|
|
|
|
|
|
N.A.
|
||||||||
|
2022
|
|
|
|
|
|
|
N.A.
|
||||||||
|
2023
|
N.A.
|
N.A.
|
|
|
|
|
N.A.
|
||||||||
|
2024 and thereafter
|
N.A.
|
N.A.
|
N.A.
|
N.A.
|
|
|
N.A.
|
||||||||
|
Redemption Price
|
|||||||||||||||||
|
April 2021 VM Sterling Senior Secured Notes
|
2025 VM 5.5% Sterling Senior Secured Notes
|
2025 VM Dollar Senior Secured Notes
|
2025 VM 5.125% Sterling Senior Secured Notes
|
2026 VM 5.25% Dollar Senior Secured Notes
|
2026 VM 5.5% Dollar Senior Secured Notes
|
2027 VM Senior Secured Notes
|
2029 VM Senior Secured Notes
|
||||||||||
|
12-month period commencing
|
April 15
|
January 15
|
January 15
|
January 15
|
January 15
|
August 15
|
January 15
|
January 15
|
|||||||||
|
2017
|
|
N.A.
|
N.A.
|
N.A.
|
N.A.
|
N.A.
|
N.A.
|
N.A.
|
|||||||||
|
2018
|
|
N.A.
|
N.A.
|
N.A.
|
N.A.
|
N.A.
|
N.A.
|
N.A.
|
|||||||||
|
2019
|
|
|
|
N.A.
|
N.A.
|
N.A.
|
N.A.
|
N.A.
|
|||||||||
|
2020
|
|
|
|
|
|
N.A.
|
N.A.
|
N.A.
|
|||||||||
|
2021
|
N.A.
|
|
|
|
|
|
|
|
|||||||||
|
2022
|
N.A.
|
|
|
|
|
|
|
|
|||||||||
|
2023
|
N.A.
|
|
|
|
|
|
|
|
|||||||||
|
2024 and thereafter
|
N.A.
|
|
|
|
|
|
|
|
|||||||||
2016
Refinancing Transactions.
In April 2016,
Virgin Media Secured Finance
issued the
2026 VM 5.5% Dollar Senior Secured Notes
. The net proceeds from the
2026 VM 5.5% Dollar Senior Secured Notes
were used to repay in full the then outstanding amount under the
VM Revolving Facility
and for general corporate purposes.
For information regarding a refinancing transaction completed subsequent to
December 31, 2016
that impacts the
VM Notes
, see note
20
.
2015
and
2014
Refinancing Transactions.
During
2015
and
2014
,
Virgin Media
completed a number of refinancing transactions that generally resulted in lower interest rates and extended maturities. In connection with these transactions,
Virgin Media
recognized gains (losses) on debt modification and extinguishment, net, of (
$
44.3
million
) and
$
32.3
million
during 2015 and 2014, respectively,
II-157
LIBERTY GLOBAL PLC
Notes to Consolidated Financial Statements — (Continued)
December 31, 2016, 2015 and 2014
which includes (i) the write-off of deferred financing costs of
$
28.6
million
and
$
15.6
million
, respectively, (ii) the payment of redemption premiums of
$
10.7
million
and
$
123.0
million
, respectively, (iii) the write-off of net unamortized (discounts) premiums (
$
4.2
million
) and
$
170.9
million
, respectively, and (iv) the payment of third-party costs of
$
0.8
million
and
nil
, respectively.
VM Credit Facilities
|
VM Credit Facilities
|
Maturity
|
Interest rate
|
Facility amount
(in borrowing
currency)
|
Outstanding principal amount
|
Unused
borrowing
capacity
|
Carrying
value (a)
|
||||||||||||||
|
|
|
|
in millions
|
|||||||||||||||||
|
Senior Secured Facilities:
|
||||||||||||||||||||
|
E
|
June 30, 2023
|
LIBOR + 3.50% (b)
|
£
|
|
|
$
|
|
|
$
|
|
|
$
|
|
|
||||||
|
I
|
January 31, 2025
|
LIBOR + 2.75%
|
$
|
|
|
|
|
|
|
|
|
|||||||||
|
VM Revolving Facility (c)
|
December 31, 2021
|
LIBOR + 2.75%
|
(d)
|
|
|
|
|
|
|
|||||||||||
|
Total Senior Secured Facilities
|
|
|
|
|
|
|
||||||||||||||
|
Senior Facility:
|
||||||||||||||||||||
|
VM Financing Facility
|
September 15, 2024
|
|
—
|
|
|
|
|
|
|
|
||||||||||
|
Total
|
$
|
|
|
$
|
|
|
$
|
|
|
|||||||||||
_______________
|
(a)
|
The carrying values of VM Facilities E and I are net of discounts and deferred financing costs.
|
|
(b)
|
VM Facility E
has a
LIBOR
floor of
|
|
(c)
|
The
VM Revolving Facility
has a fee on unused commitments of
|
|
(d)
|
|
2016
Refinancing Transactions.
In October 2016, Virgin Media Receivables Financing Notes I Designated Activity Company (
Virgin Media Receivables Financing Company
), a third-party special purpose financing entity that is not consolidated by
Virgin Media
or
Liberty Global
, issued
£
350.0
million
(
$
432.1
million
) principal amount of
5.50
%
receivables financing notes due September 15, 2024 (the
VM Receivables Financing Notes
). The net proceeds from the
VM Receivables Financing Notes
are used to purchase certain vendor financed receivables of
Virgin Media
and its subsidiaries from various third parties. To the extent that the proceeds from the
VM Receivables Financing Notes
exceed the amount of vendor financed receivables available to be purchased, the excess proceeds are used to fund an excess cash facility (the
VM Financing Facility
) under a new credit facility of
VMIH
.
Virgin Media Receivables Financing Company
can request the
VM Financing Facility
be repaid by
VMIH
as additional vendor financed receivables become available for purchase.
In December 2016, Virgin Media Bristol LLC entered into
VM Facility I
.
VM Facility I
was issued at
99.75
%
of par and is subject to a
LIBOR
floor of
0.0
%
. The net proceeds from
VM Facility I
were used to prepay (i) in full the
$
1,855.0
million
outstanding principal amount under
VM Facility F
, (ii) in full the
$
900.0
million
outstanding principal under the
April 2021 VM Dollar Senior Secured Notes
, (iii)
£
350.0
million
(
$
432.1
million
) of the
£
990.0
million
(
$
1,222.2
million
) outstanding principal amount under the
April 2021 VM Sterling Senior Secured Notes
and (iv) in full the
£
100.0
million
(
$
123.5
million
) outstanding principal amount under
VM Facility D
. In connection with these transactions,
Virgin Media
recognized a loss on debt modification and extinguishment, net, of
$
78.4
million
. This loss includes (a) the payment of
$
52.6
million
of redemption premium, (b) the write-off of
$
23.8
million
of deferred financing costs and (c) the write-off of unamortized discount of
$
2.0
million
.
II-158
LIBERTY GLOBAL PLC
Notes to Consolidated Financial Statements — (Continued)
December 31, 2016, 2015 and 2014
For information regarding a refinancing transaction completed subsequent to
December 31, 2016
that impacts the
VM Credit Facilities
, see note
20
.
Unitymedia Notes
|
|
|
|
Outstanding principal
amount
|
|
|
||||||||||||||||||||
|
Unitymedia Notes
|
Maturity
|
Interest
rate
|
Original issue amount
|
Borrowing
currency
|
U.S. $
equivalent
|
Estimated
fair value
|
Carrying
value (a)
|
||||||||||||||||||
|
|
|
|
in millions
|
||||||||||||||||||||||
|
UM Senior Notes (b):
|
|||||||||||||||||||||||||
|
2025 UM Senior Notes
|
January 15, 2025
|
|
%
|
$
|
|
|
$
|
|
|
$
|
|
|
$
|
|
|
$
|
|
|
|||||||
|
2027 UM Senior Notes
|
January 15, 2027
|
|
%
|
€
|
|
|
€
|
|
|
|
|
|
|
|
|
||||||||||
|
UM Senior Secured Notes (c):
|
|||||||||||||||||||||||||
|
2022 UM Senior Secured Notes
|
September 15, 2022
|
|
%
|
€
|
|
|
€
|
|
|
|
|
|
|
|
|
||||||||||
|
January 2023 UM Senior Secured Notes:
|
|||||||||||||||||||||||||
|
January 2023 UM Dollar Senior Secured Notes
|
January 15, 2023
|
|
%
|
$
|
|
|
$
|
|
|
|
|
|
|
|
|
||||||||||
|
January 2023 5.75% UM Euro Senior Secured Notes
|
January 15, 2023
|
|
%
|
€
|
|
|
€
|
|
|
|
|
|
|
|
|
||||||||||
|
January 2023 5.125% UM Euro Senior Secured Notes
|
January 21, 2023
|
|
%
|
€
|
|
|
€
|
|
|
|
|
|
|
|
|
||||||||||
|
April 2023 UM Senior Secured Notes
|
April 15, 2023
|
|
%
|
€
|
|
|
€
|
|
|
|
|
|
|
|
|
||||||||||
|
2025 UM Senior Secured Notes:
|
|||||||||||||||||||||||||
|
2025 UM Euro Senior Secured Notes
|
January 15, 2025
|
|
%
|
€
|
|
|
€
|
|
|
|
|
|
|
|
|
||||||||||
|
2025 UM Dollar Senior Secured Notes
|
January 15, 2025
|
|
%
|
$
|
|
|
$
|
|
|
|
|
|
|
|
|
||||||||||
|
2026 UM Senior Secured Notes
|
February 15, 2026
|
|
%
|
€
|
|
|
€
|
|
|
|
|
|
|
|
|
||||||||||
|
2027 UM Senior Secured Notes
|
January 15, 2027
|
|
%
|
€
|
|
|
€
|
|
|
|
|
|
|
|
|
||||||||||
|
2029 UM Senior Secured Notes
|
January 15, 2029
|
|
%
|
€
|
|
|
€
|
|
|
|
|
|
|
|
|
||||||||||
|
Total
|
$
|
|
|
$
|
|
|
$
|
|
|
||||||||||||||||
_______________
|
(a)
|
Amounts are net of deferred financing costs.
|
|
(b)
|
The
UM Senior Notes
were issued by
Unitymedia
.
|
|
(c)
|
|
II-159
LIBERTY GLOBAL PLC
Notes to Consolidated Financial Statements — (Continued)
December 31, 2016, 2015 and 2014
|
Unitymedia Notes
|
UM Call Date
|
|
|
2025 UM Senior Notes
|
January 15, 2020
|
|
|
2027 UM Senior Notes
|
January 15, 2021
|
|
|
2022 UM Senior Secured Notes
|
September 15, 2017
|
|
|
January 2023 UM Dollar Senior Secured Notes
|
January 15, 2018
|
|
|
January 2023 5.75% UM Euro Senior Secured Notes
|
January 15, 2018
|
|
|
January 2023 5.125% UM Euro Senior Secured Notes
|
January 21, 2018
|
|
|
April 2023 UM Senior Secured Notes
|
April 15, 2018
|
|
|
2025 UM Senior Secured Notes
|
January 15, 2020
|
|
|
2026 UM Senior Secured Notes
|
February 15, 2021
|
|
|
2027 UM Senior Secured Notes
|
January 15, 2021
|
|
|
2029 UM Senior Secured Notes
|
January 15, 2021
|
|
Unitymedia
or the
UM Senior Secured Notes Issuer
s (as applicable) may redeem some or all of the
Unitymedia Notes
at the following redemption prices (expressed as a percentage of the principal amount) plus accrued and unpaid interest and additional amounts (as specified in the applicable indenture), if any, to the applicable redemption date, as set forth below:
|
|
Redemption price
|
||||||||||||
|
2025 UM Senior Notes
|
2027 UM Senior Notes
|
2022 UM Senior Secured Notes
|
January 2023
UM Dollar Senior Secured Notes
|
January 2023 5.75%
UM Euro Senior Secured Notes
|
January 2023 5.125% UM Euro Senior Secured Notes
|
||||||||
|
12-month period commencing
|
January 15
|
January 15
|
September 15
|
January 15
|
January 15
|
January 21
|
|||||||
|
2017
|
N.A.
|
N.A.
|
|
N.A.
|
N.A.
|
N.A.
|
|||||||
|
2018
|
N.A.
|
N.A.
|
|
|
|
|
|||||||
|
2019
|
N.A.
|
N.A.
|
|
|
|
|
|||||||
|
2020
|
|
N.A.
|
|
|
|
|
|||||||
|
2021
|
|
|
|
|
|
|
|||||||
|
2022
|
|
|
N.A.
|
|
|
|
|||||||
|
2023
|
|
|
N.A.
|
N.A.
|
N.A.
|
N.A.
|
|||||||
|
2024 and thereafter
|
|
|
N.A.
|
N.A.
|
N.A.
|
N.A.
|
|||||||
II-160
LIBERTY GLOBAL PLC
Notes to Consolidated Financial Statements — (Continued)
December 31, 2016, 2015 and 2014
|
|
Redemption price
|
||||||||||||
|
April 2023 UM Senior Secured Notes
|
2025 UM Euro Senior Secured Notes
|
2025 UM Dollar Senior Secured Notes
|
2026 UM Senior Secured Notes
|
2027 UM Senior Secured Notes
|
2029 UM Senior Secured Notes
|
||||||||
|
12-month period commencing
|
April 15
|
January 15
|
January 15
|
February 15
|
January 15
|
January 15
|
|||||||
|
2018
|
|
N.A.
|
N.A.
|
N.A.
|
N.A.
|
N.A.
|
|||||||
|
2019
|
|
N.A.
|
N.A.
|
N.A.
|
N.A.
|
N.A.
|
|||||||
|
2020
|
|
|
|
N.A.
|
N.A.
|
N.A.
|
|||||||
|
2021
|
|
|
|
|
|
|
|||||||
|
2022
|
|
|
|
|
|
|
|||||||
|
2023
|
N.A.
|
|
|
|
|
|
|||||||
|
2024 and thereafter
|
N.A.
|
|
|
|
|
|
|||||||
2016
Refinancing Transactions.
In December 2015, the
UM Senior Secured Notes Issuer
s, issued the
2026 UM Senior Secured Notes
. A portion of the net proceeds from the
2026 UM Senior Secured Notes
, which were held in escrow at December 31, 2015 as cash collateral, were used in January 2016 to redeem
10
%
of the principal amount of each of the following series of notes: (i) the
€
585.0
million
(
$
617.0
million
) outstanding principal amount of
2022 UM Senior Secured Notes
and (ii) the
€
450.0
million
(
$
474.6
million
) outstanding principal amount of the
January 2023 5.125% UM Euro Senior Secured Notes
, each at a redemption price equal to
103
%
of the applicable redeemed principal amount in accordance with the indentures governing each of the notes. In connection with these transactions,
Unitymedia
recognized a loss on debt modification and extinguishment, net, of
$
4.3
million
in
2016
. This loss includes (a) the payment of
$
3.4
million
of redemption premium and (b) the write-off of
$
0.9
million
of deferred financing costs.
2015
and
2014
Refinancing Transactions.
During
2015
and
2014
,
Unitymedia
completed a number of refinancing transactions that generally resulted in lower interest rates and extended maturities. In connection with these transactions,
Unitymedia
recognized losses on debt modification and extinguishment, net, of
$
102.4
million
and
$
130.8
million
during
2015
and
2014
, respectively. These losses include (i) the payment of redemption premiums of
$
98.8
million
and
$
115.1
million
, respectively, (ii) the write-off of deferred financing costs of
$
2.2
million
and
$
14.0
million
, respectively, (iii) the write-off of unamortized discounts of
$
1.4
million
and
$
12.3
million
, respectively, and (iv) the write-off of
$
10.6
million
of unamortized premium in
2014
.
II-161
LIBERTY GLOBAL PLC
Notes to Consolidated Financial Statements — (Continued)
December 31, 2016, 2015 and 2014
Unitymedia Revolving Credit Facilities
|
Unitymedia Facility
|
Maturity
|
Interest rate
|
Facility amount (in borrowing currency)
|
Outstanding principal amount
|
Unused
borrowing
capacity (a)
|
Carrying
value
|
||||||||||||||
|
|
|
|
in millions
|
|||||||||||||||||
|
UM Senior Secured Facility (b)
|
December 31, 2020
|
EURIBOR + 2.75%
|
€
|
|
|
$
|
|
|
$
|
|
|
$
|
|
|
||||||
|
UM Super Senior Secured Facility (c)
|
December 31, 2020
|
EURIBOR + 2.25%
|
€
|
|
|
|
|
|
|
|
|
|||||||||
|
Total
|
$
|
|
|
$
|
|
|
$
|
|
|
|||||||||||
_______________
|
(a)
|
At
December 31, 2016
, our availability under the
Unitymedia Revolving Credit Facilities
was limited to
€
|
|
(b)
|
The
UM Senior Secured Facility
has a fee on unused commitments of
|
|
(c)
|
|
UPCB SPE Notes
|
|
|
Outstanding principal
amount
|
|
|
||||||||||||||||||||
|
UPCB SPE Notes
|
Maturity
|
Interest rate
|
Original issue amount
|
Borrowing
currency
|
U.S. $
equivalent
|
Estimated
fair value
|
Carrying
value (a)
|
|||||||||||||||||
|
|
|
in millions
|
||||||||||||||||||||||
|
UPCB Finance IV Dollar Notes
|
January 15, 2025
|
|
$
|
|
|
$
|
|
|
$
|
|
|
$
|
|
|
$
|
|
|
|||||||
|
UPCB Finance IV Euro Notes
|
January 15, 2027
|
|
€
|
|
|
€
|
|
|
|
|
|
|
|
|
||||||||||
|
Total
|
$
|
|
|
$
|
|
|
$
|
|
|
|||||||||||||||
_______________
|
(a)
|
|
Subject to the circumstances described below, the
UPCB Finance IV Dollar Notes
are non-callable until January 15, 2020 and the
UPCB Finance IV Euro Notes
are non-callable until January 15, 2021 (each a
UPCB SPE Notes Call Date
). If, however, at any time prior to the applicable
UPCB SPE Notes Call Date
, all or a portion of the loans under the related
UPCB SPE Funded Facility
are voluntarily prepaid (a
UPCB Early Redemption Event
), then the
UPCB SPE
will be required to redeem an aggregate principal amount of its
UPCB SPE Notes
equal to the aggregate principal amount of the loans so prepaid under the relevant
UPCB SPE Funded Facility
. In general, the redemption price payable will equal
100
%
of the principal amount of the applicable
UPCB SPE Notes
to be redeemed and a “make-whole” premium, which is the present value of all remaining scheduled interest payments
II-162
LIBERTY GLOBAL PLC
Notes to Consolidated Financial Statements — (Continued)
December 31, 2016, 2015 and 2014
to the applicable
UPCB SPE Notes Call Date
using the discount rate (as specified in the applicable indenture) as of the redemption date plus
50
basis points
.
|
Redemption price
|
|||||
|
UPCB Finance IV Dollar Notes
|
UPCB Finance IV Euro Notes
|
||||
|
12-month period commencing
|
January 15
|
January 15
|
|||
|
2020
|
|
N.A.
|
|||
|
2021
|
|
|
|||
|
2022
|
|
|
|||
|
2023
|
|
|
|||
|
2024 and thereafter
|
|
|
|||
2016
Refinancing Transactions.
In August 2016,
UPC Broadband Holding
entered into
UPC Facility AN
(as defined and described below). A portion of the net proceeds from
UPC Facility AN
were ultimately used to redeem (i) in full the amount outstanding under the
UPCB Finance V Notes
and (ii)
10
%
of the original principal amount under the
UPCB Finance VI Notes
, as further described below under
UPC Broadband Holding Bank Facility
- 2016 Refinancing Transactions
.
In November 2016,
UPC Financing
and
UPC Broadband Holding
entered into
UPC Facility AO
(as defined and described below). A portion of the net proceeds from
UPC Facility AO
were ultimately used to redeem the remaining outstanding amount under the
UPCB Finance VI Notes
, as further described below under
UPC Broadband Holding Bank Facility
- 2016 Refinancing Transactions
.
2015
Refinancing Transactions.
During
2015
,
UPC Holding
completed a number of refinancing transactions that generally resulted in lower interest rates and extended maturities. In connection with these transactions,
UPC Holding
recognized losses on debt modification and extinguishment, net, of
$
59.6
million
. These losses includes (i) the payment of
$
54.3
million
of redemption premium and (ii) the write-off of
$
5.3
million
of deferred financing costs.
UPC Holding Senior Notes
|
|
|
Outstanding principal
amount
|
|
|
||||||||||||||
|
UPC Holding Senior Notes
|
Maturity
|
Borrowing
currency
|
U.S. $
equivalent
|
Estimated
fair value
|
Carrying
value (a)
|
|||||||||||||
|
|
|
in millions
|
||||||||||||||||
|
UPC Holding 6.375% Senior Notes
|
September 15, 2022
|
€
|
|
|
$
|
|
|
$
|
|
|
$
|
|
|
|||||
|
UPC Holding 6.75% Senior Notes:
|
||||||||||||||||||
|
UPC Holding 6.75% Euro Senior Notes
|
March 15, 2023
|
€
|
|
|
|
|
|
|
|
|
||||||||
|
UPC Holding 6.75% CHF Senior Notes
|
March 15, 2023
|
CHF
|
|
|
|
|
|
|
|
|
||||||||
|
Total
|
$
|
|
|
$
|
|
|
$
|
|
|
|||||||||
II-163
LIBERTY GLOBAL PLC
Notes to Consolidated Financial Statements — (Continued)
December 31, 2016, 2015 and 2014
_______________
|
(a)
|
|
At any time prior to
September 15, 2017
, in the case of the
UPC Holding 6.375% Senior Notes
, and
March 15, 2018
, in the case of the
UPC Holding 6.75% Senior Notes
,
UPC Holding
may redeem some or all of such
UPC Holding Senior Notes
by paying a “make-whole” premium, which is the present value of all scheduled interest payments until
September 15, 2017
or
March 15, 2018
(as applicable) using the discount rate (as specified in the applicable indenture) as of the redemption date, plus
50
basis points
.
|
|
Redemption price
|
||||
|
UPC Holding 6.375%
Senior Notes
|
UPC Holding 6.75% Senior Notes
|
||||
|
12-month period commencing
|
September 15
|
March 15
|
|||
|
2017
|
|
N.A.
|
|||
|
2018
|
|
|
|||
|
2019
|
|
|
|||
|
2020
|
|
|
|||
|
2021 and thereafter
|
|
|
|||
2015
and
2014
Financing Transactions.
During
2015
and
2014
,
UPC Holding
completed a number of financing transactions that generally resulted in lower interest rates and extended maturities. In connection with these transactions,
UPC Holding
recognized losses on debt modification and extinguishment, net, of
$
69.3
million
and
$
41.5
million
during
2015
and
2014
, respectively, which includes (i) the payment of redemption premiums of
$
59.2
million
and
$
19.7
million
, respectively, (ii) the write-off of deferred financing costs of
$
10.1
million
and
$
4.4
million
, respectively and (iii) the write-off of unamortized discount of
nil
and
$
17.4
million
, respectively.
UPC Broadband Holding Bank Facility
|
UPC Broadband Holding Facility
|
Maturity
|
Interest rate
|
Facility amount
(in borrowing
currency) (a)
|
Outstanding principal amount
|
Unused
borrowing
capacity (b)
|
Carrying
value (c)
|
||||||||||||||
|
|
|
|
in millions
|
|||||||||||||||||
|
AK (d)
|
January 15, 2027
|
|
€
|
|
|
$
|
|
|
$
|
|
|
$
|
|
|
||||||
|
AL (d)
|
January 15, 2025
|
|
$
|
|
|
|
|
|
|
|
|
|||||||||
|
AM
|
December 31, 2021
|
EURIBOR + 2.75%
|
€
|
|
|
|
|
|
|
|
|
|||||||||
|
AN
|
August 31, 2024
|
LIBOR + 3.00%
|
$
|
|
|
|
|
|
|
|
|
|||||||||
|
AO
|
January 15, 2026
|
EURIBOR + 3.00%
|
€
|
|
|
|
|
|
|
|
|
|||||||||
|
Elimination of Facilities AK and AL in consolidation (d)
|
(
|
)
|
|
|
(
|
)
|
||||||||||||||
|
Total
|
$
|
|
|
$
|
|
|
$
|
|
|
|||||||||||
II-164
LIBERTY GLOBAL PLC
Notes to Consolidated Financial Statements — (Continued)
December 31, 2016, 2015 and 2014
_______________
|
(a)
|
Except as described in (d) below, amounts represent total third-party facility amounts at
December 31, 2016
.
|
|
(b)
|
At
December 31, 2016
, our availability under the
UPC Broadband Holding Bank Facility
was limited to
€
|
|
(c)
|
Amounts are net of discounts and deferred financing costs, where applicable.
|
|
(d)
|
As further discussed in the above description of the
UPCB SPE Notes
, the amounts borrowed by UPC Financing Partnership (
UPC Financing
) outstanding under UPC Facilities AK and AL are eliminated in
Liberty Global
’s consolidated financial statements.
|
2016
Refinancing Transactions.
In August 2016,
UPC Broadband Holding
entered into
UPC Facility AN
.
UPC Facility AN
was issued at
99.5
%
of par and is subject to a LIBOR floor of
0.0
%
. The net proceeds from
UPC Facility AN
were used to prepay (i) in full the
$
1,305.0
million
outstanding principal amount under
UPC Facility AH
, (ii) in full the
$
675.0
million
outstanding principal amount under
UPC Facility AC
, together with accrued and unpaid interest and the related prepayment premium, to UPCB Finance V Limited (
UPCB Finance V
) and, in turn,
UPCB Finance V
used such proceeds to fully redeem the
$
675.0
million
principal amount of its
7.250
%
senior secured notes and (iii)
10
%
of the
$
750.0
million
original principal amount under
UPC Facility AD
, together with accrued and unpaid interest and the related prepayment premium, to UPCB Finance VI Limited (
UPCB Finance VI
) and, in turn,
UPCB Finance VI
used
such proceeds to redeem
10
%
of its
$
750.0
million
original principal amount of
6.875
%
senior secured notes due January 15, 2022 (the
UPCB Finance VI Notes
). The redemption price for the
UPCB Finance VI Notes
was
103
%
of the applicable redeemed principal amount. In connection with these transactions,
UPC Holding
recognized a loss on debt modification and extinguishment, net, of
$
48.8
million
. This loss includes (a) the payment of
$
34.2
million
of redemption premium, (b) the write-off of
$
11.0
million
of deferred financing costs and (c) the write-off of unamortized discount of
$
3.6
million
.
In November 2016,
UPC Financing
entered into
UPC Facility AO
.
UPC Facility AO
was issued at
99.75
%
of par and is subject to a
EURIBOR
floor of
0.0
%
. The net proceeds from
UPC Facility AO
, in conjunction with existing cash, were used to prepay in full the remaining
$
600.0
million
outstanding principal amount under
UPC Facility AD
, together with accrued and unpaid interest and the related prepayment premium to
UPCB Finance VI
and, in turn,
UPCB Finance VI
used
such proceeds to redeem the remaining
$
600.0
million
outstanding principal amount of the
UPCB Finance VI Notes
. The redemption price for the
UPCB Finance VI Notes
was
103
%
of the applicable redeemed principal amount. In connection with these transactions,
UPC Holding
recognized a loss on debt modification and extinguishment, net, of
$
28.3
million
. This loss includes (i) the payment of
$
23.0
million
of redemption premium and (ii) the write-off of
$
5.3
million
of deferred financing costs.
For information regarding a refinancing transaction completed subsequent to
December 31, 2016
that impacts the
UPC Broadband Holding Bank Facility
, see note
20
.
2015
and
2014
Refinancing Transactions.
During
2015
and
2014
,
UPC Holding
completed a number of refinancing transactions that generally resulted in lower interest rates or extended maturities under the the
UPC Broadband Holding Bank Facility
. In connection with these transactions,
UPC Holding
recognized losses on debt modification and extinguishment, net, of
$
76.9
million
and
$
16.5
million
during
2015
and
2014
, respectively. These losses include (i) the payment of
$
53.5
million
of redemption premium in
2015
, (ii) the write-off of deferred financing costs of
$
18.7
million
and
$
11.6
million
, respectively, and (iii) the write-off of unamortized discounts of
$
4.7
million
and
$
4.9
million
, respectively.
II-165
LIBERTY GLOBAL PLC
Notes to Consolidated Financial Statements — (Continued)
December 31, 2016, 2015 and 2014
Telenet Credit Facility
|
Telenet Facility
|
Maturity
|
Interest rate
|
Facility amount
(in borrowing
currency) (a)
|
Outstanding principal amount
|
Unused
borrowing
capacity
|
Carrying
value (b)
|
||||||||||||||
|
|
|
|
in millions
|
|||||||||||||||||
|
U (c)
|
August 15, 2022
|
|
€
|
|
|
$
|
|
|
$
|
|
|
$
|
|
|
||||||
|
V (c)
|
August 15, 2024
|
|
€
|
|
|
|
|
|
|
|
|
|||||||||
|
Z (d)
|
June 30, 2018
|
EURIBOR + 2.25%
|
€
|
|
|
|
|
|
|
|
|
|||||||||
|
AB (c)
|
July 15, 2027
|
|
€
|
|
|
|
|
|
|
|
|
|||||||||
|
AE
|
January 31, 2025
|
EURIBOR + 3.25%
|
€
|
|
|
|
|
|
|
|
|
|||||||||
|
AF
|
January 31, 2025
|
LIBOR + 3.00%
|
$
|
|
|
|
|
|
|
|
|
|||||||||
|
AG (e)
|
June 30, 2023
|
EURIBOR + 2.75%
|
€
|
|
|
|
|
|
|
|
|
|||||||||
|
Telenet Overdraft Facility (f)
|
December 31, 2017
|
EURIBOR + 1.60%
|
€
|
|
|
|
|
|
|
|
|
|||||||||
|
Elimination of Telenet Facilities U, V and AB in consolidation (c)
|
(
|
)
|
|
|
(
|
)
|
||||||||||||||
|
Total
|
$
|
|
|
$
|
|
|
$
|
|
|
|||||||||||
_______________
|
(a)
|
Except as described in (c) below, amounts represent total third-party facility amounts at
December 31, 2016
.
|
|
(b)
|
Amounts are net of deferred financing costs.
|
|
(c)
|
As further discussed in the above description of the
Telenet SPE Notes
, the amounts outstanding under
Telenet
Facilities U, V and AB are eliminated in
Liberty Global
’s consolidated financial statements.
|
|
(d)
|
Telenet Facility Z
has a fee on unused commitments of
|
|
(e)
|
In November 2016,
Telenet International
entered into
Telenet Facility AG
, which is subject to a
EURIBOR
floor of
|
|
(f)
|
The
Telenet Overdraft Facility
has a fee on unused commitments of
|
2016
Refinancing Transactions.
In May 2016, Telenet Financing USD LLC (
Telenet Finance
), a wholly-owned subsidiary of
Telenet
,
entered into a new
$
850.0
million
term loan facility (
Telenet Facility AD
). The net proceeds from
Telenet Facility AD
were used to repay in full (i) the
€
400.0
million
(
$
421.9
million
) outstanding principal amount under
Telenet Facility P
, together with accrued and unpaid interest and the related prepayment premium, to Telenet Finance IV Luxembourg S.C.A. (
Telenet Finance IV
) and, in turn,
Telenet Finance IV
used such proceeds to fully redeem the
€
400.0
million
(
$
421.9
million
) principal amount of its senior secured floating rate notes and (ii) the
€
300.0
million
(
$
316.4
million
) outstanding principal amount under
Telenet Facility O
, together with accrued and unpaid interest and the related prepayment premium, to Telenet Finance III Luxembourg S.C.A. (
Telenet Finance III
) and, in turn,
Telenet Finance III
used such proceeds to fully redeem the
€
300.0
million
(
$
316.4
million
) principal amount of its
6.625
%
senior secured notes. In connection with these transactions,
Telenet
recognized a loss on debt modification and extinguishment, net, of
$
18.9
million
. This loss includes (a) the payment of
$
11.1
million
of redemption premium and (b) the write-off of
$
7.8
million
of deferred financing costs.
In November 2016, (i) Telenet International, a wholly-owned subsidiary of
Telenet
, entered into
Telenet Facility AE
which is subject to a
EURIBOR
floor of
0.0
%
, and (ii)
Telenet Finance
entered into
Telenet Facility AF
, which was issued at
99.5
%
of par and is subject to a
LIBOR
floor of
0.0
%
. The net proceeds from
Telenet Facility AE
and
Telenet Facility AF
were used to prepay in full (a) the
€
474.1
million
(
$
500.1
million
) outstanding principal amount under
Telenet Facility W
,
(b) the
€
882.9
million
(
$931.2
II-166
LIBERTY GLOBAL PLC
Notes to Consolidated Financial Statements — (Continued)
December 31, 2016, 2015 and 2014
million
) outstanding principal amount under
Telenet Facility Y
, (c) the
€
800.0
million
(
$
843.8
million
) outstanding principal amount under
Telenet Facility AA
and (d) the
$
850.0
million
outstanding principal amount under
Telenet Facility AD
. In connection with these transactions,
Telenet
recognized a loss on debt modification and extinguishment, net, of
$
33.9
million
. This loss includes (a) the write-off of
$
26.0
million
of deferred financing costs and (b) the payment of
$
7.9
million
of redemption premium.
2014 Refinancing Transactions.
During 2014,
Telenet
completed a number of refinancing transactions that generally resulted in lower interest rates and extended maturities. In connection with these transactions,
Telenet
recognized a loss on debt modification and extinguishment, net, of
$
11.9
million
, which includes (i) the write-off of
$
7.1
million
of deferred financing costs, (ii) the payment of
$
3.6
million
of redemption premium and (iii) the write-off of
$
1.2
million
of unamortized discount.
Telenet SPE Notes
|
|
|
Outstanding
principal amount
|
|
|
|||||||||||||||||
|
Telenet SPEs Notes
|
Maturity
|
Interest rate
|
Borrowing
currency
|
U.S. $
equivalent
|
Estimated
fair value
|
Carrying
value (a)
|
|||||||||||||||
|
|
|
in millions
|
|||||||||||||||||||
|
6.25% Telenet Finance V Notes
|
August 15, 2022
|
|
€
|
|
|
$
|
|
|
$
|
|
|
$
|
|
|
|||||||
|
6.75% Telenet Finance V Notes
|
August 15, 2024
|
|
€
|
|
|
|
|
|
|
|
|
||||||||||
|
Telenet Finance VI Notes
|
July 15, 2027
|
|
€
|
|
|
|
|
|
|
|
|
||||||||||
|
Total
|
$
|
|
|
$
|
|
|
$
|
|
|
||||||||||||
_______________
|
(a)
|
|
Subject to the circumstances described below, the
6.25% Telenet Finance V Notes
are non-callable until August 15, 2017, the
6.75% Telenet Finance V Notes
are non-callable until August 15, 2018 and the
Telenet Finance VI Notes
are non-callable until July 15, 2021 (each a
Telenet SPE Notes Call Date
). If, however, at any time prior to the applicable
Telenet SPE Notes Call Date
, all or a portion of the loans under the related
Telenet SPE Funded Facility
are voluntarily prepaid (a
Telenet Early Redemption Event
), then the applicable
Telenet SPE
will be required to redeem an aggregate principal amount of its
Telenet SPE Notes
equal to the principal amount of the loans so prepaid under the relevant
Telenet SPE Funded Facility
. In general, the redemption price payable will equal
100
%
of the principal amount of the applicable
Telenet SPE Notes
to be redeemed and a “make-whole” premium, which is the present value of all remaining scheduled interest payments to the applicable
Telenet SPE Notes Call Date
using the discount rate (as specified in the applicable indenture) as of the redemption date plus
50
basis points
.
II-167
LIBERTY GLOBAL PLC
Notes to Consolidated Financial Statements — (Continued)
December 31, 2016, 2015 and 2014
|
|
Redemption Price
|
||||||
|
6.25% Telenet
Finance V
Notes
|
6.75% Telenet
Finance V
Notes
|
Telenet Finance VI Notes
|
|||||
|
12-month period commencing
|
August 15
|
August 15
|
July 15
|
||||
|
2017
|
|
N.A.
|
N.A.
|
||||
|
2018
|
|
|
N.A.
|
||||
|
2019
|
|
|
N.A.
|
||||
|
2020
|
|
|
N.A.
|
||||
|
2021
|
|
|
|
||||
|
2022
|
N.A.
|
|
|
||||
|
2023
|
N.A.
|
|
|
||||
|
2024 and thereafter
|
N.A.
|
N.A.
|
|
||||
2016
Refinancing Transactions.
In May 2016,
Telenet Finance
entered into
Telenet Facility AD
(as defined and described above). A portion of the net proceeds from
Telenet Facility AD
were ultimately used to redeem in full the amounts outstanding under the
Telenet Finance III Notes
and
Telenet Finance IV Notes
, as further described above under
Telenet Credit Facility - 2016 Refinancing Transactions
.
2015 Refinancing Transaction.
During 2015,
Telenet
completed a refinancing transaction that resulted in lower interest rates and extended maturities. In connection with this transaction,
Telenet
recognized a loss on debt modification and extinguishment, net, of
$
34.3
million
, representing the payment of redemption premium.
Ziggo Group Holding
Debt
2016 Financing Transactions.
During 2016, prior to the completion of the
Dutch JV Transaction
,
Ziggo Group Holding
and certain of its subsidiaries completed the below financing transactions.
In August 2016, (i) Ziggo Secured Finance B.V. (
Ziggo Secured Finance
), a special purpose financing entity owned
100
%
by a third-party, entered into a
€
2,598.2
million
(
$
2,740.4
million
) term loan facility (
Ziggo Facility C
) and (ii) Ziggo Secured Finance Partnership, a subsidiary of
Ziggo Secured Finance
, entered into a
$
1,000.0
million
term loan facility (
Ziggo Facility D
).
Ziggo Facility C
and
Ziggo Facility D
were each issued at
99.5
%
of par and mature on August 31, 2024.
Ziggo Facility C
bears interest at a rate of
EURIBOR
plus
3.75
%
and is subject to a
EURIBOR
floor of
0.0
%
.
Ziggo Facility D
bears interest at a rate of
LIBOR
plus
3.00
%
and is subject to a
LIBOR
floor of
0.0
%
. The net proceeds from
Ziggo Facility C
were used, in conjunction with existing cash, to prepay in full (a) the
€
664.2
million
(
$
700.6
million
) outstanding principal amount under an existing
Ziggo Group Holding
credit facility that was due on March 31, 2021 and (b) the
€
1,925.0
million
(
$
2,030.4
million
) outstanding principal amount under the
Ziggo Euro Facility
, and the net proceeds from
Ziggo Facility D
were used, in conjunction with existing cash, to prepay
$
1,000.0
million
of the
$
2,350.0
million
outstanding principal amount under the
Ziggo Dollar Facility
, which bears interest at a rate of
LIBOR
plus
2.75
%
and matures on January 15, 2022. Except as noted above, these transactions were completed as non-cash refinancings. In connection with these transactions,
Ziggo Group Holding
recognized losses on debt modification and extinguishment, net, of
$
15.9
million
. These losses include (1) the the write-off of net unamortized discounts of
$
8.7
million
and (2) the write-off of
$
7.2
million
of deferred financing costs.
In September 2016, (i)
Ziggo Secured Finance
issued (a)
$
2,000.0
million
principal amount of
5.50
%
senior secured notes (the
Ziggo 2027 Dollar Senior Secured Notes
) and (b)
€
775.0
million
(
$
817.4
million
) of
4.25
%
senior secured notes (together with the
Ziggo 2027 Dollar Senior Secured Notes
, the
Ziggo 2027 Senior Secured Notes
), each due January 15, 2027, and (ii)
II-168
LIBERTY GLOBAL PLC
Notes to Consolidated Financial Statements — (Continued)
December 31, 2016, 2015 and 2014
Ziggo Bond Finance B.V., a special purpose finance entity owned
100
%
by a third party, issued
$
625.0
million
principal amount of
6.00
%
senior notes due January 15, 2027 (the
Ziggo 2027 Senior Notes
).
Ziggo Secured Finance
used
$
300.0
million
of the net proceeds from the
Ziggo 2027 Dollar Senior Secured Notes
to fund a senior secured proceeds loan (the
Ziggo Dollar Senior Secured Proceeds Loans
) under a term loan facility agreement. The
Ziggo Dollar Senior Secured Proceeds Loans
were used to prepay
$
300.0
million
of the principal amount outstanding under the
Ziggo Dollar Facility
.
The remaining net proceeds from the
Ziggo 2027 Senior Secured Notes
and the
Ziggo 2027 Senior Notes
were placed into certain escrow accounts (the
Escrowed Proceeds
). Upon completion of the
Dutch JV Transaction
, on January 4, 2017, the
Escrowed Proceeds
were used to fund a distribution to
Liberty Global
and
Vodafone
. As a result of the
Dutch JV Transaction
, effective December 31, 2016, we no longer consolidate
Ziggo Group Holding
. For information regarding the
Dutch JV Transaction
and cash proceeds received on January 4, 2017, see note
5
.
CWC Notes
|
Outstanding principal
amount |
||||||||||||||||||||
|
CWC Notes
|
Maturity
|
Interest
rate |
Borrowing
currency |
U.S. $ equivalent
|
Estimated
fair value |
Carrying
value (a) |
||||||||||||||
|
|
|
|
in millions
|
|||||||||||||||||
|
Columbus Senior Notes (b)
|
March 30, 2021
|
|
$
|
|
|
$
|
|
|
$
|
|
|
$
|
|
|
||||||
|
Sable Senior Notes (c)
|
August 1, 2022
|
|
$
|
|
|
|
|
|
|
|
|
|||||||||
|
CWC Senior Notes (d)
|
March 25, 2019
|
|
£
|
|
|
|
|
|
|
|
|
|||||||||
|
Total
|
$
|
|
|
$
|
|
|
$
|
|
|
|||||||||||
|
(a)
|
Amounts include the impact of premiums recorded in connection with the acquisition accounting for the
CWC Acquisition
.
|
|
(b)
|
The
Columbus Senior Notes
were issued by Columbus International Inc. (
Columbus
), a wholly-owned subsidiary of
CWC
.
|
|
(c)
|
The
Sable Senior Notes
were issued by
Sable
.
|
|
(d)
|
|
Subject to the circumstances described below, the
Columbus Senior Notes
are non-callable until March 30, 2018 and the
Sable Senior Notes
are non-callable until August 1, 2018. At any time prior to March 30, 2018, in the case of the
Columbus Senior Notes
and August 1, 2018, in the case of the
Sable Senior Notes
,
Columbus
and
Sable
may redeem some or all of the applicable notes by paying a “make-whole” premium, which is generally based on the present value of all scheduled interest payments until March 30, 2018 or August 1, 2018 (as applicable) using the discount rate (as specified in the applicable indenture) as of the redemption date, plus
50
basis points
, and in the case of the
Sable Senior Notes
is subject to a minimum
1
%
of the principal amount outstanding at any redemption date prior to August 1, 2018.
II-169
LIBERTY GLOBAL PLC
Notes to Consolidated Financial Statements — (Continued)
December 31, 2016, 2015 and 2014
|
Redemption price
|
||||||
|
Columbus Senior Notes
|
Sable Senior Notes
|
|||||
|
12-month period commencing
|
March 30
|
August 1
|
||||
|
2018
|
|
|
||||
|
2019
|
|
|
||||
|
2020
|
|
|
||||
|
2021 and thereafter
|
N.A.
|
|
||||
CWC Credit Facilities
|
CWC Credit Facility
|
Maturity
|
Interest rate
|
Facility amount
(in borrowing
currency)
|
Outstanding principal amount
|
Unused
borrowing
capacity (a)
|
Carrying
value (b)
|
||||||||||||||
|
|
|
|
in millions
|
|||||||||||||||||
|
CWC Term Loans
|
December 31, 2022
|
LIBOR + 4.75% (c)
|
$
|
|
|
$
|
|
|
$
|
|
|
$
|
|
|
||||||
|
CWC Revolving Credit Facility
|
July 31, 2021
|
LIBOR + 3.50% (d)
|
$
|
|
|
|
|
|
|
|
|
|||||||||
|
CWC Regional Facilities (e)
|
various dates ranging from 2017 to 2038
|
3.65% (f)
|
$
|
|
|
|
|
|
|
|
|
|||||||||
|
Total
|
$
|
|
|
$
|
|
|
$
|
|
|
|||||||||||
|
(a)
|
At
December 31, 2016
, our aggregate availability under the
CWC Revolving Credit Facility
was limited to
$
|
|
(b)
|
Amounts are net of discounts and deferred financing costs, where applicable.
|
|
(c)
|
The
CWC Term Loans
are subject to a
LIBOR
floor of
|
|
(d)
|
The
CWC Revolving Credit Facility
has a fee on unused commitments of
|
|
(e)
|
Represents certain amounts borrowed by
CWC Panama
,
CWC BTC
,
CWC Jamaica
and
CWC Barbados
.
|
|
(f)
|
|
2016
Financing Transactions.
On May 17, 2016,
Sable
and Coral-US Co-Borrower LLC (
Coral-US
), a wholly-owned subsidiary of
CWC
, acceded as borrowers and assumed obligations under the credit agreement dated May 16, 2016, pursuant to which (i)
Coral-US
entered into the
CWC Term Loans
and (ii)
Sable
and
Coral-US
entered into the
CWC Revolving Credit Facility
.
A portion of the proceeds from the
CWC Term Loans
and amounts drawn under the
CWC Revolving Credit Facility
were used to (i) repay amounts outstanding under the then existing revolving credit facility and (ii) redeem certain senior secured notes
II-170
LIBERTY GLOBAL PLC
Notes to Consolidated Financial Statements — (Continued)
December 31, 2016, 2015 and 2014
issued by
Sable
. In connection with these transactions,
CWC
recognized a gain on debt modification and extinguishment, net, of
$
1.5
million
. This gain includes (a) the write-off of
$
19.0
million
of unamortized premium and (b) the payment of
$
17.5
million
of redemption premium.
In November 2016,
Sable
and
Coral-US
entered into a new
$
300.0
million
term loan facility, which has the same maturity date, interest rate and LIBOR floor as the existing
CWC Term Loans
. The net proceeds from the new term loan were used to prepay indebtedness under the
CWC Revolving Credit Facility
and for general corporate purposes.
VTR Finance Senior Secured Notes
In January 2014,
VTR Finance
issued
$
1.4
billion
principal amount of
VTR Finance Senior Secured Notes
, due January 15, 2024. At any time prior to January 15, 2019,
VTR Finance
may redeem some or all of the
VTR Finance Senior Secured Notes
by paying a “make-whole” premium, which is the present value of all remaining scheduled interest payments to January 15, 2019 using the discount rate (as specified in the
VTR Indenture
) as of the applicable redemption date plus
50
basis points
.
|
Redemption
price
|
|||
|
12-month period commencing January 15:
|
|||
|
2019
|
|
||
|
2020
|
|
||
|
2021
|
|
||
|
2022 and thereafter
|
|
||
Liberty Puerto Rico Bank Facility
|
Liberty Puerto Rico Facility
|
Maturity
|
Interest rate
|
Facility amount
(in borrowing
currency)
|
Outstanding principal amount
|
Unused
borrowing
capacity
|
Carrying
value (a)
|
||||||||||||||
|
|
|
|
in millions
|
|||||||||||||||||
|
LPR Term Loan B
|
January 7, 2022
|
LIBOR + 3.50% (b)
|
$
|
|
|
$
|
|
|
$
|
|
|
$
|
|
|
||||||
|
LPR Term Loan C
|
July 7, 2023
|
LIBOR + 6.75% (b)
|
$
|
|
|
|
|
|
|
|
|
|||||||||
|
LPR Revolving Loan (c)
|
July 7, 2020
|
LIBOR + 3.50%
|
$
|
|
|
|
|
|
|
|
|
|||||||||
|
Total
|
$
|
|
|
$
|
|
|
$
|
|
|
|||||||||||
_______________
|
(a)
|
Amounts are net of discounts and deferred financing costs.
|
|
(b)
|
LPR Term Loan B
and
LPR Term Loan C
each have a LIBOR floor of
|
|
(c)
|
|
2014
Refinancing Transactions.
During
2014
,
Liberty Puerto Rico
completed various refinancing transactions that generally resulted in additional borrowings or extended maturities under the
Liberty Puerto Rico Bank Facility
. In connection with these
II-171
LIBERTY GLOBAL PLC
Notes to Consolidated Financial Statements — (Continued)
December 31, 2016, 2015 and 2014
transactions,
Liberty Puerto Rico
recognized a loss on debt modification and extinguishment, net, of
$
9.8
million
. This loss includes (i) third-party costs of
$
7.1
million
, (ii) the write-off of deferred financing costs of
$
3.6
million
and (iii) the write-off of unamortized premium of
$
0.9
million
.
Maturities of Debt and Capital Lease Obligations
Debt:
|
Liberty Global Group
|
LiLAC Group
|
||||||||||||||||||||||||||||||||||||||||||
|
Virgin Media
|
Unitymedia
|
UPC
Holding (a)
|
Telenet (b)
|
Other
|
Total Liberty Global Group
|
CWC
|
VTR
|
Liberty Puerto Rico
|
Total LiLAC Group
|
Total
|
|||||||||||||||||||||||||||||||||
|
|
in millions
|
||||||||||||||||||||||||||||||||||||||||||
|
Year ending December 31:
|
|||||||||||||||||||||||||||||||||||||||||||
|
2017
|
$
|
|
|
$
|
|
|
$
|
|
|
$
|
|
|
$
|
|
|
$
|
|
|
$
|
|
|
$
|
|
|
$
|
|
|
$
|
|
|
$
|
|
|
||||||||||
|
2018
|
|
|
|
|
|
|
|
|
|
|
|
|
|
|
|
|
|
|
|
|
|
|
|||||||||||||||||||||
|
2019
|
|
|
|
|
|
|
|
|
|
|
|
|
|
|
|
|
|
|
|
|
|
|
|||||||||||||||||||||
|
2020
|
|
|
|
|
|
|
|
|
|
|
|
|
|
|
|
|
|
|
|
|
|
|
|||||||||||||||||||||
|
2021
|
|
|
|
|
|
|
|
|
|
|
|
|
|
|
|
|
|
|
|
|
|
|
|||||||||||||||||||||
|
Thereafter
|
|
|
|
|
|
|
|
|
|
|
|
|
|
|
|
|
|
|
|
|
|
|
|||||||||||||||||||||
|
Total debt maturities
|
|
|
|
|
|
|
|
|
|
|
|
|
|
|
|
|
|
|
|
|
|
|
|||||||||||||||||||||
|
Unamortized premium (discount)
|
|
|
|
|
(
|
)
|
|
|
(
|
)
|
(
|
)
|
|
|
|
|
(
|
)
|
|
|
|
|
|||||||||||||||||||||
|
Unamortized deferred financing costs
|
(
|
)
|
(
|
)
|
(
|
)
|
(
|
)
|
(
|
)
|
(
|
)
|
(
|
)
|
(
|
)
|
(
|
)
|
(
|
)
|
(
|
)
|
|||||||||||||||||||||
|
Total debt
|
$
|
|
|
$
|
|
|
$
|
|
|
$
|
|
|
$
|
|
|
$
|
|
|
$
|
|
|
$
|
|
|
$
|
|
|
$
|
|
|
$
|
|
|
||||||||||
|
Current portion
|
$
|
|
|
$
|
|
|
$
|
|
|
$
|
|
|
$
|
|
|
$
|
|
|
$
|
|
|
$
|
|
|
$
|
|
|
$
|
|
|
$
|
|
|
||||||||||
|
Noncurrent portion
|
$
|
|
|
$
|
|
|
$
|
|
|
$
|
|
|
$
|
|
|
$
|
|
|
$
|
|
|
$
|
|
|
$
|
|
|
$
|
|
|
$
|
|
|
||||||||||
|
(a)
|
Amounts include the
UPCB SPE Notes
issued by the
UPCB SPE
s. As described above, the
UPCB SPE
s are consolidated by
UPC Holding
and
Liberty Global
.
|
|
(b)
|
Amounts include the
Telenet SPE Notes
issued by the
Telenet SPE
s. As described above, the
Telenet SPE
s are consolidated by
Telenet
and
Liberty Global
.
|
II-172
LIBERTY GLOBAL PLC
Notes to Consolidated Financial Statements — (Continued)
December 31, 2016, 2015 and 2014
|
Liberty Global Group
|
|||||||||||||||||||||||||||
|
Unitymedia
|
Telenet
|
Virgin Media
|
Other
|
Total Liberty Global Group
|
Total LiLAC Group
|
Total
|
|||||||||||||||||||||
|
|
in millions
|
||||||||||||||||||||||||||
|
Year ending December 31:
|
|||||||||||||||||||||||||||
|
2017
|
$
|
|
|
$
|
|
|
$
|
|
|
$
|
|
|
$
|
|
|
$
|
|
|
$
|
|
|
||||||
|
2018
|
|
|
|
|
|
|
|
|
|
|
|
|
|
|
|||||||||||||
|
2019
|
|
|
|
|
|
|
|
|
|
|
|
|
|
|
|||||||||||||
|
2020
|
|
|
|
|
|
|
|
|
|
|
|
|
|
|
|||||||||||||
|
2021
|
|
|
|
|
|
|
|
|
|
|
|
|
|
|
|||||||||||||
|
Thereafter
|
|
|
|
|
|
|
|
|
|
|
|
|
|
|
|||||||||||||
|
Total principal and interest payments
|
|
|
|
|
|
|
|
|
|
|
|
|
|
|
|||||||||||||
|
Amounts representing interest
|
(
|
)
|
(
|
)
|
(
|
)
|
(
|
)
|
(
|
)
|
(
|
)
|
(
|
)
|
|||||||||||||
|
Present value of net minimum lease payments
|
$
|
|
|
$
|
|
|
$
|
|
|
$
|
|
|
$
|
|
|
$
|
|
|
$
|
|
|
||||||
|
Current portion
|
$
|
|
|
$
|
|
|
$
|
|
|
$
|
|
|
$
|
|
|
$
|
|
|
$
|
|
|
||||||
|
Noncurrent portion
|
$
|
|
|
$
|
|
|
$
|
|
|
$
|
|
|
$
|
|
|
$
|
|
|
$
|
|
|
||||||
Non-cash Financing Transactions
II-173
LIBERTY GLOBAL PLC
Notes to Consolidated Financial Statements — (Continued)
December 31, 2016, 2015 and 2014
(
11
)
Income Taxes
Liberty Global
files its primary income tax return in the
U.K.
Its subsidiaries file income tax returns in the
U.K.
, the
U.S.
, the Netherlands and a number of other jurisdictions. The income taxes of
Liberty Global
and its subsidiaries are presented on a separate return basis for each tax-paying entity or group.
|
|
Year ended December 31,
|
||||||||||||
|
|
2016
|
2015
|
2014
|
||||||||||
|
|
in millions
|
||||||||||||
|
U.K.
|
$
|
|
|
$
|
|
|
$
|
|
|
||||
|
U.S.
|
(
|
)
|
(
|
)
|
(
|
)
|
|||||||
|
Switzerland
|
|
|
|
|
|
|
|||||||
|
The Netherlands
|
|
|
—
|
|
(
|
)
|
—
|
|
(
|
)
|
|||
|
Germany
|
(
|
)
|
(
|
)
|
(
|
)
|
|||||||
|
Chile
|
|
|
|
|
|
|
|||||||
|
Panama
|
|
|
|
|
|
|
|||||||
|
Belgium
|
|
|
—
|
|
|
|
—
|
|
|
|
|||
|
Other
|
|
|
|
|
|
|
|||||||
|
Total
|
$
|
|
|
$
|
(
|
)
|
$
|
(
|
)
|
||||
II-174
LIBERTY GLOBAL PLC
Notes to Consolidated Financial Statements — (Continued)
December 31, 2016, 2015 and 2014
|
Current
|
Deferred
|
Total
|
|||||||||
|
|
in millions
|
||||||||||
|
Year ended December 31, 2016:
|
|||||||||||
|
The Netherlands
|
$
|
(
|
)
|
$
|
|
|
$
|
|
|
||
|
U.S. (a)
|
|
|
|
|
|
|
|||||
|
Chile
|
(
|
)
|
(
|
)
|
(
|
)
|
|||||
|
Belgium
|
(
|
)
|
|
|
(
|
)
|
|||||
|
Switzerland
|
(
|
)
|
|
|
(
|
)
|
|||||
|
Germany
|
(
|
)
|
|
|
(
|
)
|
|||||
|
Panama
|
(
|
)
|
|
|
(
|
)
|
|||||
|
U.K.
|
(
|
)
|
|
|
|
|
|||||
|
Other
|
(
|
)
|
(
|
)
|
(
|
)
|
|||||
|
Total
|
$
|
(
|
)
|
$
|
|
|
$
|
|
|
||
|
Year ended December 31, 2015:
|
|||||||||||
|
U.K
|
$
|
(
|
)
|
$
|
(
|
)
|
$
|
(
|
)
|
||
|
The Netherlands
|
|
|
|
|
|
|
|||||
|
Belgium
|
(
|
)
|
|
|
(
|
)
|
|||||
|
Switzerland
|
(
|
)
|
(
|
)
|
(
|
)
|
|||||
|
Chile
|
(
|
)
|
|
|
(
|
)
|
|||||
|
Germany
|
(
|
)
|
|
|
(
|
)
|
|||||
|
U.S. (a)
|
(
|
)
|
|
|
(
|
)
|
|||||
|
Other
|
(
|
)
|
|
|
(
|
)
|
|||||
|
Total
|
$
|
(
|
)
|
$
|
|
|
$
|
(
|
)
|
||
|
Year ended December 31, 2014:
|
|||||||||||
|
Continuing operations:
|
|||||||||||
|
U.K.
|
$
|
(
|
)
|
$
|
|
|
$
|
|
|
||
|
U.S. (a)
|
(
|
)
|
|
|
|
|
|||||
|
Belgium
|
(
|
)
|
|
|
(
|
)
|
|||||
|
Switzerland
|
(
|
)
|
|
|
(
|
)
|
|||||
|
The Netherlands
|
|
|
|
|
|
|
|||||
|
Germany
|
(
|
)
|
|
|
|
|
|||||
|
Chile
|
|
|
(
|
)
|
(
|
)
|
|||||
|
Other
|
(
|
)
|
|
|
(
|
)
|
|||||
|
Total — continuing operations
|
$
|
(
|
)
|
$
|
|
|
$
|
|
|
||
|
Discontinued operation
|
$
|
|
|
$
|
(
|
)
|
$
|
(
|
)
|
||
_______________
|
(a)
|
|
II-175
LIBERTY GLOBAL PLC
Notes to Consolidated Financial Statements — (Continued)
December 31, 2016, 2015 and 2014
|
|
Year ended December 31,
|
||||||||||
|
|
2016
|
2015
|
2014
|
||||||||
|
|
in millions
|
||||||||||
|
Computed “expected” tax benefit (expense) (a)
|
$
|
(
|
)
|
$
|
|
|
$
|
|
|
||
|
Change in valuation allowances (b):
|
|||||||||||
|
Benefit
|
|
|
|
|
|
|
|||||
|
Expense
|
(
|
)
|
(
|
)
|
(
|
)
|
|||||
|
Recognition of previously unrecognized tax benefits
|
|
|
|
|
|
|
|||||
|
Non-deductible or non-taxable foreign currency exchange results (b):
|
|||||||||||
|
Benefit
|
|
|
|
|
|
|
|||||
|
Expense
|
(
|
)
|
(
|
)
|
(
|
)
|
|||||
|
Tax effect of intercompany financing
|
|
|
|
|
|
|
|||||
|
Non-deductible or non-taxable interest and other expenses (b):
|
|||||||||||
|
Expense
|
(
|
)
|
(
|
)
|
(
|
)
|
|||||
|
Benefit
|
|
|
|
|
|
|
|||||
|
Enacted tax law and rate changes (c)
|
(
|
)
|
(
|
)
|
|
|
|||||
|
International rate differences (b) (d):
|
|||||||||||
|
Benefit
|
|
|
|
|
|
|
|||||
|
Expense
|
(
|
)
|
(
|
)
|
(
|
)
|
|||||
|
Basis and other differences in the treatment of items associated with investments in subsidiaries and affiliates (b):
|
|||||||||||
|
Benefit
|
|
|
|
|
|
|
|||||
|
Expense
|
(
|
)
|
(
|
)
|
(
|
)
|
|||||
|
Other, net
|
|
|
|
|
|
|
|||||
|
Total income tax benefit (expense)
|
$
|
|
|
$
|
(
|
)
|
$
|
|
|
||
_______________
|
(a)
|
The statutory or “expected” tax rates are the
U.K.
rates of
|
|
(b)
|
Country jurisdictions giving rise to income tax benefits are grouped together and shown separately from country jurisdictions giving rise to income tax expenses.
|
|
(c)
|
During 2015, the
U.K.
enacted legislation that will change the corporate income tax rate from the current rate of
|
|
(d)
|
|
II-176
LIBERTY GLOBAL PLC
Notes to Consolidated Financial Statements — (Continued)
December 31, 2016, 2015 and 2014
|
|
December 31,
|
||||||
|
|
2016
|
2015
|
|||||
|
|
in millions
|
||||||
|
Deferred tax assets (a)
|
$
|
|
|
$
|
|
|
|
|
Deferred tax liabilities (a)
|
(
|
)
|
(
|
)
|
|||
|
Net deferred tax asset
|
$
|
|
|
$
|
|
|
|
_______________
|
(a)
|
Our deferred tax assets and liabilities are included in other assets, net and other long-term liabilities, respectively, in our consolidated balance sheets.
|
The tax effects of temporary differences that give rise to significant portions of the deferred tax assets and deferred tax liabilities are presented below:
|
|
December 31,
|
||||||
|
|
2016
|
2015
|
|||||
|
|
in millions
|
||||||
|
Deferred tax assets:
|
|||||||
|
Net operating loss and other carryforwards
|
$
|
|
|
$
|
|
|
|
|
Property and equipment, net
|
|
|
|
|
|||
|
Debt
|
|
|
|
|
|||
|
Intangible assets
|
|
|
|
|
|||
|
Derivative instruments
|
|
|
|
|
|||
|
Other future deductible amounts
|
|
|
|
|
|||
|
Deferred tax assets
|
|
|
|
|
|||
|
Valuation allowance
|
(
|
)
|
(
|
)
|
|||
|
Deferred tax assets, net of valuation allowance
|
|
|
|
|
|||
|
Deferred tax liabilities:
|
|||||||
|
Property and equipment, net
|
(
|
)
|
(
|
)
|
|||
|
Intangible assets
|
(
|
)
|
(
|
)
|
|||
|
Investments (including consolidated partnerships)
|
(
|
)
|
(
|
)
|
|||
|
Derivative instruments
|
(
|
)
|
(
|
)
|
|||
|
Other future taxable amounts
|
(
|
)
|
(
|
)
|
|||
|
Deferred tax liabilities
|
(
|
)
|
(
|
)
|
|||
|
Net deferred tax asset
|
$
|
|
|
$
|
|
|
|
Our deferred income tax valuation allowance decreased
$
380.2
million
in
2016
. This decrease reflects the net effect of (i) business acquisitions, (ii) the net tax benefit related to our continuing operations of
$
888.7
million
, including a tax benefit of
$
1.1
billion
recognized in the Netherlands upon the release of valuation allowances in the fourth quarter of 2016, (iii) foreign currency translation adjustments, (iv) the effect of enacted tax law and rate changes and (v) other individually insignificant items. The release of valuation allowances in the Netherlands is attributable to a significant improvement in our forecast of taxable income in the Netherlands, due to, among other factors, the impact of contributing
Ziggo Group Holding
to the Dutch JV on December 31, 2016, as further described in note 5.
Virgin Media
had property and equipment on which future
U.K.
tax deductions can be claimed of
$
17.9
billion
and
$
21.0
billion
at
December 31, 2016
and
2015
, respectively. The maximum amount of these “capital allowances” that can be claimed in any one year is
18
%
of the remaining balance, after additions, disposals and prior claims. The tax effects of the excess of these
II-177
LIBERTY GLOBAL PLC
Notes to Consolidated Financial Statements — (Continued)
December 31, 2016, 2015 and 2014
capital allowances over the related financial reporting bases are included in the
2016
and
2015
deferred tax assets related to property and equipment, net, in the above table.
At
December 31, 2016
, our unrecognized excess tax benefits aggregated
$
139.0
million
. These excess tax benefits, which represent tax deductions in excess of the financial reporting expense for share-based compensation, have not been recognized for financial reporting purposes as these tax benefits have not been realized as a reduction of income taxes payable. The tax effects of these unrecognized excess tax benefits are not included in the above table. For additional information regarding the adoption of ASU 2016-09, which will impact the accounting for unrecognized excess tax benefits beginning January 1, 2017, see note 2.
|
Country
|
Tax loss
carryforward
|
Related
tax asset
|
Expiration
date
|
|||||||
|
|
in millions
|
|
||||||||
|
U.K.:
|
||||||||||
|
Amount attributable to capital losses
|
$
|
|
|
$
|
|
|
Indefinite
|
|||
|
Amount attributable to net operating losses
|
|
|
|
|
Indefinite
|
|||||
|
The Netherlands
|
|
|
|
|
2017-2025
|
|||||
|
Germany
|
|
|
|
|
Indefinite
|
|||||
|
U.S.
|
|
|
|
|
2019-2036
|
|||||
|
Luxembourg
|
|
|
|
|
Indefinite
|
|||||
|
Belgium
|
|
|
|
|
Indefinite
|
|||||
|
Barbados
|
|
|
|
|
2017 - 2023
|
|||||
|
Ireland
|
|
|
|
|
Indefinite
|
|||||
|
France
|
|
|
|
|
Indefinite
|
|||||
|
Jamaica
|
|
|
|
|
Indefinite
|
|||||
|
Hungary
|
|
|
|
|
2020-2025
|
|||||
|
Other
|
|
|
|
|
Various
|
|||||
|
Total
|
$
|
|
|
$
|
|
|
||||
Our tax loss carryforwards within each jurisdiction combine all companies’ tax losses (both capital and ordinary losses) in that jurisdiction, however, certain tax jurisdictions limit the ability to offset taxable income of a separate company or different tax group with the tax losses associated with another separate company or group. Further, tax jurisdictions restrict the type of taxable income that the above losses are able to offset. The majority of the tax losses shown in the above table are not expected to be realized, including certain losses that are limited in use due to change in control or same business tests.
We have taxable outside basis differences on certain investments in non-
U.S.
subsidiaries. We intend to indefinitely reinvest earnings from these non-
U.S.
operations. At
December 31, 2016
, income and withholding taxes for which a net deferred tax liability might otherwise be required have not been provided on an estimated
$
6.9
billion
of cumulative temporary differences (including, for this purpose, any difference between the aggregate tax basis in stock of a consolidated subsidiary and the corresponding amount of the subsidiary’s net equity, including cumulative translation adjustments, determined for financial reporting purposes) on non-
U.S.
entities. The determination of the additional withholding tax that would arise upon a reversal of these temporary differences is impractical to estimate as it is subject to offset by available foreign tax credits and subject to certain limitations.
In general, a
U.K.
or
U.S.
corporation may claim a foreign tax credit against its income tax expense for foreign income taxes paid or accrued. A
U.S.
corporation may also claim a credit for foreign income taxes paid or accrued on the earnings of a foreign corporation paid to the
U.S.
corporation as a dividend.
Our ability to claim a foreign tax credit for dividends received from our foreign subsidiaries or foreign taxes paid or accrued is subject to various significant limitations under
U.S.
tax laws, including a limited carry back and carry forward period. Some of our operating companies are located in countries with which the
U.K.
or
U.S.
does not have income tax treaties. Because we lack treaty protection in these countries, we may be subject to high rates of withholding taxes on distributions and other payments from
II-178
LIBERTY GLOBAL PLC
Notes to Consolidated Financial Statements — (Continued)
December 31, 2016, 2015 and 2014
these operating companies and may be subject to double taxation on our income. Limitations on the ability to claim a foreign tax credit, lack of treaty protection in some countries and the inability to offset losses in one jurisdiction against income earned in another jurisdiction could result in a high effective tax rate on our earnings. Since a significant portion of our revenue is generated outside of the
U.K.
and substantially all of our revenue is generated outside the
U.S.
, including in jurisdictions that do not have tax treaties with the
U.K.
or
U.S.
, these risks are greater for us than for companies that generate most of their revenue in the
U.K.
or
U.S.
or in jurisdictions that have these treaties.
Through our subsidiaries, we maintain a presence in many countries. Many of these countries maintain highly complex tax regimes that differ significantly from the system of income taxation used in the
U.K.
and the
U.S.
We have accounted for the effect of these taxes based on what we believe is reasonably expected to apply to us and our subsidiaries based on tax laws currently in effect and reasonable interpretations of these laws. Because some jurisdictions do not have systems of taxation that are as well established as the system of income taxation used in the
U.K.
,
U.S.
or tax regimes used in other major industrialized countries, it may be difficult to anticipate how other jurisdictions will tax our and our subsidiaries’ current and future operations.
We and our subsidiaries file consolidated and standalone income tax returns in various jurisdictions. In the normal course of business, our income tax filings are subject to review by various taxing authorities. In connection with such reviews, disputes could arise with the taxing authorities over the interpretation or application of certain income tax rules related to our business in that tax jurisdiction. Such disputes may result in future tax and interest and penalty assessments by these taxing authorities. The ultimate resolution of tax contingencies will take place upon the earlier of (i) the settlement date with the applicable taxing authorities in either cash or agreement of income tax positions or (ii) the date when the tax authorities are statutorily prohibited from adjusting the company’s tax computations.
In general, tax returns filed by our company or our subsidiaries for years prior to 2008 are no longer subject to examination by tax authorities. Certain of our subsidiaries are currently involved in income tax examinations in various jurisdictions in which we operate, including Austria (2012 through 2014), Chile (2011 through 2015), the Czech Republic (2013), Germany (2008 through 2014), the Netherlands (2015 through 2016), Panama (2013 through 2015), Poland (2010 and 2013), Trinidad and Tobago (2006 through 2009), the U.S. (2009 through 2011 and 2016) and certain other jurisdictions within the Caribbean and Latin America. Except as noted below, any adjustments that might arise from the foregoing examinations are not expected to have a material impact on our consolidated financial position or results of operations. In the
U.S.
, we have received notices of adjustment from the Internal Revenue Service with respect to our 2010 and 2009 income tax returns, and have entered into the appeals process with respect to the 2010 and 2009 matters. In Chile, adjustments received from the tax authorities for the tax years 2011 and 2012 are in dispute. We have appealed these adjustments to the Chilean tax court. Also in Chile, we recorded an income tax receivable in connection with the expected utilization of certain net operating loss carryforwards upon the completion of a merger transaction of two indirect subsidiaries of Liberty Global. We are engaged in an ongoing examination by tax authorities in Chile in connection with this receivable and were notified during the third quarter of 2016 that approximately
48
%
of our claim has been agreed by the tax authorities. We intend to pursue the payment of the remaining portion of this receivable through available method. While we believe that the ultimate resolution of these proposed adjustments will not have a material impact on our consolidated financial position, results of operations or cash flows, no assurance can be given that this will be the case given the amounts involved and the complex nature of the related issues.
II-179
LIBERTY GLOBAL PLC
Notes to Consolidated Financial Statements — (Continued)
December 31, 2016, 2015 and 2014
|
2016
|
2015
|
2014
|
|||||||||
|
|
in millions
|
||||||||||
|
Balance at January 1
|
$
|
|
|
$
|
|
|
$
|
|
|
||
|
Reductions for tax positions of prior years
|
(
|
)
|
(
|
)
|
(
|
)
|
|||||
|
Additions for tax positions of prior years
|
|
|
|
|
|
|
|||||
|
Lapse of statute of limitations
|
(
|
)
|
(
|
)
|
(
|
)
|
|||||
|
Effects of business acquisitions
|
|
|
|
|
|
|
|||||
|
Additions based on tax positions related to the current year
|
|
|
|
|
|
|
|||||
|
Foreign currency translation
|
(
|
)
|
(
|
)
|
(
|
)
|
|||||
|
Settlements with tax authorities
|
(
|
)
|
(
|
)
|
(
|
)
|
|||||
|
Balance at December 31
|
$
|
|
|
$
|
|
|
$
|
|
|
||
No assurance can be given that any of these tax benefits will be recognized or realized.
As of
December 31, 2016
, our unrecognized tax benefits included
$
438.3
million
of tax benefits that would have a favorable impact on our effective income tax rate if ultimately recognized, after considering amounts that we would expect to be offset by valuation allowances and other factors.
During
2017
, it is reasonably possible that the resolution of ongoing examinations by tax authorities as well as expiration of statutes of limitation could result in reductions to our unrecognized tax benefits related to tax positions taken as of
December 31, 2016
. Other than the potential impacts of these ongoing examinations and the expected expiration of certain statutes of limitation, we do not expect any material changes to our unrecognized tax benefits during
2017
. No assurance can be given as to the nature or impact of any changes in our unrecognized tax positions during
2017
.
(
12
)
Equity
Capitalization
Our authorized share capital consists of an aggregate nominal amount of
$
20.0
million
, consisting of any of the following: (i)
Liberty Global
Shares (Class A, B or C), each with a nominal value of
$
0.01
per share, (ii)
LiLAC
Shares (Class A, B or C), each with a nominal value of
$
0.01
per share, (iii) preference shares, with a nominal value to be determined by the board of directors, the issuance of
one
or more classes or series of which as may be authorized by the board of directors, and (iv) any other shares of
one
or more classes as may be determined by the board of directors or by the shareholders of
Liberty Global
.
Under
Liberty Global
’s Articles of Association, effective July 1, 2015, holders of
Liberty Global
Class A ordinary shares and
LiLAC
Class A ordinary shares are entitled to
one
vote for each such share held, and holders of
Liberty Global
Class B ordinary shares and
LiLAC
Class B ordinary shares are entitled to
10
votes for each such share held, on all matters submitted to a vote of
Liberty Global
shareholders at any general meeting (annual or special). Holders of
Liberty Global
Class C ordinary shares and
LiLAC
Class C ordinary shares are not entitled to any voting powers except as required by law.
At the option of the holder, each
Liberty Global
Class B ordinary share is convertible into
one
Liberty Global
Class A ordinary share and each
LiLAC
Class B ordinary share is convertible into
one
LiLAC
Class A ordinary share.
One
Liberty Global
Class A ordinary share is reserved for issuance for each
Liberty Global
Class B ordinary share that is issued (
10,805,850
shares issued as of
December 31, 2016
), and
one
LiLAC
Class A ordinary share is reserved for issuance for each
LiLAC
Class B ordinary share
II-180
LIBERTY GLOBAL PLC
Notes to Consolidated Financial Statements — (Continued)
December 31, 2016, 2015 and 2014
(
1,888,323
shares issued as of
December 31, 2016
).
Additionally, at
December 31, 2016
, we have reserved
Liberty Global Shares
and
LiLAC Shares
for the issuance of outstanding share-based compensation awards, as set forth in the table below:
|
|
Liberty Global Shares
|
LiLAC Shares
|
||||||||||||||||
|
Class A
|
Class B
|
Class C
|
Class A
|
Class B
|
Class C
|
|||||||||||||
|
|
|
|
|
|
||||||||||||||
|
Options
|
|
|
|
|
|
|
|
|
|
|
|
|
||||||
|
SARs and PSARs
|
|
|
|
|
|
|
|
|
|
|
|
|
||||||
|
PSUs, PGUs, RSUs
|
|
|
|
|
|
|
|
|
|
|
|
|
||||||
Subject to any preferential rights of any outstanding class of our preference shares, the holders of
Liberty Global Shares
and
LiLAC Shares
are entitled to dividends as may be declared from time to time by our board of directors from funds available therefore. Such dividends may be declared in favor of
Liberty Global Shares
and
LiLAC Shares
, in equal or unequal amounts, or only in favor of the
Liberty Global Shares
or the
LiLAC Shares
. There are currently no contractual restrictions on our ability to pay dividends in cash or shares.
In the event of our liquidation, dissolution and winding up, after payment or provision for payment of our debts and liabilities and subject to the prior payment in full of any preferential amounts to which our preference shareholders, if any, may be entitled, the holders of
Liberty Global Shares
and
LiLAC Shares
will be entitled to receive their proportionate interests, expressed in liquidation units, in any assets available for distribution to our ordinary shares regardless of whether such assets are then attributed to the
Liberty Global Group
or the
LiLAC Group
. Pursuant to the terms of our Articles of Association, the liquidation units for each Liberty Global Share and each LiLAC Share are
1
and
0.94893
, respectively.
On January 26, 2014, our board of directors approved a share split in the form of a share dividend (the
2014 Share Dividend
), which constituted a bonus issue under our articles of association and English law, of
one
Liberty Global
Class C ordinary share on each outstanding
Liberty Global
Class A, Class B and Class C ordinary share as of the February 14, 2014 record date. The distribution date for the
2014 Share Dividend
was March 3, 2014. All
Liberty Global
share and per share amounts presented herein give retrospective effect to the
2014 Share Dividend
.
II-181
LIBERTY GLOBAL PLC
Notes to Consolidated Financial Statements — (Continued)
December 31, 2016, 2015 and 2014
|
|
Liberty Global Shares
|
LiLAC Shares
|
Old Liberty Global Shares
|
||||||||||||||||||||||||||||||||||||||||||||
|
|
Class A
|
Class B
|
Class C
|
Total
|
Class A
|
Class B
|
Class C
|
Total
|
Class A
|
Class B
|
Class C
|
Total
|
|||||||||||||||||||||||||||||||||||
|
in millions
|
|||||||||||||||||||||||||||||||||||||||||||||||
|
Balance at January 1, 2015
|
$
|
|
|
$
|
|
|
$
|
|
|
$
|
|
|
$
|
|
|
$
|
|
|
$
|
|
|
$
|
|
|
$
|
|
|
$
|
|
|
$
|
|
|
$
|
|
|
|||||||||||
|
Repurchase and cancellation of Old Liberty Global Shares
|
|
|
|
|
|
|
|
|
|
|
|
|
|
|
|
|
|
|
|
|
(
|
)
|
(
|
)
|
|||||||||||||||||||||||
|
Liberty Global call option contracts
|
|
|
|
|
|
|
|
|
|
|
|
|
|
|
|
|
|
|
|
|
(
|
)
|
(
|
)
|
|||||||||||||||||||||||
|
Balance at June 30, 2015
|
|
|
|
|
|
|
|
|
|
|
|
|
|
|
|
|
|
|
|
|
|
|
|
|
|
|
|
|
|
|
|
|
|||||||||||||||
|
Impact of the LiLAC Transaction (note 1)
|
|
|
|
|
|
|
|
|
|
|
|
|
|
|
|
|
(
|
)
|
(
|
)
|
(
|
)
|
(
|
)
|
|||||||||||||||||||||||
|
Repurchase and cancellation of Liberty Global Shares
|
|
|
|
|
(
|
)
|
(
|
)
|
|
|
|
|
|
|
|
|
|
|
|
|
|
|
|
|
|||||||||||||||||||||||
|
Liberty Global call option contracts
|
|
|
|
|
(
|
)
|
(
|
)
|
|
|
|
|
|
|
|
|
|
|
|
|
|
|
|
|
|||||||||||||||||||||||
|
Balance at December 31, 2015
|
$
|
|
|
|
$
|
|
|
|
$
|
|
|
$
|
|
|
|
$
|
|
|
|
$
|
|
|
|
$
|
|
|
$
|
|
|
|
$
|
|
|
|
$
|
|
|
|
$
|
|
|
$
|
|
|
|||
|
Impact of the CWC Acquisition (note 4)
|
|
|
|
|
|
|
|
|
|
|
|
|
|
|
|
|
|
|
|
|
|
|
|
|
|||||||||||||||||||||||
|
Repurchase and cancellation of Liberty Global Shares
|
(
|
)
|
|
|
(
|
)
|
(
|
)
|
|
|
|
|
|
|
|
|
|
|
|
|
|
|
|
|
|||||||||||||||||||||||
|
Impact of the LiLAC Distribution (note 4)
|
|
|
|
|
|
|
|
|
|
|
|
|
|
|
|
|
|
|
|
|
|
|
|
|
|||||||||||||||||||||||
|
Balance at December 31, 2016
|
$
|
|
|
$
|
|
|
$
|
|
|
$
|
|
|
$
|
|
|
$
|
|
|
$
|
|
|
$
|
|
|
$
|
|
|
$
|
|
|
$
|
|
|
$
|
|
|
|||||||||||
Share Repurchase Programs
As a
U.K.
incorporated company, we may only elect to repurchase shares or pay dividends to the extent of our “Distributable Reserves.” Distributable Reserves, which are not linked to a
U.S. GAAP
reported amount, may be created through the earnings of the
U.K.
parent company and, among other methods, through a reduction in share premium approved by the English Companies Court. Based on the amounts set forth in our 2015
U.K.
Companies Act Report dated April 25, 2016, which are our most recent “Relevant Accounts” for the purposes of determining our Distributable Reserves under
U.K.
law, our Distributable Reserves were
$
27.9
billion
as of December 31, 2015. This amount does not reflect earnings, share repurchases or other activity that occurred in
2016
, each of which impacts the amount of our Distributable Reserves.
Our board of directors has approved share repurchase programs for our
Liberty Global Shares
and, effective November 2016, our
LiLAC Shares
. Under these plans, we receive authorization to acquire up to the specified amount (before direct acquisition costs) of Class A and Class C
Liberty Global Shares
or
LiLAC Shares
, or other authorized securities, from time to time through open market or privately negotiated transactions, which may include derivative transactions. The most recent authorizations provide for the repurchase of up to
$
4.0
billion
and
$
300.0
million
of
Liberty Global
and LiLAC Class A and/or Class C shares, respectively. The timing of the repurchase of shares or other securities pursuant to our equity repurchase programs, which may be suspended or discontinued at any time, is dependent on a variety of factors, including market conditions. As of December 31, 2016, the remaining amount authorized for repurchases of
Liberty Global Shares
and
LiLAC Shares
was
$
1,943.4
million
and
$
278.6
million
, respectively. Subsequent to
December 31, 2016
, our board of directors increased the amount authorized under the share repurchase program for our
Liberty Global Shares
by
$
1.0
billion
.
II-182
LIBERTY GLOBAL PLC
Notes to Consolidated Financial Statements — (Continued)
December 31, 2016, 2015 and 2014
|
|
Class A ordinary shares
|
Class C ordinary shares
|
|
|||||||||||||||
|
Shares
repurchased
|
Average price
paid per share (a)
|
Shares
repurchased
|
Average price
paid per share (a)
|
Total cost (a)
|
||||||||||||||
|
|
|
|
|
|
in millions
|
|||||||||||||
|
Liberty Global Shares / Old Liberty Global Shares repurchased during:
|
||||||||||||||||||
|
2016
|
|
|
$
|
|
|
|
|
$
|
|
|
$
|
|
|
|||||
|
2015 (b)
|
|
|
$
|
|
|
|
|
$
|
|
|
$
|
|
|
|||||
|
2014 (c)
|
|
|
$
|
|
|
|
|
$
|
|
|
$
|
|
|
|||||
|
LiLAC Shares repurchased during 2016
|
|
|
$
|
|
|
|
|
$
|
|
|
$
|
|
|
|||||
_______________
|
(a)
|
Includes direct acquisition costs and the effects of derivative instruments, where applicable.
|
|
(b)
|
Amounts relate to repurchases of (i)
Old Liberty Global Shares
from January 1 through June 30, 2015 and (ii)
Liberty Global Shares
from July 1 through December 31, 2015.
|
|
(c)
|
Amounts relate to repurchases of
Old Liberty Global Shares
.
|
Call Option Contracts
From time to time, we enter into call option contracts pursuant to which we contemporaneously (i) sell call options on shares of
Liberty Global
ordinary shares and (ii) purchase call options on an equivalent number of
Liberty Global
ordinary shares with an exercise price of
zero
. These contracts can result in the receipt of cash or
Liberty Global
ordinary shares. Shares acquired through the exercise of the call options are included in our share repurchases and the net gain on cash settled contracts is recorded as an increase to additional paid-in capital in our consolidated statements of equity.
LiLAC Distribution
For information regarding the
LiLAC Distribution
, see note
4
.
Acquisition of Interests in
VTR
and
VTR Wireless
On March 14, 2014, a subsidiary of
VTR Finance
acquired each of the noncontrolling ownership interests in
VTR
and VTR Wireless SpA (
VTR Wireless
) from Inversiones Corp Comm 2 SpA (the
VTR NCI Acquisition
), formerly known as Corp Comm S.A. (the
VTR NCI Owner
).
VTR Wireless
was an indirect subsidiary of
Liberty Global
that was merged with a subsidiary of
VTR
in December 2014. The consideration for the
VTR NCI Acquisition
was satisfied by the allotment and issuance of
10,091,178
Old
Liberty Global
Class C ordinary shares to the
VTR NCI Owner
. The
VTR NCI Acquisition
has been accounted for as an equity transaction, the net effect of which was to record the issued Old
Liberty Global
Class C shares at the
$
185.4
million
carrying value of the acquired noncontrolling interests.
Subsidiary Distributions
From time to time,
Telenet
,
VTR
,
CWC
and certain other of our subsidiaries make cash distributions to their respective shareholders. Our share of these distributions is eliminated in consolidation and the noncontrolling interest owners’ share of these distributions is reflected as a charge against noncontrolling interests in our consolidated statements of equity.
II-183
LIBERTY GLOBAL PLC
Notes to Consolidated Financial Statements — (Continued)
December 31, 2016, 2015 and 2014
Restricted Net Assets
(
13
)
Share-based Compensation
Our share-based compensation expense primarily relates to the share-based incentive awards issued by
Liberty Global
to its employees and employees of its subsidiaries.
A summary of the aggregate share-based compensation expense that is included in our
other operating
and SG&A expenses is set forth below:
|
|
Year ended December 31,
|
||||||||||
|
|
2016
|
2015
|
2014
|
||||||||
|
|
in millions
|
||||||||||
|
Liberty Global:
|
|||||||||||
|
Performance-based incentive awards (a)
|
$
|
|
|
$
|
|
|
$
|
|
|
||
|
Other share-based incentive awards
|
|
|
|
|
|
|
|||||
|
Total Liberty Global (b)
|
|
|
|
|
|
|
|
||||
|
Telenet share-based incentive awards (c)
|
|
|
|
|
|
|
|||||
|
Other
|
|
|
|
|
|
|
|||||
|
Total
|
$
|
|
|
|
$
|
|
|
$
|
|
|
|
|
Included in:
|
|||||||||||
|
Other operating expense:
|
|||||||||||
|
Liberty Global Group
|
$
|
|
|
$
|
|
|
$
|
|
|
||
|
LiLAC Group
|
|
|
|
|
|
|
|||||
|
Total other operating expense
|
|
|
|
|
|
|
|
||||
|
SG&A expense:
|
|||||||||||
|
Liberty Global Group
|
|
|
|
|
|
|
|||||
|
LiLAC Group
|
|
|
|
|
|
|
|||||
|
Total SG&A expense
|
|
|
|
|
|
|
|
||||
|
Total
|
$
|
|
|
$
|
|
|
$
|
|
|
||
_______________
|
(a)
|
Includes share-based compensation expense related to (i)
Liberty Global
PSU
s, including amounts resulting from the 2016
PSU
s, as described and defined below, (ii) a challenge performance award plan for certain executive officers and key employees (the
Challenge Performance Awards
) and (iii)
PGUs
to our Chief Executive Officer, as described below. The
Challenge Performance Awards
include
PSAR
s and
PSU
s.
|
|
(b)
|
In connection with the
LiLAC Transaction
, our compensation committee approved modifications to our outstanding share-based incentive awards (the
2015 Award Modifications
) in accordance with the underlying share-based incentive plans. The objective of our compensation committee was to ensure a relatively unchanged intrinsic value of outstanding equity awards before and after the bonus issuance of the
LiLAC Shares
. The mechanism to modify outstanding share-based incentive awards, as approved by our compensation committee, utilized the volume-weighted average price of the respective shares for the
five
days prior to and the
five
days following the bonus issuance
(
Modification VWAP
s
). In order to determine if any incremental share-based compensation expense should be recorded as a result of the
2015 Award Modifications
, we were required to measure the changes in the fair values of the then outstanding share-based incentive awards using market prices immediately before and immediately after the
2015 Award Modifications
. Due to declines in the share prices of our Class A and Class C
Liberty Global Shares
following the bonus issuance, the exercise prices of options,
SAR
s and
PSAR
s determined using the
Modification VWAP
s
were lower than the exercise prices that would have resulted if the market prices immediately before and after the
2015 Award Modifications
had been used. Accordingly, the Black-Scholes fair values of
|
II-184
LIBERTY GLOBAL PLC
Notes to Consolidated Financial Statements — (Continued)
December 31, 2016, 2015 and 2014
our options,
SAR
s and
PSAR
s
increased as a result of the
2015 Award Modifications
,
resulting in incremental share-based compensation of
$
99.3
million
, including
$
16.1
million
and
$
69.3
million
recognized during 2016 and 2015, respectively, and
$
13.9
million
that will be recognized in future periods through 2019 as the related awards vest.
|
(c)
|
Represents the share-based compensation expense associated with
Telenet
’s share-based incentive awards, which, at
December 31, 2016
, included (i) warrants and employee stock options (
|
As of
December 31, 2016
,
$
450.4
million
of total unrecognized compensation cost related to our
Liberty Global
share-based compensation awards is expected to be recognized as an expense by our company in the future over a weighted-average period of approximately
2.5
years
.
|
|
Year ended December 31,
|
||||||||||
|
|
2016
|
2015
|
2014
|
||||||||
|
Assumptions used to estimate fair value of options, SARs and PSARs granted:
|
|||||||||||
|
Risk-free interest rate
|
0.88 - 1.49%
|
0.96 - 1.89%
|
0.81 - 1.77%
|
||||||||
|
Expected life
|
3.2 - 5.5 years
|
3.0 - 5.5 years
|
3.1 - 5.1 years
|
||||||||
|
Expected volatility
|
27.4 - 42.9%
|
23.1 - 30.1%
|
25.1 - 28.7%
|
||||||||
|
Expected dividend yield
|
none
|
none
|
none
|
||||||||
|
Weighted average grant-date fair value per share of awards granted:
|
|||||||||||
|
Options
|
$
|
|
|
$
|
|
|
$
|
|
|
||
|
SARs
|
$
|
|
|
$
|
|
|
$
|
|
|
||
|
PSARs
|
$
|
|
|
$
|
|
|
$
|
|
|
||
|
RSUs
|
$
|
|
|
$
|
|
|
$
|
|
|
||
|
PSUs
|
$
|
|
|
$
|
|
|
$
|
|
|
||
|
PGUs
|
$
|
|
|
$
|
|
|
$
|
|
|
||
|
Total intrinsic value of awards exercised (in millions):
|
|||||||||||
|
Options
|
$
|
|
|
$
|
|
|
$
|
|
|
||
|
SARs
|
$
|
|
|
$
|
|
|
$
|
|
|
||
|
PSARs
|
$
|
|
|
$
|
|
|
$
|
|
|
||
|
Cash received from exercise of options (in millions)
|
$
|
|
|
$
|
|
|
$
|
|
|
||
|
Income tax benefit related to share-based compensation (in millions)
|
$
|
|
|
$
|
|
|
$
|
|
|
||
Share Incentive Plans — Liberty Global Ordinary Shares
Incentive Plans
As of
December 31, 2016
, we are authorized to grant incentive awards under the Liberty Global 2014 Incentive Plan and the Liberty Global 2014 Nonemployee Director Incentive Plan. Generally, we may grant non-qualified share options,
SAR
s, restricted shares,
RSU
s, cash awards, performance awards or any combination of the foregoing under either of these incentive plans (collectively, awards). Ordinary shares issuable pursuant to awards made under these incentive plans will be made available from either authorized but unissued shares or shares that have been issued but reacquired by our company. Awards may be granted at or above fair value in any class of ordinary shares. The maximum number of
Liberty Global
ordinary shares with respect to which awards may be issued under the Liberty Global 2014 Incentive Plan and the Liberty Global 2014 Nonemployee Director Incentive
II-185
LIBERTY GLOBAL PLC
Notes to Consolidated Financial Statements — (Continued)
December 31, 2016, 2015 and 2014
Plan is
105
million
(of which no more than
50.25
million
shares may consist of Class B ordinary shares) and
10.5
million
, respectively, in each case, subject to anti-dilution and other adjustment provisions in the respective plan. As of
December 31, 2016
, the Liberty Global 2014 Incentive Plan and the Liberty Global 2014 Nonemployee Director Incentive Plan had
64,795,919
and
9,789,929
ordinary shares available for grant, respectively.
Awards (other than performance-based awards) under the Liberty Global 2014 Incentive Plan generally (i) vest
12.5
%
on the six month anniversary of the grant date and then vest at a rate of
6.25
%
each quarter thereafter and (ii) expire
seven
years after the grant date. Awards (other than
RSU
s) issued under the Liberty Global 2014 Nonemployee Director Incentive Plan generally vest in
three
equal annual installments, provided the director continues to serve as director immediately prior to the vesting date, and expire
seven
years after the grant date.
RSU
s vest on the date of the first annual general meeting of shareholders following the grant date. These awards may be granted at or above fair value in any class of ordinary shares.
Awards under the
VM Incentive Plan
issued prior to the June 7, 2013 acquisition of
Virgin Media
have a
10
-year term and become fully exercisable within
five years
of continued employment. Awards (other than performance-based awards) issued under the
Liberty Global 2005 Incentive Plan
and issued under the
VM Incentive Plan
after June 7, 2013 generally (i) vest
12.5
%
on the six month anniversary of the grant date and then vest at a rate of
6.25
%
each quarter thereafter and (ii) expire
seven
years after the grant date. All awards issued under the
Liberty Global 2005 Director Incentive Plan
were fully vested as of December 31, 2016, and other than RSUs, expire
7
to
10
years after the grant date.
RSU
s vest on the date of the first annual general meeting of shareholders following the grant date. No further awards will be granted under the
Liberty Global 2005 Incentive Plan
, the
Liberty Global 2005 Director Incentive Plan
or the
VM Incentive Plan
.
Performance Awards
The following is a summary of the material terms and conditions with respect to our performance-based awards for certain executive officers and key employees.
Liberty Global PSU
s
Equity awards are granted to executive officers and key employees based on a target annual equity value for each executive and key employee, of which approximately
two-thirds
would be delivered in the form of
PSU
s and approximately
one-third
in the form of an annual award of
SAR
s. Each currently-outstanding
PSU
represents the right to receive
one
Liberty Global
or LiLAC Class A or Class C ordinary share, as applicable, subject to performance and vesting. Although
PSU
s are generally granted on an annual basis, no
PSU
s will be granted in 2017 to recipients of the
2016 PSUs
, as defined and described below.
In March 2015, our compensation committee approved the grant of
PSU
s to executive officers and key employees (the
2015 PSU
s
). The performance plan for the
2015 PSU
s covered a two-year period ending December 31, 2016 and included a performance target based on the achievement of a specified compound annual growth rate (
CAGR
) in a consolidated
Adjusted OIBDA
metric (as defined in note
18
). The performance target was adjusted for events such as acquisitions, dispositions and changes in foreign currency exchange rates that affect comparability (
Adjusted OIBDA CAGR
), and the participant’s annual performance ratings during the
two
-year performance period. A performance range of
75
%
to
125
%
of the target
Adjusted OIBDA CAGR
will result in award recipients earning
50
%
to
150
%
of their respective
PSU
s, subject to reduction or forfeiture based on individual performance. The percentage of the
2015 PSU
s that has been earned by participants has not been finalized. The
2015 PSU
s will vest
50
%
on each of April 1 and October 1 of 2017.
In February 2016, our compensation committee approved the grant of
PSU
s to executive officers and key employees (the
2016 PSUs
) pursuant to a performance plan that is based on the achievement of a specified
Adjusted OIBDA CAGR
during the
three
-year period ended December 31, 2018. The
2016 PSUs
require delivery of a compound annual growth rate of our consolidated
Adjusted OIBDA CAGR
of
6.0
%
during the
three
-year performance period, with over- and under-performance payout opportunities should the
Adjusted OIBDA CAGR
exceed or fail to meet the target, as applicable. The performance payout may be adjusted at the compensation committee’s discretion for events that may affect comparability, such as changes in foreign currency exchange rates and accounting principles or policies. A performance range of
75
%
to
167.5
%
of the target
Adjusted OIBDA CAGR
will generally result in award recipients earning
75
%
to
300
%
of their target
2016 PSUs
, subject to reduction or forfeiture based on individual performance. The earned
2016 PSUs
will vest
50
%
on each of April 1, 2019 and October 1, 2019.
II-186
LIBERTY GLOBAL PLC
Notes to Consolidated Financial Statements — (Continued)
December 31, 2016, 2015 and 2014
Liberty Global Performance Grant Award
Effective April 30, 2014, our compensation committee authorized the grant of
PGUs
to our Chief Executive Officer, comprising a total of
one million
PGUs
with respect to Class A
Old Liberty Global Shares
and
one million
PGUs
with respect to Class B
Old Liberty Global Shares
. The
PGUs
, which were subject to a performance condition that was achieved in 2014, vest in
three
equal annual installments, the first of which occurred on March 15, 2015. Our Chief Executive Officer also received
41,589
PGUs
with respect to each Class A and Class B
LiLAC Shares
as a result of the
LiLAC Distribution
in 2016 and
33,333
PGUs
with respect to each Class A and Class B
LiLAC Shares
as a result of the
LiLAC Transaction
in 2015. Each of these additional distributions vest over the same period as the May 1, 2014 award grant described above.
Liberty Global Challenge Performance Awards
Effective June 24, 2013, our compensation committee approved the
Challenge Performance Awards
, which consisted solely of
PSAR
s for our senior executive officers and a combination of
PSAR
s and
PSU
s for our other executive officers and key employees. Each
PSU
represented the right to receive
one
Liberty Global
or LiLAC Class A or Class C ordinary share, as applicable. The performance criteria for the
Challenge Performance Awards
was based on the participant’s performance and achievement of individual goals in each of the years 2013, 2014 and 2015. As a result of satisfying performance conditions,
100
%
of the then outstanding
Challenge Performance Awards
vested and became fully exercisable on June 24, 2016. The
PSAR
s have a term of
seven years
and base prices equal to the respective market closing prices of the applicable class on the grant date.
LiLAC Distribution
In connection with the
LiLAC Distribution
, our compensation committee approved modifications to our outstanding share-based incentive awards (the
2016 Award Modification
) in accordance with the underlying share-based incentive plans. The objective of our compensation committee was to ensure a relatively unchanged intrinsic value of outstanding equity awards before and after the
LiLAC Distribution
. The mechanism to modify outstanding share-based incentive awards, as approved by our compensation committee, utilized an analysis of the prices of the respective shares before and after the share issuance. Based upon this approach, we determined the incremental value associated with the
2016 Award Modification
was immaterial. As a result, we did not recognize any incremental share-based compensation expense associated with the
2016 Award Modification
. The impact of the
LiLAC Distribution
is separately presented in the below tables.
Share-based Award Activity
—
Liberty Global Ordinary Shares
Liberty Global Shares
|
Options — Class A ordinary shares |
Number of
shares |
Weighted
average exercise price |
Weighted
average remaining contractual term |
Aggregate
intrinsic value |
|||||||||
|
|
|
|
in years
|
in millions
|
|||||||||
|
Outstanding at January 1, 2016
|
|
|
$
|
|
|
||||||||
|
Granted
|
|
|
$
|
|
|
||||||||
|
Forfeited
|
(
|
)
|
$
|
|
|
||||||||
|
Exercised
|
(
|
)
|
$
|
|
|
||||||||
|
Outstanding at June 30, 2016
|
|
|
$
|
|
|
||||||||
|
Impact of the LiLAC Distribution
|
|
|
$
|
(
|
)
|
||||||||
|
Outstanding at July 1, 2016
|
|
|
$
|
|
|
||||||||
|
Forfeited
|
(
|
)
|
$
|
|
|
||||||||
|
Exercised
|
(
|
)
|
$
|
|
|
||||||||
|
Outstanding at December 31, 2016
|
|
|
$
|
|
|
|
$
|
|
|
||||
|
Exercisable at December 31, 2016
|
|
|
$
|
|
|
|
$
|
|
|
||||
II-187
LIBERTY GLOBAL PLC
Notes to Consolidated Financial Statements — (Continued)
December 31, 2016, 2015 and 2014
Liberty Global Shares
—
continued:
|
Options — Class C ordinary shares
|
Number of
shares |
Weighted
average exercise price |
Weighted
average remaining contractual term |
Aggregate
intrinsic value |
|||||||||
|
|
|
|
in years
|
in millions
|
|||||||||
|
Outstanding at January 1, 2016
|
|
|
$
|
|
|
||||||||
|
Granted
|
|
|
$
|
|
|
||||||||
|
Forfeited
|
(
|
)
|
$
|
|
|
||||||||
|
Exercised
|
(
|
)
|
$
|
|
|
||||||||
|
Outstanding at June 30, 2016
|
|
|
$
|
|
|
||||||||
|
Impact of the LiLAC Distribution
|
|
|
$
|
(
|
)
|
||||||||
|
Outstanding at July 1, 2016
|
|
|
$
|
|
|
||||||||
|
Granted
|
|
|
$
|
|
|
||||||||
|
Forfeited
|
(
|
)
|
$
|
|
|
||||||||
|
Exercised
|
(
|
)
|
$
|
|
|
||||||||
|
Outstanding at December 31, 2016
|
|
|
$
|
|
|
|
$
|
|
|
||||
|
Exercisable at December 31, 2016
|
|
|
$
|
|
|
|
$
|
|
|
||||
|
SARs — Class A ordinary shares
|
Number of
shares |
Weighted
average base price |
Weighted
average remaining contractual term |
Aggregate
intrinsic value |
|||||||||
|
|
|
|
in years
|
in millions
|
|||||||||
|
Outstanding at January 1, 2016
|
|
|
$
|
|
|
||||||||
|
Granted
|
|
|
$
|
|
|
||||||||
|
Forfeited
|
(
|
)
|
$
|
|
|
||||||||
|
Exercised
|
(
|
)
|
$
|
|
|
||||||||
|
Outstanding at June 30, 2016
|
|
|
$
|
|
|
||||||||
|
Impact of the LiLAC Distribution
|
|
|
$
|
(
|
)
|
||||||||
|
Outstanding at July 1, 2016
|
|
|
$
|
|
|
||||||||
|
Granted
|
|
|
$
|
|
|
||||||||
|
Forfeited
|
(
|
)
|
$
|
|
|
||||||||
|
Exercised
|
(
|
)
|
$
|
|
|
||||||||
|
Outstanding at December 31, 2016
|
|
|
$
|
|
|
|
$
|
|
|
||||
|
Exercisable at December 31, 2016
|
|
|
$
|
|
|
|
$
|
|
|
||||
II-188
LIBERTY GLOBAL PLC
Notes to Consolidated Financial Statements — (Continued)
December 31, 2016, 2015 and 2014
Liberty Global Shares
—
continued:
|
SARs — Class C ordinary shares
|
Number of
shares |
Weighted
average base price |
Weighted
average remaining contractual term |
Aggregate
intrinsic value |
|||||||||
|
|
|
|
in years
|
in millions
|
|||||||||
|
Outstanding at January 1, 2016
|
|
|
$
|
|
|
||||||||
|
Granted
|
|
|
$
|
|
|
||||||||
|
Forfeited
|
(
|
)
|
$
|
|
|
||||||||
|
Exercised
|
(
|
)
|
$
|
|
|
||||||||
|
Outstanding at June 30, 2016
|
|
|
$
|
|
|
||||||||
|
Impact of the LiLAC Distribution
|
|
|
$
|
(
|
)
|
||||||||
|
Outstanding at July 1, 2016
|
|
|
$
|
|
|
||||||||
|
Granted
|
|
|
$
|
|
|
||||||||
|
Forfeited
|
(
|
)
|
$
|
|
|
||||||||
|
Exercised
|
(
|
)
|
$
|
|
|
||||||||
|
Outstanding at December 31, 2016
|
|
|
$
|
|
|
|
$
|
|
|
||||
|
Exercisable at December 31, 2016
|
|
|
$
|
|
|
|
$
|
|
|
||||
|
PSARs — Class A ordinary shares
|
Number of
shares |
Weighted
average base price |
Weighted
average remaining contractual term |
Aggregate
intrinsic value |
|||||||||
|
|
|
|
in years
|
in millions
|
|||||||||
|
Outstanding at January 1, 2016
|
|
|
$
|
|
|
||||||||
|
Forfeited
|
(
|
)
|
$
|
|
|
||||||||
|
Outstanding at June 30, 2016
|
|
|
$
|
|
|
||||||||
|
Impact of the LiLAC Distribution
|
|
|
$
|
(
|
)
|
||||||||
|
Outstanding at July 1, 2016
|
|
|
$
|
|
|
||||||||
|
Exercised
|
(
|
)
|
$
|
|
|
||||||||
|
Outstanding at December 31, 2016 (a)
|
|
|
$
|
|
|
|
$
|
|
|
||||
|
Exercisable at December 31, 2016
|
|
|
$
|
|
|
|
$
|
|
|
||||
II-189
LIBERTY GLOBAL PLC
Notes to Consolidated Financial Statements — (Continued)
December 31, 2016, 2015 and 2014
Liberty Global Shares
—
continued:
|
PSARs — Class C ordinary shares
|
Number of
shares |
Weighted
average base price |
Weighted
average remaining contractual term |
Aggregate
intrinsic value |
|||||||||
|
|
|
|
in years
|
in millions
|
|||||||||
|
Outstanding at January 1, 2016
|
|
|
$
|
|
|
||||||||
|
Forfeited
|
(
|
)
|
$
|
|
|
||||||||
|
Outstanding at June 30, 2016
|
|
|
$
|
|
|
||||||||
|
Impact of the LiLAC Distribution
|
|
|
$
|
(
|
)
|
||||||||
|
Outstanding at July 1, 2016
|
|
|
$
|
|
|
||||||||
|
Exercised
|
(
|
)
|
$
|
|
|
||||||||
|
Outstanding at December 31, 2016 (a)
|
|
|
$
|
|
|
|
$
|
|
|
||||
|
Exercisable at December 31, 2016
|
|
|
$
|
|
|
|
$
|
|
|
||||
|
RSUs — Class A ordinary shares
|
Number of
shares |
Weighted
average grant-date fair value per share |
Weighted
average remaining contractual term |
||||||
|
|
|
|
in years
|
||||||
|
Outstanding at January 1, 2016
|
|
|
$
|
|
|
||||
|
Granted
|
|
|
$
|
|
|
||||
|
Forfeited
|
(
|
)
|
$
|
|
|
||||
|
Released from restrictions
|
(
|
)
|
$
|
|
|
||||
|
Outstanding at June 30, 2016
|
|
|
$
|
|
|
||||
|
Impact of the LiLAC Distribution
|
|
|
$
|
(
|
)
|
||||
|
Outstanding at July 1, 2016
|
|
|
$
|
|
|
||||
|
Granted
|
|
|
$
|
|
|
||||
|
Forfeited
|
(
|
)
|
$
|
|
|
||||
|
Released from restrictions
|
(
|
)
|
$
|
|
|
||||
|
Outstanding at December 31, 2016
|
|
|
$
|
|
|
|
|||
II-190
LIBERTY GLOBAL PLC
Notes to Consolidated Financial Statements — (Continued)
December 31, 2016, 2015 and 2014
Liberty Global Shares
—
continued:
|
RSUs — Class C ordinary shares
|
Number of
shares |
Weighted
average grant-date fair value per share |
Weighted
average remaining contractual term |
||||||
|
|
|
|
in years
|
||||||
|
Outstanding at January 1, 2016
|
|
|
$
|
|
|
||||
|
Granted
|
|
|
$
|
|
|
||||
|
Forfeited
|
(
|
)
|
$
|
|
|
||||
|
Released from restrictions
|
(
|
)
|
$
|
|
|
||||
|
Outstanding at June 30, 2016
|
|
|
$
|
|
|
||||
|
Impact of the LiLAC Distribution
|
|
|
$
|
(
|
)
|
||||
|
Outstanding at July 1, 2016
|
|
|
$
|
|
|
||||
|
Granted
|
|
|
$
|
|
|
||||
|
Forfeited
|
(
|
)
|
$
|
|
|
||||
|
Released from restrictions
|
(
|
)
|
$
|
|
|
||||
|
Outstanding at December 31, 2016
|
|
|
$
|
|
|
|
|||
|
PSUs and PGUs — Class A ordinary shares
|
Number of
shares |
Weighted
average grant-date fair value per share |
Weighted
average remaining contractual term |
||||||
|
|
|
|
in years
|
||||||
|
Outstanding at January 1, 2016
|
|
|
$
|
|
|
||||
|
Granted
|
|
|
$
|
|
|
||||
|
Performance adjustment (b)
|
|
|
$
|
|
|
||||
|
Forfeited
|
(
|
)
|
$
|
|
|
||||
|
Released from restrictions
|
(
|
)
|
$
|
|
|
||||
|
Outstanding at June 30, 2016
|
|
|
$
|
|
|
||||
|
Impact of the LiLAC Distribution
|
|
|
$
|
(
|
)
|
||||
|
Outstanding at July 1, 2016
|
|
|
$
|
|
|
||||
|
Granted
|
|
|
$
|
|
|
||||
|
Forfeited
|
(
|
)
|
$
|
|
|
||||
|
Released from restrictions
|
(
|
)
|
$
|
|
|
||||
|
Outstanding at December 31, 2016
|
|
|
$
|
|
|
|
|||
II-191
LIBERTY GLOBAL PLC
Notes to Consolidated Financial Statements — (Continued)
December 31, 2016, 2015 and 2014
Liberty Global Shares
—
continued:
|
PGUs — Class B ordinary shares
|
Number of
shares |
Weighted
average grant-date fair value per share |
Weighted
average remaining contractual term |
||||||
|
|
|
|
in years
|
||||||
|
Outstanding at January 1, 2016
|
|
|
$
|
|
|
||||
|
Released from restriction
|
(
|
)
|
$
|
|
|
||||
|
Outstanding at June 30, 2016
|
|
|
$
|
|
|
||||
|
Impact of the LiLAC Distribution
|
|
|
$
|
(
|
)
|
||||
|
Outstanding at July 1, 2016
|
|
|
$
|
|
|
|
|||
|
Outstanding at December 31, 2016
|
|
|
$
|
|
|
|
|||
|
PSUs — Class C ordinary shares
|
Number of
shares |
Weighted
average grant-date fair value per share |
Weighted
average remaining contractual term |
||||||
|
|
|
|
in years
|
||||||
|
Outstanding at January 1, 2016
|
|
|
$
|
|
|
||||
|
Granted
|
|
|
$
|
|
|
||||
|
Performance adjustment (b)
|
|
|
$
|
|
|
||||
|
Forfeited
|
(
|
)
|
$
|
|
|
||||
|
Released from restrictions
|
(
|
)
|
$
|
|
|
||||
|
Outstanding at June 30, 2016
|
|
|
$
|
|
|
||||
|
Impact of the LiLAC Distribution
|
|
|
$
|
(
|
)
|
||||
|
Outstanding at July 1, 2016
|
|
|
$
|
|
|
||||
|
Granted
|
|
|
$
|
|
|
||||
|
Forfeited
|
(
|
)
|
$
|
|
|
||||
|
Released from restrictions
|
(
|
)
|
$
|
|
|
||||
|
Outstanding at December 31, 2016
|
|
|
$
|
|
|
|
|||
_______________
|
(a)
|
The performance criteria was achieved during 2016 and, as a result, all then outstanding awards became fully exercisable.
|
|
(b)
|
Represents the increase in
PSU
s associated with the first quarter
2016
determination that
|
II-192
LIBERTY GLOBAL PLC
Notes to Consolidated Financial Statements — (Continued)
December 31, 2016, 2015 and 2014
|
Options — Class A ordinary shares
|
Number of
shares |
Weighted
average exercise price |
Weighted
average remaining contractual term |
Aggregate
intrinsic value |
|||||||||
|
|
|
|
in years
|
in millions
|
|||||||||
|
Outstanding at January 1, 2016
|
|
|
$
|
|
|
||||||||
|
Granted
|
|
|
$
|
|
|
||||||||
|
Forfeited
|
(
|
)
|
$
|
|
|
||||||||
|
Exercised
|
(
|
)
|
$
|
|
|
||||||||
|
Outstanding at June 30, 2016
|
|
|
$
|
|
|
||||||||
|
Impact of the LiLAC Distribution
|
|
|
$
|
|
|
||||||||
|
Outstanding at July 1, 2016
|
|
|
$
|
|
|
|
|
||||||
|
Outstanding at December 31, 2016
|
|
|
$
|
|
|
|
$
|
|
|
||||
|
Exercisable at December 31, 2016
|
|
|
$
|
|
|
|
$
|
|
|
||||
|
Options — Class C ordinary shares
|
Number of
shares |
Weighted
average exercise price |
Weighted
average remaining contractual term |
Aggregate
intrinsic value |
|||||||||
|
|
|
|
in years
|
in millions
|
|||||||||
|
Outstanding at January 1, 2016
|
|
|
$
|
|
|
||||||||
|
Granted
|
|
|
$
|
|
|
||||||||
|
Forfeited
|
(
|
)
|
$
|
|
|
||||||||
|
Exercised
|
(
|
)
|
$
|
|
|
||||||||
|
Outstanding at June 30, 2016
|
|
|
$
|
|
|
||||||||
|
Impact of the LiLAC Distribution
|
|
|
$
|
|
|
||||||||
|
Outstanding at July 1, 2016
|
|
|
$
|
|
|
|
|
||||||
|
Outstanding at December 31, 2016
|
|
|
$
|
|
|
|
$
|
|
|
||||
|
Exercisable at December 31, 2016
|
|
|
$
|
|
|
|
$
|
|
|
||||
II-193
LIBERTY GLOBAL PLC
Notes to Consolidated Financial Statements — (Continued)
December 31, 2016, 2015 and 2014
LiLAC Shares
—
continued:
|
SARs — Class A ordinary shares
|
Number of
shares |
Weighted
average base price |
Weighted
average remaining contractual term |
Aggregate
intrinsic value |
|||||||||
|
|
|
|
in years
|
in millions
|
|||||||||
|
Outstanding at January 1, 2016
|
|
|
$
|
|
|
||||||||
|
Granted
|
|
|
$
|
|
|
||||||||
|
Forfeited
|
(
|
)
|
$
|
|
|
||||||||
|
Exercised
|
(
|
)
|
$
|
|
|
||||||||
|
Outstanding at June 30, 2016
|
|
|
$
|
|
|
||||||||
|
Impact of the LiLAC Distribution
|
|
|
$
|
|
|
||||||||
|
Outstanding at July 1, 2016
|
|
|
$
|
|
|
|
|
||||||
|
Granted
|
|
|
$
|
|
|
|
|
||||||
|
Forfeited
|
(
|
)
|
$
|
|
|
||||||||
|
Exercised
|
(
|
)
|
$
|
|
|
||||||||
|
Outstanding at December 31, 2016
|
|
|
$
|
|
|
|
$
|
|
|
||||
|
Exercisable at December 31, 2016
|
|
|
$
|
|
|
|
$
|
|
|
||||
|
SARs — Class C ordinary shares
|
Number of
shares |
Weighted
average base price |
Weighted
average remaining contractual term |
Aggregate
intrinsic value |
|||||||||
|
|
|
|
in years
|
in millions
|
|||||||||
|
Outstanding at January 1, 2016
|
|
|
$
|
|
|
||||||||
|
Granted
|
|
|
$
|
|
|
||||||||
|
Forfeited
|
(
|
)
|
$
|
|
|
||||||||
|
Exercised
|
(
|
)
|
$
|
|
|
||||||||
|
Outstanding at June 30, 2016
|
|
|
$
|
|
|
||||||||
|
Impact of the LiLAC Distribution
|
|
|
$
|
|
|
||||||||
|
Outstanding at July 1, 2016
|
|
|
$
|
|
|
|
|
|
|||||
|
Granted
|
|
|
$
|
|
|
|
|
||||||
|
Forfeited
|
(
|
)
|
$
|
|
|
||||||||
|
Exercised
|
(
|
)
|
$
|
|
|
||||||||
|
Outstanding at December 31, 2016
|
|
|
$
|
|
|
|
$
|
|
|
||||
|
Exercisable at December 31, 2016
|
|
|
$
|
|
|
|
$
|
|
|
||||
II-194
LIBERTY GLOBAL PLC
Notes to Consolidated Financial Statements — (Continued)
December 31, 2016, 2015 and 2014
LiLAC Shares
—
continued:
|
PSARs — Class A ordinary shares
|
Number of
shares |
Weighted
average base price |
Weighted
average remaining contractual term |
Aggregate
intrinsic value |
|||||||||
|
|
|
|
in years
|
in millions
|
|||||||||
|
Outstanding at January 1, 2016
|
|
|
$
|
|
|
||||||||
|
Forfeited
|
(
|
)
|
$
|
|
|
||||||||
|
Outstanding at June 30, 2016
|
|
|
$
|
|
|
||||||||
|
Impact of the LiLAC Distribution
|
|
|
$
|
|
|
||||||||
|
Outstanding at July 1, 2016
|
|
|
$
|
|
|
||||||||
|
Outstanding at December 31, 2016 (a)
|
|
|
$
|
|
|
|
$
|
|
|
||||
|
Exercisable at December 31, 2016
|
|
|
$
|
|
|
|
$
|
|
|
||||
|
PSARs — Class C ordinary shares
|
Number of
shares |
Weighted
average base price |
Weighted
average remaining contractual term |
Aggregate
intrinsic value |
|||||||||
|
|
|
|
in years
|
in millions
|
|||||||||
|
Outstanding at January 1, 2016
|
|
|
$
|
|
|
||||||||
|
Forfeited
|
(
|
)
|
$
|
|
|
||||||||
|
Outstanding at June 30, 2016
|
|
|
$
|
|
|
||||||||
|
Impact of the LiLAC Distribution
|
|
|
$
|
|
|
||||||||
|
Outstanding at July 1, 2016
|
|
|
$
|
|
|
||||||||
|
Outstanding at December 31, 2016 (a)
|
|
|
$
|
|
|
|
$
|
|
|
||||
|
Exercisable at December 31, 2016
|
|
|
$
|
|
|
|
$
|
|
|
||||
|
RSUs — Class A ordinary shares
|
Number of
shares |
Weighted
average grant-date fair value per share |
Weighted
average remaining contractual term |
||||||
|
|
|
|
in years
|
||||||
|
Outstanding at January 1, 2016
|
|
|
$
|
|
|
||||
|
Granted
|
|
|
$
|
|
|
||||
|
Released from restrictions
|
(
|
)
|
$
|
|
|
||||
|
Outstanding at June 30, 2016
|
|
|
$
|
|
|
||||
|
Impact of the LiLAC Distribution
|
|
|
$
|
|
|
||||
|
Outstanding at July 1, 2016
|
|
|
$
|
|
|
||||
|
Granted
|
|
|
$
|
|
|
|
|||
|
Forfeited
|
(
|
)
|
$
|
|
|
||||
|
Released from restrictions
|
(
|
)
|
$
|
|
|
||||
|
Outstanding at December 31, 2016
|
|
|
$
|
|
|
|
|||
II-195
LIBERTY GLOBAL PLC
Notes to Consolidated Financial Statements — (Continued)
December 31, 2016, 2015 and 2014
LiLAC Shares
—
continued:
|
RSUs — Class C ordinary shares
|
Number of
shares |
Weighted
average grant-date fair value per share |
Weighted
average remaining contractual term |
||||||
|
|
|
|
in years
|
||||||
|
Outstanding at January 1, 2016
|
|
|
$
|
|
|
||||
|
Granted
|
|
|
$
|
|
|
||||
|
Released from restrictions
|
(
|
)
|
$
|
|
|
||||
|
Outstanding at June 30, 2016
|
|
|
$
|
|
|
||||
|
Impact of the LiLAC Distribution
|
|
|
$
|
(
|
)
|
||||
|
Outstanding at July 1, 2016
|
|
|
$
|
|
|
||||
|
Granted
|
|
|
$
|
|
|
||||
|
Forfeited
|
(
|
)
|
$
|
|
|
||||
|
Released from restrictions
|
(
|
)
|
$
|
|
|
||||
|
Outstanding at December 31, 2016
|
|
|
$
|
|
|
|
|||
|
PSUs and PGUs — Class A ordinary shares
|
Number of
shares |
Weighted
average grant-date fair value per share |
Weighted
average remaining contractual term |
||||||
|
|
|
|
in years
|
||||||
|
Outstanding at January 1, 2016
|
|
|
$
|
|
|
||||
|
Granted
|
|
|
$
|
|
|
||||
|
Performance adjustment (b)
|
|
|
$
|
|
|
||||
|
Forfeited
|
(
|
)
|
$
|
|
|
||||
|
Released from restrictions
|
(
|
)
|
$
|
|
|
||||
|
Outstanding at June 30, 2016
|
|
|
$
|
|
|
||||
|
Impact of the LiLAC Distribution
|
|
|
$
|
(
|
)
|
|
|||
|
Outstanding at July 1, 2016
|
|
|
$
|
|
|
||||
|
Granted
|
|
|
$
|
|
|
||||
|
Forfeited
|
(
|
)
|
$
|
|
|
||||
|
Released from restrictions
|
(
|
)
|
$
|
|
|
||||
|
Outstanding at December 31, 2016
|
|
|
$
|
|
|
|
|||
|
PGUs — Class B ordinary shares
|
Number of
shares |
Weighted
average grant-date fair value per share |
Weighted
average remaining contractual term |
||||||
|
|
|
|
in years
|
||||||
|
Outstanding at January 1, 2016
|
|
|
$
|
|
|
||||
|
Released from restriction
|
(
|
)
|
$
|
|
|
||||
|
Outstanding at June 30, 2016
|
|
|
$
|
|
|
||||
|
Impact of the LiLAC Distribution
|
|
|
$
|
(
|
)
|
||||
|
Outstanding at July 1, 2016
|
|
|
$
|
|
|
||||
|
Outstanding at December 31, 2016
|
|
|
$
|
|
|
|
|||
II-196
LIBERTY GLOBAL PLC
Notes to Consolidated Financial Statements — (Continued)
December 31, 2016, 2015 and 2014
LiLAC Shares
—
continued:
|
PSUs — Class C ordinary shares
|
Number of
shares |
Weighted
average grant-date fair value per share |
Weighted
average remaining contractual term |
||||||
|
|
|
|
in years
|
||||||
|
Outstanding at January 1, 2016
|
|
|
$
|
|
|
||||
|
Granted
|
|
|
$
|
|
|
||||
|
Performance adjustment (b)
|
|
|
$
|
|
|
||||
|
Forfeited
|
(
|
)
|
$
|
|
|
||||
|
Released from restrictions
|
(
|
)
|
$
|
|
|
||||
|
Outstanding at June 30, 2016
|
|
|
$
|
|
|
||||
|
Impact of the LiLAC Distribution
|
|
|
$
|
(
|
)
|
|
|||
|
Outstanding at July 1, 2016
|
|
|
$
|
|
|
||||
|
Granted
|
|
|
$
|
|
|
||||
|
Forfeited
|
(
|
)
|
$
|
|
|
||||
|
Released from restrictions
|
(
|
)
|
$
|
|
|
||||
|
Outstanding at December 31, 2016
|
|
|
$
|
|
|
|
|||
_______________
|
(a)
|
All outstanding awards became fully exercisable during 2016 as the performance criteria was achieved during the year.
|
|
(b)
|
|
(
14
)
Restructuring Liabilities
|
Employee
severance
and
termination
|
Office
closures
|
Contract termination and other
|
Total
|
||||||||||||
|
|
in millions
|
||||||||||||||
|
Restructuring liability as of January 1, 2016
|
$
|
|
|
$
|
|
|
$
|
|
|
$
|
|
|
|||
|
Restructuring charges
|
|
|
|
|
|
|
|
|
|||||||
|
Cash paid
|
(
|
)
|
(
|
)
|
(
|
)
|
(
|
)
|
|||||||
|
CWC and BASE liabilities at acquisition date
|
|
|
|
|
|
|
|
|
|||||||
|
Disposal (a)
|
(
|
)
|
(
|
)
|
|
|
(
|
)
|
|||||||
|
Foreign currency translation adjustments and other
|
(
|
)
|
(
|
)
|
(
|
)
|
(
|
)
|
|||||||
|
Restructuring liability as of December 31, 2016
|
$
|
|
|
$
|
|
|
$
|
|
|
$
|
|
|
|||
|
Current portion
|
$
|
|
|
$
|
|
|
$
|
|
|
$
|
|
|
|||
|
Noncurrent portion
|
|
|
|
|
|
|
|
|
|||||||
|
Total
|
$
|
|
|
$
|
|
|
$
|
|
|
$
|
|
|
|||
_______________
|
(a)
|
|
II-197
LIBERTY GLOBAL PLC
Notes to Consolidated Financial Statements — (Continued)
December 31, 2016, 2015 and 2014
Our restructuring charges during
2016
included employee severance and termination costs related to certain reorganization and integration activities of
$
59.3
million
in Germany,
$
26.1
million
in
U.K./Ireland
,
$
20.4
million
in the
European Division
’s central operations,
$
11.6
million
in Chile and
$
10.8
million
in the Netherlands. Our restructuring charges during
2016
also included contract termination and other costs related to (i) contract termination charges of
$
15.0
million
included in the
European Division
’s central operations,
$
7.7
million
in the corporate and other category and
$
5.5
million
in Chile and (ii) a charge of
$
11.6
million
resulting from the write-off by
Liberty Puerto Rico
of a prepaid indefeasible right of use for telecommunications capacity due to the abandonment of this capacity in favor of capacity on
CWC
’s network.
|
Employee
severance
and
termination
|
Office
closures
|
Contract termination
|
Total
|
|||||||||||||
|
|
in millions
|
|||||||||||||||
|
Restructuring liability as of January 1, 2015
|
$
|
|
|
$
|
|
|
$
|
|
|
$
|
|
|
||||
|
Restructuring charges (credits)
|
|
|
(
|
)
|
|
|
|
|
||||||||
|
Cash paid
|
(
|
)
|
(
|
)
|
(
|
)
|
(
|
)
|
||||||||
|
Foreign currency translation adjustments and other
|
|
|
|
|
(
|
)
|
(
|
)
|
||||||||
|
Restructuring liability as of December 31, 2015
|
$
|
|
|
$
|
|
|
$
|
|
|
$
|
|
|
||||
|
Current portion
|
$
|
|
|
$
|
|
|
$
|
|
|
$
|
|
|
||||
|
Noncurrent portion
|
|
|
|
|
|
|
|
|
||||||||
|
Total
|
$
|
|
|
$
|
|
|
$
|
|
|
$
|
|
|
||||
Our restructuring charges during
2015
included (i) employee severance and termination costs related to certain reorganization and integration activities of
$
61.8
million
in the Netherlands,
$
20.9
million
in
U.K./Ireland
,
$
9.7
million
in Germany,
$
3.5
million
in Switzerland/Austria and
$
2.6
million
in Puerto Rico, (ii) contract termination charges of
$
8.1
million
in Belgium,
$
6.0
million
in Chile and
$
4.5
million
in Puerto Rico and (iii) a credit of
$
17.0
million
recorded by
Telenet
during the fourth quarter following the settlement of its digital terrestrial television (
DTT
) capacity contract obligations, the fair value of which were originally recorded during 2014 when
Telenet
discontinued the provision of
DTT
services, as further described below.
|
Employee
severance
and
termination
|
Office
closures
|
Contract termination
|
Total
|
|||||||||||||
|
|
in millions
|
|||||||||||||||
|
Restructuring liability as of January 1, 2014
|
$
|
|
|
$
|
|
|
$
|
|
|
$
|
|
|
||||
|
Restructuring charges
|
|
|
|
|
|
|
|
|
||||||||
|
Cash paid
|
(
|
)
|
(
|
)
|
(
|
)
|
(
|
)
|
||||||||
|
Ziggo liability at acquisition date
|
|
|
|
|
|
|
|
|
||||||||
|
Foreign currency translation adjustments and other
|
(
|
)
|
(
|
)
|
(
|
)
|
(
|
)
|
||||||||
|
Restructuring liability as of December 31, 2014
|
$
|
|
|
$
|
|
|
$
|
|
|
$
|
|
|
||||
|
Current portion
|
$
|
|
|
$
|
|
|
$
|
|
|
$
|
|
|
||||
|
Noncurrent portion
|
|
|
|
|
|
|
|
|
||||||||
|
Total
|
$
|
|
|
$
|
|
|
$
|
|
|
$
|
|
|
||||
II-198
LIBERTY GLOBAL PLC
Notes to Consolidated Financial Statements — (Continued)
December 31, 2016, 2015 and 2014
Prior to March 31, 2014,
Telenet
operated a
DTT
business that served a limited number of subscribers. The
DTT
network was accessed by
Telenet
pursuant to third-party capacity contracts that were accounted for as operating agreements. On March 31, 2014,
Telenet
discontinued the provision of
DTT
services and, accordingly, recorded an
$
86.1
million
restructuring charge during the three months ended March 31, 2014. This charge was equal to the then fair value of the remaining payments due under the
DTT
capacity contracts.
(
15
)
Defined Benefit Plans
Certain of our subsidiaries maintain various funded and unfunded defined benefit plans for their employees. A significant portion of these defined benefit plans are closed to new entrants and existing participants do not accrue any additional benefits.
|
Year ended December 31,
|
|||||||||||
|
2016
|
2015
|
2014
|
|||||||||
|
|
in millions
|
||||||||||
|
Projected benefit obligation
|
$
|
|
|
$
|
|
|
$
|
|
|
||
|
Fair value of plan assets (a)
|
$
|
|
|
$
|
|
|
$
|
|
|
||
|
Net liability
|
$
|
|
|
$
|
|
|
$
|
|
|
||
|
Net periodic pension cost (b)
|
$
|
|
|
$
|
|
|
$
|
|
|
||
_______________
|
(a)
|
The fair value of plan assets at
December 31, 2016
includes
$
|
|
(b)
|
|
At
December 31, 2016
, the Cable & Wireless Superannuation Fund (the
CWSF
), which is
CWC
’s largest defined benefit plan, had (i) a projected benefit obligation of
$
1,675.7
million
, (ii) fair value of plan assets of
$
1,666.0
million
and (iii) a funded status deficit of
$
9.7
million
. During the period from April 1, 2016 through December 31, 2016,
CWC
made cash contributions to the
CWSF
of
$
44.3
million
(including
$
1.1
million
of contributions made subsequent to the completion of the CWC Acquisition), which was based in part on the triennial actuarial funding valuation as of March 31, 2013.
CWC
’s acquisition of Columbus constituted a “change of control” under the contingent funding agreement (the
Contingent Funding Agreement
) between
CWC
and the trustee of the
CWSF
and, therefore, the trustee of the
CWSF
has the right to drawdown on the
$
123.5
million
letters of credit that were put in place in connection with the acquisition of Columbus pursuant to the terms of the
Contingent Funding Agreement
. Based on the pending outcome of the triennial actuarial valuation as of March 31, 2016, which is expected to be completed during the second quarter of 2017,
CWC
’s contributions necessary to fund the
CWSF
by April 2019 are currently expected to range from
nil
to
$
28.4
million
per year
during 2017, 2018 and 2019.
CWC
is currently in negotiations with the trustee of the
CWSF
with respect to the future funding requirements of the
CWSF
and the outstanding letters of credit with a view to addressing the remaining deficit through future contributions over a period of time similar in structure to prior triennial period contribution schedules. No assurance can be given as to the outcome of such negotiations.
II-199
LIBERTY GLOBAL PLC
Notes to Consolidated Financial Statements — (Continued)
December 31, 2016, 2015 and 2014
(
16
)
Accumulated Other Comprehensive Earnings (Loss)
Accumulated other comprehensive earnings (loss) included in our consolidated balance sheets and statements of equity reflect the aggregate impact of foreign currency translation adjustments and pension-related adjustments and other.
The changes in the components of accumulated other comprehensive earnings (loss), net of taxes, are summarized as follows:
|
|
Liberty Global shareholders
|
|
|
|||||||||||||||||
|
|
Foreign
currency
translation
adjustments
|
Pension-
related adjustments and other
|
Accumulated
other
comprehensive
earnings (loss)
|
Non-controlling
interests
|
Total
accumulated
other
comprehensive
earnings (loss)
|
|||||||||||||||
|
|
in millions
|
|||||||||||||||||||
|
Balance at January 1, 2014
|
$
|
|
|
$
|
|
|
$
|
|
|
$
|
|
|
$
|
|
|
|||||
|
Other comprehensive loss
|
(
|
)
|
(
|
)
|
(
|
)
|
(
|
)
|
(
|
)
|
||||||||||
|
Balance at December 31, 2014
|
|
|
(
|
)
|
|
|
|
|
|
|
||||||||||
|
Other comprehensive loss
|
(
|
)
|
(
|
)
|
(
|
)
|
|
|
(
|
)
|
||||||||||
|
Balance at December 31, 2015
|
|
|
(
|
)
|
|
|
|
|
|
|
||||||||||
|
Other comprehensive loss
|
(
|
)
|
(
|
)
|
(
|
)
|
(
|
)
|
(
|
)
|
||||||||||
|
Balance at December 31, 2016
|
$
|
(
|
)
|
$
|
(
|
)
|
$
|
(
|
)
|
$
|
|
|
$
|
(
|
)
|
|||||
The components of other comprehensive loss, net of taxes, are reflected in our consolidated statements of comprehensive earnings (loss).
The following table summarizes the tax effects related to each component of other comprehensive loss, net of amounts reclassified to our consolidated statements of operations:
|
Pre-tax
amount
|
Tax benefit
|
Net-of-tax
amount
|
||||||||||
|
|
in millions
|
|||||||||||
|
Year ended December 31, 2016:
|
||||||||||||
|
Foreign currency translation adjustments (a)
|
$
|
(
|
)
|
$
|
(
|
)
|
$
|
(
|
)
|
|||
|
Pension-related adjustments and other
|
(
|
)
|
|
|
(
|
)
|
||||||
|
Other comprehensive loss
|
(
|
)
|
(
|
)
|
(
|
)
|
||||||
|
Other comprehensive loss attributable to noncontrolling interests (b)
|
|
|
|
|
|
|
||||||
|
Other comprehensive loss attributable to Liberty Global shareholders
|
$
|
(
|
)
|
$
|
(
|
)
|
$
|
(
|
)
|
|||
|
Year ended December 31, 2015:
|
||||||||||||
|
Foreign currency translation adjustments (a)
|
$
|
(
|
)
|
$
|
|
|
$
|
(
|
)
|
|||
|
Pension-related adjustments and other
|
(
|
)
|
|
|
(
|
)
|
||||||
|
Other comprehensive loss
|
(
|
)
|
|
|
(
|
)
|
||||||
|
Other comprehensive earnings attributable to noncontrolling interests (b)
|
(
|
)
|
|
|
(
|
)
|
||||||
|
Other comprehensive loss attributable to Liberty Global shareholders
|
$
|
(
|
)
|
$
|
|
|
$
|
(
|
)
|
|||
|
Year ended December 31, 2014:
|
||||||||||||
|
Foreign currency translation adjustments (a)
|
$
|
(
|
)
|
$
|
|
|
$
|
(
|
)
|
|||
|
Pension-related adjustments
|
(
|
)
|
|
|
(
|
)
|
||||||
|
Other comprehensive loss
|
(
|
)
|
|
|
(
|
)
|
||||||
|
Other comprehensive loss attributable to noncontrolling interests (b)
|
|
|
(
|
)
|
|
|
||||||
|
Other comprehensive loss attributable to Liberty Global shareholders
|
$
|
(
|
)
|
$
|
|
|
$
|
(
|
)
|
|||
II-200
LIBERTY GLOBAL PLC
Notes to Consolidated Financial Statements — (Continued)
December 31, 2016, 2015 and 2014
_______________
|
(a)
|
For additional information regarding reclassifications of foreign currency translation losses to earnings, see the consolidated statements of comprehensive earnings (loss) and note 5.
|
|
(b)
|
|
(
17
)
Commitments and Contingencies
Commitments
In the normal course of business, we have entered into agreements that commit our company to make cash payments in future periods with respect to network and connectivity commitments, programming contracts, purchases of customer premises and other equipment and services, non-cancellable operating leases and other items.
The following table sets forth the
U.S.
dollar equivalents of such commitments as of
December 31, 2016
:
|
|
Payments due during:
|
|
|||||||||||||||||||||||||
|
|
2017
|
2018
|
2019
|
2020
|
2021
|
Thereafter
|
Total
|
||||||||||||||||||||
|
|
in millions
|
||||||||||||||||||||||||||
|
Network and connectivity commitments
|
$
|
|
|
$
|
|
|
$
|
|
|
$
|
|
|
$
|
|
|
$
|
|
|
$
|
|
|
||||||
|
Programming commitments
|
|
|
|
|
|
|
|
|
|
|
|
|
|
|
|||||||||||||
|
Purchase commitments
|
|
|
|
|
|
|
|
|
|
|
|
|
|
|
|||||||||||||
|
Operating leases
|
|
|
|
|
|
|
|
|
|
|
|
|
|
|
|||||||||||||
|
Other commitments
|
|
|
|
|
|
|
|
|
|
|
|
|
|
|
|||||||||||||
|
Total (a)
|
$
|
|
|
$
|
|
|
$
|
|
|
$
|
|
|
$
|
|
|
$
|
|
|
$
|
|
|
||||||
_______________
|
(a)
|
|
Network and connectivity commitments include (i)
Telenet
’s commitments for certain operating costs associated with its leased network, (ii) commitments associated with our
MVNO
agreements and (iii) service commitments associated with our network extension projects, primarily in the
U.K.
Telenet
’s commitments for certain operating costs are subject to adjustment based on changes in the network operating costs incurred by
Telenet
with respect to its own networks. These potential adjustments are not subject to reasonable estimation and, therefore, are not included in the above table. The amounts reflected in the above table with respect to certain of our
MVNO
commitments represent fixed minimum amounts payable under these agreements and, therefore, may be significantly less than the actual amounts we ultimately pay in these periods.
Programming commitments consist of obligations associated with certain of our programming, studio output and sports rights contracts that are enforceable and legally binding on us as we have agreed to pay minimum fees without regard to (i) the actual number of subscribers to the programming services, (ii) whether we terminate service to a portion of our subscribers or dispose of a portion of our distribution systems or (iii) whether we discontinue our premium sports services. In addition, programming commitments do not include increases in future periods associated with contractual inflation or other price adjustments that are not fixed. Accordingly, the amounts reflected in the above table with respect to these contracts are significantly less than the amounts we expect to pay in these periods under these contracts. Historically, payments to programming vendors have represented a significant portion of our operating costs, and we expect that this will continue to be the case in future periods. In this regard, our total programming and copyright costs aggregated
$
2,449.4
million
(including
$
2,104.5
million
for the
Liberty Global Group
and
$
344.9
million
for the
LiLAC Group
),
$
2,313.9
million
(including
$
2,066.6
million
for the
Liberty Global Group
and
$
247.3
million
for the
LiLAC Group
) and
$
2,160.0
million
(including
$
1,928.0
million
for the
Liberty Global Group
and
$
232.0
million
for the
LiLAC Group
) during
2016
,
2015
and
2014
, respectively.
II-201
LIBERTY GLOBAL PLC
Notes to Consolidated Financial Statements — (Continued)
December 31, 2016, 2015 and 2014
Purchase commitments include unconditional and legally binding obligations related to (i) the purchase of customer premises and other equipment and (ii) certain service-related commitments, including call center, information technology and maintenance services.
Commitments arising from acquisition agreements are not reflected in the above table. For information regarding our commitments under acquisition agreements, see note
4
.
In addition to the commitments set forth in the table above, we have significant commitments under (i) derivative instruments and (ii) defined benefit plans and similar agreements, pursuant to which we expect to make payments in future periods. For information regarding our derivative instruments, including the net cash paid or received in connection with these instruments during
2016
,
2015
and
2014
, see note
7
. For information regarding our defined benefit plans, see note
15
.
We also have commitments pursuant to agreements with, and obligations imposed by, franchise authorities and municipalities, which may include obligations in certain markets to move aerial cable to underground ducts or to upgrade, rebuild or extend portions of our broadband communication systems. Such amounts are not included in the above table because they are not fixed or determinable.
Rental expense under non-cancellable operating lease arrangements amounted to
$
250.6
million
(including
$
205.2
million
for the
Liberty Global Group
and
$
45.4
million
for the
LiLAC Group
),
$
219.0
million
(including
$
204.7
million
for the
Liberty Global Group
and
$
14.3
million
for the
LiLAC Group
) and
$
268.3
million
(including
$
252.0
million
for the
Liberty Global Group
and
$
16.3
million
for the
LiLAC Group
) during
2016
,
2015
and
2014
, respectively. It is expected that in the normal course of business, operating leases that expire generally will be renewed or replaced by similar leases.
We have established various defined contribution benefit plans for our and our subsidiaries’ employees. Our aggregate expense for matching contributions under the various defined contribution employee benefit plans was
$
76.8
million
(including
$
70.4
million
for the
Liberty Global Group
and
$
6.4
million
for the
LiLAC Group
),
$
76.7
million
(including
$
75.0
million
for the
Liberty Global Group
and
$
1.7
million
for the
LiLAC Group
) and
$
63.2
million
(including
$
61.7
million
for the
Liberty Global Group
and
$
1.5
million
for the
LiLAC Group
) during
2016
,
2015
and
2014
, respectively.
Guarantees and Other Credit Enhancements
In the ordinary course of business, we may provide (i) indemnifications to our lenders, our vendors and certain other parties and (ii) performance and/or financial guarantees to local municipalities, our customers and vendors. Historically, these arrangements have not resulted in our company making any material payments and we do not believe that they will result in material payments in the future.
Legal and Regulatory Proceedings and Other Contingencies
Interkabel Acquisition.
On
November 26, 2007
,
Telenet
and the
PICs
announced a non-binding agreement-in-principle to transfer the analog and digital television activities of the
PICs
, including all existing subscribers to
Telenet
. Subsequently,
Telenet
and the
PICs
entered into a binding agreement (the
2008 PICs Agreement
), which closed effective
October 1, 2008
. Beginning in December
2007
, Proximus NV/SA (
Proximus
), the incumbent telecommunications operator in Belgium, instituted several proceedings seeking to block implementation of these agreements. Proximus lodged summary proceedings with the President of the Court of First Instance of Antwerp to obtain a provisional injunction preventing the
PICs
from effecting the agreement-in-principle and initiated a civil procedure on the merits claiming the annulment of the agreement-in-principle. In March
2008
, the President of the Court of First Instance of Antwerp ruled in favor of
Proximus
in the summary proceedings, which ruling was overturned by the Court of Appeal of Antwerp in June
2008
.
Proximus
brought this appeal judgment before the Cour de Cassation (the
Belgian Supreme Court
), which confirmed the appeal judgment in September 2010. On
April 6, 2009
, the Court of First Instance of Antwerp ruled in favor of the
PICs
and
Telenet
in the civil procedure on the merits, dismissing
Proximus
’s request for the rescission of the agreement-in-principle and the
2008 PICs Agreement
. On
June 12, 2009
,
Proximus
appealed this judgment with the Court of Appeal of Antwerp. In this appeal,
Proximus
is now also seeking compensation for damages should the
2008 PICs Agreement
not be rescinded. While these proceedings were suspended indefinitely, other proceedings were initiated, which resulted in a ruling by the Belgian Council of State in May 2014 annulling (i) the decision of the
PICs
not to organize a public market consultation and (ii) the decision from the
PICs
’ board of directors to approve the
2008 PICs Agreement
. In December 2015,
Proximus
resumed the civil proceedings pending with the Court of Appeal of Antwerp seeking to have the
2008 PICs Agreement
annulled and claiming damages of
€
1.4
billion
(
$
1.5
billion
).
II-202
LIBERTY GLOBAL PLC
Notes to Consolidated Financial Statements — (Continued)
December 31, 2016, 2015 and 2014
Telenet
intends to defend itself vigorously in the resumed proceedings and does not expect an outcome before the end of 2017. No assurance can be given as to the outcome of these or other proceedings. However, an unfavorable outcome of existing or future proceedings could potentially lead to the annulment of the
2008 PICs Agreement
and/or to an obligation of
Telenet
to pay compensation for damages, subject to the relevant provisions of the
2008 PICs Agreement
, which stipulate that
Telenet
is responsible for damages in excess of
€
20.0
million
(
$
21.1
million
). We do not expect the ultimate resolution of this matter to have a material impact on our results of operations, cash flows or financial position.
No
amounts have been accrued by us with respect to this matter as the likelihood of loss is not considered to be probable.
Deutsche Telekom
Litigation.
On December 28, 2012,
Unitymedia
filed a lawsuit against
Deutsche Telekom
in which
Unitymedia
asserts that it pays excessive prices for the co-use of
Deutsche Telekom
’s cable ducts in
Unitymedia
’s footprint. The Federal Network Agency approved rates for the co-use of certain ducts of
Deutsche Telekom
in March 2011. Based in part on these approved rates,
Unitymedia
is seeking a reduction of the annual lease fees (approximately
€
76
million
(
$
80
million
) for 2012) by approximately
two-thirds
and the return of similarly calculated overpayments from 2009 through the ultimate settlement date, plus accrued interest. In October 2016, the first instance court dismissed this action. We have appealed this decision, however, the resolution of this matter may take several years and no assurance can be given that
Unitymedia
’s claims will be successful. Any recovery by
Unitymedia
will not be reflected in our consolidated financial statements until such time as the final disposition of this matter has been reached.
Liberty Puerto Rico
Matter.
In November 2012, we completed a business combination that resulted in, among other matters, the combination of our then operating subsidiary in Puerto Rico with San Juan Cable, LLC dba OneLink Communications (
OneLink
). In connection with this transaction (the
OneLink Acquisition
),
Liberty Puerto Rico
, as the surviving entity, became a party to certain claims previously asserted by the incumbent telephone operator (
PRTC
) against
OneLink
based on alleged conduct of
OneLink
that occurred prior to the
OneLink Acquisition
(the
PRTC Claim
). The
PRTC Claim
includes an allegation that
OneLink
acted in an anticompetitive manner in connection with a series of legal and regulatory proceedings it initiated against PRTC in Puerto Rico beginning in 2009. In March 2014, a separate class action claim was filed in Puerto Rico (the
Class Action Claim
) containing allegations substantially similar to those asserted in the
PRTC Claim
, but alleging ongoing injury on behalf of a consumer class (as opposed to harm to a competitor). In July 2016, the judge presiding over the
PRTC Claim
in the United States District Court for the District of Maine (the
District Court
) granted
OneLink
summary judgment that dismissed the
PRTC Claim
in its entirety. PRTC filed an appeal of the District Court’s decision with the United States First Circuit Court of Appeals. Based on our assessment of the
PRTC Claim
on appeal and the
Class Action Claim
, we have determined that the possibility of loss is remote. As a result, we will not report on this matter in future filings. In connection with the July 2016 decision, we have released our previously-recorded provision and related indemnification asset associated with the
PRTC Claim
, resulting in a
$
5.1
million
reduction to our SG&A expenses during the third quarter of 2016. In December 2016, we received
$
7.5
million
related to the reimbursement of legal fees we incurred in connection with the
PRTC Claim
, resulting in a reduction to our SG&A expenses during the fourth quarter of 2016 and the release of the former owners of
OneLink
from their obligations under the indemnification agreement entered into in connection with the
OneLink Acquisition
.
Belgium Regulatory Developments.
In December 2010, the Belgisch Instituut voor Post en Telecommunicatie and the regional regulators for the media sectors (together, the
Belgium Regulatory Authorities
) published their respective draft decisions reflecting the results of their joint analysis of the broadcasting market in Belgium.
The
Belgium Regulatory Authorities
adopted a final decision on July 1, 2011 (the
July 2011 Decision
) with some minor revisions. The regulatory obligations imposed by the
July 2011 Decision
include (i) an obligation to make a resale offer at “retail minus’’ of the cable analog package available to third party operators (including
Proximus
), (ii) an obligation to grant third-party operators (except
Proximus
) access to digital television platforms (including the basic digital video package) at “retail minus,” and (iii) an obligation to make a resale offer at “retail minus’’ of broadband internet access available to beneficiaries of the digital television access obligation that wish to offer bundles of digital video and broadband internet services to their customers (except
Proximus
).
In February 2012,
Telenet
submitted draft reference offers regarding the obligations described above, and the
Belgium Regulatory Authorities
published the final decision on September 9, 2013.
Telenet
has implemented the access obligations as described in its reference offers and, on March 1, 2016, Orange Belgium NV (
Orange Belgium
), formerly known as Mobistar SA, launched a commercial offer combining a cable TV package and broadband internet access for certain of their mobile customers. In addition, as a result of the November 2014 decision by the Brussels Court of Appeal described below, on November 14, 2014,
Proximus
submitted a request to Telenet to commence access negotiations.
Telenet
contests this request and has asked the
Belgium
II-203
LIBERTY GLOBAL PLC
Notes to Consolidated Financial Statements — (Continued)
December 31, 2016, 2015 and 2014
Regulatory Authorities
to assess the reasonableness of the
Proximus
request. The timing for a decision regarding this assessment by the
Belgium Regulatory Authorities
is not known.
On December 14, 2015, the
Belgium Regulatory Authorities
published a draft decision, which amended previously-issued decisions and sets forth the “retail minus” tariffs of minus
26
%
for basic television (basic analog and digital video package) and minus
18
%
for the bundle of basic television and broadband internet services during an initial
two
-year period. Following this
two
-year period, the tariffs would change to minus
15
%
and
7
%
, respectively. The draft decision was notified to the European Commission and a final decision was adopted on February 19, 2016. A “retail minus” method of pricing involves a wholesale tariff calculated as the retail price for the offered service by
Telenet
, excluding
VAT
and copyrights, and further deducting the retail costs avoided by offering the wholesale service (such as costs for billing, franchise, consumer service, marketing and sales).
Telenet
filed an appeal against the
July 2011 Decision
with the Brussels Court of Appeal. On November 12, 2014, the Brussels Court of Appeal rejected
Telenet
’s appeal of the
July 2011 Decision
and accepted
Proximus
’s claim that
Proximus
should be allowed access to
Telenet
’s, among other operators, digital television platform and the resale of bundles of digital video and broadband internet services. On November 30, 2015,
Telenet
filed an appeal of this decision with the
Belgian Supreme Court
. In 2014,
Telenet
and wireless operator
Orange Belgium
each filed an appeal with the Brussels Court of Appeal against the initial retail minus decisions. These appeals are still pending. On April 25, 2016, Telenet also filed an appeal with the Brussels Court of Appeal challenging the February 19, 2016 retail minus decision. There can be no certainty that
Telenet
’s appeals will be successful.
The
July 2011 Decision
aims to, and in its application may, strengthen
Telenet
’s competitors by granting them resale access to
Telenet
’s network to offer competing products and services notwithstanding
Telenet
’s substantial historical financial outlays in developing the infrastructure. In addition, any resale access granted to competitors could (i) limit the bandwidth available to
Telenet
to provide new or expanded products and services to the customers served by its network and (ii) adversely impact
Telenet
’s ability to maintain or increase its revenue and cash flows. The extent of any such adverse impacts ultimately will be dependent on the extent that competitors take advantage of the resale access ultimately afforded to
Telenet
’s network and other competitive factors or market developments.
Financial Transactions Tax.
Certain countries in the European Union (
E.U.
), including Germany, Austria and Slovakia, are participating in an enhanced cooperation procedure to introduce a financial transactions tax (the
FTT
). Under the draft language of the
FTT
proposal, a wide range of financial transactions could be taxed at rates of at least
0.01
%
for derivative transactions based on the notional amount and
0.1
%
for other covered financial transactions based on the underlying transaction price. Each of the individual countries would be permitted to determine an exact rate, which could be higher than the proposed rates of
0.01
%
and
0.1
%
. Any implementation of the
FTT
could have a global impact because it would apply to all financial transactions where a financial institution is involved (including unregulated entities that engage in certain types of covered activity) and either of the parties (whether the financial institution or its counterparty) is in one of the participating countries. Although there continues to be ongoing discussions in the relevant countries around the
FTT
, uncertainty remains as to if and when the
FTT
will be implemented and the breadth of its application. Based on our understanding of the current status of the potential
FTT
, we do not expect that any implementation of the
FTT
would occur before 2018. Any imposition of the
FTT
could increase banking fees and introduce taxes on internal transactions that we currently perform. Due to the uncertainty regarding the
FTT
, we are currently unable to estimate the financial impact that the
FTT
could have on our results of operations, cash flows or financial position.
Virgin Media VAT
Matters.
Virgin Media
’s application of
VAT
with respect to certain revenue generating activities has been challenged by the
U.K.
tax authorities.
Virgin Media
has estimated its maximum exposure in the event of an unfavorable outcome to be
£
46.6
million
(
$
57.5
million
) as of
December 31, 2016
.
No
portion of this exposure has been accrued by
Virgin Media
as the likelihood of loss is not considered to be probable. A court hearing was held at the end of September 2014 in relation to the
U.K.
tax authorities’ challenge and the timing of the court’s decision is uncertain
.
On March 19, 2014, the
U.K.
government announced a change in legislation with respect to the charging of
VAT
in connection with prompt payment discounts such as those that we offer to our fixed-line telephony customers. This change, which took effect on May 1, 2014, impacted our company and some of our competitors. The
U.K.
tax authority issued a decision in the fourth quarter of 2015 challenging our application of the prompt payment discount rules prior to the May 1, 2014 change in legislation. We have appealed this decision. As part of the appeal process, we were required to make aggregate payments of
£
67.0
million
(
$
99.1
million
at the respective transaction dates), which included the challenged amount of
£
63.7
million
and related interest of
£
3.3
million
. The aggregate amount paid does not include penalties, which could be significant in the unlikely event that penalties were to be assessed. This matter will likely be subject to court proceedings that could delay the ultimate resolution for an extended period of
II-204
LIBERTY GLOBAL PLC
Notes to Consolidated Financial Statements — (Continued)
December 31, 2016, 2015 and 2014
time.
No
portion of this potential exposure has been accrued by our company as the likelihood of loss is not considered to be probable.
Hungary VAT Matter.
In February 2016, our
DTH
operations in Luxembourg received a second instance decision from the Hungarian tax authorities as a result of an audit with respect to
VAT
payments that the Hungarian tax authorities conducted for the years 2010 through 2012. The Hungarian tax authorities assessed our
DTH
operations with an obligation to pay
VAT
for the years audited of HUF
5,413.2
million
(
$
18.5
million
), excluding interest and penalties, which could be significant. We believe that our
DTH
operations have operated in compliance with all applicable rules, regulations and interpretations thereof, including a binding tax ruling that we received from the Hungarian government in 2010. In October 2016, a Budapest court disagreed with the tax authorities and dismissed the assessment. On February 2, 2017, the Hungarian tax authorities appealed the Budapest court decision to the Hungarian Supreme Court.
No
portion of this exposure has been accrued by us as the likelihood of loss is not considered to be probable.
Other Regulatory Issues.
Video distribution, broadband internet, fixed-line telephony, mobile and content businesses are regulated in each of the countries in which we operate. The scope of regulation varies from country to country, although in some significant respects regulation in European markets is harmonized under the regulatory structure of the
E.U.
Adverse regulatory developments could subject our businesses to a number of risks. Regulation, including conditions imposed on us by competition or other authorities as a requirement to close acquisitions or dispositions, could limit growth, revenue and the number and types of services offered and could lead to increased operating costs and property and equipment additions. In addition, regulation may restrict our operations and subject them to further competitive pressure, including pricing restrictions, interconnect and other access obligations, and restrictions or controls on content, including content provided by third parties. Failure to comply with current or future regulation could expose our businesses to various penalties.
We have been notified of a fourfold increase in the rateable value of our network and other assets in the
U.K.
that is scheduled to become effective on April 1, 2017. This increase will affect the amount we pay for network infrastructure charges as the annual amount payable to the
U.K.
government is calculated by applying a percentage multiplier to the rateable value of assets. This proposed change, together with a similar proposed change in Ireland, would result in significant increases in our network infrastructure charges. We estimate that the aggregate amount of these increases will be approximately
£
30
million
(
$
37
million
) during 2017 and will build to a maximum aggregate increase of up to
£
120
million
(
$
148
million
) in 2021. We believe that the proposed increases are excessive, and we will challenge the underlying methodology and assumptions.
(
18
)
Segment Reporting
We generally identify our reportable segments as those consolidated subsidiaries that represent
10
%
or more of our revenue,
Adjusted OIBDA
(as defined below) or total assets. In certain cases, we may elect to include an operating segment in our segment disclosure that does not meet the above-described criteria for a reportable segment. We evaluate performance and make decisions about allocating resources to our operating segments based on financial measures such as revenue and
Adjusted OIBDA
. In addition, we review non-financial measures such as subscriber growth, as appropriate.
Adjusted operating income before depreciation and amortization (
Adjusted OIBDA
) is the primary measure used by our chief operating decision maker to evaluate segment operating performance.
Adjusted OIBDA
is also a key factor that is used by our internal decision makers to (i) determine how to allocate resources to segments and (ii) evaluate the effectiveness of our management for purposes of annual and other incentive compensation plans. As we use the term,
Adjusted OIBDA
is defined as operating income before depreciation and amortization, share-based compensation, provisions and provision releases related to significant litigation and impairment, restructuring and other operating items. Other operating items include (a) gains and losses on the disposition of long-lived assets, (b) third-party costs directly associated with successful and unsuccessful acquisitions and
II-205
LIBERTY GLOBAL PLC
Notes to Consolidated Financial Statements — (Continued)
December 31, 2016, 2015 and 2014
dispositions, including legal, advisory and due diligence fees, as applicable, and (c) other acquisition-related items, such as gains and losses on the settlement of contingent consideration. Our internal decision makers believe
Adjusted OIBDA
is a meaningful measure because it represents a transparent view of our recurring operating performance that is unaffected by our capital structure and allows management to (1) readily view operating trends, (2) perform analytical comparisons and benchmarking between segments and (3) identify strategies to improve operating performance in the different countries in which we operate. A reconciliation of total segment
Adjusted OIBDA
to our earnings (loss) from continuing operations before income taxes is presented below.
As of
December 31, 2016
, our reportable segments are as follows:
|
•
|
European Division
:
|
|
•
|
U.K./Ireland
|
|
•
|
Belgium
|
|
•
|
The Netherlands (through the completion of the
Dutch JV Transaction
)
|
|
•
|
Germany
|
|
•
|
Switzerland/Austria
|
|
•
|
Central and Eastern Europe
|
|
•
|
LiLAC Division:
|
|
•
|
CWC
|
|
•
|
Chile
|
|
•
|
Puerto Rico
|
On
December 31, 2016
, we completed the
Dutch JV Transaction
, whereby we contributed
Ziggo Group Holding
(including
Ziggo Sport
) to the
Dutch JV
. Accordingly, our results of operations include the operations of
Ziggo Group Holding
and
Ziggo Sport
for all periods presented while our
December 31, 2016
consolidated balance sheet excludes such entities. In our segment presentation,
Ziggo Group Holding
(exclusive of Ziggo Sport, which became a subsidiary of
Ziggo Group Holding
in October 2016) is separately reported as “
The Netherlands
” and
Ziggo Sport
is included in our “
Corporate and Other
” category.
Beginning with the first quarter of 2017, we expect to present the
Dutch JV
as a reportable segment. For additional information regarding the
Dutch JV Transaction
, see note
5
to our consolidated financial statements.
All of the reportable segments set forth above derive their revenue primarily from residential and
B2B
services, including video, broadband internet and fixed-line telephony services and, with the exception of Puerto Rico, mobile services. At
December 31, 2016
, our operations in the
European Division
provided residential and
B2B
services in
11
European countries and
DTH
services to customers in the Czech Republic, Hungary, Romania and Slovakia through a Luxembourg-based organization that we refer to as “
UPC DTH
.” In addition to
UPC DTH
, our Central and Eastern Europe segment includes our broadband communications operations in the Czech Republic, Hungary, Poland, Romania and Slovakia. The
European Division
’s central and other category includes (i) costs associated with certain centralized functions, including billing systems, network operations, technology, marketing, facilities, finance and other administrative functions, and (ii) intersegment eliminations within the
European Division
. In addition, our
LiLAC Division
provides residential and
B2B
services in (a)
18
countries, all but
one
of which are located in Latin America and the Caribbean, through
CWC
, (b) Chile through VTR and (c) Puerto Rico through
Liberty Puerto Rico
.
CWC
also provides (1)
B2B
services in certain other countries in Latin America and the Caribbean and (2) wholesale services over its sub-sea and terrestrial networks that connect over
30
markets in that region. The corporate and other category for the
Liberty Global Group
includes less significant consolidated operating segments that provide programming and other services, including
Ziggo Sport
through December 31, 2016
. Intersegment eliminations primarily represent the elimination of intercompany transactions between our broadband communications and programming operations. Inter-group eliminations represent the elimination of intercompany transactions between the
Liberty Global Group
and the
LiLAC Group
.
Performance Measures of Our Reportable Segments
The amounts presented below represent
100
%
of each of our reportable segment’s revenue and
Adjusted OIBDA
. As we have the ability to control
Telenet
,
Liberty Puerto Rico
and certain subsidiaries of
CWC
that are not wholly owned, we consolidate
100
%
of the revenue and expenses of these entities in our consolidated statements of operations despite the fact that third parties own significant interests in these entities. The noncontrolling owners’ interests in the operating results of
Telenet
,
Liberty Puerto
II-206
LIBERTY GLOBAL PLC
Notes to Consolidated Financial Statements — (Continued)
December 31, 2016, 2015 and 2014
Rico
, certain subsidiaries of
CWC
and other less significant majority-owned subsidiaries are reflected in net earnings or loss attributable to noncontrolling interests in our consolidated statements of operations. For additional information, see note
1
.
|
Year ended December 31,
|
|||||||||||||||||||||||
|
|
2016
|
2015
|
2014
|
||||||||||||||||||||
|
|
Revenue
|
Adjusted OIBDA
|
Revenue
|
Adjusted OIBDA
|
Revenue
|
Adjusted OIBDA
|
|||||||||||||||||
|
|
in millions
|
||||||||||||||||||||||
|
Liberty Global Group:
|
|||||||||||||||||||||||
|
European Division:
|
|||||||||||||||||||||||
|
U.K./Ireland
|
$
|
|
|
$
|
|
|
$
|
|
|
$
|
|
|
$
|
|
|
$
|
|
|
|||||
|
Belgium (a)
|
|
|
|
|
|
|
|
|
|
|
|
|
|||||||||||
|
The Netherlands (b)
|
|
|
|
|
|
|
|
|
|
|
|
|
|||||||||||
|
Germany
|
|
|
|
|
|
|
|
|
|
|
|
|
|||||||||||
|
Switzerland/Austria
|
|
|
|
|
|
|
|
|
|
|
|
|
|||||||||||
|
Total Western Europe
|
|
|
|
|
|
|
|
|
|
|
|
|
|||||||||||
|
Central and Eastern Europe
|
|
|
|
|
|
|
|
|
|
|
|
|
|||||||||||
|
Central and other
|
(
|
)
|
(
|
)
|
(
|
)
|
(
|
)
|
(
|
)
|
(
|
)
|
|||||||||||
|
Total European Division
|
|
|
|
|
|
|
|
|
|
|
|
|
|||||||||||
|
Corporate and other
|
|
|
(
|
)
|
|
|
(
|
)
|
|
|
(
|
)
|
|||||||||||
|
Intersegment eliminations (c)
|
(
|
)
|
|
|
(
|
)
|
|
|
(
|
)
|
|
|
|||||||||||
|
Total Liberty Global Group
|
|
|
|
|
|
|
|
|
|
|
|
|
|||||||||||
|
LiLAC Group:
|
|||||||||||||||||||||||
|
LiLAC Division:
|
|||||||||||||||||||||||
|
CWC (d)
|
|
|
|
|
|
|
|
|
|
|
|
|
|||||||||||
|
Chile
|
|
|
|
|
|
|
|
|
|
|
|
|
|||||||||||
|
Puerto Rico (e)
|
|
|
|
|
|
|
|
|
|
|
|
|
|||||||||||
|
Total LiLAC Division
|
|
|
|
|
|
|
|
|
|
|
|
|
|||||||||||
|
Intersegment eliminations
|
(
|
)
|
|
|
|
|
|
|
|
|
|
|
|||||||||||
|
Corporate
|
|
|
(
|
)
|
|
|
(
|
)
|
|
|
(
|
)
|
|||||||||||
|
Total LiLAC Group
|
|
|
|
|
|
|
|
|
|
|
|
|
|||||||||||
|
Total
|
$
|
|
|
$
|
|
|
$
|
|
|
$
|
|
|
$
|
|
|
$
|
|
|
|||||
_______________
|
(a)
|
The amounts presented for 2016 include the post-acquisition revenue and
Adjusted OIBDA
of
BASE
, which was acquired on February 11, 2016.
|
|
(b)
|
The amounts presented for 2014 exclude the pre-acquisition revenue and
Adjusted OIBDA
of
Ziggo
, which was acquired on November 11, 2014.
|
|
(c)
|
Amounts are primarily related to transactions between our
European Division
and our programming operations.
|
|
(d)
|
The amounts presented for 2016 reflect the post-acquisition revenue and
Adjusted OIBDA
of
CWC
, which was acquired on May 16, 2016.
|
|
(e)
|
The amounts presented for 2015 exclude the pre-acquisition revenue and
Adjusted OIBDA
of Choice, which was acquired on June 3, 2015.
|
II-207
LIBERTY GLOBAL PLC
Notes to Consolidated Financial Statements — (Continued)
December 31, 2016, 2015 and 2014
|
|
Year ended December 31,
|
||||||||||
|
|
2016
|
2015
|
2014
|
||||||||
|
|
in millions
|
||||||||||
|
Total segment Adjusted OIBDA from continuing operations
|
$
|
|
|
$
|
|
|
$
|
|
|
||
|
Share-based compensation expense
|
(
|
)
|
(
|
)
|
(
|
)
|
|||||
|
Depreciation and amortization
|
(
|
)
|
(
|
)
|
(
|
)
|
|||||
|
Impairment, restructuring and other operating items, net
|
(
|
)
|
(
|
)
|
(
|
)
|
|||||
|
Operating income
|
|
|
|
|
|
|
|||||
|
Interest expense
|
(
|
)
|
(
|
)
|
(
|
)
|
|||||
|
Realized and unrealized gains on derivative instruments, net
|
|
|
|
|
|
|
|||||
|
Foreign currency transaction losses, net
|
(
|
)
|
(
|
)
|
(
|
)
|
|||||
|
Realized and unrealized gains (losses) due to changes in fair values of certain investments and debt, net
|
(
|
)
|
|
|
|
|
|||||
|
Losses on debt modification and extinguishment, net
|
(
|
)
|
(
|
)
|
(
|
)
|
|||||
|
Gain on Dutch JV Transaction
|
|
|
|
|
|
|
|||||
|
Other income (expense), net
|
|
|
(
|
)
|
(
|
)
|
|||||
|
Earnings (loss) from continuing operations before income taxes
|
$
|
|
|
$
|
(
|
)
|
$
|
(
|
)
|
||
II-208
LIBERTY GLOBAL PLC
Notes to Consolidated Financial Statements — (Continued)
December 31, 2016, 2015 and 2014
Balance Sheet Data of our Reportable Segments
|
Long-lived assets
|
Total assets
|
||||||||||||||
|
|
December 31,
|
December 31,
|
|||||||||||||
|
|
2016
|
2015
|
2016
|
2015
|
|||||||||||
|
|
in millions
|
||||||||||||||
|
Liberty Global Group:
|
|||||||||||||||
|
European Division:
|
|||||||||||||||
|
U.K./Ireland
|
$
|
|
|
$
|
|
|
$
|
|
|
$
|
|
|
|||
|
Belgium
|
|
|
|
|
|
|
|
|
|||||||
|
The Netherlands
|
|
|
|
|
|
|
|
|
|||||||
|
Germany
|
|
|
|
|
|
|
|
|
|||||||
|
Switzerland/Austria
|
|
|
|
|
|
|
|
|
|||||||
|
Total Western Europe
|
|
|
|
|
|
|
|
|
|||||||
|
Central and Eastern Europe
|
|
|
|
|
|
|
|
|
|||||||
|
Central and other (a)
|
|
|
|
|
|
|
|
|
|||||||
|
Total European Division
|
|
|
|
|
|
|
|
|
|||||||
|
Corporate and other
|
|
|
|
|
|
|
|
|
|||||||
|
Total Liberty Global Group
|
|
|
|
|
|
|
|
|
|||||||
|
LiLAC Group:
|
|||||||||||||||
|
LiLAC Division:
|
|||||||||||||||
|
CWC
|
|
|
|
|
|
|
|
|
|||||||
|
Chile
|
|
|
|
|
|
|
|
|
|||||||
|
Puerto Rico
|
|
|
|
|
|
|
|
|
|||||||
|
Total LiLAC Division
|
|
|
|
|
|
|
|
|
|||||||
|
Corporate
|
|
|
|
|
|
|
|
|
|||||||
|
Total LiLAC Group
|
|
|
|
|
|
|
|
|
|||||||
|
Inter-group eliminations
|
|
|
|
|
(
|
)
|
(
|
)
|
|||||||
|
Total
|
$
|
|
|
$
|
|
|
$
|
|
|
$
|
|
|
|||
_______________
|
(a)
|
|
II-209
LIBERTY GLOBAL PLC
Notes to Consolidated Financial Statements — (Continued)
December 31, 2016, 2015 and 2014
Property and Equipment Additions of our Reportable Segments
|
|
Year ended December 31,
|
||||||||||
|
|
2016
|
2015
|
2014
|
||||||||
|
|
in millions
|
||||||||||
|
Liberty Global Group:
|
|||||||||||
|
European Division:
|
|||||||||||
|
U.K./Ireland
|
$
|
|
|
$
|
|
|
$
|
|
|
||
|
Belgium (a)
|
|
|
|
|
|
|
|||||
|
The Netherlands (b)
|
|
|
|
|
|
|
|||||
|
Germany
|
|
|
|
|
|
|
|||||
|
Switzerland/Austria
|
|
|
|
|
|
|
|||||
|
Total Western Europe
|
|
|
|
|
|
|
|||||
|
Central and Eastern Europe
|
|
|
|
|
|
|
|||||
|
Central and other
|
|
|
|
|
|
|
|||||
|
Total European Division
|
|
|
|
|
|
|
|||||
|
Corporate and other
|
|
|
|
|
|
|
|||||
|
Total Liberty Global Group
|
|
|
|
|
|
|
|||||
|
LiLAC Group:
|
|||||||||||
|
CWC (c)
|
|
|
|
|
|
|
|||||
|
Chile
|
|
|
|
|
|
|
|||||
|
Puerto Rico (d)
|
|
|
|
|
|
|
|||||
|
Total LiLAC Group
|
|
|
|
|
|
|
|||||
|
Total property and equipment additions
|
|
|
|
|
|
|
|||||
|
Assets acquired under capital-related vendor financing arrangements
|
(
|
)
|
(
|
)
|
(
|
)
|
|||||
|
Assets acquired under capital leases
|
(
|
)
|
(
|
)
|
(
|
)
|
|||||
|
Changes in current liabilities related to capital expenditures
|
(
|
)
|
(
|
)
|
(
|
)
|
|||||
|
Total capital expenditures
|
$
|
|
|
$
|
|
|
$
|
|
|
||
_______________
|
(a)
|
The amount presented at December 31, 2016 includes the post-acquisition property and equipment additions of
BASE
, which was acquired on February 11, 2016.
|
|
(b)
|
The amount presented at December 31, 2014 excludes the pre-acquisition property and equipment additions of
Ziggo
, which was acquired on November 11, 2014.
|
|
(c)
|
The amount presented at December 31, 2016 reflects the post-acquisition property and equipment additions of
CWC
, which was acquired on May 16, 2016.
|
|
(d)
|
The amount presented at December 31, 2015 excludes the pre-acquisition property and equipment additions of
Choice
, which was acquired on June 3, 2015.
|
II-210
LIBERTY GLOBAL PLC
Notes to Consolidated Financial Statements — (Continued)
December 31, 2016, 2015 and 2014
Revenue by Major Category
|
|
Year ended December 31,
|
||||||||||
|
|
2016
|
2015
|
2014
|
||||||||
|
|
in millions
|
||||||||||
|
Subscription revenue (a):
|
|||||||||||
|
Video
|
$
|
|
|
$
|
|
|
$
|
|
|
||
|
Broadband internet
|
|
|
|
|
|
|
|||||
|
Fixed-line telephony
|
|
|
|
|
|
|
|||||
|
Cable subscription revenue
|
|
|
|
|
|
|
|||||
|
Mobile (b)
|
|
|
|
|
|
|
|||||
|
Total subscription revenue
|
|
|
|
|
|
|
|||||
|
B2B revenue (c)
|
|
|
|
|
|
|
|||||
|
Other revenue (b) (d)
|
|
|
|
|
|
|
|||||
|
Total
|
$
|
|
|
$
|
|
|
$
|
|
|
||
_______________
|
(a)
|
Subscription revenue includes amounts received from subscribers for ongoing services, excluding installation fees and late fees. Subscription revenue from subscribers who purchase bundled services at a discounted rate is generally allocated proportionally to each service based on the standalone price for each individual service. As a result, changes in the standalone pricing of our cable and mobile products or the composition of bundles can contribute to changes in our product revenue categories from period to period.
|
|
(b)
|
Mobile subscription revenue excludes mobile interconnect revenue of
$
|
|
(c)
|
B2B
revenue includes revenue from business broadband internet, video, voice, mobile and data services offered to medium to large enterprises and, on a wholesale basis, to other operators. We also provide services to certain small or home office (
SOHO
) subscribers.
SOHO
subscribers pay a premium price to receive expanded service levels along with video, broadband internet, fixed-line telephony or mobile services that are the same or similar to the mass marketed products offered to our residential subscribers. Revenue from
SOHO
subscribers, which is included in subscription revenue, aggregated
$
|
|
(d)
|
Other revenue includes, among other items,
interconnect fees, mobile handset sales, channel carriage fees and installation fees
.
|
II-211
LIBERTY GLOBAL PLC
Notes to Consolidated Financial Statements — (Continued)
December 31, 2016, 2015 and 2014
Geographic Segments
|
|
Year ended December 31,
|
||||||||||
|
|
2016
|
2015
|
2014
|
||||||||
|
|
in millions
|
||||||||||
|
Liberty Global Group:
|
|||||||||||
|
European Division:
|
|||||||||||
|
U.K.
|
$
|
|
|
$
|
|
|
$
|
|
|
||
|
Belgium (a)
|
|
|
|
|
|
|
|||||
|
The Netherlands (b)
|
|
|
|
|
|
|
|||||
|
Germany
|
|
|
|
|
|
|
|||||
|
Switzerland
|
|
|
|
|
|
|
|||||
|
Ireland
|
|
|
|
|
|
|
|||||
|
Poland
|
|
|
|
|
|
|
|||||
|
Austria
|
|
|
|
|
|
|
|||||
|
Hungary
|
|
|
|
|
|
|
|||||
|
The Czech Republic
|
|
|
|
|
|
|
|||||
|
Romania
|
|
|
|
|
|
|
|||||
|
Slovakia
|
|
|
|
|
|
|
|||||
|
Other
|
|
|
|
|
|
|
|||||
|
Total European Division
|
|
|
|
|
|
|
|||||
|
Other, including intersegment eliminations
|
|
|
|
|
|
|
|||||
|
Total Liberty Global Group
|
|
|
|
|
|
|
|||||
|
LiLAC Group:
|
|||||||||||
|
LiLAC Division:
|
|||||||||||
|
CWC (c):
|
|||||||||||
|
Panama
|
|
|
|
|
|
|
|||||
|
Jamaica
|
|
|
|
|
|
|
|||||
|
Bahamas
|
|
|
|
|
|
|
|||||
|
Barbados
|
|
|
|
|
|
|
|||||
|
Trinidad and Tobago
|
|
|
|
|
|
|
|||||
|
Other (d)
|
|
|
|
|
|
|
|||||
|
Total CWC
|
|
|
|
|
|
|
|||||
|
Chile
|
|
|
|
|
|
|
|||||
|
Puerto Rico (e)
|
|
|
|
|
|
|
|||||
|
Total LiLAC Division
|
|
|
|
|
|
|
|||||
|
Intersegment eliminations
|
(
|
)
|
|
|
|
|
|||||
|
Total LiLAC Group
|
|
|
|
|
|
|
|||||
|
Total
|
$
|
|
|
$
|
|
|
$
|
|
|
||
|
(a)
|
The amount presented for 2016 includes the post-acquisition revenue of
BASE
, which was acquired on February 11, 2016.
|
|
(b)
|
The amount presented for 2014 excludes the pre-acquisition revenue of
Ziggo
, which was acquired on November 11, 2014.
|
II-212
LIBERTY GLOBAL PLC
Notes to Consolidated Financial Statements — (Continued)
December 31, 2016, 2015 and 2014
|
(c)
|
The amount presented for 2016 reflects the post-acquisition revenue of
CWC
, which was acquired on May 16, 2016. For each
CWC
jurisdiction, the amounts presented include (i) revenue from residential and
B2B
operations and (ii) revenue derived from wholesale network customers, as applicable.
|
|
(d)
|
The amount presented for 2016 relates to other countries in which
CWC
operates, which are primarily located in Latin America and the Caribbean, and includes (i) revenue from residential and
B2B
operations, (ii) revenue from wholesale network customers and (iii) intercompany eliminations.
|
|
(e)
|
The amount presented for 2015 excludes the pre-acquisition revenue of
Choice
, which was acquired on June 3, 2015.
|
II-213
LIBERTY GLOBAL PLC
Notes to Consolidated Financial Statements — (Continued)
December 31, 2016, 2015 and 2014
|
|
December 31,
|
||||||
|
|
2016
|
2015
|
|||||
|
|
in millions
|
||||||
|
Liberty Global Group:
|
|||||||
|
European Division:
|
|||||||
|
U.K.
|
$
|
|
|
$
|
|
|
|
|
Germany
|
|
|
|
|
|||
|
Belgium
|
|
|
|
|
|||
|
Switzerland
|
|
|
|
|
|||
|
Austria
|
|
|
|
|
|||
|
Poland
|
|
|
|
|
|||
|
Ireland
|
|
|
|
|
|||
|
The Czech Republic
|
|
|
|
|
|||
|
Hungary
|
|
|
|
|
|||
|
Romania
|
|
|
|
|
|||
|
Slovakia
|
|
|
|
|
|||
|
The Netherlands
|
|
|
|
|
|||
|
Other (a)
|
|
|
|
|
|||
|
Total European Division
|
|
|
|
|
|||
|
U.S. and other (b)
|
|
|
|
|
|||
|
Total Liberty Global Group
|
|
|
|
|
|||
|
LiLAC Group:
|
|||||||
|
CWC:
|
|||||||
|
Panama
|
|
|
|
|
|||
|
Networks (c)
|
|
|
|
|
|||
|
Trinidad and Tobago
|
|
|
|
|
|||
|
Jamaica
|
|
|
|
|
|||
|
Bahamas
|
|
|
|
|
|||
|
Barbados
|
|
|
|
|
|||
|
Other (d)
|
|
|
|
|
|||
|
Total CWC
|
|
|
|
|
|||
|
Puerto Rico
|
|
|
|
|
|||
|
Chile
|
|
|
|
|
|||
|
Corporate
|
|
|
|
|
|||
|
Total LiLAC Group
|
|
|
|
|
|||
|
Total
|
$
|
|
|
$
|
|
|
|
_______________
|
(a)
|
Primarily represents long-lived assets of the
European Division
’s central operations, which are located in the Netherlands.
|
|
(b)
|
Primarily represents the long-lived assets of our corporate offices.
|
|
(c)
|
Represents long-lived assets related to
CWC
’s sub-sea and terrestrial network that connects over
|
II-214
LIBERTY GLOBAL PLC
Notes to Consolidated Financial Statements — (Continued)
December 31, 2016, 2015 and 2014
|
(d)
|
|
(
19
)
Quarterly Financial Information (Unaudited)
|
|
2016
|
|||||||||||||||
|
|
1
st
quarter
|
2
nd
quarter
|
3
rd
quarter
|
4
th
quarter
|
||||||||||||
|
|
in millions, except per share amounts
|
|||||||||||||||
|
Revenue
|
$
|
|
|
$
|
|
|
$
|
|
|
$
|
|
|
||||
|
Operating income
|
$
|
|
|
$
|
|
|
$
|
|
|
$
|
|
|
||||
|
Net earnings (loss) attributable to Liberty Global shareholders
|
$
|
(
|
)
|
$
|
|
|
$
|
(
|
)
|
$
|
|
|
||||
|
Basic earnings (loss) attributable to Liberty Global shareholders per share (note 3):
|
||||||||||||||||
|
Liberty Global Shares
|
$
|
(
|
)
|
$
|
|
|
$
|
(
|
)
|
$
|
|
|
||||
|
LiLAC Shares
|
$
|
(
|
)
|
$
|
(
|
)
|
$
|
(
|
)
|
$
|
(
|
)
|
||||
|
Diluted earnings (loss) attributable to Liberty Global shareholders per share (note 3):
|
||||||||||||||||
|
Liberty Global Shares
|
$
|
(
|
)
|
$
|
|
|
$
|
(
|
)
|
$
|
|
|
||||
|
LiLAC Shares
|
$
|
(
|
)
|
$
|
(
|
)
|
$
|
(
|
)
|
$
|
(
|
)
|
||||
|
|
2015
|
|||||||||||||||
|
|
1
st
quarter
|
2
nd
quarter
|
3
rd
quarter
|
4
th
quarter
|
||||||||||||
|
|
in millions, except per share amounts
|
|||||||||||||||
|
Revenue
|
$
|
|
|
$
|
|
|
$
|
|
|
$
|
|
|
||||
|
Operating income
|
$
|
|
|
$
|
|
|
$
|
|
|
$
|
|
|
||||
|
Net earnings (loss) attributable to Liberty Global shareholders
|
$
|
(
|
)
|
$
|
(
|
)
|
$
|
|
|
$
|
(
|
)
|
||||
|
Basic and diluted earnings (loss) attributable to Liberty Global shareholders per share (note 3):
|
||||||||||||||||
|
Liberty Global Shares
|
$
|
|
|
$
|
(
|
)
|
||||||||||
|
LiLAC Shares
|
$
|
|
|
$
|
(
|
)
|
||||||||||
|
Old Liberty Global Shares
|
$
|
(
|
)
|
$
|
(
|
)
|
||||||||||
II-215
LIBERTY GLOBAL PLC
Notes to Consolidated Financial Statements — (Continued)
December 31, 2016, 2015 and 2014
(
20
)
Subsequent Events
Virgin Media Refinancing Transactions
In January 2017,
Virgin Media Secured Finance
issued
£
675.0
million
(
$
833.3
million
) principal amount of
5.0
%
senior secured notes due April 15, 2027 (the
April 2027 VM Senior Secured Notes
). The net proceeds from the
April 2027 VM Senior Secured Notes
were used to repay in full the outstanding principal amount under the
April 2021 VM Sterling Senior Secured Notes
.
Subject to the circumstances described below, the
April 2027 VM Senior Secured Notes
are non-callable until April 15, 2022. At any time prior to April 15, 2022,
Virgin Media Secured Finance
may redeem some or all of the
April 2027 VM Senior Secured Notes
by paying a “make-whole” premium, which is the present value of all remaining scheduled interest payments to April 15, 2022 using the discount rate (as specified in the indenture) as of the redemption date plus
50
basis points
.
Virgin Media Secured Finance
may redeem some or all of the
April 2027 VM Senior Secured Notes
at the following redemption prices (expressed as a percentage of the principal amount) plus accrued and unpaid interest and additional amounts (as specified in the indenture), if any, to the applicable redemption date, as set forth below:
|
|
Redemption price
|
|
|
12-month period commencing April 15:
|
||
|
2022
|
|
|
|
2023
|
|
|
|
2024
|
|
|
|
2025 and thereafter
|
|
|
In February 2017, Virgin Media SFA Finance Limited entered into a new
£
865.0
million
(
$
1,067.9
million
) term loan facility (
VM Facility J
).
VM Facility J
matures on January 31, 2026, bears interest at a rate of LIBOR +
3.50
%
and is subject to a LIBOR floor of
0.0
%
. The net proceeds from
VM Facility J
were used to repay in full the outstanding principal amount under
VM Facility E
.
UPC Holding Refinancing Transaction
II-216
The capitalized terms used in Part III of this Annual Report on Form 10-K are defined in the notes to our consolidated financial statements. In the following text, the terms, “we,” “our,” “our company” and “us” may refer, as the context requires, to
Liberty Global
(or its predecessor) or collectively to
Liberty Global
(or its predecessor) and its subsidiaries.
Except as indicated below, the following required information is incorporated by reference to our definitive proxy statement for our
2017
Annual Meeting of Shareholders, which we intend to hold during the second quarter of
2017
.
|
Item 10.
|
DIRECTORS, EXECUTIVE OFFICERS AND CORPORATE GOVERNANCE
|
|
Item 11.
|
EXECUTIVE COMPENSATION
|
|
Item 12.
|
SECURITY OWNERSHIP OF CERTAIN BENEFICIAL OWNERS AND MANAGEMENT AND RELATED STOCKHOLDER MATTERS
|
|
The information required by Item 201(d) of Regulation S-K is included below and accordingly will not be incorporated by reference to our definitive proxy statement.
|
|
|
Item 13.
|
CERTAIN RELATIONSHIPS AND RELATED TRANSACTIONS, AND DIRECTOR INDEPENDENCE
|
|
Item 14.
|
PRINCIPAL ACCOUNTANT FEES AND SERVICES
|
We intend to file our definitive proxy statement for our
2017
Annual Meeting of Shareholders with the Securities and Exchange Commission on or before
May 1,
2017
.
III-1
|
Item 12.
|
SECURITY OWNERSHIP OF CERTAIN BENEFICIAL OWNERS AND MANAGEMENT AND RELATED SHAREHOLDER MATTERS
|
Securities Authorized for Issuance Under Equity Compensation Plans
The following table sets forth information as of
December 31, 2016
with respect to our ordinary shares that are authorized for issuance under our equity compensation plans.
Equity Compensation Plan Information
|
Plan Category
|
Number of
securities to be
issued upon
exercise of
outstanding
options, warrants
and rights (1)(2)
|
Weighted average
exercise price of
outstanding
options, warrants
and rights (1)(2)
|
Number of
securities
available for
future issuance
under equity
compensation
plans (excluding securities reflected in the first column)
|
|||||||
|
Equity compensation plans approved by security holders:
|
||||||||||
|
Liberty Global 2014 Incentive Plan (3):
|
||||||||||
|
Total ordinary shares available for issuance
|
64,795,919
|
|
||||||||
|
Liberty Global Class A ordinary shares
|
7,434,710
|
|
$
|
35.78
|
|
|||||
|
Liberty Global Class C ordinary shares
|
14,942,006
|
|
$
|
34.42
|
|
|||||
|
LiLAC Class A ordinary shares
|
1,131,740
|
|
$
|
38.67
|
|
|||||
|
LiLAC Class C ordinary shares
|
2,266,371
|
|
$
|
39.13
|
|
|||||
|
Liberty Global 2014 Nonemployee Director Incentive Plan (4):
|
||||||||||
|
Total ordinary shares available for issuance
|
9,789,929
|
|
||||||||
|
Liberty Global Class A ordinary shares
|
212,166
|
|
$
|
35.70
|
|
|||||
|
Liberty Global Class C ordinary shares
|
423,603
|
|
$
|
34.17
|
|
|||||
|
LiLAC Class A ordinary shares
|
37,046
|
|
$
|
42.07
|
|
|||||
|
LiLAC Class C ordinary shares
|
74,030
|
|
$
|
42.25
|
|
|||||
|
Liberty Global 2005 Incentive Plan (5):
|
—
|
|
||||||||
|
Liberty Global Class A ordinary shares
|
5,472,104
|
|
$
|
24.37
|
|
|||||
|
Liberty Global Class C ordinary shares
|
16,387,658
|
|
$
|
23.24
|
|
|||||
|
LiLAC Class A ordinary shares
|
800,669
|
|
$
|
28.83
|
|
|||||
|
LiLAC Class C ordinary shares
|
2,368,978
|
|
$
|
28.99
|
|
|||||
|
Liberty Global 2005 Director Incentive Plan (5):
|
—
|
|
||||||||
|
Liberty Global Class A ordinary shares
|
262,165
|
|
$
|
15.43
|
|
|||||
|
Liberty Global Class C ordinary shares
|
793,494
|
|
$
|
14.87
|
|
|||||
|
LiLAC Class A ordinary shares
|
45,772
|
|
$
|
18.03
|
|
|||||
|
LiLAC Class C ordinary shares
|
138,572
|
|
$
|
18.20
|
|
|||||
|
VM Incentive Plan (5):
|
—
|
|
||||||||
|
Liberty Global Class A ordinary shares
|
508,726
|
|
$
|
22.50
|
|
|||||
|
Liberty Global Class C ordinary shares
|
2,347,483
|
|
$
|
25.27
|
|
|||||
|
LiLAC Class A ordinary shares
|
40,726
|
|
$
|
33.47
|
|
|||||
|
LiLAC Class C ordinary shares
|
121,668
|
|
$
|
33.38
|
|
|||||
|
Equity compensation plans not approved by security holders:
|
||||||||||
|
None
|
—
|
|
|
—
|
|
|||||
|
Totals:
|
||||||||||
|
Total ordinary shares available for issuance
|
74,585,848
|
|
||||||||
|
Liberty Global Class A ordinary shares
|
13,889,871
|
|
|
|
||||||
|
Liberty Global Class C ordinary shares
|
34,894,244
|
|
|
|
||||||
|
LiLAC Class A ordinary shares
|
2,055,953
|
|
|
|
||||||
|
LiLAC Class C ordinary shares
|
4,969,619
|
|
|
|
||||||
III-2
_______________
|
(1)
|
This table includes (i)
SAR
s with respect to
10,305,065
,
23,558,392
,
1,486,401
and
3,303,386
Liberty Global
Class A, Liberty Global Class C, LiLAC Class A and LiLAC Class C ordinary shares, respectively, and (ii)
PSAR
s with respect to
2,877,513
,
8,581,372
,
486,734
and
1,453,631
Liberty Global
Class A, Liberty Global Class C, LiLAC Class A and LiLAC Class C ordinary shares, respectively. Upon exercise, the appreciation of a
SAR
, which is the difference between the base price of the
SAR
and the then-market value of the respective underlying class of ordinary shares or in certain cases, if lower, a specified price, may be paid in shares of the applicable class of ordinary shares. Based upon the respective market prices of
Liberty Global
Class A and Class C and LiLAC Class A and Class C ordinary shares at
December 31, 2016
and excluding any related tax effects,
868,048
,
2,683,988
,
32,221
and
67,168
Liberty Global
Class A , Liberty Global Class C, LiLAC Class A and LiLAC Class C ordinary shares, respectively, would have been issued if all outstanding and in-the-money
SAR
s had been exercised on
December 31, 2016
. For further information, see note
13
to our consolidated financial statements.
|
|
(2)
|
In addition to the option,
SAR
and
PSAR
information included in this table, there are outstanding RSU, PSU and PGU awards under the various incentive plans with respect to an aggregate of
3,649,647
,
333,334
,
6,652,584
,
550,359
,
58,256
and
1,000,190
Liberty Global
Class A,
Liberty Global
Class B,
Liberty Global
Class C, LiLAC Class A, LiLAC Class B and LiLAC Class C ordinary shares, respectively.
|
|
(3)
|
The Liberty Global 2014 Incentive Plan permits grants of, or with respect to,
Liberty Global
or LiLAC ordinary shares subject to a single aggregate limit of 105 million shares (of which no more than 50.25 million shares may consist of Class B shares), subject to anti-dilution adjustments. As of
December 31, 2016
, an aggregate of
64,795,919
ordinary shares were available for issuance pursuant to the incentive plan. For further information, see note
13
to our consolidated financial statements.
|
|
(4)
|
The Liberty Global 2014 Nonemployee Director Incentive Plan permits grants of, or with respect to,
Liberty Global
or LiLAC ordinary shares subject to a single aggregate limit of 10.5 million shares, subject to anti-dilution adjustments. As of
December 31, 2016
, an aggregate of
9,789,929
ordinary shares were available for issuance pursuant to the Liberty Global 2014 Nonemployee Director Incentive Plan. For further information, see note
13
to our consolidated financial statements.
|
|
(5)
|
On January 30, 2014, our shareholders approved the Liberty Global 2014 Incentive Plan and the Liberty Global 2014 Nonemployee Director Incentive Plan and, accordingly, no further awards will be granted under the
Liberty Global 2005 Incentive Plan
, the
Liberty Global 2005 Director Incentive Plan
or the
VM Incentive Plan
.
|
III-3
|
Item 15.
|
EXHIBITS, FINANCIAL STATEMENT SCHEDULES
|
(a) (1) FINANCIAL STATEMENT
The financial statements required under this Item begin on page II-96 of this Annual Report on Form 10-K.
(a) (2) FINANCIAL STATEMENT SCHEDULES
The financial statement schedules required under this Item are as follows:
|
Schedule I - Condensed Financial Information of Registrant (Parent Company Information):
|
|
|
Liberty Global plc Condensed Balance Sheets as of December 31, 2016 and 2015 (Parent Company Only)
|
|
|
Liberty Global plc Condensed Statements of Operations for the years ended December 31, 2016, 2015 and 2014 (Parent Company Only)
|
|
|
Liberty Global plc Condensed Statements of Cash Flows for the years ended December 31, 2016, 2015, and 2014 (Parent Company Only)
|
|
|
Schedule II - Valuation and Qualifying Accounts
|
|
(a) (3) EXHIBITS
Listed below are the exhibits filed as part of this Annual Report on Form 10-K (according to the number assigned to them in Item 601 of Regulation S-K):
|
2 -- Plan of acquisition, reorganization, arrangement, liquidation or succession:
|
||
|
2.1
|
|
Rule 2.7 Announcement, dated November 16, 2015. (incorporated by reference to Exhibit 2.1 to the Registrant’s Current Report on Form 8-K/A filed November 18, 2015 (File No. 001-35961) (the November 2015 8-K/A)).
|
|
2.2
|
|
Co-operation Agreement, dated November 16, 2015, between Liberty Global plc and Cable & Wireless Communications plc (incorporated by reference to Exhibit 2.2 to the November 2015 8-K/A).
|
|
3 -- Articles of Incorporation and Bylaws:
|
||
|
3.1
|
|
Articles of Association of Liberty Global plc, effective as of July 1, 2015 (incorporated by reference to Exhibit 3.1 to the Registrant’s Registration Statement on Form 8-A filed June 19, 2015 (File No. 001-35961)).
|
|
4 -- Instruments Defining the Rights of Securities Holders, including Indentures:
|
||
|
4.1
|
|
Senior Secured Credit Facility Agreement originally dated January 16, 2004, as amended and restated on December 19, 2016, among UPC Broadband Holding B.V. (UPC Broadband Holding) and UPC Financing Partnership (UPC Financing) as Borrowers, The Bank of Nova Scotia, as Facility Agent,the Guarantors listed therein, the Security Agent and the bank and financial institutions acceding thereto from time to time (the UPC Broadband Holding Bank Facility) (incorporated by reference to Exhibit 4.1 to the Registrant's Current Report on Form 8-K filed December 23, 2016 (File No. 001-35961)).
|
|
4.2
|
|
Additional Facility AC Accession Agreement, dated November 16, 2011, among UPC Financing, as Borrower, UPC Broadband Holding, The Bank of Nova Scotia, as Facility Agent and Security Agent, and UPCB Finance V Limited, as an Additional Facility AC Lender, under the UPC Broadband Holding Bank Facility (incorporated by reference to Exhibit 4.47 to Liberty Global Inc.’s (LGI) Annual Report on Form 10-K filed February 22, 2012 (File No. 000-51360) (the LGI 2011 10-K)).
|
|
4.3
|
|
Additional Facility AD Accession Agreement, dated February 7, 2012, among UPC Financing, as Borrower, UPC Broadband Holding, The Bank of Nova Scotia, as Facility Agent and Security Agent, and UPCB Finance VI Limited, as an Additional Facility AD Lender, under the UPC Broadband Holding Bank Facility (incorporated by reference to Exhibit 4.48 to the LGI 2011 10-K).
|
|
4.4
|
|
Indenture dated April 15, 2015, among UPCB Finance IV Limited, The Bank of New York Mellon, London Branch as Trustee, Principal Paying Agent, Transfer Agent and Security Agent, The Bank of New York Mellon as New York Paying Agent, New York Transfer Agent and Dollar Notes Registrar and The Bank of New York Mellon (Luxembourg) S.A. as Euro Notes Registrar and Transfer Agent (incorporated by reference to Exhibit 4.1 to the Registrant’s Current Report on Form 8-K/A filed April 21, 2015 (File No. 001-35961) (the April 2015 8-K/A)).
|
|
4.5
|
|
Additional Facility AK Accession Agreement, dated April 15, 2015, among UPC Financing as Borrower, The Bank of Nova Scotia as Facility Agent and Security Agent, UPC Broadband Holding and UPCB Finance IV Limited as Additional Facility AK Lender, under the UPC Broadband Holding Bank Facility (incorporated by reference to Exhibit 4.2 to the April 2015 8-K/A).
|
IV-1
|
4.6
|
|
Additional Facility AL Accession Agreement, dated April 15, 2015, among UPC Financing as Borrower, The Bank of Nova Scotia as Facility Agent and Security Agent, UPC Broadband Holding and UPCB Finance IV Limited as Additional Facility AL Lender, under the UPC Broadband Holding Bank Facility (incorporated by reference to Exhibit 4.3 to the April 2015 8-K/A).
|
|
4.7
|
|
Additional Facility AL2 Accession Agreement, dated May 20, 2015, among UPC Financing as Borrower, The Bank of New York Nova Scotia as Facility Agent and Security Agent, UPC Broadband Holding and UPCB Finance IV Limited as Additional Facility AL2 Lender, under the UPC Broadband Holding Bank Facility (incorporated by reference to Exhibit 4.1 to the Registrant’s Current Report on Form 8-K/A filed May 21, 2015 (File No. 001-35961)).
|
|
4.8
|
|
Additional Facility AM Accession Agreement, dated August 3, 2015, among UPC Financing as Borrower, The Bank of Nova Scotia as Facility Agent and Security Agent and the financial institutions listed therein as Additional Facility AM Lenders, under the UPC Broadband Holding Bank Facility (incorporated by reference to Exhibit 4.1 to the Registrant’s Current Report on Form 8-K filed August 6, 2015 (File No. 001-35961)).
|
|
4.9
|
|
Additional Facility AN Accession Agreement dated August 3, 2016, between, among others, UPC Financing as Borrower and The Bank of Nova Scotia as Facility Agent and Security Agent and the financial institutions listed therein as Additional Facility AN Lenders under the UPC Broadband Holding Bank Facility (incorporated by reference to Exhibit 4.1 to the Registrant’s Current Report on Form 8-K filed August 3, 2016 (File No. 001-35961)).
|
|
4.10
|
|
Additional Facility AO Accession Agreement dated November 23, 2016, between, among others, UPC Financing as Borrower, UPC Broadband Holding, The Bank of Nova Scotia as Facility Agent and Security Agent and the financial institutions listed therein as Additional Facility AO Lenders, under the UPC Broadband Holding Bank Facility (incorporated by reference to Exhibit 4.1 to the Registrant’s Current Report on Form 8-K filed November 30, 2016 (File No. 001-35961)).
|
|
4.11
|
|
Additional Facility AP Accession Agreement dated February 2, 2017, between, among others, UPC Financing as the Borrower, UPC Broadband Holding and The Bank of Nova Scotia as the Facility Agent and Security Agent under the UPC Broadband Holding Bank Facility (incorporated by reference to Exhibit 4.2 to the Registrant’s Current Report on Form 8-K filed February 7, 2017 (File No. 001-35961)).
|
|
4.12
|
|
€2,300,000,000 Credit Agreement, originally dated August 1, 2007, and as amended and restated by supplemental agreements dated August 22, 2007, September 11, 2007, October 8, 2007, June 23, 2009, August 25, 2009, October 4, 2010 and as further amended and restated on November 2, 2015 among Telenet N.V. as Borrower, The Bank of Nova Scotia N.V. as Facility Agent, the parties listed therein as Original Guarantors, ABN AMRO Bank N.V., BNP Paribas S.A. and J.P. Morgan PLC as Mandated Lead Arrangers, KBC Bank N.V. as Security Agent, and the financial institutions listed therein as Initial Original Lenders (the Telenet Credit Facility) (incorporated by reference to Exhibit 4.1 to the Registrant’s Current Report on Form 8-K filed November 6, 2015 (File No. 000-35961)).
|
|
4.13
|
|
Telenet Additional Facility U Accession Agreement, dated August 16, 2012, among, inter alia, Telenet International Finance S.a.r.l (Telenet International) as Borrower, Telenet N.V. and Telenet International as Guarantors, The Bank of Nova Scotia as Facility Agent, KBC Bank N.V. as Security Agent and the financial institutions listed therein as additional Facility U Lenders, under the Telenet Credit Facility (incorporated by reference to Exhibit 4.2 to LGI’s Quarterly Report on Form 10-Q filed November 5, 2012 (File No. 000-51360) (the LGI November 5, 2012 10-Q)).
|
|
4.14
|
|
Telenet Additional Facility V Accession Agreement, dated August 16, 2012, among, inter alia, Telenet International as Borrower, Telenet N.V. and Telenet International as Guarantors, The Bank of Nova Scotia as Facility Agent, KBC Bank N.V. as Security Agent and the financial institutions listed therein as additional Facility V Lenders, under the Telenet Credit Facility (incorporated by reference to Exhibit 4.3 to the LGI November 5, 2012 10-Q).
|
|
4.15
|
|
Telenet Additional Facility X Accession Agreement, dated April 11, 2014, among, inter alia, Telenet International as Borrower, Telenet N.V. and Telenet International as Guarantors, The Bank of Nova Scotia as Facility Agent, KBC Bank N.V. as Security Agent and the financial institutions listed therein as Additional Facility X Lenders, under the Telenet Credit Facility (incorporated by reference to Exhibit 4.3 to the Registrant’s Current Report on Form 8-K filed April 15, 2014 (File No. 001-35961)).
|
|
4.16
|
|
Additional Facility Z Accession Agreement, dated May 7, 2015, between, among others, Telenet International as Borrower, Telenet N.V., The Bank of Nova Scotia as Facility Agent, KBC Bank N.V. Security Agent and The Royal Bank of Scotland PLC, Societe Generale, London Branch, Deutsche Bank AG, London Branch, Credit Suisse AG, London Branch, ScotiaBank Europe PLC and Goldman Sachs Bank USA as Additional Facility Z Lenders, under the Telenet Credit Facility (incorporated by reference to Exhibit 4.1 to the Registrant’s Current Report on Form 8-K filed May 13, 2015 (File No. 001-35961)).
|
|
4.17
|
|
Telenet Additional Facility X2 Accession Agreement, dated July 1, 2015, among inter alia, Telenet International as Borrower, Telenet N.V. and Telenet International as Guarantors, The Bank of Nova Scotia as Facility Agent, KBC Bank N.V. as Security Agent and the financial institutions listed therein as Additional Facility X2 Lenders, under the Telenet Credit Facility (incorporated by reference to Exhibit 4.1 to the Registrant’s Current Report on Form 8-K filed July 8, 2015 (File No. 001-35961)).
|
|
4.18
|
|
Telenet Additional Facility AB Accession Agreement, dated July 24, 2015, among, inter alia, Telenet International as Borrower, Telenet N.V. and Telenet International as Guarantors, and the other parties thereto, under the Telenet Credit Facility (incorporated by reference to Exhibit 4.1 to the Registrant's Current Report on Form 8-K filed July 30, 2015 (File No. 001-35061)).
|
IV-2
|
4.19
|
|
Telenet Additional Facility AE Accession Agreement dated November 3, 2016, among, inter alia, Telenet International as Borrower, The Bank of Nova Scotia as Facility Agent, KBC Bank N.V. as Security Agent and the financial institutions listed therein as Additional Facility AE Lenders, under the Telenet Credit Facility (incorporated by reference to Exhibit 4.1 to the Registrant’s Current Report on Form 8-K filed November 10, 2016 (File No. 001-35961) (the November 2016 8-K)).
|
|
4.20
|
|
Telenet Additional Facility AF Accession Agreement dated November 3, 2016 among, inter alia, Telenet Financing USD LLC, The Bank of Nova Scotia as Facility Agent, KBC Bank N.V. as Security Agent and the financial institutions listed therein as Additional Facility AF Lenders, under the Telenet Credit Facility (incorporated by reference to Exhibit 4.2 to the November 2016 8-K).
|
|
4.21
|
|
Telenet Additional Facility AG Accession Agreement dated November 22, 2016, among, inter alia, Telenet International, The Bank of Nova Scotia as Facility Agent, KBC Bank N.V. as Security Agent and the financial institutions listed therein as Additional Facility AG Lenders, under the Telenet Credit Facility (incorporated by reference to Exhibit 4.1 to the Registrant’s Current Report on Form 8-K filed November 29, 2016 (File No. 001-35961)).
|
|
4.22
|
|
Indenture dated December 14, 2012, between Unitymedia Hessen GmbH & Co. KG, Unitymedia NRW GmbH, The Bank of New York Mellon, London Branch, as Trustee, Transfer Agent and Principal Paying Agent, The Bank of New York Mellon as Paying Agent in New York, The Bank of New York Mellon (Luxembourg) S.A. as Registrar and Credit Suisse AG, London Branch, as Security Trustee (incorporated by reference to Exhibit 4.1 to the Registrant's Current Report on Form 8-K filed December 20, 2012 (File No. 000-51360)).
|
|
4.23
|
|
Indenture dated December 17, 2014, between Unitymedia Hessen GmbH & Co. KG, Unitymedia NRW GmbH, The Bank of New York Mellon, London Branch, as Trustee, Transfer Agent and Principal Paying Agent, The Bank of New York Mellon as New York Paying Agent and New York Transfer Agent, The Bank of New York Mellon (Luxembourg) S.A. as Registrar and Credit Suisse AG, London Branch, as Security Trustee (incorporated by reference to Exhibit 4.1 to the Registrant's Current Report on Form 8-K/A filed December 18, 2014 (File No. 001-35961)).
|
|
4.24
|
|
Indenture, dated as of March 3, 2011, among Virgin Media Secured Finance PLC, the Guarantors party thereto, The Bank of New York Mellon as Trustee and Paying Agent and The Bank of New York Mellon (Luxembourg) S.A. as Luxembourg Paying Agent (incorporated by reference to Exhibit 4.1 to Virgin Media Inc.’s (Virgin Media) Current Report on Form 8-K filed on March 3, 2011 (File No. 000-50886).
|
|
4.25
|
|
Indenture dated February 22, 2013, between, among others, Lynx I Corp., as Issuer, The Bank of New York Mellon, London Branch, as Trustee, Transfer Agent and Principal Paying Agent and The Bank of New York Mellon, as Paying Agent and Newco Security Trustee (incorporated by reference to Exhibit 4.1 to LGI’s Current Report on Form 8-K/A filed February 27, 2013 (File No. 000-51360) (the LGI February 2013 8-K/A).
|
|
4.26
|
|
Indenture, dated as of February 22, 2013, among Lynx II Corp., as Issuer, The Bank of New York Mellon, London Branch, as trustee, Transfer Agent and Principal Paying Agent and The Bank of New York Mellon, as Paying Agent and Newco Security Trustee (incorporated by reference to Exhibit 4.2 to the LGI February 2013 8-K/A).
|
|
4.27
|
|
First Supplemental Indenture, dated as of June 7, 2013, between, among others, Virgin Media Secured Finance PLC, Virgin Media Inc. (Virgin Media) and The Bank of New York Mellon as Trustee, to the Indenture dated as of March 3, 2011 for Virgin Media 5.25% Senior Secured Notes and 5.50% Senior Secured Notes each due 2021 (incorporated by reference to Exhibit 4.12 to the Registrant’s Current Report on Form 8-K filed June 12, 2013 (File No. 001-35961)(the June 2013 8-K)).
|
|
4.28
|
|
Accession Agreement, dated as of June 7, 2013, among Virgin Media Secured Finance PLC as Acceding Issuer, Lynx I Corp. and The Bank of New York Mellon, as Trustee (incorporated by reference to Exhibit 4.13 to the June 2013 8-K).
|
|
4.29
|
|
First Supplemental Indenture, dated as of June 7, 2013, between, among others, Virgin Media Secured Finance PLC and The Bank of New York Mellon as Trustee, to the Indenture dated as of February 22, 2013 for Lynx I Corp. 5⅜% Senior Secured Notes and 6.00% Senior Secured Notes each due 2021 (incorporated by reference to Exhibit 4.15 to the June 2013 8-K).
|
|
4.30
|
|
Accession Agreement, dated as of June 7, 2013, among Lynx II Corp., Virgin Media Finance PLC and The Bank of New York Mellon as Trustee and Paying Agent (incorporated by reference to Exhibit 4.16 to the June 2013 8-K).
|
|
4.31
|
|
First Supplemental Indenture, dated June 7, 2013, between, among others, Virgin Media Finance PLC, Virgin Media and The Bank of New York Mellon, as Trustee and Paying Agent, to the Indenture dated as of February 22, 2013 Lynx II Corp. 6⅜% Senior Notes and 7.00% Senior Notes each due 2023 (incorporated by reference to Exhibit 4.18 to the June 2013 8-K).
|
|
4.32
|
|
Amendment dated June 14, 2013, to the Senior Facilities Agreement, between, and among others, Virgin Media Investment Holdings Limited, certain other subsidiaries of Virgin Media and the lenders thereto (incorporated by reference to Exhibit 4.1 to the Registrant’s Current Report on Form 8-K filed June 21, 2013 (File No. 001-35961)).
|
|
4.33
|
|
Senior Facilities Agreement, dated as of June 7, 2013, as amended on June 14, 2013 and as amended and restated on July 30 2015, among, inter alia, Virgin Media Finance PLC, certain other subsidiaries of Virgin Media and the lenders thereto (the VMF Senior Facilities Agreement) (incorporated by reference to Exhibit 4.13 to the Registrant’s Quarterly Report on Form 10-Q filed August 4, 2015 (File No. 001-35061)).
|
|
4.34
|
|
Indenture dated March 28, 2014 between Virgin Media Secured Finance PLC, The Bank of New York Mellon, London Branch, as Trustee, Transfer Agent and Principal Paying Agent, The Bank of New York Mellon as Paying Agent, and The Bank of New York Mellon (Luxembourg) S.A., as Registrar (incorporated by reference to Exhibit 4.1 to the Registrant’s Current Report on Form 8-K/A filed April 3, 2014 (File No. 001-35961)).
|
IV-3
|
4.35
|
|
Virgin Additional Facility E Accession Agreement, dated April 17, 2014, among, inter alia, Virgin Media SFA Finance Limited as Borrower, certain other subsidiaries of Virgin Media, The Bank of Nova Scotia as Facility Agent and the financial institutions listed therein as Additional Facility E Lenders, under the VMF Senior Facilities Agreement (incorporated by reference to Exhibit 4.2 to the Registrant’s Current Report on Form 8-K filed April 23, 2014 (File No. 001-35961)).
|
|
4.36
|
|
Indenture dated January 28, 2015 between Virgin Media Secured Finance PLC, The Bank of New York Mellon, London Branch, as Trustee and Paying Agent and The Bank of New York Mellon (Luxembourg) S.A., as Registrar and Transfer Agent (incorporated by reference to Exhibit 4.1 to the Registrant’s Current Report on Form 8-K/A filed February 3, 2015 (File No. 001-35961) (the February 2015 8-K/A)).
|
|
4.37
|
|
Indenture dated January 28, 2015 between Virgin Media Finance PLC, The Bank of New York Mellon, London Branch, as Trustee and Principal Paying Agent, The Bank of Mellon as Paying Agent and Dollar Notes Transfer Agent and Registrar and The Bank of New York Mellon (Luxembourg) S.A., as Euro Notes Registrar and Transfer Agent (incorporated by reference to Exhibit 4.2 to the February 2015 8-K/A).
|
|
4.38
|
|
Additional I Facility Accession Deed dated December 16, 2016, among Virgin Media Investment Holdings Limited, Virgin Media Bristol LLC as Borrower, The Bank of Nova Scotia as Facility Agent, and The Bank of Nova Scotia as Additional I Facility Lender, under the VMF Senior Facilities Agreement (incorporated by reference to Exhibit 4.1 to the Registrant’s Current Report on Form 8-K filed December 22, 2016 (File No. 001-35961)(the December 2016 8-K)).
|
|
4.39
|
|
Amendment letter dated December 16, 2016, between Virgin Media Investment Holdings Limited and The Bank of Nova Scotia as the Facility Agent, amending the VMF Senior Facilities Agreement (incorporated by reference to Exhibit 4.2 to the December 2016 8-K).
|
|
4.40
|
|
Additional J Facility Accession Deed dated February 2, 2017, between Virgin Media Investment Holdings Limited as the Company, Virgin Media SFA Finance Limited as the Borrower, The Bank of Nova Scotia as the Facility Agent and The Bank of Nova Scotia as Additional J Facility Lender under the VMF Senior Facilities Agreement (incorporated by reference to Exhibit 4.1 to the Registrant’s Current Report on Form 8-K filed February 7, 2017 (File No. 001-35961)).
|
|
4.41
|
|
Indenture dated January 24, 2014, between VTR Finance B.V., The Bank of New York Mellon, London Branch, as Trustee and Security Agent, and The Bank of New York Mellon as Paying Agent, Registrar and Transfer Agent (incorporated by reference to Exhibit 4.1 to the Registrant’s Current Report on Form 8-K filed January 24, 2014 (File No. 001-35961)).
|
|
4.42
|
|
Credit Agreement, dated May 16, 2016, among LGE Coral Holdco Limited, Sable International Finance Limited and Coral-US Co-Borrower LLC as Initial Borrowers, The Bank of Nova Scotia as Administrative Agent, L/C Issuer and Swing Line Lender and FirstCaribbean International Bank (Bahamas) Limited, BNP Paribas Fortis SA/NV and Royal Bank of Canada as Alternative L/C Issuers, the other lenders a party thereto from time to time (the Coral Credit Agreement)(incorporated by reference to Exhibit 4.1 to the Registrant’s Current Report on Form 8-K filed May 20, 2016 (File No. 001-35961)(the May 2016 8-K)).
|
|
4.43
|
|
Indenture dated March 31, 2014, among Columbus International Inc., each of the Guarantors a party thereto, The Bank of New York Mellon as Trustee and The Bank of New York Mellon (Luxembourg) S.A. as Luxembourg Transfer Agent and Paying Agent (incorporated be reference to Exhibit 4.2 to the May 2016 8-K).
|
|
4.44
|
|
Indenture dated August 5, 2015, among Sable International Finance Limited as Issuer, each of the Guarantors a party thereto, Deutsche Bank Trust Company Americas as Trustee, Principal Paying Agent, Registrar and Transfer Agent and Deutsche Bank Luxembourg, S.A. as Luxembourg Paying Agent and (Regulation S) Transfer Agent (incorporated by reference to Exhibit 4.3 to the May 2016 8-K).
|
|
4.45
|
|
First Supplemental Indenture dated November 23, 2015, among Sable International Finance Limited as Issuer, each of the Guarantors a party thereto, and Deutsche Bank Trust Company Americas as Trustee, Principal Paying Agent, Registrar and Transfer Agent (incorporated by reference to Exhibit 4.4 to the May 2016 8-K).
|
|
4.46
|
|
First Supplemental Indenture dated March 10, 2015, among Columbus International Inc. as Issuer, each of the Guarantors a party thereto, and The Bank of New York Mellon as Trustee (incorporated by reference to Exhibit 4.5 to the May 2016 8-K).
|
|
4.47
|
|
Joinder Agreement dated October 7, 2016, among Sable International Finance Limited and Coral-US Co-Borrower LLC as Borrowers, the other Guarantors party thereto, The Bank of Nova Scotia as Administrative Agent and Security Trustee, and the financial institutions party thereto as Revolving Credit Lenders (incorporated by reference to Exhibit 4.1 to the Registrant’s Current Report on Form 8-K filed October 13, 2016 (File No. 001-35961)).
|
|
4.48
|
|
Joinder Agreement, dated November 18, 2016, among Sable International Finance Limited and Coral US Co-Borrower LLC as Borrowers, the other Guarantors party thereto, The Bank of Nova Scotia, as Administrative Agent and Security Trustee, and the financial institutions party thereto as Additional Term B-1B Facility Lenders (as defined therein) under the Coral Credit Agreement (incorporated by reference to Exhibit 4.1 to the Registrant’s Current Report on Form 8-K filed November 23, 2016 (File No. 001-35961)).
|
|
4.49
|
|
Amended and Restated First Lien Credit Agreement dated as of July 7, 2014, among Liberty Cablevision of Puerto Rico LLC (Liberty Puerto Rico), the Guarantors party thereto from time to time, The Bank of Nova Scotia, as Administrative Agent, each lender form time to time party thereto and Scotiabank de Puerto Rico as L/C Issuer and Swing Line Lender (incorporated by reference to Exhibit 4.1 to the Registrant’s Current Report on Form 8-K filed July 2, 2015 (File No. 001-35961) (the July 2015 8-K)).
|
IV-4
|
4.50
|
|
Amended and Restated Second Lien Credit Agreement dated as of July 7, 2014, among Liberty Puerto Rico, the Guarantors party thereto from time to time, The Bank of Nova Scotia as Administrative Agent, and each lender from time to time party thereto (incorporated by reference to Exhibit 4.2 to the July 2015 8-K).
|
|
4.51
|
|
Additional Term B-1 Facility Joinder Agreement dated as of June 1, 2015, among Liberty Puerto Rico, The Bank of Nova Scotia as Administrative Agent and Collateral Agent and the Additional Term B-1 Facility Lenders party thereto (incorporated by reference to Exhibit 4.3 to the July 2015 8-K).
|
|
4.52
|
|
Additional Term B-2 Facility Joinder Agreement dated as of June 1, 2015, among Liberty Puerto Rico, The Bank of Nova Scotia as Administrative Agent and Collateral Agent and the Additional Term B-2 Facility Lenders party thereto (incorporated by reference to Exhibit 4.4 to the July 2015 8-K).
|
|
The Registrant undertakes to furnish to the Securities and Exchange Commission, upon request, a copy of all instruments with respect to long-term debt not filed herewith.
|
||
|
10 -- Material Contracts:
|
||
|
10.1
|
|
Deed of Assumption of Liberty Global plc, dated June 7, 2013 (incorporated by reference to Exhibit 10.1 to the Registrant’s Current Report on Form 8-K filed June 7, 2013 (File No. 001-35961)(the June 7, 2013 8-K)).
|
|
10.2
|
|
Liberty Global 2014 Incentive Plan Effective March 1, 2014 as amended and restated February 24, 2015 (the Incentive Plan) (incorporated by reference to Exhibit 10.1 to the Registrant’s Quarterly Report on Form 10-Q filed May 7, 2015 (File No. 001-35961)).
|
|
10.3
|
|
Liberty Global 2014 Nonemployee Director Incentive Plan Effective March 1, 2014 (the Director Plan) (incorporated by reference to Appendix B to the Registrant’s Proxy Statement on Schedule 14A filed December 19, 2013 (File No. 001-35961)).
|
|
10.4
|
|
Form of Performance Share Units Agreement under the Incentive Plan (incorporated by reference to Exhibit 10.6 to the Registrant’s Quarterly Report on Form 10-Q filed May 6, 2014 (File No. 001-35961)).
|
|
10.5
|
|
Form of Performance Share Units Agreement under the Incentive Plan (incorporated by reference to Exhibit 10.1 to the Registrant’s Quarterly Report on Form 10-Q filed August 4, 2015 (File No. 001-35961)).
|
|
10.6
|
|
Form of Non-Qualified Share Option Agreement under the Director Plan (incorporated by reference to Exhibit 10.3 to the Registrant’s Quarterly Report on Form 10-Q filed August 5, 2014 (File No. 001-35961) (the August 5, 2014 10-Q)).
|
|
10.7
|
|
Form of Restricted Share Units Agreement under the Director Plan (incorporated by reference to Exhibit 10.4 to the August 5, 2014 10-Q).
|
|
10.8
|
|
Form of Share Appreciation Rights Agreement under the Incentive Plan (incorporated by reference to Exhibit 10.5 to the August 5, 2014 10-Q).
|
|
10.9
|
|
Form of Restricted Share Units Agreement under the Incentive Plan (incorporated by reference to Exhibit 10.6 to the August 5, 2014 10-Q).
|
|
10.10
|
|
Liberty Global, Inc. 2005 Incentive Plan (as amended and restated effective June 7, 2013) (the 2005 Incentive Plan) (incorporated by reference to Exhibit 10.2 to the June 7, 2013 8-K).
|
|
10.11
|
|
Liberty Global, Inc. 2005 Nonemployee Director Incentive Plan (as amended and restated effective June 7, 2013) (the 2005 Director Plan) (incorporated by reference to Exhibit 10.3 to the June 7, 2013 8-K).
|
|
10.12
|
|
Virgin Media 2010 Stock Incentive Plan (as amended and restated effective June 7, 2013) (incorporated by reference to Exhibit 10.4 to the June 7, 2013 8-K).
|
|
10.13
|
|
Form of Non-Qualified Share Option Agreement under the 2005 Director Plan (incorporated by reference to Exhibit 10.6 to the Registrant’s Quarterly Report on Form 10-Q filed August 1, 2013 (File No. 001-35961)).
|
|
10.14
|
|
Liberty Global Compensation Policy for Nonemployee Directors effective June 26, 2014 (incorporated by reference to Appendix A to the Registrant’s Proxy Statement on Schedule 14A filed April 30, 2014 (File No. 001-35961)).
|
|
10.15
|
|
Form of Deed of Indemnity between Liberty Global and its Directors and Executive Officers (incorporated by reference to Exhibit 10.10 to the June 7, 2013 8-K).
|
|
10.16
|
|
Form of Stock Appreciation Rights Agreement under the 2005 Incentive Plan (incorporated by reference to Exhibit 10.3 to LGI’s Quarterly Report on Form 10-Q filed May 7, 2008 (File No. 000-51360) (the LGI May 7, 2008 10-Q)).
|
|
10.17
|
|
Liberty Global 2015 Annual Cash Performance Award Program for executive officers under the Incentive Plan (description of said program is incorporated by reference to the description thereof included in Item 5.02(e) of the Registrant’s Current Report on Form 8-K filed March 25, 2015 (File No. 001-35961) (the March 2015 8-K)).
|
|
10.18
|
|
Liberty Global 2015 Performance Incentive Plan for executive officers under the Incentive Plan (a description of said plan is incorporated by reference to the description thereof included in Item 5.02(e) of the March 2015 8-K).
|
|
10.19
|
|
Liberty Global 2016 Annual Cash Performance Award Program for executive officers under the Incentive Plan (description of said program is incorporated by reference to the description thereof included in Item 5.02(e) of the Registrant’s Current Report on Form 8-K filed March 14, 2016 (File No. 001-35961)).
|
|
10.20
|
|
Liberty Global 2016 Performance Incentive Plan for executive officers under the Incentive Plan (a description of said plan is incorporated by reference to the description thereof included in Item 5.02(e) of the Registrant’s Current Report on Form 8-K filed February 9, 2016 (File No. 001-35961)).
|
|
10.21
|
|
Form of Performance Share Units Agreement for executive officers under the Incentive Plan (incorporated by reference to Exhibit 10.4 to the Registrant’s Quarterly Report on Form 10-Q filed May 9, 2016 (File No. 000-51360)).
|
IV-5
|
10.22
|
|
Deferred Compensation Plan (adopted effective December 15, 2008; Amended and Restated as of October 26, 2015)(incorporated by reference to Exhibit 10.29 to the Registrant’s Annual Report on Form 10-K filed February 12, 2016 (File No. 001-35961)(the 2016 10-K)).
|
|
10.23
|
|
Nonemployee Director Deferred Compensation Plan (As Amended and Restated Effective December 11, 2015)(incorporated by reference to Exhibit 10.30 to the 2016 10-K)).
|
|
10.24
|
|
Personal Usage of Aircraft Policy, restated June 7, 2013 (incorporated by reference to Exhibit 10.31 to the 2016 10-K).
|
|
10.25
|
|
Form of Aircraft Time Sharing Agreement (900EX) (incorporated by reference to Exhibit 10.29 to LGI Annual Report on Form 10-K filed February 13, 2013 (File No. 000-51360)(the LGI 2012 10-K)).
|
|
10.26
|
|
Form of Aircraft Time Sharing Agreement (7X) (incorporated by reference to Exhibit 10.30 to the LGI 2012 10-K).
|
|
10.27
|
|
Employment Agreement dated as of April 30, 2014, by and among the Registrant, LGI and Michael T. Fries (incorporated by reference to Exhibit 10.7 to the Registrant’s Quarterly Report on Form 10-Q filed May 6, 2014 (File No. 001-35961)(the May 6, 2014 10-Q)).
|
|
10.28
|
|
Form of Performance Grant Award Agreement under the Incentive Plan dated as of April 30, 2014, between the Registrant and Michael T. Fries (incorporated by reference to Exhibit 10.8 to the May 6, 2014 10-Q).
|
|
10.29
|
|
Form of Performance Share Units Agreement between the Registrant and our Chief Executive Officer under the Incentive Plan (incorporated by reference to Exhibit 10.1 to the Registrant’s Quarterly Report on Form 10-Q filed August 4, 2016 (File No. 001-35961)(the August 4, 2016 10-Q)).
|
|
10.30
|
|
Form of Share Appreciation Rights Agreement between the Registrant and our Chief Executive Officer under the Incentive Plan (incorporated by reference to Exhibit 10.2 to the August 4, 2016 10-Q).
|
|
10.31
|
|
Executive Service Agreement, dated December 15, 2004, between UPC Services Limited and Charles Bracken (incorporated by reference to Exhibit 10.36 to LGI’s Annual Report on Form 10-K filed February 24, 2010 (File No. 000-51360)).
|
|
10.32
|
|
Executive Services Agreement effective January 1, 2011, between Liberty Global Europe B.V. and Diederik Karsten (incorporated by reference to Exhibit 10.45 to LGI’s Annual Report on Form 10-K filed February 24, 2011 (File No. 000-51360)).
|
|
10.33
|
|
Letter Agreement dated December 12, 2016 between LGI and Bernard G. Dvorak (incorporated by reference to Exhibit 10.1 to the Registrant’s Current Report on Form 8-K filed December 14, 2016 (File No. 001-51360)).
|
|
10.34
|
|
Trade Mark Licence, dated as of April 3, 2006, between Virgin Enterprises Limited and NTL Group Limited (incorporated by reference to Exhibit 10.2 to Virgin Media’s Quarterly Report on Form 10-Q filed on August 9, 2006 (File No. 000-50886)).
|
|
10.35
|
|
Amendment Letter No. 1, dated February 8, 2007, to the Trade Mark Licence between Virgin Enterprises Limited and Virgin Media Limited dated April 3, 2006 (incorporated by reference to Exhibit 10.5 to Virgin Media’s Quarterly Report on Form 10-Q filed on August 8, 2007 (File No. 000-50886)).
|
|
10.36
|
|
Amendment Letter No. 2, dated October 1, 2007, to the Trade Mark Licence between Virgin Enterprises Limited and Virgin Media Limited dated April 3, 2006 (incorporated by reference to Exhibit 10.6 to Virgin Media’s Quarterly Report on Form 10-Q filed on November 8, 2007 (File No. 000-50886)).
|
|
10.37
|
|
Trade Mark Licence between Virgin Enterprises Limited and Virgin Media Limited dated December 16, 2009 (incorporated by reference to Exhibit 10.83 to Virgin Media’s Annual Report on Form 10-K filed on February 26, 2010 (File No. 000-50886)).
|
|
10.38
|
|
Amended and Restated Contribution and Transfer Agreement, dated July 21, 2016, as amended and restated December 31, 2016, by and among, Liberty Global Europe Holding B.V., the Registrant, Vodafone International Holdings B.V., Vodafone Group Plc and Lynx Global Europe II B.V. (incorporated by reference to Exhibit 10.1 to the Registrant’s Current Report on Form 8-K filed January 6, 2017 (File No. 001-35961)(the January 2017 8-K)).
|
|
10.39
|
|
Shareholders' Agreement, dated December 31, 2016, by and among, Vodafone International Holdings B.V., Vodafone Group Plc, Liberty Global Europe Holding B.V., the Registrant and Lynx Global Europe II B.V. (incorporated by reference to Exhibit 10.2 to the January 2017 8-K).
|
|
21 -- List of Subsidiaries*
|
||
|
23 -- Consent of Experts and Counsel:
|
||
|
23.1
|
|
Consent of KPMG LLP*
|
|
31 -- Rule 13a-14(a)/15d-14(a) Certification:
|
||
|
31.1
|
|
Certification of President and Chief Executive Officer*
|
|
31.2
|
|
Certification of Executive Vice President and Chief Financial Officer (Principal Financial Officer)*
|
|
32 -- Section 1350 Certification **
|
||
|
101.SCH
|
XBRL Taxonomy Extension Schema Document*
|
|
|
101.CAL
|
XBRL Taxonomy Extension Calculation Linkbase Document*
|
|
|
101.DEF
|
XBRL Taxonomy Extension Definition Linkbase*
|
|
IV-6
|
101.LAB
|
XBRL Taxonomy Extension Label Linkbase Document*
|
|
|
101.PRE
|
XBRL Taxonomy Extension Presentation Linkbase Document*
|
|
_______________
*
Filed herewith
** Furnished herewith
|
Item 16.
|
FORM 10-K SUMMARY
|
None.
IV-7
SIGNATURES
Pursuant to the requirements of Section 13 or 15(d) of the Securities Exchange Act of 1934, the Registrant has duly caused this report to be signed on its behalf by the undersigned, thereunto duly authorized.
|
|
LIBERTY GLOBAL PLC
|
||
|
Dated:
|
February 15, 2017
|
/s/ BRYAN H. HALL
|
|
|
Bryan H. Hall
Executive Vice President, General Counsel and Secretary
|
|||
Pursuant to the requirements of the Securities Exchange Act of 1934, this report has been signed below by the following persons on behalf of the Registrant and in the capacities and on the date indicated.
|
Signature
|
Title
|
Date
|
||
|
/s/ JOHN C. MALONE
|
Chairman of the Board
|
February 15, 2017
|
||
|
John C. Malone
|
||||
|
/s/ MICHAEL T. FRIES
|
President, Chief Executive Officer and Director
|
February 15, 2017
|
||
|
Michael T. Fries
|
||||
|
/s/ ANDREW J. COLE
|
Director
|
February 15, 2017
|
||
|
Andrew J. Cole
|
||||
|
/s/ MIRANDA CURTIS
|
Director
|
February 15, 2017
|
||
|
Miranda Curtis
|
||||
|
/s/ JOHN W. DICK
|
Director
|
February 15, 2017
|
||
|
John W. Dick
|
||||
|
/s/ PAUL A. GOULD
|
Director
|
February 15, 2017
|
||
|
Paul A. Gould
|
||||
|
/s/ RICHARD R. GREEN
|
Director
|
February 15, 2017
|
||
|
Richard R. Green
|
||||
|
/s/ DAVID E. RAPLEY
|
Director
|
February 15, 2017
|
||
|
David E. Rapley
|
||||
|
/s/ LARRY E. ROMRELL
|
Director
|
February 15, 2017
|
||
|
Larry E. Romrell
|
||||
|
/s/ J.C. SPARKMAN
|
Director
|
February 15, 2017
|
||
|
J.C. Sparkman
|
||||
|
/s/ J. DAVID WARGO
|
Director
|
February 15, 2017
|
||
|
J. David Wargo
|
||||
|
/s/ CHARLES H.R. BRACKEN
|
Executive Vice President and Chief Financial Officer
|
February 15, 2017
|
||
|
Charles H.R. Bracken
|
||||
|
/s/ JASON WALDRON
|
Senior Vice President and Chief Accounting Officer
|
February 15, 2017
|
||
|
Jason Waldron
|
||||
IV-8
SCHEDULE I
(Parent Company Information - See Notes to Consolidated Financial Statements)
CONDENSED BALANCE SHEETS
(Parent Company Only)
|
December 31,
|
|||||||
|
2016
|
2015
|
||||||
|
|
in millions
|
||||||
|
ASSETS
|
|||||||
|
Current assets:
|
|||||||
|
Cash and cash equivalents
|
$
|
|
|
$
|
|
|
|
|
Interest receivables — related-party
|
|
|
|
|
|||
|
Other receivables — related-party
|
|
|
|
|
|||
|
Other current assets
|
|
|
|
|
|||
|
Total current assets
|
|
|
|
|
|||
|
Long-term notes receivable — related-party
|
|
|
|
|
|||
|
Investments in consolidated subsidiaries, including intercompany balances
|
|
|
|
|
|||
|
Other assets, net
|
|
|
|
|
|||
|
Total assets
|
$
|
|
|
$
|
|
|
|
IV-9
LIBERTY GLOBAL PLC
SCHEDULE I
(Parent Company Information - See Notes to Consolidated Financial Statements)
CONDENSED BALANCE SHEETS — (Continued)
(Parent Company Only)
|
December 31,
|
|||||||
|
2016
|
2015
|
||||||
|
in millions
|
|||||||
|
LIABILITIES AND SHAREHOLDERS’ EQUITY
|
|||||||
|
Current liabilities:
|
|||||||
|
Accounts payable
|
$
|
|
|
$
|
|
|
|
|
Other payables — related-party
|
|
|
|
|
|||
|
Current portion of notes payable — related-party
|
|
|
|
|
|||
|
Accrued liabilities and other
|
|
|
|
|
|||
|
Total current liabilities
|
|
|
|
|
|||
|
Long-term notes payable — related-party
|
|
|
|
|
|||
|
Other long-term liabilities — related-party
|
|
|
|
|
|||
|
Other long-term liabilities
|
|
|
|
|
|||
|
Total liabilities
|
|
|
|
|
|||
|
Commitments and contingencies
|
|
|
|||||
|
Shareholders’ equity:
|
|||||||
|
Liberty Global Shares — Class A, $0.01 nominal value. Issued and outstanding 253,827,604 and 252,766,455 shares, respectively
|
|
|
|
|
|||
|
Liberty Global Shares — Class B, $0.01 nominal value. Issued and outstanding 10,805,850 and 10,472,517 shares, respectively
|
|
|
|
|
|||
|
Liberty Global Shares — Class C, $0.01 nominal value. Issued and outstanding 634,391,072 and 584,044,394 shares, respectively
|
|
|
|
|
|||
|
LiLAC Shares — Class A, $0.01 nominal value. Issued and outstanding 50,317,930 and 12,630,580 shares, respectively
|
|
|
|
|
|||
|
LiLAC Shares — Class B, $0.01 nominal value. Issued and outstanding 1,888,323 and 523,423 shares, respectively
|
|
|
|
|
|||
|
LiLAC Shares — Class C, $0.01 nominal value. Issued and outstanding 120,889,034 and 30,772,874 shares, respectively
|
|
|
|
|
|||
|
Additional paid-in capital
|
|
|
|
|
|||
|
Accumulated deficit
|
(
|
)
|
(
|
)
|
|||
|
Accumulated other comprehensive earnings (loss), net of taxes
|
(
|
)
|
|
|
|||
|
Treasury shares, at cost
|
(
|
)
|
(
|
)
|
|||
|
Total shareholders’ equity
|
|
|
|
|
|||
|
Total liabilities and shareholders’ equity
|
$
|
|
|
$
|
|
|
|
IV-10
SCHEDULE I
(Parent Company Information - See Notes to Consolidated Financial Statements)
CONDENSED STATEMENTS OF OPERATIONS
(Parent Company Only)
|
Year ended December 31,
|
|||||||||||
|
2016
|
2015
|
2014
|
|||||||||
|
in millions
|
|||||||||||
|
Operating costs and expenses:
|
|||||||||||
|
Selling, general and administrative (including share-based compensation)
|
$
|
|
|
$
|
|
|
$
|
|
|
||
|
Related-party fees and allocations
|
|
|
|
|
|
|
|||||
|
Depreciation and amortization
|
|
|
|
|
|
|
|||||
|
Other operating expenses
|
|
|
|
|
|
|
|||||
|
Operating loss
|
(
|
)
|
(
|
)
|
(
|
)
|
|||||
|
Non-operating income (expense):
|
|||||||||||
|
Interest expense — related-party
|
(
|
)
|
(
|
)
|
(
|
)
|
|||||
|
Interest income — related-party
|
|
|
|
|
|
|
|||||
|
Realized and unrealized gains on derivative instruments, net
|
|
|
|
|
|
|
|||||
|
Foreign currency transaction gains (losses), net
|
|
|
(
|
)
|
(
|
)
|
|||||
|
Other expense, net
|
(
|
)
|
(
|
)
|
(
|
)
|
|||||
|
|
|
|
|
|
|
||||||
|
Earnings before income taxes and equity in earnings (losses) of consolidated subsidiaries, net
|
|
|
|
|
|
|
|||||
|
Equity in earnings (losses) of consolidated subsidiaries, net
|
|
|
(
|
)
|
(
|
)
|
|||||
|
Income tax expense
|
(
|
)
|
(
|
)
|
(
|
)
|
|||||
|
Net earnings (loss)
|
$
|
|
|
$
|
(
|
)
|
$
|
(
|
)
|
||
IV-11
SCHEDULE I
(Parent Company Information - See Notes to Consolidated Financial Statements)
CONDENSED STATEMENTS OF CASH FLOWS
(Parent Company Only)
|
Year ended December 31,
|
|||||||||||
|
|
2016
|
2015
|
2014
|
||||||||
|
|
in millions
|
||||||||||
|
Cash flows from operating activities:
|
|||||||||||
|
Net earnings (loss)
|
$
|
|
|
$
|
(
|
)
|
$
|
(
|
)
|
||
|
Adjustments to reconcile net earnings (loss) to net cash provided by operating activities:
|
|||||||||||
|
Equity in losses (earnings) of consolidated subsidiaries, net
|
(
|
)
|
|
|
|
|
|||||
|
Share-based compensation expense
|
|
|
|
|
|
|
|||||
|
Related-party fees and allocations
|
|
|
|
|
|
|
|||||
|
Depreciation and amortization
|
|
|
|
|
|
|
|||||
|
Other operating expenses
|
|
|
|
|
|
|
|||||
|
Realized and unrealized gains on derivative instruments, net
|
|
|
|
|
(
|
)
|
|||||
|
Foreign currency transaction losses (gains), net
|
(
|
)
|
|
|
|
|
|||||
|
Deferred income tax benefit
|
(
|
)
|
(
|
)
|
(
|
)
|
|||||
|
Changes in operating assets and liabilities:
|
|||||||||||
|
Receivables and other operating assets
|
|
|
|
|
|
|
|||||
|
Payables and accruals
|
|
|
(
|
)
|
(
|
)
|
|||||
|
Net cash provided by operating activities
|
|
|
|
|
|
|
|||||
|
Cash flows from investing activities:
|
|||||||||||
|
Distribution and repayments from (investments in and advances to) consolidated subsidiaries, net
|
(
|
)
|
|
|
(
|
)
|
|||||
|
Other investing activities, net
|
|
|
(
|
)
|
|
|
|||||
|
Net cash provided (used) by investing activities
|
(
|
)
|
|
|
(
|
)
|
|||||
|
Cash flows from financing activities:
|
|||||||||||
|
Borrowings of related-party debt
|
|
|
|
|
|
|
|||||
|
Repayments of related-party debt
|
(
|
)
|
(
|
)
|
(
|
)
|
|||||
|
Repurchase of Liberty Global ordinary shares
|
(
|
)
|
(
|
)
|
(
|
)
|
|||||
|
Proceeds (payments) associated with call option contracts, net
|
|
|
(
|
)
|
(
|
)
|
|||||
|
Proceeds from issuance of Liberty Global shares upon exercise of options
|
|
|
|
|
|
|
|||||
|
Proceeds received from subsidiaries in connection with the issuance of Liberty Global ordinary shares
|
|
|
|
|
|
|
|||||
|
Other financing activities, net
|
(
|
)
|
(
|
)
|
(
|
)
|
|||||
|
Net cash
used
by financing activities
|
(
|
)
|
(
|
)
|
(
|
)
|
|||||
|
Effect of exchange rate changes on cash
|
(
|
)
|
|
|
(
|
)
|
|||||
|
Net
increase (decrease)
in cash and cash equivalents
|
|
|
(
|
)
|
(
|
)
|
|||||
|
Cash and cash equivalents:
|
|||||||||||
|
Beginning of period
|
|
|
|
|
|
|
|||||
|
End of period
|
$
|
|
|
$
|
|
|
$
|
|
|
||
IV-12
SCHEDULE II
VALUATION AND QUALIFYING ACCOUNTS
|
|
Allowance for doubtful accounts — Trade receivables
|
|||||||||||||||||||||
|
|
Balance at
beginning
of period
|
Additions to
costs and
expenses
|
Acquisitions
|
Impact of Dutch JV Transaction
|
Deductions
or write-offs
|
Foreign
currency
translation
adjustments
|
Balance at
end of
period
|
|||||||||||||||
|
|
in millions
|
|||||||||||||||||||||
|
Year ended December 31:
|
||||||||||||||||||||||
|
2014
|
$
|
|
|
|
|
|
|
|
|
(
|
)
|
(
|
)
|
$
|
|
|
||||||
|
2015
|
$
|
|
|
|
|
|
|
|
|
(
|
)
|
(
|
)
|
$
|
|
|
||||||
|
2016
|
$
|
|
|
|
|
|
|
(
|
)
|
(
|
)
|
(
|
)
|
$
|
|
|
||||||
IV-13
EXHIBIT INDEX
|
2 -- Plan of acquisition, reorganization, arrangement, liquidation or succession:
|
||
|
2.1
|
|
Rule 2.7 Announcement, dated November 16, 2015. (incorporated by reference to Exhibit 2.1 to the Registrant’s Current Report on Form 8-K/A filed November 18, 2015 (File No. 001-35961) (the November 2015 8-K/A)).
|
|
2.2
|
|
Co-operation Agreement, dated November 16, 2015, between Liberty Global plc and Cable & Wireless Communications plc (incorporated by reference to Exhibit 2.2 to the November 2015 8-K/A).
|
|
3 -- Articles of Incorporation and Bylaws:
|
||
|
3.1
|
|
Articles of Association of Liberty Global plc, effective as of July 1, 2015 (incorporated by reference to Exhibit 3.1 to the Registrant’s Registration Statement on Form 8-A filed June 19, 2015 (File No. 001-35961)).
|
|
4 -- Instruments Defining the Rights of Securities Holders, including Indentures:
|
||
|
4.1
|
|
Senior Secured Credit Facility Agreement originally dated January 16, 2004, as amended and restated on December 19, 2016, among UPC Broadband Holding B.V. (UPC Broadband Holding) and UPC Financing Partnership (UPC Financing) as Borrowers, The Bank of Nova Scotia, as Facility Agent,the Guarantors listed therein, the Security Agent and the bank and financial institutions acceding thereto from time to time (the UPC Broadband Holding Bank Facility) (incorporated by reference to Exhibit 4.1 to the Registrant's Current Report on Form 8-K filed December 23, 2016 (File No. 001-35961)).
|
|
4.2
|
|
Additional Facility AC Accession Agreement, dated November 16, 2011, among UPC Financing, as Borrower, UPC Broadband Holding, The Bank of Nova Scotia, as Facility Agent and Security Agent, and UPCB Finance V Limited, as an Additional Facility AC Lender, under the UPC Broadband Holding Bank Facility (incorporated by reference to Exhibit 4.47 to Liberty Global Inc.’s (LGI) Annual Report on Form 10-K filed February 22, 2012 (File No. 000-51360) (the LGI 2011 10-K)).
|
|
4.3
|
|
Additional Facility AD Accession Agreement, dated February 7, 2012, among UPC Financing, as Borrower, UPC Broadband Holding, The Bank of Nova Scotia, as Facility Agent and Security Agent, and UPCB Finance VI Limited, as an Additional Facility AD Lender, under the UPC Broadband Holding Bank Facility (incorporated by reference to Exhibit 4.48 to the LGI 2011 10-K).
|
|
4.4
|
|
Indenture dated April 15, 2015, among UPCB Finance IV Limited, The Bank of New York Mellon, London Branch as Trustee, Principal Paying Agent, Transfer Agent and Security Agent, The Bank of New York Mellon as New York Paying Agent, New York Transfer Agent and Dollar Notes Registrar and The Bank of New York Mellon (Luxembourg) S.A. as Euro Notes Registrar and Transfer Agent (incorporated by reference to Exhibit 4.1 to the Registrant’s Current Report on Form 8-K/A filed April 21, 2015 (File No. 001-35961) (the April 2015 8-K/A)).
|
|
4.5
|
|
Additional Facility AK Accession Agreement, dated April 15, 2015, among UPC Financing as Borrower, The Bank of Nova Scotia as Facility Agent and Security Agent, UPC Broadband Holding and UPCB Finance IV Limited as Additional Facility AK Lender, under the UPC Broadband Holding Bank Facility (incorporated by reference to Exhibit 4.2 to the April 2015 8-K/A).
|
|
4.6
|
|
Additional Facility AL Accession Agreement, dated April 15, 2015, among UPC Financing as Borrower, The Bank of Nova Scotia as Facility Agent and Security Agent, UPC Broadband Holding and UPCB Finance IV Limited as Additional Facility AL Lender, under the UPC Broadband Holding Bank Facility (incorporated by reference to Exhibit 4.3 to the April 2015 8-K/A).
|
|
4.7
|
|
Additional Facility AL2 Accession Agreement, dated May 20, 2015, among UPC Financing as Borrower, The Bank of New York Nova Scotia as Facility Agent and Security Agent, UPC Broadband Holding and UPCB Finance IV Limited as Additional Facility AL2 Lender, under the UPC Broadband Holding Bank Facility (incorporated by reference to Exhibit 4.1 to the Registrant’s Current Report on Form 8-K/A filed May 21, 2015 (File No. 001-35961)).
|
|
4.8
|
|
Additional Facility AM Accession Agreement, dated August 3, 2015, among UPC Financing as Borrower, The Bank of Nova Scotia as Facility Agent and Security Agent and the financial institutions listed therein as Additional Facility AM Lenders, under the UPC Broadband Holding Bank Facility (incorporated by reference to Exhibit 4.1 to the Registrant’s Current Report on Form 8-K filed August 6, 2015 (File No. 001-35961)).
|
|
4.9
|
|
Additional Facility AN Accession Agreement dated August 3, 2016, between, among others, UPC Financing as Borrower and The Bank of Nova Scotia as Facility Agent and Security Agent and the financial institutions listed therein as Additional Facility AN Lenders under the UPC Broadband Holding Bank Facility (incorporated by reference to Exhibit 4.1 to the Registrant’s Current Report on Form 8-K filed August 3, 2016 (File No. 001-35961)).
|
|
4.10
|
|
Additional Facility AO Accession Agreement dated November 23, 2016, between, among others, UPC Financing as Borrower, UPC Broadband Holding, The Bank of Nova Scotia as Facility Agent and Security Agent and the financial institutions listed therein as Additional Facility AO Lenders, under the UPC Broadband Holding Bank Facility (incorporated by reference to Exhibit 4.1 to the Registrant’s Current Report on Form 8-K filed November 30, 2016 (File No. 001-35961)).
|
|
4.11
|
|
Additional Facility AP Accession Agreement dated February 2, 2017, between, among others, UPC Financing as the Borrower, UPC Broadband Holding and The Bank of Nova Scotia as the Facility Agent and Security Agent under the UPC Broadband Holding Bank Facility (incorporated by reference to Exhibit 4.2 to the Registrant’s Current Report on Form 8-K filed February 7, 2017 (File No. 001-35961)).
|
|
4.12
|
|
€2,300,000,000 Credit Agreement, originally dated August 1, 2007, and as amended and restated by supplemental agreements dated August 22, 2007, September 11, 2007, October 8, 2007, June 23, 2009, August 25, 2009, October 4, 2010 and as further amended and restated on November 2, 2015 among Telenet N.V. as Borrower, The Bank of Nova Scotia N.V. as Facility Agent, the parties listed therein as Original Guarantors, ABN AMRO Bank N.V., BNP Paribas S.A. and J.P. Morgan PLC as Mandated Lead Arrangers, KBC Bank N.V. as Security Agent, and the financial institutions listed therein as Initial Original Lenders (the Telenet Credit Facility) (incorporated by reference to Exhibit 4.1 to the Registrant’s Current Report on Form 8-K filed November 6, 2015 (File No. 000-35961)).
|
|
4.13
|
|
Telenet Additional Facility U Accession Agreement, dated August 16, 2012, among, inter alia, Telenet International Finance S.a.r.l (Telenet International) as Borrower, Telenet N.V. and Telenet International as Guarantors, The Bank of Nova Scotia as Facility Agent, KBC Bank N.V. as Security Agent and the financial institutions listed therein as additional Facility U Lenders, under the Telenet Credit Facility (incorporated by reference to Exhibit 4.2 to LGI’s Quarterly Report on Form 10-Q filed November 5, 2012 (File No. 000-51360) (the LGI November 5, 2012 10-Q)).
|
|
4.14
|
|
Telenet Additional Facility V Accession Agreement, dated August 16, 2012, among, inter alia, Telenet International as Borrower, Telenet N.V. and Telenet International as Guarantors, The Bank of Nova Scotia as Facility Agent, KBC Bank N.V. as Security Agent and the financial institutions listed therein as additional Facility V Lenders, under the Telenet Credit Facility (incorporated by reference to Exhibit 4.3 to the LGI November 5, 2012 10-Q).
|
|
4.15
|
|
Telenet Additional Facility X Accession Agreement, dated April 11, 2014, among, inter alia, Telenet International as Borrower, Telenet N.V. and Telenet International as Guarantors, The Bank of Nova Scotia as Facility Agent, KBC Bank N.V. as Security Agent and the financial institutions listed therein as Additional Facility X Lenders, under the Telenet Credit Facility (incorporated by reference to Exhibit 4.3 to the Registrant’s Current Report on Form 8-K filed April 15, 2014 (File No. 001-35961)).
|
|
4.16
|
|
Additional Facility Z Accession Agreement, dated May 7, 2015, between, among others, Telenet International as Borrower, Telenet N.V., The Bank of Nova Scotia as Facility Agent, KBC Bank N.V. Security Agent and The Royal Bank of Scotland PLC, Societe Generale, London Branch, Deutsche Bank AG, London Branch, Credit Suisse AG, London Branch, ScotiaBank Europe PLC and Goldman Sachs Bank USA as Additional Facility Z Lenders, under the Telenet Credit Facility (incorporated by reference to Exhibit 4.1 to the Registrant’s Current Report on Form 8-K filed May 13, 2015 (File No. 001-35961)).
|
|
4.17
|
|
Telenet Additional Facility X2 Accession Agreement, dated July 1, 2015, among inter alia, Telenet International as Borrower, Telenet N.V. and Telenet International as Guarantors, The Bank of Nova Scotia as Facility Agent, KBC Bank N.V. as Security Agent and the financial institutions listed therein as Additional Facility X2 Lenders, under the Telenet Credit Facility (incorporated by reference to Exhibit 4.1 to the Registrant’s Current Report on Form 8-K filed July 8, 2015 (File No. 001-35961)).
|
|
4.18
|
|
Telenet Additional Facility AB Accession Agreement, dated July 24, 2015, among, inter alia, Telenet International as Borrower, Telenet N.V. and Telenet International as Guarantors, and the other parties thereto, under the Telenet Credit Facility (incorporated by reference to Exhibit 4.1 to the Registrant's Current Report on Form 8-K filed July 30, 2015 (File No. 001-35061)).
|
|
4.19
|
|
Telenet Additional Facility AE Accession Agreement dated November 3, 2016, among, inter alia, Telenet International as Borrower, The Bank of Nova Scotia as Facility Agent, KBC Bank N.V. as Security Agent and the financial institutions listed therein as Additional Facility AE Lenders, under the Telenet Credit Facility (incorporated by reference to Exhibit 4.1 to the Registrant’s Current Report on Form 8-K filed November 10, 2016 (File No. 001-35961) (the November 2016 8-K)).
|
|
4.20
|
|
Telenet Additional Facility AF Accession Agreement dated November 3, 2016 among, inter alia, Telenet Financing USD LLC, The Bank of Nova Scotia as Facility Agent, KBC Bank N.V. as Security Agent and the financial institutions listed therein as Additional Facility AF Lenders, under the Telenet Credit Facility (incorporated by reference to Exhibit 4.2 to the November 2016 8-K).
|
|
4.21
|
|
Telenet Additional Facility AG Accession Agreement dated November 22, 2016, among, inter alia, Telenet International, The Bank of Nova Scotia as Facility Agent, KBC Bank N.V. as Security Agent and the financial institutions listed therein as Additional Facility AG Lenders, under the Telenet Credit Facility (incorporated by reference to Exhibit 4.1 to the Registrant’s Current Report on Form 8-K filed November 29, 2016 (File No. 001-35961)).
|
|
4.22
|
|
Indenture dated December 14, 2012, between Unitymedia Hessen GmbH & Co. KG, Unitymedia NRW GmbH, The Bank of New York Mellon, London Branch, as Trustee, Transfer Agent and Principal Paying Agent, The Bank of New York Mellon as Paying Agent in New York, The Bank of New York Mellon (Luxembourg) S.A. as Registrar and Credit Suisse AG, London Branch, as Security Trustee (incorporated by reference to Exhibit 4.1 to the Registrant's Current Report on Form 8-K filed December 20, 2012 (File No. 000-51360)).
|
|
4.23
|
|
Indenture dated December 17, 2014, between Unitymedia Hessen GmbH & Co. KG, Unitymedia NRW GmbH, The Bank of New York Mellon, London Branch, as Trustee, Transfer Agent and Principal Paying Agent, The Bank of New York Mellon as New York Paying Agent and New York Transfer Agent, The Bank of New York Mellon (Luxembourg) S.A. as Registrar and Credit Suisse AG, London Branch, as Security Trustee (incorporated by reference to Exhibit 4.1 to the Registrant's Current Report on Form 8-K/A filed December 18, 2014 (File No. 001-35961)).
|
|
4.24
|
|
Indenture, dated as of March 3, 2011, among Virgin Media Secured Finance PLC, the Guarantors party thereto, The Bank of New York Mellon as Trustee and Paying Agent and The Bank of New York Mellon (Luxembourg) S.A. as Luxembourg Paying Agent (incorporated by reference to Exhibit 4.1 to Virgin Media Inc.’s (Virgin Media) Current Report on Form 8-K filed on March 3, 2011 (File No. 000-50886).
|
|
4.25
|
|
Indenture dated February 22, 2013, between, among others, Lynx I Corp., as Issuer, The Bank of New York Mellon, London Branch, as Trustee, Transfer Agent and Principal Paying Agent and The Bank of New York Mellon, as Paying Agent and Newco Security Trustee (incorporated by reference to Exhibit 4.1 to LGI’s Current Report on Form 8-K/A filed February 27, 2013 (File No. 000-51360) (the LGI February 2013 8-K/A).
|
|
4.26
|
|
Indenture, dated as of February 22, 2013, among Lynx II Corp., as Issuer, The Bank of New York Mellon, London Branch, as trustee, Transfer Agent and Principal Paying Agent and The Bank of New York Mellon, as Paying Agent and Newco Security Trustee (incorporated by reference to Exhibit 4.2 to the LGI February 2013 8-K/A).
|
|
4.27
|
|
First Supplemental Indenture, dated as of June 7, 2013, between, among others, Virgin Media Secured Finance PLC, Virgin Media Inc. (Virgin Media) and The Bank of New York Mellon as Trustee, to the Indenture dated as of March 3, 2011 for Virgin Media 5.25% Senior Secured Notes and 5.50% Senior Secured Notes each due 2021 (incorporated by reference to Exhibit 4.12 to the Registrant’s Current Report on Form 8-K filed June 12, 2013 (File No. 001-35961)(the June 2013 8-K)).
|
|
4.28
|
|
Accession Agreement, dated as of June 7, 2013, among Virgin Media Secured Finance PLC as Acceding Issuer, Lynx I Corp. and The Bank of New York Mellon, as Trustee (incorporated by reference to Exhibit 4.13 to the June 2013 8-K).
|
|
4.29
|
|
First Supplemental Indenture, dated as of June 7, 2013, between, among others, Virgin Media Secured Finance PLC and The Bank of New York Mellon as Trustee, to the Indenture dated as of February 22, 2013 for Lynx I Corp. 5⅜% Senior Secured Notes and 6.00% Senior Secured Notes each due 2021 (incorporated by reference to Exhibit 4.15 to the June 2013 8-K).
|
|
4.30
|
|
Accession Agreement, dated as of June 7, 2013, among Lynx II Corp., Virgin Media Finance PLC and The Bank of New York Mellon as Trustee and Paying Agent (incorporated by reference to Exhibit 4.16 to the June 2013 8-K).
|
|
4.31
|
|
First Supplemental Indenture, dated June 7, 2013, between, among others, Virgin Media Finance PLC, Virgin Media and The Bank of New York Mellon, as Trustee and Paying Agent, to the Indenture dated as of February 22, 2013 Lynx II Corp. 6⅜% Senior Notes and 7.00% Senior Notes each due 2023 (incorporated by reference to Exhibit 4.18 to the June 2013 8-K).
|
|
4.32
|
|
Amendment dated June 14, 2013, to the Senior Facilities Agreement, between, and among others, Virgin Media Investment Holdings Limited, certain other subsidiaries of Virgin Media and the lenders thereto (incorporated by reference to Exhibit 4.1 to the Registrant’s Current Report on Form 8-K filed June 21, 2013 (File No. 001-35961)).
|
|
4.33
|
|
Senior Facilities Agreement, dated as of June 7, 2013, as amended on June 14, 2013 and as amended and restated on July 30 2015, among, inter alia, Virgin Media Finance PLC, certain other subsidiaries of Virgin Media and the lenders thereto (the VMF Senior Facilities Agreement) (incorporated by reference to Exhibit 4.13 to the Registrant’s Quarterly Report on Form 10-Q filed August 4, 2015 (File No. 001-35061)).
|
|
4.34
|
|
Indenture dated March 28, 2014 between Virgin Media Secured Finance PLC, The Bank of New York Mellon, London Branch, as Trustee, Transfer Agent and Principal Paying Agent, The Bank of New York Mellon as Paying Agent, and The Bank of New York Mellon (Luxembourg) S.A., as Registrar (incorporated by reference to Exhibit 4.1 to the Registrant’s Current Report on Form 8-K/A filed April 3, 2014 (File No. 001-35961)).
|
|
4.35
|
|
Virgin Additional Facility E Accession Agreement, dated April 17, 2014, among, inter alia, Virgin Media SFA Finance Limited as Borrower, certain other subsidiaries of Virgin Media, The Bank of Nova Scotia as Facility Agent and the financial institutions listed therein as Additional Facility E Lenders, under the VMF Senior Facilities Agreement (incorporated by reference to Exhibit 4.2 to the Registrant’s Current Report on Form 8-K filed April 23, 2014 (File No. 001-35961)).
|
|
4.36
|
|
Indenture dated January 28, 2015 between Virgin Media Secured Finance PLC, The Bank of New York Mellon, London Branch, as Trustee and Paying Agent and The Bank of New York Mellon (Luxembourg) S.A., as Registrar and Transfer Agent (incorporated by reference to Exhibit 4.1 to the Registrant’s Current Report on Form 8-K/A filed February 3, 2015 (File No. 001-35961) (the February 2015 8-K/A)).
|
|
4.37
|
|
Indenture dated January 28, 2015 between Virgin Media Finance PLC, The Bank of New York Mellon, London Branch, as Trustee and Principal Paying Agent, The Bank of Mellon as Paying Agent and Dollar Notes Transfer Agent and Registrar and The Bank of New York Mellon (Luxembourg) S.A., as Euro Notes Registrar and Transfer Agent (incorporated by reference to Exhibit 4.2 to the February 2015 8-K/A).
|
|
4.38
|
|
Additional I Facility Accession Deed dated December 16, 2016, among Virgin Media Investment Holdings Limited, Virgin Media Bristol LLC as Borrower, The Bank of Nova Scotia as Facility Agent, and The Bank of Nova Scotia as Additional I Facility Lender, under the VMF Senior Facilities Agreement (incorporated by reference to Exhibit 4.1 to the Registrant’s Current Report on Form 8-K filed December 22, 2016 (File No. 001-35961)(the December 2016 8-K)).
|
|
4.39
|
|
Amendment letter dated December 16, 2016, between Virgin Media Investment Holdings Limited and The Bank of Nova Scotia as the Facility Agent, amending the VMF Senior Facilities Agreement (incorporated by reference to Exhibit 4.2 to the December 2016 8-K).
|
|
4.40
|
|
Additional J Facility Accession Deed dated February 2, 2017, between Virgin Media Investment Holdings Limited as the Company, Virgin Media SFA Finance Limited as the Borrower, The Bank of Nova Scotia as the Facility Agent and The Bank of Nova Scotia as Additional J Facility Lender under the VMF Senior Facilities Agreement (incorporated by reference to Exhibit 4.1 to the Registrant’s Current Report on Form 8-K filed February 7, 2017 (File No. 001-35961)).
|
|
4.41
|
|
Indenture dated January 24, 2014, between VTR Finance B.V., The Bank of New York Mellon, London Branch, as Trustee and Security Agent, and The Bank of New York Mellon as Paying Agent, Registrar and Transfer Agent (incorporated by reference to Exhibit 4.1 to the Registrant’s Current Report on Form 8-K filed January 24, 2014 (File No. 001-35961)).
|
|
4.42
|
|
Credit Agreement, dated May 16, 2016, among LGE Coral Holdco Limited, Sable International Finance Limited and Coral-US Co-Borrower LLC as Initial Borrowers, The Bank of Nova Scotia as Administrative Agent, L/C Issuer and Swing Line Lender and FirstCaribbean International Bank (Bahamas) Limited, BNP Paribas Fortis SA/NV and Royal Bank of Canada as Alternative L/C Issuers, the other lenders a party thereto from time to time (the Coral Credit Agreement)(incorporated by reference to Exhibit 4.1 to the Registrant’s Current Report on Form 8-K filed May 20, 2016 (File No. 001-35961)(the May 2016 8-K)).
|
|
4.43
|
|
Indenture dated March 31, 2014, among Columbus International Inc., each of the Guarantors a party thereto, The Bank of New York Mellon as Trustee and The Bank of New York Mellon (Luxembourg) S.A. as Luxembourg Transfer Agent and Paying Agent (incorporated be reference to Exhibit 4.2 to the May 2016 8-K).
|
|
4.44
|
|
Indenture dated August 5, 2015, among Sable International Finance Limited as Issuer, each of the Guarantors a party thereto, Deutsche Bank Trust Company Americas as Trustee, Principal Paying Agent, Registrar and Transfer Agent and Deutsche Bank Luxembourg, S.A. as Luxembourg Paying Agent and (Regulation S) Transfer Agent (incorporated by reference to Exhibit 4.3 to the May 2016 8-K).
|
|
4.45
|
|
First Supplemental Indenture dated November 23, 2015, among Sable International Finance Limited as Issuer, each of the Guarantors a party thereto, and Deutsche Bank Trust Company Americas as Trustee, Principal Paying Agent, Registrar and Transfer Agent (incorporated by reference to Exhibit 4.4 to the May 2016 8-K).
|
|
4.46
|
|
First Supplemental Indenture dated March 10, 2015, among Columbus International Inc. as Issuer, each of the Guarantors a party thereto, and The Bank of New York Mellon as Trustee (incorporated by reference to Exhibit 4.5 to the May 2016 8-K).
|
|
4.47
|
|
Joinder Agreement dated October 7, 2016, among Sable International Finance Limited and Coral-US Co-Borrower LLC as Borrowers, the other Guarantors party thereto, The Bank of Nova Scotia as Administrative Agent and Security Trustee, and the financial institutions party thereto as Revolving Credit Lenders (incorporated by reference to Exhibit 4.1 to the Registrant’s Current Report on Form 8-K filed October 13, 2016 (File No. 001-35961)).
|
|
4.48
|
|
Joinder Agreement, dated November 18, 2016, among Sable International Finance Limited and Coral US Co-Borrower LLC as Borrowers, the other Guarantors party thereto, The Bank of Nova Scotia, as Administrative Agent and Security Trustee, and the financial institutions party thereto as Additional Term B-1B Facility Lenders (as defined therein) under the Coral Credit Agreement (incorporated by reference to Exhibit 4.1 to the Registrant’s Current Report on Form 8-K filed November 23, 2016 (File No. 001-35961)).
|
|
4.49
|
|
Amended and Restated First Lien Credit Agreement dated as of July 7, 2014, among Liberty Cablevision of Puerto Rico LLC (Liberty Puerto Rico), the Guarantors party thereto from time to time, The Bank of Nova Scotia, as Administrative Agent, each lender form time to time party thereto and Scotiabank de Puerto Rico as L/C Issuer and Swing Line Lender (incorporated by reference to Exhibit 4.1 to the Registrant’s Current Report on Form 8-K filed July 2, 2015 (File No. 001-35961) (the July 2015 8-K)).
|
|
4.50
|
|
Amended and Restated Second Lien Credit Agreement dated as of July 7, 2014, among Liberty Puerto Rico, the Guarantors party thereto from time to time, The Bank of Nova Scotia as Administrative Agent, and each lender from time to time party thereto (incorporated by reference to Exhibit 4.2 to the July 2015 8-K).
|
|
4.51
|
|
Additional Term B-1 Facility Joinder Agreement dated as of June 1, 2015, among Liberty Puerto Rico, The Bank of Nova Scotia as Administrative Agent and Collateral Agent and the Additional Term B-1 Facility Lenders party thereto (incorporated by reference to Exhibit 4.3 to the July 2015 8-K).
|
|
4.52
|
|
Additional Term B-2 Facility Joinder Agreement dated as of June 1, 2015, among Liberty Puerto Rico, The Bank of Nova Scotia as Administrative Agent and Collateral Agent and the Additional Term B-2 Facility Lenders party thereto (incorporated by reference to Exhibit 4.4 to the July 2015 8-K).
|
|
The Registrant undertakes to furnish to the Securities and Exchange Commission, upon request, a copy of all instruments with respect to long-term debt not filed herewith.
|
||
|
10 -- Material Contracts:
|
||
|
10.1
|
|
Deed of Assumption of Liberty Global plc, dated June 7, 2013 (incorporated by reference to Exhibit 10.1 to the Registrant’s Current Report on Form 8-K filed June 7, 2013 (File No. 001-35961)(the June 7, 2013 8-K)).
|
|
10.2
|
|
Liberty Global 2014 Incentive Plan Effective March 1, 2014 as amended and restated February 24, 2015 (the Incentive Plan) (incorporated by reference to Exhibit 10.1 to the Registrant’s Quarterly Report on Form 10-Q filed May 7, 2015 (File No. 001-35961)).
|
|
10.3
|
|
Liberty Global 2014 Nonemployee Director Incentive Plan Effective March 1, 2014 (the Director Plan) (incorporated by reference to Appendix B to the Registrant’s Proxy Statement on Schedule 14A filed December 19, 2013 (File No. 001-35961)).
|
|
10.4
|
|
Form of Performance Share Units Agreement under the Incentive Plan (incorporated by reference to Exhibit 10.6 to the Registrant’s Quarterly Report on Form 10-Q filed May 6, 2014 (File No. 001-35961)).
|
|
10.5
|
|
Form of Performance Share Units Agreement under the Incentive Plan (incorporated by reference to Exhibit 10.1 to the Registrant’s Quarterly Report on Form 10-Q filed August 4, 2015 (File No. 001-35961)).
|
|
10.6
|
|
Form of Non-Qualified Share Option Agreement under the Director Plan (incorporated by reference to Exhibit 10.3 to the Registrant’s Quarterly Report on Form 10-Q filed August 5, 2014 (File No. 001-35961) (the August 5, 2014 10-Q)).
|
|
10.7
|
|
Form of Restricted Share Units Agreement under the Director Plan (incorporated by reference to Exhibit 10.4 to the August 5, 2014 10-Q).
|
|
10.8
|
|
Form of Share Appreciation Rights Agreement under the Incentive Plan (incorporated by reference to Exhibit 10.5 to the August 5, 2014 10-Q).
|
|
10.9
|
|
Form of Restricted Share Units Agreement under the Incentive Plan (incorporated by reference to Exhibit 10.6 to the August 5, 2014 10-Q).
|
|
10.10
|
|
Liberty Global, Inc. 2005 Incentive Plan (as amended and restated effective June 7, 2013) (the 2005 Incentive Plan) (incorporated by reference to Exhibit 10.2 to the June 7, 2013 8-K).
|
|
10.11
|
|
Liberty Global, Inc. 2005 Nonemployee Director Incentive Plan (as amended and restated effective June 7, 2013) (the 2005 Director Plan) (incorporated by reference to Exhibit 10.3 to the June 7, 2013 8-K).
|
|
10.12
|
|
Virgin Media 2010 Stock Incentive Plan (as amended and restated effective June 7, 2013) (incorporated by reference to Exhibit 10.4 to the June 7, 2013 8-K).
|
|
10.13
|
|
Form of Non-Qualified Share Option Agreement under the 2005 Director Plan (incorporated by reference to Exhibit 10.6 to the Registrant’s Quarterly Report on Form 10-Q filed August 1, 2013 (File No. 001-35961)).
|
|
10.14
|
|
Liberty Global Compensation Policy for Nonemployee Directors effective June 26, 2014 (incorporated by reference to Appendix A to the Registrant’s Proxy Statement on Schedule 14A filed April 30, 2014 (File No. 001-35961)).
|
|
10.15
|
|
Form of Deed of Indemnity between Liberty Global and its Directors and Executive Officers (incorporated by reference to Exhibit 10.10 to the June 7, 2013 8-K).
|
|
10.16
|
|
Form of Stock Appreciation Rights Agreement under the 2005 Incentive Plan (incorporated by reference to Exhibit 10.3 to LGI’s Quarterly Report on Form 10-Q filed May 7, 2008 (File No. 000-51360) (the LGI May 7, 2008 10-Q)).
|
|
10.17
|
|
Liberty Global 2015 Annual Cash Performance Award Program for executive officers under the Incentive Plan (description of said program is incorporated by reference to the description thereof included in Item 5.02(e) of the Registrant’s Current Report on Form 8-K filed March 25, 2015 (File No. 001-35961) (the March 2015 8-K)).
|
|
10.18
|
|
Liberty Global 2015 Performance Incentive Plan for executive officers under the Incentive Plan (a description of said plan is incorporated by reference to the description thereof included in Item 5.02(e) of the March 2015 8-K).
|
|
10.19
|
|
Liberty Global 2016 Annual Cash Performance Award Program for executive officers under the Incentive Plan (description of said program is incorporated by reference to the description thereof included in Item 5.02(e) of the Registrant’s Current Report on Form 8-K filed March 14, 2016 (File No. 001-35961)).
|
|
10.20
|
|
Liberty Global 2016 Performance Incentive Plan for executive officers under the Incentive Plan (a description of said plan is incorporated by reference to the description thereof included in Item 5.02(e) of the Registrant’s Current Report on Form 8-K filed February 9, 2016 (File No. 001-35961)).
|
|
10.21
|
|
Form of Performance Share Units Agreement for executive officers under the Incentive Plan (incorporated by reference to Exhibit 10.4 to the Registrant’s Quarterly Report on Form 10-Q filed May 9, 2016 (File No. 000-51360)).
|
|
10.22
|
|
Deferred Compensation Plan (adopted effective December 15, 2008; Amended and Restated as of October 26, 2015)(incorporated by reference to Exhibit 10.29 to the Registrant’s Annual Report on Form 10-K filed February 12, 2016 (File No. 001-35961)(the 2016 10-K)).
|
|
10.23
|
|
Nonemployee Director Deferred Compensation Plan (As Amended and Restated Effective December 11, 2015)(incorporated by reference to Exhibit 10.30 to the 2016 10-K)).
|
|
10.24
|
|
Personal Usage of Aircraft Policy, restated June 7, 2013 (incorporated by reference to Exhibit 10.31 to the 2016 10-K).
|
|
10.25
|
|
Form of Aircraft Time Sharing Agreement (900EX) (incorporated by reference to Exhibit 10.29 to LGI Annual Report on Form 10-K filed February 13, 2013 (File No. 000-51360)(the LGI 2012 10-K)).
|
|
10.26
|
|
Form of Aircraft Time Sharing Agreement (7X) (incorporated by reference to Exhibit 10.30 to the LGI 2012 10-K).
|
|
10.27
|
|
Employment Agreement dated as of April 30, 2014, by and among the Registrant, LGI and Michael T. Fries (incorporated by reference to Exhibit 10.7 to the Registrant’s Quarterly Report on Form 10-Q filed May 6, 2014 (File No. 001-35961)(the May 6, 2014 10-Q)).
|
|
10.28
|
|
Form of Performance Grant Award Agreement under the Incentive Plan dated as of April 30, 2014, between the Registrant and Michael T. Fries (incorporated by reference to Exhibit 10.8 to the May 6, 2014 10-Q).
|
|
10.29
|
|
Form of Performance Share Units Agreement between the Registrant and our Chief Executive Officer under the Incentive Plan (incorporated by reference to Exhibit 10.1 to the Registrant’s Quarterly Report on Form 10-Q filed August 4, 2016 (File No. 001-35961)(the August 4, 2016 10-Q)).
|
|
10.30
|
|
Form of Share Appreciation Rights Agreement between the Registrant and our Chief Executive Officer under the Incentive Plan (incorporated by reference to Exhibit 10.2 to the August 4, 2016 10-Q).
|
|
10.31
|
|
Executive Service Agreement, dated December 15, 2004, between UPC Services Limited and Charles Bracken (incorporated by reference to Exhibit 10.36 to LGI’s Annual Report on Form 10-K filed February 24, 2010 (File No. 000-51360)).
|
|
10.32
|
|
Executive Services Agreement effective January 1, 2011, between Liberty Global Europe B.V. and Diederik Karsten (incorporated by reference to Exhibit 10.45 to LGI’s Annual Report on Form 10-K filed February 24, 2011 (File No. 000-51360)).
|
|
10.33
|
|
Letter Agreement dated December 12, 2016 between LGI and Bernard G. Dvorak (incorporated by reference to Exhibit 10.1 to the Registrant’s Current Report on Form 8-K filed December 14, 2016 (File No. 001-51360)).
|
|
10.34
|
|
Trade Mark Licence, dated as of April 3, 2006, between Virgin Enterprises Limited and NTL Group Limited (incorporated by reference to Exhibit 10.2 to Virgin Media’s Quarterly Report on Form 10-Q filed on August 9, 2006 (File No. 000-50886)).
|
|
10.35
|
|
Amendment Letter No. 1, dated February 8, 2007, to the Trade Mark Licence between Virgin Enterprises Limited and Virgin Media Limited dated April 3, 2006 (incorporated by reference to Exhibit 10.5 to Virgin Media’s Quarterly Report on Form 10-Q filed on August 8, 2007 (File No. 000-50886)).
|
|
10.36
|
|
Amendment Letter No. 2, dated October 1, 2007, to the Trade Mark Licence between Virgin Enterprises Limited and Virgin Media Limited dated April 3, 2006 (incorporated by reference to Exhibit 10.6 to Virgin Media’s Quarterly Report on Form 10-Q filed on November 8, 2007 (File No. 000-50886)).
|
|
10.37
|
|
Trade Mark Licence between Virgin Enterprises Limited and Virgin Media Limited dated December 16, 2009 (incorporated by reference to Exhibit 10.83 to Virgin Media’s Annual Report on Form 10-K filed on February 26, 2010 (File No. 000-50886)).
|
|
10.38
|
|
Amended and Restated Contribution and Transfer Agreement, dated July 21, 2016, as amended and restated December 31, 2016, by and among, Liberty Global Europe Holding B.V., the Registrant, Vodafone International Holdings B.V., Vodafone Group Plc and Lynx Global Europe II B.V. (incorporated by reference to Exhibit 10.1 to the Registrant’s Current Report on Form 8-K filed January 6, 2017 (File No. 001-35961)(the January 2017 8-K)).
|
|
10.39
|
|
Shareholders' Agreement, dated December 31, 2016, by and among, Vodafone International Holdings B.V., Vodafone Group Plc, Liberty Global Europe Holding B.V., the Registrant and Lynx Global Europe II B.V. (incorporated by reference to Exhibit 10.2 to the January 2017 8-K).
|
|
21 -- List of Subsidiaries*
|
||
|
23 -- Consent of Experts and Counsel:
|
||
|
23.1
|
|
Consent of KPMG LLP*
|
|
31 -- Rule 13a-14(a)/15d-14(a) Certification:
|
||
|
31.1
|
|
Certification of President and Chief Executive Officer*
|
|
31.2
|
|
Certification of Executive Vice President and Chief Financial Officer (Principal Financial Officer)*
|
|
32 -- Section 1350 Certification **
|
||
|
101.SCH
|
XBRL Taxonomy Extension Schema Document*
|
|
|
101.CAL
|
XBRL Taxonomy Extension Calculation Linkbase Document*
|
|
|
101.DEF
|
XBRL Taxonomy Extension Definition Linkbase*
|
|
|
101.LAB
|
XBRL Taxonomy Extension Label Linkbase Document*
|
|
|
101.PRE
|
XBRL Taxonomy Extension Presentation Linkbase Document*
|
|
_______________
|
*
|
Filed herewith
|
|
**
|
Furnished herewith
|
TABLE OF CONTENTS
Part IItem 1. BusinessItem 1A. Risk FactorsItem 1B. Unresolved Staff CommentsItem 2. PropertiesItem 3. Legal ProceedingsItem 4. Mine Safety DisclosuresPart IIItem 5. Market For Registrant S Common Equity, Related Shareholder Matters and Issuer Purchases Of Equity SecuritiesItem 6. Selected Financial DataItem 7. Management S Discussion and Analysis Of Financial Condition and Results Of OperationsItem 1. Business - CompetitionItem 7A. Quantitative and Qualitative Disclosures About Market RiskItem 8. Financial Statements and Supplementary DataItem 9. Changes in and Disagreements with Accountants on Accounting and Financial DisclosureItem 9A. Controls and ProceduresItem 9B. Other InformationPart IIIItem 10. Directors, Executive Officers and Corporate GovernanceItem 11. Executive CompensationItem 12. Security Ownership Of Certain Beneficial Owners and Management and Related Stockholder MattersItem 13. Certain Relationships and Related Transactions, and Director IndependenceItem 14. Principal Accountant Fees and ServicesItem 12. Security Ownership Of Certain Beneficial Owners and Management and Related Shareholder MattersPart IVItem 15. Exhibits, Financial Statement SchedulesItem 16. Form 10-k Summary