LENDINGCLUB CORP
10-Ks and 10-Qs
|
|
|
|
|
|
|
|
|
|
|
|
|
|
|
|
|
|
|
|
|
|
|
|
|
|
|
|
|
|
|
|
|
|
|
|
|
|
|
|
|
UNITED STATES
SECURITIES AND EXCHANGE COMMISSION
Washington, D.C. 20549
|
FORM 10-K
|
|
x
|
ANNUAL REPORT PURSUANT TO SECTION 13 OR 15(d) OF THE SECURITIES EXCHANGE ACT OF 1934
|
For the fiscal year ended
December 31, 2015
Commission File Number: 001-36771
|
LendingClub Corporation
(Exact name of registrant as specified in its charter)
|
|
Delaware
|
|
51-0605731
|
|
(State or other jurisdiction of
incorporation or organization)
|
|
(I.R.S. Employer
Identification No.)
|
|
71 Stevenson Street, Suite 300
|
|
|
|
San Francisco, California
|
|
94105
|
|
(Address of principal executive offices)
|
|
(Zip Code)
|
(415) 632-5600
(Registrant’s telephone number, including area code)
Securities registered pursuant to Section 12(b) of the Act:
|
Title of each class:
|
|
Name of each exchange on which registered:
|
|
Common Stock, par value $0.01 per share
|
|
New York Stock Exchange
|
Securities registered pursuant to Section 12(g) of the Act: None
Indicate by check mark if the registrant is a well-known seasoned issuer, as defined in Rule 405 of the Securities Act. Yes
ý
No
¨
Indicate by check mark if the registrant is not required to file reports pursuant to Section 13 or Section 15(d) of the Act. Yes
¨
No
ý
Indicate by check mark whether the registrant (1) has filed all reports required to be filed by Section 13 or 15(d) of the Securities Exchange Act of 1934 during the preceding 12 months (or for such shorter period that the registrant was required to file such reports), and (2) has been subject to such filing requirements for the past 90 days. Yes
ý
No
¨
Indicate by check mark whether the registrant has submitted electronically and posted on its corporate Web site, if any, every Interactive Data File required to be submitted and posted pursuant to Rule 405 of Regulation S-T (§ 232.405 of this chapter) during the preceding 12 months (or for such shorter period that the registrant was required to submit and post such files). Yes
ý
No
¨
Indicate by check mark if disclosure of delinquent filers pursuant to Item 405 of Regulation S-K (§ 229.405 of this chapter) is not contained herein, and will not be contained, to the best of registrant’s knowledge, in definitive proxy or information statements incorporated by reference in Part III of this Form 10-K or any amendment to this Form 10-K.
¨
Indicate by check mark whether the registrant is a large accelerated filer, an accelerated filer, a non-accelerated filer, or a smaller reporting company. See the definitions of “large accelerated filer,” “accelerated filer” and “smaller reporting company” in Rule 12b-2 of the Exchange Act. (Check one):
|
Large accelerated filer
|
|
x
|
|
Accelerated filer
|
¨
|
|
Non-accelerated filer
|
|
¨
(Do not check if a smaller reporting company)
|
|
Smaller reporting company
|
¨
|
Indicate by check mark whether the registrant is a shell company (as defined in Rule 12b-2 of the Exchange Act). Yes
¨
No
ý
The aggregate market value of the voting and non-voting common equity held by non-affiliates of the registrant as of
June 30, 2015
, the last business day of the registrant’s most recently completed second fiscal quarter, was
$4,097,335,594
based on the closing price reported for such date on the New York Stock Exchange. Shares of the registrant’s common stock held by each executive officer, director and holder of
10%
or more of the outstanding common stock have been excluded in that such persons may be deemed to be affiliates. This calculation does not reflect a determination that certain persons are affiliates of the registrant for any other purpose.
As of
February 18, 2016
, there were
381,429,127
shares of the registrant’s common stock outstanding.
Documents Incorporated by Reference
Portions of the registrant’s Definitive Proxy Statement for the Registrant’s 2016 Annual Meeting of Stockholders are incorporated by reference into Part III of this Annual Report on Form 10-K to the extent stated herein. Such Definitive Proxy Statement will be filed with the Securities and Exchange Commission within 120 days after the end of the registrant’s fiscal year ended
December 31, 2015
.
LENDINGCLUB CORPORATION
Annual Report On Form 10-K
For Fiscal Year Ended
December 31, 2015
TABLE OF CONTENTS
LENDINGCLUB CORPORATION
Except as the context requires otherwise, as used herein, “Lending Club,” “Company,” “we,” “us,” and “our,” refer to LendingClub Corporation, a Delaware corporation, and, where appropriate, its two wholly owned subsidiaries:
|
•
|
LC Advisors, LLC (LCA), a registered investment advisor with the Securities and Exchange Commission (SEC) that acts as the general partner for certain private funds and as advisor to separately managed accounts.
|
|
•
|
Springstone Financial, LLC (Springstone), a company that facilitates education and patient finance loans.
|
LC Trust I (Trust) is an independent Delaware business trust that acquires loans from the Company and holds them for the sole benefit of certain investors that have purchased a trust certificate (Certificate) issued by the Trust and that are related to specific underlying loans for the benefit of the investor.
Forward-Looking Statements
This report contains forward-looking statements within the meaning of Section 29A of the Securities Act of 1933 and Section 21E of the Securities Exchange Act of 1934. All statements, other than statements of historical facts, included in this Annual Report on Form 10-K (Report) regarding borrowers, credit scoring, Fair Isaac Corporation (FICO) or other credit scores, our strategy, future operations, expected losses, future financial position, future revenue, projected costs, prospects, plans, objectives of management and expected market growth are forward-looking statements. The words “anticipate,” “appear,” “believe,” “continue,” “could,” “estimate,” “expect,” “intend,” “may,” “plan,” “predict,” “project,” “target,” “will,” or similar expressions are intended to identify forward-looking statements, although not all forward-looking statements contain these identifying words.
These forward-looking statements include, among other things, statements about:
|
•
|
the status of borrowers, the ability of borrowers to repay loans and the plans of borrowers;
|
|
•
|
interest rates and origination fees on loans charged by issuing banks;
|
|
•
|
expected rates of return for investors;
|
|
•
|
the effectiveness of our platform’s credit scoring models;
|
|
•
|
commitments or investments in loans to support: contractual obligations, such as to Springstone’s issuing bank for Pool B loans, regulatory commitments, such as direct mail, the testing of pilot loan programs, or customer accommodations;
|
|
•
|
transaction fee or other revenue we expect to recognize after loans are issued by our issuing bank partners;
|
|
•
|
our financial condition and performance, including the impact that management’s estimates have on our financial performance and the relationship between the interim period and full year results;
|
|
•
|
investor, borrower, platform and loan performance-related factors that may affect our revenue;
|
|
•
|
our ability to retain and hire employees and appropriately staff our operations;
|
|
•
|
our ability to prevent security breaches, disruptions in service or comparable events that could compromise the personally identifiable or confidential information held in our data systems, reduce the attractiveness of the marketplace or adversely impact our ability to service loans;
|
|
•
|
our ability to prevent and detect identity theft;
|
|
•
|
our ability to develop and maintain effective internal controls;
|
|
•
|
our compliance with applicable local, state and Federal laws;
|
|
•
|
our compliance with applicable regulations and regulatory developments or court decisions affecting our marketplace; and
|
|
•
|
other risk factors listed from time to time in reports we file with the SEC.
|
1
LENDINGCLUB CORPORATION
We caution you that the foregoing list may not contain all of the forward-looking statements in this Report. We may not actually achieve the plans, intentions or expectations disclosed in forward-looking statements, and you should not place undue reliance on forward-looking statements. We have included important factors in the cautionary statements included in this Report, particularly in the “Risk Factors” section, that could, among other things, cause actual results or events to differ materially from forward-looking statements contained in this Report. Forward-looking statements do not reflect the potential impact of any future acquisitions, mergers, dispositions, joint ventures or investments we may make.
You should read this Report carefully and completely and with the understanding that actual future results may be materially different from what we expect. We do not assume any obligation to update or revise any forward-looking statements, whether as a result of new information, future events or otherwise, other than as required by law.
2
LENDINGCLUB CORPORATION
Our Mission
Transforming the banking system to make credit more affordable and investing more rewarding.
Overview
Lending Club is the world’s largest online marketplace connecting borrowers and investors. We believe a technology-powered marketplace is a more efficient mechanism to allocate capital between borrowers and investors than the traditional banking system. Our marketplace substantially reduces the need for physical infrastructure and improves convenience and automation, which increases efficiency, reduces manual processes, and improves the overall borrower and investor experience.
Qualified consumers and small business owners borrow through Lending Club to lower the cost of their credit and enjoy a better experience than traditional bank lending. We believe the range of loan products we facilitate are simple, fair and responsible credit products that make it easier for consumers to budget for monthly repayment and meet their financial goals.
Investors use Lending Club to earn attractive risk-adjusted returns from an asset class that has generally been closed to many investors and only available on a limited basis to large institutional investors. The capital to invest in the loans enabled through our marketplace comes directly from a wide range of investors, including retail investors, high-net-worth individuals and family offices, banks and finance companies, insurance companies, hedge funds, foundations, pension plans and university endowments, and through a variety of investment channels.
We have developed our proprietary technology platform to support our marketplace and offer a variety of our issuing banks’ loan products to interested investors. Our proprietary technology automates key aspects of our operations, including the borrower application process, data gathering, credit decisioning and scoring, loan funding, investing and servicing, regulatory compliance and fraud detection. Our platform offers sophisticated analytical tools and data to enable investors to make informed decisions and assess their portfolios. Our extensible technology platform has allowed us to expand our offerings from personal loans to include small business loans, and to expand investor classes from individuals to institutions and create various investment vehicles.
We generate revenue from transaction fees from our marketplace’s role in accepting and decisioning applications for our bank partners to enable loan originations, servicing fees from investors for matching available loan assets with capital, and management fees from investment funds and other managed accounts. Our business model is not dependent on using our balance sheet and assuming credit risk for loans facilitated by our marketplace. In order to support contractual obligations (Pool B loans), regulatory commitments (direct mail), the testing of pilot loan programs, or customer accommodations, we may use our capital on the marketplace from time to time and on terms that are substantially similar to other investors.
As of
December 31, 2015
, our marketplace facilitated approximately
$16.0 billion
in loans since it first launched in
2007
, of which approximately
$3.3 billion
were invested in through notes issued pursuant to a shelf registration statement (the Note Registration Statement),
$5.5 billion
were invested in through Certificates issued by the Trust, and
$7.2 billion
were invested in through whole loan sales.
3
LENDINGCLUB CORPORATION
Industry Background and Trends
We believe a transparent and open marketplace where borrowers and investors have access to information, complemented by technology and tools, can make credit more affordable, redirect existing pools of capital trapped inside the banking system, and attract new sources of capital to a new asset class. We believe that online marketplaces have the power to transform the traditional banking system, facilitate more efficient deployment of capital, and improve the global economy.
Personal and Small Business Lending Is Essential to the Economy
We believe the ability of individuals and small businesses to access affordable credit is essential to stimulating and sustaining a healthy, diverse and innovative economy. Lending to consumers provides financial flexibility and gives households better control over when and how to purchase goods and services. While borrower appetite for consumer and small business credit has typically remained strong in most economic environments, general economic factors and conditions, including the general interest rate environment and unemployment rates, may affect borrower willingness to seek loans and investor ability or desire to invest in loans.
Borrowers Are Inadequately Served by the Current Banking System
We believe the traditional banking system generally is burdened by its high fixed cost of underwriting and services, in part due to its physical infrastructure and labor- and paper-intensive business processes, compounded by an increasingly complex regulatory environment. As a result, we believe the traditional banking system is ill-suited to meet personal and small business demand for small balance loans and has instead relied heavily on issuing credit cards, which require less personalized underwriting and have higher interest rates. While credit cards are convenient as a payment mechanism, they are an expensive long-term financing solution. Borrowers who carry a balance on their cards are often subject to high, variable interest rates and the possibility of incurring additional fees and penalties. Additionally, many borrowers are charged the same high interest rates on their balances, regardless of an individual’s specific risk profile, so low-risk borrowers often subsidize high-risk borrowers. In the limited instances when traditional banks make personal loans available, the loan application process is often opaque, frustrating and time consuming.
Investors Have Had Limited Options to Participate in Personal and Small Business Credit
Historically, access to most personal and small business loans as an investment product was limited to the banks that hold loans on their balance sheet or to structured securitized products that were syndicated to large institutional investors. Depositors effectively fund the loans made by the banking system, but they share little in the direct returns of these loans as evidenced by the low yields on various fixed income investment or deposit products offered by banks. We believe many investors generally lack the size and access to invest in structured products directly and are unable to invest in personal and small business credit in a meaningful way. While institutional investors have had some access to this market, most have lacked the tools to customize portfolios to their specific risk tolerance, which is a feature of our marketplace and products. As a result, we believe additional capital that could be invested in personal and small business loans has largely been locked out of the market and may be available for use on our marketplace as an alternative to other similarly performing fixed asset investments.
Online Marketplaces Have Proliferated Throughout the Economy
Online marketplaces have emerged to connect buyers and sellers across many industries to increase choice, improve quality, accelerate the speed of decision making and lower costs. We believe a successful online marketplace must act as a trusted intermediary providing transparency, security, supply and demand balance, and ease of use to give marketplace participants an incentive to interact and the confidence to do business together. Initial online marketplaces connected buyers and sellers of goods and services – primarily moving demand from offline to online and making the transaction process more efficient. Online marketplaces have more recently evolved to unlock supply and demand that could not previously be matched in an efficient manner offline. The “sharing economy,” a
4
LENDINGCLUB CORPORATION
term that describes this new marketplace trend, enables a better use of resources by allowing owners of underutilized assets to offer them to people who want them while capturing an economic benefit.
Our Solution
We believe that our marketplace provides the following benefits to borrowers:
|
•
|
Access to Affordable Credit.
Our innovative marketplace model, online delivery and process automation enable us to offer borrowers interest rates that are generally lower on average than the rates charged by traditional banks, credit cards or installment loans.
|
|
•
|
Superior Borrower Experience.
We offer a fast and easy-to-use online application process and provide borrowers with access to live support and online tools throughout the process and over the life of the loan.
|
|
•
|
Transparency and Fairness.
The installment loans offered through our marketplace feature a fixed rate that is clearly disclosed to the borrower during the application process, with fixed monthly payments, no hidden fees and the ability to prepay the balance at any time without penalty. Small business lines of credit have rates based upon the prime rate and allow borrowers to draw in increments, reducing their interest cost. Our platform utilizes an automated, rules-based engine for credit decisioning, which removes the human bias associated with reviewing applications.
|
|
•
|
Fast and Efficient Decisioning.
We leverage online data and technology to quickly assess risk, detect fraud, determine a credit rating and assign appropriate interest rates quickly.
|
We believe that our marketplace provides the following benefits to investors:
|
•
|
Access to a New Asset Class.
All investors can invest in personal loans facilitated through our standard loan program. Additionally, qualified investors can invest in loans facilitated through our custom program loan program in private transactions. These asset classes have historically been funded and held by financial institutions or large institutional investors on a limited basis.
|
|
•
|
Attractive Risk-Adjusted Returns.
We offer investors attractive risk-adjusted returns on loans offered through our marketplace.
|
|
•
|
Transparency.
We provide investors with transparency and choice in building their loan portfolios.
|
|
•
|
Easy-to-Use Tools.
We provide investors with tools to easily build and modify customized and diversified portfolios by selecting loans tailored to their investment objectives and to assess the returns on their portfolios. Investors can also enroll in automated investing, a free service that automatically invests any available cash in loans according to investor-specified criteria.
|
Our Competitive Strengths
We believe the following strengths differentiate us from our competitors and provide us with competitive advantages in realizing the potential of our market opportunity:
|
•
|
Leading Online Marketplace.
We are the world’s largest online marketplace connecting borrowers and investors, based on approximately
$16.0 billion
in loan originations through
December 31, 2015
, of which approximately
$3.3 billion
were invested in through notes issued pursuant to the Note Registration Statement,
$5.5 billion
were invested in through certificates issued by the Trust and
$7.2 billion
were invested in through whole loan sales.
|
5
LENDINGCLUB CORPORATION
|
•
|
Robust Network Effects.
Our online marketplace exhibits network effects that are driven by the number of participants and investments enabled through our marketplace. More participation leads to greater potential to match borrowers with investors. Additionally, increased participation also results in the generation of substantial data that is used to improve the effectiveness of our credit decisioning and scoring models, enhancing our performance record and generating increasing trust in our marketplace. As trust increases, we believe investors will continue to demonstrate a willingness to accept lower risk premiums (all else being equal), which will allow us to offer lower interest rates and attract additional high-quality borrowers, thereby reinforcing our track record and fueling a virtuous cycle for our business. We believe that these network effects reinforce our market leadership position.
|
|
•
|
High Borrower and Investor Satisfaction.
Borrowers have validated our approach with an aggregate Net Promoter Score
(1)
in the
70
s since we began surveying borrowers in
January 2013
, which places us at the upper end of customer satisfaction ratings for traditional financial service companies. Additionally, investors are confident transacting on our marketplace, as evidenced by high reinvestment rates.
|
|
•
|
Technology Platform.
Our technology platform powers our online marketplace and enables us to deliver innovative solutions to borrowers and investors. Our technology platform automates our operations and, we believe, provides a significant time and cost advantage over traditional banks that run on legacy systems that are inflexible and slow to evolve.
|
|
•
|
Sophisticated Risk Assessment.
We use proprietary algorithms that leverage behavioral data, transactional data and employment information to supplement traditional risk assessment tools, such as FICO scores. We have built our technology platform to automate the application of these proprietary algorithms to each individual borrower’s application profile at scale. This approach allows us to evaluate and segment each potential borrower’s risk profile and price the loan accordingly. In contrast, traditional lenders aggregate borrowers into large pools of risk profiles, which for some borrowers results in higher interest rates despite a more favorable credit profile.
|
|
(1)
|
Net Promoter Score is a commonly used measure of customer loyalty and satisfaction, ranging from negative 100 to positive 100, based on direct questions to borrowers.
|
Products
Borrowers
Our marketplace facilitates several types of loan products for consumers and small businesses.
Personal Loans.
Our marketplace facilitates unsecured personal loans that can be used to make major purchases, refinance credit card balances or for other purposes, at generally lower rates than other alternatives. Personal loans are offered through both our standard and custom loan programs. Personal loans approved through our standard loan program include amounts from
$1,000
to
$35,000
, maturities of
three
or
five
years, fixed interest rates, and no prepayment penalties or fees. These loans must meet certain minimum credit requirements, including a FICO score of at least
660
, satisfactory debt-to-income ratios,
36
months of credit history and a limited number of credit inquiries in the previous
six
months. Personal loans that are approved through the standard loan program are offered to all investors on our marketplace. Personal loans that fall outside of the credit criteria for the standard program might qualify under our custom program and include amounts from $1,000 to $50,000, maturities of two, three, five or seven years, fixed interest rates and no prepayment penalties or fees.
Education and Patient Finance Loans.
We facilitate unsecured education and patient installment loans and true no-interest loans through Springstone and its issuing bank partners. Installment loan terms include amounts from
$2,000
to
$50,000
, maturities from
24
to
84
months, fixed interest rates and no prepayment penalties. The true no-interest loan terms include amounts ranging from
$499
to
$32,000
and no required interest payment if the balance is paid in full during the promotional period, which can be
six
,
12
,
18
or
24
months. There is no prepayment penalty
6
LENDINGCLUB CORPORATION
and borrowers have the flexibility to pay as much or as little, subject to applicable minimums, of the outstanding balance during the promotional period as they choose. Education and Patient Finance loans are offered to private investors only and are not made publicly available on the marketplace.
Small Business Loans and Lines of Credit.
In
March 2014
, we began facilitating unsecured small business loans, and in October 2015 we began facilitating small business lines of credit. Both of these loan products are offered through our marketplace in private transactions with qualified investors. These loan products enable small business owners to expand their business, purchase equipment or inventory, or meet other obligations at an affordable rate. Small business loans and lines of credit are fixed- or variable-rate loans in amounts ranging from
$5,000
to
$300,000
, with maturities of
3 months
to
5 years
, and contain no prepayment penalties or fees. The small business lines of credit allow borrowers to draw funds in amounts they need, thus reducing their interest cost. Small Business loans are offered to private investors only and are not made publicly available on the marketplace.
Investors
Investors have the opportunity to invest in a wide range of loans based on term and credit characteristics. Personal loans that are approved through the standard loan program are offered to all investors on our marketplace, while custom program loans, which include small business, super prime, education and patient finance, new offerings, and loans that fall outside of the credit criteria of the standard program, are offered to private investors only and are not made publicly available on the marketplace. Investors receive monthly cash flow and attractive risk-adjusted returns. Investors are provided with a borrower’s proprietary credit grade and access to credit profile data on each approved loan as well as access to data on each listed loan and all of the historical performance data for nearly every loan ever invested in through our marketplace. The marketplace enables broad diversification by allowing distribution of investments in loans in increments as small as
$25
.
We attract a wide range of investors, including retail investors, high-net-worth individuals and family offices, banks and finance companies, insurance companies, hedge funds, foundations, pension plans and university endowments. We provide these investors with access to a variety of tools and products that seek to address their level of sophistication and desired level of interaction, which can range from low-touch self-directed accounts to high-touch funds and managed accounts. Investors can invest in loans through one or all of the following channels:
Notes:
We issue notes pursuant to an effective Note Registration Statement. Investors who meet the applicable financial suitability requirements and have completed our investor account opening process may purchase unsecured, borrower payment dependent notes that correspond to payments received on an underlying standard program loan selected by the investor. When an investor registers with us, the investor enters into an investor agreement with us that governs the investor’s purchases of notes. Our note channel is supported by our website and our investor services group, which provides basic customer support to these investors.
Certificates and Investment Funds:
Accredited investors and qualified purchasers may establish a relationship with LCA or another third-party advisor in order to indirectly invest in certificates, or they may directly purchase a certificate or a limited partnership interest in one of six private funds that purchase certificates. The certificates are issued by the Trust and are unsecured and settled with cash flows from underlying loans selected by the investor. Neither certificates nor limited partnership interests can be purchased through our website. Certificate investors typically seek to invest larger amounts as compared to the average note investors and often desire a more “hands off” approach to investing. Investors in certificates generally pay an asset-based management fee instead of cash flow-based servicing fee paid by note investors.
Whole Loan Purchases:
Certain institutional investors, such as banks, seek to hold the actual loan on their balance sheet. To meet this need, we sell entire standard or custom program loans to these investors through purchase agreements. Upon the sale of the loan, the investor owns all right, title and interest in the loan. We establish the investors’ accounts and the procedures for the purchase of loans, including any purchase amount limitations, which we control in our discretion. We and the investor also make limited representations and warranties and agree to
7
LENDINGCLUB CORPORATION
indemnify each other for breaches of the purchase agreement. The investor also agrees to simultaneously enter into a servicing agreement with us which designates us as the loan servicer for the sold loan. We continue to service these loans after they are sold and can only be removed as the servicer in limited circumstances. For regulatory purposes, the investor also has access to the underlying borrower information, but is prohibited from contacting or marketing to the borrower in any manner and agrees to hold such borrower information in compliance with all applicable privacy laws. Whole loan purchases are attractive for some investors as it enables them to account for the loan as an asset, which can offer favorable financial reporting and capital reserve treatment.
We believe our strategy of pursuing a diverse investor base will continue to support the growth of our marketplace and our ability to facilitate a wide variety of loans through a range of business and economic conditions. For all investment channels, we agree to repurchase the loans in cases of confirmed identity theft. While our business model is not dependent on using our balance sheet and assuming credit risk, we use our capital on the marketplace from time to time to support contractual obligations (Pool B loans), regulatory commitments (direct mail), the testing of pilot loan programs, or customer accommodations.
Credit Decisioning and Scoring Process
Our marketplace provides an integrated and automated loan application and credit decisioning and scoring process that is extensible to a variety of loan products. Borrowers come to our platform to apply online for a loan. During the simple application process, our platform uses proprietary risk algorithms that leverage behavioral data, transactional data and employment information to supplement traditional risk assessment tools, such as FICO scores, to assess a borrower’s risk profile. The platform then presents an approved borrower with various loan options, including term, rate and amount, for which they qualify. Once the borrower selects the desired loan terms, the rest of the application is completed. Our verification processes and teams then verify the borrower’s identity, income or employment by connecting to various data sources, directly or through third-party service providers, or by contacting the human resources department of the borrower’s stated employer to determine whether to approve the loan request.
Technology
Key elements of our technology include:
|
•
|
Highly Automated.
Our borrower and investor acquisition process, registration, credit decisioning and scoring, servicing and payment systems are highly automated using our internally developed software. We developed our own cash management software to process electronic cash movements, record book entries and calculate cash balances in our borrower and investor fund accounts. In nearly all payment transactions, an Automated Clearing House (ACH) electronic payment network is used to disburse loan proceeds, collect borrower loan payments on outstanding loans, receive funds from investors and disburse payments to investors.
|
|
•
|
Scalable Platform.
Our scalable infrastructure utilizes standard techniques, such as virtualization, load-balancing and high-availability platforms. Our application and database tiers are designed to be scaled horizontally by adding additional servers as needed.
|
|
•
|
Proprietary Fraud Detection.
We use a combination of third-party data, sophisticated analytical tools and current and historical data obtained during the loan application process to help determine fraud risk. High-risk loan applications are subject to further investigation. In cases of confirmed fraud, the application is cancelled, and we identify and flag characteristics of the loan application to help refine our fraud detection efforts.
|
|
•
|
Data Integrity and Security.
We maintain an effective information security program based on well-established security standards and best practices, including ISO2700x and NIST 800 series. The program establishes policies and procedures to safeguard the confidentiality, integrity and availability of borrower
|
8
LENDINGCLUB CORPORATION
and investor information. The program also addresses risk assessment, training, access control, encryption, service provider oversight, an incident response program and continuous monitoring and review.
|
•
|
Application Programming Interface.
Our application programming interface, referred to as our API, provides investors and partners access to publicly available loan attributes and allows them to analyze the data and place orders meeting their criteria without visiting our website. Investors and partners may create their own software that uses our API or they may use a variety of third-party services that invest via our API.
|
|
•
|
Lending Club Open Integration.
In August 2015, we launched Lending Club Open Integration (LCOI). LCOI allows online advisors and broker-dealers to offer Lending Club investments quickly and easily to their client bases, using a suite of API services that integrate directly into their websites. This allows these advisors and broker-dealers to provide the same functionality that currently exists on our website, including money movement, investing, reinvesting, real-time reporting of cash and holdings, and tax reporting.
|
Relationships with Issuing Bank Partners
Loans facilitated through our marketplace are originated by our issuing bank partners. Our primary issuing bank is WebBank, a Utah-chartered industrial bank that handles a variety of consumer and commercial financing programs. Additionally, we rely on NBT Bank and Comenity Capital Bank as issuing banks for our education and patient finance loans. We also have an agreement with Cross River Bank, a New Jersey chartered bank, to operate as our back-up issuing bank in the event WebBank can no longer be an issuing bank.
We have entered into a loan account program agreement with WebBank that governs the terms and conditions between us and WebBank with respect to loans facilitated through our marketplace and originated by WebBank, including our obligations for servicing the loans during the period of time that the loans are owned by WebBank. Under the terms of the loan account program agreement, we pay WebBank a monthly program fee based on the amount of loans issued by WebBank and purchased by us or our partners in a given month, subject to a minimum monthly fee. Effective in
October 2014
WebBank retains ownership of all loans for two business days and earns interest on the loans during that time. WebBank pays us a transaction fee for our role in processing loan applications through our marketplace on WebBank’s behalf. Under a loan sale agreement, WebBank sells us the loan without recourse two business days after WebBank originates the loan. The loan sale agreement prohibits us from securitizing the loans without prior written consent of WebBank. The loan account program agreement and the loan sale agreement terminate in November 2018, with two automatic, one-year renewal terms, subject to certain early termination provisions as set forth in the agreements.
Our issuing banks for education and patient finance loans originate, retain and service each education and patient finance loan issued. For our role in loan facilitation, we earn transaction fees paid by the issuing bank and education and patient service providers at the time of origination by the issuing bank. Currently, we do not earn any servicing fees, as loans are originated, retained and serviced by the issuing bank. We currently intend to continue to have these loans funded and serviced through these existing issuing banks while we develop plans to integrate qualifying loans into our standard loan program over time.
9
LENDINGCLUB CORPORATION
Loan Issuance Mechanism
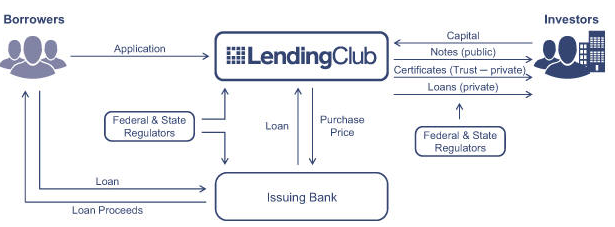
We have developed an extensible, automated platform that allows us to work with issuing banks to originate and issue a variety of loan products to an array of borrowers. Our service is provided in a seamless fashion to the borrowers. A borrower comes to our website and completes a simple application for a loan product. We then use proprietary risk algorithms to analyze an applicant’s risk profile based upon the issuing bank’s underwriting guidelines. Once a loan application is approved, we present the borrower with various loan options. After the applicant selects their personalized financing option and completes the application process, the loan is listed on our marketplace to attract investor commitments, while we simultaneously perform additional verifications on the borrower. Once the verifications are completed and sufficient investor commitments are received, the issuing bank originates and issues the loan to the borrower, net of the origination fee charged and retained by the issuing bank. After the loan is issued, we use the proceeds from these investors to purchase the loan. Investor cash balances (excluding payments in process) are held in a segregated bank or custodial accounts and are not commingled with our monies. We receive a transaction fee from the issuing bank for our marketplace’s role in originating the loan. We also earn a recurring servicing fee from investors and management fees from investment funds and other managed accounts.
Loan Servicing
We service all loans facilitated through our marketplace, except for patient and education finance loans. Servicing is comprised of account maintenance, collections, processing payments from borrowers and distributions to investors. We have made arrangements for limited backup servicing with Portfolio Financial Servicing Company.
For the month of December
2015
, approximately
99%
of loan payments for loans that we service were made through an ACH withdrawal from the borrower’s bank account. Principal and interest payments on loans are remitted utilizing ACH. We also maintain segregated bank accounts for the benefit of investors, custodial or other accounts designated by our investors. This automated process allows us to avoid the time and expense of processing a significant volume of mailed payments and provides a higher degree of certainty for timely payments. This process also provides us with prompt notice in the event of a missed payment, which allows us to respond quickly to resolve the delinquency with the borrower. Generally, in the first 30 days that a loan is delinquent, our in-house collections team works to bring the account current. Once the loan becomes more than 30 days delinquent, we will typically outsource subsequent servicing efforts to third-party collection agencies.
The servicing fee paid by investors is designed to cover the day-to-day processing costs of loans. If a loan needs more intensive collection focus, whether internal or external, we may charge investors a collection fee to compensate us for the costs of this collection activity. This fee varies, with a maximum of up to
35%
of the amount recovered. There is no fee charged if there are no loan payments recovered, and the fee cannot exceed any proceeds collected. We sell loans that have been charged-off to certain third parties. All proceeds received on these sales are subject to a collection fee, and the net proceeds are distributed to investors.
10
LENDINGCLUB CORPORATION
Springstone Acquisition
In
April 2014
, we acquired all of the outstanding limited liability company interests of Springstone, which offers education and patient finance loans. We utilize two issuing banks and a network of providers to facilitate the issuance of education and patient finance installment loans and true no-interest loans, as described above.
Competition
We compete with financial products and companies that attract borrowers, investors or both. With respect to borrowers, we primarily compete with traditional financial institutions, such as banks, credit unions, credit card issuers and other consumer finance companies. We believe our innovative marketplace model, online delivery and process automation enable us to operate more efficiently and with more competitive rates and higher borrower satisfaction than these competitors.
With respect to investors, we primarily compete with other investment vehicles and asset classes, such as equities, bonds and short-term fixed income securities. We believe that our diverse and customizable investment options give us the flexibility to offer attractive risk-adjusted returns that are generally uncorrelated with other asset classes.
We compete with other online credit marketplaces, such as Prosper Marketplace, Inc., as well as with other online lenders. We are the world’s largest online marketplace connecting borrowers to investors, which we believe provides us with a major competitive advantage. We believe that our network effects and marketplace dynamics at play make us more attractive and efficient to both borrowers and investors. We anticipate that more established internet, technology and financial services companies that possess large, existing customer bases, substantial financial resources and established distribution channels may enter the market in the future. We believe that our brand, scale, network effect, historical data and performance record provide us with significant competitive advantages over current and future competitors.
Sales and Marketing
Our marketing efforts are designed to attract and retain borrowers and investors and build brand awareness and reputation. Currently, we believe reputation, word of mouth and our direct marketing via mail drives continued organic growth in our investor and borrower base. We believe most of our marketplace investors are satisfied with their experience, often adding funds to their account and referring their friends and colleagues to us.
Regulatory and Compliance Framework
Our marketplace provides a compliance framework that allows investors to participate in consumer and commercial credit as an asset class. We believe that our relationship with issuing banks is a key component of our compliance framework.
As part of our ongoing compliance program, we have customer identification processes in place to enable us to identify user identification fraud and compare user identity against applicable governmental lists, such as the Office of Foreign Assets Control (OFAC) and the Financial Crimes Enforcement Network. We compare all users’ identities against these lists at least twice a month for continued compliance and oversight. If a user were to appear on a list, we would take appropriate action to resolve the issue. In addition to our continued identification compliance program, we use our proprietary technology to assist us in complying with applicable federal anti-money laundering laws.
Regulations and Licensing
The lending and securities industries are highly regulated. We are regulated differently than a bank as banks are exposed to capital risk from both credit and interest rate risks, whereas for loans issued through our marketplace loan balances, interest rates and maturities are matched and offset by an equal balance of notes and certificates.
11
LENDINGCLUB CORPORATION
Additionally, we do not take deposits and are therefore not regulated by the FDIC in that respect. Our current issuing banks originate all of the loans offered through our marketplace and are subject to regulation by the FDIC or other relevant federal and state regulators.
The Company and the loans made through our marketplace are subject to extensive and complex rules and regulations, licensing and examination by various federal, state and local government authorities. Our primary issuing bank, WebBank, is subject to oversight by the FDIC and the State of Utah. These authorities impose obligations and restrictions on our activities and the loans facilitated through our marketplace. For example, these rules limit the fees that may be assessed on the loans, require extensive disclosure to, and consents from, the borrowers and lenders, prohibit discrimination and unfair and deceptive acts or practices and may impose multiple qualification and licensing obligations on our activities. Failure to comply with any of these requirements may result in, among other things, revocation of required licenses or registration, loss of approved status, voiding of the loan contracts, class action lawsuits, administrative enforcement actions and civil and criminal liability. While compliance with such requirements is at times complicated by our novel business model, we believe we are in substantial compliance with these rules and regulations.
State Licensing Requirements
In most states we believe that the applicable issuing bank, as originator of loans facilitated through our marketplace, satisfies any relevant licensing requirements with respect to the origination of loans applicable to our operations. As needed, we seek authorizations to conduct activities on a uniform basis in all other states and the District of Columbia, with the exception of Iowa. State licensing statutes impose a variety of requirements and restrictions on us, including:
|
•
|
record-keeping requirements;
|
|
•
|
restrictions on servicing practices, including limits on finance charges and fees;
|
|
•
|
disclosure requirements;
|
|
•
|
examination requirements;
|
|
•
|
surety bond and minimum net worth requirements;
|
|
•
|
financial reporting requirements;
|
|
•
|
notification requirements for changes in principal officers, stock ownership or corporate control;
|
|
•
|
restrictions on advertising; and
|
|
•
|
review requirements for loan forms.
|
The statutes also subject us to the supervisory and examination authority of state regulators in certain cases.
Consumer Protection Laws
State Usury Limitations.
Section 521 of the Depository Institution Deregulation and Monetary Control Act of 1980 (DIDA) and Section 85 of the National Bank Act (NBA), federal case law interpreting the NBA such as Tiffany v. National Bank of Missouri and Marquette National Bank of Minneapolis v. First Omaha Service Corporation and FDIC advisory opinion 92-47 permit FDIC-insured depository institutions, such as WebBank, to “export” the interest rate permitted under the laws of the state or U.S. territory where the bank is located, regardless of the usury limitations imposed by the state law of the borrower’s residence unless the state has chosen to opt out of the exportation regime. WebBank is located in Utah, and Title 70C of the Utah Code does not limit the amount of fees or interest that may be charged by WebBank on loans of the type offered through our marketplace. Only Iowa and Puerto Rico have opted out of the exportation regime under Section 525 of DIDA and we do not operate in either jurisdiction. We believe, however, if a state or U.S. territory in which we operate opted out of rate exportation, judicial interpretations support the view that such opt outs would apply only to loans “made” in those states. We believe that the “opt-out” of any state would not affect the ability of our marketplace to benefit from the exportation of rates. If a loan made through our marketplace were deemed to be subject to the usury laws of a state or U.S. territory that had opted-out of the exportation regime, we could become subject to fines, penalties and possible
12
LENDINGCLUB CORPORATION
forfeiture of amounts charged to borrowers, and we could decide not to originate loans in that jurisdiction, which could adversely impact our growth.
State Disclosure Requirements and Other Substantive Lending Regulations
. We are subject to state laws and regulations that impose requirements related to loan disclosures and terms, credit discrimination, credit reporting, debt collection and unfair or deceptive business practices. Our ongoing compliance program seeks to comply with these requirements.
Truth in Lending Act.
The Truth in Lending Act (TILA), and Regulation Z, which implements it, require lenders to provide consumers with uniform, understandable information concerning certain terms and conditions of their loan and credit transactions. These rules apply to WebBank as the creditor for loans facilitated through our marketplace, but because the transactions are carried out on our hosted website, we facilitate compliance. For closed-end credit transactions of the type provided through our marketplace, these disclosures include, among others, providing the annual percentage rate, the finance charge, the amount financed, the number of payments and the amount of the monthly payment. The creditor must provide the disclosures before the loan is closed. TILA also regulates the advertising of credit and gives borrowers, among other things, certain rights regarding updated disclosures and the treatment of credit balances. Our marketplace provides borrowers with a TILA disclosure at the time a borrower posts a loan request on the marketplace. If the borrower’s request is not fully funded and the borrower chooses to accept a lesser amount offered, we provide an updated TILA disclosure. We also seek to comply with TILA’s disclosure requirements related to credit advertising.
Equal Credit Opportunity Act.
The federal Equal Credit Opportunity Act (ECOA) prohibits creditors from discriminating against credit applicants on the basis of race, color, sex, age, religion, national origin, marital status, the fact that all or part of the applicant’s income derives from any public assistance program or the fact that the applicant has in good faith exercised any right under the federal Consumer Credit Protection Act or any applicable state law. Regulation B, which implements ECOA, restricts creditors from requesting certain types of information from loan applicants and from using advertising or making statements that would discourage on a prohibited basis a reasonable person from making or pursuing an application. These requirements apply both to a lender such as WebBank as the creditor for loans facilitated through our marketplace as well as to a party such as ourselves that regularly participates in a credit decision. Investors may also be subject to the ECOA in their capacity as purchasers of notes if they are deemed to regularly participate in credit decisions. In the underwriting of loans offered through our marketplace, and in all aspects of operations, both WebBank and we seek to comply with ECOA’s provisions prohibiting discouragement and discrimination. ECOA also requires creditors to provide consumers and certain small businesses with timely notices of adverse action taken on credit applications. WebBank and we provide prospective borrowers who apply for a loan through our marketplace but are denied credit with an adverse action notice in compliance with applicable requirements.
Fair Credit Reporting Act
. The federal Fair Credit Reporting Act (FCRA), as amended by the Fair and Accurate Credit Transactions Act, administered by the Consumer Financial Protection Bureau (CFPB), promotes the accuracy, fairness and privacy of information in the files of consumer reporting agencies. FCRA requires a permissible purpose to obtain a consumer credit report and requires persons to report loan payment information to credit bureaus accurately. FCRA also imposes disclosure requirements on creditors who take adverse action on credit applications based on information contained in a credit report. WebBank and we have a permissible purpose for obtaining credit reports on potential borrowers, and we also obtain explicit consent from borrowers to obtain such reports. As the servicer for the loan, we accurately report loan payment and delinquency information to appropriate consumer reporting agencies. We provide an adverse action notice to a rejected borrower on WebBank’s behalf at the time the borrower is rejected that includes all the required disclosures. We also have processes in place to ensure that consumers are given “opt-out” opportunities, as required by the FCRA, regarding the sharing of their personal information. We have implemented an identity theft prevention program.
Fair Debt Collection Practices Act
. The federal Fair Debt Collection Practices Act (FDCPA) provides guidelines and limitations on the conduct of third-party debt collectors in connection with the collection of consumer debts. The FDCPA limits certain communications with third parties, imposes notice and debt validation requirements, and
13
LENDINGCLUB CORPORATION
prohibits threatening, harassing or abusive conduct in the course of debt collection. While the FDCPA applies to third-party debt collectors, debt collection laws of certain states impose similar requirements on creditors who collect their own debts. In addition, the CFPB prohibits unfair, deceptive or abusive acts or practices in debt collection, including first-party debt collection. Our agreement with investors prohibits investors from attempting to collect directly on the loan. Actual collection efforts in violation of this agreement are unlikely given that investors do not learn the identity of borrowers. We use our internal collection team and a professional third-party debt collection agent to collect delinquent accounts. They are required to comply with the FDCPA and all other applicable laws in collecting delinquent accounts of our borrowers.
Privacy and Data Security Laws
. The federal Gramm-Leach-Bliley Act (GLBA) includes limitations on financial institutions’ disclosure of nonpublic personal information about a consumer to nonaffiliated third parties, in certain circumstances requires financial institutions to limit the use and further disclosure of nonpublic personal information by nonaffiliated third parties to whom they disclose such information and requires financial institutions to disclose certain privacy policies and practices with respect to information sharing with affiliated and nonaffiliated entities as well as to safeguard personal customer information. We have a detailed privacy policy, which complies with GLBA and is accessible from every page of our website. We maintain consumers’ personal information securely, and we do not sell, rent or share such information with third parties for marketing purposes unless previously agreed to by the consumer. In addition, we take measures to safeguard the personal information of our borrowers and investors and protect against unauthorized access to this information.
Servicemembers Civil Relief Act
. The federal Servicemembers Civil Relief Act (SCRA) allows military members to suspend or postpone certain civil obligations so that the military member can devote his or her full attention to military duties. The SCRA requires us to adjust the interest rate of borrowers who qualify for and request relief. If a borrower with an outstanding loan qualifies for SCRA protection, we will reduce the interest rate on the loan to 6% for the duration of the borrower’s active duty. During this period, the investors who have invested in such a loan will not receive the difference between 6% and the loan’s original interest rate. For a borrower to obtain an interest rate reduction on a loan due to military service, we require the borrower to send us a written request and a copy of the borrower’s mobilization orders. We do not take military service into account in assigning loan grades to borrower loan requests and we do not disclose the military status of borrowers to investors.
The Dodd-Frank Wall Street Reform and Consumer Protection Act
. In July 2010, the Dodd-Frank Act was signed into law. The Dodd-Frank Act is extensive and significant legislation that includes consumer protection provisions. Among other things, the Dodd-Frank Act created the CFPB, which commenced operations in July 2011 and has authority to write regulations under federal consumer financial protection laws, such as the Truth in Lending Act and the Equal Credit Opportunity Act, and to enforce those laws against and examine large financial institutions, such as our issuing banks, for compliance. The CFPB is authorized to prevent “unfair, deceptive or abusive acts or practices” through its regulatory, supervisory and enforcement authority. We are subject to the CFPB’s jurisdiction, including its enforcement authority, as a servicer and acquirer of consumer credit. The CFPB may request reports concerning our organization, business conduct, markets and activities. The CFPB may also conduct on-site examinations of our business on a periodic basis if the CFPB were to determine, through its complaint system, that we were engaging in activities that pose risks to consumers.
Other Regulations
Electronic Fund Transfer Act and NACHA Rules.
The federal Electronic Fund Transfer Act (EFTA) and Regulation E that implements it provide guidelines and restrictions on the electronic transfer of funds from consumers’ bank accounts. In addition transfers performed by ACH electronic transfers are subject to detailed timing and notification rules and guidelines administered by the National Automated Clearinghouse Association (NACHA). Most transfers of funds in connection with the origination and repayment of loans are performed by ACH. We obtain necessary electronic authorization from borrowers and investors for such transfers in compliance with such rules. We also comply with the requirement that a loan cannot be conditioned on the borrower’s agreement to repay the loan through automatic fund transfers. Transfers of funds through our platform are executed by Wells Fargo and conform to the EFTA, its regulations and NACHA guidelines.
14
LENDINGCLUB CORPORATION
Electronic Signatures in Global and National Commerce Act/Uniform Electronic Transactions Act.
The federal Electronic Signatures in Global and National Commerce Act (ESIGN), and similar state laws, particularly the Uniform Electronic Transactions Act (UETA), authorize the creation of legally binding and enforceable agreements utilizing electronic records and signatures. ESIGN and UETA require businesses that want to use electronic records or signatures in consumer transactions and provide disclosures to consumers, to obtain the consumer’s consent to receive information electronically. When a borrower or investor registers on our platform, we obtain his or her consent to transact business electronically, receive electronic disclosures and maintain electronic records in compliance with ESIGN and UETA requirements.
Bank Secrecy Act.
In cooperation with WebBank, we have implemented various anti-money laundering policy and procedures to comply with applicable federal law. With respect to new borrowers, we apply the customer identification and verification program rules and screen names against the list of specially designated nationals maintained by the U.S. Department of the Treasury and OFAC pursuant to the USA PATRIOT Act amendments to the Bank Secrecy Act and its implementing regulation.
New Laws and Regulations.
From time to time, various types of federal and state legislation are proposed and new regulations are introduced that could result in additional regulation of, and restrictions on, the business of consumer lending. We cannot predict whether any such legislation or regulations will be adopted or how this would affect our business or our important relationships with third parties. In addition, the interpretation of existing legislation may change or may prove different than anticipated when applied to our novel business model. Compliance with such requirements could involve additional costs, which could have a material adverse effect on our business. As a consequence of the extensive regulation of commercial lending in the United States, our business is particularly susceptible to being affected by federal and state legislation and regulations that may increase the cost of doing business.
In addition, see “
Item 1A – Risk Factors – Risks Related to Our Business and Regulation
.”
Foreign Laws and Regulations.
We do not permit non-U.S. based individuals to register as borrowers on the platform and the lending platform does not operate outside the United States. Therefore, we do not believe that we are subject to foreign laws or regulations for borrowers.
Intellectual Property
To establish and protect our technology and intellectual property rights, we rely on a combination of copyright, trade secret and other rights, as well as confidentiality procedures, non-disclosure agreements with third parties, employee disclosure and invention assignment agreements, and other contractual rights. Despite our efforts to protect our proprietary rights, third parties may, in an authorized or unauthorized manner, attempt to use, copy or otherwise obtain and market or distribute our intellectual property rights or technology or otherwise develop a product with the same functionality as our solution. In addition, our competitors may develop products that are similar to our technology. Policing all unauthorized use of our intellectual property rights is nearly impossible, and we cannot be certain that the steps we have taken or will take in the future will prevent misappropriations of our technology or intellectual property rights.
Employees
At
December 31, 2015
, we had
1,382
employees and contract employees. None of our employees are represented by a labor union. We have not experienced any work stoppages, and we consider our employee relations to be good.
Available Information
Our website address is
www.lendingclub.com
. Our Annual Report on Form 10-K, Quarterly Reports on Form 10-Q, Current Reports on Form 8-K and amendments to reports filed pursuant to Section 13(a) and 15(d) of the Securities Exchange Act of 1934, as amended (Exchange Act), are filed with the U.S. Securities and Exchange Commission
15
LENDINGCLUB CORPORATION
(SEC). We are subject to the informational requirements of the Exchange Act and file or furnish reports, proxy statements and other information with the SEC. Such reports and other information filed by the Company with the SEC are available free of charge on our website at
ir.lendingclub.com
when such reports are available on the SEC’s website. We use our investor relations website as a means of disclosing material non-public information and for complying with our disclosure obligations under Regulation FD.
The public may read and copy any materials filed by us with the SEC at the SEC’s Public Reference Room at 100 F Street, NE, Room 1580, Washington, DC 20549. The public may obtain information on the operation of the Public Reference Room by calling the SEC at 1-800-SEC-0330. The SEC maintains an Internet site that contains reports, proxy and information statements, and other information regarding issuers that file electronically with the SEC at
www.sec.gov
.
The contents of the websites referred to above are not incorporated into this filing. Further, our references to the URLs for these websites are intended to be inactive textual references only.
16
LENDINGCLUB CORPORATION
You should carefully consider the risks and uncertainties described below, together with all of the other information in this Annual Report on Form 10-K, including the section titled “Item 7 – Management’s Discussion and Analysis of Financial Condition and Results of Operations” and the consolidated financial statements and related notes. While we believe the risks and uncertainties described below include all material risks currently known by us, it is possible that these may not be the only ones we face. If any of the risks actually occur, our business, financial condition, operating results and prospects could be materially and adversely affected.
RISKS RELATED TO OUR BUSINESS AND REGULATION
If we are unable to maintain our relationships with issuing banks, our business will suffer.
We rely on issuing banks to originate all loans and to comply with various federal, state and other laws. Our primary issuing bank is WebBank, a Utah-chartered industrial bank that handles a variety of consumer and commercial financing programs. Springstone Financial, LLC (Springstone), our wholly-owned subsidiary, relies on NBT Bank and Comenity Capital Bank as issuing banks for its education and patient finance loans.
Our agreements with WebBank are non-exclusive and do not prohibit WebBank from working with our competitors or from offering competing services. Our current agreements with WebBank have initial terms ending in November 2018, with two automatic, one-year renewal terms, subject to certain early termination provisions as set forth in the agreements. WebBank currently offers loan programs through another online marketplace. WebBank could decide that working with us is not in its interest, could make working with it cost prohibitive or could decide to enter into exclusive or more favorable relationships with our competitors. In addition, WebBank may not perform as expected under our agreements including potentially being unable to accommodate our projected growth in loan volume. We could in the future have disagreements or disputes with WebBank, which could negatively impact or threaten our relationship.
WebBank is subject to oversight by the FDIC and the State of Utah and must comply with complex rules and regulations, licensing and examination requirements, including requirements to maintain a certain amount of regulatory capital relative to its outstanding loans. We are a service provider to WebBank, and as such, we are subject to audit by WebBank in accordance with FDIC guidance related to management of third-party vendors. We may also be subject to the examination and enforcement authority of the FDIC as a bank service company covered by the Bank Service Company Act. If WebBank were to suspend, limit or cease its operations or our relationship with WebBank were to otherwise terminate, we would need to implement a substantially similar arrangement with another issuing bank, obtain additional state licenses or curtail our operations. Although we currently have a non-exclusive arrangement with Cross River Bank, another issuing bank, to date Cross River Bank has not originated any loans through our platform. If we need to enter into alternative arrangements with a different issuing bank to replace our existing arrangements, we may not be able to negotiate a comparable alternative arrangement. Transitioning loan originations to a new issuing bank is untested and may result in delays in the issuance of loans or, if our platform becomes inoperable, may result in our inability to facilitate loans through our platform. If we were unable to enter in an alternative arrangement with a different issuing bank, we would need to obtain a state license in each state in which we operate to enable us to originate loans, as well as comply with other state and federal laws, which would be costly and time-consuming. If we are unsuccessful in maintaining our relationships with WebBank or other issuing banks, our ability to provide loan products could be materially impaired and our operating results would suffer.
17
LENDINGCLUB CORPORATION
The regulatory framework for our business is evolving and uncertain as federal and state governments consider new laws to regulate online marketplaces such as ours. New laws and regulations, including taxes on services provided by us, as well as continued uncertainty regarding potential new laws or regulations, may negatively affect our business.
The regulatory framework for online marketplaces such as ours is evolving and uncertain. It is possible that new laws and regulations will be adopted in the United States and internationally, or existing laws and regulations may be interpreted in new ways, that would affect the operation of our marketplace and the way in which we interact with borrowers and investors.
Recognizing the growth in online marketplaces such as ours, in July 2015 the U.S. Treasury Department issued a request for information (RFI) to study the various business models and products offered by online marketplace lenders, the potential for online marketplace lending to expand access to credit to historically underserved borrowers and how the financial regulatory framework should evolve to support the safe growth of the industry. The RFI sought information about a number of topics, including how credit marketplaces manage the risk of fraud and security breaches, how they protect consumers against scams or default, how much investors in the loans rely on borrowed money, and whether the lenders should have to retain some risk relating to the loans they originate or underwrite. We, along with many other interested groups, submitted responses to the Treasury’s RFI by the September 30, 2015 deadline. In December 2015, the California Department of Business Oversight sent an online survey to fourteen marketplace lenders, including us, requesting information about our business model, online platform, loan performance and investor funding process.
Although the Treasury Department and California Department of Business Oversight are in the information-gathering stage and no interpretive guidance has been released, there is a possibility that our business may become subject to additional or different regulations in the future. The cost and complexity to comply with new laws or regulations could be significant and result in the need to modify our operations and increase our operating expenses, and we may be unable to pass any such costs on to borrowers and investors.
A decline in economic conditions may adversely affect our customers, which may negatively impact our business and results of operations.
As a credit marketplace, we believe our customers are more highly susceptible to uncertainties and negative trends, real or perceived, in the markets driven by, among other factors, general economic conditions in the United States and abroad. These external economic conditions and resulting trends or uncertainties could adversely impact our customer's ability or desire to participate on our marketplace as borrowers or investors, and consequently could negatively affect our business and results of operations.
There continues to be uncertainty as to how the CFPB’s actions or the actions of any other new agency could impact our business or that of our issuing banks.
The CFPB, which commenced operations in July 2011, has broad authority over the businesses in which we engage. This includes authority to write regulations under federal consumer financial protection laws, such as the Truth in Lending Act and the Equal Credit Opportunity Act, and to enforce those laws against and examine large financial institutions, such as our issuing banks, for compliance. The CFPB is authorized to prevent “unfair, deceptive or abusive acts or practices” through its regulatory, supervisory and enforcement authority. To assist in its enforcement, the CFPB maintains an online complaint system that allows consumers to log complaints with respect to various consumer finance products, including the loan products we facilitate. This system could inform future CFPB decisions with respect to its regulatory, enforcement or examination focus.
We are subject to the CFPB’s jurisdiction, including its enforcement authority, as a servicer and acquirer of consumer credit. The CFPB may request reports concerning our organization, business conduct, markets and activities. The CFPB may also conduct on-site examinations of our business on a periodic basis if the CFPB were to determine, through its complaint system that we were engaging in activities that pose risks to consumers.
18
LENDINGCLUB CORPORATION
There continues to be uncertainty as to how the CFPB’s strategies and priorities, including in both its examination and enforcement processes, will impact our businesses and our results of operations going forward. Actions by the CFPB could result in requirements to alter or cease offering affected loan products and services, making them less attractive and restricting our ability to offer them.
Although we have committed resources to enhancing our compliance programs, actions by the CFPB or other regulators against us, our issuing banks or our competitors that discourage the use of the marketplace model or suggest to consumers the desirability of other loan products or services could result in reputational harm and a loss of borrowers or investors. Our compliance costs and litigation exposure could increase materially if the CFPB or other regulators enact new regulations, change regulations that were previously adopted, modify, through supervision or enforcement, past regulatory guidance, or interpret existing regulations in a manner different or stricter than have been previously interpreted.
If the loans originated through our marketplace were found to violate a state’s usury laws, we may have to alter our business model and our business could be harmed.
The interest rates that are charged to borrowers and that form the basis of payments to investors through our marketplace are enabled by legal principles including (i) the application of federal law to enable an issuing bank that originates the loan to export the interest rates of the jurisdiction where it is located, or (ii) the application of common law “choice of law” principles based upon factors such as the loan document’s terms and where the loan transaction is completed to provide uniform rates to borrowers, or (iii) the application of principles that allow the transferee of a loan to continue to collect interest as provided in the loan document. WebBank, the primary issuing bank of the loans originated through our marketplace, is chartered in, and operates out of, Utah, which allows parties to generally agree by contract to any interest rate. The annual percentage rates offered by WebBank through our marketplace for personal loans as of
December 31, 2015
range from
5.99%
to
32.99%
, which equate to interest rates for investors that range from
5.32%
to
28.99%
. Certain states, including Utah, have no statutory interest rate limitations on personal loans, while other jurisdictions have a maximum rate. In some jurisdictions, the maximum rate is less than the current maximum rate offered by WebBank through our platform. If the laws of such jurisdictions were found to apply to the loans originated through our marketplace, those loans could be in violation of such laws.
In May 2015, based on the facts of that case in which the national bank no longer had any interest in the loan,
the U.S. Court of Appeals for the Second Circuit issued its decision in Madden v. Midland Funding, LLC that interpreted the scope of federal preemption under the National Bank Act (“NBA”) and held that a nonbank assignee of a loan originated by a national bank was not entitled to the benefits of federal preemption of claims of usury. The Second Circuit denied the defendant’s motion to reconsider the decision and remanded the case to address choice of law matters. The Second Circuit’s decision is binding on federal courts located in Connecticut, New York, and Vermont, but the decision could also be adopted by other courts. The defendant’s petition to the U.S. Supreme Court to review the decision is currently pending. We are unable to predict whether the U.S. Supreme Court will review the decision and, if it does, what the outcome will be. If applied to any of the loans originated through our marketplace, the Second Circuit’s decision could adversely impact our business.
If a borrower were to successfully bring claims against us for state usury law violations, and the rate on that borrower’s personal loan was greater than that allowed under applicable state law, we could be subject to fines and penalties, including the voiding of loans and repayment of principal and interest to borrowers and investors. We might decide to limit the maximum interest rate on certain loans originated through our marketplace, and we might decide to originate loans under state-specific licenses, where this ruling is applicable. These actions could adversely impact our business. Further, if we were unable to partner with another issuing bank, we would have to substantially modify our business operations from the manner currently contemplated and would be required to maintain state-specific licenses and only provide a limited range of interest rates for personal loans, all of which would substantially reduce our operating efficiency and attractiveness to investors and possibly result in a decline in our operating results.
19
LENDINGCLUB CORPORATION
Several lawsuits have sought to re-characterize certain loan marketers and other originators as lenders. If litigation on similar theories were successful against us, loans facilitated through our marketplace could be subject to state consumer protection laws in a greater number of states.
Several lawsuits have brought under scrutiny the association between high-interest “payday loan” marketers and out-of-state banks. These lawsuits assert that payday loan marketers use out-of-state lenders in order to evade the consumer protection laws imposed by the states where they do business. Such litigation has sought to re-characterize the loan marketer as the lender for purposes of state consumer protection law and usury restrictions. Similar civil actions have been brought in the context of gift cards and retail purchase finance. Although we believe that our activities are highly distinguishable from the activities involved in these cases, a court or regulatory authority could disagree.
Additional state consumer protection laws would be applicable to the loans facilitated through our marketplace if we were re-characterized as a lender, and the loans could be voidable or unenforceable. In addition, we could be subject to claims by borrowers, as well as enforcement actions by regulators. Even if we were not required to cease doing business with residents of certain states or to change our business practices to comply with applicable laws and regulations, we could be required to register or obtain licenses or regulatory approvals that could impose a substantial cost on us.
If we are unable to maintain or increase loan originations facilitated through our marketplace or if existing borrowers or investors do not continue to participate on our marketplace, our business and results of operations will be adversely affected.
We have experienced rapid revenue and origination growth through our marketplace in recent periods with originations totaling
$8.4 billion
,
$4.4 billion
and
$2.1 billion
for the years ended
December 31, 2015
,
2014
and
2013
, respectively. To continue to grow our business, we must continue to increase loan originations through our marketplace by attracting a large number of new borrowers who meet our platform’s lending standards and new and existing investors to invest in these loans. The number of unique borrowers on our marketplace increased over the prior year by
96%
,
116%
and
151%
for the years ending
December 31, 2015
,
2014
and
2013
, respectively. The number of unique investors on our marketplace increased over the prior year by
39%
,
28%
and
44%
for the years ending
December 31, 2015
,
2014
and
2013
, respectively. There can be no assurance that this increase in the number of unique borrowers or investors will continue and may decline based upon a variety of internal and external factors. Furthermore, we have experienced a high number of inquiries from potential borrowers who do not meet the criteria for loan application approval. If there are not sufficient qualified loan requests, investors may be unable to deploy their capital in a timely or efficient manner and may seek other investment opportunities. If there are insufficient investor commitments or participation, borrowers may be unable to obtain investment capital for their loans and may stop using our marketplace for their borrowing needs, which will impact our business results.
If we experience an increase in defaults on loans facilitated through our marketplace, the return on investment for investors in those loans would be adversely affected and investors may not find investing through our marketplace desirable.
We make payments ratably on an investor’s investment only if we receive the borrower’s payments on the corresponding loan. If we do not receive payments on the corresponding loan related to an investment, the investor will not be entitled to any payments under the terms of the investment. Further, investors may have to pay us an additional servicing fee of up to
35%
of any amount recovered by us or our third-party collection agencies assigned to collect on the loan. An investor may become dissatisfied with our marketplace if a loan underlying its investment is not repaid and it does not receive full payment. As a result, our reputation may suffer and we may lose investor confidence, which could adversely affect investor participation on our marketplace.
20
LENDINGCLUB CORPORATION
Credit and other information that we receive from borrowers or third parties about a borrower may be inaccurate or may not accurately reflect the borrower’s creditworthiness, which may cause us to inaccurately price loans facilitated through our marketplace.
Our ability to review and select qualified borrowers depends on obtaining borrower credit information from consumer reporting agencies, such as TransUnion, Experian or Equifax, and we assign loan grades to loan requests based on our marketplace’s credit decisioning and scoring models that take into account reported credit score, other information reported by the consumer reporting agencies and the requested loan amount, in addition to a variety of other factors. A credit score or loan grade assigned to a borrower may not reflect that borrower’s actual creditworthiness because the credit score may be based on outdated, incomplete or inaccurate consumer reporting data, and we do not verify the information obtained from the borrower’s credit report. Additionally, there is a risk that, following the date of the credit report that we obtain and review, a borrower may have:
|
•
|
become delinquent in the payment of an outstanding obligation;
|
|
•
|
defaulted on a pre-existing debt obligation;
|
|
•
|
taken on additional debt; or
|
|
•
|
sustained other adverse financial events.
|
In addition, borrowers supply a variety of information that is included in the loan listings on our marketplace. Other than as described below, we do not verify this information, and it may be inaccurate or incomplete. For example, we often do not verify a borrower’s stated tenure, job title, home ownership status or intention for the use of loan proceeds.
If borrowers default on loans that are not priced correctly because the information provided by the borrowers or third parties is inaccurate, investors may try to rescind their affected investments in these loans and our reputation may be harmed.
If the credit decisioning and scoring models we use contain errors or are otherwise ineffective, our reputation and relationships with borrowers and investors could be harmed and our market share could decline.
Our ability to attract borrowers and investors to, and build trust in, our marketplace is significantly dependent on our ability to effectively evaluate a borrower’s credit profile and likelihood of default. To conduct this evaluation, we utilize credit decisioning and scoring models that assign each loan offered on our marketplace a grade and a corresponding interest rate. Our marketplace’s credit decisioning and scoring models are based on algorithms that evaluate a number of factors, including behavioral data, transactional data and employment information, which may not effectively predict future loan losses. If we are unable to effectively segment borrowers into relative risk profiles, we may be unable to offer attractive interests rates for borrowers and risk-adjusted returns for investors. We continually refine these algorithms based on new data and changing macro and economic conditions. If any of these credit decisioning and scoring models contain programming or other errors, are ineffective or the data provided by borrowers or third parties is incorrect or stale, our loan pricing and approval process could be negatively affected, resulting in mispriced or misclassified loans or incorrect approvals or denials of loans. While we have not incurred any material liabilities to date, if these errors were to occur in the future, investors may try to rescind their affected investments or decide not to invest in loans in the future or borrowers may seek to revise the terms of their loans or reduce the use of our marketplace for loans.
If loan default rates are in excess of the expected default rates, we may be unable to collect our entire servicing fee.
Personal loans facilitated through our marketplace are not secured by any collateral, not guaranteed or insured by any third party and not backed by any governmental authority in any way. We are therefore limited in our ability to collect on the loans if a borrower is unwilling or unable to repay. A borrower’s ability to repay us can be negatively impacted by increases in their payment obligations to other lenders under mortgage, credit card and other loans, including student loans and home equity lines of credit. These changes can result from increases in base lending
21
LENDINGCLUB CORPORATION
rates or structured increases in payment obligations and could reduce the ability of our borrowers to meet their payment obligations to other lenders and to us. If a borrower defaults on a loan, we typically outsource subsequent servicing efforts to third-party collection agencies, which may be unsuccessful in their efforts to collect the amount of the loan. Because our servicing fees depend on the collectability of the loans, if we experience an unexpected significant increase in the number of borrowers who fail to repay their loans or an increase in the principal amount of the loans that are not repaid, we will be unable to collect our entire servicing fee for such loans and our revenue could be adversely affected.
A relatively small number of investors account for a large dollar amount of investment in loans funded through our marketplace.
A relatively small number of investors account for a large dollar amount of investment in loans funded through our marketplace. Although we continue to believe there is sufficient investor demand to replace investors who may choose not to continue to invest through our marketplace, if we are unable to attract sufficient investor commitments or investors do not continue to participate in our marketplace at the current rates, we may be unable to increase our loan originations and our revenue may grow more slowly than expected or decline. In addition, if a large number of our existing investors ceased utilizing our marketplace over a short period of time, our business could be temporarily interrupted and we may decide to use our capital to support short-term marketplace equilibrium as new investors complete the administrative and diligence updating processes necessary to enable their investments.
Our ability to protect the confidential information of our borrowers and investors may be adversely affected by cyber-attacks, computer viruses, physical or electronic break-ins or similar disruptions.
The highly automated nature of our marketplace may make it an attractive target and potentially vulnerable to cyber attacks, computer viruses, physical or electronic break-ins or similar disruptions. Our marketplace processes certain sensitive data from our borrowers and investors. While we have taken steps to protect confidential information that we have access to, our security measures could be breached. Any accidental or willful security breaches or other unauthorized access to our marketplace could cause confidential borrower and investor information to be stolen and used for criminal purposes. Security breaches or unauthorized access to confidential information could also expose us to liability related to the loss of the information, time-consuming and expensive litigation and negative publicity. If security measures are breached because of third-party action, employee error, malfeasance or otherwise, or if design flaws in our software are exposed and exploited, our relationships with borrowers and investors could be severely damaged, and we could incur significant liability.
Because techniques used to sabotage or obtain unauthorized access to systems change frequently and generally are not recognized until they are launched against a target, we and our third-party hosting facilities may be unable to anticipate these techniques or to implement adequate preventative measures. In addition, federal regulators and many federal and state laws and regulations require companies to notify individuals of data security breaches involving their personal data. These mandatory disclosures regarding a security breach are costly to implement and often lead to widespread negative publicity, which may cause borrowers and investors to lose confidence in the effectiveness of our data security measures. Any security breach, whether actual or perceived, would harm our reputation, we could lose borrowers, investors and ecosystem partners and our business and operations could be adversely affected.
Any significant disruption in service on our platform or in our computer systems, including events beyond our control, could prevent us from processing or posting payments on loans, reduce the attractiveness of our marketplace and result in a loss of borrowers or investors.
In the event of a platform outage and physical data loss, our ability to perform our servicing obligations, process applications or make loans available on our marketplace would be materially and adversely affected. The satisfactory performance, reliability and availability of our technology and our underlying network infrastructure are critical to our operations, customer service, reputation and our ability to attract new and retain existing borrowers and investors. Our platform systems are mirrored between two third-party owned and operated facilities. Our
22
LENDINGCLUB CORPORATION
primary location is in Las Vegas, Nevada and is operated by Switch, Inc. Our secondary location is located in Santa Clara, California and is operated by CenturyLink. Our operations depend on both provider’s ability to protect its and our systems in their facilities against damage or interruption from natural disasters, power or telecommunications failures, air quality issues, environmental conditions, computer viruses or attempts to harm our systems, criminal acts and similar events. If our arrangement with either provider is terminated or if there is a lapse of service or damage to their facilities, we could experience interruptions in our service as well as delays and additional expense in arranging new facilities.
Any interruptions or delays in our service, whether as a result of third-party error, our error, natural disasters or security breaches, whether accidental or willful, could harm our relationships with our borrowers and investors and our reputation. Additionally, in the event of damage or interruption, our insurance policies may not adequately compensate us for any losses that we may incur. Our disaster recovery plan has not been tested under actual disaster conditions, and we may not have sufficient capacity to recover all data and services in the event of an outage. These factors could prevent us from processing or posting payments on the loans, damage our brand and reputation, divert our employees’ attention, reduce our revenue, subject us to liability and cause borrowers and investors to abandon our marketplace, any of which could adversely affect our business, financial condition and results of operations.
Some aspects of our platform include open source software, and any failure to comply with the terms of one or more of these open source licenses could negatively affect our business.
Aspects of our platform include software covered by open source licenses, which may include, by way of example, GNU General Public License and the Apache License. The terms of various open source licenses have not been interpreted by U.S. courts, and there is a risk that such licenses could be construed in a manner that imposes unanticipated conditions or restrictions on our platform. If portions of our proprietary software are determined to be subject to an open source license, we could be required to publicly release the affected portions of our source code, re-engineer all or a portion of our technologies or otherwise be limited in the licensing of our technologies, each of which could reduce or eliminate the value of our technologies and loan products. In addition to risks related to license requirements, usage of open source software can lead to greater risks than use of third-party commercial software, as open source licensors generally do not provide warranties or controls on the origin of the software. Many of the risks associated with use of open source software cannot be eliminated, and could adversely affect our business.
Any failure to protect our own intellectual property rights could impair our brand, or subject us to claims for alleged infringement by third parties, which could harm our business.
We rely on a combination of copyright, trade secret, trademark and other rights, as well as confidentiality procedures and contractual provisions to protect our proprietary technology, processes and other intellectual property. However, the steps we take to protect our intellectual property rights may be inadequate. Third parties may seek to challenge, invalidate or circumvent our copyright, trade secret, trademark and other rights or applications for any of the foregoing. Our competitors, as well as a number of other entities and individuals, may own or claim to own intellectual property relating to our industry. From time to time, third parties may claim that we are infringing on their intellectual property rights, and we may be found to be infringing on such rights. We may, however, be unaware of the intellectual property rights that others may claim cover some or all of our technology or services.
In order to protect our intellectual property rights, we may be required to spend significant resources. Litigation brought to protect and enforce our intellectual property rights could be costly, time-consuming and distracting to management and could result in the impairment or loss of portions of our intellectual property. In addition, any claims or litigation could cause us to incur significant expenses and, if successfully asserted against us, could require that we pay substantial damages or ongoing royalty payments, prevent us from offering our loan products or operating our platform or require that we comply with other unfavorable terms. Our failure to secure, protect and enforce our intellectual property rights could seriously adversely affect our brand and adversely impact our business.
23
LENDINGCLUB CORPORATION
Our platform and internal systems rely on software that is highly technical, and if it contains undetected errors, our business could be adversely affected.
Our platform and internal systems rely on software that is highly technical and complex. In addition, our platform and internal systems depend on the ability of such software to store, retrieve, process and manage immense amounts of data. The software on which we rely has contained, and may now or in the future contain, undetected errors or bugs. Some errors may only be discovered after the code has been released for external or internal use. Errors or other design defects within the software on which we rely may result in a negative experience for borrowers and investors, delay introductions of new features or enhancements, result in errors or compromise our ability to protect borrower or investor data or our intellectual property. Any errors, bugs or defects discovered in the software on which we rely could result in harm to our reputation, loss of borrowers or investors, loss of revenue or liability for damages, any of which could adversely affect our business and financial results.
The collection, processing, storage, use and disclosure of personal data could give rise to liabilities as a result of governmental regulation, conflicting legal requirements or differing views of personal privacy rights.
We receive, transmit and store a large volume of personally identifiable information and other user data. There are federal, state and foreign laws regarding privacy and the storing, sharing, use, disclosure and protection of personally identifiable information and user data. Specifically, personally identifiable information is increasingly subject to legislation and regulations in numerous U.S. and international jurisdictions, the intent of which is to protect the privacy of personal information that is collected, processed and transmitted in or from the governing jurisdiction. This regulatory framework for privacy issues worldwide is currently evolving and is likely to remain uncertain for the foreseeable future. We could be adversely affected if legislation or regulations are expanded to require changes in business practices or privacy policies, or if governing jurisdictions interpret or implement their legislation or regulations in ways that negatively affect our business, financial condition and results of operations. Our failure to comply with applicable privacy policies or federal, state or foreign laws and regulations or any compromise of security that results in the unauthorized release of personally identifiable information or other user data could damage our reputation, discourage potential borrowers or investors from using our marketplace or result in fines or proceedings brought against us, our issuing banks or other third parties by governmental agencies, borrowers, investors or other third parties, one or all of which could adversely affect our business, financial condition and results of operations. In addition to laws, regulations and other applicable common law rules regarding privacy and privacy advocacy, industry groups or other private parties may propose new and different privacy standards. We could also be subject to liability for the inappropriate use of information made available by us. Because the interpretation and application of privacy and data protection laws and privacy standards are still uncertain, it is possible that these laws or privacy standards may be interpreted and applied in a manner that is inconsistent with our practices. Any inability to adequately address privacy concerns, even if unfounded, or to comply with applicable privacy or data protection laws, regulations and privacy standards, could result in additional cost and liability for us, damage our reputation, inhibit use of our marketplace and harm our business.
As a rapidly growing company with a relatively limited operating history at our current scale, we face increased risks, uncertainties, expenses and difficulties.
We have a limited operating history at our current scale, and we have encountered and will continue to encounter risks, uncertainties, expenses and difficulties, including:
|
•
|
navigating complex and evolving regulatory and competitive environments;
|
|
•
|
increasing the number of borrowers and investors utilizing our marketplace;
|
|
•
|
increasing the volume of loans facilitated through our marketplace and transaction fees received for matching borrowers and investors through our marketplace;
|
|
•
|
entering into new markets and introducing new loan products;
|
|
•
|
continuing to revise our marketplace’s proprietary credit decisioning and scoring models, particularly in the face of changing macro and economic conditions;
|
|
•
|
continuing to develop, maintain and scale our platform;
|
24
LENDINGCLUB CORPORATION
|
•
|
effectively using limited personnel and technology resources;
|
|
•
|
effectively maintaining and scaling our financial and risk management controls and procedures;
|
|
•
|
maintaining the security of our platform and the confidentiality of the information provided and utilized across our platform; and
|
|
•
|
attracting, integrating and retaining an appropriate number of qualified employees.
|
If we do not compete effectively in our target markets, our operating results could be harmed.
The personal and small business lending market is competitive and evolving. We compete with financial products and companies that attract borrowers, investors or both. With respect to borrowers, we primarily compete with traditional financial institutions, such as banks, credit unions, credit card issuers and other consumer and specialty finance companies. With respect to investors, we primarily compete with other investment vehicles and asset classes, such as equities, bonds and short-term fixed income securities. We also compete with other online credit marketplaces.
Many of our competitors operate with different business models, have different cost structures or participate selectively in different market segments. They may ultimately prove more successful or more adaptable to new regulatory, technological and other developments. Some of our current or potential competitors have significantly more financial, technical, marketing and other resources than we do and may be able to devote greater resources to the development, promotion, sale and support of their platforms and distribution channels. Our potential competitors may also have longer operating histories, more extensive customer bases, greater brand recognition and brand loyalty and broader customer and partner relationships than we have. For example, more established Internet companies that possess large, existing customer bases, substantial financial resources and established distribution channels could enter the market. Additionally, a current or potential competitor may acquire one of our existing competitors or form a strategic alliance with one of our competitors. Our competitors may be better at developing new products, responding quickly to new technologies and undertaking more extensive marketing campaigns. If we are unable to compete with such companies and meet the need for innovation in our industry, the demand for our marketplace could stagnate or substantially decline, we could experience reduced revenue or our marketplace could fail to achieve or maintain more widespread market acceptance, any of which could harm our business.
If we are unable to successfully expand our marketplace to new markets, we may not succeed in growing our business.
Although historically we have focused on the personal loan market, we recently expanded our marketplace to include small business borrowers and education and patient finance loans. We plan to address additional markets and loan products and expand the types of borrowers and investors to further grow our business. Any failure to successfully address additional market segments and loan products or develop a broader base of borrowers and investors could result in loss of market share or slower growth, which would harm our business, financial condition and results of operations.
Fluctuations in interest rates could negatively affect transaction volume.
All personal and nearly all small business loans facilitated through our marketplace are issued with fixed interest rates, and education and patient finance loans are issued with fixed or variable rates, depending on the type of loan. If interest rates continue to rise, investors who have already committed capital may lose the opportunity to take advantage of the higher rates, or may seek to invest capital in alternative investments. Additionally, potential borrowers could seek to defer loans as they wait for interest rates to settle, and borrowers of variable rate loans may be subject to increased interest rates. If interest rates decrease after a loan is made, borrowers through our marketplace may prepay their loans to take advantage of the lower rates. Investors through our marketplace would lose the opportunity to collect the above-market interest rate payable on the corresponding loan and may delay or reduce future loan investments. As a result, fluctuations in the interest rate environment may discourage investors
25
LENDINGCLUB CORPORATION
and borrowers from participating in our marketplace and may reduce our loan originations, which may adversely affect our business.
Negative publicity could adversely affect our business and operating results.
Negative publicity about our industry or our company, including the quality and reliability of our marketplace, effectiveness of the credit decisioning and scoring models used in the marketplace, changes to our marketplace, our ability to effectively manage and resolve borrower and investor complaints, privacy and security practices, use of loan proceeds by certain borrowers of ours or other companies in our industry for illegal purposes, litigation, regulatory activity and the experience of borrowers and investors with our marketplace or services, even if inaccurate, could adversely affect our reputation and the confidence in, and the use of, our marketplace, which could harm our business and operating results. Harm to our reputation can arise from many sources, including employee misconduct, misconduct by our partners or partners of partners, other online credit marketplaces, outsourced service providers or other counterparties, failure by us or our partners to meet minimum standards of service and quality, inadequate protection of borrower and investor information and compliance failures and claims.
If we fail to promote and maintain our brand in a cost-effective manner, we may lose market share and our revenue may decrease.
We believe that developing and maintaining awareness of our brand in a cost-effective manner is critical to attracting new and retaining existing borrowers and investors to our marketplace. Successful promotion of our brand will depend largely on the effectiveness of our marketing efforts and the experience of borrowers and investors in our marketplace. Our efforts to build our brand have involved significant expense, and it is likely that our future marketing efforts will require us to incur significant additional expense. These brand promotion activities may not result in increased revenue and, even if they do, any increases may not offset the expenses incurred. If we fail to successfully promote and maintain our brand or if we incur substantial expenses in an unsuccessful attempt to promote and maintain our brand, we may lose our existing borrowers and investors to our competitors or be unable to attract new borrowers and investors.
Our success and future growth depend significantly on our successful marketing efforts, and if we are unable to attract borrowers and investors to our marketplace, our business and financial results may be harmed.
We intend to continue to dedicate significant resources to our marketing efforts, particularly as we continue to grow our marketplace, introduce new loan products and expand into new states. Our ability to attract qualified borrowers and sufficient investors depends in large part on the success of these marketing efforts and the success of the marketing channels we use to promote our marketplace. Our marketing channels include direct-mail, social media and the press, online partnerships, search engine optimization, search engine marketing, offline partnerships, mail-to-web and radio and television advertising. If any of our current marketing channels become less effective, if we are unable to continue to use any of these channels, if the cost of using these channels were to significantly increase or if we are unsuccessful in generating new channels, we may not be able to attract new borrowers and investors in a cost-effective manner or convert potential borrowers and investors into active borrowers and investors in our marketplace. As a result, our revenue and results of operations would be adversely affected, which may impair our ability to grow our business.
Successful strategic relationships with ecosystem partners are important for our future success.
We anticipate that we will continue to depend on relationships with ecosystem partners to grow our business. Ecosystem partners can transact directly with our marketplace as investors or serve as a source of referrals for investors and borrowers. We continue to pursue additional relationships with ecosystem partners, such as banks, asset managers and insurance companies. For example, we entered into strategic relationships with community banks and other financial partners to facilitate co-branded loan offerings to their borrower customers through our marketplace, and we may seek to expand these relationships in the future. Identifying, negotiating and documenting relationships with ecosystem partners require significant time and resources as does integrating third-party data and
26
LENDINGCLUB CORPORATION
services. Our current agreements with ecosystem partners often do not prohibit them from working with our competitors or from offering competing services. Our competitors may be effective in providing incentives to ecosystem partners to favor their products or services or in reducing the volume of loans facilitated through our marketplace. In addition, these ecosystem partners may not perform as expected under our agreements with them, and we may have disagreements or disputes with such partners, which could adversely affect our brand and reputation. If we cannot successfully enter into and maintain effective strategic relationships with ecosystem partners, our business may be harmed.
From time to time we may evaluate and potentially consummate acquisitions, which could require significant management attention, disrupt our business and adversely affect our financial results.
We may evaluate and consider strategic transactions, combinations, acquisitions or alliances to enhance our existing business or develop new loan products and services. These transactions could be material to our financial condition and results of operations if consummated. If we are able to identify an appropriate business opportunity, we may not be able to successfully consummate the transaction and, even if we do consummate such a transaction, we may be unable to obtain the benefits or avoid the difficulties and risks of such transaction.
Any acquisition will involve risks commonly encountered in business relationships, including:
|
•
|
difficulties in assimilating and integrating the operations, personnel, systems, data, technologies, products and services of the acquired business;
|
|
•
|
inability of the acquired technologies, products or businesses to achieve expected levels of revenue, profitability, productivity or other benefits;
|
|
•
|
difficulties in retaining, training, motivating and integrating key personnel;
|
|
•
|
diversion of management’s time and resources from our normal daily operations;
|
|
•
|
difficulties in successfully incorporating licensed or acquired technology and rights into our platform;
|
|
•
|
difficulties in maintaining uniform standards, controls, procedures and policies within the combined organizations;
|
|
•
|
difficulties in retaining relationships with customers, employees and suppliers of the acquired business;
|
|
•
|
risks of entering markets in which we have no or limited direct prior experience;
|
|
•
|
regulatory risks, including remaining in good standing with existing regulatory bodies or receiving any necessary pre-closing or post-closing approvals, as well as being subject to new regulators with oversight over an acquired business;
|
|
•
|
assumption of contractual obligations that contain terms that are not beneficial to us, require us to license or waive intellectual property rights or increase our risk for liability;
|
|
•
|
failure to successfully further develop the acquired technology;
|
|
•
|
liability for activities of the acquired business before the acquisition, including patent and trademark infringement claims, violations of laws, regulatory actions, commercial disputes, tax liabilities and other known and unknown liabilities;
|
|
•
|
assumption of exposure to performance of any acquired loan portfolios;
|
|
•
|
potential disruptions to our ongoing businesses; and
|
|
•
|
unexpected costs and unknown risks and liabilities associated with the acquisition.
|
We may not make any acquisitions, or any future acquisitions may not be successful, may not benefit our business strategy, may not generate sufficient revenue to offset the associated acquisition costs or may not otherwise result in the intended benefits. In addition, we cannot assure you that any future acquisition of new businesses or technology will lead to the successful development of new or enhanced loan products and services or that any new or enhanced loan products and services, if developed, will achieve market acceptance or prove to be profitable.
27
LENDINGCLUB CORPORATION
Expanding our operations internationally could subject us to new challenges and risks.
Although we currently only operate in the United States, we may seek to expand our business internationally. Managing any international expansion will require additional resources and controls. Any expansion internationally could subject our business to risks associated with international operations, including:
|
•
|
adjusting the proprietary risk algorithms that we use to account for the differences in information available on borrowers;
|
|
•
|
conformity with applicable business customs, including translation into foreign languages and associated expenses;
|
|
•
|
potential changes to our established business model;
|
|
•
|
the need to support and integrate with local third-party service providers;
|
|
•
|
competition with service providers that have greater experience in the local markets than we do or that have pre-existing relationships with potential borrowers and investors in those markets;
|
|
•
|
difficulties in staffing and managing foreign operations in an environment of diverse culture, laws and customers, and the increased travel, infrastructure and legal and compliance costs associated with international operations;
|
|
•
|
compliance with multiple, potentially conflicting and changing governmental laws and regulations, including banking, securities, employment, tax, privacy and data protection laws and regulations, such as the EU Data Privacy Directive;
|
|
•
|
compliance with U.S. and foreign anti-bribery laws, including the Foreign Corrupt Practices Act and the U.K. Anti-Bribery Act;
|
|
•
|
difficulties in collecting payments in foreign currencies and associated foreign currency exposure;
|
|
•
|
restrictions on repatriation of earnings;
|
|
•
|
compliance with potentially conflicting and changing laws of taxing jurisdictions where we conduct business and applicable U.S. tax laws as they relate to international operations, the complexity and adverse consequences of such tax laws and potentially adverse tax consequences due to changes in such tax laws; and
|
|
•
|
regional economic and political conditions.
|
As a result of these risks, any potential future international expansion efforts that we may undertake may not be successful.
Fraudulent activity associated with our marketplace could negatively impact our operating results, brand and reputation and cause the use of our loan products and services to decrease and our fraud losses to increase.
We are subject to the risk of fraudulent activity associated with our marketplace, issuing banks, borrowers, investors and third parties handling borrower and investor information. Our resources, technologies and fraud prevention tools may be insufficient to accurately detect and prevent fraud. Under our agreements with investors, we are obligated to repurchase loans in cases of confirmed identity theft. The level of our fraud charge-offs and results of operations could be materially adversely affected if fraudulent activity were to significantly increase. High profile fraudulent activity or significant increases in fraudulent activity could lead to regulatory intervention, negatively impact our operating results, brand and reputation and lead us to take steps to reduce fraud risk, which could increase our costs.
Misconduct and errors by our employees and third-party service providers could harm our business and reputation.
We are exposed to many types of operational risk, including the risk of misconduct and errors by our employees and other third-party service providers. Our business depends on our employees and third-party service providers to process a large number of increasingly complex transactions, including treasury transactions that involve significant dollar amounts and loan transactions that involve the use and disclosure of personal and business information. We could be materially adversely affected if treasury transactions were redirected, misappropriated or otherwise
28
LENDINGCLUB CORPORATION
improperly executed, personal and business information was disclosed to unintended recipients or an operational breakdown or failure in the processing of other transactions occurred, whether as a result of human error, a purposeful sabotage or a fraudulent manipulation of our operations or systems. In addition, the manner in which we store and use certain personal information and interact with borrowers and investors is governed by various federal and state laws. If any of our employees or third-party service providers take, convert or misuse funds, documents or data or fail to follow protocol when interacting with borrowers and investors, we could be liable for damages and subject to regulatory actions and penalties. We could also be perceived to have facilitated or participated in the illegal misappropriation of funds, documents or data, or the failure to follow protocol, and therefore be subject to civil or criminal liability. It is not always possible to identify and deter misconduct or errors by employees or third-party service providers, and the precautions we take to detect and prevent this activity may not be effective in controlling unknown or unmanaged risks or losses. Any of these occurrences could result in our diminished ability to operate our business, potential liability to borrowers and investors, inability to attract future borrowers and investors, reputational damage, regulatory intervention and financial harm, which could negatively impact our business, financial condition and results of operations.
Limited liquidity for investments facilitated through our marketplace may make these investments less attractive to investors.
No trading market currently exists for the certificates issued by the Trust or for the investment funds, each of which are privately placed. Note investors can only sell their notes through the resale trading platform operated by FOLIOfn Investments, Inc. (FOLIOfn), an unaffiliated registered broker-dealer. During
2015
, it took an average of approximately four days to sell a note on FOLIOfn with an offer price at or below par. We cannot assure you that FOLIOfn will continue to maintain a market for the trading of notes or that another market may arise. Given the lack of liquidity for certificates and the limited liquidity for notes, investors and potential investors may consider these investments to be less appealing and demand for these investments may decrease, which may adversely affect our business.
Borrowers may prepay a loan at any time without penalty and investors may stop investing in loans, which could reduce our servicing or management fee revenues.
A borrower may decide to prepay all or a portion of the remaining principal amount on a loan at any time without penalty. If the entire remaining unpaid principal amount of a loan is prepaid, we will not receive a servicing fee on the anticipated future loan payments and investors will not receive related payments. If a significant volume of prepayments occur, investors may stop investing in loans and the amount of our servicing or management fee revenues would decline, either of which could harm our business.
If new loan products and enhancements do not achieve sufficient market acceptance, our financial results and competitive position will be harmed.
We incur expenses and expend resources upfront to develop, acquire and market new loan products and platform enhancements to incorporate additional features, improve functionality or otherwise make our marketplace more desirable to borrowers and investors. New loan products or marketplace or platform enhancements must achieve high levels of market acceptance in order for us to recoup our investment in developing and bringing them to market.
Any new loan products and changes to our marketplace or platform could fail to attain sufficient market acceptance for many reasons, including:
|
•
|
our failure to predict market demand accurately and supply loan products that meet this demand in a timely fashion;
|
|
•
|
borrowers and investors using our marketplace may not like, find useful or agree with any changes;
|
|
•
|
defects, errors or failures in our platform;
|
|
•
|
negative publicity about our loan products or our marketplace or platform’s performance or effectiveness;
|
29
LENDINGCLUB CORPORATION
|
•
|
competition with established financial institutions;
|
|
•
|
delays in releasing new loan products or marketplace or platform enhancements; and
|
|
•
|
the introduction or anticipated introduction of competing products by our competitors.
|
If our new loan products or marketplace or platform enhancements do not achieve adequate acceptance in the market, our competitive position, revenue and operating results could be harmed. The adverse effect on our financial results may be particularly acute because of the significant development, marketing, sales and other expenses we will have incurred in connection with the new loan products or enhancements.
Competition for our employees is intense, and we may not be able to attract and retain the highly skilled employees needed to support our business.
We believe our success depends on the efforts and talents of our employees, including software engineers, financial personnel and marketing professionals. Our future success depends on our continued ability to attract, develop, motivate and retain highly qualified and skilled employees. Competition for highly skilled technical and financial personnel, particularly in the San Francisco Bay Area, is extremely intense. We may not be able to hire and retain these personnel at compensation levels consistent with our existing compensation and salary structure. Many of the companies with which we compete for experienced employees have greater resources than we have and may be able to offer more attractive terms of employment.
In addition, we invest significant time and expense in training our employees, which increases their value to competitors who may seek to recruit them. If we fail to retain our employees, we could incur significant expenses in hiring and training their replacements, and the quality of our services and our ability to serve borrowers and investors could diminish, resulting in a material adverse effect on our business.
If we fail to retain our key personnel, we may not be able to achieve our anticipated level of growth and our business could suffer.
In addition to attracting and retaining highly skilled employees in general, our future performance depends, in part, on our ability to attract and retain key personnel, including our executive officers, senior management team and other key personnel, all of whom would be difficult to replace. In particular, Mr. Laplanche, our founder and Chief Executive Officer, is critical to the management of our business and operations and the development of our strategic direction. The loss of the services of Mr. Laplanche, our other executive officers or members of our senior management team, and the process to replace any of them, would involve significant time and expense and may significantly delay or prevent the achievement of our business objectives.
If we cannot maintain our corporate culture as we grow, we could lose the innovation, collaboration and focus that contribute to our business.
We believe that a critical component of our success is our corporate culture, which we believe fosters innovation, encourages teamwork and cultivates creativity. As we develop the infrastructure of a public company and continue to grow, we may find it difficult to maintain these valuable aspects of our corporate culture. Any failure to preserve our culture could negatively impact our future success, including our ability to attract and retain employees, encourage innovation and teamwork and effectively focus on and pursue our corporate objectives.
Our credit facility provides our lenders with a first-priority lien against substantially all of our assets and contains certain affirmative and negative covenants and other restrictions on our actions, and it could therefore limit our operational flexibility or otherwise adversely affect our financial condition.
We have a senior secured revolving credit facility of $120.0 million, which the Company may draw upon from time to time. As of December 31, 2015, we had not drawn on the credit facility. The loan agreements for our credit facility contain restrictions on our ability to, among other things, pay dividends, incur indebtedness, place liens on assets, merge or consolidate, make investments, and enter into certain affiliate transactions. In addition, we are
30
LENDINGCLUB CORPORATION
required to maintain a maximum total net leverage ratio (as defined in the credit agreement) of 4.00:1.00 initially, and decreasing over the term of the credit facility to 3.00:1.00 on and after June 30, 2018.
If we fail to perform under the loan agreement by, for example, failing to make timely payments or failing to comply with the required total leverage ratio, our operations and financial condition could be adversely affected. For more information regarding the covenants and requirements, see
“Item 8 – Financial Statements and Supplementary Data – Notes to Consolidated Financial Statements – 12. Debt”
included in this Annual Report on Form 10-K.
If we discover a material weakness in our internal control over financial reporting that we are unable to remedy or otherwise fail to maintain effective internal control over financial reporting or disclosure controls and procedures, our ability to report our financial results on a timely and accurate basis and the market price of our common stock may be adversely affected.
The Sarbanes-Oxley Act of 2002 (Sarbanes-Oxley Act) requires, among other things, that we maintain effective internal control over financial reporting and disclosure controls and procedures. Although we did not discover any material weaknesses in internal control over financial reporting at
December 31, 2015
, subsequent testing by us or our independent registered public accounting firm, which has not performed an audit of our internal control over financial reporting, may reveal deficiencies in our internal control over financial reporting that are deemed to be material weaknesses. To comply with Section 404A and 404B, we may incur substantial cost, expend significant management time on compliance-related issues and hire additional accounting, financial and internal audit staff with appropriate public company experience and technical accounting knowledge. Moreover, if we are not able to comply with the requirements of Section 404A and 404B in a timely manner or if we or our independent registered public accounting firm identify deficiencies in our internal control over financial reporting that are deemed to be material weaknesses, we could be subject to sanctions or investigations by the Securities and Exchange Commission (SEC) or other regulatory authorities, which would require additional financial and management resources. Any failure to maintain effective disclosure controls and procedures or internal control over financial reporting could have a material adverse effect on our business and operating results, and cause a decline in the price of our common stock.
Our quarterly results may fluctuate significantly and may not fully reflect the underlying performance of our business.
Our quarterly results of operations, including the levels of our operating revenue and expenses, contribution margin and other key metrics, may vary significantly in the future and period-to-period comparisons of our operating results may not be meaningful. Accordingly, the results for any one quarter are not necessarily an indication of future performance. Our quarterly financial results may fluctuate due to a variety of factors, some of which are outside of our control and, as a result, may not fully reflect the underlying performance of our business. Fluctuation in quarterly results may adversely affect the price of our common stock. Factors that may cause fluctuations in our quarterly financial results include:
|
•
|
our ability to attract new investors or borrowers and maintain relationships with existing borrowers and investors;
|
|
•
|
loan volumes, loan grades, loan mix and the channels through which the loans and corresponding investors are sourced;
|
|
•
|
the amount and timing of operating expenses related to acquiring borrowers and investors and the maintenance and expansion of our business, operations and infrastructure;
|
|
•
|
entering new markets and introducing new loan products;
|
|
•
|
network outages or security breaches;
|
|
•
|
general economic, industry and market conditions;
|
|
•
|
our emphasis on borrower and investor experience instead of near-term growth; and
|
|
•
|
the timing of expenses related to the development or acquisition of technologies or businesses and potential future charges for impairment of goodwill from acquired technologies or businesses.
|
31
LENDINGCLUB CORPORATION
In addition, we experience some seasonality in demand for personal loans, which is generally lower in the first and fourth quarters. While our growth has somewhat masked this seasonality, our operating results could be affected by such seasonality in the future.
Our ability to use our deferred tax assets to offset future taxable income may be subject to certain limitations that could subject our business to higher tax liabilities.
We may be limited in the portion of net operating loss carryforwards that we can use in the future to offset taxable income for U.S. federal and state income tax purposes. At
December 31, 2015
, we had federal and state net operating loss carryforwards (NOLs) of approximately
$109.9 million
and
$77.4 million
, respectively, to offset future taxable income. These federal and state net operating loss carryforwards will begin expiring in 2025 and 2028, respectively. A lack of future taxable income would adversely affect our ability to utilize these NOLs. In addition, under Section 382 of the Internal Revenue Code of 1986, as amended (Code), a corporation that undergoes an “ownership change” is subject to limitations on its ability to utilize its NOLs to offset future taxable income. Future changes in our stock ownership as well as other changes that may be outside of our control, could result in additional ownership changes under Section 382 of the Code. Our NOLs may also be impaired under similar provisions of state law. Additionally, at
December 31, 2015
, we had federal and state research and development tax credit carryforwards of
$0.8 million
and
$2.1 million
, respectively. We assess the available positive and negative evidence to estimate if sufficient future taxable income will be generated to utilize the existing deferred tax assets. On the basis of this evaluation, a full valuation allowance has historically been recorded to recognize only deferred tax assets that are more likely than not to be realized. Our deferred tax assets may expire unutilized or underutilized, which could prevent us from offsetting future taxable income.
We have incurred net losses in the past and may incur net losses in the future.
As of
December 31, 2015
, our accumulated deficit was
$88.2 million
. We anticipate that our operating expenses will increase in the foreseeable future as we seek to continue to grow our business, attract borrowers, investors and partners and further enhance and develop our loan products, marketplace and platform. These efforts may prove more expensive than we currently anticipate, and we may not succeed in increasing our revenue sufficiently to offset these higher expenses. We may incur additional net losses in the future and may not maintain profitability on a quarterly or annual basis.
Our business is subject to the risks of earthquakes, fire, power outages, floods and other catastrophic events, and to interruption by man-made problems such as strikes and terrorism.
A significant natural disaster, such as an earthquake, fire, power outage, flood or other catastrophic event, or interruptions by strikes, terrorism or other made-made problems, could have a material adverse effect on our business, operating results and financial condition. Our headquarters and our real-time disaster recovery data center are located in the San Francisco Bay Area, a region known for seismic activity. Despite any precautions we may take, the occurrence of a natural disaster or other unanticipated problems at our data centers could result in lengthy interruptions in our services. In addition, acts of strikes, terrorism and other geo-political unrest could cause disruptions in our business and lead to interruptions, delays or loss of critical data. All of the aforementioned risks may be further increased if our disaster recovery plans prove to be inadequate. We have implemented a disaster recovery program that allows us to move production to a back-up data center in the event of a catastrophe. Although this program is functional, we do not currently serve network traffic equally from each data center. If our primary data center shuts down, there will be a period of time that our loan products or services, or certain of our loan products or services, will remain inaccessible to our users or our users may experience severe issues accessing our loan products and services.
We do not currently maintain business interruption insurance to compensate us for potentially significant losses, including potential harm to our business that may result from interruptions in our ability to provide our loan products and services.
32
LENDINGCLUB CORPORATION
We may have to constrain our business activities to avoid being deemed an investment company under the Investment Company Act of 1940.
In general, a company that is or holds itself out as being engaged primarily in the business of investing, reinvesting or trading in securities may be deemed to be an investment company under the Investment Company Act of 1940, as amended (Investment Company Act). The Investment Company Act contains substantive legal requirements that regulate the manner in which “investment companies” are permitted to conduct their business activities. We believe we have conducted, and we intend to continue to conduct, our business in a manner that does not result in our company being characterized as an investment company. To avoid being deemed an investment company, we may not be able to broaden our offerings, which could require us to forego attractive opportunities. We may also apply for formal exemptive relief to provide additional clarity on our status under the Investment Company Act. We may not receive such relief on a timely basis, if at all, and such relief may require us to modify or curtail our operations. If we are deemed to be an investment company under the Investment Company Act, we may be required to institute burdensome compliance requirements and our activities may be restricted, which would materially adversely affect our business, financial condition and results of operations.
If our registered investment advisor, LC Advisors, LLC, were found to have violated the Investment Advisers Act, our ability to raise sufficient investor commitments to meet borrower demand could be impaired.
Our subsidiary LCA acts as an advisor to certain private funds and accredited investors, including those that invest in managed accounts that rely on a third-party adviser or manager to manage their investment through our marketplace. Registered investment advisers are subject to a number of regulatory and legal requirements, including conflicts of interest, advertising restrictions and custody requirements. We believe we have conducted, and we intend to continue to conduct, the business of LCA in substantial compliance with the Investment Advisers Act of 1940, as amended (Investment Advisers Act) and applicable fiduciary duties. If, however, we are deemed to have breached any of our obligations under the Investment Advisers Act, the activities of LCA could be restricted, suspended or even terminated. If this were to occur, our ability to provide investors with the opportunity to invest through managed accounts could be severely curtailed, and we may not be able to sufficiently meet borrower and investor demand for loans, which could harm our business.
We have not reviewed our compliance with foreign laws regarding the participation of non-U.S. residents on our marketplace.
From time to time, non-U.S. residents invest in loans directly through our marketplace. Through
December 31, 2015
, the percentage of notes purchased (based upon dollar amounts) by such persons since inception was less than
1%
of all loans issued. We are not experts with respect to all applicable laws in the various foreign jurisdictions, and we cannot be sure that we are complying with applicable foreign laws. Failure to comply with such laws could result in fines and penalties payable by us, which could reduce our profitability or cause us to modify or delay planned expansions and expenditures, including investments in our growth. In addition, any such fines and penalties could create negative publicity, result in additional regulatory oversight that could limit our operations and ability to succeed, or otherwise hinder our plans to expand our business internationally.
If we were required to register as a broker-dealer under federal or state law, our costs could significantly increase or our operations could be impaired.
The securities offered to investors are offered directly by us. We do not operate as a registered broker-dealer in any jurisdiction. Although we do not believe we are obligated to do so, if a regulatory body were to find that our activities require us to register as a broker-dealer or to sell the investment securities only through a registered broker-dealer, we could be subject to fines, rescission offers or other penalties, and our compliance costs and other costs of operation could increase significantly. Further, our ability to issue and distribute the securities could be significantly impaired or curtailed.
33
LENDINGCLUB CORPORATION
We and our issuing bank partners are subject to borrower protection laws and federal and state consumer protection laws.
We and our issuing bank partners must comply with regulatory regimes, including those applicable to consumer credit transactions, various aspects of which are untested as applied to our marketplace. Certain state laws generally regulate interest rates and other charges and require certain disclosures. In addition, other federal and state laws may apply to the origination and servicing of loans facilitated through our marketplace. In particular, through our marketplace, we may be subject to laws, such as:
|
•
|
state laws and regulations that impose requirements related to loan disclosures and terms, credit discrimination, credit reporting, debt servicing and collection and unfair or deceptive business practices;
|
|
•
|
the Truth-in-Lending Act and Regulation Z promulgated thereunder, and similar state laws, which require certain disclosures to borrowers regarding the terms and conditions of their loans and credit transactions;
|
|
•
|
Section 5 of the Federal Trade Commission Act, which prohibits unfair and deceptive acts or practices in or affecting commerce, and Section 1031 of the Dodd-Frank Wall Street Reform and Consumer Protection Act, which prohibits unfair, deceptive or abusive acts or practices in connection with any consumer financial product or service;
|
|
•
|
the Equal Credit Opportunity Act and Regulation B promulgated thereunder, which prohibit creditors from discriminating against credit applicants on the basis of race, color, sex, age, religion, national origin, marital status, the fact that all or part of the applicant’s income derives from any public assistance program or the fact that the applicant has in good faith exercised any right under the federal Consumer Credit Protection Act or any applicable state law;
|
|
•
|
the Fair Credit Reporting Act, as amended by the Fair and Accurate Credit Transactions Act, which promotes the accuracy, fairness and privacy of information in the files of consumer reporting agencies;
|
|
•
|
the Fair Debt Collection Practices Act and similar state debt collection laws, which provide guidelines and limitations on the conduct of third-party debt collectors in connection with the collection of consumer debts;
|
|
•
|
the Gramm-Leach-Bliley Act, which includes limitations on financial institutions’ disclosure of nonpublic personal information about a consumer to nonaffiliated third parties, in certain circumstances requires financial institutions to limit the use and further disclosure of nonpublic personal information by nonaffiliated third parties to whom they disclose such information and requires financial institutions to disclose certain privacy policies and practices with respect to information sharing with affiliated and nonaffiliated entities as well as to safeguard personal customer information, and other privacy laws and regulations;
|
|
•
|
the Bankruptcy Code, which limits the extent to which creditors may seek to enforce debts against parties who have filed for bankruptcy protection;
|
|
•
|
the Servicemembers Civil Relief Act, which allows military members to suspend or postpone certain civil obligations so that the military member can devote his or her full attention to military duties;
|
|
•
|
the Electronic Fund Transfer Act and Regulation E promulgated thereunder, which provide disclosure requirements, guidelines and restrictions on the electronic transfer of funds from consumers’ bank accounts;
|
|
•
|
the Electronic Signatures in Global and National Commerce Act and similar state laws, particularly the Uniform Electronic Transactions Act, which authorize the creation of legally binding and enforceable agreements utilizing electronic records and signatures; and
|
|
•
|
the Bank Secrecy Act, which relates to compliance with anti-money laundering, customer due diligence and record-keeping policies and procedures.
|
We may not always have been, and may not always be, in compliance with these laws. Compliance with these laws is also costly, time-consuming and limits our operational flexibility.
Failure to comply with these laws and regulatory requirements applicable to our business may, among other things, limit our or a collection agency’s ability to collect all or part of the principal of or interest on loans. As a result, we may not be able to collect our servicing fee with respect to the uncollected principal or interest, and investors may be discouraged from investing in loans. In addition, non-compliance could subject us to damages, revocation of required licenses, class action lawsuits, administrative enforcement actions, rescission rights held by investors in
34
LENDINGCLUB CORPORATION
securities offerings and civil and criminal liability, which may harm our business and our ability to maintain our marketplace and may result in borrowers rescinding their loans.
Where applicable, we will seek to comply with state small loan, loan broker, servicing and similar statutes. Currently, we do not facilitate loans to borrowers in Iowa. In all other U.S. jurisdictions with licensing or other requirements that we believe may be applicable to us, we comply with the relevant requirements through the operation of our marketplace with issuing banks or we will be seeking to obtain required licenses. Nevertheless, if we are found to not have complied with applicable laws, we could lose one or more of our licenses or authorizations or face other sanctions or penalties or be required to obtain a license in such jurisdiction, which may have an adverse effect on our ability to continue to facilitate loans through our marketplace, perform our servicing obligations or make our marketplace available to borrowers in particular states, which may harm our business.
Investors in the limited partnership interests offered by LCA or certificates offered by the Trust may be deemed to have been solicited by general solicitation or general advertising, and such investors could seek to rescind their purchase.
We offer notes through a public offering. In addition, the Trust invest in loans through our marketplace. The Trust and LCA offer certificates and limited partnership interests, respectively, to raise capital for their investments. The offerings by the Trust and LCA are made privately with potential investors with whom they have, or have established through a review and diligence process and cooling-off period which, in our opinion, constitutes a substantive, pre-existing relationship outside of the public offering for the notes prior to an investment in the certificates or limited partnership interests and separate from the public offering of the notes. Because of the fact-specific nature of what constitutes a substantive, pre-existing relationship and the means by which it is created, as well as what types of activities might constitute a general solicitation or general advertising with regard to the private offerings of the certificates and limited partnership interests, it is possible that some of these investors could assert that they became interested in an investment in these private offerings by LCA or the Trust through a general solicitation or general advertising with regard to those offerings or the public offering of notes. If it was determined that an investor’s interest in the certificates or limited partnership interests was the result of a general solicitation or general advertisement, all investors could claim that the sale of certificates or limited partnership interests violated Section 5 of the Securities Act and could seek to rescind their purchase or seek other remedies, subject to any applicable statute of limitations. We would contest vigorously any claim that a violation of the Securities Act occurred, however, litigation is inherently uncertain and can be expensive and time consuming.
Because some investors may come to our website via hyperlinks from websites of referral partners, it is possible that an unsatisfied investor could make a claim against us based on the content of these third-party websites that could result in claims that are costly to defend and distracting to management.
Some investors in notes may come to our website after reviewing the website of a referral partner via a hyperlink from this third-party website to a landing page on our website. We compensate referral partners based on whether a person “clicks through” to our web page, and do not pay any compensation based on whether or how much an investor may invest. While all investors are provided with access to a note prospectus on the landing page and during the account opening process, it is possible that an investor could have reviewed additional content on the referral partner’s website. We do not review, approve or adopt any content on a referral partner’s website and, while we do not believe we would have liability for content on a partner website, it is possible that an unsatisfied investor could bring claims against us based on such content. Such claims could be costly and time consuming to defend and would distract management’s attention from the operation of the business.
Our ability to offer our notes depends upon our compliance with requirements under federal or state securities laws.
All notes publicly offered through our marketplace are offered and sold pursuant to a registration statement filed with the SEC. We also qualify as a “well-known seasoned issuer,” which allows us to file automatically effective registration statements with the SEC. Under SEC rules, for certain material updates, we must file post-effective
35
LENDINGCLUB CORPORATION
amendments, which, if we do not qualify as a “well-known seasoned issuer,” do not become effective until declared effective by the SEC. We may fail to maintain our “well-known seasoned issuer” status if we do not file SEC reports on a timely manner or for other reasons. In addition, if we fail to file our Annual Reports on Form 10-K or quarterly reports on Form 10-Q on a timely basis or are otherwise required to suspend use of a registration statement for the notes, we could be required to suspend offering of our notes until the deficiency is resolved. Because we offer notes on a continuous basis, securities law restrictions may also limit our ability to market or advertise to potential investors.
We are also currently required to register or qualify for an exemption in every state in which we offer securities. Qualification in a state can be a time-consuming process, often requiring periodic renewals. Failure to timely renew these registrations may require us to pay penalties, suspend further offerings until we regain compliance and make rescission offers in connection with previously completed investments.
Certain states in which we offer notes also impose special suitability standards and other conditions for operation in their states, restricting the persons and conditions under which we may make offerings in these states. We do not offer our notes in all states due to the restrictions of certain states. While we believe that we may now rely on federal preemption of state registration and qualification requirements, states may interpret federal law as applied to our notes differently, possibly requiring us to continue to make filings in or limit operations in those states. Regardless of any such registration, qualification or preemption, we are subject to both state and federal antifraud rules of each state in which we operate.
As a result of these requirements, actual or alleged non-compliance with federal or state laws or changes in federal or state law or regulatory policy or could limit our ability to offer notes in certain states, require us to pay fines or penalties, or curtail our operations.
Recent legislative and regulatory initiatives have imposed restrictions and requirements on financial institutions that could have an adverse effect on our business.
The Dodd-Frank Act and other legislation and regulations relating to financial institutions and markets, including alternative asset management funds, has resulted in increased oversight and taxation. There has been, and may continue to be, a related increase in regulatory investigations of the trading and other investment activities of alternative investment funds. Such investigations may impose additional expenses by us, may require the attention of senior management and may result in fines if any of our funds are deemed to have violated any regulations. The Dodd-Frank Act is extensive and significant legislation enacting changes that broadly affect most aspects of the financial services industry. The Dodd-Frank Act, among other things:
|
•
|
created a liquidation framework under which the FDIC may be appointed as receiver following a “systemic risk determination” by the Secretary of Treasury (in consultation with the President) for the resolution of certain nonbank financial companies and other entities, defined as “covered financial companies,” and commonly referred to as “systemically important entities,” in the event such a company is in default or in danger of default and the resolution of such a company under other applicable law would have serious adverse effects on financial stability in the United States, and also for the resolution of certain of their subsidiaries;
|
|
•
|
strengthened the regulatory oversight of securities and capital markets activities by the SEC; and
|
|
•
|
increased regulation of the securitization markets through, among other things, a mandated risk retention requirement for securitizers, which, if applied to our business, would change our business model, and a direction to the SEC to regulate credit rating agencies and adopt regulations governing these organizations and their activities.
|
With respect to the new liquidation framework for systemically important entities, we cannot assure you that such framework would not apply to us. Guidance from the FDIC indicates that such new framework will largely be exercised in a manner consistent with the existing bankruptcy laws, which is the insolvency regime that would otherwise apply to us. The SEC has proposed significant changes to the rules applicable to issuers and sponsors of
36
LENDINGCLUB CORPORATION
asset-backed securities under the Securities Act and the Exchange Act. With the proposed changes, our access to the asset-backed securities capital markets could be affected and our financing programs could be less effective. Compliance with such legislation or regulation may significantly increase our costs, limit our product offerings and operating flexibility, require significant adjustments in our internal business processes and potentially require us to maintain our regulatory capital at levels above historical practices.
RISKS RELATED TO OWNERSHIP OF OUR COMMON STOCK
The market price of our common stock has been and may continue to be volatile or may decline regardless of our operating performance.
The market price of our common stock may fluctuate significantly in response to numerous factors, many of which are beyond our control. In addition to the factors discussed in Item 1A – Risk Factors and elsewhere in the Report, factors that could cause fluctuations in the market price of our common stock include the following:
|
•
|
overall performance of the equity markets;
|
|
•
|
our operating performance and the performance of other similar companies;
|
|
•
|
changes in the estimates of our operating results that we provide to the public, our failure to meet these projections or changes in recommendations by securities analysts that elect to follow our common stock;
|
|
•
|
regulatory developments;
|
|
•
|
the performance and reputation of other marketplace lenders;
|
|
•
|
announcements of innovations, new loan products or acquisitions, strategic alliances or significant agreements by our competitors;
|
|
•
|
disruptions in our platform due to computer hardware, software or network problems;
|
|
•
|
recruitment or departure of key personnel;
|
|
•
|
the economy as a whole or market conditions in our industry;
|
|
•
|
trading activity by stockholders who beneficially own large amounts of our outstanding common stock; and
|
|
•
|
the size of our market float.
|
Our stock price may also fluctuate significantly due to sales of our common stock by large stockholders or by our directors and executive officers. Sales of substantial blocks of common stock by individuals or institutions that were stockholders at the time of our initial public offering or who have acquired large positions since that time may cause the price of our common stock to decline. In addition, sales by our directors and executive officers may create a negative public perception and negatively impact our stock price.
In the past, stockholders have filed securities class action litigation following periods of market volatility. If we were to become involved in securities litigation, it could subject us to substantial costs, divert resources and the attention of management from our business and adversely affect our business.
We may invest or spend our substantial cash position in ways with which stockholders may not agree or in ways which may not yield a return or increase the price of our common stock.
We intend to use our substantial cash position for general corporate purposes, including working capital, operating expenses and capital expenditures. We have used a portion of our cash to repay indebtedness outstanding under our term loan. Additionally, we may use a portion of our cash to acquire businesses, products, services, assets or create market equilibrium. We do not, however, have agreements or commitments for any acquisitions at this time. Our management will have discretion in the application of our cash, and it may be placed in investments that do not yield a favorable return.
37
LENDINGCLUB CORPORATION
If securities or industry analysts publish negative reports about our business, our share price and trading volume could decline, or if they change their recommendations regarding our stock adversely, our stock price and trading volume could decline.
The trading market for our common stock depends, to some extent, on the research and reports that securities or industry analysts publish about us or our business. Our innovative business model is new, and therefore, there are few comparable publicly traded companies. As a result, analyst research and reports may have a greater impact on our common stock than they would on the common stock of a company in an industry with an established consensus on valuation methods, appropriate comparable businesses and future expectations. We do not have any control over these analysts. If one or more of the analysts who may in the future cover us downgrade our shares or change their opinion of our shares, our share price would likely decline. If one or more of these analysts cease coverage of us or fail to regularly publish reports on us, we could lose visibility in the financial markets, which could cause our share price or trading volume to decline.
We may require additional capital to support business growth, and this capital might not be available on acceptable terms, if at all.
We intend to continue to make investments to support our business growth and may require additional funds to respond to business challenges, including the need to develop new loan products or enhance our marketplace, improve our operating infrastructure or acquire complementary businesses and technologies. Accordingly, we may need to engage in equity or debt financings to secure additional funds. If we raise additional funds through future issuances of equity or convertible debt securities, our existing stockholders could suffer significant dilution, and any new equity securities we issue could have rights, preferences and privileges superior to those of our common stock. Any debt financing we secure in the future, in addition to or in lieu of our credit facility, could involve restrictive covenants relating to our capital raising activities and other financial and operational matters, which may make it more difficult for us to obtain additional capital and to pursue business opportunities, including potential acquisitions. If we are unable to obtain adequate financing or financing on terms satisfactory to us when we require it, our ability to continue to support our business growth and to respond to business challenges could be impaired and our business may be harmed.
If we were to become subject to a bankruptcy or similar proceeding, the right of payment of investors in our notes may be senior to the right of payment of our stockholders and there may not be value recoverable by our stockholders.
Under the terms of the notes offered through our marketplace, we are obligated to pay principal and interest on each note on a non-recourse basis only if and to the extent that we receive principal, interest or late fee payments from the borrower on the corresponding loan, but the notes become fully recourse to us if we fail to pay such obligation, which would include being prohibited from making such payments as a result of a bankruptcy or similar proceeding, or if we breach a covenant under the indenture governing the notes. In a bankruptcy or similar proceeding due to a default under current or future indebtedness, an action for repurchase or rescission of securities or other event, there is uncertainty regarding whether a holder of a note has any right of payment from our assets other than the corresponding loan. It is possible that a note holder could be deemed to have a right of payment from both the corresponding loan and from some or all of our other assets, in which case the note holder would have a claim to the proceeds of our assets that is senior to any right of payment of the holders of our common stock, regardless of whether we have received any payments from the underlying borrower, making it highly unlikely that there would be any value recoverable by our stockholders.
38
LENDINGCLUB CORPORATION
Anti-takeover provisions in our charter documents and Delaware law may delay or prevent an acquisition of our company.
Our restated certificate of incorporation and restated bylaws, contain provisions that can have the effect of delaying or preventing a change in control of us or changes in our management. The provisions, among other things:
|
•
|
establish a classified board of directors so that not all members of our board of directors are elected at one time;
|
|
•
|
permit only our board of directors to establish the number of directors and fill vacancies on the board;
|
|
•
|
provide that directors may only be removed “for cause” and only with the approval of two-thirds of our stockholders;
|
|
•
|
require two-thirds vote to amend some provisions in our restated certificate of incorporation and restated bylaws;
|
|
•
|
authorize the issuance of “blank check” preferred stock that our board of directors could use to implement a stockholder rights plan (also known as a “poison pill”);
|
|
•
|
eliminate the ability of our stockholders to call special meetings of stockholders;
|
|
•
|
prohibit stockholder action by written consent, which will require that all stockholder actions must be taken at a stockholder meeting;
|
|
•
|
do not provide for cumulative voting; and
|
|
•
|
establish advance notice requirements for nominations for election to our board of directors or for proposing matters that can be acted upon by stockholders at annual stockholder meetings.
|
These provisions, alone or together, could delay or prevent hostile takeovers and changes in control or changes in our management.
In addition, because we are incorporated in Delaware, we are governed by the provisions of Section 203 of the Delaware General Corporation Law, which limits the ability of stockholders owning in excess of
15%
of our outstanding voting stock to merge or combine with us in certain circumstances.
Any provision of our restated certificate of incorporation or restated bylaws, or Delaware law that has the effect of delaying or deterring a change in control could limit the opportunity for our stockholders to receive a premium for their shares of our common stock, and could also affect the price that some investors are willing to pay for our common stock.
Our directors, executive officers and principal stockholders have substantial control over us and could delay or prevent a change in corporate control.
As of
December 31, 2015
, our directors, executive officers and holders of more than 5% of our common stock, together with their affiliates, beneficially own, in the aggregate,
52%
of our outstanding common stock. These stockholders, acting together, have the ability to control the outcome of matters submitted to our stockholders for approval, including the election of directors and any merger, consolidation or sale of all or substantially all of our assets. In addition, these stockholders, acting together, have the ability to control the management and affairs of our company.
We do not intend to pay dividends for the foreseeable future.
We have never declared or paid cash or other dividends on our capital stock. We currently intend to retain any future earnings to finance the operation and expansion of our business, and we do not expect to declare or pay any dividends for the foreseeable future.
None.
39
LENDINGCLUB CORPORATION
The Company’s corporate headquarters is located in San Francisco, California, and consists of approximately
169,000
square feet of space under lease agreements that mostly expire in
June 2022
. Under these lease agreements, the Company has an option to extend nearly all of the space under the leases for
five years
.
In the second quarter of 2015, the Company entered into a lease agreement for approximately
112,000
square feet of additional office space in San Francisco, California. The lease agreement commenced in the second quarter of 2015 with delivery of portions of the leased space to occur in stages through March 2017. The lease agreement expires in March 2026, with the right to renew the lease term for two consecutive renewal terms of five years each.
The Company has additional leased office space of approximately
26,000
square feet in Westborough, Massachusetts, under a lease agreement that expires in
July 2021
.
For a discussion of legal proceedings, see
“Item 8 – Financial Statements and Supplementary Data – Notes to Consolidated Financial Statements – 16. Commitments and Contingencies.”
Not applicable.
40
LENDINGCLUB CORPORATION
Market Information for Common Stock
Lending Club’s stock is listed on the New York Stock Exchange (NYSE) under the ticker symbol “LC.” Prior to that date, there was no public trading market for Lending Club’s common stock.
The following table sets forth the high and low sales price per share of Lending Club’s common stock as reported on the NYSE for the periods indicated:
|
Year Ended December 31,
|
2015
|
2014
|
|||||||||||||
|
High
|
Low
|
High
|
Low
|
||||||||||||
|
First Quarter
|
$
|
25.78
|
|
$
|
18.30
|
|
N/A
|
|
N/A
|
|
|||||
|
Second Quarter
|
$
|
19.85
|
|
$
|
14.36
|
|
N/A
|
|
N/A
|
|
|||||
|
Third Quarter
|
$
|
15.14
|
|
$
|
10.28
|
|
N/A
|
|
N/A
|
|
|||||
|
Fourth Quarter
(1)
|
$
|
15.00
|
|
$
|
10.77
|
|
$
|
27.90
|
|
$
|
23.08
|
|
|||
(1)
Fourth quarter price for 2014 started from
December 11, 2014
.
N/A - Not applicable.
Holders of Record
As of
January 29, 2016
, there were
89
holders of record of Lending Club’s common stock. The closing market price per share on that date was
$7.38
. Because many of Lending Club’s shares of common stock are held by brokers and other institutions on behalf of stockholders, the Company is unable to estimate the total number of stockholders represented by these record holders.
Dividend Policy
Lending Club has not paid cash or other dividends since its inception, and does not anticipate paying cash or other dividends in the foreseeable future.
Sales of Unregistered Securities
None.
Issuer Purchases of Equity Securities
None.
41
LENDINGCLUB CORPORATION
Performance Graph
This performance graph shall not be deemed “soliciting material” or to be “filed” with the SEC for purposes of Section 18 of the Securities Exchange Act of 1934, as amended (Exchange Act), or otherwise subject to the liabilities under that Section, and shall not be deemed to be incorporated by reference into any filing of LendingClub under the Securities Act of 1933, as amended, or the Exchange Act.
The following graph compares the cumulative total return to stockholders of Lending Club’s common stock relative to the cumulative total returns of the Standard & Poor’s 500 Index (S&P 500) and the Dow Jones Internet Composite Index (DJ Internet Composite). An investment of $100 (with reinvestment of all dividends) is assumed to have been made in Lending Club’s common stock and in each index at market close on
December 11, 2014
, the date Lending Club’s common stock began trading on the NYSE, and its relative performance is tracked through
December 31, 2015
. The returns shown are based on historical results and are not intended to suggest future performance.
The Company changed its fiscal year end from March 31 to December 31 effective as of December 31, 2012, and the nine month period ended December 31, 2012 represents a transition period. The historical information presented below for the years ended December 31, 2012 and 2011 (i) combines the unaudited interim consolidated financial statements for the three months ended March 31 and the nine months ended December 31 in each year and (ii) is unaudited and has been prepared by management for illustrative purposes only. The unaudited interim consolidated financial statements and unaudited historical financial information have been prepared on the same basis as the audited consolidated financial statements and reflect, in the opinion of management, all adjustments of a normal,
42
LENDINGCLUB CORPORATION
recurring nature that are necessary for a fair statement of the unaudited interim consolidated financial statements. Lending Club’s historical results are not necessarily indicative of the results in any future period.
In the fourth quarter of 2015, the Company disaggregated the expense previously reported as “General and administrative” into “Engineering and product development” and “Other general and administrative” expense. Additionally, the Company reclassified certain operating expenses between “Sales and marketing,” “Origination and servicing,” “Engineering and product development” and “Other general and administrative” expense to align such classification and presentation with how the Company currently manages the operations and these expenses. These changes had no impact to “Total operating expenses.” Prior period amounts have been reclassified to conform to the current presentation.
43
LENDINGCLUB CORPORATION
The following selected consolidated financial data should be read in conjunction with “
Item 7 – Management’s Discussion and Analysis of Financial Condition and Results of Operations
” and the consolidated financial statements included in this Report (in thousands, except share and per share data).
|
Years Ended December 31,
|
2015
|
2014
(1)
|
2013
|
2012
|
2011
|
||||||||||||||
|
|
(audited)
|
(audited)
|
(audited)
|
(unaudited)
|
(unaudited)
|
||||||||||||||
|
Statement of Operations Data:
|
|||||||||||||||||||
|
Transaction fees
|
$
|
373,508
|
|
$
|
197,124
|
|
$
|
85,830
|
|
$
|
30,576
|
|
$
|
10,981
|
|
||||
|
Servicing fees
|
32,811
|
|
11,534
|
|
3,951
|
|
1,929
|
|
951
|
|
|||||||||
|
Management fees
|
10,976
|
|
5,957
|
|
3,083
|
|
824
|
|
103
|
|
|||||||||
|
Other revenue (expense)
|
9,402
|
|
(1,203
|
)
|
5,111
|
|
716
|
|
495
|
|
|||||||||
|
Total operating revenue
|
426,697
|
|
213,412
|
|
97,975
|
|
34,045
|
|
12,530
|
|
|||||||||
|
Net interest income (expense) and fair value adjustments
|
3,246
|
|
(2,284
|
)
|
27
|
|
(238
|
)
|
222
|
|
|||||||||
|
Total net revenue
|
429,943
|
|
211,128
|
|
98,002
|
|
33,807
|
|
12,752
|
|
|||||||||
|
Operating expenses:
(2) (3)
|
|||||||||||||||||||
|
Sales and marketing
|
171,526
|
|
85,652
|
|
37,431
|
|
18,201
|
|
11,402
|
|
|||||||||
|
Origination and servicing
|
61,335
|
|
37,326
|
|
17,978
|
|
7,589
|
|
4,758
|
|
|||||||||
|
Engineering and product development
|
77,062
|
|
38,518
|
|
15,528
|
|
4,855
|
|
2,289
|
|
|||||||||
|
Other general and administrative
|
122,182
|
|
81,136
|
|
19,757
|
|
10,024
|
|
6,572
|
|
|||||||||
|
Total operating expenses
|
432,105
|
|
242,632
|
|
90,694
|
|
40,669
|
|
25,021
|
|
|||||||||
|
Income (loss) before income tax expense
|
(2,162
|
)
|
(31,504
|
)
|
7,308
|
|
(6,862
|
)
|
(12,269
|
)
|
|||||||||
|
Income tax expense
|
2,833
|
|
1,390
|
|
—
|
|
—
|
|
—
|
|
|||||||||
|
Net income (loss)
|
$
|
(4,995
|
)
|
$
|
(32,894
|
)
|
$
|
7,308
|
|
$
|
(6,862
|
)
|
$
|
(12,269
|
)
|
||||
|
Net income (loss) per share attributable to common stockholders:
|
|||||||||||||||||||
|
Basic
(4)(6)
|
$
|
(0.01
|
)
|
$
|
(0.44
|
)
|
$
|
0.00
|
|
$
|
(0.17
|
)
|
$
|
(0.35
|
)
|
||||
|
Diluted
(4)(6)
|
$
|
(0.01
|
)
|
$
|
(0.44
|
)
|
$
|
0.00
|
|
$
|
(0.17
|
)
|
$
|
(0.35
|
)
|
||||
|
Weighted-average common shares - Basic
(4)(6)
|
374,872,118
|
|
75,573,742
|
|
51,557,136
|
|
39,984,876
|
|
34,744,860
|
|
|||||||||
|
Weighted-average common shares - Diluted
(4)(6)
|
374,872,118
|
|
75,573,742
|
|
81,426,976
|
|
39,984,876
|
|
34,744,860
|
|
|||||||||
|
December 31,
|
2015
|
2014
(1)
|
2013
|
2012
|
2011
|
||||||||||||||
|
(audited)
|
(audited)
|
(audited)
|
(unaudited)
|
(unaudited)
|
|||||||||||||||
|
Consolidated Balance Sheet Data:
|
|||||||||||||||||||
|
Cash and cash equivalents
(6)
|
$
|
623,531
|
|
$
|
869,780
|
|
$
|
49,299
|
|
$
|
52,551
|
|
$
|
24,712
|
|
||||
|
Securities available for sale
|
297,211
|
|
—
|
|
—
|
|
—
|
|
—
|
|
|||||||||
|
Loans at fair value
(5)
|
4,556,081
|
|
2,798,505
|
|
1,829,042
|
|
781,215
|
|
296,100
|
|
|||||||||
|
Total assets
(1)(6)
|
5,793,634
|
|
3,890,054
|
|
1,943,395
|
|
850,830
|
|
326,797
|
|
|||||||||
|
Notes and certificates at fair value
(5)
|
4,571,583
|
|
2,813,618
|
|
1,839,990
|
|
785,316
|
|
290,768
|
|
|||||||||
|
Total liabilities
|
4,751,774
|
|
2,916,835
|
|
1,875,301
|
|
798,620
|
|
294,262
|
|
|||||||||
|
Total stockholders’ equity
(6)
|
$
|
1,041,860
|
|
$
|
973,219
|
|
$
|
68,094
|
|
$
|
52,210
|
|
$
|
32,535
|
|
||||
|
(1)
|
In
April 2014
, the Company completed the Springstone acquisition. The Company’s consolidated financial statements include Springstone’s financial position and results of operations from the acquisition date.
|
|
(2)
|
Prior period amounts have been reclassified to conform to the current period presentation, as discussed above.
|
44
LENDINGCLUB CORPORATION
|
(3)
|
Includes stock-based compensation expense as follows:
|
|
Years Ended December 31,
|
2015
|
2014
(2)
|
2013
(2)
|
2012
(2)
|
2011
(2)
|
||||||||||||||
|
(audited)
|
(audited)
|
(audited)
|
(unaudited)
|
(unaudited)
|
|||||||||||||||
|
Sales and marketing
|
$
|
7,250
|
|
$
|
5,476
|
|
$
|
1,147
|
|
$
|
302
|
|
$
|
30
|
|
||||
|
Origination and servicing
|
2,735
|
|
1,653
|
|
424
|
|
75
|
|
9
|
|
|||||||||
|
Engineering and product development
|
11,335
|
|
6,445
|
|
2,336
|
|
449
|
|
71
|
|
|||||||||
|
Other general and administrative
|
29,902
|
|
23,576
|
|
2,376
|
|
586
|
|
181
|
|
|||||||||
|
Total stock-based compensation expense
|
$
|
51,222
|
|
$
|
37,150
|
|
$
|
6,283
|
|
$
|
1,412
|
|
$
|
291
|
|
||||
|
(4)
|
In
April 2014
, the Company’s board of directors approved a two-for-one stock split of Lending Club’s outstanding capital stock and in August 2014, the Company’s board of directors approved another two-for-one stock split of Lending Club’s outstanding capital stock, which became effective in September 2014. All share and per share data in this table has been adjusted to reflect these stock splits.
|
|
(5)
|
Loans represent obligations of borrowers facilitated through the marketplace. Notes and certificates are issued to investors and represent repayment obligations dependent upon receipt of borrower payments as to a corresponding loan. For more information regarding notes and certificates, see “
Item 7
–
Management’s Discussion and Analysis of Financial Condition and Results of Operations
–
Overview
.” Period-end differences between the two line items are largely driven by timing of applying and distributing loan payments to investors.
|
|
(6)
|
In December 2014, Lending Club registered
66,700,000
shares of our common stock in its initial public offering at the initial offering price of
$15.00
per share. In connection with this stock offering, all outstanding shares of convertible preferred stock were converted into Lending Club’s common stock.
|
45
LENDINGCLUB CORPORATION
Management's Discussion and Analysis of Financial Condition and Results of Operations
(Tabular Amounts in Thousands, Except Share and Per Share Data and Ratios, or as Noted)
The following discussion and analysis of our financial condition and results of operations should be read in conjunction with the consolidated financial statements and related notes that appear in this Annual Report on Form 10-K (Report). In addition to historical consolidated financial information, the following discussion contains forward-looking statements that reflect our plans, estimates and beliefs. Our actual results could differ materially from those discussed in the forward-looking statements. Factors that could cause or contribute to these differences include those discussed below and in this Report, particularly in Item 1A – Risk Factors.
Overview
Lending Club is the world’s largest online marketplace connecting borrowers and investors. We believe a technology-powered marketplace is a more efficient mechanism to allocate capital between borrowers and investors than the traditional banking system. Qualified consumers and small business owners borrow through Lending Club to lower the cost of their credit and enjoy a better experience than traditional bank lending.
Investors use Lending Club to earn attractive risk-adjusted returns from an asset class that has generally been closed to many investors and only available on a limited basis to institutional investors. The capital to invest in the loans enabled through our marketplace comes directly from a wide range of investors, including retail investors, high-net-worth individuals and family offices, banks and finance companies, insurance companies, hedge funds, foundations, pension plans and university endowments, and through a variety of investment channels. Our business model is not dependent on using our balance sheet and assuming credit risk for loans facilitated by our marketplace. In order to support contractual obligations (Pool B loans), regulatory commitments (direct mail), the testing of pilot loan programs, or customer accommodations, we may use our capital on the platform from time to time on terms that are substantially similar to other investors.
We generate revenue from transaction fees from our marketplace’s role in accepting and decisioning applications for our bank partners to enable loan originations, servicing fees from investors for matching available loan assets with capital and management fees from investment funds and other managed accounts.
Generally, the transaction fees we receive from issuing banks in connection with our marketplace’s role in facilitating loan originations range from
1%
to
7%
of the initial principal amount of the loan as of
December 31, 2015
. In addition, for education and patient finance loans, transaction fees may exceed
7%
as they include fees earned from issuing banks and service providers. Servicing fees paid to us vary based on investment channel. Note investors generally pay us a servicing fee equal to
1%
of payment amounts received from the borrower; whole loan purchasers pay a monthly servicing fee up to
1.3%
per annum on the month-end principal balance of loans serviced and certificate holders generally pay a monthly management fee up to
1.5%
per annum of the month-end balance of assets under management.
Since beginning operations in
2007
, our marketplace has facilitated approximately
$16.0 billion
in loan originations. These loans were facilitated through the following investment channels: (i) the issuance of notes, (ii) the sale of certificates, or (iii) the sale of whole loans to qualified investors. Approximately
$3.3 billion
of our loan originations since inception were invested in through notes,
$5.5 billion
were invested in through certificates and
$7.2 billion
were invested in through whole loan sales. In
2015
, our marketplace facilitated over
$8.4 billion
of loan originations, of which approximately
$1.3 billion
were invested in through notes,
$2.6 billion
were invested in through certificates and
$4.5 billion
were invested in through whole loan sales. In
2014
, our marketplace facilitated over
$4.4 billion
of loan originations, of which approximately
$0.8 billion
were invested in through notes,
$1.3 billion
were invested in through certificates and
$2.3 billion
were invested in through whole loan sales. See “
Item 1A – Risk Factors – A decline in economic conditions may adversely affect our customers, which may negatively impact our business and results of operations.
”
46
LENDINGCLUB CORPORATION
Management's Discussion and Analysis of Financial Condition and Results of Operations
(Tabular Amounts in Thousands, Except Share and Per Share Data and Ratios, or as Noted)
Springstone
In
April 2014
, we acquired all of the outstanding limited liability company interests of Springstone. See “
Item 8 – Financial Statements and Supplementary Data
–
Note 19 – Springstone Acquisition
” for more information.
47
LENDINGCLUB CORPORATION
Management's Discussion and Analysis of Financial Condition and Results of Operations
(Tabular Amounts in Thousands, Except Share and Per Share Data and Ratios, or as Noted)
Key Operating and Financial Metrics
We regularly review a number of metrics to evaluate our business, measure our performance, identify trends, formulate financial projections and make strategic decisions. The following presents our key operating and financial metrics:
|
Year Ended December 31,
|
2015
|
2014
|
2013
|
||||||||
|
Loan originations
|
$
|
8,361,697
|
|
$
|
4,377,503
|
|
$
|
2,064,626
|
|
||
|
Operating revenue
(1)
|
$
|
426,697
|
|
$
|
213,412
|
|
$
|
97,975
|
|
||
|
Contribution
(2)(3)
|
$
|
203,821
|
|
$
|
97,563
|
|
$
|
44,137
|
|
||
|
Contribution margin
(2)(3)
|
47.8
|
%
|
45.7
|
%
|
45.0
|
%
|
|||||
|
Adjusted EBITDA
(2)
|
$
|
69,758
|
|
$
|
21,301
|
|
$
|
15,227
|
|
||
|
Adjusted EBITDA margin
(2)
|
16.3
|
%
|
10.0
|
%
|
15.5
|
%
|
|||||
|
Net income (loss)
|
$
|
(4,995
|
)
|
$
|
(32,894
|
)
|
$
|
7,308
|
|
||
|
(1)
|
See “
Factors That Can Affect Revenue
” for more information regarding operating revenue.
|
|
(2)
|
Contribution, Contribution Margin, Adjusted EBITDA and Adjusted EBITDA Margin are non-GAAP financial measures. For more information regarding these measures and a reconciliation of these measures to the most comparable GAAP measure, see “
Reconciliations of Non-GAAP Financial Measures
.”
|
|
(3)
|
Prior period amounts have been reclassified to conform to the current period presentation. See “
Results of Operations – Operating Expenses
”
for additional information.
|
Loan Originations
We believe originations are a key indicator of the adoption rate of our marketplace, growth of our brand, scale of our business, strength of our network effect, economic competitiveness of our products and future growth. Loan originations have grown significantly over time due to increased awareness of our brand, our high borrower and investor satisfaction ratings, the effectiveness of our borrower acquisition channels, a strong track record of loan performance and the expansion of our capital resources. Factors that could affect loan originations include the interest rate and economic environment, the competitiveness of our products, the success of our operational efforts to balance investor and borrower demand, any limitations on the ability of our issuing banks to originate loans, our ability to develop new products or enhance existing products for borrowers and investors, the success of our sales and marketing initiatives and the success of borrower and investor acquisition and retention.
Contribution, Contribution Margin, Adjusted EBITDA and Adjusted EBITDA Margin
We use certain non-GAAP financial measures in evaluating our operating results. We believe that Contribution, Contribution Margin, Adjusted EBITDA and Adjusted EBITDA Margin help identify trends in our core business results and allow for greater transparency with respect to key metrics used by our management in its decision making.
Contribution is a non-GAAP financial measure that we calculate as net income (loss), excluding net interest income (expense) and other adjustments, general and administrative expense, stock-based compensation expense and income tax expense (benefit). Contribution margin is a non-GAAP financial measure calculated by dividing contribution by total operating revenue. Contribution and contribution margin are measures of product profitability used by our management and board of directors to understand and evaluate our core operating performance and trends. Contribution and contribution margin have varied from period to period and have generally increased over time. Factors that affect our contribution and contribution margin include revenue mix, variable marketing expenses and origination and servicing expenses.
48
LENDINGCLUB CORPORATION
Management's Discussion and Analysis of Financial Condition and Results of Operations
(Tabular Amounts in Thousands, Except Share and Per Share Data and Ratios, or as Noted)
Adjusted EBITDA is a non-GAAP financial measure that we calculate as net income (loss), excluding net interest income (expense) and other adjustments, acquisition and related expense, depreciation and amortization, amortization of intangible assets, stock-based compensation expense and income tax expense (benefit). Adjusted EBITDA margin is a non-GAAP financial measure calculated as adjusted EBITDA divided by total operating revenue. Adjusted EBITDA is a measure used by our management and board of directors to understand and evaluate our core operating performance and trends. Adjusted EBITDA has generally improved over time due to our increased revenue and efficiencies in the scale of our operations.
Our non-GAAP measures of contribution, contribution margin, adjusted EBITDA, and adjusted EBITDA margin have limitations as analytical tools and you should not consider them in isolation. These non-GAAP measures should not be viewed as substitutes for, or superior to, net income (loss) as prepared in accordance with GAAP. In evaluating these non-GAAP measures, you should be aware that in the future we will incur expenses similar to the adjustments in this presentation. There are a number of limitations related to the use of these non-GAAP financial measures versus their nearest GAAP equivalents.
|
•
|
Other companies, including companies in our industry, may calculate these measures differently, which may reduce their usefulness as a comparative measure.
|
|
•
|
These measures do not consider the potentially dilutive impact of stock-based compensation.
|
|
•
|
Although depreciation and amortization are non-cash charges, the assets being depreciated and amortized may have to be replaced in the future and adjusted EBITDA and adjusted EBITDA margin do not reflect cash capital expenditure requirements for such replacements or for new capital expenditure requirements.
|
|
•
|
Adjusted EBITDA and adjusted EBITDA margin do not reflect tax payments that may represent a reduction in cash available to us.
|
Reconciliations of Non-GAAP Financial Measures
The following tables present a reconciliation of net income (loss) to contributions for each of the periods indicated:
Reconciliation of Net Income (Loss) to Contribution:
|
Year Ended December 31,
|
2015
|
2014
|
2013
|
||||||||
|
Net income (loss)
|
$
|
(4,995
|
)
|
$
|
(32,894
|
)
|
$
|
7,308
|
|
||
|
Net interest (income) expense and fair value adjustments
|
(3,246
|
)
|
2,284
|
|
(27
|
)
|
|||||
|
Engineering and product development expense
(1)
|
77,062
|
|
38,518
|
|
15,528
|
|
|||||
|
Other general and administrative expense
(1)
|
122,182
|
|
81,136
|
|
19,757
|
|
|||||
|
Stock-based compensation expense
(2)
|
9,985
|
|
7,129
|
|
1,571
|
|
|||||
|
Income tax expense
|
2,833
|
|
1,390
|
|
—
|
|
|||||
|
Contribution
(1)
|
$
|
203,821
|
|
$
|
97,563
|
|
$
|
44,137
|
|
||
|
Total operating revenue
|
$
|
426,697
|
|
$
|
213,412
|
|
$
|
97,975
|
|
||
|
Contribution margin
(1)
|
47.8
|
%
|
45.7
|
%
|
45.0
|
%
|
|||||
(1)
Prior period amounts have been reclassified to conform to the current period presentation. See “
Results of Operations – Operating Expenses
”
for additional information.
49
LENDINGCLUB CORPORATION
Management's Discussion and Analysis of Financial Condition and Results of Operations
(Tabular Amounts in Thousands, Except Share and Per Share Data and Ratios, or as Noted)
(2)
Contribution also excludes stock-based compensation expense included in sales and marketing and origination and servicing expense categories, as follows:
|
Year Ended December 31,
|
2015
|
2014
(1)
|
2013
(1)
|
||||||||
|
Sales and marketing
|
$
|
7,250
|
|
$
|
5,476
|
|
$
|
1,147
|
|
||
|
Origination and servicing
|
2,735
|
|
1,653
|
|
424
|
|
|||||
|
Total
|
$
|
9,985
|
|
$
|
7,129
|
|
$
|
1,571
|
|
||
The following table presents a reconciliation of net income (loss) to Adjusted EBITDA for each of the periods indicated:
Reconciliation of Net Income (Loss) to Adjusted EBITDA:
|
Year Ended December 31,
|
2015
|
2014
|
2013
|
||||||||
|
Net income (loss)
|
$
|
(4,995
|
)
|
$
|
(32,894
|
)
|
$
|
7,308
|
|
||
|
Net interest (income) expense and fair value adjustments
|
(3,246
|
)
|
2,284
|
|
(27
|
)
|
|||||
|
Acquisition and related expense
|
2,367
|
|
3,113
|
|
—
|
|
|||||
|
Depreciation and amortization:
|
|||||||||||
|
Engineering and product development
|
13,820
|
|
5,194
|
|
1,336
|
|
|||||
|
Other general and administrative
|
2,426
|
|
1,166
|
|
327
|
|
|||||
|
Amortization of intangible assets
|
5,331
|
|
3,898
|
|
—
|
|
|||||
|
Stock-based compensation expense
|
51,222
|
|
37,150
|
|
6,283
|
|
|||||
|
Income tax expense
|
2,833
|
|
1,390
|
|
—
|
|
|||||
|
Adjusted EBITDA
|
$
|
69,758
|
|
$
|
21,301
|
|
$
|
15,227
|
|
||
|
Total operating revenue
|
$
|
426,697
|
|
$
|
213,412
|
|
$
|
97,975
|
|
||
|
Adjusted EBITDA margin
|
16.3
|
%
|
10.0
|
%
|
15.5
|
%
|
|||||
Effectiveness of Scoring Models
Our ability to attract borrowers and investors to our marketplace is significantly dependent on our platform’s ability to effectively evaluate a borrower’s credit profile and likelihood of default. We evaluate our marketplace’s credit decisioning and scoring models on a regular basis and leverage the additional data on loan history experience, borrower behavior, economic factors and prepayment trends that we accumulate to continually improve the models. If we are unable to effectively evaluate borrowers’ credit worthiness, borrowers and investors may lose confidence in our marketplace. Additionally, our ability to effectively segment borrowers into relative risk profiles impacts our ability to offer attractive interest rates for borrowers as well as our ability to offer investors attractive risk-adjusted returns, both of which directly relate to our users’ confidence in our marketplace. Our marketplace’s credit decisioning and scoring models assign each loan offered on our marketplace a corresponding interest rate and origination fee. Our investors’ returns are a function of the assigned interest rates for each particular loan invested in less any defaults over the term of the applicable loan. We believe we have a history of effectively evaluating borrower’s credit worthiness and likelihood of defaults, as evidenced by the performance of various loan vintages facilitated through our marketplace. The following charts display the historical lifetime cumulative net charge-off rates (expressed as a percent of original loan balances) through
December 31, 2015
, by booking year, for all grades and
36
or
60
month terms of standard program loans for each of the years shown.
50
LENDINGCLUB CORPORATION
Management's Discussion and Analysis of Financial Condition and Results of Operations
(Tabular Amounts in Thousands, Except Share and Per Share Data and Ratios, or as Noted)


51
LENDINGCLUB CORPORATION
Management's Discussion and Analysis of Financial Condition and Results of Operations
(Tabular Amounts in Thousands, Except Share and Per Share Data and Ratios, or as Noted)
Product Innovation
We have made, and intend to continue to make, substantial investments and incur expenses to research and develop or otherwise acquire new financial products for borrowers and investors. Our revenue growth to date has been a function of, and our future success will depend in part on, successfully meeting borrower and investor demand with new and innovative loan and investment options. For example, in early 2014, our platform began offering small business loans to qualified investors, bringing the benefit of our innovative marketplace model, online delivery and process automation to small business owners. In the latter part of 2014, we launched our super prime consumer loans and a true no-interest product for the education and patient finance market. For investors, we have introduced automated investing, application programming interface (API), investment funds and separately managed accounts that make investing in loans easier. Failure to successfully develop and offer innovative products could adversely affect our operating results and we may not recoup the costs of new products.
Marketing Effectiveness and Strategic Relationships
We intend to continue to dedicate significant resources to our marketing and brand advertising efforts and strategic relationships. Our marketing efforts are designed to build awareness of Lending Club and attract borrowers and investors to our marketplace. We use a diverse array of marketing channels and are constantly seeking to improve and optimize our experience both on- and offline to achieve efficiency and a high level of borrower and investor satisfaction. We also continue to invest in our strategic relationships to raise awareness of our platform and attract borrowers and investors to our marketplace. Our operating results and ability to sustain and grow loan volume will depend, in part, on our ability to continue to make effective investments in marketing and the effectiveness of our strategic relationships.
In February 2015, Lending Club announced that it had entered into a strategic partnership with a consortium of community banks for its platform to offer co-branded personal loans to the participating banks’ customers. As part of this partnership, each community bank is provided initial access to invest in loans sought by their own customers, which may include standard program loans. The customer loans that do not meet the community bank’s investment criteria are then made available for investment through the marketplace. All loans are originated by our issuing banks.
Regulatory Environment
The regulatory environment for credit and online marketplaces such as ours is complex, evolving and uncertain, creating both challenges and opportunities that could affect our financial performance. We expect to continue to spend significant resources to comply with various federal and state laws and various licensing requirements designed to, among other things, protect borrowers (such as truth in lending, equal credit opportunity, fair credit reporting and fair debt collections practices) and investors. Our marketplace incorporates a number of automated features to help comply with these laws in an efficient and cost effective manner. While new laws and regulations or changes under existing laws and regulations could make facilitating loans or investment opportunities more difficult to achieve on acceptable terms, or at all, these events could also provide new product and market opportunities.
In May 2015, the U.S. Court of Appeals for the Second Circuit issued its decision in Madden v. Midland Funding, LLC that interpreted the scope of federal preemption under the National Bank Act (NBA) and held that a nonbank assignee of a loan originated by a national bank was not entitled to the benefits of federal preemption of claims of usury. The Second Circuit’s decision is binding on federal courts located in Connecticut, New York, and Vermont, but the decision could also be adopted by other courts. The defendant petitioned the U.S. Supreme Court to review the decision and the petition is currently pending. We are unable to predict whether the U.S. Supreme Court will review the decision and, if it does, what the outcome will be. While we believe that our program is factually distinguishable from the case, we are revising our agreement with our primary issuing bank to further distinguish
52
LENDINGCLUB CORPORATION
Management's Discussion and Analysis of Financial Condition and Results of Operations
(Tabular Amounts in Thousands, Except Share and Per Share Data and Ratios, or as Noted)
the operation of the program from the court’s analysis of the facts in Madden. Overall, we believe that these changes will be immaterial from a cost perspective to the operation of our business.
Recognizing the growth in online marketplaces such as ours, in July 2015 the U.S. Treasury Department issued an RFI to study the various business models and products offered by online marketplace lenders, the potential for online marketplace lending to expand access to credit to historically underserved borrowers and how the financial regulatory framework should evolve to support the safe growth of the industry. We, along with many other interested groups, submitted responses to the Treasury’s RFI by the September 30, 2015 deadline. In December 2015, the California Department of Business Oversight sent an online survey to fourteen marketplace lenders, including us, requesting information about our business model, online platform, loan performance and investor funding process.
Although the Treasury Department and California Department of Business Oversight are in the information-gathering stage and no interpretive guidance has been released, there is a possibility that our business may become subject to additional or different regulations in the future. To the extent we seek to grow internationally, we would become subject to additional foreign regulation and related compliance requirements and expense.
Factors That Can Affect Revenue
As a marketplace, we work toward matching supply and demand while also growing originations and correspondingly revenue at a pace commensurate with proper planning, risk management, user experience, and operational controls that work to optimize the quality of the customer experience, customer satisfaction and long term growth.
The interplay of the following drivers can affect our revenue in any particular period:
|
•
|
the volume, timing and quality of:
|
|
◦
|
loan applications,
|
|
◦
|
investment appetite and available investment capital from investors,
|
|
◦
|
platform loan processing and originations, and
|
|
•
|
the subsequent performance of loans, which directly impacts our servicing fees.
|
These drivers collectively result in transaction, servicing or management fees earned by us related to these transactions and their future performance. As these drivers can be affected by a variety of factors, both in and out of our control, revenues may fluctuate from period to period. Factors that can affect these drivers and ultimately revenue and its timing include: the mix of loans, the timing of the deployment of investment capital by investors, the amount of new capital from pooled investment vehicles and managed accounts that typically deploy their capital at the start of a period, the amount of purchase limitations we can impose on larger investors as a way to maintain investor balance and fairness, the attractiveness of alternative opportunities for borrowers or investors, the responsiveness of applicants to our marketing efforts, expenditures on marketing initiatives in a period, the sufficiency of operational staff to process any manual portion of the loan applications in a timely manner, the responsiveness of borrowers to satisfy additional income or employment verification requirements related to their application, borrower withdrawal rates, the percentage distribution of loans between the whole and fractional loan platforms, platform system performance and other factors. In addition, there may be some seasonality in demand for lending, which is generally lower in the first and fourth quarters.
Given these factors, at any point in time we have loan applications in various stages from initial application through issuance. Depending upon the timing and impact of these factors, loans may not be issued by our issuing bank in the same period in which the corresponding application was originally made resulting in a portion of that subsequent period’s revenue being earned from loan applications that were initiated in the immediately prior period. Consistent
53
LENDINGCLUB CORPORATION
Management's Discussion and Analysis of Financial Condition and Results of Operations
(Tabular Amounts in Thousands, Except Share and Per Share Data and Ratios, or as Noted)
with our revenue recognition accounting policy under GAAP, we do not recognize the associated transaction fee revenue with a loan until the loan is issued by our issuing banks and the proceeds are delivered to the borrower.
Results of Operations
The following tables set forth the consolidated statement of operations data for each of the periods presented:
|
Year Ended December 31,
|
2015
|
2014
|
2013
|
||||||||
|
Operating revenues:
|
|||||||||||
|
Transaction fees
|
$
|
373,508
|
|
$
|
197,124
|
|
$
|
85,830
|
|
||
|
Servicing fees
|
32,811
|
|
11,534
|
|
3,951
|
|
|||||
|
Management fees
|
10,976
|
|
5,957
|
|
3,083
|
|
|||||
|
Other revenue (expense)
|
9,402
|
|
(1,203
|
)
|
5,111
|
|
|||||
|
Total operating revenue
|
426,697
|
|
213,412
|
|
97,975
|
|
|||||
|
Net interest income (expense) and fair value adjustments
|
3,246
|
|
(2,284
|
)
|
27
|
|
|||||
|
Total net revenue
|
429,943
|
|
211,128
|
|
98,002
|
|
|||||
|
Operating expenses:
(1)(2)
|
|||||||||||
|
Sales and marketing
|
171,526
|
|
85,652
|
|
37,431
|
|
|||||
|
Origination and servicing
|
61,335
|
|
37,326
|
|
17,978
|
|
|||||
|
Engineering and product development
|
77,062
|
|
38,518
|
|
15,528
|
|
|||||
|
Other general and administrative
|
122,182
|
|
81,136
|
|
19,757
|
|
|||||
|
Total operating expenses
|
432,105
|
|
242,632
|
|
90,694
|
|
|||||
|
Income (loss) before income tax expense
|
(2,162
|
)
|
(31,504
|
)
|
7,308
|
|
|||||
|
Income tax expense
|
2,833
|
|
1,390
|
|
—
|
|
|||||
|
Net income (loss)
|
$
|
(4,995
|
)
|
$
|
(32,894
|
)
|
$
|
7,308
|
|
||
|
(1)
|
Prior period amounts have been reclassified to conform to the current period presentation. See
“Results of Operations – Operating Expenses
”
for additional information.
|
|
(2)
|
Includes stock-based compensation expense as follows:
|
|
Year Ended December 31,
|
2015
|
2014
(1)
|
2013
(1)
|
||||||||
|
Sales and marketing
|
$
|
7,250
|
|
$
|
5,476
|
|
$
|
1,147
|
|
||
|
Origination and servicing
|
2,735
|
|
1,653
|
|
424
|
|
|||||
|
Engineering and product development
|
11,335
|
|
6,445
|
|
2,336
|
|
|||||
|
Other general and administrative
|
29,902
|
|
23,576
|
|
2,376
|
|
|||||
|
Total stock-based compensation expense
|
$
|
51,222
|
|
$
|
37,150
|
|
$
|
6,283
|
|
||
54
LENDINGCLUB CORPORATION
Management's Discussion and Analysis of Financial Condition and Results of Operations
(Tabular Amounts in Thousands, Except Share and Per Share Data and Ratios, or as Noted)
Total Net Revenue
|
Year Ended December 31,
|
2015
|
2014
|
Change ($)
|
Change (%)
|
||||||||||
|
Transaction fees
|
$
|
373,508
|
|
$
|
197,124
|
|
$
|
176,384
|
|
89
|
%
|
|||
|
Servicing fees
|
32,811
|
|
11,534
|
|
21,277
|
|
184
|
%
|
||||||
|
Management fees
|
10,976
|
|
5,957
|
|
5,019
|
|
84
|
%
|
||||||
|
Other revenue (expense)
|
9,402
|
|
(1,203
|
)
|
10,605
|
|
N/M
|
|
||||||
|
Total operating revenue
|
426,697
|
|
213,412
|
|
213,285
|
|
100
|
%
|
||||||
|
Net interest income (expense) and fair value adjustments
|
3,246
|
|
(2,284
|
)
|
5,530
|
|
N/M
|
|
||||||
|
Total net revenue
|
$
|
429,943
|
|
$
|
211,128
|
|
$
|
218,815
|
|
104
|
%
|
|||
|
Year Ended December 31,
|
2014
|
2013
|
Change ($)
|
Change (%)
|
||||||||||
|
Transaction fees
|
$
|
197,124
|
|
$
|
85,830
|
|
$
|
111,294
|
|
130
|
%
|
|||
|
Servicing fees
|
11,534
|
|
3,951
|
|
7,583
|
|
192
|
%
|
||||||
|
Management fees
|
5,957
|
|
3,083
|
|
2,874
|
|
93
|
%
|
||||||
|
Other revenue (expense)
|
(1,203
|
)
|
5,111
|
|
(6,314
|
)
|
(124
|
)%
|
||||||
|
Total operating revenue
|
213,412
|
|
97,975
|
|
115,437
|
|
118
|
%
|
||||||
|
Net interest income (expense) and fair value adjustments
|
(2,284
|
)
|
27
|
|
(2,311
|
)
|
N/M
|
|
||||||
|
Total net revenue
|
$
|
211,128
|
|
$
|
98,002
|
|
$
|
113,126
|
|
115
|
%
|
|||
Our primary sources of revenue consists of fees received for transactions through or related to our marketplace and include transaction, servicing and management fees.
Transaction Fees
: Transaction fees are fees paid by issuing banks or education and patient service providers to us for the work we perform through our marketplace’s role in facilitating loan originations. The amount of these fees is based upon the terms of the loan, including grade, rate, term and other factors. As of
December 31, 2015
, these fees ranged from
1%
to
7%
of the initial principal amount of a loan. In addition, for education and patient finance loans, transaction fees may exceed
7%
as they include fees earned from issuing banks and service providers.
Effective July 1, 2013, we elected to account for loans we intend to sell to whole loan purchasers at fair value. Under this election, all transaction fees and costs related to these loans are recorded when earned or incurred, respectively. Prior to this change, transaction fees and costs were included in the computation of the gain or loss on the sale of the loan, which was recorded in other revenue in the consolidated statement of operations. Transaction fees are now reflected in transaction fees and not in other revenue on the statement of operations.
Transaction fees were
$373.5 million
and
$197.1 million
for the years ended
December 31, 2015
and
2014
, respectively, an increase of
89%
. The increase was primarily due to an increase in loans facilitated through our marketplace from
$4.4 billion
for the year ended
December 31, 2014
to
$8.4 billion
for the year ended
December 31, 2015
, an increase of
91%
. The average transaction fee as a percentage of the initial principal balance of the loan was
4.5%
for both the years ended
December 31, 2015
and
2014
.
Transaction fees were
$197.1 million
and
$85.8 million
for the years ended
December 31, 2014
and
2013
, respectively, an increase of
130%
. The increase was primarily due to an increase in loans facilitated through our marketplace from
$2.1 billion
for the year ended
December 31, 2013
to
$4.4 billion
for the year ended
December 31, 2014
, an increase of
112%
. In addition, for the year ended
December 31, 2013
,
$4.9 million
in
55
LENDINGCLUB CORPORATION
Management's Discussion and Analysis of Financial Condition and Results of Operations
(Tabular Amounts in Thousands, Except Share and Per Share Data and Ratios, or as Noted)
transaction fees were included in the gain on sale of whole loans, which was included in other revenue prior to accounting for whole loans at fair value in the
third quarter of 2013
. The average transaction fees as a percentage of the initial principal balance of the loan, including the
$4.9 million
in other revenue, were
4.5%
and
4.4%
for the years ended
December 31, 2014
and
2013
, respectively. The increase was primarily due to higher percentages of 60-month loans and loans with higher risk grades, each of which have higher corresponding transaction fees.
In January 2016, we recognized approximately
$2.7 million
in transaction fee revenue associated with the issuance of loans in which the loan application process had commenced prior to the end of 2015. In January 2015, we recognized approximately $8.7 million in transaction fee revenue associated with the issuance of loans in which the loan application process had commenced prior to the end of 2014. Transaction fee revenue recognized in January 2014 that was associated with the issuance of loans in which the loan application process had commenced prior to the end of 2013 was not material.
Servicing Fees
: Servicing fees paid to us vary based on investment channel. Servicing fees compensate us for the costs we incur in servicing the related loan, including managing payments from borrowers, collections, payments to investors and maintaining investors’ account portfolios. The amount of servicing revenue earned is predominately affected by the various servicing rates paid by investors in the applicable investment channels, the unpaid principal balance for whole loan serviced, and the amount of principal and interest collected from borrowers and remitted to note and certain certificate investors. Additionally, servicing fee revenue includes the change in fair value of our servicing assets and liabilities associated with loans that we sell.
Servicing fee revenue has increased during each of the last three years due to increases in both the balances of whole loans sold and the loan balances that underlie the notes and certificates. The following table provides the outstanding principal balance of loans that we serviced at the end of the periods indicated, by the method that the loans were financed (in millions):
|
December 31,
|
2015
|
2014
|
2013
|
||||||||
|
Notes
|
$
|
1,576
|
|
$
|
1,055
|
|
$
|
688
|
|
||
|
Certificates
|
3,105
|
|
1,797
|
|
1,172
|
|
|||||
|
Whole loans sold
|
4,289
|
|
1,874
|
|
407
|
|
|||||
|
Total
|
$
|
8,970
|
|
$
|
4,726
|
|
$
|
2,267
|
|
||
The table below illustrates the composition of servicing fees by source for each period presented:
|
Year Ended December 31,
|
2015
|
2014
|
Change (%)
|
|||||||
|
Servicing fees related to whole loans sold
|
$
|
17,846
|
|
$
|
4,162
|
|
N/M
|
|
||
|
Note and certificate servicing fees
|
13,573
|
|
5,952
|
|
128
|
%
|
||||
|
Servicing fees before change in fair value of servicing assets and liabilities
|
31,419
|
|
10,114
|
|
N/M
|
|
||||
|
Change in fair value of servicing assets and liabilities, net
|
1,392
|
|
1,420
|
|
(2
|
)%
|
||||
|
Total servicing fees
|
$
|
32,811
|
|
$
|
11,534
|
|
184
|
%
|
||
N/M – Not meaningful
56
LENDINGCLUB CORPORATION
Management's Discussion and Analysis of Financial Condition and Results of Operations
(Tabular Amounts in Thousands, Except Share and Per Share Data and Ratios, or as Noted)
|
Year Ended December 31,
|
2014
|
2013
|
Change (%)
|
|||||||
|
Servicing fees related to whole loans sold
|
$
|
4,162
|
|
$
|
303
|
|
N/M
|
|
||
|
Note and certificate servicing fees
|
5,952
|
|
3,533
|
|
69
|
%
|
||||
|
Servicing fees before change in fair value of servicing assets and liabilities
|
10,114
|
|
3,836
|
|
164
|
%
|
||||
|
Change in fair value of servicing assets and liabilities, net
|
1,420
|
|
115
|
|
N/M
|
|
||||
|
Total servicing fees
|
$
|
11,534
|
|
$
|
3,951
|
|
192
|
%
|
||
N/M – Not meaningful
Management Fees:
Certain investors can invest in investment funds managed by LCA, the general partner in the funds. LCA typically charges these investors a monthly management fee based on the month-end balance of their assets under management, ranging from
0.7%
to
1.5%
per annum. LCA does not earn any carried interest from the investment funds. For managed account certificate holders, LCA earns a management fee up to
1.2%
per annum of the month-end balance of their assets under management. Any of these fees may be waived or reduced at the discretion of LCA.
Management fees were
$11.0 million
and
$6.0 million
for the years ended
December 31, 2015
and
2014
, respectively, an increase of
84%
. The increase in management fees was due primarily to an increase in the total assets under management and outstanding certificate balances.
Management fees were
$6.0 million
and
$3.1 million
for the years ended
December 31, 2014
and
2013
, respectively, an increase of
93%
. The increase in management fees was due primarily to an increase in the total assets under management and outstanding certificate balances.
Other Revenue (Expense):
Other revenue (expense) primarily consists of gains and losses on sales of whole loans and referral revenue. In connection with whole loan sales, in addition to the transaction and servicing fees earned with respect of the corresponding loan, we recognize a gain or loss on the sale of that loan based on the degree to which the contractual loan servicing fee is above or below an estimated market rate loan servicing fee (loans are sold at par). From December 1, 2012 through June 30, 2013, we included in the gain calculation on whole loan sales the amount of the transaction fees earned in respect of those loans, resulting in higher gains on sale and lower transaction fees. Referral revenue consists of fees earned from third party companies when customers referred by us complete specified actions with a third party company. The specified actions range from clicking on a link to visit a third party website to obtaining a loan from third party companies.
The table below illustrates the composition of other revenue (expense) for each period presented:
|
Year Ended December 31,
|
2015
|
2014
|
2013
|
||||||||
|
Referral revenue
|
$
|
4,332
|
|
$
|
2,298
|
|
$
|
1,170
|
|
||
|
Gain (loss) on sales of loans
|
4,885
|
|
(3,569
|
)
|
3,862
|
|
|||||
|
Other
|
185
|
|
68
|
|
79
|
|
|||||
|
Other revenue (expense)
|
$
|
9,402
|
|
$
|
(1,203
|
)
|
$
|
5,111
|
|
||
Other revenue (expense) was
$9.4 million
and
$(1.2) million
for the years ended
December 31, 2015
and
2014
, respectively. This increase for the year ended
December 31, 2015
compared to the same period in
2014
was primarily due to gains on sales of whole loans in 2015 and increases in referral revenue.
Other revenue (expense) was
$(1.2) million
and
$5.1 million
for the years ended
December 31, 2014
and
2013
, respectively, a decrease of
124%
. This was primarily attributable to a change in the investor base that we sold whole loans to and the effect of the change in accounting for transaction fees.
57
LENDINGCLUB CORPORATION
Management's Discussion and Analysis of Financial Condition and Results of Operations
(Tabular Amounts in Thousands, Except Share and Per Share Data and Ratios, or as Noted)
Net Interest Income (Expense) and Fair Value Adjustments
|
Year Ended December 31,
|
2015
|
2014
|
2013
|
||||||||
|
Net interest income (expense)
|
$
|
3,232
|
|
$
|
(2,162
|
)
|
$
|
60
|
|
||
|
Net fair value adjustments
|
14
|
|
(122
|
)
|
(33
|
)
|
|||||
|
Net interest income (expense) and fair value adjustments
|
$
|
3,246
|
|
$
|
(2,284
|
)
|
$
|
27
|
|
||
We do not assume principal or interest risk on loans facilitated through our marketplace because loan balances, interest rates and maturities are matched and offset by an equal balance of notes and certificates with the exact same interest rates and maturities. We only make principal and interest payments on notes and certificates to the extent that we receive borrower payments on corresponding loans. As a servicer, we are only required to deliver borrower payments to the extent that we actually receive them. As a result, on our statement of operations for any period and balance sheet as of any date, (i) interest income on loans corresponds to the interest expense on notes and certificates and (ii) loan balances correspond to note and certificate balances with variations resulting from timing differences between the crediting of principal and interest payments on loans and the disbursement of those payments to note and certificate holders.
Additionally, interest income (expense) includes interest income earned on cash and cash equivalents and the securities available for sale portfolio. Our investment policy and strategy is focused first on the preservation of capital and supporting our liquidity requirements, and then maximizing returns. The following tables provide additional detail related to net interest income (expense) and fair value adjustments:
|
Year Ended December 31,
|
2015
|
2014
|
Change ($)
|
Change (%)
|
||||||||||
|
Interest income:
|
||||||||||||||
|
Loans
|
$
|
549,782
|
|
$
|
354,424
|
|
$
|
195,358
|
|
55
|
%
|
|||
|
Securities available for sale
|
2,143
|
|
—
|
|
2,143
|
|
100
|
%
|
||||||
|
Cash and cash equivalents
|
1,047
|
|
29
|
|
1,018
|
|
N/M
|
|
||||||
|
Total interest income
|
552,972
|
|
354,453
|
|
198,519
|
|
56
|
%
|
||||||
|
Interest expense:
|
||||||||||||||
|
Notes and certificates
|
(549,740
|
)
|
(354,334
|
)
|
(195,406
|
)
|
55
|
%
|
||||||
|
Term loan
|
—
|
|
(2,281
|
)
|
2,281
|
|
(100
|
)%
|
||||||
|
Total interest expense
|
(549,740
|
)
|
(356,615
|
)
|
(193,125
|
)
|
54
|
%
|
||||||
|
Net interest income (expense)
|
3,232
|
|
(2,162
|
)
|
5,394
|
|
N/M
|
|
||||||
|
Average outstanding balances:
|
||||||||||||||
|
Loans
|
$
|
3,821,448
|
|
$
|
2,377,526
|
|
$
|
1,443,922
|
|
61
|
%
|
|||
|
Notes and certificates
|
$
|
3,840,241
|
|
$
|
2,389,747
|
|
$
|
1,450,494
|
|
61
|
%
|
|||
58
LENDINGCLUB CORPORATION
Management's Discussion and Analysis of Financial Condition and Results of Operations
(Tabular Amounts in Thousands, Except Share and Per Share Data and Ratios, or as Noted)
|
Year Ended December 31,
|
2014
|
2013
|
Change ($)
|
Change (%)
|
||||||||||
|
Interest income:
|
||||||||||||||
|
Loans
|
$
|
354,424
|
|
$
|
187,495
|
|
$
|
166,929
|
|
89
|
%
|
|||
|
Cash and cash equivalents
|
29
|
|
12
|
|
17
|
|
142
|
%
|
||||||
|
Total interest income
|
354,453
|
|
187,507
|
|
166,946
|
|
89
|
%
|
||||||
|
Interest expense:
|
||||||||||||||
|
Notes and certificates
|
(354,334
|
)
|
(187,447
|
)
|
(166,887
|
)
|
89
|
%
|
||||||
|
Term loan
|
(2,281
|
)
|
—
|
|
(2,281
|
)
|
N/M
|
|
||||||
|
Total interest expense
|
(356,615
|
)
|
(187,447
|
)
|
(169,168
|
)
|
90
|
%
|
||||||
|
Net interest income (expense)
|
(2,162
|
)
|
60
|
|
(2,222
|
)
|
N/M
|
|
||||||
|
Average outstanding balances:
|
||||||||||||||
|
Loans
|
$
|
2,377,526
|
|
$
|
1,278,631
|
|
$
|
1,098,895
|
|
86
|
%
|
|||
|
Notes and certificates
|
$
|
2,389,747
|
|
$
|
1,285,764
|
|
$
|
1,103,983
|
|
86
|
%
|
|||
N/M - Not meaningful
Interest income from loans was
$549.8 million
,
$354.4 million
and
$187.5 million
for the years ended
December 31, 2015
,
2014
and
2013
, respectively. The increase in interest income was primarily due to the increase in the outstanding balances of loans.
Interest expense for notes and certificates was
$549.7 million
,
$354.3 million
and
$187.4 million
for the years ended
December 31, 2015
,
2014
and
2013
, respectively. The increase in interest expense was primarily due to the increase in the outstanding balances of notes and certificates. Interest expense in
2014
also included interest expense of $2.3 million associated with a term loan that was outstanding for approximately 8 months in
2014
. We did not have a term loan in
2015
or
2013
.
Fair Value Adjustments on Loans, Notes and Certificates:
The changes in fair value of loans, notes and certificates are shown on our consolidated statement of operations on a net basis. Due to the payment dependent feature of the notes and certificates, fair value adjustments on the loans are offset by the fair value adjustments on the notes and certificates, resulting in no net effect on our earnings. We estimate the fair value of loans and their related notes and certificates using a discounted cash flow valuation methodology that is described in “
Item 8 – Financial Statements and Supplementary Data – Note 2. Summary of Significant Accounting Policies.
”
In the third quarter of 2015, we incorporated expected prepayments into the valuation of loans, notes and certificates. Expected prepayments are estimates of the cumulative amount of principal prepayments that will occur over the entire life of a loan, expressed as a percentage of the original principal amount of the loan. Expected prepayments reduce the projected balances and effective maturities of the loans, notes and certificates. Additionally, assumptions regarding expected prepayments are incorporated into the valuation process to estimate the fair value of loan servicing assets and liabilities as they are key valuation assumptions used by investors in servicing rights for unsecured consumer credit obligations.
The net fair value adjustments were immaterial for the years ended
December 31, 2015
,
2014
and
2013
. The
losses from fair value adjustments on loans were largely offset by the gains from fair value adjustments on notes
and certificates due to the borrower payment dependent design of the notes and certificates and due to the principal
balances of the loans being similar to the combined principal balances of the notes and certificates.
59
LENDINGCLUB CORPORATION
Management's Discussion and Analysis of Financial Condition and Results of Operations
(Tabular Amounts in Thousands, Except Share and Per Share Data and Ratios, or as Noted)
Operating Expenses
Our operating expenses consist of sales and marketing, origination and servicing and general and administrative expenses, which includes engineering and product development and other general and administrative expenses.
In the fourth quarter of 2015, we disaggregated the expense previously reported as “General and administrative” into “Engineering and product development” and “Other general and administrative” expense. Additionally, we reclassified certain operating expenses between “Sales and marketing,” “Origination and servicing,” “Engineering and product development” and “Other general and administrative” expense to align such classification and presentation with how we currently manage the operations and these expenses. These changes had no impact to “Total operating expenses.” Prior period amounts have been reclassified to conform to the current presentation.
|
Year Ended December 31,
|
2015
|
2014
(1)
|
Change ($)
|
Change (%)
|
||||||||||
|
Sales and marketing
|
$
|
171,526
|
|
$
|
85,652
|
|
$
|
85,874
|
|
100
|
%
|
|||
|
Origination and servicing
|
61,335
|
|
37,326
|
|
24,009
|
|
64
|
%
|
||||||
|
Engineering and product development
|
77,062
|
|
38,518
|
|
38,544
|
|
100
|
%
|
||||||
|
Other general and administrative
|
122,182
|
|
81,136
|
|
41,046
|
|
51
|
%
|
||||||
|
Total operating expenses
|
$
|
432,105
|
|
$
|
242,632
|
|
$
|
189,473
|
|
78
|
%
|
|||
|
Year Ended December 31,
|
2014
(1)
|
2013
(1)
|
Change ($)
|
Change (%)
|
||||||||||
|
Sales and marketing
|
$
|
85,652
|
|
$
|
37,431
|
|
$
|
48,221
|
|
129
|
%
|
|||
|
Origination and servicing
|
37,326
|
|
17,978
|
|
19,348
|
|
108
|
%
|
||||||
|
Engineering and product development
|
38,518
|
|
15,528
|
|
22,990
|
|
148
|
%
|
||||||
|
Other general and administrative
|
81,136
|
|
19,757
|
|
61,379
|
|
N/M
|
|
||||||
|
Total operating expenses
|
$
|
242,632
|
|
$
|
90,694
|
|
$
|
151,938
|
|
168
|
%
|
|||
(1)
Prior period amounts have been reclassified to conform to the current period presentation.
Sales and Marketing:
Sales and marketing expense consists primarily of borrower and investor acquisition efforts including costs attributable to marketing and selling our products. This includes costs of building general brand awareness, and salaries, benefits and stock-based compensation expense related to our sales and marketing team.
Sales and marketing expense was
$171.5 million
and
$85.7 million
for the years ended
December 31, 2015
and
2014
, respectively, an increase of
100%
. The increase was primarily due to a
$59.9 million
increase in variable marketing expenses that drove higher loan originations and a
$19.0 million
increase in personnel-related expenses associated with higher headcount levels. Sales and marketing expense was
$85.7 million
and
$37.4 million
for the years ended
December 31, 2014
and
2013
, respectively, an increase of
129%
. The increase was primarily due to an increase in variable marketing expenses driven by higher loan originations and an increase in personnel-related expenses associated with higher headcount levels and acceleration of vesting of stock options for a terminated employee.
Origination and Servicing:
Origination and servicing expense consists of salaries, benefits and stock-based compensation expense and vendor costs attributable to activities that most directly relate to originating and servicing loans for borrowers and investors. These costs relate to the credit, collections, customer support and payment processing teams and related vendors.
Origination and servicing expense was
$61.3 million
and
$37.3 million
for the years ended
December 31, 2015
and
2014
, respectively, an increase of
64%
. The increase was primarily due to a
$12.7 million
increase in personnel-related expenses and an
$8.9 million
increase in consumer reporting agency and loan processing costs, both driven
60
LENDINGCLUB CORPORATION
Management's Discussion and Analysis of Financial Condition and Results of Operations
(Tabular Amounts in Thousands, Except Share and Per Share Data and Ratios, or as Noted)
by higher loan originations and a higher outstanding balance of loans serviced. Origination and servicing expense was
$37.3 million
and
$18.0 million
for the years ended
December 31, 2014
and
2013
, respectively, an increase of
108%
. The increase was primarily due to increases in personnel-related expenses and consumer reporting agency and loan processing costs, both driven by higher loan originations and a higher outstanding balance of loans serviced.
Engineering and Product Development:
Engineering and product development expense consists primarily of salaries, benefits and stock-based compensation expense for engineering and product management teams, and the cost of contractors who work on the development and maintenance of our platform. Engineering and product development expense also includes non-capitalized hardware and software costs and depreciation and amortization of technology assets.
Engineering and product development expense was
$77.1 million
and
$38.5 million
for the years ended
December 31, 2015
and
2014
, respectively, an increase of
100%
. The increase was primarily driven by investment in our platform and product development, which included a
$24.0 million
increase in personnel-related expenses resulting from increased headcount, and an
$11.8 million
increase in equipment, software and depreciation expense.
Engineering and product development expense was
$38.5 million
and
$15.5 million
for the years ended
December 31, 2014
and
2013
, respectively, an increase of
148%
. The increase was primarily driven by continued investment in our platform and product development, which included an increase in personnel-related expenses resulting from increased headcount and contract labor expense and an increase in expensed equipment and software and depreciation expense.
We capitalized
$25.4 million
,
$12.2 million
and
$3.8 million
in software development costs for the years ended
December 31, 2015
,
2014
and
2013
, respectively.
Other General and Administrative:
Other general and administrative expense consists primarily of salaries, benefits and stock-based compensation expense for our accounting, finance, legal, human resources and facilities teams, and professional services fees. Other general and administrative expense also includes facilities and compensation expenses related to the acquisition of Springstone.
Other general and administrative expense was
$122.2 million
and
$81.1 million
for the years ended
December 31, 2015
and
2014
, respectively, an increase of
51%
. The increase was primarily due to a
$51.4 million
increase in salaries and stock-based compensation expense related to increased headcount as we continue to invest in infrastructure and support teams.
Other general and administrative expense was
$81.1 million
and
$19.8 million
for the years ended
December 31, 2014
and
2013
, respectively. The increase was primarily due to an increase in personnel-related expenses from increased headcount as we invested in back office support and compensation expense for stock consideration issued related to the Springstone acquisition. Additionally, the increase was due to amortization and depreciation expense primarily related to amortization on assets recognized in conjunction with the Springstone acquisition.
Income Taxes
Income tax expense was
$2.8 million
and
$1.4 million
for the years ended
December 31, 2015
and
December 31, 2014
, respectively. For the year ended
December 31, 2015
, income tax expense was primarily attributable to the amortization of tax deductible goodwill from the acquisition of Springstone, which gave rise to an indefinite-lived deferred tax liability, and the realization of excess tax benefits related to stock-based compensation. For the year ended
December 31, 2014
, income tax expense was primarily related to the amortization of tax deductible goodwill from the acquisition of Springstone. For the year ended
December 31, 2013
, there were no income taxes recorded
61
LENDINGCLUB CORPORATION
Management's Discussion and Analysis of Financial Condition and Results of Operations
(Tabular Amounts in Thousands, Except Share and Per Share Data and Ratios, or as Noted)
related to pre-tax income due to the availability of deferred tax assets subject to a full valuation allowance to offset current year income.
We continued to record a valuation allowance against the net deferred tax assets, excluding the deferred tax liability for indefinite-lived intangibles, as of December 31, 2015, and December 31, 2014. We intend to continue maintaining a full valuation allowance on our deferred tax assets until there is sufficient evidence to support the reversal of all or some portion of these allowances. However, given our current earnings and anticipated future earnings, we believe that there is a reasonable possibility that within the next 12 months, sufficient evidence may become available to allow us to conclude that a significant portion of the valuation allowance will no longer be needed. Release of the valuation allowance would result in the recognition of certain deferred tax assets and a decrease to income tax expense for the period the release is recorded. However, the exact timing and amount of the valuation allowance release are subject to change on the basis of the level of profitability that we are able to actually achieve.
Quarterly Results of Operations
The following table sets forth our unaudited consolidated statement of operations data for each of the eight quarters ended
December 31, 2015
. The unaudited quarterly statement of operations data set forth below have been prepared on the same basis as our audited consolidated financial statements and reflect, in the opinion of management, all adjustments of a normal, recurring nature that are necessary for a fair statement of the unaudited quarterly statement of operations data. Our historical results are not necessarily indicative of our future operating results. The following quarterly consolidated financial data should be read in conjunction with the consolidated financial statements and the related notes included elsewhere in this Report.
62
LENDINGCLUB CORPORATION
Management's Discussion and Analysis of Financial Condition and Results of Operations
(Tabular Amounts in Thousands, Except Share and Per Share Data and Ratios, or as Noted)
|
Quarters Ended
|
December 31,
2015
|
September 30,
2015
|
June 30,
2015
|
March 31,
2015
|
|||||||||||
|
Operating revenue:
|
|||||||||||||||
|
Transaction fees
|
$
|
114,955
|
|
$
|
100,420
|
|
$
|
85,651
|
|
$
|
72,482
|
|
|||
|
Servicing fees
|
11,941
|
|
8,999
|
|
6,479
|
|
5,392
|
|
|||||||
|
Management fees
|
3,313
|
|
2,900
|
|
2,548
|
|
2,215
|
|
|||||||
|
Other revenue (expense)
|
4,262
|
|
2,743
|
|
1,441
|
|
956
|
|
|||||||
|
Total operating revenue
|
$
|
134,471
|
|
$
|
115,062
|
|
$
|
96,119
|
|
$
|
81,045
|
|
|||
|
Net interest income (expense) and other adjustments
|
1,047
|
|
1,214
|
|
798
|
|
187
|
|
|||||||
|
Total net revenue
|
$
|
135,518
|
|
$
|
116,276
|
|
$
|
96,917
|
|
$
|
81,232
|
|
|||
|
Operating expenses:
(1)
|
|||||||||||||||
|
Sales and marketing
|
53,537
|
|
44,018
|
|
39,501
|
|
34,470
|
|
|||||||
|
Origination and servicing
|
17,696
|
|
16,732
|
|
14,706
|
|
12,201
|
|
|||||||
|
Engineering and product development
|
23,887
|
|
21,063
|
|
18,214
|
|
13,898
|
|
|||||||
|
Other general and administrative
|
35,245
|
|
32,280
|
|
28,247
|
|
26,410
|
|
|||||||
|
Total operating expenses
|
$
|
130,365
|
|
$
|
114,093
|
|
$
|
100,668
|
|
$
|
86,979
|
|
|||
|
Income (loss) before income tax expense
|
5,153
|
|
2,183
|
|
(3,751
|
)
|
(5,747
|
)
|
|||||||
|
Income tax expense
|
584
|
|
1,233
|
|
389
|
|
627
|
|
|||||||
|
Net income (loss)
|
$
|
4,569
|
|
$
|
950
|
|
$
|
(4,140
|
)
|
$
|
(6,374
|
)
|
|||
|
Other data
(2)
:
|
|||||||||||||||
|
Loan origination
(3)
|
$
|
2,579,201
|
|
$
|
2,235,647
|
|
$
|
1,911,759
|
|
$
|
1,635,090
|
|
|||
|
Contribution
(1)(4)
|
65,732
|
|
57,257
|
|
44,344
|
|
36,488
|
|
|||||||
|
Contribution margin
(1)(4)
|
48.9
|
%
|
49.8
|
%
|
46.1
|
%
|
45.0
|
%
|
|||||||
|
Adjusted EBITDA
(4)
|
24,556
|
|
21,157
|
|
13,399
|
|
10,646
|
|
|||||||
|
Adjusted EBITDA margin
(4)
|
18.3
|
%
|
18.4
|
%
|
13.9
|
%
|
13.1
|
%
|
|||||||
|
Weighted-average common shares - Basic
|
378,631,340
|
|
375,982,120
|
|
372,841,945
|
|
371,959,312
|
|
|||||||
|
Weighted-average common shares - Diluted
|
402,634,010
|
|
401,934,880
|
|
372,841,945
|
|
371,959,312
|
|
|||||||
|
Net income (loss) per share attributable to common stockholders:
|
|||||||||||||||
|
Basic
|
$
|
0.01
|
|
$
|
0.00
|
|
$
|
(0.01
|
)
|
$
|
(0.02
|
)
|
|||
|
Diluted
|
$
|
0.01
|
|
$
|
0.00
|
|
$
|
(0.01
|
)
|
$
|
(0.02
|
)
|
|||
|
(1)
|
Prior period amounts have been reclassified to conform to the current period presentation. See “
Results of Operations
– Operating Expenses
”
for additional information.
|
|
(2)
|
For more information about loan originations, contribution margin, adjusted EBITDA and adjusted EBITDA margin, see “
Key Operating and Financial Metrics
.”
|
|
(3)
|
Loan originations include loans facilitated through the platform plus outstanding purchase commitments at period end.
|
|
(4)
|
Contribution, contribution margin, adjusted EBITDA and adjusted EBITDA margin are non-GAAP financial measures. For more information regarding these measures and a reconciliation of these measures to the most comparable GAAP measure, see “
Reconciliations of Non-GAAP Financial Measures.
”
|
63
LENDINGCLUB CORPORATION
Management's Discussion and Analysis of Financial Condition and Results of Operations
(Tabular Amounts in Thousands, Except Share and Per Share Data and Ratios, or as Noted)
|
Quarters Ended
|
December 31,
2014 |
September 30,
2014 |
June 30,
2014 |
March 31,
2014 |
|||||||||||
|
Operating revenue:
|
|||||||||||||||
|
Transaction fees
|
$
|
63,289
|
|
$
|
52,622
|
|
$
|
45,801
|
|
$
|
35,412
|
|
|||
|
Servicing fees
|
5,233
|
|
3,053
|
|
1,468
|
|
1,780
|
|
|||||||
|
Management fees
|
1,794
|
|
1,608
|
|
1,461
|
|
1,094
|
|
|||||||
|
Other revenue (expense)
|
(765
|
)
|
(745
|
)
|
(109
|
)
|
416
|
|
|||||||
|
Total operating revenue
|
$
|
69,551
|
|
$
|
56,538
|
|
$
|
48,621
|
|
$
|
38,702
|
|
|||
|
Net interest income (expense) and other adjustments
|
(1,430
|
)
|
(474
|
)
|
(396
|
)
|
16
|
|
|||||||
|
Total net revenue
|
$
|
68,121
|
|
$
|
56,064
|
|
$
|
48,225
|
|
$
|
38,718
|
|
|||
|
Operating expenses:
(1)
|
|||||||||||||||
|
Sales and marketing
|
26,035
|
|
20,584
|
|
18,895
|
|
20,138
|
|
|||||||
|
Origination and servicing
|
11,661
|
|
9,880
|
|
8,412
|
|
7,373
|
|
|||||||
|
Engineering and product development
|
12,923
|
|
10,229
|
|
8,897
|
|
6,469
|
|
|||||||
|
Other general and administrative
|
26,208
|
|
22,323
|
|
20,568
|
|
12,037
|
|
|||||||
|
Total operating expenses
|
$
|
76,827
|
|
$
|
63,016
|
|
$
|
56,772
|
|
$
|
46,017
|
|
|||
|
Income (loss) before income tax expense
|
(8,706
|
)
|
(6,952
|
)
|
(8,547
|
)
|
(7,299
|
)
|
|||||||
|
Income tax expense
|
331
|
|
419
|
|
640
|
|
—
|
|
|||||||
|
Net income (loss)
|
$
|
(9,037
|
)
|
$
|
(7,371
|
)
|
$
|
(9,187
|
)
|
|
$
|
(7,299
|
)
|
||
|
Other data
(2)
:
|
|||||||||||||||
|
Loan origination
(3)
|
$
|
1,414,983
|
|
$
|
1,165,226
|
|
$
|
1,005,946
|
|
$
|
791,348
|
|
|||
|
Contribution
(1)(4)
|
33,256
|
|
27,320
|
|
22,139
|
|
14,848
|
|
|||||||
|
Contribution margin
(1)(4)
|
47.8
|
%
|
48.3
|
%
|
45.5
|
%
|
38.4
|
%
|
|||||||
|
Adjusted EBITDA
(4)
|
7,916
|
|
7,517
|
|
4,002
|
|
1,866
|
|
|||||||
|
Adjusted EBITDA margin
(4)
|
11.4
|
%
|
13.3
|
%
|
8.2
|
%
|
4.8
|
%
|
|||||||
|
Weighted-average common shares - Basic
|
127,859,281
|
|
59,844,394
|
|
57,971,180
|
|
55,780,644
|
|
|||||||
|
Weighted-average common shares - Diluted
|
127,859,281
|
|
59,844,394
|
|
57,971,180
|
|
55,780,644
|
|
|||||||
|
Net loss per share attributable to common stockholders:
|
|||||||||||||||
|
Basic
|
$
|
(0.07
|
)
|
$
|
(0.12
|
)
|
$
|
(0.16
|
)
|
$
|
(0.13
|
)
|
|||
|
Diluted
|
$
|
(0.07
|
)
|
$
|
(0.12
|
)
|
$
|
(0.16
|
)
|
$
|
(0.13
|
)
|
|||
|
(1)
|
Prior period amounts have been reclassified to conform to the current period presentation. See “
Results of Operations
– Operating Expenses
”
for additional information.
|
|
(2)
|
For more information about loan originations, contribution margin, adjusted EBITDA and adjusted EBITDA margin, see “
Key Operating and Financial Metrics
.”
|
|
(3)
|
Loan originations include loans facilitated through the platform plus outstanding purchase commitments at period end.
|
|
(4)
|
Contribution, contribution margin, adjusted EBITDA and adjusted EBITDA margin are non-GAAP financial measures. For more information regarding these measures and a reconciliation of these measures to the most comparable GAAP measure, see “
Reconciliations of Non-GAAP Financial Measures.
”
|
64
LENDINGCLUB CORPORATION
Management's Discussion and Analysis of Financial Condition and Results of Operations
(Tabular Amounts in Thousands, Except Share and Per Share Data and Ratios, or as Noted)
Liquidity and Capital Resources
Liquidity
The following table sets forth certain cash flow information for the periods presented:
|
Year Ended December 31,
|
2015
|
2014
|
2013
|
||||||||
|
Net cash provided by operating activities
|
$
|
74,741
|
|
$
|
49,920
|
|
$
|
1,139
|
|
||
|
Cash flow used for loan investing activities
(1)
|
(2,034,590
|
)
|
(1,094,065
|
)
|
(1,105,456
|
)
|
|||||
|
Cash flow used for all other investing activities
|
(372,110
|
)
|
(163,010
|
)
|
(15,159
|
)
|
|||||
|
Net cash used for investing activities
|
(2,406,700
|
)
|
(1,257,075
|
)
|
(1,120,615
|
)
|
|||||
|
Cash flow provided by note/certificate financing
(1)
|
2,034,993
|
|
1,098,108
|
|
1,112,270
|
|
|||||
|
Cash flow provided by all other financing activities
|
50,717
|
|
929,528
|
|
3,954
|
|
|||||
|
Net cash provided by financing activities
|
2,085,710
|
|
2,027,636
|
|
1,116,224
|
|
|||||
|
Net (decrease) increase in cash and cash equivalents
|
$
|
(246,249
|
)
|
$
|
820,481
|
|
$
|
(3,252
|
)
|
||
|
(1)
|
Cash flow used for loan investing activities includes the purchase of loans and repayment of loans facilitated through our marketplace. Cash flow provided by note/certificate financing activities includes the issuance of notes and certificates to investors and the repayment of those notes and certificates. These amounts generally correspond and offset each other.
|
Our short-term liquidity needs generally relate to our working capital requirements. These liquidity needs are met through cash generated from the operations of facilitating loan originations, which are reflected in transaction fee revenue, and ongoing loan and investor servicing, as reflected in servicing and management fee revenue. As shown in the table above, the Company has been operating cash flow positive for the last three years, which has contributed to our liquidity resources. There is no material impact on our liquidity position related to the purchase of loans, as such, loans are funded by proceeds from the issuance of corresponding notes and certificates, or such loans are sold on the same day to whole loan investors. Additionally, given the payment dependent structure of the notes and certificates, principal and interest payments on notes and certificates are paid only when received from borrowers on the corresponding retained loans resulting in no material impact to our liquidity.
Cash and cash equivalents are primarily held in institutional money market funds and interest-bearing deposit accounts at investment grade financial institutions. Cash and cash equivalents were
$623.5 million
,
$869.8 million
, and
$49.3 million
as of
December 31, 2015
,
2014
and
2013
, respectively. Changes in the balance of cash and cash equivalents are generally a result of timing related to working capital requirements or investments in or out of our securities available for sale portfolio.
In April 2015, we invested in securities classified as available for sale. The fair value of securities available for sale as of
December 31, 2015
was
$297.2 million
. At
December 31, 2015
, these securities include corporate debt securities, asset-backed securities, U.S. agency securities, U.S. Treasury securities and other securities, and all securities were rated investment grade (defined as a rating equivalent to a Moody’s rating of “Baa3” or higher, or a Standard & Poor’s rating of “BBB-” or higher) and there were no significant unrealized losses. These securities provided
$2.8 million
of interest income in 2015. These securities continue to be available to meet liquidity needs.
Our available liquidity resources may also be provided by external sources. On
December 17, 2015
, we entered into a credit and guaranty agreement with several lenders for an aggregate
$120 million
unsecured revolving credit facility (Credit Facility). In connection with the credit agreement, we entered into a pledge and security agreement with Morgan Stanley Senior Funding, Inc., as collateral agent. Proceeds of loans made under the Credit Facility may
65
LENDINGCLUB CORPORATION
Management's Discussion and Analysis of Financial Condition and Results of Operations
(Tabular Amounts in Thousands, Except Share and Per Share Data and Ratios, or as Noted)
be borrowed, repaid and reborrowed until
December 17, 2020
. Repayment of any outstanding proceeds are payable on
December 17, 2020
, but may be prepaid without penalty.
Borrowings under the Credit Facility bear interest, at our option, at an annual rate based on the one-year LIBOR rate plus a spread of 1.75% to 2.00%, which is fixed for a Company-selected interest period of one, two, three, six or 12 months, or an alternative base rate (which is tied to either the prime rate, federal funds effective rate, or the adjusted eurocurrency rate, as defined in the credit agreement). Base rate borrowings may be prepaid at any time without penalty, however pre-payment of LIBOR-based borrowings before the end of the selected interest period may result in the Company incurring expense to compensate the lenders for their funding costs through the end of the interest period. Interest is payable quarterly. Additionally, the Company is required to pay a quarterly commitment fee to the lenders of between
0.25%
and
0.375%
per annum, depending on the Company’s total net leverage ratio, on the average undrawn portion available under the revolving loan facility.
The Credit Facility and pledge and security agreement contain certain covenants applicable to us, including restrictions on the Company’s ability to pay dividends, incur indebtedness, pledge our assets, merge or consolidate, make investments, and enter into certain affiliate transactions. The Credit Facility also requires us to maintain a maximum total net leverage ratio (defined as the ratio of net debt to Adjusted EBITDA, on a consolidated basis for the four most recent Fiscal Quarter periods) of 4.00:1.00 initially, and which decreases over the term of the Credit Facility to 3.00:1.00 on and after June 30, 2018 (on a consolidated basis). As of December 31, 2015, the total net leverage ratio, calculated as defined in the Credit Facility, was 0%.
On
December 11, 2014
, we received
$827.7 million
in net proceeds from our IPO for use in funding our liquidity needs. A portion of these proceeds were invested in securities held in our securities available for sale portfolio.
In April 2014, we made payments of
$109.5 million
, net of cash acquired to acquire Springstone. In connection with the acquisition, in April 2014, the Company issued approximately
$65.0 million
of Series F convertible preferred stock, and borrowed
$50.0 million
under a credit and guaranty agreement entered into with several lenders referred to as the Term Loan. The Series F convertible preferred stock was converted on a one-for-one basis to common stock in conjunction with the Company’s initial public offering. On
December 17, 2014
, we fully repaid the
$49.4 million
of principal outstanding of our Term Loan using a portion of the net proceeds from our IPO. Consequently, the Term Loan was extinguished and removed from the balance sheet as of December 31, 2014, and the credit and guaranty agreement was terminated. During the term it was outstanding, the Term Loan paid interest at a weighted-average interest rate of
2.59%
.
On February 9, 2016, the board of directors approved a share repurchase program under which Lending Club may repurchase up to $150 million of the Company’s common shares
in open market or privately negotiated transactions in compliance with Securities and Exchange Act Rule 10b-18
.
This repurchase plan is valid for one year and does not obligate the Company to acquire any particular amount of common stock, and may be suspended at any time at Lending Club’s discretion.
The Company’s cash flow from operations is expected to be sufficient to meet our liquidity needs for the foreseeable future.
Capital Resources
Capital expenditures were
$39.4 million
, or 9% of total net revenue,
$20.6 million
, or 10% of total net revenue, and
$10.4 million
, or 11% of total net revenue, for the years ended
December 31, 2015
,
2014
and
2013
, respectively. Capital expenditures in 2016 are expected to be approximately $65 million, primarily related to growth in the business.
66
LENDINGCLUB CORPORATION
Management's Discussion and Analysis of Financial Condition and Results of Operations
(Tabular Amounts in Thousands, Except Share and Per Share Data and Ratios, or as Noted)
Off-Balance Sheet Arrangements
As of
December 31, 2015
, a total of
$4.7 million
in standby letters of credit were outstanding related to certain financial covenants required for lease facilities. To date, no amounts have been drawn against the letters of credit, which renew annually and expire at various dates through July 2026. There were no off-balance sheet arrangements for the years ended
December 31, 2014
and
2013
.
Contingencies
Credit Support Agreement
We are subject to a credit support agreement with a certificate investor. The credit support agreement requires us to pledge and restrict cash in support of our contingent obligation to reimburse the investor for net credit losses on loans underlying the investor’s certificate that are in excess of a specified, aggregate net loss threshold. We are contingently obligated to pledge cash, not to exceed
$5.0 million
, to support this contingent obligation. As of
December 31, 2015
and
2014
, approximately
$3.4 million
was pledged and restricted to support this contingent obligation.
As of
December 31, 2015
, the net credit losses pertaining to the investor’s certificate have not exceeded the specified threshold, nor are future net credit losses expected to exceed the specified threshold, and thus no liability has been recorded. We currently do not anticipate recording losses under this credit support agreement. If losses related to the credit support agreement are later determined to be likely to occur and are estimable, results of operations could be affected in the period in which such losses are recorded.
Legal
On June 5, 2014, Springstone received a Civil Investigative Demand from the Consumer Financial Protection Bureau, referred to as CFPB, related to the period from 2009 through May 2014. The purpose of the investigation was to determine whether Springstone engaged in unlawful acts or practices in connection with the marketing, issuance, and servicing of loans for certain healthcare related financings during the period. On August 19, 2015, Springstone agreed to settle with the CFPB related to the CFPB’s concerns about possible borrower confusion of the terms of a deferred interest product, which was terminated by the Company in December 2014. To resolve this matter, Springstone is in the process of paying restitution of $700 thousand to certain borrowers under the Springstone finance program between 2009 and 2014. The settlement amount has been recorded as a liability as of
December 31, 2015
. The settlement amount was fully covered by the indemnification provisions of the Springstone purchase agreement and, therefore, did not result in an adverse financial charge to the Company. In January 2016, we delivered to borrowers all restitution amounts that were accrued for as of December 31, 2015.
We are currently engaged in an arbitration proceeding with a prior employee who is claiming that additional equity is due to them. We believe the claim to be without merit and intend to continue to defend the matter vigorously. We have not accrued a liability for this action at this time.
In addition to the foregoing, we may be subject to legal proceedings and regulatory actions in the ordinary course of business. We do not believe it is probable that the ultimate liability, if any, arising out of any such matter will have a material effect on our financial condition, results of operations or cash flows.
67
LENDINGCLUB CORPORATION
Management's Discussion and Analysis of Financial Condition and Results of Operations
(Tabular Amounts in Thousands, Except Share and Per Share Data and Ratios, or as Noted)
Contractual Obligations
Our principal commitments consist of obligations under our loan funding operation with WebBank and in connection with direct marketing efforts, operating leases for office space and contractual commitments for other support services. The following table summarizes our contractual obligations as of
December 31, 2015
:
|
|
Payments Due by Period
|
||||||||||||||||||
|
|
Less than 1 Year
|
1 to 3 Years
|
3 to 5 Years
|
More than 5 Years
|
Total
|
||||||||||||||
|
Purchase obligations
|
$
|
4,945
|
|
$
|
3,952
|
|
$
|
375
|
|
$
|
—
|
|
$
|
9,272
|
|
||||
|
Loan funding obligations
|
7,869
|
|
—
|
|
—
|
|
—
|
|
7,869
|
|
|||||||||
|
Operating lease obligations
|
12,085
|
|
46,775
|
|
33,307
|
|
40,436
|
|
132,603
|
|
|||||||||
|
WebBank purchase obligations
|
77,625
|
|
—
|
|
—
|
|
—
|
|
77,625
|
|
|||||||||
|
Total contractual obligations
(1)
|
$
|
102,524
|
|
$
|
50,727
|
|
$
|
33,682
|
|
$
|
40,436
|
|
$
|
227,369
|
|
||||
|
(1)
|
The notes and certificates issued by Lending Club and the Trust, respectively, have been excluded from the table above because payments on those liabilities are only required to be made by us if and when we receive the related loan payments from borrowers. Our own liquidity resources are not required to make any contractual payments on the notes or certificates, except in limited instances of proven identity fraud on a related loan.
|
Loan Purchase Obligation
Under our loan account program with WebBank, a Utah-charted industrial bank that serves as our primary issuing bank, WebBank retains ownership of loans facilitated through our marketplace for two business days after origination. As part of this arrangement, we have committed to purchase the loans at par plus accrued interest, at the conclusion of the two business days. As of
December 31, 2015
, we were committed to purchase loans with an outstanding principal balance of
$77.6 million
at par plus accrued interest. As of
December 31, 2014
, we were committed to purchase loans with an outstanding principal balance of
$4.1 million
at par plus accrued interest.
Loan Funding and Purchase Commitments
We commit to purchase loans resulting from our direct marketing efforts if such loans are not otherwise invested in by investors on our platform. During
2015
, we were not required to purchase any such loans. Additionally, loans in the process of being facilitated and originated by our issuing bank partner at
December 31, 2015
, were fully funded in January 2016 and we were not required to purchase any of these loans.
Separately, Springstone and the Company are contractually committed to purchase certain loans (Pool B loans) that Springstone facilitates and that are originated by an issuing bank partner if neither Springstone nor the Company can arrange for other investors to invest in or purchase these loans.
The Company and the issuing bank have entered into purchase agreements with three investors to purchase Pool B loans or participation interests in Pool B loans. As of January 5, 2016, any minimum purchase requirements had expired under these agreements. During the year ended
December 31, 2015
, we were not required to purchase any Pool B loans or Pool B loan participation interests. In connection with current re-negotiations of the program agreement with the issuing bank, the Company may be required to deposit funds into an account at the bank to secure potential, future purchases of these loans.
Critical Accounting Policies
The Company’s significant accounting policies are described in “
Item 8 – Financial Statements and Supplementary Data – Notes to Consolidated Financial Statements – Note 2 – Summary of Significant Accounting Policies
” of the
68
LENDINGCLUB CORPORATION
Management's Discussion and Analysis of Financial Condition and Results of Operations
(Tabular Amounts in Thousands, Except Share and Per Share Data and Ratios, or as Noted)
consolidated financial statements. The Company considers certain of these policies to be critical accounting policies as they require significant judgments, assumptions and estimates which we believe are critical in understanding and evaluating our reported financial results. These critical accounting policies include (i) fair value estimates for loans, notes and certificates; (ii) fair value estimates for servicing assets and liabilities; (iii) accounting for goodwill and intangible assets; (iv) provision for income taxes, net of valuation allowance for deferred tax assets; (v) consolidation of variable interest entities; and (vi) stock-based compensation expense. These judgments, estimates and assumptions are inherently subjective and actual results may differ from these estimates and assumptions, and the differences could be material.
Fair Value of Loans, Notes and Certificates
We have elected fair value accounting for loans and related notes and the Trust’s certificates. The fair value election for these loans, notes and certificates results in symmetrical accounting in that changes in the fair values of loans are generally offset by equal changes in the fair values of notes and certificates, given the payment dependent structure of the notes and certificates.
We estimate the fair values of loans and related notes and certificates using a discounted cash flow valuation methodology. The fair valuation methodology considers projected prepayments and uses the historical actual defaults, losses and recoveries on our loans to project future losses and net cash flows on loans.
Significant assumptions used in valuing the Company’s loans, notes and certificates were as follows:
Discount rates
– The discount rates for loans reflect the Company’s estimates of the rates of return that investors in unsecured consumer credit obligations would require when investing in the various credit grades of loans. The discount rates for the projected net cash flows of the notes and certificates reflect the Company’s estimates of the rates of return, including risk premiums that investors in unsecured consumer credit obligations would require when investing in notes issued by us and certificates issued by the Trust with cash flows dependent on specific grades of loans. Discount rates for existing loans, notes and certificates are adjusted to reflect the time value of money and are based on a risk premium that reflects the return market participants require on currently offered loans due to the credit and liquidity related uncertainty inherent in the instruments’ cash flows.
Net cumulative expected losses
– Net cumulative expected losses are estimates of the net cumulative principal payments that will not be repaid over the entire life of a loan, note or certificate, expressed as a percentage of the original principal amount of the loan, note or certificate. The estimated net cumulative loss is the sum of the net losses estimated to occur each month of the life of a loan, note or certificate. Therefore, the total net losses estimated to occur over the remaining maturity of existing loans, notes and certificates are less than the estimated net cumulative losses of comparable new loans, notes and certificates.
Cumulative prepayments
– Cumulative prepayments are estimates of the cumulative amount of principal prepayments that will occur over the entire life of a loan, note or certificate expressed as a percentage of the original principal amount of the loan, note or certificate. The total prepayments estimated to occur over the remaining maturity of existing loans, notes and certificates are less than the estimated cumulative prepayments of comparable new loans, notes and certificates. The assumption regarding cumulative prepayments reduces the projected principal balances and expected terms of the loan. Beginning in the third quarter of 2015, the Company incorporates expected prepayments into the valuation of loans, notes and certificates to better reflect a market participant’s view of valuation assumptions underlying unsecured consumer credit obligations. Prior to the third quarter of 2015, the effect of prepayments was reflected through an effective adjustment to the discount rates used in the fair value methodology.
69
LENDINGCLUB CORPORATION
Management's Discussion and Analysis of Financial Condition and Results of Operations
(Tabular Amounts in Thousands, Except Share and Per Share Data and Ratios, or as Noted)
We include in earnings the estimated unrealized fair value gains or losses during the period of loans, and the offsetting estimated fair value losses or gains attributable to the expected changes in future payments on notes and certificates.
Servicing Assets and Liabilities
We record servicing assets and liabilities at their estimated fair values when we sell whole loans to unrelated third-party whole loan buyers or when the servicing contract commences. The gain or loss on a loan sale is recorded in other revenue (expense) in the consolidated statements of operations while the component of the gain or loss that is based on the degree to which the contractual loan servicing fee is above or below an estimated market rate loan servicing fee is recorded as an offset in servicing assets or liabilities. Servicing assets and liabilities are recorded in “Other assets” and “Accrued expenses and other liabilities,” respectively, on the consolidated balance sheets. Changes in the fair value of servicing assets and liabilities are reported in “Servicing Fees” in the consolidated statements of operations in the period in which the changes occur.
The Company uses the fair value measurement method to account for changes in servicing assets and liabilities. The Company uses a discounted cash flow model to estimate the fair values of loan servicing assets and liabilities. The cash flows in the valuation model represent the difference between the contractual servicing fees charged to whole loan buyers and an estimated market servicing fee. Since contractual servicing fees are generally based on the monthly unpaid principal balance of the underlying loans, the expected cash flows in the model incorporate estimated net expected losses and expected prepayments. The significant assumptions used in valuing the Company’s servicing assets and liabilities were as follows:
Market servicing rates
– The Company considers market servicing rates as those rates which a market participant would require to service the loans that Lending Club sells. The Company estimated these market servicing rates based on review of available observable market servicing rates for other loan types, adjusted for the unique loan attributes of the loans Lending Club sells and services (i.e. unsecured fixed-rate fully amortizing loans, ACH loan payments, intermediate terms, prime credit grades and sizes). The Company also supplements this analysis with market servicing benchmarking analyses performed periodically by a third-party valuation firm.
Discount rates
– The discount rates for loan servicing rights reflect the Company’s estimates of the rates of return that investors in servicing rights for unsecured consumer credit obligations would require when investing in similar servicing rights. Discount rates for servicing rights on existing loans reflect a risk premium intended to reflect the amount of compensation market participants would require due to the credit and liquidity uncertainty inherent in the instruments’ cash flows.
Net cumulative expected losses
– Net cumulative expected losses are an estimate of the net cumulative principal payments that will not be repaid over the entire life of a loan expressed as a percentage of the original principal amount of the loan. The net cumulative expected losses are estimated based on analysis of historical credit losses at the loan type, grade and maturity levels.
Cumulative prepayments
– Cumulative prepayments are estimates of the cumulative amount of principal prepayments that will occur over the entire life of a loan expressed as a percentage of the original principal amount of the loan. The cumulative prepayments are estimated based on analysis of historical prepayment rates at the loan type, grade and maturity levels.
Goodwill and Intangible Assets
Goodwill represents the fair value of acquired businesses in excess of the aggregate fair value of the identified net assets acquired. Goodwill is not amortized but is tested for impairment annually or whenever indications of
70
LENDINGCLUB CORPORATION
Management's Discussion and Analysis of Financial Condition and Results of Operations
(Tabular Amounts in Thousands, Except Share and Per Share Data and Ratios, or as Noted)
impairment exist. Our annual impairment testing date is April 1. Impairment exists whenever the carrying value of goodwill exceeds its implied fair value. Adverse changes in impairment indicators such as loss of key personnel, increase regulatory oversight, or unplanned changes in our operations could result in impairment. We did not recognize any goodwill impairment for the years ended
December 31, 2015
and
2014
. We did not have any goodwill during the year ended
December 31, 2013
.
We can elect to qualitatively assess goodwill for impairment if it is more likely than not that the fair value of a reporting unit (generally defined as a component of a business for which financial information is available and reviewed regularly by management) exceeds its carrying value. A qualitative assessment may consider macroeconomic and other industry-specific factors, such as trends in short-term and long-term interest rates and the ability to access capital or company-specific factors, such as market capitalization in excess of net assets, trends in revenue generating activities and merger or acquisition activity.
If we do not qualitatively assess goodwill we compare a reporting unit’s estimated fair value to its carrying value. We estimate the fair value of a reporting unit using both an income approach and a market approach. When applying the income approach, the Company uses a discounted cash flow model, which requires the estimation of cash flows and an appropriate discount rate. The Company projects cash flows expected to be generated by the reporting unit inclusive of an estimated terminal value. The discount rate assumption contemplates a weighted-average cost of capital based on both market observable and company-specific factors. The discount rate is risk-adjusted to include any premiums related to equity price volatility, size, and projected capital structure of publicly traded companies in similar lines of business. The market approach estimates the fair value of a reporting unit based on certain market value multiples of publicly traded companies in similar lines of business, such as total enterprise value to revenue, or to EBITDA. Under the market approach, the Company also considers fair value implied from any relevant and comparable market transactions. Both approaches include reliance on long-term growth rates, and revenue and earnings projections.
Intangible assets are amortized over their useful lives in a manner that best reflects their economic benefit, which may include straight-line or accelerated methods of amortization. Intangible assets are reviewed for impairment quarterly and whenever events or changes in circumstances indicate that the carrying amount of such assets may not be recoverable. The Company does not have any indefinite-lived intangible assets.
Income Taxes
We account for income taxes using the asset and liability method. Under this method, deferred tax assets and liabilities are recognized for the future tax consequences attributable to differences between the financial statement carrying amount of existing assets and liabilities and their respective tax bases and net operating loss and tax credit carry-forwards. A valuation allowance is recorded to reduce deferred tax assets to the amount that is more likely than not to be realized.
Given our history of operating losses, it is difficult to accurately forecast when and in what amounts future results will be affected by the realization, if any, of the tax benefits resulting from future deductions for our net operating loss carryforwards. Based on the weight of available evidence, which includes our historical operating performance and the reported cumulative net losses in prior years, we have provided a full valuation allowance against our net deferred tax assets.
At
December 31, 2015
, we had federal and state net operating loss carryforwards of approximately
$109.9 million
and
$77.4 million
, respectively, that can be used to offset future taxable income. These federal and state net operating loss carryforwards will begin expiring in
2025
and
2028
, respectively. We assess the available positive and negative evidence to estimate if sufficient future taxable income will be generated to utilize the existing
71
LENDINGCLUB CORPORATION
Management's Discussion and Analysis of Financial Condition and Results of Operations
(Tabular Amounts in Thousands, Except Share and Per Share Data and Ratios, or as Noted)
deferred tax assets. On the basis of this evaluation, a full valuation allowance has historically been recorded to recognize only deferred tax assets that are more likely than not to be realized.
Consolidation of Variable Interest Entities
A variable interest entity (VIE) is a legal entity that does not have sufficient equity at risk to finance its own operations, whose equity holders do not have the power to direct the activities most significantly affecting the economic outcome of those activities, or whose equity holders do not share proportionately in the losses or receive the residual returns of the entity. When the Company has a controlling financial interest in a VIE, it must consolidate the results of the VIE’s operations into its consolidated financial statements. A controlling financial interest exists if we have both the power to direct the VIE’s activities that most significantly affect the VIE’s economic performance and the obligation to absorb losses or receive benefits that could be potentially significant to the VIE. The Company has determined that the Trust is a VIE and that the Company has a controlling financial interest in the Trust.
We established the Trust in February 2011 and funded it with a nominal equity investment. The Company is the only equity investor in the Trust. The purpose of the Trust is to acquire and hold loans for the benefit of investors who have invested in certificates issued by the Trust. The Trust conducts no other business other than purchasing and retaining loans or portions thereof for the benefit of the investment funds and their underlying limited partners. The Trust holds loans, none of which are financed by the Company. The cash flows from the loans held by the Trust are used to repay obligations under the certificates.
In the event of our insolvency, it is anticipated that the assets of the Trust would not become part of the bankruptcy estate, but that outcome is uncertain. As a result of this risk and uncertainty and in connection with the formation of the investment funds, it was determined that in order to achieve success in raising investment capital, the assets to be invested in by the investment funds must be held by an entity that was separate and distinct from us (i.e. bankruptcy remote) in order to reduce this risk and uncertainty.
Our capital contributions, which are the only equity investments in the Trust, are insufficient to allow the Trust to finance the purchase of a significant amount of loans without the issuance of certificates to investors. Therefore, the Trust’s capitalization level qualifies the Trust as a VIE. We have a controlling financial interest in the Trust because of our right to returns related to servicing fee revenue from the Trust, our right to reimbursement for expenses, and our obligation to repurchase loans from the Trust in certain instances. Additionally, we perform or direct activities that significantly affect the Trust’s economic performance through (i) operation of the platform that enables borrowers to apply for loans purchased by the Trust; (ii) credit underwriting and servicing of loans purchased by the Trust; and (iii) LCA’s role to source investors that ultimately purchase certificates that supply the funds for the Trust to purchase loans. Collectively, the activities described above allow us to fund more loans, and to collect the related loan transaction fees, and for LCA to collect the management fees on the investors’ capital used to purchase certificates, than would be the case without the existence of the Trust. Therefore, we receive significant economic benefits from the existence and activities conducted by the Trust. Accordingly, we have concluded that we are the primary beneficiary of the Trust and have consolidated the Trust’s operations in our consolidated financial statements.
Additionally, we reviewed our relationship with certain private investment funds (Funds) and concluded that they are VIEs because all equity is held by the limited partners who have no power to direct the activities that most significantly affect the economic performance of the Funds. The Funds are designed to pass along the obligation to absorb losses and the right to receive benefits in the form of interest rate risk and credit risk to the limited partners. As such, the Company does not have a controlling interest in Funds and, therefore, such funds are not consolidated with the Company.
72
LENDINGCLUB CORPORATION
Management's Discussion and Analysis of Financial Condition and Results of Operations
(Tabular Amounts in Thousands, Except Share and Per Share Data and Ratios, or as Noted)
Management regularly reviews and reconsiders its previous conclusion regarding the status of an entity as a VIE and whether we are required to consolidate such VIE in the consolidated financial statements.
Stock-based Compensation
Stock-based compensation includes expense associated with restricted stock units, stock option grants, and our employee stock purchase plan (ESPP), as well as expense associated with stock issued related to our acquisition of Springstone. Stock-based compensation expense is based on the grant date fair value of the award, net of expected forfeitures, which are based on our historical experience. If actual forfeitures differ significantly from our estimates, stock-based compensation expense and our results of operations could be materially impacted.
The fair value of restricted stock units is based on the closing price of our common stock on the date of grant. To determine the fair value of stock options and ESPP purchase rights, we use the Black-Scholes option-pricing model, with inputs for the fair value of our common stock, expected common stock price volatility over the expected life of the stock options or ESPP purchase rights, expected term of the stock option or ESPP purchase right, risk-free interest rates and expected dividends. Prior to the Company’s IPO, the fair value of its shares of common stock was established by the board of directors. The Company’s board of directors relied upon valuations provided by third party valuation firms and other factors, including, but not limited to, the current status of the technical and commercial success of the Company’s operations, the Company’s financial condition, the stage of the Company’s product design and development, and competition to establish the fair value of the Company’s common stock at the time of grant of the option.
As we do not have a significant trading history for our common stock, the expected stock price volatility for our common stock is estimated by reference to the average historical stock price volatility for our industry peers. The industry peer group used to estimate our volatility includes small, mid and large capitalization companies in the consumer finance, investment management and technology industries taking into account the similarity in size, stage of life cycle and financial leverage. The expected term represents the period of time that stock options are estimated to be outstanding, giving consideration to the contractual terms of the options, vesting schedules, and expectations of future exercise patterns and post-vesting employee termination behavior. Given our limited operating history, the simplified method is applied to calculate the expected term. We use a risk-free interest rate based on the U.S. Treasury yield for a term consistent with the expected life of the awards in effect at the time of grant. We have never declared or paid any cash or other dividends and do not anticipate paying cash or other dividends in the foreseeable future. Consequently, we use an expected dividend yield of 0.0% in our option-pricing model.
Stock-based compensation expense related to stock options and restricted stock units that are expected to vest is recognized over the vesting period of the award, which is generally four years, on a straight-line basis. The compensation expense related to ESPP purchase rights is recognized on a straight-line basis over the requisite service period, which is generally six months.
73
LENDINGCLUB CORPORATION
Market risk represents the risk of loss that may impact our financial position due to adverse changes in financial market prices and interest rates.
Because balances, interest rates and maturities of loans are matched and offset by an equal balance of notes and certificates with the exact same interest rates and maturities, we believe that we do not have any material exposure to changes in the net fair value of the combined loan, note and certificate portfolios as a result of changes in interest rates. We do not hold or issue financial instruments for trading purposes.
The fair values of loans and the related notes and certificates are determined using a discounted cash flow methodology. The fair value adjustments for loans are largely offset by the fair value adjustments of the notes and certificates due to the borrower payment dependent design of the notes and certificates and due to the total principal balances of the loans being very close to the combined principal balances of the notes and certificates.
We had cash and cash equivalents of
$623.5 million
as of
December 31, 2015
. These amounts were held primarily in interest-bearing deposits at investment grade financial institutions and institutional money market funds, which are short-term. Cash and cash equivalents are held for working capital purposes. Due to their short-term nature, we believe that we do not have any material exposure to changes in the fair value of these liquid investments as a result of changes in interest rates. Decreases in short-term interest rates will not materially reduce interest income on these cash and cash equivalents because of the current low rate environment. Increases in short-term interest rates will modestly increase the interest income earned on these cash balances.
Interest Rate Sensitivity
The Company holds securities available for sale. At
December 31, 2015
, the fair value of our securities available for sale portfolio was
$297.2 million
, consisting of corporate debt securities, asset-backed securities, U.S. agency securities, U.S. Treasury securities and other securities. To mitigate the risk of loss, our investment policy and strategy is focused first on the preservation of capital and supporting our liquidity requirements, and then maximizing returns. To manage this risk, the Company limits and monitors maturities, credit ratings, and concentrations within the investment portfolio. Changes in U.S. interest rates affect the interest earned on our securities available for sale and the market value of those securities. A hypothetical
100
basis point increase in interest rates would result in a decrease of approximately
$2.6 million
in the fair value of our securities available for sale as of
December 31, 2015
. A hypothetical
100
basis point decrease in interest rates would result in an increase of approximately
$2.6 million
in the fair value of our securities available for sale as of
December 31, 2015
. Any realized gains or losses resulting from such interest rate changes would only be recorded if we sold the securities prior to maturity and the securities were not considered other-than-temporarily impaired.
74
LENDINGCLUB CORPORATION
|
The supplementary financial information required by this Item 8 is included in Item 7 under the caption “Quarterly Results of Operations.”
|
|
75
REPORT OF INDEPENDENT REGISTERED PUBLIC ACCOUNTING FIRM
To the Board of Directors and Stockholders of
LendingClub Corporation
San Francisco, California
We have audited the accompanying consolidated balance sheets of LendingClub Corporation and subsidiaries (the “Company”) as of December 31, 2015 and 2014, and the related consolidated statements of operations, comprehensive income (loss), changes in stockholders’ equity, and cash flows for each of the three years in the period ended December 31, 2015. Our audits also included the financial statement schedule of the Company included at Item 15. These financial statements and financial statement schedule are the responsibility of the Company’s management. Our responsibility is to express an opinion on the financial statements and financial statement schedule based on our audits.
We conducted our audits in accordance with the standards of the Public Company Accounting Oversight Board (United States). Those standards require that we plan and perform the audit to obtain reasonable assurance about whether the financial statements are free of material misstatement. An audit includes examining, on a test basis, evidence supporting the amounts and disclosures in the financial statements. An audit also includes assessing the accounting principles used and significant estimates made by management, as well as evaluating the overall financial statement presentation. We believe that our audits provide a reasonable basis for our opinion.
In our opinion, such consolidated financial statements present fairly, in all material respects, the financial position of LendingClub Corporation and subsidiaries as of December 31, 2015 and 2014, and the results of their operations and their cash flows for each of the three years in the period ended December 31, 2015, in conformity with accounting principles generally accepted in the United States of America. Also, in our opinion, such financial statement schedule, when considered in relation to the basic consolidated financial statements taken as a whole, presents fairly, in all material respects, the information set forth therein.
We have also audited, in accordance with the standards of the Public Company Accounting Oversight Board (United States), the Company’s internal control over financial reporting as of December 31, 2015, based on the criteria established in
Internal Control - Integrated Framework (2013)
issued by the Committee of Sponsoring Organizations of the Treadway Commission and our report dated February 22, 2016, expressed an unqualified opinion on the Company’s internal control over financial reporting.
DELOITTE & TOUCHE LLP
San Francisco, CA
February 22, 2016
76
LENDINGCLUB CORPORATION
(In Thousands, Except Share and Per Share Amounts)
|
December 31,
|
2015
|
2014
|
|||||
|
Assets
|
|||||||
|
Cash and cash equivalents
|
$
|
623,531
|
|
$
|
869,780
|
|
|
|
Restricted cash
|
80,733
|
|
46,763
|
|
|||
|
Securities available for sale
|
297,211
|
|
—
|
|
|||
|
Loans at fair value (includes $3,022,001 and $1,772,407 from consolidated trust, respectively)
|
4,556,081
|
|
2,798,505
|
|
|||
|
Accrued interest receivable (includes $24,477 and $15,209 from consolidated trust, respectively)
|
38,081
|
|
24,262
|
|
|||
|
Property, equipment and software, net
|
55,930
|
|
27,051
|
|
|||
|
Intangible assets, net
|
30,971
|
|
36,302
|
|
|||
|
Goodwill
|
72,683
|
|
72,592
|
|
|||
|
Other assets
|
38,413
|
|
14,799
|
|
|||
|
Total assets
|
$
|
5,793,634
|
|
$
|
3,890,054
|
|
|
|
Liabilities and Stockholders’ Equity
|
|||||||
|
Accounts payable
|
$
|
5,542
|
|
$
|
5,892
|
|
|
|
Accrued interest payable (includes $26,719 and $16,989 from consolidated trust, respectively)
|
40,244
|
|
26,964
|
|
|||
|
Accrued expenses and other liabilities
|
61,243
|
|
31,620
|
|
|||
|
Payable to investors
|
73,162
|
|
38,741
|
|
|||
|
Notes and certificates, at fair value (includes $3,034,586 and $1,772,407 from consolidated trust, respectively)
|
4,571,583
|
|
2,813,618
|
|
|||
|
Total liabilities
|
4,751,774
|
|
2,916,835
|
|
|||
|
Stockholders’ Equity
|
|||||||
|
Common stock, $0.01 par value; 900,000,000 shares authorized at December 31, 2015 and 2014; 379,716,630 and 371,443,916 shares issued and outstanding at December 31, 2015 and 2014, respectively
|
3,797
|
|
3,714
|
|
|||
|
Additional paid-in capital
|
1,127,952
|
|
1,052,728
|
|
|||
|
Accumulated deficit
|
(88,218
|
)
|
(83,223
|
)
|
|||
|
Accumulated other comprehensive loss
|
(1,671
|
)
|
—
|
|
|||
|
Total stockholders’ equity
|
1,041,860
|
|
973,219
|
|
|||
|
Total liabilities and stockholders’ equity
|
$
|
5,793,634
|
|
$
|
3,890,054
|
|
|
See Notes to Consolidated Financial Statements.
77
LENDINGCLUB CORPORATION
(In Thousands, Except Share and Per Share Amounts)
|
Year Ended December 31,
|
2015
|
2014
|
2013
|
||||||||
|
Operating revenue:
|
|||||||||||
|
Transaction fees
|
$
|
373,508
|
|
$
|
197,124
|
|
$
|
85,830
|
|
||
|
Servicing fees
|
32,811
|
|
11,534
|
|
3,951
|
|
|||||
|
Management fees
|
10,976
|
|
5,957
|
|
3,083
|
|
|||||
|
Other revenue (expense)
|
9,402
|
|
(1,203
|
)
|
5,111
|
|
|||||
|
Total operating revenue
|
426,697
|
|
213,412
|
|
97,975
|
|
|||||
|
Net interest income (expense):
|
|||||||||||
|
Total interest income
|
552,972
|
|
354,453
|
|
187,507
|
|
|||||
|
Total interest expense
|
(549,740
|
)
|
(356,615
|
)
|
(187,447
|
)
|
|||||
|
Net interest income (expense)
|
3,232
|
|
(2,162
|
)
|
60
|
|
|||||
|
Fair value adjustments, loans, notes and certificates
|
14
|
|
(122
|
)
|
(33
|
)
|
|||||
|
Net interest income (expense) and fair value adjustments
|
3,246
|
|
(2,284
|
)
|
27
|
|
|||||
|
Total net revenue
|
429,943
|
|
211,128
|
|
98,002
|
|
|||||
|
Operating expenses:
(1)
|
|||||||||||
|
Sales and marketing
|
171,526
|
|
85,652
|
|
37,431
|
|
|||||
|
Origination and servicing
|
61,335
|
|
37,326
|
|
17,978
|
|
|||||
|
Engineering and product development
|
77,062
|
|
38,518
|
|
15,528
|
|
|||||
|
Other general and administrative
|
122,182
|
|
81,136
|
|
19,757
|
|
|||||
|
Total operating expenses
|
432,105
|
|
242,632
|
|
90,694
|
|
|||||
|
Income (loss) before income tax expense
|
(2,162
|
)
|
(31,504
|
)
|
7,308
|
|
|||||
|
Income tax expense
|
2,833
|
|
1,390
|
|
—
|
|
|||||
|
Net income (loss)
|
$
|
(4,995
|
)
|
$
|
(32,894
|
)
|
$
|
7,308
|
|
||
|
Net income (loss) per share attributable to common stockholders:
|
|||||||||||
|
Basic
|
$
|
(0.01
|
)
|
$
|
(0.44
|
)
|
$
|
0.00
|
|
||
|
Diluted
|
$
|
(0.01
|
)
|
$
|
(0.44
|
)
|
$
|
0.00
|
|
||
|
Weighted-average common shares - Basic
|
374,872,118
|
|
75,573,742
|
|
51,557,136
|
|
|||||
|
Weighted-average common shares - Diluted
|
374,872,118
|
|
75,573,742
|
|
81,426,976
|
|
|||||
|
(1)
|
Prior period amounts have been reclassified to conform to the current period presentation. See “
Note 1. Basis of Presentation
”
for additional information.
|
See Notes to Consolidated Financial Statements.
78
LENDINGCLUB CORPORATION
Consolidated Statements of Comprehensive Income (Loss)
(In Thousands)
|
Year Ended December 31,
|
2015
|
2014
|
2013
|
||||||||
|
Net income (loss)
|
$
|
(4,995
|
)
|
$
|
(32,894
|
)
|
$
|
7,308
|
|
||
|
Other comprehensive loss, before tax:
|
|||||||||||
|
Change in net unrealized loss on securities available for sale
|
(1,671
|
)
|
—
|
|
—
|
|
|||||
|
Other comprehensive loss, before tax
|
(1,671
|
)
|
—
|
|
—
|
|
|||||
|
Income tax effect
|
—
|
|
—
|
|
—
|
|
|||||
|
Other comprehensive loss, net of tax
|
(1,671
|
)
|
—
|
|
—
|
|
|||||
|
Comprehensive income (loss)
|
$
|
(6,666
|
)
|
$
|
(32,894
|
)
|
$
|
7,308
|
|
||
See Notes to Consolidated Financial Statements.
79
LENDINGCLUB CORPORATION
Consolidated Statements of Changes in Stockholders' Equity
(In Thousands, Except Share Data)
|
|
Convertible Preferred Stock
|
Common Stock
|
Additional
Paid-in
Capital
|
Treasury Stock
|
Accumulated Other Comprehensive Income
|
Accumulated
Deficit
|
Total
Stockholders’
Equity
|
|||||||||||||||||||||||||||||
|
|
Shares
|
Amount
|
Shares
|
Amount
|
Shares
|
Amount
|
||||||||||||||||||||||||||||||
|
Balance at
December 31, 2012
|
239,365,432
|
|
$
|
103,023
|
|
45,167,448
|
|
$
|
123
|
|
$
|
6,713
|
|
(70,560
|
)
|
$
|
(12
|
)
|
$
|
—
|
|
$
|
(57,637
|
)
|
$
|
52,210
|
|
|||||||||
|
Exercise of warrants to purchase Series A convertible preferred stock
|
829,356
|
|
221
|
|
—
|
|
—
|
|
—
|
|
—
|
|
—
|
|
—
|
|
—
|
|
221
|
|
||||||||||||||||
|
Exercise of warrants to purchase common stock
|
—
|
|
—
|
|
957,876
|
|
2
|
|
148
|
|
—
|
|
—
|
|
—
|
|
—
|
|
150
|
|
||||||||||||||||
|
Stock-based compensation and warrant expense
|
—
|
|
—
|
|
—
|
|
—
|
|
6,490
|
|
—
|
|
—
|
|
—
|
|
—
|
|
6,490
|
|
||||||||||||||||
|
Issuance of common stock upon exercise of options
|
—
|
|
—
|
|
8,931,876
|
|
23
|
|
1,692
|
|
—
|
|
—
|
|
—
|
|
—
|
|
1,715
|
|
||||||||||||||||
|
Other
|
—
|
|
—
|
|
(70,560
|
)
|
(10
|
)
|
(2
|
)
|
70,560
|
|
12
|
|
—
|
|
—
|
|
—
|
|
||||||||||||||||
|
Net income
|
—
|
|
—
|
|
—
|
|
—
|
|
—
|
|
—
|
|
—
|
|
—
|
|
7,308
|
|
7,308
|
|
||||||||||||||||
|
Balance at
December 31, 2013
|
240,194,788
|
|
$
|
103,244
|
|
54,986,640
|
|
$
|
138
|
|
$
|
15,041
|
|
—
|
|
$
|
—
|
|
$
|
—
|
|
$
|
(50,329
|
)
|
$
|
68,094
|
|
|||||||||
|
Exercise of warrants to purchase Series A convertible preferred stock
|
572,161
|
|
66
|
|
—
|
|
—
|
|
—
|
|
—
|
|
—
|
|
—
|
|
—
|
|
66
|
|
||||||||||||||||
|
Exercise of warrants to purchase common stock
|
—
|
|
—
|
|
1,818,174
|
|
18
|
|
494
|
|
—
|
|
—
|
|
—
|
|
—
|
|
512
|
|
||||||||||||||||
|
Stock-based compensation and warrant expense
|
—
|
|
9,176
|
|
—
|
|
—
|
|
29,848
|
|
—
|
|
—
|
|
—
|
|
—
|
|
39,024
|
|
||||||||||||||||
|
Issuance of Series F convertible preferred stock for cash, net of issuance costs
|
6,390,556
|
|
64,803
|
|
—
|
|
—
|
|
—
|
|
—
|
|
—
|
|
—
|
|
—
|
|
64,803
|
|
||||||||||||||||
|
Issuance of Series F convertible preferred stock for the acquisition of Springstone
|
2,443,930
|
|
2,762
|
|
—
|
|
—
|
|
—
|
|
—
|
|
—
|
|
—
|
|
—
|
|
2,762
|
|
||||||||||||||||
|
Issuance of common stock upon exercise of options
|
—
|
|
—
|
|
6,037,667
|
|
60
|
|
3,504
|
|
—
|
|
—
|
|
—
|
|
—
|
|
3,564
|
|
||||||||||||||||
|
Issuance of common stock upon initial public offering, net of offering costs
|
—
|
|
—
|
|
59,000,000
|
|
590
|
|
827,090
|
|
—
|
|
—
|
|
—
|
|
—
|
|
827,680
|
|
||||||||||||||||
|
Conversion of preferred stock to common stock upon initial public offering
|
(249,601,435
|
)
|
(180,051
|
)
|
249,601,435
|
|
2,496
|
|
177,555
|
|
—
|
|
—
|
|
—
|
|
—
|
|
—
|
|
||||||||||||||||
|
Early exercise liability related to unvested stock options
|
—
|
|
—
|
|
—
|
|
—
|
|
(392
|
)
|
—
|
|
—
|
|
—
|
|
—
|
|
(392
|
)
|
||||||||||||||||
|
Par value adjustment for stock splits
|
—
|
|
—
|
|
—
|
|
412
|
|
(412
|
)
|
—
|
|
—
|
|
—
|
|
—
|
|
—
|
|
||||||||||||||||
|
Net loss
|
—
|
|
—
|
|
—
|
|
—
|
|
—
|
|
—
|
|
—
|
|
—
|
|
(32,894
|
)
|
(32,894
|
)
|
||||||||||||||||
|
Balance at
December 31, 2014
|
—
|
|
$
|
—
|
|
371,443,916
|
|
$
|
3,714
|
|
$
|
1,052,728
|
|
—
|
|
$
|
—
|
|
$
|
—
|
|
$
|
(83,223
|
)
|
$
|
973,219
|
|
|||||||||
|
Stock-based compensation and related tax effects
|
—
|
|
—
|
|
—
|
|
—
|
|
56,005
|
|
—
|
|
—
|
|
—
|
|
—
|
|
56,005
|
|
||||||||||||||||
|
Stock option exercises and other
|
—
|
|
—
|
|
7,862,705
|
|
79
|
|
13,394
|
|
—
|
|
—
|
|
—
|
|
—
|
|
13,473
|
|
||||||||||||||||
|
ESPP purchase shares
|
—
|
|
—
|
|
410,009
|
|
4
|
|
5,087
|
|
—
|
|
—
|
|
—
|
|
—
|
|
5,091
|
|
||||||||||||||||
|
Unrealized gain (loss) on available for sale securities
|
—
|
|
—
|
|
—
|
|
—
|
|
—
|
|
—
|
|
—
|
|
(1,671
|
)
|
—
|
|
(1,671
|
)
|
||||||||||||||||
|
Excess tax benefit from share-based award activity
|
|
|
|
|
|
|
|
|
738
|
|
|
|
|
|
—
|
|
—
|
|
738
|
|
||||||||||||||||
|
Net loss
|
—
|
|
—
|
|
—
|
|
—
|
|
—
|
|
—
|
|
—
|
|
|
|
(4,995
|
)
|
(4,995
|
)
|
||||||||||||||||
|
Balance at
December 31, 2015
|
—
|
|
$
|
—
|
|
379,716,630
|
|
$
|
3,797
|
|
$
|
1,127,952
|
|
—
|
|
$
|
—
|
|
$
|
(1,671
|
)
|
$
|
(88,218
|
)
|
$
|
1,041,860
|
|
|||||||||
See Notes to Consolidated Financial Statements.
80
LENDINGCLUB CORPORATION
(in Thousands)
|
Year Ended December 31,
|
2015
|
2014
|
2013
|
||||||||
|
Cash Flows from Operating Activities:
|
|||||||||||
|
Net (loss) income
|
$
|
(4,995
|
)
|
$
|
(32,894
|
)
|
$
|
7,308
|
|
||
|
Adjustments to reconcile net (loss) income to net cash provided by operating activities:
|
|||||||||||
|
Net fair value adjustments of loans, notes and certificates
|
(14
|
)
|
122
|
|
33
|
|
|||||
|
Change in fair value of loan servicing liabilities
|
(5,194
|
)
|
3,037
|
|
936
|
|
|||||
|
Change in fair value of loan servicing assets
|
3,803
|
|
(1,647
|
)
|
(534
|
)
|
|||||
|
Stock-based compensation, net
|
51,222
|
|
37,150
|
|
6,490
|
|
|||||
|
Excess tax benefit from share-based awards
|
(738
|
)
|
—
|
|
—
|
|
|||||
|
Depreciation and amortization
|
21,578
|
|
10,258
|
|
1,663
|
|
|||||
|
(Gain) loss on sales of loans
|
(4,885
|
)
|
3,569
|
|
(3,862
|
)
|
|||||
|
Other, net
|
(129
|
)
|
198
|
|
—
|
|
|||||
|
Loss on disposal of property, equipment and software
|
790
|
|
553
|
|
30
|
|
|||||
|
Purchase of whole loans to be sold
|
(3,358,611
|
)
|
(1,733,614
|
)
|
(442,362
|
)
|
|||||
|
Proceeds from sales of whole loans
|
3,358,611
|
|
1,730,045
|
|
446,224
|
|
|||||
|
Net change in operating assets and liabilities:
|
|||||||||||
|
Accrued interest receivable
|
(13,819
|
)
|
(8,287
|
)
|
(10,454
|
)
|
|||||
|
Other assets
|
(15,857
|
)
|
13,270
|
|
(21,021
|
)
|
|||||
|
Due from related parties
|
(188
|
)
|
(112
|
)
|
(240
|
)
|
|||||
|
Accounts payable
|
(598
|
)
|
2,357
|
|
1,788
|
|
|||||
|
Accrued interest payable
|
13,280
|
|
9,223
|
|
11,063
|
|
|||||
|
Accrued expenses and other liabilities
|
30,485
|
|
16,692
|
|
4,077
|
|
|||||
|
Net cash provided by operating activities
|
74,741
|
|
49,920
|
|
1,139
|
|
|||||
|
Cash Flows from Investing Activities:
|
|||||||||||
|
Purchase of loans
|
(3,865,565
|
)
|
(2,156,382
|
)
|
(1,618,404
|
)
|
|||||
|
Principal payments received on loans
|
1,804,719
|
|
1,054,357
|
|
511,232
|
|
|||||
|
Proceeds from recoveries and sales of charged-off loans
|
26,256
|
|
7,960
|
|
1,716
|
|
|||||
|
Purchases of securities available for sale
|
(419,173
|
)
|
—
|
|
—
|
|
|||||
|
Proceeds from sales of securities available for sale
|
120,420
|
|
—
|
|
—
|
|
|||||
|
Payments for business acquisition, net of cash acquired
|
—
|
|
(109,464
|
)
|
—
|
|
|||||
|
Net change in restricted cash
|
(33,970
|
)
|
(32,974
|
)
|
(4,724
|
)
|
|||||
|
Purchases of property, equipment and software, net
|
(39,387
|
)
|
(20,572
|
)
|
(10,435
|
)
|
|||||
|
Net cash used in investing activities
|
(2,406,700
|
)
|
(1,257,075
|
)
|
(1,120,615
|
)
|
|||||
|
Cash Flows from Financing Activities:
|
|||||||||||
|
Change in payable to investors
|
34,421
|
|
34,308
|
|
1,868
|
|
|||||
|
Proceeds from issuances of notes and certificates
|
3,861,995
|
|
2,156,019
|
|
1,618,269
|
|
|||||
|
Principal payments on notes and certificates
|
(1,800,859
|
)
|
(1,049,982
|
)
|
(504,330
|
)
|
|||||
|
Payments on notes and certificates from recoveries/sales of related charged-off loans
|
(26,143
|
)
|
(7,929
|
)
|
(1,669
|
)
|
|||||
|
Proceeds from term loan, net of debt discount
|
—
|
|
49,813
|
|
—
|
|
|||||
|
Payment for debt issuance costs
|
(1,296
|
)
|
(1,218
|
)
|
—
|
|
|||||
|
Principal payment on term loan
|
—
|
|
(50,000
|
)
|
—
|
|
|||||
|
Proceeds from initial public offering, net of offering costs
|
—
|
|
827,680
|
|
—
|
|
|||||
81
LENDINGCLUB CORPORATION
Consolidated Statements of Cash Flows
(in Thousands)
|
Year Ended December 31,
|
2015
|
2014
|
2013
|
||||||||
|
Proceeds from issuance of Series F convertible preferred stock, net of issuance costs
|
—
|
|
64,803
|
|
—
|
|
|||||
|
Proceeds from exercise of warrants to acquire Series A and Series B convertible preferred stock
|
—
|
|
66
|
|
221
|
|
|||||
|
Proceeds from exercise of warrants to acquire common stock
|
3
|
|
512
|
|
150
|
|
|||||
|
Proceeds from stock options exercises and other
|
11,670
|
|
3,564
|
|
1,715
|
|
|||||
|
Excess tax benefit from share-based awards
|
738
|
|
—
|
|
—
|
|
|||||
|
Proceeds from issuance of common stock for ESPP
|
5,091
|
|
—
|
|
—
|
|
|||||
|
Other financing activities
|
90
|
|
—
|
|
—
|
|
|||||
|
Net cash provided by financing activities
|
2,085,710
|
|
2,027,636
|
|
1,116,224
|
|
|||||
|
Net Increase (Decrease) in Cash and Cash Equivalents
|
(246,249
|
)
|
820,481
|
|
(3,252
|
)
|
|||||
|
Cash and Cash Equivalents, Beginning of Period
|
869,780
|
|
49,299
|
|
52,551
|
|
|||||
|
Cash and Cash Equivalents, End of Period
|
$
|
623,531
|
|
$
|
869,780
|
|
$
|
49,299
|
|
||
|
Supplemental Cash Flow Information:
|
|||||||||||
|
Cash paid for interest
|
$
|
536,448
|
|
$
|
345,919
|
|
$
|
176,195
|
|
||
|
Non-cash investing activity:
|
|||||||||||
|
Accruals for property, equipment and software
|
$
|
2,975
|
|
$
|
832
|
|
$
|
2,275
|
|
||
|
Non-cash investing and financing activity:
|
|||||||||||
|
Issuance of Series F convertible preferred stock
|
$
|
—
|
|
$
|
2,762
|
|
$
|
—
|
|
||
|
Non-cash financing activity:
|
|||||||||||
|
Conversion of preferred stock to common stock
|
$
|
—
|
|
$
|
180,051
|
|
$
|
—
|
|
||
|
Accrual of prepaid offering costs
|
$
|
—
|
|
$
|
2,688
|
|
$
|
—
|
|
||
See Notes to Consolidated Financial Statements.
82
LENDINGCLUB CORPORATION
Notes to Consolidated Financial Statements
(Tabular Amounts in Thousands, Except Share and Per Share Amounts, Ratios, or as Noted)
1. Basis of Presentation
LendingClub Corporation (Lending Club) is an online marketplace connecting borrowers and investors. LC Advisors, LLC (LCA), is a registered investment advisor with the Securities and Exchange Commission (SEC) and wholly-owned subsidiary of Lending Club that acts as the general partner for certain private funds and advisor to separately managed accounts (SMAs). Springstone Financial, LLC (Springstone), is a wholly-owned subsidiary of Lending Club that facilitates education and patient finance loans. LC Trust I (the Trust) is an independent Delaware business trust that acquires loans from Lending Club and holds them for the sole benefit of certain investors that have purchased a trust certificate (Certificates) issued by the Trust and that are related to specific underlying loans for the benefit of the investor.
The accompanying consolidated financial statements include Lending Club, the Trust, LCA and Springstone (collectively referred to as the Company, we, or us). All intercompany balances and transactions have been eliminated. These consolidated financial statements have been prepared in conformity with accounting principles generally accepted in the United States of America (GAAP) for financial information necessary for the fair statement of the results and financial position for the periods presented. These accounting principles require management to make certain estimates and assumptions that affect the amounts in the accompanying financial statements. Actual results may differ from those estimates.
In the fourth quarter of 2015, the Company disaggregated the expense previously reported as “General and administrative” into “Engineering and product development” and “Other general and administrative” expense. Additionally, the Company reclassified certain operating expenses between “Sales and marketing,” “Origination and servicing,” “Engineering and product development” and “Other general and administrative” expense to align such classification and presentation with how the Company currently manages the operations and these expenses. These changes had no impact to “Total operating expenses.” Prior period amounts have been reclassified to conform to the current presentation.
On December 11, 2014, the Company completed its initial public offering (IPO) and registered
66,700,000
shares of common stock at
$15.00
per share for an aggregate offering price of approximately
$1.0 billion
.
On April 17, 2014, Lending Club acquired all the outstanding limited liability company interests of Springstone. The Company’s consolidated financial statements include Springstone’s results of operations, statement of financial position, and statement of cash flows from this date (see
Note 19 – Springstone Acquisition
).
On April 15, 2014, a
2
-for
-1
equity stock split approved by the Company’s board of directors became effective, in which each outstanding share of each series or class of equity capital stock was split into two outstanding shares of such series or class of equity capital stock. Additionally, another
2
-for
-1
equity stock split approved by the Company’s board of directors became effective on September 5, 2014, in which each outstanding share of each series or class of equity capital stock was split into two outstanding shares of such series or class of equity capital stock. All share and per share data has been adjusted to reflect these stock splits. The par value of each of the outstanding shares remains the same at
$0.01
.
2. Summary of Significant Accounting Policies
Revenue Recognition
Transaction Fee Revenue:
Transaction fees are paid by issuing banks or patient service providers to Lending Club for the work Lending Club performs through its platform and Springstone’s platform. These fees are recognized as a
83
LENDINGCLUB CORPORATION
Notes to Consolidated Financial Statements
(Tabular Amounts in Thousands, Except Share and Per Share Amounts, Ratios, or as Noted)
component of operating revenue at the time of loan issuance. The amount of these fees is based upon the loan amount and other terms of the loan, including credit grade, maturity and other factors. Since Lending Club can estimate refunds for loan cancellations based on its refund experience, the Company records transaction fee revenue net of estimated refunds at the time of loan issuance.
Servicing Fees:
Note investors, certain certificate holders and whole loan purchasers typically pay Lending Club a servicing fee on each payment received from a borrower or on the investors’ month-end principal balance of loans serviced. The servicing fee compensates the Company for managing payments from borrowers and to investors and maintaining investors’ account portfolios. The Company records servicing fees as a component of operating revenue when received. Servicing fees can be, and have been, modified or waived at management’s discretion. Servicing fees also include the change in fair value of loan servicing assets and liabilities.
Management Fees
: Qualified investors can invest in investment funds managed by LCA. LCA charges limited partners in the investment funds a management fee payable monthly in arrears, based on a limited partner’s capital account balance at month end. LCA also earns management fees on SMAs, payable monthly in arrears, based on the month-end balances in the SMA accounts. Management fees are a component of operating revenue in the consolidated statements of operations and are recorded as earned. Management fees can be, and have been, modified or waived at the discretion of LCA.
Other Revenue (Expense)
:
Other revenue (expense) consists primarily of gains and losses on sales of whole loans and referral revenue earned from partner companies when customers referred by Lending Club complete specified actions with them.
Whole Loan Sales
Under loan sale agreements, the Company sells all of its right, title and interest in certain loans. At the time of such sales, the Company simultaneously enters into loan servicing agreements under which it acquires the right to service the loans. The Company calculates a gain or loss on the whole loan sale, including the acquisition of loan servicing rights, based on the net proceeds from the whole loan sale, minus the net investment in the loans being sold.
Additionally, as needed, the Company will record a liability for significant estimated post-sale obligations or contingent obligations to the purchasers of the loans.
From January 1, 2013 through June 30, 2013, transaction fees and direct loan origination and acquisition costs for loans that were sold were deferred and included in the overall net investment in the loans and then included in the gain or loss on the sale of such loans. Accordingly, the transaction fees for such loans were not included in transaction fee revenue and the direct loan origination costs for such loans were not included in operating expenses. A gain or loss on the whole loan sales was recorded on the sale date in “Other revenue (expense).”
Effective July 1, 2013, the Company elected the fair value option for whole loans acquired that are designated to be sold. All transaction fees and all direct costs incurred in the origination process are recognized in earnings as earned or incurred and are not deferred. As such, beginning July 1, 2013, transaction fees for whole loans sold are included in “Transaction fees” and direct loan origination costs are included in “Origination and servicing” operating expense in the consolidated statements of operations. Gains and losses from whole loan sales are recorded in “Other revenue (expense)” in the consolidated statements of operations.
Net Income (Loss) Per Share
Earnings (loss) per share (EPS) is the amount of net income (loss) available to each share of common stock outstanding during the reporting period. Diluted EPS is the amount of net income (loss) available to each share of common stock outstanding during the reporting period, adjusted to include the effect of potentially dilutive common
84
LENDINGCLUB CORPORATION
Notes to Consolidated Financial Statements
(Tabular Amounts in Thousands, Except Share and Per Share Amounts, Ratios, or as Noted)
shares. Potentially dilutive common shares are excluded from the computation of diluted EPS in periods in which the effect would be antidilutive. Potentially dilutive common shares include incremental shares issued for stock options, convertible preferred stock and warrants to purchase common stock.
The Company calculates EPS using the two-class method, when applicable. The two-class method allocates net income (loss) that otherwise would have been available to common stockholders to holders of participating securities. All participating securities are excluded from basic weighted-average common shares outstanding. Prior to the Company’s IPO, the Company considered all series of its convertible preferred stock to be participating securities due to their non-cumulative dividend rights. As such, net income (loss) allocated to these participating securities, which included participation rights in undistributed earnings, was subtracted from net income (loss) to determine total undistributed net income (loss) to be allocated to common stockholders. In conjunction with the Company’s IPO on December 11, 2014, all of its convertible preferred stock converted to common stock and all warrants to purchase convertible preferred stock were converted to warrants to purchase common stock. The Company had no participating securities as of
December 31, 2015
or 2014.
Cash and Cash Equivalents
Cash and cash equivalents include the Company’s unrestricted deposits with financial institutions in checking, money market and short-term certificate of deposit accounts. The Company considers all highly liquid investments with stated maturity dates of
three months
or less from the date of purchase to be cash equivalents.
Restricted Cash
Restricted cash consists primarily of checking, money market and certificate of deposit accounts that are: (i) pledged to or held in escrow by the Company’s correspondent banks as security for transactions processed on or related to Lending Club’s platform; (ii) pledged through a credit support agreement with a certificate holder or (iii) investors’ funds transactions-in-process that have not yet been applied to their accounts on the platform and transferred to segregated bank accounts that hold investors’ funds.
Investor cash balances (excluding transactions-in-process) are held in segregated bank or custodial accounts and are not commingled with the Company’s monies or held on the Company’s balance sheet.
Securities Available for Sale
Securities available for sale are recorded at fair value and unrealized gains and losses are reported, net of taxes, in accumulated other comprehensive income (loss) included in stockholders’ equity unless management determines that a security is other-than-temporarily impaired (OTTI). Realized gains and losses from sales of securities available for sale are determined on a specific identification basis and are included in other revenue (expense). Purchases and sales of securities available for sale are recorded on trade date.
Management evaluates whether securities available for sale are OTTI on a quarterly basis. Debt securities with unrealized losses are considered OTTI if the Company intends to sell the security or if it is more likely than not that it will be required to sell such security before any anticipated recovery. If management determines that a security is OTTI under these circumstances, the impairment recognized in earnings is measured as the entire difference between the amortized cost and then-current fair value.
A security is also OTTI if management does not expect to recover all of the amortized cost of the security. In this circumstance, the impairment recognized in earnings represents estimated credit loss, and is measured by the difference between the present value of expected cash flows and the amortized cost of the security. Management utilizes cash flow models to estimate the expected future cash flow from the securities to estimate the credit loss when necessary. Expected cash flows are discounted using the security’s effective interest rate.
85
LENDINGCLUB CORPORATION
Notes to Consolidated Financial Statements
(Tabular Amounts in Thousands, Except Share and Per Share Amounts, Ratios, or as Noted)
The evaluation of whether the Company expects to recover the amortized cost of a security is inherently judgmental. The evaluation includes the assessment of several security performance indicators, including the magnitude and duration of the unrealized loss and whether the Company has received all scheduled principal and interest payments. There were no impairment charges recognized during 2015.
Loans, Notes and Certificates at Fair Value
The Company has elected fair value accounting for loans and related notes and the Certificates. The fair value election for these loans, notes and certificates results in symmetrical accounting in that changes in the fair value of loans are generally offset by equal changes in the fair values of notes and certificates, given the payment dependent structure of the notes and certificates. Changes in the fair value of loans, notes and certificates are recorded in fair value adjustments in the period of the fair value changes. The Company places loans on non-accrual status at
120
days past due.
Servicing Assets and Liabilities at Fair Value
The Company records servicing assets and liabilities at their estimated fair values when it sells whole loans to unrelated third-party whole loan buyers or when the servicing contract commences. The gain or loss on a loan sale is recorded in other revenue (expense) in the consolidated statements of operations while the component of the gain or loss that is based on the degree to which the contractual loan servicing fee is above or below an estimated market rate loan servicing fee is recorded as an offset in servicing assets or liabilities. Servicing assets and liabilities are recorded in “Other Assets” and “Accrued Expenses and Other Liabilities,” respectively, on the consolidated balance sheets. The Company uses the fair value measurement method to account for changes in servicing assets and liabilities. As such, changes in the fair value of servicing assets and liabilities are reported in “Servicing Fees” in the consolidated statements of operations in the period in which the changes occur.
Fair Value of Assets and Liabilities
The Company uses fair value measurement to record loans, notes, certificates and servicing assets and liabilities at fair value on a recurring basis. Fair value is defined as the exchange price that would be received for an asset or paid to transfer a liability (an exit price) in the principal or most advantageous market for the asset or liability in an orderly transaction between market participants on the measurement date.
The fair value hierarchy includes the following three-level classification, which is based on the market observability of the inputs used for estimating the fair value of the assets or liabilities being measured:
|
Level 1
|
—
|
Quoted market prices in active markets for identical assets or liabilities.
|
|
Level 2
|
—
|
Significant other observable inputs (e.g., quoted prices for similar items in active markets, quoted prices for identical or similar items in markets that are not active, inputs other than quoted prices that are observable such as interest rate and yield curves, and market-corroborated inputs).
|
|
Level 3
|
—
|
Inputs that are unobservable in the market but reflective of the types of assumptions that market participants would use in pricing the asset or liability. Valuation techniques include use of option pricing models, discounted cash flow methodologies or similar techniques. The Company utilizes discounted cash flow valuation techniques based on its estimate of future cash flows that are expected to occur over the life of a financial instrument.
|
The Company considers unobservable inputs to be significant, if, by their exclusion, the estimated fair value of a Level 3 asset or liability would be impacted by a significant percentage change, or based on qualitative factors such as the nature of the instrument and significance of the unobservable inputs relative to other inputs used within the valuation.
86
LENDINGCLUB CORPORATION
Notes to Consolidated Financial Statements
(Tabular Amounts in Thousands, Except Share and Per Share Amounts, Ratios, or as Noted)
We estimate the fair values of loans and related notes and certificates using a discounted cash flow valuation methodology. The fair valuation methodology considers projected prepayments and uses the historical actual defaults, losses and recoveries on our loans to project future losses and net cash flows on loans.
The Company uses the fair value measurement method to account for changes in servicing assets and liabilities. Significant assumptions used in valuing the Company’s servicing assets and liabilities were as follows:
The Company uses a discounted cash flow model to estimate the fair values of loan servicing assets and liabilities. The cash flows in the valuation model represent the difference between the contractual servicing fees charged to whole loan buyers and an estimated market servicing fee. Since contractual servicing fees are generally based on the monthly unpaid principal balance of the underlying loans, the expected cash flows in the model incorporate estimated net expected losses and expected prepayments.
Securities Available for Sale
The Company uses quoted prices in active markets to measure the fair value of securities available for sale, when available.When utilizing market data and bid-ask spreads, the Company uses the price within the bid-ask spread that best represents fair value. When quoted prices do not exist, the Company uses prices obtained from independent third-party pricing services to measure the fair value of securities available for sale. The Company’s primary independent pricing service provides prices based on observable trades and discounted cash flows that incorporate observable information, such as yields for similar types of securities (a benchmark interest rate plus observable spreads) and weighted-average maturity for the same or similar securities. The Company compares the prices obtained from its primary independent pricing service to the prices obtained from the additional independent pricing services to determine if the price obtained from the primary independent pricing service is reasonable. The Company does not adjust the prices received from independent third-party pricing services unless such prices are inconsistent with the definition of fair value and result in a material difference in the recorded amounts.
Financial Instruments Not Recorded at Fair Value
Financial instruments not recorded at fair value on a recurring basis include cash and cash equivalents, restricted cash, accrued interest receivable, deposits, accrued interest payable, accounts payable and payables to investors. These assets and liabilities are recorded at historical cost. Given the short-term nature of these instruments, the Company considers the amortized cost to approximate their fair values.
Accrued Interest
Accrued interest income on loans is calculated based on the contractual interest rate of the loan and recorded as interest income as earned. Loans are placed on non-accrual status upon reaching
120 days
past due. When a loan is placed on non-accrual status, the Company stops accruing interest and reverses all accrued but unpaid interest as of such date.
Property, Equipment and Software, net
Property, equipment and software consists of internally developed and purchased software, computer equipment, leasehold improvements, furniture and fixtures and construction in process, which are recorded at cost, less accumulated depreciation and amortization.
Computer equipment, purchased software and furniture and fixtures are depreciated or amortized on a straight line basis over
two
to
five years
. Leasehold improvements are amortized over the shorter of the lease term excluding
87
LENDINGCLUB CORPORATION
Notes to Consolidated Financial Statements
(Tabular Amounts in Thousands, Except Share and Per Share Amounts, Ratios, or as Noted)
renewal periods or the estimated useful life. Internally developed software is amortized on a straight line basis over the project’s estimated useful life, generally
three years
.
Internally developed software is capitalized when preliminary development efforts are successfully completed and it is probable that the project will be completed and the software will be used as intended. Capitalized costs consist of salaries and payroll related costs for employees and fees paid to third-party consultants who are directly involved in development efforts. Costs related to preliminary project activities and post implementation activities including training and maintenance are expensed as incurred. Costs incurred for upgrades and enhancements that are considered to be probable to result in additional functionality are capitalized.
The Company evaluates potential impairments of its property, equipment and software whenever events or changes in circumstances indicate that the carrying amount of the assets may not be recoverable. Events or changes in circumstances that could result in impairment include, but are not limited to, underperformance relative to historical or projected future operating results, significant changes in the manner of use of the assets or the strategy for the Company’s overall business and significant negative industry or economic trends. The determination of recoverability of these assets is based on whether an estimate of undiscounted future cash flows resulting from the use of the asset and its eventual disposition exceed the net book value of the asset. If the asset is not recoverable, measurement of an impairment loss is based on the fair value of the asset. When an impairment loss is recognized, the carrying amount of the asset is reduced to its estimated fair value.
Consolidation of Variable Interest Entities
A variable interest entity (VIE) is a legal entity that does not have sufficient equity at risk to finance its own operations, whose equity holders do not have the power to direct the activities most significantly affecting the economic outcome of those activities, or whose equity holders do not share proportionately in the losses or receive the residual returns of the entity. The determination of whether an entity is a VIE requires a significant amount of judgment. When the Company has a controlling financial interest in a VIE, it must consolidate the results of the VIE’s operations into its consolidated financial statements. The determination of whether a controlling financial interest exists also requires judgment. A controlling financial interest exists if we have both the power to direct the VIE’s activities that most significantly affect the VIE’s economic performance and the obligation to absorb losses or receive benefits that could be potentially significant to the VIE. Management regularly reviews and reconsiders its previous conclusion regarding the status of an entity as a VIE and whether we are required to consolidate such VIE in the consolidated financial statements.
Goodwill and Intangible Assets
Goodwill represents the fair value of acquired businesses in excess of the aggregate fair value of the identified net assets acquired. Goodwill is not amortized but is tested for impairment annually or whenever indications of impairment exist. Our annual impairment testing date is April 1. Impairment exists whenever the carrying value of goodwill exceeds its implied fair value. Adverse changes in impairment indicators such as loss of key personnel, increase regulatory oversight, or unplanned changes in our operations could result in impairment. We did not recognize any goodwill impairment for the years ended
December 31, 2015
and
2014
. We did not have any goodwill during the year ended
December 31, 2013
.
We can elect to qualitatively assess goodwill for impairment if it is more likely than not that the fair value of a reporting unit (generally defined as a component of a business for which financial information is available and reviewed regularly by management) exceeds its carrying value. A qualitative assessment may consider macroeconomic and other industry-specific factors, such as trends in short-term and long-term interest rates and the ability to access capital or company-specific factors, such as market capitalization in excess of net assets, trends in revenue generating activities and merger or acquisition activity.
88
LENDINGCLUB CORPORATION
Notes to Consolidated Financial Statements
(Tabular Amounts in Thousands, Except Share and Per Share Amounts, Ratios, or as Noted)
If we do not qualitatively assess goodwill we compare a reporting unit’s estimated fair value to its carrying value. Estimated fair value of a reporting unit is generally established using an income approach based on a discounted cash flow model or a market approach, which compares each reporting unit to comparable companies in their respective industries.
Intangible assets are amortized over their useful lives in a manner that best reflects their economic benefit, which may include straight-line or accelerated methods of amortization. Intangible assets are reviewed for impairment quarterly and whenever events or changes in circumstances indicate that the carrying amount of such assets may not be recoverable. The Company does not have any indefinite-lived intangible assets.
The Company has elected to record certain costs directly related to issuing its unsecured revolving credit facility as an asset included in “Other Assets” on the Company’s consolidated balance sheets. These costs are amortized as interest expense over the contractual term of the unsecured revolving credit facility.
Stock-based Compensation
Stock-based compensation includes expense associated with restricted stock units, stock option grants, and our employee stock purchase plan (ESPP), as well as expense associated with stock issued related to our acquisition of Springstone. Stock-based compensation expense is based on the grant date fair value of the award, net of expected forfeitures, which are based on our historical experience. If actual forfeitures differ significantly from our estimates, stock-based compensation expense and our results of operations could be materially impacted.
The fair value of restricted stock units is based on the closing price of our common stock on the date of grant. To determine the fair value of stock options and ESPP purchase rights, we use the Black-Scholes option-pricing model, with inputs for the fair value of our common stock, expected common stock price volatility over the expected life of the stock options or ESPP purchase rights, expected term of the stock option or ESPP purchase right, risk-free interest rates and expected dividends. Prior to the Company’s IPO, the fair value of its shares of common stock was established by the board of directors. The Company’s board of directors relied upon valuations provided by third party valuation firms and other factors, including, but not limited to, the current status of the technical and commercial success of the Company’s operations, the Company’s financial condition, the stage of the Company’s product design and development, and competition to establish the fair value of the Company’s common stock at the time of grant of the option.
As we do not have a significant trading history for our common stock, the expected stock price volatility for our common stock is estimated by reference to the average historical stock price volatility for our industry peers. The industry peer group used to estimate our volatility includes small, mid and large capitalization companies in the consumer finance, investment management and technology industries taking into account the similarity in size, stage of life cycle and financial leverage. The expected term represents the period of time that stock options are estimated to be outstanding, giving consideration to the contractual terms of the options, vesting schedules, and expectations of future exercise patterns and post-vesting employee termination behavior. Given our limited operating history, the simplified method is applied to calculate the expected term. We use a risk-free interest rate based on the U.S. Treasury yield for a term consistent with the expected life of the awards in effect at the time of grant. We have never declared or paid any cash or other dividends and do not anticipate paying cash or other dividends in the foreseeable future. Consequently, we use an expected dividend yield of
0.0%
in our option-pricing model.
Stock-based compensation expense related to stock options and restricted stock units that are expected to vest is recognized over the vesting period of the award, which is generally
four years
, on a straight-line basis. The
89
LENDINGCLUB CORPORATION
Notes to Consolidated Financial Statements
(Tabular Amounts in Thousands, Except Share and Per Share Amounts, Ratios, or as Noted)
compensation expense related to ESPP purchase rights is recognized on a straight-line basis over the requisite service period, which is generally
six months
.
Income Taxes
The Company accounts for income taxes under the asset and liability method, which requires the recognition of deferred tax assets and liabilities for the expected future tax consequences of events that have been included in the financial statements. Under this method, deferred tax assets and liabilities are determined on the basis of the differences between the financial statement and tax bases of assets and liabilities using enacted tax rates in effect for the year in which the differences are expected to reverse. The effect of a change in tax rates on deferred tax assets and liabilities is recognized in income in the period that includes the enactment date.
The Company recognizes deferred tax assets to the extent that it believes these assets are more likely than not to be realized. In making such a determination, the Company considers all available positive and negative evidence, including future reversals of existing taxable temporary differences, projected future taxable income, tax-planning strategies, and results of recent operations. If the Company determines that it would be able to realize its deferred tax assets in the future in excess of their net recorded amount, the Company would make an adjustment to the deferred tax asset valuation allowance, which would reduce the provision for income taxes.
The Company accounts for the realization of excess tax benefits for stock-based compensation based on the “with-and-without” approach, excluding the measurement of any indirect effects. Equity will be increased if and when such deferred tax assets are ultimately realized.
The Company accounts for uncertain tax positions using a two-step process whereby (i) it determines whether it is more likely than not that the tax positions will be sustained on the basis of the technical merits of the position (“more-likely-than-not recognition threshold”) and (ii) for those tax positions that meet the more-likely-than-not recognition threshold, it recognizes the largest amount of tax benefit that is more than 50 percent likely to be realized upon ultimate settlement with the related tax authority.
The Company recognizes interest and penalties accrued on any unrecognized tax benefits as a component of provision for income tax in the consolidated statements of operations.
Use of Estimates
The preparation of the Company’s consolidated financial statements and related disclosures requires management to make judgments, assumptions and estimates that affect the amounts reported in its consolidated financial statements and accompanying notes. The Company bases its estimates on historical experience and on various other factors it believes to be reasonable under the circumstances, the results of which form the basis for making judgments about the carrying values of certain assets and liabilities. These judgments, assumptions and estimates include but are not limited to the following: (i) fair value determinations for servicing assets and liabilities; (ii) fair value determinations for loans, notes and certificates; (iii) stock-based compensation expense; (iv) provision for income taxes, net of valuation allowance for deferred tax assets; (v) recoverability of property, equipment and software; (vi) carrying values of goodwill and intangible assets; (vii) consolidation of variable interest entities; and (viii) reserves for contingencies. These judgments, estimates and assumptions are inherently subjective in nature and actual results may differ from these estimates and assumptions, and the differences could be material.
90
LENDINGCLUB CORPORATION
Notes to Consolidated Financial Statements
(Tabular Amounts in Thousands, Except Share and Per Share Amounts, Ratios, or as Noted)
New Accounting Standards Not Yet Adopted
In January 2016, the Financial Accounting Standards Board (FASB) amended guidance related to recognition and measurement of financial instruments, which will be effective January 1, 2018. The amendments change the accounting for equity investments, change disclosure requirements related to instruments at amortized cost and fair value, and clarify how entities should evaluate deferred tax assets for securities classified as available-for-sale. The Company is currently evaluating the impact of this new guidance on its financial position, results of operations, earnings per common share (EPS), or cash flows.
In November 2015, the FASB amended guidance related to the presentation of deferred income taxes, which will be effective January 1, 2017. The guidance simplified the presentation to require that all deferred income taxes be presented as noncurrent on a classified statement of financial position. The Company does not currently present a classified statement of financial position and accordingly does not expect this guidance to have any impact on its disclosures.
In May 2014, the FASB issued new guidance on revenue recognition, which is effective January 1, 2019. The guidance clarifies that revenue from contracts with customers should be recognized in a manner that depicts both the likelihood of payment and the timing of the related transfer of goods or performance of services. The Company is currently evaluating the impact of this new guidance on its financial position, results of operations, EPS or cash flows.
Adoption of New Accounting Standards
In September 2015, the FASB amended existing guidance related to recognition of adjustments to provisional amounts recorded during purchase accounting. Changes recognized during the measurement period will be recognized prospectively as adjustments to goodwill, with corresponding changes in income or expense, such as revised depreciation or amortization, recognized in current period earnings. This amendment was effective January 1, 2016. Since the Company does not currently have any open measurement periods related to a business combination, adoption of this guidance did not have an impact on the Company’s financial position, results of operations, EPS, or cash flows.
In April 2015, the FASB issued new guidance amending accounting for customer’s cloud based computing fees, which will be effective January 1, 2016. The guidance changes what a customer must consider in determining whether a cloud computing arrangement contains a software license. If the arrangement contains a software license, the customer would account for fees related to the software license element in accordance with guidance related to internal use software; if the arrangement does not contain a software license, the customer would account for the arrangement as a service contract. The adoption of this guidance did not have an impact on the Company’s financial position, results of operations, EPS, or cash flows.
In February 2015, the FASB issued new guidance amending accounting for consolidations, which was effective January 1, 2016. The guidance changes what an investor must consider in determining whether it is required to consolidate an entity in which it holds an interest. The Company is in the process of evaluating the impact of adoption, which is not expected to be material to the Company’s financial position, results of operations, EPS, or cash flows.
In June 2014, the FASB issued guidance to clarify accounting for stock-based compensation awards that provide that a performance target could be achieved after the requisite service period, which is effective January 1, 2016. The guidance requires that a performance target that affects vesting, and is achievable after the requisite service period, be treated as a performance condition. The adoption of this guidance did not have a material impact on the Company’s financial position, results of operations, EPS, or cash flows.
91
LENDINGCLUB CORPORATION
Notes to Consolidated Financial Statements
(Tabular Amounts in Thousands, Except Share and Per Share Amounts, Ratios, or as Noted)
3. Net Income (Loss) Per Share and Net Income (Loss) Attributable to Common Stockholders
The following table details the computation of the Company’s basic and diluted net income (loss) per share:
|
Year Ended December 31,
|
2015
|
2014
|
2013
|
||||||||
|
Net income (loss)
|
$
|
(4,995
|
)
|
$
|
(32,894
|
)
|
$
|
7,308
|
|
||
|
Less: Net income allocated to participating securities
(1)
|
—
|
|
—
|
|
(7,117
|
)
|
|||||
|
Net income (loss) available to common stockholders
|
$
|
(4,995
|
)
|
$
|
(32,894
|
)
|
$
|
191
|
|
||
|
Weighted average common shares – Basic
|
374,872,118
|
|
75,573,742
|
|
51,557,136
|
|
|||||
|
Weighted average effect of dilutive securities:
|
|||||||||||
|
Stock options
|
—
|
|
—
|
|
28,542,404
|
|
|||||
|
Warrants
|
—
|
|
—
|
|
1,327,436
|
|
|||||
|
Weighted average common shares – Diluted
|
374,872,118
|
|
75,573,742
|
|
81,426,976
|
|
|||||
|
Net income (loss) per share attributable to common stockholders
|
|||||||||||
|
Basic
|
$
|
(0.01
|
)
|
$
|
(0.44
|
)
|
$
|
0.00
|
|
||
|
Diluted
|
$
|
(0.01
|
)
|
$
|
(0.44
|
)
|
$
|
0.00
|
|
||
|
(1)
|
In a period with net income, both earnings and dividends (if any) are allocated to participating securities. In a period with a net loss, only declared dividends (if any) are allocated to participating securities.
|
4. Securities Available for Sale
The Company began purchasing securities available for sale during the second quarter of 2015. The amortized cost, gross unrealized gains and losses, and fair value of securities available for sale as of
December 31, 2015
, were as follows:
|
Amortized
Cost
|
Gross
Unrealized
Gains
|
Gross
Unrealized
Losses
|
Fair
Value
|
||||||||||||
|
Corporate debt securities
|
$
|
217,243
|
|
$
|
2
|
|
$
|
(1,494
|
)
|
$
|
215,751
|
|
|||
|
Asset-backed securities
|
54,543
|
|
—
|
|
(134
|
)
|
54,409
|
|
|||||||
|
U.S. agency securities
|
16,602
|
|
1
|
|
(25
|
)
|
16,578
|
|
|||||||
|
U.S. Treasury securities
|
3,489
|
|
—
|
|
(4
|
)
|
3,485
|
|
|||||||
|
Other securities
|
7,005
|
|
—
|
|
(17
|
)
|
6,988
|
|
|||||||
|
Total securities available for sale
|
$
|
298,882
|
|
$
|
3
|
|
$
|
(1,674
|
)
|
$
|
297,211
|
|
|||
92
LENDINGCLUB CORPORATION
Notes to Consolidated Financial Statements
(Tabular Amounts in Thousands, Except Share and Per Share Amounts, Ratios, or as Noted)
A summary of securities available for sale with unrealized losses as of
December 31, 2015
, aggregated by period of continuous unrealized loss, is as follows:
|
Less than
12 months
|
12 months
or longer
|
Total
|
|||||||||||||||||||||
|
Fair
Value
|
Unrealized
Losses
|
Fair
Value
|
Unrealized
Losses
|
Fair
Value
|
Unrealized
Losses
|
||||||||||||||||||
|
Corporate debt securities
|
$
|
212,018
|
|
$
|
(1,494
|
)
|
$
|
—
|
|
$
|
—
|
|
$
|
212,018
|
|
$
|
(1,494
|
)
|
|||||
|
Asset-backed securities
|
54,409
|
|
(134
|
)
|
—
|
|
—
|
|
54,409
|
|
(134
|
)
|
|||||||||||
|
U.S. agency securities
|
14,578
|
|
(25
|
)
|
—
|
|
—
|
|
14,578
|
|
(25
|
)
|
|||||||||||
|
U.S. Treasury securities
|
3,485
|
|
(4
|
)
|
—
|
|
—
|
|
3,485
|
|
(4
|
)
|
|||||||||||
|
Other securities
|
6,988
|
|
(17
|
)
|
—
|
|
—
|
|
6,988
|
|
(17
|
)
|
|||||||||||
|
Total securities with unrealized losses
(1)
|
$
|
291,478
|
|
$
|
(1,674
|
)
|
$
|
—
|
|
$
|
—
|
|
$
|
291,478
|
|
$
|
(1,674
|
)
|
|||||
|
(1)
|
The number of investment positions with unrealized losses totaled
141
.
|
The contractual maturities of securities available for sale at
December 31, 2015
, were as follows:
|
Within
1 year
|
After 1 year
through
5 years
|
After 5 years
through
10 years
|
After
10 years
|
Total
|
|||||||||||
|
Corporate debt securities
|
$
|
35,499
|
|
$
|
180,252
|
|
$
|
—
|
|
$
|
—
|
|
$
|
215,751
|
|
|
Asset-backed securities
|
3,162
|
|
51,247
|
|
—
|
|
—
|
|
54,409
|
|
|||||
|
U.S. agency securities
|
—
|
|
16,578
|
|
—
|
|
—
|
|
16,578
|
|
|||||
|
U.S. Treasury securities
|
1,000
|
|
2,485
|
|
—
|
|
—
|
|
3,485
|
|
|||||
|
Other securities
|
—
|
|
6,988
|
|
—
|
|
—
|
|
6,988
|
|
|||||
|
Total fair value
|
$
|
39,661
|
|
$
|
257,550
|
|
$
|
—
|
|
$
|
—
|
|
$
|
297,211
|
|
|
Total amortized cost
|
$
|
39,727
|
|
$
|
259,155
|
|
$
|
—
|
|
$
|
—
|
|
$
|
298,882
|
|
Proceeds and gross realized gains and losses from sales of securities available for sale were as follows:
|
Year Ended December 31,
|
2015
|
||
|
Proceeds
|
$
|
120,420
|
|
|
Gross realized gains
|
$
|
133
|
|
|
Gross realized losses
|
$
|
4
|
|
There were
no
proceeds or realized gains and losses from sales of securities available for sale for the year ended
December 31, 2014
or
2013
.
93
LENDINGCLUB CORPORATION
Notes to Consolidated Financial Statements
(Tabular Amounts in Thousands, Except Share and Per Share Amounts, Ratios, or as Noted)
5. Loans, Notes and Certificates and Loan Servicing Rights
Loans, Notes and Certificates
The Company issues notes and the Trust issues certificates as a means to allow investors to invest in the associated loans. At
December 31, 2015
and
2014
, loans, notes and certificates measured at fair value on a recurring basis were as follows:
|
|
Loans
|
Notes and Certificates
|
|||||||||||||
|
December 31,
|
2015
|
2014
|
2015
|
2014
|
|||||||||||
|
Aggregate principal balance outstanding
|
$
|
4,681,671
|
|
$
|
2,836,729
|
|
$
|
4,697,169
|
|
$
|
2,851,837
|
|
|||
|
Net fair value adjustments
|
(125,590
|
)
|
(38,224
|
)
|
(125,586
|
)
|
(38,219
|
)
|
|||||||
|
Fair value
|
$
|
4,556,081
|
|
$
|
2,798,505
|
|
$
|
4,571,583
|
|
$
|
2,813,618
|
|
|||
|
Original term
|
12 - 60 months
|
12 - 60 months
|
|||||||||||||
|
Interest rates (fixed)
|
4.99% - 29.90%
|
5.79% - 29.90%
|
|||||||||||||
|
Maturity dates
|
≤ December 2020
|
≤ December 2019
|
|||||||||||||
At
December 31, 2015
and
2014
, loans that were
90 days
or more past due (including non-accrual loans) were as follows:
|
December 31, 2015
|
December 31, 2014
|
|||||||||||||||
|
>
90 days
past due
|
Non-accrual loans
|
>
90 days
past due
|
Non-accrual loans
|
|||||||||||||
|
Outstanding principal balance
|
$
|
30,094
|
|
$
|
4,513
|
|
$
|
19,790
|
|
$
|
1,373
|
|
||||
|
Net fair value adjustments
|
(25,312
|
)
|
(3,722
|
)
|
(18,825
|
)
|
(1,289
|
)
|
||||||||
|
Fair value
|
$
|
4,782
|
|
$
|
791
|
|
$
|
965
|
|
$
|
84
|
|
||||
|
# of loans (not in thousands)
|
2,606
|
|
382
|
|
1,797
|
|
125
|
|
||||||||
Loan Servicing Rights
At
December 31, 2015
, loans underlying loan servicing rights had a total outstanding principal balance of
$4.29 billion
, original terms between
3
and
84 months
, monthly payments with interest rates ranging from
2.99%
to
33.15%
, and maturity dates through
December 2022
. At
December 31, 2014
, loans underlying loan servicing rights had a total outstanding principal balance of
$1.87 billion
, original terms between
12
and
60 months
, monthly payments with fixed interest rates ranging from
5.90%
to
33.15%
, and maturity dates through December 2019.
6. Fair Value of Assets and Liabilities
For a description of the fair value hierarchy and the Company’s fair value methodologies, see
“Note 2 – Summary of Significant Accounting Policies.”
The Company did not transfer any assets or liabilities in or out of level 3 during the years ended
December 31, 2015
,
2014
, or
2013
.
94
LENDINGCLUB CORPORATION
Notes to Consolidated Financial Statements
(Tabular Amounts in Thousands, Except Share and Per Share Amounts, Ratios, or as Noted)
Financial Instruments Recorded at Fair Value
The following tables present the fair value hierarchy for assets and liabilities measured at fair value:
|
December 31, 2015
|
Level 1 Inputs
|
Level 2 Inputs
|
Level 3 Inputs
|
Balance at Fair Value
|
||||||||||||
|
Assets:
|
||||||||||||||||
|
Loans
|
$
|
—
|
|
$
|
—
|
|
$
|
4,556,081
|
|
$
|
4,556,081
|
|
||||
|
Securities available for sale:
|
||||||||||||||||
|
Corporate debt securities
|
—
|
|
215,751
|
|
—
|
|
215,751
|
|
||||||||
|
Asset-backed securities
|
—
|
|
54,409
|
|
—
|
|
54,409
|
|
||||||||
|
U.S. agency securities
|
—
|
|
16,578
|
|
—
|
|
16,578
|
|
||||||||
|
U.S. Treasury securities
|
3,485
|
|
3,485
|
|
||||||||||||
|
Other securities
|
—
|
|
6,988
|
|
—
|
|
6,988
|
|
||||||||
|
Total securities available for sale
|
—
|
|
297,211
|
|
—
|
|
297,211
|
|
||||||||
|
Servicing assets
|
—
|
|
—
|
|
10,250
|
|
10,250
|
|
||||||||
|
Total assets
|
$
|
—
|
|
$
|
297,211
|
|
$
|
4,566,331
|
|
$
|
4,863,542
|
|
||||
|
Liabilities:
|
||||||||||||||||
|
Notes and certificates
|
$
|
—
|
|
$
|
—
|
|
$
|
4,571,583
|
|
$
|
4,571,583
|
|
||||
|
Servicing liabilities
|
—
|
|
—
|
|
3,973
|
|
3,973
|
|
||||||||
|
Total liabilities
|
$
|
—
|
|
$
|
—
|
|
$
|
4,575,556
|
|
$
|
4,575,556
|
|
||||
|
December 31, 2014
|
Level 1 Inputs
|
Level 2 Inputs
|
Level 3 Inputs
|
Balance at
Fair Value
|
||||||||||||
|
Assets:
|
||||||||||||||||
|
Loans
|
$
|
—
|
|
$
|
—
|
|
$
|
2,798,505
|
|
$
|
2,798,505
|
|
||||
|
Servicing assets
|
—
|
|
—
|
|
2,181
|
|
2,181
|
|
||||||||
|
Total assets
|
$
|
—
|
|
$
|
—
|
|
$
|
2,800,686
|
|
$
|
2,800,686
|
|
||||
|
Liabilities:
|
||||||||||||||||
|
Notes and certificates
|
$
|
—
|
|
$
|
—
|
|
$
|
2,813,618
|
|
$
|
2,813,618
|
|
||||
|
Servicing liabilities
|
—
|
|
—
|
|
3,973
|
|
3,973
|
|
||||||||
|
Total liabilities
|
$
|
—
|
|
$
|
—
|
|
$
|
2,817,591
|
|
$
|
2,817,591
|
|
||||
As the Company’s loans and related notes and certificates, and loan servicing rights do not trade in an active market with readily observable prices, the Company uses significant unobservable inputs to measure the fair value of these assets and liabilities. Financial instruments are categorized in the Level 3 valuation hierarchy based on the significance of unobservable factors in the overall fair value measurement. These fair value estimates may also include observable, actively quoted components derived from external sources. As a result, the realized and unrealized gains and losses for assets and liabilities within the Level 3 category may include changes in fair value that were attributable to both observable and unobservable inputs.
95
LENDINGCLUB CORPORATION
Notes to Consolidated Financial Statements
(Tabular Amounts in Thousands, Except Share and Per Share Amounts, Ratios, or as Noted)
Significant Unobservable Inputs
The following tables present quantitative information about the significant unobservable inputs used for the Company’s Level 3 fair value measurements at
December 31, 2015
and
2014
:
|
December 31, 2015
|
|||||||||||
|
|
|
Range of Inputs
|
|||||||||
|
Financial Instrument
|
Unobservable Input
|
Minimum
|
Maximum
|
Weighted- Average
|
|||||||
|
Loans, notes and certificates
|
Discount rates
|
2.9
|
%
|
17.5
|
%
|
9.0
|
%
|
||||
|
Net cumulative expected loss rates
(1)
|
0.3
|
%
|
22.0
|
%
|
9.9
|
%
|
|||||
|
Cumulative prepayment rates
(1)
|
23.4
|
%
|
36.4
|
%
|
30.8
|
%
|
|||||
|
Servicing asset/liability
|
Discount rates
|
3.5
|
%
|
16.3
|
%
|
9.4
|
%
|
||||
|
Net cumulative expected loss rates
(1)
|
0.3
|
%
|
22.0
|
%
|
8.8
|
%
|
|||||
|
Cumulative prepayment rates
(1)
|
8.0
|
%
|
36.4
|
%
|
30.5
|
%
|
|||||
|
Base market servicing rates (% per annum on unpaid principal balance)
(2)
|
0.50
|
%
|
0.75
|
%
|
0.50
|
%
|
|||||
|
December 31, 2014
|
|||||||||||
|
Range of Inputs
|
|||||||||||
|
Financial Instrument
|
Unobservable Input
|
Minimum
|
Maximum
|
Weighted-
Average
|
|||||||
|
Loans, notes & certificates
|
Discount rates
|
5.2
|
%
|
17.4
|
%
|
10.1
|
%
|
||||
|
Net cumulative expected loss rates
(1)
|
0.3
|
%
|
22.0
|
%
|
10.0
|
%
|
|||||
|
Servicing asset/liability
|
Discount rates
|
5.3
|
%
|
23.7
|
%
|
10.7
|
%
|
||||
|
Net cumulative expected loss rates
(1)
|
0.3
|
%
|
22.0
|
%
|
10.2
|
%
|
|||||
|
Cumulative prepayment rates
(1)
|
16.5
|
%
|
26.7
|
%
|
20.0
|
%
|
|||||
|
Base market servicing rates (% per annum on unpaid principal balance)
(2)
|
0.50
|
%
|
0.70
|
%
|
0.50
|
%
|
|||||
(1)
Expressed as a percentage of the original principal balance of the loan, note or certificate.
(2)
Excludes ancillary fees charged to investors that would be passed on to a third-party servicer.
At
December 31, 2015
and
2014
, the discounted cash flow methodology used to estimate the note and certificates fair values used the same projected net cash flows as their related loans. As demonstrated by the table below, the fair value adjustments for loans were largely offset by the fair value adjustments of the notes and certificates due to the payment dependent design of the notes and certificates and because the principal balances of the loans were very close to the combined principal balances of the notes and certificates.
96
LENDINGCLUB CORPORATION
Notes to Consolidated Financial Statements
(Tabular Amounts in Thousands, Except Share and Per Share Amounts, Ratios, or as Noted)
The following table presents additional information about Level 3 loans, notes and certificates measured at fair value on a recurring basis for the years ended
December 31, 2015
and
2014
:
|
Loans
|
Notes and Certificates
|
|||||||||||||||||||||||
|
Outstanding Principal Balance
|
Valuation Adjustment
|
Fair Value
|
Outstanding Principal Balance
|
Valuation Adjustment
|
Fair Value
|
|||||||||||||||||||
|
Balance at December 31, 2013
|
$
|
1,849,042
|
|
$
|
(20,000
|
)
|
$
|
1,829,042
|
|
$
|
1,859,982
|
|
$
|
(19,992
|
)
|
$
|
1,839,990
|
|
||||||
|
Purchases of loans
|
3,886,427
|
|
—
|
|
3,886,427
|
|
—
|
|
—
|
|
—
|
|
||||||||||||
|
Issuances of notes and certificates
|
—
|
|
—
|
|
—
|
|
2,156,019
|
|
—
|
|
2,156,019
|
|
||||||||||||
|
Whole loan sales
|
(1,730,045
|
)
|
—
|
|
(1,730,045
|
)
|
—
|
|
—
|
|
—
|
|
||||||||||||
|
Principal payments
|
(1,054,357
|
)
|
—
|
|
(1,054,357
|
)
|
(1,049,982
|
)
|
—
|
|
(1,049,982
|
)
|
||||||||||||
|
Charge-offs
|
(114,338
|
)
|
114,338
|
|
—
|
|
(114,182
|
)
|
114,182
|
|
—
|
|
||||||||||||
|
Recoveries
|
—
|
|
(7,960
|
)
|
(7,960
|
)
|
—
|
|
(7,929
|
)
|
(7,929
|
)
|
||||||||||||
|
Change in fair value recorded in earnings
|
—
|
|
(124,602
|
)
|
(124,602
|
)
|
—
|
|
(124,480
|
)
|
(124,480
|
)
|
||||||||||||
|
Balance at December 31, 2014
|
$
|
2,836,729
|
|
$
|
(38,224
|
)
|
$
|
2,798,505
|
|
$
|
2,851,837
|
|
$
|
(38,219
|
)
|
$
|
2,813,618
|
|
||||||
|
Purchases of loans
|
7,224,176
|
|
—
|
|
7,224,176
|
|
—
|
|
—
|
|
—
|
|
||||||||||||
|
Issuances of notes and certificates
|
—
|
|
—
|
|
—
|
|
3,861,995
|
|
—
|
|
3,861,995
|
|
||||||||||||
|
Whole loan sales
|
(3,358,611
|
)
|
—
|
|
(3,358,611
|
)
|
—
|
|
—
|
|
—
|
|
||||||||||||
|
Principal payments
|
(1,804,719
|
)
|
—
|
|
(1,804,719
|
)
|
(1,800,859
|
)
|
—
|
|
(1,800,859
|
)
|
||||||||||||
|
Charge-offs
|
(215,904
|
)
|
215,904
|
|
—
|
|
(215,804
|
)
|
215,804
|
|
—
|
|
||||||||||||
|
Recoveries
|
—
|
|
(26,256
|
)
|
(26,256
|
)
|
—
|
|
(26,143
|
)
|
(26,143
|
)
|
||||||||||||
|
Change in fair value recorded in earnings
|
—
|
|
(277,014
|
)
|
(277,014
|
)
|
—
|
|
(277,028
|
)
|
(277,028
|
)
|
||||||||||||
|
Balance at December 31, 2015
|
$
|
4,681,671
|
|
$
|
(125,590
|
)
|
$
|
4,556,081
|
|
$
|
4,697,169
|
|
$
|
(125,586
|
)
|
$
|
4,571,583
|
|
||||||
The following table presents additional information about Level 3 servicing assets and liabilities measured at fair value on a recurring basis for the years ended
December 31, 2015
and
2014
:
|
Servicing Assets
|
Servicing Liabilities
|
|||||||
|
Fair value at December 31, 2013
|
$
|
534
|
|
$
|
(936
|
)
|
||
|
Issuances
(1)
|
2,152
|
|
(5,721
|
)
|
||||
|
Changes in fair value, included in servicing fees
|
(1,264
|
)
|
2,684
|
|
||||
|
Additions, included in deferred revenue
|
759
|
|
—
|
|
||||
|
Fair value at December 31, 2014
|
$
|
2,181
|
|
$
|
(3,973
|
)
|
||
|
Issuances
(1)
|
10,079
|
|
(5,194
|
)
|
||||
|
Changes in fair value, included in servicing fees
|
(3,803
|
)
|
5,194
|
|
||||
|
Additions, included in deferred revenue
|
1,793
|
|
—
|
|
||||
|
Fair value at December 31, 2015
|
$
|
10,250
|
|
$
|
(3,973
|
)
|
||
|
(1)
|
Represents the offsets to the gains or losses on sales of the related loans, recorded in other revenue (expense).
|
Significant Recurring Level 3 Fair Value Asset and Liability Input Sensitivity
Certain fair valuation adjustments recorded through earnings related to Level 3 instruments for the years ended
December 31, 2015
,
2014
and
2013
. Generally, changes in the net cumulative expected loss rates, cumulative prepayment rates, and discount rates will have an immaterial net impact on the fair value of loans, notes and certificates, and servicing assets and liabilities.
97
LENDINGCLUB CORPORATION
Notes to Consolidated Financial Statements
(Tabular Amounts in Thousands, Except Share and Per Share Amounts, Ratios, or as Noted)
Certain of these unobservable inputs may (in isolation) have either a directionally consistent or opposite impact on the fair value of the financial instrument for a given change in that input. When multiple inputs are used within the valuation techniques for loans, notes and certificates, or servicing assets and liabilities, a change in one input in a certain direction may be offset by an opposite change from another input.
A specific loan that is projected to have larger future default losses than previously estimated has lower expected future cash flows over its remaining life, which reduces its estimated fair value. Conversely, a specific loan that is projected to have smaller future default losses than previously estimated has increased expected future cash flows over its remaining life, which increases its fair value. Separately, an increase in expected prepayments will reduce the estimated fair value of a loan, whereas a decrease in expected prepayments will increase the estimated fair value of a loan.
The Company’s selection of the most representative base market servicing rates for servicing assets and servicing liabilities is inherently judgmental. The Company reviewed third-party servicing rates for its loans and loans in similar credit sectors, as well as a market servicing benchmarking analysis provided by a third-party valuation firm, and determined that base market servicing rates on its loans, ranging from
0.50%
to
0.75%
per annum of outstanding principal, are reasonable estimates as of
December 31, 2015
and
2014
. The table below shows the impact on the estimated fair value of servicing assets and liabilities, calculated using different base market servicing rate assumptions as of
December 31, 2015
and
2014
:
|
December 31, 2015
|
December 31, 2014
|
||||||||||||||
|
Servicing Assets
|
Servicing Liabilities
|
Servicing Assets
|
Servicing Liabilities
|
||||||||||||
|
Weighted-average base market servicing rate assumptions
|
0.50
|
%
|
0.50
|
%
|
0.50
|
%
|
0.50
|
%
|
|||||||
|
Change in fair value from:
|
|||||||||||||||
|
Servicing rate increase to 0.60%
|
$
|
(3,504
|
)
|
$
|
1,589
|
|
$
|
(915
|
)
|
$
|
1,416
|
|
|||
|
Servicing rate decrease to 0.40%
|
$
|
3,610
|
|
$
|
(1,483
|
)
|
$
|
965
|
|
$
|
(1,366
|
)
|
|||
Financial Instruments Not Recorded at Fair Value
The following tables present the fair value hierarchy for financial instruments not recorded at fair value:
|
December 31, 2015
|
Carrying Amount
|
Level 1 Inputs
|
Level 2 Inputs
|
Level 3 Inputs
|
Balance at
Fair Value
|
||||||||||||||
|
Assets:
|
|||||||||||||||||||
|
Cash and cash equivalents
|
$
|
623,531
|
|
$
|
—
|
|
$
|
623,531
|
|
$
|
—
|
|
$
|
623,531
|
|
||||
|
Restricted cash
|
80,733
|
|
—
|
|
80,733
|
|
—
|
|
80,733
|
|
|||||||||
|
Deposits
|
871
|
|
—
|
|
871
|
|
—
|
|
871
|
|
|||||||||
|
Total assets
|
$
|
705,135
|
|
$
|
—
|
|
$
|
705,135
|
|
$
|
—
|
|
$
|
705,135
|
|
||||
|
Liabilities:
|
|||||||||||||||||||
|
Accounts payable
|
$
|
5,542
|
|
$
|
—
|
|
$
|
5,542
|
|
$
|
—
|
|
$
|
5,542
|
|
||||
|
Payables to investors
|
73,162
|
|
—
|
|
73,162
|
|
—
|
|
73,162
|
|
|||||||||
|
Total liabilities
|
$
|
78,704
|
|
$
|
—
|
|
$
|
78,704
|
|
$
|
—
|
|
$
|
78,704
|
|
||||
98
LENDINGCLUB CORPORATION
Notes to Consolidated Financial Statements
(Tabular Amounts in Thousands, Except Share and Per Share Amounts, Ratios, or as Noted)
|
December 31, 2014
|
Carrying Amount
|
Level 1 Inputs
|
Level 2 Inputs
|
Level 3 Inputs
|
Balance at
Fair Value
|
||||||||||||||
|
Assets:
|
|||||||||||||||||||
|
Cash and cash equivalents
|
$
|
869,780
|
|
$
|
—
|
|
$
|
869,780
|
|
$
|
—
|
|
$
|
869,780
|
|
||||
|
Restricted cash
|
46,763
|
|
—
|
|
46,763
|
|
—
|
|
46,763
|
|
|||||||||
|
Deposits
|
657
|
|
—
|
|
657
|
|
—
|
|
657
|
|
|||||||||
|
Total assets
|
$
|
917,200
|
|
$
|
—
|
|
$
|
917,200
|
|
$
|
—
|
|
$
|
917,200
|
|
||||
|
Liabilities:
|
|||||||||||||||||||
|
Accounts payable
|
$
|
5,892
|
|
$
|
—
|
|
$
|
5,892
|
|
$
|
—
|
|
$
|
5,892
|
|
||||
|
Payables to investors
|
38,741
|
|
—
|
|
38,741
|
|
—
|
|
38,741
|
|
|||||||||
|
Total liabilities
|
$
|
44,633
|
|
$
|
—
|
|
$
|
44,633
|
|
$
|
—
|
|
$
|
44,633
|
|
||||
7. Property, Equipment and Software, Net
Property, equipment and software, net, consist of the following:
|
December 31,
|
2015
|
2014
|
|||||
|
Internally developed software
|
$
|
40,709
|
|
$
|
16,023
|
|
|
|
Computer equipment
|
14,076
|
|
7,929
|
|
|||
|
Leasehold improvements
|
11,559
|
|
4,802
|
|
|||
|
Purchased software
|
5,336
|
|
3,326
|
|
|||
|
Furniture and fixtures
|
5,086
|
|
2,405
|
|
|||
|
Construction in progress
|
2,870
|
|
549
|
|
|||
|
Total property, equipment and software
|
79,636
|
|
35,034
|
|
|||
|
Accumulated depreciation and amortization
|
(23,706
|
)
|
(7,983
|
)
|
|||
|
Total property, equipment and software, net
|
$
|
55,930
|
|
$
|
27,051
|
|
|
Depreciation and amortization expense on property, equipment and software was
$16.2 million
,
$6.4 million
and
$1.7 million
for the years ended
December 31, 2015
,
2014
and
2013
, respectively. The Company recorded impairment expense of
$0.6 million
and
$0.5 million
, included in other general and administrative expense in the consolidated statement of operations, for the years ended December 31, 2015 and 2014, respectively. Impairment expense for the year ended December 31, 2013 was not material.
99
LENDINGCLUB CORPORATION
Notes to Consolidated Financial Statements
(Tabular Amounts in Thousands, Except Share and Per Share Amounts, Ratios, or as Noted)
8. Other Assets
Other assets consist of the following:
|
December 31,
|
2015
|
2014
|
|||||
|
Prepaid expenses
|
$
|
16,283
|
|
$
|
6,807
|
|
|
|
Loan servicing assets, at fair value
|
10,250
|
|
2,181
|
|
|||
|
Accounts receivable
|
4,976
|
|
1,744
|
|
|||
|
Deferred acquisition compensation
|
1,521
|
|
2,695
|
|
|||
|
Deferred financing cost
|
1,296
|
|
—
|
|
|||
|
Receivable from investors
|
1,117
|
|
155
|
|
|||
|
Deposits
|
871
|
|
657
|
|
|||
|
Tenant improvement receivable
|
778
|
|
—
|
|
|||
|
Due from related parties
(1)
|
655
|
|
467
|
|
|||
|
Other
|
666
|
|
93
|
|
|||
|
Total other assets
|
$
|
38,413
|
|
$
|
14,799
|
|
|
|
(1)
|
Represents management fees due to LCA from certain private funds for which LCA acts as the general partner.
|
9. Intangible Assets and Goodwill
Intangible Assets
Intangible assets consist of the following:
|
December 31, 2015
|
Gross
Carrying
Value
|
Accumulated
Amortization
|
Net
Carrying
Value
|
||||||||
|
Customer relationships
|
$
|
39,500
|
|
$
|
(8,702
|
)
|
$
|
30,798
|
|
||
|
Technology
|
400
|
|
(227
|
)
|
173
|
|
|||||
|
Brand name
|
300
|
|
(300
|
)
|
—
|
|
|||||
|
Total intangible assets
|
$
|
40,200
|
|
$
|
(9,229
|
)
|
$
|
30,971
|
|
||
|
December 31, 2014
|
Gross
Carrying
Value
|
Accumulated
Amortization
|
Net
Carrying
Value
|
||||||||
|
Customer relationships
|
$
|
39,500
|
|
$
|
(3,700
|
)
|
$
|
35,800
|
|
||
|
Technology
|
400
|
|
(93
|
)
|
307
|
|
|||||
|
Brand name
|
300
|
|
(105
|
)
|
195
|
|
|||||
|
Total intangible assets
|
$
|
40,200
|
|
$
|
(3,898
|
)
|
$
|
36,302
|
|
||
The customer relationship intangible assets are amortized on an accelerated basis over a
14
year period. The technology and brand name intangible assets are amortized on a straight line basis over
three
years and
one year
, respectively. The weighted-average amortization period for total intangibles is
13.8 years
. Amortization expense associated with intangible assets for the years ended
December 31, 2015
and
December 31, 2014
was
$5.3 million
and
$3.9 million
, respectively. The Company did not have any intangible assets at
December 31, 2013
.
100
LENDINGCLUB CORPORATION
Notes to Consolidated Financial Statements
(Tabular Amounts in Thousands, Except Share and Per Share Amounts, Ratios, or as Noted)
The expected future amortization expense for intangible assets as of
December 31, 2015
, is as follows:
|
2016
|
$
|
4,757
|
|
|
2017
|
4,287
|
|
|
|
2018
|
3,872
|
|
|
|
2019
|
3,498
|
|
|
|
2020
|
3,122
|
|
|
|
Thereafter
|
11,435
|
|
|
|
Total
|
$
|
30,971
|
|
Goodwill
Goodwill consists of the following:
|
Balance at December 31, 2013
|
$
|
—
|
|
|
Goodwill acquired
|
72,592
|
|
|
|
Balance at December 31, 2014
|
72,592
|
|
|
|
Other changes in goodwill
|
91
|
|
|
|
Balance at December 31, 2015
|
$
|
72,683
|
|
During the year ended
December 31, 2014
, the Company recorded goodwill in conjunction with the acquisition of Springstone. The Company did not record any goodwill impairment expense for the years ended
December 31, 2015
,
2014
or
2013
.
10. Accrued Expenses and Other Liabilities
Accrued expenses and other liabilities consist of the following:
|
December 31,
|
2015
|
2014
|
|||||
|
Accrued compensation
|
$
|
28,780
|
|
$
|
13,659
|
|
|
|
Accrued expenses
|
14,054
|
|
6,220
|
|
|||
|
Deferred rent
|
4,615
|
|
1,377
|
|
|||
|
Loan servicing liabilities, at fair value
|
3,973
|
|
3,973
|
|
|||
|
Deferred tax liability
|
3,446
|
|
1,332
|
|
|||
|
Deferred revenue
|
2,551
|
|
759
|
|
|||
|
Payable to issuing bank
|
955
|
|
267
|
|
|||
|
Contingent liabilities
|
700
|
|
1,995
|
|
|||
|
Transaction fee refund reserve
|
578
|
|
828
|
|
|||
|
Early stock option exercise and other equity-related liabilities
|
83
|
|
392
|
|
|||
|
Other
|
1,508
|
|
818
|
|
|||
|
Total accrued expenses and other liabilities
|
$
|
61,243
|
|
$
|
31,620
|
|
|
101
LENDINGCLUB CORPORATION
Notes to Consolidated Financial Statements
(Tabular Amounts in Thousands, Except Share and Per Share Amounts, Ratios, or as Noted)
11. Accumulated Other Comprehensive Loss
Accumulated other comprehensive loss represents other cumulative gains and losses that are not reflected in earnings. The components of other comprehensive loss were as follows:
|
Year Ended December 31,
|
2015
|
||||||||||
|
Before Tax
|
Tax Effect
|
Net of Tax
|
|||||||||
|
Change in net unrealized losses on securities available for sale
|
$
|
(1,671
|
)
|
$
|
—
|
|
$
|
(1,671
|
)
|
||
|
Other comprehensive loss
|
$
|
(1,671
|
)
|
$
|
—
|
|
$
|
(1,671
|
)
|
||
Accumulated other comprehensive loss balances were as follows:
|
Total
Accumulated Other Comprehensive Loss
|
|||
|
Balance at December 31, 2014
|
$
|
—
|
|
|
Change in net unrealized losses on securities available for sale
|
(1,671
|
)
|
|
|
Balance at December 31, 2015
|
$
|
(1,671
|
)
|
The Company did not have any items of other comprehensive income (loss) during the years ended
December 31, 2014
or
2013
.
12. Debt
Revolving Credit Facility
On
December 17, 2015
, the Company entered into a credit and guaranty agreement with several lenders for an aggregate
$120 million
unsecured revolving credit facility (Credit Facility). In connection with the credit agreement, the Company entered into a pledge and security agreement with Morgan Stanley Senior Funding, Inc., as collateral agent.
Proceeds of loans made under the Credit Facility may be borrowed, repaid and reborrowed until
December 17, 2020
. Repayment of any outstanding proceeds are payable on
December 17, 2020
, but may be prepaid without penalty.
Borrowings under the Credit Facility bear interest, at the Company’s option, at an annual rate based on the one-year LIBOR rate plus a spread of
1.75%
to
2.00%
, which is fixed for a Company-selected interest period of one, two, three, six or 12 months, or a an alternative base rate (which is tied to either the prime rate, federal funds effective rate, or the adjusted eurocurrency rate, as defined in the credit agreement). Base rate borrowings may be prepaid at any time without penalty, however pre-payment of LIBOR-based borrowings before the end of the selected interest period may result in the Company incurring expense to compensate the lenders for their funding costs through the end of the interest period. Interest is payable quarterly. Additionally, the Company is required to pay a quarterly commitment fee to the lenders of between
0.25%
and
0.375%
per annum, depending on the Company’s total net leverage ratio, on the average undrawn portion available under the revolving loan facility
.
The Credit Facility and pledge and security agreement contain certain covenants applicable to the Company, including restrictions on the Company’s ability to pay dividends, incur indebtedness, pledge our assets, merge or consolidate, make investments, and enter into certain affiliate transactions. The Credit Facility also requires the Company to maintain a maximum total net leverage ratio (defined as the ratio of net debt to Adjusted EBITDA, on a consolidated basis for the four most recent Fiscal Quarter periods) of
4.00
:1.00 initially, and which decreases over
102
LENDINGCLUB CORPORATION
Notes to Consolidated Financial Statements
(Tabular Amounts in Thousands, Except Share and Per Share Amounts, Ratios, or as Noted)
the term of the Credit Facility to
3.00
:1.00 on and after June 30, 2018 (on a consolidated basis). As of December 31, 2015, the total net leverage ratio, calculated as defined in the Credit Facility, was
0%
.
The Company did not have any loans outstanding under the Credit Facility during the year ended December 31, 2015. The Company incurred
$1.3 million
of capitalized debt issuance costs, which will be recognized as interest expense through
December 17, 2020
.
Term Loan
On
April 16, 2014
, the Company entered into a credit and guaranty agreement with several lenders for an aggregate
$50.0 million
Term Loan. In connection with the credit agreement, the Company entered into a pledge and security agreement with Morgan Stanley Senior Funding, Inc., as collateral agent. The Term Loan was outstanding for
245
days in 2014 and was fully repaid and extinguished on
December 17, 2014
. For the year ended December 31, 2014, the Company incurred interest expense on the Term Loan of
$2.3 million
, which included expense related to writing off capitalized debt issuance costs. The Company did not incur any interest expense on the Term Loan in 2015. The weighted-average interest rate on the Term Loan was
2.59%
for the period the loan was outstanding in 2014.
13. Stockholders’ Equity
Initial Public Offering
In December 2014, the Company closed its IPO of
66,700,000
shares of its common stock, which included shares registered to cover an option to purchase additional shares that it granted to the underwriters of the IPO and selling stockholders. The public offering price of the shares sold in the offering was
$15.00
per share. The Company did not receive any proceeds from the sales of shares by the selling stockholders. The total gross proceeds from the offering were
$1.0 billion
. After deducting underwriting discounts and commissions, offering expenses and proceeds to the selling stockholders, the aggregate net proceeds received by the Company totaled approximately
$827.7 million
.
Convertible Preferred Stock
As of December 31, 2013, the Company had the following shares of preferred stock authorized and outstanding:
|
Designated
Shares
|
Issued and
Outstanding Shares
|
Aggregate
Liquidation
Preference
|
Amount
|
||||||||||
|
Series A
|
68,025,100
|
|
66,100,340
|
|
$
|
17,599
|
|
$
|
17,402
|
|
|||
|
Series B
|
65,642,104
|
|
65,577,300
|
|
12,268
|
|
12,164
|
|
|||||
|
Series C
|
62,486,436
|
|
62,486,436
|
|
24,490
|
|
24,388
|
|
|||||
|
Series D
|
36,030,712
|
|
36,030,712
|
|
32,044
|
|
31,943
|
|
|||||
|
Series E
|
14,285,712
|
|
10,000,000
|
|
17,500
|
|
17,347
|
|
|||||
|
Total convertible preferred stock
|
246,470,064
|
|
240,194,788
|
|
$
|
103,901
|
|
$
|
103,244
|
|
|||
In connection with the Springstone acquisition in April, 2014, the Company sold an aggregate of
6,390,556
shares of its Series F convertible preferred stock, par value
$0.01
per share (Financing Shares) for aggregate gross proceeds of approximately
$65.0 million
, pursuant to a Series F Preferred Stock Purchase Agreement. The Company sold the Financing Shares pursuant to an exemption from registration under Section 4(a)(2) of the Securities Act of 1933, as amended; all investors in the financing were accredited investors and the Company made no general solicitation for the sale of the Financing Shares. The Financing Shares were convertible into shares of common stock, par value
$0.01
per share, on a
one
-for-one basis, as adjusted from time to time pursuant to the anti-dilution provisions of the Company’s Restated Certificate of Incorporation.
103
LENDINGCLUB CORPORATION
Notes to Consolidated Financial Statements
(Tabular Amounts in Thousands, Except Share and Per Share Amounts, Ratios, or as Noted)
In connection with the sale of Series F convertible preferred stock in April 2014, the Company filed a Restated Certificate of Incorporation with the State of Delaware, which increased the total number of shares that it was authorized to issue from
606,470,064
shares to
622,614,174
. Of the
622,614,174
shares authorized,
372,000,000
shares were designated as common stock and
250,614,174
shares were designated as preferred stock.
Immediately prior to the completion of the Company’s IPO, all shares of its outstanding convertible preferred stock automatically converted, on a
one
-for-
one
basis, into
249,601,435
shares of the Company’s common stock. All shares of authorized convertible preferred stock also automatically converted, on a
one
-for-
one
basis, into
250,614,174
authorized shares of the Company’s common stock.
On December 16, 2014, the Company filed a Restated Certificate of Incorporation with the State of Delaware, which increased the total number of shares that it was authorized to issue from
622,614,174
shares to
910,000,000
. Of the
910,000,000
shares authorized,
900,000,000
shares were designated as common stock and
10,000,000
shares were designated as preferred stock.
Common Stock Reserved for Future Issuance
As of
December 31, 2015
and
2014
, the Company had shares of common stock reserved for future issuance as follows:
|
December 31,
|
2015
|
2014
|
|||
|
Options and unvested RSUs outstanding
|
52,652,310
|
|
57,386,829
|
|
|
|
Available for future stock option and RSU grants
|
33,560,939
|
|
36,561,469
|
|
|
|
Available for ESPP
|
2,589,991
|
|
3,000,000
|
|
|
|
Total reserved for future issuance
|
88,803,240
|
|
96,948,298
|
|
|
14. Employee Incentive and Retirement Plans
The Company’s equity incentive plans provide for granting stock options and RSUs to employees, consultants, officers and directors. In addition, the Company offers a retirement plan and an ESPP to eligible employees.
Stock-based compensation expense was as follows for the periods presented:
|
Year Ended December 31,
|
2015
|
2014
|
2013
|
||||||||
|
Stock options
|
$
|
30,717
|
|
$
|
27,100
|
|
$
|
6,283
|
|
||
|
RSUs
|
1,904
|
|
—
|
|
—
|
|
|||||
|
ESPP
|
9,185
|
|
104
|
|
—
|
|
|||||
|
Stock issued related to acquisition
|
9,416
|
|
9,946
|
|
—
|
|
|||||
|
Total stock-based compensation expense
|
$
|
51,222
|
|
$
|
37,150
|
|
$
|
6,283
|
|
||
104
LENDINGCLUB CORPORATION
Notes to Consolidated Financial Statements
(Tabular Amounts in Thousands, Except Share and Per Share Amounts, Ratios, or as Noted)
The following table presents the Company’s stock-based compensation expense recorded in the consolidated statements of operations:
|
Year Ended December 31,
|
2015
|
2014
(1)
|
2013
(1)
|
||||||||
|
Sales and marketing
|
$
|
7,250
|
|
$
|
5,476
|
|
$
|
1,147
|
|
||
|
Origination and servicing
|
2,735
|
|
1,653
|
|
424
|
|
|||||
|
Engineering and product development
|
11,335
|
|
6,445
|
|
2,336
|
|
|||||
|
Other general and administrative
|
29,902
|
|
23,576
|
|
2,376
|
|
|||||
|
Total stock-based compensation expense
|
51,222
|
|
37,150
|
|
6,283
|
|
|||||
|
(1)
|
Prior period amounts have been reclassified to conform to the current period presentation. See “
|
The Company capitalized
$4.4 million
,
$1.9 million
and
$0.2 million
of stock-based compensation expense associated with developing software for internal use during the years ended
December 31, 2015
,
2014
and
2013
, respectively. In addition, the Company recognized
$0.7 million
tax benefits from exercised stock options and RSUs in
2015
. There was no net income tax benefit recognized during
2014
or
2013
relating to stock-based compensation expense and
no
tax benefits have been realized from exercised stock options and RSUs due to the full valuation allowance.
Stock-based compensation expense included
$0.3 million
and
$3.0 million
for the accelerated vesting of stock options that were accounted for as stock option modifications for the years ended
December 31, 2015
and
2014
, respectively. There was
no
expense recognized for the accelerated vesting of stock options in the year ended
December 31, 2013
.
Equity Incentive Plans
The Company has
two
equity incentive plans: the 2007 Stock Incentive Plan (2007 Plan) and the 2014 Equity Incentive Plan (2014 Plan). Upon the Company’s IPO in 2014, the 2007 Plan was terminated and all shares that remained available for future issuance under the 2007 Plan at that time were transferred to the 2014 Plan. As of
December 31, 2015
,
47,090,982
options to purchase common stock granted under the 2007 Plan remain outstanding. As of
December 31, 2015
, the total number of shares available for future grants under the 2014 Plan was
33,560,939
shares, including shares transferred from the 2007 Plan.
105
LENDINGCLUB CORPORATION
Notes to Consolidated Financial Statements
(Tabular Amounts in Thousands, Except Share and Per Share Amounts, Ratios, or as Noted)
Stock Options
The following table summarizes the activities for the Company’s stock options during
2015
:
|
Number of
Options
|
Weighted-
Average
Exercise
Price Per
Share
|
Weighted-Average
Remaining
Contractual Life (in years)
|
Aggregate
Intrinsic
Value
(1)
|
|||||||||
|
Outstanding at December 31, 2014
|
57,386,829
|
|
$
|
3.15
|
|
|||||||
|
Granted
|
1,164,929
|
|
$
|
20.00
|
|
|||||||
|
Exercised
|
(7,579,324
|
)
|
$
|
1.57
|
|
|||||||
|
Forfeited/Expired
|
(2,763,523
|
)
|
$
|
6.57
|
|
|||||||
|
Outstanding at December 31, 2015
|
48,208,911
|
|
$
|
3.60
|
|
7.1
|
$
|
370,388
|
|
|||
|
Vested and expected to vest at December 31, 2015
|
47,784,071
|
|
$
|
3.58
|
|
6.9
|
$
|
368,127
|
|
|||
|
Exercisable at December 31, 2015
|
27,290,693
|
|
$
|
1.93
|
|
6.3
|
$
|
250,057
|
|
|||
|
(1)
|
The aggregate intrinsic value is calculated as the difference between the exercise price of the underlying awards and the Company’s closing stock price of
$11.05
as reported on the New York Stock Exchange on
December 31, 2015
.
|
For the year ended
December 31, 2015
, the Company granted service-based stock options to purchase
1,164,929
shares of common stock with a weighted average exercise price of
$20.00
per share, a weighted average grant date fair value of
$9.80
per option share and an aggregate estimated fair value of
$11.4 million
.
For the year ended
December 31, 2014
, the Company granted service-based stock options to purchase
22,081,243
shares of common stock with a weighted average exercise price of
$6.74
per option share, a weighted average grant date fair value of
$4.62
per share and an aggregate estimated fair value of
$102.1 million
.
For the year ended
December 31, 2013
, the Company granted service-based stock options to purchase
12,707,000
shares of common stock with a weighted average exercise price of
$2.44
per option share, a weighted average grant date fair value of
$2.71
per share and an aggregate estimated fair value of
$34.4 million
.
The aggregate intrinsic value of options exercised was
$103.5 million
,
$48.6 million
and
$26.2 million
for the years ended
December 31, 2015
,
2014
and
2013
, respectively. The total fair value of stock options vested for the years ended
December 31, 2015
,
2014
and
2013
was
$36.8 million
,
$19.6 million
and
$4.5 million
, respectively.
As of
December 31, 2015
, the total unrecognized compensation cost, net of forfeitures, related to outstanding stock options was
$78.3 million
, which is expected to be recognized over the next
2.4 years
.
The Company uses the Black-Scholes option pricing model to estimate the fair value of stock options granted with the following assumptions:
|
Year Ended December 31,
|
2015
|
2014
|
2013
|
|||||
|
Expected dividend yield
|
—
|
|
—
|
|
—
|
|
||
|
Weighted-average assumed stock price volatility
|
49.4
|
%
|
53.5
|
%
|
59.1
|
%
|
||
|
Weighted-average risk-free interest rate
|
1.61
|
%
|
1.88
|
%
|
1.46
|
%
|
||
|
Weighted-average expected life (in years)
|
6.25
|
|
6.35
|
|
6.30
|
|
||
106
LENDINGCLUB CORPORATION
Notes to Consolidated Financial Statements
(Tabular Amounts in Thousands, Except Share and Per Share Amounts, Ratios, or as Noted)
Restricted Stock Units
During the first quarter of 2015, the Company began issuing RSUs to certain employees, officers and directors. The following table summarizes the activities for the Company’s RSUs during the year of 2015:
|
Number
of Units
|
Weighted-
Average
Grant Date
Fair Value
|
|||||
|
Unvested at December 31, 2014
|
—
|
|
$
|
—
|
|
|
|
Granted
|
4,807,875
|
|
$
|
15.52
|
|
|
|
Vested
|
(155,725
|
)
|
$
|
19.92
|
|
|
|
Forfeited/expired
|
(208,751
|
)
|
$
|
18.44
|
|
|
|
Unvested at December 31, 2015
|
4,443,399
|
|
$
|
15.23
|
|
|
|
Expected to vest after December 31, 2015
|
4,251,011
|
|
$
|
15.25
|
|
|
As of
December 31, 2015
, the Company granted
4,807,875
RSUs with an aggregate fair value of
$74.6 million
.
As of
December 31, 2015
, there was
$61.6 million
of unrecognized compensation cost, net of forfeitures, related to unvested RSUs, which is expected to be recognized over the next
3.5 years
.
Employee Stock Purchase Plan
The Company’s ESPP became effective on
December 11, 2014
. The ESPP allows eligible employees to purchase shares of the Company’s common stock at a discount through payroll deductions, subject to plan limitations. Payroll deductions are accumulated during
six
-month offering periods. The purchase price for each share of common stock is
85%
of the lower of the fair market value of the common stock on the first business day of the offering period or on the last business day of the offering period. As of
December 31, 2015
, the Company’s employees purchased
410,009
shares of common stock at an average exercise price of
$12.42
. The Company did not purchase any shares under the ESPP during the year ended
December 31, 2014
. As of
December 31, 2015
and 2014, a total of
2,589,991
and
3,000,000
shares of common stock were reserved for issuance under the ESPP, respectively.
The fair value of stock purchase rights granted to employees under the ESPP is measured under the ESPP on the grant date using the Black-Scholes option pricing model. The Company used the following assumptions in estimating the fair value of grants under the ESPP, which are derived using the same methodology applied to stock option assumptions:
|
Year Ended December 31,
|
2015
|
2014
|
|||
|
Expected dividend yield
|
—
|
|
—
|
|
|
|
Weighted-average assumed stock price volatility
|
43.7
|
%
|
48.2
|
%
|
|
|
Weighted-average risk-free rate
|
0.23
|
%
|
0.09
|
%
|
|
|
Weighted-average expected life (years)
|
0.46
|
|
0.50
|
|
|
Stock Issued Related to Acquisition
As part of the Springstone acquisition, the sellers received shares of the Company’s Series F convertible preferred stock having an aggregate value of
$25.0 million
(Share Consideration).
$22.1 million
of the Share Consideration is subject to certain vesting and forfeiture conditions over a
three
-year period for key continuing employees. This is accounted for as a compensation agreement and expensed over the
three
-year vesting period. In conjunction with the conversion of preferred stock upon the IPO, these preferred shares were converted into common shares.
107
LENDINGCLUB CORPORATION
Notes to Consolidated Financial Statements
(Tabular Amounts in Thousands, Except Share and Per Share Amounts, Ratios, or as Noted)
Retirement Plan
Upon completing
90
days of service, employees may participate in the Company’s qualified retirement plan that is governed by section 401(k) of the IRS Code. Participants may elect to contribute a portion of their annual compensation up to the maximum limit allowed by federal tax law. In the second quarter of 2014, the Company approved an employer match of up to
3%
of an employee’s eligible compensation with a maximum annual match of
$5,000
per employee. The total expense for the employer match for the years ended
December 31, 2015
and
2014
was
$2.1 million
and
$0.9 million
, respectively.
15. Income Taxes
Income (loss) before income tax expense was
$(2.2) million
,
$(31.5) million
and
$7.3 million
for the years ended
December 31, 2015
,
2014
and
2013
, respectively. Income tax expense consisted of the following for the periods shown below:
|
Year Ended December 31,
|
2015
|
2014
|
2013
|
||||||||
|
Current:
|
|||||||||||
|
Federal
|
$
|
—
|
|
$
|
—
|
|
$
|
—
|
|
||
|
State
|
720
|
|
56
|
|
—
|
|
|||||
|
Total current tax expense
|
$
|
720
|
|
$
|
56
|
|
$
|
—
|
|
||
|
Deferred:
|
|||||||||||
|
Federal
|
$
|
1,405
|
|
$
|
1,185
|
|
$
|
—
|
|
||
|
State
|
708
|
|
149
|
|
—
|
|
|||||
|
Total deferred tax expense
|
$
|
2,113
|
|
$
|
1,334
|
|
$
|
—
|
|
||
|
Income tax expense
|
$
|
2,833
|
|
$
|
1,390
|
|
$
|
—
|
|
||
Income tax expense for the year ended
December 31, 2015
, was primarily attributable to the amortization of tax deductible goodwill from the acquisition of Springstone, which gave rise to an indefinite-lived deferred tax liability, and the realization of excess tax benefits related to stock-based compensation. For the year ended
December 31, 2014
, income tax expense was primarily related to the amortization of tax deductible goodwill from the acquisition of Springstone. For the year ended
December 31, 2013
, there were no income taxes recorded related to pre-tax income due to the availability of deferred tax assets subject to a full valuation allowance to offset current year income.
A reconciliation of the income taxes expected at the statutory federal income tax rate and the income tax expense for the years ended
December 31, 2015
,
2014
and
2013
, is as follows:
|
Year Ended December 31,
|
2015
|
2014
|
2013
|
||||||||
|
Tax at federal statutory rate
|
$
|
(738
|
)
|
$
|
(10,711
|
)
|
$
|
2,485
|
|
||
|
State tax, net of federal tax benefit
|
1,277
|
|
98
|
|
563
|
|
|||||
|
Stock-based compensation expense
|
549
|
|
5,040
|
|
(593
|
)
|
|||||
|
Research and development tax credits
|
(1,068
|
)
|
—
|
|
(459
|
)
|
|||||
|
Change in valuation allowance
|
2,686
|
|
6,858
|
|
(2,534
|
)
|
|||||
|
Change in unrecognized tax benefit
|
(62
|
)
|
—
|
|
518
|
|
|||||
|
Other
|
189
|
|
105
|
|
20
|
|
|||||
|
Income tax expense
|
$
|
2,833
|
|
$
|
1,390
|
|
$
|
—
|
|
||
108
LENDINGCLUB CORPORATION
Notes to Consolidated Financial Statements
(Tabular Amounts in Thousands, Except Share and Per Share Amounts, Ratios, or as Noted)
The significant components of the Company’s deferred tax assets and liabilities as of
December 31, 2015
and
2014
were:
|
December 31,
|
2015
|
2014
|
|||||
|
Deferred tax assets:
|
|||||||
|
Stock-based compensation
|
$
|
19,696
|
|
$
|
8,491
|
|
|
|
Reserves and accruals
|
11,506
|
|
6,249
|
|
|||
|
Net operating loss carryforwards
|
5,621
|
|
13,510
|
|
|||
|
Intangible assets
|
2,693
|
|
1,161
|
|
|||
|
Tax credit carryforwards
|
1,810
|
|
552
|
|
|||
|
Other
|
697
|
|
10
|
|
|||
|
Servicing fees
|
—
|
|
1,428
|
|
|||
|
Total deferred tax assets
|
42,023
|
|
31,401
|
|
|||
|
Valuation allowance
|
(25,348
|
)
|
(26,788
|
)
|
|||
|
Deferred tax assets – net of valuation allowance
|
$
|
16,675
|
|
$
|
4,613
|
|
|
|
Deferred tax liabilities:
|
|||||||
|
Internally developed software
|
$
|
(11,353
|
)
|
$
|
(2,967
|
)
|
|
|
Depreciation and amortization
|
(4,089
|
)
|
(1,798
|
)
|
|||
|
Goodwill
|
(3,163
|
)
|
(1,180
|
)
|
|||
|
Servicing fees
|
(1,516
|
)
|
—
|
|
|||
|
Total deferred tax liabilities
|
$
|
(20,121
|
)
|
$
|
(5,945
|
)
|
|
|
Deferred tax (liability) asset – net
|
$
|
(3,446
|
)
|
$
|
(1,332
|
)
|
|
The table of deferred tax assets and liabilities does not include certain deferred tax assets as of
December 31, 2015
and
2014
, related to tax deductions for equity-based compensation greater than the compensation recognized for financial reporting. Stockholders’ equity is estimated to increase by approximately
$40 million
, if and when such deferred tax assets are ultimately realized. The “with-and-without” approach, excluding the measurement of any indirect effects, is used when determining when excess tax benefits have been realized.
The table of deferred tax assets and liabilities as of December 31, 2014 has been restated to remove deferred tax assets of approximately
$14.0 million
and a corresponding valuation allowance of approximately
$14.0 million
attributable to excess tax deductions for equity-based compensation greater than the compensation recognized for financial reporting. These excess tax benefits that were previously included in the balance of net operating loss carryforwards in the table of deferred tax assets and liabilities should have been excluded as they had not met the criteria to be treated as deferred tax assets. Since the Company recorded a valuation allowance for the entire balance of deferred tax assets, this disclosure correction has no net effect on the Company’s financial condition, results of operations, or cash flows as of and for the year ended
December 31, 2014
. The Company does not believe correction of this amount is material to the financial statements as a whole.
The Company continues to recognize a full valuation allowance against net deferred tax assets, excluding the deferred tax liability for indefinite-lived intangibles. This determination was based on the assessment of the available positive and negative evidence to estimate if sufficient future taxable income will be generated to utilize the existing deferred tax assets. As of
December 31, 2015
and
2014
, the valuation allowance was
$25.3 million
and
$26.8 million
, respectively.
As of
December 31, 2015
, the Company had federal and state net operating loss (NOL) carryforwards of approximately
$109.9 million
and
$77.4 million
, respectively, to offset future taxable income. The federal and state
109
LENDINGCLUB CORPORATION
Notes to Consolidated Financial Statements
(Tabular Amounts in Thousands, Except Share and Per Share Amounts, Ratios, or as Noted)
NOL carryforwards will expire beginning in
2025
and
2028
, respectively. Additionally, as of
December 31, 2015
, the Company had federal and state tax credit carryforwards of
$0.8 million
and
$2.1 million
, respectively. The federal tax credit carryforwards will expire beginning in
2025
and the state tax credits will expire beginning in
2020
.
In general, a corporation’s ability to utilize its NOL and research and development carryforwards may be substantially limited due to the ownership change limitations as required by Section 382 and 383 of the Internal Revenue Code of 1986, as amended (Code), as well as similar state provisions. The federal and state Section 382 and 383 limitations may limit the use of a portion of the Company’s domestic NOL and tax credit carryforwards. Further, a portion of the carryforwards may expire before being applied to reduce future income tax liabilities.
A reconciliation of the beginning and ending balance of total unrecognized tax benefits for the years ended
December 31, 2015
,
2014
and
2013
, is as follows:
|
Year Ended December 31,
|
2015
|
2014
|
2013
|
||||||||
|
Beginning balance
|
$
|
491
|
|
$
|
1,080
|
|
$
|
367
|
|
||
|
Gross increase (decrease) for tax positions related to prior years
|
(310
|
)
|
(589
|
)
|
523
|
|
|||||
|
Gross increase for tax positions related to the current year
|
248
|
|
—
|
|
190
|
|
|||||
|
Ending balance
|
$
|
429
|
|
$
|
491
|
|
$
|
1,080
|
|
||
If the unrecognized tax benefit as of
December 31, 2015
is recognized, there will be no effect on the Company’s effective tax rate due to the full valuation allowance. The Company recognizes interest and penalties related to unrecognized tax benefits within income tax expense. As of
December 31, 2015
, the Company had no accrued interest and penalties related to unrecognized tax benefits. The Company does not expect any significant increases or decreases to its unrecognized benefits within the next twelve months.
The Company files income tax returns in the United States and various state jurisdictions. As of
December 31, 2015
, the Company’s federal tax returns for 2011 and earlier, and the state tax returns for 2010 and earlier were no longer subject to examination by the taxing authorities. However, tax periods closed in a prior period may be subject to audit and re-examination by tax authorities for which tax carryforwards are utilized in subsequent years.
16. Commitments and Contingencies
Operating Lease Commitments
The Company’s corporate headquarters are located in San Francisco, California, and consist of approximately
169,000
square feet of space under lease agreements, the longest of which is expected to expire in
June 2022
. Under these lease agreements, the Company has an option to extend nearly all of the space for
five years
.
In April 2015, the Company entered into a lease agreement for approximately
112,000
square feet of additional office space in San Francisco, California. The lease agreement commenced in the second quarter of 2015 with delivery of portions of the leased space to occur in stages through March 2017. The lease agreement expires on March 31, 2026, with the right to renew the lease term for
two
consecutive renewal terms of
five
years each.
The Company has additional leased office space of approximately
26,000
square feet in Westborough, Massachusetts, under a lease agreement that expires in
July 2021
.
Total facilities rental expense for the years ended
December 31, 2015
,
2014
and
2013
was
$7.4 million
,
$3.7 million
and
$1.9 million
, respectively. The Company had
no
sublease rental income for the years ended
December 31, 2015
,
110
LENDINGCLUB CORPORATION
Notes to Consolidated Financial Statements
(Tabular Amounts in Thousands, Except Share and Per Share Amounts, Ratios, or as Noted)
2014
, or
2013
. Minimum lease payments for the years ended
December 31, 2015
,
2014
and
2013
were
$6.0 million
,
$3.3 million
and
$1.3 million
, respectively.
As of
December 31, 2015
, the Company pledged
$0.8 million
of cash and
$4.7 million
in letters of credit as security deposits in connection with its lease agreements.
The Company’s future minimum payments under non-cancelable operating leases in excess of one year as of
December 31, 2015
were as follows:
|
Years Ended December 31,
|
|
||
|
2016
|
$
|
12,085
|
|
|
2017
|
15,095
|
|
|
|
2018
|
16,056
|
|
|
|
2019
|
15,624
|
|
|
|
2020
|
16,526
|
|
|
|
Thereafter
|
57,217
|
|
|
|
Total
|
$
|
132,603
|
|
Loan Purchase Obligation
Under the Company’s loan account program with WebBank, a Utah-chartered industrial bank that serves as the Company’s primary issuing bank, WebBank retains ownership of the loans facilitated through Lending Club’s marketplace for
two
business days after origination. As part of this arrangement, the Company has committed to purchase the loans at par plus accrued interest, at the conclusion of the two business days. As of
December 31, 2015
and
2014
, the Company was committed to purchase loans with an outstanding principal balance of
$77.6 million
and
$4.1 million
, respectively, at par plus accrued interest. There were
no
outstanding commitments as of
December 31, 2013
.
Loan Funding and Purchase Commitments
As required by applicable regulations, the Company is required to purchase loans resulting from direct marketing efforts if such loans are not otherwise invested in by investors on the platform. During
2015
, the Company was not required to purchase any such loans. Additionally, loans in the process of being facilitated and originated by the Company’s issuing bank partner at
December 31, 2015
, were fully funded in January 2016 and the Company was not required to purchase any of these loans.
Separately, Springstone and the Company are contractually committed to purchase certain loans (Pool B loans) that Springstone facilitates and that are originated by an issuing bank partner if neither Springstone nor the Company can arrange for other investors to invest in or purchase these loans.
The Company and the issuing bank have entered into purchase agreements with three investors to purchase Pool B loans or participation interests in Pool B loans. As of January 5, 2016, any minimum purchase requirements had expired under these agreements. During the year ended December 31, 2015, the Company was not required to purchase any Pool B loans or Pool B loan participation interests. In connection with current re-negotiations of the program agreement with the issuing bank, the Company may be required to deposit funds into an account at the bank to secure potential, future purchases of these loans.
Credit Support Agreement
The Company is subject to a credit support agreement with a certificate investor. The credit support agreement requires the Company to pledge and restrict cash in support of its contingent obligation to reimburse the investor for
111
LENDINGCLUB CORPORATION
Notes to Consolidated Financial Statements
(Tabular Amounts in Thousands, Except Share and Per Share Amounts, Ratios, or as Noted)
net credit losses on loans underlying the investor’s certificate that are in excess of a specified, aggregate net loss threshold. The Company is contingently obligated to pledge cash, not to exceed
$5.0 million
, to support this contingent obligation. Approximately
$3.4 million
was pledged and restricted to support this contingent obligation for the years ended
December 31, 2015
,
2014
and
2013
.
As of
December 31, 2015
and
2014
, the net credit losses pertaining to the investor’s certificate have not exceeded the specified threshold, nor are future net credit losses expected to exceed the specified threshold, and thus no liability has been recorded. The Company currently does not anticipate recording losses under this credit support agreement. If losses related to the credit support agreement are later determined to be likely to occur and are estimable, results of operations could be affected in the period in which such losses are recorded.
Legal
On June 5, 2014, Springstone received a Civil Investigative Demand from the Consumer Financial Protection Bureau, referred to as CFPB, related to the period from 2009 through May 2014. The purpose of the investigation was to determine whether Springstone engaged in unlawful acts or practices in connection with the marketing, issuance, and servicing of loans for certain healthcare related financings during the period. On August 19, 2015, Springstone agreed to settle with the CFPB related to the CFPB’s concerns about possible borrower confusion of the terms of a deferred interest product, which was terminated by the Company in December 2014. To resolve this matter, Springstone is in the process of paying restitution of
$700 thousand
to certain borrowers under the Springstone finance program between 2009 and 2014. The settlement amount has been recorded as a liability as of
December 31, 2015
. The settlement amount was fully covered by the indemnification provisions of the Springstone purchase agreement and, therefore, did not result in an adverse financial charge to the Company. In January 2016, the Company delivered to borrowers all restitution amounts that were accrued for as of December 31, 2015.
The Company is currently engaged in an arbitration proceeding with a prior employee who is claiming that additional equity is due to them. The Company believes the claim to be without merit and intends to continue to defend the matter vigorously. The Company has not accrued a liability for this action at this time.
In addition to the foregoing, the Company may be subject to legal proceedings and regulatory actions in the ordinary course of business. The Company does not believe it is probable that the ultimate liability, if any, arising out of any such matter will have a material effect on our financial condition, results of operations or cash flows.
17. Segment Reporting
The Company defines operating segments to be components of the Company for which discrete financial information is evaluated regularly by the Company’s chief operating decision maker (CODM). For purposes of allocating resources and evaluating financial performance, the Company’s CODM reviews financial information by the product types of personal loans, and education and patient finance loans. These product types are aggregated and viewed as one operating segment, and therefore,
one
reportable segment due to their similar economic characteristics, product economics, production process, and regulatory environment.
Substantially all of the Company’s revenue is generated in the United States. No individual customer accounted for
10%
or more of consolidated net revenue for any of the periods presented.
18. Related Party Transactions
Related party transactions must be reviewed and approved by the Audit Committee of the Company’s Board of Directors when not conducted in the ordinary course of business subject to the standard terms of the Company’s online marketplace or certificate investment program. Related party transactions may include any transaction between entities under common control or with a related person occurring since the beginning of the Company’s
112
LENDINGCLUB CORPORATION
Notes to Consolidated Financial Statements
(Tabular Amounts in Thousands, Except Share and Per Share Amounts, Ratios, or as Noted)
latest fiscal year, or any currently proposed transaction involving the Company where the amount involved exceeds
$120,000
. This review also includes any material amendment or modification to an existing related party transaction. The Company has defined related persons as members of the Board of Directors, executive officers, principal owners of the Company’s outstanding stock and any immediate family members of each such related persons, as well as any other person or entity with significant influence over the Company’s management or operations.
Several of the Company’s executive officers and directors (including immediate family members) have opened investor accounts with Lending Club, made deposits and withdrawals to their accounts, and purchased notes and certificates. All note and certificate purchases made by related parties were made in the ordinary course of business and were transacted on terms and conditions that were not more favorable than those obtained by third-party investors. There were no other transactions with related parties identified during the years ended 2015, 2014 or 2013.
19. Springstone Acquisition
On
April 17, 2014
, Lending Club acquired all of the outstanding limited liability company interests of
Springstone
(Acquisition) for
$111.8 million
, which was comprised of
$109.0 million
in cash and shares of Series F convertible preferred stock with an aggregate value of
$2.8 million
. Upon closing of the Acquisition, Springstone became Lending Club’s wholly owned subsidiary. The Company has included the financial results of Springstone in the consolidated financial statements from the date of acquisition.
To secure the retention of certain key employees, a total of
$25.6 million
comprised of
$22.1 million
of shares of Series F convertible preferred stock (Escrow Shares) and
$3.5 million
of cash were placed in a third-party escrow, and are subject to certain vesting and forfeiture conditions applicable to these employees continuing employment over a three-year period from the closing. These amounts are accounted for as a compensation arrangement and expensed over the
three
-year vesting period and are included under “General and administrative operating expenses” in the Consolidated Statements of Operations. Additionally,
$19.0 million
of the cash consideration and certain Escrow Shares were placed in a third-party escrow for
15 months
from the closing date to secure, in part, the indemnification obligations of the sellers under the purchase agreement. In connection with the Acquisition, the Company also paid
$2.4 million
for transactions costs incurred by Springstone.
The cash portion of the consideration was funded by a combination of cash from us, Series F convertible preferred stock financing, and proceeds from the Term Loan.
The Company has completed the allocation of the purchase price to acquired assets and liabilities with the exception of finalizing the determination of certain contingent liabilities and the finalization of any deferred tax asset or liability as of the acquisition date. The preliminary purchase price allocation as of the acquisition date is as follows:
113
LENDINGCLUB CORPORATION
Notes to Consolidated Financial Statements
(Tabular Amounts in Thousands, Except Share and Per Share Amounts, Ratios, or as Noted)
|
|
Fair Value
|
||
|
Assets:
|
|||
|
Cash
|
$
|
2,256
|
|
|
Restricted cash
|
1,581
|
|
|
|
Property, equipment and software
|
366
|
|
|
|
Other assets
|
599
|
|
|
|
Identified intangible assets
|
40,200
|
|
|
|
Goodwill
|
72,592
|
|
|
|
Liabilities:
|
|||
|
Accounts payable
|
239
|
|
|
|
Accrued expenses and other liabilities
|
5,536
|
|
|
|
Total purchase consideration
|
$
|
111,819
|
|
The goodwill balance is primarily attributed to expected operational synergies, the combined workforce, and the future development initiatives of the combined workforce. Goodwill is expected to be deductible for U.S. income tax purposes.
The amounts of net revenue of Springstone included in the Company’s consolidated statements of operations from the acquisition date of April 17, 2014 to December 31, 2014 was
$15.3 million
. The Company has recognized acquisition-related expenses of
$2.3 million
for the year ended December 31, 2014, which is included in general and administrative expense. The Company did not recognize acquisition-related costs for the year ended
December 31, 2013
.
The following pro forma financial information summarizes the combined results of operations for Lending Club and Springstone, as though the companies were combined as of January 1, 2013. These pro forma results have been prepared for comparative purposes only and do not purport to be indicative of the results of operations which would have resulted had the acquisition occurred as of January 1, 2013, nor is it indicative of future operating results. The pro forma results presented below include interest expense on the debt financing, amortization of acquired intangible assets, compensation expense related to the post-acquisition compensation arrangements entered into with the continuing employees and tax expense:
|
Years Ended December 31,
|
2014
|
2013
|
|||||
|
Total net revenue
|
$
|
219,174
|
|
$
|
113,040
|
|
|
|
Net loss
(1)
|
$
|
(33,796
|
)
|
$
|
(17,592
|
)
|
|
|
Basic net loss per share attributable to common stockholders
|
$
|
(0.45
|
)
|
$
|
(0.34
|
)
|
|
|
Diluted net loss per share attributable to common stockholders
|
$
|
(0.45
|
)
|
$
|
(0.34
|
)
|
|
|
(1)
|
Net loss for the year ended December 31, 2013 includes
$8.6 million
of one-time acquisition-related costs and compensation expenses.
|
114
LENDINGCLUB CORPORATION
Notes to Consolidated Financial Statements
(Tabular Amounts in Thousands, Except Share and Per Share Amounts, Ratios, or as Noted)
20. Subsequent Events
The Company has evaluated the impact of events that have occurred subsequent to December 31, 2015, through the date the consolidated financial statements were filed with the SEC. Based on this evaluation, other than as recorded or disclosed within these consolidated financial statements, related notes or below, the Company has determined none of these events were required to be recognized or disclosed.
On February 9, 2016, the board of directors approved a share repurchase program under which Lending Club may repurchase up to
$150 million
of the Company’s common shares
in open market or privately negotiated transactions in compliance with Securities and Exchange Act Rule 10b-18
.
This repurchase plan is valid for
one
year and does not obligate the Company to acquire any particular amount of common stock, and may be suspended at any time at Lending Club’s discretion.
115
LENDINGCLUB CORPORATION
None.
Evaluation of Disclosure Controls and Procedures
The Company has adopted and maintain disclosure controls and procedures that are designed to ensure that information required to be disclosed in its reports required under the 1934 Act is recorded, processed, summarized and reported within the time periods specified in the SEC’s rules and forms, and that the information is accumulated and communicated to its management, including the Chief Executive Officer and Chief Financial Officer, as appropriate, to allow for timely decisions regarding required disclosure. In designing and evaluating its disclosure controls and procedures, the Company’s management recognizes that any controls and procedures, no matter how well designed and operated, can provide only reasonable, not absolute assurance of achieving the desired control objectives, and is required to apply its judgment in evaluating the cost-benefit relationship of possible controls and procedures.
As required by Rule 13a-15(b) of the 1934 Act, the Company carried out an evaluation, under the supervision and with the participation of the Company’s management, including its Chief Executive Officer and Chief Financial Officer, of the effectiveness of the design and operation of its disclosure controls and procedures as of
December 31, 2015
. Based on the foregoing, the Company’s Chief Executive Officer and Chief Financial Officer have concluded that its disclosure controls and procedures were effective at a reasonable assurance level.
Management’s Annual Report on Internal Control over Financial Reporting
The Company’s management is responsible for maintaining effective internal control over financial reporting and for assessing the effectiveness of internal control over financial reporting, as defined in Rule 13a-15(f) of the 1934 Act. Under the supervision and with the participation of the Company’s Chief Executive Officer and Chief Financial Officer, management conducted an evaluation of the effectiveness of its internal control over financial reporting as of
December 31, 2015
, based on the criteria established in
Internal Control – Integrated Framework (2013)
issued by the Committee of Sponsoring Organizations of the Treadway Commission. As a result of this assessment, management concluded that, as of December 31, 2015, our internal control over financial reporting was effective in providing reasonable assurance regarding the reliability of financial reporting and the preparation of financial statements for external purposes in accordance with generally accepted accounting principles. Deloitte & Touche, LLP, has independently audited the effectiveness of our internal control over financial reporting and its report is included below.
All internal control systems, no matter how well designed, have inherent limitations including the possibility of human error and the circumvention or overriding of controls. Further, because of changes in conditions, the effectiveness of internal controls may vary over time. Projections of any evaluation of effectiveness to future periods are subject to the risk that controls may become inadequate because of changes in conditions, or that the degree of compliance with the policies or procedures may deteriorate. Accordingly, even those systems determined to be effective can provide only reasonable assurance with respect to financial statement preparation and presentation.
116
REPORT OF INDEPENDENT REGISTERED PUBLIC ACCOUNTING FIRM
To the Board of Directors and Stockholders of
LendingClub Corporation
San Francisco, California
We have audited the internal control over financial reporting of LendingClub Corporation and subsidiaries (the “Company”) as of December 31, 2015, based on criteria established in
Internal Control - Integrated Framework (2013)
issued by the Committee of Sponsoring Organizations of the Treadway Commission. The Company’s management is responsible for maintaining effective internal control over financial reporting and for its assessment of the effectiveness of internal control over financial reporting, included in the accompanying
Management’s Annual Report on Internal Control over Financial Reporting
. Our responsibility is to express an opinion on the Company’s internal control over financial reporting based on our audit.
We conducted our audit in accordance with the standards of the Public Company Accounting Oversight Board (United States). Those standards require that we plan and perform the audit to obtain reasonable assurance about whether effective internal control over financial reporting was maintained in all material respects. Our audit included obtaining an understanding of internal control over financial reporting, assessing the risk that a material weakness exists, testing and evaluating the design and operating effectiveness of internal control based on the assessed risk, and performing such other procedures as we considered necessary in the circumstances. We believe that our audit provides a reasonable basis for our opinion.
A company’s internal control over financial reporting is a process designed by, or under the supervision of, the company’s principal executive and principal financial officers, or persons performing similar functions, and effected by the company’s board of directors, management, and other personnel to provide reasonable assurance regarding the reliability of financial reporting and the preparation of financial statements for external purposes in accordance with generally accepted accounting principles. A company’s internal control over financial reporting includes those policies and procedures that (1) pertain to the maintenance of records that, in reasonable detail, accurately and fairly reflect the transactions and dispositions of the assets of the company; (2) provide reasonable assurance that transactions are recorded as necessary to permit preparation of financial statements in accordance with generally accepted accounting principles, and that receipts and expenditures of the company are being made only in accordance with authorizations of management and directors of the company; and (3) provide reasonable assurance regarding prevention or timely detection of unauthorized acquisition, use, or disposition of the company’s assets that could have a material effect on the financial statements.
Because of the inherent limitations of internal control over financial reporting, including the possibility of collusion or improper management override of controls, material misstatements due to error or fraud may not be prevented or detected on a timely basis. Also, projections of any evaluation of the effectiveness of the internal control over financial reporting to future periods are subject to the risk that the controls may become inadequate because of changes in conditions, or that the degree of compliance with the policies or procedures may deteriorate.
In our opinion, the Company maintained, in all material respects, effective internal control over financial reporting as of December 31, 2015, based on the criteria established in
Internal Control - Integrated Framework (2013)
issued by the Committee of Sponsoring Organizations of the Treadway Commission.
We have also audited, in accordance with the standards of the Public Company Accounting Oversight Board (United States), the consolidated financial statements and financial statement schedule as of and for the year ended December 31, 2015 of the Company and our report dated February 22, 2016 expressed an unqualified opinion on those financial statements and financial statement schedule.
DELOITTE & TOUCHE LLP
San Francisco, California
February 22, 2016
117
LENDINGCLUB CORPORATION
Not Applicable.
The information required by Item 10 will be included in our Proxy Statement under the headings “Corporate Governance at LendingClub” and “Section 16(a) Beneficial Ownership Reporting Compliance,” and is incorporated herein by reference. The Proxy Statement will be filed with the Securities and Exchange Commission pursuant to Regulation 14A within 120 days of the end of the 2015 fiscal year.
The information required by Item 11 will be included in the Proxy Statement under the headings “Director Compensation,” “Compensation Discussion and Analysis,” “Named Executive Officer Compensation,” “Compensation Committee Interlocks and Insider Participation” and “Compensation Committee Report,” and is incorporated herein by reference.
The information required by Item 12 will be included in the Proxy Statement under the headings “Security Ownership” and “Equity Compensation Plans,” and is incorporated herein by reference.
The information required by Item 13 will be included in the Proxy Statement under the headings “Related Person Transactions” and “Director Independence,” and is incorporated herein by reference.
The information required by Item 14 will be included in the Proxy Statement under the heading “Ratification of Selection of Independent Auditors,” and is incorporated herein by reference.
(a) We have filed the following documents as part of this Annual Report on Form 10-K:
1. Consolidated Financial Statements
118
LENDINGCLUB CORPORATION
|
2.
|
Financial Statement Schedule
|
Schedule II – Valuation and Qualifying Accounts (in thousands)
|
|
|
Additions
|
|
|
|||||||||||||||
|
|
Balance at
Beginning of
Period
|
Charged to
Expenses
|
Charged
to Other
Accounts
|
Deductions
|
Balance at
End of Period |
||||||||||||||
|
Allowance for Deferred Tax Assets:
|
|||||||||||||||||||
|
Year ended December 31, 2015
|
$
|
26,788
|
|
$
|
—
|
|
$
|
680
|
|
$
|
2,120
|
|
$
|
25,348
|
|
||||
|
Year ended December 31, 2014
|
$
|
19,931
|
|
$
|
6,857
|
|
$
|
—
|
|
$
|
—
|
|
$
|
26,788
|
|
||||
|
Year ended December 31, 2013
|
$
|
22,465
|
|
$
|
—
|
|
$
|
—
|
|
$
|
2,534
|
|
$
|
19,931
|
|
||||
3. Exhibits
The documents listed in the Exhibit index of this Annual Report on Form 10-K are incorporated by reference or are filed with this Annual Report on Form 10-K, in each case as indicated therein on the Exhibit Index.
LENDINGCLUB CORPORATION
SIGNATURES
Pursuant to the requirements of Section 13 or 15(d) of the Securities Exchange Act of 1934, the registrant has duly caused this report to be signed on its behalf by the undersigned, thereunto duly authorized.
Date:
February 22, 2016
|
LENDINGCLUB CORPORATION
|
|||
|
By:
|
|
/s/ RENAUD LAPLANCHE
|
|
|
Renaud Laplanche
|
|||
|
Chief Executive Officer
|
|||
Pursuant to the requirements of the Securities Exchange Act of 1934, this report has been signed below by the following persons on behalf of the registrant and in the capacities and on the dates indicated.
|
Signature
|
|
Title
|
|
Date
|
|
/s/ Renaud Laplanche
|
|
Chief Executive Officer and Director (Principal Executive Officer)
|
|
February 22, 2016
|
|
Renaud Laplanche
|
||||
|
/s/ Carrie L. Dolan
|
|
Chief Financial Officer
(Principal Financial Officer and Principal Accounting Officer)
|
|
February 22, 2016
|
|
Carrie L. Dolan
|
||||
|
/s/ Jeffrey M. Crowe
|
|
Director
|
|
February 22, 2016
|
|
Jeffrey M. Crowe
|
||||
|
|
Director
|
|
||
|
Daniel Ciporin
|
||||
|
|
Director
|
|
||
|
John J. Mack
|
||||
|
/s/ Mary Meeker
|
|
Director
|
|
February 22, 2016
|
|
Mary Meeker
|
||||
|
/s/ John C. Morris
|
|
Director
|
|
February 22, 2016
|
|
John C. Morris
|
||||
|
|
Director
|
|
||
|
Lawrence Summers
|
||||
|
/s/ Simon Williams
|
|
Director
|
|
February 22, 2016
|
|
Simon Williams
|
||||
120
LENDINGCLUB CORPORATION
Exhibit Index
|
|
|
Incorporated by Reference
|
|
|||||||||
|
Exhibit
Number
|
Exhibit Description
|
Form
|
File No.
|
Exhibit
|
Filing
Date
|
Filed
Herewith
|
||||||
|
2.1
|
Interest Purchase Agreement, dated as of April 17, 2014, by and among LendingClub Corporation, Springstone Financial, LLC, Premier Payment Solutions, Inc., NBT Capital Corp. and James P. Donovan
|
8-K
|
000-54752
|
2.1
|
April 17, 2014
|
|||||||
|
3.1
|
Restated Certificate of Incorporation of LendingClub
Corporation
|
8-K
|
000-54752
|
3.1
|
December 16, 2014
|
|||||||
|
3.2
|
Restated Bylaws of LendingClub Corporation
|
8-K
|
333-151827
|
3.2
|
December 16, 2014
|
|||||||
|
4.1
|
Form of Three-Year Member Payment Dependent Note
(included as Exhibit A to Exhibit 4.6)
|
S-1,
Amendment
No. 1
|
333-198393
|
4.6
|
October 20, 2014
|
|||||||
|
4.2
|
Form of Five-Year Member Payment Dependent Note
(included as Exhibit B to Exhibit 4.6)
|
S-1,
Amendment
No. 1
|
333-198393
|
4.6
|
October 20, 2014
|
|||||||
|
4.3
|
Form of Indenture by and between LendingClub Corporation and Wells Fargo Bank, National
Association
|
S-1,
Amendment
No. 3
|
333-151827
|
4.2
|
October 9, 2008
|
|||||||
|
4.4
|
First Supplemental Indenture, dated as of July 10, 2009, by and between LendingClub Corporation
and Wells Fargo Bank, National Association
|
S-1, Post-
Effective
Amendment
No. 3
|
333-151827
|
4.3
|
July 23, 2009
|
|||||||
|
4.5
|
Second Supplemental Indenture, dated as of May 5, 2010, by and between LendingClub Corporation and Wells Fargo Bank, National Association
|
S-1, Post-
Effective
Amendment
No. 5
|
333-151827
|
4.5
|
May 6, 2010
|
|||||||
|
4.6
|
Third Supplemental Indenture, dated as of October 3, 2014, by and between LendingClub Corporation and Wells Fargo Bank, National Association.
|
S-1,
Amendment
No. 1
|
333-198393
|
4.6
|
October 20, 2014
|
|||||||
|
4.7
|
Amended and Restated Investor Rights Agreement, dated as of April 16, 2014, by and among LendingClub Corporation and the Investors named therein
|
8-K
|
000-54752
|
4.1
|
April 17, 2014
|
|||||||
|
4.8
|
Form of Common Stock Certificate of LendingClub Corporation
|
S-1,
Amendment
No. 2
|
333-198393
|
4.8
|
November 17, 2014
|
|||||||
|
4.9
|
Forms of Warrants to Purchase Common Stock
|
S-1,
Amendment
No. 3
|
333-198393
|
4.9
|
December 1, 2014
|
|||||||
|
4.10
|
Forms of Warrants to Purchase Series A Convertible Preferred Stock
|
S-1,
Amendment
No. 3
|
333-198393
|
4.10
|
December 1, 2014
|
|||||||
|
10.1
|
Form of Indemnity Agreement
|
S-1,
Amendment
No. 3
|
333-198393
|
10.1
|
December 1,2014
|
|||||||
|
10.2
|
Form of Borrower Loan Agreement
|
X
|
||||||||||
|
10.3
|
Form of Borrower Membership Agreement
|
10-Q
|
011-36771
|
10.2
|
August 5, 2015
|
|||||||
121
LENDINGCLUB CORPORATION
|
|
|
Incorporated by Reference
|
|
|||||||||
|
Exhibit
Number
|
Exhibit Description
|
Form
|
File No.
|
Exhibit
|
Filing
Date
|
Filed
Herewith
|
||||||
|
10.4
|
LendingClub Corporation 2007 Stock Incentive Plan, as amended, and form of award agreement thereunder
|
S-1,
Amendment
No. 3
|
333-198393
|
10.4
|
December 1, 2014
|
|||||||
|
10.6
|
2014 Equity Incentive Plan, and forms of award agreements thereunder
|
S-1,
Amendment No. 3 |
333-198393
|
10.6
|
December 1, 2014
|
|||||||
|
10.7
|
2014 Employee Stock Purchase Plan, and forms of enrollment agreements thereunder
|
S-1,
Amendment No. 3 |
333-198393
|
10.7
|
December 1, 2014
|
|||||||
|
10.8+
|
Second Amended and Restated Loan Sale Agreement, dated as of February 28, 2014, by and between LendingClub Corporation and WebBank
|
10-K
|
000-54752
|
10.6
|
March 31, 2014
|
|||||||
|
10.9+
|
Second Amended and Restated Loan Account Program Agreement, dated as of February 28, 2014, by and between LendingClub Corporation and WebBank
|
10-K
|
000-54752
|
10.7
|
March 31, 2014
|
|||||||
|
10.10
|
Hosting Services Agreement, dated as of October 6, 2008, by and between LendingClub Corporation and FOLIOfn Investments, Inc.
|
10-K
|
333-151827
|
10.15
|
June 17, 2009
|
|||||||
|
10.11
|
Services Agreement, dated as of October 6, 2008, by and between LendingClub Corporation and
FOLIOfn Investments, Inc. |
S-1,
Amendment No. 1 |
333-198393
|
10.11
|
October 20, 2014
|
|||||||
|
10.12
|
License Agreement, dated as of October 6, 2008, by and between LendingClub Corporation and FOLIOfn Investments, Inc.
|
10-K
|
333-151827
|
10.17
|
June 17, 2009
|
|||||||
|
10.13
|
Backup and Successor Servicing Agreement, dated as of
September 15, 2011, by and between Portfolio Financial Servicing Company and LendingClub Corporation |
S-1,
Amendment No. 1 |
333-198393
|
10.13
|
October 20, 2014
|
|||||||
|
10.14
|
Form of Partner Agreement
|
S-1/A
|
333-177230
|
10.28
|
March 19, 2012
|
|||||||
|
10.15
|
Form of Employment Agreement for Chief Executive Officer
|
S-1,
Amendment No. 3 |
333-198393
|
10.15
|
December 1, 2014
|
|||||||
|
10.16
|
Form of Employment Agreement for Executive Officers other than Chief Executive Officer
|
S-1,
Amendment No. 3 |
333-198393
|
10.16
|
December 1, 2014
|
|||||||
|
10.20
|
Credit and Guaranty Agreement, dated as of December 17, 2015, among LendingClub Corporation, the guarantors party thereto, Morgan Stanley Senior Funding, Inc. and the lenders party thereto
|
8-K
|
011-36771
|
10.1
|
December 22, 2015
|
|||||||
|
10.21
|
Pledge and Security Agreement, dated December 17, 2015, by and among LendingClub Corporation, the grantors referred to therein and Morgan Stanley Senior Funding, Inc.
|
8-K
|
011-36771
|
10.2
|
December 22, 2015
|
|||||||
|
10.22
|
Lease Agreement, dated as of May 17, 2013, by and between LendingClub Corporation and Forward One, LLC, as amended
|
S-1,
Amendment No. 2 |
333-198393
|
10.22
|
November 17, 2014
|
|||||||
122
LENDINGCLUB CORPORATION
|
|
|
Incorporated by Reference
|
|
|||||||||
|
Exhibit
Number
|
Exhibit Description
|
Form
|
File No.
|
Exhibit
|
Filing
Date
|
Filed
Herewith
|
||||||
|
10.23
|
Assignment and Assumption of Lease, dated as of October 17, 2014, by and between LendingClub Corporation and Teachscape, Inc.
|
S-1,
Amendment No. 2 |
333-198393
|
10.23
|
November 17, 2014
|
|||||||
|
10.24
|
Lease Agreement, dated as of April 16, 2015, by and between LendingClub Corporation and 595 Market Street, Inc.
|
10-Q
|
011-36771
|
10.31
|
May 5, 2015
|
|||||||
|
10.25
|
Form of Fund Subscription Agreement
|
S-1,
Amendment No. 1 |
333-198393
|
10.24
|
October 20, 2014
|
|||||||
|
10.26
|
Form of Investment Advisory Agreement
|
S-1,
Amendment No. 1 |
333-198393
|
10.25
|
October 20, 2014
|
|||||||
|
10.27
|
Form of Master Loan Purchase Agreement
|
X
|
||||||||||
|
10.28
|
Form of Master Loan Servicing Agreement
|
X
|
||||||||||
|
10.29
|
Form of Investor Agreement
|
10-Q
|
011-36771
|
10.5
|
August 5, 2015
|
|||||||
|
10.30
|
Form of LCA Investment Advisory Agreement
|
S-1,
Amendment No. 4 |
333-198393
|
10.29
|
December 8, 2014
|
|||||||
|
10.31
|
Form of Certificate Account Opening and Maintenance Agreement
|
S-1,
Amendment No. 4 |
333-198393
|
10.30
|
December 8, 2014
|
|||||||
|
21.1
|
List of Subsidiaries
|
X
|
||||||||||
|
23.1
|
Consent of Deloitte & Touche LLP
|
X
|
||||||||||
|
31.1
|
Certification of Chief Executive Officer Pursuant to Section 302 of the Sarbanes-Oxley Act of 2002
|
X
|
||||||||||
|
31.2
|
Certification of Chief Financial Officer Pursuant to Section 302 of the Sarbanes-Oxley Act of 2002
|
X
|
||||||||||
|
32.1
|
Certification of Chief Executive Officer and Chief Financial Officer Pursuant to Section 906 of the Sarbanes-Oxley Act of 2002
|
X
|
||||||||||
|
101.INS
|
XBRL Instance Document
|
X
|
||||||||||
|
101.SCH
|
XBRL Taxonomy Extension Schema Document
|
X
|
||||||||||
|
101.CAL
|
XBRL Taxonomy Extension Calculation Linkbase
|
X
|
||||||||||
|
101.DEF
|
XBRL Taxonomy Extension Definition Linkbase
|
X
|
||||||||||
|
101.LAB
|
XBRL Taxonomy Extension Label Linkbase
|
X
|
||||||||||
|
101.PRE
|
XBRL Taxonomy Extension Presentation Linkbase
|
X
|
||||||||||
+ Confidential treatment requested
123
TABLE OF CONTENTS
Part IItem 1. BusinessItem 1A Risk Factors Risks Related To Our Business and RegulationItem 1A. Risk FactorsItem 1B. Unresolved Staff CommentsItem 2. PropertiesItem 3. Legal ProceedingsItem 4. Mine Safety DisclosuresPart IIItem 5. Market For Registrant S Common Equity, Related Stockholder Matters and Issuer Purchases Of Equity SecuritiesItem 6. Selected Financial DataItem 7 Management S Discussion and Analysis Of Financial Condition and Results Of OperationsItem 7. Management S Discussion and Analysis Of Financial Condition and Results Of OperationsItem 8 Financial Statements and Supplementary DataNote 19 Springstone AcquisitionItem 8 Financial Statements and Supplementary Data Note 2. Summary Of Significant Accounting PoliciesItem 7A. Quantitative and Qualitative Disclosures About Market RiskItem 8. Financial Statements and Supplementary DataNote 1. Basis Of PresentationItem 9. Changes in and Disagreements with Accountants on Accounting and Financial DisclosureItem 9A. Controls and ProceduresItem 9B. Other InformationPart IIIItem 10. Directors, Executive Officers and Corporate GovernanceItem 11. Executive CompensationItem 12. Security Ownership Of Certain Beneficial Owners and Management and Related Stockholder MattersItem 13. Certain Relationships and Related Transactions, and Director IndependenceItem 14. Principal Accountant Fees and ServicesPart IVItem 15. Exhibits and Financial Statement Schedule