LENDINGCLUB CORP
10-Ks and 10-Qs
|
|
|
|
|
|
|
|
|
|
|
|
|
|
|
|
|
|
|
|
|
|
|
|
|
|
|
|
|
|
|
|
|
|
|
|
|
|
|
|
|
UNITED STATES
SECURITIES AND EXCHANGE COMMISSION
Washington, D.C. 20549
|
FORM 10-Q
|
|
QUARTERLY REPORT PURSUANT TO SECTION 13 OR 15(d) OF THE SECURITIES EXCHANGE ACT OF 1934
|
For the quarterly period ended March 31, 2015
Commission File Number: 001-36771
|
LendingClub Corporation
(Exact name of registrant as specified in its charter)
|
|
Delaware
|
51-0605731
|
|
(State or other jurisdiction of
incorporation or organization)
|
(I.R.S. Employer
Identification No.)
|
|
71 Stevenson St., Suite 300, San Francisco, CA 94105
|
|
|
(Address of principal executive offices and zip code)
|
|
Registrant's telephone number, including area code: (415) 632-5600
Indicate by check mark whether the registrant (1) has filed all reports required to be filed by Section 13 or 15(d) of the Securities Exchange Act of 1934 during the preceding 12 months (or for such shorter period that the registrant was required to file such reports), and (2) has been subject to such filing requirements for the past 90 days. Yes
ý
No
¨
Indicate by check mark whether the registrant has submitted electronically and posted on its corporate Web site, if any, every Interactive Data File required to be submitted and posted pursuant to Rule 405 of Regulation S-T (§232.405 of this chapter) during the preceding 12 months (or for such shorter period that the registrant was required to submit and post such files). Yes
ý
No
¨
Indicate by check mark whether the registrant is a large accelerated filer, an accelerated filer, a non-accelerated filer, or a smaller reporting company. See the definitions of “large accelerated filer,” “accelerated filer” and “smaller reporting company” in Rule 12b-2 of the Exchange Act. (Check one):
|
Large accelerated filer
|
|
¨
|
Accelerated filer
|
¨
|
|
Non-accelerated filer
|
|
ý
(Do not check if a smaller reporting company)
|
Smaller reporting company
|
¨
|
Indicate by check mark whether the registrant is a shell company (as defined in Rule 12b-2 of the Exchange Act). Yes
¨
No
ý
As of
April 30, 2015
, there were
372,313,820
shares of the registrant’s common stock outstanding.
LENDINGCLUB CORPORATION
TABLE OF CONTENTS
Except as the context requires otherwise, as used herein, “Lending Club,” “Company”, “we,” “us,” and “our,” refer to LendingClub Corporation, a Delaware corporation, and, where appropriate, its wholly owned subsidiaries, which include:
|
•
|
LC Advisors, LLC (LCA), a registered investment advisor that acts as the general partner for certain private funds and advisor to separately managed accounts.
|
|
•
|
Springstone Financial, LLC (Springstone), a company we acquired in April 2014 that facilitates education and patient finance loans.
|
Forward-Looking Statements
This report contains forward-looking statements within the meaning of Section 29A of the Securities Act of 1933 and Section 21E of the Securities Exchange Act of 1934. All statements, other than statements of historical facts, included in this Quarterly Report on Form 10-Q (Report) regarding borrowers, credit scoring, Fair Isaac Corporation (“FICO”) or other credit scores, our strategy, future operations, expected losses, future financial position, future revenue, projected costs, prospects, plans, objectives of management and expected market growth are forward-looking statements. The words “anticipate,” “appear,” “believe,” “continue,” “could,” “estimate,” “expect,” “intend,” “may,” “plan,” “predict,” “project,” “target,” “will,” or similar expressions are intended to identify forward-looking statements, although not all forward-looking statements contain these identifying words. These forward-looking statements include, among other things, statements about:
|
•
|
the status of borrowers, the ability of borrowers to repay loans and the plans of borrowers;
|
|
•
|
interest rates and origination fees on loans charged by issuing banks;
|
|
•
|
expected rates of return provided to investors;
|
|
•
|
the likelihood of us having to fund contingent commitments, including commitments made to Springstone’s issuing bank and a credit support agreement we have entered into with a certificate investor;
|
|
•
|
the potential impact of having to fund any such contingent commitments;
|
|
•
|
transaction fee revenue we expect to recognize when loans are originated by our banking partner;
|
|
•
|
our financial condition and performance, including our ability to remain cash flow positive and the impact that management’s estimates have on our financial performance;
|
|
•
|
our ability to prevent and detect identity theft;
|
|
•
|
our ability to develop and maintain effective internal controls;
|
|
•
|
our compliance with applicable local, state and federal laws, including the Investment Advisors Act of 1940, the Investment Company Act of 1940 and other laws; and
|
|
•
|
our compliance with applicable regulations and regulatory developments affecting our marketplace.
|
We may not actually achieve the plans, intentions or expectations disclosed in forward-looking statements, and you should not place undue reliance on forward-looking statements. We have included important factors in the cautionary statements included in this Report, particularly in the “Risk Factors” section of our Annual Report on Form 10-K for the year ended December 31, 2014, that could, among other things, cause actual results or events to differ materially from forward-looking statements contained in this Report. Forward-looking statements do not reflect the potential impact of any future acquisitions, mergers, dispositions, joint ventures or investments we may make.
You should read this Report carefully and completely and with the understanding that actual future results may be materially different from what we expect. We do not assume any obligation to update or revise any forward-looking statements, whether as a result of new information, future events or otherwise, other than as required by law.
1
PART I. FINANCIAL INFORMATION
Item 1. Financial Statements
LENDINGCLUB CORPORATION
(In Thousands, Except Share and Per Share Amounts)
(Unaudited)
|
March 31, 2015
|
December 31, 2014
|
||||||
|
Assets
|
|||||||
|
Cash and cash equivalents
|
$
|
874,125
|
|
$
|
869,780
|
|
|
|
Restricted cash
|
39,247
|
|
46,763
|
|
|||
|
Loans at fair value (includes $2,037,776 and $1,772,407 from consolidated trust, respectively)
|
3,230,661
|
|
2,798,505
|
|
|||
|
Accrued interest receivable (includes $16,604 and $15,209 from consolidated trust, respectively)
|
26,577
|
|
24,262
|
|
|||
|
Property, equipment and software, net
|
31,295
|
|
27,051
|
|
|||
|
Intangible assets, net
|
34,758
|
|
36,302
|
|
|||
|
Goodwill
|
72,683
|
|
72,592
|
|
|||
|
Due from related parties
|
524
|
|
467
|
|
|||
|
Other assets
|
17,718
|
|
14,332
|
|
|||
|
Total assets
|
$
|
4,327,588
|
|
$
|
3,890,054
|
|
|
|
Liabilities
|
|||||||
|
Accounts payable
|
$
|
3,861
|
|
$
|
5,892
|
|
|
|
Accrued interest payable (includes $18,732 and $16,989 from consolidated trust, respectively)
|
29,683
|
|
26,964
|
|
|||
|
Accrued expenses and other liabilities
|
31,786
|
|
31,620
|
|
|||
|
Payable to investors
|
30,817
|
|
38,741
|
|
|||
|
Notes and certificates at fair value (includes $2,049,748 and $1,772,407 from consolidated trust, respectively)
|
3,249,346
|
|
2,813,618
|
|
|||
|
Total liabilities
|
3,345,493
|
|
2,916,835
|
|
|||
|
Commitments and contingencies (see
Note 12 - Commitments and Contingencies
)
|
|
|
|||||
|
Stockholders' Equity
|
|||||||
|
Common stock, $0.01 par value; 900,000,000 shares authorized at March 31, 2015 and December 31, 2014, respectively; 372,103,394 and 371,443,916 shares issued and outstanding at March 31, 2015 and December 31, 2014, respectively
|
3,721
|
|
3,714
|
|
|||
|
Additional paid-in capital
|
1,067,971
|
|
1,052,728
|
|
|||
|
Accumulated deficit
|
(89,597
|
)
|
(83,223
|
)
|
|||
|
Total stockholders’ equity
|
982,095
|
|
973,219
|
|
|||
|
Total liabilities and stockholders’ equity
|
$
|
4,327,588
|
|
$
|
3,890,054
|
|
|
See Notes to Consolidated Financial Statements
2
LENDINGCLUB CORPORATION
(In Thousands, Except Share and Per Share Amounts)
(Unaudited)
|
Three Months Ended March 31,
|
|||||||
|
|
2015
|
2014
|
|||||
|
Operating revenue:
|
|||||||
|
Transaction fees
|
$
|
72,482
|
|
$
|
35,412
|
|
|
|
Servicing fees
|
5,392
|
|
1,780
|
|
|||
|
Management fees
|
2,215
|
|
1,094
|
|
|||
|
Other revenue
|
956
|
|
416
|
|
|||
|
Total operating revenue
|
81,045
|
|
38,702
|
|
|||
|
Net interest income:
|
|||||||
|
Total interest income
|
113,472
|
|
73,048
|
|
|||
|
Total interest expense
|
(113,280
|
)
|
(73,000
|
)
|
|||
|
Net interest income
|
192
|
|
48
|
|
|||
|
Fair value adjustments, loans
|
(47,820
|
)
|
(24,749
|
)
|
|||
|
Fair value adjustments, notes and certificates
|
47,815
|
|
24,717
|
|
|||
|
Net interest income after fair value adjustments
|
187
|
|
16
|
|
|||
|
Total net revenue
|
81,232
|
|
38,718
|
|
|||
|
Operating expenses:
|
|||||||
|
Sales and marketing
|
34,884
|
|
20,582
|
|
|||
|
Origination and servicing
|
12,680
|
|
7,402
|
|
|||
|
General and administrative
|
39,415
|
|
18,033
|
|
|||
|
Total operating expenses
|
86,979
|
|
46,017
|
|
|||
|
Loss before income tax expense
|
(5,747
|
)
|
(7,299
|
)
|
|||
|
Income tax expense
|
627
|
|
—
|
|
|||
|
Net loss
|
$
|
(6,374
|
)
|
$
|
(7,299
|
)
|
|
|
Basic net loss per share attributable to common stockholders
|
$
|
(0.02
|
)
|
$
|
(0.13
|
)
|
|
|
Diluted net loss per share attributable to common stockholders
|
$
|
(0.02
|
)
|
$
|
(0.13
|
)
|
|
|
Weighted-average common shares - Basic
|
371,959,312
|
|
55,780,644
|
|
|||
|
Weighted-average common shares - Diluted
|
371,959,312
|
|
55,780,644
|
|
|||
See Notes to Consolidated Financial Statements
3
LENDINGCLUB CORPORATION
(In Thousands)
(Unaudited)
|
Three Months Ended March 31,
|
|||||||
|
|
2015
|
2014
|
|||||
|
Cash flows from operating activities:
|
|||||||
|
Net loss
|
$
|
(6,374
|
)
|
$
|
(7,299
|
)
|
|
|
Adjustments to reconcile net loss to net cash provided by operating activities:
|
|||||||
|
Net fair value adjustments of loans, notes and certificates
|
5
|
|
32
|
|
|||
|
Change in loan servicing liabilities
|
424
|
|
285
|
|
|||
|
Change in loan servicing assets
|
(1,315
|
)
|
(330
|
)
|
|||
|
Stock-based compensation, net
|
11,593
|
|
7,033
|
|
|||
|
Depreciation and amortization
|
4,693
|
|
1,007
|
|
|||
|
Loss (gain) on sales of loans
|
(95
|
)
|
71
|
|
|||
|
Other, net
|
18
|
|
5
|
|
|||
|
Purchase of whole loans to be sold
|
(622,050
|
)
|
(265,653
|
)
|
|||
|
Proceeds from sales of whole loans
|
622,145
|
|
265,582
|
|
|||
|
Net change in operating assets and liabilities:
|
|||||||
|
Accrued interest receivable
|
(2,315
|
)
|
(1,453
|
)
|
|||
|
Other assets
|
(2,074
|
)
|
18,070
|
|
|||
|
Due from related parties
|
(57
|
)
|
(24
|
)
|
|||
|
Accounts payable
|
(1,812
|
)
|
(131
|
)
|
|||
|
Accrued interest payable
|
2,719
|
|
1,667
|
|
|||
|
Accrued expenses and other liabilities
|
990
|
|
1,232
|
|
|||
|
Net cash provided by operating activities
|
6,495
|
|
20,094
|
|
|||
|
Cash flows from investing activities:
|
|||||||
|
Purchase of loans
|
(852,827
|
)
|
(511,219
|
)
|
|||
|
Principal payments received from loans
|
369,379
|
|
204,950
|
|
|||
|
Proceeds from recoveries and sales of charged-off loans
|
3,472
|
|
744
|
|
|||
|
Net change in restricted cash
|
7,516
|
|
(3,759
|
)
|
|||
|
Purchase of property, equipment and software
|
(6,240
|
)
|
(5,005
|
)
|
|||
|
Net cash used in investing activities
|
(478,700
|
)
|
(314,289
|
)
|
|||
|
Cash flows from financing activities:
|
|||||||
|
Change in payable to investors
|
(7,924
|
)
|
3,672
|
|
|||
|
Proceeds from issuances of notes and certificates
|
852,715
|
|
510,962
|
|
|||
|
Principal payments on notes and certificates
|
(365,711
|
)
|
(205,274
|
)
|
|||
|
Payments on notes and certificates from recoveries/sales of related charged-off loans
|
(3,461
|
)
|
(734
|
)
|
|||
|
Change in equity offering costs
|
65
|
|
—
|
|
|||
|
Proceeds from stock option exercises
|
863
|
|
780
|
|
|||
|
Proceeds from exercise of warrants to acquire common stock
|
3
|
|
89
|
|
|||
|
Net cash provided by financing activities
|
476,550
|
|
309,495
|
|
|||
4
LENDINGCLUB CORPORATION
Consolidated Statements of Cash Flows (Continued)
(In Thousands)
(Unaudited)
|
Three Months Ended March 31,
|
|||||||
|
2015
|
2014
|
||||||
|
Net increase in cash and cash equivalents
|
4,345
|
|
15,300
|
|
|||
|
Cash and cash equivalents, beginning of period
|
869,780
|
|
49,299
|
|
|||
|
Cash and cash equivalents, end of period
|
$
|
874,125
|
|
$
|
64,599
|
|
|
|
Supplemental disclosure of cash flow information:
|
|||||||
|
Cash paid for interest
|
$
|
110,562
|
|
$
|
71,296
|
|
|
|
Non-cash investing activity - Accruals for property, equipment and software
|
$
|
1,184
|
|
$
|
385
|
|
|
|
Non-cash financing activity - Accruals for prepaid offering costs
|
$
|
296
|
|
$
|
—
|
|
|
|
Non-cash financing activity - Reclassification of early-exercise liability relating to stock options
|
$
|
108
|
|
$
|
174
|
|
|
See Notes to Consolidated Financial Statements
5
LENDINGCLUB CORPORATION
Notes to Consolidated Financial Statements
(Tabular Amounts in Thousands, Except Share and Per Share Amounts, Ratios, or as Noted)
(Unaudited)
1. Basis of Presentation
Our consolidated financial statements include LendingClub Corporation and its wholly owned subsidiaries, including LC Advisors, LLC (LCA) and Springstone Financial, LLC (Springstone). All intercompany balances and transactions have been eliminated. The accompanying consolidated financial statements have been prepared in conformity with accounting principles generally accepted in the United States of America (GAAP) for interim financial information and, in the opinion of management, reflect all adjustments (consisting of normally recurring accruals) necessary for the fair statement of the results and financial position for such periods. We did not have any items of other comprehensive income (loss) during any of the periods presented in the consolidated financial statements and therefore, we are not required to report comprehensive income (loss). The results of operations and cash flows for any interim period are not necessarily indicative of the results for the full year.
The accompanying interim consolidated financial statements and these related notes should be read in conjunction with the consolidated financial statements and related notes included in the Company’s Annual Report on Form 10-K for the year ended
December 31, 2014
(Annual Report).
2. New Accounting Standards
Recently Issued Accounting Guidance
In February 2015, the Financial Accounting Standards Board issued new guidance amending accounting for consolidations which will be effective January 1, 2016. The guidance changes what an investor must consider in determining whether it is required to consolidate an entity in which it holds an interest. The Company is currently evaluating the impact of this guidance on the Company’s financial position, results of operations, earnings per common share, and cash flows.
In April 2015, the Financial Accounting Standards Board issued new guidance amending accounting for customer's cloud based fees which will be effective January 1, 2016. The guidance changes what a customer must consider in determining whether a cloud computing arrangement contains a software license. If the arrangement contains a software license, the customer would account for the fees related to the software license element in accordance with guidance related to internal use software; if the arrangement does not contain a software license, the customer would account for the arrangement as a service contract. The Company is currently evaluating the impact of this guidance on the Company’s financial position, results of operations, earnings per common share, and cash flows.
3. Net Loss Per Share and Net Loss Attributable to Common Stockholders
Earnings (loss) per share (EPS) is the amount of net income (loss) available to each share of common stock outstanding during the reporting period. Diluted EPS is the amount of net income (loss) available to each share of common stock outstanding during the reporting period, adjusted to include the effect of potentially dilutive common shares. Potentially dilutive common shares include incremental shares issued for stock options, convertible preferred stock (through December 11, 2014) and warrants to purchase common stock. Potentially dilutive common shares are excluded from the computation of dilutive EPS in periods in which the effect would be antidilutive.
We calculate EPS using the two-class method when applicable. The two-class method allocates net income that otherwise would have been available to common shareholders to holders of participating securities. All participating securities are excluded from basic weighted-average common shares outstanding. Prior to our Initial Public Offering (IPO), we considered all series of our convertible preferred stock to be participating securities. In conjunction with our IPO, all of our convertible preferred stock converted to common stock and all warrants to purchase convertible preferred stock were converted to warrants to purchase common stock. We had no participating securities as of
March 31, 2015
.
6
LENDINGCLUB CORPORATION
Notes to Consolidated Financial Statements
(Tabular Amounts in Thousands, Except Share and Per Share Amounts, Ratios, or as Noted)
(Unaudited)
The following table details the computation of the basic and diluted net loss per share:
|
Three Months Ended March 31,
|
||||||||
|
2015
|
2014
|
|||||||
|
Net loss
|
$
|
(6,374
|
)
|
$
|
(7,299
|
)
|
||
|
Net loss available to common stockholders
(1)
|
$
|
(6,374
|
)
|
$
|
(7,299
|
)
|
||
|
Weighted average common shares - Basic
|
371,959,312
|
|
55,780,644
|
|
||||
|
Weighted average common shares - Diluted
|
371,959,312
|
|
55,780,644
|
|
||||
|
Basic net loss per share attributable to common stockholders
|
$
|
(0.02
|
)
|
$
|
(0.13
|
)
|
||
|
Diluted net loss per share attributable to common stockholders
|
$
|
(0.02
|
)
|
$
|
(0.13
|
)
|
||
|
(1)
|
In a period with net income, both earnings and dividends (if any) are allocated to participating securities. In a period with a net loss, only declared dividends (if any) are allocated to participating securities. There were no dividends declared in the three months ended
March 31, 2014
.
|
4. Loans, Notes and Certificates, and Loan Servicing Rights
Loans, Notes and Certificates
At
March 31, 2015
and
December 31, 2014
, loans, notes and certificates measured at fair value on a recurring basis were as follows:
|
Loans
|
Notes and Certificates
|
|||||||||||||||
|
March 31, 2015
|
December 31, 2014
|
March 31, 2015
|
December 31, 2014
|
|||||||||||||
|
Aggregate principal balance outstanding
|
$
|
3,276,356
|
|
$
|
2,836,729
|
|
$
|
3,295,034
|
|
$
|
2,851,837
|
|
||||
|
Net fair value adjustments
|
(45,695
|
)
|
(38,224
|
)
|
(45,688
|
)
|
(38,219
|
)
|
||||||||
|
Fair value
|
$
|
3,230,661
|
|
$
|
2,798,505
|
|
$
|
3,249,346
|
|
$
|
2,813,618
|
|
||||
|
Original term
|
12 - 60 months
|
12 - 60 months
|
||||||||||||||
|
Interest rates (fixed)
|
5.79% - 29.90%
|
5.79% - 29.90%
|
||||||||||||||
|
Maturity dates
|
≤ March 2020
|
≤ December 2019
|
||||||||||||||
We place loans on non-accrual status once they are
120
days past due, including loans to borrowers who have filed for bankruptcy. At
March 31, 2015
and
December 31, 2014
, loans for which the borrower has filed for bankruptcy or is deceased, or that were
90 days
or more past due (including non-accrual loans), were as follows:
|
March 31, 2015
|
December 31, 2014
|
|||||||||||||||
|
> 90 days past due
(1)
|
Non-accrual loans
|
> 90 days past due
(1)
|
Non-accrual loans
|
|||||||||||||
|
Outstanding principal balance
|
$
|
20,202
|
|
$
|
948
|
|
$
|
19,790
|
|
$
|
1,373
|
|
||||
|
Net fair value adjustments
|
(19,186
|
)
|
(886
|
)
|
(18,825
|
)
|
(1,289
|
)
|
||||||||
|
Fair value
|
$
|
1,016
|
|
$
|
62
|
|
$
|
965
|
|
$
|
84
|
|
||||
|
# of loans (not in thousands)
|
1,869
|
|
95
|
|
1,797
|
|
125
|
|
||||||||
(1)
Includes all loans for which the borrower has filed for bankruptcy or is deceased, or that were 90 days or more past due (including non-accrual loans).
7
LENDINGCLUB CORPORATION
Notes to Consolidated Financial Statements
(Tabular Amounts in Thousands, Except Share and Per Share Amounts, Ratios, or as Noted)
(Unaudited)
Loan Servicing Rights
Servicing assets and liabilities related to retained servicing rights are recorded at fair value, in “Other assets” and “Accrued expenses and other liabilities”, respectively. At
March 31, 2015
, loans underlying loan servicing rights had a total outstanding principal balance of
$2,296.9 million
, original terms between
12
and
84 months
,
monthly
payments with fixed interest rates ranging from
3.99%
to
33.15%
and maturity dates through
March 2022
. At
December 31, 2014
, loans underlying loan servicing rights had a total outstanding principal balance of
$1,872.4 million
, original terms between
12
and
60 months
,
monthly
payments with fixed interest rates ranging from
5.90%
to
33.15%
and maturity dates through
December 2019
.
5. Fair Value of Financial Instruments Measured at Fair Value
Financial Instruments Recorded at Fair Value
For a description of the fair value hierarchy and the Company’s fair value methodologies, see
Part II - Item 8 - Financial Statements and Supplementary Data - Note 2 - Summary of Significant Accounting Policies
in the Company’s Annual Report. There were no significant changes in these methodologies during the three months ended
March 31, 2015
. The Company did not transfer any assets or liabilities in or out of level 3 during the three months ended
March 31, 2015
or the year ended
December 31, 2014
. As our loans and related notes and certificates, and loan servicing rights do not trade in an active market with readily observable prices, we use significant unobservable inputs to measure the fair value of these assets and liabilities. Accordingly, we classify them as level 3 as follows:
|
Level 1 Inputs
|
Level 2 Inputs
|
Level 3 Inputs
|
Total Fair Value
|
|||||||||||
|
March 31, 2015
|
||||||||||||||
|
Assets:
|
||||||||||||||
|
Loans
|
—
|
|
—
|
|
$
|
3,230,661
|
|
$
|
3,230,661
|
|
||||
|
Servicing assets
|
—
|
|
—
|
|
3,496
|
|
3,496
|
|
||||||
|
Total assets
|
—
|
|
—
|
|
$
|
3,234,157
|
|
$
|
3,234,157
|
|
||||
|
Liabilities:
|
||||||||||||||
|
Notes and certificates
|
—
|
|
—
|
|
$
|
3,249,346
|
|
$
|
3,249,346
|
|
||||
|
Servicing liabilities
|
—
|
|
—
|
|
4,397
|
|
4,397
|
|
||||||
|
Total liabilities
|
—
|
|
—
|
|
$
|
3,253,743
|
|
$
|
3,253,743
|
|
||||
|
December 31, 2014
|
||||||||||||||
|
Assets:
|
||||||||||||||
|
Loans
|
—
|
|
—
|
|
$
|
2,798,505
|
|
$
|
2,798,505
|
|
||||
|
Servicing assets
|
—
|
|
—
|
|
2,181
|
|
2,181
|
|
||||||
|
Total assets
|
—
|
|
—
|
|
$
|
2,800,686
|
|
$
|
2,800,686
|
|
||||
|
Liabilities:
|
||||||||||||||
|
Notes and certificates
|
—
|
|
—
|
|
$
|
2,813,618
|
|
$
|
2,813,618
|
|
||||
|
Servicing liabilities
|
—
|
|
—
|
|
3,973
|
|
3,973
|
|
||||||
|
Total liabilities
|
—
|
|
—
|
|
$
|
2,817,591
|
|
$
|
2,817,591
|
|
||||
8
LENDINGCLUB CORPORATION
Notes to Consolidated Financial Statements
(Tabular Amounts in Thousands, Except Share and Per Share Amounts, Ratios, or as Noted)
(Unaudited)
Financial instruments are categorized in the level 3 valuation hierarchy based on the significance of unobservable factors in the overall fair value measurement. These fair value estimates may also include observable, actively quoted components derived from external sources. As a result, the realized and unrealized gains and losses for assets and liabilities within the level 3 category may include changes in fair value that were attributable to both observable and unobservable inputs.
Significant Unobservable Inputs
The following table presents quantitative information about the significant unobservable inputs used for our level 3 fair value measurements at
March 31, 2015
and
December 31, 2014
:
|
March 31, 2015
|
|||||||||||
|
Range of Inputs
|
|||||||||||
|
Financial Instrument
|
Unobservable Input
|
Minimum
|
Maximum
|
Weighted- Average
|
|||||||
|
Loans, notes and certificates
|
Discount rates
|
5.1
|
%
|
17.2
|
%
|
10.0
|
%
|
||||
|
Net cumulative expected loss rates
|
0.3
|
%
|
22.2
|
%
|
10.2
|
%
|
|||||
|
Servicing asset/liability
|
Discount rates
|
3.5
|
%
|
23.4
|
%
|
10.4
|
%
|
||||
|
Net cumulative expected loss rates
|
0.3
|
%
|
22.2
|
%
|
10.2
|
%
|
|||||
|
Cumulative prepayment rates
|
16.4
|
%
|
36.0
|
%
|
21.5
|
%
|
|||||
|
Market servicing rates (% per annum on unpaid principal balance)
|
0.5
|
%
|
0.7
|
%
|
0.5
|
%
|
|||||
|
December 31, 2014
|
|||||||||||
|
Range of Inputs
|
|||||||||||
|
Financial Instrument
|
Unobservable Input
|
Minimum
|
Maximum
|
Weighted- Average
|
|||||||
|
Loans, notes and certificates
|
Discount rates
|
5.2
|
%
|
17.4
|
%
|
10.1
|
%
|
||||
|
Net cumulative expected loss rates
|
0.3
|
%
|
22.0
|
%
|
10.0
|
%
|
|||||
|
Servicing asset/liability
|
Discount rates
|
5.3
|
%
|
23.7
|
%
|
10.7
|
%
|
||||
|
Net cumulative expected loss rates
|
0.3
|
%
|
22.0
|
%
|
10.2
|
%
|
|||||
|
Cumulative prepayment rates
|
16.5
|
%
|
26.7
|
%
|
20.0
|
%
|
|||||
|
Market servicing rates (% per annum on unpaid principal balance)
|
0.5
|
%
|
0.7
|
%
|
0.5
|
%
|
|||||
At
March 31, 2015
, the discounted cash flow methodology used to estimate the note and certificates fair values used the same projected cash flows as the related loans. As demonstrated in the following table, the fair value adjustments for loans were largely offset by the fair value adjustments of the notes and certificates due to the member payment dependent design of the notes and certificates and because the principal balances of the loans were very close to the combined principal balances of the notes and certificates.
9
LENDINGCLUB CORPORATION
Notes to Consolidated Financial Statements
(Tabular Amounts in Thousands, Except Share and Per Share Amounts, Ratios, or as Noted)
(Unaudited)
The following tables present additional information about level 3 loans, notes and certificates measured at fair value on a recurring basis for the three months ended
March 31, 2015
and
2014
:
|
Loans
|
Notes and Certificates
|
||||||
|
Fair value at December 31, 2013
|
$
|
1,829,042
|
|
$
|
1,839,990
|
|
|
|
Purchases of loans
|
776,801
|
|
—
|
|
|||
|
Issuances of notes and certificates
|
—
|
|
510,962
|
|
|||
|
Whole loan sales
|
(265,582
|
)
|
—
|
|
|||
|
Principal payments
|
(204,950
|
)
|
(205,274
|
)
|
|||
|
Recoveries from sale and collection of charged-off loans
|
(744
|
)
|
(734
|
)
|
|||
|
Carrying value before fair value adjustments
|
2,134,567
|
|
2,144,944
|
|
|||
|
Fair value adjustments, included in net loss
|
(24,749
|
)
|
(24,717
|
)
|
|||
|
Fair value at March 31, 2014
|
$
|
2,109,818
|
|
$
|
2,120,227
|
|
|
|
Loans
|
Notes and Certificates
|
||||||
|
Fair value at December 31, 2014
|
$
|
2,798,505
|
|
$
|
2,813,618
|
|
|
|
Purchases of loans
|
1,474,972
|
|
—
|
|
|||
|
Issuances of notes and certificates
|
—
|
|
852,715
|
|
|||
|
Whole loan sales
|
(622,145
|
)
|
—
|
|
|||
|
Principal payments
|
(369,379
|
)
|
(365,711
|
)
|
|||
|
Recoveries from sale and collection of charged-off loans
|
(3,472
|
)
|
(3,461
|
)
|
|||
|
Carrying value before fair value adjustments
|
3,278,481
|
|
3,297,161
|
|
|||
|
Fair value adjustments, included in net loss
|
(47,820
|
)
|
(47,815
|
)
|
|||
|
Fair value at March 31, 2015
|
$
|
3,230,661
|
|
$
|
3,249,346
|
|
|
The following table presents additional information about level 3 servicing assets and liabilities measured at fair value on a recurring basis for the three months ended
March 31, 2015
and
2014
:
|
Three Months Ended March 31, 2015
|
Three Months Ended March 31, 2014
|
|||||||||||||||
|
Servicing Assets
|
Servicing Liabilities
|
Servicing Assets
|
Servicing Liabilities
|
|||||||||||||
|
Fair value at beginning of period
|
$
|
2,181
|
|
$
|
3,973
|
|
$
|
534
|
|
$
|
936
|
|
||||
|
Issuances
(1)
|
1,508
|
|
1,412
|
|
442
|
|
512
|
|
||||||||
|
Changes in fair value, included in servicing fees
|
(491
|
)
|
(988
|
)
|
(112
|
)
|
(227
|
)
|
||||||||
|
Additions, included in deferred revenue
|
298
|
|
—
|
|
—
|
|
—
|
|
||||||||
|
Fair value at end of period
|
$
|
3,496
|
|
$
|
4,397
|
|
$
|
864
|
|
$
|
1,221
|
|
||||
|
(1)
|
Represents the offset to the gain or loss on sale of the related loan, recorded in other revenue.
|
10
LENDINGCLUB CORPORATION
Notes to Consolidated Financial Statements
(Tabular Amounts in Thousands, Except Share and Per Share Amounts, Ratios, or as Noted)
(Unaudited)
Significant Recurring Level 3 Fair Value Asset and Liability Input Sensitivity
The majority of fair value adjustments included in net loss are attributable to changes in estimated instrument-specific future credit losses. All fair valuation adjustments were related to level 3 instruments for the three months ended
March 31, 2015
and
2014
. A specific loan that is projected to have higher future default losses than previously estimated has lower expected future cash flows over its remaining life, which reduces its estimated fair value. Conversely, a specific loan that is projected to have lower future default losses than previously estimated has increased expected future cash flows over its remaining life, which increases its fair value.
Changes in the unobservable inputs discussed above may have a significant impact on the fair value of loans, notes and certificates, or servicing assets and liabilities. Certain of these unobservable inputs will (in isolation) have a directionally consistent impact on the fair value of the financial instrument for a given change in that input. Alternatively, the fair value of the financial instrument may move in an opposite direction for a given change in another input. When multiple inputs are used within the valuation techniques for loans, notes and certificates, or servicing assets and liabilities, a change in one input in a certain direction may be offset by an opposite change from another input.
Generally, changes in the net cumulative expected loss rates and discount rates will have an immaterial impact on the fair value of loans, notes, certificates, and servicing assets and liabilities. Additionally, changes in prepayment rates will have an immaterial impact on the fair value of loans and notes and certificates.
Our selection of the most representative prepayment rates and market servicing rates for our loans is inherently judgmental. We reviewed third-party servicing rates for assets in similar credit sectors and determined that market servicing rates on our products of
0.40%
to
0.70%
of outstanding principal are reasonable. Expected prepayments are based on analyses of actual prepayment experience of loans considering their various types, terms, and credit grades. The table below shows the estimated impact on our estimated fair value of servicing assets and liabilities, calculated using different market servicing and prepayment rate assumptions as of
March 31, 2015
and
December 31, 2014
:
|
March 31, 2015
|
December 31, 2014
|
||||||||||||||
|
Servicing Assets
|
Servicing Liabilities
|
Servicing Assets
|
Servicing Liabilities
|
||||||||||||
|
Weighted-average market servicing rate assumptions
|
0.50
|
%
|
0.50
|
%
|
0.50
|
%
|
0.50
|
%
|
|||||||
|
Change in fair value from:
|
|||||||||||||||
|
Servicing rate increase to 0.60%
|
|
($1,299
|
)
|
1,537
|
|
|
($915
|
)
|
|
$1,416
|
|
||||
|
Servicing rate decrease to 0.40%
|
1,365
|
|
(1,471
|
)
|
|
$965
|
|
|
($1,366
|
)
|
|||||
|
Weighted-average cumulative prepayment rate assumptions
|
21.5
|
%
|
21.5
|
%
|
20.0
|
%
|
20.0
|
%
|
|||||||
|
Change in fair value from:
|
|||||||||||||||
|
25% increase in cumulative prepayments
|
|
($120
|
)
|
|
($277
|
)
|
|
($65
|
)
|
|
($228
|
)
|
|||
|
25% decrease in cumulative prepayments
|
126
|
|
285
|
|
|
$67
|
|
|
$231
|
|
|||||
Financial Instruments Not Recorded at Fair Value
At
March 31, 2015
and
December 31, 2014
, the carrying amount of all financial assets and liabilities not recorded at fair value approximated fair value due to the short term nature of these assets and liabilities. Instruments to which this applies include: cash and cash equivalents, restricted cash, accrued interest receivable and payable, accounts payable, and payables to investors.
11
LENDINGCLUB CORPORATION
Notes to Consolidated Financial Statements
(Tabular Amounts in Thousands, Except Share and Per Share Amounts, Ratios, or as Noted)
(Unaudited)
6. Property, Equipment and Software, net
Property, equipment and software consist of the following:
|
March 31, 2015
|
December 31, 2014
|
||||||||
|
Internally developed software
|
$
|
20,836
|
|
$
|
16,023
|
|
|||
|
Computer equipment
|
8,817
|
|
7,929
|
|
|||||
|
Leasehold improvements
|
5,604
|
|
4,802
|
|
|||||
|
Purchased software
|
3,525
|
|
3,326
|
|
|||||
|
Furniture and fixtures
|
2,826
|
|
2,405
|
|
|||||
|
Construction in progress
|
814
|
|
549
|
|
|||||
|
Total property, equipment and software
|
42,422
|
|
35,034
|
|
|||||
|
Accumulated depreciation and amortization
|
(11,127
|
)
|
(7,983
|
)
|
|||||
|
Property, equipment and software, net
|
$
|
31,295
|
|
$
|
27,051
|
|
|||
Depreciation and amortization expense on property, equipment and software for the three months ended
March 31, 2015
and
2014
was
$3.1 million
and
$1.0 million
, respectively.
7. Other Assets
Other assets consist of the following:
|
March 31, 2015
|
December 31, 2014
|
||||||||
|
Prepaid expenses
|
$
|
8,151
|
|
$
|
6,807
|
|
|||
|
Deferred acquisition compensation
|
2,401
|
|
2,695
|
|
|||||
|
Loan servicing assets at fair value
|
3,496
|
|
2,181
|
|
|||||
|
Accounts receivable
|
2,282
|
|
1,744
|
|
|||||
|
Deposits
|
665
|
|
657
|
|
|||||
|
Receivable from investors
|
340
|
|
155
|
|
|||||
|
Tenant improvement receivable
|
172
|
|
—
|
|
|||||
|
Other
|
211
|
|
93
|
|
|||||
|
Total other assets
|
$
|
17,718
|
|
$
|
14,332
|
|
|||
8. Intangible Assets and Goodwill
Intangible Assets
The Company's intangible asset balance of
$34.8 million
at
March 31, 2015
did not significantly change during the three months ended
March 31, 2015
.
Amortization expense associated with intangible assets for the three months ended
March 31, 2015
was
$1.5 million
. The Company did not have any intangible assets as of
March 31, 2014
, and accordingly, did not have any amortization expense for the three months ended
March 31, 2014
.
Goodwill
The Company's goodwill balance of
$72.7 million
at
March 31, 2015
did not significantly change during the three months ended
March 31, 2015
. We did not record any goodwill impairment expense for the three months ended
March 31, 2015
.
12
LENDINGCLUB CORPORATION
Notes to Consolidated Financial Statements
(Tabular Amounts in Thousands, Except Share and Per Share Amounts, Ratios, or as Noted)
(Unaudited)
9. Accrued Expenses and Other Liabilities
Accrued expenses and other liabilities consist of the following:
|
March 31, 2015
|
December 31, 2014
|
|||||||
|
Accrued expenses
|
$
|
10,414
|
|
$
|
6,220
|
|
||
|
Accrued compensation
|
8,756
|
|
13,659
|
|
||||
|
Loan servicing liabilities at fair value
|
4,397
|
|
3,973
|
|
||||
|
Deferred rent
|
2,085
|
|
1,377
|
|
||||
|
Deferred tax liability
|
1,961
|
|
1,332
|
|
||||
|
Deferred revenue
|
1,057
|
|
759
|
|
||||
|
Loan funding payables
|
802
|
|
—
|
|
||||
|
Transaction fee refund reserve
|
643
|
|
828
|
|
||||
|
Payable to issuing bank
|
565
|
|
267
|
|
||||
|
Contingent liabilities
|
475
|
|
1,995
|
|
||||
|
Early stock option exercise liability
|
284
|
|
392
|
|
||||
|
Other
|
347
|
|
818
|
|
||||
|
Total accrued expenses and other liabilities
|
$
|
31,786
|
|
$
|
31,620
|
|
||
10. Employee Incentive and Retirement Plans
The Company’s equity incentive plans provide for granting stock options and restricted stock units (RSUs) to employees, officers and directors. In addition, the Company offers a retirement plan and an Employee Stock Purchase Plan (“ESPP”) to eligible employees.
There were no significant changes to the Company's retirement plan or to the stock issued related to the Springstone acquisition during the three months ended
March 31, 2015
.
Stock-based compensation expense was as follows for the periods presented:
|
Three Months Ended March 31,
|
||||||||
|
2015
|
2014
|
|||||||
|
Stock options
|
$
|
7,086
|
|
$
|
7,033
|
|
||
|
ESPP
|
479
|
|
—
|
|
||||
|
RSUs
|
481
|
|
—
|
|
||||
|
Stock issued related to acquisition
|
3,547
|
|
—
|
|
||||
|
Total stock-based compensation expense
|
$
|
11,593
|
|
$
|
7,033
|
|
||
13
LENDINGCLUB CORPORATION
Notes to Consolidated Financial Statements
(Tabular Amounts in Thousands, Except Share and Per Share Amounts, Ratios, or as Noted)
(Unaudited)
This stock-based compensation expense was recorded in the consolidated statement of operations as follows:
|
Three Months Ended March 31,
|
||||||||
|
2015
|
2014
|
|||||||
|
Sales and marketing
|
$
|
1,519
|
|
$
|
3,502
|
|
||
|
Origination and servicing
|
721
|
|
358
|
|
||||
|
General and administrative:
|
||||||||
|
Engineering and product development
|
1,406
|
|
737
|
|
||||
|
Other
|
7,947
|
|
2,436
|
|
||||
|
Total stock-based compensation expense
|
$
|
11,593
|
|
$
|
7,033
|
|
||
We capitalized
$0.8 million
and
$0.3 million
of stock-based compensation expense associated with the cost of developing software for internal use during the three months ended
March 31, 2015
and
2014
, respectively.
Stock Options
There were no significant changes to the Company's incentive plans or methodology related to stock options valuation during the three months ended
March 31, 2015
.
We use the Black-Scholes option pricing model to estimate the fair value of stock options granted with the following assumptions during the periods presented:
|
Three Months Ended March 31,
|
||||||
|
2015
|
2014
|
|||||
|
Expected dividend yield
|
—
|
|
—
|
|
||
|
Weighted-average assumed stock price volatility
|
49.9
|
%
|
54.7
|
%
|
||
|
Weighted-average risk-free rate
|
1.56
|
%
|
1.90
|
%
|
||
|
Weighted-average expected life (in years)
|
6.25
|
|
6.33
|
|
||
14
LENDINGCLUB CORPORATION
Notes to Consolidated Financial Statements
(Tabular Amounts in Thousands, Except Share and Per Share Amounts, Ratios, or as Noted)
(Unaudited)
The following table summarizes the activities for our options for the three months ended
March 31, 2015
:
|
Number of Shares
|
Weighted-
Average Exercise Price Per Share |
Weighted-Average Remaining Contractual Life (in years)
|
Aggregate Intrinsic Value
|
||||||||||
|
Outstanding at December 31, 2014
|
57,386,829
|
|
$
|
3.15
|
|
||||||||
|
Options granted
|
768,500
|
|
$
|
20.81
|
|
||||||||
|
Options exercised
|
(531,822
|
)
|
$
|
1.62
|
|
||||||||
|
Options forfeited/expired
|
(390,152
|
)
|
$
|
7.11
|
|
||||||||
|
Outstanding at March 31, 2015
|
57,233,355
|
|
$
|
3.37
|
|
7.81
|
$
|
932,931
|
|
||||
|
Vested and expected to vest at March 31, 2015
|
56,450,213
|
|
$
|
3.29
|
|
7.77
|
$
|
924,352
|
|
||||
|
Exercisable at March 31, 2015
|
24,343,206
|
|
$
|
0.92
|
|
6.65
|
$
|
461,441
|
|
||||
For the three months ended
March 31, 2015
, we granted service-based stock options to purchase
768,500
shares of common stock with a weighted average exercise price of
$20.81
per share, a weighted average grant date fair value of
$10.27
per share and an aggregate estimated fair value of
$7.9 million
. For the three months ended
March 31, 2014
, we granted service-based stock options to purchase
14,218,940
shares of common stock with a weighted average exercise price of
$4.99
per share, a weighted average grant date fair value of
$4.20
per share and a total estimated fair value of
$59.7 million
.
Options to purchase
531,822
shares with a total intrinsic value of
$10.8 million
were exercised during the three months ended
March 31, 2015
. Options to purchase
1,439,124
shares with a total intrinsic value of
$6.4 million
were exercised during the three months ended
March 31, 2014
.
The total grant date fair value of stock options vested during the three months ended
March 31, 2015
and
2014
was
$6.1 million
and
$3.9 million
, respectively. For the three months ended
March 31, 2014
, we incurred
$3.0 million
of expense for the accelerated vesting of stock options for a terminated employee that was accounted for as a stock option modification. We did not accelerate vesting of any stock options for the three months ended
March 31, 2015
.
As of
March 31, 2015
total unrecognized compensation cost was
$115.0 million
and these costs are expected to be recognized over the next
3.06
years.
Since the Company holds a full valuation allowance against all deferred tax benefits, no income tax benefit has been recognized for stock-based compensation expense or for exercised stock options.
15
LENDINGCLUB CORPORATION
Notes to Consolidated Financial Statements
(Tabular Amounts in Thousands, Except Share and Per Share Amounts, Ratios, or as Noted)
(Unaudited)
Restricted Stock Units
During the three months ended
March 31, 2015
, the Company began issuing RSUs to certain employees, officers, and directors. The following table summarizes the activities for our RSUs for the three months ended
March 31, 2015
:
|
Number of Shares
|
Weighted-
Average Grant Date Fair Value |
|||||
|
Unvested at December 31, 2014
|
—
|
|
$
|
—
|
|
|
|
RSUs granted
|
975,763
|
|
$
|
20.51
|
|
|
|
RSUs vested
|
—
|
|
$
|
—
|
|
|
|
RSUs forfeited/expired
|
(2,746
|
)
|
$
|
20.51
|
|
|
|
Unvested at March 31, 2015
|
973,017
|
|
$
|
20.51
|
|
|
|
Expected to vest after March 31, 2015
|
796,360
|
|
$
|
20.51
|
|
|
For the three months ended
March 31, 2015
, we granted
975,763
RSUs with an aggregate fair value of
$20.0 million
.
As of
March 31, 2015
, there was
$19.5 million
of unrecognized compensation cost related to unvested RSUs. This amount is expected to be recognized over a weighted-average period of
3.9 years
.
Employee Stock Purchase Plan
There were no significant changes to the terms of the Company's ESPP during the three months ended
March 31, 2015
.
As of
March 31, 2015
, a total of
3,000,000
shares of common stock were reserved for issuance under the ESPP. As of March 31, 2015, employees had not purchased any shares under the ESPP and all
3,000,000
shares remain available for future issuance.
The fair value of stock purchase rights granted to employees under the ESPP is measured on the grant date using the Black-Scholes option pricing model. The compensation expense related to ESPP purchase rights is recognized on a straight-line basis, net of estimated forfeitures, over the
6
-month requisite service period. We used the following assumptions in estimating the fair value of the grant under the ESPP in December 2014, which are derived using the same methodology applied to stock option assumptions:
|
Expected dividend yield
|
—
|
|
|
Weighted-average assumed stock price volatility
|
48.2
|
%
|
|
Weighted-average risk-free rate
|
0.09
|
%
|
|
Weighted-average expected life (in years)
|
0.5
|
|
There were no grants under the ESPP during the three months ended
March 31, 2015
.
16
LENDINGCLUB CORPORATION
Notes to Consolidated Financial Statements
(Tabular Amounts in Thousands, Except Share and Per Share Amounts, Ratios, or as Noted)
(Unaudited)
11. Income Taxes
For the three months ended
March 31, 2015
we recorded income tax expense of
$0.6 million
due to recognition of a full valuation allowance against deferred tax assets as well as the amortization of tax deductible goodwill which gives rise to an indefinite-lived deferred tax liability. For the three months ended
March 31, 2014
, we recorded
no
income tax expense or benefit due to a full valuation allowance recorded against our deferred tax assets.
We assess the available positive and negative evidence to estimate if sufficient future taxable income will be generated to utilize the existing deferred tax assets. On the basis of this evaluation, as of
March 31, 2015
, a full valuation allowance of
$40.8 million
has been recorded to recognize only deferred tax assets that are more likely than not to be realized.
12. Commitments and Contingencies
Operating Lease Commitments
Our corporate headquarters is located in San Francisco, California and consists of approximately
141,000
square feet of space under lease agreements that mostly expire in
June 2022
. Under these lease agreements, we have an option to extend nearly all of the space under the leases for
five
years. We have additional leased office space of approximately
20,000
square feet in Westborough, Massachusetts under a lease agreement that expires in
January 2020
.
Total facilities rental expense for the three months ended
March 31, 2015
and
2014
was
$1.4 million
and
$0.7 million
, respectively. Minimum lease payments for the three months ended
March 31, 2015
and
2014
was
$1.2 million
and
$0.6 million
, respectively. As part of these lease agreements, as of
March 31, 2015
we have pledged
$0.6 million
of cash and arranged for a
$0.2 million
letter of credit as security deposits.
Loan Funding and Purchase Commitments
For loans listed on the platform as a result of direct marketing efforts, we have committed to invest in such loans if investors do not provide funding for all or a portion of such loans. At
March 31, 2015
, there were
192
such loans on the platform with an unfunded balance of
$1.9 million
. All of these loans were fully funded by investors by
April 3, 2015
.
In connection with transitional activities related to the acquisition of Springstone, in
June 2014
, we entered into a contingent loan purchase agreement with an issuing bank that originates loans facilitated by Springstone and a third-party investor that has agreed to purchase certain of these loans from the issuing bank. In
March 2015
, this purchase agreement was extended to
January 2016
. The contingent loan purchase commitment provides that we will purchase such loans from the bank if the third-party investor defaults on its loan purchase obligations to the bank through
January 2016
. The remaining limit of this contingent loan purchase commitment was
$53.9 million
at
March 31, 2015
. We were not required to purchase any such loans pursuant to the contingent loan purchase commitment during the three months ended
March 31, 2015
.
Credit Support Agreement
We are subject to a credit support agreement with a certificate investor. The credit support agreement requires us to pledge and restrict cash in support of its contingent obligation to reimburse the investor for credit losses on loans underlying the investor’s certificate that are in excess of a specified, aggregate loss threshold. We are contingently obligated to pledge cash, not to exceed
$5.0 million
, to support this contingent obligation. As of
March 31, 2015
, approximately
$3.4 million
was pledged and restricted to support this contingent obligation.
17
LENDINGCLUB CORPORATION
Notes to Consolidated Financial Statements
(Tabular Amounts in Thousands, Except Share and Per Share Amounts, Ratios, or as Noted)
(Unaudited)
As of
March 31, 2015
, the credit losses pertaining to the investor’s certificates have not exceeded the specified threshold, nor are future credit losses expected to exceed the specified threshold, and thus no liability has been recorded. We currently do not anticipate recording losses under this credit support agreement. If losses related to the credit support agreement are later determined to be likely to occur and are estimable, results of operations could be affected in the period in which such losses are recorded.
Loan Purchase Obligation
Under our loan account program with WebBank, our primary issuing bank, WebBank retains ownership of the loans facilitated through our marketplace for two business days after origination. As part of this arrangement, we have committed to purchase the loans at par plus accrued interest, at the conclusion of the two business days. As of
March 31, 2015
we were committed to purchase loans with an outstanding principal balance of
$3.6 million
at par plus accrued interest.
Legal
On June 5, 2014, Springstone received a Civil Investigative Demand from the Consumer Financial Protection Bureau, referred to as CFPB, related to the period from 2009 through May 2014. The purpose of the investigation is to determine whether Springstone engaged in unlawful acts or practices in connection with the marketing, issuance, and servicing of loans for healthcare related financing during the period. We have had and continue to hold discussions with the CFPB staff regarding the possible resolution of this matter.
In addition to the foregoing, we may be subject to legal proceedings and regulatory actions in the ordinary course of business. We do not believe it is probable that the ultimate liability, if any, arising out of any such matter will have a material effect on our financial condition, results of operations or cash flows.
13. Segment Reporting
We report segment information using the “management approach.” Under this approach, operating segments are identified in substantially the same manner as they are reported internally and used by us for purposes of evaluating performance and allocating resources. Based on this approach, we have
one
reportable segment. Our management reporting process is based on our internal operating structure.
14. Related Party Transactions
Several of our executive officers and directors (including immediate family members) have opened investor accounts with LC, made deposits and withdrawals to their accounts and purchased notes and certificates. All note and certificate purchases made by related parties were transacted on terms and conditions that were not more favorable than those obtained by other investors.
The deposits made by related parties whose transactions totaled
$120,000
or more were
$0.3 million
and
$0.2 million
for the three months ended
March 31, 2015
and
2014
, respectively. The withdrawals made by related parties whose transactions totaled
$120,000
or more was
$0.3 million
for the three months ended
March 31, 2015
. There were no withdrawals made by related parties whose transactions totaled
$120,000
or more for the three months ended
March 31, 2014
.
15. Springstone Acquisition
In April 2015, we completed the allocation of the purchase price of our acquisition of Springstone to acquired assets and liabilities. There were no material adjustments to the preliminary purchase price allocation as included in
Part II - Item 8 - Financial Statements and Supplementary Data - Note 17 - Springstone Acquisition
in our Annual Report.
18
LENDINGCLUB CORPORATION
Notes to Consolidated Financial Statements
(Tabular Amounts in Thousands, Except Share and Per Share Amounts, Ratios, or as Noted)
(Unaudited)
The following 2014 pro forma financial information summarizes the combined results of operations for us and Springstone, as though the companies were combined as of January 1, 2013. These pro forma results have been prepared for comparative purposes only and do not purport to be indicative of the results of operations which would have resulted had the acquisition occurred as of January 1, 2013, nor is it indicative of future operating results. The pro forma results presented below include interest expense on the debt financing, amortization of acquired intangible assets, compensation expense related to the post-acquisition compensation arrangements entered into with the continuing employees, and tax expense. Results for the three months ended March 31, 2015 as presented in the Consolidated Statements of Operations reflect consolidated results, including Springstone, for the full period.
|
Three Months Ended March 31, 2014
|
|||
|
Total net revenue
|
$
|
43,514
|
|
|
Net loss
|
$
|
(7,708
|
)
|
|
Basic net loss per share attributable to common stockholders
|
$
|
(0.14
|
)
|
|
Diluted net loss per share attributable to common stockholders
|
$
|
(0.14
|
)
|
16. Subsequent Events
On
April 16, 2015
, the Company entered into a lease agreement for additional office space in San Francisco, California. The lease agreement commences in the second quarter of 2015 with delivery of portions of the leased space to occur in stages through March 2017. The lease agreement expires on March 31, 2026, with the right to renew the lease term for
two
consecutive renewal terms of
five years
each.
Expected annual minimum lease payments related to this additional office space are
$0.4 million
,
$4 million
and
$6 million
, respectively, for fiscal years 2015, 2016 and 2017. Expected annual minimum lease payments are
$7 million
to
$9 million
from 2018-2025 and
$2 million
in 2026.
19
LENDINGCLUB CORPORATION
Management's Discussion and Analysis of Financial Condition and Results of Operations
(Tabular Amounts in Thousands, Except Share and Per Share Data and Ratios, or as Noted)
Item 2. Management’s Discussion and Analysis of Financial Condition and Results of Operations
The following discussion and analysis of our financial condition and results of operations should be read in conjunction with the consolidated financial statements and related notes that appear in this Quarterly Report on Form 10-Q (Report). In addition to historical consolidated financial information, the following discussion contains forward-looking statements that reflect our plans, estimates and beliefs. Our actual results could differ materially from those discussed in the forward-looking statements. Factors that could cause or contribute to these differences include those discussed below and elsewhere in this Report, particularly in Part I - Item 1A - Risk Factors in the Company's Annual Report on Form 10-K for the year ended December 31, 2014 (Annual Report).
Overview
Lending Club is the world’s largest online marketplace connecting borrowers and investors. We believe a technology-powered marketplace is a more efficient mechanism to allocate capital between borrowers and investors than the traditional banking system. Consumers and small business owners borrow through Lending Club to lower the cost of their credit and enjoy a better experience than traditional bank lending. Investors use Lending Club to earn attractive risk-adjusted returns from an asset class that has generally been closed to many investors and only available on a limited basis to institutional investors.
Since beginning operations in
2007
, our marketplace has facilitated
$9.3 billion
in loan originations. These loans were facilitated through the following investment channels: (i) the issuance of notes, (ii) the sale of certificates, or (iii) the sale of whole loans to qualified investors. In the first quarter of
2015
, our marketplace facilitated
$1.6 billion
of loan originations, of which approximately
$0.3 billion
were invested in through notes,
$0.5 billion
were invested in through certificates and
$0.8 billion
were invested in through whole loan sales.
Our trusted brand, scale and network effect drives significant borrowing and investing activity on our marketplace. We generate revenue from transaction fees from our marketplace’s role in matching borrowers with investors to enable loan originations, servicing fees from investors and management fees from investment funds and other managed accounts. We do not assume credit risk or use our own capital to invest in loans facilitated by our marketplace, except in limited circumstances and in amounts that are not material. The capital to invest in the loans enabled through our marketplace comes directly from investors. Our proprietary technology automates key aspects of our operations, including the borrower application process, data gathering, credit decisioning and scoring, loan funding, investing and servicing, regulatory compliance and fraud detection. We operate with a lower cost structure than traditional banks due to our innovative model, online delivery and process automation, without the physical branches, legacy technology or high overhead associated with the traditional banking system.
Our marketplace is where borrowers and investors engage in transactions relating to unsecured standard or custom program loans. Standard program loans which are part of the publicly available standard program, are three- or five-year unsecured personal loans which are offered to borrowers with a FICO score of at least 660 and that meet other strict credit criteria. These loans can be invested in through the purchase of notes issued pursuant to a note registration statement, and are only available through our website. Separately, qualified investors may also invest in standard program loans in private transactions not facilitated through our website. Custom program loans are only invested in through private transactions with qualified investors, for which notes are not available and are not visible through our public website. Custom program loans include small business loans, super prime consumer loans, lending platform loans, education and patient finance loans and personal loans that do not meet the requirements of standard program loans.
20
LENDINGCLUB CORPORATION
Management's Discussion and Analysis of Financial Condition and Results of Operations
(Tabular Amounts in Thousands, Except Share and Per Share Data and Ratios, or as Noted)
The transaction fees we receive from issuing banks in connection with our marketplace’s role in facilitating loan originations range from
1%
to
6%
of the initial principal amount of the loan as of
March 31, 2015
. In addition, for education and patient finance loans, transaction fees may exceed
6%
. Servicing fees paid to us vary based on investment channel. Note investors generally pay us a servicing fee equal to
1%
of each payment amount received from the borrower; whole loan purchasers pay a monthly servicing fee up to
1.3%
per annum on the month-end principal balance of loans serviced and certificate holders generally pay a monthly management fee ranging from
0.7%
to
1.5%
per annum of the month-end balance of assets under management.
Loans to qualified borrowers are originated by issuing banks. Investors can invest in loans that are offered through our marketplace in one or all of the following channels:
Notes:
Pursuant to an effective shelf registration statement, investors who meet the applicable financial suitability requirements and have completed our investor account opening process may purchase unsecured, borrower payment dependent notes that correspond to payments received on an underlying standard program loan selected by the investor. When an investor registers with us, the investor enters into an investor agreement with us that governs the investor’s purchases of notes. Our note channel is supported by our website knowledge base and our investor services group who provide basic customer support to these investors.
Certificates and Investment Funds:
Accredited investors and qualified purchasers may establish a relationship with LCA or another third-party advisor in order to indirectly invest in certificates, or they may directly purchase a certificate or interests in separate limited partnership entities that purchase certificates. The certificates are unsecured and are settled with cash flows from underlying standard or custom program loans selected by the investor. Neither certificates nor limited partnership interests can be purchased through our website. Certificate investors typically seek to invest larger amounts as compared to the average note investors and often desire a more “hands off” approach to investing. Investors in certificates generally pay an asset-based management fee instead of cash flow-based servicing fee paid by note investors.
Whole Loan Purchases:
Certain institutional investors, such as banks, seek to hold the actual loan on their balance sheet. To meet this need, we sell entire standard or custom program loans to these investors through purchase agreements. Upon the sale of the loan, the investor owns all right, title and interest in the loan. We establish the investors’ accounts and the procedures for the purchase of loans, including any purchase amount limitations, which we control at our discretion. We and the investor also make limited representations and warranties and agree to indemnify each other for breaches of the purchase agreement. The investor also agrees to simultaneously enter into a servicing agreement with us which designates us as the loan servicer for the sold loan. We continue to service these loans after they are sold and can only be removed as the servicer in limited circumstances. For regulatory purposes, the investor also has access to the underlying borrower information, but is prohibited from contacting or marketing to the borrower in any manner and agrees to hold such borrower information in compliance with all applicable privacy laws.
For all investment channels, we agree to repurchase loans in cases of confirmed identity theft.
Springstone
In
April 2014
, we acquired all of the outstanding limited liability company interests of Springstone. See
Part II - Item 8 - Financial Statements and Supplementary Data - Note 17 - Springstone Acquisition
in our Annual Report
for more information.
21
LENDINGCLUB CORPORATION
Management's Discussion and Analysis of Financial Condition and Results of Operations
(Tabular Amounts in Thousands, Except Share and Per Share Data and Ratios, or as Noted)
Key Operating and Financial Metrics
We regularly review a number of metrics to evaluate our business, measure our performance, identify trends, formulate financial projections and make strategic decisions. The following presents our key operating and financial metrics:
|
Three Months Ended March 31,
|
||||||||
|
2015
|
2014
|
|||||||
|
Loan originations
|
$
|
1,635,090
|
|
$
|
791,348
|
|
||
|
Operating revenue
|
$
|
81,045
|
|
$
|
38,702
|
|
||
|
Contribution
(1)
|
$
|
35,721
|
|
$
|
14,578
|
|
||
|
Contribution margin
(1)
|
44.1
|
%
|
37.7
|
%
|
||||
|
Adjusted EBITDA
(1)
|
$
|
10,646
|
|
$
|
1,866
|
|
||
|
Adjusted EBITDA margin
(1)
|
13.1
|
%
|
4.8
|
%
|
||||
|
Net loss
|
$
|
(6,374
|
)
|
$
|
(7,299
|
)
|
||
(1)
Contribution, Contribution margin, Adjusted EBITDA and Adjusted EBITDA margin are non-GAAP financial measures. For more information regarding these measures and a reconciliation of these measures to the most comparable GAAP measure, see “
Part I - Financial Information - Item 2 - Management’s Discussion and Analysis of Financial Condition and Results of Operations - Reconciliations of Non-GAAP Financial Measures
.”
Loan Originations
Originations are a key indicator of the adoption rate of our marketplace, growth of our brand, scale of our business, strength of our network effect, economic competitiveness of our products and future growth. Loan originations have grown significantly over time due to increased awareness of our brand, our high borrower and investor satisfaction ratings, the effectiveness of our borrower acquisition channels, a strong track record of loan performance and the expansion of our capital resources. Factors that could affect loan originations include the interest rate and economic environment, the competitiveness of our products, the success of our operational efforts to balance investor and borrower demand, any limitations on the ability of our issuing banks to originate loans, our ability to develop new products or enhance existing products for borrowers and investors, the success of our sales and marketing initiatives and the success of borrower and investor acquisition and retention.
Contribution, Contribution Margin, Adjusted EBITDA and Adjusted EBITDA Margin
Contribution is a non-GAAP financial measure that we calculate as net income (loss), excluding net interest income (expense) and other adjustments, general and administrative expense, stock-based compensation expense and income tax expense (benefit). Contribution margin is a non-GAAP financial measure calculated by dividing contribution by total operating revenue. Contribution and contribution margin are measures used by our management and board of directors to understand and evaluate our core operating performance and trends. Contribution and contribution margin have varied from period to period and have generally increased over time. Factors that affect our contribution and contribution margin include revenue mix, variable marketing expenses and origination and servicing expenses.
22
LENDINGCLUB CORPORATION
Management's Discussion and Analysis of Financial Condition and Results of Operations
(Tabular Amounts in Thousands, Except Share and Per Share Data and Ratios, or as Noted)
Adjusted EBITDA is a non-GAAP financial measure that we calculate as net income (loss), excluding net interest income (expense) and other adjustments, acquisition and related expense, depreciation and amortization, amortization of intangible assets, stock-based compensation expense and income tax expense (benefit). Adjusted EBITDA margin is a non-GAAP financial measure calculated as adjusted EBITDA divided by total operating revenue. Adjusted EBITDA is a measure used by our management and board of directors to understand and evaluate our core operating performance and trends. Adjusted EBITDA has generally improved over time due to our increased revenue and efficiencies in the scale of our operations. For more information regarding the limitations of contributions, contribution margins, adjusted EBITDA and adjusted EBITDA margin and a reconciliation of net income (loss) to adjusted EBITDA, see “
Part I - Financial Information - Item 2 - Management’s Discussion and Analysis of Financial Condition and Results of Operations - Reconciliations of Non-GAAP Financial Measures
.”
Effectiveness of Scoring Models
Our ability to attract borrowers and investors to our marketplace is significantly dependent on our ability to effectively evaluate a borrower’s credit profile and likelihood of default. We evaluate our marketplace’s credit decisioning and scoring models on a regular basis and leverage the additional data on loan history experience, borrower behavior, economic factors and prepayment trends that we accumulate to continually improve the models. If we are unable to effectively evaluate borrowers’ credit profiles, borrowers and investors may lose confidence in our marketplace. Additionally, our ability to effectively segment borrowers into relative risk profiles impacts our ability to offer attractive interest rates for borrowers as well as our ability to offer investors attractive risk-adjusted returns, both of which directly relate to our users’ confidence in our marketplace. Our marketplace's credit decisioning and scoring models assign each loan offered on our marketplace a corresponding interest rate and origination fee. Our investors’ returns are a function of the assigned interest rates for each particular loan invested in less any defaults over the term of the applicable loan. We believe we have a history of effectively evaluating borrower’s credit profiles and likelihood of defaults, as evidenced by the performance of various loan vintages facilitated through our marketplace. The following charts display the historical lifetime cumulative net charge-off rates through
March 31, 2015
, by booking year, for all grades and
36
and
60
month terms of standard program loans for each of the years shown.
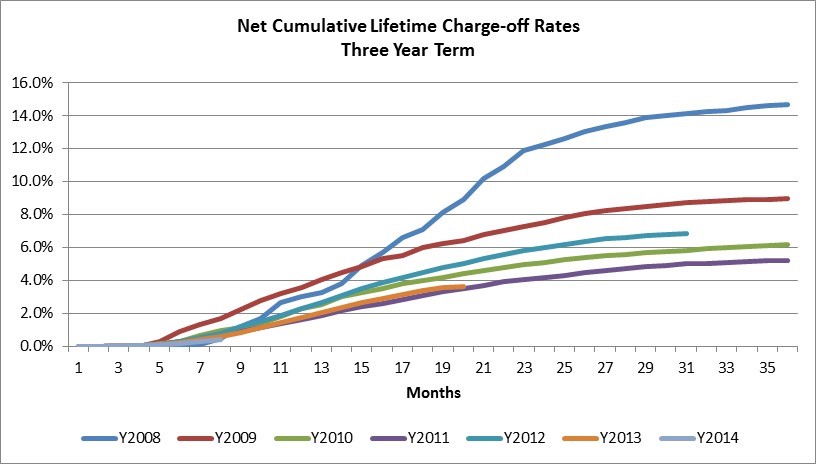
23
LENDINGCLUB CORPORATION
Management's Discussion and Analysis of Financial Condition and Results of Operations
(Tabular Amounts in Thousands, Except Share and Per Share Data and Ratios, or as Noted)

Product Innovation
We have made and intend to continue to make substantial investments and incur expenses to research and develop or otherwise acquire new financial products for borrowers and investors. Our revenue growth to date has been a function of, and our future success will depend in part on, successfully meeting borrower and investor demand with new and innovative loan and investment options. For example, in early
2014
, we began offering small business loans to qualified investors, bringing the benefit of our innovative marketplace model, online delivery and process automation to small business owners. In the latter part of
2014
we launched super prime consumer loans and a true no interest product for the education and patient finance market. For investors, we have introduced automated investing, API, investment funds and separately managed accounts, that make investing in loans easier. Failure to successfully develop and offer innovative products could adversely affect our operating results and we may not recoup the costs of new products.
Marketing Effectiveness and Strategic Relationships
We intend to continue to dedicate significant resources to our marketing and brand advertising efforts and strategic relationships. Our marketing efforts are designed to build awareness of Lending Club and attract borrowers and investors to our marketplace. We use a diverse array of marketing channels and are constantly seeking to improve and optimize our experience both on- and offline to achieve efficiency and a high level of borrower and investor satisfaction. We also continue to invest in our strategic relationships to raise awareness of our platform and attract borrowers and investors to our marketplace. Our operating results and ability to sustain and grow loan volume will depend, in part, on our ability to continue to make effective investments in marketing and the effectiveness of our strategic relationships.
In February 2015, Lending Club announced that it had entered into a strategic partnership with a consortium of community banks for its platform to offer co-branded personal loans to the participating banks' customers. As part of this partnership, each community bank is provided initial access to invest in loans sought by their own customers. The customer loans that do not meet the community bank's investment criteria are then made available for investment through the marketplace. All loans are originated by Lending Club's issuing banks.
24
LENDINGCLUB CORPORATION
Management's Discussion and Analysis of Financial Condition and Results of Operations
(Tabular Amounts in Thousands, Except Share and Per Share Data and Ratios, or as Noted)
Regulatory Environment
The regulatory environment for credit is complex and evolving, creating both challenges and opportunities that could affect our financial performance. We expect to continue to spend significant resources to comply with various federal and state laws and various licensing requirements designed to, among other things, protect borrowers (such as truth in lending, equal credit opportunity, fair credit reporting and fair debt collections practices) and investors. Our marketplace incorporates a number of automated features to help comply with these laws in an efficient and cost effective manner. While new laws and regulations or changes under existing laws and regulations could make facilitating loans or investment opportunities more difficult to achieve on acceptable terms, or at all, these events could also provide new product and market opportunities. To the extent we seek to grow internationally, we would become subject to additional foreign regulation and related compliance requirements and expense.
25
LENDINGCLUB CORPORATION
Management's Discussion and Analysis of Financial Condition and Results of Operations
(Tabular Amounts in Thousands, Except Share and Per Share Data and Ratios, or as Noted)
Results of Operations
The following tables set forth the consolidated condensed statement of operations data for each of the periods presented:
|
Three Months Ended March 31,
|
||||||||||||||
|
2015
|
2014
|
Change ($)
|
Change (%)
|
|||||||||||
|
Operating revenues:
|
||||||||||||||
|
Transaction fees
|
$
|
72,482
|
|
$
|
35,412
|
|
$
|
37,070
|
|
105
|
%
|
|||
|
Servicing fees
|
5,392
|
|
1,780
|
|
3,612
|
|
N/M
|
|
||||||
|
Management fees
|
2,215
|
|
1,094
|
|
1,121
|
|
102
|
%
|
||||||
|
Other revenue
|
956
|
|
416
|
|
540
|
|
130
|
%
|
||||||
|
Total operating revenue
|
81,045
|
|
38,702
|
|
42,343
|
|
109
|
%
|
||||||
|
Net interest income and other adjustments
|
187
|
|
16
|
|
171
|
|
N/M
|
|
||||||
|
Total net revenue
|
81,232
|
|
38,718
|
|
42,514
|
|
110
|
%
|
||||||
|
Operating expenses
(1)
:
|
||||||||||||||
|
Sales and marketing
|
34,884
|
|
20,582
|
|
14,302
|
|
69
|
%
|
||||||
|
Origination and servicing
|
12,680
|
|
7,402
|
|
5,278
|
|
71
|
%
|
||||||
|
General and administrative:
|
||||||||||||||
|
Engineering and product development
|
12,328
|
|
5,722
|
|
6,606
|
|
115
|
%
|
||||||
|
Other
|
27,087
|
|
12,311
|
|
14,776
|
|
120
|
%
|
||||||
|
Total operating expenses
|
86,979
|
|
46,017
|
|
40,962
|
|
89
|
%
|
||||||
|
Loss before income tax expense
|
(5,747
|
)
|
(7,299
|
)
|
1,552
|
|
21
|
%
|
||||||
|
Income tax expense
|
627
|
|
—
|
|
627
|
|
100
|
%
|
||||||
|
Net loss
|
$
|
(6,374
|
)
|
$
|
(7,299
|
)
|
$
|
925
|
|
13
|
%
|
|||
(1)
Includes stock-based compensation expense as follows:
|
Three Months Ended March 31,
|
||||||||||||||
|
2015
|
2014
|
Change ($)
|
Change (%)
|
|||||||||||
|
Sales and marketing
|
$
|
1,519
|
|
$
|
3,502
|
|
$
|
(1,983
|
)
|
(57
|
%)
|
|||
|
Origination and servicing
|
721
|
|
358
|
|
363
|
|
101
|
%
|
||||||
|
General and administrative:
|
||||||||||||||
|
Engineering and product development
|
1,406
|
|
737
|
|
669
|
|
91
|
%
|
||||||
|
Other
|
7,947
|
|
2,436
|
|
5,511
|
|
N/M
|
|
||||||
|
Total stock-based compensation expense
|
$
|
11,593
|
|
$
|
7,033
|
|
$
|
4,560
|
|
65
|
%
|
|||
N/M - Not meaningful.
26
LENDINGCLUB CORPORATION
Management's Discussion and Analysis of Financial Condition and Results of Operations
(Tabular Amounts in Thousands, Except Share and Per Share Data and Ratios, or as Noted)
Total Net Revenue
|
Three Months Ended March 31,
|
||||||||||||||
|
2015
|
2014
|
Change ($)
|
Change (%)
|
|||||||||||
|
Transaction fees
|
$
|
72,482
|
|
$
|
35,412
|
|
$
|
37,070
|
|
105
|
%
|
|||
|
Servicing fees
|
5,392
|
|
1,780
|
|
3,612
|
|
N/M
|
|
||||||
|
Management fees
|
2,215
|
|
1,094
|
|
1,121
|
|
102
|
%
|
||||||
|
Other revenue
|
956
|
|
416
|
|
540
|
|
130
|
%
|
||||||
|
Total operating revenue
|
81,045
|
|
38,702
|
|
42,343
|
|
109
|
%
|
||||||
|
Net interest income and other adjustments
|
187
|
|
16
|
|
171
|
|
N/M
|
|
||||||
|
Total net revenue
|
$
|
81,232
|
|
$
|
38,718
|
|
$
|
42,514
|
|
110
|
%
|
|||
N/M - Not meaningful.
Our primary sources of net revenue consist of fees charged for transactions through or related to our marketplace. Our fees include transaction, servicing and management fees.
Transaction Fees:
Transaction fees are fees paid by issuing banks or service providers to us for the work we perform through our platforms. The amount of these fees is based upon the terms of the loan, including grade, rate, term and other factors. These fees are recognized as a component of operating revenue at the time of loan issuance.
Transaction fees were
$72.5 million
and
$35.4 million
for the three months ended
March 31, 2015
and
2014
, respectively, an increase of
105%
. The increase was primarily due to an increase in loans facilitated through our marketplace from
$791.3 million
for the three months ended
March 31, 2014
to
$1,635.1 million
for the three months ended
March 31, 2015
, an increase of
107%
. The average transaction fees as a percentage of the initial principal balance of the loan, were
4.4%
and
4.5%
for the three months ended
March 31, 2015
and
2014
, respectively. The decrease was primarily due to a change in the mix of loans facilitated.
Servicing Fees:
Servicing fees paid to us vary based on investment channel. The servicing fee compensates us for the costs we incur in servicing the related loan, including managing payments from borrowers, collections, payments to investors and maintaining investors’ account portfolios.
We record servicing assets and liabilities at their estimated fair values when we sell whole loans to unrelated third parties or when the servicing contract commences. Over the life of the loan, changes in the estimated fair value of servicing assets and liabilities are included in servicing fees in the period in which the changes occur.
The following table provides the outstanding principal balance of loans that we serviced at the end of the periods indicated, by the method that the loans were financed (in millions):
|
March 31, 2015
|
December 31, 2014
|
|||||||
|
Notes
|
$
|
1,209.7
|
|
$
|
1,055.2
|
|
||
|
Certificates
|
2,066.7
|
|
1,796.6
|
|
||||
|
Whole loans sold
|
2,299.7
|
|
1,873.7
|
|
||||
|
Total
|
$
|
5,576.1
|
|
$
|
4,725.5
|
|
||
27
LENDINGCLUB CORPORATION
Management's Discussion and Analysis of Financial Condition and Results of Operations
(Tabular Amounts in Thousands, Except Share and Per Share Data and Ratios, or as Noted)
Servicing fees were
$5.4 million
and
$1.8 million
for the three months ended
March 31, 2015
and
2014
, respectively, an increase of
203%
. Servicing fees, including collection fees, earned from whole loan sales were
$2.6 million
and
$0.5 million
for the three months ended
March 31, 2015
and
2014
, respectively. Servicing fees, including collection fees, earned from retail investors were
$2.3 million
and
$1.2 million
for the three months ended
March 31, 2015
and
2014
, respectively, an increase of
88%
. The increase in servicing fees was due to an increase in outstanding principal balances underlying notes and certificates and sold loans serviced by us, and an increase in fees earned from the collection process.
The table below illustrates the composition of servicing fees by source for each period presented:
|
Three Months Ended March 31,
|
||||||||
|
2015
|
2014
|
Change (%)
|
||||||
|
Servicing fees related to whole loans sold
|
$
|
2,612
|
|
$
|
452
|
|
N/M
|
|
|
Note and certificate servicing fees
|
2,283
|
|
1,213
|
|
88
|
%
|
||
|
Total servicing fees before change in fair value of servicing assets and liabilities
|
4,895
|
|
1,665
|
|
194
|
%
|
||
|
Change in fair value of servicing assets and liabilities, net
|
497
|
|
115
|
|
N/M
|
|
||
|
Total servicing fees
|
$
|
5,392
|
|
$
|
1,780
|
|
N/M
|
|
N/M - Not meaningful.
Management Fees:
Certain investors can invest in investment funds managed by LCA. LCA typically charges these investors a monthly management fee based on the month-end balance of their assets under management, ranging from
0.7%
to
1.5%
per annum. This fee may be waived or reduced for individual limited partners at the discretion of the general partner. LCA does not earn any carried interest from the investment funds. For managed account certificate holders, LCA earns a management fee typically ranging from
0.85%
to
1.2%
per annum of the month-end balance of their assets under management. This fee may be waived or reduced at the discretion of LCA.
Management fees were
$2.2 million
and
$1.1 million
for the three months ended
March 31, 2015
and
2014
, respectively, an increase of
102%
. The increase in management fees was due primarily to an increase in the total assets under management and outstanding certificate balances.
28
LENDINGCLUB CORPORATION
Management's Discussion and Analysis of Financial Condition and Results of Operations
(Tabular Amounts in Thousands, Except Share and Per Share Data and Ratios, or as Noted)
Other Revenue:
Other revenue consists of gains and losses on sales of whole loans and referral revenue. Certain investors investing through our marketplace acquire standard or custom program loans in their entirety. In connection with these whole loan sales, in addition to the transaction fee earned in respect of the corresponding loan, we recognize a gain or loss on the sale of that loan based on the degree to which the contractual loan servicing fee is above or below an estimated market rate loan servicing fee (loans are typically sold at par). Referral revenue consists of fees earned from partner companies when customers referred by us complete specified actions with a partner company. The specified action ranges from clicking on a link to visit a partner company’s website to obtaining a loan from the partner company.
Other revenue was
$1.0 million
and
$0.4 million
for the three months ended
March 31, 2015
and
2014
, respectively, an increase of
130%
. This was primarily attributable to an increase in the amount of referral revenues.
The table below illustrates the composition of other revenue for each period presented:
|
Three Months Ended March 31,
|
|||||||||||
|
2015
|
2014
|
Change (%)
|
|||||||||
|
Referral revenue
|
$
|
848
|
|
$
|
469
|
|
81
|
%
|
|||
|
Gain (loss) on sales of loans
|
95
|
|
(71
|
)
|
N/M
|
|
|||||
|
Other
|
13
|
|
18
|
|
(28
|
%)
|
|||||
|
Other revenue
|
$
|
956
|
|
$
|
416
|
|
130
|
%
|
|||
N/M - Not meaningful.
Net Interest Income and Other Adjustments
We do not assume principal or interest risk on loans facilitated through our marketplace because loan balances, interest rates and maturities are matched and offset by an equal balance of notes and certificates with the exact same interest rates and maturities. We only make principal and interest payments on notes and certificates to the extent that we receive borrower payments on loans. As a servicer, we are only required to deliver borrower payments to the extent that we actually receive them. As a result, on our statement of operations for any period and balance sheet as of any date, (i) interest income on loans corresponds to the interest expense on notes and certificates and (ii) loan balances correspond to note and certificate balances with variations resulting from timing differences between the crediting of principal and interest payments on loans and the disbursement of those payments to investors.
We may make limited loan investments
without issuing a corresponding note or certificate to investors, resulting in differences between interest income from loans and interest expense from notes and certificates on our statement of operations and total loans and notes and certificates balances on our balance sheets. These loan investments have been related primarily to customer accommodations and have not been material. We do not anticipate that such investments will be material in the foreseeable future.
29
LENDINGCLUB CORPORATION
Management's Discussion and Analysis of Financial Condition and Results of Operations
(Tabular Amounts in Thousands, Except Share and Per Share Data and Ratios, or as Noted)
Additionally, interest income (expense) includes interest income earned on cash and cash equivalents. The following table provides additional detail related to net interest income and fair value adjustments:
|
Three Months Ended March 31,
|
|||||||||||||||
|
2015
|
2014
|
Change ($)
|
Change (%)
|
||||||||||||
|
Interest income:
|
|||||||||||||||
|
Loans
|
$
|
113,292
|
|
$
|
73,047
|
|
$
|
40,245
|
|
55
|
%
|
||||
|
Cash and cash equivalents
|
180
|
|
1
|
|
179
|
|
N/M
|
|
|||||||
|
Total interest income
|
113,472
|
|
73,048
|
|
40,424
|
|
55
|
%
|
|||||||
|
Interest expense:
|
|||||||||||||||
|
Notes and certificates
|
(113,280
|
)
|
(73,000
|
)
|
(40,280
|
)
|
(55
|
%)
|
|||||||
|
Total interest expense
|
(113,280
|
)
|
(73,000
|
)
|
(40,280
|
)
|
(55
|
%)
|
|||||||
|
Net interest income
|
192
|
|
48
|
|
144
|
|
N/M
|
|
|||||||
|
Fair value adjustments on loans, notes and certificates, net
|
(5
|
)
|
(32
|
)
|
27
|
|
84
|
%
|
|||||||
|
Net interest income and other adjustments
|
$
|
187
|
|
$
|
16
|
|
$
|
171
|
|
N/M
|
|
||||
|
Average outstanding balances:
|
|||||||||||||||
|
Loans
|
$
|
3,090,451
|
|
$
|
1,994,319
|
|
$
|
1,096,132
|
|
55
|
%
|
||||
|
Notes and certificates
|
$
|
3,105,488
|
|
$
|
2,002,609
|
|
$
|
1,102,879
|
|
55
|
%
|
||||
N/M - Not meaningful.
For the three months ended
March 31, 2015
and
2014
, interest income from loans was
$113.3 million
and
$73.0 million
, respectively. The increase in interest income was primarily due to the increase in the outstanding balances of loans.
For the three months ended
March 31, 2015
and
2014
, we recorded interest expense for notes and certificates of
$113.3 million
and
$73.0 million
, respectively. The increase in interest expense was primarily due to the increase in the outstanding balances of notes and certificates.
Fair Value Adjustments on Loans, Notes and Certificates:
We estimate the fair value of loans and their related notes and certificates using a discounted cash flow valuation methodology that is described in "
Note 2 - Summary of Significant Accounting Policies"
in the Company’s Annual Report. The changes in fair value of loans, notes and certificates are shown on our consolidated statement of operations on a gross basis. Due to the payment dependent feature of the notes and certificates, fair value adjustments on the loans are offset by the fair value adjustments on the notes and certificates, resulting in no net effect on our earnings. From time to time, however, we may make limited loan investments
without us issuing a corresponding note or certificate to investors, resulting in differences between total interest income and expense amounts on our statement of operations and total loans and notes and certificates balances on our balance sheets. These loan investments have been related primarily to customer accommodations and have been insignificant. We do not anticipate that such investments will be material in the foreseeable future.
The losses from fair value adjustments on loans were largely offset by the gains from fair value adjustments on notes and certificates due to the borrower payment dependent design of the notes and certificates and due to the principal balances of the loans being similar to the combined principal balances of the notes and certificates. Accordingly, the net fair value adjustments were immaterial for the three months ended
March 31, 2015
and
2014
.
30
LENDINGCLUB CORPORATION
Management's Discussion and Analysis of Financial Condition and Results of Operations
(Tabular Amounts in Thousands, Except Share and Per Share Data and Ratios, or as Noted)
Operating Expenses
|
Three Months Ended March 31,
|
|||||||||||||||
|
2015
|
2014
|
Change ($)
|
Change (%)
|
||||||||||||
|
Sales and marketing
|
$
|
34,884
|
|
$
|
20,582
|
|
$
|
14,302
|
|
69
|
%
|
||||
|
Origination and servicing
|
12,680
|
|
7,402
|
|
5,278
|
|
71
|
%
|
|||||||
|
General and administrative:
|
|||||||||||||||
|
Engineering and product development
|
12,328
|
|
5,722
|
|
6,606
|
|
115
|
%
|
|||||||
|
Other
|
27,087
|
|
12,311
|
|
14,776
|
|
120
|
%
|
|||||||
|
Total operating expenses
|
$
|
86,979
|
|
$
|
46,017
|
|
$
|
40,962
|
|
89
|
%
|
||||
Our operating expenses consist of sales and marketing, origination and servicing and general and administrative expenses, which includes engineering and product development and other general and administrative expenses.
Sales and Marketing:
Sales and marketing expense consists primarily of those related to borrower and investor acquisition. In addition, these include general brand and awareness building, and salaries, benefits and stock-based compensation expense related to our sales and marketing team.
Sales and marketing expense was
$34.9 million
and
$20.6 million
for the three months ended
March 31, 2015
and
2014
, respectively, an increase of
69%
. The increase was primarily due to a $10.4 million increase in variable marketing expenses driven by higher loan originations and a $2.5 million increase in personnel-related expenses associated with higher headcount levels.
Origination and Servicing:
Origination and servicing expense consists primarily of salaries, benefits and stock-based compensation expense related to our credit, collections, customer support and payment processing teams and vendor costs associated with facilitating and servicing loans.
Origination and servicing expense was
$12.7 million
and
$7.4 million
for the three months ended
March 31, 2015
and
2014
, respectively, an increase of
71%
. The increase was primarily due to a $2.8 million increase in personnel-related expenses and a $1.9 million increase in consumer reporting agency and loan processing costs, both driven by higher loan originations and higher outstanding balance of loans serviced.
General and Administrative:
Engineering and product development expense consists primarily of salaries, benefits and stock-based compensation expense for our engineering and product development team and the costs of contractors who work on the development and maintenance of our platform. Engineering and product development expense also includes non-capitalized hardware and software costs and depreciation and amortization of technology assets.
Engineering and product development expense was
$12.3 million
and
$5.7 million
for the three months ended
March 31, 2015
and
2014
, respectively, an increase of
115%
. The increase was primarily driven by continued investment in our platform and product development, which included a $3.5 million increase in personnel-related expenses resulting from increased headcount and a $2.6 million increase in expensed equipment, software and the related support and maintenance and depreciation expense. We capitalized
$4.8 million
and
$2.4 million
in software development costs for the three months ended
March 31, 2015
and
2014
, respectively.
Other general and administrative expense consists primarily of salaries, benefits and stock-based compensation expense for our accounting and finance, business development, legal, human resources and facilities teams, professional fees related to legal and accounting, and facilities expense and compensation expense related to the acquisition of Springstone.
31
LENDINGCLUB CORPORATION
Management's Discussion and Analysis of Financial Condition and Results of Operations
(Tabular Amounts in Thousands, Except Share and Per Share Data and Ratios, or as Noted)
Other general and administrative expense was
$27.1 million
and
$12.3 million
for the three months ended
March 31, 2015
and
2014
, respectively, an increase of
120%
. The increase was primarily due to a $10.4 million increase in share-based compensation expense and salaries related to increased headcount, as we continued to invest in back office infrastructure, and compensation expense for stock consideration issued related to the Springstone acquisition.
Income Taxes
For the three months ended
March 31, 2015
we recorded income tax expense of
$0.6 million
due to recognition of a full valuation allowance against deferred tax assets as well as the amortization of tax deductible goodwill which gives rise to an indefinite-lived deferred tax liability. For the three months ended
March 31, 2014
, we recorded no income tax expense or benefit due to a full valuation allowance against our deferred tax assets.
We assess the available positive and negative evidence to estimate if sufficient future taxable income will be generated to utilize the existing deferred tax assets. On the basis of this evaluation, as of
March 31, 2015
, a full valuation allowance of
$40.8 million
has been recorded to recognize only deferred tax assets that are more likely than not to be realized.
Reconciliations of Non-GAAP Financial Measures
Our non-GAAP measures, including contribution, contribution margin, adjusted EBITDA, and adjusted EBITDA margin, have limitations as analytical tools and you should not consider them in isolation or as a substitute for an analysis of our results under GAAP. There are a number of limitations related to the use of these non-GAAP financial measures versus their nearest GAAP equivalents. These non-GAAP measures should not be viewed as substitutes for, or superior to, net income (loss) as prepared in accordance with GAAP. Other companies, including companies in our industry, may calculate these measures differently, which may reduce their usefulness as a comparative measure. These measures do not consider the potentially dilutive impact of stock-based compensation. Although depreciation and amortization are non-cash charges, the assets being depreciated and amortized may have to be replaced in the future and adjusted EBITDA and adjusted EBITDA margin do not reflect cash capital expenditure requirements for such replacements or for new capital expenditure requirements. Adjusted EBITDA and adjusted EBITDA margin do not reflect tax payments that may represent a reduction in cash available to us.
32
LENDINGCLUB CORPORATION
Management's Discussion and Analysis of Financial Condition and Results of Operations
(Tabular Amounts in Thousands, Except Share and Per Share Data and Ratios, or as Noted)
In evaluating these non-GAAP measures, you should be aware that in the future we will incur expenses similar to the adjustments in this presentation. The following tables present a reconciliation of net loss to contributions for each of the periods indicated:
|
Reconciliation of Net Loss to Contribution
|
Three Months Ended March 31,
|
||||||
|
2015
|
2014
|
||||||
|
Net loss
|
$
|
(6,374
|
)
|
$
|
(7,299
|
)
|
|
|
Net interest income and other adjustments
|
(187
|
)
|
(16
|
)
|
|||
|
General and administrative expense:
|
|||||||
|
Engineering and product development
|
12,328
|
|
5,722
|
|
|||
|
Other
|
27,087
|
|
12,311
|
|
|||
|
Stock-based compensation expense
(1)
|
2,240
|
|
3,860
|
|
|||
|
Income tax expense
|
627
|
|
—
|
|
|||
|
Contribution
|
$
|
35,721
|
|
$
|
14,578
|
|
|
|
Total operating revenue
|
$
|
81,045
|
|
$
|
38,702
|
|
|
|
Contribution margin
|
44.1
|
%
|
37.7
|
%
|
|||
|
(1)
Contribution also excludes stock-based compensation expense as follows:
|
|||||||
|
Stock-based Compensation Expense:
|
Three Months Ended March 31,
|
||||||
|
2015
|
2014
|
||||||
|
Sales and marketing
|
$
|
1,519
|
|
$
|
3,502
|
|
|
|
Origination and servicing
|
721
|
|
358
|
|
|||
|
Total
|
$
|
2,240
|
|
$
|
3,860
|
|
|
|
Reconciliation of Net Loss to Adjusted EBITDA:
|
Three Months Ended March 31,
|
||||||
|
2015
|
2014
|
||||||
|
Net loss
|
$
|
(6,374
|
)
|
$
|
(7,299
|
)
|
|
|
Net interest income and other adjustments
|
(187
|
)
|
(16
|
)
|
|||
|
Acquisition and related expense
|
294
|
|
1,141
|
|
|||
|
Depreciation and amortization:
|
|||||||
|
Engineering and product development
|
2,744
|
|
791
|
|
|||
|
Other
|
404
|
|
216
|
|
|||
|
Amortization of intangible assets
|
1,545
|
|
—
|
|
|||
|
Stock-based compensation expense
|
11,593
|
|
7,033
|
|
|||
|
Income tax expense
|
627
|
|
—
|
|
|||
|
Adjusted EBITDA
|
$
|
10,646
|
|
$
|
1,866
|
|
|
|
Total operating revenue
|
$
|
81,045
|
|
$
|
38,702
|
|
|
|
Adjusted EBITDA margin
|
13.1
|
%
|
4.8
|
%
|
|||
Liquidity and Capital Resources
At
March 31, 2015
, we had
$874.1 million
in available cash and cash equivalents. At
March 31, 2015
we primarily held our excess unrestricted cash in institutional money market funds and interest-bearing deposits at investment grade financial institutions.
33
LENDINGCLUB CORPORATION
Management's Discussion and Analysis of Financial Condition and Results of Operations
(Tabular Amounts in Thousands, Except Share and Per Share Data and Ratios, or as Noted)
At
March 31, 2015
, we had
$39.2 million
in restricted cash that consisted primarily of
$30.8 million
of cash received for investors and not yet applied to their accounts,
$3.4 million
for an investor as part of a credit support agreement and pledged cash of
$3.0 million
as security for our primary issuing bank.
The following table sets forth certain cash flow information for the periods presented:
|
Three Months Ended March 31,
|
||||||||
|
Condensed Cash Flow Information:
|
2015
|
2014
|
||||||
|
Net cash flow from operating activities
|
$
|
6,495
|
|
$
|
20,094
|
|
||
|
Cash flow from loan investing activities
(1)
|
(479,976
|
)
|
(305,525
|
)
|
||||
|
Cash flow from all other investing activities
|
1,276
|
|
(8,764
|
)
|
||||
|
Net cash used in investing activities
|
(478,700
|
)
|
(314,289
|
)
|
||||
|
Cash flow from note/certificate financing
(1)
|
483,543
|
|
304,954
|
|
||||
|
Cash flow from all other financing activities
|
(6,993
|
)
|
4,541
|
|
||||
|
Net cash flow from financing activities
|
476,550
|
|
309,495
|
|
||||
|
Net increase in cash
|
$
|
4,345
|
|
$
|
15,300
|
|
||
|
(1)
|
Cash flow from loan investing activities includes the purchase of loans and repayment of loans facilitated through our marketplace. Cash flow from note/certificate financing activities includes the issuance of notes and certificates to investors and the repayment of those notes and certificates. These amounts generally correspond and offset each other.
|
Net Cash Provided by Operating Activities
Net cash provided by operating activities for the quarter ended
March 31, 2015
was
$6.5 million
. Cash flow provided by operating activities was driven by the net loss for the three months ended
March 31, 2015
of
$6.4 million
, adjusted for non-cash stock-based compensation expense of
$11.6 million
and depreciation and amortization expense of
$4.7 million
. Additionally cash flow provided by operating activities was driven by changes in certain components of our working capital, including an increase in accounts payable of
$1.8 million
offset by an increase in other assets of
$2.1 million
that was primarily related to payments of receivables due from investors, and a decrease in accrued expenses and other liabilities of
$1.0 million
.
Net cash provided by operating activities for the three months ended
March 31, 2014
was
$20.1 million
. Cash flow from operating activities primarily resulted from the net loss for the three months ended March 31, 2014 of
$7.3 million
, adjusted for non-cash stock-based compensation expense of
$7.0 million
. Additionally, operating cash flows were generated due to changes in certain components of our working capital, including a decrease in other assets of
$18.1 million
that was primarily related to payments of receivables due to investors.
Net Cash Used in Investing Activities
Net cash used in investing activities for the three months ended
March 31, 2015
was
$478.7 million
. Cash used in investing activities includes
$852.8 million
of cash used to purchase loans at fair value and
$6.2 million
of purchases of property, equipment and software, partially offset by a
$7.5 million
increase in restricted cash and by
$369.4 million
of principal payments received on loans at fair value.
Net cash used in investing activities for the three months ended
March 31, 2014
was
$314.3 million
, which primarily resulted from
$511.2 million
of cash used to purchase loans at fair value,
$5.0 million
of purchases of property, equipment and software and a
$3.8 million
increase in restricted cash, partially offset by
$205.0 million
of principal payments received on loans at fair value.
34
LENDINGCLUB CORPORATION
Management's Discussion and Analysis of Financial Condition and Results of Operations
(Tabular Amounts in Thousands, Except Share and Per Share Data and Ratios, or as Noted)
Net Cash Provided by Financing Activities
Net cash provided by financing activities for the three months ended
March 31, 2015
was
$476.6 million
. Cash provided by financing includes
$852.7 million
of proceeds from our issuance of notes and sale of loans to the Trust in connection with its issuance of certificates, partially offset by a
$7.9 million
decrease in the amount payable to investors and by
$365.7 million
in principal payments made on notes and certificates.
Net cash provided by financing activities for the three months ended
March 31, 2014
was
$309.5 million
, which primarily resulted from
$511.0 million
of proceeds from our issuance of notes and sale of loans to the Trust in connection with its issuance of certificates, which was partially offset by
$205.3 million
of principal payments made on notes and certificates.
Off-Balance Sheet Arrangements
We did not have any off-balance sheet arrangements during the three months ended
March 31, 2015
and
2014
.
Contingencies
The Company's contingencies as of
March 31, 2015
are included in
Part I - Financial Information - Item 1 - Financial Statements - Note 12 - Commitments and Contingencies
.
Critical Accounting Policies and Estimates
Certain of the Company's accounting policies that involve a higher degree of judgment and complexity are discussed in
Part II - Item 7 - Management's Discussion and Analysis of Financial Condition and Results of Operation - Critical Accounting Estimates
in the Company’s Annual Report. There have been no significant changes to these critical accounting estimates during the first three months of
2015
.
35
LENDINGCLUB CORPORATION
Item 3. Quantitative and Qualitative Disclosures about Market Risk
Market risk represents the risk of loss that may impact our financial position due to adverse changes in financial market prices and interest rates. We do not have a material exposure to market risk with respect to the fair value of financial instruments.
Because balances, interest rates and maturities of loans are matched and offset by an equal balance of notes and certificates with the exact same interest rates and maturities, we believe that we do not have any material exposure to changes in the net fair value of the combined loan, note and certificate portfolios as a result of changes in interest rates. We do not hold or issue financial instruments for trading purposes.
The fair values of loans and the related notes and certificates are determined using a discounted cash flow methodology. The fair value adjustments for loans are largely offset by the fair value adjustments of the notes and certificates due to the borrower payment dependent design of the notes and certificates and due to the total principal balances of the loans being very close to the combined principal balances of the notes and certificates.
We had cash and cash equivalents of
$874.1 million
as of
March 31, 2015
. These amounts were held primarily in interest-bearing deposits at investment grade financial institutions and institutional money market funds, which are short-term. Cash and cash equivalents are held for working capital purposes. Due to their short-term nature, we believe that we do not have any material exposure to changes in the fair value of these liquid investments as a result of changes in interest rates. Decreases in short-term interest rates will not materially reduce interest income on these cash and cash equivalents because of the current low rate environment. Increases in short-term interest rates will modestly increase the interest income earned on these cash balances.
Item 4. Controls and Procedures
Evaluation of Disclosure Controls and Procedures
The management of the Company, with the participation of the Company’s Chief Executive Officer and Chief Financial Officer, has evaluated the effectiveness of the Company’s disclosure controls and procedures (as defined in Rule 13a-15(e) under the Securities Exchange Act of 1934) as of March 31, 2015. Based on this evaluation, the Company’s Chief Executive Officer and Chief Financial Officer have concluded that the Company’s disclosure controls and procedures were effective as of March 31, 2015.
Changes in Internal Control Over Financial Reporting
No change in the Company's internal control over financial reporting (as defined in Rule 13a-15(f) under the Securities Exchange Act of 1934) was identified during the three months ended
March 31, 2015
, that has materially affected, or is reasonably likely to materially affect, the Company's internal control over financial reporting.
36
LENDINGCLUB CORPORATION
PART II. OTHER INFORMATION
Item 1. Legal Proceedings
For a discussion of legal proceedings, see
Part 1 - Financial Information - Item 1 - Financial Statements - Note 12 - Commitments and Contingencies - Legal
.
Item 1A. Risk Factors
During the first
three
months of
2015
, there have been no material changes to the risk factors in
Part I - Item 1A - Risk Factors
in the Company's Annual Report.
None.
None.
None.
None.
37
LENDINGCLUB CORPORATION
See Exhibit Index. The exhibits noted in the accompanying Exhibit Index are filed or incorporated by reference as a part of this Report and such Exhibit Index is incorporated herein by reference.
|
Incorporated by Reference
|
||||||
|
Exhibit
Number
|
Exhibit Description
|
Form
|
File No.
|
Exhibit
|
Filing
Date
|
Filed Herewith
|
|
2.1
|
Interest Purchase Agreement, dated as of April 17, 2014, by and among LendingClub Corporation, Springstone Financial, LLC, Premier Payment Solutions, Inc., NBT Capital Corp. and James P. Donovan
|
8-K
|
000-54752
|
2.1
|
April 17, 2014
|
|
|
3.1
|
Restated Certificate of Incorporation of LendingClub Corporation
|
8-K
|
000-54752
|
3.1
|
December 16, 2014
|
|
|
3.3
|
Restated Bylaws of LendingClub Corporation
|
8-K
|
333-151827
|
3.2
|
December 16, 2014
|
|
|
4.1
|
Form of Three-Year Member Payment Dependent Note
(included as Exhibit A to Exhibit 4.6)
|
S-1, Amendment No. 1
|
333-198393
|
4.1
|
October 20, 2014
|
|
|
4.2
|
Form of Five-Year Member Payment Dependent Note
(included as Exhibit B to Exhibit 4.6)
|
S-1, Amendment No. 1
|
333-198393
|
4.2
|
October 20, 2014
|
|
|
4.3
|
Form of Indenture by and between LendingClub Corporation and Wells Fargo Bank, National Association
|
S-1, Amendment No. 3
|
333-151827
|
4.2
|
October 9, 2008
|
|
|
4.4
|
First Supplemental Indenture, dated as of July 10, 2009, by and between LendingClub Corporation and Wells Fargo Bank, National Association
|
S-1, Post-Effective Amendment No. 3
|
333-151827
|
4.3
|
July 23, 2009
|
|
|
4.5
|
Second Supplemental Indenture, dated as of May 5, 2010, by and between LendingClub Corporation and Wells Fargo Bank, National Association
|
S-1, Post-Effective Amendment No. 5
|
333-151827
|
4.5
|
May 6, 2010
|
|
|
4.6
|
Third Supplemental Indenture, dated as of October 3, 2014, by and between LendingClub Corporation and Wells Fargo Bank, National Association.
|
S-1, Amendment No. 1
|
333-198393
|
4.6
|
October 20, 2014
|
|
|
4.7
|
Amended and Restated Investor Rights Agreement, dated as of April 16, 2014, by and among LendingClub Corporation and the Investors named therein
|
8-K
|
000-54752
|
4.1
|
April 17, 2014
|
|
|
4.8
|
Form of Common Stock Certificate of LendingClub Corporation
|
S-1, Amendment No. 2
|
333-198393
|
4.8
|
November 17, 2014
|
|
|
4.9
|
Forms of Warrants to Purchase Common Stock
|
S-1, Amendment No. 3
|
333-198393
|
4.9
|
December 1, 2014
|
|
|
4.10
|
Forms of Warrants to Purchase Series A Convertible Preferred Stock
|
S-1, Amendment No. 3
|
333-198393
|
4.9
|
December 1, 2014
|
|
|
10.1
|
Form of Indemnity Agreement
|
S-1, Amendment No. 3
|
333-198393
|
4.9
|
December 1, 2014
|
|
|
10.2
|
Form of Loan Agreement
|
S-1
|
333-177230
|
10.1
|
October 7, 2011
|
|
|
10.3
|
Form of Borrower Membership Agreement
|
S-1
|
333-177230
|
10.2
|
October 7, 2011
|
|
38
LENDINGCLUB CORPORATION
|
Incorporated by Reference
|
||||||
|
Exhibit
Number
|
Exhibit Description
|
Form
|
File No.
|
Exhibit
|
Filing
Date
|
Filed Herewith
|
|
10.4
|
LendingClub Corporation 2007 Stock Incentive Plan, as amended, and form of award agreement thereunder
|
S-1, Amendment No. 3
|
333-198393
|
10.4
|
December 1, 2014
|
|
|
10.6
|
2014 Equity Incentive Plan, and forms of award agreements thereunder
|
S-1, Amendment No. 3
|
333-198393
|
10.4
|
December 1, 2014
|
|
|
10.7
|
2014 Employee Stock Purchase Plan, and forms of enrollment agreements thereunder
|
S-1, Amendment No. 3
|
333-198393
|
10.4
|
December 1, 2014
|
|
|
10.8*
|
Second Amended and Restated Loan Sale Agreement, dated as of February 28, 2014, by and between LendingClub Corporation and WebBank
|
10-K/A
|
000-54752
|
10.6
|
December 4, 2014
|
|
|
10.9*
|
Second Amended and Restated Loan Account Program Agreement, dated as of February 28, 2014, by and between LendingClub Corporation and WebBank
|
10-K/A
|
000-54752
|
10.7
|
December 4, 2014
|
|
|
10.10
|
Hosting Services Agreement, dated as of October 6, 2008, by and between LendingClub Corporation and FOLIOfn Investments, Inc.
|
10-K
|
333-151827
|
10.15
|
June 17, 2009
|
|
|
10.11
|
Services Agreement, dated as of October 6, 2008, by and between LendingClub Corporation and FOLIOfn Investments, Inc.
|
S-1, Amendment No. 1
|
333-198393
|
10.11
|
October 20, 2014
|
|
|
10.12
|
License Agreement, dated as of October 6, 2008, by and between LendingClub Corporation and FOLIOfn Investments, Inc.
|
10-K
|
333-151827
|
10.17
|
June 17, 2009
|
|
|
10.13
|
Backup and Successor Servicing Agreement, dated as of September 15, 2011, by and between Portfolio Financial Servicing Company and LendingClub Corporation
|
S-1, Amendment No. 1
|
333-198393
|
10.13
|
October 20, 2014
|
|
|
10.14
|
Form of Partner Agreement
|
S-1/A
|
333-177230
|
10.28
|
March 19, 2012
|
|
|
10.15
|
Form of Employment Agreement for Chief Executive Officer
|
S-1, Amendment No. 3
|
333-198393
|
10.4
|
December 1, 2014
|
|
|
10.16
|
Form of Employment Agreement for Executive Officers other than Chief Executive Officer
|
S-1, Amendment No. 3
|
333-198393
|
10.4
|
December 1, 2014
|
|
|
10.20
|
Credit and Guaranty Agreement, dated as of April 16, 2014, among LendingClub Corporation, the guarantors party thereto, the lenders party thereto and Morgan Stanley Senior Funding, Inc.
|
S-1, Post-Effective Amendment No. 4
|
333-177230
|
10.23
|
April 29, 2014
|
|
|
10.21
|
Pledge and Security Agreement, dated April 16, 2014, by and among LendingClub Corporation, the guarantors referred to therein and Morgan Stanley Senior Funding, Inc.
|
S-1, Post-Effective Amendment No. 4
|
333-177230
|
10.24
|
April 29, 2014
|
|
|
10.22
|
Lease Agreement, dated as of May 17, 2013, by and between LendingClub Corporation and Forward One, LLC, as amended
|
S-1, Amendment No. 2
|
333-198393
|
10.22
|
November 17, 2014
|
|
39
LENDINGCLUB CORPORATION
|
Incorporated by Reference
|
||||||
|
Exhibit
Number
|
Exhibit Description
|
Form
|
File No.
|
Exhibit
|
Filing
Date
|
Filed Herewith
|
|
10.23
|
Assignment and Assumption of Lease, dated as of October 17, 2014, by and between LendingClub Corporation and Teachscape, Inc.
|
S-1, Amendment No. 2
|
333-198393
|
10.23
|
November 17, 2014
|
|
|
10.24
|
Form of Fund Subscription Agreement
|
S-1, Amendment No. 1
|
333-198393
|
10.24
|
October 20, 2014
|
|
|
10.25
|
Form of Investment Advisory Agreement
|
S-1, Amendment No. 1
|
333-198393
|
10.25
|
October 20, 2014
|
|
|
10.26
|
Form of Loan Purchase Agreement
|
S-1, Amendment No. 1
|
333-198393
|
10.26
|
October 20, 2014
|
|
|
10.27
|
Form of Loan Servicing Agreement
|
S-1, Amendment No. 1
|
333-198393
|
10.27
|
October 20, 2014
|
|
|
10.28
|
Form of Investor Agreement
|
S-1, Amendment No. 1
|
333-198393
|
10.28
|
October 20, 2014
|
|
|
10.29
|
Form of LCA Investment Advisory Agreement
|
S-1, Amendment No. 4
|
333-198393
|
10.29
|
December 8, 2014
|
|
|
10.30
|
Form of Certificate Account Opening and Maintenance Agreement
|
S-1, Amendment No. 4
|
333-198393
|
10.29
|
December 8, 2014
|
|
|
10.31
|
Lease Agreement, dated as of April 16, 2015, by and between LendingClub Corporation and 595 Market Street, Inc.
|
X
|
||||
|
31.1
|
Certification of Chief Executive Officer Pursuant to Section 302 of the Sarbanes-Oxley Act of 2002
|
X
|
||||
|
31.2
|
Certification of Chief Financial Officer Pursuant to Section 302 of the Sarbanes-Oxley Act of 2002
|
X
|
||||
|
32.1
|
Certification of Chief Executive Officer and Chief Financial Officer Pursuant to Section 906 of the Sarbanes-Oxley Act of 2002
|
X
|
||||
|
101.INS
|
XBRL Instance Document
|
X
|
||||
|
101.SCH
|
XBRL Taxonomy Extension Schema Document
|
X
|
||||
|
101.CAL
|
XBRL Taxonomy Extension Calculation Linkbase
|
X
|
||||
|
101.DEF
|
XBRL Taxonomy Extension Definition Linkbase
|
X
|
||||
|
101.LAB
|
XBRL Taxonomy Extension Label Linkbase
|
X
|
||||
|
101.PRE
|
XBRL Taxonomy Extension Presentation Linkbase
|
X
|
||||
|
*
|
Confidential treatment granted as to certain portions which portions have been omitted and filed separately with the SEC.
|
|||||
40
LENDINGCLUB CORPORATION
SIGNATURES
Pursuant to the requirements of Section 13 or 15(d) of the Securities Exchange Act of 1934, the registrant has duly caused this report to be signed on its behalf by the undersigned, thereunto duly authorized.
|
LENDINGCLUB CORPORATION
|
||||
|
(Registrant)
|
||||
|
Date:
|
May 5, 2015
|
/s/ RENAUD LAPLANCHE
|
||
|
Renaud Laplanche
|
||||
|
Chief Executive Officer
|
||||
|
/s/ CARRIE DOLAN
|
||||
|
Carrie Dolan
|
||||
|
Chief Financial Officer
|
||||
41
TABLE OF CONTENTS