LCNB CORP
10-Ks and 10-Qs
|
|
|
|
|
|
|
|
|
|
|
|
|
|
|
|
|
|
|
|
|
|
|
|
|
|
|
|
|
|
|
|
|
|
|
|
|
|
|
|
|
|
|
|
|
|
|
|
|
|
|
|
|
UNITED STATES
SECURITIES AND EXCHANGE COMMISSION
Washington, D.C. 20549
FORM 10-K
(Mark One)
|
☒
|
ANNUAL REPORT PURSUANT TO SECTION 13 OR 15(d) OF THE SECURITIES EXCHANGE ACT OF 1934
|
For the fiscal year ended
December 31, 2017
or
|
☐
|
TRANSITION REPORT PURSUANT TO SECTION 13 OR 15(d) OF THE SECURITIES EXCHANGE ACT OF 1934
|
For the transition period from _______________________ to ______________________
Commission File Number 000-26121
LCNB Corp.
(Exact name of registrant as specified in its charter)
|
Ohio
|
|
31-1626393
|
|
(State or other jurisdiction of incorporation or organization)
|
|
(I.R.S. Employer Identification Number)
|
2 North Broadway, Lebanon, Ohio 45036
(Address of principal executive offices, including Zip Code)
(513) 932-1414
(Registrant's telephone number, including area code)
Securities registered pursuant to Section 12(b) of the Exchange Act:
|
Title of Each Class
|
|
Name of each exchange on which registered
|
|
None
|
|
None
|
Securities registered pursuant to 12(g) of the Exchange Act:
COMMON STOCK, NO PAR VALUE
(Title of Class)
Indicate by check mark if the registrant is a well-known seasoned issuer, as defined in Rule 405 of the Securities Act.
☐
Yes
☒
No
Indicate by check mark if the registrant is not required to file reports pursuant to Section 13 or Section 15(d) of the Act.
☐
Yes
☒
No
Indicate by check mark whether the registrant (1) has filed all reports required to be filed by Section 13 or 15(d) of the Securities Exchange Act of 1934 during the preceding 12 months (or for such shorter period that the registrant was required to file such reports), and (2) has been subject to such filing requirements for the past 90 days.
☒
Yes
☐
No
Indicate by check mark whether the registrant has submitted electronically and posted on its corporate Website, if any, every Interactive Data File required to be submitted and posted pursuant to Rule 405 of Regulation S-T (§232.405 of this chapter) during the preceding 12 months (or for such shorter period that the registrant was required to submit and post such files).
☒
Yes
☐
No
Indicate by check mark if disclosure of delinquent filers pursuant to Item 405 of Regulation S-K (§229.405 of this chapter) is not contained herein, and will not be contained, to the best of the registrant's knowledge, in definitive proxy or information statements incorporated by reference in Part III of this Form 10-K or any amendment to this Form 10-K.
☐
Indicate by check mark whether the registrant is a large accelerated filer, an accelerated filer, a non-accelerated filer, or a smaller reporting company. See the definitions of “large accelerated filer, “accelerated filer” and “smaller reporting company” in Rule 12b-2 of the Exchange Act.
|
☐
Large accelerated filer
|
☒
Accelerated filer
|
|
☐
Non-accelerated filer (Do not check if a smaller reporting company)
|
☐
Smaller reporting company
|
Indicate by check mark whether the registrant is a shell company (as defined in Rule 12b-2 of the Act).
☐
Yes
☒
No
The aggregate market value of the registrant’s outstanding voting common stock held by nonaffiliates on June 30, 2017, determined using a per share closing price on that date of
$20.00
as quoted on the NASDAQ Capital Market, was
$192,316,000
.
As of
March 8, 2018
,
10,026,203
common shares were issued and outstanding.
DOCUMENTS INCORPORATED BY REFERENCE
Portions of the Proxy Statement included in the Notice of Annual Meeting of Shareholders to be held
April 24, 2018
, which Proxy Statement will be mailed to shareholders within 120 days from the end of the fiscal year ended
December 31, 2017
are incorporated by reference into Part III.
LCNB CORP.
For the Year Ended
December 31, 2017
TABLE OF CONTENTS
|
PART I
|
|
|
Item 1.
Business
|
|
|
Item 1A.
Risk Factors
|
|
|
Item 1B.
Unresolved Staff Comments
|
|
|
Item 2.
Properties
|
|
|
Item 3.
Legal Proceedings
|
|
|
Item 4.
Mine Safety Disclosures
|
|
|
|
|
|
PART II
|
|
|
Item 6.
Selected Financial Data
|
|
|
Item 9A.
Controls and Procedures
|
|
|
Item 9B.
Other Information
|
|
|
|
|
|
PART III
|
|
|
Item 11.
Executive Compensation
|
|
|
|
|
|
PART IV
|
|
|
|
|
-
3
-
FORWARD-LOOKING STATEMENTS
Certain statements made in this document regarding LCNB’s financial condition, results of operations, plans, objectives, future performance and business, are “forward-looking statements” within the meaning of Section 27A of the Securities Act of 1933, as amended, Section 21E of the Securities Exchange Act of 1934, as amended, and the Private Securities Litigation Reform Act of 1995. These forward-looking statements are identified by the fact they are not historical facts and include words such as “anticipate”, “could”, “may”, “feel”, “expect”, “believe”, “plan”, and similar expressions.
These forward-looking statements reflect management's current expectations based on all information available to management and its knowledge of LCNB’s business and operations. Additionally, LCNB’s financial condition, results of operations, plans, objectives, future performance and business are subject to risks and uncertainties that may cause actual results to differ materially. These factors include, but are not limited to:
|
1.
|
the success, impact, and timing of the implementation of LCNB’s business strategies;
|
|
2.
|
LCNB’s ability to integrate future acquisitions, including the pending merger with Columbus First Bancorp, Inc., may be unsuccessful, or may be more difficult, time-consuming or costly than expected;
|
|
3.
|
LCNB’s ability to obtain regulatory approvals of the proposed merger of LCNB with Columbus First Bancorp, Inc. on the proposed terms and schedule, and approval of the merger by the shareholders of LCNB or Columbus First Bancorp, Inc. may be unsuccessful;
|
|
4.
|
LCNB may incur increased charge-offs in the future;
|
|
5.
|
LCNB may face competitive loss of customers;
|
|
6.
|
changes in the interest rate environment may have results on LCNB’s operations materially different from those anticipated by LCNB’s market risk management functions;
|
|
7.
|
changes in general economic conditions and increased competition could adversely affect LCNB’s operating results;
|
|
8.
|
changes in other regulations and government policies affecting bank holding companies and their subsidiaries, including changes in monetary policies, could negatively impact LCNB’s operating results;
|
|
9.
|
LCNB may experience difficulties growing loan and deposit balances;
|
|
10.
|
the current economic environment poses significant challenges for us and could adversely affect our financial condition and results of operations;
|
|
11.
|
deterioration in the financial condition of the U.S. banking system may impact the valuations of investments LCNB has made in the securities of other financial institutions resulting in either actual losses or other than temporary impairments on such investments;
|
|
12.
|
difficulties with technology or data security breaches, including cyberattacks, that could negatively affect LCNB's ability to conduct business and its relationships with customers, vendors, and others; and
|
|
13.
|
government intervention in the U.S. financial system, including the effects of recent legislative, tax, accounting and regulatory actions and reforms, including the Dodd-Frank Wall Street Reform and Consumer Protection Act (the “Dodd-Frank Act”), the Jumpstart Our Business Startups Act, the Consumer Financial Protection Bureau, the capital ratios of Basel III as adopted by the federal banking authorities and the Tax Cuts and Jobs Act.
|
Forward-looking statements made herein reflect management's expectations as of the date such statements are made. Such information is provided to assist shareholders and potential investors in understanding current and anticipated financial operations of LCNB and is included pursuant to the safe harbor provisions of the Private Securities Litigation Reform Act of 1995. LCNB undertakes no obligation to update any forward-looking statement to reflect events or circumstances that arise after the date such statements are made.
-
4
-
DESCRIPTION OF LCNB CORP.'S BUSINESS
General Description
LCNB Corp., an Ohio corporation formed in December 1998, is a financial holding company headquartered in Lebanon, Ohio. Substantially all of the assets, liabilities and operations of LCNB Corp. are attributable to its wholly-owned subsidiary, LCNB National Bank (the "Bank"). LCNB Risk Management, Inc., a captive insurance agency, was incorporated in Nevada by LCNB Corp. during the second quarter 2017. LCNB Corp. and its subsidiaries are herein collectively referred to as “LCNB.” The predecessor of LCNB Corp., the Bank, was formed as a national banking association in 1877. On May 19, 1999, the Bank became a wholly-owned subsidiary of LCNB Corp.
On January 11, 2013, LCNB consummated a merger with First Capital Bancshares, Inc. (“First Capital”) in a stock and cash transaction valued at approximately $20.2 million. Immediately following the merger of First Capital into LCNB, Citizens National Bank (“Citizens National”), a wholly-owned subsidiary of First Capital, was merged into LCNB National Bank. At that time, Citizens National’s six full–service offices became offices of LCNB. Three of these offices are located in Chillicothe, Ohio and one office is located in each of Frankfort, Ohio, Clarksburg, Ohio, and Washington Court House, Ohio. The office in Clarksburg, Ohio was closed on January 24, 2017.
On January 24, 2014, LCNB purchased all of the outstanding stock of Eaton National Bank & Trust Co. ("Eaton National") from its holding company, Colonial Banc Corp., in a cash transaction totaling $24.75 million. Upon consummation of the transaction, Eaton National was merged into the Bank and its five offices became offices of the Bank. Two of these offices are located in Eaton, Ohio and one office is located in each of New Paris, Ohio, Lewisburg, Ohio, and West Alexandria, Ohio.
On April 30, 2015, LCNB consummated a merger with BNB Bancorp, Inc. (“BNB”) in a stock and cash transaction valued at approximately $13.5 million. Immediately following the merger of BNB into LCNB, Brookville National Bank ("Brookville National"), a wholly-owned subsidiary of BNB, was merged into LCNB National Bank. At that time, Brookville National's two offices, both located in Brookville, Ohio, became offices of LCNB. The office located on Hay Avenue in Brookville was closed on November 10, 2017.
On December 20, 2017, LCNB and Columbus First Bancorp, Inc. (“CFB”) entered into an Agreement and Plan of Merger pursuant to which CFB will be merged into LCNB in an all-stock transaction valued at $66.9 million. Immediately following the merger of CFB into LCNB, Columbus First Bank (“Columbus First”), a wholly-owned subsidiary of CFB, will be merged into the Bank. Columbus First operates one full-service office in Worthington, Ohio. This office will become a branch of the Bank after the merger. The transaction is expected to close in the second quarter of 2018, assuming shareholder approval by LCNB and CFB shareholders and all applicable governmental approvals have been received by that date and all other conditions precedent to the merger have been satisfied or waived.
The Bank is a full service community bank offering a wide range of commercial and personal banking services. Deposit services include checking accounts, NOW accounts, savings accounts, Christmas and vacation club accounts, money market deposit accounts, Lifetime Checking accounts (a senior citizen program), individual retirement accounts, and certificates of deposit. Additional supportive services include online banking, bill pay, mobile banking and telephone banking. Commercial customers also have both cash management and remote deposit capture products as potential options. Deposits of the Bank are insured up to applicable limits by the Deposit Insurance Fund, which is administered by the Federal Deposit Insurance Corporation (the “FDIC”).
Loan products offered include commercial and industrial loans, commercial and residential real estate loans, agricultural loans, construction loans, various types of consumer loans, and Small Business Administration loans. The Bank's residential mortgage lending activities consist primarily of loans for purchasing or refinancing personal residences, home equity lines of credit, and loans for commercial or consumer purposes secured by residential mortgages. Most fixed-rate residential real estate loans are sold to the Federal Home Loan Mortgage Corporation with servicing retained. Consumer lending activities include automobile, boat, home improvement and personal loans.
The Trust and Investment Management Division of the Bank provides complete trust administrative, estate settlement, and fiduciary services and also offers investment management of trusts, agency accounts, individual retirement accounts, and foundations/endowments.
-
5
-
Security brokerage services are offered by the Bank through arrangements with LPL Financial LLC, a registered broker/dealer. Licensed brokers offer a full range of investment services and products, including financial needs analysis, mutual funds, securities trading, annuities, and life insurance.
Other services offered include safe deposit boxes, night depositories, cashier's checks, bank-by-mail, ATMs, cash and transaction services, debit cards, wire transfers, electronic funds transfer, utility bill collections, notary public service, personal computer-based cash management services, 24 hour telephone banking, PC Internet banking, mobile banking, and other services tailored for both individuals and businesses.
The Bank is not dependent upon any one significant customer or specific industry. Business is not seasonal to any material degree.
The address of the main office of the Bank is 2 North Broadway, Lebanon, Ohio 45036; telephone (513) 932-1414.
Primary Market Area
The Bank considers its primary market area to consist of counties where it has a physical presence and neighboring counties, which includes Southwestern and South Central Ohio. At
December 31, 2017
, the Bank had:
|
•
|
34
offices, including a main office in Warren County, Ohio and branch offices in Warren, Butler, Clinton, Clermont, Hamilton, Montgomery, Preble, Ross, and Fayette Counties, Ohio,
|
|
•
|
a loan production office in Franklin County, Ohio,
|
|
•
|
an Operations Center in Warren County, Ohio,
|
|
•
|
and
38
ATMs.
|
Competition
The Bank faces strong competition both in making loans and attracting deposits. The deregulation of the banking industry and the wide spread enactment of state laws that permit multi-bank holding companies as well as the availability of nationwide interstate banking has created a highly competitive environment for financial services providers. The Bank competes with other national and state banks, savings and loan associations, credit unions, finance companies, mortgage brokerage firms, realty companies with captive mortgage brokerage firms, mutual funds, insurance companies, brokerage and investment banking companies, and other financial intermediaries operating in its market and elsewhere, many of whom have substantially larger financial and managerial resources.
The Bank seeks to minimize the competitive effect of other financial institutions through a community banking approach that emphasizes direct customer access to the Bank's CEO/President and other officers in an environment conducive to friendly, informed, and courteous personal services. Management believes that the Bank is well positioned to compete successfully in its primary market area. Competition among financial institutions is based upon interest rates offered on deposit accounts, interest rates charged on loans and other credit and service charges, the quality and scope of the services rendered, the convenience of the banking facilities, and, in the case of loans to commercial borrowers, relative lending limits.
The ability to access and use technology is an increasingly competitive factor in the finance services industry. Technology relating to the delivery of financial services, the security and privacy of customer information, and the processing of information is evolving rapidly. LCNB must continually make technology investments to remain competitive in the finance services industry.
Management believes the commitment of the Bank to personal service, innovation, and involvement in the communities and primary market areas it serves, as well as its commitment to quality community banking service, are factors that contribute to its competitive advantage.
Supervision and Regulation
LCNB Corp., as a financial holding company, is regulated under the Bank Holding Company Act of 1956, as amended (the "Act"), and is subject to the supervision and examination of the Board of Governors of the Federal Reserve System (the "Federal Reserve Board").
-
6
-
The Bank is subject to the provisions of the National Bank Act. The Bank is subject to primary supervision, regulation and examination by the Office of the Comptroller of the Currency (the "OCC"). The Bank is also subject to the rules and regulations of the Board of Governors of the Federal Reserve System and the FDIC.
LCNB Corp. and the Bank are subject to an extensive array of banking laws and regulations that are intended primarily for the protection of the Bank's customers and depositors. These laws and regulations govern such areas as permissible activities, loans and investments, and rates of interest that can be charged on loans and reserves. LCNB and the Bank also are subject to general U.S. federal laws and regulations and to the laws and regulations of the State of Ohio. Set forth below are brief descriptions of selected laws and regulations applicable to LCNB and the Bank.
The Financial Reform, Recovery and Enforcement Act of 1989 ("FIRREA") provides that a holding company and its controlled insured depository institutions are liable for any loss incurred by the FDIC in connection with the default of any FDIC assisted transaction involving an affiliated insured bank or savings association.
The Federal Deposit Insurance Corporation Improvement Act of 1991 ("FDICIA") substantially revised the bank regulatory and funding provisions of the Federal Deposit Insurance Act and several other federal banking statutes. Among its many reforms, FDICIA, as amended:
|
1.
|
Required regulatory agencies to take "prompt corrective action" with financial institutions that do not meet minimum capital requirements;
|
|
2.
|
Established five capital tiers: well capitalized, adequately capitalized, undercapitalized, significantly undercapitalized, and critically undercapitalized;
|
|
3.
|
Imposed significant restrictions on the operations of a financial institution that is not rated well-capitalized or adequately capitalized;
|
|
4.
|
Prohibited a depository institution from making any capital distributions, including payments of dividends or paying any management fee to its holding company, if the institution would be undercapitalized as a result;
|
|
5.
|
Implemented a risk-based premium system;
|
|
6.
|
Required an audit committee to be comprised of outside directors;
|
|
7.
|
Required a financial institution with more than $500 million in total assets to issue annual, audited financial statements prepared in conformity with U.S. generally accepted accounting principles; and
|
|
8.
|
Required a financial institution with more than $1 billion in total assets to document, evaluate, and report on the effectiveness of the entity's internal control system and required an independent public accountant to attest to management's assertions concerning the bank's internal control system.
|
The members of an audit committee for banks with more than $1 billion in total assets must be independent of management. FDICIA does not relieve financial institutions that are public companies, such as LCNB, from internal control reporting and attestation requirements or audit committee independence requirements prescribed by the Sarbanes-Oxley Act of 2002 (see below).
The Gramm-Leach-Bliley Act, which amended the Bank Holding Company Act of 1956 and other banking related laws, was signed into law on November 12, 1999. The Gramm-Leach-Bliley Act repealed certain sections of the Glass-Steagall Act and substantially eliminated the barriers separating the banking, insurance, and securities industries. Effective March 11, 2000, qualifying bank holding companies could elect to become financial holding companies. Financial holding companies have expanded investment powers, including affiliating with securities and insurance firms and engaging in other activities that are "financial in nature or incidental to such financial activity," as defined in the act, or "complementary to a financial activity."
The Sarbanes-Oxley Act of 2002 ("SOX") became effective on July 30, 2002. The purpose of SOX is to strengthen accounting oversight and corporate accountability by enhancing disclosure requirements, increasing accounting and auditor regulation, creating new federal crimes, and increasing penalties for existing federal crimes. SOX directly impacts publicly traded companies, certified public accounting firms auditing public companies, attorneys who work for public companies or have public companies as clients, brokerage firms, investment bankers, and financial analysts who work for brokerage firms or investment bankers. Key provisions affecting LCNB include:
|
1.
|
Certification of financial reports by the chief executive officer ("CEO") and the chief financial officer ("CFO"), who are responsible for designing and monitoring internal controls to ensure that material information relating to the issuer and its consolidated subsidiaries is made known to the certifying officers by others within the company;
|
-
7
-
|
2.
|
Inclusion of an internal control report in annual reports that include management's assessment of the effectiveness of a company's internal control over financial reporting and a report by the company's independent registered public accounting firm attesting to the effectiveness of internal control over financial reporting;
|
|
3.
|
Accelerated reporting of stock trades on Form 4 by directors and executive officers;
|
|
4.
|
Disgorgement requirements of incentive pay or stock-based compensation profits received within twelve months of the release of financial statements if the company is later required to restate those financial statements due to material noncompliance with any financial reporting requirement that resulted from misconduct;
|
|
5.
|
Disclosure in a company's periodic reports stating if it has adopted a code of ethics for its CFO and principal accounting officer or controller and, if such code of ethics has been implemented, immediate disclosure of any change in or waiver of the code of ethics;
|
|
6.
|
Disclosure in a company's periodic reports stating if at least one member of the audit committee is a "financial expert," as that term is defined by the Securities and Exchange Commission (the "SEC"); and
|
|
7.
|
Implementation of new duties and responsibilities for a company's audit committee, including independence requirements, the direct responsibility to appoint the outside auditing firm and to provide oversight of the auditing firm's work, and a requirement to establish procedures for the receipt, retention, and treatment of complaints from a company's employees regarding questionable accounting, internal control, or auditing matters.
|
In addition, the SEC adopted final rules on September 5, 2002, which rules were amended in December, 2005, requiring accelerated filing of quarterly and annual reports. Under the amended rules, “large accelerated filers” includes companies with a market capitalization of $700 million or more and “accelerated filers” includes companies with a market capitalization between $75 million and $700 million. Large accelerated filers are required to file their annual reports within 60 days of year-end and quarterly reports within 40 days. Accelerated filers are required to file their annual and quarterly reports within 75 days and 40 days, respectively. These new accelerated filing deadlines were effective for fiscal years ending on or after December 15, 2005. Under the amended rules, LCNB is considered an accelerated filer.
The Federal Deposit Insurance Reform Act of 2005 and the Federal Deposit Insurance Reform Conforming Amendments Act of 2005 (collectively, the “Deposit Insurance Reform Acts”) were both signed into law during February, 2006. The provisions of the Deposit Insurance Reform Acts included:
|
1.
|
Merging the Bank Insurance Fund and the Savings Association Insurance Fund into a new fund called the Deposit Insurance Fund, effective March 31, 2006;
|
|
2.
|
Increasing insurance coverage for retirement accounts from $100,000 to $250,000, effective April 1, 2006; and
|
|
3.
|
Eliminating a 1.25% hard target Designated Reserve Ratio, as defined, and giving the FDIC discretion to set the Designated Reserve Ratio within a range of 1.15% to 1.50% for any given year.
|
The Dodd-Frank Wall Street Reform and Consumer Protection Act (the “Dodd-Frank Act”) became effective on July 21, 2010. The Dodd-Frank Act includes provisions that specifically affect financial institutions and other entities providing financial services and other corporate governance and compensation provisions that will affect most public companies.
The Dodd-Frank Act established a new independent regulatory body within the Federal Reserve System known as the Consumer Financial Protection Bureau (the “CFPB”). The CFPB has assumed responsibility for most consumer protection laws and has broad authority, with certain exceptions, to regulate financial products offered by banks and non-banks. The CFPB has authority to supervise, examine, and take enforcement actions with respect to depository institutions with more than $10 billion in assets, non-bank mortgage industry participants, and other CFPB-designated non-bank providers of consumer financial services. The primary regulator for depository institutions with $10 billion or less in assets will continue to have primary examination and enforcement authority for these institutions. The regulations enforced, however, will be the regulations written by the CFPB.
The Dodd-Frank Act directs federal bank regulators to develop new capital requirements for holding companies and depository institutions that address activities that pose risk to the financial system, such as significant activities in higher risk areas, or concentrations in assets whose reported values are based on models.
The Dodd-Frank Act permanently raised the FDIC maximum deposit insurance amount to $250,000. In addition, the Dodd-Frank Act places a floor on the FDIC’s reserve ratio at 1.35% of estimated insured deposits or the comparable percentage of the assessment base.
-
8
-
General corporate governance provisions included in the Dodd-Frank Act include expanding executive compensation disclosures to be included in the annual proxy statement, requiring non-binding shareholder advisory votes on executive compensation at annual meetings, enhancing independence requirements for compensation committee members and any advisers used by the compensation committee, and requiring the adoption of certain compensation policies including the recovery of executive compensation in the event of a financial statement restatement.
Noncompliance with laws and regulations by bank holding companies and banks can lead to monetary penalties and/or an increased level of supervision or a combination of these two items. Management is not aware of any current significant instances of noncompliance with laws and regulations and does not anticipate any problems maintaining compliance on a prospective basis. Recent regulatory inspections and examinations of LCNB and the Bank have not disclosed any significant instances of noncompliance.
The earnings and growth of LCNB are affected not only by general economic conditions, but also by the fiscal and monetary policies of the federal government and its agencies, particularly the Federal Reserve Board. Its policies influence the amount of bank loans and deposits and the interest rates charged and paid thereon and thus have an effect on earnings. The nature of future monetary policies and the effect of such policies on the future business and earnings of LCNB and the Bank cannot be predicted.
A substantial portion of LCNB's cash revenues is derived from dividends paid by the Bank. These dividends are subject to various legal and regulatory restrictions. Generally, dividends are limited to the aggregate of current year retained net income, as defined, plus the retained net income of the two prior years. In addition, dividend payments may not reduce capital levels below minimum regulatory guidelines.
Employees
As of
December 31, 2017
, LCNB employed
310
full-time equivalent employees. LCNB is not a party to any collective bargaining agreement. Management considers its relationship with its employees to be very good. Employee benefit programs are considered by management to be competitive with benefit programs provided by other financial institutions and major employers within LCNB’s market area.
Availability of Financial Information
LCNB files unaudited quarterly financial reports on Form 10-Q, annual financial reports on Form 10-K, current reports on Form 8-K, and amendments to these reports are filed or furnished pursuant to Section 13(a) or 15(d) of the Securities Exchange Act of 1934 with the SEC. Copies of these reports are available free of charge in the shareholder information section of the Bank's website, www.lcnb.com, as soon as reasonably practicable after they are electronically filed or furnished to the SEC, or by writing to:
Robert C. Haines II
Executive Vice President, CFO
LCNB Corp.
2 North Broadway
P.O. Box 59
Lebanon, Ohio 45036
Financial reports and other materials filed by LCNB with the SEC may also be read and copied at the SEC's Public Reference Room at 100 F Street, N.E., Washington, D.C. 20549. Information on the operation of the Public Reference Room may be obtained from the SEC by calling 1-800-SEC-0330. The SEC also maintains an internet site (www.sec.gov) that contains reports, proxy and information statements, and other information regarding registrants that file reports electronically, as LCNB does.
FINANCIAL INFORMATION ABOUT FOREIGN AND DOMESTIC OPERATIONS AND EXPORT SALES
LCNB and its subsidiaries do not have any offices located in foreign countries and have no foreign assets, liabilities or related income and expense for the years presented.
-
9
-
STATISTICAL INFORMATION
The following tables and certain tables appearing in Item 7, Management's Discussion and Analysis present additional statistical information about LCNB Corp. and its operations and financial condition. They should be read in conjunction with the consolidated financial statements and related notes and the discussion included in Item 7, Management's Discussion and Analysis of Financial Condition and Results of Operations, and Item 7A, Quantitative and Qualitative Disclosures about Market Risk.
Distribution of Assets, Liabilities and Shareholders' Equity; Interest Rates and Interest Differential
The table presenting an average balance sheet, interest income and expense, and the resultant average yield for average interest-earning assets and average interest-bearing liabilities is included in Item 7, Management's Discussion and Analysis of Financial Condition and Results of Operations.
The table analyzing changes in interest income and expense by volume and rate is included in Item 7, Management's Discussion and Analysis of Financial Condition and Results of Operations.
Investment Portfolio
The following table presents the carrying values of securities for the years indicated:
|
|
At December 31,
|
||||||||
|
|
2017
|
2016
|
2015
|
||||||
|
|
(In thousands)
|
||||||||
|
Securities available-for-sale:
|
|
|
|
||||||
|
U.S. Treasury notes
|
$
|
2,259
|
|
28,145
|
|
72,846
|
|
||
|
U.S. Agency notes
|
83,261
|
|
85,400
|
|
139,889
|
|
|||
|
U.S. Agency mortgage-backed securities
|
67,153
|
|
71,047
|
|
29,378
|
|
|||
|
Certificates of deposit
|
—
|
|
—
|
|
249
|
|
|||
|
Municipal securities
|
122,540
|
|
132,860
|
|
132,420
|
|
|||
|
Mutual funds
|
2,542
|
|
2,482
|
|
2,466
|
|
|||
|
Trust preferred securities
|
50
|
|
48
|
|
50
|
|
|||
|
Equity securities
|
667
|
|
677
|
|
680
|
|
|||
|
Total securities available-for-sale
|
278,472
|
|
320,659
|
|
377,978
|
|
|||
|
Securities held-to-maturity:
|
|
|
|
|
|
|
|||
|
Municipal securities
|
32,571
|
|
41,003
|
|
22,633
|
|
|||
|
Federal Reserve Bank stock
|
2,732
|
|
2,732
|
|
2,732
|
|
|||
|
Federal Home Loan Bank stock
|
3,638
|
|
3,638
|
|
3,638
|
|
|||
|
Total securities
|
$
|
317,413
|
|
368,032
|
|
406,981
|
|
||
-
10
-
Contractual maturities of securities at
December 31, 2017
, were as follows. Actual maturities may differ from contractual maturities when issuers have the right to call or prepay obligations.
|
|
Available-for-Sale
|
Held-to-Maturity
|
|||||||||||||||||
|
Amortized
Cost
|
Fair
Value
|
Yield
|
Amortized
Cost
|
Fair
Value
|
Yield
|
||||||||||||||
|
|
(Dollars in thousands)
|
||||||||||||||||||
|
U.S. Treasury notes:
|
|
|
|
|
|
|
|||||||||||||
|
Within one year
|
$
|
—
|
|
—
|
|
—
|
%
|
$
|
—
|
|
—
|
|
—
|
%
|
|||||
|
One to five years
|
—
|
|
—
|
|
—
|
%
|
—
|
|
—
|
|
—
|
%
|
|||||||
|
Five to ten years
|
2,283
|
|
2,259
|
|
2.07
|
%
|
—
|
|
—
|
|
—
|
%
|
|||||||
|
After ten years
|
—
|
|
—
|
|
—
|
%
|
—
|
|
—
|
|
—
|
%
|
|||||||
|
Total U.S. Treasury notes
|
2,283
|
|
2,259
|
|
2.07
|
%
|
—
|
|
—
|
|
—
|
%
|
|||||||
|
U.S. Agency notes:
|
|
|
|
|
|
|
|
|
|
|
|
|
|||||||
|
Within one year
|
998
|
|
998
|
|
1.40
|
%
|
—
|
|
—
|
|
—
|
%
|
|||||||
|
One to five years
|
38,235
|
|
37,805
|
|
1.77
|
%
|
—
|
|
—
|
|
—
|
%
|
|||||||
|
Five to ten years
|
45,604
|
|
44,458
|
|
2.02
|
%
|
—
|
|
—
|
|
—
|
%
|
|||||||
|
After ten years
|
—
|
|
—
|
|
—
|
%
|
—
|
|
—
|
|
—
|
%
|
|||||||
|
Total U.S. Agency notes
|
84,837
|
|
83,261
|
|
1.90
|
%
|
—
|
|
—
|
|
—
|
%
|
|||||||
|
Municipal securities (1):
|
|
|
|
|
|
|
|
|
|
|
|
|
|||||||
|
Within one year
|
10,224
|
|
10,269
|
|
3.29
|
%
|
4,043
|
|
4,047
|
|
3.15
|
%
|
|||||||
|
One to five years
|
54,665
|
|
54,648
|
|
2.73
|
%
|
4,128
|
|
4,045
|
|
2.90
|
%
|
|||||||
|
Five to ten years
|
54,633
|
|
54,119
|
|
2.94
|
%
|
8,415
|
|
8,286
|
|
3.04
|
%
|
|||||||
|
After ten years
|
3,640
|
|
3,504
|
|
2.80
|
%
|
15,985
|
|
15,972
|
|
5.81
|
%
|
|||||||
|
Total Municipal securities
|
123,162
|
|
122,540
|
|
2.93
|
%
|
32,571
|
|
32,350
|
|
4.40
|
%
|
|||||||
|
U.S. Agency mortgage-backed securities
|
68,347
|
|
67,153
|
|
2.17
|
%
|
—
|
|
—
|
|
—
|
%
|
|||||||
|
Mutual funds
|
2,586
|
|
2,542
|
|
2.23
|
%
|
—
|
|
—
|
|
—
|
%
|
|||||||
|
Trust preferred securities
|
49
|
|
50
|
|
7.78
|
%
|
—
|
|
—
|
|
—
|
%
|
|||||||
|
Equity securities
|
574
|
|
667
|
|
3.59
|
%
|
—
|
|
—
|
|
—
|
%
|
|||||||
|
Totals
|
$
|
281,838
|
|
278,472
|
|
2.40
|
%
|
32,571
|
|
32,350
|
|
4.40
|
%
|
||||||
|
(1)
|
Yields on tax-exempt obligations are computed on a taxable-equivalent basis based upon a 34.0% statutory Federal income tax rate.
|
Excluding holdings in U.S. Treasury securities and U.S. Government Agencies, there were no investments in securities of any issuer that exceeded 10% of LCNB's consolidated shareholders' equity at
December 31, 2017
.
Loan Portfolio
Administration of the lending function is the responsibility of the Chief Lending Officer and certain senior lenders. Lenders perform their duties subject to oversight and policy direction from the Board of Directors and the Loan Committee. The Loan Committee consists of LCNB’s Chief Executive Officer/President, Chief Financial Officer, Cashier, Chief Lending Officer, Chief Credit Officer, Loan Operations Officer, Loan Review Officer, Credit Analysis Officer, and the officers in charge of the commercial, agricultural, and retail loan portfolios.
-
11
-
Employees authorized to accept loan applications have various, designated lending limits for the approval of loans. A loan application for an amount outside a particular employee’s lending limit needs to be approved by an employee with a lending limit sufficient for that loan. Loans secured by residential or commercial real estate require the approval of two individuals with appropriate lending authority: Chief Executive Officer/President, Chief Lending Officer, Chief Credit Officer, Senior Vice President ("SVP") of Commercial Lending, SVP of Mortgage Lending, SVP of Consumer Lending, Assistant Vice President of Secondary Market Lending, or other board-designated lending officers. Board approval is required on any loan with policy exceptions or that will exceed 50% of the Bank's legal lending limit, rounded down to the previous $100,000, in aggregate credit to any one borrower or entity, as defined by the OCC in 12 C.F.R § 32.2(b).
Interest rates charged by LCNB vary with degree of risk, type of loan, amount, complexity, repricing frequency and other relevant factors associated with the loan.
The following table summarizes the distribution of the loan portfolio for the years indicated:
|
|
At December 31,
|
|||||||||||||||||||||||||||||||||
|
|
2017
|
2016
|
2015
|
2014
|
2013
|
|||||||||||||||||||||||||||||
|
|
Amount
|
%
|
Amount
|
%
|
Amount
|
%
|
Amount
|
%
|
Amount
|
%
|
||||||||||||||||||||||||
|
|
(Dollars in thousands)
|
|||||||||||||||||||||||||||||||||
|
Commercial and industrial
|
$
|
36,057
|
|
4.2
|
%
|
$
|
41,878
|
|
5.1
|
%
|
$
|
45,275
|
|
5.9
|
%
|
$
|
35,424
|
|
5.1
|
%
|
$
|
29,337
|
|
5.1
|
%
|
|||||||||
|
Commercial, secured by real estate
|
527,947
|
|
62.2
|
%
|
477,275
|
|
58.2
|
%
|
419,633
|
|
54.5
|
%
|
379,141
|
|
54.3
|
%
|
314,252
|
|
54.7
|
%
|
||||||||||||||
|
Residential real estate
|
251,582
|
|
29.6
|
%
|
265,788
|
|
32.5
|
%
|
273,139
|
|
35.4
|
%
|
254,087
|
|
36.4
|
%
|
215,587
|
|
37.6
|
%
|
||||||||||||||
|
Consumer
|
17,450
|
|
2.1
|
%
|
19,173
|
|
2.3
|
%
|
18,510
|
|
2.4
|
%
|
18,006
|
|
2.5
|
%
|
12,643
|
|
2.2
|
%
|
||||||||||||||
|
Agricultural
|
15,194
|
|
1.8
|
%
|
14,802
|
|
1.8
|
%
|
13,479
|
|
1.7
|
%
|
11,472
|
|
1.6
|
%
|
2,472
|
|
0.4
|
%
|
||||||||||||||
|
Other loans, including deposit overdrafts
|
539
|
|
0.1
|
%
|
633
|
|
0.1
|
%
|
665
|
|
0.1
|
%
|
680
|
|
0.1
|
%
|
91
|
|
—
|
%
|
||||||||||||||
|
|
848,769
|
|
100.0
|
%
|
819,549
|
|
100.0
|
%
|
770,701
|
|
100.0
|
%
|
698,810
|
|
100.0
|
%
|
574,382
|
|
100.0
|
%
|
||||||||||||||
|
Deferred origination costs (fees), net
|
291
|
|
|
|
254
|
|
|
|
237
|
|
|
|
146
|
|
|
|
(28
|
)
|
|
|
||||||||||||||
|
Total loans
|
849,060
|
|
|
|
819,803
|
|
|
|
770,938
|
|
|
|
698,956
|
|
|
|
574,354
|
|
|
|
||||||||||||||
|
Less allowance for loan losses
|
3,403
|
|
|
|
3,575
|
|
|
|
3,129
|
|
|
|
3,121
|
|
|
|
3,588
|
|
|
|
||||||||||||||
|
Loans, net
|
$
|
845,657
|
|
|
|
$
|
816,228
|
|
|
|
$
|
767,809
|
|
|
|
$
|
695,835
|
|
|
|
$
|
570,766
|
|
|
|
|||||||||
As of
December 31, 2017
, there were no concentrations of loans exceeding 10% of total loans that are not already disclosed as a category of loans in the above table, except for loans secured by multifamily properties. Loans secured by multifamily properties, which are included in the commercial, secured by real estate category in the above table, totaled $85,853,000, or 10.1% of total loans, at December 31, 2017.
-
12
-
The following table summarizes the commercial and agricultural loan maturities and sensitivities to interest rate change at
December 31, 2017
:
|
|
(In thousands)
|
||
|
Maturing in one year or less
|
$
|
32,732
|
|
|
Maturing after one year, but within five years
|
57,451
|
|
|
|
Maturing beyond five years
|
489,015
|
|
|
|
Total commercial and agricultural loans
|
$
|
579,198
|
|
|
|
|
|
|
|
Loans maturing beyond one year:
|
|
|
|
|
Fixed rate
|
$
|
199,916
|
|
|
Variable rate
|
346,550
|
|
|
|
Total
|
$
|
546,466
|
|
Risk Elements
The following table summarizes non-accrual, past-due, and accruing restructured loans for the dates indicated:
|
|
At December 31,
|
||||||||||||||
|
|
2017
|
2016
|
2015
|
2014
|
2013
|
||||||||||
|
|
(Dollars in thousands)
|
||||||||||||||
|
Non-accrual loans
|
$
|
2,965
|
|
5,725
|
|
1,723
|
|
5,599
|
|
2,961
|
|
||||
|
Past-due 90 days or more and still accruing
|
—
|
|
23
|
|
559
|
|
203
|
|
250
|
|
|||||
|
Accruing restructured loans
|
10,469
|
|
11,731
|
|
13,723
|
|
14,269
|
|
15,151
|
|
|||||
|
Total
|
$
|
13,434
|
|
17,479
|
|
16,005
|
|
20,071
|
|
18,362
|
|
||||
|
Percent to total loans
|
1.58
|
%
|
2.13
|
%
|
2.08
|
%
|
2.87
|
%
|
3.20
|
%
|
|||||
LCNB is not committed to lend additional funds to debtors whose loans have been modified to provide a reduction or deferral of principal or interest because of deterioration in the financial position of the borrower.
At
December 31, 2017
, there were no material additional loans not classified as acquired credit impaired or already disclosed as non-accrual, accruing restructured, or accruing past due 90 days or more where known information about possible credit problems of the borrowers causes management to have serious doubts as to the ability of such borrowers to comply with present loan repayment terms.
Summary of Loan Loss Experience
The table summarizing the activity related to the allowance for loan losses is included in Item 7, Management’s Discussion and Analysis of Financial Condition and Results of Operations.
-
13
-
Allocation of the Allowance for Loan Losses
The following table presents the allocation of the allowance for loan loss:
|
|
At December 31,
|
|||||||||||||||||||||||||||||||||
|
|
2017
|
2016
|
2015
|
2014
|
2013
|
|||||||||||||||||||||||||||||
|
|
Amount
|
Percent
of Loans
in Each
Category
to Total
Loans
|
Amount
|
Percent
of Loans
in Each
Category
to Total
Loans
|
Amount
|
Percent
of Loans
in Each
Category
to Total
Loans
|
Amount
|
Percent
of Loans
in Each
Category
to Total
Loans
|
Amount
|
Percent
of Loans
in Each
Category
to Total
Loans
|
||||||||||||||||||||||||
|
|
(Dollars in thousands)
|
|||||||||||||||||||||||||||||||||
|
Commercial and industrial
|
$
|
378
|
|
4.2
|
%
|
$
|
350
|
|
5.1
|
%
|
$
|
244
|
|
5.9
|
%
|
$
|
129
|
|
5.1
|
%
|
$
|
175
|
|
5.1
|
%
|
|||||||||
|
Commercial, secured by real estate
|
2,178
|
|
62.2
|
%
|
2,179
|
|
58.2
|
%
|
1,908
|
|
54.5
|
%
|
1,990
|
|
54.3
|
%
|
2,520
|
|
54.7
|
%
|
||||||||||||||
|
Residential real estate
|
717
|
|
29.6
|
%
|
885
|
|
32.5
|
%
|
854
|
|
35.4
|
%
|
926
|
|
36.4
|
%
|
826
|
|
37.6
|
%
|
||||||||||||||
|
Consumer
|
76
|
|
2.1
|
%
|
96
|
|
2.3
|
%
|
54
|
|
2.4
|
%
|
63
|
|
2.5
|
%
|
66
|
|
2.2
|
%
|
||||||||||||||
|
Agricultural
|
53
|
|
1.8
|
%
|
60
|
|
1.8
|
%
|
66
|
|
1.7
|
%
|
11
|
|
1.6
|
%
|
—
|
|
0.4
|
%
|
||||||||||||||
|
Other loans, including deposit overdrafts
|
1
|
|
0.1
|
%
|
5
|
|
0.1
|
%
|
3
|
|
0.1
|
%
|
2
|
|
0.1
|
%
|
1
|
|
—
|
%
|
||||||||||||||
|
Unallocated
|
—
|
|
—
|
|
—
|
|
—
|
|
—
|
|
—
|
|
—
|
|
—
|
|
—
|
|
—
|
|
||||||||||||||
|
Total
|
$
|
3,403
|
|
100.0
|
%
|
$
|
3,575
|
|
100.0
|
%
|
$
|
3,129
|
|
100.0
|
%
|
$
|
3,121
|
|
100.0
|
%
|
$
|
3,588
|
|
100.0
|
%
|
|||||||||
Deposits
The statistical information regarding average amounts and average rates paid for the deposit categories is included in the "Distribution of Assets, Liabilities and Shareholders' Equity" table included in Item 7, Management's Discussion and Analysis of Financial Condition and Results of Operations.
The following table presents the contractual maturity of time deposits of $100,000 or more at
December 31, 2017
:
|
|
(In thousands)
|
||
|
Maturity within 3 months
|
$
|
4,311
|
|
|
After 3 but within 6 months
|
2,830
|
|
|
|
After 6 but within 12 months
|
14,526
|
|
|
|
After 12 months
|
44,940
|
|
|
|
|
$
|
66,607
|
|
Return on Equity and Assets
The statistical information regarding the return on assets, return on equity, dividend payout ratio, and equity to assets ratio is presented in Item 6, Selected Financial Data.
-
14
-
There are risks inherent in LCNB’s operations, many beyond management’s control, which may adversely affect its financial condition and results from operations and should be considered in evaluating the Company. Credit, market, operational, liquidity, interest rate and other risks are described elsewhere in this report. Other risk factors may include the items described below.
New capital requirements could adversely affect LCNB’s capital ratios
On July 2, 2013, the Federal Reserve Board approved the final rules implementing the Basel Committee on Banking Supervision’s capital guidelines for U.S. bank holding companies as well as state banks that are members of the Federal Reserve System and savings and loan holding companies (commonly known as Basel III). On July 9, 2013, the OCC adopted the same rules for national banks and federal savings associations, and the FDIC approved the same provisions, as an interim final rule, for state nonmember banks and state savings associations.
Under the final rules, minimum requirements will increase for both the quantity and quality of capital held by banks and savings associations. The rules include a new common equity Tier 1 capital to risk-weighted assets ratio of 4.5% and a common equity Tier 1 capital conservation buffer of 2.5% of risk-weighted assets. The final rules also raise the minimum ratio of Tier 1 capital to risk-weighted assets from 4.0% to 6.0% and require a minimum leverage ratio of 4.0%.
The phase-in period for the final rules began for LCNB on January 1, 2015, with full compliance with all of the final rules' requirements phased in over a multi-year schedule through January 1, 2019. While management expects that LCNB's capital ratios under Basel III will continue to exceed the well capitalized minimum capital requirements, there can be no assurance that such will be the case. If LCNB is unable to meet or exceed the applicable minimum capital requirements, it may become subject to supervisory actions ranging in severity from losing its financial holding company status, to being precluded from making acquisitions or engaging in new activities or becoming subject to informal or formal regulatory enforcement actions.
LCNB’s earnings are significantly affected by market interest rates.
Fluctuations in interest rates may negatively impact LCNB’s profitability. A primary source of income from operations is net interest income, which is equal to the difference between interest income earned on loans and investment securities and the interest paid for deposits and other borrowings. These rates are highly sensitive to many factors beyond LCNB’s control, including general economic conditions, the slope of the yield curve (that is, the relationship between short and long-term interest rates), and the monetary and fiscal policies of the United States Federal government. LCNB expects the current level of interest rates and the current slope of the yield curve will cause further downward pressure on its net interest margin.
Increases in general interest rates could have a negative impact on LCNB’s results of operations by reducing the ability of borrowers to repay their current loan obligations. Some residential real estate mortgage loans, most home equity line of credit loans, and many of LCNB’s commercial loans have adjustable rates. Borrower inability to make scheduled loan payments due to a higher loan cost could result in increased loan defaults, foreclosures, and write-offs and may necessitate additions to the allowance for loan losses. In addition, increases in the general level of interest rates may decrease the demand for new consumer and commercial loans, thus limiting LCNB’s growth and profitability. A general increase in interest rates may also result in deposit disintermediation, which is the flow of deposits away from banks and other depository institutions into direct investments that have the potential for higher rates of return, such as stocks, bonds, and mutual funds. If this occurs, LCNB may have to rely more heavily on borrowings as a source of funds in the future, which could negatively impact its net interest margin.
Gains from sales of mortgage loans may experience significant volatility.
Gains from sales of mortgage loans are highly influenced by the level and direction of mortgage interest rates, real estate activity, and refinancing activity. Current historically low market interest rates created a refinancing demand for residential fixed-rate mortgage loans. The increased volume of refinancing activity increased gains from sales of mortgage loans as LCNB sold most of these loans to the Federal Home Loan Mortgage Corporation. An increase in market interest rates may decrease the demand for refinanced loans and decrease the gains from sales of mortgage loans recognized in LCNB’s consolidated statements of income. Gains from sales of mortgage loans may also be impacted by changes in LCNB’s strategy to manage its residential mortgage portfolio. For example, LCNB may occasionally change the proportion of loan originations that are sold in the secondary market and instead add a greater proportion to its loan portfolio.
-
15
-
Banking competition in Southwestern and South Central Ohio is intense.
LCNB faces strong competition for deposits, loans, trust accounts, and other services from other banks, savings banks, credit unions, mortgage brokers, and other financial institutions. Many of LCNB’s competitors include major financial institutions that have been in business for many years and have established customer bases, numerous branches, and substantially higher regulatory lending limits. Competitors in the Southwestern and South Central Ohio areas include U.S. Bank, PNC Bank, Fifth Third Bank, Chase, KeyBank, Park National Bank, Huntington National Bank, and First Financial Bank. In addition, credit unions are growing larger due to more flexible membership requirement regulations and are offering more financial services than they legally could in the past.
LCNB also competes with numerous real estate brokerage firms, some owned by realty companies, for residential real estate mortgage loans. Incentives offered by captive finance companies owned by the major automobile companies have limited the banking industry’s opportunities for growth in the new automobile loan market. The banking industry now competes with brokerage firms and mutual fund companies for funds that would have historically been held as bank deposits. Technology has lowered barriers to entry and made it possible for non-banks to offer products and services traditionally provided by banks, such as automatic transfer and automatic payment systems. Many of these competitors have fewer regulatory constraints and may have lower cost structures.
If LCNB is unable to attract and retain loan, deposit, brokerage, and trust customers, its growth and profitability levels may be negatively impacted.
Economic conditions in Southwestern and South Central Ohio could adversely affect LCNB’s financial condition and results of operations.
LCNB conducts its operations from offices that are located in nine Southwestern and South Central Ohio counties, from which substantially all of its customer base is drawn. Because of this geographic concentration of operations and customer base, LCNB's financial performance is heavily influenced by economic conditions in these areas. Any material deterioration in economic conditions in these markets could have material direct or indirect adverse impacts on LCNB's customers and on LCNB. Such deterioration could increase the number of customers experiencing financial distress, negatively impacting their ability to obtain new loans or to repay existing loans. As a result, LCNB may experience increases in the levels of impaired loans, increased charge-offs, and increased provisions for loan losses. Deteriorating economic conditions may also affect the ability of depositors to maintain or add to deposit balances and may affect the demand for loans, trust, brokerage, and other products and services offered by LCNB. Such losses and decreased demand could have material adverse affects on LCNB's financial position, results of operations, and cash flows.
The allowance for loan losses may be inadequate.
The provision for loan losses is determined by management based upon its evaluation of the amount needed to maintain the allowance for loan losses at a level considered appropriate in relation to the estimated risk of losses inherent in the portfolio. In addition to historic charge-off percentages, factors taken into consideration to determine the adequacy of the allowance for loan losses include the nature, volume, and consistency of the loan portfolio, overall portfolio quality, a review of specific problem loans, the fair value of any underlying collateral, borrowers’ cash flows, and current economic conditions that may affect borrowers’ ability to make payments. Increases in the allowance result in an expense for the period. By its nature, the evaluation is imprecise and requires significant judgment. Actual results may vary significantly from management’s assumptions. If, as a result of general economic conditions or a decrease in asset quality, management determines that additional increases in the allowance for loan losses are necessary, LCNB will incur additional expenses.
LCNB’s loan portfolio includes a substantial amount of commercial and industrial loans and commercial real estate loans, which may have more risks than residential or consumer loans.
LCNB’s commercial and industrial and commercial real estate loans comprise a substantial portion of its total loan portfolio. These loans generally carry larger loan balances and involve a greater degree of financial and credit risk than home equity, residential mortgage, or consumer loans. The increased financial and credit risk associated with these types of loans is a result of several factors, including the concentration of principal in a limited number of loans, the size of loan balances, the effects of general economic conditions on income-producing properties, and the increased difficulty of evaluating and monitoring these types of loans.
-
16
-
The repayment of loans secured by commercial real estate is often dependent upon the successful operation, development, or sale of the related real estate or commercial business and may, therefore, be subject to adverse conditions in the real estate market or economy. If the cash flow from operations is reduced, the borrower’s ability to repay the loan may be impaired. In such cases, LCNB may take one or more actions to protect its financial interest in the loan. Such actions may include foreclosure on the real estate securing the loan, taking possession of other collateral that may have been pledged as security for the loan, or modifying the terms of the loan. If foreclosed on, commercial real estate is often unique and may not be as salable as a residential home.
The fair value of LCNB’s investments could decline.
Most of LCNB’s investment securities portfolio is designated as available-for-sale. Accordingly, unrealized gains and losses, net of tax, in the estimated fair value of the available-for-sale portfolio is recorded as other comprehensive income, a separate component of shareholders’ equity. The fair value of LCNB’s investment portfolio may decline, causing a corresponding decline in shareholders’ equity. Management believes that several factors will affect the fair values of the investment portfolio including, but not limited to, changes in interest rates or expectations of changes, the degree of volatility in the securities markets, inflation rates or expectations of inflation, and the slope of the interest rate yield curve. These and other factors may impact specific categories of the portfolio differently and the effect any of these factors may have on any specific category of the portfolio cannot be predicted.
Many state and local governmental authorities have experienced deterioration of financial condition in recent years due to declining tax revenues, increased demand for services, and various other factors. To the extent LCNB has any municipal securities in its portfolio from issuers who are experiencing deterioration of financial condition or who may experience future deterioration of financial condition, the value of such securities may decline and could result in other-than-temporary impairment charges, which could have an adverse effect on LCNB’s financial condition and results of operations. Additionally, a general, industry-wide decline in the fair value of municipal securities could significantly affect LCNB’s financial condition and results of operations.
Changes in income tax laws or interpretations or in accounting standards could materially affect LCNB’s financial condition or results of operations.
Changes in income tax laws could be enacted, or interpretations of existing income tax laws could change, causing an adverse effect to LCNB’s financial condition or results of operations. Similarly, new accounting standards may be issued by the Financial Accounting Standards Board (the “FASB”) or existing standards revised, changing the methods for preparing financial statements. These changes are not within LCNB’s control and may significantly impact its reported financial condition and results of operations.
LCNB is subject to environmental liability risk associated with lending activities.
A significant portion of the Bank’s loan portfolio is secured by real property. During the ordinary course of business, the Bank may foreclose on and take title to properties securing certain loans. In doing so, there is a risk that hazardous or toxic substances could be found on these properties. If hazardous or toxic substances are found, the Bank may be liable for remediation costs, as well as for personal injury and property damage. Environmental laws may require the Bank to incur substantial expenses and may materially reduce the affected property’s value or limit the Bank’s ability to use or sell the affected property. In addition, future laws or more stringent interpretations or enforcement policies with respect to existing laws may increase the Bank’s exposure to environmental liability. Although the Bank has policies and procedures to perform an environmental review before initiating any foreclosure action on real property, these reviews may not be sufficient to detect all potential environmental hazards. The remediation costs and any other financial liabilities associated with an environmental hazard could have a material adverse effect on LCNB’s financial condition and results of operations.
The banking industry is highly regulated.
LCNB is subject to regulation, supervision, and examination by the Federal Reserve Board and the Bank is subject to regulation, supervision, and examination by the OCC. LCNB and the Bank are also subject to regulation and examination by the FDIC as the deposit insurer. The CFPB is responsible for most consumer protection laws and has broad authority, with certain exceptions, to regulate financial products offered by banks. Federal and state laws and regulations govern numerous matters including, but not limited to, changes in the ownership or control of banks, maintenance of adequate capital, permissible business operations, maintenance of deposit insurance, protection of customer financial privacy, the level of reserves held against deposits, restrictions on dividend payments, the making of loans, and the acceptance of deposits. See the previous section titled “Supervision and Regulation” for more information on this subject.
-
17
-
Federal regulators may initiate various enforcement actions against a financial institution that violates laws or regulations or that operates in an unsafe or unsound manner. These enforcement actions may include, but are not limited to, the assessment of civil money penalties, the issuance of cease-and-desist or removal orders, and the imposition of written agreements.
Proposals to change the laws governing financial institutions are periodically introduced in Congress and proposals to change regulations are periodically considered by the regulatory bodies. Such future legislation and/or changes in regulations could increase or decrease the cost of doing business, limit or expand permissible activities, or affect the competitive balance among banks, savings associations, credit unions, and other financial institutions. The likelihood of any major changes in the future and their effects are impossible to predict.
Federal income tax reform could have unforeseen effects on our financial condition and results of operations.
On December 22, 2017, the President of the United States signed into law H.R. 1, originally known as the “Tax Cuts and Jobs Act.” The Company is still in the process of analyzing the Tax Cuts and Jobs Act and its possible effects on the Company. The Tax Cuts and Jobs Act includes a number of provisions, including the lowering of the U.S. corporate tax rate from 35 percent to 21 percent, effective January 1, 2018. There are also provisions that may partially offset the benefit of such rate reduction. Financial statement impacts include adjustments for, among other things, the re-measurement of deferred tax assets and liabilities. While there are benefits, there is also substantial uncertainty regarding the details of U.S. Tax Reform. The intended and unintended consequences of the Tax Cuts and Jobs Act on our business and on holders of our common shares is uncertain and could be adverse. The Company anticipates that the impact of the Tax Cuts and Jobs Act may be material to our business, financial condition and results of operations.
FDIC deposit insurance assessments may materially increase in the future.
Deposits of LCNB are insured up to statutory limits by the Federal Deposit Insurance Corporation (FDIC) and, accordingly, LCNB and other banks and financial institutions pay quarterly premiums to the FDIC to maintain the Deposit Insurance Fund. The likelihood and extent of future rate increases are indeterminable.
Future growth and expansion opportunities may contain risks.
From time to time LCNB may seek to acquire other financial institutions or parts of those institutions or may open new branch offices. It may also consider and enter into new lines of business or offer new products or services. Such activities involve a number of risks, which may include potential inaccuracies in estimates and judgments used to evaluate the expansion opportunity, diversion of management and employee attention, lack of experience in a new market or product or service, and difficulties in integrating a future acquisition or introducing a new product or service. There is no assurance that such growth or expansion activities will be successful or that they will achieve desired profitability levels.
The financial services industry, as well as the broader economy, may be subject to new legislation, regulation, and government policy
.
At this time, it is difficult to predict the legislative and regulatory changes that will result from the combination of a new President of the United States and the first year since 2010 in which both Houses of Congress and the White House have majority memberships from the same political party. In recent years, however, both the new President and senior members of the House of Representatives have advocated for significant reduction of financial services regulation, to include amendments to the Dodd-Frank Act and structural changes to the CFPB. The new Administration and Congress also may cause broader economic changes due to changes in governing ideology and governing style. New appointments to the Board of Governors of the Federal Reserve could affect monetary policy and interest rates and changes in fiscal policy could affect broader patterns of trade and economic growth. Future legislation, regulation, and government policy could affect the banking industry as a whole, including LCNB's business and results of operations, in ways that are difficult to predict. In addition, LCNB's results of operations could be adversely affected by changes in the way in which existing statutes and regulations are interpreted or applied by courts and government agencies.
LCNB’s controls and procedures may fail or be circumvented.
Management regularly reviews and updates LCNB’s internal controls, disclosure controls and procedures, and corporate governance policies and procedures. Any system of controls, however well designed and operated, is based in part on certain assumptions and can provide only reasonable, not absolute, assurances that the objectives of the system are met. Any failure or circumvention of LCNB’s controls and procedures or failure to comply with regulations related to its controls and procedures could have a material adverse effect on LCNB’s business, results of operations, and financial condition.
-
18
-
LCNB’s information systems may experience an interruption, cyberattack, or other breach in security.
LCNB relies heavily on communications and information systems to conduct its business. Significant resources are devoted to maintaining and regularly updating LCNB's data systems, there can be no assurance that these security measures will provide absolute security. Any failure, interruption, cyberattack, or other breach in security of these systems could result in failures or disruptions in LCNB’s customer relationship management, general ledger, deposit, loan, and other systems. While LCNB has policies and procedures designed to prevent or limit the effect of the failure, interruption, cyberattack, or other security breach of its information systems, there can be no assurance that any such occurrences will not occur or, if they do occur, that they will be adequately addressed. The occurrence of any failures, interruptions, cyberattacks, or other security breaches of LCNB’s information systems could significantly disrupt LCNB's operations, allow misappropriation of LCNB's confidential information, allow misappropriation of customer confidential information, damage LCNB’s reputation, result in a loss of customer business, subject LCNB to additional regulatory scrutiny, or expose LCNB to significant civil litigation and possible financial liability, any of which could have a material adverse effect on its financial condition and results of operations.
LCNB continually encounters technological change.
The financial services industry is continually undergoing rapid technological change with frequent introductions of new technology-driven products and services. LCNB’s future success depends, in part, upon its ability to address customer needs by using technology to provide products and services that will satisfy customer demands, as well as to create additional efficiencies in LCNB’s operations. LCNB may not be able to effectively implement new technology-driven products and services or be successful in marketing these products and services to its customers. Failure to successfully keep pace with technological change affecting the financial services industry could negatively affect LCNB’s growth, revenue and profit.
Emergence of nonbank alternatives to the financial system.
Consumers may decide not to use banks to complete their financial transactions. Technology and other changes, including the emergence of “Fintech Companies,” are allowing parties to complete financial transactions through alternative methods that historically have involved banks. For example, consumers can complete transactions, such as paying bills and/or transferring funds, directly without the assistance of banks. The process of eliminating banks as intermediaries, known as “disintermediation,” could result in the loss of fee income, as well as the loss of customer deposits and the related income generated from those deposits. The loss of these revenue streams and the lower cost of deposits as a source of funds could have a material adverse effect on our financial condition and results of operations.
Risk factors related to LCNB’s trust business.
Competition for trust business is intense. Competitors include other commercial bank and trust companies, brokerage firms, investment advisory firms, mutual fund companies, accountants, and attorneys.
LCNB’s trust business is directly affected by conditions in the debt and equity securities markets. The debt and equity securities markets are affected by, among other factors, domestic and foreign economic conditions and the monetary and fiscal policies of the United States Federal government, all of which are beyond LCNB’s control. Changes in economic conditions may directly affect the economic performance of the trust accounts in which clients’ assets are invested. A decline in the fair value of the trust accounts caused by a decline in general economic conditions directly affects LCNB’s trust fee income because such fees are primarily based on the fair value of the trust accounts. In addition, a sustained decrease in the performance of the trust accounts or a lack of sustained growth may encourage clients to seek alternative investment options.
The management of trust accounts is subject to the risk of mistaken distributions, poor investment choices, and miscellaneous other incorrect decisions. Such mistakes may give rise to surcharge actions by beneficiaries, with damages substantially in excess of the fees earned from management of the accounts.
LCNB’s ability to pay cash dividends is limited.
LCNB is dependent upon the earnings of the Bank for funds to pay dividends on its common shares. The payment of dividends by LCNB and the Bank is subject to certain regulatory restrictions. As a result, any payment of dividends in the future will be dependent, in large part, on the ability of LCNB and the Bank to satisfy these regulatory restrictions and on the Bank’s earnings, capital levels, financial condition, and other factors. Although LCNB’s financial earnings and financial condition have allowed it to declare and pay periodic cash dividends to shareholders, there can be no assurance that the current dividend policy or the amount of dividend distributions will continue in the future.
-
19
-
Not applicable.
-
20
-
The Bank conducts its business from the following offices:
|
Name of Office
|
Address
|
County
|
||||||
|
1.
|
Main Office
|
2 North Broadway
Lebanon, Ohio 45036
|
Warren
|
Owned
|
||||
|
2.
|
Auto Bank
|
Silver and Mechanic Streets
Lebanon, Ohio 45036
|
Warren
|
Owned
|
||||
|
3.
|
Barron Street Office
|
1697 North Barron Street
Eaton, Ohio 45320
|
Preble
|
Leased
|
||||
|
4.
|
Bridge Street Office
|
1240 North Bridge Street
Chillicothe, Ohio 45601
|
Ross
|
Owned
|
||||
|
5.
|
Brookville Office
|
225 West Upper Lewisburg Salem Road Brookville, Ohio 45309
|
Montgomery
|
Owned
|
||||
|
6.
|
Centerville Office
|
9605 Dayton-Lebanon Pike
Centerville, Ohio 45458
|
Montgomery
|
Owned
|
||||
|
7.
|
Chillicothe Office
|
33 West Main Street
Chillicothe, Ohio 45601
|
Ross
|
Owned
|
||||
|
8.
|
Colerain Township Office
|
3209 West Galbraith Road
Cincinnati, Ohio 45239
|
Hamilton
|
Owned
|
||||
|
9.
|
Columbus Avenue Office
|
730 Columbus Avenue
Lebanon, Ohio 45036
|
Warren
|
Owned
|
||||
|
10.
|
Eaton Office
|
110 West Main Street
Eaton, Ohio 45320
|
Preble
|
Owned
|
||||
|
11.
|
Fairfield Office
|
765 Nilles Road
Fairfield, Ohio 45014
|
Butler
|
Leased
|
||||
|
12.
|
Frankfort Office
|
Springfield and Main Streets
Frankfort, Ohio 45628
|
Ross
|
Owned
|
||||
|
13.
|
Goshen Office
|
6726 Dick Flynn Blvd.
Goshen, Ohio 45122
|
Clermont
|
Owned
|
||||
|
14.
|
Hamilton Office
|
794 NW Washington Blvd.
Hamilton, Ohio 45013
|
Butler
|
Owned
|
||||
|
15.
|
Hunter Office
|
3878 State Route 122
Franklin, Ohio 45005
|
Warren
|
Owned
|
||||
|
16.
|
Lewisburg Office
|
522 South Commerce Street
Lewisburg, Ohio 45338
|
Preble
|
Owned
|
||||
|
17.
|
Loveland Office
|
500 Loveland-Madeira Road Loveland, Ohio 45140
|
Hamilton
|
Owned
|
||||
-
21
-
|
Name of Office
|
Address
|
County
|
||||||
|
18.
|
Maineville Office
|
7795 South State Route 48 Maineville, Ohio 45039
|
Warren
|
Owned
|
||||
|
19.
|
Mason/West Chester Office
|
1050 Reading Road
Mason, Ohio 45040
|
Warren
|
Owned
|
||||
|
20.
|
Middletown Office
|
4441 Marie Drive
Middletown, Ohio 45044
|
Butler
|
Owned
|
||||
|
21.
|
Monroe Office
|
101 Clarence F. Warner Drive
Monroe, Ohio 45050
|
Butler
|
Owned
|
||||
|
22.
|
New Paris Office
|
201 South Washington Street
New Paris, Ohio 45347
|
Preble
|
Owned
|
||||
|
23.
|
Oakwood Office
|
2705 Far Hills Avenue
Oakwood, Ohio 45419
|
Montgomery
|
(2)
|
||||
|
24.
|
Otterbein Office
|
Otterbein Retirement Community
State Route 741
Lebanon, Ohio 45036
|
Warren
|
Leased
|
||||
|
25.
|
Oxford Office (1)
|
30 West Park Place
Oxford, Ohio 45056
|
Butler
|
(2)
|
||||
|
26.
|
Rochester/Morrow Office
|
Route 22-3 at 123
Morrow, Ohio 45152
|
Warren
|
Owned
|
||||
|
27.
|
South Lebanon Office
|
603 Corwin Nixon Blvd.
South Lebanon, Ohio 45065
|
Warren
|
Owned
|
||||
|
28.
|
Springboro/Franklin Office
|
525 West Central Avenue
Springboro, Ohio 45066
|
Warren
|
Owned
|
||||
|
29.
|
Warrior Office
|
Lebanon High School
1916 Drake Road
Lebanon, Ohio 45036
|
Warren
|
Leased
|
||||
|
30.
|
Washington Court House Office
|
100 Crossings Drive
Washington Court House, Ohio 43160
|
Fayette
|
Owned
|
||||
|
31.
|
Waynesville Office
|
9 North Main Street
Waynesville, Ohio 45068
|
Warren
|
Owned
|
||||
|
32.
|
West Alexandria Office
|
55 East Dayton Street
West Alexandria, Ohio 45381
|
Preble
|
Owned
|
||||
|
33.
|
Western Avenue Office
|
1006 Western Avenue
Chillicothe, Ohio 45601
|
Ross
|
Owned
|
||||
|
34.
|
Wilmington Office
|
1243 Rombach Avenue
Wilmington, Ohio 45177
|
Clinton
|
Owned
|
||||
|
35.
|
Loan Production Office
|
1500 West Third Ave., Suite 205 & 209 Grandview Heights, Ohio 43212
|
Franklin
|
Leased
|
||||
-
22
-
|
Name of Office
|
Address
|
County
|
||||||
|
36.
|
Operations Center
|
105 North Broadway
Lebanon, Ohio 45036 |
Warren
|
Owned
|
||||
|
(1)
|
Excess space in this office is leased to third parties.
|
|
(2)
|
The Bank owns the Oakwood and Oxford office buildings and leases the land.
|
Except for routine litigation incidental to its businesses, LCNB is not a party to any material pending legal proceedings and none of its property is the subject of any material proceedings.
Not Applicable.
-
23
-
LCNB had approximately 962 registered holders of its common stock as of December 31, 2017. The number of shareholders includes banks and brokers who act as nominees, each of whom may represent more than one shareholder. LCNB’s stock trades on the NASDAQ Capital Market exchange under the symbol “LCNB.”
Trade prices for shares of LCNB Common Stock and cash dividends per share declared and paid are set forth below. The trade prices shown below are interdealer without retail markups, markdowns, or commissions.
|
|
2017
|
2016
|
||||||||||||||||
|
|
High
|
Low
|
Dividends Declared
|
High
|
Low
|
Dividends Declared
|
||||||||||||
|
First Quarter
|
$
|
24.35
|
|
20.80
|
|
0.16
|
|
17.75
|
|
15.51
|
|
0.16
|
|
|||||
|
Second Quarter
|
23.90
|
|
19.00
|
|
0.16
|
|
17.24
|
|
15.69
|
|
0.16
|
|
||||||
|
Third Quarter
|
21.85
|
|
18.05
|
|
0.16
|
|
19.13
|
|
15.73
|
|
0.16
|
|
||||||
|
Fourth Quarter
|
22.84
|
|
19.40
|
|
0.16
|
|
25.00
|
|
16.55
|
|
0.16
|
|
||||||
|
Total dividends declared
|
0.64
|
|
0.64
|
|
||||||||||||||
It is expected that LCNB will continue to pay dividends on a similar schedule, to the extent permitted by business and potential factors beyond management's control.
LCNB depends on dividends from the Bank for the majority of its liquid assets, including the cash needed to pay dividends to its shareholders. National banking law limits the amount of dividends the Bank may pay to the sum of retained net income, as defined, for the current year plus retained net income for the previous two calendar years. Prior approval from the OCC, the Bank’s primary regulator, would be necessary for the Bank to pay dividends in excess of this amount. In addition, dividend payments may not reduce capital levels below minimum regulatory guidelines. Management believes the Bank will be able to pay anticipated ordinary dividends to LCNB without needing to request approval.
During the period of this report, LCNB did not sell any of its securities that were not registered under the Securities Act.
On April 17, 2001, LCNB's Board of Directors authorized three separate stock repurchase programs, two of which continue to be in effect – the “Market Repurchase Program and the “Private Sale Repurchase Program.” Any shares purchased will be held for future corporate purposes.
Under the Market Repurchase Program, LCNB was originally authorized to purchase up to 200,000 shares of its stock through market transactions with a selected stockbroker. On November 14, 2005, the Board of Directors extended the Market Repurchase Program by increasing the shares authorized for repurchase to 400,000 total shares. Through December 31, 2017, 290,444 shares have been purchased under this program. No shares were purchased under the Market Repurchase Program during 2017 and 2016.
The Private Sale Repurchase Program is available to shareholders who wish to sell large blocks of stock at one time. Because LCNB's common stock is not widely traded, a shareholder releasing large blocks may not be able to readily sell all shares through normal procedures. Purchases of blocks will be considered on a case-by-case basis and will be made at prevailing market prices. There is no limit to the number of shares that may be purchased under this program. A total of 466,018 shares have been purchased under this program since its inception through December 31, 2017. No shares were purchased under the Private Sale Repurchase Program during 2017 and 2016.
LCNB established an Ownership Incentive Plan (the "2002 Plan") during 2002 that allowed for the issuance of up to 200,000 shares of stock-based awards to eligible employees, as determined by the Board of Directors. The awards could be in the form of stock options, share awards, and/or appreciation rights. The 2002 Plan expired on April 16, 2012. Outstanding, unexercised options continue to be exercisable in accordance with their terms.
-
24
-
The 2015 Ownership Incentive Plan (the "2015 Plan") was approved by LCNB's shareholders at the annual meeting on April 28, 2015 and allows for stock-based awards to eligible employees, as determined by the Compensation Committee of the Board of Directors. Awards may be made in the form of stock options, appreciation rights, restricted shares, and/or restricted share units. This plan provides for the issuance of up to 450,000 shares and will terminate on April 28, 2025, unless earlier terminated by the Compensation Committee.
The following table shows information relating to stock options outstanding under the 2002 Plan and 2015 Plan at December 31, 2017:
|
Plan Category
|
Number of Securities to
be Issued upon Exercise
of Outstanding Options
|
Weighted Average
Exercise Price of
Outstanding Options
|
Number of Securities
Remaining Available
for Future Issuance
|
||||||
|
Equity compensation plans approved by security holders
|
20,265
|
|
$
|
11.42
|
|
429,935
|
|
||
|
Equity compensation plans not approved by security holders
|
—
|
|
—
|
|
—
|
|
|||
|
Total
|
20,265
|
|
$
|
11.42
|
|
429,935
|
|
||
-
25
-
The graph below provides an indicator of cumulative total shareholder returns for LCNB as compared with the NASDAQ Composite, the SNL Midwest OTC-BB and Pink Sheet Banks, and the SNL Midwest Bank indexes. This graph covers the period from December 31, 2012 through December 31, 2017. The cumulative total shareholder returns included in the graph reflect the returns for the shares of common stock of LCNB. The information provided in the graph assumes that $100 was invested on December 31, 2012 in LCNB common stock, the NASDAQ Composite, and the SNL Midwest Bank Index and that all dividends were reinvested.
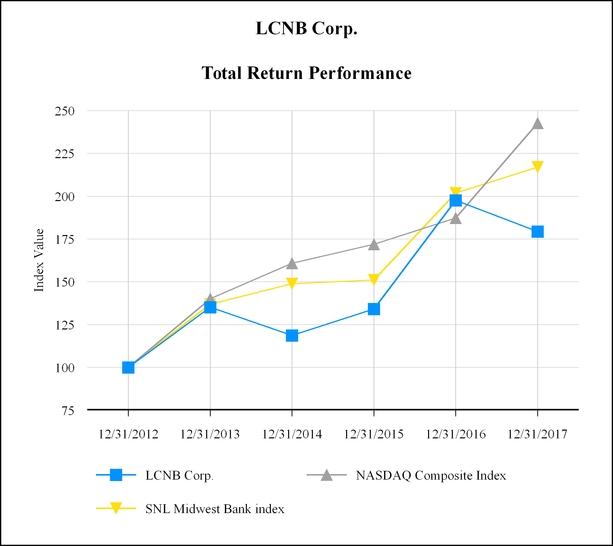
|
Period Ending
|
|||||||||||||
|
Index
|
12/31/2012
|
|
12/31/2013
|
|
12/31/2014
|
|
12/31/2015
|
|
12/31/2016
|
|
12/31/2017
|
|
|
|
LCNB Corp.
|
$
|
100.00
|
|
135.14
|
|
118.72
|
|
134.15
|
|
197.63
|
|
179.39
|
|
|
NASDAQ Composite Index
|
$
|
100.00
|
|
140.12
|
|
160.78
|
|
171.97
|
|
187.22
|
|
242.71
|
|
|
SNL Midwest Bank index
|
$
|
100.00
|
|
136.91
|
|
148.84
|
|
151.10
|
|
201.89
|
|
216.95
|
|
|
Source: S&P Global Market Intelligence
|
|||||||||||||
|
© 2017
|
|||||||||||||
-
26
-
The following represents selected consolidated financial data of LCNB for the years ended December 31, 2013 through 2017 and are derived from LCNB's consolidated financial statements. Certain prior year data presented in this table have been reclassified to conform with the current year presentation. This data should be read in conjunction with the consolidated financial statements and the notes thereto included in Item 8 of this Form 10-K and Management's Discussion and Analysis of Financial Condition and Results of Operations and Quantitative and Qualitative Disclosures about Market Risk included in Items 7 and 7A, respectively, of this Form 10-K, and are qualified in their entirety thereby and by other detailed information elsewhere in this Form 10-K.
|
|
For the Years Ended December 31,
|
||||||||||||||
|
|
2017
|
2016
|
2015
|
2014
|
2013
|
||||||||||
|
|
(Dollars in thousands, except per share data)
|
||||||||||||||
|
Income Statement:
|
|
|
|
|
|
|
|
|
|
|
|||||
|
Interest income
|
$
|
44,463
|
|
43,750
|
|
42,659
|
|
39,477
|
|
33,497
|
|
||||
|
Interest expense
|
3,599
|
|
3,504
|
|
3,328
|
|
3,590
|
|
4,065
|
|
|||||
|
Net interest income
|
40,864
|
|
40,246
|
|
39,331
|
|
35,887
|
|
29,432
|
|
|||||
|
Provision for loan losses
|
215
|
|
913
|
|
1,366
|
|
930
|
|
588
|
|
|||||
|
Net interest income after provision for loan losses
|
40,649
|
|
39,333
|
|
37,965
|
|
34,957
|
|
28,844
|
|
|||||
|
Non-interest income
|
10,458
|
|
10,853
|
|
10,123
|
|
9,142
|
|
9,090
|
|
|||||
|
Non-interest expenses
|
33,863
|
|
33,261
|
|
32,392
|
|
30,844
|
|
26,212
|
|
|||||
|
Income before income taxes
|
17,244
|
|
16,925
|
|
15,696
|
|
13,255
|
|
11,722
|
|
|||||
|
Provision for income taxes
|
4,272
|
|
4,443
|
|
4,222
|
|
3,386
|
|
2,942
|
|
|||||
|
Net income
|
$
|
12,972
|
|
12,482
|
|
11,474
|
|
9,869
|
|
8,780
|
|
||||
|
Dividends per common share
|
$
|
0.64
|
|
0.64
|
|
0.64
|
|
0.64
|
|
0.64
|
|
||||
|
Earnings per common share:
|
|
|
|
|
|
|
|
|
|
|
|||||
|
Basic
|
1.30
|
|
1.26
|
|
1.18
|
|
1.06
|
|
1.12
|
|
|||||
|
Diluted
|
1.29
|
|
1.25
|
|
1.17
|
|
1.05
|
|
1.10
|
|
|||||
|
Balance Sheet:
|
|
|
|
|
|
|
|
|
|
|
|||||
|
Securities
|
$
|
317,413
|
|
368,032
|
|
406,981
|
|
314,074
|
|
279,021
|
|
||||
|
Loans, net
|
845,657
|
|
816,228
|
|
767,809
|
|
695,835
|
|
570,766
|
|
|||||
|
Total assets
|
1,295,638
|
|
1,306,799
|
|
1,280,531
|
|
1,108,066
|
|
932,338
|
|
|||||
|
Total deposits
|
1,085,821
|
|
1,110,905
|
|
1,087,160
|
|
946,205
|
|
785,761
|
|
|||||
|
Short-term borrowings
|
47,000
|
|
42,040
|
|
37,387
|
|
16,645
|
|
8,655
|
|
|||||
|
Long-term debt
|
303
|
|
598
|
|
5,947
|
|
11,357
|
|
12,102
|
|
|||||
|
Total shareholders' equity
|
150,271
|
|
142,944
|
|
140,108
|
|
125,695
|
|
118,873
|
|
|||||
|
Selected Financial Ratios and Other Data:
|
|
|
|
|
|
|
|
|
|
|
|||||
|
Return on average assets
|
0.99
|
%
|
0.96
|
%
|
0.94
|
%
|
0.88
|
%
|
0.93
|
%
|
|||||
|
Return on average equity
|
8.74
|
%
|
8.60
|
%
|
8.43
|
%
|
8.04
|
%
|
9.02
|
%
|
|||||
|
Equity-to-assets ratio
|
11.60
|
%
|
10.94
|
%
|
10.94
|
%
|
11.34
|
%
|
12.75
|
%
|
|||||
|
Dividend payout ratio
|
49.23
|
%
|
50.79
|
%
|
54.24
|
%
|
60.38
|
%
|
57.14
|
%
|
|||||
|
Net interest margin, fully taxable equivalent
|
3.58
|
%
|
3.51
|
%
|
3.64
|
%
|
3.66
|
%
|
3.57
|
%
|
|||||
Eaton National merged with and into LCNB as of the close of business on January 24, 2014. As of the date of the merger, LCNB recorded additional loans of $115.9 million and additional deposits of $165.3 million.
BNB merged with and into LCNB as of the close of business on April 30, 2015. As of the date of the merger, LCNB recorded additional loans of $34.7 million and additional deposits of $99.1 million.
-
27
-
Introduction
The following is management's discussion and analysis of the consolidated financial condition and consolidated results of operations of LCNB. It is intended to amplify certain financial information regarding LCNB and should be read in conjunction with the consolidated financial statements and related notes contained in the
2017
Annual Report to Shareholders.
Overview
Net income for
2017
was $12,972,000 (basic and diluted earnings per share of $1.30 and $1.29, respectively), compared to $12,482,000 (basic and diluted earnings per share of $1.26 and $1.25) in 2016 and $11,474,000 (basic and diluted earnings per share of $1.18 and $1.17) in 2015.
The following items significantly affected earnings for 2017:
|
•
|
Net gain on sales of securities was significantly greater in 2016 as compared to 2017 and 2015 due primarily to market rates at the time of the sales. In addition, the amount of securities sold in 2017 was less than the amounts sold in 2016 and 2015.
|
|
•
|
Other real estate owned expense was greater in 2016 and 2015 as compared to 2017 because of valuation writedowns and losses on sales recognized during 2016 and 2015. Other real estate owned properties held during 2017 were minimal.
|
|
•
|
Other non-interest expense for 2017 included $154,000 in organizational costs for LCNB Risk Management, Inc. and $113,000 in losses from sales of fixed assets, primarily due to the sale of a closed office building.
|
|
•
|
As a result of the Tax Cuts and Jobs Act that was signed into law on December 22, 2017, LCNB revalued its net deferred tax liability position to reflect the reduction in its federal corporate income tax rate from 34% to 21%. This revaluation resulted in a one-time income tax benefit of approximately $224,000, or $0.02 of basic and diluted earnings per common share for the year ended December 31, 2017.
|
Net Interest Income
LCNB's primary source of earnings is net interest income, which is the difference between earnings from loans and other investments and interest paid on deposits and other liabilities. The following table presents, for the years indicated, average balances for interest-earning assets and interest-bearing liabilities, the income or expense related to each item, and the resulting average yields earned or rates paid.
-
28
-
LCNB CORP. AND SUBSIDIARIES
Item 7. Management's Discussion and Analysis of Financial Condition and Results of Operations (continued)
|
|
Years ended December 31,
|
||||||||||||||||||||||||||||
|
|
2017
|
2016
|
2015
|
||||||||||||||||||||||||||
|
|
Average
Outstanding
Balance
|
Interest
Earned/
Paid
|
Average
Yield/
Rate
|
Average
Outstanding
Balance
|
Interest
Earned/
Paid
|
Average
Yield/
Rate
|
Average
Outstanding
Balance
|
Interest
Earned/
Paid
|
Average
Yield/
Rate
|
||||||||||||||||||||
|
|
(Dollars in thousands)
|
||||||||||||||||||||||||||||
|
Loans (1)
|
$
|
822,452
|
|
36,571
|
|
4.45
|
%
|
$
|
792,526
|
|
35,600
|
|
4.49
|
%
|
$
|
740,626
|
|
35,285
|
|
4.76
|
%
|
||||||||
|
Federal funds sold
|
—
|
|
—
|
|
—
|
%
|
—
|
|
—
|
|
—
|
%
|
452
|
|
1
|
|
0.22
|
%
|
|||||||||||
|
Interest-bearing demand deposits
|
7,972
|
|
88
|
|
1.10
|
%
|
12,394
|
|
59
|
|
0.48
|
%
|
12,245
|
|
30
|
|
0.24
|
%
|
|||||||||||
|
Federal Reserve Bank stock
|
2,732
|
|
164
|
|
6.00
|
%
|
2,732
|
|
164
|
|
6.00
|
%
|
2,495
|
|
152
|
|
6.09
|
%
|
|||||||||||
|
Federal Home Loan Bank stock
|
3,638
|
|
182
|
|
5.00
|
%
|
3,638
|
|
146
|
|
4.01
|
%
|
3,638
|
|
146
|
|
4.01
|
%
|
|||||||||||
|
Investment securities:
|
|
|
|
|
|
|
|
|
|
|
|
|
|
|
|
|
|
|
|||||||||||
|
Taxable
|
208,918
|
|
4,328
|
|
2.07
|
%
|
243,559
|
|
4,582
|
|
1.88
|
%
|
245,410
|
|
4,197
|
|
1.71
|
%
|
|||||||||||
|
Non-taxable (2)
|
143,394
|
|
4,815
|
|
3.36
|
%
|
140,692
|
|
4,862
|
|
3.46
|
%
|
115,215
|
|
4,315
|
|
3.75
|
%
|
|||||||||||
|
Total earning assets
|
1,189,106
|
|
46,148
|
|
3.88
|
%
|
1,195,541
|
|
45,413
|
|
3.80
|
%
|
1,120,081
|
|
44,126
|
|
3.94
|
%
|
|||||||||||
|
Non-earning assets
|
123,800
|
|
|
|
|
|
112,909
|
|
|
|
|
|
107,919
|
|
|
|
|
|
|||||||||||
|
Allowance for loan losses
|
(3,405
|
)
|
|
|
|
|
(3,318
|
)
|
|
|
|
|
(2,888
|
)
|
|
|
|
|
|||||||||||
|
Total assets
|
$
|
1,309,501
|
|
|
|
|
|
$
|
1,305,132
|
|
|
|
|
|
$
|
1,225,112
|
|
|
|
|
|
||||||||
|
Savings deposits
|
$
|
645,471
|
|
594
|
|
0.09
|
%
|
$
|
654,891
|
|
652
|
|
0.10
|
%
|
$
|
608,925
|
|
545
|
|
0.09
|
%
|
||||||||
|
IRA and time certificates
|
205,540
|
|
2,784
|
|
1.35
|
%
|
217,228
|
|
2,788
|
|
1.28
|
%
|
219,562
|
|
2,464
|
|
1.12
|
%
|
|||||||||||
|
Short-term borrowings
|
23,976
|
|
209
|
|
0.87
|
%
|
17,952
|
|
38
|
|
0.21
|
%
|
15,105
|
|
24
|
|
0.16
|
%
|
|||||||||||
|
Long-term debt
|
421
|
|
12
|
|
2.85
|
%
|
826
|
|
26
|
|
3.15
|
%
|
6,177
|
|
295
|
|
4.78
|
%
|
|||||||||||
|
Total interest-bearing liabilities
|
875,408
|
|
3,599
|
|
0.41
|
%
|
890,897
|
|
3,504
|
|
0.39
|
%
|
849,769
|
|
3,328
|
|
0.39
|
%
|
|||||||||||
|
Demand deposits
|
274,855
|
|
|
|
|
|
259,060
|
|
|
|
|
|
230,608
|
|
|
|
|
|
|||||||||||
|
Other liabilities
|
10,795
|
|
|
|
|
|
10,014
|
|
|
|
|
|
8,590
|
|
|
|
|
|
|||||||||||
|
Capital
|
148,443
|
|
|
|
|
|
145,161
|
|
|
|
|
|
136,145
|
|
|
|
|
|
|||||||||||
|
Total liabilities and capital
|
$
|
1,309,501
|
|
|
|
|
|
$
|
1,305,132
|
|
|
|
|
|
$
|
1,225,112
|
|
|
|
|
|
||||||||
|
Net interest rate spread (3)
|
|
|
|
|
3.47
|
%
|
|
|
|
|
3.41
|
%
|
|
|
|
|
3.55
|
%
|
|||||||||||
|
Net interest income and net interest margin on a tax equivalent basis (4)
|
|
|
42,549
|
|
3.58
|
%
|
|
|
41,909
|
|
3.51
|
%
|
|
|
40,798
|
|
3.64
|
%
|
|||||||||||
|
Ratio of interest-earning assets to interest-bearing liabilities
|
135.83
|
%
|
|
|
|
|
134.20
|
%
|
|
|
|
|
131.81
|
%
|
|
|
|
|
|||||||||||
|
(1)
|
Includes non-accrual loans if any.
|
|
(2)
|
Income from tax-exempt securities is included in interest income on a taxable-equivalent basis. Interest income has been divided by a factor comprised of the complement of the incremental tax rate of 34%.
|
|
(3)
|
The net interest spread is the difference between the average rate on total interest-earning assets and interest-bearing liabilities.
|
|
(4)
|
The net interest margin is the taxable-equivalent net interest income divided by average interest-earning assets.
|
-
29
-
LCNB CORP. AND SUBSIDIARIES
Item 7. Management's Discussion and Analysis of Financial Condition and Results of Operations (continued)
The following table presents the changes in interest income and expense for each major category of interest-earning assets and interest-bearing liabilities and the amount of change attributable to volume and rate changes for the years indicated. Changes not solely attributable to rate or volume have been allocated to volume and rate changes in proportion to the relationship of absolute dollar amounts of the changes in each.
|
|
For the years ended December 31,
|
|||||||||||||||||
|
|
2017 vs. 2016
|
2016 vs. 2015
|
||||||||||||||||
|
|
Increase (decrease) due to
|
Increase (decrease) due to
|
||||||||||||||||
|
|
Volume
|
Rate
|
Total
|
Volume
|
Rate
|
Total
|
||||||||||||
|
|
(In thousands)
|
|||||||||||||||||
|
Interest income attributable to:
|
|
|
|
|
|
|
||||||||||||
|
Loans (1)
|
$
|
1,334
|
|
(363
|
)
|
971
|
|
2,395
|
|
(2,080
|
)
|
315
|
|
|||||
|
Federal funds sold
|
—
|
|
—
|
|
—
|
|
(1
|
)
|
—
|
|
(1
|
)
|
||||||
|
Interest-bearing demand deposits
|
(27
|
)
|
56
|
|
29
|
|
—
|
|
29
|
|
29
|
|
||||||
|
Federal Reserve Bank stock
|
—
|
|
—
|
|
—
|
|
14
|
|
(2
|
)
|
12
|
|
||||||
|
Federal Home Loan Bank stock
|
—
|
|
36
|
|
36
|
|
—
|
|
—
|
|
—
|
|
||||||
|
Investment securities:
|
|
|
|
|
|
|
|
|
|
|
|
|
||||||
|
Taxable
|
(690
|
)
|
436
|
|
(254
|
)
|
(32
|
)
|
417
|
|
385
|
|
||||||
|
Non-taxable (2)
|
92
|
|
(139
|
)
|
(47
|
)
|
900
|
|
(353
|
)
|
547
|
|
||||||
|
Total interest income
|
709
|
|
26
|
|
735
|
|
3,276
|
|
(1,989
|
)
|
1,287
|
|
||||||
|
Interest expense attributable to:
|
|
|
|
|
|
|
|
|
|
|
|
|
||||||
|
Savings deposits
|
(9
|
)
|
(49
|
)
|
(58
|
)
|
43
|
|
64
|
|
107
|
|
||||||
|
IRA and time certificates
|
(154
|
)
|
150
|
|
(4
|
)
|
(26
|
)
|
350
|
|
324
|
|
||||||
|
Short-term borrowings
|
17
|
|
154
|
|
171
|
|
5
|
|
9
|
|
14
|
|
||||||
|
Long-term debt
|
(12
|
)
|
(2
|
)
|
(14
|
)
|
(193
|
)
|
(76
|
)
|
(269
|
)
|
||||||
|
Total interest expense
|
(158
|
)
|
253
|
|
95
|
|
(171
|
)
|
347
|
|
176
|
|
||||||
|
Net interest income
|
$
|
867
|
|
(227
|
)
|
640
|
|
3,447
|
|
(2,336
|
)
|
1,111
|
|
|||||
|
(1)
|
Non-accrual loans, if any, are included in average loan balances.
|
|
(2)
|
Change in interest income from non-taxable investment securities is computed based on interest income determined on a taxable-equivalent yield basis. Interest income has been divided by a factor comprised of the complement of the incremental tax rate of 34%.
|
2017 vs. 2016.
Net interest income on a fully tax-equivalent basis for 2017 totaled $42,549,000, an increase of $640,000 from 2016. The increase resulted from an increase in total taxable-equivalent interest income of $735,000, slightly offset by an increase in total interest expense of $95,000.
The increase in total interest income was due primarily to a $971,000 increase in loan interest income caused by a $29.9 million increase in average loans, partially offset by a 4 basis point (a basis point equals 0.01%) decrease in the average rate earned on loans. Partially offsetting the increase in loan interest income was a $254,000 decrease in interest income from taxable investment securities and a $47,000 decrease in taxable-equivalent interest income from non-taxable investment securities. Interest income from taxable investment securities decreased due to a $34.6 million decrease in average taxable investment securities, partially offset by a 19 basis point increase in the average rate earned on these securities. Interest income from non-taxable investment securities decreased due to a 10 basis point decrease in the average rate earned on these securities, partially offset by a $2.7 million increase in non-taxable investment securities.
-
30
-
LCNB CORP. AND SUBSIDIARIES
Item 7. Management's Discussion and Analysis of Financial Condition and Results of Operations (continued)
The increase in total interest expense was primarily due to a $171,000 increase in interest paid on short-term borrowings, partially offset by decreases in interest paid on savings deposits, IRA and time certificates, and long-term debt. Short-term borrowings increased due to a 66 basis point increase in the average rate paid and, secondarily, due to a $6.0 million increase in the average balance of borrowings outstanding. Interest paid on savings deposits decreased due to a 1 basis point decrease in the average rate paid and due to a $9.4 million decrease in average deposits outstanding. IRA and time certificates decreased due to an $11.7 million decrease in average certificates outstanding, largely offset by a 7 basis point increase in the average rate paid. Long-term debt decreased primarily due to a $405,000 decrease in average debt outstanding and to a 30 basis point decrease in the average rate paid.
2016 vs. 2015.
Net interest income on a fully tax-equivalent basis for 2016 totaled $41,909,000, an increase of $1,111,000 from 2015. The increase resulted from an increase in total taxable-equivalent interest income of $1,287,000, slightly offset by an increase in total interest expense of $176,000.
The increase in taxable-equivalent interest income was due to a $75.5 million increase in total average interest-earning assets, slightly offset by a 14 basis point decrease in the average rate earned on interest-earning assets. The increase in total average interest-earning assets reflects an increase of $51.9 million in average loans and a $25.5 million increase in non-taxable investment securities. The decrease in the average rate earned was primarily due to general decreases in market rates.
Interest expense increased primarily due to a 16 basis point increase in the average rate paid on IRA and time certificates and a 1 basis point increase in the average rate paid on savings deposits, partially offset by a 163 basis point decrease in the rate paid on long-term debt. The rate variance was partially offset by a $5.4 million decrease in average long-term debt. The decrease in the average rate paid on long-term debt and the decrease in the average balance of long-term debt was due to the pre-payment in full during the first quarter of 2016 of a $5.0 million borrowing from the Federal Home Loan Bank of Cincinnati bearing an interest rate of 5.25%. The borrowing was pre-paid to reduce future interest expense.
-
31
-
LCNB CORP. AND SUBSIDIARIES
Item 7. Management's Discussion and Analysis of Financial Condition and Results of Operations (continued)
Provisions and Allowance for Loan Losses
The following table presents the total loan loss provision and the other changes in the allowance for loan losses for the years 2013 through 2017:
|
|
2017
|
2016
|
2015
|
2014
|
2013
|
||||||||||
|
|
(Dollars in thousands)
|
||||||||||||||
|
Balance – Beginning of year
|
$
|
3,575
|
|
3,129
|
|
3,121
|
|
3,588
|
|
3,437
|
|
||||
|
Loans charged off:
|
|
|
|
|
|
|
|
|
|
|
|||||
|
Commercial and industrial
|
—
|
|
234
|
|
100
|
|
261
|
|
119
|
|
|||||
|
Commercial, secured by real estate
|
462
|
|
185
|
|
1,133
|
|
573
|
|
58
|
|
|||||
|
Residential real estate
|
225
|
|
127
|
|
304
|
|
652
|
|
244
|
|
|||||
|
Consumer
|
90
|
|
85
|
|
52
|
|
129
|
|
181
|
|
|||||
|
Agricultural
|
—
|
|
—
|
|
67
|
|
—
|
|
—
|
|
|||||
|
Other loans, including deposit overdrafts
|
138
|
|
119
|
|
74
|
|
79
|
|
67
|
|
|||||
|
Total loans charged off
|
915
|
|
750
|
|
1,730
|
|
1,694
|
|
669
|
|
|||||
|
Recoveries:
|
|
|
|
|
|
|
|
|
|
|
|||||
|
Commercial and industrial
|
99
|
|
26
|
|
7
|
|
42
|
|
4
|
|
|||||
|
Commercial, secured by real estate
|
113
|
|
98
|
|
96
|
|
63
|
|
26
|
|
|||||
|
Residential real estate
|
140
|
|
52
|
|
107
|
|
40
|
|
31
|
|
|||||
|
Consumer
|
114
|
|
53
|
|
60
|
|
108
|
|
127
|
|
|||||
|
Agricultural
|
—
|
|
—
|
|
67
|
|
—
|
|
—
|
|
|||||
|
Other loans, including deposit overdrafts
|
62
|
|
54
|
|
35
|
|
44
|
|
44
|
|
|||||
|
Total recoveries
|
528
|
|
283
|
|
372
|
|
297
|
|
232
|
|
|||||
|
Net charge offs
|
387
|
|
467
|
|
1,358
|
|
1,397
|
|
437
|
|
|||||
|
Provision charged to operations
|
215
|
|
913
|
|
1,366
|
|
930
|
|
588
|
|
|||||
|
Balance - End of year
|
$
|
3,403
|
|
3,575
|
|
3,129
|
|
3,121
|
|
3,588
|
|
||||
|
Ratio of net charge-offs during the period to average loans outstanding
|
0.05
|
%
|
0.06
|
%
|
0.18
|
%
|
0.21
|
%
|
0.08
|
%
|
|||||
|
Ratio of allowance for loan losses to total loans at year-end
|
0.40
|
%
|
0.44
|
%
|
0.41
|
%
|
0.45
|
%
|
0.62
|
%
|
|||||
Charge-offs for the commercial, secured by real estate category had an elevated balance during 2015 due to the sale of impaired loans.
Charge-offs and recoveries classified as “Other” include charge-offs and recoveries on checking and NOW account overdrafts. LCNB charges off such overdrafts when considered uncollectible, but no later than 60 days from the date first overdrawn.
LCNB continuously reviews the loan portfolio for credit risk through the use of its lending and loan review functions. Independent loan reviews analyze specific loans, providing validation that credit risks are appropriately identified and reported to the Loan Committee and Board of Directors. In addition, the Board of Directors’ Audit Committee receives loan review reports throughout each year. New credits meeting specific criteria are analyzed prior to origination and are reviewed by the Loan Committee and Board of Directors.
-
32
-
LCNB CORP. AND SUBSIDIARIES
Item 7. Management's Discussion and Analysis of Financial Condition and Results of Operations (continued)
Inputs from all of the Bank’s credit risk identification processes are used by management to analyze and validate the adequacy and methodology of the allowance quarterly. The analysis includes two basic components: specific allocations for individual loans and general loss allocations for pools of loans based on average historic loss ratios for the sixty preceding months adjusted for identified economic and other risk factors. Due to the number, size, and complexity of loans within the loan portfolio, there is always a possibility of inherent undetected losses.
Non-Interest Income
A comparison of non-interest income for 2017, 2016, and 2015 is as follows:
|
Increase (Decrease)
|
|||||||||||||||
|
2017
|
2016
|
2015
|
2017 vs. 2016
|
2016 vs. 2015
|
|||||||||||
|
(In thousands)
|
|||||||||||||||
|
Fiduciary income
|
$
|
3,473
|
|
3,286
|
|
3,262
|
|
187
|
|
24
|
|
||||
|
Service charges and fees on deposit accounts
|
5,236
|
|
5,008
|
|
4,920
|
|
228
|
|
88
|
|
|||||
|
Net gains on sales of securities
|
233
|
|
1,082
|
|
495
|
|
(849
|
)
|
587
|
|
|||||
|
Bank owned life insurance income
|
867
|
|
746
|
|
625
|
|
121
|
|
121
|
|
|||||
|
Net gains from sales of loans
|
166
|
|
244
|
|
343
|
|
(78
|
)
|
(99
|
)
|
|||||
|
Other operating income
|
483
|
|
487
|
|
478
|
|
(4
|
)
|
9
|
|
|||||
|
Total non-interest income
|
10,458
|
|
10,853
|
|
10,123
|
|
(395
|
)
|
730
|
|
|||||
Reasons for material increases and decreases include:
|
•
|
Fiduciary income increased during 2017 due to an increase in assets managed and to fee adjustments.
|
|
•
|
Service charges and fees on deposit accounts increased during 2017 due to fee adjustments on certain services and greater customer utilization of various services.
|
|
•
|
Comparing 2017 to 2016, net gains on sales of securities were less during 2017 primarily due to a lower volume of sales. Comparing 2016 to 2015, net gains were greater in 2016 primarily due to market rates at the times of the sales.
|
|
•
|
Comparing 2017 to 2016, bank owned life insurance income was greater for 2017 primarily due to mortality benefits received during the second quarter. Comparing 2016 to 2015, income was greater for 2016 primarily due to $4 million of new policies purchased during the first quarter 2016.
|
|
•
|
Comparing 2017 to 2016, net gains from sales of loans was less for 2017 primarily due to a lower volume of loans sold. Comparing 2016 to 2015, net gains were less, even though a higher volume of loans were sold during 2016, due to market pricing at the times of the sales.
|
-
33
-
LCNB CORP. AND SUBSIDIARIES
Item 7. Management's Discussion and Analysis of Financial Condition and Results of Operations (continued)
Non-Interest Expense
A comparison of non-interest expense for 2017, 2016, and 2015 is as follows:
|
Increase (Decrease)
|
|||||||||||||||
|
2017
|
2016
|
2015
|
2017 vs. 2016
|
2016 vs. 2015
|
|||||||||||
|
(In thousands)
|
|||||||||||||||
|
Salaries and employee benefits
|
$
|
18,585
|
|
18,215
|
|
17,593
|
|
370
|
|
622
|
|
||||
|
Equipment expenses
|
1,172
|
|
1,048
|
|
1,257
|
|
124
|
|
(209
|
)
|
|||||
|
Occupancy expense, net
|
2,613
|
|
2,271
|
|
2,307
|
|
342
|
|
(36
|
)
|
|||||
|
State financial institutions tax
|
1,137
|
|
1,114
|
|
1,001
|
|
23
|
|
113
|
|
|||||
|
Marketing
|
873
|
|
696
|
|
720
|
|
177
|
|
(24
|
)
|
|||||
|
Amortization of intangibles
|
751
|
|
753
|
|
700
|
|
(2
|
)
|
53
|
|
|||||
|
FDIC premiums
|
423
|
|
547
|
|
598
|
|
(124
|
)
|
(51
|
)
|
|||||
|
ATM expense
|
572
|
|
721
|
|
698
|
|
(149
|
)
|
23
|
|
|||||
|
Computer maintenance and supplies
|
882
|
|
790
|
|
782
|
|
92
|
|
8
|
|
|||||
|
Telephone expense
|
735
|
|
746
|
|
707
|
|
(11
|
)
|
39
|
|
|||||
|
Contracted services
|
1,255
|
|
1,033
|
|
842
|
|
222
|
|
191
|
|
|||||
|
Other real estate owned
|
10
|
|
624
|
|
489
|
|
(614
|
)
|
135
|
|
|||||
|
Merger-related expenses
|
118
|
|
—
|
|
643
|
|
118
|
|
(643
|
)
|
|||||
|
Other non-interest expense
|
4,737
|
|
4,703
|
|
4,055
|
|
34
|
|
648
|
|
|||||
|
Total non-interest expense
|
33,863
|
|
33,261
|
|
32,392
|
|
602
|
|
869
|
|
|||||
Reasons for material increases and decreases include:
|
•
|
Salaries and employee benefits were 2.0% greater in 2017 than in 2016 and 2016 was 3.5% greater than in 2015. The increase for 2017 was primarily due to salary and wage increases, an increase in the number of employees, and an increase in health insurance costs, partially offset by a net decrease in pension expenses. The increase for 2016 was primarily due to salary and wage increases and employees retained from the acquisition of BNB Bancorp, Inc. on April 30, 2015, partially offset by a net decrease in pension expenses. The number of full-time equivalent employees was 310 at December 31, 2017, 282 at December 31, 2016, and 280 at December 31, 2015.
|
|
•
|
Comparing 2017 to 2016, equipment expenses increased primarily due to increased depreciation expense on furniture and equipment purchased for the new Operations Center. Comparing 2016 to 2015, equipment expenses decreased primarily due to a decrease in depreciation expense.
|
|
•
|
Occupancy expense for 2017 increased primarily due to increased depreciation on bank premises and, secondarily, to increased maintenance-related expenses, both primarily due to the new Operations Center.
|
|
•
|
Marketing expense increased in 2017 primarily due to expanded use of television and digital methods of advertising.
|
|
•
|
FDIC premiums decreased in 2017 primarily due to a change in the calculation method used to determine periodic premiums.
|
|
•
|
ATM expense for 2017 decreased primarily due to a change in the ATM network that processes PIN-based transactions.
|
|
•
|
Contracted services for 2017 increased largely due to fees paid to professional placement services firms, enhanced utilization of loan review specialists, fees related to an after-hours call answering service, and costs related to moving departments from the Main Office to the Operations Center. The increase in 2016 reflects increased use of outside professionals in general.
|
|
•
|
Other real estate owned expense decreased during 2017 because other real estate owned property held during the year was minimal.
|
|
•
|
Merger-related expenses for 2015 related to the acquisition of BNB Bancorp. Inc. Merger-related expenses for 2017 relate to the pending acquisition of Columbus First Bancorp, Inc.
|
|
•
|
Other non-interest expense for 2017 included $154,000 in organizational costs for LCNB Risk Management, Inc. and $113,000 in losses from sales of fixed assets, primarily due to the sale of a closed office building. Other non-interest expense for 2016 included a $251,000 penalty incurred during the first quarter 2016 to pre-pay a Federal Home Loan Bank borrowing. The borrowing bore an interest rate of 5.25% and was paid off to reduce future interest expense.
|
-
34
-
LCNB CORP. AND SUBSIDIARIES
Item 7. Management's Discussion and Analysis of Financial Condition and Results of Operations (continued)
Income Taxes
LCNB's effective tax rates for the years ended December 31, 2017, 2016, and 2015 were 24.8%, 26.3%, and 26.9%, respectively. The difference between the statutory rate of 34.0% and the effective tax rate is primarily due to tax-exempt interest income, tax-exempt earnings from bank owned life insurance, and tax credits and losses related to investments in affordable housing tax credit limited partnerships.
As a result of the Tax Cuts and Jobs Act that was signed into law on December 22, 2017, LCNB revalued its net deferred tax liability position to reflect the reduction in its federal corporate income tax rate from 34% to 21%. This revaluation resulted in a one-time income tax benefit of approximately $224,000, or $0.02 of basic and diluted earnings per common share for the year ended December 31, 2017.
Assets
Total cash and cash equivalents were $6.5 million greater at December 31, 2017 than at December 31, 2016 primarily due to shrinkage in the investment securities portfolios and an increase in short-term borrowings, partially offset by growth in the loan portfolio and shrinkage in total deposits.
Available-for-sale and held-to-maturity investment securities at December 31, 2017 were respectively $42.2 million less and $8.4 million less than at December 31, 2016. Management used the decrease in investment funds to fund loan growth, to fund deposit shrinkage, and to maintain liquidity.
Net loans at year-end 2017 were $29.4 million greater than at year-end 2016, primarily due to a $50.7 million increase in the commercial, secured by real estate loans. This increase was partially offset by a $5.8 million decrease in commercial and industrial loans, a $14.2 million decrease in residential real estate loans, and a $1.7 million decrease in consumer loans. The increase in the loan portfolio does not reflect $7.5 million of residential fixed-rate real estate loans that were originated and sold to the Federal Home Loan Mortgage Corporation during 2017.
Net premises and equipment at December 31, 2017 was $4.7 million greater than at December 31, 2016 primarily due to construction costs for the new Operations Center in Lebanon, Ohio.
Liabilities
Total deposits at December 31, 2017 were $25.1 million less than at December 31, 2016. Part of the decrease can be attributed to growth in two off-balance sheet investment alternatives offered by LCNB. Assets managed by LCNB Investment Services, a brokerage partnership with LPL Financial LLC, grew from $188.7 million at December 31, 2016 to $229.0 at December 31, 2017. In addition, LCNB introduced a new product during 2017 that sweeps funds from larger balance LCNB deposits into multiple smaller balance, FDIC-insured deposits at other banks.
Short-term borrowings at December 31, 2017 were $5.0 million greater than at December 31, 2016. The additional borrowings were used for liquidity purposes.
Liquidity
Liquidity is the ability to have funds available at all times to meet the commitments of LCNB. These commitments may include paying dividends to shareholders, funding new loans for borrowers, funding withdrawals by depositors, paying general and administrative expenses, and funding capital expenditures. Sources of liquidity include growth in deposits, principal payments received on loans, proceeds from the sale of loans, the sale or maturation of investment securities, cash generated by operating activities, and the ability to borrow funds. Management closely monitors the level of liquid assets available to meet ongoing funding requirements. It is management's intent to maintain adequate liquidity so that sufficient funds are readily available at a reasonable cost. LCNB experienced no liquidity or operational problems during the past year as a result of current liquidity levels.
The liquidity of LCNB is enhanced by the fact that 85.1% of total deposits at December 31, 2017 were "core" deposits. Core deposits, for this purpose, are defined as total deposits less public funds and certificates of deposit greater than $100,000.
-
35
-
LCNB CORP. AND SUBSIDIARIES
Item 7. Management's Discussion and Analysis of Financial Condition and Results of Operations (continued)
Liquid assets include cash and cash equivalents, federal funds sold and securities available-for-sale. Except for investments in the stock of the Federal Reserve Bank and the Federal Home Loan Bank of Cincinnati (“FHLB”) and certain local municipal securities, all of LCNB's investment portfolio is classified as "available-for-sale" and can be readily sold to meet liquidity needs, subject to certain pledging commitments for public funds, repurchase agreements, and other requirements. At December 31, 2017, LCNB's liquid assets amounted to $303.9 million or 23.5% of total assets, compared to $339.5 million or 26.0% of total assets at December 31, 2016. The ratio for 2017 is less than 2016 because of a decrease in securities available-for-sale.
An additional source of funding is borrowings from the FHLB. Long-term advances totaling $303,000 and short-term advances totaling $47.0 million were outstanding at December 31, 2017. Total remaining available borrowing capacity with the FHLB, including short-term advances, at December 31, 2017 was approximately $56.3 million. One of the factors limiting availability of FHLB borrowings is a bank’s ownership of FHLB stock. LCNB could increase its available borrowing capacity by purchasing more FHLB stock.
Besides short-term FHLB advances, short-term borrowings may include federal funds purchased and advances from lines of credit with two other financial institutions. At December 31, 2017, LCNB could borrow up to $30 million through the lines of credit and up to $10 million under a federal funds arrangements with another financial institution.
Commitments to extend credit at
December 31, 2017
totaled $150.7 million, including standby letters of credit totaling $294,000, and are more fully described in Note 14 - Commitments and Contingent Liabilities to LCNB's consolidated financial statements. Since many commitments to extend credit may expire without being drawn upon, the total commitment amounts do not necessarily represent future cash requirements.
The following table provides information concerning LCNB's contractual obligations at
December 31, 2017
:
|
|
|
Payments due by period
|
|||||||||||||
|
Total
|
1 year
or less
|
Over 1
through 3
years
|
Over 3
through 5
years
|
More than
5 years
|
|||||||||||
|
|
(In thousands)
|
||||||||||||||
|
Short-term borrowings
|
$
|
47,000
|
|
47,000
|
|
—
|
|
—
|
|
—
|
|
||||
|
Long-term debt obligations
|
303
|
|
248
|
|
55
|
|
—
|
|
—
|
|
|||||
|
Operating lease obligations
|
4,459
|
|
321
|
|
450
|
|
325
|
|
3,363
|
|
|||||
|
Estimated pension plan contribution for 2018
|
224
|
|
224
|
|
—
|
|
—
|
|
—
|
|
|||||
|
Funding commitments for affordable housing tax credit limited partnerships
|
2,257
|
|
784
|
|
856
|
|
213
|
|
404
|
|
|||||
|
Estimated capital expenditure obligations
|
40
|
|
40
|
|
—
|
|
—
|
|
—
|
|
|||||
|
Certificates of deposit:
|
|
|
|
|
|
|
|
|
|
|
|||||
|
$100,000 and over
|
66,607
|
|
21,667
|
|
29,243
|
|
15,264
|
|
433
|
|
|||||
|
Other time certificates
|
125,292
|
|
42,787
|
|
54,939
|
|
25,773
|
|
1,793
|
|
|||||
|
Total
|
$
|
246,182
|
|
113,071
|
|
85,543
|
|
41,575
|
|
5,993
|
|
||||
The following table provides information concerning LCNB's commitments at
December 31, 2017
:
|
|
|
Amount of Commitment Expiration Per Period
|
|||||||||||||
|
|
Total
Amounts
Committed
|
1 year
or less
|
Over 1
through 3
years
|
Over 3
through 5
years
|
More than
5 years
|
||||||||||
|
|
(In thousands)
|
||||||||||||||
|
Commitments to extend credit
|
$
|
22,861
|
|
22,861
|
|
—
|
|
—
|
|
—
|
|
||||
|
Unused lines of credit
|
127,572
|
|
52,094
|
|
39,044
|
|
17,659
|
|
18,775
|
|
|||||
|
Standby letters of credit
|
294
|
|
294
|
|
—
|
|
—
|
|
—
|
|
|||||
|
Total
|
$
|
150,727
|
|
75,249
|
|
39,044
|
|
17,659
|
|
18,775
|
|
||||
-
36
-
LCNB CORP. AND SUBSIDIARIES
Item 7. Management's Discussion and Analysis of Financial Condition and Results of Operations (continued)
Capital Resources
LCNB and the Bank are required by banking regulators to meet certain minimum levels of capital adequacy. Failure to meet minimum capital requirements can initiate certain mandatory and possibly additional discretionary actions by regulators that, if undertaken, could have a material effect on LCNB's and the Bank's financial statements. These minimum levels are expressed in the form of certain ratios. Capital is separated into Tier 1 capital (essentially shareholders' equity less goodwill and other intangibles) and Tier 2 capital (essentially the allowance for loan losses limited to 1.25% of risk-weighted assets). Common Equity Tier 1 Capital is the sum of common stock, related surplus, and retained earnings, net of treasury stock, accumulated other comprehensive income, and other adjustments. The first three ratios, which are based on the degree of credit risk in the Bank's assets, provide for weighting assets based on assigned risk factors and include off-balance sheet items such as loan commitments and stand-by letters of credit. Information summarizing the regulatory capital of LCNB and the Bank at
December 31, 2017
and
2016
and corresponding regulatory minimum requirements is included in Note 15 - Regulatory Matters of the consolidated financial statements.
The FDIC, the insurer of deposits in financial institutions, has adopted a risk-based insurance premium system based in part on an institution's capital adequacy. Under this system, a depository institution is required to pay successively higher premiums depending on its capital levels and its supervisory rating by its primary regulator. It is management's intention to maintain sufficient capital to permit the Bank to maintain a "well capitalized" designation (the FDIC's highest rating).
On April 17, 2001, LCNB's Board of Directors authorized three separate stock repurchase programs, two of which continue to be in effect – the “Market Repurchase Program” and the “Private Sale Repurchase Program.” Any shares purchased will be held for future corporate purposes.
Under the Market Repurchase Program, LCNB was originally authorized to purchase up to 200,000 shares of its stock, as restated for a 100% stock dividend issued in May, 2007, through market transactions with a selected stockbroker. On November 14, 2005, the Board of Directors extended the Market Repurchase Program by increasing the shares authorized for repurchase to 400,000 total shares, as restated for a stock dividend. Through
December 31, 2017
, 290,444 shares, as restated for the stock dividend, had been purchased under this program. No shares were purchased under this program during
2017
.
The Private Sale Repurchase Program is available to shareholders who wish to sell large blocks of stock at one time. Because LCNB's stock is not widely traded, a shareholder releasing large blocks may not be able to readily sell all shares through normal procedures. Purchases of blocks will be considered on a case-by-case basis and will be made at prevailing market prices. A total of 466,018 shares, as restated for the stock dividend, had been purchased under this program at
December 31, 2017
. No shares were purchased under this program during
2017
.
LCNB established an Ownership Incentive Plan during 2002 that allowed for stock-based awards to eligible employees. Under the plan, awards could be in the form of stock options, share awards, and/or appreciation rights. The plan provided for the issuance of up to 200,000 shares, as restated for a stock dividend. The plan expired on April 16, 2012. Any outstanding unexercised options, however, continue to be exercisable in accordance with their terms.
The 2015 Ownership Incentive Plan (the "2015 Plan") was approved by LCNB's shareholders at the annual meeting on April 28, 2015 and allows for stock-based awards to eligible employees, as determined by the Compensation Committee of the Board of Directors. Awards may be made in the form of stock options, appreciation rights, restricted shares, and/or restricted share units. The 2015 Plan provides for the issuance of up to 450,000 shares. The 2015 Plan will terminate on April 28, 2025 and is subject to earlier termination by the Compensation Committee.
Critical Accounting Policies
Allowance for Loan Losses
. The allowance for loan losses is established through a provision for loan losses charged to expense. Loans are charged against the allowance for loan losses when management believes that the collectibility of the principal is unlikely. Subsequent recoveries, if any, are credited to the allowance. The allowance is an amount that management believes will be adequate to absorb inherent losses in the loan portfolio, based on evaluations of the collectibility of loans and prior loan loss experience. The evaluations take into consideration such factors as changes in the nature and volume of the loan portfolio, overall portfolio quality, review of specific problem loans, and current economic conditions that may affect the borrowers' ability to pay. This evaluation is inherently subjective as it requires estimates that are susceptible to significant revision as more information becomes available.
-
37
-
LCNB CORP. AND SUBSIDIARIES
The allowance consists of specific and general components. The specific component relates to loans that are classified as doubtful, substandard, or special mention. For such loans an allowance is established when the discounted cash flows or collateral value is lower than the carrying value of that loan. The general component covers non-classified loans and is based on historical loss experience adjusted for qualitative factors, which include trends in underperforming loans, trends in the volume and terms of loans, economic trends and conditions, concentrations of credit, trends in the quality of loans, and borrower financial statement exceptions.
Based on its evaluations, management believes that the allowance for loan losses will be adequate to absorb estimated losses inherent in the current loan portfolio.
Acquired Credit Impaired Loans.
LCNB
accounts for acquisitions using the acquisition method of accounting, which requires that assets acquired and liabilities assumed be measured at their fair values at the acquisition date. Acquired loans are reviewed to determine if there is evidence of deterioration in credit quality since inception and if it is probable that LCNB will be unable to collect all amounts due under the contractual loan agreements. The analysis includes expected prepayments and estimated cash flows including principal and interest payments at the date of acquisition. The amount in excess of the estimated future cash flows is not accreted into earnings. The amount in excess of the estimated future cash flows over the book value of the loan is accreted into interest income over the remaining life of the loan (accretable yield). LCNB records these loans on the acquisition date at their net realizable value. Thus, an allowance for estimated future losses is not established on the acquisition date. Subsequent to the date of acquisition, expected future cash flows on loans acquired are updated and any losses or reductions in estimated cash flows which arise subsequent to the date of acquisition are reflected as a charge through the provision for loan losses. An increase in the expected cash flows adjusts the level of the accretable yield recognized on a prospective basis over the remaining life of the loan. Due to the number, size, and complexity of loans within the acquired loan portfolio, there is always a possibility of inherent undetected losses.
Accounting for Intangibles.
LCNB’s intangible assets at
December 31, 2017
are composed primarily of goodwill and core deposit intangibles related to acquisitions of other financial institutions. It also includes mortgage servicing rights recorded from sales of fixed-rate mortgage loans to the Federal Home Loan Mortgage Corporation and mortgage servicing rights acquired through the acquisition of Eaton National Bank & Trust Co. Goodwill is not subject to amortization, but is reviewed annually for impairment. Core deposit intangibles are being amortized on a straight line basis over their respective estimated weighted average lives. Mortgage servicing rights are capitalized by allocating the total cost of loans between mortgage servicing rights and the loans based on their estimated fair values. Capitalized mortgage servicing rights are amortized to loan servicing income in proportion to and over the period of estimated servicing income, subject to periodic review for impairment.
Fair Value Accounting for Investment Securities.
Securities classified as available-for-sale are carried at estimated fair value. Unrealized gains and losses, net of taxes, are reported as accumulated other comprehensive income or loss in shareholders’ equity. Fair value is estimated using market quotations for U.S. Treasury and equity investments. Fair value for the majority of the remaining available-for-sale securities is estimated using the discounted cash flow method for each security with discount rates based on rates observed in the market.
-
38
-
Market risk for LCNB is primarily interest rate risk. LCNB attempts to mitigate this risk through asset/liability management strategies designed to decrease the vulnerability of its earnings to material and prolonged changes in interest rates. LCNB does not use derivatives such as interest rate swaps, caps or floors to hedge this risk. LCNB has not entered into any market risk instruments for trading purposes.
The Bank's Asset and Liability Management Committee ("ALCO") primarily uses a combination of Interest Rate Sensitivity Analysis (IRSA) and Economic Value of Equity (EVE) analysis for measuring and managing interest rate risk. The IRSA model is used to estimate the effect on net interest income during a one-year period of instantaneous and sustained movements in interest rates, also called interest rate shocks, of 100, 200, and 300 basis points. Management considers the results of any significant downward scenarios to not be meaningful in the current interest rate environment. The base projection uses a current interest rate scenario. As shown below, the December 31, 2017 IRSA indicates that an increase in interest rates at all shock levels will have a positive effect on net interest income. The changes in net interest income for all rate assumptions are within LCNB’s acceptable ranges.
|
Rate Shock Scenario in
Basis Points
|
Amount
(In thousands)
|
$ Change in
Net Interest
Income
|
% Change in
Net Interest
Income
|
|||||||
|
Up 300
|
$
|
46,728
|
|
2,196
|
|
4.93
|
%
|
|||
|
Up 200
|
45,975
|
|
1,443
|
|
3.24
|
%
|
||||
|
Up 100
|
45,239
|
|
707
|
|
1.59
|
%
|
||||
|
Base
|
44,532
|
|
—
|
|
—
|
%
|
||||
IRSA shows the effect on net interest income during a one-year period only. A more long-range model is the EVE analysis, which shows the estimated present value of future cash inflows from interest-earning assets less the present value of future cash outflows for interest-bearing liabilities for the same rate shocks. As shown below, the December 31, 2017 EVE analysis indicates that an increase in interest rates would have a negative effect on the EVE for all shock levels. The changes in the EVE for all rate assumptions are within LCNB’s acceptable ranges.
|
Rate Shock Scenario in
Basis Points
|
Amount
(In thousands)
|
$ Change in
EVE
|
% Change in
EVE
|
|||||||
|
Up 300
|
$
|
151,988
|
|
(2,484
|
)
|
(1.61
|
)%
|
|||
|
Up 200
|
152,730
|
|
(1,742
|
)
|
(1.13
|
)%
|
||||
|
Up 100
|
152,384
|
|
(2,088
|
)
|
(1.35
|
)%
|
||||
|
Base
|
154,472
|
|
—
|
|
—
|
%
|
||||
The IRSA and EVE simulations discussed above are not projections of future income or equity and should not be relied on as being indicative of future operating results. Assumptions used, including the nature and timing of interest rate levels, yield curve shape, prepayments on loans and securities, deposit decay rates, pricing decisions on loans and deposits, and reinvestment or replacement of asset and liability cash flows, are inherently uncertain and, as a result, the models cannot precisely measure future net interest income or equity. Furthermore, the models do not reflect actions that borrowers, depositors, and management may take in response to changing economic conditions and interest rate levels.
-
39
-
REPORT OF MANAGEMENT’S ASSESSMENT OF INTERNAL CONTROL OVER FINANCIAL REPORTING
LCNB Corp. (“LCNB”) is responsible for the preparation, integrity, and fair presentation of the consolidated financial statements included in this annual report. Management of LCNB and its subsidiaries is responsible for establishing and maintaining adequate internal control over financial reporting, as such term is defined in Exchange Act Rules 13a-15f. LCNB’s internal control over financial reporting is a process designed under the supervision of LCNB’s Chief Executive Officer and the Chief Financial Officer. The purpose is to provide reasonable assurance to the Board of Directors regarding the reliability of financial reporting and the preparation of LCNB’s consolidated financial statements for external purposes in accordance with U.S. generally accepted accounting principles.
Management maintains internal controls over financial reporting. The internal controls contain control processes and actions are taken to correct deficiencies as they are identified. The internal controls are evaluated on an ongoing basis by LCNB’s management and Audit Committee. Even effective internal controls, no matter how well designed, have inherent limitations – including the possibility of circumvention or overriding of controls – and therefore can provide only reasonable assurance with respect to financial statement preparation. Also, because of changes in conditions, internal control effectiveness may vary over time.
Management assessed LCNB’s internal controls as of
December 31, 2017
, in relation to criteria for effective internal control over financial reporting described in “Internal Control – Integrated Framework (2013)” issued by the Committee of Sponsoring Organizations (COSO) of the Treadway Commission. Based on this assessment, management believes that, as of
December 31, 2017
, LCNB’s internal control over financial reporting met the criteria.
BKD LLP, an independent registered public accounting firm, has issued an attestation report on the effectiveness of LCNB’s internal control over financial reporting as of
December 31, 2017
.
Submitted by:
LCNB Corp.
|
/s/ Steve P. Foster
|
|
/s/ Robert C. Haines II
|
|
|
Steve P. Foster
|
|
Robert C. Haines II
|
|
|
Chief Executive Officer & President
|
|
Executive Vice President &
|
|
|
March 9, 2018
|
|
Chief Financial Officer
|
|
|
|
March 9, 2018
|
|
|
-
40
-
Report of Independent Registered Public Accounting Firm
To the Shareholders, Board of Directors and Audit Committee
LCNB Corp.
Lebanon, Ohio
Opinion on the Internal Control Over Financial Reporting
We have audited LCNB Corp.’s (Company) internal control over financial reporting as of December 31, 2017, based on criteria established in
Internal Control - Integrated Framework: (2013)
issued by the Committee of Sponsoring Organizations of the Treadway Commission (COSO).
In our opinion, the Company maintained, in all material respects, effective internal control over financial reporting as of December 31, 2017, based on criteria established in
Internal Control - Integrated Framework: (2013)
issued by COSO.
We also have audited, in accordance with the standards of the Public Company Accounting Oversight Board (United States) (“PCAOB”), the consolidated financial statements of the Company and our report dated March 9, 2018, expressed an unqualified opinion thereon.
Basis for Opinion
The Company’s management is responsible for maintaining effective internal control over financial reporting and for its assessment of the effectiveness of internal control over financial reporting, included in the accompanying Management Report on Internal Control Over Financial Reporting. Our responsibility is to express an opinion on the Company’s internal control over financial reporting based on our audit.
We are a public accounting firm registered with the PCAOB and are required to be independent with respect to the Company in accordance with the U.S. federal securities laws and the applicable rules and regulations of the Securities and Exchange Commission and the PCAOB.
We conducted our audit in accordance with the standards of the PCAOB. Those standards require that we plan and perform the audit to obtain reasonable assurance about whether effective internal control over financial reporting was maintained in all material respects.
Our audit included obtaining an understanding of internal control over financial reporting, assessing the risk that a material weakness exists and testing and evaluating the design and operating effectiveness of internal control based on the assessed risk. Our audit also included performing such other procedures as we considered necessary in the circumstances. We believe that our audit provides a reasonable basis for our opinion.
-
41
-
Definitions and Limitations of Internal Control Over Financial Reporting
A company’s internal control over financial reporting is a process designed to provide reasonable assurance regarding the reliability of financial reporting and the preparation of financial statements for external purposes in accordance with generally accepted accounting principles. A company’s internal control over financial reporting includes those policies and procedures that (1) pertain to the maintenance of records that, in reasonable detail, accurately and fairly reflect the transactions and dispositions of the assets of the company; (2) provide reasonable assurance that transactions are recorded as necessary to permit preparation of financial statements in accordance with generally accepted accounting principles, and that receipts and expenditures of the company are being made only in accordance with authorizations of management and directors of the company; and (3) provide reasonable assurance regarding prevention or timely detection of unauthorized acquisition, use or disposition of the company’s assets that could have a material effect on the consolidated financial statements.
Because of its inherent limitations, internal control over financial reporting may not prevent or detect misstatements. Also, projections of any evaluation of effectiveness to future periods are subject to the risk that controls may become inadequate because of changes in conditions or that the degree of compliance with the policies or procedures may deteriorate.
|
/s/ BKD, LLP
|
|
||
|
BKD,
LLP
|
|
|
|
|
Cincinnati, Ohio
|
|
|
|
|
March 9, 2018
|
|
|
|
-
42
-
Report of Independent Registered Public Accounting Firm
To the Shareholders, Board of Directors and Audit Committee
LCNB Corp.
Lebanon, Ohio
Opinion on the Financial Statements
We have audited the accompanying consolidated balance sheets of LCNB Corp. (the “Company”) as of December 31, 2017 and 2016, the related consolidated statements of income, comprehensive income, shareholders’ equity and cash flows for each of the years in the three-year period ended December 31, 2017, and the related notes (collectively referred to as the “financial statements”). In our opinion, the consolidated financial statements referred to above present fairly, in all material respects, the financial position of the Company as of December 31, 2017 and 2016, and the results of its operations and its cash flows for each of the years in the three-year period ended December 31, 2017, in conformity with accounting principles generally accepted in the United States of America.
We also have audited, in accordance with the standards of the Public Company Accounting Oversight Board (United States) (“PCAOB”), the Company’s internal control over financial reporting as of December 31, 2017, based on criteria established in
Internal Control - Integrated Framework (2013)
issued by the Committee of Sponsoring Organizations of the Treadway Commission (COSO) and our report dated March 9, 2018, expressed an unqualified opinion on the effectiveness of the Company’s internal control over financial reporting.
Basis for Opinion
These consolidated financial statements are the responsibility of the Company’s management. Our responsibility is to express an opinion on the Company’s consolidated financial statements based on our audits.
We are a public accounting firm registered with the PCAOB and are required to be independent with respect to the Company in accordance with the U.S. federal securities laws and the applicable rules and regulations of the Securities and Exchange Commission and the PCAOB.
We conducted our audits in accordance with the standards of the PCAOB. Those standards require that we plan and perform the audits to obtain reasonable assurance about whether the consolidated financial statements are free of material misstatement, whether due to error or fraud. Our audits included performing procedures to assess the risks of material misstatement of the consolidated financial statements, whether due to error or fraud, and performing procedures that respond to those risks. Such procedures include examining, on a test basis, evidence regarding the amounts and disclosures in the consolidated financial statements. Our audits also included evaluating the accounting principles used and significant estimates made by management, as well as evaluating the overall presentation of the consolidated financial statements. We believe that our audits provide a reasonable basis for our opinion.
|
/s/ BKD, LLP
|
|
|
|
BKD,
LLP
|
||
|
We have served as the Company’s auditor since 2014.
|
||
|
|
|
|
|
Cincinnati, Ohio
|
|
|
|
March 9, 2018
|
|
|
-
43
-
FINANCIAL STATEMENTS AND SUPPLEMENTARY DATA
LCNB CORP. AND SUBSIDIARIES
At December 31,
(Dollars in thousands)
|
|
2017
|
2016
|
||||
|
ASSETS:
|
|
|
||||
|
Cash and due from banks
|
$
|
21,159
|
|
18,378
|
|
|
|
Interest-bearing demand deposits
|
4,227
|
|
487
|
|
||
|
Total cash and cash equivalents
|
25,386
|
|
18,865
|
|
||
|
Investment securities:
|
|
|
||||
|
Available-for-sale, at fair value
|
278,472
|
|
320,659
|
|
||
|
Held-to-maturity, at cost
|
32,571
|
|
41,003
|
|
||
|
Federal Reserve Bank stock, at cost
|
2,732
|
|
2,732
|
|
||
|
Federal Home Loan Bank stock, at cost
|
3,638
|
|
3,638
|
|
||
|
Loans, net
|
845,657
|
|
816,228
|
|
||
|
Premises and equipment, net
|
34,927
|
|
30,244
|
|
||
|
Goodwill
|
30,183
|
|
30,183
|
|
||
|
Core deposit and other intangibles
|
3,799
|
|
4,582
|
|
||
|
Bank owned life insurance
|
27,985
|
|
27,307
|
|
||
|
Other assets
|
10,288
|
|
11,358
|
|
||
|
TOTAL ASSETS
|
$
|
1,295,638
|
|
1,306,799
|
|
|
|
LIABILITIES:
|
|
|
||||
|
Deposits:
|
|
|
||||
|
Non-interest-bearing
|
$
|
283,212
|
|
271,332
|
|
|
|
Interest-bearing
|
802,609
|
|
839,573
|
|
||
|
Total deposits
|
1,085,821
|
|
1,110,905
|
|
||
|
Short-term borrowings
|
47,000
|
|
42,040
|
|
||
|
Long-term debt
|
303
|
|
598
|
|
||
|
Accrued interest and other liabilities
|
12,243
|
|
10,312
|
|
||
|
TOTAL LIABILITIES
|
1,145,367
|
|
1,163,855
|
|
||
|
COMMITMENTS AND CONTINGENT LIABILITIES
|
—
|
|
—
|
|
||
|
SHAREHOLDERS' EQUITY:
|
|
|
||||
|
Preferred shares - no par value, authorized 1,000,000 shares, none outstanding
|
—
|
|
—
|
|
||
|
Common shares - no par value; authorized 19,000,000 shares at December 31, 2017 and 2016; issued 10,776,686 and 10,751,652 shares at December 31, 2017 and 2016, respectively
|
76,977
|
|
76,490
|
|
||
|
Retained earnings
|
87,301
|
|
80,736
|
|
||
|
Treasury shares at cost, 753,627 shares at December 31, 2017 and 2016
|
(11,665
|
)
|
(11,665
|
)
|
||
|
Accumulated other comprehensive loss, net of taxes
|
(2,342
|
)
|
(2,617
|
)
|
||
|
TOTAL SHAREHOLDERS' EQUITY
|
150,271
|
|
142,944
|
|
||
|
TOTAL LIABILITIES AND SHAREHOLDERS' EQUITY
|
$
|
1,295,638
|
|
1,306,799
|
|
|
The accompanying notes to consolidated financial statements are an integral part of these statements.
-
44
-
LCNB CORP. AND SUBSIDIARIES
For the years ended December 31,
(Dollars in thousands, except per share data)
|
|
2017
|
2016
|
2015
|
||||||
|
INTEREST INCOME:
|
|
|
|
||||||
|
Interest and fees on loans
|
$
|
36,571
|
|
35,600
|
|
35,285
|
|
||
|
Interest on investment securities:
|
|
|
|
|
|
|
|||
|
Taxable
|
4,328
|
|
4,582
|
|
4,197
|
|
|||
|
Non-taxable
|
3,130
|
|
3,199
|
|
2,848
|
|
|||
|
Other investments
|
434
|
|
369
|
|
329
|
|
|||
|
TOTAL INTEREST INCOME
|
44,463
|
|
43,750
|
|
42,659
|
|
|||
|
INTEREST EXPENSE:
|
|
|
|
|
|
|
|||
|
Interest on deposits
|
3,378
|
|
3,440
|
|
3,009
|
|
|||
|
Interest on short-term borrowings
|
209
|
|
38
|
|
24
|
|
|||
|
Interest on long-term debt
|
12
|
|
26
|
|
295
|
|
|||
|
TOTAL INTEREST EXPENSE
|
3,599
|
|
3,504
|
|
3,328
|
|
|||
|
NET INTEREST INCOME
|
40,864
|
|
40,246
|
|
39,331
|
|
|||
|
PROVISION FOR LOAN LOSSES
|
215
|
|
913
|
|
1,366
|
|
|||
|
NET INTEREST INCOME AFTER PROVISION FOR LOAN LOSSES
|
40,649
|
|
39,333
|
|
37,965
|
|
|||
|
NON-INTEREST INCOME:
|
|
|
|
|
|
|
|||
|
Fiduciary income
|
3,473
|
|
3,286
|
|
3,262
|
|
|||
|
Service charges and fees on deposit accounts
|
5,236
|
|
5,008
|
|
4,920
|
|
|||
|
Net gains on sales of securities
|
233
|
|
1,082
|
|
495
|
|
|||
|
Bank owned life insurance income
|
867
|
|
746
|
|
625
|
|
|||
|
Net gains from sales of loans
|
166
|
|
244
|
|
343
|
|
|||
|
Other operating income
|
483
|
|
487
|
|
478
|
|
|||
|
TOTAL NON-INTEREST INCOME
|
10,458
|
|
10,853
|
|
10,123
|
|
|||
|
NON-INTEREST EXPENSE:
|
|
|
|
|
|
|
|||
|
Salaries and employee benefits
|
18,585
|
|
18,215
|
|
17,593
|
|
|||
|
Equipment expenses
|
1,172
|
|
1,048
|
|
1,257
|
|
|||
|
Occupancy expense, net
|
2,613
|
|
2,271
|
|
2,307
|
|
|||
|
State financial institutions tax
|
1,137
|
|
1,114
|
|
1,001
|
|
|||
|
Marketing
|
873
|
|
696
|
|
720
|
|
|||
|
Amortization of intangibles
|
751
|
|
753
|
|
700
|
|
|||
|
FDIC premiums
|
423
|
|
547
|
|
598
|
|
|||
|
ATM expense
|
572
|
|
721
|
|
698
|
|
|||
|
Computer maintenance and supplies
|
882
|
|
790
|
|
782
|
|
|||
|
Telephone expense
|
735
|
|
746
|
|
707
|
|
|||
|
Contracted services
|
1,255
|
|
1,033
|
|
842
|
|
|||
|
Other real estate owned
|
10
|
|
624
|
|
489
|
|
|||
|
Merger-related expenses
|
118
|
|
—
|
|
643
|
|
|||
|
Other non-interest expense
|
4,737
|
|
4,703
|
|
4,055
|
|
|||
|
TOTAL NON-INTEREST EXPENSE
|
33,863
|
|
33,261
|
|
32,392
|
|
|||
|
INCOME BEFORE INCOME TAXES
|
17,244
|
|
16,925
|
|
15,696
|
|
|||
|
PROVISION FOR INCOME TAXES
|
4,272
|
|
4,443
|
|
4,222
|
|
|||
|
NET INCOME
|
$
|
12,972
|
|
12,482
|
|
11,474
|
|
||
|
Earnings per common share:
|
|
|
|
|
|
|
|||
|
Basic
|
$
|
1.30
|
|
1.26
|
|
1.18
|
|
||
|
Diluted
|
1.29
|
|
1.25
|
|
1.17
|
|
|||
|
Weighted average common shares outstanding:
|
|
|
|
|
|
|
|||
|
Basic
|
10,005,575
|
|
9,948,057
|
|
9,704,965
|
|
|||
|
Diluted
|
10,012,511
|
|
9,976,370
|
|
9,811,467
|
|
|||
The accompanying notes to consolidated financial statements are an integral part of these statements.
-
45
-
LCNB CORP. AND SUBSIDIARIES
CONSOLIDATED STATEMENTS OF COMPREHENSIVE INCOME
For the years ended December 31,
(Dollars in thousands)
|
|
2017
|
2016
|
2015
|
||||||
|
Net income
|
$
|
12,972
|
|
12,482
|
|
11,474
|
|
||
|
Other comprehensive income (loss):
|
|
|
|
|
|
|
|||
|
Net unrealized gain (loss) on available-for-sale securities (net of tax expense (benefit) of $285, $(1,242), and $(169) for 2017, 2016, and 2015, respectively)
|
585
|
|
(2,390
|
)
|
(329
|
)
|
|||
|
Reclassification adjustment for net realized gain on sale of available-for-sale securities included in net income (net of tax expense of $81, $370, and $168 for 2017, 2016 and 2015, respectively)
|
(152
|
)
|
(712
|
)
|
(327
|
)
|
|||
|
Change in nonqualified pension plan unrecognized net gain (loss) and unrecognized prior service cost (net of tax expense (benefit) of $(53), $128, and $55 for 2017, 2016, and 2015, respectively)
|
(158
|
)
|
249
|
|
107
|
|
|||
|
Other comprehensive income (loss)
|
275
|
|
(2,853
|
)
|
(549
|
)
|
|||
|
TOTAL COMPREHENSIVE INCOME
|
$
|
13,247
|
|
9,629
|
|
10,925
|
|
||
|
SUPPLEMENTAL INFORMATION:
|
|
|
|
|
|
|
|||
|
COMPONENTS OF ACCUMULATED OTHER COMPREHENSIVE INCOME (LOSS), NET OF TAX, AS OF YEAR-END:
|
|
|
|
|
|
|
|||
|
Net unrealized gain (loss) on securities available-for-sale
|
$
|
(2,200
|
)
|
(2,633
|
)
|
469
|
|
||
|
Net unfunded liability for nonqualified pension plan
|
(142
|
)
|
16
|
|
(233
|
)
|
|||
|
Balance at year-end
|
$
|
(2,342
|
)
|
(2,617
|
)
|
236
|
|
||
The accompanying notes to consolidated financial statements are an integral part of these statements.
-
46
-
LCNB CORP. AND SUBSIDIARIES
CONSOLIDATED STATEMENTS OF SHAREHOLDERS’ EQUITY
For the years ended December 31,
(Dollars in thousands, except share data)
|
Common
Shares
Outstanding
|
|
Common
Shares
|
|
Retained
Earnings
|
|
Treasury
Shares
|
|
Accumulated
Other
Comprehensive
Income (Loss)
|
|
Total
Shareholders'
Equity
|
|
|||||||
|
Balance, December 31, 2014
|
9,311,318
|
|
$
|
67,181
|
|
69,394
|
|
(11,665
|
)
|
785
|
|
125,695
|
|
|||||
|
Net income
|
|
|
|
|
11,474
|
|
|
|
|
|
11,474
|
|
||||||
|
Other comprehensive loss, net of taxes
|
|
|
|
|
|
|
|
|
(549
|
)
|
(549
|
)
|
||||||
|
Dividend Reinvestment and Stock Purchase Plan
|
24,610
|
|
390
|
|
|
|
|
|
|
|
390
|
|
||||||
|
Acquisition of BNB Bancorp, Inc.
|
560,132
|
|
9,063
|
|
9,063
|
|
||||||||||||
|
Exercise of stock options
|
13,449
|
|
152
|
|
152
|
|
||||||||||||
|
Excess tax benefit on exercise and forfeiture of stock options
|
13
|
|
13
|
|
||||||||||||||
|
Compensation expense relating to stock options
|
|
|
19
|
|
|
|
|
|
|
|
19
|
|
||||||
|
Compensation expense relating to restricted stock
|
16,038
|
|
90
|
|
90
|
|
||||||||||||
|
Common stock dividends, $0.64 per share
|
|
|
|
|
(6,239
|
)
|
|
|
|
|
(6,239
|
)
|
||||||
|
Balance, December 31, 2015
|
9,925,547
|
|
76,908
|
|
74,629
|
|
(11,665
|
)
|
236
|
|
140,108
|
|
||||||
|
Net income
|
|
|
|
|
12,482
|
|
|
|
|
|
12,482
|
|
||||||
|
Other comprehensive loss, net of taxes
|
|
|
|
|
|
|
|
|
(2,853
|
)
|
(2,853
|
)
|
||||||
|
Dividend Reinvestment and Stock Purchase Plan
|
21,088
|
|
379
|
|
|
|
|
|
|
|
379
|
|
||||||
|
Repurchase of stock warrants
|
(1,545
|
)
|
(1,545
|
)
|
||||||||||||||
|
Exercise of stock options
|
51,390
|
|
592
|
|
592
|
|
||||||||||||
|
Excess tax benefit on exercise and forfeiture of stock options and vesting of restricted common stock
|
61
|
|
61
|
|
||||||||||||||
|
Compensation expense relating to stock options
|
|
|
5
|
|
|
|
|
|
|
|
5
|
|
||||||
|
Compensation expense relating to restricted stock
|
—
|
|
90
|
|
90
|
|
||||||||||||
|
Common stock dividends, $0.64 per share
|
|
|
|
|
(6,375
|
)
|
|
|
|
|
(6,375
|
)
|
||||||
|
Balance, December 31, 2016
|
9,998,025
|
|
76,490
|
|
80,736
|
|
(11,665
|
)
|
(2,617
|
)
|
142,944
|
|
||||||
|
Net income
|
|
|
|
|
12,972
|
|
|
|
|
|
12,972
|
|
||||||
|
Other comprehensive income, net of taxes
|
|
|
|
|
|
|
|
|
275
|
|
275
|
|
||||||
|
Dividend Reinvestment and Stock Purchase Plan
|
17,609
|
|
360
|
|
|
|
|
|
|
|
360
|
|
||||||
|
Exercise of stock options
|
3,398
|
|
51
|
|
51
|
|
||||||||||||
|
Compensation expense relating to stock options
|
|
|
1
|
|
|
|
|
|
|
|
1
|
|
||||||
|
Compensation expense relating to restricted stock
|
4,027
|
|
75
|
|
75
|
|
||||||||||||
|
Common stock dividends, $0.64 per share
|
|
|
|
|
(6,407
|
)
|
|
|
|
|
(6,407
|
)
|
||||||
|
Balance, December 31, 2017
|
10,023,059
|
|
$
|
76,977
|
|
87,301
|
|
(11,665
|
)
|
(2,342
|
)
|
150,271
|
|
|||||
The accompanying notes to consolidated financial statements are an integral part of these statements.
-
47
-
LCNB CORP. AND SUBSIDIARIES
For the years ended December 31,
(Dollars in thousands)
|
|
2017
|
2016
|
2015
|
||||||
|
CASH FLOWS FROM OPERATING ACTIVITIES:
|
|
|
|
||||||
|
Net income
|
$
|
12,972
|
|
12,482
|
|
11,474
|
|
||
|
Adjustments to reconcile net income to net cash flows from operating activities-
|
|
|
|
|
|
|
|||
|
Depreciation, amortization and accretion
|
3,308
|
|
2,557
|
|
2,997
|
|
|||
|
Provision for loan losses
|
215
|
|
913
|
|
1,366
|
|
|||
|
Impact of Tax Cuts and Jobs Act on Accumulated Other Comprehensive Income
|
486
|
|
—
|
|
—
|
|
|||
|
Deferred income tax provision (benefit)
|
1,254
|
|
928
|
|
(58
|
)
|
|||
|
Increase in cash surrender value of bank owned life insurance
|
(760
|
)
|
(746
|
)
|
(625
|
)
|
|||
|
Bank owned life insurance death benefits in excess of cash surrender value
|
(107
|
)
|
—
|
|
—
|
|
|||
|
Realized gain on sales of securities available-for-sale
|
(233
|
)
|
(1,082
|
)
|
(495
|
)
|
|||
|
Realized loss (gain) on sale of premises and equipment
|
113
|
|
33
|
|
(1
|
)
|
|||
|
Realized loss from sale and write-downs of other real estate owned and repossessed assets
|
3
|
|
534
|
|
378
|
|
|||
|
Origination of mortgage loans for sale
|
(7,513
|
)
|
(11,217
|
)
|
(7,725
|
)
|
|||
|
Realized gains from sales of loans
|
(166
|
)
|
(244
|
)
|
(343
|
)
|
|||
|
Proceeds from sales of loans
|
7,588
|
|
11,353
|
|
7,809
|
|
|||
|
Penalty for prepayment of long-term debt
|
—
|
|
251
|
|
—
|
|
|||
|
Compensation expense related to stock options
|
1
|
|
5
|
|
19
|
|
|||
|
Compensation expense related to restricted stock
|
75
|
|
90
|
|
90
|
|
|||
|
Changes in:
|
|
|
|
|
|
|
|||
|
Income receivable
|
(4
|
)
|
(216
|
)
|
(160
|
)
|
|||
|
Other assets
|
(269
|
)
|
(791
|
)
|
(3,302
|
)
|
|||
|
Other liabilities
|
1,172
|
|
634
|
|
1,815
|
|
|||
|
TOTAL ADJUSTMENTS
|
5,163
|
|
3,002
|
|
1,765
|
|
|||
|
NET CASH FLOWS PROVIDED BY OPERATING ACTIVITIES
|
18,135
|
|
15,484
|
|
13,239
|
|
|||
|
CASH FLOWS FROM INVESTING ACTIVITIES:
|
|
|
|
|
|
|
|||
|
Proceeds from sales of investment securities available-for-sale
|
43,246
|
|
92,455
|
|
97,981
|
|
|||
|
Proceeds from maturities and calls of investment securities:
|
|
|
|
|
|
|
|||
|
Available-for-sale
|
25,012
|
|
84,529
|
|
29,700
|
|
|||
|
Held-to-maturity
|
14,057
|
|
6,640
|
|
3,515
|
|
|||
|
Purchases of investment securities:
|
|
|
|
|
|
|
|||
|
Available-for-sale
|
(27,012
|
)
|
(124,934
|
)
|
(163,859
|
)
|
|||
|
Held-to-maturity
|
(5,625
|
)
|
(25,010
|
)
|
(3,413
|
)
|
|||
|
Purchase of Federal Reserve Bank stock
|
—
|
|
—
|
|
(256
|
)
|
|||
|
Proceeds from sale of impaired loans
|
—
|
|
—
|
|
4,559
|
|
|||
|
Net increase in loans
|
(29,692
|
)
|
(48,153
|
)
|
(42,530
|
)
|
|||
|
Purchase of bank owned life insurance
|
—
|
|
(4,000
|
)
|
—
|
|
|||
|
Proceeds from bank owned life insurance death benefits
|
189
|
|
—
|
|
—
|
|
|||
|
Proceeds from sales of other real estate owned and repossessed assets
|
971
|
|
526
|
|
245
|
|
|||
|
Additions to other real estate owned
|
—
|
|
(182
|
)
|
(20
|
)
|
|||
|
Purchases of premises and equipment
|
(6,617
|
)
|
(9,450
|
)
|
(504
|
)
|
|||
|
Proceeds from sales of premises and equipment
|
272
|
|
63
|
|
22
|
|
|||
|
Net cash acquired from acquisition
|
—
|
|
—
|
|
8,993
|
|
|||
|
NET CASH FLOWS PROVIDED BY (USED IN) INVESTING ACTIVITIES
|
14,801
|
|
(27,516
|
)
|
(65,567
|
)
|
|||
|
CASH FLOWS FROM FINANCING ACTIVITIES:
|
|
|
|
|
|
|
|||
|
Net increase (decrease) in deposits
|
(25,084
|
)
|
23,745
|
|
41,822
|
|
|||
|
Net increase in short-term borrowings
|
4,960
|
|
4,653
|
|
20,742
|
|
|||
|
Principal payments on long-term debt
|
(295
|
)
|
(5,349
|
)
|
(5,410
|
)
|
|||
|
Penalty for prepayment of long-term debt
|
—
|
|
(251
|
)
|
—
|
|
|||
|
Proceeds from issuance of common stock
|
41
|
|
52
|
|
66
|
|
|||
|
Repurchase of stock warrants
|
—
|
|
(1,545
|
)
|
—
|
|
|||
|
Proceeds from exercise of stock options
|
51
|
|
592
|
|
152
|
|
|||
|
Excess tax benefit from exercise of stock options and vesting of restricted common stock
|
—
|
|
61
|
|
13
|
|
|||
|
Cash dividends paid on common stock
|
(6,088
|
)
|
(6,048
|
)
|
(5,915
|
)
|
|||
|
NET CASH FLOWS PROVIDED BY (USED IN) FINANCING ACTIVITIES
|
(26,415
|
)
|
15,910
|
|
51,470
|
|
|||
|
NET CHANGE IN CASH AND CASH EQUIVALENTS
|
6,521
|
|
3,878
|
|
(858
|
)
|
|||
|
CASH AND CASH EQUIVALENTS AT BEGINNING OF YEAR
|
18,865
|
|
14,987
|
|
15,845
|
|
|||
|
CASH AND CASH EQUIVALENTS AT END OF YEAR
|
$
|
25,386
|
|
18,865
|
|
14,987
|
|
||
|
SUPPLEMENTAL CASH FLOW INFORMATION:
|
|
|
|
||||||
|
CASH PAID DURING THE YEAR FOR:
|
|
|
|
||||||
|
Interest
|
$
|
3,577
|
|
3,542
|
|
3,396
|
|
||
|
Income taxes
|
2,185
|
|
4,420
|
|
4,820
|
|
|||
|
SUPPLEMENTAL DISCLOSURES OF NON-CASH INVESTING ACTIVITY:
|
|
|
|
|
|
|
|||
|
Transfer from loans to other real estate owned and repossessed assets
|
974
|
|
32
|
|
79
|
|
|||
The accompanying notes to consolidated financial statements are an integral part of these statements.
-
48
-
LCNB CORP. AND SUBSIDIARIES
NOTES TO CONSOLIDATED FINANCIAL STATEMENTS
December 31, 2017
NOTE 1 -
SUMMARY OF SIGNIFICANT ACCOUNTING POLICIES
LCNB Corp. (the "Company" or “LCNB”), an Ohio corporation formed in December 1998, is a financial holding company whose principal activity is the ownership of LCNB National Bank (the "Bank"). The Bank was founded in 1877 and provides full banking services, including trust and brokerage services, to customers primarily in Southwestern and South Central Ohio.
BASIS OF PRESENTATION
The consolidated financial statements include the accounts of the Company and its subsidiaries. Significant intercompany accounts and transactions are eliminated in consolidation. The accounting and reporting policies of the Company conform with U.S. generally accepted accounting principles and with general practices in the banking industry.
Certain prior period data presented in the financial statements have been reclassified to conform with the current year presentation. These reclassifications had no effect on net income.
USE OF ESTIMATES
The preparation of financial statements in conformity with U.S. generally accepted accounting principles requires management to make estimates and assumptions that affect the reported amounts of assets and liabilities and disclosure of contingent assets and liabilities at the date of the financial statements and the reported amounts of revenues and expenses during the reporting period. Actual results could differ from those estimates.
CASH AND CASH EQUIVALENTS
For purposes of reporting cash flows, cash and cash equivalents include cash, balances due from banks, federal funds sold, and interest-bearing demand deposits with original maturities of
twelve
months or less. Deposits with other banks routinely have balances greater than FDIC insured limits. Management considers the risk of loss to be very low with respect to such deposits.
INVESTMENT SECURITIES
Certain municipal debt securities that management has the positive intent and ability to hold to maturity are classified as “held-to-maturity” and recorded at amortized cost. Securities not classified as held-to-maturity are classified as “available-for-sale” and recorded at fair value, with unrealized gains and losses excluded from earnings and reported in other comprehensive income, a separate component of shareholders’ equity. Amortization of premiums and accretion of discounts are recognized as adjustments to interest income using the level-yield method. Realized gains or losses from the sale of securities are recorded on the trade date and are computed using the specific identification method.
Declines in the fair value of securities below their cost that are deemed to be other-than-temporarily impaired, and for which the Company does not intend to sell the securities and it is not more likely than not that the securities will be sold before the anticipated recovery of the impairment, are separated into losses related to credit factors and losses related to other factors. The losses related to credit factors are recognized in earnings and losses related to other factors are recognized in other comprehensive income. In estimating other than temporary impairment losses, management considers the length of time and the extent to which the fair value has been less than cost, the financial condition and near-term prospects of the issuer, and the intent and ability of the Company to retain its investment in the issuer for a period of time sufficient to allow for any anticipated recovery in fair value. The Company's consolidated statements of income as of
December 31, 2017
,
2016
, and
2015
, do not reflect any such impairment.
Federal Home Loan Bank ("FHLB") stock is an equity interest in the Federal Home Loan Bank of Cincinnati. It can be sold only at its par value of
$100
per share and only to the FHLB or to another member institution. In addition, the equity ownership rights are more limited than would be the case for a public company because of the oversight role exercised by the Federal Housing Finance Agency in the process of budgeting and approving dividends. Federal Reserve Bank stock is similarly restricted in marketability and value. Both investments are carried at cost, which is their par value.
FHLB and Federal Reserve Bank stock are both subject to minimum ownership requirements by member banks. The required investments in common stock are based on predetermined formulas.
-
49
-
LCNB CORP. AND SUBSIDIARIES
NOTES TO CONSOLIDATED FINANCIAL STATEMENTS
December 31, 2017
(Continued)
NOTE 1 -
SUMMARY OF SIGNIFICANT ACCOUNTING POLICIES
(continued)
LOANS
The Company’s loan portfolio includes most types of commercial and industrial loans, commercial loans secured by real estate, residential real estate loans, consumer loans, agricultural loans and other types of loans. Most of the properties collateralizing the loan portfolio are located within the Company’s market area.
Loans are stated at the principal amount outstanding, net of unearned income, deferred origination fees and costs, and the allowance for loan losses. Interest income is accrued on the unpaid principal balance. The delinquency status of a loan is based on contractual terms and not on how recently payments have been received. Generally, a loan is placed on non-accrual status when it is classified as impaired or there is an indication that the borrower’s cash flow may not be sufficient to make payments as they come due, unless the loan is well secured and in the process of collection. Subsequent cash receipts on non-accrual loans are recorded as a reduction of principal and interest income is recorded once principal recovery is reasonably assured. The current year's accrued interest on loans placed on non-accrual status is charged against earnings. Previous years' accrued interest is charged against the allowance for loan losses. Non-accrual loans are returned to accrual status when, in the opinion of management, the financial position of the borrower indicates there is no longer a reasonable doubt as to the timely collection of interest or principal.
Loan origination fees and certain direct loan origination costs are deferred and the net amount amortized as an adjustment of loan yields. These amounts are being amortized over the lives of the related loans.
In the ordinary course of business, the Company enters into off-balance sheet financial instruments consisting of commitments to extend credit and standby letters of credit. Such financial instruments are recorded in the financial statements when they are funded. The credit risk associated with these commitments is evaluated in a manner similar to the allowance for loan losses.
Loans acquired from mergers are recorded at fair value with no carryover of the acquired entity's previously established allowance for loan losses. The excess of expected cash flows over the estimated fair value of acquired loans is recognized as interest income over the remaining contractual lives of the loans using the level yield method. Subsequent decreases in expected cash flows will require additions to the allowance for loan losses. Subsequent improvements in expected cash flows result in the recognition of additional interest income over the then-remaining contractual lives of the loans. Management estimates the cash flows expected to be collected at acquisition using a third-party risk model, which incorporates the estimate of key assumptions, such as default rates, severity, and prepayment speeds.
Impaired loans acquired are accounted for under FASB ASC 310-30. Factors considered in evaluating whether an acquired loan was impaired include delinquency status and history, updated borrower credit status, collateral information, and current loan-to-value information. The difference between contractually required payments at the time of acquisition and the cash flows expected to be collected is referred to as the nonaccretable difference. The interest component of the cash flows expected to be collected is referred to as the accretable yield and is recognized as interest income over the remaining contractual life of the loan using the level yield method. Subsequent decreases in expected cash flows will require additions to the allowance for loan losses. Subsequent improvements in expected cash flows will result in a reclassification from the nonaccretable difference to the accretable yield.
ALLOWANCE FOR LOAN LOSSES
The allowance for loan losses is established through a provision for loan losses charged to expense. Loans are charged against the allowance for loan losses when management believes that the collectibility of the principal is unlikely. Consumer loans are charged off when they reach
120
days past due. Subsequent recoveries, if any, are credited to the allowance.
-
50
-
LCNB CORP. AND SUBSIDIARIES
NOTES TO CONSOLIDATED FINANCIAL STATEMENTS
December 31, 2017
(Continued)
NOTE 1 -
SUMMARY OF SIGNIFICANT ACCOUNTING POLICIES
(continued)
The provision for loan losses is determined by management based upon its evaluation of the amount needed to maintain the allowance for loan losses at a level considered appropriate in relation to the estimated risk of losses inherent in the portfolio. Current methodology used by management to estimate the allowance takes into consideration such factors as changes in the nature and volume of the loan portfolio, overall portfolio quality, review of specific problem loans, historic categorical trends, current delinquency levels as related to historical levels, portfolio growth rates, changes in composition of the portfolio, the current economic environment, as well as current allowance adequacy in relation to the portfolio. Management is cognizant that reliance on historical information coupled with the cyclical nature of the economy, including credit cycles, affects the allowance. Management considers all of these factors prior to making any adjustments to the allowance due to the subjectivity and imprecision involved in allocation methodology. This evaluation is inherently subjective as it requires estimates that are susceptible to significant revision as more information becomes available.
The allowance consists of specific and general components. The specific component relates to loans that are specifically reviewed for impairment. For such loans, an allowance is established when the discounted cash flows (or collateral value or observable market price) of the impaired loan is lower than the carrying value of that loan. The general component covers loans not specifically reviewed for impairment and homogeneous loan pools, such as residential real estate and consumer loans. The general component is measured for each loan category separately based on each category’s average of historical loss experience over a trailing
sixty
month period, adjusted for qualitative factors. Such qualitative factors may include current economic conditions if different from the
five
-year historical loss period, trends in underperforming loans, trends in volume and terms of loan categories, concentrations of credit, and trends in loan quality.
A loan is considered impaired when management believes, based on current information and events, it is probable that the Bank will be unable to collect all amounts due, including principal and interest, according to the contractual terms of the loan agreement. An impaired loan is measured by the present value of expected future cash flows using the loan's effective interest rate. An impaired collateral-dependent loan may be measured based on collateral value. Smaller-balance homogeneous loans, including residential mortgage and consumer installment loans, that are not evaluated individually are collectively evaluated for impairment.
PREMISES AND EQUIPMENT
Premises and equipment are stated at cost less accumulated depreciation. Depreciation is computed on both the straight-line and accelerated methods over the estimated useful lives of the assets, generally
15
to
40
years for premises and
3
to
10
years for equipment. Leasehold improvements are amortized over the terms of the respective leases or the estimated useful lives of the improvements, whichever is shorter. Costs incurred for maintenance and repairs are expensed as incurred. Premises and equipment are evaluated for impairment whenever events or changes in circumstances indicate that the carrying amount of a particular asset may not be recoverable.
OTHER REAL ESTATE OWNED
Other real estate owned includes properties acquired through foreclosure. Such property is held for sale and is initially recorded at fair value, less costs to sell, establishing a new cost basis. Fair value is primarily based on a property appraisal obtained at the time of transfer and any periodic updates that may be obtained thereafter. The allowance for loan losses is charged for any write down of the loan’s carrying value to fair value at the date of transfer. Any subsequent reductions in fair value and expenses incurred from holding other real estate owned are charged to other non-interest expense. Costs, excluding interest, relating to the improvement of other real estate owned are capitalized. Gains and losses from the sale of other real estate owned are included in other non-interest expense.
GOODWILL AND OTHER INTANGIBLE ASSETS
Goodwill is the excess of the purchase price over the fair value of the net identifiable assets acquired in a business combination. Goodwill is not amortized, but is instead subject to an annual review for impairment.
Mortgage servicing rights on originated mortgage loans that have been sold are initially recorded at their estimated fair values. Mortgage servicing rights are amortized to loan servicing income in proportion to and over the period of estimated servicing income. Such assets are periodically evaluated as to the recoverability of their carrying value.
-
51
-
LCNB CORP. AND SUBSIDIARIES
NOTES TO CONSOLIDATED FINANCIAL STATEMENTS
December 31, 2017
(Continued)
NOTE 1 -
SUMMARY OF SIGNIFICANT ACCOUNTING POLICIES
(continued)
The Company’s other intangible assets relate to core deposits acquired from business combinations. These intangible assets are amortized on a straight-line basis over their estimated useful lives. Management evaluates whether events or circumstances have occurred that indicate the remaining useful life or carrying value of the amortizing intangible should be revised.
BANK OWNED LIFE INSURANCE
The Company has purchased life insurance policies on certain officers of the Company. The Company is the beneficiary of these policies and has recorded the estimated cash surrender value in other assets in the consolidated balance sheets. Income on the policies, based on the increase in cash surrender value and any incremental death benefits, is included in other non-interest income in the consolidated statements of income.
AFFORDABLE HOUSING TAX CREDIT LIMITED PARTNERSHIP
LCNB has elected to account for its investment in an affordable housing tax credit limited partnership using the proportional amortization method described in FASB ASU 2014-01, "Investments - Equity Method and Joint Ventures (Topic 323): Accounting for Investments in Qualified Affordable Housing Projects (A Consensus of the FASB Emerging Issues Task Force)." Under the proportional amortization method, an investor amortizes the initial cost of the investment to income tax expense in proportion to the tax credits and other tax benefits received and recognizes the net investment performance in the income statement as a component of income tax expense. The investment in the limited partnership is included in other assets and the unfunded amount is included in accrued interest and other liabilities in LCNB's consolidated balance sheets.
FAIR VALUE MEASUREMENTS
Accounting guidance establishes a fair value hierarchy to prioritize the inputs to valuation techniques used to measure fair value. A financial instrument’s level within the hierarchy is based on the lowest level of input that is significant to the fair value measurement. The three broad input levels are:
|
•
|
Level 1 – quoted prices in active markets for identical assets or liabilities that the reporting entity has the ability to access at the reporting date;
|
|
•
|
Level 2 – inputs other than quoted prices included within level 1 that are observable for the asset or liability either directly or indirectly; and
|
|
•
|
Level 3 - inputs that are unobservable for the asset or liability.
|
Accounting guidance permits, but does not require, companies to measure many financial instruments and certain other items at fair value. The decision to elect the fair value option is made individually for each instrument and is irrevocable once made. Changes in fair value for the selected instruments are recorded in earnings. The Company did not select any financial instruments for the fair value election in
2017
or
2016
.
ADVERTISING EXPENSE
Advertising costs are expensed as incurred and are recorded as a marketing expense, a component of non-interest expense.
PENSION PLANS
Eligible employees of the Company hired before 2009 participate in a multiple-employer qualified noncontributory defined benefit retirement plan. This plan is accounted for as a multi-employer plan because assets contributed by an employer are not segregated in a separate account or restricted to provide benefits only to employees of that employer.
Citizens National had a qualified noncontributory, defined benefit pension plan, which has been assumed by the Company, that covers eligible employees hired before May 1, 2005. This is a single employer plan.
TREASURY STOCK
Common shares repurchased are recorded at cost. Cost of shares retired or reissued is determined using the weighted average method.
-
52
-
LCNB CORP. AND SUBSIDIARIES
NOTES TO CONSOLIDATED FINANCIAL STATEMENTS
December 31, 2017
(Continued)
NOTE 1 -
SUMMARY OF SIGNIFICANT ACCOUNTING POLICIES
(continued)
STOCK OPTIONS AND RESTRICTED STOCK AWARD PLANS
The cost of employee services received in exchange for stock option grants is the grant-date fair value of the award estimated using an option-pricing model. The compensation cost for restricted stock awards is based on the market price of the Company's common stock at the date of grant multiplied by the number of shares granted that are expected to vest. The estimated cost is recognized on a straight-line basis over the period the employee is required to provide services in exchange for the award, usually the vesting period. The Company uses a Black-Scholes pricing model and related assumptions for estimating the fair value of stock option grants and a
five
-year vesting period for stock options and restricted stock.
INCOME TAXES
Deferred income taxes are determined using the asset and liability method of accounting. Under this method, the net deferred tax asset or liability is determined based on the tax effects of temporary differences between the book and tax basis of the various balance sheet assets and liabilities and gives current recognition to changes in tax rates and laws.
Management analyzes material tax positions taken in any income tax return for any tax jurisdiction and determines the likelihood of the positions being sustained in a tax examination. A tax position is recognized as a benefit only if it is “more likely than not” that the tax position would be sustained in a tax examination, with a tax examination being presumed to occur. The amount recognized is the largest amount of tax benefit that is greater than 50% likely of being realized on examination. For tax positions not meeting the “more likely than not” test, no tax benefit is recorded.
EARNINGS PER SHARE
Basic earnings per share allocated to common shareholders is calculated using the two-class method and is computed by dividing net income allocated to common shareholders by the weighted average number of common shares outstanding during the period. Diluted earnings per share is adjusted for the dilutive effects of stock based compensation and warrants and is calculated using the two-class method or the treasury stock method. The diluted average number of common shares outstanding has been increased for the assumed exercise of stock based compensation and warrants with the proceeds used to purchase treasury shares at the average market price for the period.
RECENT ACCOUNTING PRONOUNCEMENTS
From time to time the FASB issues an Accounting Standards Update ("ASU") to communicate changes to Generally Accepted Accounting Principles ("GAAP"). The following information provides brief summaries of newly issued but not yet effective ASUs that could have an effect on LCNB’s financial position or results of operations:
ASU No. 2014-09, "Revenue from Contracts with Customers (Topic 606)"
ASU No. 2014-09 was issued in May 2014 and supersedes most current revenue recognition guidance for contracts to transfer goods or services or other nonfinancial assets. Lease contracts, insurance contracts, and most financial instruments are not included in the scope of this update. ASU No. 2014-09 provides that an entity should recognize revenue to depict the transfer of promised goods or services to customers in an amount that reflects the consideration to which the entity expects to be entitled in exchange for those goods or services. The guidance enumerates five steps that entities should follow in achieving this core principle. Additional disclosures providing information about contracts with customers are required.
Guidance in ASU No. 2014-09 has been clarified by the following ASUs:
|
•
|
ASU No. 2016-08, "Revenue from Contracts with Customers (Topic 606): Principal versus Agent Considerations (Reporting Revenue Gross versus Net)"
|
|
•
|
ASU No. 2016-10, "Revenue from Contracts with Customers (Topic 606): Identifying Performance Obligations and Licensing"
|
|
•
|
ASU No. 2016-12, "Revenue from Contracts with Customers (Topic 606): Narrow Scope Improvements and Practical Expedients"
|
|
•
|
ASU No. 2016-20, "Revenue from Contracts with Customers (Topic 606): Technical Corrections and Improvements"
|
-
53
-
LCNB CORP. AND SUBSIDIARIES
NOTES TO CONSOLIDATED FINANCIAL STATEMENTS
December 31, 2017
(Continued)
NOTE 1 -
SUMMARY OF SIGNIFICANT ACCOUNTING POLICIES
(continued)
As extended by
ASU No. 2015-14, "Revenue from Contracts with Customers (Topic 606): Deferral of the Effective Date,"
ASU No. 2014-09 and the clarifying ASUs are effective for public companies for annual reporting periods beginning after December 15, 2017, including interim periods within that reporting period. Transitional guidance is included in the updates. Earlier adoption is permitted only as of annual reporting periods beginning after December 15, 2016, including interim reporting periods within that reporting period. LCNB's revenue is comprised of net interest income, which is explicitly excluded from the scope of ASU No. 2014-09, and non-interest income. LCNB management has finalized its assessment of the update's affect on non-interest income and has determined that the amendments in ASU No. 2014-09 will not result in a material change from current accounting. Changes to related disclosures are still being analyzed.
ASU No. 2016-01, "Financial Instruments - Overall (Subtopic 825-10): Recognition and Measurement of Financial Assets and Financial Liabilities"
ASU No. 2016-01 was issued in January 2016 and applies to all entities that hold financial assets or owe financial liabilities. It makes targeted changes to generally accepted accounting principles for public companies as follows:
|
1.
|
Requires most equity investments to be measured at fair value with changes in fair value recognized in net income.
|
|
2.
|
Simplifies the impairment assessment of equity investments without readily determinable fair values by requiring a qualitative assessment to identify impairment. When a qualitative assessment indicates that impairment exists, an entity is required to measure the investment at fair value.
|
|
3.
|
Eliminates the requirement to disclose the method(s) and significant assumptions used to estimate the fair value that is required to be disclosed for financial instruments measured at amortized cost on the balance sheet.
|
|
4.
|
Requires use of the exit price notion when measuring the fair value of financial instruments for disclosure purposes.
|
|
5.
|
Requires an entity to present separately in other comprehensive income the portion of the total change in the fair value of a liability resulting from a change in the instrument-specific credit risk when the entity has elected to measure the liability at fair value in accordance with the fair value option for financial instruments.
|
|
6.
|
Requires separate presentation of financial assets and financial liabilities by measurement category and form of financial asset (that is, securities or loans and receivables) on the balance sheet or the accompanying notes to the financial statements.
|
|
7.
|
Clarifies that an entity should evaluate the need for a valuation allowance on a deferred tax asset related to available-for-sale securities in combination with the entity’s other deferred tax assets.
|
For public business entities, the new guidance is effective for annual reporting periods, and interim reporting periods within those annual periods, beginning after December 15, 2017. Adoption of ASU No. 2016-01 did not have a material impact on LCNB's results of operations or financial position.
ASU No. 2016-02, "Leases (Topic 842)"
ASU No. 2016-02 was issued in February 2016 and requires a lessee to recognize in the statement of financial position a liability to make lease payments ("the lease liability") and a right-of-use asset representing its right to use the underlying asset for the lease term, initially measured at the present value of the lease payments. When measuring assets and liabilities arising from a lease, the lessee should include payments to be made in optional periods only if the lessee is reasonably certain, as defined, to exercise an option to the lease or not to exercise an option to terminate the lease. Optional payments to purchase the underlying asset should be included if the lessee is reasonably certain it will exercise the purchase option. Most variable lease payments should be excluded except for those that depend on an index or a rate or are in substance fixed payments.
A lessee shall classify a lease as a finance lease if it meets any of five listed criteria:
|
1.
|
The lease transfers ownership of the underlying asset to the lessee by the end of the lease term.
|
|
2.
|
The lease grants the lessee an option to purchase the underlying asset that the lessee is reasonably certain to exercise.
|
|
3.
|
The lease term is for the major part of the remaining economic life of the underlying asset.
|
|
4.
|
The present value of the sum of the lease payments and any residual value guaranteed by the lessee equals or exceeds substantially all of the fair value of the underlying asset.
|
|
5.
|
The underlying asset is of such a specialized nature that it is expected to have no alternative use to the lessor at the end of the lease term.
|
-
54
-
LCNB CORP. AND SUBSIDIARIES
NOTES TO CONSOLIDATED FINANCIAL STATEMENTS
December 31, 2017
(Continued)
NOTE 1 -
SUMMARY OF SIGNIFICANT ACCOUNTING POLICIES
(continued)
For finance leases, a lessee shall recognize in the statement of income interest on the lease liability separately from amortization of the right-of-use asset. Amortization of the right-of-use asset shall be on a straight-line basis, unless another basis is more representative of the pattern in which the lessee expects to consume the right-of-use asset’s future economic benefits. If the lease does not meet any of the five criteria, the lessee shall classify it as an operating lease and shall recognize a single lease cost on a straight-line basis over the lease term. For leases with a term of 12 months or less, a lessee is permitted to make an accounting policy election by class of underlying asset not to recognize lease assets and lease liabilities. If a lessee makes this election, it should recognize lease expense for such leases generally on a straight-line basis over the lease term.
The amendments in this update are to be applied using a modified retrospective approach, as defined, and are effective for public business entities for fiscal years, and for interim periods within those fiscal years, beginning after December 15, 2018. Early application is permitted. LCNB estimates that it will recognize discounted right of use assets and lease liabilities totaling approximately
$5 million
for the leases disclosed in Note 8 - Leases. This projection is based on various assumptions, including the level of interest rates and no significant increases in leasing activity, that may change between now and the effective date.
ASU No. 2016-13, "Financial Instruments - Credit Losses (Topic 326): Measurement of Credit Losses on Financial Instruments"
ASU No. 2016-13 was issued in June 2016 and, once effective, will significantly change current guidance for recognizing impairment of financial instruments. Current guidance requires an "incurred loss" methodology for recognizing credit losses that delays recognition until it is probable a loss has been incurred. ASU No. 2016-13 replaces the incurred loss impairment methodology with a new methodology that reflects expected credit losses over the lives of the loans and requires consideration of a broader range of information to inform credit loss estimates. The ASU requires an organization to estimate all expected credit losses for financial assets measured at amortized cost, including loans and held-to-maturity debt securities, based on historical experience, current conditions, and reasonable and supportable forecasts. Additional disclosures are required.
ASU No. 2016-13 also amends the accounting for credit losses on available-for-sale debt securities and purchased financial assets with credit deterioration. Under the new guidance, entities will determine whether all or a portion of the unrealized loss on an available-for-sale debt security is a credit loss. Any credit loss will be recognized as an allowance for credit losses on available-for-sale debt securities rather than as a direct reduction of the amortized cost basis of the investment, as is currently required. As a result, entities will recognize improvements to estimated credit losses on available-for-sale debt securities immediately in earnings rather than as interest income over time, as currently required.
ASU No. 2016-13 eliminates the current accounting model for purchased credit impaired loans and debt securities. Instead, purchased financial assets with credit deterioration will be recorded gross of estimated credit losses as of the date of acquisition and the estimated credit losses amounts will be added to the allowance for credit losses. Thereafter, entities will account for additional impairment of such purchased assets using the models listed above.
ASU No. 2016-13 will take effect for U.S. Securities and Exchange Commission (SEC) filers for fiscal years, and interim periods within those fiscal years, beginning after December 15, 2019. Early application will be permitted for fiscal years, and interim periods within those fiscal years, beginning after December 15, 2018. While LCNB's Loan Committee expects that the implementation of ASU No. 2016-13 will increase the balance of the allowance for loan losses, it is continuing to evaluate the potential impact on LCNB's results of operations and financial position. The Loan Committee is currently analyzing its data collection efforts, pool segmentation, and reporting mechanisms to prepare for adoption of this ASU. The financial statement impact of this new standard cannot be reasonably estimated at this time.
-
55
-
LCNB CORP. AND SUBSIDIARIES
NOTES TO CONSOLIDATED FINANCIAL STATEMENTS
December 31, 2017
(Continued)
NOTE 1 -
SUMMARY OF SIGNIFICANT ACCOUNTING POLICIES
(continued)
ASU No. 2017-04, "Intangibles - Goodwill and Other (Topic 350): Simplifying the Test for Goodwill Impairment"
ASU No. 2017-04 was issued in January 2017 and applies to public and other entities that have goodwill reported in their financial statements. To simplify the subsequent measurement of goodwill, this ASU eliminates Step 2 from the goodwill impairment test. In computing the implied fair value of goodwill under Step 2, an entity had to perform procedures to determine the fair value at the impairment testing date of its assets and liabilities, including unrecognized assets and liabilities, following the procedure that would be required in determining the fair value of assets acquired and liabilities assumed in a business combination. Instead, under the amendments in this update, an entity should perform its annual, or interim, goodwill impairment test by comparing the fair value of a reporting unit with its carrying amount. An entity should recognize an impairment charge for the amount by which the carrying amount exceeds the reporting unit’s fair value; however, the loss recognized should not exceed the total amount of goodwill allocated to that reporting unit. A public business entity that is an SEC filer should adopt the amendments in this update on a prospective basis for its annual or any interim goodwill impairment tests in fiscal years beginning after December 15, 2019. Adoption of ASU No. 2017-04 is not expected to have a material impact on LCNB's results of operations or financial position.
ASU No. 2017-07, "Compensation - Retirement Benefits (Topic 715): Improving the Presentation of Net Periodic Pension Cost
and Net Periodic Postretirement Benefit Cost"
ASU No. 2017-07 was issued in March 2017 and applies to all employers that offer to their employees defined benefit pension plans, other postretirement benefit plans, or other types of benefits accounted for under Topic 715. The amendments in this update require that an employer report the service cost component in the same line item or items as other compensation costs arising from services rendered by the pertinent employees during the period. The other components of net benefit cost, as defined, are required to be presented in the income statement separately from the service cost component and outside a subtotal of income from operations, if one is presented. If a separate line item or items are not used, the line item or items used in the income statement to present the other components of net benefit cost must be disclosed. The amendments in ASU No. 2017-07 are effective for public business entities for annual periods beginning after December 15, 2017, including interim periods within those annual periods. The amendments in this update are to be applied retrospectively for the presentation of the service cost component and the other components of net periodic pension cost and net periodic postretirement benefit cost in the income statement. Adoption of ASU No. 2017-07 did not have a material impact on LCNB's results of operations or financial position.
ASU No. 2017-09, "Compensation - Stock Compensation (Topic 718): Scope of Modification Accounting"
ASU No. 2017-09 was issued in May 2017 and applies to any entity that changes the terms or conditions of a share-based payment award. The amendments in this update provide that an entity would not apply modification accounting under the guidance in Topic 718 if the fair value, vesting conditions, and classification of the awards are the same immediately before and after the modification. The amendments are to be applied prospectively and are effective for all entities for annual periods, and interim periods within those annual periods, beginning after December 15, 2017. Adoption of ASU No. 2017-09 did not have a material impact on LCNB's results of operations or financial position.
ASU No. 2017-12, "Derivatives and Hedging (Topic 815): Targeted Improvements to Accounting for Hedging Activities"
ASU No. 2017-12 was issued in August 2017 and applies to any entity that elects to apply hedge accounting in accordance with current generally accepted accounting principles. The amendments in this update better align an entity’s risk management activities and financial reporting for hedging relationships through changes to both the designation and measurement guidance for qualifying hedging relationships and the presentation of hedge results. To meet that objective, the amendments expand and refine hedge accounting for both nonfinancial and financial risk components. The amendments are effective for public business entities for fiscal years beginning after December 15, 2018, and interim periods within those fiscal years. Early application is permitted. LCNB does not currently own any instruments within the scope of ASU No. 2017-12 and its adoption is not expected to have a material impact on its results of operations or financial position.
-
56
-
LCNB CORP. AND SUBSIDIARIES
NOTES TO CONSOLIDATED FINANCIAL STATEMENTS
December 31, 2017
(Continued)
NOTE 1 -
SUMMARY OF SIGNIFICANT ACCOUNTING POLICIES
(continued)
ASU No. 2018-02, "Income Statement - Reporting Comprehensive Income (Topic 220): Reclassification of Certain Tax Effects from Accumulated Other Comprehensive Income"
ASU No. 2018-02 was issued in February 2018 and addresses a narrow-scope financial reporting issue that arose as a consequence of the passage of H.R. 1, originally known as the “Tax Cuts and Jobs Act.” GAAP requires adjustment of deferred tax assets and liabilities for the effect of a change in tax laws or rates with the effect to be included in income from continuing operations in the reporting period that includes the enactment date. This guidance is applicable even in situations in which the related income tax effects of items in accumulated other comprehensive income were originally recognized in other comprehensive income rather than in income from continuing operations. As a consequence, the tax effects of items within accumulated other comprehensive income, referred to as stranded tax effects in the update, do not reflect the appropriate tax rate. The amendments in ASU No. 2018-02 allow a reclassification from accumulated other comprehensive income to retained earnings for the stranded tax effects resulting from the Tax Cuts and Jobs Act. Because the amendments only relate to the reclassification of the income tax effects of the Tax Cuts and Jobs Act, the underlying guidance that requires that the effect of a change in tax laws or rates be included in income from continuing operations is not affected. ASU No. 2018-02 is effective for all entities for fiscal years beginning after December 15, 2018, and interim periods within those fiscal years. Early adoption is permitted, including adoption in any interim period. LCNB intends to early adopt ASU No. 2018-02 as of January 1, 2018 and reclassify its stranded tax effects totaling
$486,000
(credit) into retained earnings.
NOTE 2 –
ACQUISITIONS (UNAUDITED)
On December 20, 2017, LCNB and Columbus First Bancorp, Inc. (“CFB”) entered into an Agreement and Plan of Merger (“Merger Agreement”) pursuant to which CFB will merge with and into LCNB in an all-stock transaction. Immediately following the merger of CFB into LCNB, Columbus First Bank, a wholly-owned subsidiary of CFB, will be merged into theBank. Columbus First Bank operates from one full-service office located in Worthington, Ohio. Subject to customary regulatory approvals, LCNB and CFB shareholder approvals, and other conditions set forth in the definitive merger agreement, the transaction is anticipated to close in the second quarter of 2018. At that time, Columbus First Bank's office will become a branch of the Bank.
Under the terms of the Merger Agreement, which has been unanimously approved by the Board of Directors of each company, the shareholders of CFB will be entitled to receive
two
LCNB common shares for each outstanding CFB common share. Any unexercised stock options of CFB will be canceled in exchange for a cash payment. Based on LCNB's closing share price of
$18.50
as of February 28, 2018, the transaction is valued at
$37.00
for each CFB share or approximately
$58.8 million
in aggregate. As of February 28, 2018, Columbus First has
1,589,516
shares outstanding, as well as
65,724
options with a weighted average strike price of
$14.06
per share.
The acquisition will be accounted for in accordance with applicable accounting guidance. Accordingly, the assets and liabilities
of CFB will be recorded at their estimated fair values at the acquisition date. The excess of the estimated fair value of LCNB common shares issued over the net fair values of the assets acquired, including identifiable intangible assets and liabilities assumed, will be recorded as goodwill. The results of operations will be included in the consolidated income statement from the date of the acquisition. Goodwill will be subject to an annual test for impairment and the amount impaired, if any, will be charged to expense at the time of impairment.
The estimated fair values of the assets and liabilities have not yet been determined. The recorded amounts reflected on the historic financial records of CFB as of December 31, 2017 include total assets of approximately
$330.4 million
, consisting primarily of net loans of
$279.7 million
and interest-bearing deposits of
$36.5 million
. Recorded liabilities totaling approximately
$297.7 million
consisted primarily of deposits totaling
$259.3 million
.
-
57
-
LCNB CORP. AND SUBSIDIARIES
NOTES TO CONSOLIDATED FINANCIAL STATEMENTS
December 31, 2017
(Continued)
The amortized cost and fair value of available-for-sale investment securities at December 31 are summarized as follows (in thousands):
|
Amortized
Cost
|
Unrealized
Gains
|
Unrealized
Losses
|
Fair
Value
|
|||||||||
|
2017
|
||||||||||||
|
Investment Securities Available-for-Sale:
|
||||||||||||
|
U.S. Treasury notes
|
$
|
2,283
|
|
—
|
|
24
|
|
2,259
|
|
|||
|
U.S. Agency notes
|
84,837
|
|
57
|
|
1,633
|
|
83,261
|
|
||||
|
U.S. Agency mortgage-backed securities
|
68,347
|
|
33
|
|
1,227
|
|
67,153
|
|
||||
|
Municipal securities:
|
|
|
|
|
|
|
|
|
||||
|
Non-taxable
|
102,849
|
|
343
|
|
1,018
|
|
102,174
|
|
||||
|
Taxable
|
20,313
|
|
175
|
|
122
|
|
20,366
|
|
||||
|
Mutual funds
|
2,586
|
|
2
|
|
46
|
|
2,542
|
|
||||
|
Trust preferred securities
|
49
|
|
1
|
|
—
|
|
50
|
|
||||
|
Equity securities
|
574
|
|
97
|
|
4
|
|
667
|
|
||||
|
|
$
|
281,838
|
|
708
|
|
4,074
|
|
278,472
|
|
|||
|
Investment Securities Held-to-Maturity:
|
||||||||||||
|
Municipal securities:
|
||||||||||||
|
Non-taxable
|
$
|
28,871
|
|
101
|
|
227
|
|
28,745
|
|
|||
|
Taxable
|
3,700
|
|
—
|
|
95
|
|
3,605
|
|
||||
|
$
|
32,571
|
|
101
|
|
322
|
|
32,350
|
|
||||
|
2016
|
||||||||||||
|
Investment Securities Available-for-Sale:
|
||||||||||||
|
U.S. Treasury notes
|
$
|
28,180
|
|
41
|
|
76
|
|
28,145
|
|
|||
|
U.S. Agency notes
|
87,098
|
|
150
|
|
1,848
|
|
85,400
|
|
||||
|
U.S. Agency mortgage-backed securities
|
72,402
|
|
89
|
|
1,444
|
|
71,047
|
|
||||
|
Municipal securities:
|
|
|
|
|
|
|
|
|
||||
|
Non-taxable
|
114,064
|
|
574
|
|
1,623
|
|
113,015
|
|
||||
|
Taxable
|
19,710
|
|
220
|
|
85
|
|
19,845
|
|
||||
|
Mutual funds
|
2,527
|
|
—
|
|
45
|
|
2,482
|
|
||||
|
Trust preferred securities
|
49
|
|
—
|
|
1
|
|
48
|
|
||||
|
Equity securities
|
632
|
|
55
|
|
10
|
|
677
|
|
||||
|
|
$
|
324,662
|
|
1,129
|
|
5,132
|
|
320,659
|
|
|||
|
Investment Securities Held-to-Maturity:
|
||||||||||||
|
Municipal securities:
|
||||||||||||
|
Non-taxable
|
$
|
31,015
|
|
56
|
|
352
|
|
30,719
|
|
|||
|
Taxable
|
9,988
|
|
—
|
|
217
|
|
9,771
|
|
||||
|
$
|
41,003
|
|
56
|
|
569
|
|
40,490
|
|
||||
-
58
-
LCNB CORP. AND SUBSIDIARIES
NOTES TO CONSOLIDATED FINANCIAL STATEMENTS
December 31, 2017
(Continued)
NOTE 3 -
INVESTMENT SECURITIES
(Continued)
Information concerning securities with gross unrealized losses at
December 31, 2017
and
2016
, aggregated by length of time that individual securities have been in a continuous loss position, is as follows (in thousands):
|
|
Less Than Twelve Months
|
Twelve Months or More
|
||||||||||
|
|
Fair
Value
|
Unrealized
Losses
|
Fair
Value
|
Unrealized
Losses
|
||||||||
|
2017
|
||||||||||||
|
Investment Securities Available-for-Sale:
|
||||||||||||
|
U.S. Treasury notes
|
$
|
2,259
|
|
24
|
|
—
|
|
—
|
|
|||
|
U.S. Agency notes
|
33,651
|
|
344
|
|
44,560
|
|
1,289
|
|
||||
|
U.S. Agency mortgage-backed securities
|
24,433
|
|
142
|
|
41,080
|
|
1,085
|
|
||||
|
Municipal securities:
|
|
|
|
|
|
|
||||||
|
Non-taxable
|
36,348
|
|
315
|
|
24,197
|
|
703
|
|
||||
|
Taxable
|
11,068
|
|
114
|
|
1,032
|
|
8
|
|
||||
|
Mutual funds
|
—
|
|
—
|
|
1,519
|
|
46
|
|
||||
|
Trust preferred securities
|
—
|
|
—
|
|
—
|
|
—
|
|
||||
|
Equity securities
|
119
|
|
2
|
|
17
|
|
2
|
|
||||
|
|
$
|
107,878
|
|
941
|
|
112,405
|
|
3,133
|
|
|||
|
Investment Securities Held-to-Maturity:
|
||||||||||||
|
Municipal securities:
|
||||||||||||
|
Non-taxable
|
$
|
9,824
|
|
133
|
|
3,542
|
|
94
|
|
|||
|
Taxable
|
—
|
|
—
|
|
3,205
|
|
95
|
|
||||
|
$
|
9,824
|
|
133
|
|
6,747
|
|
189
|
|
||||
|
2016
|
||||||||||||
|
Investment Securities Available-for-Sale:
|
||||||||||||
|
U.S. Treasury notes
|
$
|
16,076
|
|
76
|
|
—
|
|
—
|
|
|||
|
U.S. Agency notes
|
69,784
|
|
1,848
|
|
—
|
|
—
|
|
||||
|
U.S. Agency mortgage-backed securities
|
64,564
|
|
1,310
|
|
3,518
|
|
134
|
|
||||
|
Municipal securities:
|
||||||||||||
|
Non-taxable
|
72,867
|
|
1,621
|
|
451
|
|
2
|
|
||||
|
Taxable
|
9,721
|
|
82
|
|
450
|
|
3
|
|
||||
|
Mutual funds
|
1,205
|
|
37
|
|
277
|
|
8
|
|
||||
|
Trust preferred securities
|
49
|
|
1
|
|
—
|
|
—
|
|
||||
|
Equity securities
|
201
|
|
10
|
|
—
|
|
—
|
|
||||
|
$
|
234,467
|
|
4,985
|
|
4,696
|
|
147
|
|
||||
|
Investment Securities Held-to-Maturity:
|
||||||||||||
|
Municipal securities:
|
||||||||||||
|
Non-taxable
|
$
|
20,429
|
|
251
|
|
2,564
|
|
101
|
|
|||
|
Taxable
|
8,030
|
|
217
|
|
—
|
|
—
|
|
||||
|
$
|
28,459
|
|
468
|
|
2,564
|
|
101
|
|
||||
Management has determined that the unrealized losses at
December 31, 2017
are primarily due to fluctuations in market interest rates and do not reflect credit quality deterioration of the securities. Because the Company does not have the intent to sell the investments and it is more likely than not that the Company will not be required to sell the investments before recovery of their amortized cost, the Company does not consider these investments to be other-than-temporarily impaired.
-
59
-
LCNB CORP. AND SUBSIDIARIES
NOTES TO CONSOLIDATED FINANCIAL STATEMENTS
December 31, 2017
(Continued)
NOTE 3 -
INVESTMENT SECURITIES
(Continued)
Contractual maturities of investment securities at
December 31, 2017
were as follows (in thousands). Actual maturities may differ from contractual maturities when issuers have the right to call or prepay obligations.
|
|
Available-for-Sale
|
Held-to-Maturity
|
||||||||||
|
Amortized
Cost
|
Fair
Value
|
Amortized
Cost
|
Fair
Value
|
|||||||||
|
Due within one year
|
$
|
11,222
|
|
11,267
|
|
4,043
|
|
4,047
|
|
|||
|
Due from one to five years
|
92,900
|
|
92,453
|
|
4,128
|
|
4,045
|
|
||||
|
Due from five to ten years
|
102,520
|
|
100,836
|
|
8,415
|
|
8,286
|
|
||||
|
Due after ten years
|
3,640
|
|
3,504
|
|
15,985
|
|
15,972
|
|
||||
|
|
210,282
|
|
208,060
|
|
32,571
|
|
32,350
|
|
||||
|
U.S. Agency mortgage-backed securities
|
68,347
|
|
67,153
|
|
—
|
|
—
|
|
||||
|
Mutual funds
|
2,586
|
|
2,542
|
|
—
|
|
—
|
|
||||
|
Trust preferred securities
|
49
|
|
50
|
|
—
|
|
—
|
|
||||
|
Equity securities
|
574
|
|
667
|
|
—
|
|
—
|
|
||||
|
|
$
|
281,838
|
|
278,472
|
|
32,571
|
|
32,350
|
|
|||
Investment securities with a market value of
$108,751,000
and
$149,990,000
at
December 31, 2017
and
2016
, respectively, were pledged to secure public deposits and for other purposes required or permitted by law.
Certain information concerning the sale of investment securities available-for-sale for the years ended December 31 was as follows (in thousands):
|
|
2017
|
2016
|
2015
|
||||||
|
Proceeds from sales
|
$
|
43,246
|
|
92,455
|
|
97,981
|
|
||
|
Gross realized gains
|
247
|
|
1,103
|
|
627
|
|
|||
|
Gross realized losses
|
14
|
|
21
|
|
132
|
|
|||
NOTE 4 -
LOANS
Major classifications of loans at December 31 were as follows (in thousands):
|
|
2017
|
2016
|
||||
|
Commercial and industrial
|
$
|
36,057
|
|
41,878
|
|
|
|
Commercial, secured by real estate
|
527,947
|
|
477,275
|
|
||
|
Residential real estate
|
251,582
|
|
265,788
|
|
||
|
Consumer
|
17,450
|
|
19,173
|
|
||
|
Agricultural
|
15,194
|
|
14,802
|
|
||
|
Other loans, including deposit overdrafts
|
539
|
|
633
|
|
||
|
|
848,769
|
|
819,549
|
|
||
|
Deferred origination costs, net
|
291
|
|
254
|
|
||
|
|
849,060
|
|
819,803
|
|
||
|
Less allowance for loan losses
|
3,403
|
|
3,575
|
|
||
|
Loans-net
|
$
|
845,657
|
|
816,228
|
|
|
-
60
-
LCNB CORP. AND SUBSIDIARIES
NOTES TO CONSOLIDATED FINANCIAL STATEMENTS
December 31, 2017
(Continued)
NOTE 4 -
LOANS
(Continued)
Non-accrual, past-due, and accruing restructured loans at December 31 were as follows (dollars in thousands):
|
|
2017
|
2016
|
||||
|
Non-accrual loans:
|
|
|
||||
|
Commercial and industrial
|
$
|
—
|
|
—
|
|
|
|
Commercial, secured by real estate
|
2,183
|
|
4,312
|
|
||
|
Agricultural
|
178
|
|
334
|
|
||
|
Residential real estate
|
604
|
|
1,079
|
|
||
|
Total non-accrual loans
|
2,965
|
|
5,725
|
|
||
|
Past-due 90 days or more and still accruing
|
—
|
|
23
|
|
||
|
Total non-accrual and past-due 90 days or more and still accruing
|
2,965
|
|
5,748
|
|
||
|
Accruing restructured loans
|
10,469
|
|
11,731
|
|
||
|
Total
|
$
|
13,434
|
|
17,479
|
|
|
|
Percentage of total non-accrual and past-due 90 days or more and still accruing to total loans
|
0.35
|
%
|
0.70
|
%
|
||
|
Percentage of total non-accrual, past-due 90 days or more and still accruing, and accruing restructured loans to total loans
|
1.58
|
%
|
2.13
|
%
|
||
Interest income that would have been recorded during
2017
and
2016
if loans on non-accrual status at
December 31, 2017
and
2016
had been current and in accordance with their original terms was approximately
$202,000
and
$220,000
, respectively.
The Company is not committed to lend additional funds to debtors whose loans have been modified to provide a reduction or deferral of principal or interest because of deterioration in the financial position of the borrower.
-
61
-
LCNB CORP. AND SUBSIDIARIES
NOTES TO CONSOLIDATED FINANCIAL STATEMENTS
December 31, 2017
(Continued)
NOTE 4 -
LOANS
(Continued)
The allowance for loan losses and recorded investment in loans for the years ended December 31 were as follows (in thousands):
|
|
Commercial
& Industrial
|
Commercial,
Secured by
Real Estate
|
Residential
Real Estate
|
Consumer
|
Agricultural
|
Other
|
Total
|
||||||||||||||
|
December 31, 2017
|
|
|
|
|
|
|
|
||||||||||||||
|
Allowance for loan losses:
|
|
|
|
|
|
|
|
||||||||||||||
|
Balance, beginning of year
|
$
|
350
|
|
2,179
|
|
885
|
|
96
|
|
60
|
|
5
|
|
3,575
|
|
||||||
|
Provision charged to expenses
|
(71
|
)
|
348
|
|
(83
|
)
|
(44
|
)
|
(7
|
)
|
72
|
|
215
|
|
|||||||
|
Losses charged off
|
—
|
|
(462
|
)
|
(225
|
)
|
(90
|
)
|
—
|
|
(138
|
)
|
(915
|
)
|
|||||||
|
Recoveries
|
99
|
|
113
|
|
140
|
|
114
|
|
—
|
|
62
|
|
528
|
|
|||||||
|
Balance, end of year
|
$
|
378
|
|
2,178
|
|
717
|
|
76
|
|
53
|
|
1
|
|
3,403
|
|
||||||
|
Individually evaluated for impairment
|
$
|
8
|
|
146
|
|
29
|
|
8
|
|
—
|
|
—
|
|
191
|
|
||||||
|
Collectively evaluated for impairment
|
370
|
|
2,032
|
|
688
|
|
68
|
|
53
|
|
1
|
|
3,212
|
|
|||||||
|
Acquired credit impaired loans
|
—
|
|
—
|
|
—
|
|
—
|
|
—
|
|
—
|
|
—
|
|
|||||||
|
Balance, end of year
|
$
|
378
|
|
2,178
|
|
717
|
|
76
|
|
53
|
|
1
|
|
3,403
|
|
||||||
|
Loans:
|
|
|
|
|
|
|
|
|
|
|
|
|
|
|
|||||||
|
Individually evaluated for impairment
|
$
|
303
|
|
11,289
|
|
1,351
|
|
47
|
|
177
|
|
—
|
|
13,167
|
|
||||||
|
Collectively evaluated for impairment
|
34,792
|
|
512,259
|
|
248,674
|
|
17,516
|
|
15,033
|
|
137
|
|
828,411
|
|
|||||||
|
Acquired credit impaired loans
|
1,008
|
|
4,048
|
|
2,024
|
|
—
|
|
—
|
|
402
|
|
7,482
|
|
|||||||
|
Balance, end of year
|
$
|
36,103
|
|
527,596
|
|
252,049
|
|
17,563
|
|
15,210
|
|
539
|
|
849,060
|
|
||||||
|
December 31, 2016
|
|
|
|
|
|
|
|
|
|
|
|
|
|
|
|||||||
|
Allowance for loan losses:
|
|
|
|
|
|
|
|
|
|
|
|
|
|
|
|||||||
|
Balance, beginning of year
|
$
|
244
|
|
1,908
|
|
854
|
|
54
|
|
66
|
|
3
|
|
3,129
|
|
||||||
|
Provision charged to expenses
|
314
|
|
358
|
|
106
|
|
74
|
|
(6
|
)
|
67
|
|
913
|
|
|||||||
|
Losses charged off
|
(234
|
)
|
(185
|
)
|
(127
|
)
|
(85
|
)
|
—
|
|
(119
|
)
|
(750
|
)
|
|||||||
|
Recoveries
|
26
|
|
98
|
|
52
|
|
53
|
|
—
|
|
54
|
|
283
|
|
|||||||
|
Balance, end of year
|
$
|
350
|
|
2,179
|
|
885
|
|
96
|
|
60
|
|
5
|
|
3,575
|
|
||||||
|
Individually evaluated for impairment
|
$
|
9
|
|
55
|
|
100
|
|
13
|
|
—
|
|
—
|
|
177
|
|
||||||
|
Collectively evaluated for impairment
|
341
|
|
1,832
|
|
785
|
|
83
|
|
60
|
|
5
|
|
3,106
|
|
|||||||
|
Acquired credit impaired loans
|
—
|
|
292
|
|
—
|
|
—
|
|
—
|
|
—
|
|
292
|
|
|||||||
|
Balance, end of year
|
$
|
350
|
|
2,179
|
|
885
|
|
96
|
|
60
|
|
5
|
|
3,575
|
|
||||||
|
Loans:
|
|
|
|
|
|
|
|
|
|
|
|
|
|
|
|||||||
|
Individually evaluated for impairment
|
$
|
337
|
|
12,580
|
|
1,518
|
|
52
|
|
334
|
|
—
|
|
14,821
|
|
||||||
|
Collectively evaluated for impairment
|
41,466
|
|
458,059
|
|
262,266
|
|
19,192
|
|
14,475
|
|
178
|
|
795,636
|
|
|||||||
|
Acquired credit impaired loans
|
98
|
|
6,305
|
|
2,471
|
|
17
|
|
—
|
|
455
|
|
9,346
|
|
|||||||
|
Balance, end of year
|
$
|
41,901
|
|
476,944
|
|
266,255
|
|
19,261
|
|
14,809
|
|
633
|
|
819,803
|
|
||||||
-
62
-
LCNB CORP. AND SUBSIDIARIES
NOTES TO CONSOLIDATED FINANCIAL STATEMENTS
December 31, 2017
(Continued)
NOTE 4 -
LOANS
(Continued)
|
|
Commercial
& Industrial
|
Commercial,
Secured by
Real Estate
|
Residential
Real Estate
|
Consumer
|
Agricultural
|
Other
|
Total
|
||||||||||||||
|
December 31, 2015
|
|
|
|
|
|
|
|
||||||||||||||
|
Allowance for loan losses:
|
|
|
|
|
|
|
|
||||||||||||||
|
Balance, beginning of year
|
$
|
129
|
|
1,990
|
|
926
|
|
63
|
|
11
|
|
2
|
|
3,121
|
|
||||||
|
Provision charged to expenses
|
208
|
|
955
|
|
125
|
|
(17
|
)
|
55
|
|
40
|
|
1,366
|
|
|||||||
|
Losses charged off
|
(100
|
)
|
(1,133
|
)
|
(304
|
)
|
(52
|
)
|
(67
|
)
|
(74
|
)
|
(1,730
|
)
|
|||||||
|
Recoveries
|
7
|
|
96
|
|
107
|
|
60
|
|
67
|
|
35
|
|
372
|
|
|||||||
|
Balance, end of year
|
$
|
244
|
|
1,908
|
|
854
|
|
54
|
|
66
|
|
3
|
|
3,129
|
|
||||||
|
Individually evaluated for impairment
|
$
|
9
|
|
306
|
|
48
|
|
—
|
|
—
|
|
—
|
|
363
|
|
||||||
|
Collectively evaluated for impairment
|
235
|
|
1,602
|
|
806
|
|
54
|
|
66
|
|
3
|
|
2,766
|
|
|||||||
|
Acquired credit impaired loans
|
—
|
|
—
|
|
—
|
|
—
|
|
—
|
|
—
|
|
—
|
|
|||||||
|
Balance, end of year
|
$
|
244
|
|
1,908
|
|
854
|
|
54
|
|
66
|
|
3
|
|
3,129
|
|
||||||
The risk characteristics of LCNB's material loan portfolio segments were as follows:
Commercial and Industrial Loans.
LCNB’s commercial and industrial loan portfolio consists of loans for various purposes, including loans to fund working capital requirements (such as inventory and receivables financing) and purchases of machinery and equipment. LCNB offers a variety of commercial and industrial loan arrangements, including term loans, balloon loans, and lines of credit. Most commercial and industrial loans have a variable rate, with adjustment periods ranging from
one month
to
five years
. Adjustments are generally based on a publicly available index rate plus a margin. The margin varies based on the terms and collateral securing the loan. Commercial and industrial loans are offered to businesses and professionals for short and medium terms on both a collateralized and uncollateralized basis. Commercial and industrial loans typically are underwritten on the basis of the borrower’s ability to make repayment from the cash flow of the business. Collateral, when obtained, may include liens on furniture, fixtures, equipment, inventory, receivables, or other assets. As a result, such loans involve complexities, variables, and risks that require thorough underwriting and more robust servicing than other types of loans.
Commercial, Secured by Real Estate Loans.
Commercial real estate loans include loans secured by a variety of commercial, retail, and office buildings, religious facilities, multifamily (more than two-family) residential properties, construction and land development loans, and other land loans. Commercial real estate loan products generally amortize over
five
to
twenty-five
years and are payable in monthly principal and interest installments. Some have balloon payments due within
one
to
ten
years after the origination date. Many have adjustable interest rates with adjustment periods ranging from
one
to
ten
years, some of which are subject to established “floor” interest rates.
Commercial real estate loans are underwritten based on the ability of the property, in the case of income producing property, or the borrower’s business to generate sufficient cash flow to amortize the debt. Secondary emphasis is placed upon global debt service, collateral value, financial strength of any guarantors, and other factors. Commercial real estate loans are generally originated with a
75%
to
80%
maximum loan to appraised value ratio, depending upon borrower occupancy.
Residential Real Estate Loans.
Residential real estate loans include loans secured by first or second mortgage liens on one to two-family residential property. Home equity lines of credit and mortgage loans secured by owner-occupied agricultural property are included in this category. First and second mortgage loans are generally amortized over
five
to
thirty
years with monthly principal and interest payments. Home equity lines of credit generally have a
five
year draw period with interest only payments followed by a repayment period with monthly payments based on the amount outstanding. LCNB offers both fixed and adjustable rate mortgage loans. Adjustable rate loans are available with adjustment periods ranging between
one
to
ten years
and adjust according to an established index plus a margin, subject to certain floor and ceiling rates. Home equity lines of credit have a variable rate based on the Wall Street Journal prime rate plus a margin.
LCNB does not originate reverse mortgage loans or residential real estate loans generally considered to be “subprime.”
-
63
-
LCNB CORP. AND SUBSIDIARIES
NOTES TO CONSOLIDATED FINANCIAL STATEMENTS
December 31, 2017
(Continued)
NOTE 4 -
LOANS
(Continued)
Residential real estate loans are underwritten primarily based on the borrower’s ability to repay, prior credit history, and the value of the collateral. LCNB requires private mortgage insurance for first mortgage loans that have a loan to appraised value ratio of greater than
80%
.
Consumer Loans.
LCNB’s portfolio of consumer loans generally includes secured and unsecured loans to individuals for household, family and other personal expenditures. Secured loans include loans to fund the purchase of automobiles, recreational vehicles, boats, and similar acquisitions. Consumer loans made by LCNB generally have fixed rates and terms ranging up to
72
months, depending upon the nature of the collateral, size of the loan, and other relevant factors.
Consumer loans generally have higher interest rates, but pose additional risks of collectibility and loss when compared to certain other types of loans. Collateral, if present, is generally subject to damage, wear, and depreciation. The borrower’s ability to repay is of primary importance in the underwriting of consumer loans.
Agricultural Loans.
LCNB’s portfolio of agricultural loans includes loans for financing agricultural production or for financing the purchase of equipment used in the production of agricultural products. LCNB’s agricultural loans are generally secured by farm machinery, livestock, crops, vehicles, or other agricultural-related collateral.
The Company uses a risk-rating system to quantify loan quality. A loan is assigned to a risk category based on relevant information about the ability of the borrower to service the debt including, but not limited to, current financial information, historical payment experience, credit documentation, public information, and current economic trends. The categories used are:
|
•
|
Pass – loans categorized in this category are higher quality loans that do not fit any of the other categories described below.
|
|
•
|
Other Assets Especially Mentioned (OAEM) - loans in this category are currently protected but are potentially weak. These loans constitute a risk but not to the point of justifying a classification of substandard. The credit risk may be relatively minor yet constitute an undue risk in light of the circumstances surrounding a specific asset.
|
|
•
|
Substandard – loans in this category are inadequately protected by the current sound net worth and paying capacity of the obligor or of the collateral pledged, if any. Assets so classified must have a well-defined weakness or weaknesses that jeopardize the liquidation of the debt. They are characterized by the possibility that the Company will sustain some loss if the deficiencies are not corrected.
|
|
•
|
Doubtful – loans classified in this category have all the weaknesses inherent in loans classified substandard with the added characteristic that the weaknesses make collection or liquidation in full, on the basis of currently existing facts, conditions, and values, highly questionable and improbable.
|
-
64
-
LCNB CORP. AND SUBSIDIARIES
NOTES TO CONSOLIDATED FINANCIAL STATEMENTS
December 31, 2017
(Continued)
NOTE 4 -
LOANS
(Continued)
An analysis of the Company’s loan portfolio by credit quality indicators at December 31 is as follows (in thousands):
|
|
Pass
|
OAEM
|
Substandard
|
Doubtful
|
Total
|
||||||||||
|
December 31, 2017
|
|
|
|
|
|
||||||||||
|
Commercial & industrial
|
$
|
35,683
|
|
176
|
|
244
|
|
—
|
|
36,103
|
|
||||
|
Commercial, secured by real estate
|
506,833
|
|
2,180
|
|
18,583
|
|
—
|
|
527,596
|
|
|||||
|
Residential real estate
|
250,039
|
|
—
|
|
2,010
|
|
—
|
|
252,049
|
|
|||||
|
Consumer
|
17,522
|
|
—
|
|
41
|
|
—
|
|
17,563
|
|
|||||
|
Agricultural
|
14,233
|
|
—
|
|
977
|
|
—
|
|
15,210
|
|
|||||
|
Other
|
539
|
|
—
|
|
—
|
|
—
|
|
539
|
|
|||||
|
Total
|
$
|
824,849
|
|
2,356
|
|
21,855
|
|
—
|
|
849,060
|
|
||||
|
December 31, 2016
|
|
|
|
|
|
|
|
|
|
|
|||||
|
Commercial & industrial
|
$
|
41,178
|
|
304
|
|
419
|
|
—
|
|
41,901
|
|
||||
|
Commercial, secured by real estate
|
443,781
|
|
5,479
|
|
27,684
|
|
—
|
|
476,944
|
|
|||||
|
Residential real estate
|
261,839
|
|
442
|
|
3,974
|
|
—
|
|
266,255
|
|
|||||
|
Consumer
|
19,182
|
|
—
|
|
79
|
|
—
|
|
19,261
|
|
|||||
|
Agricultural
|
13,311
|
|
—
|
|
1,498
|
|
—
|
|
14,809
|
|
|||||
|
Other
|
633
|
|
—
|
|
—
|
|
—
|
|
633
|
|
|||||
|
Total
|
$
|
779,924
|
|
6,225
|
|
33,654
|
|
—
|
|
819,803
|
|
||||
The Company evaluates the loan risk grading system definitions and allowance for loan loss methodology on an ongoing basis. No significant changes were made to either during the past year.
-
65
-
LCNB CORP. AND SUBSIDIARIES
NOTES TO CONSOLIDATED FINANCIAL STATEMENTS
December 31, 2017
(Continued)
NOTE 4 -
LOANS
(Continued)
A loan portfolio aging analysis at December 31 is as follows (in thousands):
|
|
30-59 Days
Past Due
|
60-89 Days
Past Due
|
Greater Than
90 Days
|
Total
Past Due
|
Current
|
Total Loans
Receivable
|
Total Loans Greater Than
90 Days and
Accruing
|
||||||||||||||
|
December 31, 2017
|
|
|
|
|
|
|
|
||||||||||||||
|
Commercial & industrial
|
$
|
—
|
|
—
|
|
—
|
|
—
|
|
36,103
|
|
36,103
|
|
—
|
|
||||||
|
Commercial, secured by real estate
|
124
|
|
—
|
|
598
|
|
722
|
|
526,874
|
|
527,596
|
|
—
|
|
|||||||
|
Residential real estate
|
362
|
|
135
|
|
496
|
|
993
|
|
251,056
|
|
252,049
|
|
—
|
|
|||||||
|
Consumer
|
29
|
|
2
|
|
—
|
|
31
|
|
17,532
|
|
17,563
|
|
—
|
|
|||||||
|
Agricultural
|
—
|
|
—
|
|
177
|
|
177
|
|
15,033
|
|
15,210
|
|
—
|
|
|||||||
|
Other
|
82
|
|
—
|
|
—
|
|
82
|
|
457
|
|
539
|
|
—
|
|
|||||||
|
Total
|
$
|
597
|
|
137
|
|
1,271
|
|
2,005
|
|
847,055
|
|
849,060
|
|
—
|
|
||||||
|
December 31, 2016
|
|
|
|
|
|
|
|
|
|
|
|
|
|
|
|||||||
|
Commercial & industrial
|
$
|
19
|
|
—
|
|
—
|
|
19
|
|
41,882
|
|
41,901
|
|
—
|
|
||||||
|
Commercial, secured by real estate
|
99
|
|
69
|
|
127
|
|
295
|
|
476,649
|
|
476,944
|
|
—
|
|
|||||||
|
Residential real estate
|
686
|
|
80
|
|
727
|
|
1,493
|
|
264,762
|
|
266,255
|
|
20
|
|
|||||||
|
Consumer
|
59
|
|
16
|
|
3
|
|
78
|
|
19,183
|
|
19,261
|
|
3
|
|
|||||||
|
Agricultural
|
125
|
|
—
|
|
—
|
|
125
|
|
14,684
|
|
14,809
|
|
—
|
|
|||||||
|
Other
|
115
|
|
—
|
|
—
|
|
115
|
|
518
|
|
633
|
|
—
|
|
|||||||
|
Total
|
$
|
1,103
|
|
165
|
|
857
|
|
2,125
|
|
817,678
|
|
819,803
|
|
23
|
|
||||||
-
66
-
LCNB CORP. AND SUBSIDIARIES
NOTES TO CONSOLIDATED FINANCIAL STATEMENTS
December 31, 2017
(Continued)
NOTE 4 -
LOANS
(Continued)
Impaired loans for the years ended December 31 were as follows (in thousands):
|
|
Recorded
Investment
|
Unpaid
Principal
Balance
|
Related
Allowance
|
Average
Recorded
Investment
|
Interest
Income
Recognized
|
||||||||||
|
December 31, 2017
|
|
|
|
|
|
||||||||||
|
With no related allowance recorded:
|
|
|
|
|
|
||||||||||
|
Commercial & industrial
|
$
|
1,015
|
|
1,100
|
|
—
|
|
685
|
|
88
|
|
||||
|
Commercial, secured by real estate
|
12,677
|
|
13,608
|
|
—
|
|
14,113
|
|
1,068
|
|
|||||
|
Residential real estate
|
2,822
|
|
3,516
|
|
—
|
|
3,216
|
|
546
|
|
|||||
|
Consumer
|
6
|
|
6
|
|
—
|
|
20
|
|
2
|
|
|||||
|
Agricultural
|
177
|
|
177
|
|
—
|
|
269
|
|
12
|
|
|||||
|
Other
|
402
|
|
554
|
|
—
|
|
441
|
|
55
|
|
|||||
|
Total
|
$
|
17,099
|
|
18,961
|
|
—
|
|
18,744
|
|
1,771
|
|
||||
|
With an allowance recorded:
|
|
|
|
|
|
|
|
|
|
|
|||||
|
Commercial & industrial
|
$
|
296
|
|
301
|
|
8
|
|
311
|
|
18
|
|
||||
|
Commercial, secured by real estate
|
2,660
|
|
2,660
|
|
146
|
|
2,739
|
|
45
|
|
|||||
|
Residential real estate
|
553
|
|
572
|
|
29
|
|
596
|
|
19
|
|
|||||
|
Consumer
|
41
|
|
41
|
|
8
|
|
43
|
|
3
|
|
|||||
|
Agricultural
|
—
|
|
—
|
|
—
|
|
—
|
|
—
|
|
|||||
|
Other
|
—
|
|
—
|
|
—
|
|
—
|
|
—
|
|
|||||
|
Total
|
$
|
3,550
|
|
3,574
|
|
191
|
|
3,689
|
|
85
|
|
||||
|
Total:
|
|
|
|
|
|
|
|
|
|
|
|||||
|
Commercial & industrial
|
$
|
1,311
|
|
1,401
|
|
8
|
|
996
|
|
106
|
|
||||
|
Commercial, secured by real estate
|
15,337
|
|
16,268
|
|
146
|
|
16,852
|
|
1,113
|
|
|||||
|
Residential real estate
|
3,375
|
|
4,088
|
|
29
|
|
3,812
|
|
565
|
|
|||||
|
Consumer
|
47
|
|
47
|
|
8
|
|
63
|
|
5
|
|
|||||
|
Agricultural
|
177
|
|
177
|
|
—
|
|
269
|
|
12
|
|
|||||
|
Other
|
402
|
|
554
|
|
—
|
|
441
|
|
55
|
|
|||||
|
Total
|
$
|
20,649
|
|
22,535
|
|
191
|
|
22,433
|
|
1,856
|
|
||||
-
67
-
LCNB CORP. AND SUBSIDIARIES
NOTES TO CONSOLIDATED FINANCIAL STATEMENTS
December 31, 2017
(Continued)
NOTE 4 -
LOANS
(Continued)
|
|
Recorded
Investment
|
Unpaid
Principal
Balance
|
Related
Allowance
|
Average
Recorded
Investment
|
Interest
Income
Recognized
|
||||||||||
|
December 31, 2016
|
|
|
|
|
|
||||||||||
|
With no related allowance recorded:
|
|
|
|
|
|
||||||||||
|
Commercial & industrial
|
$
|
109
|
|
263
|
|
—
|
|
998
|
|
151
|
|
||||
|
Commercial, secured by real estate
|
14,195
|
|
15,522
|
|
—
|
|
15,274
|
|
1,140
|
|
|||||
|
Residential real estate
|
3,238
|
|
4,286
|
|
—
|
|
3,736
|
|
369
|
|
|||||
|
Consumer
|
26
|
|
27
|
|
—
|
|
37
|
|
29
|
|
|||||
|
Agricultural
|
334
|
|
334
|
|
—
|
|
392
|
|
136
|
|
|||||
|
Other
|
455
|
|
629
|
|
—
|
|
481
|
|
77
|
|
|||||
|
Total
|
$
|
18,357
|
|
21,061
|
|
—
|
|
20,918
|
|
1,902
|
|
||||
|
With an allowance recorded:
|
|
|
|
|
|
|
|
|
|
|
|||||
|
Commercial & industrial
|
$
|
326
|
|
326
|
|
9
|
|
341
|
|
19
|
|
||||
|
Commercial, secured by real estate
|
4,690
|
|
4,946
|
|
347
|
|
4,194
|
|
257
|
|
|||||
|
Residential real estate
|
751
|
|
751
|
|
100
|
|
651
|
|
36
|
|
|||||
|
Consumer
|
43
|
|
43
|
|
13
|
|
43
|
|
3
|
|
|||||
|
Agricultural
|
—
|
|
—
|
|
—
|
|
—
|
|
—
|
|
|||||
|
Other
|
—
|
|
—
|
|
—
|
|
—
|
|
—
|
|
|||||
|
Total
|
$
|
5,810
|
|
6,066
|
|
469
|
|
5,229
|
|
315
|
|
||||
|
Total:
|
|
|
|
|
|
|
|
|
|
|
|||||
|
Commercial & industrial
|
$
|
435
|
|
589
|
|
9
|
|
1,339
|
|
170
|
|
||||
|
Commercial, secured by real estate
|
18,885
|
|
20,468
|
|
347
|
|
19,468
|
|
1,397
|
|
|||||
|
Residential real estate
|
3,989
|
|
5,037
|
|
100
|
|
4,387
|
|
405
|
|
|||||
|
Consumer
|
69
|
|
70
|
|
13
|
|
80
|
|
32
|
|
|||||
|
Agricultural
|
334
|
|
334
|
|
—
|
|
392
|
|
136
|
|
|||||
|
Other
|
455
|
|
629
|
|
—
|
|
481
|
|
77
|
|
|||||
|
Total
|
$
|
24,167
|
|
27,127
|
|
469
|
|
26,147
|
|
2,217
|
|
||||
-
68
-
LCNB CORP. AND SUBSIDIARIES
NOTES TO CONSOLIDATED FINANCIAL STATEMENTS
December 31, 2017
(Continued)
NOTE 4 -
LOANS
(Continued)
|
|
Average
Recorded Investment |
Interest
Income Recognized |
||||
|
December 31, 2015
|
|
|
||||
|
With no related allowance recorded:
|
|
|
||||
|
Commercial & industrial
|
$
|
1,467
|
|
206
|
|
|
|
Commercial, secured by real estate
|
18,575
|
|
2,229
|
|
||
|
Residential real estate
|
4,092
|
|
453
|
|
||
|
Consumer
|
106
|
|
25
|
|
||
|
Agricultural
|
81
|
|
487
|
|
||
|
Other
|
510
|
|
82
|
|
||
|
Total
|
$
|
24,831
|
|
3,482
|
|
|
|
With an allowance recorded:
|
|
|
||||
|
Commercial & industrial
|
$
|
370
|
|
21
|
|
|
|
Commercial, secured by real estate
|
4,007
|
|
114
|
|
||
|
Residential real estate
|
864
|
|
37
|
|
||
|
Consumer
|
—
|
|
—
|
|
||
|
Agricultural
|
—
|
|
—
|
|
||
|
Other
|
—
|
|
—
|
|
||
|
Total
|
$
|
5,241
|
|
172
|
|
|
|
Total:
|
|
|
||||
|
Commercial & industrial
|
$
|
1,837
|
|
227
|
|
|
|
Commercial, secured by real estate
|
22,582
|
|
2,343
|
|
||
|
Residential real estate
|
4,956
|
|
490
|
|
||
|
Consumer
|
106
|
|
25
|
|
||
|
Agricultural
|
81
|
|
487
|
|
||
|
Other
|
510
|
|
82
|
|
||
|
Total
|
$
|
30,072
|
|
3,654
|
|
|
Of the interest income recognized on impaired loans during
2017
,
2016
, and
2015
, approximately
$28,000
,
$51,000
, and
$96,000
, respectively, were recognized on a cash basis. The Company continued to accrue interest on certain loans classified as impaired during
2017
,
2016
, and
2015
because they were restructured or considered well secured and in the process of collection.
-
69
-
LCNB CORP. AND SUBSIDIARIES
NOTES TO CONSOLIDATED FINANCIAL STATEMENTS
December 31, 2017
(Continued)
NOTE 4 -
LOANS
(Continued)
Loan modifications that were classified as troubled debt restructurings during the years ended December 31 were as follows (dollars in thousands):
|
|
2017
|
2016
|
2015
|
|||||||||||||||||||||||||||||
|
|
Number
of Loans |
Pre-Modification Recorded Balance
|
Post-Modification Recorded Balance
|
Number
of Loans |
Pre-Modification Recorded Balance
|
Post-Modification Recorded Balance
|
Number
of Loans |
Pre-Modification Recorded Balance
|
Post-Modification Recorded Balance
|
|||||||||||||||||||||||
|
Commercial and industrial
|
—
|
|
$
|
—
|
|
$
|
—
|
|
—
|
|
$
|
—
|
|
$
|
—
|
|
—
|
|
$
|
—
|
|
$
|
—
|
|
||||||||
|
Commercial, secured by real estate
|
—
|
|
—
|
|
—
|
|
4
|
|
2,142
|
|
2,215
|
|
1
|
|
75
|
|
74
|
|
||||||||||||||
|
Residential real estate
|
1
|
|
18
|
|
9
|
|
6
|
|
139
|
|
139
|
|
7
|
|
217
|
|
221
|
|
||||||||||||||
|
Consumer
|
1
|
|
14
|
|
14
|
|
3
|
|
39
|
|
39
|
|
2
|
|
9
|
|
9
|
|
||||||||||||||
|
|
2
|
|
$
|
32
|
|
$
|
23
|
|
13
|
|
$
|
2,320
|
|
$
|
2,393
|
|
10
|
|
$
|
301
|
|
$
|
304
|
|
||||||||
Each restructured loan is separately negotiated with the borrower and includes terms and conditions that reflect the borrower’s ability to pay the debt as modified. Modifications may include interest only payments for a period of time, temporary or permanent reduction of the loan’s interest rate, capitalization of delinquent interest, or extensions of the maturity date. Post-modification balances of newly restructured troubled debt by type of modification for the years ended December 31 were as follows (in thousands):
|
|
Term Modification
|
Rate Modification
|
Interest Only
|
Principal Forgiveness
|
Combination
|
Total Modifications
|
||||||||||||
|
December 31, 2017
|
|
|
|
|
|
|||||||||||||
|
Commercial & industrial
|
$
|
—
|
|
—
|
|
—
|
|
—
|
|
—
|
|
—
|
|
|||||
|
Commercial, secured by real estate
|
—
|
|
—
|
|
—
|
|
—
|
|
—
|
|
—
|
|
||||||
|
Residential real estate
|
—
|
|
—
|
|
—
|
|
9
|
|
—
|
|
9
|
|
||||||
|
Consumer
|
14
|
|
—
|
|
—
|
|
—
|
|
—
|
|
14
|
|
||||||
|
Total
|
$
|
14
|
|
—
|
|
—
|
|
9
|
|
—
|
|
23
|
|
|||||
|
December 31, 2016
|
|
|
|
|
|
|||||||||||||
|
Commercial & industrial
|
$
|
—
|
|
—
|
|
—
|
|
—
|
|
—
|
|
—
|
|
|||||
|
Commercial, secured by real estate
|
1,539
|
|
—
|
|
304
|
|
—
|
|
372
|
|
2,215
|
|
||||||
|
Residential real estate
|
38
|
|
47
|
|
—
|
|
—
|
|
54
|
|
139
|
|
||||||
|
Consumer
|
—
|
|
28
|
|
—
|
|
—
|
|
11
|
|
39
|
|
||||||
|
Total
|
$
|
1,577
|
|
75
|
|
304
|
|
—
|
|
437
|
|
2,393
|
|
|||||
|
December 31, 2015
|
|
|
|
|
|
|||||||||||||
|
Commercial & industrial
|
$
|
—
|
|
—
|
|
—
|
|
—
|
|
—
|
|
—
|
|
|||||
|
Commercial, secured by real estate
|
74
|
|
—
|
|
—
|
|
—
|
|
—
|
|
74
|
|
||||||
|
Residential real estate
|
221
|
|
—
|
|
—
|
|
—
|
|
—
|
|
221
|
|
||||||
|
Consumer
|
9
|
|
—
|
|
—
|
|
—
|
|
—
|
|
9
|
|
||||||
|
Total
|
$
|
304
|
|
—
|
|
—
|
|
—
|
|
—
|
|
304
|
|
|||||
LCNB is not committed to lend additional funds to borrowers whose loan terms were modified in a troubled debt restructuring.
-
70
-
LCNB CORP. AND SUBSIDIARIES
NOTES TO CONSOLIDATED FINANCIAL STATEMENTS
December 31, 2017
(Continued)
NOTE 4 -
LOANS
(Continued)
There were
no
troubled debt restructurings that subsequently defaulted within twelve months of the restructuring date for the
years
ended December 31,
2016
, and
2015
. Two commercial, secured by real estate loans to the same borrower totaling
$1,236,000
that were modified during the fourth quarter 2016 subsequently defaulted in February 2017.
All troubled debt restructurings are considered impaired loans. The allowance for loan loss on such restructured loans is based on the present value of future expected cash flows.
Approximately
$21,000
of impaired loans without a valuation allowance at
December 31, 2017
consisted of loans that were modified during 2017 and were determined to be troubled debt restructurings.
None
of the impaired loans restructured during 2017 had a valuation allowance at
December 31, 2017
. Approximately
$881,000
of impaired loans without a valuation allowance and
$1,168,000
of impaired loans with a valuation allowance at
December 31, 2016
consisted of loans that were modified during
2016
and were determined to be troubled debt restructurings.
Mortgage loans sold to and serviced for the Federal Home Loan Mortgage Corporation and other investors are not included in the accompanying consolidated balance sheets. The unpaid principal balances of those loans at
December 31, 2017
,
2016
and
2015
were approximately
$92,818,000
,
$100,982,000
, and
$111,837,000
, respectively.
Mortgage servicing right assets are included in core deposit and other intangibles in the consolidated balance sheets. Amortization of mortgage servicing rights is an adjustment to loan servicing income, which is included with other operating income in the consolidated statements of income. Activity in the mortgage servicing rights portfolio during the years ended December 31 was as follows (in thousands):
|
|
2017
|
2016
|
2015
|
||||||
|
Balance, beginning of year
|
$
|
428
|
|
488
|
|
591
|
|
||
|
Amount capitalized to mortgage servicing rights
|
91
|
|
109
|
|
78
|
|
|||
|
Amortization of mortgage servicing rights
|
(123
|
)
|
(169
|
)
|
(181
|
)
|
|||
|
Balance, end of year
|
$
|
396
|
|
428
|
|
488
|
|
||
NOTE 5 -
ACQUIRED CREDIT IMPAIRED LOANS
The following table provides, as of December 31, the major classifications of loans acquired that are accounted for in accordance with FASB ASC 310-30 (in thousands):
|
2017
|
2016
|
|||||
|
Commercial & industrial
|
$
|
1,008
|
|
98
|
|
|
|
Commercial, secured by real estate
|
4,048
|
|
6,305
|
|
||
|
Residential real estate
|
2,024
|
|
2,471
|
|
||
|
Consumer
|
—
|
|
17
|
|
||
|
Agricultural
|
—
|
|
—
|
|
||
|
Other loans, including deposit overdrafts
|
402
|
|
455
|
|
||
|
|
7,482
|
|
9,346
|
|
||
|
Less allowance for loan losses
|
—
|
|
292
|
|
||
|
Loans, net
|
$
|
7,482
|
|
9,054
|
|
|
-
71
-
LCNB CORP. AND SUBSIDIARIES
NOTES TO CONSOLIDATED FINANCIAL STATEMENTS
December 31, 2013
(Continued)
NOTE 5 -
ACQUIRED CREDIT IMPAIRED LOANS
(continued)
The following table provides the outstanding balance and related carrying amount for acquired impaired loans at December 31 (in thousands):
|
2017
|
2016
|
|||||
|
Outstanding balance
|
$
|
9,065
|
|
12,289
|
|
|
|
Carrying amount
|
7,482
|
|
9,346
|
|
||
Activity during
2017
and
2016
for the accretable discount related to acquired impaired loans is as follows (in thousands):
|
2017
|
2016
|
|||||
|
Accretable discount, beginning of year
|
$
|
1,080
|
|
1,503
|
|
|
|
Accretable discount acquired during period
|
—
|
|
—
|
|
||
|
Reclass from nonaccretable discount to accretable discount
|
564
|
|
423
|
|
||
|
Less disposals
|
(170
|
)
|
(5
|
)
|
||
|
Less accretion
|
(805
|
)
|
(841
|
)
|
||
|
Accretable discount, end of year
|
$
|
669
|
|
1,080
|
|
|
NOTE 6 –
OTHER REAL ESTATE OWNED
Other real estate owned includes property acquired through foreclosure or deed-in-lieu of foreclosure and are included in other assets in the consolidated balance sheets. Changes in other real estate owned were as follows (in thousands):
|
|
2017
|
2016
|
||||
|
Balance, beginning of year
|
$
|
—
|
|
846
|
|
|
|
Additions
|
974
|
|
214
|
|
||
|
Reductions due to sales
|
(974
|
)
|
(484
|
)
|
||
|
Reductions due to valuation write downs
|
—
|
|
(576
|
)
|
||
|
Balance, end of year
|
$
|
—
|
|
—
|
|
|
The total recorded investment in residential consumer mortgage loans secured by residential real estate that was in the process of foreclosure at
December 31, 2017
was
$185,000
.
NOTE 7 -
PREMISES AND EQUIPMENT
Premises and equipment at December 31 are summarized as follows (in thousands):
|
|
2017
|
2016
|
||||
|
Land
|
$
|
8,190
|
|
8,277
|
|
|
|
Buildings
|
31,965
|
|
21,400
|
|
||
|
Equipment
|
15,648
|
|
13,065
|
|
||
|
Construction in progress
|
120
|
|
7,362
|
|
||
|
Total
|
55,923
|
|
50,104
|
|
||
|
Less accumulated depreciation
|
20,996
|
|
19,860
|
|
||
|
Premises and equipment, net
|
$
|
34,927
|
|
30,244
|
|
|
Depreciation charged to expense was,
$1,549,000
in
2017
,
$1,210,000
in
2016
, and
$1,427,000
in
2015
.
-
72
-
LCNB CORP. AND SUBSIDIARIES
NOTES TO CONSOLIDATED FINANCIAL STATEMENTS
December 31, 2017
(Continued)
NOTE 8 -
LEASES
Some of the Bank's branches, telephone equipment, and other equipment are leased under agreements expiring at various dates through 2050. These leases are accounted for as operating leases. The leases generally provide for renewal options and most require periodic changes in rental amounts based on various indices. Minimum annual rentals for non-cancelable leases at
December 31, 2017
that have terms in excess of one year were as follows (in thousands):
|
2018
|
$
|
321
|
|
|
2019
|
243
|
|
|
|
2020
|
207
|
|
|
|
2021
|
161
|
|
|
|
2022
|
164
|
|
|
|
Thereafter
|
3,363
|
|
|
|
Total
|
$
|
4,459
|
|
Rental expense for all leased branches and equipment was approximately
$569,000
in
2017
,
$545,000
in
2016
, and
$542,000
in
2015
.
NOTE 9 -
GOODWILL AND OTHER INTANGIBLE ASSETS
There were
no
changes in goodwill during
2017
and
2016
.
Other intangible assets in the consolidated balance sheets at
December 31, 2017
and
2016
were as follows (in thousands):
|
2017
|
2016
|
|||||||||||||||||
|
Gross
Intangible
Assets
|
Accumulated
Amortization
|
Net
Intangible
Assets
|
Gross
Intangible Assets |
Accumulated
Amortization |
Net
Intangible Assets |
|||||||||||||
|
Core deposit intangibles
|
$
|
6,458
|
|
3,055
|
|
3,403
|
|
6,458
|
|
2,304
|
|
4,154
|
|
|||||
|
Mortgage servicing rights
|
1,279
|
|
883
|
|
396
|
|
1,188
|
|
760
|
|
428
|
|
||||||
|
Total
|
$
|
7,737
|
|
3,938
|
|
3,799
|
|
7,646
|
|
3,064
|
|
4,582
|
|
|||||
The estimated aggregate future amortization expense for each of the next five years for intangible assets remaining as of
December 31, 2017
is as follows (in thousands):
|
2018
|
$
|
848
|
|
|
2019
|
829
|
|
|
|
2020
|
815
|
|
|
|
2021
|
800
|
|
|
|
2022
|
224
|
|
|
NOTE 10 -
AFFORDABLE HOUSING TAX CREDIT LIMITED PARTNERSHIPS
LCNB is a limited partner in limited partnerships that sponsor affordable housing projects utilizing the Low Income Housing Tax Credit (LIHTC) pursuant to Section 42 of the Internal Revenue Code. The purpose of the investments is to achieve a satisfactory return on capital, to facilitate the sale of additional affordable housing product offerings, and to assist in achieving goals associated with the Community Reinvestment Act. The primary activities of the limited partnerships include the identification, development, and operation of multi-family housing that is leased to qualifying residential tenants.
-
73
-
LCNB CORP. AND SUBSIDIARIES
NOTES TO CONSOLIDATED FINANCIAL STATEMENTS
December 31, 2017
(Continued)
NOTE 10 -
AFFORDABLE HOUSING TAX CREDIT LIMITED PARTNERSHIPS
(continued)
The following table presents the balances of LCNB's affordable housing tax credit investment and related unfunded commitment at December 31 (in thousands):
|
|
2017
|
2016
|
||||
|
Affordable housing tax credit investment
|
$
|
3,000
|
|
2,000
|
|
|
|
Less amortization
|
231
|
|
93
|
|
||
|
Net affordable housing tax credit investment
|
$
|
2,769
|
|
1,907
|
|
|
|
Unfunded commitment
|
$
|
2,257
|
|
1,617
|
|
|
The net affordable housing tax credit investment is included in other assets and the unfunded commitment is included in accrued interest and other liabilities in the Consolidated Balance Sheets.
LCNB expects to fund the unfunded commitment over
ten
years.
The following table presents other information relating to LCNB's affordable housing tax credit investment for the years indicated (in thousands):
|
Year ended December 31,
|
|||||||||
|
|
2017
|
2016
|
2015
|
||||||
|
Tax credits and other tax benefits recognized
|
$
|
180
|
|
103
|
|
14
|
|
||
|
Tax credit amortization expense included in provision for income taxes
|
138
|
|
81
|
|
12
|
|
|||
NOTE 11 -
TIME DEPOSITS
Contractual maturities of time deposits at
December 31, 2017
were as follows (in thousands):
|
2018
|
$
|
64,454
|
|
|
2019
|
34,893
|
|
|
|
2020
|
49,289
|
|
|
|
2021
|
32,370
|
|
|
|
2022
|
8,667
|
|
|
|
Thereafter
|
2,226
|
|
|
|
|
$
|
191,899
|
|
The aggregate amount of time deposits in denominations of $250,000 or more at December 31,
2017
and
2016
was
$17,759,000
and
$22,410,000
, respectively.
-
74
-
LCNB CORP. AND SUBSIDIARIES
NOTES TO CONSOLIDATED FINANCIAL STATEMENTS
December 31, 2017
(Continued)
NOTE 12 -
BORROWINGS
Funds borrowed from the FHLB at December 31 by year of maturity were as follows (dollars in thousands):
|
Outstanding Balance
|
Average Rate
|
|||||
|
December 31, 2017
|
||||||
|
2018
|
$
|
248
|
|
2.82
|
%
|
|
|
2019
|
55
|
|
2.82
|
%
|
||
|
Total
|
$
|
303
|
|
2.82
|
%
|
|
|
December 31, 2016
|
||||||
|
2017
|
$
|
295
|
|
2.82
|
%
|
|
|
2018
|
248
|
|
2.82
|
%
|
||
|
2019
|
55
|
|
2.82
|
%
|
||
|
Total
|
$
|
598
|
|
2.82
|
%
|
|
All advances from the FHLB are secured by a blanket pledge of the Company’s 1-4 family first lien mortgage loans in the amount of approximately
$217 million
and
$229 million
at
December 31, 2017
and
2016
, respectively. Additionally, the Company was required to hold minimum levels of FHLB stock, based on the outstanding borrowings. Total remaining borrowing capacity, including short-term borrowing arrangements, at
December 31, 2017
was approximately
$56.3 million
. One of the factors limiting remaining borrowing capacity is ownership of FHLB stock. The Company could increase its remaining borrowing capacity by purchasing additional FHLB stock.
Short-term borrowings at December 31 were as follows (dollars in thousands):
|
|
2017
|
2016
|
|||||||||||
|
|
Amount
|
Rate
|
Amount
|
Rate
|
|||||||||
|
Line of credit
|
$
|
—
|
|
—
|
%
|
$
|
—
|
|
—
|
%
|
|||
|
FHLB short-term advance
|
47,000
|
|
1.43
|
%
|
25,000
|
|
0.63
|
%
|
|||||
|
Repurchase agreements
|
—
|
|
—
|
%
|
17,040
|
|
0.10
|
%
|
|||||
|
|
$
|
47,000
|
|
1.43
|
%
|
$
|
42,040
|
|
0.42
|
%
|
|||
At
December 31, 2017
, the Company had short-term borrowing arrangements with
three
financial institutions and the Federal Home Loan Bank of Cincinnati ("FHLB"). The first arrangement is a short-term line of credit for a maximum amount of
$10 million
at the interest rate in effect at the time of the borrowing. The second arrangement provides that the Company can borrow up to
$10 million
in federal funds at the interest rate in effect at the time of the borrowing. The third arrangement is a short-term line of credit for a maximum amount of
$20 million
at an interest rate equal to the lending institution’s federal funds rate plus a spread of
50
basis points.
The Company has two short-term borrowing arrangements with the FHLB - a Cash Management Advance arrangement and a Repo Advance arrangement. Under the terms of the Cash Management Advance program, the Company can borrow up to
$65.3 million
in short-term advances, subject to total remaining borrowing capacity limitations. The Company has the option of selecting a variable rate of interest for up to
90
days or a fixed rate of interest for up to
30
days. This agreement expires on
August 24, 2018
. Under the Repo Advance program, the Company can borrow up to
$65.3 million
in advances, subject to total remaining borrowing capacity limitations, with terms ranging from one day to one year. Prepayment is not permitted. This agreement expires on December 12, 2018. The interest rate for both the Cash Management Advance and Repo Advance programs is the published rate in effect at the time of the advance.
-
75
-
LCNB CORP. AND SUBSIDIARIES
NOTES TO CONSOLIDATED FINANCIAL STATEMENTS
December 31, 2013
(Continued)
NOTE 12 -
BORROWINGS
(continued)
The repurchase agreements product was discontinued in August 2017. Repurchase agreements were an option customers could use in managing their cash positions and matured the next business day after issuance. Repurchase agreements at December 31, 2016 were fully secured by U.S. Agency notes and such collateral securities were held by the Federal Reserve Bank. The maximum amount of outstanding agreements at any month-end during
2017
and
2016
totaled
$16,320,000
and
$18,715,000
, respectively. The average balance through August
2017
was
$10,515,000
and the average balance for 2016 was
$13,891,000
.
As of December 31,
2016
, approximately
$3.1 million
of the now discontinued repurchase agreements outstanding were held by a company owned by a member of the Company’s Board of Directors.
NOTE 13 -
INCOME TAXES
The provision for federal income taxes consists of (in thousands):
|
|
2017
|
2016
|
2015
|
||||||
|
Income taxes currently payable
|
$
|
3,018
|
|
3,515
|
|
4,280
|
|
||
|
Revaluation of net deferred tax liability
|
(224
|
)
|
—
|
|
—
|
|
|||
|
Deferred income tax provision (benefit)
|
1,478
|
|
928
|
|
(58
|
)
|
|||
|
Provision for income taxes
|
$
|
4,272
|
|
4,443
|
|
4,222
|
|
||
A reconciliation between the statutory income tax and the Company's effective tax rate follows:
|
|
2017
|
2016
|
2015
|
|||||
|
Statutory tax rate
|
34.0
|
%
|
34.0
|
%
|
34.0
|
%
|
||
|
Increase (decrease) resulting from -
|
|
|
|
|
|
|
||
|
Tax exempt interest
|
(6.0
|
)%
|
(6.3
|
)%
|
(6.0
|
)%
|
||
|
Tax exempt income on bank owned life insurance
|
(1.7
|
)%
|
(1.5
|
)%
|
(1.4
|
)%
|
||
|
Revaluation of net deferred tax liability
|
(1.3
|
)%
|
—
|
%
|
—
|
%
|
||
|
Captive insurance premium income
|
(0.9
|
)%
|
—
|
%
|
—
|
%
|
||
|
Other – net
|
0.7
|
%
|
0.1
|
%
|
0.3
|
%
|
||
|
Effective tax rate
|
24.8
|
%
|
26.3
|
%
|
26.9
|
%
|
||
-
76
-
LCNB CORP. AND SUBSIDIARIES
NOTES TO CONSOLIDATED FINANCIAL STATEMENTS
December 31, 2017
(Continued)
NOTE 13 -
INCOME TAXES
(continued)
Deferred tax assets and liabilities, included in the Consolidated Balance Sheets with accrued interest and other liabilities in 2017 and other assets in 2016, consist of the following at December 31 (in thousands):
|
|
2017
|
2016
|
||||
|
Deferred tax assets:
|
|
|
||||
|
Allowance for loan losses
|
$
|
715
|
|
1,223
|
|
|
|
Net unrealized losses on investment securities available-for-sale
|
707
|
|
1,369
|
|
||
|
Fair value adjustment on loans acquired from merger with First Capital
|
238
|
|
592
|
|
||
|
Pension and deferred compensation
|
760
|
|
1,157
|
|
||
|
Other
|
471
|
|
546
|
|
||
|
|
2,891
|
|
4,887
|
|
||
|
Deferred tax liabilities:
|
|
|
|
|
||
|
Depreciation of premises and equipment
|
(1,672
|
)
|
(1,332
|
)
|
||
|
Amortization of intangibles
|
(1,030
|
)
|
(1,567
|
)
|
||
|
Prepaid expenses
|
(210
|
)
|
—
|
|
||
|
Deferred loan fees
|
(1
|
)
|
(2
|
)
|
||
|
FHLB stock dividends
|
(216
|
)
|
(351
|
)
|
||
|
Fair value adjustment on securities acquired from merger with First Capital
|
(9
|
)
|
(19
|
)
|
||
|
|
(3,138
|
)
|
(3,271
|
)
|
||
|
Net deferred tax (liabilities) assets
|
$
|
(247
|
)
|
1,616
|
|
|
As of
December 31, 2017
and
2016
there were
no
unrecognized tax benefits and the Company does not anticipate the total amount of unrecognized tax benefits will significantly change within the next twelve months. There were
no
amounts recognized for interest and penalties in the consolidated statements of income for the three-year period ended
December 31, 2017
.
The Company is no longer subject to examination by federal tax authorities for years before 2014.
The Tax Cuts and Jobs Act ("Tax Act") was enacted on December 22, 2017. Among other changes, the Tax Act reduces the US Federal corporate tax rate from 35% to 21%. At December 31, 2017, the Company has substantially completed its accounting for the tax effects of enactment of the Tax Act. For deferred tax assets and liabilities, amounts were remeasured based on the rates expected to reverse in the future, which is now 21%. The Company continues to analyze certain aspects of the Tax Act and further refinements are possible, which could potentially affect the measurement of these balances or potentially give rise to new deferred tax amounts, although LCNB management does not expect these adjustments to materially impact its financial statements.
NOTE 14 -
COMMITMENTS AND CONTINGENT LIABILITIES
LCNB is a party to financial instruments with off-balance-sheet risk in the normal course of business to meet the financing needs of its customers. These financial instruments include commitments to extend credit. They involve, to varying degrees, elements of credit and interest rate risk in excess of the amount recognized in the balance sheets. The Company's exposure to credit loss in the event of nonperformance by the other party to the financial instrument for commitments to extend credit is represented by the contract amount of those instruments.
The Bounce Protection product, a customer deposit overdraft program, is offered as a service and does not constitute a contract between the customer and LCNB.
-
77
-
LCNB CORP. AND SUBSIDIARIES
NOTES TO CONSOLIDATED FINANCIAL STATEMENTS
December 31, 2017
(Continued)
NOTE 14 -
COMMITMENTS AND CONTINGENT LIABILITIES
(continued)
LCNB uses the same credit policies in making commitments and conditional obligations as it does for on-balance-sheet instruments.
Financial instruments whose contract amounts represent off-balance-sheet credit risk at December 31 were as follows (in thousands):
|
2017
|
2016
|
|||||
|
Commitments to extend credit:
|
||||||
|
Commercial loans
|
$
|
18,964
|
|
10,350
|
|
|
|
Other loans:
|
||||||
|
Fixed rate
|
2,747
|
|
4,425
|
|
||
|
Adjustable rate
|
1,150
|
|
1,044
|
|
||
|
Unused lines of credit:
|
||||||
|
Fixed rate
|
20,984
|
|
9,731
|
|
||
|
Adjustable rate
|
90,147
|
|
80,222
|
|
||
|
Unused overdraft protection amounts on demand and NOW accounts
|
16,441
|
|
17,123
|
|
||
|
Standby letters of credit
|
294
|
|
657
|
|
||
|
$
|
150,727
|
|
123,552
|
|
||
Commitments to extend credit are agreements to lend to a customer as long as there is no violation of any condition established in the contract or agreement. Unused lines of credit include amounts not drawn on line of credit loans. Commitments to extend credit and unused lines of credit generally have fixed expiration dates or other termination clauses.
Standby letters of credit are conditional commitments issued to guarantee the performance of a customer to a third party. These guarantees generally are fully secured and have varying maturities.
The Company evaluates each customer’s credit worthiness on a case-by-case basis. The amount of collateral obtained, if deemed necessary by the Company, is based on management’s credit evaluation of the borrower. Collateral held varies, but may include accounts receivable; inventory; property, plant and equipment; residential realty; and income-producing commercial properties.
Capital expenditures include the construction or acquisition of new office buildings, improvements to LCNB's offices, purchases of furniture and equipment, and additions or improvements to LCNB's information technology system. Commitments outstanding for capital expenditures as of
December 31, 2017
totaled approximately
$40,000
.
The Company and the Bank are parties to various claims and proceedings arising in the normal course of business. Management, after consultation with legal counsel, believes that the liabilities, if any, arising from such proceedings and claims will not be material to LCNB's consolidated financial position or results of operations.
-
78
-
LCNB CORP. AND SUBSIDIARIES
NOTES TO CONSOLIDATED FINANCIAL STATEMENTS
December 31, 2017
(Continued)
NOTE 15 -
REGULATORY MATTERS
The Federal Reserve Act requires depository institutions to maintain cash reserves with the Federal Reserve Bank. In
2017
and
2016
, the Bank maintained average reserve balances of
$7,924,000
and
$10,903,000
, respectively. The reserve balances at December 31,
2017
and
2016
were
$1,422,000
and
$4,313,000
, respectively.
The principal source of income and funds for LCNB Corp. is dividends paid by the Bank. The payment of dividends is subject to restriction by regulatory authorities. For
2018
, the restrictions generally limit dividends to the aggregate of net income for the year
2018
plus the net earnings retained for
2017
and
2016
. In addition, dividend payments may not reduce capital levels below minimum regulatory guidelines. At
December 31, 2017
, approximately
$18,865,000
of the Bank’s earnings retained was available for dividends in
2018
under this guideline. Dividends in excess of these limitations would require the prior approval of the Comptroller of the Currency.
The Company (consolidated) and the Bank must meet certain minimum capital requirements set by federal banking agencies. Failure to meet minimum capital requirements can initiate certain mandatory and possible additional discretionary actions by regulators that, if undertaken, could have a material effect on the Company's and Bank's financial statements. The Company’s and Bank’s capital amounts and classification are also subject to qualitative judgments by regulators about components, risk weightings, and other factors.
A new rule requiring a Capital Conservation Buffer began phase-in on January 1, 2016 and will be fully implemented at the beginning of 2019. Under the fully-implemented rule, a financial institution will need to maintain a Capital Conservation Buffer composed of Common Equity Tier 1 Capital of at least
2.5%
above its minimum risk-weighted capital requirements to avoid limitations on its ability to make capital distributions, including dividend payments to shareholders and certain discretionary bonus payments to executive officers. A financial institution with a buffer below
2.5%
will be subject to increasingly stringent limitations on capital distributions as the buffer approaches zero.
For various regulatory purposes, financial institutions are classified into categories based upon capital adequacy:
|
|
Minimum
Requirement
|
Minimum Requirement with Capital Conservation Buffer for 2017
|
To Be Considered
Well-Capitalized
|
|||||
|
Ratio of Common Equity Tier 1 Capital to risk-weighted assets
|
4.5
|
%
|
5.75
|
%
|
6.5
|
%
|
||
|
Ratio of tier 1 capital to risk-weighted assets
|
6.0
|
%
|
7.25
|
%
|
8.0
|
%
|
||
|
Ratio of total capital (tier 1 capital plus tier 2 capital) to risk-weighted assets
|
8.0
|
%
|
9.25
|
%
|
10.0
|
%
|
||
|
Leverage ratio (tier 1 capital to adjusted quarterly average total assets)
|
4.0
|
%
|
N/A
|
|
5.0
|
%
|
||
As of the most recent notification from their regulators, the Company and Bank were categorized as "well-capitalized" under the regulatory framework for prompt corrective action. Management believes that no conditions or events have occurred since the last notification that would change the Bank's category.
-
79
-
LCNB CORP. AND SUBSIDIARIES
NOTES TO CONSOLIDATED FINANCIAL STATEMENTS
December 31, 2017
(Continued)
NOTE 15 -
REGULATORY MATTERS
(continued)
A summary of the regulatory capital of the Consolidated Company and Bank at December 31 follows (dollars in thousands):
|
|
2017
|
2016
|
||||||||||
|
Consolidated
Company
|
Bank
|
Consolidated
Company
|
Bank
|
|||||||||
|
Regulatory Capital:
|
|
|
|
|
||||||||
|
Shareholders' equity
|
$
|
150,271
|
|
148,163
|
|
142,944
|
|
141,325
|
|
|||
|
Goodwill and other intangible assets
|
(32,906
|
)
|
(32,906
|
)
|
(32,676
|
)
|
(32,676
|
)
|
||||
|
Accumulated other comprehensive loss
|
2,828
|
|
2,859
|
|
2,617
|
|
2,605
|
|
||||
|
Tier 1 risk-based capital
|
120,193
|
|
118,116
|
|
112,885
|
|
111,254
|
|
||||
|
Eligible allowance for loan losses
|
3,403
|
|
3,403
|
|
3,575
|
|
3,575
|
|
||||
|
Total risk-based capital
|
$
|
123,596
|
|
121,519
|
|
116,460
|
|
114,829
|
|
|||
|
Capital Ratios:
|
|
|
|
|
|
|
|
|
||||
|
Common Equity Tier 1 Capital to risk-weighted assets
|
13.29
|
%
|
13.07
|
%
|
13.00
|
%
|
12.82
|
%
|
||||
|
Tier 1 capital to risk-weighted assets
|
13.29
|
%
|
13.07
|
%
|
13.00
|
%
|
12.82
|
%
|
||||
|
Total capital (tier 1 capital plus tier 2 capital) to risk-weighted assets
|
13.66
|
%
|
13.45
|
%
|
13.41
|
%
|
13.24
|
%
|
||||
|
Leverage ratio (tier 1 capital to adjusted quarterly average total assets)
|
9.51
|
%
|
9.36
|
%
|
8.81
|
%
|
8.69
|
%
|
||||
LCNB Corp. filed a Registration Statement on Form S-3 with the SEC on July 27, 2011 to register
400,000
shares for use in its Amended and Restated Dividend Reinvestment and Stock Purchase Plan (the “Amended Plan”). Formerly LCNB purchased the shares needed for its Dividend and Stock Purchase Plan in the secondary market. Under the Amended Plan, LCNB has the option of purchasing shares in the secondary market, using treasury shares, or issuing new shares.
NOTE 16 -
ACCUMULATED OTHER COMPREHENSIVE INCOME (LOSS)
Changes in accumulated other comprehensive income (loss) for
2017
and
2016
were as follows (in thousands):
|
2017
|
2016
|
|||||||||||||||||
|
|
Unrealized Gains and Losses on Available-for-Sale Securities
|
Changes in Pension Plan Assets and Benefit Obligations
|
Total
|
Unrealized Gains and Losses on Available-for-Sale Securities
|
Changes in Pension Plan Assets and Benefit Obligations
|
Total
|
||||||||||||
|
Balance at beginning of year
|
$
|
(2,633
|
)
|
16
|
|
(2,617
|
)
|
469
|
|
(233
|
)
|
236
|
|
|||||
|
Before reclassifications
|
585
|
|
(158
|
)
|
427
|
|
(2,390
|
)
|
249
|
|
(2,141
|
)
|
||||||
|
Reclassifications
|
(152
|
)
|
—
|
|
(152
|
)
|
(712
|
)
|
—
|
|
(712
|
)
|
||||||
|
Balance at end of year
|
$
|
(2,200
|
)
|
(142
|
)
|
(2,342
|
)
|
(2,633
|
)
|
16
|
|
(2,617
|
)
|
|||||
-
80
-
LCNB CORP. AND SUBSIDIARIES
NOTES TO CONSOLIDATED FINANCIAL STATEMENTS
December 31, 2016
(Continued)
NOTE 16 -
ACCUMULATED OTHER COMPREHENSIVE INCOME
(continued)
Reclassifications out of accumulated other comprehensive income (loss) during
2017
and
2016
and the affected line items in the consolidated statements of income were as follows (in thousands):
|
|
2017
|
2016
|
Affected Line Item in the Consolidated Statements of Income
|
|||||
|
Realized gain on sales of securities
|
$
|
233
|
|
1,082
|
|
Net gain on sale of securities
|
||
|
Less provision for income taxes
|
81
|
|
370
|
|
Provision for income taxes
|
|||
|
Reclassification adjustment, net of taxes
|
$
|
152
|
|
712
|
|
|||
NOTE 17 -
RETIREMENT PLANS
Prior to January 1, 2009, the Company had a single-employer qualified noncontributory defined benefit retirement plan that covered substantially all regular full-time employees. Effective January 1, 2009, the Company redesigned the plan and merged it into a multiple-employer plan, which is accounted for as a multi-employer plan because assets contributed by an employer are not segregated in a separate account or restricted to provide benefits only to employees of that employer. Employees hired on or after January 1, 2009 are not eligible to participate in this plan.
Effective February 1, 2009, the Company amended the plan to reduce benefits for those whose age plus vesting service equaled less than
65
at that date. Also effective February 1, 2009, an enhanced 401(k) plan was made available to those hired on or after January 1, 2009 and to those who received benefit reductions from the amendments to the noncontributory defined benefit retirement plan. Employees hired on or after January 1, 2009 receive a
50%
employer match on their contributions into the 401(k) plan, up to a maximum company contribution of
3%
of each individual employee’s annual compensation. Employees who received a benefit reduction under the retirement plan amendments receive an automatic contribution of
5%
or
7%
of annual compensation, depending on the sum of an employee’s age and vesting service, into the 401(k) plan, regardless of the contributions made by the employees. This contribution is made annually and these employees will not receive any employer matches to their 401(k) contributions.
Certain information pertaining to the qualified noncontributory defined benefit retirement plan is as follows:
|
Legal name
|
|
Pentegra Defined Benefit Plan for Financial Institutions
|
|
Plan's employer identification number
|
|
13-5645888
|
|
Plan number
|
|
333
|
The plan is at least
80%
funded as of July 1,
2017
and
2016
. A funding improvement or rehabilitation plan has not been implemented, nor has a surcharge been paid to the plan. The Company’s contributions to the qualified noncontributory defined benefit retirement plan do not represent more than
5%
of total contributions to the plan.
Funding and administrative costs of the qualified noncontributory defined benefit retirement plan and 401(k) plan charged to salaries and employee benefits in the consolidated statements of income for the years ended December 31 were as follows (in thousands):
|
|
2017
|
2016
|
2015
|
||||||
|
Qualified noncontributory defined benefit retirement plan
|
$
|
1,054
|
|
969
|
|
984
|
|
||
|
401(k) plan
|
374
|
|
359
|
|
346
|
|
|||
The Company expects a minimum contribution of $
224,000
to the qualified noncontributory defined benefit retirement plan in
2018
. The Company expects to contribute $
426,000
to the 401(k) plan in
2018
.
-
81
-
LCNB CORP. AND SUBSIDIARIES
NOTES TO CONSOLIDATED FINANCIAL STATEMENTS
December 31, 2017
(Continued)
NOTE 17 -
RETIREMENT PLANS
(continued)
Citizens National had a qualified noncontributory defined benefit pension plan which covered employees hired before May 1, 2005. The Company assumed this plan at the time of the merger. At
December 31, 2017
, the amount of the liability for this plan was
$128,000
, representing the funded status of the plan.
The Bank has a benefit plan which permits eligible officers to defer a portion of their compensation. The deferred compensation balance, which accrues interest at
8%
annually, is distributable in cash after retirement or termination of employment. The amount of such deferred compensation liability at
December 31, 2017
and
2016
was
$3,406,000
and
$3,407,000
, respectively.
The Bank also has supplemental income plans which provide certain employees an amount based on a percentage of average compensation, payable in accordance with individually defined schedules upon retirement. The projected benefit obligation included in other liabilities for the supplemental income plans at
December 31, 2017
and
2016
is
$1,249,000
and
$1,284,000
, respectively. The average discount rate used to determine the present value of the obligations was approximately
5.2%
in
2017
and
5.2%
in
2016
. The service cost associated with the plans was
$0
for
2017
,
$0
for
2016
, and
$183,000
for
2015
. Interest costs were
$62,000
,
$63,000
, and
$56,000
for
2017
,
2016
, and
2015
, respectively.
The deferred compensation plan and supplemental income plans are nonqualified and unfunded. Participation in each plan is limited to a select group of management.
Effective February 1, 2009, the Company established a nonqualified defined benefit retirement plan, which is also unfunded, for certain highly compensated employees. The nonqualified plan ensures that participants receive the full amount of benefits to which they would have been entitled under the noncontributory defined benefit retirement plan in the absence of limits on benefit levels imposed by certain sections of the Internal Revenue Code.
The components of net periodic pension cost of the nonqualified defined benefit retirement plan for the years ended December 31 are summarized as follows (in thousands):
|
|
2017
|
2016
|
2015
|
||||||
|
Service cost
|
$
|
—
|
|
41
|
|
38
|
|
||
|
Interest cost
|
69
|
|
78
|
|
68
|
|
|||
|
Amortization of unrecognized (gain) loss
|
16
|
|
168
|
|
171
|
|
|||
|
Net periodic pension cost
|
$
|
85
|
|
287
|
|
277
|
|
||
A reconciliation of changes in the projected benefit obligation of the nonqualified defined benefit retirement plan at December 31 follows (in thousands):
|
|
2017
|
2016
|
2015
|
||||||
|
Projected benefit obligation at beginning of year
|
$
|
1,727
|
|
1,843
|
|
1,741
|
|
||
|
Service cost
|
—
|
|
41
|
|
38
|
|
|||
|
Interest cost
|
69
|
|
78
|
|
68
|
|
|||
|
Actuarial (gain) or loss
|
238
|
|
(209
|
)
|
10
|
|
|||
|
Benefits paid
|
(63
|
)
|
(26
|
)
|
(14
|
)
|
|||
|
Projected benefit obligation at end of year
|
$
|
1,971
|
|
1,727
|
|
1,843
|
|
||
Amounts recognized in other liabilities in the consolidated balance sheets for the nonqualified defined benefit retirement plan at
December 31, 2017
and
2016
were
$1,971,000
and
$1,727,000
, respectively.
The accumulated benefit obligation for the nonqualified defined benefit retirement plan at
December 31, 2017
and
2016
was
$1,971,000
and
$1,727,000
, respectively.
-
82
-
LCNB CORP. AND SUBSIDIARIES
NOTES TO CONSOLIDATED FINANCIAL STATEMENTS
December 31, 2017
(Continued)
NOTE 17 -
RETIREMENT PLANS
(continued)
Amounts recognized in accumulated other comprehensive income, net of tax, at December 31 for the nonqualified defined benefit retirement plan consists of (in thousands):
|
|
2017
|
2016
|
2015
|
||||||
|
Net actuarial (gain)/loss
|
$
|
141
|
|
(16
|
)
|
233
|
|
||
|
Past service cost
|
—
|
|
—
|
|
—
|
|
|||
|
|
$
|
141
|
|
(16
|
)
|
233
|
|
||
The estimated unrecognized net actuarial gain that will be amortized from accumulated other comprehensive income into net periodic benefit cost during
2018
for the nonqualified defined benefit retirement plan is
$16,000
.
Key weighted-average assumptions used to determine the benefit obligation and net periodic pension costs for the nonqualified defined benefit retirement plan for the years ended December 31 were as follows:
|
|
2017
|
2016
|
2015
|
|||||
|
Benefit obligation:
|
|
|
|
|||||
|
Discount rate
|
3.60
|
%
|
4.14
|
%
|
4.34
|
%
|
||
|
Salary increase rate
|
2.00
|
%
|
2.00
|
%
|
2.00
|
%
|
||
|
Net periodic pension cost:
|
|
|
|
|
|
|
||
|
Discount rate
|
4.14
|
%
|
4.34
|
%
|
3.95
|
%
|
||
|
Salary increase rate
|
2.00
|
%
|
2.00
|
%
|
2.00
|
%
|
||
|
Amortization period in years
|
1.00
|
|
1.00
|
|
1.98
|
|
||
The nonqualified defined benefit retirement plan is not funded. Therefore
no
contributions will be made in
2018
. Estimated future benefit payments reflecting expected future service for the years ended after
December 31, 2017
are (in thousands):
|
2018
|
$
|
130
|
|
|
2019
|
130
|
|
|
|
2020
|
130
|
|
|
|
2021
|
130
|
|
|
|
2022
|
130
|
|
|
|
2023-2027
|
633
|
|
|
NOTE 18 -
STOCK-BASED COMPENSATION
LCNB established an Ownership Incentive Plan (the "2002 Plan") during 2002 that allowed for stock-based awards to eligible employees, as determined by the Board of Directors. The awards were in the form of stock options, share awards, and/or appreciation rights. The 2002 Plan provided for the issuance of up to
200,000
shares. The 2002 Plan expired on April 16, 2012. Any outstanding unexercised options, however, continue to be exercisable in accordance with their terms.
The 2015 Ownership Incentive Plan (the "2015 Plan") was approved by LCNB's shareholders at the annual meeting on April 28, 2015 and allows for stock-based awards to eligible employees, as determined by the Compensation Committee of the Board of Directors. Awards may be made in the form of stock options, appreciation rights, restricted shares, and/or restricted share units. The 2015 Plan provides for the issuance of up to
450,000
shares. The 2015 Plan will terminate on April 28, 2025 and is subject to earlier termination by the Compensation Committee.
Stock-based awards may be in the form of treasury shares or new shares.
-
83
-
LCNB CORP. AND SUBSIDIARIES
NOTES TO CONSOLIDATED FINANCIAL STATEMENTS
December 31, 2017
(Continued)
NOTE 18 -
STOCK-BASED COMPENSATION
(continued)
LCNB has not granted stock options since 2012. Option awards granted to date under the 2002 Plan vest ratably over a
five
year period and expire
ten
years after the date of grant. Stock options outstanding at
December 31, 2017
were as follows:
|
|
Outstanding Stock Options
|
Exercisable Stock Options
|
||||||||||||||||
|
Exercise
Price Range
|
Number
|
Weighted
Average
Exercise
Price
|
Weighted
Average
Remaining
Contractual
Life (Years)
|
Number
|
Weighted
Average
Exercise
Price
|
Weighted
Average
Remaining
Contractual
Life (Years)
|
||||||||||||
|
$9.00 - 10.99
|
4,356
|
|
$
|
9.00
|
|
1.1
|
4,356
|
|
$
|
9.00
|
|
1.1
|
||||||
|
$11.00 - 12.99
|
15,909
|
|
12.08
|
|
2.6
|
15,909
|
|
12.08
|
|
2.6
|
||||||||
|
$17.00 - 18.99
|
—
|
|
—
|
|
0.0
|
—
|
|
—
|
|
0.0
|
||||||||
|
|
20,265
|
|
11.42
|
|
2.3
|
20,265
|
|
11.42
|
|
2.3
|
||||||||
The following table summarizes stock option activity for the years indicated:
|
2017
|
2016
|
2015
|
|||||||||||||||||
|
|
Options |
Weighted
Average Exercise Price |
Options
|
Weighted
Average
Exercise
Price
|
Options |
Weighted
Average Exercise Price |
|||||||||||||
|
Outstanding at January 1,
|
24,669
|
|
12.17
|
|
83,861
|
|
$
|
12.39
|
|
99,810
|
|
$
|
12.16
|
|
|||||
|
Granted
|
—
|
|
—
|
|
—
|
|
—
|
|
—
|
|
—
|
|
|||||||
|
Exercised
|
(3,398
|
)
|
14.94
|
|
(51,390
|
)
|
11.53
|
|
(13,449
|
)
|
11.31
|
|
|||||||
|
Expired
|
(1,006
|
)
|
17.88
|
|
(7,802
|
)
|
18.76
|
|
(2,500
|
)
|
9.00
|
|
|||||||
|
Outstanding at December 31,
|
20,265
|
|
11.42
|
|
24,669
|
|
12.17
|
|
83,861
|
|
12.39
|
|
|||||||
|
Exercisable at December 31,
|
20,265
|
|
11.42
|
|
22,924
|
|
12.13
|
|
75,072
|
|
12.40
|
|
|||||||
The following table provides information related to stock options exercised during the years indicated (in thousands):
|
|
2017
|
2016
|
2015
|
||||||
|
Intrinsic value of options exercised
|
$
|
25
|
|
288
|
|
67
|
|
||
|
Cash received from options exercised
|
51
|
|
592
|
|
152
|
|
|||
|
Tax benefit realized from options exercised
|
5
|
|
59
|
|
13
|
|
|||
The aggregate intrinsic value (the amount by which the current market value of the underlying stock exceeds the exercise price of the option) for options outstanding at
December 31, 2017
that were “in the money” (market price greater than exercise price) was
$183,000
. The aggregate intrinsic value at that date for only the options that were exercisable was
$183,000
. The aggregate intrinsic value for options outstanding at
December 31, 2016
that were in the money was
$273,000
and the aggregate intrinsic value at that date for only the options that were exercisable was
$255,000
. The intrinsic value changes based on changes in the market value of the Company’s stock.
Total expense related to options included in salaries and wages in the consolidated statements of income for the years ended
December 31, 2017
,
2016
, and
2015
was
$1,000
,
$5,000
, and
$19,000
, respectively. The related tax benefit for
2017
,
2016
, and
2015
was
$0
,
$2,000
, and
$6,000
, respectively. Compensation costs related to option awards were recognized in full during the first quarter 2017.
-
84
-
LCNB CORP. AND SUBSIDIARIES
NOTES TO CONSOLIDATED FINANCIAL STATEMENTS
December 31, 2017
(Continued)
NOTE 18 -
STOCK-BASED COMPENSATION
(continued)
Restricted stock awards granted under the 2015 Plan were as follows:
|
2017
|
2016
|
2015
|
||||||||||||||||||
|
|
Shares |
Weighted Average Grant Date Fair Value
|
Shares
|
Weighted Average Grant Date Fair Value
|
Shares
|
Weighted Average Grant Date Fair Value
|
||||||||||||||
|
Outstanding at January 1,
|
8,624
|
|
$
|
15.47
|
|
16,038
|
|
$
|
15.47
|
|
—
|
|
$
|
—
|
|
|||||
|
Granted
|
4,027
|
|
22.60
|
|
—
|
|
—
|
|
16,038
|
|
15.47
|
|
||||||||
|
Vested
|
(3,834
|
)
|
16.73
|
|
(7,414
|
)
|
15.47
|
|
—
|
|
—
|
|
||||||||
|
Forfeited
|
—
|
|
—
|
|
—
|
|
—
|
|
—
|
|
—
|
|
||||||||
|
Outstanding at December 31,
|
8,817
|
|
$
|
16.44
|
|
8,624
|
|
$
|
15.47
|
|
16,038
|
|
$
|
15.47
|
|
|||||
Total expense related to restricted stock awards included in salaries and wages in the consolidated statements of income for the years ended
December 31, 2017
,
2016
, and
2015
was
$75,000
,
$90,000
, and
$90,000
respectively. The related tax benefit for the years ended
December 31, 2017
,
2016
, and
2015
was
$26,000
,
$31,000
, and
$31,000
, respectively. Unrecognized compensation expense for restricted stock awards was
$84,000
at
December 31, 2017
and is expected to be recognized over a period of
4.2 years
.
NOTE 19 -
EARNINGS PER SHARE
LCNB has granted restricted stock awards with non-forfeitable dividend rights, which are considered participating securities. Accordingly, earnings per share is computed using the two-class method as required by FASB ASC 260-10-45. Basic earnings per common share is calculated by dividing net income allocated to common shareholders by the weighted average number of common shares outstanding during the period, which excludes the participating securities. Diluted earnings per common share is adjusted for the dilutive effects of stock options, warrants, and restricted stock. The diluted average number of common shares outstanding has been increased for the assumed exercise of stock options and warrants with proceeds used to purchase treasury shares at the average market price for the period.
-
85
-
LCNB CORP. AND SUBSIDIARIES
NOTES TO CONSOLIDATED FINANCIAL STATEMENTS
December 31, 2017
(Continued)
NOTE 19 -
EARNINGS PER SHARE
(continued)
Earnings per share for the years ended December 31 were calculated as follows (in thousands, except share and per share data):
|
|
2017
|
2016
|
2015
|
||||||
|
Net income
|
$
|
12,972
|
|
12,482
|
|
11,474
|
|
||
|
Less allocation of earnings and dividends to participating securities
|
7
|
|
13
|
|
—
|
|
|||
|
Net income allocated to common shareholders
|
12,965
|
|
12,469
|
|
11,474
|
|
|||
|
Weighted average common shares outstanding, gross
|
10,011,358
|
|
9,958,300
|
|
9,704,965
|
|
|||
|
Less average participating securities
|
5,783
|
|
10,243
|
|
—
|
|
|||
|
Weighted average number of shares outstanding used in the calculation of basic earnings per common share
|
10,005,575
|
|
9,948,057
|
|
9,704,965
|
|
|||
|
Add dilutive effect of:
|
|
|
|
|
|
|
|||
|
Stock options
|
6,936
|
|
10,765
|
|
17,174
|
|
|||
|
Stock warrants
|
—
|
|
17,548
|
|
89,328
|
|
|||
|
Adjusted weighted average number of shares outstanding used in the calculation of diluted earnings per common share
|
10,012,511
|
|
9,976,370
|
|
9,811,467
|
|
|||
|
Earnings per common share:
|
|
|
|
|
|
|
|||
|
Basic
|
$
|
1.30
|
|
1.26
|
|
1.18
|
|
||
|
Diluted
|
1.29
|
|
1.25
|
|
1.17
|
|
|||
Options to purchase
12,962
shares of common stock at a weighted average price of
$18.41
per share were outstanding at
December 31, 2015
and were not included in the computation of diluted earnings per common share because the exercise prices of the options were greater than the average market prices of the common shares. There were
no
such options at
December 31, 2017
or
2016
.
NOTE 20 -
RELATED PARTY TRANSACTIONS
LCNB has entered into related party transactions with various directors and executive officers. Management believes these transactions do not involve more than a normal risk of collectibility or present other unfavorable features. The following table provides a summary of the loan activity for these officers and directors for the years ended December 31 (in thousands):
|
|
2017
|
2016
|
||||
|
Beginning balance
|
$
|
1,447
|
|
1,091
|
|
|
|
New loans and advances
|
669
|
|
64
|
|
||
|
Change in composition of related parties
|
—
|
|
506
|
|
||
|
Reductions
|
(246
|
)
|
(214
|
)
|
||
|
Ending Balance
|
$
|
1,870
|
|
1,447
|
|
|
Deposits from executive officers, directors and related interests of such persons held by the Company at
December 31, 2017
and
2016
amounted to
$5,698,000
and
$4,618,000
, respectively.
-
86
-
LCNB CORP. AND SUBSIDIARIES
NOTES TO CONSOLIDATED FINANCIAL STATEMENTS
December 31, 2017
(Continued)
NOTE 21 -
FAIR VALUE OF FINANCIAL INSTRUMENTS
The majority of LCNB’s financial debt securities are classified as available-for-sale. The securities are reported at fair value with unrealized holding gains and losses reported net of income taxes in accumulated other comprehensive income.
LCNB utilizes a pricing service for determining the fair values of most of its investment securities. Methods and significant assumptions used to estimate fair value are as follows:
|
•
|
Fair value for U.S. Treasury notes are determined based on market quotations (level 1).
|
|
•
|
Fair values for the other debt securities are calculated using the discounted cash flow method for each security. The discount rates for these cash flows are estimated by the pricing service using rates observed in the market (level 2). Cash flow streams are dependent on estimated prepayment speeds and the overall structure of the securities given existing market conditions.
|
|
•
|
Fair value for trust preferred and equity securities are determined based on market quotations (level 1). These securities are not priced by the pricing service.
|
|
•
|
LCNB has investments in
five
mutual funds. These investments are not priced by the pricing service. Investments in
two
of the mutual funds are measured at fair value using net asset values ("NAV") per share as a practical expedient and are not required to be classified in the fair value hierarchy. These funds can be redeemed at any time at their current NAVs.
Two
other mutual funds are traded in active markets and their fair values are based on market quotations (level 1). The investment in the remaining mutual fund, which is not traded in an active market, is considered to have level 2 inputs because an investor can have its interest in the fund redeemed for the balance of its capital account at any quarter-end assuming the fund is given a
60
day notice. The investment in this fund is carried at fair value, which approximates cost.
|
Assets that may be recorded at fair value on a nonrecurring basis include impaired loans, other real estate owned, and other repossessed assets. A loan is considered impaired when management believes it is probable that payment of interest and principal will not be made in accordance with the contractual terms of the loan agreement. Impaired loans are carried at the present value of estimated future cash flows using the loan's existing rate or the fair value of collateral if the loan is collateral dependent, if this value is less than the loan balance. The inputs are considered to be level 3.
Other real estate owned is adjusted to fair value upon transfer of the loan to foreclosed assets, usually based on an appraisal of the property. Subsequently, foreclosed assets are carried at the lower of carrying value or fair value. These inputs are also considered to be level 3.
-
87
-
LCNB CORP. AND SUBSIDIARIES
NOTES TO CONSOLIDATED FINANCIAL STATEMENTS
December 31, 2017
(Continued)
NOTE 21 -
FAIR VALUE OF FINANCIAL INSTRUMENTS
(continued)
The following table summarizes the valuation of LCNB’s assets recorded at fair value by input levels as of December 31 (in thousands):
|
|
Fair Value Measurements at the End of
the Reporting Period Using
|
||||||||||||
|
|
Fair Value
Measurements
|
Quoted Prices in Active Markets for Identical Assets
(Level 1) |
Significant Other Observable Inputs
(Level 2) |
Significant Unobservable Inputs
(Level 3) |
|||||||||
|
December 31, 2017
|
|
|
|
|
|||||||||
|
Recurring fair value measurements:
|
|
|
|
|
|||||||||
|
Investment securities available-for-sale:
|
|
|
|
|
|||||||||
|
U.S. Treasury notes
|
$
|
2,259
|
|
2,259
|
|
—
|
|
—
|
|
||||
|
U.S. Agency notes
|
83,261
|
|
—
|
|
83,261
|
|
—
|
|
|||||
|
U.S. Agency mortgage-backed securities
|
67,153
|
|
—
|
|
67,153
|
|
—
|
|
|||||
|
Municipal securities:
|
|
|
|
|
|
|
|
|
|||||
|
Non-taxable
|
102,174
|
|
—
|
|
102,174
|
|
—
|
|
|||||
|
Taxable
|
20,366
|
|
—
|
|
20,366
|
|
—
|
|
|||||
|
Mutual funds
|
1,023
|
|
23
|
|
1,000
|
|
—
|
|
|||||
|
Mutual funds measured at net asset value (a)
|
1,519
|
|
|||||||||||
|
Trust preferred securities
|
50
|
|
50
|
|
—
|
|
—
|
|
|||||
|
Equity securities
|
667
|
|
667
|
|
—
|
|
—
|
|
|||||
|
Total recurring fair value measurements
|
$
|
278,472
|
|
2,999
|
|
273,954
|
|
—
|
|
||||
|
Nonrecurring fair value measurements:
|
|
|
|
|
|
|
|
|
|||||
|
Impaired loans
|
$
|
3,359
|
|
—
|
|
—
|
|
3,359
|
|
||||
|
December 31, 2016
|
|
|
|
|
|
|
|
|
|||||
|
Recurring fair value measurement:
|
|
|
|
|
|
|
|
|
|||||
|
Investment securities available-for-sale:
|
|
|
|
|
|
|
|
|
|||||
|
U.S. Treasury notes
|
$
|
28,145
|
|
28,145
|
|
—
|
|
—
|
|
||||
|
U.S. Agency notes
|
85,400
|
|
—
|
|
85,400
|
|
—
|
|
|||||
|
U.S. Agency mortgage-backed securities
|
71,047
|
|
—
|
|
71,047
|
|
—
|
|
|||||
|
Municipal securities:
|
|
|
|
|
|
|
|
|
|||||
|
Non-taxable
|
113,015
|
|
—
|
|
113,015
|
|
—
|
|
|||||
|
Taxable
|
19,845
|
|
—
|
|
19,845
|
|
—
|
|
|||||
|
Mutual funds
|
1,000
|
|
—
|
|
1,000
|
|
—
|
|
|||||
|
Mutual funds measured at net asset value (a)
|
1,482
|
|
|||||||||||
|
Trust preferred securities
|
48
|
|
48
|
|
—
|
|
—
|
|
|||||
|
Equity securities
|
677
|
|
677
|
|
—
|
|
—
|
|
|||||
|
Total recurring fair value measurements
|
$
|
320,659
|
|
28,870
|
|
290,307
|
|
—
|
|
||||
|
Nonrecurring fair value measurements:
|
|
|
|
|
|
|
|
|
|||||
|
Impaired loans
|
$
|
5,340
|
|
—
|
|
—
|
|
5,340
|
|
||||
|
(a)
|
In accordance with Subtopic 820-10, certain investments that are measured at fair value using the net asset value per share practical expedient have not been classified in the fair value hierarchy. The fair value amounts presented in this table are intended to permit reconciliation of the fair value hierarchy to the amounts presented in the Consolidated Balance Sheets.
|
||||||||||||
-
88
-
LCNB CORP. AND SUBSIDIARIES
NOTES TO CONSOLIDATED FINANCIAL STATEMENTS
December 31, 2017
(Continued)
NOTE 21 -
FAIR VALUE OF FINANCIAL INSTRUMENTS
(continued)
The following table presents quantitative information about unobservable inputs used in nonrecurring Level 3 fair value measurements at
December 31, 2017
and
2016
(dollars in thousands):
|
Range
|
|||||||||||||||||
|
Fair Value
|
Valuation Technique
|
Unobservable Inputs
|
High
|
Low
|
Weighted Average
|
||||||||||||
|
2017
|
|||||||||||||||||
|
Impaired loans
|
$
|
3,359
|
|
Estimated sales price
|
Adjustments for comparable properties, discounts to reflect current market conditions
|
Not applicable
|
|||||||||||
|
Discounted cash flows
|
Discount rate
|
8.25
|
%
|
3.25
|
%
|
6.27
|
%
|
||||||||||
|
2016
|
|||||||||||||||||
|
Impaired loans
|
$
|
5,340
|
|
Estimated sales price
|
Adjustments for comparable properties, discounts to reflect current market conditions
|
Not applicable
|
|||||||||||
|
Discounted cash flows
|
Discount rate
|
8.25
|
%
|
4.50
|
%
|
|
5.56
|
%
|
|||||||||
-
89
-
LCNB CORP. AND SUBSIDIARIES
NOTES TO CONSOLIDATED FINANCIAL STATEMENTS
December 31, 2017
(Continued)
NOTE 21 -
FAIR VALUE OF FINANCIAL INSTRUMENTS
(continued)
Carrying amounts and estimated fair values of financial instruments as of December 31 were as follows (in thousands):
|
Fair Value Measurements at the End of
the Reporting Period Using |
|||||||||||||||
|
Carrying
Amount
|
Fair
Value
|
Quoted
Prices in Active Markets for Identical Assets (Level 1) |
Significant Other
Observable Inputs (Level 2) |
Significant
Unobservable Inputs (Level 3) |
|||||||||||
|
2017
|
|||||||||||||||
|
FINANCIAL ASSETS:
|
|
|
|
|
|||||||||||
|
Cash and cash equivalents
|
$
|
25,386
|
|
25,386
|
|
25,386
|
|
—
|
|
—
|
|
||||
|
Investment securities, held-to-maturity
|
32,571
|
|
32,350
|
|
—
|
|
—
|
|
32,350
|
|
|||||
|
Federal Reserve Bank stock
|
2,732
|
|
2,732
|
|
2,732
|
|
—
|
|
—
|
|
|||||
|
Federal Home Loan Bank stock
|
3,638
|
|
3,638
|
|
3,638
|
|
—
|
|
—
|
|
|||||
|
Loans, net
|
845,657
|
|
813,368
|
|
—
|
|
—
|
|
813,368
|
|
|||||
|
Accrued interest receivable
|
3,511
|
|
3,511
|
|
—
|
|
3,511
|
|
—
|
|
|||||
|
FINANCIAL LIABILITIES:
|
|
|
|
|
|||||||||||
|
Deposits
|
1,085,821
|
|
1,087,086
|
|
894,046
|
|
193,040
|
|
—
|
|
|||||
|
Short-term borrowings
|
47,000
|
|
47,000
|
|
47,000
|
|
—
|
|
—
|
|
|||||
|
Long-term debt
|
303
|
|
307
|
|
—
|
|
307
|
|
—
|
|
|||||
|
Accrued interest payable
|
329
|
|
329
|
|
—
|
|
329
|
|
—
|
|
|||||
|
2016
|
|||||||||||||||
|
FINANCIAL ASSETS:
|
|||||||||||||||
|
Cash and cash equivalents
|
$
|
18,865
|
|
18,865
|
|
18,865
|
|
—
|
|
—
|
|
||||
|
Investment securities, held-to-maturity
|
41,003
|
|
40,490
|
|
—
|
|
—
|
|
40,490
|
|
|||||
|
Federal Reserve Bank stock
|
2,732
|
|
2,732
|
|
2,732
|
|
—
|
|
—
|
|
|||||
|
Federal Home Loan Bank stock
|
3,638
|
|
3,638
|
|
3,638
|
|
—
|
|
—
|
|
|||||
|
Loans, net
|
816,228
|
|
799,791
|
|
—
|
|
—
|
|
799,791
|
|
|||||
|
Accrued interest receivable
|
3,559
|
|
3,559
|
|
—
|
|
3,559
|
|
—
|
|
|||||
|
FINANCIAL LIABILITIES:
|
|
|
|
|
|||||||||||
|
Deposits
|
1,110,905
|
|
1,113,187
|
|
896,147
|
|
217,040
|
|
—
|
|
|||||
|
Short-term borrowings
|
42,040
|
|
42,040
|
|
42,040
|
|
—
|
|
—
|
|
|||||
|
Long-term debt
|
598
|
|
614
|
|
—
|
|
614
|
|
—
|
|
|||||
|
Accrued interest payable
|
307
|
|
307
|
|
—
|
|
307
|
|
—
|
|
|||||
The fair values of off-balance-sheet financial instruments such as loan commitments and letters of credit are based on fees currently charged to enter into similar agreements, taking into account the remaining terms of the agreements. The fair values of such instruments were not material at
December 31, 2017
and
2016
.
-
90
-
LCNB CORP. AND SUBSIDIARIES
NOTES TO CONSOLIDATED FINANCIAL STATEMENTS
December 31, 2017
(Continued)
NOTE 21 -
FAIR VALUE OF FINANCIAL INSTRUMENTS
(continued)
Fair values of financial instruments are based on various assumptions, including the discount rate and estimates of future cash flows. Therefore, the fair values presented may not represent amounts that could be realized in actual transactions. In addition, because the required disclosures exclude certain financial instruments and all nonfinancial instruments, any aggregation of the fair value amounts presented would not represent the underlying value of the Company. The following methods and assumptions were used to estimate the fair value of certain financial instruments:
Cash and cash equivalents
The carrying amounts presented are deemed to approximate fair value.
Investment securities, held-to-maturity
Fair values for investment securities, held-to-maturity are based on quoted market prices for similar securities and/or discounted
cash flow analysis or other methods.
Federal Home Loan Bank and Federal Reserve Bank stock
The carrying value of Federal Home Loan Bank and Federal Reserve Bank stock approximates fair value based on the respective redemptive provisions.
Loans
Fair value is estimated by discounting the future cash flows using the current rates at which similar loans would be made to borrowers with similar credit ratings and for the same remaining maturities, incorporating assumptions of current and projected prepayment speeds. These current rates approximate market rates.
Deposits
The fair value of demand deposits, savings accounts, and certain money market deposits is the amount payable on demand at the reporting date. The fair value of fixed-maturity certificates of deposit is estimated using the rates currently offered for deposits of similar remaining maturities, which approximates market rates.
Borrowings
The carrying amounts of federal funds purchased, repurchase agreements, and U.S. Treasury demand note borrowings are deemed to approximate fair value of short-term borrowings. For long-term debt, fair values are estimated based on the discounted value of expected net cash flows using current interest rates.
Accrued interest receivable and Accrued interest payable
Carrying amount approximates fair value.
-
91
-
LCNB CORP. AND SUBSIDIARIES
NOTES TO CONSOLIDATED FINANCIAL STATEMENTS
December 31, 2017
(Continued)
NOTE 22 –
QUARTERLY RESULTS OF OPERATIONS (UNAUDITED)
The following table sets forth certain quarterly results for the years ended
December 31, 2017
and
2016
(dollars in thousands, except per share data):
|
|
Three Months Ended
|
|||||||||||
|
|
March 31
|
June 30
|
Sep. 30
|
Dec. 31
|
||||||||
|
2017
|
|
|
|
|
||||||||
|
Interest income
|
$
|
10,864
|
|
10,934
|
|
11,055
|
|
11,610
|
|
|||
|
Interest expense
|
877
|
|
861
|
|
908
|
|
953
|
|
||||
|
Net interest income
|
9,987
|
|
10,073
|
|
10,147
|
|
10,657
|
|
||||
|
Provision for loan losses
|
15
|
|
222
|
|
(12
|
)
|
(10
|
)
|
||||
|
Net interest income after provision
|
9,972
|
|
9,851
|
|
10,159
|
|
10,667
|
|
||||
|
Total non-interest income
|
2,430
|
|
2,790
|
|
2,659
|
|
2,579
|
|
||||
|
Total non-interest expenses
|
7,968
|
|
8,611
|
|
8,672
|
|
8,612
|
|
||||
|
Income before income taxes
|
4,434
|
|
4,030
|
|
4,146
|
|
4,634
|
|
||||
|
Provision for income taxes
|
1,188
|
|
1,027
|
|
1,040
|
|
1,017
|
|
||||
|
Net income
|
$
|
3,246
|
|
3,003
|
|
3,106
|
|
3,617
|
|
|||
|
Earnings per common share:
|
|
|
|
|
|
|
|
|
||||
|
Basic
|
$
|
0.32
|
|
0.30
|
|
0.31
|
|
0.37
|
|
|||
|
Diluted
|
0.32
|
|
0.30
|
|
0.31
|
|
0.36
|
|
||||
|
2016
|
|
|
|
|
|
|
|
|
||||
|
Interest income
|
$
|
10,621
|
|
11,008
|
|
10,895
|
|
11,226
|
|
|||
|
Interest expense
|
849
|
|
883
|
|
885
|
|
887
|
|
||||
|
Net interest income
|
9,772
|
|
10,125
|
|
10,010
|
|
10,339
|
|
||||
|
Provision for loan losses
|
90
|
|
396
|
|
372
|
|
55
|
|
||||
|
Net interest income after provision
|
9,682
|
|
9,729
|
|
9,638
|
|
10,284
|
|
||||
|
Total non-interest income
|
2,642
|
|
2,750
|
|
2,846
|
|
2,615
|
|
||||
|
Total non-interest expenses
|
8,292
|
|
8,468
|
|
8,593
|
|
7,908
|
|
||||
|
Income before income taxes
|
4,032
|
|
4,011
|
|
3,891
|
|
4,991
|
|
||||
|
Provision for income taxes
|
1,068
|
|
1,043
|
|
995
|
|
1,337
|
|
||||
|
Net income
|
$
|
2,964
|
|
2,968
|
|
2,896
|
|
3,654
|
|
|||
|
Earnings per common share:
|
|
|
|
|
|
|
|
|
||||
|
Basic
|
$
|
0.30
|
|
0.30
|
|
0.29
|
|
0.37
|
|
|||
|
Diluted
|
0.30
|
|
0.29
|
|
0.29
|
|
0.37
|
|
||||
-
92
-
LCNB CORP. AND SUBSIDIARIES
NOTES TO CONSOLIDATED FINANCIAL STATEMENTS
December 31, 2017
(Continued)
NOTE 23 -
PARENT COMPANY FINANCIAL INFORMATION
Condensed financial information for LCNB Corp., parent company only, follows (in thousands):
|
Condensed Balance Sheets:
|
|
|
||||
|
December 31,
|
2017
|
2016
|
||||
|
Assets:
|
|
|
||||
|
Cash on deposit with subsidiary
|
$
|
308
|
|
491
|
|
|
|
Investment securities available-for-sale, at fair value
|
919
|
|
893
|
|
||
|
Investment in subsidiaries
|
148,850
|
|
141,325
|
|
||
|
Other assets
|
194
|
|
235
|
|
||
|
Total assets
|
$
|
150,271
|
|
142,944
|
|
|
|
Liabilities
|
$
|
—
|
|
—
|
|
|
|
Shareholders' equity
|
150,271
|
|
142,944
|
|
||
|
Total liabilities and shareholders' equity
|
$
|
150,271
|
|
142,944
|
|
|
|
Condensed Statements of Income
|
|
|
|
||||||
|
Year ended December 31,
|
2017
|
2016
|
2015
|
||||||
|
Income:
|
|
|
|
||||||
|
Dividends from subsidiaries
|
$
|
6,800
|
|
7,300
|
|
5,400
|
|
||
|
Interest and dividends
|
36
|
|
38
|
|
58
|
|
|||
|
Net gain on sales of securities
|
14
|
|
8
|
|
254
|
|
|||
|
Total income
|
6,850
|
|
7,346
|
|
5,712
|
|
|||
|
Total expenses
|
1,290
|
|
1,014
|
|
1,016
|
|
|||
|
Income before income tax expense/benefit and equity in undistributed income of subsidiaries
|
5,560
|
|
6,332
|
|
4,696
|
|
|||
|
Income tax benefit
|
380
|
|
336
|
|
250
|
|
|||
|
Equity in undistributed income of subsidiaries
|
7,032
|
|
5,814
|
|
6,528
|
|
|||
|
Net income
|
$
|
12,972
|
|
12,482
|
|
11,474
|
|
||
-
93
-
LCNB CORP. AND SUBSIDIARIES
NOTES TO CONSOLIDATED FINANCIAL STATEMENTS
December 31, 2017
(Continued)
NOTE 23 -
PARENT COMPANY FINANCIAL INFORMATION
(continued)
|
Condensed Statements of Cash Flows
|
|
|
|
||||||
|
Year ended December 31,
|
2017
|
2016
|
2015
|
||||||
|
Cash flows from operating activities:
|
|
|
|
||||||
|
Net income
|
$
|
12,972
|
|
12,482
|
|
11,474
|
|
||
|
Adjustments for non-cash items -
|
|
|
|
|
|
|
|||
|
Increase in undistributed income of subsidiaries
|
(7,032
|
)
|
(5,814
|
)
|
(6,528
|
)
|
|||
|
Other, net
|
84
|
|
126
|
|
42
|
|
|||
|
Net cash flows provided by operating activities
|
6,024
|
|
6,794
|
|
4,988
|
|
|||
|
Cash flows from investing activities:
|
|
|
|
|
|
|
|||
|
Purchases of securities available-for-sale
|
(54
|
)
|
(177
|
)
|
(215
|
)
|
|||
|
Proceeds from maturities of securities available-for-sale
|
50
|
|
55
|
|
—
|
|
|||
|
Proceeds from sales of available-for-sale securities
|
43
|
|
173
|
|
1,217
|
|
|||
|
Investments in subsidiaries
|
(250
|
)
|
—
|
|
—
|
|
|||
|
Cash paid for business acquisition
|
—
|
|
—
|
|
(3,757
|
)
|
|||
|
Net cash flows provided by (used in) investing activities
|
(211
|
)
|
51
|
|
(2,755
|
)
|
|||
|
Cash flows from financing activities:
|
|
|
|
|
|
|
|||
|
Proceeds from issuance of common stock
|
360
|
|
379
|
|
390
|
|
|||
|
Repurchase of stock warrants
|
—
|
|
(1,545
|
)
|
—
|
|
|||
|
Cash dividends paid on common stock
|
(6,407
|
)
|
(6,375
|
)
|
(6,239
|
)
|
|||
|
Other
|
51
|
|
653
|
|
165
|
|
|||
|
Net cash flows used in financing activities
|
(5,996
|
)
|
(6,888
|
)
|
(5,684
|
)
|
|||
|
Net change in cash
|
(183
|
)
|
(43
|
)
|
(3,451
|
)
|
|||
|
Cash at beginning of year
|
491
|
|
534
|
|
3,985
|
|
|||
|
Cash at end of year
|
$
|
308
|
|
491
|
|
534
|
|
||
-
94
-
None.
Disclosure Controls and Procedures
An evaluation of the effectiveness of LCNB’s internal controls over financial reporting was carried out under the supervision and with the participation of LCNB’s management, including the Chief Executive Officer and Chief Financial Officer. Based on that evaluation, the Chief Executive Officer and Chief Financial Officer concluded that LCNB’s disclosure controls and procedures were effective as of the end of the period covered by this annual report.
Internal Control Over Financial Reporting
Information required by this item is set forth in the “Report of Management’s Assessment of Internal Control over Financial Reporting” and the “Report of Independent Registered Public Accounting Firm” included in Item 8 of this
2017
Annual Report on Form 10-K.
Changes in Internal Control over Financial Reporting
During the fourth quarter
2017
, there were no changes in LCNB's internal control over financial reporting that have materially affected, or are reasonably likely to materially affect, LCNB's internal control over financial reporting.
None.
-
95
-
Portions of the Company’s Definitive Proxy Statement (the “Proxy Statement”) included in the Notice of Annual Meeting of Shareholders to be held
April 24, 2018
, which Proxy Statement will be mailed to shareholders within 120 days from the end of the fiscal year ended
December 31, 2017
, are incorporated by reference into Part III.
The information required by this item concerning the Executive Officers and Directors of the Registrant is incorporated herein by reference under the caption "Directors and Executive Officers" of the Proxy Statement.
The information required by this item concerning the Audit Committee and Code of Business Conduct and Ethics is incorporated herein by reference under the captions "Board of Directors Meetings and Committees," "Audit Committee Report," and "Code of Ethics" of the Proxy Statement.
The information required by this item concerning Section 16(a) Beneficial Ownership Reporting Compliance is incorporated herein by reference under the caption "Section 16(a) Beneficial Ownership Reporting Compliance" of the proxy Statement.
The information contained in the Proxy Statement under the captions "Board of Directors Meetings and Committees" "Compensation Committee Interlocks and Insider Participation" "Equity Compensation Plan Information," "Compensation of Executive Officers," and "Compensation Committee Report on Executive Compensation" is incorporated herein by reference.
The information contained in the Proxy Statement under the captions "Market Price of Stock and Dividend Data" and "Voting Securities and Principal Holders" is incorporated herein by reference.
The information contained in the Proxy Statement under the captions "Election of Directors," "Directors and Executive Officers," "Board of Directors Meetings and Committees," and "Certain Relationships and Related Transactions" is incorporated herein by reference.
The information contained in the Proxy Statement under the captions "Independent Registered Accounting Firm" and "Board of Directors Meetings and Committees" is incorporated herein by reference.
-
96
-
|
(a)1.
|
Financial Statements
|
|
|
|
|
|
REPORT OF INDEPENDENT REGISTERED PUBLIC ACCOUNTING FIRM
|
|
|
FINANCIAL STATEMENTS
|
|
|
Consolidated Balance Sheets as of December 31, 2017 and 2016.
|
|
|
Consolidated Statements of Income for the Years Ended December 31, 2017, 2016, and 2015.
|
|
|
Consolidated Statements of Comprehensive Income for the Years Ended December 31, 2017, 2016, and 2015.
|
|
|
Consolidated Statements of Shareholders' Equity for the Years Ended December 31, 2017, 2016, and 2015.
|
|
|
Consolidated Statements of Cash Flows for the Years Ended December 31, 2017, 2016, and 2015.
|
|
|
Notes to Consolidated Financial Statements
|
|
|
|
|
2.
|
Financial Statement Schedules – None
|
|
|
|
|
3.
|
Exhibits required by Item 601 Regulation S-K.
|
|
(a)
Exhibit No
.
|
Exhibit Description
|
||
|
2.1
|
|||
|
2.2
|
|||
|
2.3
|
|||
|
2.4
|
|||
|
3.1
|
|||
|
3.2
|
|||
|
10.1
|
|||
|
10.2
|
|||
|
10.3
|
|||
|
10.5
|
|||
|
10.7
|
|||
|
14.1
|
|||
|
14.2
|
|||
-
97
-
|
(a)
Exhibit No
.
|
Exhibit Description
|
||
|
21
|
|||
|
23
|
|||
|
31.1
|
|||
|
31.2
|
|||
|
32
|
|||
|
101
|
The following financial information from LCNB Corp.’s Annual Report on Form 10-K for the year ended December 31, 2017 is formatted in Extensible Business Reporting Language: (i) the Consolidated Balance Sheets, (ii) the Consolidated Statements of Income, (iii) the Consolidated Statements of Comprehensive Income, (iv) the Consolidated Statements of Shareholders’ Equity, (v) the Consolidated Statements of Cash Flows, and (vi) the Notes to Consolidated Financial Statements, tagged as blocks of text.
|
||
-
98
-
SIGNATURES
Pursuant to the requirements of Section 13 or 15(d) of the Securities Exchange Act of 1934, the Registrant has duly caused this report to be signed on its behalf by the undersigned, thereunto duly authorized.
|
|
LCNB Corp.
|
|
|
|
(Registrant)
|
|
|
|
|
|
|
|
|
|
|
|
/s/ Steve P. Foster
|
|
|
|
Steve P. Foster
|
|
|
|
Chief Executive Officer & President
|
|
|
|
March 9, 2018
|
|
|
|
||
Pursuant to the requirements of the Securities Exchange Act of 1934, this report has been signed below by the following persons on behalf of the Registrant and in the capacities and on the dates indicated:
|
/s/ Steve P. Foster
|
|
/s/ William H. Kaufman
|
|
|
Steve P. Foster
|
|
William H. Kaufman
|
|
|
Chief Executive Officer, President, & Director
|
|
Director
|
|
|
(Principal Executive Officer)
|
|
March 9, 2018
|
|
|
March 9, 2018
|
|
|
|
|
|
|
|
|
|
|
|
/s/ Anne E. Krehbiel
|
|
|
/s/ Robert C. Haines II
|
|
Anne E. Krehbiel
|
|
|
Robert C. Haines II
|
|
Director
|
|
|
Executive Vice President & Chief Financial
|
|
March 9, 2018
|
|
|
Officer (Principal Financial and Accounting
|
|
|
|
|
Officer)
|
|||
|
March 9, 2018
|
|
/s/ John H. Kochensparger III
|
|
|
John H. Kochensparger III
|
|||
|
|
|
Director
|
|
|
/s/ Stephen P. Wilson
|
|
March 9, 2018
|
|
|
Stephen P. Wilson
|
|
|
|
|
Chairman of the Board of Directors
|
|
|
|
|
March 9, 2018
|
|
/s/ Valerie S. Krueckeberg
|
|
|
Valerie S. Krueckeberg
|
|||
|
|
|
Director
|
|
|
/s/ Spencer S. Cropper
|
|
March 9, 2018
|
|
|
Spencer S. Cropper
|
|
|
|
|
Director
|
|
|
|
|
March 9, 2018
|
|
/s/ George L. Leasure
|
|
|
|
|
George L. Leasure
|
|
|
|
|
Director
|
|
|
March 9, 2018
|
|||
-
99
-
TABLE OF CONTENTS
Part IItem 1. BusinessItem 1A. Risk FactorsItem 1B. Unresolved Staff CommentsItem 2. PropertiesItem 3. Legal ProceedingsItem 4. Mine Safety DisclosuresPart IIItem 5. Market For Registrant's Common Equity, Related Stockholder Matters, and Issuer Purchases Of Equity SecuritiesItem 6. Selected Financial DataItem 7. Management's Discussion and Analysis Of Financial Condition and Results Of OperationsItem 7. Management's Discussion and Analysis Of Financial Condition and Results Of Operations (continued)Item 7A. Quantitative and Qualitative Disclosures About Market RiskItem 8. Financial Statements and Supplementary DataNote 1 - Summary Of Significant Accounting PoliciesNote 1 - Summary Of Significant Accounting Policies (continued)Note 2 Acquisitions (unaudited)Note 3 - Investment SecuritiesNote 3 - Investment Securities (continued)Note 4 - LoansNote 4 - Loans (continued)Note 5 - Acquired Credit Impaired LoansNote 5 - Acquired Credit Impaired Loans (continued)Note 6 Other Real Estate OwnedNote 7 - Premises and EquipmentNote 8 - LeasesNote 9 - Goodwill and Other Intangible AssetsNote 10 - Affordable Housing Tax Credit Limited PartnershipsNote 10 - Affordable Housing Tax Credit Limited Partnerships (continued)Note 11 - Time DepositsNote 12 - BorrowingsNote 12 - Borrowings (continued)Note 13 - Income TaxesNote 13 - Income Taxes (continued)Note 14 - Commitments and Contingent LiabilitiesNote 14 - Commitments and Contingent Liabilities (continued)Note 15 - Regulatory MattersNote 15 - Regulatory Matters (continued)Note 16 - Accumulated Other Comprehensive Income (loss)Note 16 - Accumulated Other Comprehensive Income (continued)Note 17 - Retirement PlansNote 17 - Retirement Plans (continued)Note 18 - Stock-based CompensationNote 18 - Stock-based Compensation (continued)Note 19 - Earnings Per ShareNote 19 - Earnings Per Share (continued)Note 20 - Related Party TransactionsNote 21 - Fair Value Of Financial InstrumentsNote 21 - Fair Value Of Financial Instruments (continued)Note 22 Quarterly Results Of Operations (unaudited)Note 23 - Parent Company Financial InformationNote 23 - Parent Company Financial Information (continued)Item 9. Changes in and Disagreements with Accountants on Accounting and Financial DisclosuresItem 9A. Controls and ProceduresItem 9B. Other InformationPart IIIItem 10. Directors, Executive Officers and Corporate GovernanceItem 11. Executive CompensationItem 12. Security Ownership Of Certain Beneficial Owners and Management and Related Stockholder MattersItem 13. Certain Relationships and Related Transactions, and Director IndependenceItem 14. Principal Accounting Fees and ServicesPart IVItem 15. Exhibits, Financial Statement Schedules