LEIDOS HOLDINGS, INC.
10-Ks and 10-Qs
|
|
|
|
|
|
|
|
|
|
|
|
|
|
|
|
|
|
|
|
|
|
|
|
|
|
|
|
|
|
|
|
|
|
|
|
|
|
|
|
|
|
|
|
|
|
|
|
|
|

UNITED STATES
SECURITIES AND EXCHANGE COMMISSION
Washington, D.C. 20549
Form 10-K
(Mark One)
x
ANNUAL REPORT PURSUANT TO SECTION 13 OR 15(d) OF THE SECURITIES EXCHANGE ACT OF 1934
For the fiscal year ended
December 28, 2018
or
o
TRANSITION REPORT PURSUANT TO SECTION 13 OR 15(d) OF THE SECURITIES EXCHANGE ACT OF 1934
For the transition period from to
|
Commission File Number: 001-33072
|
||
|
Leidos Holdings, Inc.
|
||
|
(Exact name of registrant as specified in its charter)
|
||
|
Delaware
|
20-3562868
|
|
|
(State or other jurisdiction of incorporation or organization)
|
(I.R.S. Employer Identification No.)
|
|
|
11951 Freedom Drive, Reston, Virginia
|
20190
|
|
|
(Address of principal executive offices)
|
(Zip Code)
|
|
|
(571) 526-6000
|
||
|
(Registrant's telephone number, including area code)
|
||
Securities registered pursuant to Section 12(b) of the Act:
|
Title of each class
|
|
Name of each exchange on which registered
|
|
Leidos Holdings, Inc. Common Stock, Par Value $.0001 Per Share
|
|
New York Stock Exchange
|
Securities registered pursuant to Section 12(g) of the Act:
None
Indicate by check mark if the registrant is a well-known seasoned issuer, as defined in Rule 405 of the Securities Act. Yes
x
No
o
Indicate by check mark if the registrant is not required to file reports pursuant to Section 13 or Section 15(d) of the Act. Yes
o
No
x
Indicate by check mark whether the registrant (1) has filed all reports required to be filed by Section 13 or 15(d) of the Securities Exchange Act of 1934 during the preceding 12 months (or for such shorter period that the registrant was required to file such reports), and (2) has been subject to such filing requirements for the past 90 days. Yes
x
No
o
Indicate by check mark whether the registrant has submitted electronically every Interactive Data File required to be submitted pursuant to Rule 405 of Regulation S-T (§232.405 of this chapter) during the preceding 12 months (or for such shorter period that the registrant was required to submit such files). Yes
x
No
o
Indicate by check mark if disclosure of delinquent filers pursuant to Item 405 of Regulation S-K (§229.405 of this chapter) is not contained herein, and will not be contained, to the best of registrant’s knowledge, in definitive proxy or information statements incorporated by reference in Part III of this Form 10-K or any amendment to this Form 10-K.
x
Indicate by check mark whether the registrant is a large accelerated filer, an accelerated filer, a non-accelerated filer, a smaller reporting company, or an emerging growth company. See the definitions of “large accelerated filer,” “accelerated filer”, “smaller reporting company”, and "emerging growth company" in Rule 12b-2 of the Exchange Act.
Large accelerated filer
x
Accelerated filer
o
Non-accelerated filer
o
Smaller reporting company
o
Emerging growth company
o
If an emerging growth company, indicate by check mark if the registrant has elected not to use the extended transition period for complying with any new or revised financial accounting standards provided pursuant to Section 13(a) of the Exchange Act.
o
Indicate by check mark whether the registrant is a shell company (as defined in Rule 12b-2 of the Act). Yes
o
No
x
As of
June 29, 2018
, which was the last business day of the registrant's most recently completed second fiscal quarter, the aggregate market value of Leidos Holdings, Inc. common stock (based upon the closing price of the stock on the New York Stock Exchange) held by non-affiliates of the registrant was
$8,841,791,254
.
The number of shares issued and outstanding of the registrant’s class of common stock as of
February 11, 2019
was
146,160,889
shares ($.0001 par value per share).
DOCUMENTS INCORPORATED BY REFERENCE
Portions of Leidos Holdings, Inc.'s definitive Proxy Statement for the 2019 Annual Meeting of Stockholders ("
2019 Proxy Statement
") are incorporated by reference in Part III of this Annual Report on Form 10-K.
LEIDOS HOLDINGS, INC.
FORM 10-K
TABLE OF CONTENTS
|
|
|
Page
|
|
|
|
|
|
Item 1.
|
||
|
Item 1A.
|
||
|
Item 1B.
|
||
|
Item 2.
|
||
|
Item 3.
|
||
|
Item 4.
|
||
|
|
|
|
|
Item 5.
|
||
|
Item 6.
|
||
|
Item 7.
|
||
|
Item 7A.
|
||
|
Item 8.
|
||
|
Item 9.
|
||
|
Item 9A.
|
||
|
Item 9B.
|
||
|
|
|
|
|
Item 10.
|
||
|
Item 11.
|
||
|
Item 12.
|
||
|
Item 13.
|
||
|
Item 14.
|
||
|
|
|
|
|
Item 15.
|
||
|
Item 16.
|
||
Item 1.
Business
Our Company
Leidos Holdings, Inc. ("Leidos"), a Delaware corporation, is a holding company whose direct 100%-owned subsidiary and principal operating company is Leidos, Inc. Leidos was founded in 1969 by physicist Dr. Robert Beyster. Since our founding 50 years ago, we have applied our expertise in science, research and engineering in rapidly evolving technologies and markets to solve complex problems of global concern.
We use the terms "Company," "we," "us" and "our" to refer collectively to Leidos Holdings, Inc. and its consolidated subsidiaries.
Leidos is
a FORTUNE 500
®
science, engineering and information technology company that provides services and solutions in the defense, intelligence, civil and health markets. We bring domain-specific capability and cross-market innovations to customers in each of these markets by leveraging seven core capabilities:
enterprise modernization; cyber operations; operations and logistics; mission software systems; integrated systems; sensors and phenomenology; and mission support
. Applying our technically advanced solutions to help solve our customers' most difficult problems has enabled us to build strong relationships with key customers. Our domestic customers include the U.S. Department of Defense ("DoD"), the U.S. Intelligence Community, the U.S. Department of Homeland Security ("DHS"), the Federal Aviation Administration ("FAA"), the Department of Veterans Affairs ("VA") and many other U.S. government civilian agencies, as well as state and local government agencies. With a focus on delivering mission-critical solutions, Leidos generated
85%
of fiscal
2018
revenues from U.S. government contracts.
Building on our foundation in offering innovative services and solutions to U.S. government customers, Leidos serves international government and broader commercial markets. Our international customers include foreign governments and their agencies, primarily located in Australia and the United Kingdom ("U.K."). By leveraging expertise in multiple disciplines, tailoring our services and solutions to the particular needs of our targeted markets and using advanced analytics, we work to securely deliver services and solutions that not only meet customers' current goals, but also support their future missions.
For additional discussion and analysis related to recent business developments, see "Business Environment and Trends" in "Management's Discussion and Analysis of Financial Condition and Results of Operations" in Part II of this Annual Report on Form 10-K.
Our Business Segments
During fiscal 2017, we completed a business reorganization, which resulted in the identification of new reportable segments. We commenced operating and reporting under the new organization structure effective the beginning of fiscal 2017. As a result of this change, fiscal 2016 segment results and disclosures have been recast to reflect the new reportable segments.
At
December 28, 2018
, our business is aligned into three reportable segments (Defense Solutions, Civil and Health). Additionally, we separately present the costs associated with corporate functions as Corporate. Our operations and reportable segments are organized around the markets served and the nature of the products and services provided to customers in those markets. We provide a wide array of scientific, engineering and technical services and solutions across these reportable segments. Less than
10%
of our revenues and tangible long-lived assets are generated by or owned by entities located outside of the United States.
Defense Solutions
Defense Solutions is focused on rapidly deploying agile, cost-effective solutions to meet the ever-changing missions of our customers in the areas of intelligence surveillance and reconnaissance ("ISR"), enterprise information technology ("IT"), integrated systems, cybersecurity and global services. We provide a diverse portfolio of national security solutions and systems for air, land, sea, space and cyberspace for the U.S. Intelligence Community, the DoD, military services, DHS, government agencies of U.S. allies abroad and other federal, civilian and commercial customers in the national security industry. Our solutions deliver innovative technology, large-scale intelligence systems, command and control platforms, data analytics, logistics and cybersecurity solutions, as well as intelligence analysis and operations support to critical missions around the world. Defense Solutions represented
48%
,
49%
and
55%
of total revenues for fiscal
2018
,
2017
and
2016
, respectively.
Leidos Holdings, Inc. Annual Report -
1
Our Defense Solutions business offers broad technology, development and integration capabilities and is responsible for leading our efforts in surveillance and reconnaissance, integrated systems solutions and global services for the U.S. Intelligence Community, military commands and other government and commercial customers.
|
•
|
Surveillance and Reconnaissance –
We offer a wide range of technologies in multiple domains that address the nation's most critical threats and deliver solutions to the U.S. Intelligence Community, DoD and military services. A primary focus is on the DoD's technology organizations, which include the Defense Advanced Research Projects Agency, Army Research Lab, Air Force Research Lab and Office of Naval Research. Our market concentration is on airborne and ground ISR, maritime systems, electronic warfare systems, distributed sensor systems, autonomous systems and command and control. We provide multi-spectral, airborne, ground and maritime ISR collection and processing systems, advanced sensor design, command and control solutions and training systems.
|
|
•
|
Enterprise IT and Integrated Systems –
We offer extensive software development capabilities for intelligence and information systems and deliver mission and enterprise-level solutions to the U.S. and allied Intelligence Community, DoD, military services, DHS and the Australian Department of Defense. Our markets include cybersecurity, data analytics, enterprise IT and operations and logistics. Our cybersecurity solutions detect and manage the most sophisticated cyber threats. We offer innovative data analytics capabilities, and we design, develop, integrate, deploy and support information-centric software and enterprise IT systems for complex, data-driven national security challenges. Our operations and logistics offerings include enterprise platforms that speed the supply chain of highly complex systems.
|
|
•
|
Global Services –
We provide high-end services to the U.S. Intelligence Community, DoD and federal civilian agencies. Operating around the world daily, we provide intelligence analysis, operational support, security, linguistics and training. In addition, we deliver tailored IT services and solutions to our customers across the globe.
|
Civil
Our Civil business is focused on seamlessly integrating and protecting physical, digital and data domains. By applying leading science, effective technologies and business acumen, our talented employees help customers maximize their performance and take on the connected world with data-driven insights, improved efficiencies and technological advantages. Civil represented
34%
,
33%
and
29%
of total revenues for fiscal
2018
,
2017
and
2016
, respectively.
|
•
|
Aviation Solutions –
Leidos is a trusted systems integrator serving Air Navigation Service Providers including the FAA, the Transportation Security Administration ("TSA") and airport operators. Our work in airport modernization helps stakeholders achieve stated objectives, including increased operational efficiency and safety, a technology enhanced passenger experience, non-aeronautical revenue enablement and state-of-the-art situational awareness and security. Leidos air traffic control systems are used in Air Navigation Service Provider facilities that control more than 60 percent of the world's air traffic. We work diligently to support the FAA's NextGen program with government accepted systems including En Route Automation Modernization, Advanced Technology Oceanic Procedures, Time Based Flow Management and Terminal Flight Data Management. For the National Air Traffic Services system in the U.K., we offer the SkyLine Air Traffic Management suite to enhance safety, improve on-time performance and increase fuel efficiency.
|
|
•
|
Security Products –
Our Vehicle and Cargo Inspection Systems enable the rapid scanning of vehicles and cargo using patented technology that produces a high-quality image using a low radiation dose while using less space and processing higher volumes of cars and trucks than other scanning systems. Our Reveal line of explosive detection systems for checked airline baggage pioneered the "reduced size" segment of this market with small, flexible systems that can be installed at airport check-in counters. We also have a line of radiation detection systems, which are used today at ports, border crossings and industrial facilities around the world – including most ports and border crossings in the United States.
|
Leidos Holdings, Inc. Annual Report -
2
|
•
|
Enterprise IT Services –
We deliver secure, user-centric IT solutions in cloud computing, mobility, application modernization, DevOps, data center and network modernization, asset management, help desk operations and digital workplace enablement
.
We help our customers achieve their missions and business goals by delivering purpose-built solutions, cybersecurity as a standard, efficient project delivery and end-user satisfaction. Leidos is modernizing enterprise IT for CONUS/OCONUS programs in classified and unclassified environments, including programs with the General Services Administration ("GSA"), the Department of Housing and Urban Development and the Department of Justice.
|
|
•
|
Federal Environment and Infrastructure –
We are trusted by civilian and defense agencies with substantial environmental and sustainability driven missions. Our pedigree across environmental management, nuclear security, energy efficiency, infrastructure management, mission support and IT modernization provides the applicable expertise needed to transform operations while modernizing aging infrastructure and maintaining environmental stewardship. We support several of the Department of Energy's largest nuclear production, operations and remediation sites. At Hanford, we provide site-wide infrastructure management and operation including oversight of land and logistics, public works, information technology, fleet transportation, environmental sustainability and compliance, first responder services and future project planning. Our environmental engineers and scientists address all aspects of remediation for soil, groundwater, surface water and sediment, including removal, treatment, bioremediation, containment, resource management, land use and institutional controls, air emission control and monitoring and remedy performance monitoring and reviews, including National Emergency Rapid Response.
|
|
•
|
Logistics –
Leidos is a global leader in large-scale, complex operations and logistics. Our programs extend from the bottom of the world on the Antarctic ice to the orbiting outpost that is the International Space Station. Our expertise goes beyond supply sourcing, shipping, warehousing and maintenance as we also provide systems engineering, specialized product support, training and field readiness, base operations, data analytics and software development. We are helping our customers, including the United Kingdom Ministry of Defence ("U.K. MoD"), the National Science Foundation ("NSF") and the National Aeronautics and Space Administration ("NASA"), streamline logistics through data analytics so more of their budgets can be applied to their mission activities.
|
Health
Our Health business is focused on delivering effective and affordable solutions to federal and commercial customers that are responsible for the health and well-being of people worldwide including service members and veterans. Our solutions enable customers to deliver on the health mission of providing high quality, cost effective care, and are accomplished through the integration of information technology, engineering, health and life sciences, clinical insights and health policy. The capabilities we provide are principally encapsulated by four major areas of activity: complex systems integration, managed health services, enterprise IT transformation and life sciences. Health represented
18%
of total revenues for fiscal
2018
and
2017
and
16%
of total revenues for fiscal
2016
.
|
•
|
Complex Systems Integration
– Leidos employs whole-systems thinking in fielding applied technology solutions across the entire continuum of care. We are working as the lead systems integrator deploying the next generation electronic health records system to DoD hospitals and treatment facilities worldwide, responsible for architecture, cyber and complex systems integration. We provide information technology solutions to the VA, National Institutes of Health, DoD and other government customers. Commercially, we are one of the largest systems integration and staff support firms for hospitals deploying modern electronic health records, and combined with our federal work, Leidos has a significant presence in electronic health record implementation, optimization and support. In addition, we provide consulting, platform integration services and support across a broad range of health operational activities including value based care enablement solutions, IT strategy, revenue cycle management, accountable care transformation, risk management, technology infrastructure and project management. Our teams are staffed with clinical subject matter experts who draw upon their deep experience and knowledge of healthcare and IT systems.
|
Leidos Holdings, Inc. Annual Report -
3
|
•
|
Managed Health Services
– We deploy a national footprint of health clinics and health providers to support care delivery services, including medical disability examinations for the Veterans Administration (including behavioral assessments), as well as serving other independent medical exam markets. We have developed unique capabilities in behavioral health management through many decades of experience with a special emphasis on substance abuse services. Our managed health services activities leverage our IT and mission enablement capabilities which underpin solutions we offer to our customers across all of our served markets.
|
|
•
|
Enterprise IT Transformation
– We manage the entire lifecycle of the IT journey for our customers. Our expertise includes IT strategic planning, outsourcing and management of large scale data centers, agile software development and system transformation, cloud migration and application modernization, digitization and advanced analytics. Our customers include the Centers for Medicare & Medicaid Services, Food and Drug Administration, Social Security Administration, VA and commercial customers. Leidos helps transform our customers' IT environments in support of their most critical missions. All of this is accomplished in a highly secure manner by leveraging our cybersecurity capabilities.
|
|
•
|
Life Sciences –
We provide life science research and development support to the National Institutes of Health, Center for Disease Control, Army Medical Research community, commercial biotech companies and the Frederick National Laboratory for Cancer Research, where we employ approximately
2,300
scientists, technicians, administrators and support staff. Our professionals operate a wide range of leading-edge research and development laboratories in the areas of genetics and genomics, proteins and proteomics, advanced biomedical computing and information technology, biopharmaceutical development and manufacturing, nanotechnology characterization and clinical trials management.
|
From the biomedical sciences to implementing and optimizing electronic health records to enabling providers to perform care coordination and population health management, Leidos is pioneering the use of systems integration principles, processes and technologies to transform the health industry’s evolution towards better quality, more cost-effective and safe care.
Corporate
Corporate includes the operations of various corporate activities, certain expense items that are not reimbursed by our U.S. government customers and certain other expense items excluded from a reportable segment's performance.
Acquisitions and Divestitures
On August 16, 2016, a wholly-owned subsidiary of Leidos Holdings, Inc. merged with the Information Systems & Global Solutions business (the "IS&GS Business") of Lockheed Martin Corporation in a Reverse Morris Trust transaction. See "Management's Discussion and Analysis of Financial Condition and Results of Operations–Lockheed Martin Transaction" and "
Note 6—Acquisitions
" in Part II of this Annual Report on Form 10-K for a further description of the Lockheed Martin Transaction.
During fiscal 2016, we divested of our heavy construction business. For further information, see "
Note 7—Divestitures
" in Part II of this Annual Report on Form 10-K.
Key Customers
Substantially all of our revenues are generated in the United States. Our consolidated revenues are largely attributable to prime contracts or to subcontracts with other contractors engaged in work for the U.S. government, with the remaining attributable to international customers, including the U.K. MoD and Australian Department of Defense, and customers across a variety of commercial markets. Within the U.S. government, our revenues are diversified across many agencies, including various intelligence agencies, the U.S. Army, Navy and Air Force, DHS, FAA, TSA, the Defense Health Agency, VA, Department of Health and Human Services, NASA, NSF, the Environmental Protection Agency and research agencies such as the Defense Advanced Research Projects Agency.
Leidos Holdings, Inc. Annual Report -
4
The percentage of total revenues for the U.S. government, its agencies and other customers comprising more than
10%
of consolidated revenues for the periods presented were as follows:
|
|
Year Ended
|
||||||||
|
|
December 28,
2018 |
December 29,
2017 |
December 30,
2016 |
||||||
|
U.S. Government
|
85
|
%
|
84
|
%
|
81
|
%
|
|||
|
U.S. DoD
|
47
|
%
|
47
|
%
|
56
|
%
|
|||
|
U.S. Army
|
13
|
%
|
13
|
%
|
14
|
%
|
|||
These customers have a number of subsidiary agencies that have separate budgets and procurement functions. Our contracts may be with the highest level of these agencies or with the subsidiary agencies of these customers.
Employees
As of
December 28, 2018
, we employed approximately
32,000
full and part-time employees in more than
30
countries worldwide. The experience and expertise of our employees makes Leidos capable of solving our customers' most challenging technical problems. Approximately
38%
of our employees have degrees in science, technology, engineering or mathematics fields, nearly
1,000
employees have doctoral degrees, approximately
39%
of our employees possess security clearances and approximately
22%
of our employees are military veterans.
Research and Development
We conduct research and development activities under customer-funded contracts and with company-funded internal research and development ("IR&D") funds. IR&D efforts consist of projects involving basic research, applied research, development and systems and other concept formulation studies. IR&D expenses are included in selling, general and administrative expenses and are generally allocated to U.S. government contracts. For fiscal
2018
,
2017
and
2016
, our company-funded IR&D expense was
$46 million
,
$42 million
and
$44 million
, respectively, which as a percentage of consolidated revenues was
0.5%
,
0.4%
and
0.6%
, respectively. We charge expenses for research and development activities performed under customer contracts directly to cost of revenues for those contracts.
Intellectual Property Rights
Our technical services and products are not generally dependent upon patent protection, although we do selectively seek patent protection. We claim a proprietary interest in certain of our products, software programs, methodologies and know-how. This proprietary information is protected in confidence as trade secrets, using non-disclosure agreements, contracts and other definitive agreements. We selectively pursue opportunities to license or transfer our technologies to third parties.
In connection with the performance of services and solutions, the U.S. government has certain rights to inventions, data, software codes and related material that we develop under U.S. government-funded contracts and subcontracts. Generally, the U.S. government may disclose or license such information to third parties, including, in some instances, our competitors. In the case of some subcontracts that we perform, the prime contractor generally obtains rights to use the programs and products that we deliver under the subcontract to perform its prime contract obligations.
Competition
Competition for contracts is significant, and we often compete against a large number of well established corporations that may have greater name and brand recognition. We also compete against smaller, more specialized companies that concentrate their resources on particular areas, as well as the U.S. government’s own capabilities and federal non-profit contract research centers. As a result of the diverse requirements of the U.S. government and our commercial customers, we frequently collaborate with other companies to compete for large contracts and bid against these same companies in other situations.
Leidos Holdings, Inc. Annual Report -
5
We believe that our principal competitors currently include the following companies: BAE Systems plc, Booz Allen Hamilton Inc., CACI International Inc., General Dynamics Corporation, L3 Technologies, Lockheed Martin Corporation, ManTech International Corporation, Northrop Grumman Corporation, Perspecta Inc., Raytheon Company and SAIC. These companies span across sectors that include engineering and technical services divisions of large defense contractors, diversified U.S. and international IT providers and contractors focused solely on technical services, supply chain management, other logistics services and major systems operations and maintenance, homeland security and health solutions.
We compete on various factors, including our technical expertise and qualified professional and/or security-cleared personnel; our ability to deliver innovative cost-effective solutions in a timely manner; successful program execution; our reputation and standing with customers; pricing; and the size and geographic presence of our company.
The U.S. government has indicated that it intends to increase competition for future procurement of products and services, which has led to fewer sole source awards and more emphasis on cost-competitiveness and affordability. The U.S. government is also committed to maintaining a socioeconomically diverse base of suppliers, which may lead to contracts being set aside for smaller businesses. In addition, procurement initiatives to improve efficiency, refocus priorities and enhance best practices could result in fewer new opportunities for our industry as a whole, which would intensify competition within the industry as companies compete for a more limited set of new programs.
Contract Procurement
Our business is heavily regulated and we must comply with and are affected by laws and regulations relating to the formation, administration and performance of U.S. government and other contracts. The U.S. government procurement environment has evolved due to statutory and regulatory procurement reform initiatives. Today, U.S. government customers employ several contracting methods to purchase services and products. Budgetary pressures and reforms in the procurement process have caused many U.S. government customers to increasingly purchase services and products using contracting methods that give them the ability to select multiple contract winners or pre-qualify certain contractors to provide services or products on established general terms and conditions rather than through single-award contracts. The predominant contracting methods through which U.S. government agencies procure services and products include the following:
|
•
|
Definitive Award Contracts. U.S. government agencies may procure services and products through single definitive award contracts which specify the scope of services or products purchased and identify the contractor that will provide the specified services or products. When an agency has a requirement, the agency will issue a solicitation or request for proposal to which interested contractors can submit a proposal. The bidding and selection process can take a year or more to complete. For the contractor, this method of contracting may provide greater certainty of the timing and amounts to be received at the time of contract award because it generally results in the customer contracting for a specific scope of services or products from the single definitive successful awardee.
|
|
•
|
Indefinite Delivery/Indefinite Quantity ("IDIQ") Contracts. The U.S. government uses IDIQ contracts to obtain commitments from contractors to provide certain services or products on pre-established terms and conditions. The U.S. government then issues task orders under the IDIQ contracts to purchase the specific services or products it needs. IDIQ contracts are awarded to one or more contractors following a competitive procurement process. Under a single-award IDIQ contract, all task orders under that contract are awarded to one pre-established contractor. Under a multiple-award IDIQ contract, task orders can be awarded to any of the pre-established contractors, which can result in further limited competition for the award of task orders. Multiple-award IDIQ contracts that are open for any government agency to use for procurement are commonly referred to as "government-wide acquisition contracts." IDIQ contracts often have multi-year terms and unfunded ceiling amounts, therefore enabling, but not committing, the U.S. government to purchase substantial amounts of services or products from one or more contractors. At the time an IDIQ contract is awarded (prior to the award of any task orders), a contractor may have limited or no visibility as to the ultimate amount of services or products that the U.S. government will purchase under the contract, and in the case of a multiple-award IDIQ, the contractor from which such purchases may be made.
|
Leidos Holdings, Inc. Annual Report -
6
|
•
|
U.S. GSA Schedule Contracts. The GSA maintains listings of approved suppliers of services and products with agreed-upon prices for use throughout the U.S. government. In order for a company to provide services under a GSA Schedule contract, a company must be pre-qualified and awarded a contract by the GSA. When an agency uses a GSA Schedule contract to meet its requirements, the agency, or the GSA on behalf of the agency, conducts the procurement. The user agency, or the GSA on its behalf, evaluates the user agency’s requirements and initiates a competition limited to GSA Schedule qualified contractors. GSA Schedule contracts are designed to provide the user agency with reduced procurement time and lower procurement costs. Similar to IDIQ contracts, at the time a GSA Schedule contract is awarded, a contractor may have limited or no visibility as to the ultimate amount of services or products that the U.S. government will purchase under the contract.
|
We often partner with other companies, including our competitors, to submit bids for large U.S. government procurements or other opportunities where we believe that the combination of services and products that we can provide as a team will help us win and perform the contract. Our relationships with our partners, including whether we serve as the prime contractor or as a subcontractor, vary with each contract opportunity and typically depend on the program, contract or customer requirements, as well as the relative size, qualifications, capabilities, customer relationships and experience of our company and our partners.
Contracting with the U.S. government also subjects us to substantial regulation and unique risks, including the U.S. government’s ability to cancel any contract at any time through a termination for the convenience of the U.S. government. Most of our contracts have cancellation terms that would permit us to recover all or a portion of our incurred costs and fees for work performed where the U.S. government issues a termination for convenience. These regulations and risks are described in more detail below under "Business–Regulation" and "Risk Factors" in this Annual Report on Form 10-K.
Contract Types
Generally, the type of contract for our services and products is determined by or negotiated with the U.S. government and may depend on certain factors, including the type and complexity of the work to be performed, degree and timing of the responsibility to be assumed by the contractor for the costs of performance, the extent of price competition and the amount and nature of the profit incentive offered to the contractor for achieving or exceeding specified standards or goals. We generate revenues under several types of contracts, including the following:
|
•
|
Cost-reimbursement contracts include cost-plus-fixed-fee, award-fee and incentive
-
fee contracts. These contracts provide for reimbursement of our direct contract costs and allocable indirect costs, plus a fee. These contracts are generally used when uncertainties involved in contract performance do not permit costs to be estimated with sufficient accuracy to use a fixed-price contract. Cost-reimbursement contracts generally subject us to lower risk but generally require us to use our best efforts to accomplish the scope of the work within a specified time and budget. Award and incentive fees are generally based on performance criteria such as cost, schedule, quality and/or technical performance. Award fees are determined and earned based on customer evaluation of the company's performance against contractual criteria. Incentive fees that are based on cost provide for an initially negotiated fee to be adjusted later, typically using a formula to measure performance against the associated criteria, based on the relationship of total allowable costs to total target costs.
|
|
•
|
Fixed-price-incentive-fee ("FP-IF") contracts are substantially similar to cost-plus-incentive-fee contracts except they require specified targets for cost and profit, price ceiling (but not a profit ceiling or floor) and profit adjustment formula. Under an FP-IF contract, the allowable costs incurred are eligible for reimbursement but are subject to a cost-share arrangement, which affects profitability. Generally, if our costs exceed the contract target cost or are not allowable under the applicable regulations, we may not be able to obtain reimbursement for all costs and may have our fees reduced or eliminated.
|
Leidos Holdings, Inc. Annual Report -
7
|
•
|
Time-and-materials ("T&M") contracts typically provide for negotiated fixed hourly rates for specified categories of direct labor plus reimbursement of other direct costs. This type of contract is generally used when there is uncertainty about the extent or duration of the work to be performed by the contractor at the time of contract award or it is not possible to anticipate costs with any reasonable degree of confidence. On T&M contracts, we assume the risk of providing appropriately qualified staff to perform these contracts at the hourly rates set forth in the contracts over the period of performance of the contracts.
|
|
•
|
Fixed-price-level-of-effort ("FP-LOE") contracts are substantially similar to T&M contracts except they require a specified level of effort over a stated period of time on work that can be stated only in general terms. This type of contract is generally used when the contractor is required to perform an investigation or study in a specific research and development area and to provide a report showing the results achieved based on the level of effort. Payment is based on the effort expended rather than the results achieved.
|
|
•
|
Firm-fixed-price ("FFP") contracts provide for a fixed price for specified products, systems and/or services. This type of contract is generally used when the government acquires products and services on the basis of reasonably definitive specifications and which have a determinable fair and reasonable price. These contracts offer us potential increased profits if we can complete the work at lower costs than planned. While FFP contracts allow us to benefit from cost savings, these contracts also increase our exposure to the risk of cost overruns.
|
Our earnings and profitability may vary materially depending on changes in the proportionate amount of revenues derived from each type of contract and the nature of services or products provided, as well as the achievement of performance objectives and the stage of performance at which the right to receive fees, particularly under incentive-fee and award-fee contracts, is finally determined. Cost-reimbursement and T&M contracts generally have lower profitability than FFP contracts.
Backlog
Backlog represents the estimated amount of future revenues to be recognized under negotiated contracts as work is performed. Our backlog consists of funded backlog and negotiated unfunded backlog. Backlog includes priced option periods not yet exercised. We expect to recognize a substantial portion of our funded backlog from U.S. government customers as revenues within the next 12 months. However, the U.S. government may cancel any contract at any time through a termination for the convenience of the U.S. government. In addition, certain contracts with commercial or non-U.S. federal government customers included in funded backlog may include provisions that allow the customer to cancel at any time. Many of our contracts have cancellation terms that would permit us to recover all or a portion of our incurred costs and fees for work performed. For additional discussion and analysis of backlog, see "Results of Operations—Bookings and Backlog" in "Management's Discussion and Analysis of Financial Condition and Results of Operations" in Part II of this Annual Report on Form 10-K.
Seasonality
The U.S. government's fiscal year ends on September 30 of each year. While not certain, it is not uncommon for U.S. government agencies to award extra tasks or complete other contract actions in the timeframe leading up to the end of its fiscal year in order to avoid the loss of unexpended fiscal year funds, which may favorably impact our third fiscal quarter. In addition, our quarterly results may be impacted by the number of working days in a given quarter. We tend to generate less revenue from our labor services during the fourth quarter as a result of the holiday season. For selected quarterly financial data, see "Selected Quarterly Financial Data" in Part II of this Annual Report on Form 10-K.
Leidos Holdings, Inc. Annual Report -
8
Regulation
We are heavily regulated in most of the fields in which we operate. We provide services and products to numerous U.S. government agencies and entities, including to the DoD, the U.S. Intelligence Community and the DHS. When working with these and other U.S. government agencies and entities, we must comply with various laws and regulations relating to the formation, administration and performance of contracts. U.S. government contracts generally are subject to the Federal Acquisition Regulation ("FAR"), which sets forth policies, procedures and requirements for the acquisition of goods and services by the U.S. government, agency-specific regulations that implement or supplement the FAR, such as the Department of Defense Federal Acquisition Regulation Supplement, and other applicable laws and regulations. These regulations impose a broad range of requirements, many of which are unique to government contracting, including various procurement, import and export, security, contract pricing and cost, contract termination and adjustment and audit requirements. Among other things, these laws and regulations:
|
•
|
require certification and disclosure of all cost and pricing data in connection with certain contract negotiations;
|
|
•
|
define allowable and unallowable costs and otherwise govern our right to reimbursement under various cost-type U.S. government contracts;
|
|
•
|
require compliance with U.S. government Cost Accounting Standards ("CAS");
|
|
•
|
require reviews by the Defense Contract Audit Agency ("DCAA"), Defense Contract Management Agency ("DCMA") and other U.S. government agencies of compliance with government requirements for a contractor’s business systems;
|
|
•
|
restrict the use and dissemination of and require the protection of unclassified contract-related information and information classified for national security purposes and the export of certain products and technical data; and
|
|
•
|
require us not to compete for work if an actual or potential organizational conflict of interest, as defined by these laws and regulations, related to such work exists and/or cannot be appropriately mitigated, neutralized or avoided.
|
The U.S. government may revise its procurement practices or adopt new contract rules and regulations at any time. In order to help ensure compliance with these complex laws and regulations, all of our employees are required to complete ethics and other compliance trainings relevant to their position.
Some of our operations and service offerings involve access to and use by us of personally identifiable information and/or protected health information. These activities are regulated by extensive federal, state and international privacy and data security laws requiring organizations to provide certain privacy protections and security safeguards for such information.
Environmental Matters
Our operations are subject to various foreign, federal, state and local environmental protection and health and safety laws and regulations. In addition, our operations may become subject to future laws and regulations, including those related to climate change and environmental sustainability. See "Risk Factors" in this Annual Report on Form 10-K for further details. Although we do not currently anticipate that the costs of complying with, or the liabilities associated with, environmental laws will materially and adversely affect us, we cannot ensure that we will not incur material costs or liabilities in the future.
Company Website and Information
Our website can be accessed at
www.leidos.com
. The website contains information about our company and operations. Through a link on the Investor Relations section of our website, copies of each of our filings with the U.S. Securities and Exchange Commission ("SEC") on Form 10-K, Form 10-Q and Form 8-K, and all amendments to those reports, can be viewed and downloaded free of charge as soon as reasonably practicable after the reports and amendments are electronically filed with or furnished to the SEC. The information on our website is not incorporated by reference into and is not a part of this Annual Report on Form 10-K.
Leidos Holdings, Inc. Annual Report -
9
You may request a copy of the materials identified in the preceding paragraph, at no cost, by writing or telephoning us at our corporate headquarters at the following:
Leidos Holdings, Inc.
11951 Freedom Drive
Reston, VA 20190
Attention: Corporate Secretary
Telephone: (571) 526-6000
Leidos Holdings, Inc. Annual Report -
10
Item 1A.
Risk Factors
In your evaluation of our company and business, you should carefully consider the risks and uncertainties described below, together with information included elsewhere in this Annual Report on Form 10-K and other documents we file with the SEC. The risks and uncertainties described below are those that we have identified as material but are not the only risks and uncertainties facing us. If any of these risks or uncertainties actually occurs, our business, financial condition or operating results could be materially harmed and the price of our stock could decline. Our business is also subject to general risks and uncertainties that affect many other companies, such as our ability to collect receivables, overall U.S. and global economic and industry conditions, geopolitical events, changes in laws or accounting rules, fluctuations in interest and exchange rates, terrorism, international conflicts, major health concerns, climate change or other disruptions of expected economic and business conditions. Additional risks and uncertainties not currently known to us or that we currently believe are immaterial also may materially harm our business, financial condition or operating results and result in a decline in the price of our stock.
Risks Relating to Our Business
We depend on government agencies as our primary customer and if our reputation or relationships with these agencies were harmed, our future revenues and growth prospects would be adversely affected.
We generated
85%
,
84%
and
81%
of our total revenues during fiscal
2018
,
2017
and
2016
, respectively, from contracts with the U.S. government (including all branches of the U.S. military), either as a prime contractor or a subcontractor to other contractors engaged in work for the U.S. government. We generated more than
10%
of our total revenues during fiscal
2018
,
2017
and
2016
from the U.S. Army. We expect to continue to derive most of our revenues from work performed under U.S. government contracts. Our reputation and relationship with the U.S. government, and in particular with the agencies of the DoD and the U.S. Intelligence Community, are key factors in maintaining and growing our revenues. Negative press reports or publicity, which could pertain to employee or subcontractor misconduct; conflicts of interest; poor contract performance; deficiencies in services, reports, products or other deliverables; information security breaches or other aspects of our business, regardless of accuracy, could harm our reputation, particularly with these agencies. If our reputation is negatively affected, or if we are suspended or debarred from contracting with government agencies for any reason, the amount of business with government and other customers would decrease and our future revenues and growth prospects would be adversely affected.
A decline in the U.S. government budget, changes in spending or budgetary priorities or delays in contract awards may significantly and adversely affect our future revenues and limit our growth prospects.
Revenues under contracts with the DoD, either as a prime contractor or subcontractor to other contractors, represented approximately
47%
of our total revenues for fiscal
2018
and
2017
and
56%
of our total revenues for fiscal
2016
. Levels of U.S. government and DoD spending are difficult to predict and subject to significant risk. Our operating results could be adversely affected by spending caps or changes in the budgetary priorities of the U.S. government or the DoD, as well as delays in program starts or the award of contracts or task orders under contracts. Current U.S. government spending levels for defense-related or other programs may not be sustained and future spending and program authorizations may not increase or may decrease or shift to programs in areas in which we do not provide services or are less likely to be awarded contracts. Such changes in spending authorizations and budgetary priorities may occur as a result of uncertainty surrounding the federal budget, increasing political pressure and legislation, shifts in spending priorities from defense-related or other programs as a result of competing demands for federal funds, the number and intensity of military conflicts or other factors.
The U.S. government also conducts periodic reviews of U.S. defense strategies and priorities, which may shift DoD or other budgetary priorities, reduce overall U.S. government spending or delay contract or task order awards for defense-related or other programs, including programs from which we expect to derive a significant portion of our future revenues. In addition, changes to the federal or DoD acquisition system and contracting models could affect whether and how we pursue certain opportunities and the terms under which we are able to do so. A significant decline in overall U.S. government spending, including in the areas of national security, intelligence and homeland security, a significant shift in its spending priorities, the substantial reduction or elimination of particular defense-related programs or significant delays in contract or task order awards for large programs could adversely affect our future revenues and limit our growth prospects.
Leidos Holdings, Inc. Annual Report -
11
Because we depend on U.S. government contracts, a delay in the completion of the U.S. government's budget and appropriation process could delay procurement of the products, services and solutions we provide and have an adverse effect on our future revenues.
The funding of U.S. government programs is subject to an annual congressional budget authorization and appropriations process. In years when the U.S. government does not complete its appropriations before the beginning of the new fiscal year on October 1, government operations are typically funded pursuant to a "continuing resolution," which allows federal government agencies to operate at spending levels approved in the previous appropriations cycle, but does not authorize new spending initiatives. When the U.S. government operates under a continuing resolution, delays can occur in the procurement of the products, services and solutions that we provide and may result in new initiatives being canceled. We have from time to time experienced a decline in revenues in our fourth quarter as a result of this annual appropriations cycle, and we could experience similar declines in revenues from future delays in the appropriations process. When the U.S. government fails to complete its appropriations process or to provide for a continuing resolution, a full or partial federal government shutdown may result. A federal government shutdown could, in turn, result in our incurrence of substantial labor or other costs without reimbursement under customer contracts, the delay or cancellation of key programs or the delay of contract payments, which could have a negative effect on our cash flows and adversely affect our future results. In addition, when supplemental appropriations are required to operate the U.S. government or fund specific programs and passage of legislation needed to approve any supplemental appropriations bill is delayed, the overall funding environment for our business could be adversely affected. For additional discussion and analysis of the potential of an ongoing U.S. government shutdown, see "Business Environment and Trends" in "Management's Discussion and Analysis of Financial Condition and Results of Operations" in Part II of this Annual Report on Form 10-K.
Our failure to comply with a variety of complex procurement rules and regulations could result in our being liable for penalties, including termination of our U.S. government contracts, disqualification from bidding on future U.S. government contracts and suspension or debarment from U.S. government contracting.
We must comply with laws and regulations relating to the formation, administration and performance of U.S. government contracts, which affect how we do business with our customers and may impose added costs on our business. Some significant statutes and regulations that affect us include:
|
•
|
the FAR and supplements, which regulate the formation, administration and performance of U.S. government contracts;
|
|
•
|
the Truth in Negotiations Act, which requires certification and disclosure of cost and pricing data in connection with certain contract negotiations;
|
|
•
|
the Procurement Integrity Act, which regulates access to competitor bid and proposal information and government source selection information and our ability to provide compensation to certain former government officials;
|
|
•
|
the Civil False Claims Act, which provides for substantial civil penalties for violations, including for submission of a false or fraudulent claim to the U.S. government for payment or approval; and
|
|
•
|
the U.S. government CAS, which imposes accounting requirements that govern our right to reimbursement under certain cost-based U.S. government contracts.
|
The FAR and many of our U.S. government contracts contain organizational conflict of interest clauses that may limit our ability to compete for or perform certain other contracts or other types of services for particular customers. Organizational conflicts of interest arise when we engage in activities that may make us unable to render impartial assistance or advice to the U.S. government, impair our objectivity in performing contract work or provide us with an unfair competitive advantage. A conflict of interest issue that precludes our competition for or performance on a significant program or contract could harm our prospects.
Leidos Holdings, Inc. Annual Report -
12
The U.S. government may adopt new contract rules and regulations or revise its procurement practices in a manner adverse to us at any time.
Our industry has experienced, and we expect it will continue to experience, significant changes to business practices as a result of an increased focus on affordability, efficiencies and recovery of costs, among other items. U.S. government agencies may face restrictions or pressure regarding the type and amount of services that they may obtain from private contractors. Legislation, regulations and initiatives dealing with procurement reform, mitigation of potential conflicts of interest and environmental responsibility or sustainability, as well as any resulting shifts in the buying practices of U.S. government agencies, such as increased usage of fixed-price contracts, multiple-award contracts and small business set-aside contracts, could have adverse effects on government contractors, including us. Any of these changes could impair our ability to obtain new contracts or renew our existing contracts when those contracts are recompeted. Any new contracting requirements or procurement methods could be costly or administratively difficult for us to implement and could adversely affect our future revenues, profitability and prospects.
Our business is subject to reviews, audits and cost adjustments by the U.S. government, which, if resolved unfavorably to us, could adversely affect our profitability, cash position or growth prospects.
U.S. government agencies, including the DCAA, DCMA and others, routinely audit and review a contractor's performance on government contracts, indirect rates and pricing practices and compliance with applicable contracting and procurement laws, regulations and standards. They also review the adequacy of the contractor’s compliance with government standards for its business systems, including; a contractor's accounting system, earned value management system, estimating system, materials management and accounting system, property management system and purchasing system.
Both contractors and the U.S. government agencies conducting these audits and reviews have come under increased scrutiny. As a result, the current audits and reviews have become more rigorous and the standards to which we are held are being more strictly interpreted, increasing the likelihood of an audit or review resulting in an adverse outcome. During the course of its current audits, the DCAA is closely examining and questioning several of our long established and disclosed practices that it had previously audited and accepted, increasing the uncertainty as to the ultimate conclusion that will be reached.
A finding of significant control deficiencies in our system audits or other reviews can result in decremented billing rates to our U.S. government customers until the control deficiencies are corrected and our remediations are accepted by DCMA. Government audits and reviews may conclude that our practices are not consistent with applicable laws and regulations and result in adjustments to contract costs and mandatory customer refunds. Such adjustments can be applied retroactively, which could result in significant customer refunds. Our receipt of adverse audit findings or the failure to obtain an "approved" determination of our various business systems from the responsible U.S. government agency could significantly and adversely affect our business, including our ability to bid on new contracts and our competitive position in the bidding process. A determination of non-compliance with applicable contracting and procurement laws, regulations and standards could also result in the U.S. government imposing penalties and sanctions against us, including withholding of payments, suspension of payments and increased government scrutiny that could delay or adversely affect our ability to invoice and receive timely payment on contracts, perform contracts or compete for contracts with the U.S. government.
As of
December 28, 2018
, indirect cost audits by the DCAA remain open for
fiscal 2013
and subsequent fiscal years. Although we have recorded contract revenues based upon our estimate of costs that we believe will be approved upon final audit or review, we cannot predict the outcome of any ongoing or future audits or reviews and adjustments and, if future adjustments exceed our estimates, our profitability may be adversely affected.
Leidos Holdings, Inc. Annual Report -
13
Our business is subject to governmental review and investigation which could adversely affect our financial position, operating results and growth prospects.
We are routinely subject to governmental investigations relating to compliance with various laws and regulations with respect to our role as a contractor to federal, state and local government customers and in connection with performing services in countries outside the United States. If a review or investigation identifies improper or illegal activities, we may be subject to civil or criminal penalties or administrative sanctions, including the termination of contracts, forfeiture of profits, the triggering of price reduction clauses, suspension of payments, fines and suspension or debarment from doing business with governmental agencies. We may suffer harm to our reputation if allegations of impropriety are made against us, which would impair our ability to win new contract awards or receive contract renewals. Penalties and sanctions are not uncommon in our industry. If we incur a material penalty or administrative sanction or otherwise suffer harm to our reputation, our revenues, profitability, cash position and future prospects could be adversely affected. More generally, increases in scrutiny and investigations from government organizations, legislative bodies or agencies into business practices and into major programs supported by contractors may lead to increased legal costs and may harm our reputation, revenues, profitability and growth prospects.
Misconduct of employees, subcontractors, agents and business partners could cause us to lose existing contracts or customers and adversely affect our ability to obtain new contracts and customers and could have a significant adverse impact on our business and reputation.
Misconduct could include fraud or other improper activities such as falsifying time or other records and violations of laws, including the Anti-Kickback Act. Other examples could include the failure to comply with our policies and procedures or with federal, state or local government procurement regulations; regulations regarding the use and safeguarding of classified or other protected information; legislation regarding the pricing of labor and other costs in government contracts, laws and regulations relating to environmental, health or safety matters; bribery of foreign government officials; import-export control; lobbying or similar activities and any other applicable laws or regulations. Any data loss or information security lapses resulting in the compromise of personal information or the improper use or disclosure of sensitive or classified information could result in claims, remediation costs, regulatory sanctions against us, loss of current and future contracts and serious harm to our reputation. Although we have implemented policies, procedures and controls to prevent and detect these activities, these precautions may not prevent all misconduct, and as a result, we could face unknown risks or losses. Our failure to comply with applicable laws or regulations or misconduct by any of our employees, subcontractors, agents or business partners could damage our reputation and subject us to fines and penalties, restitution or other damages, loss of security clearance, loss of current and future customer contracts and suspension or debarment from contracting with federal, state or local government agencies, any of which would adversely affect our business, reputation and our future results.
Due to the competitive process to obtain contracts and the likelihood of bid protests, we may be unable to achieve or sustain revenue growth and profitability.
We expect that a majority of the business that we seek in the foreseeable future will be awarded through a competitive bidding process. The U.S. government has increasingly relied on contracts that are subject to a continuing competitive bidding process, including IDIQ, GSA Schedule and other multi-award contracts, which has resulted in greater competition and increased pricing pressure. The competitive bidding process involves substantial costs and a number of risks, including significant cost and managerial time to prepare bids and proposals for contracts that may not be awarded to us, or that may be awarded but for which we do not receive meaningful task orders, and to the risk of inaccurately estimating the resources and costs that will be required to fulfill any contract we win. Following contract award, we may encounter significant expense, delay, contract modifications or even contract loss as a result of our competitors protesting the award of contracts to us in competitive bidding. Any resulting loss or delay of start-up and funding of work under protested contract awards may adversely affect our revenues and/or profitability. In addition, multi-award contracts require that we make sustained post-award efforts to obtain task orders under the contract. As a result, we may not be able to obtain these task orders or recognize revenues under these multi-award contracts. Our failure to compete effectively in this procurement environment would adversely affect our revenues and/or profitability.
Leidos Holdings, Inc. Annual Report -
14
The U.S. government may terminate, cancel, modify or curtail our contracts at any time prior to their completion and, if we do not replace them, this may adversely affect our future revenues and profitability.
Many of the U.S. government programs in which we participate as a contractor or subcontractor extend for several years and include one or more base years and one or more option years. These programs are normally funded on an annual basis. Under our contracts, the U.S. government generally has the right to not exercise options to extend or expand our contracts and may otherwise terminate, cancel, modify or curtail our contracts at its convenience. Any decisions by the U.S. government to not exercise contract options or to terminate, cancel, modify or curtail our major programs or contracts would adversely affect our revenues, revenue growth and profitability.
We have experienced and continue to experience periodic performance issues under certain of our contracts. Some of our contracts involve the development of complex systems and products to achieve challenging customer goals in a competitive procurement environment. As a result, we sometimes experience technological or other performance difficulties, which have in the past and may in the future result in delays, cost overruns and failures in our performance of these contracts. If a government customer terminates a contract for default, we may be exposed to liability, including for excess costs incurred by the customer in procuring undelivered services and products from another source. Depending on the nature and value of the contract, a performance issue or termination for default could cause our actual results to differ from those anticipated and could harm our reputation.
We face aggressive competition that can impact our ability to obtain contracts and therefore affect our future revenues and growth prospects.
Our business is highly competitive and we compete with larger companies that have greater name recognition, financial resources and a larger technical staff. We also compete with smaller, more specialized companies that are able to concentrate their resources on particular areas. Additionally, we compete with the U.S. government’s own capabilities and federal non-profit contract research centers.
The markets in which we operate are characterized by rapidly changing technology and the needs of our customers change and evolve regularly. Accordingly, our success depends on our ability to develop services and products that address these changing needs and to provide people and technology needed to deliver these services and products. To remain competitive, we must consistently provide superior service, technology and performance on a cost-effective basis to our customers. Our competitors may be able to provide our customers with different or greater capabilities or technologies or better contract terms than we can provide, including technical qualifications, past contract experience, geographic presence, price and the availability of qualified professional personnel. In addition, our competitors may consolidate or establish teaming or other relationships among themselves or with third parties to increase their ability to address customers’ needs. Accordingly, we anticipate that larger or new competitors or alliances among competitors may emerge, which may adversely affect our ability to compete.
A failure to attract, train and retain skilled employees, including our management team, would adversely affect our ability to execute our strategy and may disrupt our operations.
Our business involves the development of tailored services and solutions for our customers, a process that relies heavily upon the expertise and services of our employees. Our continued success depends on our ability to recruit and retain highly trained and skilled engineering, technical and professional personnel. Competition for skilled personnel is intense and competitors aggressively recruit key employees. In addition, many U.S. government programs require contractors to have security clearances. Depending on the level of required clearance, security clearances can be difficult and time-consuming to obtain and personnel with security clearances are in great demand. Particularly in highly specialized areas, it has become more difficult to retain employees and meet all of our needs for employees in a timely manner, which may affect our growth. Although we intend to continue to devote significant resources to recruit, train and retain qualified employees, we may not be able to attract, effectively train and retain these employees. Any failure to do so could impair our ability to perform our contractual obligations efficiently and timely meet our customers’ needs and win new business, which could adversely affect our future results.
Leidos Holdings, Inc. Annual Report -
15
In addition to attracting and retaining qualified engineering, technical and professional personnel, we believe that our success will also depend on the continued employment of a highly qualified and experienced senior management team and its ability to retain existing business and generate new business. Our senior management team is important to our business because personal reputations and individual business relationships are a critical element of retaining and obtaining customer contracts in our industry, particularly with agencies performing classified operations. An inability to retain appropriately qualified and experienced senior executives could cause us to lose customers or new business opportunities.
We may not realize as revenues the full amounts reflected in our backlog, which could adversely affect our expected future revenues and growth prospects.
As of
December 28, 2018
, our total backlog was
$20.8 billion
, including
$6.4 billion
in funded backlog. Due to the U.S. government's ability to not exercise contract options or to terminate, modify or curtail our programs or contracts and the rights of our non-U.S. government customers to cancel contracts and purchase orders in certain circumstances, we may realize less than expected or may never realize revenues from some of the contracts that are included in our backlog. Our unfunded backlog, in particular, contains management’s estimate of amounts expected to be realized on unfunded contract work that may never be realized as revenues. If we fail to realize as revenues amounts included in our backlog, our future revenues, profitability and growth prospects could be adversely affected.
Our earnings and profitability may vary based on the mix of our contracts and may be adversely affected by our failure to accurately estimate and manage costs, time and resources.
We generate revenues under various types of contracts, which include cost-reimbursement, FP-IF, T&M, FP-LOE and FFP contracts. Our earnings and profitability may vary materially depending on changes in the proportionate amount of revenues derived from each type of contract, the nature of services or products provided, as well as the achievement of performance objectives and the stage of performance at which the right to receive fees, particularly under incentive-fee and award-fee contracts, is finally determined. Cost-reimbursement and T&M contracts are generally less profitable than FFP contracts. Our operating results in any period may also be affected, positively or negatively, by customers' variable purchasing patterns of our more profitable proprietary products.
Our profitability is adversely affected when we incur contract costs that we cannot bill to our customers. To varying degrees, each of our contract types involves some risk that we could underestimate the costs and resources necessary to fulfill the contract. While FFP contracts allow us to benefit from cost savings, these contracts also increase our exposure to the risk of cost overruns. Revenues from FFP contracts represented approximately
31%
of our total revenues for fiscal
2018
. When making proposals on these types of contracts, we rely heavily on our estimates of costs and timing to complete the associated projects, as well as assumptions regarding technical issues. In each case, our failure to accurately estimate costs or the resources and technology needed to perform our contracts or to effectively manage and control our costs during performance could result, and in some instances has resulted, in reduced profits or in losses. More generally, any increased or unexpected costs or unanticipated delays in the performance of our contracts, including costs and delays caused by contractual disputes or other factors outside of our control, such as performance failures of our subcontractors, natural disasters or other force majeure events, could make our contracts less profitable than expected or unprofitable.
We use estimates in recognizing revenues, and if we make changes to estimates used in recognizing revenues, our profitability may be adversely affected.
We recognize revenue on our service based contracts primarily over time as there is continuous transfer of control to the customer over the duration of the contract as we perform the promised services, which generally requires estimates of total costs at completion, fees earned on the contract, or both. This estimation process, particularly due to the technical nature of the services performed and the long-term nature of certain contracts, is complex and involves significant judgment. Adjustments to original estimates are often required as work progresses, experience is gained and additional information becomes known, even though the scope of the work required under the contract may not change. Any adjustment as a result of a change in estimate is recognized as events become known. Changes in the underlying assumptions, circumstances or estimates could result in adjustments that may adversely affect our future financial results.
Leidos Holdings, Inc. Annual Report -
16
Legal disputes could require us to pay potentially large damage awards and could be costly to defend, which would adversely affect our cash balances and profitability, and could damage our reputation.
We are subject to a number of lawsuits and claims described in "Legal Proceedings" in Part I of this Annual Report on Form 10-K, as may be updated in our future filings with the SEC, including our Quarterly Reports on Form 10-Q. We are also subject to, and may become a party to, a variety of other litigation or claims and suits that arise from time to time in the ordinary course of our business. Adverse judgments or settlements in some or all of these legal disputes may result in significant monetary damages, penalties or injunctive relief against us. Any claims or litigation could be costly to defend, and even if we are successful or if fully indemnified or insured, could damage our reputation and make it more difficult to compete effectively or obtain adequate insurance in the future. Litigation and other claims, including those described in "Legal Proceedings," are subject to inherent uncertainties and management’s view of these matters may change in the future.
Our business and operations expose us to numerous legal and regulatory requirements, and any violation of these requirements could harm our business.
We are subject to numerous federal, state and foreign legal requirements on matters as diverse as data privacy and protection, employment and labor relations, immigration, taxation, anticorruption, import-export controls, trade restrictions, internal and disclosure control obligations, securities regulation and anti-competition. Compliance with diverse and changing legal requirements is costly, time-consuming and requires significant resources. We also conduct business in certain identified growth areas, such as health information technology, energy and environmental services, which are highly regulated and may expose us to increased compliance risk. Violations of one or more of these diverse legal requirements in the conduct of our business could result in significant fines and other damages, criminal sanctions against us or our officers, prohibitions on doing business and damage to our reputation. Violations of these regulations or contractual obligations related to regulatory compliance in connection with the performance of customer contracts could also result in liability for significant monetary damages, fines and/or criminal prosecution, unfavorable publicity and other reputational damage, restrictions on our ability to compete for certain work and allegations by our customers that we have not performed our contractual obligations.
Information security incidents could negatively impact our business and financial results or cause harm to our reputation or competitive position.
As a government contractor and a provider of information technology services operating in multiple regulated industries and geographies, we and our suppliers and subcontractors process and/or store sensitive information, including personally identifiable information, protected health information, personnel information, classified information, contractor unclassified information and financial information, concerning our business, employees and our customers. Therefore, we are continuously exposed to unauthorized attempts to compromise such sensitive information through cyber-attacks, insider threats and other information security threats, including physical break-ins and malicious insiders. Any electronic or physical break-in or other security breach or compromise may jeopardize security of information stored or transmitted through our information technology systems and networks. This could lead to disruptions in mission-critical systems, unauthorized release of confidential or otherwise protected information and corruption of data or systems.
Although we have implemented policies, procedures and controls to protect against, detect and mitigate these threats, we face advanced and persistent attacks on our information systems. Attempts by others to gain unauthorized access to sensitive information are constantly evolving, increasingly sophisticated and increasingly difficult to detect and successfully defend against. These attempts include covertly introducing malware to our computers and networks and impersonating authorized users, among others, and may be perpetrated by well-funded organized crime or state-sponsored efforts.
We seek to detect and investigate all information security incidents and to prevent their occurrence or recurrence. We continue to invest in and improve our threat protection, detection and mitigation policies, procedures and controls. In addition, we work with other companies in the industry and government participants on increased awareness and enhanced protections against information security and malicious insider threats. However, because of the evolving nature and sophistication of these security threats, which can be difficult to detect, there can be no assurance that our policies, procedures and controls have detected or will detect or prevent any of these threats and we cannot predict the full impact of any such past or future incident. We may be currently unaware of certain vulnerabilities or lack the capability to detect them, which may allow them to persist in our IT environment over long periods of time.
Leidos Holdings, Inc. Annual Report -
17
We may experience similar security threats to the information technology systems that we develop, install or maintain under customer contracts. Although we work cooperatively with our customers and other business partners, including our suppliers and subcontractors, to seek to minimize the impact of cyber and other security threats, we must rely on the safeguards put in place by those entities. Any remedial costs or other liabilities related to cyber or other security threats may not be fully insured or indemnified by other means. Occurrence of any of these security threats could disrupt our systems or those of our customers, impair our ability to provide services to our customers, result in product development delays, compromise confidential or technical business information and, as a result
,
expose us to claims, contract terminations and damages and could adversely affect our reputation, ability to win work on sensitive U.S. government contracts, business operations and financial results.
Internal system or service failures could disrupt our business and impair our ability to effectively provide our services and products to our customers, which could damage our reputation and adversely affect our revenues and profitability.
Any system or service disruptions, including those caused by ongoing projects to improve our information technology systems and the delivery of services, whether through our shared services organization or outsourced services, if not anticipated and appropriately mitigated, could have a material adverse effect on our business including, among other things, an adverse effect on our ability to perform on contracts, bill our customers for work performed on our contracts, collect the amounts that have been billed and produce accurate financial statements in a timely manner. We are also subject to systems failures, including network, software or hardware failures, whether caused by us, third-party service providers, cybersecurity threats, malicious insiders, natural disasters, power shortages, terrorist attacks or other events, which could cause loss of data and interruptions or delays in our business, cause us to incur remediation costs, subject us to claims and damage our reputation. In addition, the failure or disruption of our communications could cause us to interrupt or suspend our operations or otherwise adversely affect our business. Our property and business interruption insurance may be inadequate to compensate us for all losses that may occur as a result of any system or operational failure or disruption and, as a result, our future results could be adversely affected.
Customer systems failures could damage our reputation and adversely affect our revenues and profitability.
Many of the systems and networks that we develop, install and maintain for our customers involve managing and protecting personal information and information relating to national security and other sensitive government functions. While we have programs designed to comply with relevant privacy and security laws and restrictions, if a system or network that we develop, install or maintain were to fail or experience a security breach or service interruption, whether caused by us, third-party service providers, cybersecurity threats or other events, we may experience loss of revenue, remediation costs or face claims for damages or contract termination. Any such event could cause serious harm to our reputation and prevent us from having access to or being eligible for further work on such systems and networks. Our errors and omissions liability insurance may be inadequate to compensate us for all of the damages that we may incur and, as a result, our future results could be adversely affected.
Many of our contracts contain performance obligations that require innovative design capabilities, are technologically complex or are dependent upon factors not wholly within our control. Failure to meet these obligations could adversely affect our profitability and future prospects.
We design and develop technologically advanced and innovative products and services applied by our customers in a variety of environments. Problems and delays in development or delivery as a result of issues with respect to design, technology, licensing and patent rights, labor, learning curve assumptions or materials and components could prevent us from achieving contractual requirements.
In addition, our offerings cannot be tested and proven in all situations and are otherwise subject to unforeseen problems that could negatively affect revenue and profitability such as problems with quality and workmanship, country of origin, delivery of subcontractor components or services and unplanned degradation of product performance. Among the factors that may affect revenue and profits could be unforeseen costs and expenses not covered by insurance or indemnification from the customer, diversion of management focus in responding to unforeseen problems, loss of follow-on work, and, in the case of certain contracts, repayment to the government customer of contract costs and fee payments we previously received.
Leidos Holdings, Inc. Annual Report -
18
We have contracts with the U.S. government that are classified, which may limit investor insight into portions of our business.
We derive a portion of our revenues from programs with the U.S. government that are subject to security restrictions (classified programs), which preclude the dissemination of information that is classified for national security purposes. We are limited in our ability to provide information about these classified programs, their risks or any disputes or claims relating to such programs. As a result, investors have less insight into our classified programs than our other businesses and therefore less ability to fully evaluate the risks related to our classified business.
We have made and continue to make acquisitions, investments, joint ventures and divestitures that involve numerous risks and uncertainties.
We selectively pursue strategic acquisitions, investments and joint ventures. These transactions require significant investment of time and resources and may disrupt our business and distract our management from other responsibilities. Even if successful, these transactions could reduce earnings for a number of reasons, including the amortization of intangible assets, impairment charges, acquired operations that are not yet profitable or the payment of additional consideration under earn-out arrangements if an acquisition performs better than expected. Acquisitions, investments and joint ventures pose many other risks that could adversely affect our reputation, operations or financial results, including:
|
•
|
we may not be able to identify, compete effectively for or complete suitable acquisitions and investments at prices we consider attractive;
|
|
•
|
we may not be able to accurately estimate the financial effect of acquisitions and investments on our business, and we may not realize anticipated synergies or acquisitions may not result in improved operating performance;
|
|
•
|
we may encounter performance problems with acquired technologies, capabilities and products, particularly with respect to those that are still in development when acquired;
|
|
•
|
we may have trouble retaining key employees and customers of an acquired business or otherwise integrating such businesses, such as incompatible accounting, information management or other control systems, which could result in unforeseen difficulties;
|
|
•
|
we may assume material liabilities that were not identified as part of our due diligence or for which we are unable to receive a purchase price adjustment or reimbursement through indemnification;
|
|
•
|
we may assume legal or regulatory risks, particularly with respect to smaller businesses that have immature business processes and compliance programs;
|
|
•
|
acquired entities or joint ventures may not achieve expected business growth or operate profitably, which could adversely affect our operating income or operating margins, and we may be unable to recover investments in any such acquisitions;
|
|
•
|
acquisitions, investments and joint ventures may require us to spend a significant amount of cash or to issue capital stock, resulting in dilution of ownership; and
|
|
•
|
we may not be able to effectively influence the operations of our joint ventures, or we may be exposed to certain liabilities if our joint venture partners do not fulfill their obligations.
|
If our acquisitions, investments or joint ventures fail, perform poorly or their value is otherwise impaired for any reason, including contractions in credit markets and global economic conditions, our business and financial results could be adversely affected.
In addition, we periodically divest businesses, including businesses that are no longer a part of our ongoing strategic plan. These divestitures similarly require significant investment of time and resources, may disrupt our business, distract management from other responsibilities and may result in losses on disposal or continued financial involvement in the divested business, including through indemnification, guarantee or other financial arrangements, for a period of time following the transaction, which would adversely affect our financial results.
Leidos Holdings, Inc. Annual Report -
19
Goodwill and other intangible assets represent approximately
63%
of our total assets and any impairment of these assets could negatively impact our results of operations.
Intangible assets with indefinite lives, including goodwill, are tested for impairment at least annually or whenever events or changes in circumstances indicate that the carrying value may not be recoverable. Intangible assets with finite lives are assessed for impairment whenever events or changes in circumstances indicate that the carrying value may not be recoverable. Examples of events or changes in circumstances indicating that the carrying value of intangible assets may not be recoverable could include a significant adverse change in legal factors or in the business climate, an adverse action or assessment by a regulator, unanticipated competition, loss of key personnel, or a more-likely-than-not expectation that a reporting unit or a significant portion of a reporting unit will be sold or otherwise disposed. We face continued uncertainty in our business environment due to the substantial fiscal and economic challenges facing the U.S. government, our primary customer, as well as challenges in the commercial healthcare industry, compounded by lower levels of U.S. government reimbursements, including reductions in Medicare reimbursements which in turn impact hospital IT spending. Adverse changes in fiscal and economic conditions, such as the manner in which budget cuts are implemented, including sequestration, and issues related to the nation’s debt ceiling, could adversely impact our future revenues and profitability. These circumstances could result in an impairment of goodwill and/or other intangibles. Also, adverse equity market conditions that result in a decline in market multiples and our stock price could result in an impairment of goodwill and/or other intangibles. Any future impairment of goodwill or other intangible assets would have a negative impact on our profitability and financial results.
We depend on our teaming arrangements and relationships with other contractors and subcontractors. If we are not able to maintain these relationships, or if these parties fail to satisfy their obligations to us or the customer, our revenues, profitability and growth prospects could be adversely affected.
We rely on our teaming relationships with other prime contractors and subcontractors, who are also often our competitors in other contexts, in order to submit bids for large procurements or other opportunities where we believe the combination of services and products provided by us and other companies will help us to win and perform the contract. Our future revenues and growth prospects could be adversely affected if other contractors eliminate or reduce their contract relationships with us, or if the U.S. government terminates or reduces these other contractors’ programs, does not award them new contracts or refuses to pay under a contract. Companies that do not have access to U.S. government contracts may perform services as our subcontractor and that exposure could enhance such companies’ prospect of securing a future position as a prime U.S. government contractor which could increase competition for future contracts and impair our ability to perform on contracts.
We may have disputes with our subcontractors arising from, among other things, the quality and timeliness of work performed by the subcontractor, customer concerns about the subcontractor, our failure to extend existing task orders or issue new task orders under a subcontract, our hiring of a subcontractor’s personnel or the subcontractor’s failure to comply with applicable law. Uncertain economic conditions heighten the risk of financial stress of our subcontractors, which could adversely impact their ability to meet their contractual requirements to us. If any of our subcontractors fail to timely meet their contractual obligations or have regulatory compliance or other problems, our ability to fulfill our obligations as a prime contractor or higher tier subcontractor may be jeopardized. Significant losses could arise in future periods and subcontractor performance deficiencies could result in our termination for default. A termination for default could eliminate a revenue source, expose us to liability and have an adverse effect on our ability to compete for future contracts and task orders, especially if the customer is an agency of the U.S. government.
Leidos Holdings, Inc. Annual Report -
20
Our services and operations sometimes involve using, handling or disposing of hazardous substances, which could expose us to potentially significant liabilities.
Some of our services and operations involve the assessment or remediation of environmental hazards, as well as the use, handling or disposal of hazardous substances. These activities and our operations generally subject us to extensive foreign, federal, state and local environmental protection and health and safety laws and regulations, which, among other things, require us to incur costs to comply with these regulations and could impose liability on us for handling or disposing of hazardous substances. Furthermore, failure to comply with these environmental protection and health and safety laws and regulations could result in civil, criminal, regulatory, administrative or contractual sanctions, including fines, penalties or suspension or debarment from contracting with the U.S. government. Our current and previous ownership and operation of real property also subjects us to environmental protection laws, some of which hold current or previous owners or operators of businesses and real property liable for hazardous substance releases, even if they did not know of and were not responsible for the releases. If we have any violations of, or incur liabilities pursuant to these laws or regulations, our financial condition and operating results could be adversely affected.
We could incur significant liabilities and suffer negative publicity if our inspection or detection systems fail to detect bombs, explosives, weapons, contraband or other threats.
We design, develop, manufacture, sell, service and maintain various inspection systems that are designed to assist in the detection of bombs, explosives, weapons, contraband or other threats. In some instances, we also train operators of such systems. Many of these systems utilize software algorithms that are probabilistic in nature and subject to significant technical limitations. Many of these systems are also dependent on the performance of their operators. There are many factors, some of which are beyond our control, which could result in the failure of our products to help detect the presence of bombs, explosives, weapons, contraband or other threats. Some of these factors could include operator error, inherent limitations in our systems and misuse or malfunction of our systems. The failure of our systems to help detect the presence of any of these dangerous materials could lead to injury, death and extensive property damage and may lead to product liability, professional liability or other claims against us. Further, if our systems fail to, or are perceived to have failed to help detect a threat, the negative publicity from such incident could have a material adverse effect on our business.
Our insurance may be insufficient to protect us from product and other liability claims or losses.
We maintain insurance coverage with third-party insurers as part of our overall risk management strategy and because some of our contracts require us to maintain specific insurance coverage limits. However, not every risk or liability is or can be protected by insurance, and, for those risks we insure, the limits of coverage we purchase or that are reasonably obtainable in the market may not be sufficient to cover all actual losses or liabilities incurred. If any of our third-party insurers fail, cancel our coverage or otherwise are unable to provide us with adequate insurance coverage, then our overall risk exposure and our operational expenses would increase and the management of our business operations would be disrupted. Our insurance may be insufficient to protect us from significant product and other liability claims or losses. Moreover, there is a risk that commercially available liability insurance will not continue to be available to us at a reasonable cost, if at all. If liability claims or losses exceed our current or available insurance coverage, our business, financial position, operating results and prospects may be harmed. Regardless of the adequacy of our liability insurance coverages, any significant claim may have an adverse effect on our industry and market reputation, leading to a substantial decrease in demand for our products and services and reduced revenues.
We face risks associated with our international business.
Our international business operations may be subject to additional and different risks than our U.S. business. Failure to comply with U.S. government and foreign laws and regulations applicable to international business, such as the Foreign Corrupt Practices Act or U.S. export control regulations, could have an adverse impact on our business with the U.S. government and could expose us to administrative, civil or criminal penalties. Additionally, these risks relating to international operations may expose us to potentially significant contract losses.
Leidos Holdings, Inc. Annual Report -
21
In some countries, there is an increased chance for economic, legal or political changes that may adversely affect the performance of our services, sale of our products or repatriation of our profits. International transactions can also involve increased financial and legal risks arising from foreign exchange rate variability, imposition of tariffs or additional taxes, restrictive trade policies, any delay or failure to collect amounts due to us and differing legal systems. We provide services and products in support of U.S. government customers in countries with governments that may be or may become unstable, which increases the risk of an incident resulting in injury or loss of life, damage or destruction of property or inability to meet our contractual obligations. Although our international operations have historically generated a small proportion of our revenues, we are seeking to grow our international business, in which case these regulatory, geopolitical and other factors may have a greater impact on our business in the future and could adversely affect our business.
We have only a limited ability to protect our intellectual property rights, which are important to our success. Our failure to adequately protect our proprietary information and intellectual property rights could adversely affect our competitive position.
We rely principally on trade secrets to protect much of our intellectual property in cases where we do not believe that patent protection is appropriate or obtainable. However, trade secrets are difficult to protect. Although our employees are subject to confidentiality obligations, this protection may be inadequate to deter or prevent misappropriation of our confidential information. We may be unable to detect unauthorized use of our intellectual property or otherwise take appropriate steps to enforce our rights. Failure to obtain or maintain trade secret protection could adversely affect our competitive business position. If we are unable to prevent third parties from infringing or misappropriating our copyrights, trademarks or other proprietary information, our competitive position could be adversely affected. In addition, in connection with the performance of services, the U.S. government has certain rights to inventions, data, software codes and related material that we develop under government-funded contracts and subcontracts, which means that the U.S. government may disclose or license our information to third parties, including, in some instances, our competitors.
In the course of conducting our business, we may inadvertently infringe the intellectual property rights of others, resulting in claims against us or our customers. Our contracts generally indemnify our customers for third-party claims for intellectual property infringement by the services and products we provide. The expense of defending these claims may adversely affect our financial results.
Our financial results may vary significantly from period-to-period.
Our financial results may fluctuate as a result of a number of factors, many of which are outside of our control. For these reasons, comparing our operating results on a period-to-period basis may not be meaningful, and you should not rely on our past results as an indication of our future performance. Our financial results may be negatively affected by any of the risk factors listed in this "Risk Factors" section and other matters described elsewhere in this Annual Report on Form 10-K.
We use estimates in accounting for many of our programs and changes in our estimates could adversely affect our future financial results.
Accounting for many of our programs requires judgment relative to assessing risks, including risks associated with estimating directed delays and reductions in scheduled deliveries, unfavorable resolutions of claims and contractual matters, judgments associated with estimating contract revenues and costs, and assumptions for schedule and technical issues. Due to the size and nature of many of our contracts, the estimation of total revenues and cost at completion is complicated and subject to many variables. For example, we must make assumptions regarding the length of time to complete the contract because costs also include expected increases in wages and prices for materials, consider whether the intent of entering into multiple contracts was effectively to enter into a single project in order to determine whether such contracts should be combined or segmented, consider incentives or penalties related to performance on contracts in estimating revenue and profit rates and record them when there is sufficient information for us to assess anticipated performance and use estimates of award fees in estimating revenue and profit rates based on actual and anticipated awards. Because of the significance of the judgments and estimation processes involved in accounting, materially different amounts could be recorded if we used different assumptions or if the underlying circumstances were to change. Changes in underlying assumptions, circumstances or estimates may adversely affect our future results of operations and financial condition.
Leidos Holdings, Inc. Annual Report -
22
Risks Relating to Our Stock
We cannot assure you that we will continue to pay dividends on our common stock.
In March 2012, our Board of Directors approved the initiation of a quarterly dividend program. The timing, declaration, amount and payment of any future dividends fall within the discretion of our Board of Directors and will depend on many factors, including our available cash, estimated cash needs, earnings, financial condition, operating results and capital requirements, as well as limitations in our contractual agreements, applicable law, regulatory constraints, industry practice and other business considerations that our Board of Directors considers relevant. A change in our dividend program could have an adverse effect on the market price of our common stock.
Provisions in our charter documents and under Delaware law could delay or prevent transactions that many stockholders may favor.
Some provisions of our certificate of incorporation and bylaws may have the effect of delaying, discouraging or preventing a merger or acquisition that our stockholders may consider favorable, including transactions in which stockholders might receive a premium for their shares. These restrictions, which may also make it more difficult for our stockholders to elect directors not endorsed by our current directors and management, include the following:
|
•
|
Our certificate of incorporation provides that our bylaws and certain provisions of our certificate of incorporation may be amended by only two-thirds or more voting power of all of the outstanding shares entitled to vote. These supermajority voting requirements could impede our stockholders’ ability to make changes to our certificate of incorporation and bylaws.
|
|
•
|
Our certificate of incorporation contains certain supermajority voting provisions, which generally provide that mergers and certain other business combinations between us and a related person be approved by the holders of securities having at least
80%
of our outstanding voting power, as well as by the holders of a majority of the voting power of such securities that are not owned by the related person.
|
|
•
|
Our stockholders may not act by written consent. As a result, a holder, or holders, controlling a majority of our capital stock are limited in their ability to take certain actions other than in connection with its annual stockholders' meeting or a special meeting called at the request of qualified stockholders as provided in our certificate of incorporation and bylaws.
|
|
•
|
Our Board of Directors may issue, without stockholder approval, shares of undesignated preferred stock. The ability to authorize undesignated preferred stock makes it possible for our Board of Directors to issue preferred stock with voting or other rights or preferences that could impede the success of any attempt to acquire us.
|
As a Delaware corporation, we are also subject to certain restrictions on business combinations. Under Delaware law, a corporation may not engage in a business combination with any holder of
15%
or more of its capital stock unless the holder has held the stock for three years, or among other things, our Board of Directors has approved the business combination or the transaction pursuant to which such person became a
15%
holder prior to the time the person became a
15%
holder.
Forward-Looking Statement Risks
You may not be able to rely on forward-looking statements.
This Annual Report on Form 10-K contains forward-looking statements that are based on our management’s belief and assumptions about the future in light of information currently available to our management. In some cases, you can identify forward-looking statements by words such as "may," "will," "should," "expects," "intends," "plans," "anticipates," "believes," "estimates," "predicts," "potential," "continue," and similar words or phrases or the negative of these words or phrases. These statements relate to future events or our future financial performance, and involve known and unknown risks, uncertainties and other factors that may cause our actual results, levels of activity, performance or achievements to be materially different from any future results, levels of activity, performance or achievements expressed or implied by these forward-looking statements. Although we believe that the expectations reflected in the forward-looking statements are reasonable when made, we cannot guarantee future results, levels of activity, performance or achievements. There are a number of important factors that could cause our actual results to differ materially from those results anticipated by our forward-looking statements, which include, but are not limited to:
Leidos Holdings, Inc. Annual Report -
23
|
•
|
developments in the U.S. government defense budget, including budget reductions, sequestration, implementation of spending limits or changes in budgetary priorities, or delays in the U.S. government budget process or approval of raising the debt ceiling;
|
|
•
|
delays in the U.S. government contract procurement process or the award of contracts and delays or loss of contracts as a result of competitor protests;
|
|
•
|
changes in U.S. government procurement rules, regulations and practices;
|
|
•
|
our compliance with various U.S. government and other government procurement rules and regulations;
|
|
•
|
governmental reviews, audits and investigations of our company;
|
|
•
|
our ability to effectively compete and win contracts with the U.S. government and other customers;
|
|
•
|
our reliance on information technology spending by hospitals/healthcare organizations;
|
|
•
|
our reliance on infrastructure investments by industrial and natural resources organizations;
|
|
•
|
energy efficiency and alternative energy sourcing investments;
|
|
•
|
investments by U.S. government and commercial organizations in environment impact and remediation projects;
|
|
•
|
our ability to attract, train and retain skilled employees, including our management team, and to obtain security clearances for our employees;
|
|
•
|
our ability to accurately estimate costs associated with our FFP and other contracts;
|
|
•
|
resolution of legal and other disputes with our customers and others or legal or regulatory compliance issues;
|
|
•
|
cybersecurity, data security or other security threats, system failures or other disruptions of our business;
|
|
•
|
our ability to effectively acquire businesses and make investments;
|
|
•
|
our ability to maintain relationships with prime contractors, subcontractors and joint venture partners;
|
|
•
|
our ability to manage performance and other risks related to customer contracts;
|
|
•
|
the failure of our inspection or detection systems to detect threats;
|
|
•
|
the adequacy of our insurance programs designed to protect us from significant product or other liability claims;
|
|
•
|
our ability to manage risks associated with our international business;
|
|
•
|
exposure to lawsuits and contingencies associated with Lockheed Martin’s IS&GS business;
|
|
•
|
our ability to declare future dividends based on our earnings, financial condition, capital requirements and other factors, including compliance with applicable law and our agreements;
|
|
•
|
our ability to grow our commercial health and infrastructure businesses, which could be negatively affected by budgetary constraints faced by hospitals and by developers of energy and infrastructure projects;
|
|
•
|
for acquisitions that we agree to but are unable for regulatory or other reasons to consummate, we may incur break-up fees; and
|
|
•
|
our ability to execute our business plan and long-term management initiatives effectively and to overcome these and other known and unknown risks that we face.
|
We do not undertake any obligation to update or revise any of the forward-looking statements to reflect events, circumstances, changes in expectations, or the occurrence of unanticipated events after the date of those statements or to conform these statements to actual results.
Item 1B.
Unresolved Staff Comments
None.
Leidos Holdings, Inc. Annual Report -
24
Item 2.
Properties
As of
December 28, 2018
, we conducted our operations in
334
offices located in
37
states, the District of Columbia and various foreign countries. We occupy approximately
6.8 million
square feet of floor space. Of this amount, we own approximately
0.9 million
square feet, and the remaining balance is leased. Our major locations are in the Washington, D.C., metropolitan area, where we occupy a combination of leased and owned floor space of approximately
3.7 million
square feet. We also have employees working at customer sites throughout the United States and in other countries.
As of
December 28, 2018
, we owned the following properties:
|
Location
|
Number of
buildings |
|
Square
footage |
|
Acreage
|
||||
|
Gaithersburg, Maryland
|
1
|
|
542,000
|
|
44.8
|
|
|||
|
Columbia, Maryland
|
1
|
|
95,000
|
|
7.3
|
|
|||
|
Orlando, Florida
|
1
|
|
85,000
|
|
8.5
|
|
|||
|
Oak Ridge, Tennessee
|
1
|
|
83,000
|
|
8.4
|
|
|||
|
Reston, Virginia
|
1
|
|
62,000
|
|
2.6
|
|
|||
The nature of our business is such that there is no practicable way to relate occupied space to our reportable segments.
See "
Note 27—Subsequent Events
" of the notes to the consolidated financial statements contained within this Annual Report on Form 10-K for information regarding the sale of our Gaithersburg, Maryland property which occurred on December 31, 2018. See "
Note 22—Leases
" of the notes to the consolidated financial statements contained within this Annual Report on Form 10-K for information regarding commitments under leases.
Item 3.
Legal Proceedings
We have provided information about legal proceedings in which we are involved in "
Note 25—Contingencies
" of the notes to the consolidated financial statements contained within this Annual Report on Form 10-K.
In addition, we are routinely subject to investigations and reviews relating to compliance with various laws and regulations. Additional information regarding such investigations and reviews is set forth in "
Note 25—Contingencies
” of the notes to the consolidated financial statements contained within this Annual Report on Form 10-K.
Item 4.
Mine Safety Disclosures
Not applicable.
Executive Officers of the Registrant
The following is a list of the names and ages (as of
February 19, 2019
) of our executive officers, indicating all positions and offices held by each such person and each such person’s business experience during at least the past five years. All such persons have been elected to serve until their successors are elected and qualified or until their earlier resignation or removal.
|
Name of officer
|
Age
|
Position(s) with the company and prior business experience
|
||
|
Roger A. Krone
|
62
|
Mr. Krone has served as Chief Executive Officer since July 2014. Mr. Krone is also Chairman of the Board. He brings more than 37 years of operational, strategic and financial execution experience for some of the nation’s most prominent names in aerospace. Mr. Krone has held senior program management and finance positions at The Boeing Company, McDonnell Douglas Corp. and General Dynamics. Mr. Krone is currently a member of the Georgia Tech Foundation Board of Trustees. He is a long-time supporter of the Urban League and currently serves on the board of the Greater Washington chapter. He is also a member of the Executive Council of the Aerospace Industries Association and a member of the AOPA Foundation's Board of Visitors.
|
||
Leidos Holdings, Inc. Annual Report -
25
|
Name of officer
|
Age
|
Position(s) with the company and prior business experience
|
||
|
James C. Reagan
|
60
|
Mr. Reagan has served as Executive Vice President and Chief Financial Officer since July 2015. Prior to joining Leidos, from 2012 to 2015, Mr. Reagan was with Vencore, Inc. (formerly The SI Organization, Inc.), a provider of information solutions and engineering and analysis services to the U.S. Intelligence Community, DoD and federal and civilian agencies, where he served as Senior Vice President and Chief Financial Officer. From 2011 to 2012, Mr. Reagan was Executive Vice President and Chief Financial Officer of PAE, Inc., a provider of mission support services to the U.S. government. Mr. Reagan is a Certified Public Accountant.
|
||
|
Ranjit S. Chadha
|
48
|
Mr. Chadha has served as Senior Vice President, Chief Accounting Officer and Controller since April 2016, and before that, as Assistant Controller. Prior to joining Leidos, Mr. Chadha spent six years at CSC (now DXC), and during his tenure there held several roles with progressive responsibility, most recently as an Assistant Controller at CSC. Prior to CSC, he spent 17 years at PwC, including two years in the firm's National Office Assurance Quality Group. He is a Certified Public Accountant as well as a Chartered Accountant from India.
|
||
|
Paul O. Engola
|
47
|
Mr. Engola has served as Senior Vice President, Chief Human Resources Officer and Head of Business Partnerships since January 2019, and before that, as Chief Administrative Officer and Deputy President, Defense and Intelligence Group. Prior to joining Leidos, Mr. Engola served Lockheed Martin Corporation for more than 10 years, most recently as Vice President, Transportation & Financial Solutions in their former Information Systems & Global Solutions business.
|
||
|
Gerard A. Fasano
|
53
|
Mr. Fasano has served as Executive Vice President and President, Defense Group since October 2018, and before that, as Chief Business Development Strategy Officer. Prior to joining Leidos, Mr. Fasano served Lockheed Martin Corporation for over 30 years in several capacities, most recently as a Vice President and General Manager in their former Information Systems & Global Solutions business.
|
||
|
Angela L. Heise
|
44
|
Ms. Heise has served as President, Civil Group since August 2016 when she joined Leidos. Prior to joining Leidos, Ms. Heise served as Vice President of Commercial Cyber for Lockheed Martin Corporation's former Information Systems & Global Solutions business.
|
||
|
Jerald S. Howe, Jr.
|
63
|
Mr. Howe has served as Executive Vice President and General Counsel since July 2017. Prior to joining Leidos, Mr. Howe was a partner at Fried, Frank, Harris, Shriver & Jacobson LLP, where he served in the firm’s government contracts, mergers and acquisitions, and aerospace and defense practices. Prior to joining Fried Frank, Mr. Howe held general counsel positions at TASC, a leading aerospace and defense company, and at Veridian Corporation, a publicly traded company that provided advanced technology services and solutions to the intelligence community, military and homeland defense agencies.
|
||
|
Mary V. Schmanske
|
56
|
Ms. Schmanske has served as Senior Vice President and President, Intelligence Group since October 2018, and before that, as Chief Administrative Officer and Deputy President and Chief Operations Officer, Health Group. Prior to joining Leidos, Ms. Schmanske served Lockheed Martin Corporation in several capacities, most recently as Vice President of Operations for programs under strategic review, Civil, Defense & Intelligence Solutions.
|
||
|
Jonathan W. Scholl
|
57
|
Mr. Scholl has served as President, Health Group since August 2016, and before that, as President, Health and Infrastructure Group. Prior to joining Leidos, Mr. Scholl served for five years as the Chief Strategy Officer for Texas Health Resources, one of the largest nonprofit health care delivery systems in the country. Prior to that, he spent 15 years with The Boston Consulting group and served as head of their North American Healthcare Provider Practice and leader of their Lean Six Sigma initiative for hospitals. He also served as Vice President for Applications Development for the TenFold HealthCare Group in Dallas. Mr. Scholl served five years in the U.S. Navy as a nuclear submarine officer and nuclear power plant instructor.
|
||
Leidos Holdings, Inc. Annual Report -
26
Item 5.
Market for Registrant's Common Equity, Related Stockholder Matters and Issuer Purchases of Equity Securities
Our common stock is listed on the New York Stock Exchange ("NYSE") under the ticker symbol "LDOS."
Holders of Common Stock
As of
February 11, 2019
, there were approximately
21,150
holders of record of Leidos common stock. The number of stockholders of record of our common stock is not representative of the number of beneficial owners due to the fact that many shares are held by depositories, brokers or nominees.
Dividend Policy
During fiscal
2018
and
2017
, we declared and paid quarterly dividends totaling
$1.28
per share of Leidos common stock. We currently intend to continue paying dividends on a quarterly basis, although the declaration of any future dividends will be determined by our Board of Directors and will depend on many factors, including available cash, estimated cash needs, earnings, financial condition, operating results and capital requirements, as well as limitations in our contractual agreements, applicable law, regulatory constraints, industry practice and other business considerations that the Board of Directors considers relevant. Our ability to declare and pay future dividends on Leidos stock may be restricted by the provisions of Delaware law and covenants in our then-existing indebtedness arrangements.
Leidos Holdings, Inc. Annual Report -
27
Stock Performance Graph
The following graph compares the total cumulative five-year return on Leidos common stock through
December 28, 2018
to two indices: (i) the Standard & Poor's 400 Composite index and (ii) the Standard & Poor's 500 IT Services Industry index. The graph assumes an initial investment of $100 on December 31, 2013, and that dividends, if any, have been reinvested.The comparisons in the graph are required by the SEC, based upon historical data and are not intended to forecast or be indicative of possible future performance of Leidos common stock
.
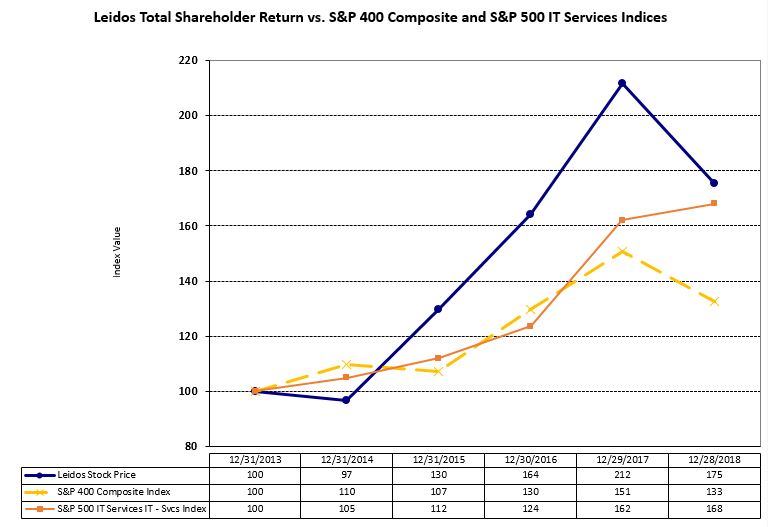
Purchases of Equity Securities
On February 16, 2018, our Board of Directors authorized a new share repurchase program of up to 20 million shares of Leidos outstanding common stock. The shares may be repurchased from time to time in one or more open market repurchases or privately negotiated transactions, including accelerated share repurchase transactions. The actual timing, number and value of shares repurchased under the program will depend on a number of factors, including the market price of Leidos common stock, general market and economic conditions, applicable legal requirements, compliance with the terms of our outstanding indebtedness and other considerations. There is no assurance as to the number of shares that will be repurchased, and the repurchase program may be suspended or discontinued at any time at our Board of Directors' discretion. This share repurchase authorization replaced the previous share repurchase authorization announced in December 2013.
Leidos Holdings, Inc. Annual Report -
28
The following table presents repurchases of Leidos common stock during the quarter ended
December 28, 2018
:
|
Period
|
Total Number of Shares Purchased (1) |
|
Average Price Paid per Share |
|
Total Number of
Shares Purchased as Part of Publicly Announced Repurchase Plans or Programs |
|
Maximum Number of Shares that May Yet Be Purchased Under the Plans or Programs |
||||||
|
September 29, 2018 - September 30, 2018
|
—
|
|
$
|
—
|
|
—
|
|
17,535,284
|
|
||||
|
October 1, 2018 - October 31, 2018
(2)
|
3,347,602
|
|
63.18
|
|
3,345,876
|
|
14,189,408
|
|
|||||
|
November 1, 2018 - November 30, 2018
|
8,504
|
|
64.82
|
|
—
|
|
14,189,408
|
|
|||||
|
December 1, 2018 - December 28, 2018
(2)
|
690,720
|
|
63.18
|
|
690,674
|
|
13,498,734
|
|
|||||
|
Total
|
4,046,826
|
|
$
|
63.18
|
|
4,036,550
|
|
|
|||||
|
(1)
|
The total number of shares purchased includes shares surrendered to satisfy statutory tax withholdings obligations related to vesting of restricted stock units.
|
|
(2)
|
In October 2018, we entered into an Accelerated Share Repurchase agreement with a financial institution, whereby we paid an aggregate of
$250 million
and received approximately
4.0 million
shares of Leidos outstanding shares of common stock during the fourth quarter of fiscal 2018. All shares delivered were immediately retired. See "
Note 18—Earnings Per Share
" of the notes to the consolidated financial statements contained within this Annual Report on Form 10-K for further information.
|
Item 6.
Selected Financial Data
The selected financial data for the five-year period set forth below is derived from our consolidated financial statements for fiscal years 2018, 2017 and 2016, the 11-month period ended January 1, 2016, and fiscal 2015.
This information should be read in conjunction with "Management's Discussion and Analysis of Financial Condition and Results of Operations" in Part II and our consolidated financial statements and the notes thereto contained within this Annual Report on Form 10-K.
Leidos Holdings, Inc. Annual Report -
29
|
|
12 Months Ended
(1)
|
11 Months Ended
(1)
|
12 Months Ended
(1)
|
|||||||||||||||||
|
|
December 28, 2018
(2)
|
December 29, 2017
(3)
|
December 30, 2016
(4)
|
January 1, 2016
(5)
|
January 30, 2015
(6)
|
|||||||||||||||
|
|
(in millions, except for per share amounts)
|
|||||||||||||||||||
|
Consolidated Statement of Income (Loss) Data:
|
|
|
||||||||||||||||||
|
Revenues
|
$
|
10,194
|
|
$
|
10,170
|
|
$
|
7,043
|
|
$
|
4,712
|
|
$
|
5,063
|
|
|||||
|
Operating income (loss)
|
749
|
|
559
|
|
417
|
|
320
|
|
(214
|
)
|
||||||||||
|
Income (loss) from continuing operations
|
582
|
|
364
|
|
246
|
|
243
|
|
(330
|
)
|
||||||||||
|
(Loss) income from discontinued operations, net of taxes
|
—
|
|
—
|
|
—
|
|
(1
|
)
|
7
|
|
||||||||||
|
Net income (loss)
|
582
|
|
364
|
|
246
|
|
242
|
|
(323
|
)
|
||||||||||
|
Less: net income (loss) attributable to non-controlling interest
|
1
|
|
(2
|
)
|
2
|
|
—
|
|
—
|
|
||||||||||
|
Net income (loss) attributable to Leidos Holdings, Inc.
|
$
|
581
|
|
$
|
366
|
|
$
|
244
|
|
$
|
242
|
|
$
|
(323
|
)
|
|||||
|
Earnings (loss) per share:
|
||||||||||||||||||||
|
Basic:
|
||||||||||||||||||||
|
Income (loss) from continuing operations attributable to Leidos common stockholders
|
$
|
3.85
|
|
$
|
2.41
|
|
$
|
2.39
|
|
$
|
3.33
|
|
$
|
(4.46
|
)
|
|||||
|
(Loss) income from discontinued operations, net of taxes
|
—
|
|
—
|
|
—
|
|
(0.01
|
)
|
0.10
|
|
||||||||||
|
Net income (loss) attributable to Leidos common stockholders
|
$
|
3.85
|
|
$
|
2.41
|
|
$
|
2.39
|
|
$
|
3.32
|
|
$
|
(4.36
|
)
|
|||||
|
Diluted:
|
||||||||||||||||||||
|
Income (loss) from continuing operations attributable to Leidos common stockholders
|
$
|
3.80
|
|
$
|
2.38
|
|
$
|
2.35
|
|
$
|
3.28
|
|
$
|
(4.46
|
)
|
|||||
|
(Loss) income from discontinued operations, net of taxes
|
—
|
|
—
|
|
—
|
|
(0.01
|
)
|
0.10
|
|
||||||||||
|
Net income (loss) attributable to Leidos common stockholders
|
$
|
3.80
|
|
$
|
2.38
|
|
$
|
2.35
|
|
$
|
3.27
|
|
$
|
(4.36
|
)
|
|||||
|
Cash dividend per common share
|
$
|
1.28
|
|
$
|
1.28
|
|
$
|
14.92
|
|
$
|
1.28
|
|
$
|
1.28
|
|
|||||
|
|
||||||||||||||||||||
|
|
December 28,
2018 |
December 29,
2017 |
December 30,
2016 |
January 1,
2016 |
January 30,
2015 |
|||||||||||||||
|
|
(in millions)
|
|||||||||||||||||||
|
Consolidated Balance Sheet Data:
|
|
|
||||||||||||||||||
|
Total assets
|
$
|
8,770
|
|
$
|
8,990
|
|
$
|
9,132
|
|
$
|
3,370
|
|
$
|
3,281
|
|
|||||
|
Long-term debt, including current portion
|
3,124
|
|
3,111
|
|
3,287
|
|
1,081
|
|
1,158
|
|
||||||||||
|
Other long-term liabilities
(7)
|
178
|
|
129
|
|
204
|
|
149
|
|
147
|
|
||||||||||
|
(1)
|
References to financial data are to the Company's continuing operations, unless otherwise noted.
|
|
(2)
|
Fiscal 2018 reflects the effects from our December 30, 2017 adoption of ASC 606. Fiscal 2018 also includes acquisition, integration and restructuring costs of
$37 million
and a tangible asset impairment charge of
$7 million
. For further information, see "
Note 6—Acquisitions
," "
Note 8—Restructuring Expenses
" and "
Note 12—Property, Plant and Equipment
" of the notes to the consolidated financial statements contained within this Annual Report on Form 10-K.
|
|
(3)
|
Fiscal 2017 includes acquisition, integration and restructuring costs of
$139 million
. For further information, see "
Note 6—Acquisitions
" and "
Note 8—Restructuring Expenses
" of the notes to the consolidated financial statements contained within this Annual Report on Form 10-K.
|
|
(4)
|
Fiscal 2016 includes acquisition, integration and restructuring costs of
$104 million
. For further detail regarding the acquisition of the IS&GS Business, see "
Note 6—Acquisitions
" and "
Note 8—Restructuring Expenses
" of the notes to the consolidated financial statements contained within this Annual Report on Form 10-K.
|
Leidos Holdings, Inc. Annual Report -
30
|
(5)
|
Reflects the 11-month period of January 31, 2015, through January 1, 2016, as a result of the change in our fiscal year end. The 11-month period ended January 1, 2016, results include a gain on a real estate sale of
$82 million
, tangible asset impairment charges of $
29 million
, intangible asset impairment charges of $
4 million
and bad debt expense of
$8 million
.
|
|
(6)
|
Fiscal 2015 results include goodwill impairment charges of
$486 million
, intangible asset impairment charges of
$41 million
and a tangible asset impairment charge of
$40 million
.
|
|
(7)
|
Beginning in fiscal 2016, the Company has separately disclosed "Deferred tax liabilities," which was previously aggregated within "Other long-term liabilities" within the consolidated balance sheets. Deferred tax liabilities for the 11-month period ended January 1, 2016 and fiscal 2015 were
$34 million
and
$21 million
, respectively.
|
Item 7.
Management’s Discussion and Analysis of Financial Condition and Results of Operations
The following discussion and analysis of Leidos Holdings, Inc.'s ("Leidos") financial condition, results of operations and quantitative and qualitative disclosures about market risk should be read in conjunction with the consolidated financial statements and related notes.
Unless indicated otherwise, references in this report to the “Company,” “we,” “us,” and “our” refer collectively to Leidos and its consolidated subsidiaries.
The following discussion contains forward-looking statements, including statements regarding our intent, belief, or current expectations with respect to, among other things, trends affecting our financial condition or results of operations, backlog, initiatives, our industry and government budgets and spending. Such statements are not guarantees of future performance and involve risks and uncertainties, and actual results may differ materially from those in the forward-looking statements as a result of various factors (see “Risk Factors—Forward-Looking Statement Risks” in Part I of this Annual Report on Form 10-K). Factors that could cause or contribute to these differences include those discussed below and elsewhere in this Annual Report on Form 10-K, particularly in “Risk Factors" and "Business Environment and Trends.” Due to such uncertainties and risks, you are cautioned not to place undue reliance on such forward-looking statements, which speak only as of the date hereof. We do not undertake any obligation to update these factors or to publicly announce the results of any changes to our forward-looking statements due to future events or developments.
Overview
We are
a FORTUNE 500
®
science, engineering and information technology company that provides services and solutions in the defense, intelligence, civil and health markets. We bring domain-specific capability and cross-market innovations to customers in each of these markets by leveraging seven core capabilities:
enterprise modernization; cyber operations; operations and logistics; mission software systems; integrated systems; sensors and phenomenology; and mission support
.
Our domestic customers include the U.S. Department of Defense ("DoD"), the U.S. Intelligence Community, the U.S. Department of Homeland Security, the Federal Aviation Administration, the Department of Veterans Affairs and many other U.S. government civilian agencies, as well as state and local government agencies. Our international customers include foreign governments and their agencies, primarily located in Australia and the United Kingdom ("U.K."). Less than
10%
of our revenues and tangible long-lived assets are generated by or owned by entities located outside of the United States.
During fiscal 2017, we completed a business reorganization, which resulted in the identification of three reportable segments (Defense Solutions, Civil and Health). Additionally, we separately present the costs associated with corporate functions as Corporate. We commenced operating and reporting under the new organizational structure effective the beginning of fiscal 2017. As a result of this change, fiscal 2016 segment results and disclosures have been recast to reflect the new reportable segments.
For additional information regarding our reportable segments, see “Business” in Part I and "
Note 24—Business Segments
" of the notes to the consolidated financial statements contained within this Annual Report on Form 10-K.
Our significant initiatives include the following:
|
•
|
achieving internal, or non-acquisition related, annual revenue growth through internal collaboration and better leveraging of key differentiators across our company and the deployment of resources and investments into higher growth markets;
|
|
•
|
increasing headcount and internal direct labor content on our contract portfolio;
|
|
•
|
continued improvement in our back office infrastructure and related business processes for greater effectiveness and efficiency across all business functions; and
|
Leidos Holdings, Inc. Annual Report -
31
|
•
|
disciplined deployment of our cash resources and use of our capital structure to enhance shareholder value while retaining an appropriate amount of financial leverage, through internal growth initiatives, stock repurchases, dividends, strategic acquisitions, debt level management and other uses to achieve our goals.
|
Sales Trend.
For fiscal 2018, revenues were
$10.2 billion
, consistent with fiscal 2017. For fiscal 2017, revenues increased by
$3.1 billion
, or
44%
, compared to fiscal 2016, primarily attributable to the Information Systems & Global Solutions business (the "IS&GS Business") of Lockheed Martin Corporation acquired during the third quarter of fiscal 2016 and
growth in airborne programs. The increase was partially offset by
fiscal 2016 revenues from the divestiture of the heavy construction business, net
volume decreases and
lower revenues from our international business
. See "Results of Operations" below for discussion of our individual segment results.
Operating Expenses and Income Trend.
For fiscal 2018, operating expenses decreased by
$161 million
, or
2%
, compared to fiscal 2017. Operating margin for fiscal 2018 was
7.3%
compared to
5.5%
for fiscal 2017. Operating income was
$749 million
for fiscal 2018, a
$190 million
increase compared to fiscal 2017. These changes were primarily attributable to decreases in acquisition, integration and restructuring costs and lower amortization of intangible assets.
For fiscal 2017, operating expenses increased by
$3.0 billion
, or
45%
, compared to fiscal 2016, primarily attributable to the acquired IS&GS Business. Operating margin for fiscal 2017 was
5.5%
compared to
5.9%
for fiscal 2016. The decrease in operating margin was primarily due to
a contract write-up in fiscal 2016 along with an increase in acquisition, integration and restructuring costs.
For fiscal 2017, our operating income was
$559 million
, a
$142 million
increase compared to fiscal 2016. The increase in operating income was primarily attributable to the operating results of the acquired IS&GS Business.
From a macroeconomic perspective, our industry is under general competitive pressures associated with spending from our largest customer, the U.S. government, and has required and will require a higher level of cost management focus to allow us to remain competitive. Although the current Administration has indicated a desire to increase spending, primarily in the defense and homeland security sectors, the likelihood, extent and duration of higher spending in these areas remains unclear. We continue to review our cost structure against our anticipated sales and undertake cost management actions and efficiency initiatives where necessary.
Lockheed Martin Transaction
On January 26, 2016, Leidos announced that it had entered into a definitive agreement (as amended, the "Merger Agreement") with Lockheed Martin Corporation ("Lockheed Martin"); Abacus Innovations Corporation, a Delaware corporation and a wholly owned subsidiary of Lockheed Martin ("Splitco"); and Lion Merger Co., a Delaware corporation and, at the time of announcement, a wholly owned subsidiary of Leidos ("Merger Sub"), pursuant to which Leidos would combine with Lockheed Martin’s realigned Information Systems & Global Solutions business in a Reverse Morris Trust transaction. In connection with the Merger Agreement, Lockheed Martin and Splitco entered into a Separation Agreement dated January 26, 2016 (as amended, the "Separation Agreement"), pursuant to which Lockheed Martin would separate the IS&GS Business from Lockheed Martin and transfer the IS&GS Business to Splitco. The transactions contemplated by the Merger Agreement and the Separation Agreement are referred to herein as the "Transactions."
On August 16, 2016, the acquisition date, we completed the Transactions. In the Transactions, among other steps, (i) Lockheed Martin transferred the IS&GS Business to Splitco; (ii) Lockheed Martin offered to Lockheed Martin stockholders the right to exchange all or a portion of their shares of Lockheed Martin common stock for shares of Splitco common stock by way of an exchange offer (the "Distribution"); and (iii) Merger Sub merged with and into Splitco, with Splitco as the surviving corporation (the "Merger") and a wholly owned subsidiary of Leidos. Upon consummation of the Transactions, those Lockheed Martin stockholders who elected to participate in the exchange offer received approximately
77 million
shares of Leidos common stock, which represented approximately
50.5%
of the outstanding shares of Leidos common stock after consummation of the Transactions. Holders of Leidos shares prior to the transaction held the remaining
49.5%
of the outstanding shares of Leidos common stock immediately after the closing.
Prior to the Distribution, Splitco incurred third-party debt financing in an aggregate principal amount of
$1.8 billion
and immediately thereafter, Lockheed Martin transferred the IS&GS Business to Splitco and Splitco made a special cash payment to Lockheed Martin of
$1.8 billion
.
Leidos Holdings, Inc. Annual Report -
32
In connection with the Transactions, Leidos incurred new indebtedness and assumed Splitco's indebtedness in the form of term loans in an aggregate principal amount of
$690 million
and
$1.8 billion
, respectively, and entered into a new
$750 million
senior secured revolving credit facility, which replaced its existing revolving credit facility. See "
Note 15—Debt
" of the notes to the consolidated financial statements contained within this Annual Report on Form 10-K for further information regarding the new debt incurred and the new senior revolving credit facility.
In conjunction with the Transactions, our Board of Directors declared a special dividend of
$13.64
per share of Leidos common stock. Consequently, on August 22, 2016, we paid
$993 million
to stockholders of record as of August 15, 2016, and accrued
$29 million
of dividend equivalents with respect to outstanding unvested equity awards. See "
Note 19—Stock-Based Compensation
" of the notes to the consolidated financial statements contained within this Annual Report on Form 10-K for further information regarding the modifications made to our outstanding stock awards as a result of the special dividend.
We incurred
$29 million
,
$77 million
and
$46 million
of integration costs during fiscal
2018
,
2017
and
2016
, respectively.
After the acquisition of the IS&GS Business, we began an initiative to review our cost structure, which included optimization of our real estate portfolio by vacating facilities that were not necessary for future requirements and reducing headcount. For fiscal
2018
,
2017
and
2016
, we recognized
$8 million
,
$37 million
and
$12 million
, respectively, of restructuring expenses related to this program.
Business Environment and Trends
U.S. Government Markets
In fiscal
2018
, we generated approximately
85%
of our total revenues from contracts with the U.S. government, either as a prime contractor or a subcontractor to other contractors engaged in work for the U.S. government. Revenues under contracts with the DoD, including subcontracts under which the DoD is the ultimate purchaser, represented approximately
47%
of our total revenues for fiscal
2018
. Accordingly, our business performance is affected by the overall level of U.S. government spending, especially national security, homeland security and intelligence spending, and the alignment of our service and product offerings and capabilities with current and future budget priorities of the U.S. government.
In March 2018, Congress passed and the President signed into law the Omnibus Appropriations Bill, thereby funding the federal government through the end of the 2018 government fiscal year ("GFY"). The appropriations legislation passed earlier in the year suspended previously enacted budget caps and included a two-year budget agreement that provided
$300 billion
in sequestration relief for defense and non-defense spending. Defense programs saw additional funding of
$80 billion
and
$85 billion
in GFY 2018 and GFY 2019, respectively, and non-defense funding increased by
$63 billion
and
$68 billion
in GFY 2018 and GFY 2019, respectively, over the caps established in the Budget Control Act of 2011. The legislation also suspended the debt ceiling until March 2019.
In September 2018, Congress passed and the President signed a second consolidated appropriations bill funding the Departments of Defense, Labor, and Health and Human Services for the full GFY 2019. Earlier in the year, funding for the Departments of Veterans Affairs and Energy as well as funding for Congress were also enacted. All were funded at increased levels from the previous year.
The remaining seven appropriations bills were operating under a continuing resolution ("CR") until it expired on December 21, 2018. From the expiration of that CR until the passage of a new CR on January 25, 2019 there was a partial U.S. government shutdown, which reduced or delayed work on existing contracts and caused delays in other government contracting actions and payments. Prior to the expiration of the January CR, Congress passed appropriations for the seven remaining appropriations bills, thereby completing funding for GFY 2019.
Trends in the U.S. government contracting process, including a shift towards multiple-awards contracts (in which certain contractors are preapproved using indefinite-delivery/indefinite-quantity ("IDIQ") and U.S. General Services Administration ("GSA") contract vehicles) and awarding contracts on a low price, technically acceptable basis, have increased competition for U.S. government contracts, reduced backlogs by shortening periods of performance on contracts and increased pricing pressure. We expect that a majority of the business that we seek in the foreseeable future will be awarded through a competitive bidding process. For more information on these risks and uncertainties, see “Risk Factors” in Part I of this Annual Report on Form 10-K.
Leidos Holdings, Inc. Annual Report -
33
International Markets
Sales to customers in international markets represented
9%
of total revenues for fiscal
2018
. Our international customers include foreign governments and their agencies, primarily located in the U.K. and Australia. Our international business increases our exposure to international markets and the associated international regulatory and geopolitical risks.
Recent changes in international trade policies, including higher tariffs on imported goods and materials, may increase our procurement costs of certain IT hardware used both on our contracts and for internal use. However, we expect to recover certain portions of these higher tariffs through our cost-plus contracts. While we are still evaluating the impact of higher tariffs, currently, we do not expect tariffs to have a significant impact to our business.
Key Performance Measures
The primary financial performance measures we use to manage our business and monitor results of operations are revenue, operating income, cash flows from operations and diluted earnings per share. Bookings and backlog are also useful measures for management and investors to evaluate our performance and potential future revenues. In addition, we consider business performance by contract type to be useful to management and investors when evaluating our operating income and margin performance.
Leidos Holdings, Inc. Annual Report -
34
Results of Operations
Our results of operations for the periods presented were as follows:
|
|
Year Ended
|
2018 to 2017
|
2017 to 2016
|
|||||||||||||||||||||||
|
|
December 28,
2018 |
December 29,
2017 |
December 30,
2016 |
Dollar change
|
Percent
change |
Dollar change
|
Percent
change |
|||||||||||||||||||
|
|
(dollars in millions)
|
|||||||||||||||||||||||||
|
Revenues
|
$
|
10,194
|
|
$
|
10,170
|
|
$
|
7,043
|
|
$
|
24
|
|
—
|
%
|
$
|
3,127
|
|
44
|
%
|
|||||||
|
Cost of revenues
(1)
|
8,690
|
|
8,738
|
|
6,103
|
|
(48
|
)
|
(1
|
)%
|
2,635
|
|
43
|
%
|
||||||||||||
|
Selling, general and administrative expenses:
|
|
|
||||||||||||||||||||||||
|
General and administrative
(1)
|
547
|
|
573
|
|
289
|
|
(26
|
)
|
(5
|
)%
|
284
|
|
98
|
%
|
||||||||||||
|
Bid and proposal
|
136
|
|
122
|
|
89
|
|
14
|
|
11
|
%
|
33
|
|
37
|
%
|
||||||||||||
|
Internal research and development
|
46
|
|
42
|
|
44
|
|
4
|
|
10
|
%
|
(2
|
)
|
(5
|
)%
|
||||||||||||
|
Bad debt expense
|
—
|
|
10
|
|
3
|
|
(10
|
)
|
(100
|
)%
|
7
|
|
NM
|
|
||||||||||||
|
Acquisition, integration and restructuring costs
|
37
|
|
139
|
|
104
|
|
(102
|
)
|
(73
|
)%
|
35
|
|
34
|
%
|
||||||||||||
|
Asset impairment charges
|
7
|
|
—
|
|
4
|
|
7
|
|
100
|
%
|
(4
|
)
|
(100
|
)%
|
||||||||||||
|
Equity earnings of non-consolidated subsidiaries
|
(18
|
)
|
(13
|
)
|
(10
|
)
|
(5
|
)
|
38
|
%
|
(3
|
)
|
30
|
%
|
||||||||||||
|
Operating income
|
749
|
|
559
|
|
417
|
|
190
|
|
34
|
%
|
142
|
|
34
|
%
|
||||||||||||
|
Non-operating expense, net
|
(139
|
)
|
(166
|
)
|
(99
|
)
|
27
|
|
(16
|
)%
|
(67
|
)
|
68
|
%
|
||||||||||||
|
Income before income taxes
|
610
|
|
393
|
|
318
|
|
217
|
|
55
|
%
|
75
|
|
24
|
%
|
||||||||||||
|
Income tax expense
|
(28
|
)
|
(29
|
)
|
(72
|
)
|
1
|
|
(3
|
)%
|
43
|
|
(60
|
)%
|
||||||||||||
|
Net income
|
582
|
|
364
|
|
246
|
|
218
|
|
60
|
%
|
118
|
|
48
|
%
|
||||||||||||
|
Less: net income (loss) attributable to non-controlling interest
|
1
|
|
(2
|
)
|
2
|
|
3
|
|
150
|
%
|
(4
|
)
|
(200
|
)%
|
||||||||||||
|
Net income attributable to Leidos Holdings, Inc.
|
$
|
581
|
|
$
|
366
|
|
$
|
244
|
|
$
|
215
|
|
59
|
%
|
$
|
122
|
|
50
|
%
|
|||||||
|
Operating income margin
|
7.3
|
%
|
5.5
|
%
|
5.9
|
%
|
||||||||||||||||||||
NM – Not meaningful
|
(1)
|
Effective the beginning of fiscal 2018, the Company established a new U.S. government Cost Accounting Standards structure and revised its disclosure statements accordingly to reflect the related cost accounting practice changes. Consequently,
$185 million
and
$88 million
was reclassified from "Cost of revenues" to "Selling, general and administrative expenses" on the consolidated statements of income for fiscal 2017 and 2016, respectively. For more information, see "
Note 1—Nature of Operations and Basis of Presentation
" of the notes to the consolidated financial statements contained within this Annual Report on Form 10-K.
|
Leidos Holdings, Inc. Annual Report -
35
Segment and Corporate Results
|
Year Ended
|
2018 to 2017
|
2017 to 2016
|
||||||||||||||||||||||||
|
Defense Solutions
|
December 28,
2018 |
December 29,
2017 |
December 30,
2016 |
Dollar change
|
Percent
change |
Dollar change
|
Percent
change |
|||||||||||||||||||
|
|
(dollars in millions)
|
|||||||||||||||||||||||||
|
Revenues
|
$
|
4,948
|
|
$
|
4,959
|
|
$
|
3,843
|
|
$
|
(11
|
)
|
—
|
%
|
$
|
1,116
|
|
29
|
%
|
|||||||
|
Operating income
|
347
|
|
307
|
|
312
|
|
40
|
|
13
|
%
|
(5
|
)
|
(2
|
)%
|
||||||||||||
|
Operating income margin
|
7.0
|
%
|
6.2
|
%
|
8.1
|
%
|
|
|||||||||||||||||||
The decrease in revenues for fiscal 2018 as compared to fiscal 2017 was primarily attributable to
the completion of certain contracts and adverse impact of the foreign exchange rate movement between the U.S. dollar and Australian dollar, partially offset by new awards.
The increase in revenues for fiscal 2017 as compared to fiscal 2016 was primarily attributable to the acquired IS&GS Business of $1,146 million and growth in airborne programs, partially offset by completion of certain contracts, net volume decreases and a contract write-up in fiscal 2016.
The increase in operating income for fiscal 2018 as compared to fiscal 2017 was primarily attributable to lower amortization.
The decrease in operating income for fiscal 2017 as compared to fiscal 2016 was primarily attributable to a contract write-up in fiscal 2016 and completion of certain contracts, partially offset by the acquired IS&GS Business of $23 million.
|
Year Ended
|
2018 to 2017
|
2017 to 2016
|
||||||||||||||||||||||||
|
Civil
|
December 28,
2018 |
December 29,
2017 |
December 30,
2016 |
Dollar change
|
Percent change
|
Dollar change
|
Percent change
|
|||||||||||||||||||
|
(dollars in millions)
|
||||||||||||||||||||||||||
|
Revenues
|
$
|
3,429
|
|
$
|
3,409
|
|
$
|
2,082
|
|
$
|
20
|
|
1
|
%
|
$
|
1,327
|
|
64
|
%
|
|||||||
|
Operating income
|
290
|
|
226
|
|
146
|
|
64
|
|
28
|
%
|
80
|
|
55
|
%
|
||||||||||||
|
Operating income margin
|
8.5
|
%
|
6.6
|
%
|
7.0
|
%
|
|
|||||||||||||||||||
The increase in revenues for fiscal 2018 as compared to fiscal 2017 was primarily attributable to new awards, favorable impact of the foreign exchange rate movement between the U.S. dollar and British pound and a net increase in program volumes, partially offset by the completion of certain contracts.
The increase in revenues for fiscal 2017 as compared to fiscal 2016 was primarily attributable to the acquired IS&GS Business of $1,528 million, partially offset by fiscal 2016 revenues from the divestiture of the heavy construction business, reduced volume on certain contracts and lower revenues from our international business, including the adverse impact of foreign exchange rates due to the movement of the exchange rate between the U.S. dollar and the British pound.
The increase in operating income for fiscal 2018 as compared to fiscal 2017 was primarily attributable to lower amortization and indirect expenditures, partially offset by net decrease in program volumes.
The increase in operating income for fiscal 2017 as compared to fiscal 2016 was primarily attributable to the acquired IS&GS Business of $78 million.
Leidos Holdings, Inc. Annual Report -
36
|
|
Year Ended
|
2018 to 2017
|
2017 to 2016
|
|||||||||||||||||||||||
|
Health
|
December 28,
2018 |
December 29,
2017 |
December 30,
2016 |
Dollar change
|
Percent
change |
Dollar change
|
Percent
change |
|||||||||||||||||||
|
|
(dollars in millions)
|
|||||||||||||||||||||||||
|
Revenues
|
$
|
1,817
|
|
$
|
1,802
|
|
$
|
1,117
|
|
$
|
15
|
|
1
|
%
|
$
|
685
|
|
61
|
%
|
|||||||
|
Operating income
|
230
|
|
228
|
|
110
|
|
2
|
|
1
|
%
|
118
|
|
107
|
%
|
||||||||||||
|
Operating income margin
|
12.7
|
%
|
12.7
|
%
|
9.8
|
%
|
|
|||||||||||||||||||
The increase in revenues for fiscal 2018 as compared to fiscal 2017 was primarily attributable to
a net increase in program volumes and new awards, partially offset by the completion of certain contracts and lower net profit write-ups in the current year.
The increase in revenues for fiscal 2017 as compared to fiscal 2016 was primarily attributable to the acquired IS&GS Business of $685 million and growth in our federal health business, partially offset by lower volume in commercial health.
The increase in operating income for fiscal 2018 as compared to fiscal 2017 was primarily due to a net increase in program volumes, partially offset by the completion of certain contracts, higher investment costs and lower net profit write-ups in the current year.
The increase in operating income for fiscal 2017 as compared to fiscal 2016 was primarily due to the acquired IS&GS Business of $132 million, partially offset by lower volume in commercial health.
|
|
Year Ended
|
2018 to 2017
|
2017 to 2016
|
|||||||||||||||||||||||
|
Corporate
|
December 28,
2018 |
December 29,
2017 |
December 30,
2016 |
Dollar change
|
Percent
change |
Dollar change
|
Percent
change |
|||||||||||||||||||
|
|
(dollars in millions)
|
|||||||||||||||||||||||||
|
Revenues
|
$
|
—
|
|
$
|
—
|
|
$
|
1
|
|
$
|
—
|
|
—
|
%
|
$
|
(1
|
)
|
(100
|
)%
|
|||||||
|
Operating loss
|
(118
|
)
|
(202
|
)
|
(151
|
)
|
84
|
|
(42
|
)%
|
(51
|
)
|
34
|
%
|
||||||||||||
Corporate operating loss represents corporate costs that are not directly related to the operating performance of the reportable segments.
The decrease in operating loss for fiscal 2018 as compared to fiscal 2017, was primarily attributable to lower acquisition, integration and restructuring costs of $102 million, partially offset by increased legal fees and an asset impairment charge of
$7 million
.
The increase in operating loss for fiscal 2017 as compared to fiscal 2016, was primarily attributable to increases of
$31 million
of integration costs incurred related to the acquisition of the IS&GS Business and $23 million of restructuring expenses due to severance costs and lease termination expenses. This was partially offset by a decrease of
$19 million
of acquisition costs incurred related to the IS&GS Business. The acquisition costs incurred during fiscal 2017 were primarily attributable to a
$24 million
working capital adjustment recorded as a result of the settlement agreement reached.
Equity earnings of non-consolidated subsidiaries
As a result of the Transactions, we received certain non-controlling ownership interests in equity method investments. For fiscal 2018 and 2017, we recorded earnings of
$28 million
and
$27 million
, respectively, from our equity method investments, partially offset by amortization of
$10 million
and
$14 million
, respectively. For fiscal 2016, we recorded earnings of
$10 million
from our equity method investments.
Non-Operating Expense
Non-operating expense decreased
$27 million
for fiscal 2018 as compared to fiscal 2017, primarily due to a
$33 million
promissory note impairment that occurred during fiscal 2017, partially offset by unfavorable fair value changes on investments held in our benefit plans.
Leidos Holdings, Inc. Annual Report -
37
Non-operating expense increased
$67 million
for fiscal 2017 as compared to fiscal 2016, primarily due to interest expense associated with our term loans secured in connection with the Transactions and a
$33 million
promissory note impairment that occurred during fiscal 2017. The increase in non-operating expense was partially offset by favorable year-over-year foreign currency exchange movements, mostly due to the movement of the exchange rate between the U.S. dollar and the British pound.
Provision for Income Taxes
On December 22, 2017, the U.S. government enacted comprehensive tax legislation commonly referred to as the Tax Cuts and Jobs Act (the “Tax Act”). The Tax Act makes broad and complex changes to the U.S. tax code, including, but not limited to, (1) reducing the U.S. federal corporate tax rate from
35%
to
21%
; (2) requiring companies to pay a one-time transition tax on certain unrepatriated earnings of foreign subsidiaries; (3) generally eliminating U.S. federal income taxes on dividends from foreign subsidiaries; and (4) limiting the deductibility of certain executive compensation. See “
Note 20—Income Taxes
” of the notes to the consolidated financial statements contained within this Annual Report on Form 10-K for further information on the impacts of this legislation.
Our effective tax rate was
4.6%
,
7.4%
and
22.6%
in fiscal
2018
,
2017
and
2016
, respectively. The effective tax rate for fiscal 2018 was favorably impacted primarily by a decrease in valuation allowances arising from the taxable conversion of a subsidiary and the utilization of capital losses, an increase in deferred tax assets related to the stock basis of a subsidiary held for sale, excess tax benefits related to employee stock-based payment transactions and federal research tax credits
.
The effective tax rate for fiscal 2017 was favorably impacted primarily by the Tax Act’s reduction of the federal corporate tax rate from 35% to 21% applied to our fiscal 2017 year-end deferred tax balances and excess tax benefits related to employee stock-based payment transactions, partially offset by the impact of certain capitalized transaction costs.
The effective tax rate for fiscal 2016 was favorably impacted primarily by the tax deductibility of the special cash dividend, related to the Transactions described in “
Note 6—Acquisitions
” on shares held by the Leidos retirement plan, excess tax benefits related to employee stock-based payment transactions and federal research tax credits, partially offset by the impact of certain capitalized transaction costs related to the Transactions.
Non-controlling Interest
As a result of the Transactions, we received an interest in Mission Support Alliance, LLC ("MSA"), a joint venture with Centerra Group, LLC. On January 26, 2018, we entered into a Membership Interest Purchase Agreement with Jacobs Engineering Group, Inc. ("Jacobs Group"), whereby we purchased
100%
of Jacobs Group's
41%
outstanding membership interest in MSA. As a result, we increased our controlling ownership in MSA from
47%
to
88%
. We include the financial results for MSA in our consolidated financial statements. Net income attributable to non-controlling interest for fiscal 2018 and fiscal 2016 was
$1 million
and
$2 million
, respectively, compared to net loss attributable to non-controlling interest of
$2 million
for fiscal 2017.
Bookings and Backlog
We had net bookings of
$13.7 billion
and
$9.7 billion
during fiscal
2018
and
2017
, respectively. Net bookings represent the estimated amount of revenue to be earned in the future from funded and unfunded contract awards that were received during the year, net of any adjustments to previously awarded backlog amounts. We calculate net bookings as the year’s ending backlog, plus the year’s revenues, less the prior year’s ending backlog and any impacts from foreign currency.
Leidos Holdings, Inc. Annual Report -
38
Backlog represents the estimated amount of future revenues to be recognized under negotiated contracts, which consists of remaining performance obligations (see "
Note 4—Revenues
" of the notes to the consolidated financial statements contained within this Annual Report on Form 10-K) and unexercised option periods. We segregate our backlog into two categories as follows:
|
•
|
Funded Backlog.
Funded backlog for contracts with the U.S. government represents the value on contracts for which funding is appropriated less revenues previously recognized on these contracts. Funded backlog for contracts with non-U.S. government entities and commercial customers represents the estimated value on contracts, which may cover multiple future years, under which we are obligated to perform, less revenues previously recognized on the contracts.
|
|
•
|
Negotiated Unfunded Backlog.
Negotiated unfunded backlog represents estimated amounts of revenue to be earned in the future from contracts for which funding has not been appropriated and unexercised priced contract options. Negotiated unfunded backlog does not include future potential task orders expected to be awarded under IDIQ, GSA Schedule or other master agreement contract vehicles, with the exception of certain IDIQ contracts where task orders are not competitively awarded and separately priced but instead are used as a funding mechanism, and where there is a basis for estimating future revenues and funding on future task orders is anticipated.
|
The estimated value of our total backlog for the periods presented was as follows:
|
|
December 28,
2018 |
December 29,
2017 |
||||||
|
|
(in millions)
|
|||||||
|
Defense Solutions:
|
||||||||
|
Funded backlog
|
$
|
2,811
|
|
$
|
2,384
|
|
||
|
Negotiated unfunded backlog
|
6,891
|
|
5,285
|
|
||||
|
Total Defense Solutions backlog
|
$
|
9,702
|
|
$
|
7,669
|
|
||
|
Civil:
|
||||||||
|
Funded backlog
|
$
|
2,314
|
|
$
|
2,064
|
|
||
|
Negotiated unfunded backlog
|
5,079
|
|
5,321
|
|
||||
|
Total Civil backlog
|
$
|
7,393
|
|
$
|
7,385
|
|
||
|
Health:
|
|
|||||||
|
Funded backlog
|
$
|
1,254
|
|
$
|
595
|
|
||
|
Negotiated unfunded backlog
|
2,483
|
|
1,827
|
|
||||
|
Total Health backlog
|
$
|
3,737
|
|
$
|
2,422
|
|
||
|
Total:
|
||||||||
|
Funded backlog
|
$
|
6,379
|
|
$
|
5,043
|
|
||
|
Negotiated unfunded backlog
|
14,453
|
|
12,433
|
|
||||
|
Total backlog
|
$
|
20,832
|
|
$
|
17,476
|
|
||
Total backlog at
December 28, 2018
included an adverse impact of
$171 million
when compared to total backlog at December 29, 2017, due to exchange rate movements in the British pound and Australian dollar when compared to the U.S. dollar. Total backlog at
December 28, 2018
included
$165 million
within our Civil segment attributable to our held for sale commercial cybersecurity business. See "
Note 7—Divestitures
" of the notes to the consolidated financial statements contained within this Annual Report on Form 10-K for more information on the expected sale.
Bookings and backlog fluctuate from period to period depending on our success rate in winning contracts and the timing of contract awards, renewals, modifications and cancellations, as well as foreign currency movements. Contract awards may be negatively impacted by ongoing industry-wide delays in procurement decisions and budget cuts by the U.S. government as discussed in “Business Environment and Trends” in this Annual Report on Form 10-K.
Leidos Holdings, Inc. Annual Report -
39
We expect to recognize a substantial portion of our funded backlog as revenues within the next 12 months. However, the U.S. government may cancel any contract at any time through a termination for the convenience of the U.S. government. In addition, certain contracts with commercial or non-U.S. government customers may include provisions that allow the customer to cancel at any time. Most of our contracts have cancellation terms that would permit us to recover all or a portion of our incurred costs and fees for work performed.
Contract Types
Our earnings and profitability may vary materially depending on changes in the proportionate amount of revenues derived from each type of contract. For a discussion of the types of contracts under which we generate revenues, see “Business—Contract Types” in Part I of this Annual Report on Form 10-K. Revenues by contract type as a percentage of our total revenues for the periods presented were as follows:
|
|
Year Ended
|
||||||||
|
|
December 28,
2018 |
December 29,
2017 |
December 30,
2016 |
||||||
|
Cost-reimbursement and fixed-price-incentive-fee
|
54
|
%
|
56
|
%
|
51
|
%
|
|||
|
Firm-fixed-price
|
31
|
|
28
|
|
30
|
|
|||
|
Time-and-materials and fixed-price-level-of-effort
|
15
|
|
16
|
|
19
|
|
|||
|
Total
|
100
|
%
|
100
|
%
|
100
|
%
|
|||
Liquidity and Capital Resources
Overview of Liquidity
As of
December 28, 2018
, we had
$327 million
in cash and cash equivalents. In addition, we have a secured revolving credit facility which can provide up to
$750 million
in secured borrowing capacity, if required. During fiscal
2018
and
2017
, there were no borrowings outstanding under the credit facility and we were in compliance with the financial covenants.
In August 2016, our Board of Directors declared a special dividend of
$13.64
per share of Leidos common stock. Consequently, on August 22, 2016, we paid
$993 million
to stockholders of record as of August 15, 2016, and accrued
$29 million
of dividend equivalents with respect to the outstanding unvested equity awards. In addition, we paid dividends of
$198 million
for fiscal
2018
and
2017
, and
$142 million
for fiscal
2016
.
At
December 28, 2018
and
December 29, 2017
, we had outstanding debt of
$3.1 billion
. The notes outstanding as of
December 28, 2018
, contain financial covenants and customary restrictive covenants. We were in compliance with all covenants as of
December 28, 2018
.
In connection with the Transactions, Leidos incurred
$2.5 billion
of new indebtedness in the form of term loans (see "
Note 6—Acquisitions
" of the notes to the consolidated financial statements contained within this Annual Report on Form 10-K). During fiscal
2018
and
2017
, we made
$59 million
and
$209 million
of principal payments, respectively, on our long-term debt, which was primarily related to our senior secured term loans. This activity included
$46 million
and
$76 million
of required quarterly payments on our term loans during fiscal
2018
and fiscal
2017
, respectively. In April 2018, we made a required debt prepayment of
$10 million
on our senior secured term loans. The prepayment was a result of the annual excess cash flow calculation clause in our credit agreements. In addition to the required quarterly payments, we prepaid
$130 million
and
$275 million
on our term loans during fiscal 2017 and fiscal 2016, respectively (see "
Note 15—Debt
" of the notes to the consolidated financial statements contained within this Annual Report on Form 10-K).
During fiscal 2018, 2017 and 2016, we entered into interest rate swap agreements to hedge the cash flows on our variable rate senior secured term loans (see "
Note 14—Derivative Instruments
" of the notes to the consolidated financial statements contained within this Annual Report on Form 10-K). As of December 28, 2018, we had cash flow interest rate swaps on
$1.5 billion
of the Company's variable rate senior secured term loans. The objective of these instruments is to reduce variability in the forecasted interest payments of our variable rate secured notes.
We may from time to time seek to retire or purchase our outstanding debt through cash purchases in the open market, privately negotiated transactions or otherwise. Such repurchases, if any, will depend on prevailing market conditions, our liquidity requirements, contractual restrictions and other factors. The amounts involved may be material.
Leidos Holdings, Inc. Annual Report -
40
Stock repurchases of Leidos common stock may be made on the open market or in privately negotiated transactions with third parties including through accelerated share repurchase ("ASR") agreements. Whether repurchases are made and the timing and actual number of shares repurchased depends on a variety of factors including price, corporate capital requirements, other market conditions and regulatory requirements. The repurchase program may be accelerated, suspended, delayed or discontinued at any time.
During fiscal 2018, we entered into an ASR agreement with a financial institution, whereby we paid an aggregate of
$250 million
and received approximately
4 million
shares of Leidos outstanding shares of common stock during the fourth quarter of fiscal 2018 (see "
Note 18—Earnings Per Share
" of the notes to the consolidated financial statements contained within this Annual Report on Form 10-K). All shares delivered were immediately retired. Additionally, during fiscal 2018, we made open market repurchases of our common stock for an aggregate purchase price of
$167 million
. During fiscal 2017 and fiscal 2016, there were no open market repurchases of our common stock.
For the next 12 months, we anticipate that we will be able to meet our liquidity needs, including servicing our debt, through cash generated from operations, available cash balances and, if needed, borrowings from our revolving credit facility.
Summary of Cash Flows
The following table summarizes cash flow information for the periods presented:
|
|
Year Ended
|
|||||||||||
|
|
December 28,
2018 |
December 29,
2017 |
December 30,
2016 |
|||||||||
|
|
(in millions)
|
|||||||||||
|
Net cash provided by operating activities of continuing operations
|
$
|
768
|
|
$
|
526
|
|
$
|
449
|
|
|||
|
Net cash (used in) provided by investing activities of continuing operations
|
(114
|
)
|
(71
|
)
|
26
|
|
||||||
|
Net cash used in financing activities of continuing operations
|
(707
|
)
|
(429
|
)
|
(751
|
)
|
||||||
|
Net decrease in cash, cash equivalents and restricted cash from discontinued operations
|
—
|
|
—
|
|
(1
|
)
|
||||||
|
Net (decrease) increase in cash, cash equivalents and restricted cash
|
$
|
(53
|
)
|
$
|
26
|
|
$
|
(277
|
)
|
|||
Net cash provided by operating activities increased
$242 million
for fiscal 2018 as compared to fiscal 2017. The increase was primarily due to lower payments for taxes, integration and restructuring costs and proceeds received from the termination of interest rate swaps. This was partially offset by
$24 million
of cash paid related to the 2016 acquisition of the IS&GS Business.
Net cash provided by operating activities increased
$77 million
for fiscal 2017 as compared to fiscal 2016. The increase was primarily due to the favorable timing of working capital changes, partially offset by higher integration and restructuring costs and higher payments for interest and taxes.
Net cash used in investing activities increased
$43 million
for fiscal 2018 as compared to fiscal 2017. The increase was primarily due to
$81 million
of cash paid related to the 2016 acquisition of the IS&GS Business, partially offset by
$40 million
of proceeds from the settlement of a promissory note.
Net cash used in investing activities increased
$97 million
for fiscal 2017 as compared to fiscal 2016. The increase was primarily due to cash acquired as part of the acquisition of the IS&GS Business in fiscal 2016, proceeds received from the divestiture of the heavy construction business in fiscal 2016 and higher purchases of property, plant and equipment.
Net cash used in financing activities increased
$278 million
for fiscal 2018 as compared to fiscal 2017. The increase was primarily due to
$250 million
of stock repurchases under the ASR program,
$167 million
of open market stock repurchases and
$23 million
of cash paid related to a tax indemnification liability. This was partially offset by $150 million of lower debt payments and
$14 million
of proceeds received from a real estate financing transaction.
Leidos Holdings, Inc. Annual Report -
41
Net cash used in financing activities decreased
$322 million
for fiscal 2017 as compared to fiscal 2016. The decrease was primarily due to a special dividend cash payment in connection with the Transactions of
$993 million
in fiscal 2016 and decreased payments of long-term debt of
$68 million
, partially offset by net proceeds from debt issuance activity of
$660 million
in fiscal 2016 as well as higher dividend payments of
$56 million
and less proceeds from issuances of stock of
$12 million
.
Off-Balance Sheet Arrangements
We have outstanding performance guarantees and cross-indemnity agreements in connection with certain aspects of our business. We also have letters of credit outstanding principally related to performance guarantees on contracts and surety bonds outstanding principally related to performance and subcontractor payment bonds as described in "
Note 26—Commitments
" of the notes to the consolidated financial statements contained within this Annual Report on Form 10-K. These arrangements have not had, and management does not believe it is likely that they will in the future have, a material effect on our liquidity, capital resources, operations or financial condition.
Contractual Obligations
The following table summarizes, as of
December 28, 2018
, our obligations to make future payments pursuant to certain contracts or arrangements and provides an estimate of the fiscal years in which these obligations are expected to be satisfied:
|
|
Total
|
2019
|
2020
|
2021
|
2022
|
2023
|
2024 and thereafter
|
|||||||||||||||||||||
|
|
(in millions)
|
|||||||||||||||||||||||||||
|
Contractual obligations
(1)
:
|
|
|
|
|
|
|
|
|||||||||||||||||||||
|
Long-term debt (including current portion)
(2)
|
$
|
4,318
|
|
$
|
237
|
|
$
|
634
|
|
$
|
299
|
|
$
|
212
|
|
$
|
717
|
|
$
|
2,219
|
|
|||||||
|
Operating lease obligations
|
713
|
|
144
|
|
114
|
|
83
|
|
71
|
|
55
|
|
246
|
|
||||||||||||||
|
Capital lease obligations
|
3
|
|
3
|
|
—
|
|
—
|
|
—
|
|
—
|
|
—
|
|
||||||||||||||
|
Other long-term liabilities
(3)
|
91
|
|
7
|
|
10
|
|
7
|
|
7
|
|
7
|
|
53
|
|
||||||||||||||
|
Total contractual obligations
|
$
|
5,125
|
|
$
|
391
|
|
$
|
758
|
|
$
|
389
|
|
$
|
290
|
|
$
|
779
|
|
$
|
2,518
|
|
|||||||
|
(1)
|
We have excluded purchase orders for services or products to be delivered pursuant to U.S. government contracts for which we are entitled to full recourse under normal contract termination clauses.
|
|
(2)
|
Includes total interest payments on our outstanding debt. Interest payments represent
$161 million
,
$125 million
,
$118 million
,
$110 million
and
$98 million
of the balance for fiscal
2019
,
2020
,
2021
,
2022
and
2023
, respectively, and
$542 million
for fiscal
2024 and thereafter
. The total interest payments on our outstanding term loan debt are calculated based on the stated variable rates of the notes as of
December 28, 2018
. The total interest payments on our outstanding senior fixed rate secured and unsecured notes are calculated based on the stated fixed rates and do not reflect the variable interest component due to the interest rate swap agreements.
|
|
(3)
|
Other long-term liabilities were allocated by fiscal year as follows: liabilities under deferred compensation arrangements are based upon the average annual payments in prior years upon termination of employment by participants and other liabilities are based on the fiscal year that the liabilities are expected to be realized. The table above does not include income tax liabilities for uncertain tax positions of
$3 million
and
$4 million
of other tax liabilities, as we are not able to reasonably estimate the timing of payments in individual years due to uncertainties in the timing of audit outcomes and when settlements will become due. There is no obligation included for our foreign defined benefit pension plan, as the plan is overfunded as of
December 28, 2018
. For a discussion of potential changes in these pension obligations, see "
Note 21—Retirement Plans
" of the notes to the consolidated financial statements contained within this Annual Report on Form 10-K.
|
Commitments and Contingencies
We are subject to a number of reviews, investigations, claims, lawsuits, other uncertainties and future obligations related to our business. For a discussion of these items, see "
Note 22—Leases
," "
Note 25—Contingencies
" and "
Note 26—Commitments
" of the notes to the consolidated financial statements contained within this Annual Report on Form 10-K.
Leidos Holdings, Inc. Annual Report -
42
Critical Accounting Policies
Our discussion and analysis of our financial condition and results of operations are based upon our consolidated financial statements, which are prepared in accordance with accounting principles generally accepted in the United States of America ("GAAP"). The preparation of these financial statements in accordance with GAAP requires management to make estimates and assumptions that affect the reported amounts of assets and liabilities and the disclosure of contingencies at the date of the financial statements, as well as the reported amounts of revenues and expenses during the reporting periods. Management evaluates these estimates and assumptions on an ongoing basis. Our estimates and assumptions have been prepared by management on the basis of the most current and best available information. The results of these estimates form the basis for making judgments about the carrying values of assets and liabilities that are not readily apparent from other sources. Actual results could differ from these estimates under different assumptions and conditions.
We have identified the following accounting policies as critical because they require significant judgments and assumptions about highly complex and inherently uncertain matters and the use of reasonably different estimates and assumptions could have a material impact on our results of operations or financial condition.
|
•
|
Revenue Recognition
|
|
•
|
Changes in Estimates on Contracts
|
|
•
|
Goodwill Impairment
|
|
•
|
Intangible Assets Impairment
|
|
•
|
Income Taxes
|
Revenue Recognition
Our revenues from contracts with customers are from offerings including
enterprise modernization; cyber operations; operations and logistics; mission software systems; integrated systems; sensors and phenomenology; and mission support
, primarily with the U.S. government and its agencies. We also serve various state and local governments, foreign governments and U.S. commercial customers.
We perform under various types of contracts, which include firm-fixed-price ("FFP"), time-and-materials ("T&M"), fixed-price-level-of-effort ("FP-LOE"), cost-plus-fixed-fee, cost-plus-award-fee, cost-plus-incentive-fee and fixed-price-incentive-fee contracts.
To determine the proper revenue recognition, we first evaluate whether we have a duly approved and enforceable contract with a customer, in which the rights of the parties and payment terms are identified, and collectability is probable. We also evaluate whether two or more contracts should be combined and accounted for as a single contract, including the task orders issued under an IDIQ award. In addition, we assess contract modifications to determine whether the changes to existing contracts should be accounted for as part of the original contract or as a separate contract. Contract modifications for us generally relate to changes in contract specifications and requirements and do not add distinct services, and therefore are accounted for as part of the original contract. If contract modifications add distinct goods or services and increase the contract value by an amount that reflects the standalone selling price, those modifications are accounted for as separate contracts.
Most of our contracts are comprised of multiple promises including the design and build of software-based systems, integration of hardware and software solutions, running and maintaining of IT infrastructure and procurement services. In all cases, we assess if the multiple promises should be accounted for as separate performance obligations or combined into a single performance obligation. We generally separate multiple promises in a contract as separate performance obligations if those promises are distinct, both individually and in the context of the contract. If multiple promises in a contract are highly interrelated or require significant integration or customization within a group, they are combined and accounted for as a single performance obligation.
Our contracts with the U.S. government often contain options to renew existing contracts for an additional period of time (generally a year at a time) under the same terms and conditions as the original contract, and generally do not provide the customer any material rights under the contract. We account for renewal options as separate contracts when they include distinct goods or services at standalone selling prices.
Leidos Holdings, Inc. Annual Report -
43
Contracts with the U.S. government are subject to the Federal Acquisition Regulation ("FAR") and priced on estimated or actual costs of providing the goods or services. The FAR provides guidance on types of costs that are allowable in establishing prices for goods and services provided to the U.S. government and its agencies. Each contract is competitively priced and bid separately. Pricing for non-U.S. government agencies and commercial customers is based on specific negotiations with each customer. In circumstances where the standalone selling price is not directly observable, we estimate the standalone selling price using the expected cost plus margin approach. We exclude any taxes collected or imposed when determining the transaction price.
Certain of our cost-plus and fixed-price contracts contain award fees, incentive fees or other provisions that may either increase or decrease the transaction price. These variable amounts generally are awarded upon achievement of certain performance metrics, program milestones or cost targets and can be based upon customer discretion. We estimate variable consideration at the most probable amount that we expect to be entitled to, based on the assessment of the contractual variable fee criteria, complexity of work and related risks, extent of customer discretion, amount of variable consideration received historically and the potential of significant reversal of revenue.
We allocate the transaction price of a contract to our performance obligations in the proportion of its respective standalone selling prices. The standalone selling price of our performance obligations is generally based on an expected cost-plus margin approach, in accordance with the FAR. For certain product sales, we use prices from other standalone sales. Substantially all of our contracts do not contain a significant financing component, which would require an adjustment to the transaction price of the contract.
We recognize revenue on our service based contracts primarily over time as there is continuous transfer of control to the customer over the duration of the contract as we perform the promised services. For U.S. government contracts, continuous transfer of control to the customer is evidenced by clauses in the contract that allow the customer to unilaterally terminate the contract for convenience, pay for costs incurred plus a reasonable profit and take control of any work-in-process. Similarly, for non-U.S. government contracts, the customer typically controls the work-in-process as evidenced by rights to payment for work performed to date plus a reasonable profit to deliver products or services that do not have an alternate use to us. Anticipated losses on service based contracts are recognized when known. In certain product sales, where the products have an alternate use, we recognize revenue at a point in time when the customer takes control of the asset usually denoted by possession and legal title.
On FFP contracts, revenue recognized over time generally uses a method that measures the extent of progress towards completion of a performance obligation, principally using a cost-input method (referred to as the cost-to-cost method). Under the cost-to-cost method, revenue is recognized based on the proportion of total costs incurred to estimated total costs-at-completion ("EAC"). A performance obligation's EAC includes all direct costs such as materials, labor, subcontract costs, overhead and a ratable portion of general and administrative costs. In addition, we include in an EAC of a performance obligation future losses estimated to be incurred on onerous contracts, as and when known. On certain other contracts, principally T&M, FP-LOE, and cost-plus, revenue is recognized using the right-to-invoice practical expedient as we are contractually able to invoice the customer based on the control transferred to the customer. Additionally, on maintenance (generally FFP) performance obligations, revenue is recognized over time using a straight-line method as the control of the services is provided to the customer evenly over the period of performance.
For certain performance obligations, we are not primarily responsible for fulfilling the promise to provide the goods or service to the customer, do not have inventory risk and do not have discretion in establishing the price for the goods or service. In such cases, we recognize revenue on a net basis.
Changes in Estimates on Contracts
Changes in estimates related to contracts accounted for using the cost-to-cost method of accounting are recognized in the period in which such changes are made for the inception-to-date effect of the changes, with the exception of contracts acquired through the acquisition of the IS&GS Business, where the adjustment is made for the period commencing from the date of acquisition.
Leidos Holdings, Inc. Annual Report -
44
Changes in estimates on contracts for the periods presented were as follows:
|
Year Ended
|
||||||||||||
|
December 28,
2018 |
December 29,
2017 |
December 30,
2016 |
||||||||||
|
(in millions, except for per share amounts)
|
||||||||||||
|
Net favorable impact to income before income taxes
|
$
|
105
|
|
$
|
103
|
|
$
|
37
|
|
|||
|
Impact on diluted EPS attributable to Leidos common stockholders
|
$
|
0.52
|
|
$
|
0.41
|
|
$
|
0.22
|
|
|||
The increase in the changes in estimates on contracts from fiscal 2016 to fiscal 2017 is primarily due to completion of contracts or events which mitigated risk and due to the finalization of award and incentive fees.
The impact on diluted EPS attributable to Leidos common stockholders is calculated using our statutory tax rate.
During fiscal
2018
, revenue recognized from performance obligations satisfied in previous periods was
$102 million
.
The changes primarily relate to revisions of variable consideration, including award fees, and revisions to estimates at completion resulting from changes in contract scope, mitigation of contract risks or due to true-ups of contract estimates at the end of contract performance
.
Goodwill Impairment
Goodwill represents the excess of the fair value of consideration transferred, plus the fair value of any non-controlling interests in the acquiree, over the fair value of the net assets acquired and liabilities assumed as of the acquisition date. Goodwill is not amortized, but instead is tested annually for impairment at the reporting unit level and tested more frequently if events or circumstances indicate that the carrying value may not be recoverable. Our policy is to perform our annual goodwill impairment evaluation as of the first day of the fourth quarter of our fiscal year. During fiscal
2018
, we had five reporting units for the purpose of testing goodwill for impairment.
Goodwill is evaluated for impairment either under a qualitative assessment option or a quantitative approach depending on the facts and circumstances of a reporting unit, consideration of the excess of a reporting unit's fair value over its carrying amount in previous assessments and changes in business environment.
When performing a qualitative assessment, we consider factors including, but not limited to, current macroeconomic conditions, industry and market conditions, cost factors, financial performance and other events relevant to the entity or reporting unit under evaluation to determine whether it is more likely than not that the fair value of a reporting unit is less than its carrying amount. If we determine that it is more likely than not that a reporting unit’s fair value is less than its carrying amount, a quantitative goodwill impairment test is performed.
When performing a quantitative goodwill impairment test, the reporting unit carrying value is compared to its fair value. Goodwill is deemed impaired if, and the impairment loss is recognized for the amount by which, the reporting unit carrying value exceeds its fair value. For fiscal 2018, a qualitative analysis was performed for four of our reporting units and a quantitative step one analysis was performed for one reporting unit. A quantitative analysis was performed for all reporting units for fiscal
2017
.
We estimate the fair value of each reporting unit using both market and income approaches when a quantitative analysis is performed. To determine the fair value of the reporting units, the outputs from both methods are equally weighted.
The market approach is a technique where the fair value is calculated based on the multiples of comparable publicly-traded companies that provide a reasonable basis of comparison with each of our reporting units. Valuation ratios are selected that relate market prices to selected financial metrics from comparable companies. These ratios are applied after consideration of adjustments and weightings related to financial position, growth, volatility, working capital movement and other factors. Due to the fact that stock prices of comparable companies represent minority interests, we also consider an acquisition control premium to reflect the impact of additional value associated with a controlling interest.
Leidos Holdings, Inc. Annual Report -
45
The income approach is a technique where the fair value is calculated based on present value future cash flows using risk-adjusted discount rates, which represent the weighted-average cost of capital ("WACC") for each reporting unit. Determination of WACC includes assessing the cost of equity and debt as of the valuation date. In addition, a terminal value is developed for forecasted future cash flows beyond the projection period discounted back to the present value. The forecasts used in our estimation of fair value are developed by management based on business and market considerations.
The goodwill impairment test process and valuation model is based upon certain key assumptions that require the exercise of significant judgment and assumptions including the use of appropriate financial projections, economic expectations, WACC and expected long-term growth rates, as well as using available market data. Significant changes to these estimates and assumptions could adversely impact our conclusions and actual future results may differ from the estimates. In addition, the identification of reporting units and the allocation of assets and liabilities to the reporting units when determining the carrying value of each reporting unit also requires judgment.
Based on a qualitative analysis performed during our annual impairment evaluation for fiscal 2018 for certain of our reporting units, it was determined that it is more likely than not that the fair values of the reporting units were in excess of the individual reporting unit carrying values, and as a result, a quantitative step one analysis was not necessary. Additionally, based on the results of the quantitative step one analysis for one of our reporting units, it was determined that the fair value significantly exceeded the reporting unit's carrying value. We did not recognize any goodwill impairments during 2018, 2017 or 2016.
By definition, assumptions used in estimating the fair value of a reporting unit are judgmental and inherently uncertain. A significant change in the economic conditions of a reporting unit, such as declines in business performance, changes in government fiscal policies, deterioration in market conditions, adverse estimates of regulatory or legislative changes or increases in the estimated cost of equity, could cause the estimated fair values of our reporting units to decline in the future and increase the risk of a goodwill impairment charge to earnings in a future period.
Intangible Assets Impairment
Intangible assets with finite lives are assessed for impairment whenever events or changes in circumstances indicate that the carrying value may not be recoverable. Intangible assets with indefinite lives are not amortized but are assessed for impairment at the beginning of the fourth quarter and whenever events or changes in circumstances indicate that the carrying value may not be recoverable. Additionally, indefinite-lived intangible assets are not being amortized until such time that the useful life is determined to no longer be indefinite.
There were no intangible asset impairment charges recognized in fiscal
2018
,
2017
and
2016
. The net carrying value of intangible assets as of
December 28, 2018
, was
$652 million
.
Income Taxes
We account for income taxes under the asset and liability method of accounting, which requires the recognition of deferred tax assets and liabilities for the expected future tax consequences of temporary differences between the carrying amounts and the tax bases of assets and liabilities. Under this method, changes in tax rates and laws are recognized in income in the period such changes are enacted. The provision for federal, state, foreign and local income taxes is calculated on income before income taxes based on current tax law and includes the cumulative effect of any changes in tax rates from those used previously in determining deferred tax assets and liabilities. Such provision differs from the amounts currently payable because certain items of income and expense are recognized in different reporting periods for financial reporting purposes than for income tax purposes.
Recording our provision for income taxes requires management to make significant judgments and estimates for matters whose ultimate resolution may not become known until the final resolution of an examination by the IRS or state agencies. Additionally, recording liabilities for uncertain tax positions involves significant judgment in evaluating our tax positions and developing our best estimate of the taxes ultimately expected to be paid.
Leidos Holdings, Inc. Annual Report -
46
We record net deferred tax assets to the extent we believe these assets will more likely than not be realized. In making such determination, we consider all available positive and negative evidence, including future reversals of existing taxable temporary differences, projected future taxable income, tax planning strategies and recent results of operations. If we were to determine that we would be able to realize our deferred income tax assets in the future in excess of their net recorded amount or would no longer be able to realize our deferred income tax assets in the future as currently recorded, we would make an adjustment to the valuation allowance which would decrease or increase the provision for income taxes.
We also recognize liabilities for uncertain tax positions when it is more likely than not that a tax position will not be sustained upon examination and settlement with various taxing authorities. Liabilities for uncertain tax positions are measured based upon the largest amount of benefit that is greater than
50%
likely to be realized upon ultimate settlement. We have experienced years when liabilities for uncertain tax positions were settled for amounts different from recorded amounts as described in "
Note 20—Income Taxes
" of the notes to the consolidated financial statements contained within this Annual Report on Form 10-K.
Recently Adopted and Issued Accounting Pronouncements
For a discussion of these items, see "
Note 2—Accounting Standards
" of the notes to the consolidated financial statements contained within this Annual Report on Form 10-K.
Item 7A.
Quantitative and Qualitative Disclosures About Market Risk
We are exposed to certain market risks in the normal course of business. Our current market risk exposures are primarily related to interest rates and foreign currency fluctuations. The following information about our market sensitive financial instruments contains forward-looking statements.
Interest Rate Risk
Our exposure to market risk for changes in interest rates relates primarily to long-term debt obligations and derivatives. Our policy authorizes, with Board of Directors' approval, the limited use of derivative instruments to hedge specific interest rate risks.
Debt and derivatives
At
December 28, 2018
and
December 29, 2017
, we had
$3.1 billion
of fixed and variable rate debt. During fiscal 2016, in connection with the acquisition of the IS&GS Business, Leidos, Inc. secured a new term loan of
$690 million
. As a result of the acquisition, Leidos assumed the IS&GS Business' term loans of
$1.8 billion
, which were obtained by the IS&GS Business immediately prior to the Transactions. These senior secured term loans have variable stated interest rates that are determined based on the LIBOR rate plus a margin. As a result, we may experience fluctuations in interest expense.
We have interest rate swap agreements to hedge the cash flows of a portion of our variable rate senior secured term loans ("Variable Rate Loans"). Under the terms of the interest rate swap agreements, we receive variable interest payments based on the one-month LIBOR rate and pay interest at a fixed rate. The interest rate swap agreements on
$1.1 billion
of our Variable Rate Loans had a maturity date of December 2021 and a fixed interest rate of
1.08%
. The interest rate swap agreements on
$300 million
and
$250 million
of our Variable Rate Loans had a maturity date of August 2022 and fixed interest rates of
1.66%
and
2.59%
, respectively. During fiscal 2018, we terminated these interest rate swaps and entered into new interest rate swap agreements, which mature in August 2025 and have a fixed interest rate of
3.00%
, to hedge the cash flows of
$1.5 billion
of our Variable Rate Loans. The interest rate swap agreements effectively converted a portion of our variable rate borrowings to fixed rate borrowings. As of
December 28, 2018
, and
December 29, 2017
, the fair value of our interest rate swap agreements with respect to our variable rate senior secured loans was a
$32 million
liability and a
$37 million
asset, respectively.
Additionally, we have interest rate swap agreements with respect to all of the
$450 million
aggregate principal outstanding on our fixed rate
4.45%
notes maturing in December 2020. The interest rate swap agreements effectively converted a portion of our fixed-rate debt to floating-rate debt tied to the changes in the six-month LIBOR benchmark interest rate. As a result, we may experience fluctuations in interest expense. Under the terms of the interest rate swap agreements, we will receive semi-annual interest payments at the coupon rate of
4.45%
and will pay variable interest based on the six-month LIBOR rate. As of
December 28, 2018
, and
December 29, 2017
, the fair value of our interest rate swaps with respect to our fixed rate debt was a
$3 million
liability and an immaterial amount, respectively.
Leidos Holdings, Inc. Annual Report -
47
The counterparties to these agreements are financial institutions. We do not hold or issue derivative financial instruments for trading or speculative purposes. We cannot predict future market fluctuations in interest rates and their impact on our interest rate swaps. For fiscal
2018
and fiscal
2017
, a hypothetical 10% movement in the six-month LIBOR rate would result in a $15 million and $8 million amount, respectively, related to our annual interest expense due to the interest rate swaps. For fiscal
2018
and fiscal
2017
, a hypothetical 10% movement in the one-month LIBOR rate would result in a $12 million and $11 million amount, respectively, related to our annual interest expense due to the interest rate swaps and variable rate debt. The net hypothetical 10% movement in the six-month and one-month LIBOR rates would not have a significant impact on our annual interest expense. For additional information related to our interest rate swap agreements and debt, see "
Note 14—Derivative Instruments
" and "
Note 15—Debt
," respectively, of the notes to the consolidated financial statements contained within this Annual Report on Form 10-K.
Cash and Cash Equivalents
As of
December 28, 2018
, and
December 29, 2017
, our cash and cash equivalents included investments in several large institutional money market funds and bank deposits. For fiscal
2018
and fiscal
2017
, a hypothetical 10% interest rate movement would not have a significant impact on the value of our holdings or on interest income.
Foreign Currency Risk
Although the majority of our transactions are denominated in U.S. dollars, some of our transactions are denominated in foreign currencies. Our foreign currency exchange rate risk relates to receipts from customers, payments to suppliers and certain intercompany transactions denominated in currencies other than our (or one of our subsidiaries') functional currency. Our foreign operations represented
9%
of total revenues for both fiscal
2018
and fiscal
2017
.
Leidos Holdings, Inc. Annual Report -
48
Item 8.
Financial Statements and Supplementary Data
LEIDOS HOLDINGS, INC.
INDEX TO CONSOLIDATED FINANCIAL STATEMENTS
|
|
Page
|
|
|
CONSOLIDATED FINANCIAL STATEMENTS
|
|
|
Financial statement schedules are omitted because they are not applicable or the required information is presented in the consolidated financial statements or the notes thereto.
Leidos Holdings, Inc. Annual Report -
49
REPORT OF INDEPENDENT REGISTERED PUBLIC ACCOUNTING FIRM
To the shareholders and the Board of Directors of Leidos Holdings, Inc.
Reston, Virginia
Opinion on the Financial Statements
We have audited the accompanying consolidated balance sheets of Leidos Holdings, Inc. and subsidiaries (the "Company") as of
December 28, 2018
and
December 29, 2017
, the related consolidated statements of income, comprehensive income, equity, and cash flows, for the fiscal years ended
December 28, 2018
,
December 29, 2017
, and
December 30, 2016
and the related notes (collectively referred to as the "financial statements"). In our opinion, the financial statements present fairly, in all material respects, the financial position of the Company as of
December 28, 2018
,
December 29, 2017
, and the results of its operations and its cash flows for the fiscal years ended
December 28, 2018
,
December 29, 2017
, and
December 30, 2016
, in conformity with accounting principles generally accepted in the United States of America.
We have also audited, in accordance with the standards of the Public Company Accounting Oversight Board (United States) (PCAOB), the Company's internal control over financial reporting as of
December 28, 2018
, based on criteria established in Internal Control — Integrated Framework (2013) issued by the Committee of Sponsoring Organizations of the Treadway Commission and our report dated
February 19, 2019
, expressed an unqualified opinion on the Company's internal control over financial reporting.
Basis for Opinion
These financial statements are the responsibility of the Company's management. Our responsibility is to express an opinion on the Company's financial statements based on our audits. We are a public accounting firm registered with the PCAOB and are required to be independent with respect to the Company in accordance with the U.S. federal securities laws and the applicable rules and regulations of the Securities and Exchange Commission and the PCAOB.
We conducted our audits in accordance with the standards of the PCAOB. Those standards require that we plan and perform the audit to obtain reasonable assurance about whether the financial statements are free of material misstatement, whether due to error or fraud. Our audits included performing procedures to assess the risks of material misstatement of the financial statements, whether due to error or fraud, and performing procedures that respond to those risks. Such procedures included examining, on a test basis, evidence regarding the amounts and disclosures in the financial statements. Our audits also included evaluating the accounting principles used and significant estimates made by management, as well as evaluating the overall presentation of the financial statements. We believe that our audits provide a reasonable basis for our opinion.
/s/ Deloitte & Touche LLP
McLean, Virginia
February 19, 2019
We have served as the Company's auditor since fiscal 2000.
Leidos Holdings, Inc. Annual Report -
50
LEIDOS HOLDINGS, INC.
CONSOLIDATED BALANCE SHEETS
|
|
December 28,
2018 |
|
December 29,
2017 |
|||||
|
|
(in millions)
|
|||||||
|
ASSETS
|
|
|
||||||
|
Cash and cash equivalents
|
$
|
327
|
|
|
$
|
390
|
|
|
|
Receivables, net
|
1,877
|
|
|
1,831
|
|
|||
|
Other current assets
|
543
|
|
|
453
|
|
|||
|
Assets held for sale
|
92
|
|
—
|
|
||||
|
Total current assets
|
2,839
|
|
|
2,674
|
|
|||
|
Property, plant and equipment, net
|
237
|
|
|
232
|
|
|||
|
Intangible assets, net
|
652
|
|
|
856
|
|
|||
|
Goodwill
|
4,860
|
|
4,974
|
|
||||
|
Other assets
|
182
|
|
|
254
|
|
|||
|
|
$
|
8,770
|
|
|
$
|
8,990
|
|
|
|
LIABILITIES AND EQUITY
|
|
|
||||||
|
Accounts payable and accrued liabilities
|
$
|
1,476
|
|
|
$
|
1,639
|
|
|
|
Accrued payroll and employee benefits
|
473
|
|
|
487
|
|
|||
|
Dividends payable
|
12
|
|
17
|
|
||||
|
Income taxes payable
|
3
|
|
4
|
|
||||
|
Long-term debt, current portion
|
72
|
|
|
55
|
|
|||
|
Liabilities held for sale
|
23
|
|
—
|
|
||||
|
Total current liabilities
|
2,059
|
|
|
2,202
|
|
|||
|
Long-term debt, net of current portion
|
3,052
|
|
|
3,056
|
|
|||
|
Deferred tax liabilities
|
170
|
|
220
|
|
||||
|
Other long-term liabilities
|
178
|
|
|
129
|
|
|||
|
Commitments and contingencies (Notes 22, 25 and 26)
|
|
|
||||||
|
Stockholders’ equity:
|
|
|
||||||
|
Preferred stock, $.0001 par value,10 million shares authorized and no shares issued and outstanding at December 28, 2018, and December 29, 2017
|
—
|
|
|
—
|
|
|||
|
Common stock, $.0001 par value, 500 million shares authorized, 146 million and 151 million shares issued and outstanding at December 28, 2018, and December 29, 2017, respectively
|
—
|
|
|
—
|
|
|||
|
Additional paid-in capital
|
2,966
|
|
|
3,344
|
|
|||
|
Accumulated earnings (deficit)
|
372
|
|
|
(7
|
)
|
|||
|
Accumulated other comprehensive (loss) income
|
(30
|
)
|
|
33
|
|
|||
|
Total Leidos stockholders’ equity
|
3,308
|
|
|
3,370
|
|
|||
|
Non-controlling interest
|
3
|
|
13
|
|
||||
|
Total equity
|
3,311
|
|
3,383
|
|
||||
|
|
$
|
8,770
|
|
|
$
|
8,990
|
|
|
See accompanying notes to consolidated financial statements.
Leidos Holdings, Inc. Annual Report -
51
LEIDOS HOLDINGS, INC.
CONSOLIDATED STATEMENTS OF INCOME
|
Year Ended
|
||||||||||||
|
|
December 28,
2018 |
December 29,
2017 |
December 30,
2016 |
|||||||||
|
|
(in millions, except per share amounts)
|
|||||||||||
|
Revenues
|
$
|
10,194
|
|
$
|
10,170
|
|
$
|
7,043
|
|
|||
|
Cost of revenues
|
8,690
|
|
8,738
|
|
6,103
|
|
||||||
|
Selling, general and administrative expenses
|
729
|
|
737
|
|
422
|
|
||||||
|
Bad debt expense
|
—
|
|
10
|
|
3
|
|
||||||
|
Acquisition, integration and restructuring costs
|
37
|
|
139
|
|
104
|
|
||||||
|
Asset impairment charges
|
7
|
|
—
|
|
4
|
|
||||||
|
Equity earnings of non-consolidated subsidiaries
|
(18
|
)
|
(13
|
)
|
(10
|
)
|
||||||
|
Operating income
|
749
|
|
559
|
|
417
|
|
||||||
|
Non-operating expense:
|
||||||||||||
|
Interest expense, net
|
(138
|
)
|
(140
|
)
|
(86
|
)
|
||||||
|
Other expense, net
|
(1
|
)
|
(26
|
)
|
(13
|
)
|
||||||
|
Income before income taxes
|
610
|
|
393
|
|
318
|
|
||||||
|
Income tax expense
|
(28
|
)
|
(29
|
)
|
(72
|
)
|
||||||
|
Net income
|
582
|
|
364
|
|
246
|
|
||||||
|
Less: net income (loss) attributable to non-controlling interest
|
1
|
|
(2
|
)
|
2
|
|
||||||
|
Net income attributable to Leidos common stockholders
|
$
|
581
|
|
$
|
366
|
|
$
|
244
|
|
|||
|
Earnings per share:
|
||||||||||||
|
Basic
|
$
|
3.85
|
|
$
|
2.41
|
|
$
|
2.39
|
|
|||
|
Diluted
|
3.80
|
|
2.38
|
|
2.35
|
|
||||||
See accompanying notes to consolidated financial statements.
Leidos Holdings, Inc. Annual Report -
52
LEIDOS HOLDINGS, INC.
CONSOLIDATED STATEMENTS OF COMPREHENSIVE INCOME
|
|
Year Ended
|
|||||||||||
|
|
December 28,
2018 |
December 29,
2017 |
December 30,
2016 |
|||||||||
|
|
(in millions)
|
|||||||||||
|
Net income
|
$
|
582
|
|
$
|
364
|
|
$
|
246
|
|
|||
|
Foreign currency translation adjustments
|
(61
|
)
|
24
|
|
(7
|
)
|
||||||
|
Unrecognized (loss) gain on derivative instruments
|
(10
|
)
|
4
|
|
14
|
|
||||||
|
Pension adjustments
|
(1
|
)
|
9
|
|
(3
|
)
|
||||||
|
Total other comprehensive (loss) income, net of taxes
|
(72
|
)
|
37
|
|
4
|
|
||||||
|
Comprehensive income
|
510
|
|
401
|
|
250
|
|
||||||
|
Less: comprehensive income (loss) attributable to non-controlling interest
|
1
|
|
(2
|
)
|
2
|
|
||||||
|
Comprehensive income attributable to Leidos common stockholders
|
$
|
509
|
|
$
|
403
|
|
$
|
248
|
|
|||
See accompanying notes to consolidated financial statements.
Leidos Holdings, Inc. Annual Report -
53
|
|
Shares of common stock
|
Additional
paid-in capital |
Accumulated earnings (deficit)
|
Accumulated
other comprehensive (loss) income |
Leidos Holdings, Inc. stockholders' equity
|
Non-controlling interest
|
Total
|
||||||||||||||||||||
|
|
|||||||||||||||||||||||||||
|
|
(in millions, except for per share amounts)
|
||||||||||||||||||||||||||
|
Balance at January 1, 2016
|
72
|
|
$
|
1,353
|
|
$
|
(277
|
)
|
$
|
(8
|
)
|
$
|
1,068
|
|
$
|
—
|
|
$
|
1,068
|
|
|||||||
|
Net income
|
—
|
|
—
|
|
244
|
|
—
|
|
244
|
|
2
|
|
246
|
|
|||||||||||||
|
Other comprehensive income, net of tax
es
|
—
|
|
—
|
|
—
|
|
4
|
|
4
|
|
—
|
|
4
|
|
|||||||||||||
|
Issuances of stock (less forfeitures)
|
1
|
|
36
|
|
—
|
|
—
|
|
36
|
|
—
|
|
36
|
|
|||||||||||||
|
Repurchases of stock and other
|
—
|
|
(24
|
)
|
—
|
|
—
|
|
(24
|
)
|
—
|
|
(24
|
)
|
|||||||||||||
|
Dividends of $1.28 per share
|
—
|
|
—
|
|
(144
|
)
|
—
|
|
(144
|
)
|
—
|
|
(144
|
)
|
|||||||||||||
|
Special cash dividend of $13.64 per share
|
—
|
|
(1,022
|
)
|
—
|
|
—
|
|
(1,022
|
)
|
—
|
|
(1,022
|
)
|
|||||||||||||
|
Stock-based compensation
|
—
|
|
35
|
|
—
|
|
—
|
|
35
|
|
—
|
|
35
|
|
|||||||||||||
|
Stock issued for the IS&GS Business acquisition
|
77
|
|
2,938
|
|
—
|
|
—
|
|
2,938
|
|
—
|
|
2,938
|
|
|||||||||||||
|
Equity interest acquired
|
—
|
|
—
|
|
—
|
|
—
|
|
—
|
|
10
|
|
10
|
|
|||||||||||||
|
Balance at December 30, 2016
|
150
|
|
3,316
|
|
(177
|
)
|
(4
|
)
|
3,135
|
|
12
|
|
3,147
|
|
|||||||||||||
|
Net income (loss)
|
—
|
|
—
|
|
366
|
|
—
|
|
366
|
|
(2
|
)
|
364
|
|
|||||||||||||
|
Other comprehensive income, net of taxes
|
—
|
|
—
|
|
—
|
|
37
|
|
37
|
|
—
|
|
37
|
|
|||||||||||||
|
Issuances of stock (less forfeitures)
|
1
|
|
16
|
|
—
|
|
—
|
|
16
|
|
—
|
|
16
|
|
|||||||||||||
|
Repurchases of stock and other
|
—
|
|
(31
|
)
|
—
|
|
—
|
|
(31
|
)
|
—
|
|
(31
|
)
|
|||||||||||||
|
Dividends of $1.28 per share
|
—
|
|
—
|
|
(196
|
)
|
—
|
|
(196
|
)
|
—
|
|
(196
|
)
|
|||||||||||||
|
Stock-based compensation
|
—
|
|
43
|
|
—
|
|
—
|
|
43
|
|
—
|
|
43
|
|
|||||||||||||
|
Adjustment to original purchase price allocation
|
—
|
|
—
|
|
—
|
|
—
|
|
—
|
|
3
|
|
3
|
|
|||||||||||||
|
Balance at December 29, 2017
|
151
|
|
3,344
|
|
(7
|
)
|
33
|
|
3,370
|
|
13
|
|
3,383
|
|
|||||||||||||
|
Cumulative adjustments related to ASU adoptions
|
—
|
|
—
|
|
(8
|
)
|
9
|
|
1
|
|
—
|
|
1
|
|
|||||||||||||
|
Balance at December 30, 2017
|
151
|
|
3,344
|
|
(15
|
)
|
42
|
|
3,371
|
|
13
|
|
3,384
|
|
|||||||||||||
|
Net income
|
—
|
|
—
|
|
581
|
|
—
|
|
581
|
|
1
|
|
582
|
|
|||||||||||||
|
Other comprehensive loss, net of taxes
|
—
|
|
—
|
|
—
|
|
(72
|
)
|
(72
|
)
|
—
|
|
(72
|
)
|
|||||||||||||
|
Issuances of stock (less forfeitures)
|
1
|
|
17
|
|
—
|
|
—
|
|
17
|
|
—
|
|
17
|
|
|||||||||||||
|
Repurchases of stock and other
|
(6
|
)
|
(438
|
)
|
—
|
|
—
|
|
(438
|
)
|
—
|
|
(438
|
)
|
|||||||||||||
|
Dividends of $1.28 per share
|
—
|
|
—
|
|
(194
|
)
|
—
|
|
(194
|
)
|
—
|
|
(194
|
)
|
|||||||||||||
|
Stock-based compensation
|
—
|
|
44
|
|
—
|
|
—
|
|
44
|
|
—
|
|
44
|
|
|||||||||||||
|
Purchase of a non-controlling interest
|
—
|
|
(1
|
)
|
—
|
|
—
|
|
(1
|
)
|
(10
|
)
|
(11
|
)
|
|||||||||||||
|
Other
|
—
|
|
—
|
|
—
|
|
—
|
|
—
|
|
(1
|
)
|
(1
|
)
|
|||||||||||||
|
Balance at December 28, 2018
|
146
|
|
$
|
2,966
|
|
$
|
372
|
|
$
|
(30
|
)
|
$
|
3,308
|
|
$
|
3
|
|
$
|
3,311
|
|
|||||||
See accompanying notes to consolidated financial statements.
Leidos Holdings, Inc. Annual Report -
54
|
|
Year Ended
|
|||||||||||
|
|
December 28,
2018 |
December 29,
2017 |
December 30,
2016 |
|||||||||
|
|
(in millions)
|
|||||||||||
|
Cash flows from operations:
|
||||||||||||
|
Net income
|
$
|
582
|
|
$
|
364
|
|
$
|
246
|
|
|||
|
Adjustments to reconcile net income to net cash provided by continuing operations:
|
||||||||||||
|
Depreciation and amortization
|
257
|
|
336
|
|
122
|
|
||||||
|
Amortization of equity method investments
|
10
|
|
14
|
|
—
|
|
||||||
|
Stock-based compensation
|
44
|
|
43
|
|
35
|
|
||||||
|
Asset impairment charges
|
7
|
|
—
|
|
4
|
|
||||||
|
Non-cash interest expense
|
6
|
|
12
|
|
4
|
|
||||||
|
Promissory note impairment
|
—
|
|
33
|
|
—
|
|
||||||
|
Bad debt expense
|
—
|
|
10
|
|
3
|
|
||||||
|
Other
|
2
|
|
9
|
|
(7
|
)
|
||||||
|
Change in assets and liabilities, net of effects of acquisitions and dispositions:
|
||||||||||||
|
Receivables
|
(58
|
)
|
(191
|
)
|
123
|
|
||||||
|
Other current assets
|
(73
|
)
|
(76
|
)
|
(98
|
)
|
||||||
|
Accounts payable and accrued liabilities
|
(46
|
)
|
152
|
|
(25
|
)
|
||||||
|
Accrued payroll and employee benefits
|
(12
|
)
|
8
|
|
26
|
|
||||||
|
Deferred income taxes and income taxes receivable/payable
|
(39
|
)
|
(151
|
)
|
36
|
|
||||||
|
Other long-term assets/liabilities
|
88
|
|
(37
|
)
|
(20
|
)
|
||||||
|
Net cash provided by operating activities of continuing operations
|
768
|
|
526
|
|
449
|
|
||||||
|
Cash flows from investing activities:
|
||||||||||||
|
Payments for property, plant and equipment
|
(73
|
)
|
(81
|
)
|
(29
|
)
|
||||||
|
Collections on promissory note
|
40
|
|
2
|
|
4
|
|
||||||
|
Acquisitions of businesses
|
(81
|
)
|
—
|
|
25
|
|
||||||
|
Net proceeds from sale of assets
|
—
|
|
8
|
|
3
|
|
||||||
|
Proceeds from disposition of business
|
—
|
|
—
|
|
23
|
|
||||||
|
Net cash (used in) provided by investing activities of continuing operations
|
(114
|
)
|
(71
|
)
|
26
|
|
||||||
Leidos Holdings, Inc. Annual Report -
55
|
|
Year Ended
|
|||||||||||
|
|
December 28,
2018 |
December 29,
2017 |
December 30,
2016 |
|||||||||
|
|
(in millions)
|
|||||||||||
|
Cash flows from financing activities:
|
||||||||||||
|
Payments of long-term debt
|
(59
|
)
|
(209
|
)
|
(277
|
)
|
||||||
|
Proceeds from debt issuance
|
—
|
|
—
|
|
690
|
|
||||||
|
Payments for debt issuance and modification costs
|
(8
|
)
|
(4
|
)
|
(30
|
)
|
||||||
|
Proceeds from issuances of stock
|
14
|
|
13
|
|
25
|
|
||||||
|
Repurchases of stock and other
|
(438
|
)
|
(31
|
)
|
(24
|
)
|
||||||
|
Special cash dividend payment
|
—
|
|
—
|
|
(993
|
)
|
||||||
|
Dividend payments
|
(198
|
)
|
(198
|
)
|
(142
|
)
|
||||||
|
Payment of tax indemnification liability
|
(23
|
)
|
—
|
|
—
|
|
||||||
|
Proceeds from real estate financing transaction
|
14
|
|
—
|
|
—
|
|
||||||
|
Payments for non-controlling interest acquired
|
(8
|
)
|
—
|
|
—
|
|
||||||
|
Other
|
(1
|
)
|
—
|
|
—
|
|
||||||
|
Net cash used in financing activities of continuing operations
|
(707
|
)
|
(429
|
)
|
(751
|
)
|
||||||
|
Net (decrease) increase in cash, cash equivalents and restricted cash from continuing operations
|
(53
|
)
|
26
|
|
(276
|
)
|
||||||
|
Cash flows from discontinued operations:
|
||||||||||||
|
Net cash used in investing activities of discontinued operations
|
—
|
|
—
|
|
(1
|
)
|
||||||
|
Net decrease in cash, cash equivalents and restricted cash from discontinued operations
|
—
|
|
—
|
|
(1
|
)
|
||||||
|
Net (decrease) increase in cash, cash equivalents and restricted cash
|
(53
|
)
|
26
|
|
(277
|
)
|
||||||
|
Cash, cash equivalents and restricted cash at beginning of year
|
422
|
|
396
|
|
673
|
|
||||||
|
Cash, cash equivalents and restricted cash at end of year
|
$
|
369
|
|
$
|
422
|
|
$
|
396
|
|
|||
See accompanying notes to consolidated financial statements.
Leidos Holdings, Inc. Annual Report -
56
LEIDOS HOLDINGS, INC.
NOTES TO CONSOLIDATED FINANCIAL STATEMENTS
Note 1—Nature of Operations and Basis of Presentation
Nature of Operations and Basis of Presentation
Leidos Holdings, Inc. ("Leidos"), a Delaware corporation, is a holding company whose direct 100%-owned subsidiary and principal operating company is Leidos, Inc. Leidos is a FORTUNE 500
®
science, engineering and information technology company that provides services and solutions in the defense, intelligence, civil and health markets. Leidos' domestic customers include the U.S. Department of Defense ("DoD"), the U.S. Intelligence Community, the U.S. Department of Homeland Security ("DHS"), the Federal Aviation Administration, the Department of Veterans Affairs and many other U.S. government civilian agencies, as well as state and local government agencies. Leidos' international customers include foreign governments and their agencies, primarily located in Australia and the United Kingdom ("U.K."). Unless indicated otherwise, references to the "Company," "we," "us" and "our" refer collectively to Leidos Holdings, Inc. and its consolidated subsidiaries.
On August 16, 2016, a wholly-owned subsidiary of Leidos Holdings, Inc. merged with the Information Systems & Global Solutions business (the "IS&GS Business") of Lockheed Martin Corporation in a Reverse Morris Trust transaction (see "
Note 6—Acquisitions
" for further information). The acquired IS&GS Business was renamed Leidos Innovations Corporation. On December 28, 2018, Leidos Innovations Corporation was merged into Leidos, Inc. As a result of the Lockheed Martin transaction, the Company received a controlling interest in Mission Support Alliance, LLC ("MSA"), a joint venture with Centerra Group, LLC and Jacobs Engineering Group, Inc. ("Jacobs Group"). On January 26, 2018, the Company entered into a Membership Interest Purchase Agreement with Jacobs Group, whereby the Company purchased
100%
of Jacobs Group's
41%
outstanding membership interest in MSA. As a result, Leidos increased its controlling ownership in MSA from
47%
to
88%
. The Company consolidates the financial results for MSA into its consolidated financial statements.
The consolidated financial statements also include the balances of all voting interest entities in which Leidos has a controlling voting interest ("subsidiaries") and a variable interest entity ("VIE") in which Leidos is the primary beneficiary. The consolidated balances of the Company's VIE are not material to the Company's consolidated financial statements for the periods presented. Intercompany accounts and transactions between consolidated companies have been eliminated in consolidation.
During fiscal 2017, the Company completed its business reorganization, which resulted in identification of
three
reportable segments (Defense Solutions, Civil and Health). Additionally, the Company separately presents the costs associated with corporate functions as Corporate. The Company commenced operating and reporting under the new organizational structure effective the beginning of fiscal 2017. As a result of this change, fiscal 2016 segment results and disclosures have been recast to reflect the new reportable segments (see "
Note 24—Business Segments
").
Certain amounts in the prior year financial statements have been reclassified to conform to the current year presentation. The Company classifies indirect costs incurred within or allocated to its U.S. government customers as overhead (included in "Cost of revenues") or general administrative expenses in the same manner as such costs are defined in the Company's disclosure statements under U.S. government Cost Accounting Standards ("CAS"). Effective the beginning of fiscal 2018, the Company established a new CAS structure and revised its disclosure statements accordingly to reflect the related cost accounting practice changes. Consequently,
$185 million
and
$88 million
was reclassified from "Cost of revenues" to "Selling, general and administrative expenses" on the consolidated statements of income for fiscal 2017 and 2016, respectively.
The Company aggregated "Acquisition and integration costs" and "Restructuring expenses" into "Acquisition, integration and restructuring costs", and "Interest income" and "Interest expense" into "Interest expense, net" on the consolidated statements of income. Additionally, the Company separately disclosed "Collections on promissory note", which was previously included in "Other" within investing cash flows on the consolidated statements of cash flows.
Leidos Holdings, Inc. Annual Report -
57
Note 2—Accounting Standards
Accounting Standards Updates Adopted
During fiscal
2018
, the Company adopted the following Accounting Standards Updates ("ASU"):
ASU 2014-09,
Revenue from Contracts with Customers (Topic 606)
In May 2014, the Financial Accounting Standards Board ("FASB") issued Accounting Standards Update 2014-09 ("ASC 606")
and related amendments, which superseded all prior revenue recognition methods and industry-specific guidance. The core principle of ASC 606 is an entity should recognize revenue to depict the transfer of control for promised goods or services to customers in an amount that reflects the consideration to which the entity expects to be entitled in exchange for those goods or services. In applying the revenue principles, an entity is required to identify the contract(s) with a customer, identify the performance obligations, determine the transaction price, allocate the transaction price to the performance obligations and recognize revenue when the performance obligation is satisfied (i.e., either over time or point in time). ASC 606 further requires that companies disclose sufficient information to enable users of financial statements to understand the nature, amount, timing and uncertainty of revenue and cash flows arising from contracts with customers.
ASC 606 provided companies an option of two transition methods, the full retrospective method, in which case the standard would be applied to each prior reporting period presented and the cumulative effect of applying the standard would be recognized at the earliest period shown, or the modified retrospective method, in which case the cumulative effect of applying the standard would be recognized at the date of initial application. The ASU was effective for annual reporting periods beginning after December 15, 2017.
Effective December 30, 2017 (the beginning of fiscal 2018), the Company adopted the requirements of ASC 606 using the modified retrospective method. The guidance was not applied to contracts that were complete at December 30, 2017, and the comparative information for the prior fiscal years have not been retrospectively adjusted.
As a result of the adoption the Company recorded a
$1 million
decrease to its beginning accumulated deficit as the cumulative impact of adoption of the new revenue standard. The primary impact was on certain units-of-delivery contracts, as the Company previously recognized revenue at a point in time when the customer accepted delivery of the product or service. Under ASC 606, revenues on certain units-of-delivery contracts are now recognized using an over-time model. The adoption of ASC 606 did not have a significant impact on the Company's revenue recognition policy as revenues on substantially all of the Company's contracts continue to be recognized over time.
In adopting ASC 606, the Company elected to use certain practical expedients permitted by the standard including using the portfolio approach where contracts with similar characteristics were assessed collectively to evaluate risk over the impact of ASC 606. The Company also elected to adopt the right-to-invoice practical expedient on certain cost-reimbursable contracts where the Company recognizes revenues as it is contractually able to invoice the customer based on the control transferred to the customer.
ASU 2017-12,
Derivatives and Hedging (Topic 815): Targeted Improvements to Accounting for Hedge Activities
In August 2017, the FASB issued ASU 2017-12, which simplifies the application of hedge accounting and improves the financial reporting of hedging relationships to better portray the economic results of an entity's risk management activities. The ASU is effective for public companies for annual reporting periods beginning after December 15, 2018, and should be applied on a modified retrospective basis. Early adoption is permitted.
The Company early adopted the provisions of ASU 2017-12 using the modified retrospective method during the first quarter of fiscal 2018, and recorded a
$3 million
increase to accumulated other comprehensive income and a corresponding increase to beginning accumulated deficit for the cumulative ineffectiveness gains related to the cash flow hedges.
Leidos Holdings, Inc. Annual Report -
58
ASU 2018-02,
Income Statement
–
Reporting Comprehensive Income (Topic 220): Reclassification of Certain Tax Effects from Accumulated Other Comprehensive Income
In February 2018, the FASB issued ASU 2018-02, which allows a reclassification from accumulated other comprehensive income to retained earnings for stranded tax effects resulting from the Tax Cuts and Jobs Act ("Tax Act"). This ASU is effective for all entities for annual reporting periods beginning after December 15, 2018, and should be applied either in the period of adoption or retrospectively to each period in which the effect of the change in the U.S. federal corporate income tax rate due to the Tax Act is recognized. Early adoption is permitted.
The Company early adopted the provisions of ASU 2018-02 during the first quarter of fiscal 2018 (applied in the period of adoption), and recorded a
$6 million
increase to accumulated other comprehensive income and a corresponding increase to beginning accumulated deficit to reflect the changes in the U.S. federal corporate income tax rate as a result of the Tax Act. As a result of the adoption of ASU 2018-02, the Company's policy to release income tax effects in accumulated other comprehensive income is consistent with the underlying book method.
The cumulative effect of the changes made to the Company's consolidated balance sheet for the adoptions of the ASUs above was as follows:
|
Balance at December 29, 2017
|
Adjustments due to ASU 2014-09
|
Adjustments due to ASU 2017-12
|
Adjustments due to ASU 2018-02
|
Balance at December 30, 2017
|
||||||||||||||||
|
(in millions)
|
||||||||||||||||||||
|
Assets:
|
||||||||||||||||||||
|
Receivables, net
|
$
|
1,831
|
|
$
|
4
|
|
$
|
—
|
|
$
|
—
|
|
$
|
1,835
|
|
|||||
|
Other current assets
|
453
|
|
(3
|
)
|
—
|
|
—
|
|
450
|
|
||||||||||
|
Equity:
|
||||||||||||||||||||
|
Accumulated deficit
|
$
|
(7
|
)
|
$
|
1
|
|
$
|
(3
|
)
|
$
|
(6
|
)
|
$
|
(15
|
)
|
|||||
|
Accumulated other comprehensive income
|
33
|
|
—
|
|
3
|
|
6
|
|
42
|
|
||||||||||
Accounting Standards Updates Issued But Not Yet Adopted
ASU 2016-02, ASU 2018-10, ASU 2018-11 and ASU 2018-20,
Leases
(Topic 842)
In February 2016, the FASB issued ASU 2016-02, which supersedes the current lease guidance under
Leases (Topic 840)
and makes several changes, such as requiring an entity to recognize a right-of-use ("ROU") asset and corresponding lease obligation on the balance sheet, classified as financing or operating, as appropriate. The update is effective for public companies for annual and interim reporting periods beginning after December 15, 2018, and should be adopted under the modified retrospective approach.
In July 2018, the FASB issued ASU 2018-10 "Codification Improvements to Topic 842, Leases" to add clarity to certain areas within ASU 2016-02 and ASU 2018-11 "Targeted Improvements", to add an additional and optional transition method to adopt the new leases standard by allowing recognition of a cumulative-effect adjustment to the opening balance of retained earnings in the period of adoption. In December 2018, the FASB issued ASU 2018-20 "Narrow-Scope Improvements for Lessors" to add clarity to lessors accounting for sales taxes and other similar taxes collected from lessees, accounting for variable payments for contracts with lease and non-lease components, and accounting for certain lessor costs. The effective date and transition requirements of these updates will be the same as ASU 2016-02.
The Company plans to adopt the new lease accounting standards in fiscal 2019 using the optional transition method. The Company has made progress in reviewing lease and other service based contracts, implementing a new lease accounting and administration software solution, establishing new processes and internal controls. The Company has elected to adopt certain practical expedients provided under ASC 842, including the option to not apply lease recognition for short-term leases, reassessment of whether expired or existing contracts contain leases, reassessment of lease classification for expired or existing leases, applying a single discount rate to a portfolio of leased assets with similar durations, reassessing initial direct costs and combining lease and non-lease components in revenue arrangements.
Leidos Holdings, Inc. Annual Report -
59
The Company expects the adoption of the new standard will result in the recognition of at least
$350 million
and
$400 million
of ROU assets and lease liabilities, respectively, primarily due to its operating leases, to the Company's consolidated balance sheets, but will not have a material impact on the consolidated statements of income and consolidated statements of cash flows. The Company's accounting for capital leases will remain substantially unchanged. Additionally, the Company estimates a
$65 million
increase in retained earnings due to the cumulative effect of recognizing a gain related to the sale and leaseback of the San Diego properties (see "
Note 22—Leases
").
ASU 2016-13,
Financial Instruments – Credit Losses (Topic 326)
In June 2016, the FASB issued ASU 2016-13, which eliminates the requirement that a credit loss on a financial instrument be "probable" prior to recognition. Instead, a valuation allowance will be recorded to reflect an entity's current estimate of all expected credit losses, based on both historical and forecasted information related to an instrument. The update is effective for public companies for annual and interim reporting periods beginning after December 15, 2019, and should be adopted using a modified retrospective approach, which applies a cumulative-effect adjustment to retained earnings as of the beginning of the first reporting period in which the guidance is effective. A prospective approach is required for debt securities for which an other-than-temporary impairment had been recognized before the effective date and loans and debt securities acquired with deteriorated credit quality. Early adoption is permitted. The Company is evaluating the provisions of ASU 2016-13 and its impact on the Company's consolidated financial position, results of operations and cash flows.
ASU 2018-15,
Customer’s Accounting for Implementation Costs Incurred in a Cloud Computing Arrangement (Subtopic 350-40)
In August 2018, the FASB issued ASU 2018-15, which aligns the capitalization requirements for implementation costs incurred in a hosting arrangement that is a service contract with the existing capitalization requirements for implementation costs associated with internal-use software. The update is effective for public companies for annual and interim reporting periods beginning after December 15, 2019, and may be adopted either retrospectively or prospectively. Early adoption is permitted. The Company is evaluating the provisions of ASU 2018-15 and its impact on the Company’s consolidated financial position, results of operations and cash flows.
Note 3—Summary of Significant Accounting Policies
Reporting Periods
Leidos' fiscal year ends on the Friday nearest the end of December. Fiscal 2018, 2017 and 2016 each included
52
weeks.
Use of Estimates
The preparation of financial statements in conformity with accounting principles generally accepted in the United States of America ("GAAP") requires management to make estimates and assumptions that affect the reported amounts of assets and liabilities and the disclosure of contingencies at the date of the financial statements, as well as the reported amounts of revenues and expenses during the reporting periods. Management evaluates these estimates and assumptions on an ongoing basis, including those relating to estimated profitability of long-term contracts, indirect billing rates, allowances for doubtful accounts, inventories, fair value and impairment of intangible assets and goodwill, income taxes, pension benefits, stock-based compensation expense and contingencies. These estimates have been prepared by management on the basis of the most current and best available information; however, actual results could differ materially from those estimates.
Operating Cycle
The Company's operating cycle for long-term contracts may be greater than
one
year and is measured by the average time intervening between the inception and the completion of those contracts.
Business Combinations, Investments and Variable Interest Entities
Business Combinations
The accounting for business combinations requires the Company to make judgments and estimates related to the fair value of assets acquired, including the identification and valuation of intangible assets, as well as liabilities and contingencies assumed. Such judgments and estimates directly impact the amount of goodwill recognized in connection with an acquisition.
Leidos Holdings, Inc. Annual Report -
60
Investments
Investments in entities and corporate joint ventures where the Company has a non-controlling ownership interest but over which the Company has the ability to exercise significant influence, are accounted for under the equity method of accounting whereby the Company recognizes its proportionate share of the entities' net income or loss and does not consolidate the entities' assets and liabilities.
Equity investments in entities over which the Company does not have the ability to exercise significant influence and whose securities do not have a readily determinable fair value are carried at cost or cost net of other-than-temporary impairments.
Variable Interest Entities
The Company occasionally forms joint ventures and/or enters into arrangements with special purpose limited liability companies for the purpose of bidding and executing on specific projects. The Company analyzes each such arrangement to determine whether it represents a VIE. If the arrangement is determined to be a VIE, the Company assesses whether it is the primary beneficiary of the VIE and is consequently required to consolidate the VIE.
Divestitures
From time-to-time, the Company may dispose (or management may commit to plans to dispose) of strategic or non-strategic components of the business. Divestitures representing a strategic shift in operations are classified as discontinued operations for all periods presented. Non-strategic divestitures are not reclassified as discontinued operations and remain in continuing operations.
Restructuring Expenses
Restructuring expenses are incurred in connection with programs aimed at reducing the Company's costs and primarily include lease termination, vacancy costs and termination costs associated with headcount reduction.
The Company's restructuring actions include one-time involuntary termination benefits as well as certain contractual termination benefits or employee terminations under ongoing benefit arrangements. One-time involuntary termination benefits are recognized as a liability at estimated fair value when the plan of termination has been communicated to employees and certain other criteria are met. Ongoing termination benefit arrangements are recognized as a liability at estimated fair value when it is probable that amounts will be paid to employees and such amounts are reasonably estimable. When the Company ceases using a facility but does not intend to or is unable to terminate the operating lease, the Company records a liability for the present value of the remaining lease payments, net of estimated sublease income, if any, that could be reasonably obtained for the property (even if the Company does not intend to sublease the facility for the remaining term of the lease). Costs associated with exit or disposal activities, including the related one-time and ongoing involuntary termination benefits, are included as "Acquisition, integration and restructuring costs" on the consolidated statements of income. See "
Note 8—Restructuring Expenses
" for additional information about the Company's restructuring activities.
Revenue Recognition
The Company's revenues from contracts with customers are from offerings including
enterprise modernization; cyber operations; operations and logistics; mission software systems; integrated systems; sensors and phenomenology; and mission support
, primarily with the U.S. government and its agencies. The Company also serves various state and local governments, foreign governments and U.S. commercial customers.
The Company performs under various types of contracts, which include firm-fixed-price ("FFP"), time-and-materials ("T&M"), fixed-price-level-of-effort ("FP-LOE"), cost-plus-fixed-fee, cost-plus-award-fee, cost-plus-incentive-fee and fixed-price-incentive-fee ("FP-IF") contracts.
Leidos Holdings, Inc. Annual Report -
61
To determine the proper revenue recognition, the Company first evaluates whether it has a duly approved and enforceable contract with a customer, in which the rights of the parties and payment terms are identified, and collectability is probable. The Company also evaluates whether two or more contracts should be combined and accounted for as a single contract, including the task orders issued under an indefinite delivery/indefinite quantity ("IDIQ") award. In addition, the Company assesses contract modifications to determine whether changes to existing contracts should be accounted for as part of the original contract or as a separate contract. Contract modifications for the Company generally relate to changes in contract specifications and requirements and do not add distinct services, and therefore are accounted for as part of the original contract. If contract modifications add distinct goods or services and increase the contract value by an amount that reflects the standalone selling price, those modifications are accounted for as separate contracts.
Most of the Company's contracts are comprised of multiple promises including the design and build of software-based systems, integration of hardware and software solutions, running and maintaining of IT infrastructure and procurement services. In all cases, the Company assesses if the multiple promises should be accounted for as separate performance obligations or combined into a single performance obligation. The Company generally separates multiple promises in a contract as separate performance obligations if those promises are distinct, both individually and in the context of the contract. If multiple promises in a contract are highly interrelated or require significant integration or customization within a group, they are combined and accounted for as a single performance obligation.
The Company's contracts with the U.S. government often contain options to renew existing contracts for an additional period of time (generally a year at a time) under the same terms and conditions as the original contract, and generally do not provide the customer any material rights under the contract. The Company accounts for renewal options as separate contracts when they include distinct goods or services at standalone selling prices.
Contracts with the U.S. government are subject to the Federal Acquisition Regulation ("FAR") and priced on estimated or actual costs of providing the goods or services. The FAR provides guidance on types of costs that are allowable in establishing prices for goods and services provided to the U.S. government and its agencies. Each contract is competitively priced and bid separately. Pricing for non-U.S. government agencies and commercial customers is based on specific negotiations with each customer. In circumstances where the standalone selling price is not directly observable, we estimate the standalone selling price using the expected cost plus margin approach. The Company excludes any taxes collected or imposed when determining the transaction price.
Certain of the Company's cost-plus and fixed-price contracts contain award fees, incentive fees or other provisions that may either increase or decrease the transaction price. These variable amounts generally are awarded upon achievement of certain performance metrics, program milestones or cost targets and can be based upon customer discretion. The Company estimates variable consideration at the most probable amount that it expects to be entitled to, based on the assessment of the contractual variable fee criteria, complexity of work and related risks, extent of customer discretion, amount of variable consideration received historically and the potential of significant reversal of revenue.
The Company allocates the transaction price of a contract to its performance obligations in the proportion of its respective standalone selling prices. The standalone selling price of the Company's performance obligations is generally based on an expected cost-plus margin approach, in accordance with the FAR. For certain product sales, the Company uses prices from other standalone sales. Substantially all of the Company's contracts do not contain a significant financing component, which would require an adjustment to the transaction price of the contract.
The Company recognizes revenue on its service based contracts primarily over time as there is continuous transfer of control to the customer over the duration of the contract as the Company performs the promised services. For U.S. government contracts, continuous transfer of control to the customer is evidenced by clauses in the contract that allow the customer to unilaterally terminate the contract for convenience, pay for costs incurred plus a reasonable profit and take control of any work-in-process. Similarly, for non-U.S. government contracts, the customer typically controls the work-in-process as evidenced by rights to payment for work performed to date plus a reasonable profit to deliver products or services that do not have an alternate use to the Company. Anticipated losses on service based contracts are recognized when known. In certain product sales, where the products have an alternate use, the Company recognizes revenue at a point in time when the customer takes control of the asset usually denoted by possession and legal title.
Leidos Holdings, Inc. Annual Report -
62
On FFP contracts, revenue recognized over time generally uses a method that measures the extent of progress towards completion of a performance obligation, principally using a cost-input method (referred to as the cost-to-cost method). Under the cost-to-cost method, revenue is recognized based on the proportion of total costs incurred to estimated total costs-at-completion ("EAC"). A performance obligation's EAC includes all direct costs such as materials, labor, subcontract costs, overhead, and a ratable portion of general and administrative costs. In addition, the Company includes in an EAC of a performance obligation future losses estimated to be incurred on onerous contracts, as and when known. On certain other contracts, principally T&M, FP-LOE, and cost-plus, revenue is recognized using the right-to-invoice practical expedient as the Company is contractually able to invoice the customer based on the control transferred to the customer. Additionally, on maintenance (generally FFP) performance obligations, revenue is recognized over time using a straight-line method as the control of the services is provided to the customer evenly over the period of performance.
For certain performance obligations, the Company is not primarily responsible for fulfilling the promise to provide the goods or service to the customer, does not have inventory risk and does not have discretion in establishing the price for the goods or service. In such cases, the Company recognizes revenue on a net basis.
Contract Costs
Contract costs generally include direct costs such as materials, labor, subcontract costs and indirect costs identifiable with or allocable to a specific contract. Costs are expensed as incurred except for costs incurred to fulfill a contract, which are capitalized and amortized on a straight-line basis over the expected period of performance. The Company does not incur significant incremental costs to acquire contracts. Contract costs incurred for U.S. government contracts, including indirect costs, are subject to audit and adjustment by the Defense Contract Audit Agency ("DCAA") (see "
Note 25—Contingencies
").
Pre-contract Costs
Costs incurred on projects as pre-contract costs are deferred as assets when the Company has been requested by the customer to begin work under a new arrangement prior to contract execution and it is probable that the Company will recover the costs through the issuance of a contract. When the formal contract has been executed, the costs are recorded to the contract and revenue is recognized.
Transition Costs
Under certain service contracts, costs are incurred, usually at the beginning of the contract performance, to transition the services, employees and equipment to or from the customer or prior contractor. These costs are generally capitalized as deferred assets and amortized over the contractual period of performance and unexercised option periods.
Project Assets
Purchases of project assets are capitalized for specific contracts where delivery has not yet occurred, ownership is maintained by the Company over the life of the contract or the benefit is received over a period of time. Project assets include enterprise software licenses, hardware, maintenance agreements, computers and significant material purchases and other costs incurred on contracts. Project assets are relieved from the balance sheet based on different methodologies, including transfer of assets and amortization based on the estimated useful life of the asset or using the straight-line method over the expected term of the performance obligation.
Changes in Estimates on Contracts
Changes in estimates related to contracts accounted for using the cost-to-cost method of accounting are recognized in the period in which such changes are made for the inception-to-date effect of the changes, with the exception of contracts acquired through the acquisition of the IS&GS Business (see "
Note 6—Acquisitions
"), where the adjustment is for the period commencing from the date of acquisition.
Leidos Holdings, Inc. Annual Report -
63
Changes in estimates on contracts for the periods presented were as follows:
|
Year Ended
|
||||||||||||
|
December 28,
2018 |
December 29,
2017 |
December 30,
2016 |
||||||||||
|
(in millions, except for per share amounts)
|
||||||||||||
|
Net favorable impact to income before income taxes
|
$
|
105
|
|
$
|
103
|
|
$
|
37
|
|
|||
|
Impact on diluted EPS attributable to Leidos common stockholders
|
$
|
0.52
|
|
$
|
0.41
|
|
$
|
0.22
|
|
|||
The increase in the changes in estimates on contracts from fiscal 2016 to fiscal 2017 is primarily due to completion of contracts or events which mitigated risk and due to the finalization of award and incentive fees.
The impact on diluted EPS attributable to Leidos common stockholders is calculated using the Company's statutory tax rate.
During fiscal
2018
, revenue recognized from performance obligations satisfied in previous periods was
$102 million
.
The changes primarily relate to revisions of variable consideration, including award fees, and revisions to estimates at completion resulting from changes in contract scope, mitigation of contract risks or due to true-ups of contract estimates at the end of contract performance
.
Selling, General and Administrative Expenses
The Company classifies indirect costs incurred within or allocated to its U.S. government customers as overhead (included in "Cost of revenues") or general and administrative expenses in the same manner as such costs are defined in the Company's disclosure statements under U.S. government CAS.
Selling, general and administrative expenses include general and administrative, bid and proposal and internal research and development ("IR&D") expenses.
The Company conducts research and development activities under customer-funded contracts and with company-funded IR&D funds. For fiscal
2018
,
2017
and
2016
, company-funded IR&D expense was
$46 million
,
$42 million
and
$44 million
, respectively. Expenses for research and development activities performed under customer contracts are charged directly to cost of revenues for those contracts.
Income Taxes
The Company accounts for income taxes under the asset and liability method in accordance with the accounting standard for income taxes. The asset and liability method requires the recognition of deferred tax assets and liabilities for the expected future tax consequences of temporary differences between the carrying amounts and tax bases of assets and liabilities. Under this method, changes in tax rates and laws are recognized in income in the period such changes are enacted.
The Company records net deferred tax assets to the extent that it believes these assets will more likely than not be realized. In making such determination, the Company considers all available positive and negative evidence, including future reversals of existing taxable temporary differences, projected future taxable income, tax planning strategies and recent results of operations. If the Company were to determine that it would be able to realize its deferred income tax assets in the future in excess of their net recorded amount or would no longer be able to realize its deferred income tax assets in the future as currently recorded, the Company would make an adjustment to the valuation allowance which would decrease or increase the provision for income taxes.
The provision for federal, state, foreign and local income taxes is calculated on income before income taxes based on current tax law and includes the cumulative effect of any changes in tax rates from those used previously in determining deferred tax assets and liabilities. Such provision differs from the amounts currently payable because certain items of income and expense are recognized in different reporting periods for financial reporting purposes than for income tax purposes.
The Company recognizes liabilities for uncertain tax positions when it is more likely than not that a tax position will not be sustained upon examination and settlement with various taxing authorities. Liabilities for uncertain tax positions are measured based upon the largest amount of benefit that is greater than
50%
likely of being realized upon ultimate settlement. The Company recognizes interest and penalties related to uncertain tax positions in its income tax expense.
Leidos Holdings, Inc. Annual Report -
64
Cash and Cash Equivalents
The Company's cash equivalents were primarily comprised of investments in several large institutional money market funds and bank deposits, with original maturity of three months or less. The Company includes outstanding payments within "Cash and cash equivalents" and correspondingly increases "Accounts payable and accrued liabilities" on the consolidated balance sheets. At
December 28, 2018
, and
December 29, 2017
, the Company included
$56 million
and
$169 million
, respectively, of outstanding payments within "Cash and cash equivalents."
Restricted Cash
The Company has restricted cash balances, primarily representing
advances from customers that are restricted as to use for certain expenditures related to that customer's contract
. Restricted cash balances are included as "Other current assets" in the consolidated balance sheets.
Receivables
The Company's receivables include amounts billed and currently due from customers, amounts billable where the right to consideration is unconditional and amounts unbilled. As of fiscal 2018, amounts billable were classified as billed receivables. These receivables were classified as unbilled receivables for fiscal 2017 (see "
Note 9—Receivables
").
Amounts billable and unbilled amounts are recognized at estimated realizable value and consist of costs and fees, substantially all of which are expected to be billed and collected generally within one year. Unbilled amounts also include rate variances that are billable upon negotiation of final indirect rates with the DCAA.
The typical billing for the Company's cost-reimbursable and T&M contracts is as costs are incurred. FFP contracts are billed either based on milestones, which are the achievement of specific events as defined in the contract, or based on progress payments, which are interim payments up to a designated amount of costs incurred as work progresses. On certain contracts, the customer withholds a certain percentage of the contract price (retainage). These withheld amounts are included within the Company's unbilled receivables and are billed upon contract completion or the occurrence of a specified event, and when negotiation of final indirect rates with the U.S. government is complete. Based on the Company's historical experience, the write-offs of retention balances have not been significant.
When events or conditions indicate that amounts outstanding from customers may become uncollectible, an allowance is estimated and recorded.
Amounts billed and collected on contracts but not yet recorded as revenue because the Company has not performed its obligation under the arrangement with a customer are deferred and included within "Accounts payable and accrued liabilities" or "Other long-term liabilities" on the consolidated balance sheets.
Concentration of Credit Risk
Financial instruments that potentially subject the Company to concentrations of credit risk primarily consist of accounts receivable and derivatives. Since the Company's receivables are primarily with the U.S. government, the Company does not have exposure to a material credit risk. The Company manages its credit risk related to derivatives through the use of multiple counterparties with high credit standards.
Inventories
Inventories are valued at the lower of cost or estimated net realizable value. Raw material inventory is valued using the average cost method. Work-in-process inventory includes raw material costs plus labor costs, including fringe benefits and allocable overhead costs. The majority of finished goods inventory consists of security products, inspection systems and baggage scanning equipment. The Company evaluates inventory against historical and planned usage to determine appropriate provisions for obsolete inventory. Inventory balances are included as "Other current assets" in the consolidated balance sheets.
Leidos Holdings, Inc. Annual Report -
65
Goodwill
Goodwill represents the excess of the fair value of consideration transferred, plus the fair value of any non-controlling interests in the acquiree, over the fair value of the net assets acquired and liabilities assumed as of the acquisition date. Goodwill is not amortized, but instead is tested annually for impairment at the reporting unit level and tested more frequently if events or circumstances indicate that the carrying value may not be recoverable. The Company's policy is to perform its annual goodwill impairment evaluation as of the first day of the fourth quarter of its fiscal year. During fiscal
2018
, the Company had
five
reporting units for the purpose of testing goodwill for impairment.
Goodwill is evaluated for impairment either under a qualitative assessment option or a quantitative approach depending on the facts and circumstances of a reporting unit, consideration of the excess of a reporting unit's fair value over its carrying amount in previous assessments and changes in business environment.
When performing a qualitative assessment, the Company considers factors including, but not limited to, current macroeconomic conditions, industry and market conditions, cost factors, financial performance and other events relevant to the entity or reporting unit under evaluation to determine whether it is more likely than not that the fair value of a reporting unit is less than its carrying amount. If the Company determines that it is more likely than not that a reporting unit's fair value is less than its carrying amount, a quantitative goodwill impairment test is performed.
When performing a quantitative goodwill impairment test, the reporting unit carrying value is compared to its fair value. Goodwill is deemed impaired if, and the impairment loss is recognized for the amount by which, the reporting unit carrying value exceeds its fair value.
The Company estimates the fair value of each reporting unit using both market and income approaches (Level 3) when a quantitative analysis is performed. To determine the fair value of the reporting units, the outputs from both methods are equally weighted.
The market approach is a technique where the fair value is calculated based on the multiples of comparable publicly-traded companies that provide a reasonable basis of comparison with each of the Company's reporting units. Valuation ratios are selected that relate market prices to selected financial metrics from comparable companies. These ratios are applied after consideration of adjustments and weightings related to financial position, growth, volatility, working capital movement and other factors. Due to the fact that stock prices of comparable companies represent minority interests, the Company also considers an acquisition control premium to reflect the impact of additional value associated with a controlling interest.
The income approach is a technique where the fair value is calculated based on present value of future cash flows using risk-adjusted discount rates, which represent the weighted-average cost of capital ("WACC") for each reporting unit. Determination of WACC includes assessing the cost of equity and debt as of the valuation date. In addition, a terminal value is developed for forecasted future cash flows beyond the projection period discounted back to the present value. The forecasts used in the Company’s estimation of fair value are developed by management based on business and market considerations.
The goodwill impairment test process and valuation model is based upon certain key assumptions that require the exercise of significant judgment and assumptions including the use of appropriate financial projections, economic expectations, WACC and expected long-term growth rates, as well as using available market data. Significant changes to these estimates and assumptions could adversely impact conclusions and actual future results may differ from the estimates. In addition, the identification of reporting units and the allocation of assets and liabilities to the reporting units when determining the carrying value of each reporting unit also requires judgment.
Leidos Holdings, Inc. Annual Report -
66
Intangible Assets
Acquired intangible assets with finite lives and internally developed software are amortized using the method that best reflects how their economic benefits are utilized or, if a pattern of economic benefits cannot be reliably determined, on a straight-line basis over their estimated useful lives. Intangible assets with finite lives are amortized over the following periods:
|
|
Estimated useful lives (in years)
|
|
|
Program and contract intangibles
|
6-11
|
|
|
Backlog
|
1
|
|
|
Customer relationships
|
8
|
|
|
Software and technology
|
4-15
|
|
Intangible assets with finite lives are assessed for impairment whenever events or changes in circumstances indicate that the carrying value may not be recoverable.
Intangible assets with indefinite lives are not amortized but are assessed for impairment at the beginning of the fourth quarter and whenever events or changes in circumstances indicate that the carrying value may not be recoverable.
Property, Plant and Equipment
Purchases of property, plant and equipment, including purchases of software and software licenses, as well as costs associated with major renewals and improvements are capitalized. Maintenance, repairs and minor renewals and improvements are expensed as incurred.
Construction in Progress ("CIP") is used to accumulate all costs for projects that are not yet complete. CIP balances are transferred to the appropriate asset account when the asset is capitalized and ready for its intended use.
When assets are sold or otherwise disposed of, the cost and related accumulated depreciation or amortization are removed from the accounts and any resulting gain or loss is recognized. Depreciation is recognized using the methods and estimated useful lives as follows:
|
|
Depreciation method
|
Estimated useful lives (in years)
|
||
|
Computers and other equipment
|
Straight-line or declining-balance
|
3-10
|
||
|
Buildings
|
Straight-line
|
Not to exceed 40
|
||
|
Building improvements and leasehold improvements
|
Straight-line
|
Shorter of useful life of asset or remaining lease term
|
||
|
Office furniture and fixtures
|
Straight-line or declining-balance
|
6-9
|
||
The Company evaluates its long-lived assets for potential impairment whenever there is evidence that events or changes in circumstances indicate that the carrying value may not be recoverable and the carrying amount of the asset exceeds its estimated fair value.
Fair Value Measurements
The accounting standard for fair value measurements establishes a three-level fair value hierarchy, which prioritizes the inputs used in measuring fair value as follows: observable inputs such as quoted prices in active markets (Level 1); inputs other than quoted prices in active markets for identical assets or liabilities that are observable either directly or indirectly or quoted prices that are not active (Level 2); and unobservable inputs in which there is little or no market data (e.g., discounted cash flow and other similar pricing models), which requires the Company to develop its own assumptions (Level 3).
Leidos Holdings, Inc. Annual Report -
67
The accounting guidance for fair value measurements requires that the Company maximize the use of observable inputs and minimize the use of unobservable inputs in determining fair value. The accounting guidance provides for the irrevocable option to elect, on a contract-by-contract basis, to measure certain financial assets and liabilities at fair value at inception of the contract and record any subsequent changes in fair value in earnings. The Company has not made fair value option elections on any of its financial assets and liabilities.
The fair value of financial instruments is determined based on quoted market prices, if available, or management's best estimate (see "Financial Instruments" below).
Management evaluates its investments for other-than-temporary impairment at each balance sheet date. When testing long-term investments for recovery of carrying value, the fair value of long-term investments is determined using various valuation techniques and factors such as, market prices of comparable companies (Level 2 input), discounted cash flow models (Level 3 input) and recent capital transactions of the portfolio companies being valued (Level 3 input). If management determines that an other-than-temporary decline in the fair value of an investment has occurred, an impairment loss is recognized to reduce the investment to its estimated fair value.
The Company's non-financial instruments measured at fair value on a non-recurring basis include goodwill, indefinite-lived intangible assets and long-lived tangible assets. The valuation methods used to determine fair value require a significant degree of management judgment to determine the key assumptions. As such, the Company generally classifies non-financial instruments as either Level 2 or Level 3 fair value measurements.
Financial Instruments
The Company is exposed to certain market risks which are inherent in certain transactions entered into during the normal course of business. These transactions include sales or purchase contracts denominated in foreign currencies and exposure to changing interest rates. The Company manages its risk to changes in interest rates through the use of derivative instruments.
For fixed rate borrowings, the Company uses variable interest rate swaps, effectively converting fixed rate borrowings to variable rate borrowings. These swaps are designated as fair value hedges. The fair value of these interest rate swaps is determined based on observed values for underlying interest rates on the LIBOR yield curve (Level 2).
For variable rate borrowings, the Company uses fixed interest rate swaps, effectively converting a portion of the variable interest rate payments to fixed interest rate payments. These swaps are designated as cash flow hedges. The fair value of these interest rate swaps is determined based on observed values for the underlying interest rates (Level 2).
The Company does not hold derivative instruments for trading or speculative purposes.
The Company's defined benefit plan assets consist of investments in pooled funds that contain investments with values based on quoted market prices, but for which the pools are not valued on a daily quoted market basis (Level 2).
Stock-Based Compensation
The Company accounts for stock-based compensation at the grant date based on the fair value of the award and is recognized as expense over the requisite service period, which is generally the vesting period, net of an estimated forfeiture rate.
The fair value of restricted stock awards and performance-based stock awards is based on the closing price of the Company's common stock on the date of grant. The fair value of performance-based stock awards with market conditions is based on using the Monte Carlo simulation.
The fair value of stock option awards granted is based on using the Black-Scholes-Merton option pricing model. The estimation of stock option fair value requires management to make estimates and judgments about, among other things, employee exercise behavior, forfeiture rates and the expected volatility of Leidos common stock over the expected option term. These judgments directly affect the amount of compensation expense that will ultimately be recognized.
Leidos Holdings, Inc. Annual Report -
68
Foreign Currency
The financial statements of consolidated international subsidiaries, for which the functional currency is not the U.S. dollar, are translated into U.S. dollars using the exchange rate at each balance sheet date for assets and liabilities and a weighted average exchange rate over the reporting period for revenues, expenses, gains and losses. Translation adjustments are recorded as accumulated other comprehensive (loss) income in stockholders' equity. Gains and losses due to movements in foreign currency exchange rates are recognized as "
Other expense, net
" on the consolidated statements of income.
Note 4—Revenues
Dual Reporting
The effects to the consolidated financial statements at and as of
December 28, 2018
, as a result of applying ASC 606, rather than previous GAAP ("ASC 605"), were the following:
Balance Sheet
|
As Reported
(ASC 606)
|
As Adjusted
(ASC 605)
|
|||||||
|
(in millions)
|
||||||||
|
Receivables, net
|
$
|
1,877
|
|
$
|
1,872
|
|
||
|
Other current assets
|
543
|
|
545
|
|
||||
|
Accumulated earnings (deficit)
|
372
|
|
369
|
|
||||
Income Statement
|
Year Ended December 28, 2018
|
||||||||
|
As Reported
(ASC 606)
|
As Adjusted
(ASC 605) |
|||||||
|
(in millions)
|
||||||||
|
Revenues
|
$
|
10,194
|
|
$
|
10,189
|
|
||
|
Cost of revenues
|
8,690
|
|
8,688
|
|
||||
|
Operating income
|
749
|
|
746
|
|
||||
The changes reflected above were primarily due to the Company's units-of-delivery contracts, which were recognized at a point in time under ASC 605 and are recognized using an over-time model under ASC 606.
Remaining Performance Obligations
Remaining performance obligations represent the expected value of exercised contracts, both funded and unfunded, less revenue recognized to date. Remaining performance obligations do not include unexercised option periods and future potential task orders expected to be awarded under IDIQ contracts.
As of
December 28, 2018
, the Company had
$10.2 billion
of remaining performance obligations, which are expected to be recognized as revenue in the amounts of
$7.3 billion
,
$1.1 billion
and
$1.8 billion
for fiscal
2019
, fiscal
2020
and fiscal
2021
and thereafter, respectively.
Disaggregation of Revenues
The Company disaggregates revenues by customer-type, contract-type and geographic location for each of its reportable segments. These categories represent how the nature, timing and uncertainty of revenues and cash flows are affected by the U.S. government procurement environment.
Leidos Holdings, Inc. Annual Report -
69
Disaggregated revenues by customer-type were as follows:
|
Year Ended December 28, 2018
|
||||||||||||||||
|
Defense Solutions
|
Civil
|
Health
|
Total
|
|||||||||||||
|
(in millions)
|
||||||||||||||||
|
DoD
|
$
|
4,318
|
|
$
|
128
|
|
$
|
386
|
|
$
|
4,832
|
|
||||
|
Other government agencies
(1)
|
194
|
|
2,412
|
|
1,276
|
|
3,882
|
|
||||||||
|
Commercial and non-U.S. customers
|
436
|
|
889
|
|
155
|
|
1,480
|
|
||||||||
|
Total
|
$
|
4,948
|
|
$
|
3,429
|
|
$
|
1,817
|
|
$
|
10,194
|
|
||||
(1)
Includes non-DoD federal government agencies, state and local government agencies.
The majority of the Company's revenues are generated from U.S. government contracts, either as a prime contractor or as a subcontractor to other contractors. Revenues from the U.S. government can be adversely impacted by spending caps or changes in budgetary priorities of the U.S. government, as well as delays in program start dates or the award of a contract. Government spending levels for the DoD may be impacted by spending priorities as a result of competing demands for federal funds.
Disaggregated revenues by contract-type were as follows:
|
Year Ended December 28, 2018
|
||||||||||||||||
|
Defense Solutions
|
Civil
|
Health
|
Total
|
|||||||||||||
|
(in millions)
|
||||||||||||||||
|
Cost-reimbursement and fixed-price-incentive-fee
|
$
|
3,417
|
|
$
|
1,863
|
|
$
|
189
|
|
$
|
5,469
|
|
||||
|
Firm-fixed-price
|
1,031
|
|
1,004
|
|
1,134
|
|
3,169
|
|
||||||||
|
Time-and-materials and fixed-price-level-of-effort
|
500
|
|
562
|
|
494
|
|
1,556
|
|
||||||||
|
Total
|
$
|
4,948
|
|
$
|
3,429
|
|
$
|
1,817
|
|
$
|
10,194
|
|
||||
Cost-reimbursement and FP-IF contracts are generally lower risk and have lower profits. T&M and FP-LOE contracts are also low risk but profits may vary depending on actual labor costs compared to negotiated contract billing rates. FFP contracts offer the potential for higher profits while increasing the Company’s exposure to risk of cost overruns.
Disaggregated revenues by geographic location were as follows:
|
Year Ended December 28, 2018
|
||||||||||||||||
|
Defense Solutions
|
Civil
|
Health
|
Total
|
|||||||||||||
|
(in millions)
|
||||||||||||||||
|
United States
|
$
|
4,572
|
|
$
|
2,876
|
|
$
|
1,817
|
|
$
|
9,265
|
|
||||
|
International
|
376
|
|
553
|
|
—
|
|
929
|
|
||||||||
|
Total
|
$
|
4,948
|
|
$
|
3,429
|
|
$
|
1,817
|
|
$
|
10,194
|
|
||||
The Company's international business operations, primarily located in Australia and the U.K., are subject to additional and different risks than its U.S. business. Failure to comply with U.S. government laws and regulations applicable to international business, such as the Foreign Corrupt Practices Act or U.S. export control regulations, could have an adverse impact on the Company's business with the U.S. government.
In some countries, there is an increased chance for economic, legal or political changes that may adversely affect the performance of the Company's services, sales of products or repatriation of profits. International transactions can also involve increased financial and legal risks arising from foreign exchange variability, imposition of tariffs or additional taxes and restrictive trade policies and delays or failure to collect amounts due to differing legal systems.
Leidos Holdings, Inc. Annual Report -
70
Note 5—Contract Assets and Liabilities
The Company’s performance obligations are satisfied either over time as work progresses or at a point in time. FFP contracts are typically billed to the customer using milestone payments while cost-reimbursable and T&M contracts are typically billed to the customer on a monthly or bi-weekly basis as indicated by the negotiated billing terms and conditions of the contract. As a result, for each of the company’s contracts, the timing of revenue recognition, customer billings and cash collections results in a net contract asset or liability at the end of each reporting period.
Contract assets include unbilled receivables, which is the amount of revenue recognized that exceeds the amount billed to the customer, where right to payment is not just subject to the passage of time.
Contract liabilities consist of deferred revenue.
The components of contract assets and contract liabilities consisted of the following:
|
Balance sheet line item
|
December 28,
2018 |
December 30, 2017
(1)
|
||||||||
|
(in millions)
|
||||||||||
|
Contract assets - current:
|
||||||||||
|
Unbilled receivables
(2)
|
Receivables, net
|
$
|
818
|
|
$
|
844
|
|
|||
|
Contract liabilities - current:
|
||||||||||
|
Deferred revenue
|
Accounts payable and accrued liabilities
|
$
|
276
|
|
$
|
293
|
|
|||
|
Contract liabilities - non-current:
|
||||||||||
|
Deferred revenue
|
Other long-term liabilities
|
$
|
10
|
|
$
|
17
|
|
|||
(1)
Includes the cumulative effect of the changes made to the Company's opening balance sheet at December 30, 2017, as a result of the adoption of ASU 2014-09,
Revenue from Contracts with Customers (Topic 606)
.
(2)
Balances exclude
$381 million
and
$234 million
determined to be billable at
December 28, 2018
, and December 30, 2017, respectively.
The decrease in unbilled receivables was primarily due to the timing of billings and revenue recognized on certain contracts. The decrease in deferred revenue was primarily due to revenue recognized during the period partially offset by the timing of advance payments from customers.
During fiscal
2018
, the Company recognized revenues of
$208 million
relating to amounts that were included as a contract liability at December 30, 2017
.
The Company did not recognize any impairment losses on contract assets during fiscal
2018
.
Note 6—Acquisitions
The Company may acquire businesses as part of its growth strategy to provide new or enhance existing capabilities and offerings to customers. During fiscal 2016, the Company completed the acquisition of Lockheed Martin's IS&GS Business.
Lockheed Martin Transaction
On January 26, 2016, Leidos announced it had entered into a definitive agreement (as amended, the "Merger Agreement") with Lockheed Martin Corporation ("Lockheed Martin"); Abacus Innovations Corporation, a Delaware corporation and a wholly owned subsidiary of Lockheed Martin ("Splitco"); and Lion Merger Co., a Delaware corporation and, at the time of announcement, a wholly owned subsidiary of Leidos ("Merger Sub"), pursuant to which Leidos would combine with Lockheed Martin's realigned Information Systems & Global Solutions business in a Reverse Morris Trust transaction. In connection with the Merger Agreement, Lockheed Martin and Splitco entered into a Separation Agreement dated January 26, 2016 (as amended, the "Separation Agreement"), pursuant to which Lockheed Martin would separate the IS&GS Business from Lockheed Martin and transfer the IS&GS Business to Splitco. The transactions contemplated by the Merger Agreement and the Separation Agreement are referred to herein as the "Transactions."
Leidos Holdings, Inc. Annual Report -
71
On August 16, 2016, the acquisition date, the Company completed the Transactions. In the Transactions, among other steps, (i) Lockheed Martin transferred the IS&GS Business to Splitco; (ii) Lockheed Martin offered to Lockheed Martin stockholders the right to exchange all or a portion of their shares of Lockheed Martin common stock for shares of Splitco common stock by way of an exchange offer (the "Distribution"); and (iii) Merger Sub merged with and into Splitco, with Splitco as the surviving corporation (the "Merger") and a wholly owned subsidiary of Leidos. Upon consummation of the Transactions, those Lockheed Martin stockholders who elected to participate in the exchange offer received approximately
77 million
shares of Leidos common stock, which represented approximately
50.5%
of the outstanding shares of Leidos common stock after consummation of the Transactions. Holders of Leidos shares prior to the transaction held the remaining
49.5%
of the outstanding shares of Leidos common stock immediately after the closing.
Prior to the Distribution, Splitco incurred third-party debt financing in an aggregate principal amount of
$1.8 billion
and immediately thereafter, Lockheed Martin transferred the IS&GS Business to Splitco and Splitco made a special cash payment to Lockheed Martin of
$1.8 billion
.
In connection with the Transactions, Leidos incurred new indebtedness and assumed Splitco's indebtedness in the form of term loans in an aggregate principal amount of
$690 million
and
$1.8 billion
, respectively, and entered into a new
$750 million
senior secured revolving credit facility, which replaced its existing revolving credit facility. See "
Note 15—Debt
" for further information regarding the debt incurred and the senior revolving credit facility.
In conjunction with the Transactions, Leidos' Board of Directors declared a special dividend of
$13.64
per share of Leidos common stock. Consequently, on August 22, 2016, the Company paid
$993 million
to stockholders of record as of August 15, 2016, and accrued
$29 million
of dividend equivalents with respect to outstanding equity awards. See "
Note 19—Stock-Based Compensation
" for further information regarding the modifications made to the Company's outstanding stock awards as a result of the special dividend.
As a result of the Transactions, membership on the Leidos Board of Directors was increased to
12
directors, in which
three
directors designated by Lockheed Martin were appointed to the board. A majority of the senior management of Leidos immediately prior to the consummation of the Transactions remained Leidos executive officers immediately after the Transactions. Leidos management determined that Leidos is the accounting acquirer in the Transactions based on the facts and circumstances noted within this section and other relevant factors.
The acquisition adds large, complex information technology ("IT") system implementation and operation experience and additional federal and international IT solutions and services work to the Leidos portfolio, providing more venues to sell value added services such as cybersecurity and analytics. As a result, the Company is more diversified in markets it serves and provides the Company the scale and access to markets intended to further growth.
The final purchase consideration for the acquisition of the IS&GS Business was as follows (in millions):
|
Value of common stock issued to Lockheed Martin stockholders
(1)
|
$
|
2,929
|
|
|
Equity consideration for replacement awards
(2)
|
9
|
|
|
|
Working capital adjustments
(3)
|
81
|
|
|
|
Purchase price
|
$
|
3,019
|
|
(1)
Represents approximately
77 million
new shares of Leidos common stock issued to those Lockheed Martin stockholders who elected to participate in the exchange offer, based on the Company's August 16, 2016, closing share price of
$51.69
, less the Leidos special cash dividend amount of
$13.64
, which the Lockheed Martin stockholders were not entitled to receive.
(2)
Represents a portion of the
$23 million
total fair value of replacement equity-based awards attributable to the pre-Merger service period. The remaining
$12 million
, net of estimated forfeitures, will be recognized as stock-based compensation expense over the remaining requisite service period (see "
Note 19—Stock-Based Compensation
").
(3)
In January 2018, the Company finalized its net working capital at
$105 million
. The additional
$24 million
was recorded as acquisition costs in the consolidated statements of income.
Leidos Holdings, Inc. Annual Report -
72
The final fair values of the assets acquired and liabilities assumed at the date of the Transactions were as follows (in millions):
|
Cash
|
$
|
25
|
|
|
Receivables, net
|
938
|
|
|
|
Other current assets
|
73
|
|
|
|
Property, plant and equipment
|
87
|
|
|
|
Intangible assets
|
1,194
|
|
|
|
Other assets
|
58
|
|
|
|
Accounts payable and accrued liabilities
|
(733
|
)
|
|
|
Accrued payroll and employee benefits
|
(186
|
)
|
|
|
Long-term debt, current portion
|
(23
|
)
|
|
|
Deferred tax liabilities
|
(328
|
)
|
|
|
Long-term debt, net of current portion
|
(1,780
|
)
|
|
|
Other long-term liabilities
|
(45
|
)
|
|
|
Total identifiable net liabilities assumed
|
(720
|
)
|
|
|
Non-controlling interest
|
(13
|
)
|
|
|
Goodwill
|
3,752
|
|
|
|
Purchase price
|
$
|
3,019
|
|
During fiscal 2017, the Company recorded adjustments to finalize the fair value of acquired assets and liabilities assumed which resulted in a
$337 million
increase in goodwill
.
Significant changes included intangible assets, property, plant and equipment, deferred tax assets, other assets, accounts payable and accrued liabilities and deferred tax liabilities. The Company recognized cumulative catch-up adjustments related to valuation adjustments for equity method investments and property, plant, and equipment, which resulted in an increase of
$7 million
in amortization expense and an increase of
$7 million
of depreciation expense, respectively. The Company recorded the cumulative catch-up adjustments to equity method investments within "
Equity earnings of non-consolidated subsidiaries
" and adjustments to depreciation within "Costs of revenues" and "Selling, general and administrative expenses" on the consolidated statement of income.
Additionally, during fiscal 2017, the Company recorded a valuation adjustment to reflect the fair value of the non-controlling interest acquired. The fair value of
$13 million
was determined by calculating the present value of future cash flows for the non-controlling interest. Significant assumptions inherent in the valuation of the non-controlling interest include the estimated after-tax cash flows expected to be received and an assessment of the appropriate discount rate.
The goodwill represents intellectual capital and the acquired assembled work force, none of which qualify for recognition as a separate intangible asset. The value of goodwill has been allocated to the reporting units on a relative fair value approach (see "
Note 10—Goodwill
"). Of the total goodwill,
$414 million
is tax deductible.
The Company identified
$1.2 billion
of intangible assets, representing program and contract intangibles, backlog and software and technology. The fair value measurements were primarily based on significant inputs that are not observable in the market and represent a Level 3 measurement (see "
Note 13—Fair Value Measurements
"). The income approach was primarily used to value the intangible assets, consisting primarily of acquired program and contract intangibles and backlog. The income approach indicates value for an asset based on the present value of cash flow projected to be generated by the asset. Projected cash flow is discounted at a rate of return that reflects the relative risk of achieving the cash flow and the time value of money.
Leidos Holdings, Inc. Annual Report -
73
The following table summarizes the fair value of intangible assets acquired at the date of acquisition and the related weighted average amortization period:
|
Weighted average amortization period
|
Fair value
|
|||||
|
(in years)
|
(in millions)
|
|||||
|
Program and contract intangibles
(1)
|
9.7
|
$
|
1,011
|
|
||
|
Backlog
|
1.8
|
157
|
|
|||
|
Software and technology
(1)
|
4.6
|
26
|
|
|||
|
Total
|
8.6
|
$
|
1,194
|
|
||
(1)
The weighted average amortization period is estimated based on the projected economic benefits associated with these assets.
The Company incurred the following expenses related to the acquisition and integration of the IS&GS Business:
|
Year Ended
|
||||||||||||
|
December 28,
2018 |
December 29,
2017 |
December 30,
2016 |
||||||||||
|
(in millions)
|
||||||||||||
|
Acquisition costs
|
$
|
—
|
|
$
|
25
|
|
$
|
44
|
|
|||
|
Integration costs
|
29
|
|
77
|
|
46
|
|
||||||
|
Total acquisition and integration costs
|
$
|
29
|
|
$
|
102
|
|
$
|
90
|
|
|||
These acquisition and integration costs have been recorded within Corporate and presented in "Acquisition, integration and restructuring costs" on the consolidated statements of income.
On January 10, 2018, the final amount of the net working capital of the IS&GS Business was determined through a binding arbitration proceeding in accordance with the Separation Agreement with Lockheed Martin. As a result,
$24 million
was recorded as acquisition costs in the consolidated statements of income for fiscal 2017. On January 18, 2018, the final working capital amount of
$105 million
was paid to Lockheed Martin, of which
$24 million
and
$81 million
was presented as cash flows from operating and investing activities, respectively, on the consolidated statement of cash flows.
During fiscal 2018, a tax indemnification liability of
$23 million
was paid to Lockheed Martin in accordance with the Tax Matters Agreement, which was presented as cash flows from financing activities on the consolidated statement of cash flows.
Pro Forma Financial Information (unaudited)
The following pro forma financial information presents consolidated results of operations as if the acquisition had occurred on January 31, 2015. The pro forma financial information was prepared based on historical financial information and has been adjusted to give effect to the events that are directly attributable to the Transactions and factually supportable. The pro forma results below do not reflect future events that have occurred or may occur after the Transactions, including anticipated synergies or other expected benefits that may be realized from the Transactions. The pro forma financial information is not intended to reflect the actual results of operations that would have occurred if the acquisition had been completed on January 31, 2015, nor is it intended to be an indication of future operating results.
Leidos Holdings, Inc. Annual Report -
74
|
Year Ended
|
||||
|
(unaudited)
|
December 30,
2016 |
|||
|
(in millions, except for per share amounts)
|
||||
|
Revenues
|
$
|
10,443
|
|
|
|
Net income
|
340
|
|
||
|
Net income attributable to Leidos common stockholders
|
335
|
|
||
|
Earnings per share:
|
||||
|
Basic
|
$
|
2.23
|
|
|
|
Diluted
|
2.20
|
|
||
The unaudited pro forma financial information above excludes acquisition-related costs of
$44 million
as a non-recurring significant adjustment. This adjustment was made to account for certain costs incurred as if the Transactions had been completed on January 31, 2015.
Note 7—Divestitures
Commercial Cybersecurity Business
On June 5, 2018, the Company entered into a Stock and Asset Purchase Agreement to sell the Company's commercial cybersecurity business, included within the Company's Civil segment, in order to focus on providing solutions, including cybersecurity, to the Company's core markets of governments and highly regulated industries. The sale is expected to be completed in early fiscal 2019 and is not expected to result in a loss. The Company has presented the associated assets and liabilities of the business as held for sale in the Company's consolidated balance sheet as of December 28, 2018. The major classes of assets and liabilities classified as held for sale were as follows:
|
December 28,
2018 |
||||
|
(in millions)
|
||||
|
Receivables, net
|
$
|
16
|
|
|
|
Other current assets
|
5
|
|
||
|
Property, plant and equipment, net
|
3
|
|
||
|
Intangible assets, net
|
5
|
|
||
|
Goodwill
|
57
|
|
||
|
Deferred tax assets
|
6
|
|
||
|
Total assets held for sale
|
$
|
92
|
|
|
|
Accounts payable and accrued liabilities
|
$
|
16
|
|
|
|
Accrued payroll and employee benefits
|
4
|
|
||
|
Other long-term liabilities
|
3
|
|
||
|
Total liabilities held for sale
|
$
|
23
|
|
|
Leidos Holdings, Inc. Annual Report -
75
The planned disposition does not represent a strategic shift in operations that will have a material effect on the Company's operations and financial results, and accordingly was not presented as discontinued operations.
Heavy Construction Business
In April 2016, the Company's Civil segment disposed of a business that was primarily focused on providing design, build and heavy construction engineering services. The Company received cash proceeds of
$23 million
, resulting in a pre-tax gain on sale of
$3 million
. The major classes of assets and liabilities sold included
$73 million
of accounts receivable, net;
$3 million
of non-current assets and
$63 million
of accounts payable and accrued liabilities. The Company recorded the pre-tax gain on sale in "
Other expense, net
" on the consolidated statements of income.
Plainfield Renewable Energy Holdings LLC
On July 24, 2015, the Company completed the sale of its equity interests in Plainfield Renewable Energy Holdings LLC ("Plainfield"), a biomass-fueled power plant in Plainfield, Connecticut (the "plant"), for an aggregate consideration of
$102 million
, subject to certain adjustments. The consideration received at closing consisted of a cash payment of
$29 million
(the "Closing Payment") and a secured promissory note for
$73 million
, net of discount (the "Note").
The original maturity date of the Note was July 24, 2017 (the "Original Maturity Date"), with an option to extend the maturity date for
three
consecutive one-year periods. The annual interest rate of
6%
would increase to
8%
if the maturity date was extended beyond July 24, 2017, and would increase to
9%
if extended beyond July 24, 2019. The first payment of accrued and unpaid interest was due January 24, 2016, with subsequent payments occurring every six months, including a portion of the principal balance. The Note allowed for a six-month deferral of certain payments due in January 2016 and July 2016. In January 2016 and July 2016, the Company was notified by the buyer that the interest payment due on January 24, 2016, would be deferred to the next payment date, and a portion of the principal payment due on July 24, 2016, would be deferred to the next payment due date.
During the quarter ended June 30, 2017, Plainfield exercised the first of
three
one
-year term extension options available under the original credit agreement, thereby extending the maturity date of the Note to July 24, 2018. Concurrent with this extension, the interest rate on the Note increased from
6%
to
8%
. Also, during the quarter ended June 30, 2017, Leidos and Plainfield entered into an amendment to the Note allowing Plainfield to defer up to
$4 million
of the interest and principal payments due in July 2017 and January 2018 until July 2018. In consideration of this deferment, Leidos received certain concessions and releases from obligations under the original transaction documents.
The Company collected
$6 million
of principal and interest each year during fiscal 2016 and fiscal 2017. Payments under the Note were secured by a general security interest in the personal property of Plainfield, a pledge of the membership interests of Plainfield and a first mortgage on the real property that comprised the plant.
In January 2018, the Company entered into negotiations with the equity owners of Plainfield LLC regarding the Plainfield Recapitalization Plan ("Plan"). The Plan envisioned raising new equity combined with reduction of Plainfield's debt. As a result, the Company recorded a
$33 million
impairment of its Note, which is presented in "
Other expense, net
" on the consolidated statements of income. The net realizable value of the Note at December 29, 2017, was estimated to be approximately
$40 million
, compared to its carrying value of
$73 million
, including accrued interest.
On July 12, 2018, Leidos and Plainfield entered into an additional amendment to the Note, allowing Plainfield to defer the maturity of the Note until the earlier of August 24, 2018, or the date Plainfield successfully closed on a refinancing agreement with a third party. Under the terms of the agreement, if Plainfield successfully refinanced the Note prior to August 24, 2018, Leidos would allow Plainfield to settle the Note in full for
$40 million
plus
50%
of additional net proceeds obtained by Plainfield. On August 23, 2018, Leidos and Plainfield entered into an agreement with respect to the final payoff of the Note. As a result, the Company received proceeds of
$40 million
in full satisfaction of Plainfield's obligations under the Note.
Leidos Holdings, Inc. Annual Report -
76
Note 8—Restructuring Expenses
After the acquisition of the IS&GS Business, the Company began an initiative to reduce its cost structure, which includes optimization of its real estate portfolio by vacating certain facilities and consolidating others, and by reducing headcount.
The restructuring expenses related to this program were as follows:
|
Year Ended
|
||||||||||||
|
|
December 28,
2018 |
December 29,
2017 |
December 30,
2016 |
|||||||||
|
|
(in millions)
|
|||||||||||
|
Severance costs
|
$
|
2
|
|
$
|
18
|
|
$
|
10
|
|
|||
|
Lease termination expenses
|
6
|
|
19
|
|
2
|
|
||||||
|
Restructuring expenses related to the IS&GS Business
|
$
|
8
|
|
$
|
37
|
|
$
|
12
|
|
|||
As of December 28, 2018, the Company has recognized a total of
$57 million
of expense in connection with restructuring activities. These restructuring expenses have been recorded within Corporate and presented in "Acquisition, integration and restructuring costs" on the consolidated statements of income.
The related restructuring liability related to this program was as follows:
|
Severance Costs
|
Lease Termination Expenses
|
Total
|
||||||||||
|
(in millions)
|
||||||||||||
|
Balance at December 30, 2016
|
$
|
7
|
|
$
|
1
|
|
$
|
8
|
|
|||
|
Charges
|
18
|
|
19
|
|
37
|
|
||||||
|
Cash payments
|
(20
|
)
|
(16
|
)
|
(36
|
)
|
||||||
|
Balance at December 29, 2017
|
5
|
|
4
|
|
9
|
|
||||||
|
Charges
|
2
|
|
6
|
|
8
|
|
||||||
|
Cash payments
|
(7
|
)
|
(8
|
)
|
(15
|
)
|
||||||
|
Balance at December 28, 2018
|
$
|
—
|
|
$
|
2
|
|
$
|
2
|
|
|||
Note 9—Receivables
The components of receivables, net consisted of the following:
|
|
December 28,
2018 |
December 29,
2017 |
||||||
|
|
(in millions)
|
|||||||
|
Billed receivables
(1)
|
$
|
1,067
|
|
$
|
771
|
|
||
|
Unbilled receivables
|
818
|
|
1,074
|
|
||||
|
Allowance for doubtful accounts
|
(8
|
)
|
(14
|
)
|
||||
|
$
|
1,877
|
|
$
|
1,831
|
|
|||
(1)
As a result of the adoption of ASC 606,
$381 million
of billable receivables were classified as billed receivables for fiscal 2018.
$234 million
of billable receivables were classified as unbilled receivables for fiscal 2017.
Note 10—Goodwill
During fiscal 2017, the Company completed its business reorganization, which resulted in identification of
three
reportable segments (Defense Solutions, Civil and Health). Additionally, the Company separately presents the costs associated with corporate functions as Corporate. The Company commenced operating and reporting under the new organizational structure effective the beginning of fiscal 2017 (see "
Note 24—Business Segments
"). Goodwill, including the amounts from the acquisition of the IS&GS Business, was allocated to the reporting units on a relative fair value approach.
Leidos Holdings, Inc. Annual Report -
77
The following table presents changes in the carrying amount of goodwill by reportable segment:
|
Defense Solutions
|
Civil
|
Health
|
Total
|
|||||||||||||
|
|
(in millions)
|
|||||||||||||||
|
Goodwill at December 30, 2016
(1)
|
$
|
1,954
|
|
$
|
1,731
|
|
$
|
937
|
|
$
|
4,622
|
|
||||
|
Adjustment to original purchase price allocation
|
94
|
|
259
|
|
(16
|
)
|
337
|
|
||||||||
|
Foreign currency translation adjustments
|
7
|
|
8
|
|
—
|
|
15
|
|
||||||||
|
Goodwill at December 29, 2017
(1)
|
2,055
|
|
1,998
|
|
921
|
|
4,974
|
|
||||||||
|
Foreign currency translation adjustments
|
(40
|
)
|
(11
|
)
|
—
|
|
(51
|
)
|
||||||||
|
Transfers to assets held for sale
|
—
|
|
(57
|
)
|
—
|
|
(57
|
)
|
||||||||
|
Adjustment to goodwill
|
—
|
|
(6
|
)
|
—
|
|
(6
|
)
|
||||||||
|
Goodwill at December 28, 2018
(1)
|
$
|
2,015
|
|
$
|
1,924
|
|
$
|
921
|
|
$
|
4,860
|
|
||||
(1)
Carrying amount includes accumulated impairment losses of
$369 million
and
$117 million
within the Health and Civil segments, respectively.
See "
Note 6—Acquisitions
" for the description of adjustments to the original purchase price allocation.
In conjunction with the fiscal 2017 change in reportable segments, the Company evaluated goodwill for impairment, both before and after the segment change and determined that goodwill was not impaired.
Based on a qualitative analysis performed during the Company's annual impairment evaluation for fiscal 2018 and fiscal 2016 for certain of its reporting units, it was determined that it is more likely than not that the fair values of the reporting units were in excess of the individual reporting unit carrying values, and as a result, a quantitative step one analysis was not necessary. Additionally, based on the results of the quantitative step one analysis for certain other of its reporting units, it was determined that the fair value was in excess of the individual reporting units carrying values. In fiscal 2017, the company performed a quantitative analysis for all reporting units. It was determined that the fair values of all reporting units exceeded their carrying values. As a result, no goodwill impairments were identified as part of the annual goodwill impairment evaluation for the periods mentioned above.
During the year ended December 28, 2018, the Company recorded an immaterial correction of
$6 million
with respect to fair value of liabilities acquired from the Transactions (see "
Note 6—Acquisitions
").
Note 11—Intangible Assets
Intangible assets consisted of the following:
|
|
December 28, 2018
|
December 29, 2017
|
||||||||||||||||||||||
|
|
Gross
carrying value |
Accumulated
amortization |
Net
carrying value |
Gross
carrying value |
Accumulated
amortization |
Net
carrying value |
||||||||||||||||||
|
|
(in millions)
|
|||||||||||||||||||||||
|
Finite-lived intangible assets:
|
|
|
|
|||||||||||||||||||||
|
Program and contract intangibles
|
$
|
1,003
|
|
$
|
(374
|
)
|
$
|
629
|
|
$
|
1,013
|
|
$
|
(187
|
)
|
$
|
826
|
|
||||||
|
Software and technology
|
93
|
|
(74
|
)
|
19
|
|
89
|
|
(64
|
)
|
25
|
|
||||||||||||
|
Customer relationships
|
4
|
|
(4
|
)
|
—
|
|
4
|
|
(3
|
)
|
1
|
|
||||||||||||
|
Backlog
|
—
|
|
—
|
|
—
|
|
158
|
|
(158
|
)
|
—
|
|
||||||||||||
|
Total finite-lived intangible assets
|
1,100
|
|
(452
|
)
|
648
|
|
1,264
|
|
(412
|
)
|
852
|
|
||||||||||||
|
Indefinite-lived intangible assets:
|
|
|
|
|
|
|
||||||||||||||||||
|
Trade names
|
4
|
|
—
|
|
4
|
|
4
|
|
—
|
|
4
|
|
||||||||||||
|
Total intangible assets
|
$
|
1,104
|
|
$
|
(452
|
)
|
$
|
652
|
|
$
|
1,268
|
|
$
|
(412
|
)
|
$
|
856
|
|
||||||
Amortization expense related to intangible assets, including those acquired through the Transactions, was
$201 million
,
$281 million
and
$84 million
for fiscal
2018
,
2017
and
2016
, respectively.
Leidos Holdings, Inc. Annual Report -
78
Program and contract intangible assets are amortized over their respective estimated useful lives in proportion to the pattern of economic benefit based on expected future discounted cash flows. Customer relationships and backlog intangible assets are amortized on a straight-line basis over their estimated useful lives. Software and technology intangible assets are amortized either on a straight-line basis over their estimated useful lives or over their respective estimated useful lives in proportion to the pattern of economic benefit based on expected future discounted cash flows, as deemed appropriate.
The estimated annual amortization expense related to finite-lived intangible assets as of
December 28, 2018
, is as follows:
|
Fiscal Year Ending
|
|
|||
|
|
(in millions)
|
|||
|
2019
|
$
|
171
|
|
|
|
2020
|
126
|
|
||
|
2021
|
106
|
|
||
|
2022
|
92
|
|
||
|
2023
|
73
|
|
||
|
2024 and thereafter
|
80
|
|
||
|
|
$
|
648
|
|
|
Actual amortization expense in future periods could differ from these estimates as a result of future acquisitions, divestitures, impairments, the outcome and timing of completion of in-process research and development projects and other factors.
Note 12—Property, Plant and Equipment
Property, plant and equipment, net consisted of the following:
|
|
December 28,
2018 |
December 29,
2017 |
||||||
|
|
(in millions)
|
|||||||
|
Computers and other equipment
|
$
|
233
|
|
$
|
194
|
|
||
|
Leasehold improvements
|
206
|
|
171
|
|
||||
|
Buildings and improvements
|
56
|
|
54
|
|
||||
|
Land
|
40
|
|
49
|
|
||||
|
Office furniture and fixtures
|
36
|
|
34
|
|
||||
|
Construction in progress
|
15
|
|
44
|
|
||||
|
|
586
|
|
546
|
|
||||
|
Less: accumulated depreciation and amortization
|
(349
|
)
|
(314
|
)
|
||||
|
|
$
|
237
|
|
$
|
232
|
|
||
Depreciation expense was
$56 million
,
$55 million
and
$38 million
for fiscal
2018
,
2017
and
2016
, respectively.
During the quarter ended March 30, 2018, the Company determined that the carrying amount of a real estate property may not be recoverable and as a result recorded an impairment charge of
$7 million
, which was recorded within Corporate. On July 23, 2018, the Company entered into a Contract of Sale to sell and lease back the property. The term of the lease is expected to end during fiscal 2020. See "
Note 27—Subsequent Events
" regarding the completion of the sale.
Leidos Holdings, Inc. Annual Report -
79
Note 13—Fair Value Measurements
The Company's financial instruments measured on a recurring basis at fair value consisted of the following:
|
December 28, 2018
|
December 29, 2017
|
|||||||||||||||
|
Carrying value
|
Fair value
|
Carrying value
|
Fair value
|
|||||||||||||
|
(in millions)
|
||||||||||||||||
|
Financial assets:
|
||||||||||||||||
|
Derivatives
|
$
|
—
|
|
$
|
—
|
|
$
|
37
|
|
$
|
37
|
|
||||
|
Financial liabilities:
|
||||||||||||||||
|
Derivatives
|
35
|
|
35
|
|
—
|
|
—
|
|
||||||||
The Company's derivatives consisted of the fair value interest rate swaps on its
$450 million
fixed rate
4.45%
senior secured notes maturing in December 2020, and cash flow interest rate swaps on
$1.5 billion
of the Company's variable rate senior secured term loans (see "
Note 14—Derivative Instruments
"). The fair value of the fair value interest rate swaps and cash flow interest rate swaps is determined based on observed values for underlying interest rates on the LIBOR yield curve and the underlying interest rate, respectively (Level 2 inputs).
The Company's financial instruments measured on a recurring basis at fair value also includes its defined benefit plan assets (Level 2 inputs). See "
Note 21—Retirement Plans
" for further details on these investments.
The carrying amounts of the Company's financial instruments, other than derivatives, which include cash equivalents, accounts receivable, other short-term receivable, accounts payable and accrued expenses, are reasonable estimates of their related fair values. The carrying value of the Company's notes receivable (see "
Note 7—Divestitures
" and "
Note 22—Leases
") of
$24 million
and
$63 million
as of
December 28, 2018
, and
December 29, 2017
, respectively, approximates fair value as the stated interest rates within the agreements are consistent with the current market rates used in notes with similar terms in the market (Level 2 inputs).
As of
December 28, 2018
, and
December 29, 2017
, the fair value of debt was
$3.1 billion
and
$3.2 billion
, respectively, and the carrying amount was
$3.1 billion
for both periods (see "
Note 15—Debt
"). The fair value of long-term debt is determined based on current interest rates available for debt with terms and maturities similar to the Company's existing debt arrangements (Level 2
inputs).
During fiscal
2018
and
2017
, the Company did not have any assets or liabilities measured at fair value on a non-recurring basis, other than a real estate property measured at fair value (Level 2) on March 30, 2018, which resulted in an impairment charge of
$7 million
(see "
Note 12—Property, Plant and Equipment
").
Note 14—Derivative Instruments
The fair value of the Company's interest rate swaps was as follows:
|
Asset derivatives
|
||||||||||
|
Balance sheet line item
|
December 28,
2018 |
December 29,
2017 |
||||||||
|
(in millions)
|
||||||||||
|
Cash flow interest rate swaps
|
Other assets
|
$
|
—
|
|
$
|
37
|
|
|||
|
Liability derivatives
|
||||||||||
|
Balance sheet line item
|
December 28,
2018 |
December 29,
2017 |
||||||||
|
(in millions)
|
||||||||||
|
Fair value interest rate swaps
|
Other long-term liabilities
|
$
|
3
|
|
$
|
—
|
|
|||
|
Cash flow interest rate swaps
|
Other long-term liabilities
|
32
|
|
—
|
|
|||||
|
$
|
35
|
|
$
|
—
|
|
|||||
The fair value adjustment to the fair value interest rate swap and the underlying debt was a decrease of
$3 million
for both the year ended
December 28, 2018
, and
December 29, 2017
.
Leidos Holdings, Inc. Annual Report -
80
The cash flows associated with the interest rate swaps are classified as operating activities in the consolidated statements of cash flows.
Fair Value Hedges
The Company has interest rate swap agreements to hedge the fair value of the
$450 million
fixed rate
4.45%
senior secured notes maturing in December 2020 (the "Notes"). The objective of these instruments is to hedge the Notes against changes in fair value due to the variability in the six-month LIBOR rate (the benchmark interest rate). Under the terms of the interest rate swap agreements, the Company will receive semi-annual interest payments at the coupon rate of
4.45%
and will pay variable interest based on the six-month LIBOR rate.
The interest rate swaps were accounted for as a fair value hedge of the Notes and qualified for the shortcut method of hedge accounting, which allows for the assumption of no ineffectiveness. The resulting changes in the fair value of the interest rate swaps are fully offset by the changes in the fair value of the underlying debt (the hedged item) (see "
Note 15—Debt
").
The fair value of the Notes is stated at an amount that reflects changes in the six-month LIBOR rate subsequent to the inception of the interest rate swaps through the reporting date.
The following amounts were recorded on the consolidated balance sheets related to cumulative basis adjustments for fair value hedges:
|
Carrying amount of hedged item
|
Cumulative amount of fair value adjustment included within the hedged item
|
|||||||||||||||
|
Balance sheet line item of hedged item
|
December 28,
2018 |
December 29,
2017 |
December 28,
2018 |
December 29,
2017 |
||||||||||||
|
(in millions)
|
||||||||||||||||
|
Long-term debt, net of current portion
|
$
|
447
|
|
$
|
449
|
|
$
|
(3
|
)
|
$
|
—
|
|
||||
Cash Flow Hedges
The Company has interest rate swap agreements to hedge the cash flows of a portion of its variable rate senior secured term loans (the "Variable Rate Loans"). The objective of these instruments is to reduce variability in the forecasted interest payments of the Company's Variable Rate Loans, which is based on the LIBOR rate. Under the terms of the interest rate swap agreements, the Company will receive monthly variable interest payments based on the one-month LIBOR rate and will pay interest at a fixed rate. In August 2016, September 2017 and February 2018, the Company entered into interest rate swap agreements to hedge the cash flows of
$1.1 billion
,
$300 million
and
$250 million
of its Variable Rate Loans, respectively. The interest rate swap agreements on
$1.1 billion
of the Company's Variable Rate Loans had a maturity date of December 2021 and a fixed interest rate of
1.08%
. The interest rate swap agreements on
$300 million
and
$250 million
of the Company's Variable Rate Loans both had a maturity date of August 2022 and fixed interest rates of
1.66%
and
2.59%
, respectively. The counterparties to these agreements are financial institutions.
In September 2018, the Company terminated its existing interest rate swaps. The net derivative gain of
$60 million
related to the discontinued cash flow hedge will continue to be reported within accumulated other comprehensive (loss) income and will be reclassified into earnings over the remaining life of the original hedge as the hedged variable rate debt impacts earnings.
Additionally, in September 2018, the Company entered into new interest rate swap agreements to hedge the cash flows of
$1.5 billion
of the Company's Variable Rate Loans. These interest rate swap agreements have a maturity date of August 2025 and a fixed interest rate of
3.00%
.
The interest rate swap transactions were accounted for as cash flow hedges. The gain/loss on the swap is reported as a component of other comprehensive income/loss and is reclassified into earnings when the interest payments on the underlying hedged items impact earnings. A qualitative assessment of hedge effectiveness is performed on a quarterly basis, unless facts and circumstances indicate the hedge may no longer be highly effective.
Leidos Holdings, Inc. Annual Report -
81
The effect of the Company's cash flow hedges on other comprehensive (loss) income and earnings for the periods presented was as follows:
|
Year Ended
|
||||||||||||
|
December 28,
2018 |
December 29,
2017 |
December 30,
2016 |
||||||||||
|
(in millions)
|
||||||||||||
|
Total interest expense, net presented in the consolidated statements of income in which the effects of cash flow hedges are recorded
|
$
|
138
|
|
$
|
140
|
|
$
|
86
|
|
|||
|
Amount recognized in other comprehensive (loss) income
|
(7
|
)
|
10
|
|
22
|
|
||||||
|
Amount reclassified from accumulated other comprehensive (loss) income to interest expense, net
|
(6
|
)
|
—
|
|
2
|
|
||||||
The Company expects to reclassify gains of
$12 million
from accumulated other comprehensive (loss) income into earnings during the next 12 months.
Note 15—Debt
The Company's debt consisted of the following:
|
|
Stated
interest rate |
Effective
interest rate |
December 28, 2018
(1)
|
December 29, 2017
(1)
|
||||||||||
|
|
(in millions)
|
|||||||||||||
|
Senior secured notes:
|
|
|
|
|
|
|||||||||
|
$450 million notes, due December 2020
|
|
4.45
|
%
|
4.53
|
%
|
$
|
447
|
|
|
$
|
449
|
|
||
|
$300 million notes, due December 2040
|
|
5.95
|
%
|
6.03
|
%
|
216
|
|
|
216
|
|
||||
|
Senior secured term loans:
|
|
|||||||||||||
|
$690 million Term Loan A, due August 2023
|
|
3.88
|
%
|
4.31
|
%
|
617
|
|
644
|
|
|||||
|
$310 million Term Loan A, due August 2023
|
|
3.88
|
%
|
4.33
|
%
|
258
|
|
270
|
|
|||||
|
$1,131 million Term Loan B, due August 2025
|
|
4.13
|
%
|
4.48
|
%
|
1,085
|
|
1,101
|
|
|||||
|
Senior unsecured notes:
|
|
|
|
|
|
|||||||||
|
$250 million notes, due July 2032
|
|
7.13
|
%
|
7.43
|
%
|
246
|
|
246
|
|
|||||
|
$300 million notes, due July 2033
|
|
5.50
|
%
|
5.88
|
%
|
158
|
|
158
|
|
|||||
|
Notes payable and capital leases due on various dates through fiscal 2022
|
0%-5.55%
|
|
Various
|
|
97
|
|
|
27
|
|
|||||
|
Total long-term debt
|
|
|
3,124
|
|
|
3,111
|
|
|||||||
|
Less: current portion
|
|
|
72
|
|
|
55
|
|
|||||||
|
Total long-term debt, net of current portion
|
|
|
$
|
3,052
|
|
|
$
|
3,056
|
|
|||||
|
(1)
|
The carrying amounts of the senior secured term loans and notes and unsecured notes as of
December 28, 2018
, and
December 29, 2017
, include the remaining principal outstanding of
$3,073 million
and
$3,129 million
, respectively, less total unamortized debt discounts and deferred debt issuance costs of
$43 million
and
$45 million
, respectively, less
$3 million
related to the fair value of the interest rate swaps (see "
Note 14—Derivative Instruments
") as of
December 28, 2018
.
|
On August 16, 2016, in connection with the acquisition of the IS&GS Business, Leidos, Inc. secured a new term loan of
$690 million
. In addition, as a result of the acquisition, Leidos assumed the IS&GS Business' term loans of
$1.8 billion
, which were obtained by the IS&GS Business immediately prior to the Transactions (see "
Note 6—Acquisitions
"). The outstanding obligations under the term loans are secured by a first priority lien on substantially all of the assets of the Company, subject to certain exceptions set forth in the credit agreements and related documentation.
In February 2017, Leidos amended the terms of its senior secured
$1.1 billion
Term Loan B. As a result, the margin on Term Loan B was reduced by
50
basis points to
2.25%
and the six month call provision was extended an additional six months. The repricing of the term loan became effective on February 16, 2017.
Leidos Holdings, Inc. Annual Report -
82
In August 2017, Leidos amended its senior secured term loans and revolving credit facility agreements. These amendments reduced the applicable margins for the revolving credit facility and Term Loans A and B each by
25
basis points. Additionally, the maturity date for the revolving credit facility,
$690 million
Term Loan A and
$310 million
Term Loan A were each extended by
one
year to August 2022, and the scheduled increase in quarterly principal payments for both of these term loans was delayed
one
year to March 2020. The amendments also include a collateral suspension provision that will permit the secured credit agreements to become unsecured under certain circumstances.
In March 2018, Leidos amended the terms of its senior secured
$1.1 billion
Term Loan B. As a result, the margin on Term Loan B was reduced by
25
basis points to
1.75%
. The repricing of the term loan became effective March 15, 2018.
In August 2018, Leidos amended its senior secured term loans and revolving credit facility agreements. These amendments modified the margin range for the revolving credit facility and Term Loan A loans and extended their maturity dates by
one year
to August 2023. The amendments also extended the maturity date of Term Loan B by
two years
to August 2025 and delayed the scheduled increase in quarterly principal payments for Term Loan A by
one year
to March 2021. Additionally, the senior secured leverage ratio calculation was amended and now excludes the lesser of
$350 million
and the Company's unrestricted cash and cash equivalents.
In November 2018, Leidos amended the terms of its senior secured
$310 million
Term Loan A and
$1.1 billion
Term Loan B. As a result, this transaction assigned the remaining Leidos Innovations Corporation term loan debts to Leidos, Inc. No other terms of the original or amended Term Loan A or Term Loan B loan agreements were changed.
The interest rate on the Company's senior secured term loans is determined based on the LIBOR rate plus a margin. The margin for the Term Loan A loans ranges from
1.25%
to
2.00%
, depending on the Company's senior secured leverage ratio, and is computed on a quarterly basis. At
December 28, 2018
, the current margin on Term Loan A was
1.50%
and the margin on Term Loan B was
1.75%
.
As part of the credit agreements, the Company is required to perform a calculation each quarter that determines the incremental available amount of funds the Company is permitted to use towards investments relating to mergers and acquisitions, investments in joint ventures, repayment of outstanding debt and restricted payments relating to dividends and share repurchases. The incremental available amount is calculated as
$35 million
plus a portion of certain cash proceeds, multiplied by a percentage tied to the Company's senior secured leverage ratio, which is added to an annual fixed amount of
$250 million
, as defined in the credit agreements. The constraints associated with use of cash are reduced and/or eliminated based on the Company's total leverage ratio.
The Company is also required to perform an excess cash flow calculation annually that determines the additional amount of debt prepayments the Company is required to make during the first quarter of the following fiscal year, with the first payment due in fiscal 2018. The excess cash flow is calculated based on the Company's consolidated net income as of the end of the fiscal year plus or minus adjustments for certain non-cash items and incurred and expected cash payments, as defined in the credit agreements. The amount of the excess cash flow that the Company is required to use to prepay the loans is based upon the Company's senior secured net leverage ratio. The required debt prepayment amount is equal to
50%
of the excess cash flow calculated.
No
additional debt prepayment is required if the senior secured net leverage ratio is equal to or less than
2.00
.
During fiscal
2018
and
2017
, the Company made
$59 million
and
$209 million
of principal payments, respectively, on its long-term debt, which was primarily related to its senior secured term loans. This activity included
$46 million
and
$76 million
of required quarterly payments on its term loans during fiscal
2018
and fiscal
2017
, respectively. In April 2018, the Company made a required debt prepayment of
$10 million
on its senior secured term loans. The prepayment was a result of the annual excess cash flow calculation for fiscal 2017. In addition to the required quarterly payments, the Company prepaid
$130 million
and
$275 million
of its term loans during fiscal 2017 and fiscal 2016, respectively. Associated with these early repayments,
$2 million
and
$5 million
of unamortized debt discount and deferred financing costs were written off during fiscal 2017 and fiscal 2016, respectively, and recorded to "
Other expense, net
" in the Company's consolidated statements of income.
Leidos Holdings, Inc. Annual Report -
83
Principal payments are made quarterly on the Company's variable rate senior secured term loans, with the majority of the principal due at maturity. Interest on the variable rate senior secured term loans is payable on a periodic basis, which must be at least quarterly. Interest on the senior fixed rate secured notes and unsecured notes is payable on a semi-annual basis with principal payments due at maturity.
In connection with the senior secured term loans, the Company recognized
$53 million
of debt discount and debt issuance costs in fiscal 2016, which were recorded as an offset against the carrying value of debt and will be amortized to interest expense over the term of the term loans. The Company also recognized
$15 million
of origination costs related to the new credit facility (see "Revolving Credit Facility" below), which were capitalized within "Other assets" in the consolidated balance sheets. In connection with the fiscal
2018
and fiscal
2017
amendments, the Company incurred
$8 million
and
$4 million
of debt issuance costs, respectively, related to the senior secured term loans and revolving credit facility, which were recorded using the same methodology as the original debt issuance costs discussed above. Amortization for the senior secured term loans and notes, unsecured notes and revolving credit facility was
$10 million
,
$13 million
and
$6 million
for fiscal
2018
,
2017
and
2016
, respectively.
The senior secured term loans and notes, unsecured notes and revolving credit facility are fully and unconditionally guaranteed by intercompany guarantees. The senior secured term loans and notes and unsecured notes contain certain customary restrictive covenants, including among other things, restrictions on the Company's ability to create liens and enter into sale and leaseback transactions under certain circumstances. The Company was in compliance with all covenants as of
December 28, 2018
.
Future minimum payments of debt are as follows:
|
Fiscal Year Ending
|
||||
|
|
(in millions)
|
|||
|
2019
|
$
|
79
|
|
|
|
2020
|
509
|
|
||
|
2021
|
181
|
|
||
|
2022
|
102
|
|
||
|
2023
|
619
|
|
||
|
2024 and thereafter
|
1,677
|
|
||
|
Total principal payments
|
3,167
|
|
||
|
Less: unamortized debt discount and issuance costs
|
(43
|
)
|
||
|
Total long-term debt
|
$
|
3,124
|
|
|
Revolving Credit Facility
Leidos, Inc. has a revolving credit facility providing up to
$750 million
in secured borrowing capacity at interest rates determined based upon the LIBOR rate plus a margin that is subject to step-down provisions based on the Company's senior secured leverage ratio. The maturity date of the credit facility is
August 2023
. During fiscal
2018
and
2017
, there were
no
borrowings under the credit facility.
The credit agreements contain certain customary representations and warranties, as well as certain affirmative and negative covenants. The financial covenants define the debt-to-EBITDA ratio that the Company needs to maintain at the end of each quarter. The Company maintains a ratio of total senior secured debt, including borrowings under this credit facility, minus the lesser of
$350 million
and the Company's unrestricted cash and cash equivalents, to the trailing
four
quarters of EBITDA (adjusted for certain items as defined in the credit facility) of not more than
4.75
prior to February 16, 2018,
4.25
from February 16, 2018, to February 16, 2019, and
3.75
thereafter. The Company was in compliance with these financial covenants as of
December 28, 2018
.
Leidos Holdings, Inc. Annual Report -
84
Other covenants in the credit facility restrict certain of the Company's activities, including, among other things, its ability to create liens, dispose of certain assets and merge or consolidate with other entities. The credit facility also contains certain customary events of default, including, among others, defaults based on certain bankruptcy and insolvency events, nonpayment, cross-defaults to other debt, breach of specified covenants, Employee Retirement Income Security Act events, material monetary judgments, change of control events and the material inaccuracy of the Company’s representations and warranties.
Notes Payable
During fiscal 2018, the Company recognized a
$79 million
note payable related to the sale and leaseback arrangement of its San Diego, California properties (see "
Note 22—Leases
" for further information).
During fiscal 2017, the Company recognized
$21 million
of notes payable related to secured borrowings associated with certain contracts within its commercial energy business.
Note 16—Accumulated Other Comprehensive (Loss) Income
Changes in the components of accumulated other comprehensive (loss) income were as follows:
|
Foreign currency translation adjustments
|
Unrecognized (loss) gain on derivative instruments
|
Pension adjustments
|
Total accumulated other comprehensive (loss) income
|
|||||||||||||
|
(in millions)
|
||||||||||||||||
|
Balance at January 1, 2016
|
$
|
—
|
|
$
|
(4
|
)
|
$
|
(4
|
)
|
$
|
(8
|
)
|
||||
|
Other comprehensive (loss) income
|
(8
|
)
|
26
|
|
1
|
|
19
|
|
||||||||
|
Taxes
|
1
|
|
(10
|
)
|
2
|
|
(7
|
)
|
||||||||
|
Reclassification from accumulated other comprehensive (loss) income
|
—
|
|
(2
|
)
|
(6
|
)
|
(8
|
)
|
||||||||
|
Balance at December 30, 2016
|
(7
|
)
|
10
|
|
(7
|
)
|
(4
|
)
|
||||||||
|
Other comprehensive income
|
36
|
|
10
|
|
9
|
|
55
|
|
||||||||
|
Taxes
|
(12
|
)
|
(6
|
)
|
—
|
|
(18
|
)
|
||||||||
|
Balance at December 29, 2017
|
17
|
|
14
|
|
2
|
|
33
|
|
||||||||
|
Cumulative adjustments related to ASU adoptions (Note 2)
|
3
|
|
10
|
|
(4
|
)
|
9
|
|
||||||||
|
Balance at December 30, 2017
|
20
|
|
24
|
|
(2
|
)
|
42
|
|
||||||||
|
Other comprehensive loss
|
(65
|
)
|
(7
|
)
|
(1
|
)
|
(73
|
)
|
||||||||
|
Taxes
|
4
|
|
3
|
|
—
|
|
7
|
|
||||||||
|
Reclassification from accumulated other comprehensive (loss) income
|
—
|
|
(6
|
)
|
—
|
|
(6
|
)
|
||||||||
|
Balance at December 28, 2018
|
$
|
(41
|
)
|
$
|
14
|
|
$
|
(3
|
)
|
$
|
(30
|
)
|
||||
The change in the foreign currency translation adjustments is due to the impact of the foreign exchange rate movement between the U.S. dollar and British pound and Australian dollar.
Reclassifications for unrecognized (loss) gain on derivative instruments are associated with outstanding debt and are recorded in "Interest expense, net" on the consolidated statements of income. The loss during fiscal 2018 is due to a change in Company's interest rate swap agreements that hedge the Company's Variable Rate Loans. See "
Note 14—Derivative Instruments
" for more information on the Company's interest rate swap agreements.
Reclassifications for pension adjustments are recorded in "Selling, general and administrative expenses" on the consolidated statements of income.
Leidos Holdings, Inc. Annual Report -
85
Note 17—Composition of Certain Financial Statement Captions
|
Balance Sheet
|
December 28,
2018 |
December 29,
2017 |
||||||
|
|
(in millions)
|
|||||||
|
Other current assets:
|
|
|
||||||
|
Transition costs and project assets
(1)(2)
|
$
|
145
|
|
$
|
87
|
|
||
|
Pre-contract costs
|
41
|
|
64
|
|
||||
|
Other
(4)
|
357
|
|
302
|
|
||||
|
|
$
|
543
|
|
$
|
453
|
|
||
|
Other assets:
|
||||||||
|
Equity method investments
(3)
|
$
|
26
|
|
$
|
37
|
|
||
|
Other
(4)
|
156
|
|
217
|
|
||||
|
$
|
182
|
|
$
|
254
|
|
|||
|
Accounts payable and accrued liabilities:
|
|
|
||||||
|
Accrued liabilities
|
$
|
650
|
|
$
|
747
|
|
||
|
Accounts payable
|
547
|
|
557
|
|
||||
|
Deferred revenue
|
276
|
|
293
|
|
||||
|
Other
|
3
|
|
42
|
|
||||
|
|
$
|
1,476
|
|
$
|
1,639
|
|
||
|
Accrued payroll and employee benefits:
|
|
|
||||||
|
Salaries, bonuses and amounts withheld from employees’ compensation
|
$
|
248
|
|
$
|
245
|
|
||
|
Accrued vacation
|
225
|
|
236
|
|
||||
|
Other
|
—
|
|
6
|
|
||||
|
|
$
|
473
|
|
$
|
487
|
|
||
(1)
During the year ended December 28, 2018, the Company recognized
$146 million
of amortization related to its transition costs and project assets. The total balance of transition costs and project assets on the Company's consolidated balance sheets at December 28, 2018 and December 29, 2017, was
$167 million
and
$100 million
, respectively.
(2)
As of December 29, 2017, the Company reclassified
$28 million
of "Prepaid expenses" to "Transition costs and project assets" for comparability purposes.
(3)
Balances are net of
$29 million
and
$30 million
of dividends received during fiscal
2018
and fiscal
2017
, respectively, that were recorded in cash flows provided by operating activities of continuing operations on the consolidated statements of cash flows.
(4)
Balance represents items that are not individually significant to disclose separately.
|
|
Year Ended
|
|||||||||||
|
Income Statement
|
December 28,
2018 |
December 29,
2017 |
December 30,
2016 |
|||||||||
|
|
(in millions)
|
|||||||||||
|
Interest expense, net:
|
||||||||||||
|
Interest expense
|
$
|
(145
|
)
|
$
|
(148
|
)
|
$
|
(96
|
)
|
|||
|
Interest income
|
7
|
|
8
|
|
10
|
|
||||||
|
$
|
(138
|
)
|
$
|
(140
|
)
|
$
|
(86
|
)
|
||||
|
Other expense, net
|
||||||||||||
|
Promissory note impairment
|
$
|
—
|
|
$
|
(33
|
)
|
$
|
—
|
|
|||
|
Gain (loss) on foreign currencies
|
2
|
|
5
|
|
(18
|
)
|
||||||
|
Other (expense) income, net
|
(3
|
)
|
2
|
|
5
|
|
||||||
|
$
|
(1
|
)
|
$
|
(26
|
)
|
$
|
(13
|
)
|
||||
Leidos Holdings, Inc. Annual Report -
86
Note 18—Earnings Per Share
("EPS")
Basic EPS is computed by dividing net income attributable to Leidos common stockholders by the basic weighted average number of shares outstanding. Diluted EPS is calculated to give effect to all potentially dilutive common shares that were outstanding during the reporting period. The dilutive effect of outstanding equity-based compensation awards is reflected in diluted EPS by application of the treasury stock method, only in periods in which such effect would have been dilutive for the period.
The Company issues unvested stock awards that have forfeitable rights to dividends or dividend equivalents. These stock awards are dilutive common share equivalents subject to the treasury stock method.
The weighted average number of shares used to compute basic and diluted EPS attributable to Leidos stockholders were:
|
|
Year Ended
|
||||||||
|
|
December 28,
2018 |
December 29,
2017 |
December 30,
2016 |
||||||
|
|
(in millions)
|
||||||||
|
Basic weighted average number of shares outstanding
|
151
|
|
152
|
|
102
|
|
|||
|
Dilutive common share equivalents—stock options and other stock awards
|
2
|
|
2
|
|
2
|
|
|||
|
Diluted weighted average number of shares outstanding
|
153
|
|
154
|
|
104
|
|
|||
Anti-dilutive stock-based awards are excluded from the weighted average number of shares outstanding used to compute diluted EPS. For the year ended December 28, 2018, there was a total of
1 million
of outstanding stock options and vesting stock awards that were anti-dilutive.
Share repurchases
In the fourth quarter of 2018, the Company entered into an uncollared Accelerated Share Repurchase ("ASR") agreement with a financial institution to repurchase shares of its outstanding common stock. The Company paid
$250 million
to the financial institution and received an initial and final delivery of
3.3 million
and
0.7 million
shares, respectively. The purchase was recorded to "Additional paid-in capital" in the consolidated balance sheets. All shares delivered were immediately retired.
The delivery of
4 million
shares of Leidos common stock reduced the Company's outstanding shares used to determine the weighted average shares outstanding for purposes of calculating basic and diluted EPS at December 28, 2018.
During fiscal 2018, the Company also made open market repurchases of its common stock for an aggregate purchase price of
$167 million
. All shares repurchased were immediately retired.
There were
no
open market repurchases during fiscal 2017 and fiscal 2016.
Note 19—Stock-Based Compensation
Plan Summaries
As of
December 28, 2018
, the Company had stock-based compensation awards outstanding under the following plans: the 2017 Omnibus Incentive Plan, 2006 Equity Incentive Plan, as amended, and the 2006 Employee Stock Purchase Plan, as amended ("ESPP"). Leidos issues new shares upon the issuance of the vesting of stock units or exercising of stock options under these plans.
In fiscal 2017, stockholders approved the 2017 Omnibus Incentive Plan which provides the Company and its affiliates' employees, directors and consultants the opportunity to receive various types of stock-based compensation awards, such as stock options, restricted stock units and performance-based awards, as well as cash awards. Service-based awards granted under the plan prior to fiscal 2015 generally vested or became exercisable
20%
a year for the first three years and
40%
in the fourth year. In fiscal 2015, the Company began granting awards that generally vest or become exercisable
25%
a year over
four
years or cliff vest in three years. As of
December 28, 2018
,
5.0 million
shares of Leidos' stock were reserved for future issuance under the 2017 Omnibus Incentive Plan and the 2006 Equity Incentive Plan.
Leidos Holdings, Inc. Annual Report -
87
The Company offers eligible employees the opportunity to defer restricted stock units into an equity-based deferred equity compensation plan, the Key Executive Stock Deferral Plan ("KESDP"). Prior to 2013 the Company offered an additional opportunity for deferrals into the Management Stock Compensation Plan ("MSCP"). Benefits from these plans are payable in shares of Leidos' stock that are held in a trust for the purpose of funding shares to the plans' participants. Restricted stock units deferred under the KESDP are counted against the total shares available for future issuance under the 2017 Omnibus Incentive Plan. All awards under the MSCP are fully vested and the plan does not provide for a maximum number of shares available for future issuance.
The Company's ESPP allows eligible employees to purchase shares of Leidos' stock at a discount of up to
15%
of the fair market value on the date of purchase. During the first half of fiscal 2018, fiscal
2017
and
2016
, the discount was
5%
of the fair market value on the date of purchase, thereby resulting in the ESPP being non-compensatory. Effective the second half of fiscal 2018, the Company increased the discount to
10%
of the fair market value on the date of purchase, resulting in the ESPP being compensatory. During fiscal 2018 and 2017,
$11 million
and
$10 million
, respectively, was received from ESPP plan participants for the issuance of Leidos' stock. A total of
4.6 million
shares remain available for future issuance under the ESPP.
Stock-based compensation and related tax benefits recognized under all plans were as follows:
|
|
Year Ended
|
|||||||||||
|
|
December 28,
2018 |
December 29,
2017 |
December 30,
2016 |
|||||||||
|
|
(in millions)
|
|||||||||||
|
Total stock-based compensation expense
|
$
|
44
|
|
$
|
43
|
|
$
|
35
|
|
|||
|
Tax benefits recognized from stock-based compensation
|
11
|
|
17
|
|
14
|
|
||||||
Stock Options
Stock options are granted with exercise prices equal to the fair market value of Leidos' common stock on the date of grant and for terms not greater than
ten
years. Stock options have a term of
seven
years and a vesting period of
four
years, except for stock options granted to the Company's outside directors, which have a vesting period of the earlier of
one
year from grant date or the next annual meeting of stockholders following grant date.
The fair value of the Company's stock option awards is estimated on the date of grant using the Black-Scholes-Merton option-pricing model. The fair value of the Company's stock option awards to employees are expensed on a straight-line basis over the vesting period of
four
years, except for stock options granted to the Company's outside directors, which is recognized over the vesting period of
one
year or less.
During fiscal 2016, expected volatility was based on using a blended approach, which included weighted average historical volatility of a group of publicly-traded peer companies, weighted average historical volatility of the Company and the weighted average implied volatility. The expected volatility increased, from pre-acquisition to post-acquisition of the IS&GS Business in fiscal 2016, due to a higher allocation of peer group volatility used post-acquisition. The post-acquisition volatility reflected an updated peer group mix.
During fiscal 2017, the Company ceased the usage of peer group volatility, as an input into its blended approach to measure expected volatility, and increased the reliance on historical volatility. The revised blended approach includes the Company's weighted average historical and implied volatilities. The Company continued the use of this approach during fiscal 2018.
The risk-free rate is derived using the yield curve of a zero-coupon U.S. Treasury bond with a maturity equal to the expected term of the stock option on the grant date. Leidos utilizes the simplified method for the expected term, which represents an appropriate period of time that the options granted are expected to remain outstanding between the weighted-average vesting period and end of the respective contractual term. The dividend yield increased from pre-acquisition to post-acquisition due to historical stock price fluctuations. The Company uses historical data to estimate forfeitures and was derived in the same manner as in the prior years presented.
Leidos Holdings, Inc. Annual Report -
88
The weighted average grant-date fair value and assumptions used to determine fair value of stock options granted for the periods presented were as follows:
|
|
|
Year Ended
|
||||||||||||||
|
|
|
December 28,
2018 |
|
December 29,
2017 |
December 30, 2016
(Grants after acquisition) |
December 30, 2016
(Grants before acquisition) |
||||||||||
|
Weighted average grant-date fair value
|
|
$
|
13.85
|
|
|
$
|
11.53
|
|
|
$
|
10.33
|
|
$
|
9.54
|
|
|
|
Expected term (in years)
|
|
4.7
|
|
|
4.7
|
|
|
4.7
|
|
4.8
|
|
|||||
|
Expected volatility
|
|
26.6
|
%
|
|
29.7
|
%
|
|
37.9
|
%
|
29.9
|
%
|
|||||
|
Risk-free interest rate
|
|
2.6
|
%
|
|
1.9
|
%
|
|
1.2
|
%
|
1.3
|
%
|
|||||
|
Dividend yield
|
|
2.0
|
%
|
|
2.5
|
%
|
|
2.7
|
%
|
2.5
|
%
|
|||||
Special Dividend Adjustment
As a result of the payment of the special cash dividend to Leidos stockholders in August 2016, Leidos modified all outstanding stock options to preserve their original grant date fair value. The modifications resulted in a reduction in the strike prices of the outstanding stock options by a factor of
0.74
and an increase in the number of shares issuable upon the exercise of each option by a factor of
1.35
between the pre-modification stock price and post-modification stock price. These adjustments did not result in additional stock-based compensation expense, as the fair value of the outstanding options immediately following the payment of the special cash dividend was equal to the fair value immediately prior to such distribution. The modifications resulted in an increase in options outstanding by
0.9 million
. The special dividend declared was
$993 million
. As a result of the special dividend declaration, the Company accrued
$29 million
of dividend equivalents with respect to outstanding equity awards. The transactions associated with the special cash dividend were recorded to "Additional paid-in capital" in the consolidated balance sheets.
Stock option activity for each of the periods presented was as follows:
|
Shares of
stock under
stock options
|
Weighted
average
exercise price
|
Weighted
average
remaining
contractual
term
|
Aggregate
intrinsic value
|
||||||||||
|
|
(in millions)
|
|
(in years)
|
(in millions)
|
|||||||||
|
Outstanding at January 1, 2016
|
2.4
|
|
$
|
38.21
|
|
4.5
|
$
|
43
|
|
||||
|
Options granted
|
0.6
|
|
43.56
|
|
|||||||||
|
Special dividend adjustments
|
0.9
|
|
|||||||||||
|
Options forfeited or expired
|
(0.2
|
)
|
34.98
|
|
|||||||||
|
Options exercised
|
(0.4
|
)
|
34.11
|
|
5
|
|
|||||||
|
Outstanding at December 30, 2016
|
3.3
|
|
$
|
29.77
|
|
4.1
|
$
|
70
|
|
||||
|
Options granted
|
0.5
|
|
53.51
|
|
|||||||||
|
Options forfeited or expired
|
(0.2
|
)
|
35.72
|
|
|||||||||
|
Options exercised
|
(0.8
|
)
|
27.23
|
|
23
|
|
|||||||
|
Outstanding at December 29, 2017
|
2.8
|
|
$
|
34.38
|
|
3.9
|
$
|
86
|
|
||||
|
Options granted
|
0.4
|
|
63.75
|
|
|
|
|
||||||
|
Options forfeited or expired
|
(0.2
|
)
|
49.65
|
|
|
|
|
||||||
|
Options exercised
|
(0.6
|
)
|
30.40
|
|
|
24
|
|
||||||
|
Outstanding at December 28, 2018
|
2.4
|
|
39.41
|
|
3.8
|
36
|
|
||||||
|
Exercisable at December 28, 2018
|
1.4
|
|
$
|
31.72
|
|
2.8
|
$
|
29
|
|
||||
|
Vested and expected to vest in the future as of December 28, 2018
|
2.4
|
|
$
|
39.15
|
|
3.7
|
$
|
36
|
|
||||
Leidos Holdings, Inc. Annual Report -
89
As of
December 28, 2018
, there was
$6 million
of unrecognized compensation cost, net of estimated forfeitures, related to stock options, which is expected to be recognized over a weighted-average period of
2.0
years. Tax benefits from stock options exercised for fiscal 2018, 2017 and 2016 were
$6 million
,
$7 million
and
$1 million
respectively.
Restricted Stock Units and Awards
Compensation expense is measured at the grant date fair value and generally recognized over the vesting period of either
three
to
four
years based upon required service conditions and in some cases revenue or EPS-based performance conditions.
In connection with the Transactions (see "
Note 6—Acquisitions
"), the Company issued
0.6 million
replacement restricted stock units valued at
$23 million
, of which
$9 million
was allocated as purchase consideration attributed to pre-acquisition service and the remaining
$12 million
represents the total remaining stock-based compensation expense, net of estimated forfeitures. This remaining expense will be recognized over
three years
from the date of acquisition.
Restricted stock units and awards activity for each of the periods presented was as follows:
|
Shares of stock
under stock
awards
|
Weighted
average grant-
date fair value
|
||||||
|
(in millions)
|
|
||||||
|
Unvested stock awards at January 1, 2016
|
2.3
|
|
$
|
38.97
|
|
||
|
Awards granted
|
1.5
|
|
41.45
|
|
|||
|
Awards forfeited
|
(0.2
|
)
|
40.88
|
|
|||
|
Awards vested
|
(1.1
|
)
|
38.91
|
|
|||
|
Unvested stock awards at December 30, 2016
|
2.5
|
|
$
|
40.39
|
|
||
|
Awards granted
|
0.8
|
|
53.91
|
|
|||
|
Awards forfeited
|
(0.3
|
)
|
45.89
|
|
|||
|
Awards vested
|
(1.0
|
)
|
41.02
|
|
|||
|
Unvested stock awards at December 29, 2017
|
2.0
|
|
$
|
44.96
|
|
||
|
Awards granted
|
0.6
|
|
64.05
|
|
|||
|
Awards forfeited
|
(0.2
|
)
|
42.67
|
|
|||
|
Awards vested
|
(0.4
|
)
|
44.60
|
|
|||
|
Unvested stock awards at December 28, 2018
|
2.0
|
|
$
|
50.85
|
|
||
As of
December 28, 2018
, there was
$37 million
of unrecognized compensation cost, net of estimated forfeitures, related to restricted stock units, which is expected to be recognized over a weighted average period of
2.0
years. The fair value of restricted stock units that vested in fiscal
2018
,
2017
and
2016
, was
$22 million
,
$33 million
and
$43 million
, respectively. In addition, the fair value of dividend equivalents with respect to restricted stock units that vested in fiscal
2018
,
2017
and
2016
was
$1 million
,
$13 million
and
$8 million
, respectively.
Performance-Based Stock Awards
Historically, the Company granted performance-based stock awards to certain officers and key employees of the Company under the 2006 Equity Incentive Plan. During fiscal 2017, upon stockholder approval, the Company started granting performance-based stock awards to these individuals under the 2017 Omnibus Incentive Plan. Under both plans, the Company's performance-based stock awards vest and the stock is issued at the end of a
three
-year period based upon the achievement of specific performance criteria, with the number of shares ultimately awarded, if any, ranging up to
150%
of the specified target awards. If performance is below the threshold level of performance, no shares will be issued.
Leidos Holdings, Inc. Annual Report -
90
For awards granted during fiscal
2018
,
2017
and
2016
, the target number of shares of stock granted under the awards will vest and the stock will be issued at the end of a
three
-year period based on a
three
-year cycle performance period and the actual number of shares to be issued will be based upon the achievement of the
three
-year cycle's performance criteria. Also, during fiscal
2018
,
2017
and
2016
, the Company granted performance-based awards with market conditions. These market conditions grants represent the target number of shares and the actual number of shares to be awarded upon vesting may be higher or lower depending upon the achievement of the relevant market conditions. The target number of shares granted under the market conditions grants will vest and the stock will be issued at the end of a
three
-year period based on the attainment of certain total shareholder return performance measures and the employee's continued service through the vest date.
Performance-based stock award activity for each of the periods presented was as follows:
|
Expected number
of shares of stock
to be issued under
performance-based
stock awards
|
Weighted
average grant-
date fair value
|
||||||
|
|
(in millions)
|
|
|||||
|
Unvested at January 1, 2016
|
0.2
|
|
$
|
43.35
|
|
||
|
Awards granted
|
0.2
|
|
45.62
|
|
|||
|
Unvested at December 30, 2016
|
0.4
|
|
$
|
44.44
|
|
||
|
Awards granted
|
0.2
|
|
57.94
|
|
|||
|
Awards vested
|
(0.1
|
)
|
42.85
|
|
|||
|
Unvested at December 29, 2017
|
0.5
|
|
$
|
50.34
|
|
||
|
Awards granted
|
0.3
|
|
61.43
|
|
|||
|
Awards forfeited
|
(0.1
|
)
|
61.81
|
|
|||
|
Awards vested
|
(0.2
|
)
|
44.04
|
|
|||
|
Unvested at December 28, 2018
|
0.5
|
|
$
|
57.36
|
|
||
The weighted average grant date fair value for performance-based stock, excluding those with a market condition, during fiscal
2018
,
2017
and
2016
was
$63.76
,
$53.58
and
$45.83
, respectively. The weighted average grant date fair value for performance-based stock with market conditions that were granted during fiscal
2018
,
2017
and
2016
, was
$71.50
,
$62.30
and
$45.80
, respectively, and was calculated using the Monte Carlo simulation.
The Monte Carlo simulation assumptions used for the periods presented were as follows:
|
|
|
Year Ended
|
||||||||||
|
|
|
December 28,
2018 |
December 29,
2017 |
December 30,
2016 |
||||||||
|
Expected volatility
|
|
25.37
|
%
|
27.19
|
%
|
31.73
|
%
|
|||||
|
Risk free rate of return
|
|
2.35
|
%
|
1.53
|
%
|
1.01
|
%
|
|||||
|
Weighted average grant date stock price
|
|
$
|
65.00
|
|
$
|
53.73
|
|
$
|
46.54
|
|
||
As of
December 28, 2018
, there was
$11 million
of unrecognized compensation cost, net of estimated forfeitures, which is expected to be recognized over a weighted average period of
1.7
years. The fair value of performance-based stock awards that vested in fiscal
2018
and
2017
was
$13 million
and
$4 million
, respectively. There were
no
performance-based stock awards that vested in fiscal 2016.
Note 20—Income Taxes
In December 2017, the U.S. government enacted the Tax Act which made broad and complex changes to the U.S. tax code, including, but not limited to, (1) reducing the U.S. federal corporate tax rate from
35%
to
21%
; (2) requiring companies to pay a one-time transition tax on certain unrepatriated earnings of foreign subsidiaries; (3) generally eliminating U.S. federal income taxes on dividends from foreign subsidiaries; and (4) limiting the deductibility of certain executive compensation.
Leidos Holdings, Inc. Annual Report -
91
As a result of the Company’s preliminary analysis of the impact of the Tax Act, a discrete net tax benefit of
$115 million
was recorded in fiscal 2017, which primarily consisted of a net benefit for the corporate rate reduction of
$119 million
. This rate reduction resulted in a corresponding net decrease of deferred tax liabilities. During fiscal 2018, the Company completed its assessment of the impact of the Tax Act during the one-year measurement period. As a result, the Company increased its preliminary estimate of the deemed repatriation tax by
$5 million
and decreased its preliminary estimate of the limitation on the deductibility of certain executive compensation by $
1 million
, resulting in a net increase of
$4 million
to fiscal 2018 income tax expense.
Less than
10%
of the Company's income before income taxes for fiscal
2018
,
2017
and
2016
was earned outside of the United States. The provision for income taxes for the periods presented included the following:
|
|
Year Ended
|
|||||||||||
|
|
December 28,
2018 |
December 29,
2017 |
December 30,
2016 |
|||||||||
|
|
(in millions)
|
|||||||||||
|
Current:
|
|
|
|
|||||||||
|
Federal and foreign
|
$
|
54
|
|
$
|
130
|
|
$
|
88
|
|
|||
|
State
|
23
|
|
30
|
|
16
|
|
||||||
|
Deferred:
|
|
|
||||||||||
|
Federal and foreign
|
(39
|
)
|
(141
|
)
|
(29
|
)
|
||||||
|
State
|
(10
|
)
|
10
|
|
(3
|
)
|
||||||
|
Total
|
$
|
28
|
|
$
|
29
|
|
$
|
72
|
|
|||
A reconciliation of the provision for income taxes to the amount computed by applying the statutory federal income tax rate to income before income taxes for the periods presented was as follows:
|
|
Year Ended
|
|||||||||||
|
|
December 28,
2018 |
December 29,
2017 |
December 30,
2016 |
|||||||||
|
|
(in millions)
|
|||||||||||
|
Amount computed at the statutory federal income tax rate
|
$
|
128
|
|
$
|
138
|
|
$
|
111
|
|
|||
|
State income taxes, net of federal tax benefit
|
10
|
|
31
|
|
8
|
|
||||||
|
Change in valuation allowance for deferred tax assets
|
(49
|
)
|
7
|
|
(8
|
)
|
||||||
|
Taxable conversion of a subsidiary
|
(17
|
)
|
—
|
|
—
|
|
||||||
|
Stock basis in subsidiary held for sale
|
(16
|
)
|
—
|
|
—
|
|
||||||
|
Change in statutory federal tax rate
|
(10
|
)
|
(125
|
)
|
—
|
|
||||||
|
Excess tax benefits from stock-based compensation
|
(9
|
)
|
(12
|
)
|
(8
|
)
|
||||||
|
Research and development credits
|
(9
|
)
|
(7
|
)
|
(4
|
)
|
||||||
|
Dividends paid to employee stock ownership plan
|
(2
|
)
|
(4
|
)
|
(38
|
)
|
||||||
|
Change in accruals for uncertain tax positions
|
1
|
|
—
|
|
1
|
|
||||||
|
Capitalized transaction costs
|
—
|
|
9
|
|
7
|
|
||||||
|
Impact of foreign operations
|
—
|
|
(4
|
)
|
—
|
|
||||||
|
Other
|
1
|
|
(4
|
)
|
3
|
|
||||||
|
Total
|
$
|
28
|
|
$
|
29
|
|
$
|
72
|
|
|||
|
Effective income tax rate
|
4.6
|
%
|
7.4
|
%
|
22.6
|
%
|
||||||
The Company's effective tax rate for fiscal 2018 was favorably impacted primarily by a decrease in valuation allowances arising from the taxable conversion of a subsidiary and the utilization of capital losses, an increase in deferred tax assets related to stock basis of a subsidiary held for sale, excess tax benefits related to employee stock-based payment transactions and federal research tax credits.
Leidos Holdings, Inc. Annual Report -
92
The Company's effective tax rate for fiscal 2017 was favorably impacted primarily by the Tax Act's reduction of the federal corporate tax rate from
35%
to
21%
applied to the Company's fiscal 2017 year-end deferred tax balances and excess tax benefits related to employee stock-based payment transactions.
The Company's effective tax rate for fiscal 2016 was
favorably impacted primarily by the tax deductibility of the special cash dividend, related to the Transactions described in “
Note 6—Acquisitions
,” on shares held by the Leidos retirement plan, excess tax benefits related to employee stock-based payment transactions and federal research tax credits, partially offset by the impact of certain capitalized transaction costs related to the Transactions.
Deferred income taxes are recorded for differences in the basis of assets and liabilities for financial reporting purposes and tax reporting purposes. Deferred tax assets (liabilities) were comprised of the following:
|
|
December 28,
2018 |
December 29,
2017 |
||||||
|
|
(in millions)
|
|||||||
|
Reserves
|
$
|
57
|
|
$
|
62
|
|
||
|
Accrued vacation and bonuses
|
48
|
|
54
|
|
||||
|
Credits and net operating losses carryovers
|
31
|
|
33
|
|
||||
|
Deferred compensation
|
25
|
|
22
|
|
||||
|
Vesting stock awards
|
20
|
|
17
|
|
||||
|
Deferred gain
|
20
|
|
—
|
|
||||
|
Deferred rent and tenant allowances
|
18
|
|
10
|
|
||||
|
Investments
|
18
|
|
2
|
|
||||
|
Capital loss carryover
|
—
|
|
60
|
|
||||
|
Other
|
13
|
|
18
|
|
||||
|
Total deferred tax assets
|
250
|
|
278
|
|
||||
|
Valuation allowance
|
(28
|
)
|
(83
|
)
|
||||
|
Deferred tax assets, net of valuation allowance
|
222
|
|
195
|
|
||||
|
|
||||||||
|
Purchased intangible assets
|
(326
|
)
|
(340
|
)
|
||||
|
Deferred revenue
|
(40
|
)
|
(34
|
)
|
||||
|
Accumulated other comprehensive (loss) income
|
(6
|
)
|
(13
|
)
|
||||
|
Employee benefit contributions
|
(4
|
)
|
(3
|
)
|
||||
|
Partnership interest
|
(2
|
)
|
(17
|
)
|
||||
|
Other
|
(14
|
)
|
(8
|
)
|
||||
|
Total deferred tax liabilities
|
(392
|
)
|
(415
|
)
|
||||
|
Net deferred tax liabilities
|
$
|
(170
|
)
|
$
|
(220
|
)
|
||
At
December 28, 2018
, the Company had state net operating losses of
$131 million
, which will begin to expire in fiscal 2019. The Company had state tax credits of
$9 million
, which will begin to expire in fiscal 2019. The Company expects to utilize
$3 million
and
$18 million
of these state tax credits and state net operating losses, respectively. The Company also had foreign net operating losses of
$69 million
. The Company expects to utilize
$8 million
of these foreign net operating losses.
Our valuation allowance for deferred tax assets was
$28 million
and
$83 million
as of December 28, 2018 and December 29, 2017, respectively. The valuation allowance decreased by
$55 million
primarily due to the taxable conversion of a subsidiary and the utilization of capital losses from the sale of the San Diego properties.
Leidos Holdings, Inc. Annual Report -
93
The Company's income tax balance sheet items are included in the accompanying consolidated balance sheets as follows:
|
|
December 28,
2018 |
December 29,
2017 |
||||||
|
|
(in millions)
|
|||||||
|
Other current assets:
|
||||||||
|
Prepaid income taxes and tax refunds receivable
|
$
|
43
|
|
$
|
54
|
|
||
|
Income taxes payable
|
3
|
|
4
|
|
||||
|
Deferred tax liabilities
|
170
|
|
220
|
|
||||
|
Other long-term liabilities:
|
||||||||
|
Unrecognized tax benefits
|
3
|
|
9
|
|
||||
The Company's unrecognized tax benefits are primarily related to certain recurring deductions customary for the Company’s industry. The changes in the unrecognized tax benefits, excluding
$1 million
of accrued interest and penalties for each respective period, were as follows:
|
|
Year Ended
|
|||||||||||
|
|
December 28,
2018 |
December 29,
2017 |
December 30,
2016 |
|||||||||
|
|
(in millions)
|
|||||||||||
|
Unrecognized tax benefits at beginning of year
|
$
|
10
|
|
$
|
9
|
|
$
|
11
|
|
|||
|
Additions for tax positions related to current year
|
3
|
|
2
|
|
1
|
|
||||||
|
Additions for tax positions related to prior years
|
—
|
|
2
|
|
4
|
|
||||||
|
Reductions for tax positions related to prior years
|
(7
|
)
|
(3
|
)
|
(7
|
)
|
||||||
|
Unrecognized tax benefits at end of year
|
$
|
6
|
|
$
|
10
|
|
$
|
9
|
|
|||
|
Unrecognized tax benefits that, if recognized, would affect the effective income tax rate
|
$
|
6
|
|
$
|
7
|
|
$
|
4
|
|
|||
At
December 28, 2018
, the balance of unrecognized tax benefits included liabilities for uncertain tax positions of
$7 million
,
$3 million
of which were classified as other long-term liabilities on the Company's consolidated balance sheets. At
December 29, 2017
, the balance of unrecognized tax benefits included liabilities for uncertain tax positions of
$11 million
,
$7 million
of which were classified as other long-term liabilities on the Company's consolidated balance sheets. At
December 30, 2016
, the balance of unrecognized tax benefits included liabilities for uncertain tax positions of
$10 million
,
$5 million
of which were classified as other long-term liabilities on the Company's consolidated balance sheets.
The Company files income tax returns in the United States and various state and foreign jurisdictions. The Company participates in the Internal Revenue Service (“IRS”) Compliance Assurance Process, a real-time audit of the Company's consolidated federal corporate income tax return. The IRS has examined the Company's consolidated federal income tax returns through the year ended December 30, 2016. With a few exceptions, as of
December 28, 2018
, the Company is no longer subject to state, local, or foreign examinations by the tax authorities for fiscal years ending on or before January 30, 2015.
During the next 12 months, it is reasonably possible that resolution of reviews by taxing authorities, both domestic and international, could be reached with respect to
$3 million
of the Company's unrecognized tax benefits, depending on the timing of ongoing examinations, any litigation and expiration of statute of limitations, either because the Company's tax positions are sustained or because the Company agrees to their disallowance and pays the related income tax. While the Company believes it has adequate accruals for uncertain tax positions, the tax authorities may determine that the Company owes taxes in excess of recorded accruals or the recorded accruals may be in excess of the final settlement amounts agreed to by tax authorities.
Leidos Holdings, Inc. Annual Report -
94
Note 21—Retirement Plans
Defined Contribution Plans
The Company sponsors a defined contribution plan, the Leidos, Inc. Retirement Plan, which is both a 401(k) plan and an employee stock ownership plan in which most employees are eligible to participate. This plan allows eligible participants to contribute a portion of their income through payroll deductions and the Company may also make discretionary contributions. Company contributions were
$94 million
for fiscal
2018
and
2017
, and
$68 million
for fiscal
2016
.
Deferred Compensation Plans
The Company maintains
three
deferred compensation plans, the Keystaff Deferral Plan ("KDP"), the KESDP and the MSCP (the "Plans"), for the benefit of certain management or highly compensated employees or members of the Board of Directors. The deferred compensation plans allow eligible participants to elect to defer a portion of their salary, and all or a portion of certain bonuses, including restricted stock unit awards. Directors may also elect to defer their director fees and retainers in addition to their restricted stock unit awards. Deferred balances in the Plans are paid in lump sum or installments upon retirement, termination or the elected specified date.
The Company makes no contributions to the KDP but maintains participant accounts for deferred amounts and investments. The Company maintains a rabbi trust for the purpose of funding benefit payments to the KDP participants. Participants may allocate deferred cash bonus amounts into a variety of designated investment options, with gains and losses based on the elected investment option performance with the participant assuming all risks related to future returns of their contributions.
Under the KESDP, eligible participants may also elect to defer in share units all or a portion of certain cash bonuses and restricted stock unit awards granted under the previous 2006 Equity Incentive Plan and the current 2017 Omnibus Incentive Plan (see "
Note 19—Stock-Based Compensation
"). Under the MSCP, restricted stock share units that are deferred are fully vested and no further deferrals into the plan are made. The Company makes no contributions to the accounts of KESDP or MSCP participants. Benefits from the KESDP and MSCP are payable in shares of Leidos common stock held in a rabbi trust for the purpose of funding benefit payments to KESDP and MSCP participants.
The Company sponsored a 401(k) Excess Deferral Plan ("Excess Plan") for the benefit of certain management or highly compensated employees that allowed participants to elect to defer up to
20%
of their eligible salary once the participant had met the IRS contribution limit imposed on the Leidos, Inc. Retirement Plan. The Company made matching contributions to participants who received a reduced Company contribution in the Leidos, Inc. Retirement Plan due to the participant's deferral of salary into the Excess Plan which were included in the contributions expensed amount for defined contributions plans. This plan was frozen effective December 31, 2016.
Defined Benefit Plans
The Company sponsors a defined benefit pension plan in the United Kingdom for former employees on an expired customer contract. While benefits under the plan are frozen, the Company has continuing defined benefit pension obligations with respect to certain plan participants. In fiscal 2012, the Company sold certain components of its business, including the component of its business that contained this pension and employed the pension plan participants. Pursuant to the definitive sale agreement, the Company retained the assets and obligations of this defined benefit pension plan. As a result of retaining the pension obligation, the remaining immaterial components of ongoing pension expense, primarily interest costs and assumed return on plan assets subsequent to the sale, are recorded in continuing operations.
The projected benefit obligation as of
December 28, 2018
, and
December 29, 2017
, was
$103 million
and
$120 million
, respectively. The decrease in the projected benefit obligation was primarily due to the impact of a stronger U.S. dollar, settlements during fiscal 2018 and a gain resulting from changes in assumptions used in the valuation.
The fair value of plan assets as of
December 28, 2018
, and
December 29, 2017
, was
$115 million
and
$129 million
, respectively. The plan funding status was overfunded
$12 million
and
$9 million
as of
December 28, 2018
, and
December 29, 2017
, respectively, and included in other assets.
Leidos Holdings, Inc. Annual Report -
95
Other
The Company also sponsors a defined benefit pension plan for employees working on one U.S. government contract. As part of the contractual agreement, the customer reimburses the Company for contributions made to the plan that are allowable under government contract cost accounting requirements. If the Company were to cease being the contractor as a result of a recompetition process, this defined benefit pension plan and related plan assets and liabilities would transfer to the new contractor. If the contract expires or is terminated with no transfer of the plan to a successor contractor, any amount by which plan liabilities exceed plan assets, as of that date, will be reimbursed by the U.S. government customer. Since the Company is not responsible for the current or future funded status of this plan, no assets or liabilities arising from its funded status are recorded in the Company's consolidated financial statements and no amounts associated with this plan are included in the defined benefit plan disclosures above.
Note 22—Leases
The Company occupies most of its facilities under operating leases. Most of the leases require the Company to pay maintenance and operating expenses such as taxes, insurance and utilities and also contain renewal options to extend the lease and provisions for periodic rate escalations to reflect inflationary increases. Certain equipment is leased under short-term or cancelable operating leases. Rental expense for facilities and equipment for the periods presented were as follows:
|
|
Year Ended
|
|||||||||||
|
|
December 28,
2018 |
December 29,
2017 |
December 30,
2016 |
|||||||||
|
|
(in millions)
|
|||||||||||
|
Gross rental expense
|
$
|
163
|
|
$
|
181
|
|
$
|
107
|
|
|||
|
Less: sublease income
|
(1
|
)
|
(3
|
)
|
(2
|
)
|
||||||
|
Net rental expense
|
$
|
162
|
|
$
|
178
|
|
$
|
105
|
|
|||
The increase in rental expense from fiscal 2016 to fiscal 2017 was primarily due to the acquisition of the IS&GS Business.
Future minimum lease commitments and sublease receipts, under non-cancelable operating leases in effect at
December 28, 2018
, are as follows:
|
Fiscal Year Ending
|
Operating lease
commitment |
Sublease
receipts |
||||||
|
|
(in millions)
|
|||||||
|
2019
|
$
|
144
|
|
$
|
3
|
|
||
|
2020
|
114
|
|
1
|
|
||||
|
2021
|
83
|
|
1
|
|
||||
|
2022
|
71
|
|
—
|
|
||||
|
2023
|
55
|
|
—
|
|
||||
|
2024 and thereafter
|
246
|
|
—
|
|
||||
|
Total
|
$
|
713
|
|
$
|
5
|
|
||
As of
December 28, 2018
, the Company had capital lease obligations of
$3 million
that are payable over the next year (see "
Note 15—Debt
").
On January 24, 2018, the Company entered into a lease agreement with its current lessor for office space in a building to be constructed to function as the Company's new corporate headquarters in Reston, Virginia. The Company will occupy the space for an initial term of
148
months and rent expense will be
$11 million
for the first lease year, with an annual rent expense increase of
2.5%
. The Company currently expects construction to be completed and to take occupancy of the building by April 1, 2020, at which point the Company's lease agreements for its current corporate headquarters will terminate.
Leidos Holdings, Inc. Annual Report -
96
Sale and Leaseback Agreements
Former Headquarters
On May 3, 2013, the Company entered into a purchase and sale agreement relating to the sale of approximately
18 acres
of land in Fairfax County, Virginia, including
four
office buildings, a multi-level parking garage, surface parking lots and other related improvements and structures, as well as tangible personal property and third-party leases.
On August 31, 2015, the Company entered into an amendment to the original purchase and sale agreement and subsequently, in December 2015, closed the sale of the remaining building, parcels of land that surround the building and the multi-level surface parking garage for a net purchase consideration of
$95 million
. The closing consideration consisted of a cash payment of
$75 million
and a promissory note (the "Note") of
$20 million
, net of discount of
$5 million
.
The Note matures on December 17, 2019 ("Maturity Date"), and accrues interest at 30-day LIBOR subject to a floor of
0.25%
per annum, plus
0.50%
over a
four
-year period. Interest will accrue daily and is not compounded to the outstanding principal balance. The total accumulated interest and principal will be paid in a lump sum on the Maturity Date. If prepayments are made towards the outstanding principal and interest balance prior to the maturity date, the Company will credit
60%
of the accrued interest against the outstanding balance.
San Diego Properties
In December 2018, the Company entered into and closed on a sales and leaseback agreement relating to
two
buildings and the adjacent land in San Diego, California for consideration of
$79 million
, net of selling costs. The Company received cash proceeds of
$14 million
and recognized a short-term receivable for the remaining
$65 million
of consideration. The sale of the properties is being accounted for as a financing transaction. The net consideration of
$79 million
was recorded as a note payable (see "
Note 15—Debt
") expected to be paid over the next
3 years
.
Leidos Holdings, Inc. Annual Report -
97
Note 23—Supplementary Cash Flow Information and Restricted Cash
Supplementary cash flow information, including non-cash activities, for the periods presented was as follows:
|
|
Year Ended
|
|||||||||||
|
|
December 28,
2018 |
December 29,
2017 |
December 30,
2016 |
|||||||||
|
|
(in millions)
|
|||||||||||
|
Supplementary cash flow information:
|
||||||||||||
|
Cash paid for interest
|
$
|
133
|
|
$
|
133
|
|
$
|
90
|
|
|||
|
Cash paid for income taxes, net of refunds
|
70
|
|
214
|
|
47
|
|
||||||
|
Non-cash investing activity:
|
||||||||||||
|
Stock issued for acquisition of the IS&GS Business
|
$
|
—
|
|
$
|
—
|
|
$
|
2,938
|
|
|||
|
Non-cash financing activity:
|
||||||||||||
|
Real estate financing transaction
|
$
|
65
|
|
$
|
—
|
|
$
|
—
|
|
|||
|
Dividends declared
|
3
|
|
3
|
|
21
|
|
||||||
|
Notes payable and capital lease obligations
|
—
|
|
27
|
|
—
|
|
||||||
The following is a reconciliation of cash and cash equivalents, as reported within the consolidated balance sheets, to the total cash, cash equivalents and restricted cash, as reported within the consolidated statements of cash flows:
|
December 28,
2018 |
December 29,
2017 |
|||||||
|
(in millions)
|
||||||||
|
Cash and cash equivalents
|
$
|
327
|
|
$
|
390
|
|
||
|
Restricted cash
|
42
|
|
32
|
|
||||
|
Total cash, cash equivalents and restricted cash
|
$
|
369
|
|
$
|
422
|
|
||
The restricted cash is recorded within "Other current assets" in the Company's consolidated balance sheets.
The restricted cash primarily comprises of
advances from customers that are restricted as to use for certain expenditures related to that customer's contract
.
Leidos Holdings, Inc. Annual Report -
98
Note 24—Business Segments
The Company's operations and reportable segments are organized around the markets served and the nature of the products and services provided to customers in those markets. The Company defines its reportable segments based on the way the chief operating decision maker ("CODM"), currently its Chairman and Chief Executive Officer, manages the operations of the Company for purposes of allocating resources and assessing performance.
During fiscal 2017, the Company completed its business reorganization, which resulted in identification of
three
reportable segments (Defense Solutions, Civil and Health). Additionally, the Company separately presents the costs associated with corporate functions as Corporate. The Company commenced operating and reporting under the new organization structure effective the beginning of fiscal 2017. The segment information for fiscal 2016 has been recast to reflect the Company's current reportable segments structure.
Defense Solutions is focused on rapidly deploying agile, cost-effective solutions to meet the ever-changing missions of the Company's customers in the areas of intelligence surveillance and reconnaissance, enterprise IT, integrated systems, cybersecurity and global services. Defense Solutions provides a diverse portfolio of national security solutions and systems for air, land, sea, space and cyberspace for the U.S. Intelligence Community, the DoD, military services, DHS, government agencies of U.S. allies abroad and other federal, civilian and commercial customers in the national security industry. The Company's solutions deliver innovative technology, large-scale intelligence systems, command and control platforms, data analytics, logistics and cybersecurity solutions, as well as intelligence analysis and operations support to critical missions around the world.
The Civil business is focused on seamlessly integrating and protecting physical, digital and data domains. By applying leading science, effective technologies and business acumen, the Company's talented employees help customers maximize their performance and take on the connected world with data-driven insights, improved efficiencies and technological advantages.
The Health business is focused on delivering effective and affordable solutions to federal and commercial customers that are responsible for the health and wellbeing of people worldwide including service members and veterans. These solutions enable customers to deliver on the health mission of providing high quality, cost effective care and are accomplished through the integration of information technology, engineering, health and life sciences, clinical insights and health policy. The capabilities the Health business provides are principally encapsulated by four major areas of activity: complex systems integration, managed health services, enterprise IT transformation and life sciences.
Corporate includes the operations of various corporate activities, certain corporate expense items that are not reimbursed by the Company's U.S. government customers and certain other expense items excluded from a reportable segment's performance.
Leidos Holdings, Inc. Annual Report -
99
The following table summarizes business segment information for the periods presented:
|
|
Year Ended
|
|||||||||||
|
|
December 28,
2018 |
December 29,
2017 |
December 30,
2016 |
|||||||||
|
|
(in millions)
|
|||||||||||
|
Revenues:
|
|
|
||||||||||
|
Defense Solutions
|
$
|
4,948
|
|
$
|
4,959
|
|
$
|
3,843
|
|
|||
|
Civil
|
3,429
|
|
3,409
|
|
2,082
|
|
||||||
|
Health
|
1,817
|
|
1,802
|
|
1,117
|
|
||||||
|
Corporate
|
—
|
|
—
|
|
1
|
|
||||||
|
Total revenues
|
$
|
10,194
|
|
$
|
10,170
|
|
$
|
7,043
|
|
|||
|
Operating income (loss):
|
|
|
||||||||||
|
Defense Solutions
|
$
|
347
|
|
$
|
307
|
|
$
|
312
|
|
|||
|
Civil
|
290
|
|
226
|
|
146
|
|
||||||
|
Health
|
230
|
|
228
|
|
110
|
|
||||||
|
Corporate
|
(118
|
)
|
(202
|
)
|
(151
|
)
|
||||||
|
Total operating income
|
$
|
749
|
|
$
|
559
|
|
$
|
417
|
|
|||
|
Amortization of intangible assets:
|
|
|
||||||||||
|
Defense Solutions
|
$
|
68
|
|
$
|
108
|
|
$
|
17
|
|
|||
|
Civil
|
87
|
|
132
|
|
39
|
|
||||||
|
Health
|
46
|
|
41
|
|
28
|
|
||||||
|
Total amortization of intangible assets
|
$
|
201
|
|
$
|
281
|
|
$
|
84
|
|
|||
The financial performance measures used to evaluate segment performance are revenues and operating income. As a result, "Interest expense, net," "
Other expense, net
," and "Income tax expense," as reported in the consolidated financial statements are not allocated to the Company's segments. Under U.S. government CAS, indirect costs including depreciation expense are collected in numerous indirect cost pools, which are then collectively allocated out to the Company’s reportable segments based on a representative causal or beneficial relationship of the costs in the pool to the costs in the base. While depreciation expense is a component of the allocated costs, the allocation process precludes depreciation expense from being specifically identified by the Company’s individual reportable segments. For this reason, depreciation expense by reportable segment has not been reported above.
Asset information by segment is not a key measure of performance used by the CODM.
Less than
10%
of the Company's revenues and tangible long-lived assets are generated by or owned by entities outside of the United States (see "
Note 4—Revenues
" for international revenues by segment). As such, additional financial information by geographic location is not presented.
The Company's revenues are largely attributable to prime contracts with the U.S. government or to subcontracts with other contractors engaged in work for the U.S. government. The percentages of total revenues for the U.S. government, its agencies and other customers comprising more than
10%
of total revenues in any of the periods for the periods presented were as follows:
|
|
Year Ended
|
||||||||
|
|
December 28,
2018 |
December 29,
2017 |
December 30,
2016 |
||||||
|
U.S. Government
|
85
|
%
|
84
|
%
|
81
|
%
|
|||
|
U.S. DoD
|
47
|
%
|
47
|
%
|
56
|
%
|
|||
|
U.S. Army
|
13
|
%
|
13
|
%
|
14
|
%
|
|||
Leidos Holdings, Inc. Annual Report -
100
Note 25—Contingencies
Legal Proceedings
MSA Joint Venture
On November 10, 2015, MSA received a final decision by the Department of Energy ("DoE") contracting officer for the Mission Support Contract concluding that certain payments to MSA by DoE for the performance of IT services by Lockheed Martin Services, Inc. (“LMSI”) under a subcontract to MSA constituted alleged affiliate fees in violation of the FAR. Lockheed Martin Integrated Technology LLC (now known as Leidos Integrated Technology LLC) is a member entity of MSA. Subsequent to the contracting officer's final decision, MSA, LMSI and Lockheed Martin Corporation received notice from the U.S. Attorney's Office for the Eastern District of Washington that the U.S. government had initiated a False Claims Act investigation into the facts surrounding this dispute, and each of MSA, LMSI and Lockheed Martin Corporation have produced information in response to Civil Investigative Demands from the U.S. Attorney's Office. On February 8, 2019, the U.S. Attorney's office filed a complaint in the United States District Court for the Eastern District of Washington against MSA, Lockheed Martin Corporation, Lockheed Martin Services, Inc. and a Lockheed Martin employee. The complain alleges violations of the False Claims Act, the Anti-Kickback Act, breach of contract with DoE, among other things. The U.S. Attorney's office had previously advised that a parallel criminal investigation was open, although no subjects or targets of the investigation had been identified. The U.S. Attorney's office has informed MSA that it has closed the criminal investigation.
Since this issue first was raised by the DoE, MSA has asserted that the IT services performed by LMSI under a fixed-price/fixed-unit rate subcontract approved by the DoE meet the definition of a "commercial item" under the FAR and any profits earned on that subcontract are permissible. MSA filed an appeal of the contracting officer's decision with the Civilian Board of Contract Appeals and that appeal is pending, but has been stayed pending resolution of the False Claims Act investigation. Subsequent to the filing of MSA's appeal, the contracting officer demanded that MSA reimburse the DoE in the amount of
$64 million
, which was his estimate of the profits earned during the period from 2010 to 2014 by LMSI. The DoE has deferred collection of
$32 million
of that demand, pending resolution of the appeal and without prejudice to MSA's position that it is not liable for any of the DOE's
$64 million
reimbursement claim. The Company has agreed to indemnify Jacobs Group and Centerra Group, LLC for any liability MSA incurs in this matter. Under the terms of the Separation Agreement, Lockheed Martin agreed to indemnify the Company for
100%
of any damages in excess of
$38 million
up to
$64 million
, and
50%
of any damages in excess of
$64 million
, with respect to claims asserted against MSA related to this matter. At
December 28, 2018
, and December 29, 2017, the Company has a liability of
$39 million
and an indemnification asset of
$1 million
recorded in the consolidated balance sheets.
Securities Litigation
Between February and April 2012, alleged stockholders filed
three
putative securities class actions against the Company and several former executives relating to the Company's contract to develop and implement an automated time and attendance and workforce management system for certain agencies of the City of New York ("CityTime").
One
case was withdrawn and
two
cases were consolidated in the U.S. District Court for the Southern District of New York in
In Re: SAIC, Inc. Securities Litigation
. The consolidated securities complaint asserted claims under Sections 10(b) and 20(a) of the Securities Exchange Act of 1934 based on allegations that the Company and individual defendants made misleading statements or omissions about the Company's revenues, operating income and internal controls in connection with disclosures relating to the CityTime project. The plaintiffs sought to recover from the Company and the individual defendants an unspecified amount of damages class members allegedly incurred by buying Leidos' stock at an inflated price. The District Court dismissed the plaintiffs' claims with prejudice and without leave to replead. The plaintiffs then appealed to the United States Court of Appeals for the Second Circuit, which issued an opinion affirming in part, and vacating in part, the District Court's ruling. The Company filed a petition for a writ of certiorari in the U.S. Supreme Court, which was granted on March 27, 2017. The District Court granted the Company's request to stay all proceedings, including discovery, pending the outcome at the Supreme Court. In September 2017, the parties engaged in mediation resulting in an agreement to settle all remaining claims for an immaterial amount to be paid by the Company. The amounts payable by the Company are covered by an insurance policy. The terms of the proposed settlement remain subject to court approval.
Leidos Holdings, Inc. Annual Report -
101
Greek Government Contract
In 2003, the Company entered into an FFP contract with the Hellenic Republic of Greece to provide a Command, Control, Communications, Coordination and Integration System. The Greek government disputed the contract balance owed to the Company and has not paid the Company's final invoice. In 2013, the Company received an arbitral award by the International Chamber of Commerce for
€39 million
, which has not been satisfied. In January 2017, the U.S. District Court granted an order to enforce the arbitration award and entered judgment in the Company's favor. The Company has commenced enforcement proceedings against the Greek government in several jurisdictions. Separately, the Greek government has sought to annul the award through separate litigation in the Greek courts, and such a challenge is currently pending. Based on the complex nature of this contractual situation and the difficulties encountered to date, significant uncertainties exist and the Company is unable to reliably estimate the ultimate outcome.
Arbitration Proceeding
The Company is a party to an arbitration proceeding involving a claim by Lockheed Martin for indemnification for
$56 million
in taxes attributable to deferred revenue recognized as a result of the Transactions. Based on the arguments advanced to date, the Company believes that the claim appears to be without merit and intends to vigorously defend itself in arbitration. The Company does not believe that a material loss is probable, and has therefore not recorded any liability for this matter. We expect a final decision by the arbitration panel to be issued during the first half of fiscal 2019.
Other
The Company is also involved in various claims and lawsuits arising in the normal conduct of its business, none of which, in the opinion of the Company's management, based upon current information, will likely have a material adverse effect on the Company's consolidated financial position, results of operations or cash flows.
Other Contingencies
VirnetX, Inc.
On September 29, 2017, the federal trial court in the Eastern District of Texas entered a final judgment in the VirnetX v. Apple case referred to as the Apple I case. The court found that Apple willfully infringed the VirnetX patents at issue in the Apple I case and awarded enhanced damages, bringing the total award against Apple to over
$343 million
in pre-interest damages. The court subsequently awarded an additional sum of over
$96 million
for costs, attorneys' fees and interest, bringing the total award to VirnetX in the Apple I case to over
$439 million
. Apple appealed the judgment in the Apple I case with the U.S. Court of Appeals for the Federal Circuit and on January 15, 2019, the court affirmed the
$439 million
judgment. It is expected that Apple will appeal this decision.
On April 10, 2018, a jury trial concluded in an additional patent infringement case brought by VirnetX against Apple, referred to as the Apple II case, in which the jury returned a verdict against Apple for infringement and awarded VirnetX damages in the amount of over
$502 million
. On April 11, 2018, in a second phase of the Apple II trial, the jury found Apple's infringement to be willful. On August 30, 2018, the federal trial court in the Eastern District of Texas entered a final judgment and rulings on post-trial motions in the Apple II case. The court affirmed the jury’s verdict of over
$502 million
and granted VirnetX’s motions for supplemental damages, a sunset royalty and royalty rate of
$1.20
per infringing device, along with pre-judgment and post-judgment interest and costs. The court denied VirnetX’s motions for enhanced damages, attorneys’ fees and an injunction. The court also denied Apple’s motions for judgment as a matter of law and for a new trial. An additional sum of over
$93 million
for costs and pre-judgment interest was subsequently agreed upon pursuant to a court order, bringing the total award to VirnetX in the Apple II case to over
$595 million
. Apple has filed an appeal of the judgment in the Apple II case with the U.S. Court of Appeals for the Federal Circuit.
Under its agreements with VirnetX, the Company would receive
25%
of the proceeds obtained by VirnetX after reduction for attorneys' fees and costs. However, the verdicts in these cases remain subject to appeal. In addition, the patents at issue in these cases are subject to U.S. Patent and Trademark Office post-grant inter partes review and/or reexamination proceedings and related appeals, which may result in all or part of these patents being invalidated or the claims of the patents being limited. Thus, no assurances can be given when or if the Company will receive any proceeds in connection with these jury awards. In addition, if the Company receives any proceeds, the Company is required to pay a royalty to the customer who paid for the development of the technology.
Leidos Holdings, Inc. Annual Report -
102
The Company does not have any assets or liabilities recorded in connection with this matter as of
December 28, 2018
.
Government Investigations and Reviews
The Company is routinely subject to investigations and reviews relating to compliance with various laws and regulations with respect to its role as a contractor to federal, state and local government customers and in connection with performing services in countries outside of the United States. Adverse findings could have a material effect on the Company's business, financial position, results of operations and cash flows due to its reliance on government contracts.
During fiscal
2018
, pursuant to the resolution of certain government accounting matters, including audits by the DCAA, the Company recorded a net reduction of
$19 million
to its accrued liabilities.
As of
December 28, 2018
, indirect cost audits by the DCAA remain open for
fiscal 2013
and subsequent fiscal years. Although the Company has recorded contract revenues based upon an estimate of costs that the Company believes will be approved upon final audit or review, the Company cannot predict the outcome of any ongoing or future audits or reviews and adjustments and, if future adjustments exceed the Company's estimates, its profitability would be adversely affected.
As of
December 28, 2018
, the Company believes it has adequately reserved for potential adjustments from audits or reviews of contract costs.
Note 26—Commitments
The Company has outstanding letters of credit of
$73 million
as of
December 28, 2018
, principally related to performance guarantees on contracts. The Company also has outstanding surety bonds with net exposure of
$44 million
as of
December 28, 2018
, principally related to performance and subcontractor payment bonds on the Company's contracts. The outstanding letters of credit and surety bonds have various terms with the majority expiring over the next
three years
.
Note 27—Subsequent Events
On December 31, 2018, the Company closed the sales agreement relating to the sale and leaseback of the building and land at its Gaithersburg, Maryland property. The Company received proceeds of
$31 million
, net of selling costs, for the property, which had a carrying value of
$31 million
at closing.
Leidos Holdings, Inc. Annual Report -
103
Selected Quarterly Financial Data (Unaudited)
Selected financial data (unaudited) for the periods presented was as follows:
|
|
Three Months Ended
|
|||||||||||||||
|
March 30,
2018 |
June 29,
2018 |
September 28,
2018 |
December 28,
2018 |
|||||||||||||
|
|
(in millions, except per share amounts)
|
|||||||||||||||
|
Fiscal 2018
(1)
|
||||||||||||||||
|
Revenues
|
$
|
2,443
|
|
$
|
2,529
|
|
$
|
2,575
|
|
$
|
2,647
|
|
||||
|
Operating income
|
159
|
|
199
|
|
203
|
|
188
|
|
||||||||
|
Net income
|
102
|
|
145
|
|
147
|
|
188
|
|
||||||||
|
Net income attributable to Leidos common stockholders
|
102
|
|
144
|
|
147
|
|
188
|
|
||||||||
|
Basic earnings per share attributable to Leidos common stockholders
(3)
|
$
|
0.67
|
|
$
|
0.95
|
|
$
|
0.97
|
|
$
|
1.27
|
|
||||
|
Diluted earnings per share attributable to Leidos common stockholders
(3)
|
0.66
|
|
0.94
|
|
0.96
|
|
1.25
|
|
||||||||
|
|
Three Months Ended
|
|||||||||||||||
|
March 31,
2017 |
June 30,
2017 |
September 29,
2017 |
December 29,
2017 |
|||||||||||||
|
|
(in millions, except per share amounts)
|
|||||||||||||||
|
Fiscal 2017
(2)
|
|
|
|
|
||||||||||||
|
Revenues
|
$
|
2,580
|
|
$
|
2,571
|
|
$
|
2,503
|
|
$
|
2,516
|
|
||||
|
Operating income
|
141
|
|
166
|
|
151
|
|
101
|
|
||||||||
|
Net income
|
74
|
|
98
|
|
79
|
|
113
|
|
||||||||
|
Net income attributable to Leidos common stockholders
|
72
|
|
98
|
|
82
|
|
114
|
|
||||||||
|
Basic earnings per share attributable to Leidos common stockholders
(3)
|
$
|
0.48
|
|
$
|
0.65
|
|
$
|
0.54
|
|
$
|
0.75
|
|
||||
|
Diluted earnings per share attributable to Leidos common stockholders
(3)
|
0.47
|
|
0.64
|
|
0.53
|
|
0.74
|
|
||||||||
|
(1)
|
The fiscal
2018
quarterly results include acquisition, integration and restructuring costs of
$17 million
,
$8 million
,
$7 million
, and
$5 million
in the first, second, third and fourth quarter, respectively. The fiscal 2018 first quarter results include a
$7 million
tangible asset impairment charge.
|
|
(2)
|
The fiscal
2017
quarterly results include acquisition, integration and restructuring costs of
$32 million
,
$22 million
,
$27 million
, and
$58 million
in the first, second, third, and fourth quarter, respectively. The fiscal
2017
fourth quarter results include a
$33 million
promissory note impairment charge.
|
|
(3)
|
Earnings per share are computed independently for each of the quarters presented and therefore may not sum to the totals for fiscal
2018
and
2017
.
|
Item 9.
Changes in and Disagreements With Accountants on Accounting and Financial Disclosure
None.
Leidos Holdings, Inc. Annual Report -
104
Item 9A.
Controls and Procedures
Evaluation of Disclosure Controls and Procedures
Our management, with the participation of our principal executive officer (our Chairman and Chief Executive Officer) and principal financial officer (our Executive Vice President and Chief Financial Officer), has evaluated the effectiveness of our disclosure controls and procedures (as defined in Rules 13a-15(e) or 15d-15(e) under the Securities Exchange Act of 1934) as of
December 28, 2018
. Based upon that evaluation, our principal executive officer and principal financial officer have concluded that our disclosure controls and procedures are effective to ensure that information required to be disclosed by us in the reports that we file or submit under the Securities Exchange Act of 1934 is recorded, processed, summarized and reported within the time periods specified in the rules and forms of the U.S. Securities Exchange Commission. These disclosure controls and procedures include, without limitation, controls and procedures designed to ensure that information required to be disclosed by us in the reports that we file or submit under the Securities Exchange Act of 1934 is accumulated and communicated to our management, including our principal executive officer and our principal financial officer, as appropriate to allow timely decisions regarding required disclosure.
Changes in Internal Control Over Financial Reporting
There have been no changes in our internal control over financial reporting that occurred in the fourth quarter of the period ended
December 28, 2018
, covered by this Annual Report that materially affected, or are reasonably likely to materially affect, our internal control over financial reporting.
Management’s Report on Internal Control Over Financial Reporting
Our management is responsible for establishing and maintaining adequate internal control over financial reporting. Internal control over financial reporting is a process designed to provide reasonable assurance regarding the reliability of financial reporting and the preparation of financial statements for external purposes in accordance with accounting principles generally accepted in the United States of America.
Our management, with the participation of our principal executive officer and principal financial officer, has evaluated the effectiveness of our internal control over financial reporting as of
December 28, 2018
, based on criteria established in
Internal Control—Integrated Framework (2013)
issued by the Committee of Sponsoring Organizations of the Treadway Commission. Our management has assessed the effectiveness of our internal control over financial reporting as of
December 28, 2018
, and has concluded that our internal control over financial reporting as of that date was effective.
Deloitte & Touche LLP, an independent registered public accounting firm, audited our consolidated financial statements included in this Annual Report on Form 10-K and our internal control over financial reporting, and that firm’s report on our internal control over financial reporting is set forth below.
February 19, 2019
Leidos Holdings, Inc. Annual Report -
105
REPORT OF INDEPENDENT REGISTERED PUBLIC ACCOUNTING FIRM
To the shareholders and the Board of Directors of Leidos Holdings, Inc.
Reston, Virginia
Opinion on Internal Control over Financial Reporting
We have audited the internal control over financial reporting of Leidos Holdings, Inc. and subsidiaries (the "Company") as of
December 28, 2018
, based on criteria established in Internal Control — Integrated Framework (2013) issued by the Committee of Sponsoring Organizations of the Treadway Commission (COSO). In our opinion, the Company maintained, in all material respects, effective internal control over financial reporting as of
December 28, 2018
, based on criteria established in Internal Control — Integrated Framework (2013) issued by COSO.
We have also audited, in accordance with the standards of the Public Company Accounting Oversight Board (United States) (PCAOB), the consolidated financial statements as of and for the year ended
December 28, 2018
, of the Company and our report dated
February 19, 2019
, expressed an unqualified opinion on those financial statements.
Basis for Opinion
The Company’s management is responsible for maintaining effective internal control over financial reporting and for its assessment of the effectiveness of internal control over financial reporting, included in the accompanying Annual Report on Form 10-K. Our responsibility is to express an opinion on the Company’s internal control over financial reporting based on our audit. We are a public accounting firm registered with the PCAOB and are required to be independent with respect to the Company in accordance with the U.S. federal securities laws and the applicable rules and regulations of the Securities and Exchange Commission and the PCAOB.
We conducted our audit in accordance with the standards of the PCAOB. Those standards require that we plan and perform the audit to obtain reasonable assurance about whether effective internal control over financial reporting was maintained in all material respects. Our audit included obtaining an understanding of internal control over financial reporting, assessing the risk that a material weakness exists, testing and evaluating the design and operating effectiveness of internal control based on the assessed risk, and performing such other procedures as we considered necessary in the circumstances. We believe that our audit provides a reasonable basis for our opinion.
Definition and Limitations of Internal Control over Financial Reporting
A company’s internal control over financial reporting is a process designed to provide reasonable assurance regarding the reliability of financial reporting and the preparation of financial statements for external purposes in accordance with generally accepted accounting principles. A company’s internal control over financial reporting includes those policies and procedures that (1) pertain to the maintenance of records that, in reasonable detail, accurately and fairly reflect the transactions and dispositions of the assets of the company; (2) provide reasonable assurance that transactions are recorded as necessary to permit preparation of financial statements in accordance with generally accepted accounting principles, and that receipts and expenditures of the company are being made only in accordance with authorizations of management and directors of the company; and (3) provide reasonable assurance regarding prevention or timely detection of unauthorized acquisition, use, or disposition of the company’s assets that could have a material effect on the financial statements.
Because of its inherent limitations, internal control over financial reporting may not prevent or detect misstatements. Also, projections of any evaluation of effectiveness to future periods are subject to the risk that controls may become inadequate because of changes in conditions, or that the degree of compliance with the policies or procedures may deteriorate.
/s/ Deloitte & Touche LLP
McLean, Virginia
February 19, 2019
Leidos Holdings, Inc. Annual Report -
106
Item 9B.
Other Information
None.
Leidos Holdings, Inc. Annual Report -
107
Item 10.
Directors, Executive Officers and Corporate Governance
For certain information required by Item 10 with respect to executive officers, see "Executive Officers of the Registrant" at the end of Part I of this Annual Report on Form 10-K. For additional information required by Item 10 with respect to executive officers and directors, including audit committee and audit committee financial experts, procedures by which stockholders may recommend nominees to the Board of Directors and compliance with Section 16(a) of the Securities Exchange Act of 1934, see the information set forth under the captions "Proposal 1–Election of Directors," "Corporate Governance" and "Other Information" appearing in the
2019 Proxy Statement
, which required information is incorporated by reference into this Annual Report on Form 10-K.
We have adopted a code of conduct that applies to our principal executive officer and our senior financial officers. A copy of our code of conduct is available on the Investor Relations section of our website free of charge at
www.leidos.com
by clicking on the links entitled "Investors" then "Corporate Governance" and then "Code of Conduct." We intend to post on our website any material changes to or waivers from our code of business ethics. The information on our website is not incorporated by reference into and is not a part of this Annual Report on Form 10-K.
Item 11.
Executive Compensation
For information required by Item 11 with respect to executive compensation and director compensation, see the information set forth under the captions "Compensation Discussion and Analysis," "Executive Compensation" and "Corporate Governance" in the
2019 Proxy Statement
, which is incorporated by reference into this Annual Report on Form 10-K.
For information required by Item 11 with respect to compensation committee interlocks and insider participation, see the information set forth under the caption "Corporate Governance" in the
2019 Proxy Statement
, which is incorporated by reference into this Annual Report on Form 10-K.
Item 12.
Security Ownership of Certain Beneficial Owners and Management and Related Stockholder Matters
For information required by Item 12 with respect to the security ownership of certain beneficial owners and management, see the information set forth under the caption "Other Information" in the
2019 Proxy Statement
, which is incorporated by reference into this Annual Report on Form 10-K.
Information with respect to our equity compensation plans as of
December 28, 2018
, is set forth below:
|
Plan Category
|
(a)
Number of securities
to be issued upon
exercise of
outstanding options,
warrants and rights
|
|
(b)
Weighted-average
exercise price of
outstanding
options, warrants
and rights
|
|
(c)
Number of securities
remaining available
for future issuance
under equity
compensation
plans (excluding
securities reflected
in column (a))
|
|
|||||
|
Equity compensation plans approved by security holders
(1)
|
4,961,505
|
|
(2)
|
$
|
39.41
|
|
(3)
|
14,031,561
|
|
(4)
|
|
|
Equity compensation plans not approved by security holders
(5)
|
—
|
|
|
—
|
|
|
—
|
|
(5)
|
||
|
Total
|
4,961,505
|
|
(2)
|
$
|
39.41
|
|
(3)
|
14,031,561
|
|
|
|
|
(1)
|
The following equity compensation plans approved by security holders are included in this plan category: the 2017 Omnibus Incentive Plan, the 2006 Equity Incentive Plan, as amended, and the 2006 Employee Stock Purchase Plan, as amended.
|
|
(2)
|
Represents (i)
2,493,594
shares of Leidos common stock reserved for future issuance for service-based awards and performance and market-based awards assuming achievement of the target level of performance for unearned performance and market-based awards (does not include an additional
244,927
shares if the maximum level of performance is achieved) and other stock awards under the 2017 Omnibus Incentive Plan and 2006 Equity Incentive Plan, (ii)
37,995
shares of Leidos common stock issuable pursuant to dividend equivalent rights for deferred awards and (iii)
2,429,916
shares of Leidos common stock reserved for future issuance upon the exercise of outstanding options awarded under the 2017 Omnibus Incentive Plan and 2006 Equity Incentive Plan. Does not include shares to be issued pursuant to purchase rights under the 2006 Employee Stock Purchase Plan.
|
|
(3)
|
Does not include shares to be issued for performance-based and other stock awards and shares of stock issuable pursuant to dividend equivalent rights.
|
Leidos Holdings, Inc. Annual Report -
108
|
(4)
|
Represents
9,433,178
and
4,598,383
shares of Leidos common stock under the 2017 Omnibus Incentive Plan and 2006 Employee Stock Purchase Plan, respectively. The maximum number of shares initially available for issuance under the 2017 Omnibus Incentive Plan was
7.5 million
. The 2006 Equity Incentive Plan was amended in June 2012 to provide that the maximum number of shares available for issuance thereunder is
12.5 million
. The 2006 Employee Stock Purchase Plan was amended in September 2016 to provide that the maximum number of shares available for issuance thereunder is
5.0 million
. Those shares (i) that are issued under the 2017 Omnibus Incentive Plan and 2006 Equity Incentive Plan that are forfeited or repurchased at the original purchase price or less or that are issuable upon exercise of awards granted under the plan that expire or become unexercisable for any reason after their grant date without having been exercised in full, (ii) that are withheld from an option or stock award pursuant to a Company-approved net exercise provision, or (iii) that are not delivered to or are award shares surrendered by a holder in consideration for applicable tax withholding will continue to be available for issuance under the 2017 Omnibus Incentive Plan.
|
|
(5)
|
The Management Stock Compensation Plan has not been approved by security holders and is included in this plan category. This plan does not provide for a maximum number of shares available for future issuance. For further information on this plan, see "
Note 19—Stock-Based Compensation
" of the notes to the consolidated financial statements contained within Part II of this Annual Report on Form 10-K.
|
Item 13.
Certain Relationships and Related Transactions, and Director Independence
For information required by Item 13 with respect to certain relationships and related transactions and the independence of directors and nominees, see the information set forth under the caption "Corporate Governance" in the
2019 Proxy Statement
, which is incorporated by reference into this Annual Report on Form 10-K.
Item 14.
Principal Accounting Fees and Services
For information required by Item 14 with respect to principal accounting fees and services, see the information set forth under the caption "Audit Matters" in the
2019 Proxy Statement
, which is incorporated by reference into this Annual Report on Form 10-K.
Leidos Holdings, Inc. Annual Report -
109
Item 15.
Exhibits, Financial Statement Schedules
(a) Documents filed as part of the report:
1. Financial Statements
2. Financial Statement Schedules
Financial statement schedules are omitted because they are not applicable or the required information is shown in our consolidated financial statements or the notes thereto.
3. Exhibits
|
Exhibit
Number |
Description of Exhibit
|
|
|
2.1
|
||
|
2.2
|
||
|
2.3
|
||
|
2.4
|
||
|
2.5
|
||
|
3.1
|
||
|
3.2
|
||
|
4.1**
|
Indenture dated June 28, 2002, between Leidos, Inc. and JPMorgan Chase Bank, as trustee. Incorporated by reference to Exhibit 4.2 to our Current Report on Form 8-K filed with the SEC on July 3, 2002. (SEC File No. 000-12771)
|
|
|
4.2
|
||
|
4.3
|
||
|
10.1*
|
||
|
10.2*
|
||
Leidos Holdings, Inc. Annual Report -
110
|
Exhibit
Number |
Description of Exhibit
|
|
|
10.3*
|
||
|
10.4*
|
||
|
10.5*
|
||
|
10.6*
|
||
|
10.7*
|
||
|
10.8*
|
||
|
10.9*
|
||
|
10.10*
|
||
|
10.11*
|
||
|
10.12*
|
||
|
10.13*
|
||
|
10.14*
|
||
|
10.15*
|
||
|
10.16*
|
||
|
10.17*
|
||
|
10.18*
|
||
|
10.19*
|
||
|
10.20*
|
||
Leidos Holdings, Inc. Annual Report -
111
|
Exhibit
Number |
Description of Exhibit
|
|
|
10.21*
|
||
|
10.22*
|
||
|
10.23*
|
||
|
10.24*
|
||
|
10.25*
|
||
|
10.26
|
||
|
10.27
|
||
|
10.28
|
||
|
10.29
|
||
|
10.30
|
||
|
10.31
|
||
|
10.32
|
||
|
10.33
|
||
|
10.34
|
||
Leidos Holdings, Inc. Annual Report -
112
|
Exhibit
Number |
Description of Exhibit
|
|
|
10.35
|
||
|
10.36
|
|
|
|
10.37
|
||
|
10.38
|
||
|
10.39
|
||
|
10.40
|
||
|
10.41
|
||
|
10.42
|
||
|
10.43
|
||
|
10.44
|
||
|
21
|
||
|
23.1
|
||
|
31.1
|
||
|
31.2
|
||
|
32.1
|
||
|
32.2
|
||
|
99.1
|
||
Leidos Holdings, Inc. Annual Report -
113
|
Exhibit
Number |
Description of Exhibit
|
|
|
99.2†
|
||
|
99.3
|
||
|
99.4
|
||
|
99.5
|
||
|
99.6
|
||
|
99.7†
|
||
|
101
|
Interactive Data File.
|
|
|
*
|
Executive Compensation Plans and Arrangements
|
** Paper filing
|
†
|
Confidential treatment has been granted with respect to certain portions of these exhibits
|
Item 16.
Form 10-K Summary
None.
Leidos Holdings, Inc. Annual Report -
114
SIGNATURES
Pursuant to the requirements of Section 13 or 15(d) of the Securities Exchange Act of 1934, the registrant has duly caused this report to be signed on its behalf by the undersigned, thereunto duly authorized.
|
Leidos Holdings, Inc.
|
|
|
By
|
/s/ James C. Reagan
|
|
|
James C. Reagan
Executive Vice President and Chief Financial Officer
|
Dated:
February 19, 2019
Pursuant to the requirements of the Securities Exchange Act of 1934, this report has been signed below by the following persons on behalf of Leidos Holdings, Inc., in the capacities and on the dates indicated.
|
Signature
|
Title
|
Date
|
|
/s/ Roger A. Krone
|
Principal Executive Officer
|
February 19, 2019
|
|
Roger A. Krone
|
||
|
/s/ James C. Reagan
|
Principal Financial Officer
|
February 19, 2019
|
|
James C. Reagan
|
||
|
/s/ Ranjit S. Chadha
|
Principal Accounting Officer
|
February 19, 2019
|
|
Ranjit S. Chadha
|
||
|
/s/ Gregory R. Dahlberg
|
Director
|
February 19, 2019
|
|
Gregory R. Dahlberg
|
||
|
/s/ David G. Fubini
|
Director
|
February 19, 2019
|
|
David G. Fubini
|
||
|
/s/ Miriam E. John
|
Director
|
February 19, 2019
|
|
Miriam E. John
|
||
|
/s/ Frank Kendall III
|
Director
|
February 19, 2019
|
|
Frank Kendall III
|
||
|
/s/ Robert C. Kovarik, Jr.
|
Director
|
February 19, 2019
|
|
Robert C. Kovarik, Jr.
|
||
|
/s/ Harry M. J. Kraemer, Jr.
|
Director
|
February 19, 2019
|
|
Harry M. J. Kraemer, Jr.
|
||
|
/s/ Gary S. May
|
Director
|
February 19, 2019
|
|
Gary S. May
|
||
|
/s/ Surya N. Mohapatra
|
Director
|
February 19, 2019
|
|
Surya N. Mohapatra
|
||
|
/s/ Lawrence C. Nussdorf
|
Director
|
February 19, 2019
|
|
Lawrence C. Nussdorf
|
||
|
/s/ Robert S. Shapard
|
Director
|
February 19, 2019
|
|
Robert S. Shapard
|
||
|
/s/ Susan M. Stalnecker
|
Director
|
February 19, 2019
|
|
Susan M. Stalnecker
|
||
|
/s/ Noel B. Williams
|
Director
|
February 19, 2019
|
|
Noel B. Williams
|
||
Leidos Holdings, Inc. Annual Report -
115
TABLE OF CONTENTS
Part IPart IIItem 5. Market For Registrant's Common Equity, Related Stockholder Matters and Issuer Purchases Of Equity SecuritiesNote 18 Earnings Per ShareItem 6. Selected Financial DataNote 6 AcquisitionsNote 8 Restructuring ExpensesNote 12 Property, Plant and EquipmentItem 7. Management S Discussion and Analysis Of Financial Condition and Results Of OperationsNote 24 Business SegmentsNote 15 DebtNote 19 Stock-based CompensationNote 1 Nature Of Operations and Basis Of PresentationNote 20 Income TaxesNote 4 RevenuesNote 7 DivestituresNote 14 Derivative InstrumentsNote 26 CommitmentsNote 21 Retirement PlansNote 22 LeasesNote 25 ContingenciesNote 2 Accounting StandardsItem 7A. Quantitative and Qualitative Disclosures About Market RiskItem 8. Financial Statements and Supplementary DataNote 3 Summary Of Significant Accounting PoliciesNote 9 ReceivablesNote 5 Contract Assets and LiabilitiesNote 10 GoodwillNote 13 Fair Value MeasurementsNote 11 Intangible AssetsNote 27 Subsequent EventsNote 16 Accumulated Other Comprehensive (loss) IncomeNote 17 Composition Of Certain Financial Statement CaptionsNote 18 Earnings Per Share ("eps")Note 23 Supplementary Cash Flow Information and Restricted CashItem 9. Changes in and Disagreements with Accountants on Accounting and Financial DisclosureItem 9A. Controls and ProceduresItem 9B. Other InformationPart IIIItem 10. Directors, Executive Officers and Corporate GovernanceItem 11. Executive CompensationItem 12. Security Ownership Of Certain Beneficial Owners and Management and Related Stockholder MattersItem 13. Certain Relationships and Related Transactions, and Director IndependenceItem 14. Principal Accounting Fees and ServicesPart IVItem 15. Exhibits, Financial Statement SchedulesItem 16. Form 10-k Summary