LEAR CORP
10-Ks and 10-Qs
|
|
|
|
|
|
|
|
|
|
|
|
|
|
|
|
|
|
|
|
|
|
|
|
|
|
|
|
|
|
|
|
|
|
|
|
|
|
|
|
|
|
|
|
|
|
|
|
|
|
|
|
|
|
|
|
|
|
|
UNITED STATES SECURITIES AND EXCHANGE COMMISSION
Washington, D.C. 20549
FORM 10-K
(Mark One)
|
x
|
ANNUAL REPORT PURSUANT TO SECTION 13 OR 15(D) OF THE SECURITIES EXCHANGE ACT OF 1934
|
For the fiscal year ended
December 31, 2016
.
|
¨
|
TRANSITION REPORT PURSUANT TO SECTION 13 OR 15(D) OF THE SECURITIES EXCHANGE ACT OF 1934
|
For the transition period from
to
.
Commission file number: 1-11311

(Exact name of registrant as specified in its charter)
|
Delaware
|
|
13-3386776
|
|
(State or other jurisdiction of
incorporation or organization)
|
|
(I.R.S. Employer
Identification No.)
|
|
21557 Telegraph Road, Southfield, MI
|
|
48033
|
|
(Address of principal executive offices)
|
|
(Zip code)
|
Registrant’s telephone number, including area code: (248) 447-1500
Securities registered pursuant to Section 12(b) of the Act:
|
Title of each class
|
|
Name of each exchange on which registered
|
|
Common Stock, par value $0.01 per share
|
|
New York Stock Exchange
|
Securities registered pursuant to Section 12(g) of the Act: None
Indicate by check mark if the registrant is a well-known seasoned issuer, as defined in Rule 405 of the Securities Act. Yes
x
No
¨
Indicate by check mark if the registrant is not required to file reports pursuant to Section 13 or Section 15(d) of the Act. Yes
¨
No
x
Indicate by check mark whether the registrant (1) has filed all reports required to be filed by Section 13 or 15(d) of the Act during the preceding 12 months (or for such shorter period that the registrant was required to file such reports) and (2) has been subject to such filing requirements for the past 90 days. Yes
x
No
¨
Indicate by check mark whether the registrant has submitted electronically and posted on its corporate Web site, if any, every Interactive Data File required to be submitted and posted pursuant to Rule 405 of Regulation S-T (§232.405 of this chapter) during the preceding 12 months (or for such shorter period that the registrant was required to submit and post such files). Yes
x
No
¨
Indicate by check mark if disclosure of delinquent filers pursuant to Item 405 of Regulation S-K is not contained herein and will not be contained, to the best of registrant’s knowledge, in definitive proxy or information statements incorporated by reference in Part III of this Form 10-K or any amendment to this Form 10-K.
x
Indicate by check mark whether the registrant is a large accelerated filer, an accelerated filer, a non-accelerated filer or a smaller reporting company. See the definitions of "large accelerated filer," "accelerated filer" and "smaller reporting company" in Rule 12b-2 of the Exchange Act.
|
Large accelerated filer
|
x
|
Accelerated filer
|
¨
|
Non-accelerated filer
|
o
|
Smaller reporting company
|
o
|
|
(Do not check if a smaller reporting company)
|
|||||||
Indicate by check mark whether the registrant is a shell company (as defined in Rule 12b-2 of the Act). Yes
¨
No
x
As of
July 2, 2016
, the aggregate market value of the registrant’s common stock, par value $0.01 per share, held by non-affiliates of the registrant was
$7,333,554,195
. The closing price of the common stock on July 2, 2016, as reported on the New York Stock Exchange, was $102.81 per share.
As of
February 3, 2017
, the number of shares outstanding of the registrant’s common stock was
69,431,643
shares.
DOCUMENTS INCORPORATED BY REFERENCE
Certain sections of the registrant’s Notice of Annual Meeting of Stockholders and Definitive Proxy Statement on Schedule 14A for its Annual Meeting of Stockholders to be held in May
2017
, as described in the Cross Reference Sheet and Table of Contents included herewith, are incorporated by reference into Part III of this Report.
LEAR CORPORATION AND SUBSIDIARIES
CROSS REFERENCE SHEET AND TABLE OF CONTENTS
|
|
|
Page Number
or Reference
|
|
ITEM 1.
|
||
|
ITEM 1A.
|
||
|
ITEM 1B.
|
||
|
ITEM 2.
|
||
|
ITEM 3.
|
||
|
ITEM 4.
|
||
|
SUPPLEMENTARY ITEM.
|
||
|
ITEM 5.
|
||
|
ITEM 6.
|
||
|
ITEM 7.
|
||
|
ITEM 7A.
|
Quantitative and qualitative disclosures about market risk (included in Item 7)
|
|
|
ITEM 8.
|
||
|
ITEM 9.
|
||
|
ITEM 9A.
|
||
|
ITEM 9B.
|
||
|
ITEM 10.
|
||
|
ITEM 11.
|
||
|
ITEM 12.
|
||
|
ITEM 13.
|
||
|
ITEM 14.
|
||
|
ITEM 15.
|
||
________________________
|
(1)
|
Certain information is incorporated by reference, as indicated below, to the registrant’s Notice of Annual Meeting of Stockholders and Definitive Proxy Statement on Schedule 14A for its Annual Meeting of Stockholders to be held in May 2017 (the "Proxy Statement").
|
|
(2)
|
A portion of the information required is incorporated by reference to the Proxy Statement sections entitled "Election of Directors" and "Directors and Corporate Governance."
|
|
(3)
|
Incorporated by reference to the Proxy Statement sections entitled "Directors and Corporate Governance — Director Compensation," "Compensation Discussion and Analysis," "Executive Compensation," "Compensation Committee Interlocks and Insider Participation" and "Compensation Committee Report."
|
|
(4)
|
A portion of the information required is incorporated by reference to the Proxy Statement section entitled "Directors and Corporate Governance — Security Ownership of Certain Beneficial Owners, Directors and Management."
|
|
(5)
|
Incorporated by reference to the Proxy Statement sections entitled "Certain Relationships and Related Party Transactions" and "Directors and Corporate Governance — Independence of Directors."
|
|
(6)
|
Incorporated by reference to the Proxy Statement section entitled "Fees of Independent Accountants."
|
In this Report, when we use the terms the "Company," "Lear," "we," "us" and "our," unless otherwise indicated or the context otherwise requires, we are referring to Lear Corporation and its consolidated subsidiaries. A substantial portion of the Company’s operations are conducted through subsidiaries controlled by Lear Corporation. The Company is also a party to various joint venture arrangements. Certain disclosures included in this Report constitute forward-looking statements that are subject to risks and uncertainties. See Item 1A, "Risk Factors," and Part II
—
Item 7, "Management’s Discussion and Analysis of Financial Condition and Results of Operations
—
Forward-Looking Statements."
BUSINESS OF THE COMPANY
General
Lear Corporation is a leading Tier 1 supplier to the global automotive industry. We supply seating, electrical distribution systems and electronic modules, as well as related sub-systems, components and software, to virtually every major automotive manufacturer in the world. We have
243
manufacturing, engineering and administrative locations in
37
countries and are continuing to grow our business in all automotive producing regions of the world, both organically and through complementary acquisitions. Our manufacturing footprint reflects more than
143
facilities in
22
low cost countries.
We use our product, design and technological expertise, global reach and competitive manufacturing footprint to achieve the following financial goals and objectives with the aim to maximize shareholder value:
|
•
|
Continue to deliver profitable growth, balancing risks and returns;
|
|
•
|
Maintain a strong balance sheet with investment grade credit metrics; and
|
|
•
|
Consistently return excess cash to our shareholders.
|
Our business is organized under two reporting segments: Seating and E-Systems (formerly Electrical). Each of these segments has a varied product range across a number of component categories:
|
•
|
Seating
— Our seating segment consists of the design, development, engineering, just-in-time assembly and delivery of complete seat systems, as well as the design, development, engineering and manufacture of all major seat components, including seat covers and surface materials such as leather and fabric, seat structures and mechanisms, seat foam and headrests. Further, we have capabilities in active sensing and comfort for seats, utilizing electronically controlled sensor and adjustment systems and internally developed algorithms. Through a strategic investment, we also offer thermoelectric seat heating and cooling capabilities.
|
|
◦
|
E-Systems
— Our E-Systems segment consists of the design, development, engineering and manufacture of complete electrical distribution systems that route electrical signals and manage electrical power within the vehicle for traditional vehicle architectures, as well as high power and hybrid electric systems. Key components in the electrical distribution system include wiring harnesses, terminals and connectors and junction boxes, including components for high power and hybrid electric systems. We also design, develop, engineer and manufacture sophisticated electronic control modules that facilitate signal, data and power management within the vehicle, as well as associated software. We have added capabilities in wireless communication modules and cybersecurity that securely process various signals to, from and within the vehicle, as well as road infrastructure.
|
We serve the worldwide automotive and light truck market in both our seating and E-Systems segments. We have automotive content on over
400
vehicle nameplates worldwide and serve all of the world’s major automotive manufacturers across our businesses and various component categories in both our seating and E-Systems segments. It is common to have both seating and electrical content on the same and multiple vehicle platforms with a single customer. In addition, our electrical components are often integrated into our complete seat systems. Our businesses benefit globally from leveraging common operating standards and disciplines, including world-class development and manufacturing processes, as well as common customer support and regional infrastructures. Our core capabilities are shared across component categories and include high-precision manufacturing and assembly with short lead times, management of complex supply chains, global engineering and program management skills, the agility to establish and/or move facilities quickly and a unique customer-focused culture. Our businesses utilize proprietary, industry-specific processes and standards, leverage common low-cost engineering centers and share centralized operating support functions, such as logistics, supply chain management, quality and health and safety, as well as all major administrative functions.
3
Available Information on our Website
Our website address is http://www.lear.com. We make available on our website, free of charge, the periodic reports that we file with or furnish to the Securities and Exchange Commission ("SEC"), as well as all amendments to these reports, as soon as reasonably practicable after such reports are filed with or furnished to the SEC. We also make available on our website or in printed form upon request, free of charge, our Corporate Governance Guidelines, Code of Business Conduct and Ethics (which includes specific provisions for our executive officers), charters for the standing committees of our Board of Directors and other information related to the Company. We are not including the information contained on our website as a part of, or incorporating it by reference into, this Report.
The public may read and copy any materials that we file with the SEC at the SEC’s Public Reference Room at 100 F Street, N.E., Washington D.C. 20549. The public may obtain information about the operation of the Public Reference Room by calling the SEC at 1-800-SEC-0330. The SEC maintains an internet site (http://www.sec.gov) that contains reports, proxy and information statements and other information related to issuers that file electronically with the SEC.
History
Lear was founded in Detroit in 1917 as American Metal Products, a manufacturer of seating assemblies and other components for the automotive and aircraft industries, and was incorporated in Delaware in 1987. Through a management-led buyout in 1988, Lear Corporation established itself as a privately-held seat assembly operation for the North American automobile market with annual sales of approximately $900 million. We completed an initial public offering in 1994 and developed into a global supplier through organic growth and a series of acquisitions.
In May 1999, we acquired UT Automotive, Inc. ("UT Automotive") for a purchase price of approximately $2.3 billion from United Technologies Corporation. UT Automotive was a leading supplier of automotive electrical distribution systems. The acquisition of UT Automotive represented our entry into automotive electrical and electronic systems and was the basis for our current E-Systems segment. In addition to electrical distribution systems, UT Automotive produced a broad portfolio of automotive interior products, which were subsequently included in the transfer of substantially all of the assets of our interior business to International Automotive Components Group in October 2006 (European assets) and March 2007 (North American assets).
We have subsequently augmented our internal growth plans with selective acquisitions to expand our component capabilities and global footprint, as well as expand our technology portfolio. In May 2012, we acquired Guilford Mills, a leading supplier of automotive seat and interior fabric, from Cerberus Capital Management, L.P., for approximately $243 million. In January 2015, we acquired Everett Smith Group, Ltd., the parent company of Eagle Ottawa, LLC ("Eagle Ottawa"), the world's leading provider of leather for the automotive industry, for approximately $844 million. In August 2015, we acquired intellectual property and technology from Autonet Mobile, a developer of wireless communication software and devices for automotive applications. In November 2015, we completed the acquisition of Arada Systems Inc., an automotive technology company that specializes in vehicle-to-vehicle ("V2V") and vehicle-to-infrastructure ("V2I" and together with V2V, "V2X") communications. In December 2016, we acquired AccuMED Holdings Corp. ("AccuMED"), a privately-held developer and manufacturer of specialty fabrics. AccuMED was founded in 1974 and has an experienced management team, modern facilities with a low-cost footprint and a reputation for superior quality and innovation. Strategically, AccuMED provides innovative fabric processing technology that will benefit our automotive fabric operations, and it adds critical mass to our existing non-automotive fabric products.
Industry and Strategy
We supply all vehicle segments of the automotive light vehicle original equipment market in every major automotive producing region in the world. Our sales are driven by the number of vehicles produced by the automotive manufacturers, which is ultimately dependent on consumer demand for automotive vehicles, and our content per vehicle. Global automotive industry production volumes improved 2% in
2015
from the prior year and another
5%
in
2016
to a record
91.2 million
units.
4
Details on light vehicle production in certain key regions for
2016
and
2015
are provided below. Our actual results are impacted by the specific mix of products within each market, as well as other factors described in Item 1A, "Risk Factors."
|
(In thousands of units)
|
2016
(1)
|
2015
(1, 2)
|
% Change
|
||||
|
North America
|
17,849.3
|
|
17,495.4
|
|
2%
|
||
|
Europe and Africa
|
22,287.8
|
|
21,528.1
|
|
4%
|
||
|
Asia
|
46,987.2
|
|
43,942.4
|
|
7%
|
||
|
South America
|
2,598.8
|
|
2,871.2
|
|
(9)%
|
||
|
Other
|
1,503.8
|
|
1,258.7
|
|
19%
|
||
|
Total
|
91,226.9
|
|
87,095.8
|
|
5%
|
||
|
(1)
|
Production data based on IHS Automotive for vehicle weights up to 3.5 tons.
|
|
(2)
|
Production data for
2015
has been updated to reflect actual production levels.
|
Details on light vehicle production in certain emerging markets for
2016
and
2015
are provided below.
|
(In thousands of units)
|
2016
(1)
|
2015
(1, 2)
|
% Change
|
||||
|
China
|
25,649.2
|
|
22,497.6
|
|
14%
|
||
|
India
|
4,135.8
|
|
3,775.4
|
|
10%
|
||
|
Brazil
|
2,121.8
|
|
2,330.0
|
|
(9)%
|
||
|
Russia
|
1,191.7
|
|
1,287.9
|
|
(7)%
|
||
|
(1)
|
Production data based on IHS Automotive for vehicle weights up to 3.5 tons.
|
|
(2)
|
Production data for
2015
has been updated to reflect actual production levels.
|
Details on our sales in certain key regions for
2016
and
2015
are provided below.
|
(In millions)
|
2016
|
2015
|
% Change
|
||||||
|
North America
|
$
|
7,523.6
|
|
$
|
7,755.7
|
|
(3)%
|
||
|
Europe and Africa
|
7,051.8
|
|
6,756.1
|
|
4%
|
||||
|
Asia
|
3,444.6
|
|
3,235.5
|
|
6%
|
||||
|
South America
|
537.6
|
|
464.1
|
|
16%
|
||||
|
Total
|
$
|
18,557.6
|
|
$
|
18,211.4
|
|
2%
|
||
|
China (consolidated)
|
$
|
2,277.6
|
|
$
|
2,141.9
|
|
6%
|
||
|
China (non-consolidated)
|
1,598.6
|
|
1,508.0
|
|
6%
|
||||
A growing trend toward crossover and sport utility vehicles has benefited our business, as our content on such vehicles can be significantly higher than average, particularly in our seating segment. Crossover and sport utility vehicle production has grown to approximately 30% of total vehicle production in 2016, up from 17% of total vehicle production five years ago. China has been a major driver of this trend, where crossover and sport utility vehicle production now comprises approximately 35% of total vehicle production, up from 11% of total vehicle production five years ago.
Key trends that specifically affect our business include automotive manufacturers’ utilization of global vehicle platforms, increasing demand for luxury and performance features, including increasing levels of electrical and electronic content, and China’s emergence as the single largest major automotive market in the world with above average long-term growth expectations.
Our strategy is built on addressing these trends and the major imperatives for success as an automotive supplier: quality, cost and efficiency and innovation and technology. We have expanded key component and software capabilities through organic investment and acquisitions to ensure a full complement of the highest quality solutions for our customers. We have restructured, and continue to align, our manufacturing and engineering footprint to attain a leading competitive position globally. We have established or expanded activities in new and growing markets, especially China, in support of our customers’ growth and global platform initiatives. These initiatives have helped us achieve our financial goals overall, as well as a more balanced regional, customer and vehicle segment diversification in our business.
In addition, we believe that the following mega-trends are likely to be at the forefront of our industry for the foreseeable future with each of these trends advancing and converging toward autonomous vehicles:
5
|
•
|
Connectivity
— Customer and consumer demand to have constant communication and information exchange. This trend began with consumer demand to extend and integrate their mobile connectivity into the vehicle by connecting mobile devices with vehicle infotainment systems. Connectivity requirements will continue to grow as we believe that vehicles will increasingly have direct communication with cellular networks, infrastructure, satellites and other vehicles in the grid to enable more advanced safety and fuel efficiency functionality. Vehicles are effectively becoming smart devices on wheels as the automobile is increasingly becoming a platform connected to various types of communication networks. We expect these trends to continue, making the vehicle a constantly connected device, receiving and transmitting data through a variety of signals, which communicate directly with the on-board vehicle network.
|
|
•
|
Safety
— Customer and consumer demand for safety features and systems that protect vehicle occupants when a crash occurs, and also, with an increasing prevalence, for advanced driver assistance systems that proactively respond to driving situations to reduce the likelihood or severity of a crash.
|
|
•
|
Efficiency
— Customer and consumer demand for more energy efficient vehicles that meet increasingly strict fuel economy and emission standards and reduce the environmental impact of automobiles. This requires further use of electronically controlled powertrains and related components to improve fuel efficiency, adoption of alternative energy powertrains, such as hybrid, electric and other powertrain technologies that facilitate high power electrification of the vehicle, and use of lighter weight materials throughout the car.
|
These mega-trends have become widely accepted and also are attracting new, non-traditional entrants to the automotive industry that are leveraging technology, vehicle electrification and consumer relationships to exploit growth opportunities in the industry. Regulation is also a major influence with these mega-trends, as government mandates (e.g., for vehicles to meet minimum fuel economy and emissions standards or be equipped with certain safety-related components) are driving vehicle design and technology plans. For example, in December 2016, the U.S. Department of Transportation issued a proposed rule that would advance the deployment of connected vehicle technologies throughout the U.S. light vehicle fleet. The proposed rule would require V2V communication technology on all new light-duty vehicles, enabling a multitude of new crash-avoidance applications that, once fully deployed, could prevent hundreds of thousands of crashes every year by helping vehicles “talk” to each other.
We are well positioned for growth by capitalizing on these mega-trends as we supply high value systems and components that drive critical functionality and core elements of the vehicle’s electrical architecture and design. The systems and components that we design, develop and manufacture facilitate connectivity of various vehicle systems, impact a vehicle’s safety and crashworthiness and support more fuel efficient alternative powertrains. Many of our systems and components also directly impact the consumer, providing us with the opportunity to offer our automotive customers technology, solutions and designs that will differentiate their vehicles in the consumer marketplace.
We are well positioned to directly participate in the connectivity mega-trend as we design, develop and supply systems, components and software that connect the various electrical and electronic systems within the vehicle into integrated on-board power and data communication networks. We further have the technology and expertise to wirelessly and securely connect these on-board vehicle networks and systems with external networks over various standards and protocols. This expertise allows us to offer our automotive customers electronic modules, such as connected gateway modules, that offer functionality such as over-the-air software updates or cellular communication of vehicle performance data to the automotive manufacturers, their dealers or the vehicle owners. Our expertise in dedicated short-range communications ("DSRC") technology allows us to provide in-vehicle and roadside modules and software that facilitate direct, high speed communication between vehicles and road infrastructure. Importantly, we have expertise in cybersecurity, including architectures, designs and techniques that promote highly secure transmission of data to, from and within the vehicle, as well as road infrastructure.
Furthermore, a seat is an active part of the vehicle safety system. As a result of our innovative product design and technology capabilities, we are able to provide seats with enhanced safety features, such as the active head restraint and seat structures that withstand collision impact well in excess of what is demanded by regulatory agencies. We have developed products and materials to reduce cost and enhance seat design and packaging flexibility, including our mini recliners and micro adjust tracks. Another way in which we are well-positioned to benefit from this mega-trend related growth is our belief that the seat system will become increasingly more sophisticated, dynamic and connected to both the occupants and the vehicle. The seat is the logical focal point for monitoring the driver and passenger and for facilitating feedback between the vehicle and the occupants. Our capabilities in DSRC and other V2X communications protocols and applications position us to provide high speed communication between vehicles, even in extreme weather conditions, potentially reducing crashes through real-time advisories alerting drivers to imminent hazards in the roadway ahead, including other vehicles on a potential path for collision.
Continued growth in more fuel efficient, complex and electronically controlled powertrains is helping to drive content growth in the vehicle's electrical distribution system. The emergence and continued development of alternative energy powertrains, including electric, hybrid electric, 48-volt and other technologies, is driving growth in high power electric systems and
6
components. Hybrid and electric vehicles incorporate both high power and low power components. As a result, they offer a significant incremental content opportunity for us. These trends all support continued growth in electrical and electronic content on the vehicle, as well as associated software. This content growth will require far more complex vehicle electrical architectures. Our significant experience designing and manufacturing highly integrated and standardized architectures that optimize size, performance and quality leaves us well positioned to take advantage of the growth in electrical content and the increasingly complex architectures.
We believe that the convergence of these mega-trends and eventual wide-spread adoption of autonomous vehicles will benefit both our seating and E-Systems segments. We believe that autonomous vehicles will have seat designs and requirements that are far more flexible and demanding in both autonomous and piloted driving states. Further, more active monitoring of the driver and the driver’s position and physical state will be required to manage the transitions between automonous and piloted driving conditions. We also believe that autonomous vehicles will not only need to be fully connected and networked to maximize their safety and efficiency, they will have much higher levels of power consumption to support the array of sensors and processing power required to operate such vehicles.
Seating Segment
Lear is a recognized global leader in complete automotive seat systems and key individual seat components. The seating segment consists of the design, development, engineering, just-in-time assembly and delivery of complete seat systems, as well as the design, development, engineering and manufacture of all major seat components, including seat covers and surface materials such as leather and fabric, seat structures and mechanisms, seat foam and headrests, as well as seating-related electrical and electronics (including software products). We have the most complete set of component offerings of any automotive seating supplier and are a market leader in every automotive producing market in the world. Further, we have expertise and are building capabilities in seat comfort technologies, including heating and cooling. Overall, our global manufacturing and engineering expertise, low-cost footprint, complete component capabilities, quality leadership and strong customer relationships provide us with a solid platform for future growth in this segment.
We produce seat systems that are fully assembled and ready for installation in automobiles and light trucks. Seat systems are generally designed and engineered for specific vehicle models or platforms. We develop seat systems and components for all vehicle segments from compact cars to full-size sport utility vehicles. We are the world leader in luxury and performance automotive seating, providing craftsmanship, elegance in design, use of innovative materials and industry-leading technology required by premium brands, including Alfa Romeo, Audi, BMW, Cadillac, Ferrari, Jaguar Land Rover, Lamborghini, Lincoln, Maserati, Mercedes-Benz and Porsche.
We have been executing a strategy for vertical integration of key seat components to enhance growth, improve quality, increase profitability and support our current market position in just-in-time seat assembly. In this regard, our capabilities in seat structures and mechanisms include complete development and manufacturing capabilities in every major automotive producing region in the world. In addition, we have developed standardized seat structures and mechanisms that can be adapted to multiple segments to minimize investment costs. We believe that our low-cost manufacturing footprint in seat structures and mechanisms and our precision engineered seat mechanism expertise are competitive advantages.
We have also expanded our seat cover operations, including precision cutting, assembly, sewing and lamination of seat fabric, in low-cost markets, entered the fabric business (largely through our acquisition of Guilford Performance Textiles) and added industry-leading leather design, development and manufacturing capabilities (through our acquisition of Eagle Ottawa). We can provide globally a full range of seat cover capabilities and design solutions, including the use of unique leather and fabric applications. We believe that the combination of these capabilities in seating surface materials leads the industry.
Craftsmanship and Design
We believe that our broad portfolio of capabilities, including advanced design and material integration skills, is a differentiating competitive advantage for us. The breadth of our portfolio and depth of our design expertise allow us to have early involvement in the automotive manufacturer’s design process and the opportunity to better integrate all seating components to provide differentiated comfort, quality and overall value for the end consumer. We are leveraging our unique position to be an industry leader in differentiated design through the creation of a Center for Craftsmanship. This is a dedicated studio for customer interface where designers and engineers work collaboratively to create innovative solutions early in the design process. We have also developed a proprietary craftsmanship process called Harmonic Precision that synthesizes all of our component expertise and technologies with our customers’ design visions. We believe that our unmatched component capabilities and design know-how, combined with our global manufacturing presence, enable us to be uniquely positioned to bring innovative designs into production with the highest level of craftsmanship.
7
Intelligent Seating (INTU
TM
Seating)
The seat is emerging as an integral device facilitating the direct connection between drivers and passengers and the vehicle. This direct connection will increasingly support the functionality of connected and autonomous vehicles. We are the only seating supplier with both global capabilities in all major seat components and global electronics development (including software), manufacturing and integration. We believe that the seat will increasingly integrate electronics, not only for motorized control, but for dynamic sensing and response. We have developed active sensing and comfort seat capabilities, utilizing electronically controlled sensor and adjustment systems and internally developed algorithms. These seat designs automatically and constantly adjust the seat's cushioning and support based on the occupant’s position and ideal alignment for health and wellness. We also have developed technologies that will monitor certain bio-metric readings through seat sensors with a high level of accuracy and reliability. We believe that intelligent and dynamic seating solutions, which we call INTU
TM
Seating, will provide future benefits as consumers and automotive manufacturers demand seats that can sense key attributes of a driver and passenger and communicate these attributes within the vehicle network, as well as to external networks. Our seats will intuitively anticipate and dynamically adjust to the occupant's needs and preferences related to posture, health and wellness, comfort and safety. We believe that the seat will increasingly become a more dynamic and integrated system that will actively react to both the driver and driving conditions, particularly with the advent of autonomous vehicles. Such trends will promote increased levels of electrical and electronic integration into the seat.
Manufacturing
Our seat assembly facilities use lean manufacturing techniques, and our finished products are delivered to the automotive manufacturers on a just-in-time basis, matching our customers’ exact build specifications for a particular day, shift and sequence thereby reducing inventory levels. These facilities are typically located adjacent to or near our customers’ manufacturing and assembly sites. Increasingly, we are utilizing component and sub-assembly designs that allow us to drive higher efficiencies in our seat assembly facilities and further integrate certain assembly activities with our core component manufacturing operations. Our seat components, including recliner mechanisms, seat tracks and seat trim covers, leather and fabric are manufactured in batches, typically utilizing facilities in low-cost regions.
Financial Summary
A summary of revenues from external customers and other financial information for our seating segment is shown below. For additional information regarding the operating results of our seating segment, see Item 7, "Management’s Discussion and Analysis of Financial Condition and Results of Operations - Results of Operations." For additional information regarding Lear’s total sales and long-lived assets by geographic area, as well as customer concentrations, see Note
12
, "
Segment Reporting
," to the consolidated financial statements included in this Report. The top five customers of this segment are: General Motors, Ford, BMW, Fiat Chrysler and Daimler.
|
(In millions)
|
2016
|
2015
|
2014
|
||||||||
|
Revenues from external customers
|
$
|
14,356.7
|
|
$
|
14,098.5
|
|
$
|
13,310.6
|
|
||
|
Segment earnings
(1)
|
1,136.0
|
|
907.0
|
|
655.2
|
|
|||||
|
Depreciation and amortization
|
258.1
|
|
239.3
|
|
199.8
|
|
|||||
|
Capital expenditures
|
341.6
|
|
317.2
|
|
268.9
|
|
|||||
|
Total assets
|
6,199.2
|
|
5,780.7
|
|
4,855.6
|
|
|||||
|
(1)
|
As discussed in Note
2
, "
Summary of Significant Accounting Policies
— Segment Reporting," segment earnings represents pretax income before equity in net income of affiliates, interest expense and other expense.
|
Competition
Based on independent market studies and management estimates, we believe that we hold the #2 position in seat systems assembly globally on the basis of revenue with strong positions in all major markets. We estimate the global seat systems market at more than $64 billion in
2016
. We believe that we are also among the leading suppliers of various components produced for complete seat systems.
Our primary competitor in this segment globally is Adient, plc. Other competitors in this segment include Faurecia S.A., Toyota Boshoku Corporation, TS Tech Co., Ltd. and Magna International Inc., which have varying market presence depending on the region, country or automotive manufacturer. Peugeot S.A., Toyota Motor Corporation and Honda Motor Co. Ltd. hold equity ownership positions in Faurecia S.A., Toyota Boshoku Corporation and TS Tech Co., Ltd., respectively. Other automotive manufacturers maintain a presence in the seat systems market through wholly owned subsidiaries or in-house operations. In seat components, we compete with the seat systems suppliers identified above, as well as certain suppliers that specialize in particular components.
8
Technology
We maintain state-of-the-art testing, instrumentation and data analysis capabilities. We own industry-leading seat validation test centers featuring crashworthiness, durability and full acoustic and sound quality testing capabilities. Together with computer-controlled data acquisition and analysis capabilities, these centers provide precisely controlled laboratory conditions for sophisticated testing of parts, materials and systems. In addition, we incorporate many convenience, comfort and safety features into our designs, including advanced whiplash prevention concepts, integrated restraint seat systems and side impact airbags. We also invest in our computer-aided engineering design and computer-aided manufacturing systems.
We also are investing in seat heating and cooling capabilities and technologies. We are building expertise in this area and entered into a strategic partnership for thermoelectric seat heating and cooling technology that will provide us with the potential to heat and cool seats faster utilizing less energy than other systems available today. The addition of seat heating and cooling to our existing capabilities and technologies in seat fabric, premium leather and seat cover sewing, as well as seat foam and seat structures, allows us to offer unique seat designs and the most complete range of seat features.
We have developed products and materials to improve comfort and ease of adjustment, promote customization and styling flexibility, increase durability and reliability, enhance safety, expand the usage of environmentally friendly materials and reduce cost and weight. ProActive™ Posture seating uses proprietary MySeat by Lear™ technology powered by our TheraMetric™ analytical process. This process is derived from our research to provide a driver with a seating position that promotes better posture and cumulative wellness benefits. ProActive™ Posture Seating has been endorsed by the American Chiropractic Association, International Chiropractors Association, World Federation of Chiropractic and Loomis Institute of Enzyme Nutrition. Our Lear Crafted Comfort Connect™ and Advanced Comfort Systems™ are adjustable cushions, seat backs and side bolsters which support correct posture and provide improved comfort and appearance. Our Guilford TeXstyle™ fabrics provide customizable fabric engineered to improve the vehicle experience and durability, and our TeXstyle™ Enhance offerings provide a range of secondary embellishment technologies to enhance standard fabrics, enabling unique design within an array of fabric choices. Our proprietary, anti-soiling performance leather finishing technology, Ansolé™, improves durability and protects against fading. Our head restraints provide improved comfort and safety with adjustability. Our high speed smart fold technology is a regulated high speed folding adjustment mechanism that delivers premium convenience while maintaining leading safety and comfort benefits. Our mini recliners and micro adjust tracks are seat mechanisms, which provide precision movement and facilitate interior packaging space flexibility. Our Dynamic Environmental Comfort Systems™ utilize environmentally friendly materials and offer weight reductions of 30% - 40%, as compared to current foam seat designs. Our SoyFoam™ seats, which are used by multiple global customers, are up to 24% renewable, as compared to non-renewable, petroleum-based foam seats.
For additional factors that may impact our seating segment’s business, financial condition, operating results and/or cash flows, see Item 1A, "Risk Factors."
E-Systems Segment
The E-Systems segment consists of the design, development, engineering, manufacture, assembly and supply of electrical distribution systems, electronic modules and related components and software for light vehicles globally. We are a leader in power management and signal distribution within the vehicle for traditional vehicle architectures, as well as high power and hybrid electric systems. We have connectivity hardware and software capabilities, including cybersecurity expertise, that facilitate secure, wireless communication between the vehicle’s electrical and electronic architecture and external networks, as well as other vehicles.
Electrical Distribution Systems
Electrical distribution systems route electrical signals and manage electrical power within the vehicle for traditional vehicle architectures, as well as high power and hybrid electric systems. Key components in the electrical distribution system include wiring harnesses, terminals and connectors and junction boxes, including components for high power and hybrid electric systems.
Wire harness assemblies are a collection of wiring and terminals and connectors that link all of the various electrical and electronic devices within the vehicle to each other and/or to a power source. Wire harness assemblies are a collection of individual circuits fabricated from raw and insulated wire, which is automatically cut to length and terminated during the manufacturing process. Individual circuits are assembled together on a jig or table, inserted into connectors and wrapped or taped to form wire harness assemblies. The assembly process is labor intensive, and as a result, production is generally performed in low-cost labor sites in Mexico, Honduras, Eastern Europe, Africa, China, the Philippines, Brazil and Thailand.
Terminals and connectors include conductive metal components and connector housings that join wire harness assemblies together at their respective end points or connect devices to wire harness assemblies. Terminals and connectors can vary significantly in size and complexity depending on the amount of power or data being transferred and the number of connections
9
being made at any particular point in the electrical distribution system. Terminals and connectors are currently manufactured in Germany, China, Eastern Europe and the United States.
Junction boxes are centrally located modules within the vehicle that contain fuses and/or relays for circuit and device protection and serve as a connection point for multiple wire harnesses. Junction boxes are manufactured in Mexico, Northern Africa, Europe, China and the Philippines with a proprietary, capital-intensive assembly process using printed circuit boards, a portion of which are purchased from third-party suppliers. Certain materials, particularly certain specialized electronic components, are available from a limited number of suppliers. Proprietary features have been developed to improve the function of these junction boxes in harsh environments, including extreme temperatures and humidity.
Our advanced efficiency systems group is dedicated to the development of high power and hybrid electric systems and components, including wiring, terminals and connectors and power electronics. We have products and technologies that enable the varying degrees of powertrain electrification being employed by automotive manufacturers today from mild hybrid vehicles to full electric vehicles, including 48-volt architectures. Our products include on-board charging systems, charge cord sets, high voltage electrical distribution systems and battery monitoring technology. Our global center for Advanced Efficiency Systems and high power applications is in Southfield, Michigan with full development capabilities also located in Valls, Spain. We are supplying, or will supply, high voltage components and systems for hybrid and electric vehicles produced by BMW, Daimler, Fiat Chrysler, General Motors, Jaguar Land Rover and Renault-Nissan. We believe that our expertise in high power electrical distribution systems will provide additional growth opportunities going forward and will be beneficial with the entrance of technology and emergent companies focusing on electric or other alternative powertrain designs.
Electronics
In our E-Systems segment, we also design, develop, engineer and manufacture electronics, which control various functions within the vehicle, as well as develop and integrate the associated software for these electronic modules. Our electronic modules include body control modules, smart junction boxes, gateway modules, wireless control modules, lighting control modules and audio amplifiers. Our engineering and development activities for electronics are in Southfield, Michigan, Santa Rosa, California, Spain, Germany, Belgium, China and India. We assemble these modules using high-speed surface mount placement equipment in Mexico, China, the Philippines, Morocco, Spain and Germany.
Body control modules primarily control vehicle interior functions outside of the vehicle’s head unit or infotainment system. Depending on the vehicle’s electrical and electronic architecture, these modules can be either highly integrated, consolidating multiple functional controls into a single module, or focus on a specific function, such as seat position and comfort controls or the door zone control module which controls features such as window lift, door lock and power mirrors. As electronic control modules become increasingly centralized and integrated, we developed "smart junction boxes," which are junction boxes augmented with integrated electronic functionality that otherwise would be contained in other body control modules. The integration of functionality in our smart junction boxes eliminates interconnections, increases overall system reliability and can consolidate the number of electronic modules within the vehicle. This can lead to reduced cost and complexity. We believe that our expertise in consolidating functional controls into integrated modules and integrating these modules into the vehicle’s electrical and electronic architecture is a competitive strength.
We develop and produce gateway modules, which facilitate secure access to, and communication with, all of the vehicle systems at a central point and translate various signals to facilitate data exchange across vehicle domains. This gateway becomes increasingly important as formerly distinct vehicle systems increasingly must work in concert with one another. We also offer wireless functionality in both integrated and stand-alone modules, which send and receive signals using radio frequency technology. Our wireless systems include passive entry systems, remote keyless entry and dual range/dual function remote keyless entry systems. We are building on both our core gateway and wireless capabilities as we add and develop higher levels of data and signal connectivity in and out of the vehicle.
Our electronics product offerings also include lighting control modules, which provide the electronic control logic and diagnostics for increasingly advanced and complex vehicle lighting systems. We supply LED lighting control systems for vehicle interiors and exteriors. In addition, we offer audio electronics, including premium audio amplifiers and complete vehicle sound system development capabilities with advanced domain control and audio tuning.
The higher level of complexity and processing power in these electronic control modules is driving rapid increases in software requirements associated with these modules. Accordingly, we continue to build on our knowledge and capabilities in software in order to design and develop more complex and integrated electronic control modules capable of more efficiently managing the distribution of power and data signals through the vehicle.
Connectivity
We are building connectivity capabilities that facilitate secure, wireless communication between the vehicle’s systems and external networks, as well as other vehicles. Our connectivity strategy is based on leveraging our expertise in vehicle electrical
10
and electronic architecture design and development, electronic module functional integration, gateway module data exchange and core wireless signals. We are building capabilities organically through internal investment and through acquisition and partnership. Recent transactions added technology that directly connects on-board vehicle systems with cloud-based applications using proprietary, secure data exchange capabilities via cellular networks and V2X hardware and software solutions utilizing expertise in 5.9 GHz DSRC and other wireless communications protocols, notably GPS satellite communications.
These capabilities, combined with our vehicle electrical and electronic architecture expertise and products, allow us to offer our customers embedded modules and software that facilitate direct and secure connectivity between the vehicle and external networks. Products that we can offer will include connected gateway modules with an array of features including over-the-air software update capabilities, embedded cellular communication modules, e-Call modules that automatically contact emergency services in the event of a crash and both on-board and roadside DSRC units that facilitate V2X communications. We combine these offerings with cybersecurity expertise and software solutions to permit highly secure communications and defend against cybersecurity attacks.
Financial Summary
A summary of revenues from external customers and other financial information for our E-Systems segment is shown below. For additional information regarding the operating results of our E-Systems segment, see Item 7, "Management’s Discussion and Analysis of Financial Condition and Results of Operations — Results of Operations." For additional information regarding Lear’s total sales and long-lived assets by geographic area, as well as customer concentrations, see Note
12
, "
Segment Reporting
," to the consolidated financial statements included in this Report. The top five customers of this segment are: Ford, General Motors, Renault-Nissan, Jaguar Land Rover and BMW.
|
(In millions)
|
2016
|
2015
|
2014
|
||||||||
|
Revenues from external customers
|
$
|
4,200.9
|
|
$
|
4,112.9
|
|
$
|
4,416.7
|
|
||
|
Segment earnings (1)
|
591.3
|
|
554.4
|
|
556.6
|
|
|||||
|
Depreciation and amortization
|
107.6
|
|
99.3
|
|
103.3
|
|
|||||
|
Capital expenditures
|
162.4
|
|
134.4
|
|
138.4
|
|
|||||
|
Total assets
|
1,675.9
|
|
1,572.9
|
|
1,609.9
|
|
|||||
|
(1)
|
As discussed in Note
2
, "
Summary of Significant Accounting Policies
— Segment Reporting," segment earnings represents pretax income before equity in net income of affiliates, interest expense and other expense.
|
Competition
We estimate the global target market for our E-Systems business to be over $70 billion. Our major competitors in electrical distribution systems include Delphi Automotive PLC, Leoni AG, Molex Incorporated (a subsidiary of Koch Industries Inc.), Sumitomo Corporation, TE Connectivity and Yazaki Corporation. Our major competitors in electronic modules, including connectivity solutions, include Continental AG, Delphi Automotive PLC, Denso Corporation, Harman International Industries, Incorporated (acquired by Samsung Electronics Co. Ltd.), Hella AG, Robert Bosch GmbH, Valeo S.A. and Visteon Corporation.
Technology
The E-Systems segment is technology driven and typically requires higher investment as a percentage of sales than our seating segment. Our complete electrical distribution system design capabilities, coupled with certain market-leading component technologies, allow access to our customers’ development teams, which provides an early indication of our customers’ product needs and enables us to develop system design efficiencies. Our ability to design and integrate electronic modules creates a competitive advantage as we support customers with complete electrical architecture development. Our expertise is developed and delivered by over 2,200 engineers across fourteen countries
and is led by five global technology centers of excellence in Belgium, China, Germany, Spain and the United States for each of our major product lines in this segment, which are described below.
In electrical distribution systems, our technology includes expertise in the design and use of alternative conductor materials, such as aluminum, copper-clad steel and other hybrid alloys. Alternative conductor materials can enable the use of ultra small gauge conductors, which reduce the weight and packaging size of electrical distribution systems. We were the first to implement copper-clad steel cabling in series production. We also have developed proprietary manufacturing process technologies, such as our vertical manufacturing system that features three dimensional wire harness assembly boards. Our expertise in terminals and connectors technology facilitates our ability to implement these small gauge and alternative alloy conductors. We have developed advanced capabilities in aluminum terminals and aluminum wire termination, ultra small gauge
11
termination, and high voltage terminals and connectors. We have developed high packaging density in-line connectors and new small gauge terminals that will enable wire gauge reduction and provide our customers with smaller and lower cost solutions. Our high voltage terminals and connectors are a part of our advanced efficiency systems capabilities, and we have established a leading capability in power density (power per packaging size) that is being adopted by multiple automakers. Our advanced efficiency systems and components for high voltage vehicle applications have achieved industry leading efficiency, packaging and reliability. We continue to build on our strong technology position for high voltage applications and have developed an 11kW wireless charging system that enables electric vehicles to safely recharge at the highest power level available without plugging in the vehicle. We have
619
patents issued or applied for in the advanced efficiency systems product technology area.
In electronics, we are a market leader in smart junction box technology and began production of our Automotive News PACE Award winning Solid State Smart Junction Box™ in 2016. We continue to refine our smart junction box technology, including the development of aluminum printed circuit boards. We have developed body control modules with dual core microprocessors that allow body control and gateway functionality in a single module. We are a leader in gateway module technology and have capabilities to enable our gateway and other electronic control modules to efficiently and securely manage the increasing amount of both wired and wireless signals running throughout, as well as within and outside of, the vehicle. We also have developed wireless products, such as lower-cost passive entry systems with improved security using ultra wide band technology and that feature our 2-way remote keyless entry systems that enable the vehicle to provide feedback to the consumer, such as verification that the doors have locked or that the engine has started. In lighting, we have developed advanced technology electronic controls, including a Matrix LED Control System capable of individually dimming and switching on/off up to 100 LEDs. This system enables steerable light beams and other advanced lighting features and can be paired with driver assistance system sensors for functionality, such as automatic high beam management and obstacle highlighting. In audio, we have developed an ethernet audio video bridging amplifier that facilitates faster processing of digital data at a lower cost.
Software remains a critical element of our E-Systems business. Software capabilities are becoming more important in the management of complex and highly sophisticated electrical architectures. Software within the vehicle is rapidly growing as a key element of technological innovation and a cost effective way to provide new features and functions. We currently employ approximately 600 software engineers globally and are pursuing expansion of specialized capabilities in vehicle networking, encryption, cybersecurity and connectivity protocols. We have expanded our software development capabilities through acquisition, internal investment and strategic hires, building on our architecture and power management capabilities with expertise in wireless communication software and cybersecurity. As part of our strategy to provide vehicle cybersecurity solutions to our customers, we have developed a firewall module, including proprietary software, which protects the vehicle from cybersecurity intrusion through one of its most vulnerable points, the on-board diagnostic port. We also have enhanced our V2X product line by adding secure, over-the-air software update capabilities to our V2X modules, allowing these units to receive regular software upgrades, which provide additional applications and functionality.
For additional factors that may impact our E-Systems segment’s business, financial condition, operating results and/or cash flows, see Item 1A, "Risk Factors."
Customers
In
2016
, Ford and General Motors, two of the largest automotive and light truck manufacturers in the world, each accounted for 21% of our net sales. In addition, BMW accounted for approximately
10%
of our net sales. We supply and have expertise in all vehicle segments of the automotive market. Our sales content tends to be higher on those vehicle platforms and segments which offer more features and functionality. The popularity of particular vehicle platforms and segments varies over time and by regional market. We expect to continue to win new business and grow sales at a greater rate than overall automotive industry production. For further information related to our customers and domestic and foreign sales and operations, see Note
12
, "
Segment Reporting
," to the consolidated financial statements included in this Report.
Our customers award business to their suppliers in a number of ways, including the award of complete systems, which allows suppliers either to manufacture components internally or to purchase components from other suppliers at their discretion. Certain of our customers also elect to award certain components directly to component suppliers and independent of the award of the complete system. We have been selectively expanding our component capabilities and investing in manufacturing capacity in low-cost regions in order to maximize our participation in such component sourcing.
Our customers typically award contracts several years before actual production is scheduled to begin. Each year, the automotive manufacturers introduce new models, update existing models and discontinue certain models and, recently, even complete brands. In this process, we may be selected as the supplier on a new model, we may continue as the supplier on an updated model or we may lose a new or updated model to a competitor. Our sales backlog reflects estimated net sales over the next three years from formally awarded new programs, less lost and discontinued programs. This measure excludes the sales backlog at our non-consolidated joint ventures. As of January 2017, our 2017 to 2019 sales backlog is $2.8 billion, an increase of 40% as compared to our sales backlog as of January 2016. Our current sales backlog reflects $1.25 billion related to 2017
12
and 73% and 27% related to our seating and E-Systems segments, respectively. In addition, our 2017 to 2019 sales backlog at our non-consolidated joint ventures is $800 million. Our current sales backlog assumes volumes based on the independent industry projections of IHS Automotive as of December 2016 and a Euro exchange rate of $1.05 / Euro. This sales backlog is generally subject to a number of risks and uncertainties, including vehicle production volumes on new and replacement programs and foreign exchange rates, as well as the timing of production launches and changes in customer development plans. For additional information regarding risks that may affect our sales backlog, see Item 1A, "Risk Factors," and Part II — Item 7, "Management’s Discussion and Analysis of Financial Condition and Results of Operations — Forward-Looking Statements."
We receive purchase orders from our customers that generally provide for the supply of a customer’s annual requirements for a particular vehicle model and assembly plant, or in some cases, for the supply of a customer’s requirements for the life of a particular vehicle model, rather than for the purchase of a specified quantity of products. Although most purchase orders may be terminated by our customers at any time, such terminations have been minimal and have not had a material impact on our operating results. We are subject to risks that an automotive manufacturer will produce fewer units of a vehicle model than anticipated or that an automotive manufacturer will not award us a replacement program following the life of a vehicle model. To reduce our reliance on any one vehicle model, we produce automotive systems and components for a broad cross-section of both new and established models. However, larger cars and light trucks, as well as vehicle platforms that offer more features and functionality, such as luxury, sport utility and crossover vehicles, typically have more content and, therefore, tend to have a more significant impact on our operating performance. Our net sales for the year ended
December 31, 2016
, consisted of
13%
compact,
46%
mid-size,
23%
full-size/luxury and
18%
full frame and were comprised of
47%
cars and
53%
light trucks.
Our agreements with our major customers generally provide for an annual productivity price reduction. Historically, cost reductions through product design changes, increased manufacturing productivity and similar programs with our suppliers have generally offset these customer-imposed price reduction requirements. However, raw material, energy and commodity costs can be volatile. Although we have developed and implemented strategies to mitigate the impact of higher raw material, energy and commodity costs, these strategies, together with commercial negotiations with our customers and suppliers, typically offset only a portion of the adverse impact. Certain of these strategies also may limit our opportunities in a declining commodity environment. In addition, we are exposed to increasing market risk associated with fluctuations in foreign exchange as a result of our low-cost footprint and vertical integration strategies. We use derivative financial instruments to reduce our exposure to fluctuations in foreign exchange rates. For additional information regarding our foreign exchange and commodity price risk, see Part II — Item 7, "Management’s Discussion and Analysis of Financial Condition and Results of Operations — Liquidity and Financial Condition — Foreign Exchange" and "— Commodity Prices."
Seasonality
Our principal operations are directly related to the automotive industry. Consequently, we may experience seasonal fluctuations to the extent automotive vehicle production slows, such as in the summer months when many customer plants close for model year changeovers, in December when many customer plants close for the holidays and during periods of high vehicle inventory. See Note
14
, "
Quarterly Financial Data
," to the consolidated financial statements included in this Report.
Raw Materials
The principal raw materials used in our seat systems, electrical distribution systems and electronics are generally available and obtained from multiple suppliers under various types of supply agreements. Components, such as fabric, foam, leather, seat structures and mechanisms, terminals and connectors and certain other components are either manufactured by us internally or purchased from multiple suppliers under various types of supply agreements. The majority of the steel used in our products is comprised of fabricated components that are integrated into a seat system, such as seat frames, recliner mechanisms, seat tracks and other mechanical components. Therefore, our exposure to changes in steel prices is primarily indirect, through these purchased components. With the exception of certain terminals and connectors, the materials that we use to manufacture wire harness assemblies are substantially purchased from suppliers, including extruded and insulated wire and cable. The majority of our copper purchases are comprised of extruded wire and cable that we integrate into electrical wire harnesses. In general, our copper purchases, as well as a significant portion of our leather purchases, are subject to price index agreements with our customers. We utilize a combination of short-term and long-term supply contracts to purchase key components. We generally retain the right to terminate these agreements if our supplier does not remain competitive in terms of cost, quality, delivery, technology or customer support.
13
Employees
As of
December 31, 2016
and
2015
, our employment levels worldwide were approximately as follows:
|
Region
|
2016
|
2015
|
|||
|
United States and Canada
|
9,900
|
|
10,200
|
|
|
|
Mexico
|
48,700
|
|
46,600
|
|
|
|
Central and South America
|
11,100
|
|
10,400
|
|
|
|
Europe and Africa
|
52,600
|
|
47,200
|
|
|
|
Asia
|
26,100
|
|
21,800
|
|
|
|
Total
|
148,400
|
|
136,200
|
|
|
A substantial number of our employees are members of unions or national trade organizations. We have collective bargaining agreements with several North American unions, including the United Auto Workers, Unifor, International Brotherhood of Electrical Workers and Workers United. Each of our unionized facilities in the United States and Canada has a separate collective bargaining agreement with the union that represents the workers at such facility, with each such agreement having an expiration date that is independent of the other agreements. The majority of our employees in Mexico and Europe are members of industrial trade union organizations or confederations within their respective countries. Many of these organizations and confederations operate under national contracts, which are not specific to any one employer. We have occasionally experienced labor disputes at our plants. We have been able to resolve all such labor disputes and believe our relations with our employees are generally good.
See Item 1A, "Risk Factors — A significant labor dispute involving us or one or more of our customers or suppliers or that could otherwise affect our operations could adversely affect our financial performance," and Part II — Item 7, "Management’s Discussion and Analysis of Financial Condition and Results of Operations — Forward-Looking Statements."
Intellectual Property
Worldwide, we have approximately 2,100 patents and patent applications pending. While we believe that our patent portfolio is a valuable asset, no individual patent or group of patents is critical to the success of our business. We also license selected technologies to automotive manufacturers and to other automotive suppliers. We continually strive to identify and implement new technologies for use in the design and development of our products.
Advanced technology development is conducted worldwide at our six advanced technology centers and at our product engineering centers. At these centers, we engineer our products to comply with applicable safety standards, meet quality and durability standards, respond to environmental conditions and conform to customer and consumer requirements. Our global innovation and technology center located in Southfield, Michigan, develops and integrates new concepts and is our central location for consumer research, benchmarking, craftsmanship and industrial design activity.
We have numerous registered trademarks in the United States and in many foreign countries. The most important of these marks include LEAR CORPORATION
®
(including our stylized version thereof) and LEAR
®
, which are widely used in connection with our products and services. Our other principal brands include GUILFORD
TM
and EAGLE OTTAWA
®
, AVENTINO
®
leather, INTU
TM
Seating, LEAR CONNEXUS
TM
signal and data communications, PROACTIVE POSTURE
TM
seating, ProTec
®
active head restraints, SMART JUNCTION BOX
TM
technology, STRUCSURE
TM
systems and TeXstyle
TM
fabrics are some of the other trademarks used in connection with certain of our product lines.
We will continue to dedicate resources to engineering and development. Engineering and development costs incurred in connection with product launch, to the extent not recoverable from our customers, are charged to cost of sales as incurred. All other engineering and development costs are charged to selling, general and administrative expenses when incurred. Engineering and development costs charged to selling, general and administrative expenses totaled approximately
$144 million
,
$127 million
and
$102 million
for the years ended
December 31, 2016
,
2015
and
2014
, respectively. Engineering and development costs for which reimbursement is contractually guaranteed by our customers are capitalized. Engineering and development costs capitalized totaled approximately
$179 million
,
$194 million
and
$232 million
for the years ended
December 31, 2016
,
2015
and
2014
, respectively.
Environmental Matters
We are subject to local, state, federal and foreign laws, regulations and ordinances which govern activities or operations that may have adverse environmental effects and which impose liability for clean-up costs resulting from past spills, disposals or other releases of hazardous wastes and environmental compliance. For a description of our outstanding environmental matters
14
and other legal proceedings, see Note
11
, "
Commitments and Contingencies
," to the consolidated financial statements included in this Report.
In addition, our customers are subject to significant environmentally focused state, federal and foreign laws and regulations that regulate vehicle emissions, fuel economy and other matters related to the environmental impact of vehicles. To the extent that such laws and regulations ultimately increase or decrease automotive vehicle production, such laws and regulations would likely impact our business. See Item 1A, "Risk Factors."
Furthermore, we currently offer products with environmentally friendly features, and our expertise and capabilities are allowing us to expand our product offerings in this area. We will continue to monitor emerging developments in this area.
Joint Ventures and Noncontrolling Interests
We form joint ventures in order to gain entry into new markets, expand our product offerings and broaden our customer base. In particular, we believe that certain joint ventures have provided us, and will continue to provide us, with the opportunity to expand our business relationships with Asian automotive manufacturers, particularly in emerging markets. We also partner with companies having significant local experience in commerce and customs, as well as capacity, to reduce our financial risk and enhance our potential for achieving expected financial returns. In some cases, these joint ventures may be located in North America or Europe and used to expand our customer relationships.
As of
December 31, 2016
, we had 22 operating joint ventures located in six countries. Of these joint ventures, eight are consolidated and fourteen are accounted for using the equity method of accounting. Fifteen of the joint ventures operate in Asia and seven operate in North America (including one that is dedicated to serving Asian automotive manufacturers). Net sales of our consolidated joint ventures accounted for approximately 12% of our net sales in
2016
. As of
December 31, 2016
, our investments in non-consolidated joint ventures totaled
$154 million
.
A summary of our non-consolidated operating joint ventures, including ownership percentages, is shown below. For further information related to our joint ventures, see Note
5
, "
Investments in Affiliates and Other Related Party Transactions
," to the consolidated financial statements included in this Report.
|
Country
|
Name
|
Ownership
Percentage
|
|
China
|
Shanghai Lear STEC Automotive Parts Co., Ltd.
|
55%
|
|
China
|
Beijing BHAP Lear Automotive Systems Co., Ltd.
|
50
|
|
China
|
Jiangxi Jiangling Lear Interior Systems Co., Ltd.
|
50
|
|
China
|
Lear Dongfeng Automotive Seating Co., Ltd.
|
50
|
|
China
|
Changchun Lear FAWSN Automotive Electrical and Electronics Co., Ltd.
|
49
|
|
China
|
Changchun Lear FAWSN Automotive Seat Systems Co., Ltd.
|
49
|
|
China
|
Beijing Lear Dymos Automotive Systems Co., Ltd.
|
40
|
|
Honduras
|
Honduras Electrical Distribution Systems S. de R.L. de C.V.
|
49
|
|
India
|
Dymos Lear Automotive India Private Limited
|
35
|
|
Korea
|
Dong Kwang Lear Yuhan Hoesa
|
50
|
|
United States
|
Kyungshin-Lear Sales and Engineering LLC
|
49
|
|
United States
|
eLumigen, LLC
|
46
|
|
United States
|
RevoLaze, LLC
|
20
|
|
United States
|
Tempronics, Inc.
|
12
|
Our business, financial condition, operating results and cash flows may be impacted by a number of factors. In addition to the factors affecting our business identified elsewhere in this Report, the most significant factors affecting our operations include the following:
|
•
|
Our industry is cyclical and a decline in the production levels of our major customers, particularly with respect to models for which we are a significant supplier, could adversely affect our financial performance.
|
Our sales are driven by the number of vehicles produced by the automotive manufacturers, which is ultimately dependent on consumer demand for automotive vehicles, and our content per vehicle. The automotive industry is cyclical and
15
sensitive to general economic conditions, including the global credit markets, interest rates, consumer credit and consumer spending and preferences. Automotive sales and production can also be affected by the age of the vehicle fleet and related scrappage rates, labor relations issues, fuel prices, regulatory requirements, government initiatives, trade agreements, the availability and cost of credit, the availability of critical components needed to complete the production of vehicles, restructuring actions of our customers and suppliers, facility closures, increased competition, changing consumer attitudes toward vehicle ownership and usage and other factors, including consumer preferences regarding vehicle size, configuration and features.
Our ability to reduce the risks inherent in certain concentrations of business, and thereby maintain our financial performance in the future, will depend, in part, on our ability to continue to diversify our sales on a customer, product, platform and geographic basis to reflect the market overall. While we are pursuing a strategy of aggressively expanding our sales and operations in Asia, no assurances can be given as to how successful we will be in doing so. As a result, an economic downturn or other adverse industry conditions that result in a decline in the production levels of our major customers, particularly with respect to models for which we are a significant supplier, could reduce our sales and thereby adversely affect our financial condition, operating results and cash flows.
|
•
|
The loss of business with respect to, or the lack of commercial success of, a vehicle model for which we are a significant supplier could adversely affect our financial performance.
|
Although we receive purchase orders from our customers, these purchase orders generally provide for the supply of a customer’s annual requirements for a particular vehicle model and assembly plant, or in some cases, for the supply of a customer’s requirements for the life of a particular vehicle model, rather than for the purchase of a specific quantity of products. In addition, it is possible that our customers could elect to manufacture our products internally or increase the extent to which they require us to utilize specific suppliers or materials in the manufacture of our products. The loss of business with respect to, the lack of commercial success of or an increase in directed component sourcing for a vehicle model for which we are a significant supplier could reduce our sales or margins and thereby adversely affect our financial condition, operating results and cash flows.
|
•
|
Our inability to achieve product cost reductions which offset customer-imposed price reductions could adversely affect our financial performance.
|
Downward pricing pressure by automotive manufacturers is a characteristic of the automotive industry. We regularly negotiate contracts and sales prices with our customers. These contracts require us to reduce our prices over the life of a vehicle model and, at the same time, assume significant responsibility for the design, development and engineering of our products. Our financial performance is largely dependent on our ability to achieve product cost reductions through product design enhancement and supply chain management, as well as manufacturing efficiencies and restructuring actions. We also seek to enhance our financial performance by investing in product development, design capabilities and new product initiatives that respond to the needs of our customers and consumers. We continually evaluate operational and strategic alternatives to align our business with the changing needs of our customers and improve our business structure by investing in vertical integration opportunities. Our inability to achieve product cost reductions which offset customer-imposed price reductions could adversely affect our financial condition, operating results and cash flows.
|
•
|
Increases in the costs and restrictions on the availability of raw materials, energy, commodities and product components could adversely affect our financial performance.
|
Raw material, energy and commodity costs can be volatile. Although we have developed and implemented strategies to mitigate the impact of higher raw material, energy and commodity costs, these strategies, together with commercial negotiations with our customers and suppliers, typically offset only a portion of the adverse impact. Certain of these strategies also may limit our opportunities in a declining commodity environment. In addition, the availability of raw materials, commodities and product components fluctuates from time to time due to factors outside of our control. If the costs of raw materials, energy, commodities and product components increase or the availability thereof is restricted, it could adversely affect our financial condition, operating results and cash flows.
|
•
|
Adverse developments affecting or the financial distress of one or more of our suppliers could adversely affect our financial performance.
|
We obtain components and other products and services from numerous Tier 2 automotive suppliers and other vendors throughout the world. We are responsible for managing our supply chain, including suppliers that may be the sole sources of products that we require, that our customers direct us to use or that have unique capabilities that would make it difficult and/or expensive to re-source. In certain instances, entire industries may experience short-term capacity constraints. Additionally, our production capacity, and that of our customers and suppliers, may be adversely affected by natural
16
disasters. Any such significant disruption could adversely affect our financial performance. Furthermore, unfavorable economic or industry conditions could result in financial distress within our supply base, thereby increasing the risk of supply disruption. Although market conditions generally have improved in recent years, uncertainty remains and another economic downturn or other unfavorable industry conditions in one or more of the regions in which we operate could cause a supply disruption and thereby adversely affect our financial condition, operating results and cash flows.
|
•
|
Our substantial international operations make us vulnerable to risks associated with doing business in foreign countries.
|
As a result of our global presence, a significant portion of our revenues and expenses are denominated in currencies other than the U.S. dollar. We have substantial manufacturing and distribution facilities in many foreign countries, including Mexico and countries in Africa, Asia, Central and South America and Europe. International operations are subject to certain risks inherent in doing business abroad, including:
|
•
|
exposure to local economic conditions;
|
|
•
|
political, economic and civil instability and uncertainty (including acts of terrorism, civil unrest, drug-cartel related and other forms of violence and outbreaks of war);
|
|
•
|
labor unrest;
|
|
•
|
expropriation and nationalization;
|
|
•
|
currency exchange rate fluctuations, currency controls and the ability to economically hedge currencies;
|
|
•
|
withholding and other taxes on remittances and other payments by subsidiaries;
|
|
•
|
investment restrictions or requirements;
|
|
•
|
repatriation restrictions or requirements;
|
|
•
|
export and import restrictions and increases in duties and tariffs;
|
|
•
|
increases in working capital requirements related to long supply chains; and
|
|
•
|
global sovereign fiscal matters and creditworthiness, including potential defaults and the related impacts on economic activity, including the possible effects on credit markets, currency values, monetary unions, international treaties and fiscal policies.
|
Expanding our sales and operations in Asia and our manufacturing operations in lower-cost regions are important elements of our strategy. As a result, our exposure to the risks described above is substantial. The likelihood of such occurrences and their potential effect on us vary from country to country and are unpredictable. However, any such occurrences could adversely affect our financial condition, operating results and cash flows.
|
•
|
Certain of our operations are conducted through joint ventures which have unique risks.
|
Certain of our operations, particularly in emerging markets, are conducted through joint ventures. With respect to our joint ventures, we may share ownership and management responsibilities with one or more partners that may not share our goals and objectives. Operating a joint venture requires us to operate the business pursuant to the terms of the agreement that we entered into with our partners, including additional organizational formalities, as well as to share information and decision making. Additional risks associated with joint ventures include one or more partners failing to satisfy contractual obligations, conflicts arising between us and any of our partners, a change in the ownership of any of our partners and less of an ability to control compliance with applicable rules and regulations, including the Foreign Corrupt Practices Act and related rules and regulations. Additionally, our ability to sell our interest in a joint venture may be subject to contractual and other limitations. Accordingly, any such occurrences could adversely affect our financial condition, operating results and cash flows.
|
•
|
We operate in a highly competitive industry and efforts by our competitors, as well as new non-traditional entrants to the industry, to gain market share could adversely affect our financial performance.
|
We operate in a highly competitive industry. We and most of our competitors are seeking to expand market share with new and existing customers, including in Asia and other potential high growth regions. Our customers award business based on, among other things, price, quality, service and technology. Our competitors’ efforts, as well as the efforts of new non-traditional entrants to the industry, to grow market share could exert downward pressure on our product pricing and margins. In addition, the success of portions of our business requires us to develop and/or incorporate leading technologies. Such technologies are subject to rapid obsolescence. Our inability to maintain access to these technologies
17
(either through development or licensing) may adversely affect our ability to compete. If we are unable to differentiate our products or maintain a low-cost footprint, we may lose market share or be forced to reduce prices, thereby lowering our margins. Any such occurrences could adversely affect our financial condition, operating results and cash flows.
|
•
|
Our inability to effectively manage the timing, quality and costs of new program launches could adversely affect our financial performance.
|
In connection with the award of new business, we obligate ourselves to deliver new products and services that are subject to our customers’ timing, performance and quality standards. Additionally, as a Tier 1 supplier, we must effectively coordinate the activities of numerous suppliers in order for the program launches of our products to be successful. Given the complexity of new program launches, we may experience difficulties managing product quality, timeliness and associated costs. In addition, new program launches require a significant ramp up of costs; however, our sales related to these new programs generally are dependent upon the timing and success of our customers’ introduction of new vehicles. Our inability to effectively manage the timing, quality and costs of these new program launches could adversely affect our financial condition, operating results and cash flows.
|
•
|
A significant labor dispute involving us or one or more of our customers or suppliers or that could otherwise affect our operations could adversely affect our financial performance.
|
A substantial number of our employees and the employees of our largest customers and suppliers are members of industrial trade unions and are employed under the terms of various labor agreements. We have labor agreements covering approximately
77,000
employees globally. In the United States and Canada, each of our unionized facilities has a separate collective bargaining agreement with the union that represents the workers at such facility, with each such agreement having an expiration date that is independent of the other agreements. Labor agreements covering approximately
78%
of our unionized work force, including approximately
2%
of our unionized workforce in the United States and Canada, are scheduled to expire during
2017
. There can be no assurances that future negotiations with the unions will be resolved favorably or that we will not experience a work stoppage or disruption that could adversely affect our financial condition, operating results and cash flows. A labor dispute involving us, any of our customers or suppliers or any other suppliers to our customers or that otherwise affects our operations, or the inability by us, any of our customers or suppliers or any other suppliers to our customers to negotiate, upon the expiration of a labor agreement, an extension of such agreement or a new agreement on satisfactory terms could adversely affect our financial condition, operating results and cash flows. In addition, if any of our significant customers experience a material work stoppage, the customer may halt or limit the purchase of our products. This could require us to shut down or significantly reduce production at facilities relating to such products, which could adversely affect our business and harm our profitability.
|
•
|
Our existing indebtedness and the inability to access capital markets could restrict our business activities or our ability to execute our strategic objectives or adversely affect our financial performance.
|
As of
December 31, 2016
, we had approximately
$1.9 billion
of outstanding indebtedness, as well as
$1.25 billion
available for borrowing under our revolving credit facility. The debt instruments governing our indebtedness contain covenants that may restrict our business activities or our ability to execute our strategic objectives, and our failure to comply with these covenants could result in a default under our indebtedness. We also lease certain buildings and equipment under non-cancelable lease agreements with terms exceeding one year, which are accounted for as operating leases. Additionally, any downgrade in the ratings that rating agencies assign to us and our debt may ultimately impact our access to capital markets. Our inability to generate sufficient cash flow to satisfy our debt and lease obligations, to refinance our debt obligations or to access capital markets on commercially reasonable terms could adversely affect our financial condition, operating results and cash flows.
|
•
|
Significant changes in discount rates, the actual return on pension assets and other factors could adversely affect our financial performance.
|
Our earnings may be positively or negatively impacted by the amount of income or expense recorded related to our defined benefit plans. Accounting principles generally accepted in the United States require that income or expense related to the defined benefit plans be calculated at the annual measurement date using actuarial calculations, which reflect certain assumptions. The most significant of these assumptions relate to interest rates, the capital markets and other economic conditions. These assumptions, as well as the actual value of pension assets at the measurement date, will impact the calculation of pension and other postretirement benefit expense for the year. Although pension expense and pension contributions are not directly related, the key economic indicators that affect pension expense also affect the amount of cash that we will contribute to our pension plans. Because interest rates and the values of these pension assets have fluctuated and will continue to fluctuate in response to changing market conditions, pension and other postretirement
18
benefit expense in subsequent periods, the funded status of our pension plans and the future minimum required pension contributions, if any, could adversely affect our financial condition, operating results and cash flows.
|
•
|
Impairment charges relating to our goodwill and long-lived assets could adversely affect our financial performance.
|
We regularly monitor our goodwill and long-lived assets for impairment indicators. In conducting our goodwill impairment testing, we may first perform a qualitative assessment of whether it is more likely than not that a reporting unit’s fair value is less than its carrying amount. If not, no further goodwill impairment testing is required. If it is more likely than not that a reporting unit’s fair value is less than its carrying amount, or if we elect not to perform a qualitative assessment of a reporting unit, we then compare the fair value of the reporting unit to the related net book value. If the net book value of a reporting unit exceeds its fair value, an impairment loss is measured and recognized. In conducting our impairment analysis of long-lived assets, we compare the undiscounted cash flows expected to be generated from the long-lived assets to the related net book values. Changes in economic or operating conditions impacting our estimates and assumptions could result in the impairment of our goodwill or long-lived assets. In the event that we determine that our goodwill or long-lived assets are impaired, we may be required to record a significant charge to earnings that could adversely affect our financial condition and operating results.
|
•
|
Our failure to execute our strategic objectives could adversely affect our financial performance.
|
Our financial performance depends, in part, on our ability to successfully execute our strategic objectives. Our objectives are to deliver superior long-term shareholder value by investing in our business to grow and improve our competitive position, while maintaining a strong and flexible balance sheet and returning cash to our shareholders. Various factors, including the industry environment and the other matters described herein and in Part II — Item 7, "Management’s Discussion and Analysis of Financial Condition and Results of Operations," including "— Forward-Looking Statements," could adversely affect our ability to execute our strategic objectives. These risk factors include our failure to identify suitable opportunities for organic investment and/or acquisitions, our inability to successfully develop such opportunities or complete such acquisitions or our inability to successfully utilize or integrate the investments in our operations. Our failure to execute our strategic objectives could adversely affect our financial condition, operating results and cash flows. Moreover, there can be no assurances that, even if implemented, our strategic objectives will be successful.
|
•
|
A disruption in our information technology systems, including a disruption related to cybersecurity, could adversely affect our financial performance.
|
We rely on the accuracy, capacity and security of our information technology systems. Despite the security measures that we have implemented, including those measures related to cybersecurity, our systems could be breached or damaged by computer viruses, natural or man-made incidents or disasters or unauthorized physical or electronic access. A breach could result in business disruption, theft of our intellectual property, trade secrets or customer information and unauthorized access to personnel information. To the extent that our business is interrupted or data is lost, destroyed or inappropriately used or disclosed, such disruptions could adversely affect our competitive position, relationships with our customers, financial condition, operating results and cash flows. In addition, we may be required to incur significant costs to protect against the damage caused by these disruptions or security breaches in the future.
|
•
|
A significant product liability lawsuit, warranty claim or product recall involving us or one of our major customers could adversely affect our financial performance.
|
In the event that our products fail to perform as expected, whether allegedly due to our fault or that of one of our sub-suppliers, and such failure results in, or is alleged to result in, bodily injury and/or property damage or other losses, we may be subject to product liability lawsuits and other claims or we may be required or requested by our customers to participate in a recall or other corrective action involving such products. We also are a party to agreements with certain of our customers, whereby these customers may pursue claims against us for contribution of all or a portion of the amounts sought in connection with product liability and warranty claims. We carry insurance for certain product liability claims, but such coverage may be limited. We do not maintain insurance for product warranty or recall matters. In addition, we may not be successful in recovering amounts from third parties, including sub-suppliers, in connection with these claims. These types of claims could adversely affect our financial condition, operating results and cash flows.
|
•
|
We are involved from time to time in various legal and regulatory proceedings and claims, which could adversely affect our financial performance.
|
We are involved in various legal and regulatory proceedings and claims that, from time to time, are significant. These are typically claims that arise in the normal course of business including, without limitation, commercial or contractual disputes, including disputes with our customers, suppliers or competitors, intellectual property matters, personal injury
19
claims, environmental matters, tax matters, employment matters and antitrust matters. No assurances can be given that such proceedings and claims will not adversely affect our financial condition, operating results and cash flows.
|
•
|
New laws or regulations or changes in existing laws or regulations could adversely affect our financial performance.
|
We and the automotive industry are subject to a variety of federal, state, local and foreign laws and regulations, including those related to health, safety and environmental matters. Governmental regulations also affect taxes and levies, capital markets, healthcare costs, energy usage, international trade and immigration and other labor issues, all of which may have a direct or indirect effect on our business and the businesses of our customers and suppliers. We cannot predict the substance or impact of pending or future legislation or regulations, or the application thereof. The introduction of new laws or regulations or changes in existing laws or regulations, or the interpretation thereof, could increase the costs of doing business for us or our customers or suppliers or restrict our actions and adversely affect our financial condition, operating results and cash flows.
|
•
|
We are subject to regulation of our international operations that could adversely affect our financial performance.
|
We are subject to many laws governing our international operations, including those that prohibit improper payments to government officials and restrict where we can do business and what information or products we can supply to certain countries, including but not limited to the Foreign Corrupt Practices Act and the U.S. Export Administration Act. Violations of these laws, which are complex and often difficult to interpret and apply, could result in significant criminal penalties or sanctions that could adversely affect our business, financial condition, operating results and cash flows.
|
•
|
We are required to comply with environmental laws and regulations that could cause us to incur significant costs.
|
Our manufacturing facilities are subject to numerous laws and regulations designed to protect the environment, and we expect that additional requirements with respect to environmental matters will be imposed on us in the future.
Material future expenditures may be necessary if compliance standards change or material unknown conditions that require remediation are discovered. Environmental laws could also restrict our ability to expand our facilities or could require us to acquire costly equipment or to incur other significant expenses in connection with our business. If we fail to comply with present and future environmental laws and regulations, we could be subject to future liabilities, which could adversely affect our financial condition, operating results and cash flows.
|
•
|
Developments or assertions by or against us relating to intellectual property rights could adversely affect our financial performance.
|
We own significant intellectual property, including a large number of patents, trademarks, copyrights and trade secrets, and we are involved in numerous licensing arrangements. Our intellectual property plays an important role in maintaining our competitive position in a number of the markets that we serve. Developments or assertions by or against us relating to intellectual property rights could adversely affect our financial condition, operating results and cash flows.
|
•
|
Our U.S. net operating loss, capital loss and tax credit carryforwards could be substantially limited if we experience an ownership change as defined in the Internal Revenue Code.
|
We have significant U.S. net operating loss, capital loss and tax credit carryforwards (collectively, the "Tax Attributes"). Under federal tax laws, we can carry forward and use our Tax Attributes to reduce our future U.S. taxable income and tax liabilities until such Tax Attributes expire in accordance with the Internal Revenue Code of 1986, as amended (the "IRC"). Section 382 and Section 383 of the IRC provide an annual limitation on our ability to utilize our Tax Attributes, as well as certain built-in-losses, against future U.S. taxable income in the event of a change in ownership, as defined under the IRC. We may experience a change in ownership in the future as a result of changes in our stock ownership that are beyond our control, and any such subsequent changes in ownership for purposes of the IRC could further limit our ability to use our Tax Attributes. Accordingly, any such occurrences could adversely impact our ability to offset future tax liabilities and, therefore, adversely affect our financial condition, net income and cash flow.
|
•
|
The impact of potential changes in tax and trade policies in the United States and the potential corresponding actions by other countries in which we do business could adversely affect our financial performance.
|
The U.S. government has recently proposed comprehensive tax and trade reform. These proposals are designed to encourage increased production in the United States and include a border tax on imports, an increase in customs duties and the renegotiation of U.S. trade agreements. Reflective of the automotive industry, our vehicle parts manufacturing facilities in the United States, Mexico and Canada are highly dependent on trade within the North American Free Trade Agreement (“NAFTA”) region. A significant number of these facilities are in Mexico and represent a critical component
20
of our supply chain and that of our customers. We have significant imports into the United States, and the imposition of a border tax or an increase in customs duties with respect to these imports could negatively impact our financial performance. If such taxes or customs duties are implemented, it also may cause our trading partners to take actions with respect to U.S. imports or U.S. investment activities in their respective countries. Any potential changes in tax and trade policies in the United States and the potential corresponding actions by other countries in which we do business could adversely affect our financial performance.
|
•
|
Changes in the United Kingdom's economic and other relationships with the European Union could adversely affect us.
|
In June 2016, a majority of voters in the United Kingdom elected to withdraw from the European Union in a national referendum (also referred to as "Brexit"). The referendum was advisory, and by the terms of the Treaty on European Union, any withdrawal is subject to a negotiation period that could last at least two years after the government of the United Kingdom formally initiates the withdrawal process. The ultimate effects of Brexit on us are difficult to predict, but because we currently conduct business in the United Kingdom and in Europe, the results of the referendum and any eventual withdrawal could cause disruptions and create uncertainty to our businesses, including affecting the business of and/or our relationships with our customers and suppliers, as well as altering the relationship among tariffs and currencies, including the value of the British pound and the Euro relative to the U.S. dollar. Such disruptions and uncertainties could adversely affect our financial condition, operating results and cash flows. In addition, Brexit could result in legal uncertainty and potentially divergent national laws and regulations as new legal relationships between the United Kingdom and the European Union are established. The ultimate effects of Brexit on us will also depend on the terms of any agreements the United Kingdom and the European Union make to retain access to each other's respective markets either during a transitional period or more permanently.
None.
21
As of
December 31, 2016
, our operations were conducted through
243
facilities, some of which are used for multiple purposes, including
82
just-in-time manufacturing facilities,
114
dedicated component manufacturing facilities,
7
sequencing and distribution sites,
32
administrative/technical support facilities and
8
advanced technology centers, in
37
countries. Our corporate headquarters is located in Southfield, Michigan.
Of our
243
total facilities, which include facilities owned or leased by our consolidated subsidiaries,
104
are owned and
139
are leased with expiration dates ranging from
2017
through
2053
. We believe that substantially all of our property and equipment is in good condition and that we have sufficient capacity to meet our current and expected manufacturing and distribution needs. See Part II — Item 7, "Management’s Discussion and Analysis of Financial Condition and Results of Operations — Liquidity and Financial Condition."
|
Seating
|
|||||
|
Argentina
|
Czech Republic
|
Indonesia
|
Mexico (continued)
|
Russia
|
United States
|
|
Escobar, BA
|
Kolin
|
Cikarang
|
Nuevo Casas
|
Kaluga
|
Arlington, TX
|
|
Ferreyra, CBA
|
Stribro
|
Italy
|
Grandes, CH
|
Nizhny Novgorod
|
Auburn Hills, MI
|
|
Brazil
|
Dominican Republic
|
Caivano, NA
|
Panzacola, TL
|
St. Petersburg
|
Columbia City, IN
|
|
Betim
|
Santo Domingo
|
Cassino, FR
|
Piedras Negras, CO
|
Slovak Republic
|
Detroit, MI
|
|
Caçapava
|
France
|
Grugliasco, TO
|
Ramos Arizpe, CO
|
Presov
|
Duncan, SC
|
|
Camaçari
|
Cergy
|
Melfi, PZ
|
Saltillo, CO
|
Voderady
|
Farwell, MI
|
|
Joinville
|
Feignies
|
Pozzo d’Adda, MI
|
San Felipe, GU
|
South Africa
|
Hammond, IN
|
|
Pernambuco
|
Germany
|
Macedonia
|
San Luis Potosi, SL
|
East London
|
Hebron, OH
|
|
Canada
|
Besigheim
|
Tetovo
|
Silao, GO
|
Port Elizabeth
|
Highland Park, MI
|
|
Ajax, ON
|
Bremen
|
Malaysia
|
Toluca, MX
|
Rosslyn
|
Kenansville, NC
|
|
Whitby, ON
|
Eisenach
|
Behrang Stesen
|
Villa Ahumada, CH
|
South Korea
|
Louisville, KY
|
|
China
|
Ginsheim-
|
Klang
|
Moldova
|
Gyeongju
|
Montgomery, AL
|
|
Beijing
|
Gustavsburg
|
Mexico
|
Ungheni
|
Spain
|
Morristown, TN
|
|
Changshu
|
Rietberg
|
Aguascalientes, AG
|
Morocco
|
Barcelona
|
Pine Grove, PA
|
|
Chongqing
|
Wackersdorf
|
Arteaga, CA
|
Tangier
|
Epila
|
Portage, IN
|
|
Guangzhou
|
Hungary
|
Ascension, CH
|
Poland
|
Valencia
|
Rochester Hills, MI
|
|
Hangzhou
|
Györ
|
Cuautlancingo, PU
|
Bierun
|
Thailand
|
Roscommon, MI
|
|
Liuzhou
|
Mor
|
Fresnillo, ZA
|
Jaroslaw
|
Mueang Nakhon
|
Selma, AL
|
|
Nanjing
|
Szolnok
|
Hermosillo, SO
|
Legnica
|
Ratchasima
|
Tuscaloosa, AL
|
|
Rui’an
|
India
|
Huamantla, TL
|
Tychy
|
Rayong
|
Wentzville, MO
|
|
Shanghai
|
Chennai
|
Juarez, CH
|
Romania
|
United Kingdom
|
Vietnam
|
|
Shenyang
|
Halol
|
Leon, GT
|
Iasi
|
Alfreton
|
Hai Phong City
|
|
Wuhan
|
Haridwar
|
Mexico City, DF
|
Coventry
|
||
|
Wuhu
|
Nasik
|
Monclova, CO
|
Redditch
|
||
|
Pune
|
Sunderland
|
||||
|
E-Systems
|
|||||
|
Argentina
|
Czech Republic
|
Honduras
|
Morocco
|
Russia
|
Thailand
|
|
Pacheco, BA
|
Vyskov
|
Naco
|
Kenitra
|
Volokolamsk
|
Kabin Buri
|
|
Brazil
|
France
|
Hungary
|
Salé Al-Jadida
|
Serbia
|
United States
|
|
Navegantes
|
Hordain
|
Gödöllö
|
Tangier
|
Novi Sad
|
Plymouth, IN
|
|
China
|
Sandouville
|
Gyöngyös
|
Philippines
|
South Africa
|
Taylor, MI
|
|
Chongqing
|
Germany
|
India
|
LapuLapu City
|
Port Elizabeth
|
Traverse City, MI
|
|
Shanghai
|
Bersenbrueck
|
Pune
|
Poland
|
Spain
|
|
|
Wuhan
|
Kronach
|
Mexico
|
Mielec
|
Almussafes
|
|
|
Yangzhou
|
Saarlouis
|
Apodaca, NL
|
Romania
|
Valls
|
|
|
Wismar
|
Chihuahua, CH
|
Campulung
|
|||
|
Juarez, CH
|
Pitesti
|
||||
|
Torreon, CA
|
|||||
|
ADMINISTRATIVE/TECHNICAL
|
|||||
|
Australia
|
France
|
India
|
Mexico
|
South Korea
|
United States
|
|
Essendon Fields
|
Vélizy-
|
Bengaluru
|
Juarez, CH
|
Seoul
|
Detroit, MI
|
|
Belgium
|
Villacoublay
|
Pune
|
Mexico City, DF
|
Spain
|
El Paso, TX
|
|
Leuven
|
Germany
|
Italy
|
Netherlands
|
Valls
|
Rochester Hills, MI
|
|
Brazil
|
Cologne
|
Grugliasco, TO
|
Hilversum
|
Sweden
|
Santa Rosa, CA
|
|
São Paulo
|
Korntal-
|
Japan
|
Philippines
|
Gothenburg
|
Southfield, MI
|
|
China
|
Münchingen
|
Hiroshima
|
LapuLapu City
|
United Kingdom
|
Wilmington, NC
|
|
Shanghai
|
Remscheid
|
Kariya
|
Singapore
|
Coventry
|
|
|
Czech Republic
|
Schwaig-Oberding
|
Nagoya
|
|||
|
Brno
|
Sindelfingen
|
Tokyo
|
|||
|
Pilsen
|
Wolfsburg
|
Yokohama
|
|||
22
Legal and Environmental Matters
We are involved from time to time in various legal proceedings and claims, including, without limitation, commercial or contractual disputes, product liability claims and environmental and other matters. For a description of risks related to various legal proceedings and claims, see Item 1A, "Risk Factors." For a description of our outstanding material legal proceedings, see Note
11
, "
Commitments and Contingencies
," to the consolidated financial statements included in this Report.
None.
SUPPLEMENTARY ITEM – EXECUTIVE OFFICERS OF THE COMPANY
The following table sets forth the names, ages and positions of our executive officers. Executive officers are appointed annually by our Board of Directors and serve at the pleasure of our Board.
|
Name
|
Age
|
Position
|
|
Shari L. Burgess
|
58
|
Vice President, Treasurer and Chief Diversity Officer
|
|
Thomas A. DiDonato
|
58
|
Senior Vice President, Human Resources
|
|
Jay K. Kunkel
|
57
|
Senior Vice President and President, Asia-Pacific Operations
|
|
Terrence B. Larkin
|
62
|
Executive Vice President, Business Development, General Counsel and Corporate Secretary
|
|
James L. Murawski
|
65
|
Vice President, Corporate Controller and Chief Accounting Officer
|
|
Frank C. Orsini
|
44
|
Senior Vice President and President, E-Systems
|
|
Raymond E. Scott
|
51
|
Executive Vice President and President, Seating
|
|
Matthew J. Simoncini
|
56
|
President and Chief Executive Officer
|
|
Melvin L. Stephens
|
61
|
Senior Vice President, Communications and Corporate & Investor Relations
|
|
Jeffrey H. Vanneste
|
57
|
Senior Vice President and Chief Financial Officer
|
Set forth below is a description of the business experience of each of our executive officers.
|
Shari L. Burgess
|
Ms. Burgess is the Company’s Vice President, Treasurer and Chief Diversity Officer, a position she has held since January 2014. Previously, Ms. Burgess served as the Company’s Vice President and Treasurer since August 2002 and in various financial roles since joining the Company in 1992. Prior to joining the Company, Ms. Burgess served as the corporate controller for Victor International Corporation and as an audit manager for Ernst & Young LLP.
|
|
Thomas A. DiDonato
|
Mr. DiDonato is the Company’s Senior Vice President, Human Resources, a position he has held since April 2012. Prior to joining the Company, Mr. DiDonato served as Executive Vice President, Human Resources for American Eagle Outfitters, Inc. since 2005, Chief People Officer for H.J. Heinz since 2004 and Senior Vice President, Human Resources for Heinz North America since 2001. Earlier experiences include directing human resources for a $14 billion division of Merck & Co. and heading worldwide staffing for Pepsico. Mr. DiDonato began his career at General Foods Corporation and moved up to manage the personnel at its largest manufacturing facility.
|
|
Jay K. Kunkel
|
Mr. Kunkel is the Company’s Senior Vice President and President, Asia-Pacific Operations, a position he has held since June 2013. Prior to joining the Company, Mr. Kunkel served as President Asia and as a Member of the Automotive Management Board for Continental A.G. since December 2007 and initially joined Continental A.G. in February 2005. Prior to joining Continental A.G., Mr. Kunkel served as a Director for SRP International Group Ltd. and held various positions of increasing responsibility at PricewaterhouseCoopers, Visteon, Mitsubishi and Chrysler.
|
23
|
Terrence B. Larkin
|
Mr. Larkin is the Company’s Executive Vice President, Business Development, General Counsel and Corporate Secretary, a position he has held since November 2011. Mr. Larkin previously served as the Company’s Senior Vice President, General Counsel and Corporate Secretary since January 2008. Prior to joining the Company, Mr. Larkin was a partner since 1986 of Bodman PLC, a Detroit-based law firm. Mr. Larkin served on the executive committee of Bodman PLC and was the chairman of its business law practice group. Mr. Larkin’s practice was focused on general corporate, commercial transactions and mergers and acquisitions.
|
|
James L. Murawski
|
Mr. Murawski is the Company’s Vice President, Corporate Controller and Chief Accounting Officer, a position he has held since September 2015. Mr. Murawski most recently served as the Company’s Vice President and Chief Information Officer since 2009. Previously, he served as the Company’s Vice President, Operational Finance since 2007, Corporate Controller since 2005 and in various other management positions for the Company since 2003. Prior to joining the Company, Mr. Murawski was employed in public accounting at Deloitte & Touche for fourteen years and in financial positions at various other companies.
|
|
Frank C. Orsini
|
Mr. Orsini is the Company’s Senior Vice President and President, E-Systems, a position he has held since September 2012. Mr. Orsini most recently served as the Company’s Vice President and Interim President, E-Systems since October 2011. Previously, he served as the Company’s Vice President, Operations, E-Systems since 2009, Vice President, Sales, Program Management & Manufacturing, E-Systems since 2008, Vice President, North America Seating Operations since 2005 and in various other management positions for the Company since 1994. Mr. Orsini currently sits on the board of directors of Focus: HOPE, a non-profit organization.
|
|
Raymond E. Scott
|
Mr. Scott is the Company’s Executive Vice President and President, Seating, a position he has held since November 2011. Mr. Scott most recently served as the Company’s Senior Vice President and President, E-Systems since February 2008. Previously, he served as the Company’s Senior Vice President and President, North American Seat Systems Group since August 2006, Senior Vice President and President, North American Customer Group since June 2005, President, European Customer Focused Division since June 2004 and President, General Motors Division since November 2000.
|
|
Matthew J. Simoncini
|
Mr. Simoncini is the Company’s President and Chief Executive Officer, a position he has held since September 2011. Mr. Simoncini most recently served as the Company’s Senior Vice President and Chief Financial Officer since 2007. Previously, he served as the Company’s Senior Vice President, Finance and Chief Accounting Officer since August 2006, Vice President, Global Finance since February 2006, Vice President of Operational Finance since June 2004, Vice President of Finance — Europe since 2001 and prior to 2001, in various senior financial management positions for the Company and UT Automotive, Inc.
|
|
Melvin L. Stephens
|
Mr. Stephens is the Company’s Senior Vice President, Communications and Corporate & Investor Relations, a position he has held since April 2012. Mr. Stephens most recently served as the Company’s Senior Vice President, Communications, Human Resources and Investor Relations since September 2009. Previously, he served as the Company’s Vice President of Corporate Communications and Investor Relations since January 2002. Prior to joining the Company, Mr. Stephens worked for Ford Motor Company for 23 years and held various leadership positions in finance, business planning, corporate strategy, communications, sales and marketing and investor relations.
|
|
Jeffrey H. Vanneste
|
Mr. Vanneste is the Company’s Senior Vice President and Chief Financial Officer, a position he has held since March 2012. Prior to joining the Company, Mr. Vanneste served as Executive Vice President and Chief Financial Officer for International Automotive Components Group ("IAC") since January 2011 and as Chief Financial Officer for IAC North America since March 2007. Prior to joining IAC, Mr. Vanneste worked with the Company in positions of increasing responsibility over 15 plus years including: Vice President of Finance, European Operations, Vice President of Corporate Business Planning and Analysis, Vice President of Finance, Seating and Vice President of Finance for the Ford and GM Divisions. Prior to joining the Company in October 1991, he served as the assistant controller for Champagne-Webber, Inc. and as an audit senior for Coopers & Lybrand.
|
24
RELATED STOCKHOLDER MATTERS AND ISSUER PURCHASES OF EQUITY SECURITIES
Market Information
Our common stock is listed on the New York Stock Exchange under the symbol "LEA."
The high and low sales prices per share of our common stock, as reported on the New York Stock Exchange, and the amount of our dividend declarations for
2016
and
2015
are shown below:
|
2016
|
Price Range of
Common Stock
|
Cash
Dividend Per Share
|
|||||||||
|
High
|
Low
|
||||||||||
|
4
th
Quarter
|
$
|
138.80
|
|
$
|
110.77
|
|
$
|
0.30
|
|
||
|
3
rd
Quarter
|
121.78
|
|
98.00
|
|
0.30
|
|
|||||
|
2
nd
Quarter
|
120.00
|
|
97.35
|
|
0.30
|
|
|||||
|
1
st
Quarter
|
124.56
|
|
93.54
|
|
0.30
|
|
|||||
|
2015
|
Price Range of
Common Stock
|
Cash
Dividend Per Share |
|||||||||
|
High
|
Low
|
||||||||||
|
4
th
Quarter
|
$
|
127.00
|
|
$
|
103.20
|
|
$
|
0.25
|
|
||
|
3
rd
Quarter
|
115.81
|
|
89.71
|
|
0.25
|
|
|||||
|
2
nd
Quarter
|
118.50
|
|
107.80
|
|
0.25
|
|
|||||
|
1
st
Quarter
|
112.67
|
|
92.45
|
|
0.25
|
|
|||||
Dividends
Our Board of Directors declared quarterly cash dividends of
$0.30
and
$0.25
per share of common stock in
2016
and
2015
, respectively.
We currently expect to pay quarterly cash dividends in the future, although such payments are at the discretion of our Board of Directors and will depend upon our financial condition, results of operations, capital requirements, alternative uses of capital and other factors that our Board of Directors may consider at its discretion. In addition, our amended and restated credit agreement places certain limitations on the payment of cash dividends. See Part II — Item 7, "Management’s Discussion and Analysis of Financial Condition and Results of Operations — Forward-Looking Statements," and Note
6
, "
Debt
," to the consolidated financial statements included in this Report.
Holders of Common Stock
The Transfer Agent and Registrar for our common stock is Computershare Trust Company, N.A., located in Canton, Massachusetts. On February 3, 2017, there were 68 registered holders of record of our common stock.
For certain information regarding our equity compensation plans, see Part III — Item 12, "Security Ownership of Certain Beneficial Owners and Management and Related Stockholder Matters — Equity Compensation Plan Information."
Common Stock Share Repurchase Program
Since the first quarter of 2011, our Board of Directors has authorized
$3.4 billion
in share repurchases under our common stock share repurchase program. As of
December 31, 2016
, we have a remaining repurchase authorization of
$341.2 million
, which will expire on December 31, 2017.
We may implement our share repurchases through a variety of methods, including open market purchases, accelerated stock repurchase programs and structured repurchase transactions. The extent to which we will repurchase our outstanding common stock and the timing of such repurchases will depend upon our financial condition, prevailing market conditions, alternative uses of capital and other factors. In addition, our amended and restated credit agreement places certain limitations on the repurchase of common shares. See Part II — Item 7, "Management’s Discussion and Analysis of Financial Condition and
25
Results of Operations — Forward-Looking Statements," Note
6
, "
Debt
," and Note
9
, "
Capital Stock, Equity and Accumulated Other Comprehensive Loss
," to the consolidated financial statements included in this Report.
As of
December 31, 2016
, we have paid
$3.1 billion
in aggregate for repurchases of our outstanding common stock, at an average price of
$74.51
per share, excluding commissions and related fees, since the first quarter of 2011. A summary of the shares of our common stock repurchased during the fiscal quarter ended
December 31, 2016
, is shown below:
|
Period
|
Total Number
of Shares
Purchased
|
Average
Price Paid
per Share
|
Total Number of Shares
Purchased as Part of
Publicly Announced
Plans or Programs
|
Approximate Dollar
Value of Shares that
May Yet be Purchased
Under the Program
(in millions) |
||||||||||
|
October 2, 2016 through October 29, 2016
|
26,280
|
|
$
|
113.70
|
|
26,280
|
|
$
|
439.3
|
|
||||
|
October 30, 2016 through November 26, 2016
|
485,200
|
|
122.98
|
|
485,200
|
|
379.6
|
|
||||||
|
November 27, 2016 through December 31, 2016
|
289,327
|
|
132.78
|
|
289,327
|
|
341.2
|
|
||||||
|
Total
|
800,807
|
|
$
|
126.21
|
|
800,807
|
|
$
|
341.2
|
|
(1)
|
|||
|
(1)
|
Remaining authorization as of
December 31, 2016
.
|
Performance Graph
The following graph compares the cumulative total stockholder return from December 31, 2011, through
December 31, 2016
, for our common stock, the S&P 500 Index and a peer group
(1)
of companies that we have selected for purposes of this comparison. We have assumed that dividends have been reinvested, and the returns of each company in the S&P 500 Index and the peer group have been weighted to reflect relative stock market capitalization. The graph below assumes that $100 was invested on December 31, 2011, in each of our common stock, the stocks comprising the S&P 500 Index and the stocks comprising the peer group.
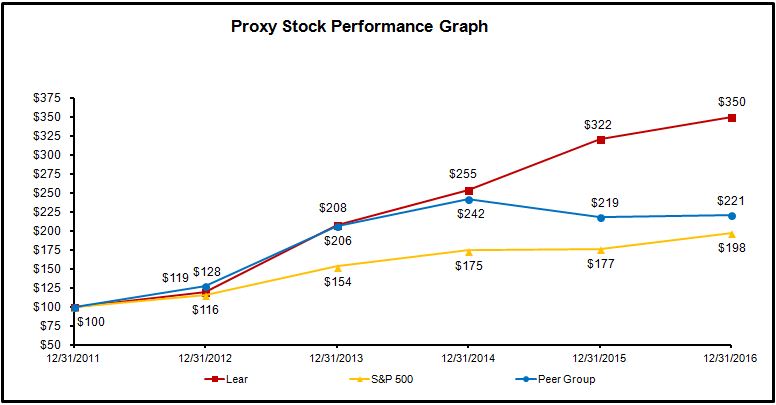
|
December 31,
2011 |
December 31,
2012 |
December 31,
2013 |
December 31,
2014 |
December 31,
2015 |
December 31,
2016 |
|||||||||||||||||||
|
Lear Corporation
|
$
|
100.00
|
|
$
|
119.31
|
|
$
|
208.43
|
|
$
|
254.68
|
|
$
|
321.78
|
|
$
|
350.36
|
|
||||||
|
S&P 500
|
$
|
100.00
|
|
$
|
115.99
|
|
$
|
153.54
|
|
$
|
174.54
|
|
$
|
176.94
|
|
$
|
198.09
|
|
||||||
|
Peer Group
(1)
|
$
|
100.00
|
|
$
|
127.87
|
|
$
|
206.33
|
|
$
|
242.30
|
|
$
|
218.72
|
|
$
|
221.30
|
|
||||||
|
(1)
|
We do not believe that there is a single published industry or line of business index that is appropriate for comparing stockholder returns. As a result, we have selected a peer group comprised of representative independent automotive suppliers whose common stock is publicly traded. Our peer group, referenced in the graph above, consists of American
|
26
Axle & Manufacturing Holdings Inc., BorgWarner Inc., Dana Holding Corporation, Delphi Automotive PLC, Federal-Mogul Holdings Corporation, Gentex Corp., Magna International, Inc., Superior Industries International, Inc., Tenneco Inc. and Visteon Corporation. Delphi Automotive PLC completed an initial public offering in 2011 and has been included in the peer group calculation beginning January 1, 2012. In 2016, Johnson Controls, Inc. completed both a spinoff of its automotive business and a merger with Tyco International plc and, accordingly, is not included in the peer group for any period presented.
The following statement of operations, statement of cash flows and balance sheet data were derived from our consolidated financial statements. Our consolidated financial statements for the years ended
December 31, 2016
,
2015
,
2014
,
2013
and
2012
, have been audited by Ernst & Young LLP. The selected financial data below should be read in conjunction with Item 7, "Management’s Discussion and Analysis of Financial Condition and Results of Operations," and our consolidated financial statements and the notes thereto included in this Report.
|
For the year ended December 31,
|
2016
(1)
|
2015
(2)
|
2014
(3)
|
2013
(4)
|
2012
(5)
|
||||||||||||||
|
Statement of Operations:
(in millions)
|
|||||||||||||||||||
|
Net sales
|
$
|
18,557.6
|
|
$
|
18,211.4
|
|
$
|
17,727.3
|
|
$
|
16,234.0
|
|
$
|
14,567.0
|
|
||||
|
Gross profit
|
2,102.1
|
|
1,819.8
|
|
1,492.8
|
|
1,299.7
|
|
1,217.5
|
|
|||||||||
|
Selling, general and administrative expenses
|
621.9
|
|
580.5
|
|
529.9
|
|
528.7
|
|
479.3
|
|
|||||||||
|
Amortization of intangible assets
|
53.0
|
|
52.5
|
|
33.7
|
|
34.4
|
|
33.0
|
|
|||||||||
|
Interest expense
|
82.5
|
|
86.7
|
|
67.5
|
|
68.4
|
|
49.9
|
|
|||||||||
|
Other expense, net
(6)
|
6.4
|
|
68.6
|
|
74.3
|
|
58.1
|
|
6.4
|
|
|||||||||
|
Consolidated income before provision (benefit) for income taxes and equity in net income of affiliates
|
1,338.3
|
|
|
1,031.5
|
|
|
787.4
|
|
|
610.1
|
|
|
648.9
|
|
|||||
|
Provision (benefit) for income taxes
|
370.2
|
|
285.5
|
|
121.4
|
|
192.7
|
|
(638.0
|
)
|
|||||||||
|
Equity in net income of affiliates
|
(72.4
|
)
|
(49.8
|
)
|
(36.3
|
)
|
(38.4
|
)
|
(30.3
|
)
|
|||||||||
|
Consolidated net income
|
1,040.5
|
|
795.8
|
|
702.3
|
|
455.8
|
|
1,317.2
|
|
|||||||||
|
Net income attributable to noncontrolling interests
|
65.4
|
|
50.3
|
|
29.9
|
|
24.4
|
|
34.4
|
|
|||||||||
|
Net income attributable to Lear
|
$
|
975.1
|
|
$
|
745.5
|
|
$
|
672.4
|
|
$
|
431.4
|
|
$
|
1,282.8
|
|
||||
|
For the year ended December 31,
|
2016
(1)
|
2015
(2)
|
2014
(3)
|
2013
(4)
|
2012
(5)
|
||||||||||||||
|
Statement of Operations Data:
|
|||||||||||||||||||
|
Basic net income per share attributable to Lear
|
$
|
13.48
|
|
$
|
9.71
|
|
$
|
8.39
|
|
$
|
5.07
|
|
$
|
13.04
|
|
||||
|
Diluted net income per share attributable to Lear
|
$
|
13.33
|
|
$
|
9.59
|
|
$
|
8.23
|
|
$
|
4.99
|
|
$
|
12.85
|
|
||||
|
Weighted average shares outstanding – basic
|
72,345,436
|
|
76,754,270
|
|
80,187,516
|
|
85,094,889
|
|
98,388,228
|
|
|||||||||
|
Weighted average shares outstanding – diluted
|
73,124,949
|
|
77,767,017
|
|
81,728,479
|
|
86,415,786
|
|
99,825,686
|
|
|||||||||
|
Dividends per share
|
$
|
1.20
|
|
$
|
1.00
|
|
$
|
0.80
|
|
$
|
0.68
|
|
$
|
0.56
|
|
||||
|
Statement of Cash Flows Data:
(in millions)
|
|||||||||||||||||||
|
Cash flows from operating activities
|
$
|
1,619.3
|
|
$
|
1,271.1
|
|
$
|
927.8
|
|
$
|
820.1
|
|
$
|
729.8
|
|
||||
|
Cash flows from investing activities
|
(637.1
|
)
|
(965.3
|
)
|
(780.6
|
)
|
(403.9
|
)
|
(687.9
|
)
|
|||||||||
|
Cash flows from financing activities
|
(872.9
|
)
|
(156.3
|
)
|
(160.8
|
)
|
(698.5
|
)
|
(396.1
|
)
|
|||||||||
|
Capital expenditures
|
528.3
|
|
485.8
|
|
424.7
|
|
460.6
|
|
458.3
|
|
|||||||||
|
Other Data
(unaudited):
|
|||||||||||||||||||
|
Ratio of earnings to fixed charges
(7)
|
12.0x
|
|
9.4x
|
|
8.4x
|
|
6.8x
|
|
8.7x
|
|
|||||||||
27
|
As of or for the year ended December 31,
|
2016
|
2015
|
2014
|
2013
|
2012
|
||||||||||||||
|
Balance Sheet Data:
(in millions)
(8)
|
|||||||||||||||||||
|
Current assets
|
$
|
5,649.3
|
|
$
|
5,286.6
|
|
$
|
5,165.6
|
|
$
|
4,735.1
|
|
$
|
4,707.5
|
|
||||
|
Total assets
|
9,900.6
|
|
9,405.8
|
|
9,113.1
|
|
8,303.0
|
|
8,164.0
|
|
|||||||||
|
Current liabilities
|
4,182.3
|
|
3,839.6
|
|
3,945.1
|
|
3,556.0
|
|
3,197.8
|
|
|||||||||
|
Long-term debt
|
1,898.0
|
|
1,931.7
|
|
1,454.0
|
|
1,042.3
|
|
616.1
|
|
|||||||||
|
Equity
|
3,192.9
|
|
3,017.7
|
|
3,029.3
|
|
3,149.5
|
|
3,612.2
|
|
|||||||||
|
Other Data
(unaudited):
|
|||||||||||||||||||
|
Employees at year end
|
148,400
|
|
136,200
|
|
125,200
|
|
122,300
|
|
113,400
|
|
|||||||||
|
North American content per vehicle
(9)
|
$
|
422
|
|
$
|
443
|
|
$
|
398
|
|
$
|
377
|
|
$
|
370
|
|
||||
|
North American vehicle production (in millions)
(10)
|
17.8
|
|
17.5
|
|
17.0
|
|
16.2
|
|
15.4
|
|
|||||||||
|
European content per vehicle
(11)
|
$
|
316
|
|
$
|
314
|
|
$
|
341
|
|
$
|
315
|
|
$
|
283
|
|
||||
|
European vehicle production (in millions)
(12)
|
22.3
|
|
21.5
|
|
20.6
|
|
19.8
|
|
19.6
|
|
|||||||||
|
(1)
|
2016 results include $69.6 million of restructuring and related manufacturing inefficiency charges (including $4.7 million of fixed asset impairment charges), $34.2 million non-cash pension settlement charge, $1.3 million of transaction costs, $30.3 million gain related to the consolidation of an affiliate and $23.6 million of net tax benefits related to restructuring charges, a non-cash pension settlement charge and various other items.
|
|
(2)
|
2015 results include $97.2 million of restructuring and related manufacturing inefficiency charges (including $3.9 million of fixed asset impairment charges), $10.9 million of transaction and other related costs, $15.8 million charge due to an acquisition-related inventory fair value adjustment, $14.3 million loss on the extinguishment of debt, $1.8 million loss related to an affiliate and $43.1 million of net tax benefits related to restructuring charges, debt redemption costs, acquisition costs and various other items.
|
|
(3)
|
2014 results include $115.3 million of restructuring and related manufacturing inefficiency charges (including $0.5 million of fixed asset impairment charges), $5.3 million of transaction costs, $17.9 million loss on the extinguishment of debt, $0.8 million of losses related to affiliates and $149.1 million of net tax benefits related to net reductions in valuation allowances with respect to the deferred tax assets of certain foreign subsidiaries, reductions in tax reserves due to audit settlements, debt redemption costs, restructuring charges and various other items.
|
|
(4)
|
2013 results include $83.8 million of restructuring and related manufacturing inefficiency charges (including $9.2 million of fixed asset impairment charges),
$3.0 million
of costs related to a proxy contest, $7.3 million of losses and incremental costs related to the destruction of assets caused by a fire at one of our European production facilities, $3.6 million loss on the partial extinguishment of debt and
$27.8 million
of net tax benefits related to restructuring, net changes in valuation allowances with respect to the deferred tax assets of certain foreign subsidiaries, the retroactive reinstatement of the U.S. research and development tax credit by the American Taxpayer Relief Act of 2012, which was signed into law on January 2, 2013, and various other items.
|
|
(5)
|
2012 results include $55.6 million of restructuring and related manufacturing inefficiency charges (including $6.0 million of fixed asset impairment charges), $6.2 million of transaction costs primarily related to advisory services for the acquisition of Guilford Mills, $10.1 million of fees and expenses related to our capital restructuring and other related matters, ($41.1) million of insurance recoveries, net of losses and incremental costs, related to the destruction of assets caused by a fire at one of our European production facilities, $5.1 million of gains related to affiliates, a $3.7 million loss on the partial extinguishment of debt and $764.4 million of net tax benefits related to the reversal of a valuation allowance on our deferred tax assets in the United States, as well as changes in valuation allowances in certain foreign countries, reductions in tax reserves due to audit settlements and various other items.
|
|
(6)
|
Includes non-income related taxes, foreign exchange gains and losses, gains and losses related to certain derivative instruments and hedging activities, gains and losses on the extinguishment of debt, gains and losses on the disposal of fixed assets and other miscellaneous income and expense.
|
|
(7)
|
"Fixed charges" consist of interest on debt, amortization of deferred financing fees and that portion of rental expenses representative of interest. "Earnings" consist of consolidated income before provision (benefit) for income taxes and equity in the undistributed net income of affiliates and fixed charges.
|
|
(8)
|
The balance sheet data for 2014, 2013 and 2012 has been restated to reflect the presentation of debt issuance costs as a reduction of current portion of long-term debt and long-term debt in conjunction with the 2015 adoption of Accounting
|
28
Standards Update ("ASU") 2015-03, "Interest — Imputation of Interest (Subtopic 835-30): Simplifying the Presentation of Debt Issuance Costs," and ASU 2015-15, "Interest — Imputation of Interest (Subtopic 835-30): Presentation and Subsequent Measurement of Debt Issuance Costs Associated with Line-of-Credit Arrangements — Amendments to SEC Paragraphs Pursuant to Staff Announcement at June 18, 2015 EITF Meeting." In addition, the balance sheet data for 2014, 2013 and 2012 has been restated to reflect the presentation of all deferred tax assets and liabilities, as well as related valuation allowances, as non-current in conjunction with the 2015 adoption of ASU 2015-17, "Balance Sheet Classification of Deferred Taxes." For further information, see Note
6
, "
Debt
," and Note
7
, "
Income Taxes
," to the consolidated financial statements included in this Report.
|
(9)
|
"North American content per vehicle" is our net sales in North America divided by total North American vehicle production. Content per vehicle data excludes business conducted through non-consolidated joint ventures. Content per vehicle data for
2015
has been updated to reflect actual production levels.
|
|
(10)
|
"North American vehicle production" includes car and light truck production for vehicle weights up to 3.5 tons in the United States, Canada and Mexico as provided by IHS Automotive. Production data for
2015
has been updated to reflect actual production levels.
|
|
(11)
|
"European content per vehicle" is our net sales in Europe and Africa divided by total European and African vehicle production. Content per vehicle data excludes business conducted through non-consolidated joint ventures. Content per vehicle data for
2015
has been updated to reflect actual production levels.
|
|
(12)
|
"European vehicle production" includes car and light truck production for vehicle weights up to 3.5 tons in Austria, Belarus, Belgium, Bosnia, Bulgaria, Czech Republic, Finland, France, Germany, Hungary, Italy, Morocco, Netherlands, Norway, Poland, Portugal, Romania, Russia, Serbia, Slovakia, Slovenia, South Africa, Spain, Sweden, Turkey, Ukraine and the United Kingdom as provided by IHS Automotive. Production data for
2015
has been updated to reflect actual production levels.
|
29
Executive Overview
We are a leading Tier 1 supplier to the global automotive industry. We supply seating, electrical distribution systems and electronic modules, as well as related sub-systems, components and software, to virtually every major automotive manufacturer in the world.
We use our product, design and technological expertise, global reach and competitive manufacturing footprint to achieve our financial goals and objectives of continuing to deliver profitable growth (balancing risks and returns), maintaining a strong balance sheet with investment grade credit metrics and consistently returning excess cash to our shareholders.
Our seating business consists of the design, development, engineering, just-in-time assembly and delivery of complete seat systems, as well as the design, development, engineering and manufacture of all major seat components, including seat covers and surface materials such as leather and fabric, seat structures and mechanisms, seat foam and headrests. Further, we have capabilities in active sensing and comfort for seats, utilizing electronically controlled sensor and adjustment systems and internally developed algorithms. Our E-Systems (formerly electrical) business consists of the design, development, engineering and manufacture of complete electrical distribution systems that route electrical signals and manage electrical power within the vehicle for traditional vehicle architectures, as well as high power and hybrid electric systems. Key components in the electrical distribution system include wiring harnesses, terminals and connectors and junction boxes, including components for high power and hybrid electric systems. We also design, develop, engineer and manufacture sophisticated electronic control modules that facilitate signal, data and power management within the vehicle, as well as associated software. We have added capabilities in wireless communication modules and cybersecurity that securely process various signals to, from and within the vehicle, as well road infrastructure.
We serve all of the world's major automotive manufacturers across both our seating and E-Systems businesses. It is common to have both seating and electrical content on the same and multiple vehicle platforms with a single customer. Our businesses benefit globally from leveraging common operating standards and disciplines, including world-class development and manufacturing processes, as well as common customer support and regional infrastructures. Our core capabilities are shared across component categories, including high-precision manufacturing and assembly with short lead times, management of complex supply chains, global engineering and program management skills and a unique customer-focused culture. Our businesses utilize proprietary, industry-specific processes and standards, leverage common low-cost engineering centers and share centralized operating support functions, such as logistics, supply chain management, quality and health and safety, as well as all major administrative functions.
Industry Overview
Our sales are driven by the number of vehicles produced by the automotive manufacturers, which is ultimately dependent on consumer demand for automotive vehicles, and our content per vehicle. Global automotive industry production volumes in
2016
, as compared to
2015
, are shown below (in millions of units):
|
2016
|
2015
|
% Change
|
||||
|
North America
|
17.8
|
17.5
|
2
|
%
|
||
|
Europe and Africa
|
22.3
|
21.5
|
4
|
%
|
||
|
Asia
|
47.0
|
43.9
|
7
|
%
|
||
|
South America
|
2.6
|
2.9
|
(9
|
)%
|
||
|
Other
|
1.5
|
1.3
|
19
|
%
|
||
|
Global light vehicle production
|
91.2
|
87.1
|
5
|
%
|
||
Automotive sales and production can be affected by the age of the vehicle fleet and related scrappage rates, labor relations issues, fuel prices, regulatory requirements, government initiatives, trade agreements, the availability and cost of credit, the availability of critical components needed to complete the production of vehicles, restructuring actions of our customers and suppliers, facility closures, changing consumer attitudes toward vehicle ownership and usage and other factors. Our operating results are also significantly impacted by the overall commercial success of the vehicle platforms for which we supply particular products, as well as the profitability of the products that we supply for these platforms. The loss of business with respect to any vehicle model for which we are a significant supplier, or a decrease in the production levels of any such models, could adversely affect our operating results. In addition, larger cars and light trucks, as well as vehicle platforms that offer more features and functionality, such as luxury, sport utility and crossover vehicles, typically have more content and, therefore, tend to have a more significant impact on our operating results.
30
Our percentage of consolidated net sales by region in
2016
and
2015
is shown below:
|
2016
|
2015
|
||||
|
North America
|
40
|
%
|
43
|
%
|
|
|
Europe and Africa
|
38
|
%
|
37
|
%
|
|
|
Asia
|
19
|
%
|
18
|
%
|
|
|
South America
|
3
|
%
|
2
|
%
|
|
|
Total
|
100
|
%
|
100
|
%
|
|
Our ability to reduce the risks inherent in certain concentrations of business, and thereby maintain our financial performance in the future, will depend, in part, on our ability to continue to diversify our sales on a customer, product, platform and geographic basis to reflect the market overall.
Key trends that specifically affect our business include automotive manufacturers’ utilization of global vehicle platforms, increasing demand for luxury and performance features, including increasing levels of electrical and electronic content, and China’s emergence as the single largest major automotive market in the world. In addition, three major mega-trends have broadly emerged as major drivers of change and growth in the automotive industry: connectivity, safety and efficiency.
Our sales and marketing approach is based on addressing these trends, while our strategy focuses on the major imperatives for success as an automotive supplier: quality, service, cost and efficiency and innovation and technology. We have expanded key component and software capabilities through organic investment and acquisitions to ensure a full complement of the highest quality solutions for our customers. We have restructured, and continue to align, our manufacturing and engineering footprint to attain a leading competitive position globally. We have established or expanded our capabilities in new and growing markets, especially China, in support of our customers’ growth and global platform initiatives. These initiatives have helped us achieve our financial goals overall, as well as a more balanced regional, customer and vehicle segment diversification in our business. For further information related to these trends and our strategy, see Part 1 — Item 1, "Business — Industry and Strategy."
Our customers typically require us to reduce our prices over the life of a vehicle model and, at the same time, assume significant responsibility for the design, development and engineering of our products. Our financial performance is largely dependent on our ability to achieve product cost reductions through product design enhancement and supply chain management, as well as manufacturing efficiencies and restructuring actions. We also seek to enhance our financial performance by investing in product development, design capabilities and new product initiatives that respond to the needs of our customers and consumers. We continually evaluate operational and strategic alternatives to improve our business structure and align our business with the changing needs of our customers and major industry trends affecting our business.
Our material cost as a percentage of net sales was 64.8% in
2016
, as compared to 66.6% in
2015
and 67.8% in
2014
. Raw material, energy and commodity costs can be volatile. We have developed and implemented strategies to mitigate the impact of higher raw material, energy and commodity costs, such as the selective in-sourcing of components, the continued consolidation of our supply base, longer-term purchase commitments and the selective expansion of low-cost country sourcing and engineering, as well as value engineering and product benchmarking. However, these strategies, together with commercial negotiations with our customers and suppliers, typically offset only a portion of the adverse impact. Certain of these strategies also may limit our opportunities in a declining commodity environment. In addition, the availability of raw materials, commodities and product components fluctuates from time to time due to factors outside of our control. If these costs increase or availability is restricted, it could have an adverse impact on our operating results in the foreseeable future. See Part I — Item 1A, "Risk Factors — Increases in the costs and restrictions on the availability of raw materials, energy, commodities and product components could adversely affect our financial performance," and "— Forward-Looking Statements."
Financial Measures
In evaluating our financial condition and operating performance, we focus primarily on earnings, operating margins, cash flows and return on invested capital. In addition to maintaining and expanding our business with our existing customers in our more established markets, our expansion plans are focused primarily on emerging markets. Asia, in particular, continues to present significant growth opportunities, as major global automotive manufacturers implement production expansion plans and local automotive manufacturers aggressively expand their operations to meet increasing demand in this region. We currently have fifteen joint ventures with operations in Asia, as well as an additional joint venture in North America dedicated to serving Asian automotive manufacturers. We also have aggressively pursued this strategy by selectively increasing our vertical integration capabilities globally, as well as expanding our component manufacturing capacity in Asia, Brazil, Eastern Europe, Mexico and Northern Africa. Furthermore, we have expanded our low-cost engineering capabilities in India and the Philippines.
31
Our success in generating cash flow will depend, in part, on our ability to manage working capital effectively. Working capital can be significantly impacted by the timing of cash flows from sales and purchases. Historically, we generally have been successful in aligning our vendor payment terms with our customer payment terms. However, our ability to continue to do so may be impacted by adverse automotive industry conditions, changes to our customers’ payment terms and the financial condition of our suppliers, as well as our financial condition. In addition, our cash flow is impacted by our ability to manage our inventory and capital spending effectively. We utilize return on invested capital as a measure of the efficiency with which our assets generate earnings. Improvements in our return on invested capital will depend on our ability to maintain an appropriate asset base for our business and to increase productivity and operating efficiency.
Acquisitions
Eagle Ottawa
On January 5, 2015, we completed the acquisition of Everett Smith Group Ltd., the parent of Eagle Ottawa, LLC ("Eagle Ottawa"), the world's leading provider of leather for the automotive industry, with annual sales of approximately $1 billion (including annual sales to Lear of approximately $200 million), for approximately $844 million. Eagle Ottawa was a privately-held company based in Auburn Hills, Michigan and has a reputation for superior quality, product innovation and craftsmanship. This acquisition has further strengthened our global seating business, enhanced our position as the industry leader in luxury and performance automotive seating and complemented our existing capabilities in the design and manufacturing of seat covers.
Other
In 2016, we acquired AccuMED Holdings Corp. ("AccuMED"), a privately-held developer and manufacturer of specialty fabrics. AccuMED provides innovative fabric processing technology that will benefit our automotive fabric operations, and it adds critical mass to our existing non-automotive fabric products.
In 2015, we acquired intellectual property and technology from Autonet Mobile, a developer of software and devices for automotive applications, and completed the acquisition of Arada Systems Inc, an automotive technology company that specializes in vehicle-to-vehicle and vehicle-to-infrastructure communications. These acquisitions have added software and hardware capabilities that will improve connectivity and communication features in vehicles, as well as provide growth opportunities for our E-Systems segment.
Subsequent Event
On February 6, 2017, we signed a definitive agreement to acquire Grupo Antolin's automotive seating business. Grupo Antolin's seating business is headquartered in France with sales and operations concentrated in
five
European countries. Grupo Antolin's seating business is comprised of just-in-time seat assembly, as well as seat structures, mechanisms and trim. The transaction is valued at approximately
€286 million
on a cash and debt free basis. The closing of the transaction is expected to occur in the second quarter of 2017 and is subject to customary conditions, including regulatory approvals.
Operational Restructuring
In
2016
, we incurred pretax restructuring costs of approximately
$64 million
and related manufacturing inefficiency charges of approximately
$6 million
. Any future restructuring actions will depend upon market conditions, customer actions and other factors.
For further information, see Note
4
, "
Restructuring
," to the consolidated financial statements included in this Report.
Financing Transactions
Senior Notes
In November 2014, we issued $650 million in aggregate principal amount of 5.25% senior unsecured notes due 2025 (the "2025 Notes"). In January 2015, we used $350 million of the net proceeds from the offering, along with $500 million in borrowings under the term loan facility (see "— Credit Agreement" below), to finance the acquisition of Eagle Ottawa. In March 2015, we used $250 million of the net proceeds from the offering, along with $5 million in available cash, to redeem the remaining outstanding aggregate principal amount of our 8.125% senior unsecured notes due 2020 (the "2020 Notes"). In connection with this transaction, we recognized a loss of approximately $14 million on the extinguishment of debt.
In March 2014, we refinanced certain of our outstanding indebtedness to lower our borrowing costs and extend our debt maturity profile. In March 2014, we issued $325 million in aggregate principal amount of 5.375% senior unsecured notes due 2024 (the "2024 Notes") and paid $327 million to redeem the remaining outstanding aggregate principal amount of our 7.875%
32
senior unsecured notes due 2018 (the "2018 Notes") and 10% of the original aggregate principal amount of the 2020 Notes. In connection with these transactions, we recognized losses of approximately $18 million on the extinguishment of debt.
For further information, see "— Liquidity and Financial Condition — Capitalization — Senior Notes" and Note
6
, "
Debt
," to the consolidated financial statements included in this Report.
Credit Agreement
In November 2014, we amended and restated our senior secured credit agreement ("Credit Agreement") to, among other things, increase the borrowing capacity of our revolving credit facility (the "Revolving Credit Facility") from
$1.0 billion
to
$1.25 billion
, extend the maturity of the facility from January 30, 2018 to November 14, 2019, and establish a
$500 million
delayed-draw term loan facility (the "Term Loan Facility"), which matures on January 5, 2020. In January 2015, we borrowed $500 million under the Term Loan Facility to finance, in part, the acquisition of Eagle Ottawa. For further information, see "— Liquidity and Financial Condition — Capitalization — Credit Agreement" and Note
6
, "
Debt
," to the consolidated financial statements included in this Report.
Share Repurchase Program and Quarterly Cash Dividends
Since the first quarter of 2011, our Board of Directors has authorized
$3.4 billion
in share repurchases under our common stock share repurchase program. In
2016
, we completed
$659 million
of share repurchases and have a remaining repurchase authorization of
$341 million
, which will expire on December 31, 2017.
Our Board of Directors declared a quarterly cash dividend of
$0.30
per share of common stock in
2016
.
For further information regarding our common stock share repurchase program and our quarterly dividends, see Item 5, "Market for the Company’s Common Equity, Related Stockholder Matters and Issuer Purchases of Equity Securities," "— Liquidity and Financial Condition — Capitalization" and Note
9
, "
Capital Stock, Equity and Accumulated Other Comprehensive Loss
," to the consolidated financial statements included in this Report.
Other Matters
In 2016, we amended the existing joint venture agreement of Beijing BAI Lear Automotive Systems Co., Ltd. (“Beijing BAI”) to eliminate the substantive participating rights of our joint venture partner. In conjunction with the consolidation of Beijing BAI and the valuation of our prior equity investment in Beijing BAI at fair value, we recognized a gain of approximately $30 million.
In 2016, we recognized a $34 million non-cash settlement charge, of which approximately $20 million is recorded in cost of sales and approximately $14 million is recorded in selling, general and administrative expenses, in connection with our lump-sum payout to certain terminated vested plan participants of our U.S. defined benefit pension plans.
In 2016, we recognized net tax benefits of $24 million related to restructuring charges, a non-cash pension settlement charge and various other items.
In 2015, we recognized net tax benefits of $43 million related to restructuring charges, debt redemption costs, acquisition costs and various other items.
In 2014, we recognized net tax benefits of $111 million primarily related to net reductions in valuation allowances with respect to the deferred tax assets of certain foreign subsidiaries and reductions in tax reserves due to audit settlements and net tax benefits of $38 million related to debt redemption costs, restructuring charges and various other items.
As discussed above, our results for the years ended
December 31, 2016
,
2015
and
2014
, reflect the following items (in millions):
|
For the year ended December 31,
|
2016
|
2015
|
2014
|
||||||||
|
Costs related to restructuring actions, including manufacturing inefficiencies of $6 million in 2016, $8 million in 2015 and $8 million in 2014
|
$
|
70
|
|
$
|
97
|
|
$
|
115
|
|
||
|
Pension settlement charge
|
34
|
|
—
|
|
—
|
|
|||||
|
Acquisition and other related costs
|
1
|
|
11
|
|
5
|
|
|||||
|
Acquisition-related inventory fair value adjustment
|
—
|
|
16
|
|
—
|
|
|||||
|
Losses on extinguishment of debt
|
—
|
|
14
|
|
18
|
|
|||||
|
(Gain) loss related to affiliate
|
(30
|
)
|
2
|
|
1
|
|
|||||
|
Tax benefits, net
|
(24
|
)
|
(43
|
)
|
(149
|
)
|
|||||
33
For further information regarding these items, see Note
3
, "
Acquisitions
," Note
4
, "
Restructuring
," Note
5
, "
Investments in Affiliates and Other Related Party Transactions
," Note
6
, "
Debt
," Note
7
, "
Income Taxes
," and Note 8, "Pension and Other Postretirement Benefit Plans," to the consolidated financial statements included in this Report. This section includes forward-looking statements that are subject to risks and uncertainties. For further information regarding these and other factors that have had, or may have in the future, a significant impact on our business, financial condition or results of operations, see Part I — Item 1A, "Risk Factors," and "— Forward-Looking Statements."
Results of Operations
A summary of our operating results in millions of dollars and as a percentage of net sales is shown below:
|
For the year ended December 31,
|
2016
|
2015
|
2014
|
|||||||||||||||||
|
Net sales
|
||||||||||||||||||||
|
Seating
|
$
|
14,356.7
|
|
77.4
|
%
|
$
|
14,098.5
|
|
77.4
|
%
|
$
|
13,310.6
|
|
75.1
|
%
|
|||||
|
E-Systems
|
4,200.9
|
|
22.6
|
|
4,112.9
|
|
22.6
|
|
4,416.7
|
|
24.9
|
|
||||||||
|
Net sales
|
18,557.6
|
|
100.0
|
|
18,211.4
|
|
100.0
|
|
17,727.3
|
|
100.0
|
|
||||||||
|
Cost of sales
|
16,455.5
|
|
88.7
|
|
16,391.6
|
|
90.0
|
|
16,234.5
|
|
91.6
|
|
||||||||
|
Gross profit
|
2,102.1
|
|
11.3
|
|
1,819.8
|
|
10.0
|
|
1,492.8
|
|
8.4
|
|
||||||||
|
Selling, general and administrative expenses
|
621.9
|
|
3.4
|
|
580.5
|
|
3.2
|
|
529.9
|
|
3.0
|
|
||||||||
|
Amortization of intangible assets
|
53.0
|
|
0.3
|
|
52.5
|
|
0.3
|
|
33.7
|
|
0.2
|
|
||||||||
|
Interest expense
|
82.5
|
|
0.4
|
|
86.7
|
|
0.3
|
|
67.5
|
|
0.4
|
|
||||||||
|
Other expense, net
|
6.4
|
|
—
|
|
68.6
|
|
0.4
|
|
74.3
|
|
0.3
|
|
||||||||
|
Provision for income taxes
|
370.2
|
|
2.0
|
|
285.5
|
|
1.6
|
|
121.4
|
|
0.7
|
|
||||||||
|
Equity in net income of affiliates
|
(72.4
|
)
|
(0.4
|
)
|
(49.8
|
)
|
(0.3
|
)
|
(36.3
|
)
|
(0.2
|
)
|
||||||||
|
Net income attributable to noncontrolling interests
|
65.4
|
|
0.3
|
|
50.3
|
|
0.2
|
|
29.9
|
|
0.1
|
|
||||||||
|
Net income attributable to Lear
|
$
|
975.1
|
|
5.3
|
%
|
$
|
745.5
|
|
4.3
|
%
|
$
|
672.4
|
|
3.9
|
%
|
|||||
Year Ended
December 31, 2016
, Compared With Year Ended
December 31, 2015
Net sales for the year ended
December 31, 2016
were
$18.6 billion
, as compared to
$18.2 billion
for the year ended
December 31, 2015
, an increase of
$346 million
or
2%
. New business in Asia, Europe and South America and higher production volumes on key Lear platforms in Europe and Asia positively impacted net sales by $845 million and $139 million, respectively. These increases were partially offset by net foreign exchange rate fluctuations related to the strengthening of the U.S. dollar against most major currencies and selling price reductions, which reduced net sales by $602 million.
|
(in millions)
|
Cost of Sales
|
|||
|
2015
|
$
|
16,391.6
|
|
|
|
Material cost
|
(91.4
|
)
|
||
|
Labor and other
|
128.0
|
|
||
|
Depreciation
|
27.3
|
|
||
|
2016
|
$
|
16,455.5
|
|
|
Cost of sales in
2016
was
$16.5 billion
, as compared to
$16.4 billion
in
2015
. New business in Asia, Europe and South America and higher production volumes on key Lear platforms in Europe and Asia resulted in an increase in cost of sales of $810 million. These increases were partially offset by favorable operating performance and the benefit of operational restructuring actions and net foreign exchange rate fluctuations related to the strengthening of the U.S. dollar against most major currencies, which reduced cost of sales by $703 million.
Gross profit and gross margin were
$2.1 billion
and
11.3%
of net sales in
2016
, as compared to
$1.8 billion
and
10.0%
of net sales in
2015
. New business and higher production volumes on key Lear platforms positively impacted gross profit by $148 million. The impact of favorable operating performance and the benefit of operational restructuring actions of $412 million more than offset the impact of selling price reductions and net foreign exchange rate fluctuations of $300 million. These factors had a corresponding impact on gross margin.
34
Selling, general and administrative expenses, including engineering and development expenses, were
$622 million
for the year ended
December 31, 2016
, as compared to
$581 million
for the year ended
December 31, 2015
, reflecting an increase in engineering and development expenses to support future business growth, as well as a $14 million non-cash settlement charge in connection with our lump-sum payout to certain terminated vested plan participants of our U.S. defined benefit pension plans. As a percentage of net sales, selling, general and administrative expenses were
3.4%
in
2016
, as compared to
3.2%
in
2015
.
Engineering and development costs incurred in connection with the development of new products and manufacturing methods, to the extent not recoverable from the customer, are charged to selling, general and administrative expenses as incurred. Such costs totaled $144 million in
2016
, as compared to $127 million in
2015
. In certain situations, the reimbursement of pre-production engineering and design costs is contractually guaranteed by, and fully recoverable from, our customers and, therefore, is capitalized. We capitalized
$179 million
of such costs in
2016
, as compared to
$194 million
in
2015
.
Amortization of intangible assets was
$53 million
in
2016
and
2015
.
Interest expense was
$83 million
in
2016
, as compared to
$87 million
in
2015
.
Other expense, net, which includes non-income related taxes, foreign exchange gains and losses, gains and losses related to certain derivative instruments and hedging activities, gains and losses on the extinguishment of debt, gains and losses on the disposal of fixed assets and other miscellaneous income and expense, was
$6 million
in
2016
, as compared to
$69 million
in
2015
. In
2016
, we recognized a gain of approximately $30 million related to the consolidation of an affiliate. In
2015
, we recognized a loss of approximately $14 million related to the redemption of the remaining outstanding aggregate principal amount of our 8.125% senior unsecured notes due 2020. Net foreign exchange losses decreased to $10 million in
2016
, as compared to $23 million in
2015
.
In
2016
, the provision for income taxes was
$370 million
, representing an effective tax rate of
27.7%
on pretax income before equity in net income of affiliates of
$1,338 million
. In
2015
, the provision for income taxes was
$286 million
, representing an effective tax rate of
27.7%
on pretax income before equity in net income of affiliates of
$1,032 million
.
In 2016 and 2015, the provision for income taxes was impacted by the level and mix of earnings among tax jurisdictions. The provision was also impacted by a portion of our restructuring charges and other expenses, for which no tax benefit was provided as the charges were incurred in certain countries for which no tax benefit is likely to be realized due to a history of operating losses in those countries. In 2016, we recognized a gain of approximately $30 million related to the consolidation of an affiliate, for which no tax expense was provided. In addition, we recognized net tax benefits of $24 million related to restructuring charges, a non-cash pension settlement charge and various other items. In 2015, we recognized net tax benefits of $43 million related to restructuring charges, debt redemption costs, acquisition costs and various other items. Excluding these items, the effective tax rate in 2016 and 2015 approximated the U.S. federal statutory income tax rate of 35% adjusted for income taxes on foreign earnings, losses and remittances, valuation allowances, tax credits, income tax incentives and other permanent items.
For information related to our valuation allowances, see "Other Matters — Significant Accounting Policies and Critical Accounting Estimates — Income Taxes."
Equity in net income of affiliates was
$72 million
for the year ended
December 31, 2016
, as compared to
$50 million
for the year ended
December 31, 2015
, reflecting the increase in sales and improved operating performance of our equity affiliates in China.
Net income attributable to Lear was
$975 million
, or
$13.33
per diluted share, in
2016
, as compared to
$746 million
, or
$9.59
per diluted share, in
2015
. Net income and diluted net income per share increased for the reasons described above. In addition, diluted net income per share was impacted by the decrease in average shares outstanding between the periods.
Reportable Operating Segments
We have
two
reportable operating segments: seating, which includes complete seat systems and all major seat components, including seat covers and surface materials such as leather and fabric, seat structures and mechanisms, seat foam and headrests, and E-Systems, which includes complete electrical distribution systems, electronic control modules and associated software and wireless communication modules. Key components in the electrical distribution system include wiring harnesses, terminals and connectors and junction boxes, including components for high power and hybrid electric systems.
The financial information presented below is for our two reportable operating segments and our other category for the periods presented. The other category includes unallocated costs related to corporate headquarters, regional headquarters and the elimination of intercompany activities, none of which meets the requirements for being classified as an operating segment. Corporate and regional headquarters costs include various support functions, such as information technology, corporate finance, legal, executive administration and human resources. Financial measures regarding each segment’s pretax income before equity
35
in net income of affiliates, interest expense and other expense ("segment earnings") and segment earnings divided by net sales ("margin") are not measures of performance under accounting principles generally accepted in the United States ("GAAP"). Segment earnings and the related margin are used by management to evaluate the performance of our reportable operating segments. Segment earnings should not be considered in isolation or as a substitute for net income attributable to Lear, net cash provided by operating activities or other income statement or cash flow statement data prepared in accordance with GAAP or as measures of profitability or liquidity. In addition, segment earnings, as we determine it, may not be comparable to related or similarly titled measures reported by other companies. For a reconciliation of consolidated segment earnings to consolidated income before provision for income taxes and equity in net income of affiliates, see Note
12
, "
Segment Reporting
," to the consolidated financial statements included in this Report.
Seating –
A summary of financial measures for our seating segment is shown below (dollar amounts in millions):
|
For the year ended December 31,
|
2016
|
2015
|
|||||
|
Net sales
|
$
|
14,356.7
|
|
$
|
14,098.5
|
|
|
|
Segment earnings
(1)
|
1,136.0
|
|
907.0
|
|
|||
|
Margin
|
7.9
|
%
|
6.4
|
%
|
|||
|
(1)
|
See definition above.
|
Seating net sales were
$14.4 billion
for the year ended
December 31, 2016
, as compared to
$14.1 billion
for the year ended
December 31, 2015
, an increase of
$258 million
or
2%
. New business positively impacted net sales by $656 million. This increase was partially offset by net foreign exchange rate fluctuations and selling price reductions, which negatively impacted net sales by $427 million. Segment earnings, including restructuring costs, and the related margin on net sales were
$1,136 million
and
7.9%
in
2016
, as compared to
$907 million
and
6.4%
in
2015
. New business and lower restructuring costs positively impacted segment earnings by $122 million. The impact of favorable operating performance and the benefit of operational restructuring actions of $261 million more than offset the impact of selling price reductions and net foreign exchange rate fluctuations.
E-Systems –
A summary of financial measures for our E-Systems segment is shown below (dollar amounts in millions):
|
For the year ended December 31,
|
2016
|
2015
|
|||||
|
Net sales
|
$
|
4,200.9
|
|
$
|
4,112.9
|
|
|
|
Segment earnings
(1)
|
591.3
|
|
554.4
|
|
|||
|
Margin
|
14.1
|
%
|
13.5
|
%
|
|||
|
(1)
|
See definition above.
|
E-Systems net sales were
$4.2 billion
for the year ended
December 31, 2016
, as compared to
$4.1 billion
for the year ended
December 31, 2015
, an increase of
$88 million
or
2%
. New business and higher production volumes on key Lear platforms positively impacted net sales by $179 million and $71 million, respectively. These increases were partially offset by selling price reductions and net foreign exchange rate fluctuations, which negatively impacted net sales by $175 million. Segment earnings, including restructuring costs, and the related margin on net sales were
$591 million
and
14.1%
in
2016
, as compared to
$554 million
and
13.5%
in
2015
. New business and higher production volumes on key Lear platforms positively impacted segment earnings by $52 million. The impact of improved operating performance of $111 million was offset by the impact of selling price reductions and net foreign exchange rate fluctuations.
36
Other –
A summary of financial measures for our other category, which is not an operating segment, is shown below (dollar amounts in millions):
|
For the year ended December 31,
|
2016
|
2015
|
|||||
|
Net sales
|
$
|
—
|
|
$
|
—
|
|
|
|
Segment earnings
(1)
|
(300.1
|
)
|
(274.6
|
)
|
|||
|
Margin
|
N/A
|
|
N/A
|
|
|||
|
(1)
|
See definition above.
|
Segment earnings related to our other category were
($300) million
in
2016
, as compared to
($275) million
in
2015
. In 2016, we recognized a $34 million non-cash settlement charge in connection with our lump-sum payout to certain terminated vested plan participants of our U.S. defined benefit pension plans.
Year Ended
December 31, 2015
, Compared With Year Ended
December 31, 2014
Net sales for the year ended
December 31, 2015
were
$18.2 billion
, as compared to
$17.7 billion
for the year ended
December 31, 2014
, an increase of
$484 million
or
3%
. The acquisition of Eagle Ottawa, new business in Europe, North America and Asia and higher production volumes on key Lear platforms in North America and Europe positively impacted net sales by $820 million, $769 million and $426 million, respectively. These increases were offset by net foreign exchange rate fluctuations, primarily related to the Euro, which negatively impacted net sales by $1.5 billion.
|
(in millions)
|
Cost of Sales
|
|||
|
2014
|
$
|
16,234.5
|
|
|
|
Material cost
|
97.1
|
|
||
|
Labor and other
|
46.1
|
|
||
|
Depreciation
|
13.9
|
|
||
|
2015
|
$
|
16,391.6
|
|
|
Cost of sales in
2015
was
$16.4 billion
, as compared to
$16.2 billion
in
2014
. Net foreign exchange rate fluctuations, primarily related to the Euro, reduced cost of sales by $1.4 billion. This decrease was more than offset by new business in Europe, North America and Asia, higher production volumes on key Lear platforms in North America and Europe and the acquisition of Eagle Ottawa.
Gross profit and gross margin were
$1.8 billion
and
10.0%
of net sales in
2015
, as compared to
$1.5 billion
and
8.4%
of net sales in
2014
. New business, higher production volumes on key Lear platforms and the acquisition of Eagle Ottawa positively impacted gross profit by $383 million. The impact of favorable operating performance and the benefit of operational restructuring actions of $325 million was more than offset by selling price reductions and net foreign exchange fluctuations of $404 million. These factors had a corresponding impact on gross margin.
Selling, general and administrative expenses, including engineering and development expenses, were
$581 million
for the year ended
December 31, 2015
, as compared to
$530 million
for the year ended
December 31, 2014
, reflecting the acquisition of Eagle Ottawa. As a percentage of net sales, selling, general and administrative expenses were
3.2%
in
2015
, as compared to
3.0%
in
2014
.
Engineering and development costs incurred in connection with the development of new products and manufacturing methods, to the extent not recoverable from the customer, are charged to selling, general and administrative expenses as incurred. Such costs totaled
$127 million
in
2015
, as compared to
$102 million
in
2014
, reflecting the acquisition of Eagle Ottawa. In certain situations, the reimbursement of pre-production engineering and design costs is contractually guaranteed by, and fully recoverable from, our customers and, therefore, is capitalized. We capitalized
$194 million
of such costs in
2015
, as compared to
$232 million
in
2014
.
Amortization of intangible assets was
$53 million
in
2015
, as compared to
$34 million
in
2014
, reflecting the amortization of intangible assets related to the acquisition of Eagle Ottawa.
Interest expense was
$87 million
in
2015
, as compared to
$68 million
in
2014
, primarily reflecting debt incurred to finance the acquisition of Eagle Ottawa, partially offset by the refinancing of certain of our senior notes at lower interest rates.
37
Other expense, net, which includes non-income related taxes, foreign exchange gains and losses, gains and losses related to certain derivative instruments and hedging activities, gains and losses on the extinguishment of debt, gains and losses on the disposal of fixed assets and other miscellaneous income and expense, was
$69 million
in
2015
, as compared to
$74 million
in
2014
. In 2015, we recognized a loss of $14 million related to the redemption of the remaining outstanding aggregate principal amount of the 2020 Notes. In 2014, we recognized losses of $18 million related to the redemption of the remaining aggregate principal amount of our 2018 Notes and 10% of the original aggregate principal amount of our 2020 Notes and a gain of $5 million related to a transaction with an affiliate. Net foreign exchange losses decreased $7 million between periods.
In
2015
, the provision for income taxes was
$286 million
, representing an effective tax rate of
27.7%
on pretax income before equity in net income of affiliates of
$1,032 million
. In
2014
, the provision for income taxes was
$121 million
, representing an effective tax rate of
15.4%
on pretax income before equity in net income of affiliates of
$787 million
.
In
2015
and
2014
, the provision for income taxes was impacted by the level and mix of earnings among tax jurisdictions. The provision was also impacted by a portion of our restructuring charges and other expenses, for which no tax benefit was provided as the charges were incurred in certain countries for which no tax benefit is likely to be realized due to a history of operating losses in those countries. In 2015, we recognized net tax benefits of $43 million related to restructuring charges, debt redemption costs, acquisition costs and various other items. In 2014, we recognized net tax benefits of $111 million primarily related to net reductions in valuation allowances with respect to the deferred tax assets of certain foreign subsidiaries and reductions in tax reserves due to audit settlements and net tax benefits of $38 million related to debt redemption costs, restructuring charges and various other items. The reduction in valuation allowances includes the reversal of a valuation allowance of $79 million with respect to the deferred tax assets of our subsidiaries in Spain. During the fourth quarter of 2014, our subsidiaries in Spain became profitable on a three-year cumulative basis and forecasted continued profitability in 2015 and subsequent years. As a result, we concluded that it was more likely than not that the deferred tax assets in Spain would be realized, and therefore, the valuation allowance was no longer necessary. Excluding these items, the effective tax rate in 2015 and 2014 approximated the U.S. federal statutory income tax rate of 35% adjusted for income taxes on foreign earnings, losses and remittances, valuation allowances, tax credits, income tax incentives and other permanent items.
For information related to our valuation allowances, see "Other Matters — Significant Accounting Policies and Critical Accounting Estimates — Income Taxes."
Equity in net income of affiliates was
$50 million
for the year ended
December 31, 2015
, as compared to
$36 million
for the year ended
December 31, 2014
, reflecting the improved operating performance of our equity affiliates in China.
Net income attributable to Lear was
$746 million
, or
$9.59
per diluted share, in
2015
, as compared to
$672 million
, or
$8.23
per diluted share, in
2014
. Net income and diluted net income per share increased for the reasons described above. In addition, diluted net income per share was impacted by the decrease in average shares outstanding between the periods.
Reportable Operating Segments
For a description of our reportable operating segments, see "Year Ended
December 31, 2016
, Compared with Year Ended
December 31, 2015
— Reportable Operating Segments" above.
Seating –
A summary of financial measures for our seating segment is shown below (dollar amounts in millions):
|
For the year ended December 31,
|
2015
|
2014
|
|||||
|
Net sales
|
$
|
14,098.5
|
|
$
|
13,310.6
|
|
|
|
Segment earnings
(1)
|
907.0
|
|
655.2
|
|
|||
|
Margin
|
6.4
|
%
|
4.9
|
%
|
|||
|
(1)
|
See definition above.
|
Seating net sales were
$14.1 billion
for the year ended
December 31, 2015
, as compared to
$13.3 billion
for the year ended
December 31, 2014
, an increase of
$788 million
or
6%
. The acquisition of Eagle Ottawa, new business and higher production volumes on key Lear platforms positively impacted net sales by $820 million, $617 million and $362 million, respectively. These increases were partially offset by net foreign exchange rate fluctuations, which negatively impacted net sales by $1.0 billion. Segment earnings, including restructuring costs, and the related margin on net sales were
$907 million
and
6.4%
in
2015
, as compared to
$655 million
and
4.9%
in
2014
. New business, higher production volumes on key Lear platforms and the acquisition of Eagle Ottawa positively impacted segment earnings by $256 million. The impact of favorable operating performance and the benefit of operational restructuring actions of $181 million was more than offset by selling price reductions and net foreign exchange fluctuations.
38
E-Systems –
A summary of financial measures for our E-Systems segment is shown below (dollar amounts in millions):
|
For the year ended December 31,
|
2015
|
2014
|
|||||
|
Net sales
|
$
|
4,112.9
|
|
$
|
4,416.7
|
|
|
|
Segment earnings
(1)
|
554.4
|
|
556.6
|
|
|||
|
Margin
|
13.5
|
%
|
12.6
|
%
|
|||
|
(1)
|
See definition above.
|
E-Systems net sales were
$4.1 billion
for the year ended
December 31, 2015
, as compared to
$4.4 billion
for the year ended
December 31, 2014
, a decrease of
$304 million
or
7%
. Net foreign exchange rate fluctuations negatively impacted net sales by $452 million. This decrease was partially offset by new business and higher production volumes on key Lear platforms, which positively impacted net sales by $152 million and $64 million, respectively. Segment earnings, including restructuring costs, and the related margin on net sales were
$554 million
and
13.5%
in
2015
, as compared to
$557 million
and
12.6%
in
2014
. The impact of improved operating performance, new business and higher production volumes on key Lear platforms of $167 million was offset by selling price reductions and net foreign exchange fluctuations.
Other –
A summary of financial measures for our other category, which is not an operating segment, is shown below (dollar amounts in millions):
|
For the year ended December 31,
|
2015
|
2014
|
|||||
|
Net sales
|
$
|
—
|
|
$
|
—
|
|
|
|
Segment earnings
(1)
|
(274.6
|
)
|
(282.6
|
)
|
|||
|
Margin
|
N/A
|
|
N/A
|
|
|||
|
(1)
|
See definition above.
|
Segment earnings related to our other category were
($275) million
in
2015
, as compared to
($283) million
in
2014
, reflecting favorable performance and the benefit of restructuring actions and net foreign exchange rate fluctuations, partially offset by transaction costs of $9 million related to the acquisition of Eagle Ottawa.
Liquidity and Financial Condition
Our primary liquidity needs are to fund general business requirements, including working capital requirements, capital expenditures, operational restructuring actions and debt service requirements. In addition, we expect to continue to pay quarterly dividends and repurchase shares of our common stock pursuant to our authorized common stock share repurchase program (see Item 5, "Market for the Company’s Common Equity, Related Stockholder Matters and Issuer Purchases of Equity Securities"). Our principal sources of liquidity are cash flows from operating activities, borrowings under available credit facilities and our existing cash balance. A substantial portion of our operating income is generated by our subsidiaries. As a result, we are dependent on the earnings and cash flows of and the combination of dividends, royalties, intercompany loan repayments and other distributions and advances from our subsidiaries to provide the funds necessary to meet our obligations.
As of
December 31, 2016
and
2015
, cash and cash equivalents of $767 million and $664 million, respectively, were held in foreign subsidiaries and can be repatriated, primarily through the repayment of intercompany loans, without creating additional income tax expense. There are no significant restrictions on the ability of our subsidiaries to pay dividends or make other distributions to Lear. For further information regarding potential dividends from our non-U.S. subsidiaries, see "— Adequacy of Liquidity Sources," below and Note
7
, "
Income Taxes
," to the consolidated financial statements included in this Report.
39
Cash Flows
Year Ended
December 31, 2016
, Compared with Year Ended
December 31, 2015
A summary of net cash provided by operating activities is shown below (in millions):
|
For the year ended December 31,
|
2016
|
2015
|
Incremental Increase (Decrease) in Operating
Cash Flow
|
||||||||
|
Consolidated net income and depreciation and amortization
|
$
|
1,419
|
|
$
|
1,144
|
|
$
|
275
|
|
||
|
Net change in working capital items:
|
|||||||||||
|
Accounts receivable
|
(176
|
)
|
(173
|
)
|
(3
|
)
|
|||||
|
Inventory
|
(54
|
)
|
4
|
|
(58
|
)
|
|||||
|
Accounts payable
|
158
|
|
76
|
|
81
|
|
|||||
|
Accrued liabilities and other
|
160
|
|
151
|
|
9
|
|
|||||
|
Net change in working capital items
|
88
|
|
58
|
|
30
|
|
|||||
|
Other
|
113
|
|
70
|
|
43
|
|
|||||
|
Net cash provided by operating activities
|
$
|
1,619
|
|
$
|
1,271
|
|
$
|
348
|
|
||
In
2016
, increases in accounts receivable, inventories and accounts payable resulted in a use of cash of
$176 million
, a use of cash of
$54 million
and a source of cash of
$158 million
, respectively, primarily reflecting higher working capital to support the increase in our sales. In
2016
, changes in accrued liabilities and other resulted in a source of cash of
$160 million
, primarily reflecting the timing of payment of accrued liabilities.
Net cash used in investing activities was
$637 million
in
2016
, as compared to
$965 million
in
2015
. This decrease is primarily due to cash paid of $149 million for the acquisition of AccuMED in 2016, as compared to cash paid of $465 million for the acquisition of Eagle Ottawa in 2015. Capital spending in
2017
is estimated at $550 million.
Net cash used in financing activities was
$873 million
in
2016
, as compared to
$156 million
in
2015
. In
2016
and
2015
, we paid
$659 million
and
$487 million
, respectively, for repurchases of our common stock. In
2015
, financing activities included $500 million of borrowings under our Term Loan Facility (see "— Credit Agreement" below) to finance, in part, the acquisition of Eagle Ottawa.
For further information regarding our
2016
and
2015
financing transactions, see "— Capitalization," below and Note
6
, "
Debt
," and Note
9
, "
Capital Stock, Equity and Accumulated Other Comprehensive Loss
," to the consolidated financial statements included in this Report.
Year Ended
December 31, 2015
, Compared with Year Ended
December 31, 2014
A summary of net cash provided by operating activities is shown below (in millions):
|
For the year ended December 31,
|
2015
|
2014
|
Incremental Increase (Decrease) in Operating
Cash Flow
|
||||||||
|
Consolidated net income and depreciation and amortization
|
$
|
1,144
|
|
$
|
1,013
|
|
$
|
130
|
|
||
|
Net change in working capital items:
|
|||||||||||
|
Accounts receivable
|
(173
|
)
|
(359
|
)
|
185
|
|
|||||
|
Inventory
|
4
|
|
(91
|
)
|
95
|
|
|||||
|
Accounts payable
|
76
|
|
231
|
|
(155
|
)
|
|||||
|
Accrued liabilities and other
|
151
|
|
78
|
|
73
|
|
|||||
|
Net change in working capital items
|
58
|
|
(140
|
)
|
198
|
|
|||||
|
Other
|
70
|
|
55
|
|
15
|
|
|||||
|
Net cash provided by operating activities
|
$
|
1,271
|
|
$
|
928
|
|
$
|
343
|
|
||
40
In
2015
, increases in accounts receivable and accounts payable resulted in a use of cash of
$173 million
and a source of cash of
$76 million
, respectively, primarily reflecting higher working capital to support the increase in our sales. In 2015, changes in accrued liabilities and other resulted in a source of cash of
$151 million
, primarily reflecting the timing of payments of accrued liabilities.
Net cash used in investing activities was
$965 million
in
2015
, as compared to
$781 million
in
2014
. In 2015, we paid cash for the acquisition of Eagle Ottawa of $465 million, net of cash acquired and use of restricted cash of $350 million. In 2014, the partial restriction of the cash proceeds from the issuance of the 2025 Notes for the 2015 financing of the Eagle Ottawa acquisition resulted in a use of cash of $350 million. In addition, capital spending increased $61 million between periods.
Net cash used in financing activities was
$156 million
in
2015
, as compared to
$161 million
in
2014
. In 2015, we borrowed
$500 million
under our Term Loan Facility to finance, in part, the acquisition of Eagle Ottawa and made required principal payments of
$9 million
under the Term Loan Facility. In addition, we paid
$5 million
to redeem the remaining outstanding 2020 Notes, net of use of restricted cash of $250 million, and paid
$487 million
in aggregate for repurchases of our common stock. In 2014, we issued
$975 million
in aggregate principal amount of 2024 Notes and 2025 Notes and paid
$327 million
to redeem the remaining outstanding 2018 Notes and a portion of the outstanding 2020 Notes. In addition, we paid
$411 million
in aggregate to repurchase our common stock, including $356 million of open market repurchases and $55 million to settle the accelerated share repurchase ("ASR") program. The partial restriction of the cash proceeds from the issuance of the 2025 Notes for the 2015 redemption of the remaining outstanding 2020 Notes resulted in a use of cash of $250 million.
For further information regarding our
2015
and
2014
financing transactions, including the partial restriction of cash proceeds from the issuance of the 2025 Notes, see "— Capitalization," below and Note
6
, "
Debt
," and Note
9
, "
Capital Stock, Equity and Accumulated Other Comprehensive Loss
," to the consolidated financial statements included in this Report.
Capitalization
From time to time, we utilize uncommitted credit facilities to fund our capital expenditures and working capital requirements at certain of our foreign subsidiaries, in addition to cash provided by operating activities. As of
December 31, 2016
, our short-term debt balance was
$9 million
. As of
December 31, 2015
, there were no short-term debt balances outstanding. The availability of uncommitted lines of credit may be affected by our financial performance, credit ratings and other factors.
Senior Notes
As of
December 31, 2016
, our senior notes (collectively, the "Notes") consist of the amounts shown below (in millions, except stated coupon rates):
|
Note
|
Aggregate Principal Amount
|
Stated Coupon Rate
|
||||
|
Senior unsecured notes due 2023
|
$
|
500
|
|
4.75%
|
||
|
Senior unsecured notes due 2024
|
325
|
|
5.375%
|
|||
|
Senior unsecured notes due 2025
|
650
|
|
5.25%
|
|||
|
$
|
1,475
|
|
||||
In November 2014, we issued the 2025 Notes, resulting in net proceeds of $642 million. In January 2015, we used $350 million of the net proceeds from the offering, along with $500 million in borrowings under the Term Loan Facility (see "— Credit Agreement" below), to finance the acquisition of Eagle Ottawa. In March 2015, we paid $255 million (which included $250 million of the net proceeds from the offering of the 2025 Notes) to redeem the remaining outstanding aggregate principal amount of the 2020 Notes. In connection with this transaction, we recognized a loss of approximately $14 million on the extinguishment of debt. The remaining proceeds from the offering were used for general corporate purposes, including the payment of fees and expenses associated with the acquisition of Eagle Ottawa and related financing transactions.
The 2024 Notes were issued in March 2014. The net proceeds from the offering of $321 million, together with our existing sources of liquidity, were used to redeem the remaining outstanding aggregate principal amount of the 2018 Notes ($280 million) and to redeem 10% of the original aggregate principal amount at maturity of the 2020 Notes ($35 million) at stated redemption prices, plus accrued and unpaid interest to the respective redemption dates. In connection with these transactions, we paid an aggregate of $327 million and recognized losses of $18 million on the extinguishment of debt in 2014.
Interest is payable on January 15 and July 15 of each year, in the case of the 2023 Notes and 2025 Notes, and March 15 and September 15 of each year, in the case of the 2024 Notes. The 2023 Notes mature on January 15, 2023, the 2024 Notes mature on March 15, 2024, and the 2025 Notes mature on January 15, 2025. As of
December 31, 2016
and
2015
, the aggregate carrying value of the Notes was
$1.5 billion
. The indentures governing the Notes contain certain restrictive covenants and
41
customary events of default. As of
December 31, 2016
, we were in compliance with all covenants under the indentures governing the Notes.
The Notes are senior unsecured obligations. Our obligations under the Notes are fully and unconditionally guaranteed, jointly and severally, on a senior unsecured basis by certain domestic subsidiaries, which are directly or indirectly 100% owned by Lear.
For further information related to the Notes, including information on early redemption, covenants and events of default, see Note
6
, "
Debt
," to the consolidated financial statements included in this Report.
Credit Agreement
As of
December 31, 2016
, our Credit Agreement consists of a $1.25 billion Revolving Credit Facility, which matures on November 14, 2019, and a $500 million Term Loan Facility, which matures on January 5, 2020. As of
December 31, 2016
and
2015
, there were no borrowings outstanding under the Revolving Credit Facility and
$469 million
and
$491 million
, respectively, of borrowings outstanding under the Term Loan Facility. In
2016
, we made required principal payments of
$22 million
under the Term Loan Facility. As of
December 31, 2016
, we were in compliance with all covenants under the Credit Agreement.
For further information related to the Credit Agreement, including information on pricing, covenants and events of default, see Note
6
, "
Debt
," to the consolidated financial statements included in this Report and the amended and restated credit agreement, which has been incorporated by reference as an exhibit to this Report.
Contractual Obligations
The scheduled maturities of the Notes, obligations under the Credit Agreement and the scheduled interest payments on the Notes as of the date of this Report are shown below (in millions). In addition, our lease commitments under non-cancelable operating leases as of
December 31, 2016
, are shown below (in millions):
|
2017
|
2018
|
2019
|
2020
|
2021
|
Thereafter
|
Total
|
|||||||||||||||||||||
|
Senior notes
|
$
|
—
|
|
$
|
—
|
|
$
|
—
|
|
$
|
—
|
|
$
|
—
|
|
$
|
1,475.0
|
|
$
|
1,475.0
|
|
||||||
|
Credit agreement —
term loan facility
|
34.4
|
|
46.9
|
|
37.4
|
|
350.0
|
|
—
|
|
—
|
|
468.7
|
|
|||||||||||||
|
Scheduled interest payments
|
75.3
|
|
75.3
|
|
75.3
|
|
75.3
|
|
75.3
|
|
198.7
|
|
575.2
|
|
|||||||||||||
|
Lease commitments
|
109.0
|
|
89.3
|
|
85.0
|
|
77.1
|
|
65.0
|
|
138.3
|
|
563.7
|
|
|||||||||||||
|
Total
|
$
|
218.7
|
|
$
|
211.5
|
|
$
|
197.7
|
|
$
|
502.4
|
|
$
|
140.3
|
|
$
|
1,812.0
|
|
$
|
3,082.6
|
|
||||||
We enter into agreements with our customers to produce products at the beginning of a vehicle’s life cycle. Although such agreements do not provide for a specified quantity of products, once we enter into such agreements, we are generally required to fulfill our customers’ purchasing requirements for the production life of the vehicle. Prior to being formally awarded a program, we typically work closely with our customers in the early stages of the design and engineering of a vehicle’s systems. Failure to complete the design and engineering work related to a vehicle’s systems, or to fulfill a customer’s contract, could have a material adverse impact on our business.
We also enter into agreements with suppliers to assist us in meeting our customers’ production needs. These agreements vary as to duration and quantity commitments. Historically, most have been short-term agreements, which do not provide for minimum purchases, or are requirements-based contracts.
We may be required to make significant cash outlays related to our unrecognized tax benefits, including interest and penalties. However, due to the uncertainty of the timing of future cash flows associated with our unrecognized tax benefits, we are unable to make reasonably reliable estimates of the period of cash settlement, if any, with the respective taxing authorities. Accordingly, unrecognized tax benefits, including interest and penalties, of $37 million as of
December 31, 2016
, have been excluded from the contractual obligations table above. For further information related to our unrecognized tax benefits, see Note
7
, "
Income Taxes
," to the consolidated financial statements included in this Report.
We also have minimum funding requirements with respect to our pension obligation. We may elect to make contributions in excess of the minimum funding requirements in response to investment performance or changes in interest rates or when we believe that it is financially advantageous to do so and based on our other cash requirements. Our minimum funding requirements after
2017
will depend on several factors, including investment performance and interest rates. Our minimum funding requirements may also be affected by changes in applicable legal requirements. Our minimum required contributions to our domestic and foreign pension plans, including distributions to participants in certain of our non-qualified defined benefit plans, are expected to be approximately
$10 million
to
$15 million
in
2017
. We also have payments due with respect to our
42
postretirement benefit obligation. We do not fund our postretirement benefit obligation. Rather, payments are made as costs are incurred by covered retirees. We expect payments related to our postretirement benefit obligation to be approximately
$6 million
in
2017
.
For further information related to our pension and other postretirement benefit plans, see "— Other Matters — Pension and Other Postretirement Defined Benefit Plans" and Note
8
, "
Pension and Other Postretirement Benefit Plans
," to the consolidated financial statements included in this Report.
Accounts Receivable Factoring
One of our European subsidiaries has an uncommitted factoring agreement, which provides for aggregate purchases of specified customer accounts of up to €200 million. As of
December 31, 2016
, there were no factored receivables outstanding. We cannot provide any assurances that this factoring facility will be available or utilized in the future.
Common Stock Share Repurchase Program
See Item 5, "Market for the Company’s Common Equity, Related Stockholder Matters and Issuer Purchases of Equity Securities."
Dividends
See Item 5, "Market for the Company’s Common Equity, Related Stockholder Matters and Issuer Purchases of Equity Securities."
Adequacy of Liquidity Sources
As of
December 31, 2016
, we had approximately
$1.3 billion
of cash and cash equivalents on hand and
$1.25 billion
in available borrowing capacity under our Revolving Credit Facility. Together with cash provided by operating activities, we believe that this will enable us to meet our liquidity needs to satisfy ordinary course business obligations. In addition, we expect to continue to pay quarterly dividends and repurchase shares of our common stock pursuant to our authorized common stock share repurchase program (see Item 5, "Market for the Company’s Common Equity, Related Stockholder Matters and Issuer Purchases of Equity Securities"). Our future financial results and our ability to continue to meet our liquidity needs are subject to, and will be affected by, cash flows from operations, including the impact of restructuring activities, automotive industry conditions, the financial condition of our customers and suppliers and other related factors. Additionally, an economic downturn or reduction in production levels could negatively impact our financial condition. For further discussion of the risks and uncertainties affecting our cash flows from operations and our overall liquidity, see Part I — Item 1A, "Risk Factors," "— Executive Overview" above and "— Forward-Looking Statements" below.
Market Risk Sensitivity
In the normal course of business, we are exposed to market risks associated with fluctuations in foreign exchange rates, interest rates and commodity prices. We manage a portion of these risks through the use of derivative financial instruments in accordance with our policies. We enter into all hedging transactions for periods consistent with the underlying exposures. We do not enter into derivative instruments for trading purposes.
Foreign Exchange
Operating results may be impacted by our buying, selling and financing in currencies other than the functional currency of our operating companies ("transactional exposure"). We may mitigate a portion of this risk by entering into foreign exchange forwards, futures and option contracts. The foreign exchange contracts are executed with banks that we believe are creditworthy. Gains and losses related to foreign exchange contracts are deferred where appropriate and included in the measurement of the foreign currency transaction subject to the hedge. Gains and losses incurred related to foreign exchange contracts are generally offset by the direct effects of currency movements on the underlying transactions.
A summary of the notional amount and estimated aggregate fair value of our outstanding foreign exchange contracts is shown below (in millions):
|
December 31
|
2016
|
2015
|
|||||
|
Notional amount (contract maturities < 24 months)
|
$
|
1,956
|
|
$
|
1,818
|
|
|
|
Fair value
|
(54
|
)
|
(51
|
)
|
|||
43
Currently, our most significant foreign currency transactional exposures relate to the Mexican peso, various European currencies, the Thai baht, the Chinese renminbi, the Brazilian real and the Canadian dollar. We have performed a sensitivity analysis of our net transactional exposure, as shown below (in millions):
|
Potential Earnings Benefit (Adverse Earnings Impact)
|
|||||||||
|
December 31
|
Hypothetical Strengthening %
(1)
|
2016
|
2015
|
||||||
|
U.S. dollar
|
10%
|
$
|
(19
|
)
|
$
|
(18
|
)
|
||
|
Euro
|
10%
|
16
|
|
10
|
|
||||
|
(1)
|
Relative to all other currencies to which it is exposed for a twelve-month period
|
We have performed a sensitivity analysis related to the aggregate fair value of our outstanding foreign exchange contracts, as shown below (in millions):
|
Estimated Change in Fair Value
|
|||||||||
|
December 31
|
Hypothetical
Change %
(2)
|
2016
|
2015
|
||||||
|
U.S. dollar
|
10%
|
$
|
50
|
|
$
|
38
|
|
||
|
Euro
|
10%
|
35
|
|
63
|
|
||||
|
(2)
|
Relative to all other currencies to which it is exposed
|
There are certain shortcomings inherent in the sensitivity analyses above. The analyses assume that all currencies would uniformly strengthen or weaken relative to the U.S. dollar or Euro. In reality, some currencies may strengthen while others may weaken, causing the earnings impact to increase or decrease depending on the currency and the direction of the rate movement.
In addition to the transactional exposure described above, our operating results are impacted by the translation of our foreign operating income into U.S. dollars ("translational exposure"). In
2016
, net sales outside of the United States accounted for 77% of our consolidated net sales, although certain non-U.S. sales are U.S. dollar denominated. We do not enter into foreign exchange contracts to mitigate our translational exposure.
Commodity Prices
Raw material, energy and commodity costs can be volatile. We have developed and implemented strategies to mitigate the impact of higher raw material, energy and commodity costs, such as the selective in-sourcing of components, the continued consolidation of our supply base, longer-term purchase commitments and the selective expansion of low-cost country sourcing and engineering, as well as value engineering and product benchmarking. However, these strategies, together with commercial negotiations with our customers and suppliers, typically offset only a portion of the adverse impact. Certain of these strategies also may limit our opportunities in a declining commodity cost environment. If these costs increase, it could have an adverse impact on our operating results in the foreseeable future. See Part I — Item 1A, "Risk Factors — Increases in the costs and restrictions on the availability of raw materials, energy, commodities and product components could adversely affect our financial performance," and "— Forward-Looking Statements."
We have commodity price risk with respect to purchases of certain raw materials, including steel, copper, diesel fuel, chemicals, resins and leather. Our main cost exposures relate to steel, copper and leather. The majority of the steel used in our products is comprised of fabricated components that are integrated into a seat system, such as seat frames, recliner mechanisms, seat tracks and other mechanical components. Therefore, our exposure to changes in steel prices is primarily indirect, through these purchased components. Approximately
91%
of our copper purchases and a significant portion of our leather purchases are subject to price index agreements with our customers.
For further information related to the financial instruments described above, see Note
13
, "
Financial Instruments
," to the consolidated financial statements included in this Report.
Other Matters
Legal and Environmental Matters
We are involved from time to time in various legal proceedings and claims, including, without limitation, commercial and contractual disputes, product liability claims and environmental and other matters. As of
December 31, 2016
, we had recorded
44
reserves for pending legal disputes, including commercial disputes and other matters, of
$11 million
. In addition, as of
December 31, 2016
, we had recorded reserves for product liability claims and environmental matters of
$49 million
and
$9 million
, respectively. Although these reserves were determined in accordance with GAAP, the ultimate outcomes of these matters are inherently uncertain, and actual results may differ significantly from current estimates. For a description of risks related to various legal proceedings and claims, see Part I — Item 1A, "Risk Factors." For a more complete description of our outstanding material legal proceedings, see Note
11
, "
Commitments and Contingencies
," to the consolidated financial statements included in this Report.
Significant Accounting Policies and Critical Accounting Estimates
Our significant accounting policies are more fully described in Note
2
, "
Summary of Significant Accounting Policies
," to the consolidated financial statements included in this Report. Certain of our accounting policies require management to make estimates and assumptions that affect the reported amounts of assets and liabilities as of the date of the consolidated financial statements and the reported amounts of revenues and expenses during the reporting period. These estimates and assumptions are based on our historical experience, the terms of existing contracts, our evaluation of trends in the industry, information provided by our customers and suppliers and information available from other outside sources, as appropriate. However, these estimates and assumptions are subject to an inherent degree of uncertainty. As a result, actual results in these areas may differ significantly from our estimates.
We consider an accounting estimate to be critical if it requires us to make assumptions about matters that were uncertain at the time the estimate was made and changes in the estimate would have had a significant impact on our consolidated financial position or results of operations.
Pre-Production Costs Related to Long-Term Supply Agreements
We incur pre-production engineering and development ("E&D") and tooling costs related to the products produced for our customers under long-term supply agreements. We expense all pre-production E&D costs for which reimbursement is not contractually guaranteed by the customer. In addition, we expense all pre-production tooling costs related to customer-owned tools for which reimbursement is not contractually guaranteed by the customer or for which we do not have a non-cancelable right to use the tooling.
A change in the commercial arrangements affecting any of our significant programs that would require us to expense E&D or tooling costs that we currently capitalize could have a material adverse impact on our operating results.
Impairment of Goodwill
As of
December 31, 2016
and
2015
, we had recorded goodwill of
$1,121 million
and
$1,054 million
, respectively. Goodwill is not amortized but is tested for impairment on at least an annual basis. Impairment testing is required more often than annually if an event or circumstance indicates that an impairment is more likely than not to have occurred. In conducting our annual impairment testing, we may first perform a qualitative assessment of whether it is more likely than not that a reporting unit’s fair value is less than its carrying amount. If not, no further goodwill impairment testing is performed. If it is more likely than not that a reporting unit’s fair value is less than its carrying amount, or if we elect not to perform a qualitative assessment of a reporting unit, we then compare the fair value of the reporting unit to the related net book value. If the net book value of a reporting unit exceeds its fair value, an impairment loss is measured and recognized. We conduct our annual impairment testing as of the first day of our fourth quarter.
We utilize an income approach to estimate the fair value of each of our reporting units and a market valuation approach to further support this analysis. The income approach is based on projected debt-free cash flow which is discounted to the present value using discount factors that consider the timing and risk of cash flows. We believe that this approach is appropriate because it provides a fair value estimate based upon the reporting unit’s expected long-term operating cash flow performance. This approach also mitigates the impact of cyclical trends that occur in the industry. Fair value is estimated using recent automotive industry and specific platform production volume projections, which are based on both third-party and internally developed forecasts, as well as commercial, wage and benefit, inflation and discount rate assumptions. The discount rate used is the value-weighted average of our estimated cost of equity and of debt ("cost of capital") derived using both known and estimated customary market metrics. Our weighted average cost of capital is adjusted by reporting unit to reflect a risk factor, if necessary. Other significant assumptions include terminal value growth rates, terminal value margin rates, future capital expenditures and changes in future working capital requirements. While there are inherent uncertainties related to the assumptions used and to management’s application of these assumptions to this analysis, we believe that the income approach provides a reasonable estimate of the fair value of our reporting units. The market valuation approach is used to further support our analysis and is based on recent transactions involving comparable companies.
45
In
2016
, we performed a combination of qualitative and quantitative assessments of our reporting units. All assessments were completed as of the first day of our fourth quarter. The assessments indicated that the fair value of each of the reporting units exceeded its respective carrying value. We do not believe that any of our reporting units is at risk for impairment.
Impairment of Long-Lived Assets
We monitor our long-lived assets for impairment indicators on an ongoing basis in accordance with GAAP. If impairment indicators exist, we perform the required impairment analysis by comparing the undiscounted cash flows expected to be generated from the long-lived assets to the related net book values. If the net book value exceeds the undiscounted cash flows, an impairment loss is measured and recognized. An impairment loss is measured as the difference between the net book value and the fair value of the long-lived assets. Fair value is estimated based upon either discounted cash flow analyses or estimated salvage values. Cash flows are estimated using internal budgets based on recent sales data, independent automotive production volume estimates and customer commitments, as well as assumptions related to discount rates. Changes in economic or operating conditions impacting these estimates and assumptions could result in the impairment of our long-lived assets.
For the years ended
December 31, 2016
,
2015
and
2014
, we recognized fixed asset impairment charges of
$5 million
,
$4 million
and
$1 million
, respectively, in conjunction with our restructuring actions, as well as additional fixed asset impairment charges of
$1 million
,
$2 million
and
$2 million
, respectively. See Note
4
, "
Restructuring
," to the consolidated financial statements included in this Report.
Impairment of Investments in Affiliates
As of
December 31, 2016
and
2015
, we had aggregate investments in affiliates of
$154 million
and
$157 million
, respectively. We monitor our investments in affiliates for indicators of other-than-temporary declines in value on an ongoing basis in accordance with GAAP. If we determine that an other-than-temporary decline in value has occurred, we recognize an impairment loss, which is measured as the difference between the recorded book value and the fair value of the investment. Fair value is generally determined using an income approach based on discounted cash flows or negotiated transaction values. A deterioration in industry conditions and decline in the operating results of our non-consolidated affiliates could result in the impairment of our investments.
Restructuring
Accruals have been recorded in conjunction with our restructuring actions. These accruals include estimates primarily related to facility consolidations and closures, employment reductions and contract termination costs. Actual costs may vary from these estimates. Restructuring-related accruals are reviewed on a quarterly basis, and changes to restructuring actions are appropriately recognized when identified.
Legal and Other Contingencies
We are involved from time to time in various legal proceedings and claims, including commercial or contractual disputes, product liability claims and environmental and other matters, that arise in the normal course of business. We routinely assess the likelihood of any adverse judgments or outcomes related to these matters, as well as ranges of probable losses, by consulting with internal personnel principally involved with such matters and with our outside legal counsel handling such matters. We have accrued for estimated losses in accordance with GAAP for those matters where we believe that the likelihood that a loss has occurred is probable and the amount of the loss is reasonably estimable. The determination of the amount of such reserves is based on knowledge and experience with regard to past and current matters and consultation with internal personnel principally involved with such matters and with our outside legal counsel handling such matters. The amount of such reserves may change in the future due to new developments or changes in circumstances. The inherent uncertainty related to the outcome of these matters can result in amounts materially different from any provisions made with respect to their resolution. See Note
11
, "
Commitments and Contingencies
," to the consolidated financial statements included in this Report.
Pension and Other Postretirement Defined Benefit Plans
We provide certain pension and other postretirement benefits to our employees and retired employees, including pensions, postretirement health care benefits and other postretirement benefits.
Plan assets and obligations are measured using various actuarial assumptions, such as discount rates, rate of compensation increase, mortality rates, turnover rates and health care cost trend rates, which are determined as of the current year measurement date. The measurement of net periodic benefit cost is based on various actuarial assumptions, including discount rates, expected return on plan assets and rate of compensation increase, which are determined as of the prior year measurement date. We review our actuarial assumptions on an annual basis and modify these assumptions when appropriate. As required by GAAP, the effects of the modifications are recorded currently or are amortized over future periods.
46
Approximately
8%
of our active workforce is covered by defined benefit pension plans, and less than 1% of our active workforce is covered by other postretirement benefit plans. Pension plans provide benefits based on plan-specific benefit formulas as defined by the applicable plan documents. Postretirement benefit plans generally provide for the continuation of medical benefits for all eligible employees. We also have contractual arrangements with certain employees which provide for supplemental retirement benefits. In general, our policy is to fund our pension benefit obligation based on legal requirements, tax and liquidity considerations and local practices. We do not fund our postretirement benefit obligation.
Pension and other postretirement obligations as of
December 31, 2016
, are shown below (in millions, except rates):
|
Pension
|
Other Postretirement
|
||||||
|
Benefit obligation
|
$
|
991
|
|
$
|
104
|
|
|
|
Unfunded status
|
$
|
211
|
|
$
|
104
|
|
|
|
Weighted average actuarial assumptions used in determining the benefit obligations:
|
|||||||
|
Discount rate -
|
|||||||
|
Domestic plans
|
4.1
|
%
|
3.9
|
%
|
|||
|
Foreign plans
|
3.3
|
%
|
3.9
|
%
|
|||
Net periodic benefit cost for the year ended
December 31, 2016
, and forecasted net periodic benefit cost for the year ending
December 31, 2017
, are shown below (in millions, except rates):
|
Pension
|
Other Postretirement
|
||||||
|
2016 net periodic benefit cost, including a pension settlement loss of $34.4 million
|
$
|
37
|
|
$
|
4
|
|
|
|
Weighted average actuarial assumptions used in determining the net periodic benefit cost:
|
|||||||
|
Discount rate -
|
|||||||
|
Domestic plans
|
4.4
|
%
|
4.2
|
%
|
|||
|
Foreign plans
|
3.8
|
%
|
4.2
|
%
|
|||
|
Expected return on plan assets -
|
|||||||
|
Domestic plans
|
7.5
|
%
|
N/A
|
|
|||
|
Foreign plans
|
6.3
|
%
|
N/A
|
|
|||
|
2017 forecasted net periodic benefit cost
|
$
|
5
|
|
$
|
2
|
|
|
|
Weighted average actuarial assumptions used in determining the net periodic benefit cost:
|
|||||||
|
Discount rate -
|
|||||||
|
Domestic plans
|
4.1
|
%
|
3.9
|
%
|
|||
|
Foreign plans
|
3.3
|
%
|
3.9
|
%
|
|||
|
Expected return on plan assets -
|
|||||||
|
Domestic plans
|
7.3
|
%
|
N/A
|
|
|||
|
Foreign plans
|
6.3
|
%
|
N/A
|
|
|||
The determination of the discount rate is generally based on an index created from a hypothetical bond portfolio consisting of high-quality fixed income securities with durations that match the timing of expected benefit payments. Changes in the selected discount rate could have a material impact on the projected benefit obligations, unfunded status and related net periodic benefit cost of our pension and other postretirement benefit plans.
The expected return on plan assets is determined based on several factors, including adjusted historical returns, historical risk
47
premiums for various asset classes and target asset allocations within the portfolio. Adjustments made to the historical returns are based on recent return experience in the equity and fixed income markets and the belief that deviations from historical returns are likely over the relevant investment horizon.
The sensitivity to a 100 basis point ("bp") decrease in the discount rate and expected return on plan assets is shown below (in millions):
|
Increase in Benefit Obligation
|
Increase in 2017
Net Periodic Benefit Cost
|
||||||||||||||
|
Pension
|
Other Postretirement
|
Pension
|
Other Postretirement
|
||||||||||||
|
100 bp decrease in discount rate
|
$
|
144
|
|
$
|
14
|
|
$
|
2
|
|
$
|
1
|
|
|||
|
100 bp decrease in expected return on plan assets
|
N/A
|
|
N/A
|
|
$
|
8
|
|
N/A
|
|
||||||
For further information related to our pension and other postretirement benefit plans, see "— Liquidity and Financial Condition — Capitalization — Contractual Obligations" above and Note
8
, "
Pension and Other Postretirement Benefit Plans
," to the consolidated financial statements included in this Report.
Revenue Recognition and Sales Commitments
We enter into agreements with our customers to produce products at the beginning of a vehicle’s life cycle. Although such agreements do not provide for a specified quantity of products, once we enter into such agreements, we are generally required to fulfill our customers’ purchasing requirements for the production life of the vehicle. These agreements generally may be terminated by our customers at any time. Historically, terminations of these agreements have been minimal. Sales are generally recorded upon shipment of product to customers and transfer of title under standard commercial terms. In certain instances, we may be committed under existing agreements to supply products to our customers at selling prices which are not sufficient to cover the direct cost to produce such products. In such situations, we recognize losses as they are incurred.
We receive purchase orders from our customers on an annual basis. Generally, each purchase order provides the annual terms, including pricing, related to a particular vehicle model. Purchase orders do not specify quantities. We recognize revenue based on the pricing terms included in our annual purchase orders. We are asked to provide our customers with annual productivity price reductions as part of certain agreements. We accrue for such amounts as a reduction of revenue as our products are shipped to our customers. In addition, we have ongoing adjustments to our pricing arrangements with our customers based on the related content, the cost of our products and other commercial factors. Such pricing accruals are adjusted as they are settled with our customers.
Income Taxes
We account for income taxes in accordance with GAAP. Deferred tax assets and liabilities are recognized for the future tax consequences attributable to temporary differences between financial statement carrying amounts of existing assets and liabilities and their respective tax bases and tax loss and credit carryforwards. Deferred tax assets and liabilities are measured using enacted tax rates expected to apply to taxable income in the years in which those temporary differences are expected to be recovered or settled.
Our current and future provision for income taxes is impacted by the initial recognition of and changes in valuation allowances in certain countries. We intend to maintain these allowances until it is more likely than not that the deferred tax assets will be realized. Our future provision for income taxes will include no tax benefit with respect to losses incurred and, except for certain jurisdictions, no tax expense with respect to income generated in these countries until the respective valuation allowances are eliminated. Accordingly, income taxes are impacted by changes in valuation allowances and the mix of earnings among jurisdictions. We evaluate the realizability of our deferred tax assets on a quarterly basis. In completing this evaluation, we consider all available evidence in order to determine whether, based on the weight of the evidence, a valuation allowance for our deferred tax assets is necessary. Such evidence includes historical results, future reversals of existing taxable temporary differences and expectations for future taxable income (exclusive of the reversal of temporary differences and carryforwards), as well as the implementation of feasible and prudent tax planning strategies. If, based on the weight of the evidence, it is more likely than not that all or a portion of our deferred tax assets will not be realized, a valuation allowance is recorded. As of
December 31, 2016
, we had a valuation allowance related to tax loss and credit carryforwards and other deferred tax assets of
$34 million
in the United States and
$412 million
in several international jurisdictions. If operating results improve or decline on a continual basis in a particular jurisdiction, our decision regarding the need for a valuation allowance could change, resulting in either the initial recognition or reversal of a valuation allowance in that jurisdiction, which could have a significant impact on income tax expense in the period recognized and subsequent periods. In determining the provision for income taxes
48
for financial statement purposes, we make certain estimates and judgments, which affect our evaluation of the carrying value of our deferred tax assets, as well as our calculation of certain tax liabilities.
The calculation of our gross unrecognized tax benefits and liabilities includes uncertainties in the application of, and changes in, complex tax regulations in a multitude of jurisdictions across our global operations. We recognize tax benefits and liabilities based on our estimate of whether, and the extent to which, additional taxes will be due. We adjust these benefits and liabilities based on changing facts and circumstances; however, due to the complexity of these uncertainties and the impact of tax audits, the ultimate resolutions may differ significantly from our estimates.
For further information, see "— Forward-Looking Statements," and Note
7
, "
Income Taxes
," to the consolidated financial statements included in this Report.
Fair Value Measurements
We measure certain assets and liabilities at fair value on a non-recurring basis using unobservable inputs (Level 3 input based on the GAAP fair value hierarchy). For further information on these fair value measurements, see "— Impairment of Goodwill," "— Impairment of Long-Lived Assets," "— Restructuring" and "— Impairment of Investments in Affiliates" above.
Use of Estimates
The preparation of the consolidated financial statements in conformity with GAAP requires management to make estimates and assumptions that affect the reported amounts of assets and liabilities as of the date of the consolidated financial statements and the reported amounts of revenues and expenses during the reporting period. During
2016
, there were no material changes in the methods or policies used to establish estimates and assumptions. Other matters subject to estimation and judgment include amounts related to accounts receivable realization, inventory obsolescence, asset impairments, useful lives of fixed and intangible assets, unsettled pricing discussions with customers and suppliers, restructuring accruals, deferred tax asset valuation allowances and income taxes, pension and other postretirement benefit plan assumptions, accruals related to litigation, warranty and environmental remediation costs and self-insurance accruals. Actual results may differ significantly from our estimates.
Recently Issued Accounting Pronouncements
For information on the impact of recently issued accounting pronouncements, see Note
15
, "
Accounting Pronouncements
," to the consolidated financial statements included in this Report.
Forward-Looking Statements
The Private Securities Litigation Reform Act of 1995 provides a safe harbor for forward-looking statements made by us or on our behalf. The words "will," "may," "designed to," "outlook," "believes," "should," "anticipates," "plans," "expects," "intends," "estimates," "forecasts" and similar expressions identify certain of these forward-looking statements. We also may provide forward-looking statements in oral statements or other written materials released to the public. All such forward-looking statements contained or incorporated in this Report or in any other public statements which address operating performance, events or developments that we expect or anticipate may occur in the future, including, without limitation, statements related to business opportunities, awarded sales contracts, sales backlog and ongoing commercial arrangements, or statements expressing views about future operating results, are forward-looking statements. Actual results may differ materially from any or all forward-looking statements made by us. Important factors, risks and uncertainties that may cause actual results to differ materially from anticipated results include, but are not limited to:
|
•
|
general economic conditions in the markets in which we operate, including changes in interest rates or currency exchange rates;
|
|
•
|
currency controls and the ability to economically hedge currencies;
|
|
•
|
the financial condition and restructuring actions of our customers and suppliers;
|
|
•
|
changes in actual industry vehicle production levels from our current estimates;
|
|
•
|
fluctuations in the production of vehicles or the loss of business with respect to, or the lack of commercial success of, a vehicle model for which we are a significant supplier;
|
|
•
|
disruptions in the relationships with our suppliers;
|
|
•
|
labor disputes involving us or our significant customers or suppliers or that otherwise affect us;
|
|
•
|
the outcome of customer negotiations and the impact of customer-imposed price reductions;
|
|
•
|
the impact and timing of program launch costs and our management of new program launches;
|
49
|
•
|
the costs, timing and success of restructuring actions;
|
|
•
|
increases in our warranty, product liability or recall costs;
|
|
•
|
risks associated with conducting business in foreign countries;
|
|
•
|
the impact of regulations on our foreign operations;
|
|
•
|
the operational and financial success of our joint ventures;
|
|
•
|
competitive conditions impacting us and our key customers and suppliers;
|
|
•
|
disruptions to our information technology systems, including those related to cybersecurity;
|
|
•
|
the cost and availability of raw materials, energy, commodities and product components and our ability to mitigate such costs;
|
|
•
|
the outcome of legal or regulatory proceedings to which we are or may become a party;
|
|
•
|
the impact of pending legislation and regulations or changes in existing federal, state, local or foreign laws or regulations;
|
|
•
|
unanticipated changes in cash flow, including our ability to align our vendor payment terms with those of our customers;
|
|
•
|
limitations imposed by our existing indebtedness and our ability to access capital markets on commercially reasonable terms;
|
|
•
|
impairment charges initiated by adverse industry or market developments;
|
|
•
|
our ability to execute our strategic objectives;
|
|
•
|
changes in discount rates and the actual return on pension assets;
|
|
•
|
costs associated with compliance with environmental laws and regulations;
|
|
•
|
developments or assertions by or against us relating to intellectual property rights;
|
|
•
|
our ability to utilize our net operating loss, capital loss and tax credit carryforwards;
|
|
•
|
global sovereign fiscal matters and creditworthiness, including potential defaults and the related impacts on economic activity, including the possible effects on credit markets, currency values, monetary unions, international treaties and fiscal policies;
|
|
•
|
the impact of potential changes in tax and trade policies in the United States and related actions by countries in which we do business;
|
|
•
|
the anticipated changes in economic and other relationships between the United Kingdom and the European Union; and
|
|
•
|
other risks, described in Part I — Item 1A, "Risk Factors," as well as the risks and information provided from time to time in our filings with the Securities and Exchange Commission.
|
The forward-looking statements in this Report are made as of the date hereof, and we do not assume any obligation to update, amend or clarify them to reflect events, new information or circumstances occurring after the date hereof.
50
SUPPLEMENTARY DATA
INDEX TO CONSOLIDATED FINANCIAL STATEMENTS
|
|
Page
|
51
Report of Independent Registered Public Accounting Firm
The Board of Directors and Shareholders of Lear Corporation
We have audited the accompanying consolidated balance sheets of Lear Corporation and subsidiaries as of
December 31, 2016
and
2015
, and the related consolidated statements of income, comprehensive income, equity and cash flows for each of the three years in the period ended
December 31, 2016
. Our audits also included the financial statement schedule listed in the Index at Item 15(a). These financial statements and schedule are the responsibility of the Company’s management. Our responsibility is to express an opinion on these financial statements and schedule based on our audits.
We conducted our audits in accordance with the standards of the Public Company Accounting Oversight Board (United States). Those standards require that we plan and perform the audit to obtain reasonable assurance about whether the financial statements are free of material misstatement. An audit includes examining, on a test basis, evidence supporting the amounts and disclosures in the financial statements. An audit also includes assessing the accounting principles used and significant estimates made by management, as well as evaluating the overall financial statement presentation. We believe that our audits provide a reasonable basis for our opinion.
In our opinion, the financial statements referred to above present fairly, in all material respects, the consolidated financial position of Lear Corporation and subsidiaries at
December 31, 2016
and
2015
, and the consolidated results of their operations and their cash flows for each of the three years in the period ended
December 31, 2016
, in conformity with U.S. generally accepted accounting principles. Also, in our opinion, the related financial statement schedule, when considered in relation to the basic financial statements taken as a whole, presents fairly in all material respects the information set forth therein.
We also have audited, in accordance with the standards of the Public Company Accounting Oversight Board (United States), Lear Corporation’s internal control over financial reporting as of
December 31, 2016
, based on criteria established in Internal Control-Integrated Framework issued by the Committee of Sponsoring Organizations of the Treadway Commission (2013 framework), and our report dated
February 7, 2017
, expressed an unqualified opinion thereon.
/s/ Ernst & Young LLP
Detroit, Michigan
February 7, 2017
52
Report of Independent Registered Public Accounting Firm on
Internal Control over Financial Reporting
The Board of Directors and Shareholders of Lear Corporation
We have audited Lear Corporation and subsidiaries’ internal control over financial reporting as of
December 31, 2016
, based on criteria established in Internal Control-Integrated Framework issued by the Committee of Sponsoring Organizations of the Treadway Commission (2013 framework) (the COSO criteria). Lear Corporation and subsidiaries’ management is responsible for maintaining effective internal control over financial reporting and for its assessment of the effectiveness of internal control over financial reporting included in the accompanying Management’s Annual Report on Internal Control Over Financial Reporting. Our responsibility is to express an opinion on the Company’s internal control over financial reporting based on our audit.
We conducted our audit in accordance with the standards of the Public Company Accounting Oversight Board (United States). Those standards require that we plan and perform the audit to obtain reasonable assurance about whether effective internal control over financial reporting was maintained in all material respects. Our audit included obtaining an understanding of internal control over financial reporting, assessing the risk that a material weakness exists, testing and evaluating the design and operating effectiveness of internal control based on the assessed risk and performing such other procedures as we considered necessary in the circumstances. We believe that our audit provides a reasonable basis for our opinion.
A company’s internal control over financial reporting is a process designed to provide reasonable assurance regarding the reliability of financial reporting and the preparation of financial statements for external purposes in accordance with generally accepted accounting principles. A company’s internal control over financial reporting includes those policies and procedures that (1) pertain to the maintenance of records that, in reasonable detail, accurately and fairly reflect the transactions and dispositions of the assets of the company; (2) provide reasonable assurance that transactions are recorded as necessary to permit preparation of financial statements in accordance with generally accepted accounting principles and that receipts and expenditures of the company are being made only in accordance with authorizations of management and directors of the company; and (3) provide reasonable assurance regarding prevention or timely detection of unauthorized acquisition, use or disposition of the company’s assets that could have a material effect on the financial statements.
Because of its inherent limitations, internal control over financial reporting may not prevent or detect misstatements. Also, projections of any evaluation of effectiveness to future periods are subject to the risk that controls may become inadequate because of changes in conditions or that the degree of compliance with the policies or procedures may deteriorate.
In our opinion, Lear Corporation and subsidiaries maintained, in all material respects, effective internal control over financial reporting as of
December 31, 2016
, based on the COSO criteria.
We also have audited, in accordance with the standards of the Public Company Accounting Oversight Board (United States), the
2016
consolidated financial statements of Lear Corporation and subsidiaries, and our report dated
February 7, 2017
, expressed an unqualified opinion thereon.
/s/ Ernst & Young LLP
Detroit, Michigan
February 7, 2017
53
LEAR CORPORATION AND SUBSIDIARIES
(In millions, except share data)
|
December 31,
|
2016
|
2015
|
|||||
|
Assets
|
|||||||
|
Current Assets:
|
|||||||
|
Cash and cash equivalents
|
$
|
1,271.6
|
|
$
|
1,196.6
|
|
|
|
Accounts receivable
|
2,746.5
|
|
2,590.0
|
|
|||
|
Inventories
|
1,020.6
|
|
947.6
|
|
|||
|
Other
|
610.6
|
|
552.4
|
|
|||
|
Total current assets
|
5,649.3
|
|
5,286.6
|
|
|||
|
Long-Term Assets:
|
|||||||
|
Property, plant and equipment, net
|
2,019.3
|
|
1,826.5
|
|
|||
|
Goodwill
|
1,121.3
|
|
1,053.8
|
|
|||
|
Other
|
1,110.7
|
|
1,238.9
|
|
|||
|
Total long-term assets
|
4,251.3
|
|
4,119.2
|
|
|||
|
Total assets
|
$
|
9,900.6
|
|
$
|
9,405.8
|
|
|
|
Liabilities and Equity
|
|||||||
|
Current Liabilities:
|
|||||||
|
Short-term borrowings
|
$
|
8.6
|
|
$
|
—
|
|
|
|
Accounts payable and drafts
|
2,640.5
|
|
2,504.4
|
|
|||
|
Accrued liabilities
|
1,497.6
|
|
1,312.1
|
|
|||
|
Current portion of long-term debt
|
35.6
|
|
23.1
|
|
|||
|
Total current liabilities
|
4,182.3
|
|
3,839.6
|
|
|||
|
Long-Term Liabilities:
|
|||||||
|
Long-term debt
|
1,898.0
|
|
1,931.7
|
|
|||
|
Other
|
627.4
|
|
616.8
|
|
|||
|
Total long-term liabilities
|
2,525.4
|
|
2,548.5
|
|
|||
|
Equity:
|
|||||||
|
Preferred stock, 100,000,000 shares authorized (including 10,896,250 shares
of Series A convertible preferred stock authorized); no shares outstanding |
—
|
|
—
|
|
|||
|
Common stock, $0.01 par value, 300,000,000 shares authorized; 80,563,291 shares issued as of December 31, 2016 and 2015, respectively
|
0.8
|
|
0.8
|
|
|||
|
Additional paid-in capital
|
1,385.3
|
|
1,451.9
|
|
|||
|
Common stock held in treasury, 11,131,648 and 6,099,078 shares
as of December 31, 2016 and 2015, respectively, at cost |
(1,200.2
|
)
|
(623.0
|
)
|
|||
|
Retained earnings
|
3,706.9
|
|
2,827.8
|
|
|||
|
Accumulated other comprehensive loss
|
(835.6
|
)
|
(730.1
|
)
|
|||
|
Lear Corporation stockholders’ equity
|
3,057.2
|
|
2,927.4
|
|
|||
|
Noncontrolling interests
|
135.7
|
|
90.3
|
|
|||
|
Equity
|
3,192.9
|
|
3,017.7
|
|
|||
|
Total liabilities and equity
|
$
|
9,900.6
|
|
$
|
9,405.8
|
|
|
The accompanying notes are an integral part of these consolidated balance sheets.
54
LEAR CORPORATION AND SUBSIDIARIES
(In millions, except share and per share data)
|
For the year ended December 31,
|
2016
|
2015
|
2014
|
||||||||
|
Net sales
|
$
|
18,557.6
|
|
$
|
18,211.4
|
|
$
|
17,727.3
|
|
||
|
Cost of sales
|
16,455.5
|
|
16,391.6
|
|
16,234.5
|
|
|||||
|
Selling, general and administrative expenses
|
621.9
|
|
580.5
|
|
529.9
|
|
|||||
|
Amortization of intangible assets
|
53.0
|
|
52.5
|
|
33.7
|
|
|||||
|
Interest expense
|
82.5
|
|
86.7
|
|
67.5
|
|
|||||
|
Other expense, net
|
6.4
|
|
68.6
|
|
74.3
|
|
|||||
|
Consolidated income before provision for income taxes and equity in net income of affiliates
|
1,338.3
|
|
1,031.5
|
|
787.4
|
|
|||||
|
Provision for income taxes
|
370.2
|
|
285.5
|
|
121.4
|
|
|||||
|
Equity in net income of affiliates
|
(72.4
|
)
|
(49.8
|
)
|
(36.3
|
)
|
|||||
|
Consolidated net income
|
1,040.5
|
|
795.8
|
|
702.3
|
|
|||||
|
Less: Net income attributable to noncontrolling interests
|
65.4
|
|
50.3
|
|
29.9
|
|
|||||
|
Net income attributable to Lear
|
$
|
975.1
|
|
$
|
745.5
|
|
$
|
672.4
|
|
||
|
Basic net income per share attributable to Lear
|
$
|
13.48
|
|
$
|
9.71
|
|
$
|
8.39
|
|
||
|
Diluted net income per share attributable to Lear
|
$
|
13.33
|
|
$
|
9.59
|
|
$
|
8.23
|
|
||
|
Average common shares outstanding
|
72,345,436
|
|
76,754,270
|
|
80,187,516
|
|
|||||
|
Average diluted shares outstanding
|
73,124,949
|
|
77,767,017
|
|
81,728,479
|
|
|||||
The accompanying notes are an integral part of these consolidated financial statements.
55
LEAR CORPORATION AND SUBSIDIARIES
CONSOLIDATED STATEMENTS OF COMPREHENSIVE INCOME
(In millions)
|
For the year ended December 31,
|
2016
|
2015
|
2014
|
||||||||
|
Consolidated net income
|
$
|
1,040.5
|
|
$
|
795.8
|
|
$
|
702.3
|
|
||
|
Other comprehensive income (loss), net of tax:
|
|||||||||||
|
Defined benefit plan adjustments
|
1.8
|
|
24.6
|
|
(114.7
|
)
|
|||||
|
Derivative instruments and hedging activities
|
(6.4
|
)
|
(5.5
|
)
|
(27.9
|
)
|
|||||
|
Foreign currency translation adjustments
|
(109.5
|
)
|
(251.1
|
)
|
(195.2
|
)
|
|||||
|
Total other comprehensive loss
|
(114.1
|
)
|
(232.0
|
)
|
(337.8
|
)
|
|||||
|
Consolidated comprehensive income
|
926.4
|
|
563.8
|
|
364.5
|
|
|||||
|
Less: Comprehensive income attributable to noncontrolling interests
|
56.8
|
|
46.4
|
|
28.0
|
|
|||||
|
Comprehensive income attributable to Lear
|
$
|
869.6
|
|
$
|
517.4
|
|
$
|
336.5
|
|
||
The accompanying notes are an integral part of these consolidated financial statements.
56
LEAR CORPORATION AND SUBSIDIARIES
CONSOLIDATED STATEMENTS OF EQUITY
(In millions, except share data)
|
Preferred
Stock
|
Common
Stock
|
Additional Paid-in Capital
|
Common
Stock Held in Treasury
|
Retained
Earnings
|
|||||||||||||||
|
Balance at December 31, 2013
|
$
|
—
|
|
$
|
0.9
|
|
$
|
1,652.9
|
|
$
|
(362.1
|
)
|
$
|
1,920.3
|
|
||||
|
Comprehensive income (loss):
|
|||||||||||||||||||
|
Net income
|
—
|
|
—
|
|
—
|
|
—
|
|
672.4
|
|
|||||||||
|
Other comprehensive loss
|
—
|
|
—
|
|
—
|
|
—
|
|
—
|
|
|||||||||
|
Total comprehensive income (loss)
|
—
|
|
—
|
|
—
|
|
—
|
|
672.4
|
|
|||||||||
|
Stock-based compensation
|
—
|
|
—
|
|
70.7
|
|
—
|
|
—
|
|
|||||||||
|
Excess tax benefits related to stock-based compensation
|
—
|
|
—
|
|
0.9
|
|
—
|
|
—
|
|
|||||||||
|
Net issuances of 868,746 shares held in treasury in settlement of stock-based compensation
|
—
|
|
—
|
|
(43.6
|
)
|
21.2
|
|
—
|
|
|||||||||
|
Repurchases of 3,805,114 shares of common stock at an average price of $93.52 per share
|
—
|
|
—
|
|
(55.5
|
)
|
(355.9
|
)
|
—
|
|
|||||||||
|
Retirement of 8,000,000 shares held in treasury at average price of $64.98 per share
|
—
|
|
(0.1
|
)
|
(155.9
|
)
|
519.9
|
|
(363.9
|
)
|
|||||||||
|
Dividends declared to Lear Corporation stockholders
|
—
|
|
—
|
|
—
|
|
—
|
|
(67.1
|
)
|
|||||||||
|
Dividends paid to noncontrolling interests
|
—
|
|
—
|
|
—
|
|
—
|
|
—
|
|
|||||||||
|
Acquisition of outstanding noncontrolling interests
|
—
|
|
—
|
|
5.7
|
|
—
|
|
—
|
|
|||||||||
|
Sale of controlling interest
|
—
|
|
—
|
|
—
|
|
—
|
|
—
|
|
|||||||||
|
Balance at December 31, 2014
|
$
|
—
|
|
$
|
0.8
|
|
$
|
1,475.2
|
|
$
|
(176.9
|
)
|
$
|
2,161.7
|
|
||||
|
Comprehensive income (loss):
|
|||||||||||||||||||
|
Net income
|
—
|
|
—
|
|
—
|
|
—
|
|
745.5
|
|
|||||||||
|
Other comprehensive income (loss)
|
—
|
|
—
|
|
—
|
|
—
|
|
—
|
|
|||||||||
|
Total comprehensive income (loss)
|
—
|
|
—
|
|
—
|
|
—
|
|
745.5
|
|
|||||||||
|
Stock-based compensation
|
—
|
|
—
|
|
65.7
|
|
—
|
|
—
|
|
|||||||||
|
Excess tax benefits related to stock-based compensation
|
—
|
|
—
|
|
2.5
|
|
—
|
|
—
|
|
|||||||||
|
Net issuances of 807,015 shares held in treasury in settlement of stock-based compensation
|
—
|
|
—
|
|
(91.5
|
)
|
41.3
|
|
—
|
|
|||||||||
|
Repurchases of 4,366,365 shares of common stock at an average price of $111.62 per share
|
—
|
|
—
|
|
—
|
|
(487.4
|
)
|
—
|
|
|||||||||
|
Dividends declared to Lear Corporation stockholders
|
—
|
|
—
|
|
—
|
|
—
|
|
(79.4
|
)
|
|||||||||
|
Dividends paid to noncontrolling interests
|
—
|
|
—
|
|
—
|
|
—
|
|
—
|
|
|||||||||
|
Additions to noncontrolling interests
|
—
|
|
—
|
|
—
|
|
—
|
|
—
|
|
|||||||||
|
Balance at December 31, 2015
|
$
|
—
|
|
$
|
0.8
|
|
$
|
1,451.9
|
|
$
|
(623.0
|
)
|
$
|
2,827.8
|
|
||||
|
Comprehensive income (loss):
|
|||||||||||||||||||
|
Net income
|
—
|
|
—
|
|
—
|
|
—
|
|
975.1
|
|
|||||||||
|
Other comprehensive income (loss)
|
—
|
|
—
|
|
—
|
|
—
|
|
—
|
|
|||||||||
|
Total comprehensive income (loss)
|
—
|
|
—
|
|
|
—
|
|
|
—
|
|
|
975.1
|
|
||||||
|
Stock-based compensation
|
—
|
|
—
|
|
68.2
|
|
—
|
|
—
|
|
|||||||||
|
Excess tax benefits related to stock-based compensation
|
—
|
|
—
|
|
8.8
|
|
—
|
|
—
|
|
|||||||||
|
Net issuances of 783,793 shares held in treasury in settlement of stock-based compensation
|
—
|
|
—
|
|
(124.2
|
)
|
81.6
|
|
(4.7
|
)
|
|||||||||
|
Repurchases of 5,816,363 shares of common stock at an average price of $113.26 per share
|
—
|
|
—
|
|
—
|
|
(658.8
|
)
|
—
|
|
|||||||||
|
Dividends declared to Lear Corporation stockholders
|
—
|
|
—
|
|
—
|
|
—
|
|
(89.1
|
)
|
|||||||||
|
Dividends declared to noncontrolling interests
|
—
|
|
—
|
|
—
|
|
—
|
|
—
|
|
|||||||||
|
Consolidation of affiliate
|
—
|
|
—
|
|
—
|
|
—
|
|
—
|
|
|||||||||
|
Acquisition of outstanding noncontrolling interests
|
—
|
|
—
|
|
(19.4
|
)
|
—
|
|
—
|
|
|||||||||
|
Noncontrolling interests — other
|
—
|
|
—
|
|
—
|
|
—
|
|
(2.2
|
)
|
|||||||||
|
Balance at December 31, 2016
|
$
|
—
|
|
$
|
0.8
|
|
$
|
1,385.3
|
|
$
|
(1,200.2
|
)
|
$
|
3,706.9
|
|
||||
The accompanying notes are an integral part of these consolidated financial statements.
57
LEAR CORPORATION AND SUBSIDIARIES
CONSOLIDATED STATEMENTS OF EQUITY (continued)
(In millions, except share data)
|
|
Accumulated Other Comprehensive Loss, net of tax
|
|
|||||||||||||||||||||
|
|
Defined
Benefit Plans
|
Derivative
Instruments and
Hedging
Activities
|
Cumulative
Translation
Adjustments
|
Lear
Corporation
Stockholders’
Equity
|
Non-controlling
Interests
|
Equity
|
|||||||||||||||||
|
Balance at December 31, 2013
|
$
|
(104.5
|
)
|
$
|
(5.3
|
)
|
$
|
(56.3
|
)
|
$
|
3,045.9
|
|
$
|
103.6
|
|
$
|
3,149.5
|
|
|||||
|
Comprehensive income (loss):
|
|||||||||||||||||||||||
|
Net income
|
—
|
|
—
|
|
—
|
|
672.4
|
|
29.9
|
|
702.3
|
|
|||||||||||
|
Other comprehensive loss
|
(114.7
|
)
|
(27.9
|
)
|
(193.3
|
)
|
(335.9
|
)
|
(1.9
|
)
|
(337.8
|
)
|
|||||||||||
|
Total comprehensive income (loss)
|
(114.7
|
)
|
(27.9
|
)
|
(193.3
|
)
|
336.5
|
|
28.0
|
|
364.5
|
|
|||||||||||
|
Stock-based compensation
|
—
|
|
—
|
|
—
|
|
70.7
|
|
—
|
|
70.7
|
|
|||||||||||
|
Excess tax benefits related to stock-based compensation
|
—
|
|
—
|
|
—
|
|
0.9
|
|
—
|
|
0.9
|
|
|||||||||||
|
Net issuances of 868,746 shares held in treasury in settlement of stock-based compensation
|
—
|
|
—
|
|
—
|
|
(22.4
|
)
|
—
|
|
(22.4
|
)
|
|||||||||||
|
Repurchases of 3,805,114 shares of common stock at an average price of $93.52 per share
|
—
|
|
—
|
|
—
|
|
(411.4
|
)
|
—
|
|
(411.4
|
)
|
|||||||||||
|
Retirement of 8,000,000 shares held in treasury at average price of $64.98 per share
|
—
|
|
—
|
|
—
|
|
—
|
|
—
|
|
—
|
|
|||||||||||
|
Dividends declared to Lear Corporation stockholders
|
—
|
|
—
|
|
—
|
|
(67.1
|
)
|
—
|
|
(67.1
|
)
|
|||||||||||
|
Dividends paid to noncontrolling interests
|
—
|
|
—
|
|
—
|
|
—
|
|
(25.9
|
)
|
(25.9
|
)
|
|||||||||||
|
Acquisition of outstanding noncontrolling interests
|
—
|
|
—
|
|
—
|
|
5.7
|
|
(23.7
|
)
|
(18.0
|
)
|
|||||||||||
|
Sale of controlling interest
|
—
|
|
—
|
|
—
|
|
—
|
|
(11.5
|
)
|
(11.5
|
)
|
|||||||||||
|
Balance at December 31, 2014
|
$
|
(219.2
|
)
|
$
|
(33.2
|
)
|
$
|
(249.6
|
)
|
$
|
2,958.8
|
|
$
|
70.5
|
|
$
|
3,029.3
|
|
|||||
|
Comprehensive income (loss):
|
|||||||||||||||||||||||
|
Net income
|
—
|
|
—
|
|
—
|
|
745.5
|
|
50.3
|
|
795.8
|
|
|||||||||||
|
Other comprehensive income (loss)
|
24.6
|
|
(5.5
|
)
|
(247.2
|
)
|
(228.1
|
)
|
(3.9
|
)
|
(232.0
|
)
|
|||||||||||
|
Total comprehensive income (loss)
|
24.6
|
|
(5.5
|
)
|
(247.2
|
)
|
517.4
|
|
46.4
|
|
563.8
|
|
|||||||||||
|
Stock-based compensation
|
—
|
|
—
|
|
—
|
|
65.7
|
|
—
|
|
65.7
|
|
|||||||||||
|
Excess tax benefits related to stock-based compensation
|
—
|
|
—
|
|
—
|
|
2.5
|
|
—
|
|
2.5
|
|
|||||||||||
|
Net issuances of 807,015 shares held in treasury in settlement of stock-based compensation
|
—
|
|
—
|
|
—
|
|
(50.2
|
)
|
—
|
|
(50.2
|
)
|
|||||||||||
|
Repurchases of 4,366,365 shares of common stock at an average price of $111.62 per share
|
—
|
|
—
|
|
—
|
|
(487.4
|
)
|
—
|
|
(487.4
|
)
|
|||||||||||
|
Dividends declared to Lear Corporation stockholders
|
—
|
|
—
|
|
—
|
|
(79.4
|
)
|
—
|
|
(79.4
|
)
|
|||||||||||
|
Dividends paid to noncontrolling interests
|
—
|
|
—
|
|
—
|
|
—
|
|
(29.3
|
)
|
(29.3
|
)
|
|||||||||||
|
Additions to noncontrolling interests
|
—
|
|
—
|
|
—
|
|
—
|
|
2.7
|
|
2.7
|
|
|||||||||||
|
Balance at December 31, 2015
|
$
|
(194.6
|
)
|
$
|
(38.7
|
)
|
$
|
(496.8
|
)
|
$
|
2,927.4
|
|
$
|
90.3
|
|
$
|
3,017.7
|
|
|||||
|
Comprehensive income (loss):
|
|||||||||||||||||||||||
|
Net income
|
—
|
|
—
|
|
—
|
|
975.1
|
|
65.4
|
|
1,040.5
|
|
|||||||||||
|
Other comprehensive income (loss)
|
1.8
|
|
(6.4
|
)
|
(100.9
|
)
|
(105.5
|
)
|
(8.6
|
)
|
(114.1
|
)
|
|||||||||||
|
Total comprehensive income (loss)
|
1.8
|
|
(6.4
|
)
|
(100.9
|
)
|
869.6
|
|
56.8
|
|
926.4
|
|
|||||||||||
|
Stock-based compensation
|
—
|
|
—
|
|
—
|
|
68.2
|
|
—
|
|
68.2
|
|
|||||||||||
|
Excess tax benefits related to stock-based compensation
|
—
|
|
—
|
|
—
|
|
8.8
|
|
—
|
|
8.8
|
|
|||||||||||
|
Net issuances of 783,793 shares held in treasury in settlement of stock-based compensation
|
—
|
|
—
|
|
—
|
|
(47.3
|
)
|
—
|
|
(47.3
|
)
|
|||||||||||
|
Repurchases of 5,816,363 shares of common stock at an average price of $113.26 per share
|
—
|
|
—
|
|
—
|
|
(658.8
|
)
|
—
|
|
(658.8
|
)
|
|||||||||||
|
Dividends declared to Lear Corporation stockholders
|
—
|
|
—
|
|
—
|
|
(89.1
|
)
|
—
|
|
(89.1
|
)
|
|||||||||||
|
Dividends declared to noncontrolling interests
|
—
|
|
—
|
|
—
|
|
—
|
|
(41.2
|
)
|
(41.2
|
)
|
|||||||||||
|
Consolidation of affiliate
|
—
|
|
—
|
|
—
|
|
—
|
|
41.0
|
|
41.0
|
|
|||||||||||
|
Acquisition of outstanding noncontrolling interests
|
—
|
|
—
|
|
—
|
|
(19.4
|
)
|
(13.4
|
)
|
(32.8
|
)
|
|||||||||||
|
Noncontrolling interests — other
|
—
|
|
—
|
|
—
|
|
(2.2
|
)
|
2.2
|
|
—
|
|
|||||||||||
|
Balance at December 31, 2016
|
$
|
(192.8
|
)
|
$
|
(45.1
|
)
|
$
|
(597.7
|
)
|
$
|
3,057.2
|
|
$
|
135.7
|
|
$
|
3,192.9
|
|
|||||
The accompanying notes are an integral part of these consolidated financial statements.
58
LEAR CORPORATION AND SUBSIDIARIES
(In millions)
|
For the year ended December 31,
|
2016
|
2015
|
2014
|
||||||||
|
Cash Flows from Operating Activities:
|
|||||||||||
|
Consolidated net income
|
$
|
1,040.5
|
|
$
|
795.8
|
|
$
|
702.3
|
|
||
|
Adjustments to reconcile consolidated net income to net cash provided by operating activities –
|
|||||||||||
|
Equity in net income of affiliates
|
(72.4
|
)
|
(49.8
|
)
|
(36.3
|
)
|
|||||
|
Loss on extinguishment of debt
|
—
|
|
14.3
|
|
17.9
|
|
|||||
|
Fixed asset impairment charges
|
5.4
|
|
5.7
|
|
2.6
|
|
|||||
|
Deferred tax provision (benefit)
|
103.6
|
|
48.6
|
|
(58.0
|
)
|
|||||
|
Depreciation and amortization
|
378.2
|
|
347.8
|
|
310.9
|
|
|||||
|
Stock-based compensation
|
68.2
|
|
65.7
|
|
70.7
|
|
|||||
|
Net change in recoverable customer engineering, development and tooling
|
(16.9
|
)
|
(57.8
|
)
|
7.6
|
|
|||||
|
Net change in working capital items (see below)
|
88.1
|
|
58.0
|
|
(140.2
|
)
|
|||||
|
Changes in other long-term liabilities
|
(12.9
|
)
|
(20.2
|
)
|
5.4
|
|
|||||
|
Changes in other long-term assets
|
38.3
|
|
44.3
|
|
41.4
|
|
|||||
|
Other, net
|
(0.8
|
)
|
18.7
|
|
3.5
|
|
|||||
|
Net cash provided by operating activities
|
1,619.3
|
|
1,271.1
|
|
927.8
|
|
|||||
|
Cash Flows from Investing Activities:
|
|||||||||||
|
Additions to property, plant and equipment
|
(528.3
|
)
|
(485.8
|
)
|
(424.7
|
)
|
|||||
|
Acquisitions, net of cash acquired and use of $350 million restricted cash in 2015 (see non-cash investing activities below) (Note 3)
|
(155.9
|
)
|
(499.2
|
)
|
—
|
|
|||||
|
Cash restricted for use - acquisition of Eagle Ottawa
|
—
|
|
—
|
|
(350.0
|
)
|
|||||
|
Other, net
|
47.1
|
|
19.7
|
|
(5.9
|
)
|
|||||
|
Net cash used in investing activities
|
(637.1
|
)
|
(965.3
|
)
|
(780.6
|
)
|
|||||
|
Cash Flows from Financing Activities:
|
|||||||||||
|
Credit agreement borrowings
|
—
|
|
500.0
|
|
—
|
|
|||||
|
Credit agreement repayments
|
(21.9
|
)
|
(9.4
|
)
|
—
|
|
|||||
|
Short-term borrowings, net
|
9.1
|
|
—
|
|
—
|
|
|||||
|
Proceeds from the issuance of senior notes
|
—
|
|
—
|
|
975.0
|
|
|||||
|
Repurchase of senior notes, net of use of $250 million restricted cash in 2015 (see non-cash financing activities below) (Note 6)
|
—
|
|
(5.0
|
)
|
(327.1
|
)
|
|||||
|
Payment of debt issuance and other financing costs
|
—
|
|
—
|
|
(18.1
|
)
|
|||||
|
Cash restricted for use - repurchase of senior notes
|
—
|
|
—
|
|
(250.0
|
)
|
|||||
|
Repurchase of common stock
|
(658.8
|
)
|
(487.4
|
)
|
(411.4
|
)
|
|||||
|
Dividends paid to Lear Corporation stockholders
|
(88.8
|
)
|
(78.5
|
)
|
(65.3
|
)
|
|||||
|
Dividends paid to noncontrolling interests
|
(33.3
|
)
|
(27.8
|
)
|
(25.9
|
)
|
|||||
|
Other, net
|
(79.2
|
)
|
(48.2
|
)
|
(38.0
|
)
|
|||||
|
Net cash used in financing activities
|
(872.9
|
)
|
(156.3
|
)
|
(160.8
|
)
|
|||||
|
Effect of foreign currency translation
|
(34.3
|
)
|
(47.0
|
)
|
(30.0
|
)
|
|||||
|
Net Change in Cash and Cash Equivalents
|
75.0
|
|
102.5
|
|
(43.6
|
)
|
|||||
|
Cash and Cash Equivalents as of Beginning of Period
|
1,196.6
|
|
1,094.1
|
|
1,137.7
|
|
|||||
|
Cash and Cash Equivalents as of End of Period
|
$
|
1,271.6
|
|
$
|
1,196.6
|
|
$
|
1,094.1
|
|
||
|
Changes in Working Capital Items:
|
|||||||||||
|
Accounts receivable
|
$
|
(176.3
|
)
|
$
|
(173.4
|
)
|
$
|
(358.7
|
)
|
||
|
Inventories
|
(53.5
|
)
|
4.1
|
|
(91.2
|
)
|
|||||
|
Accounts payable (including $45.7 million of cash paid in 2015 in conjunction with the acquisition of Eagle Ottawa to settle pre-existing accounts payable)
|
157.6
|
|
76.2
|
|
231.3
|
|
|||||
|
Accrued liabilities and other
|
160.3
|
|
151.1
|
|
78.4
|
|
|||||
|
Net change in working capital items
|
$
|
88.1
|
|
$
|
58.0
|
|
$
|
(140.2
|
)
|
||
|
Supplementary Disclosure:
|
|||||||||||
|
Cash paid for interest
|
$
|
88.8
|
|
$
|
85.6
|
|
$
|
70.7
|
|
||
|
Cash paid for income taxes, net of refunds received of $16.4 million in 2016, $11.9 million in 2015 and $24.0 million in 2014
|
$
|
237.6
|
|
$
|
218.7
|
|
$
|
154.6
|
|
||
|
Non-cash Investing Activities:
|
|||||||||||
|
Cash restricted for use - acquisition of Eagle Ottawa
|
$
|
—
|
|
$
|
(350.0
|
)
|
$
|
—
|
|
||
|
Non-cash Financing Activities:
|
|||||||||||
|
Cash restricted for use - repurchase of senior notes
|
$
|
—
|
|
$
|
(250.0
|
)
|
$
|
—
|
|
||
The accompanying notes are an integral part of these consolidated financial statements.
59
Lear Corporation and Subsidiaries
Notes to Consolidated Financial Statements
(
1
)
Basis of Presentation
Lear Corporation ("Lear," and together with its consolidated subsidiaries, the "Company") and its affiliates design and manufacture automotive seating and electrical distribution systems and related components. The Company’s main customers are automotive original equipment manufacturers. The Company operates facilities worldwide.
The accompanying consolidated financial statements include the accounts of Lear, a Delaware corporation, and the wholly owned and less than wholly owned subsidiaries controlled by Lear.
(
2
)
Summary of Significant Accounting Policies
Consolidation
Lear consolidates all entities, including variable interest entities, in which it has a controlling financial interest. Investments in affiliates in which Lear does not have control, but does have the ability to exercise significant influence over operating and financial policies, are accounted for under the equity method (Note
5
, "
Investments in Affiliates and Other Related Party Transactions
").
Fiscal Period Reporting
The Company’s annual financial results are reported on a calendar year basis, and quarterly interim results are reported using a thirteen week reporting calendar.
Cash and Cash Equivalents
Cash and cash equivalents include all highly liquid investments with original maturities of ninety days or less.
Accounts Receivable
The Company records accounts receivable as title is transferred to its customers. The Company’s customers are the world’s major automotive manufacturers. The Company records accounts receivable reserves for known collectibility issues, as such issues relate to specific transactions or customer balances. As of
December 31, 2016
and
2015
, accounts receivable are reflected net of reserves of
$32.8 million
and
$34.4 million
, respectively. The Company writes off accounts receivable when it becomes apparent, based upon age or customer circumstances, that such amounts will not be collected. Generally, the Company does not require collateral for its accounts receivable.
Inventories
Inventories are stated at the lower of cost or market. Cost is determined using the first-in, first-out method. Finished goods and work-in-process inventories include material, labor and manufacturing overhead costs. The Company records reserves for inventory in excess of production and/or forecasted requirements and for obsolete inventory in production and service inventories. As of
December 31, 2016
and
2015
, inventories are reflected net of reserves of
$94.4 million
and
$93.9 million
, respectively. A summary of inventories is shown below (in millions):
|
December 31,
|
2016
|
2015
|
|||||
|
Raw materials
|
$
|
746.3
|
|
$
|
706.8
|
|
|
|
Work-in-process
|
106.4
|
|
90.2
|
|
|||
|
Finished goods
|
167.9
|
|
150.6
|
|
|||
|
Inventories
|
$
|
1,020.6
|
|
$
|
947.6
|
|
|
Pre-Production Costs Related to Long-Term Supply Agreements
The Company incurs pre-production engineering and development ("E&D") and tooling costs related to the products produced for its customers under long-term supply agreements. The Company expenses all pre-production E&D costs for which reimbursement is not contractually guaranteed by the customer. In addition, the Company expenses all pre-production tooling costs related to customer-owned tools for which reimbursement is not contractually guaranteed by the customer or for which the Company does not have a non-cancelable right to use the tooling.
During
2016
and
2015
, the Company capitalized
$179.3 million
and
$193.7 million
, respectively, of pre-production E&D costs for which reimbursement is contractually guaranteed by the customer. During
2016
and
2015
, the Company also capitalized
60
Lear Corporation and Subsidiaries
Notes to Consolidated Financial Statements (continued)
$96.0 million
and
$121.0 million
, respectively, of pre-production tooling costs related to customer-owned tools for which reimbursement is contractually guaranteed by the customer or for which the Company has a non-cancelable right to use the tooling. These amounts are included in other current and long-term assets in the accompanying consolidated balance sheets as of December 31, 2016 and 2015. During
2016
and
2015
, the Company collected
$264.6 million
and
$266.4 million
, respectively, of cash related to E&D and tooling costs.
The classification of recoverable customer E&D and tooling costs related to long-term supply agreements is shown below (in millions):
|
December 31,
|
2016
|
2015
|
|||||
|
Current
|
$
|
185.9
|
|
$
|
162.0
|
|
|
|
Long-term
|
43.4
|
|
53.7
|
|
|||
|
Recoverable customer E&D and tooling
|
$
|
229.3
|
|
$
|
215.7
|
|
|
Property, Plant and Equipment
Property, plant and equipment is stated at cost. Costs associated with the repair and maintenance of the Company’s property, plant and equipment are expensed as incurred. Costs associated with improvements which extend the life, increase the capacity or improve the efficiency or safety of the Company’s property, plant and equipment are capitalized and depreciated over the remaining useful life of the related asset. Depreciable property is depreciated over the estimated useful lives of the assets, using principally the straight-line method as follows:
|
Buildings and improvements
|
10 to 40 years
|
|
Machinery and equipment
|
5 to 10 years
|
A summary of property, plant and equipment is shown below (in millions):
|
December 31,
|
2016
|
2015
|
|||||
|
Land
|
$
|
101.7
|
|
$
|
97.9
|
|
|
|
Buildings and improvements
|
648.1
|
|
560.4
|
|
|||
|
Machinery and equipment
|
2,459.6
|
|
2,125.8
|
|
|||
|
Construction in progress
|
296.4
|
|
274.9
|
|
|||
|
Total property, plant and equipment
|
3,505.8
|
|
3,059.0
|
|
|||
|
Less – accumulated depreciation
|
(1,486.5
|
)
|
(1,232.5
|
)
|
|||
|
Net property, plant and equipment
|
$
|
2,019.3
|
|
$
|
1,826.5
|
|
|
For the years ended
December 31, 2016
,
2015
and
2014
, depreciation expense was
$325.2 million
,
$295.3 million
and
$277.2 million
, respectively. As of December 31,
2016
,
2015
and
2014
, capital expenditures recorded in accounts payable totaled
$117.8 million
,
$91.6 million
and
$86.7 million
, respectively.
Impairment of Goodwill
Goodwill is not amortized but is tested for impairment on at least an annual basis. Impairment testing is required more often than annually if an event or circumstance indicates that an impairment is more likely than not to have occurred. In conducting its annual impairment testing, the Company may first perform a qualitative assessment of whether it is more likely than not that a reporting unit’s fair value is less than its carrying amount. If not, no further goodwill impairment testing is required. If it is more likely than not that a reporting unit’s fair value is less than its carrying amount, or if the Company elects not to perform a qualitative assessment of a reporting unit, the Company then compares the fair value of the reporting unit to the related net book value. If the net book value of a reporting unit exceeds its fair value, an impairment loss is measured and recognized. The Company conducts its annual impairment testing as of the first day of its fourth quarter.
The Company utilizes an income approach to estimate the fair value of each of its reporting units and a market valuation approach to further support this analysis. The income approach is based on projected debt-free cash flow which is discounted to the present value using discount factors that consider the timing and risk of cash flows. The Company believes that this approach is appropriate because it provides a fair value estimate based upon the reporting unit’s expected long-term operating cash flow performance. This approach also mitigates the impact of cyclical trends that occur in the industry. Fair value is estimated using recent automotive industry and specific platform production volume projections, which are based on both third-party and internally developed forecasts, as well as commercial, wage and benefit, inflation and discount rate assumptions. The
61
Lear Corporation and Subsidiaries
Notes to Consolidated Financial Statements (continued)
discount rate used is the value-weighted average of the Company’s estimated cost of equity and of debt ("cost of capital") derived using both known and estimated customary market metrics. The Company’s weighted average cost of capital is adjusted by reporting unit to reflect a risk factor, if necessary. Other significant assumptions include terminal value growth rates, terminal value margin rates, future capital expenditures and changes in future working capital requirements. While there are inherent uncertainties related to the assumptions used and to management’s application of these assumptions to this analysis, the Company believes that the income approach provides a reasonable estimate of the fair value of its reporting units. The market valuation approach is used to further support the Company’s analysis and is based on recent transactions involving comparable companies.
In
2016
, the Company performed a combination of qualitative and quantitative assessments of its reporting units. All assessments were completed as of the first day of the Company’s fourth quarter. The assessments indicated that the fair value of each of the reporting units exceeded its respective carrying value. The Company does not believe that any of its reporting units is at risk for impairment.
A summary of the changes in the carrying amount of goodwill for each of the periods in the two years ended
December 31, 2016
, is shown below (in millions):
|
Seating
|
E-Systems
|
Total
|
|||||||||
|
Balance as of December 31, 2014
|
$
|
726.2
|
|
$
|
—
|
|
$
|
726.2
|
|
||
|
Acquisitions
|
343.7
|
|
27.0
|
|
370.7
|
|
|||||
|
Foreign currency translation and other
|
(43.1
|
)
|
—
|
|
(43.1
|
)
|
|||||
|
Balance as of December 31, 2015
|
1,026.8
|
|
27.0
|
|
1,053.8
|
|
|||||
|
Acquisitions
|
72.0
|
|
2.6
|
|
74.6
|
|
|||||
|
Consolidation of affiliate
|
8.9
|
|
—
|
|
8.9
|
|
|||||
|
Foreign currency translation and other
|
(16.5
|
)
|
0.5
|
|
(16.0
|
)
|
|||||
|
Balance as of December 31, 2016
|
$
|
1,091.2
|
|
$
|
30.1
|
|
$
|
1,121.3
|
|
||
For further information related to acquisitions and the consolidation of an affiliate, see Note
3
, "
Acquisitions
," and Note
5
, "
Investments in Affiliates and Other Related Party Transactions
."
Intangible Assets
As of December 31, 2016, intangible assets consist primarily of certain intangible assets recorded in connection with the acquisitions of Guilford Mills in 2012, Everett Smith Group, Ltd., the parent company of Eagle Ottawa, LLC, in 2015 and AccuMED in 2016 (Note
3
, "
Acquisitions
"). These intangible assets were recorded at their estimated fair value, based on independent appraisals, as of the transaction or acquisition date. The value assigned to technology intangibles is based on the royalty savings method, which applies a hypothetical royalty rate to projected revenues attributable to the identified technologies. Royalty rates were determined based primarily on analysis of market information. The customer-based intangible asset includes the acquired entity's established relationships with its customers and the ability of these customers to generate future economic profits for the Company. The value assigned to customer-based intangibles is based on the present value of future earnings attributable to the asset group after recognition of required returns to other contributory assets.
A summary of intangible assets as of
December 31, 2016
and
2015
, is shown below (in millions):
|
Gross Carrying
Value
|
Accumulated
Amortization
|
Net Carrying
Value
|
Weighted
Average Useful
Life (years)
|
||||||||||
|
Technology
|
$
|
24.6
|
|
$
|
(16.4
|
)
|
$
|
8.2
|
|
8.6
|
|||
|
Customer-based
|
338.2
|
|
(68.3
|
)
|
269.9
|
|
7.4
|
||||||
|
Other
|
10.7
|
|
(1.7
|
)
|
9.0
|
|
5.8
|
||||||
|
Balance as of December 31, 2016
|
$
|
373.5
|
|
$
|
(86.4
|
)
|
$
|
287.1
|
|
7.5
|
|||
Intangible assets with a gross carrying value of
$153.6 million
became fully amortized in 2016 and are no longer included in the intangible asset gross carrying value or accumulated amortization as of December 31, 2016.
62
Lear Corporation and Subsidiaries
Notes to Consolidated Financial Statements (continued)
|
Gross Carrying
Value
|
Accumulated
Amortization
|
Net Carrying
Value
|
Weighted
Average Useful
Life (years)
|
||||||||||
|
Technology
|
$
|
31.1
|
|
$
|
(19.4
|
)
|
$
|
11.7
|
|
7.7
|
|||
|
Customer-based
|
406.0
|
|
(172.4
|
)
|
233.6
|
|
8.8
|
||||||
|
Other
|
10.9
|
|
—
|
|
10.9
|
|
5.7
|
||||||
|
Balance as of December 31, 2015
|
$
|
448.0
|
|
$
|
(191.8
|
)
|
$
|
256.2
|
|
8.7
|
|||
Excluding the impact of any future acquisitions, the Company’s estimated annual amortization expense for the five succeeding years is shown below (in millions):
|
Year
|
Expense
|
||
|
2017
|
$
|
40.2
|
|
|
2018
|
36.2
|
|
|
|
2019
|
35.7
|
|
|
|
2020
|
34.0
|
|
|
|
2021
|
32.2
|
|
|
Impairment of Long-Lived Assets
The Company monitors its long-lived assets for impairment indicators on an ongoing basis in accordance with accounting principles generally accepted in the United States ("GAAP"). If impairment indicators exist, the Company performs the required impairment analysis by comparing the undiscounted cash flows expected to be generated from the long-lived assets to the related net book values. If the net book value exceeds the undiscounted cash flows, an impairment loss is measured and recognized. An impairment loss is measured as the difference between the net book value and the fair value of the long-lived assets. Fair value is estimated based upon either discounted cash flow analyses or estimated salvage values. Cash flows are estimated using internal budgets based on recent sales data, independent automotive production volume estimates and customer commitments, as well as assumptions related to discount rates.
For the years ended
December 31, 2016
,
2015
and
2014
, the Company recognized fixed asset impairment charges of
$4.7 million
,
$3.9 million
and
$0.5 million
, respectively, in conjunction with its restructuring actions (Note
4
, "
Restructuring
"), as well as additional fixed asset impairment charges of
$0.7 million
,
$1.8 million
and
$2.1 million
, respectively.
Fixed asset impairment charges are recorded in cost of sales in the accompanying consolidated statements of income for the years ended
December 31, 2016
,
2015
and
2014
.
Impairment of Investments in Affiliates
The Company monitors its investments in affiliates for indicators of other-than-temporary declines in value on an ongoing basis in accordance with GAAP. If the Company determines that an other-than-temporary decline in value has occurred, it recognizes an impairment loss, which is measured as the difference between the recorded book value and the fair value of the investment. Fair value is generally determined using an income approach based on discounted cash flows or negotiated transaction values.
Revenue Recognition and Sales Commitments
The Company enters into agreements with its customers to produce products at the beginning of a vehicle’s life cycle. Although such agreements do not provide for a specified quantity of products, once the Company enters into such agreements, the Company is generally required to fulfill its customers’ purchasing requirements for the production life of the vehicle. These agreements generally may be terminated by the Company’s customers at any time. Historically, terminations of these agreements have been minimal. Sales are generally recorded upon shipment of product to customers and transfer of title under standard commercial terms. In certain instances, the Company may be committed under existing agreements to supply products to its customers at selling prices which are not sufficient to cover the direct cost to produce such products. In such situations, the Company recognizes losses as they are incurred.
The Company receives purchase orders from its customers on an annual basis. Generally, each purchase order provides the annual terms, including pricing, related to a particular vehicle model. Purchase orders do not specify quantities. The Company recognizes revenue based on the pricing terms included in its annual purchase orders. The Company is asked to provide its customers with annual price reductions as part of certain agreements. The Company accrues for such amounts as a reduction of revenue as its products are shipped to its customers. In addition, the Company has ongoing adjustments to its pricing
63
Lear Corporation and Subsidiaries
Notes to Consolidated Financial Statements (continued)
arrangements with its customers based on the related content, the cost of its products and other commercial factors. Such pricing accruals are adjusted as they are settled with the Company’s customers.
Amounts billed to customers related to shipping and handling costs are included in net sales in the consolidated statements of income. Shipping and handling costs are included in cost of sales in the consolidated statements of income.
Cost of Sales and Selling, General and Administrative Expenses
Cost of sales includes material, labor and overhead costs associated with the manufacture and distribution of the Company’s products. Distribution costs include inbound freight costs, purchasing and receiving costs, inspection costs, warehousing costs and other costs of the Company’s distribution network. Selling, general and administrative expenses include selling, engineering and development and administrative costs not directly associated with the manufacture and distribution of the Company’s products.
Restructuring Costs
Restructuring costs include employee termination benefits, fixed asset impairment charges and contract termination costs, as well as other incremental costs resulting from the restructuring actions. These incremental costs principally include equipment and personnel relocation costs. The Company also incurs incremental manufacturing inefficiency costs at the operating locations impacted by the restructuring actions during the related restructuring implementation period. Restructuring costs are recognized in the Company’s consolidated financial statements in accordance with GAAP. Generally, charges are recorded as restructuring actions are approved and/or implemented.
Engineering and Development
Costs incurred in connection with product launch, to the extent not recoverable from the Company’s customers, are charged to cost of sales as incurred. All other engineering and development costs are charged to selling, general and administrative expenses when incurred. Engineering and development costs charged to selling, general and administrative expenses totaled
$143.7 million
,
$126.8 million
and
$102.0 million
for the years ended
December 31, 2016
,
2015
and
2014
, respectively.
Other Expense, Net
Other expense, net includes non-income related taxes, foreign exchange gains and losses, gains and losses related to certain derivative instruments and hedging activities, gains and losses on the extinguishment of debt (Note
6
, "
Debt
"), gains and losses on the disposal of fixed assets (Note
11
, "
Commitments and Contingencies
") and other miscellaneous income and expense. A summary of other expense, net is shown below (in millions):
|
For the year ended December 31,
|
2016
|
2015
|
2014
|
||||||||
|
Other expense
|
$
|
42.2
|
|
$
|
71.4
|
|
$
|
82.4
|
|
||
|
Other income
|
(35.8
|
)
|
(2.8
|
)
|
(8.1
|
)
|
|||||
|
Other expense, net
|
$
|
6.4
|
|
$
|
68.6
|
|
$
|
74.3
|
|
||
Income Taxes
Deferred tax assets and liabilities are recognized for the future tax consequences attributable to temporary differences between financial statement carrying amounts of existing assets and liabilities and their respective tax bases and tax loss and credit carryforwards. Deferred tax assets and liabilities are measured using enacted tax rates expected to apply to taxable income in the years in which those temporary differences are expected to be recovered or settled.
The Company’s current and future provision for income taxes is impacted by the initial recognition of and changes in valuation allowances in certain countries. The Company intends to maintain these allowances until it is more likely than not that the deferred tax assets will be realized. The Company’s future provision for income taxes will include no tax benefit with respect to losses incurred and, except for certain jurisdictions, no tax expense with respect to income generated in these countries until the respective valuation allowances are eliminated. Accordingly, income taxes are impacted by changes in valuation allowances and the mix of earnings among jurisdictions. The Company evaluates the realizability of its deferred tax assets on a quarterly basis. In completing this evaluation, the Company considers all available evidence in order to determine whether, based on the weight of the evidence, a valuation allowance for its deferred tax assets is necessary. Such evidence includes historical results, future reversals of existing taxable temporary differences and expectations for future taxable income (exclusive of the reversal of temporary differences and carryforwards), as well as the implementation of feasible and prudent tax planning strategies. If, based on the weight of the evidence, it is more likely than not that all or a portion of the Company’s deferred tax assets will not
64
Lear Corporation and Subsidiaries
Notes to Consolidated Financial Statements (continued)
be realized, a valuation allowance is recorded. If operating results improve or decline on a continual basis in a particular jurisdiction, the Company’s decision regarding the need for a valuation allowance could change, resulting in either the initial recognition or reversal of a valuation allowance in that jurisdiction, which could have a significant impact on income tax expense in the period recognized and subsequent periods. In determining the provision for income taxes for financial statement purposes, the Company makes certain estimates and judgments, which affect its evaluation of the carrying value of its deferred tax assets, as well as its calculation of certain tax liabilities.
The calculation of the Company’s gross unrecognized tax benefits and liabilities includes uncertainties in the application of, and changes in, complex tax regulations in a multitude of jurisdictions across its global operations. The Company recognizes tax benefits and liabilities based on its estimates of whether, and the extent to which, additional taxes will be due. The Company adjusts these benefits and liabilities based on changing facts and circumstances; however, due to the complexity of these uncertainties and the impact of tax audits, the ultimate resolutions may differ significantly from the Company’s estimates.
Foreign Currency Translation
Assets and liabilities of foreign subsidiaries that use a functional currency other than the U.S. dollar are translated into U.S. dollars at the foreign exchange rates in effect at the end of the period. Revenues and expenses of foreign subsidiaries are translated into U.S. dollars using an average of the foreign exchange rates in effect during the period. Translation adjustments that arise from translating a foreign subsidiary’s financial statements from the functional currency to the U.S. dollar are reflected in accumulated other comprehensive loss in the consolidated balance sheets.
Transaction gains and losses that arise from foreign exchange rate fluctuations on transactions denominated in a currency other than the functional currency, except certain long-term intercompany transactions, are included in the consolidated statements of income as incurred. For the years ended
December 31, 2016
,
2015
and
2014
, other expense, net includes net foreign currency transaction losses of
$7.6 million
,
$28.5 million
and
$32.1 million
, respectively.
Stock-Based Compensation
The Company measures stock-based employee compensation expense at fair value in accordance with GAAP and recognizes such expense over the vesting period of the stock-based employee awards.
Net Income Per Share Attributable to Lear
Basic net income per share attributable to Lear is computed by dividing net income attributable to Lear by the average number of common shares outstanding during the period. Common shares issuable upon the satisfaction of certain conditions pursuant to a contractual agreement are considered common shares outstanding and are included in the computation of basic net income per share attributable to Lear.
Diluted net income per share attributable to Lear is computed using the treasury stock method by dividing net income attributable to Lear by the average number of common shares outstanding, including the dilutive effect of common stock equivalents using the average share price during the period.
A summary of information used to compute basic net income per share attributable to Lear is shown below (in millions, except share and per share data):
|
For the year ended December 31,
|
2016
|
2015
|
2014
|
||||||||
|
Net income attributable to Lear
|
$
|
975.1
|
|
$
|
745.5
|
|
$
|
672.4
|
|
||
|
Average common shares outstanding
|
72,345,436
|
|
76,754,270
|
|
80,187,516
|
|
|||||
|
Basic net income per share attributable to Lear
|
$
|
13.48
|
|
$
|
9.71
|
|
$
|
8.39
|
|
||
65
Lear Corporation and Subsidiaries
Notes to Consolidated Financial Statements (continued)
A summary of information used to compute diluted net income per share attributable to Lear is shown below (in millions, except share and per share data):
|
For the year ended December 31,
|
2016
|
2015
|
2014
|
||||||||
|
Net income attributable to Lear
|
$
|
975.1
|
|
$
|
745.5
|
|
$
|
672.4
|
|
||
|
Average common shares outstanding
|
72,345,436
|
|
76,754,270
|
|
80,187,516
|
|
|||||
|
Dilutive effect of common stock equivalents
|
779,513
|
|
1,012,747
|
|
1,540,963
|
|
|||||
|
Average diluted shares outstanding
|
73,124,949
|
|
77,767,017
|
|
81,728,479
|
|
|||||
|
Diluted net income per share attributable to Lear
|
$
|
13.33
|
|
$
|
9.59
|
|
$
|
8.23
|
|
||
Product Warranty
Product warranty reserves are recorded when liability is probable and related amounts are reasonably estimable.
Segment Reporting
The Company has
two
reportable operating segments: seating, which includes complete seat systems and all major seat components, including seat covers and surface materials such as leather and fabric, seat structures and mechanisms, seat foam and headrests, and E-Systems (formerly electrical), which includes complete electrical distribution systems, electronic control modules and associated software and wireless communication modules. Key components in the electrical distribution system include wiring harnesses, terminals and connectors and junction boxes, including components for high power and hybrid electric systems. The other category includes unallocated costs related to corporate headquarters, regional headquarters and the elimination of intercompany activities, none of which meets the requirements for being classified as an operating segment.
Each of the Company’s operating segments reports its results from operations and makes its requests for capital expenditures directly to the chief operating decision maker. The economic performance of each operating segment is driven primarily by automotive production volumes in the geographic regions in which it operates, as well as by the success of the vehicle platforms for which it supplies products. Also, each operating segment operates in the competitive Tier 1 automotive supplier environment and is continually working with its customers to manage costs and improve quality. The Company’s production processes generally make use of hourly labor, dedicated facilities, sequential manufacturing and assembly processes and commodity raw materials.
The Company evaluates the performance of its operating segments based primarily on (i) revenues from external customers, (ii) pretax income before equity in net income of affiliates, interest expense and other expense ("segment earnings") and (iii) cash flows, being defined as segment earnings less capital expenditures plus depreciation and amortization.
The accounting policies of the Company’s operating segments are the same as those described in this note to the consolidated financial statements.
Derivative Instruments and Hedging Activities
The Company has used derivative financial instruments, including forwards, futures, options, swaps and other derivative contracts, to reduce the effects of fluctuations in foreign exchange rates and interest rates and the resulting variability of the Company’s operating results. The Company is not a party to leveraged derivatives. The Company’s derivative financial instruments are subject to master netting arrangements that provide for the net settlement of contracts, by counterparty, in the event of default or termination. On the date that a derivative contract for a hedging instrument is entered into, the Company designates the derivative as either (1) a hedge of the exposure to changes in the fair value of a recognized asset or liability or of an unrecognized firm commitment (a fair value hedge), (2) a hedge of the exposure of a forecasted transaction or of the variability in the cash flows of a recognized asset or liability (a cash flow hedge) or (3) a hedge of a net investment in a foreign operation (a net investment hedge).
For a fair value hedge, both the effective and ineffective portions of the change in the fair value of the derivative are recorded in earnings and reflected in the consolidated statement of income on the same line as the gain or loss on the hedged item attributable to the hedged risk. For a cash flow hedge, the effective portion of the change in the fair value of the derivative is recorded in accumulated other comprehensive loss in the consolidated balance sheet. When the underlying hedged transaction is realized, the gain or loss included in accumulated other comprehensive loss is recorded in earnings and reflected in the consolidated statement of income on the same line as the gain or loss on the hedged item attributable to the hedged risk. For a net investment hedge, the effective portion of the change in the fair value of the derivative is recorded in cumulative translation
66
Lear Corporation and Subsidiaries
Notes to Consolidated Financial Statements (continued)
adjustment, which is a component of accumulated other comprehensive loss in the consolidated balance sheet. In addition, for both cash flow and net investment hedges, changes in the fair value of the derivative that are excluded from the Company’s effectiveness assessments and the ineffective portion of changes in the fair value of the derivative are recorded in earnings and reflected in the consolidated statement of income as other expense, net.
The Company formally documents its hedge relationships, including the identification of the hedging instruments and the related hedged items, as well as its risk management objectives and strategies for undertaking the hedge transaction. Derivatives are recorded at fair value in other current and long-term assets and other current and long-term liabilities in the consolidated balance sheet. The Company also formally assesses, both at inception and at least quarterly thereafter, whether a derivative used in a hedging transaction is highly effective in offsetting changes in either the fair value or the cash flows of the hedged item. When it is determined that a derivative ceases to be highly effective, the Company discontinues hedge accounting.
Use of Estimates
The preparation of the consolidated financial statements in conformity with GAAP requires management to make estimates and assumptions that affect the reported amounts of assets and liabilities as of the date of the consolidated financial statements and the reported amounts of revenues and expenses during the reporting period. During
2016
, there were no material changes in the methods or policies used to establish estimates and assumptions. Other matters subject to estimation and judgment include amounts related to accounts receivable realization, inventory obsolescence, asset impairments, useful lives of fixed and intangible assets and unsettled pricing discussions with customers and suppliers (Note
2
, "
Summary of Significant Accounting Policies
"); acquisitions (Note
3
, "
Acquisitions
"); restructuring accruals (Note
4
, "
Restructuring
"); deferred tax asset valuation allowances and income taxes (Note
7
, "
Income Taxes
"); pension and other postretirement benefit plan assumptions (Note
8
, "
Pension and Other Postretirement Benefit Plans
"); accruals related to litigation, warranty and environmental remediation costs (Note
11
, "
Commitments and Contingencies
"); and self-insurance accruals. Actual results may differ significantly from the Company’s estimates.
Reclassifications
Certain amounts in prior years’ financial statements have been reclassified to conform to the presentation used in the year ended
December 31, 2016
.
(
3
)
Acquisitions
AccuMED
On December 21, 2016, the Company completed the acquisition of
100%
of the outstanding equity interests of AccuMED Holdings Corp. ("AccuMED"), a privately-held developer and manufacturer of specialty fabrics for
$148.6 million
, net of cash acquired. AccuMED has annual sales of approximately
$80 million
. The AccuMED acquisition was accounted for as a business combination, and accordingly, the assets acquired and liabilities assumed are included in the accompanying consolidated balance sheet as of
December 31, 2016
. The operating results and cash flows of AccuMED are included in the accompanying consolidated financial statements from the date of acquisition and in the Company's seating segment. The purchase price and preliminary allocation are shown below (in millions):
|
Purchase price paid, net of cash acquired
|
$
|
148.6
|
|
|
|
Property, plant and equipment
|
$
|
13.9
|
|
|
|
Other assets purchased and liabilities assumed, net
|
9.7
|
|
||
|
Goodwill
|
72.0
|
|
||
|
Intangible assets
|
53.0
|
|
||
|
Preliminary purchase price allocation
|
$
|
148.6
|
|
|
Recognized goodwill is attributable to the assembled workforce, expected synergies and other intangible assets that do not qualify for separate recognition.
Intangible assets consist of provisional amounts recognized for the fair value of customer-based assets. Customer-based assets include AccuMED's established relationships with its customers and the ability of these customers to generate future economic profits for the Company. It is estimated that these intangible assets have a weighted average useful life of approximately
fifteen years
.
67
The purchase price and related allocation are preliminary and will be revised as a result of adjustments made to the purchase price and additional information regarding projected financial information, assets acquired and liabilities assumed, including, but not limited to, certain tax attributes, contingent liabilities and revisions of provisional estimates of fair values resulting from the completion of independent appraisals and valuations of property, plant and equipment and intangible assets.
The pro-forma effects of this acquisition would not materially impact the Company's reported results for any period presented.
For further information on acquired assets measured at fair value, see Note
13
, "
Financial Instruments
."
Eagle Ottawa
On January 5, 2015, the Company completed the acquisition of
100%
of the outstanding equity interests of Everett Smith Group, Ltd., the parent company of Eagle Ottawa, LLC ("Eagle Ottawa"). Eagle Ottawa is a leading provider of leather for the automotive industry, with annual sales of approximately
$1 billion
, including annual sales to Lear of approximately
$200 million
. The purchase price of
$843.9 million
(net of purchase price adjustments received in the second quarter of 2015 of
$8.0 million
) consists of cash paid of
$815.3 million
, net of cash acquired, and contingent consideration of
$28.6 million
. In addition, the Company incurred transaction costs related to advisory services of
$8.6 million
, which were expensed as incurred and are recorded in selling, general and administrative expenses in the accompanying consolidated statement of income for the year ended December 31, 2015. The acquisition was financed with
$350 million
of restricted cash proceeds from the Company's offering of
$650 million
in aggregate principal amount of senior unsecured notes due 2025 at a stated coupon rate of
5.25%
in November 2014 and borrowings under a
$500 million
delayed-draw term loan facility ("Term Loan Facility") established in November 2014 under the Company's amended and restated senior secured credit agreement (the "Credit Agreement") (Note
6
, "
Debt
").
The Eagle Ottawa acquisition was accounted for as a business combination, and accordingly, the assets acquired and liabilities assumed are included in the accompanying consolidated balance sheets as of December 2016 and 2015. The operating results and cash flows of Eagle Ottawa are included in the accompanying consolidated financial statements from the date of acquisition and in the Company's seating segment. The purchase price and related allocation are shown below (in millions):
|
Purchase price paid, net of cash acquired
|
$
|
815.3
|
|
|
|
Acquisition date contingent consideration
|
28.6
|
|
||
|
Net purchase price
|
$
|
843.9
|
|
|
|
Property, plant and equipment
|
$
|
142.4
|
|
|
|
Other assets purchased and liabilities assumed, net
|
146.5
|
|
||
|
Goodwill
|
343.7
|
|
||
|
Intangible assets
|
211.3
|
|
||
|
Purchase price allocation
|
$
|
843.9
|
|
|
Contingent consideration represents the discounted value of estimated amounts due to the seller pending the resolution of certain tax matters. As of the acquisition date, the undiscounted value of estimated contingent consideration was
$32.0 million
. In 2016 and 2015, the Company paid
$5.5 million
and
$3.9 million
, respectively, of the contingent consideration, which is reflected as cash used in financing activities in the accompanying consolidated statements of cash flows.
Recognized goodwill is attributable to the assembled workforce, expected synergies and other intangible assets that do not qualify for separate recognition.
Intangible assets consist of amounts recognized for the fair value of customer-based assets and were based on an independent appraisal. Customer-based assets include Eagle Ottawa's established relationships with its customers and the ability of these customers to generate future economic profits for the Company and have a weighted average useful life of approximately
ten years
.
As of the acquisition date, the Company had amounts payable to Eagle Ottawa of
$45.7 million
for purchases of raw materials. As a result of the acquisition, these amounts payable were effectively settled at carrying value, which approximated fair value. The purchase price paid to the former owner excludes cash paid to settle this pre-existing relationship.
The pro-forma effects of this acquisition would not materially impact the Company's reported results for any period presented.
For further information on acquired assets measured at fair value, see Note
13
, "
Financial Instruments
."
68
Subsequent Event
On February 6, 2017, the Company signed a definitive agreement to acquire Grupo Antolin's automotive seating business. Grupo Antolin's seating business is headquartered in France with sales and operations concentrated in
five
European countries. Grupo Antolin's seating business is comprised of just-in-time seat assembly, as well as seat structures, mechanisms and trim. The transaction is valued at approximately
€286 million
on a cash and debt free basis. The closing of the transaction is expected to occur in the second quarter of 2017 and is subject to customary conditions, including regulatory approvals.
(
4
)
Restructuring
In
2016
, the Company recorded charges of
$63.6 million
in connection with its restructuring actions. These charges consist of
$55.4 million
recorded as cost of sales,
$8.5 million
recorded as selling, general and administrative expenses and
$0.3 million
recorded as other income. The restructuring charges consist of employee termination benefits of
$54.1 million
, asset impairment charges of
$4.7 million
and contract termination costs of
$0.1 million
, as well as other related costs of
$4.7 million
. Employee termination benefits were recorded based on existing union and employee contracts, statutory requirements, completed negotiations and Company policy. Asset impairment charges relate to the disposal of buildings, leasehold improvements and machinery and equipment with carrying values
$4.7 million
in excess of related estimated fair values. The Company expects to incur approximately
$35 million
of additional restructuring costs related to activities initiated as of
December 31, 2016
, and expects that the components of such costs will be consistent with its historical experience. Any future restructuring actions will depend upon market conditions, customer actions and other factors.
A summary of
2016
activity is shown below (in millions):
|
Accrual as of
|
2016
|
Utilization
|
Accrual as of
|
||||||||||||||||
|
January 1, 2016
|
Charges
|
Cash
|
Non-cash
|
December 31, 2016
|
|||||||||||||||
|
Employee termination benefits
|
$
|
66.5
|
|
$
|
54.1
|
|
$
|
(51.2
|
)
|
$
|
—
|
|
$
|
69.4
|
|
||||
|
Asset impairments
|
—
|
|
4.7
|
|
—
|
|
(4.7
|
)
|
—
|
|
|||||||||
|
Contract termination costs
|
5.3
|
|
0.1
|
|
(0.8
|
)
|
—
|
|
4.6
|
|
|||||||||
|
Other related costs
|
—
|
|
4.7
|
|
(4.7
|
)
|
—
|
|
—
|
|
|||||||||
|
Total
|
$
|
71.8
|
|
$
|
63.6
|
|
$
|
(56.7
|
)
|
$
|
(4.7
|
)
|
$
|
74.0
|
|
||||
In
2015
, the Company recorded charges of
$88.8 million
in connection with its restructuring actions. These charges consist of
$68.4 million
recorded as cost of sales,
$18.4 million
recorded as selling, general and administrative expenses and
$2.0 million
recorded as other expense, net. The restructuring charges consist of employee termination benefits of
$70.0 million
, asset impairment charges of
$3.9 million
, a pension benefit plan curtailment loss of
$7.7 million
and other contract termination costs of
$1.7 million
, as well as other related costs of
$5.5 million
. Employee termination benefits were recorded based on existing union and employee contracts, statutory requirements, completed negotiations and Company policy. Asset impairment charges relate to the disposal of buildings, leasehold improvements and machinery and equipment with carrying values
$3.9 million
in excess of related estimated fair values.
A summary of
2015
activity, excluding the pension benefit plan curtailment loss of
$7.7 million
, is shown below (in millions):
|
Accrual as of
|
2015
|
Utilization
|
Accrual as of
|
||||||||||||||||
|
January 1, 2015
|
Charges
|
Cash
|
Non-cash
|
December 31, 2015
|
|||||||||||||||
|
Employee termination benefits
|
$
|
45.1
|
|
$
|
70.0
|
|
$
|
(48.6
|
)
|
$
|
—
|
|
$
|
66.5
|
|
||||
|
Asset impairments
|
—
|
|
3.9
|
|
—
|
|
(3.9
|
)
|
—
|
|
|||||||||
|
Contract termination costs
|
5.1
|
|
1.7
|
|
(1.5
|
)
|
—
|
|
5.3
|
|
|||||||||
|
Other related costs
|
—
|
|
5.5
|
|
(3.5
|
)
|
(2.0
|
)
|
—
|
|
|||||||||
|
Total
|
$
|
50.2
|
|
$
|
81.1
|
|
$
|
(53.6
|
)
|
$
|
(5.9
|
)
|
$
|
71.8
|
|
||||
In
2014
, the Company recorded charges of
$107.0 million
in connection with its restructuring actions. These charges consist of
$86.8 million
recorded as cost of sales,
$19.2 million
recorded as selling, general and administrative expenses and
$1.0 million
recorded as other expense, net. The restructuring charges consist of employee termination benefits of
$88.6 million
, asset impairment charges of
$0.5 million
and contract termination costs
$0.5 million
, as well as other related costs of
$17.4 million
. Employee termination benefits were recorded based on existing union and employee contracts, statutory requirements, completed negotiations and Company policy. Asset impairment charges relate to the disposal of buildings, leasehold improvements and machinery and equipment with carrying values of
$0.5 million
in excess of related estimated fair values.
69
Lear Corporation and Subsidiaries
Notes to Consolidated Financial Statements (continued)
A summary of
2014
activity is shown below (in millions):
|
Accrual as of
|
2014
|
Utilization
|
Accrual as of
|
||||||||||||||||
|
January 1, 2014
|
Charges
|
Cash
|
Non-cash
|
December 31, 2014
|
|||||||||||||||
|
Employee termination benefits
|
$
|
38.7
|
|
$
|
88.6
|
|
$
|
(82.2
|
)
|
$
|
—
|
|
$
|
45.1
|
|
||||
|
Asset impairments
|
—
|
|
0.5
|
|
—
|
|
(0.5
|
)
|
—
|
|
|||||||||
|
Contract termination costs
|
5.6
|
|
0.5
|
|
(1.0
|
)
|
—
|
|
5.1
|
|
|||||||||
|
Other related costs
|
—
|
|
17.4
|
|
(17.4
|
)
|
—
|
|
—
|
|
|||||||||
|
Total
|
$
|
44.3
|
|
$
|
107.0
|
|
$
|
(100.6
|
)
|
$
|
(0.5
|
)
|
$
|
50.2
|
|
||||
(
5
)
Investments in Affiliates and Other Related Party Transactions
The Company’s beneficial ownership in affiliates accounted for under the equity method is shown below:
|
December 31,
|
2016
|
2015
|
2014
|
||
|
Shanghai Lear STEC Automotive Parts Co., Ltd. (China)
|
55%
|
55%
|
55%
|
||
|
Beijing BHAP Lear Automotive Systems Co., Ltd. (China)
|
50
|
50
|
50
|
||
|
Dong Kwang Lear Yuhan Hoesa (Korea)
|
50
|
50
|
50
|
||
|
Industrias Cousin Freres, S.L. (Spain)
|
50
|
50
|
50
|
||
|
Jiangxi Jiangling Lear Interior Systems Co., Ltd. (China)
|
50
|
50
|
50
|
||
|
Lear Dongfeng Automotive Seating Co., Ltd. (China)
|
50
|
50
|
50
|
||
|
Changchun Lear FAWSN Automotive Electrical and Electronics Co., Ltd. (China)
|
49
|
49
|
49
|
||
|
Changchun Lear FAWSN Automotive Seat Systems Co., Ltd. (China)
|
49
|
49
|
49
|
||
|
Honduras Electrical Distribution Systems S. de R.L. de C.V. (Honduras)
|
49
|
49
|
49
|
||
|
Kyungshin-Lear Sales and Engineering LLC
|
49
|
49
|
49
|
||
|
eLumigen, LLC
|
46
|
30
|
30
|
||
|
Beijing Lear Dymos Automotive Systems Co., Ltd. (China)
|
40
|
40
|
40
|
||
|
Dymos Lear Automotive India Private Limited (India)
|
35
|
35
|
35
|
||
|
RevoLaze, LLC
|
20
|
20
|
20
|
||
|
HB Polymer Company, LLC
|
10
|
10
|
10
|
||
|
Beijing BAI Lear Automotive Systems Co., Ltd. (China)
|
—
|
50
|
50
|
||
Summarized group financial information for affiliates accounted for under the equity method as of
December 31, 2016
and
2015
, and for the years ended
December 31, 2016
,
2015
and
2014
, is shown below (unaudited; in millions):
|
December 31,
|
2016
|
2015
|
|||||
|
Balance sheet data:
|
|||||||
|
Current assets
|
$
|
1,011.0
|
|
$
|
977.7
|
|
|
|
Non-current assets
|
197.3
|
|
211.5
|
|
|||
|
Current liabilities
|
850.5
|
|
823.2
|
|
|||
|
Non-current liabilities
|
26.6
|
|
34.2
|
|
|||
|
For the year ended December 31,
|
2016
|
2015
|
2014
|
||||||||
|
Income statement data:
|
|||||||||||
|
Net sales
|
$
|
2,186.4
|
|
$
|
2,087.8
|
|
$
|
2,074.4
|
|
||
|
Gross profit
|
200.6
|
|
155.5
|
|
123.4
|
|
|||||
|
Income before provision for income taxes
|
195.3
|
|
127.4
|
|
112.3
|
|
|||||
|
Net income attributable to affiliates
|
155.4
|
|
96.0
|
|
85.6
|
|
|||||
70
Lear Corporation and Subsidiaries
Notes to Consolidated Financial Statements (continued)
A summary of amounts recorded in the Company's consolidated balance sheets related to its affiliates is shown below (in millions):
|
December 31,
|
2016
|
2015
|
|||||
|
Aggregate investment in affiliates
|
$
|
153.5
|
|
$
|
156.5
|
|
|
|
Receivables due from affiliates (including notes and advances)
|
121.8
|
|
95.5
|
|
|||
|
Payables due to affiliates
|
4.3
|
|
7.7
|
|
|||
A summary of transactions with affiliates accounted for under the equity method and other related parties is shown below (in millions):
|
For the year ended December 31,
|
2016
|
2015
|
2014
|
||||||||
|
Sales to affiliates
|
$
|
147.0
|
|
$
|
198.5
|
|
$
|
292.5
|
|
||
|
Purchases from affiliates
|
17.8
|
|
26.3
|
|
32.1
|
|
|||||
|
Management and other fees for services provided to affiliates
|
25.3
|
|
36.8
|
|
26.9
|
|
|||||
|
Dividends received from affiliates
|
35.6
|
|
54.1
|
|
25.0
|
|
|||||
The Company’s investment in Shanghai Lear STEC Automotive Parts Co., Ltd. is accounted for under the equity method as the result of certain approval rights granted to the minority shareholders, including approval of the annual budget, business plan and the appointment or dismissal of management. The Company’s investment in HB Polymer Company, LLC is accounted for under the equity method as the Company’s interest in this entity is similar to a partnership interest.
2016
On June 21, 2016, the Company gained control of Beijing BAI Lear Automotive Systems Co., Ltd. (“Beijing BAI”) by amending the existing joint venture agreement to eliminate the substantive participating rights of its joint venture partner. Prior to the amendment, Beijing BAI was accounted for under the equity method. The consolidation of Beijing BAI was accounted for as a business combination, and accordingly, the assets acquired and liabilities assumed are included in the accompanying consolidated balance sheet as of
December 31, 2016
. The operating results and cash flows of Beijing BAI are included in the accompanying consolidated financial statements from the date of the amended joint venture agreement and in the Company's seating segment.
A summary of the fair value of the assets acquired and liabilities assumed in conjunction with the consolidation is shown below (in millions):
|
Property, plant and equipment
|
$
|
20.7
|
|
|
Other assets and liabilities assumed, net
|
40.4
|
|
|
|
Goodwill
|
8.9
|
|
|
|
Intangible assets
|
34.0
|
|
|
|
$
|
104.0
|
|
|
Recognized goodwill is attributable to the assembled workforce, expected synergies and other intangible assets that do not qualify for separate recognition.
Intangible assets consist of amounts recognized for the fair value of customer-based assets and were based on an independent appraisal. Customer-based assets include Beijing BAI’s established relationships with its customers and the ability of these customers to generate future economic profits for the Company. It is estimated that these intangible assets have a weighted average useful life of approximately
eight
years.
As of the date of consolidation, the fair value of the Company’s previously held equity interest in Beijing BAI was
$63.0 million
, and the fair value of the noncontrolling interest in Beijing BAI was
$41.0 million
. As a result of valuing the Company’s previously held equity interest in Beijing BAI at fair value, the Company recognized a gain of
$30.3 million
, which is included in other expense, net in the accompanying consolidated statement of income for the year ended
December 31, 2016
.
Also in 2016, the Company acquired an additional ownership interest in eLumigen LLC, thereby increasing its ownership interest to
46%
from
30%
.
71
Lear Corporation and Subsidiaries
Notes to Consolidated Financial Statements (continued)
2014
In April 2014, the Company sold its
49%
ownership interest in Tacle Seating USA, LLC. The Company did not recognize a significant gain or loss related to this transaction. Also in 2014, the Company acquired an additional ownership interest in eLumigen, LLC, thereby increasing its ownership interest to
30%
from
15%
.
(
6
)
Debt
Short-Term Borrowings
The Company utilizes uncommitted lines of credit as needed for its short-term working capital fluctuations. As of
December 31, 2016
and
2015
, the Company had lines of credit from banks totaling
$21.4 million
and
$10.0 million
, respectively. As of
December 31, 2016
, the Company's short-term debt balance was
$8.6 million
related to draws on the lines of credit. As of
December 31, 2015
, there were
no
short-term debt balances outstanding. The remaining unused balance is available for draw subject to certain restrictions imposed by the indentures governing the Notes and the Credit Agreement.
Long-Term Debt
A summary of long-term debt, net of unamortized debt issuance costs, and the related weighted average interest rates is shown below (in millions):
|
December 31,
|
2016
|
2015
|
|||||||||||||||||||||||||
|
Debt Instrument
|
Long-Term Debt
|
Debt Issuance Costs
(1)
|
Long-Term
Debt, Net
|
Weighted
Average
Interest
Rate
|
Long-Term Debt
|
Debt Issuance Costs
(1)
|
Long-Term
Debt, Net
|
Weighted
Average
Interest
Rate
|
|||||||||||||||||||
|
Credit Agreement — Term Loan Facility
|
$
|
468.7
|
|
$
|
(1.6
|
)
|
$
|
467.1
|
|
2.105%
|
$
|
490.6
|
|
$
|
(2.2
|
)
|
$
|
488.4
|
|
1.78%
|
|||||||
|
4.75% Senior Notes due 2023
|
500.0
|
|
(4.8
|
)
|
495.2
|
|
4.75%
|
500.0
|
|
(5.5
|
)
|
494.5
|
|
4.75%
|
|||||||||||||
|
5.375% Senior Notes due 2024
|
325.0
|
|
(2.8
|
)
|
322.2
|
|
5.375%
|
325.0
|
|
(3.2
|
)
|
321.8
|
|
5.375%
|
|||||||||||||
|
5.25% Senior Notes due 2025
|
650.0
|
|
(6.6
|
)
|
643.4
|
|
5.25%
|
650.0
|
|
(7.5
|
)
|
642.5
|
|
5.25%
|
|||||||||||||
|
Other
|
5.7
|
|
—
|
|
5.7
|
|
N/A
|
7.6
|
|
—
|
|
7.6
|
|
N/A
|
|||||||||||||
|
$
|
1,949.4
|
|
$
|
(15.8
|
)
|
1,933.6
|
|
$
|
1,973.2
|
|
$
|
(18.4
|
)
|
1,954.8
|
|
||||||||||||
|
Less — Current portion
|
(35.6
|
)
|
(23.1
|
)
|
|||||||||||||||||||||||
|
Long-term debt
|
$
|
1,898.0
|
|
$
|
1,931.7
|
|
|||||||||||||||||||||
|
(1)
|
Unamortized portion
|
Senior Notes
As of
December 31, 2016
, the Company's senior notes consist of
$500 million
in aggregate principal amount of senior unsecured notes due 2023 at a stated coupon rate of
4.75%
(the "2023 Notes"),
$325 million
in aggregate principal amount of senior unsecured notes due 2024 at a stated coupon rate of
5.375%
(the "2024 Notes") and
$650 million
in aggregate principal amount of senior unsecured notes due 2025 at a stated coupon rate of
5.25%
(the "2025 Notes" and together with the 2023 Notes and 2024 Notes, the "Notes").
2023 Notes
The 2023 Notes were issued in January 2013 and mature on January 15, 2023. Interest is payable on January 15 and July 15 of each year. The 2023 Notes were offered and sold in a private transaction to qualified institutional buyers under Rule 144A and, outside of the United States, pursuant to Regulation S of the Securities Act of 1933, as amended (the "Securities Act"). In accordance with the registration rights agreement entered into at the time of the issuance of the 2023 Notes, the Company completed an exchange offer to exchange the 2023 Notes for substantially identical notes registered under the Securities Act in 2014.
72
Lear Corporation and Subsidiaries
Notes to Consolidated Financial Statements (continued)
The Company may redeem the 2023 Notes, in whole or in part, on or after January 15, 2018, at the redemption prices set forth below, plus accrued and unpaid interest to the redemption date.
|
Twelve-Month Period Commencing January 15,
|
2023 Notes
|
|
2018
|
102.375%
|
|
2019
|
101.583%
|
|
2020
|
100.792%
|
|
2021 and thereafter
|
100.000%
|
Prior to January 15, 2018, the Company may redeem the 2023 Notes, in whole or in part, at a redemption price equal to
100%
of the aggregate principal amount thereof, plus a "make-whole" premium as of, and accrued and unpaid interest to, the redemption date.
2024 Notes
The 2024 Notes were issued in March 2014 and mature on March 15, 2024. Interest is payable on March 15 and September 15 of each year. The proceeds from the offering of
$325 million
, net of related issuance costs of
$3.9 million
, together with existing cash on hand, were used to redeem the remaining outstanding aggregate principal amount of the 2018 Notes (
$280 million
) and to redeem
10%
of the original aggregate principal amount at maturity of the 2020 Notes (
$35 million
) at stated redemption prices, plus accrued and unpaid interest to the respective redemption dates. In connection with these transactions, the Company paid an aggregate of
$327.1 million
and recognized losses of
$17.5 million
on the extinguishment of debt in the year ended December 31, 2014.
The Company may redeem the 2024 Notes, in whole or in part, on or after March 15, 2019, at the redemption prices set forth below, plus accrued and unpaid interest to the redemption date.
|
Twelve-Month Period Commencing March 15,
|
2024 Notes
|
|
2019
|
102.688%
|
|
2020
|
101.792%
|
|
2021
|
100.896%
|
|
2022 and thereafter
|
100.000%
|
Prior to March 15, 2017, the Company may redeem up to
35%
of the aggregate principal amount of the 2024 Notes, in an amount not to exceed the amount of net cash proceeds of one or more equity offerings, at a redemption price equal to
105.375%
of the aggregate principal amount thereof, plus accrued and unpaid interest to the redemption date, provided that at least
65%
of the original aggregate principal amount of the 2024 Notes remains outstanding after the redemption and any such redemption is made within
90
days after the closing of such equity offering. Prior to March 15, 2019, the Company may redeem the 2024 Notes, in whole or in part, at a redemption price equal to
100%
of the aggregate principal amount thereof, plus a "make-whole" premium as of, and accrued and unpaid interest to, the redemption date.
2025 Notes
The 2025 Notes were issued in November 2014 and mature on January 15, 2025. Interest is payable on January 15 and July 15 of each year. Of the
$650 million
of proceeds from the offering, net of related issuance costs of
$8.4 million
,
$250 million
was restricted for the redemption of the remaining outstanding aggregate principal amount of the 2020 Notes (
$245 million
) and
$350 million
was restricted to finance, in part, the acquisition of Eagle Ottawa (Note
3
, "
Acquisitions
"). Cash proceeds restricted for redemption of the 2020 Notes and the acquisition of Eagle Ottawa were recorded in other current assets and other long-term assets, respectively, in the accompanying consolidated balance sheet as of December 31, 2014. In January 2015, the Company used
$350 million
of restricted cash proceeds from the offering, along with
$500 million
in borrowings under the Term Loan Facility (see "— Credit Agreement" below), to finance the acquisition of Eagle Ottawa. In March 2015, the Company redeemed the 2020 Notes at a price equal to
104.063%
of the principal amount thereof, plus accrued and unpaid interest to the redemption date. In connection with this transaction, the Company paid
$255.0 million
, including
$250 million
of restricted cash proceeds from the offering, and recognized a loss of
$14.3 million
on the extinguishment of debt in the year ended December 31, 2015. The use of restricted cash for the acquisition of Eagle Ottawa and the redemption of the 2020 Notes is reflected as non-cash investing and financing activities, respectively, in the accompanying consolidated statement of cash flows for the year ended December 31, 2015. The remaining proceeds from the offering were used for general corporate purposes, including the payment of fees and expenses associated with the acquisition of Eagle Ottawa and related financing transactions.
73
Lear Corporation and Subsidiaries
Notes to Consolidated Financial Statements (continued)
The Company may redeem the 2025 Notes, in whole or in part, on or after January 15, 2020, at the redemption prices set forth below, plus accrued and unpaid interest to the redemption date.
|
Twelve-Month Period Commencing January 15,
|
2025 Notes
|
|
2020
|
102.625%
|
|
2021
|
101.750%
|
|
2022
|
100.875%
|
|
2023 and thereafter
|
100.000%
|
Prior to January 15, 2018, the Company may redeem up to
40%
of the aggregate principal amount of the 2025 Notes, in an amount not to exceed the amount of net cash proceeds of one or more equity offerings, at a redemption price equal to
105.25%
of the aggregate principal amount thereof, plus accrued and unpaid interest to the redemption date, provided that at least
50%
of the original aggregate principal amount of the 2025 Notes remains outstanding after the redemption and any such redemption is made within
120
days after the closing of such equity offering. Prior to January 15, 2020, the Company may redeem the 2025 Notes, in whole or in part, at a redemption price equal to
100%
of the aggregate principal amount thereof, plus a "make-whole" premium as of, and accrued and unpaid interest to, the redemption date.
Guarantees
The Notes are senior unsecured obligations. The Company’s obligations under the Notes are fully and unconditionally guaranteed, jointly and severally, on a senior unsecured basis by certain domestic subsidiaries, which are directly or indirectly
100%
owned by Lear (Note
16
, "
Supplemental Guarantor Consolidating Financial Statements
").
Covenants
Subject to certain exceptions, the indentures governing the Notes contain restrictive covenants that, among other things, limit the ability of the Company to: (i) create or permit certain liens and (ii) consolidate or merge or sell all or substantially all of the Company’s assets. The indentures governing the 2023 Notes and 2024 Notes limit the ability of the Company to enter into sale and leaseback transactions. The indentures governing the Notes also provide for customary events of default.
As of
December 31, 2016
, the Company was in compliance with all covenants under the indentures governing the Notes.
Credit Agreement
In November 2014, the Company amended and restated its Credit Agreement to, among other things, increase the borrowing capacity of the revolving credit facility (the "Revolving Credit Facility") from
$1.0 billion
to
$1.25 billion
, extend the maturity date from January 30, 2018 to November 14, 2019, and establish the
$500 million
Term Loan Facility, which matures on January 5, 2020. In connection with this transaction, the Company paid related issuance costs of
$5.8 million
and recorded a loss on the extinguishment of debt of
$0.4 million
. As of
December 31, 2016
and
2015
, there were
no
borrowings outstanding under the Revolving Credit Facility. In
2016
, there were
no
borrowings or repayments under the Revolving Credit Facility. In
2015
, aggregate borrowings and repayments under the Revolving Credit Facility were
$48.0 million
. In January 2015, the Company borrowed
$500 million
under the Term Loan Facility to finance, in part, the acquisition of Eagle Ottawa. In
2016
and 2015, the Company made required principal payments of
$21.9 million
and
$9.4 million
, respectively, under the Term Loan Facility.
Advances under the Revolving Credit Facility generally bear interest at a variable rate per annum equal to (i) the Eurocurrency Rate (as defined in the Credit Agreement) plus an adjustable margin of
1.0%
to
2.25%
based on the Company’s corporate rating (
1.25%
as of
December 31, 2016
), payable on the last day of each applicable interest period but in no event less frequently than quarterly, or (ii) the Adjusted Base Rate (as defined in the Credit Agreement) plus an adjustable margin of
0.0%
to
1.25%
based on the Company’s corporate rating (
0.25%
as of
December 31, 2016
), payable quarterly. A facility fee, which ranges from
0.25%
to
0.50%
of the total amount committed under the Revolving Credit Facility, is payable quarterly.
Loans under the Term Loan Facility generally bear interest at a variable rate per annum equal to (i) the Eurocurrency Rate (as defined in the Credit Agreement) plus an adjustable margin of
1.25%
to
2.25%
based on the Company's corporate rating (
1.375%
as of
December 31, 2016
), payable on the last day of each applicable interest period but in no event less frequently than quarterly, or (ii) the Adjusted Base Rate (as defined in the Credit Agreement) plus an adjustable margin of
0.25%
to
1.25%
based on the Company's corporate rating (
0.375%
as of
December 31, 2016
), payable quarterly.
The Company's obligations under the Credit Agreement are guaranteed, jointly and severally, on a first priority basis, by certain domestic subsidiaries, which are directly or indirectly
100%
owned by Lear (Note
16
, "
Supplemental Guarantor Consolidating Financial Statements
").
74
Lear Corporation and Subsidiaries
Notes to Consolidated Financial Statements (continued)
The Credit Agreement contains various customary representations, warranties and covenants by the Company, including, without limitation, (i) covenants regarding maximum leverage and minimum interest coverage, (ii) limitations on fundamental changes involving the Company or its subsidiaries and (iii) limitations on indebtedness, liens, investments and restricted payments. As of
December 31, 2016
, the Company was in compliance with all covenants under the Credit Agreement.
Other
As of
December 31, 2016
, other long-term debt consists of amounts outstanding under capital leases.
Scheduled Maturities
As of
December 31, 2016
, scheduled maturities related to the Credit Agreement — Term Loan Facility for the five succeeding years, as of the date of this Report, are shown below (in millions):
|
2017
|
$
|
34.4
|
|
|
2018
|
46.9
|
|
|
|
2019
|
37.4
|
|
|
|
2020
|
350.0
|
|
|
|
2021
|
—
|
|
|
(
7
)
Income Taxes
A summary of consolidated income before provision for income taxes and equity in net income of affiliates and the components of provision for income taxes is shown below (in millions):
|
For the year ended December 31,
|
2016
|
2015
|
2014
|
||||||||
|
Consolidated income before provision for income taxes and equity in net income of affiliates:
|
|||||||||||
|
Domestic
|
$
|
457.3
|
|
$
|
344.7
|
|
$
|
228.0
|
|
||
|
Foreign
|
881.0
|
|
686.8
|
|
559.4
|
|
|||||
|
$
|
1,338.3
|
|
$
|
1,031.5
|
|
$
|
787.4
|
|
|||
|
Domestic provision for income taxes:
|
|||||||||||
|
Current provision
|
$
|
46.6
|
|
$
|
45.4
|
|
$
|
24.3
|
|
||
|
Deferred provision
|
99.2
|
|
55.0
|
|
47.0
|
|
|||||
|
Total domestic provision
|
145.8
|
|
100.4
|
|
71.3
|
|
|||||
|
Foreign provision for income taxes:
|
|||||||||||
|
Current provision
|
220.0
|
|
191.5
|
|
155.1
|
|
|||||
|
Deferred provision (benefit)
|
4.4
|
|
(6.4
|
)
|
(105.0
|
)
|
|||||
|
Total foreign provision
|
224.4
|
|
185.1
|
|
50.1
|
|
|||||
|
Provision for income taxes
|
$
|
370.2
|
|
$
|
285.5
|
|
$
|
121.4
|
|
||
The domestic provision includes withholding taxes related to dividends and royalties paid by the Company’s foreign subsidiaries, as well as state and local taxes. In
2016
,
2015
and
2014
, the foreign deferred provision (benefit) includes the benefit of prior unrecognized net operating loss carryforwards of
$5.4 million
,
$1.7 million
and
$10.0 million
, respectively.
75
Lear Corporation and Subsidiaries
Notes to Consolidated Financial Statements (continued)
A summary of the differences between the provision for income taxes calculated at the United States federal statutory income tax rate of
35%
and the consolidated provision for income taxes is shown below (in millions):
|
For the year ended December 31,
|
2016
|
2015
|
2014
|
||||||||
|
Consolidated income before provision for income taxes and equity in net income of affiliates multiplied by the United States federal statutory income tax rate
|
$
|
468.4
|
|
$
|
361.0
|
|
$
|
275.6
|
|
||
|
Differences in income taxes on foreign earnings, losses and remittances
|
(43.9
|
)
|
(79.2
|
)
|
(47.8
|
)
|
|||||
|
Valuation allowance adjustments
|
(44.2
|
)
|
24.6
|
|
(74.2
|
)
|
|||||
|
Tax credits
|
(2.7
|
)
|
(5.7
|
)
|
(0.7
|
)
|
|||||
|
Tax audits and assessments
|
(1.8
|
)
|
0.7
|
|
(12.8
|
)
|
|||||
|
Other
|
(5.6
|
)
|
(15.9
|
)
|
(18.7
|
)
|
|||||
|
Provision for income taxes
|
$
|
370.2
|
|
$
|
285.5
|
|
$
|
121.4
|
|
||
For the years ended
December 31, 2016
,
2015
and
2014
, income in foreign jurisdictions with tax holidays was
$89.7 million
,
$72.2 million
and
$57.6 million
, respectively. Such tax holidays generally expire from 2017 through 2027.
Deferred income taxes represent temporary differences in the recognition of certain items for financial reporting and income tax purposes. A summary of the components of the net deferred income tax asset is shown below (in millions):
|
December 31,
|
2016
|
2015
|
|||||
|
Deferred income tax assets:
|
|||||||
|
Tax loss carryforwards
|
$
|
485.1
|
|
$
|
559.8
|
|
|
|
Tax credit carryforwards
|
187.9
|
|
326.0
|
|
|||
|
Retirement benefit plans
|
89.4
|
|
100.6
|
|
|||
|
Accrued liabilities
|
158.2
|
|
131.8
|
|
|||
|
Self-insurance reserves
|
8.4
|
|
7.8
|
|
|||
|
Current asset basis differences
|
44.6
|
|
42.9
|
|
|||
|
Long-term asset basis differences
|
(77.3
|
)
|
(88.6
|
)
|
|||
|
Deferred compensation
|
57.3
|
|
58.0
|
|
|||
|
Recoverable customer engineering, development and tooling
|
(6.9
|
)
|
(9.5
|
)
|
|||
|
Undistributed earnings of foreign subsidiaries
|
(62.4
|
)
|
(50.6
|
)
|
|||
|
Derivative instruments and hedging activities
|
20.1
|
|
16.0
|
|
|||
|
Other
|
0.6
|
|
1.9
|
|
|||
|
905.0
|
|
1,096.1
|
|
||||
|
Valuation allowance
|
(445.6
|
)
|
(495.7
|
)
|
|||
|
Net deferred income tax asset
|
$
|
459.4
|
|
$
|
600.4
|
|
|
As of
December 31, 2016
and
2015
, the valuation allowance with respect to the Company’s deferred tax assets was
$445.6 million
and
$495.7 million
, respectively, a net decrease of
$50.1 million
.
Concluding that a valuation allowance is not required is difficult when there is significant negative evidence, such as cumulative losses in recent years, which is objective and verifiable. When measuring cumulative losses in recent years, the Company uses a rolling three-year period of pretax book income, adjusted for permanent differences between book and taxable income and certain other items. As of
December 31, 2016
, the Company continues to maintain a valuation allowance of
$33.8 million
with respect to certain U.S. deferred tax assets that, due to their nature, are not likely to be realized. In addition, the Company continues to maintain a valuation allowance of
$411.8 million
with respect to its deferred tax assets in several international jurisdictions.
76
Lear Corporation and Subsidiaries
Notes to Consolidated Financial Statements (continued)
The classification of the net deferred income tax asset is shown below (in millions):
|
December 31,
|
2016
|
2015
|
|||||
|
Long-term deferred income tax assets
|
$
|
504.4
|
|
$
|
646.0
|
|
|
|
Long-term deferred income tax liabilities
|
(45.0
|
)
|
(45.6
|
)
|
|||
|
Net deferred income tax asset
|
$
|
459.4
|
|
$
|
600.4
|
|
|
Deferred income taxes have not been provided on
$1.7 billion
of certain undistributed earnings of the Company’s foreign subsidiaries as such amounts are considered to be permanently reinvested. It is not practicable to determine the unrecognized deferred tax liability on these earnings because the actual tax liability on these earnings, if any, is dependent on circumstances existing when remittance occurs.
As of
December 31, 2016
, the Company had tax loss carryforwards of
$1.9 billion
. Of the total tax loss carryforwards,
$1.7 billion
have no expiration date, and
$201.3 million
expire between 2017 and 2036. In addition, the Company had tax credit carryforwards of
$242.4 million
, comprised principally of U.S. foreign tax credits, research and development credits and investment tax credits that generally expire between 2017 and 2036. As of
December 31, 2016
, the deferred tax asset related to domestic tax credit carryforwards is lower than the actual amount reported on the Company’s domestic tax returns by
$54.5 million
. This difference is the result of tax deductions in excess of financial statement amounts for stock-based compensation. On January 1, 2017, the Company will adopt Accounting Standards Update ("ASU") 2016-09, "Improvements to Employee Share-Based Payment Accounting." As a result of the adoption, the
$54.5 million
contra deferred tax asset will be eliminated and reflected as an increase to retained earnings. See Note
15
, "
Accounting Pronouncements
."
As of
December 31, 2016
and
2015
, the Company’s gross unrecognized tax benefits were
$29.5 million
and
$30.4 million
(excluding interest and penalties), respectively, all of which, if recognized, would affect the Company’s effective tax rate. The gross unrecognized tax benefits are recorded in other long-term liabilities.
A summary of the changes in gross unrecognized tax benefits is shown below (in millions):
|
For the year ended December 31,
|
2016
|
2015
|
2014
|
||||||||
|
Balance at beginning of period
|
$
|
30.4
|
|
$
|
39.7
|
|
$
|
45.2
|
|
||
|
Additions based on tax positions related to current year
|
4.0
|
|
5.0
|
|
5.6
|
|
|||||
|
Reductions based on tax positions related to prior years
|
(0.9
|
)
|
(0.2
|
)
|
(1.8
|
)
|
|||||
|
Settlements
|
—
|
|
(12.3
|
)
|
(6.5
|
)
|
|||||
|
Statute expirations
|
(2.9
|
)
|
(0.6
|
)
|
—
|
|
|||||
|
Foreign currency translation
|
(1.1
|
)
|
(1.2
|
)
|
(2.8
|
)
|
|||||
|
Balance at end of period
|
$
|
29.5
|
|
$
|
30.4
|
|
$
|
39.7
|
|
||
The Company recognizes interest and penalties with respect to unrecognized tax benefits as income tax expense. As of
December 31, 2016
and
2015
, the Company had recorded gross reserves of
$7.8 million
and
$7.5 million
, respectively, related to interest and penalties, of which
$7.8 million
and
$7.4 million
, respectively, if recognized, would affect the Company’s effective tax rate.
The Company operates in multiple jurisdictions throughout the world, and its tax returns are periodically audited or subject to review by both domestic and foreign tax authorities. During the next twelve months, it is reasonably possible that, as a result of audit settlements, the conclusion of current examinations and the expiration of the statute of limitations in multiple jurisdictions, the Company may decrease the amount of its gross unrecognized tax benefits by approximately
$2.5 million
, all of which, if recognized, would affect the Company’s effective tax rate. The gross unrecognized tax benefits subject to potential decrease involve issues related to transfer pricing and various other tax items in multiple jurisdictions. However, as a result of ongoing examinations, tax proceedings in certain countries, additions to the gross unrecognized tax benefits for positions taken and interest and penalties, if any, arising in
2017
, it is not possible to estimate the potential net increase or decrease to the Company’s gross unrecognized tax benefits during the next twelve months.
The Company considers its significant tax jurisdictions to include China, Germany, Hungary, Italy, Mexico, Poland, Spain, the United Kingdom and the United States. The Company or its subsidiaries generally remain subject to income tax examination in certain U.S. state and local jurisdictions for years after 2011. Further, the Company or its subsidiaries remain subject to income tax examination in Mexico for years after 2006, in Spain for years after 2007, in Hungary and Poland for years after 2010, in Italy generally for years after 2011, in China, Germany and the United Kingdom for years after 2012 and in the United States generally for years after 2015.
77
Lear Corporation and Subsidiaries
Notes to Consolidated Financial Statements (continued)
(
8
)
Pension and Other Postretirement Benefit Plans
The Company has noncontributory defined benefit pension plans covering certain domestic employees and certain employees in foreign countries, principally Canada. The Company’s salaried pension plans provide benefits based on final average earnings formulas. The Company’s hourly pension plans provide benefits under flat benefit and cash balance formulas. The Company also has contractual arrangements with certain employees which provide for supplemental retirement benefits. In general, the Company’s policy is to fund its pension benefit obligation based on legal requirements, tax and liquidity considerations and local practices.
The Company has postretirement benefit plans covering certain domestic and Canadian employees. The Company’s postretirement benefit plans generally provide for the continuation of medical benefits for all eligible employees who complete a specified number of years of service and retire from the Company at age
55
or older. The Company does not fund its postretirement benefit obligation. Rather, payments are made as costs are incurred by covered retirees.
Obligations and Funded Status
A reconciliation of the change in benefit obligation and the change in plan assets for the years ended
December 31, 2016
and
2015
, is shown below (in millions):
|
|
Pension
|
Other Postretirement
|
||||||||||||||||||||||||||||||
|
|
December 31, 2016
|
December 31, 2015
|
December 31, 2016
|
December 31, 2015
|
||||||||||||||||||||||||||||
|
|
U.S.
|
Foreign
|
U.S.
|
Foreign
|
U.S.
|
Foreign
|
U.S.
|
Foreign
|
||||||||||||||||||||||||
|
Change in benefit obligation:
|
||||||||||||||||||||||||||||||||
|
Benefit obligation at
beginning of period |
$
|
686.6
|
|
$
|
427.4
|
|
$
|
717.8
|
|
$
|
493.0
|
|
$
|
78.9
|
|
$
|
36.5
|
|
$
|
83.3
|
|
$
|
46.8
|
|
||||||||
|
Service cost
|
5.6
|
|
6.5
|
|
4.7
|
|
8.4
|
|
0.2
|
|
0.5
|
|
0.2
|
|
0.7
|
|
||||||||||||||||
|
Interest cost
|
29.8
|
|
15.8
|
|
28.7
|
|
16.2
|
|
3.2
|
|
1.6
|
|
3.1
|
|
1.7
|
|
||||||||||||||||
|
Actuarial (gain) loss
|
3.5
|
|
27.4
|
|
(42.5
|
)
|
(12.4
|
)
|
(12.8
|
)
|
0.8
|
|
(3.1
|
)
|
(1.2
|
)
|
||||||||||||||||
|
Benefits paid
|
(22.4
|
)
|
(29.1
|
)
|
(22.1
|
)
|
(19.9
|
)
|
(4.8
|
)
|
(1.9
|
)
|
(4.6
|
)
|
(2.2
|
)
|
||||||||||||||||
|
Lump sum payout
(1)
|
(154.9
|
)
|
—
|
|
—
|
|
—
|
|
—
|
|
—
|
|
—
|
|
—
|
|
||||||||||||||||
|
Curtailment
|
—
|
|
—
|
|
—
|
|
6.5
|
|
—
|
|
—
|
|
—
|
|
(2.8
|
)
|
||||||||||||||||
|
Special termination benefits
|
—
|
|
—
|
|
—
|
|
—
|
|
—
|
|
0.3
|
|
—
|
|
0.8
|
|
||||||||||||||||
|
Translation adjustment
|
—
|
|
(5.5
|
)
|
—
|
|
(64.4
|
)
|
—
|
|
1.0
|
|
—
|
|
(7.3
|
)
|
||||||||||||||||
|
Benefit obligation at end of period
|
$
|
548.2
|
|
$
|
442.5
|
|
$
|
686.6
|
|
$
|
427.4
|
|
$
|
64.7
|
|
$
|
38.8
|
|
$
|
78.9
|
|
$
|
36.5
|
|
||||||||
|
|
Pension
|
Other Postretirement
|
||||||||||||||||||||||||||||||
|
|
December 31, 2016
|
December 31, 2015
|
December 31, 2016
|
December 31, 2015
|
||||||||||||||||||||||||||||
|
|
U.S.
|
Foreign
|
U.S.
|
Foreign
|
U.S.
|
Foreign
|
U.S.
|
Foreign
|
||||||||||||||||||||||||
|
Change in plan assets:
|
||||||||||||||||||||||||||||||||
|
Fair value of plan assets at
beginning of period |
$
|
522.1
|
|
$
|
368.2
|
|
$
|
519.2
|
|
$
|
415.1
|
|
$
|
—
|
|
$
|
—
|
|
$
|
—
|
|
$
|
—
|
|
||||||||
|
Actual return on plan assets
|
30.2
|
|
21.1
|
|
(3.7
|
)
|
19.5
|
|
—
|
|
—
|
|
—
|
|
—
|
|
||||||||||||||||
|
Employer contributions
|
37.6
|
|
8.5
|
|
28.7
|
|
13.9
|
|
4.8
|
|
1.9
|
|
4.6
|
|
2.2
|
|
||||||||||||||||
|
Benefits paid
|
(22.4
|
)
|
(29.1
|
)
|
(22.1
|
)
|
(19.9
|
)
|
(4.8
|
)
|
(1.9
|
)
|
(4.6
|
)
|
(2.2
|
)
|
||||||||||||||||
|
Lump sum payout
(1)
|
(154.9
|
)
|
—
|
|
—
|
|
—
|
|
—
|
|
—
|
|
—
|
|
—
|
|
||||||||||||||||
|
Translation adjustment
|
—
|
|
(1.6
|
)
|
—
|
|
(60.4
|
)
|
—
|
|
—
|
|
—
|
|
—
|
|
||||||||||||||||
|
Fair value of plan assets at
end of period |
$
|
412.6
|
|
$
|
367.1
|
|
$
|
522.1
|
|
$
|
368.2
|
|
$
|
—
|
|
$
|
—
|
|
$
|
—
|
|
$
|
—
|
|
||||||||
|
Funded status
|
$
|
(135.6
|
)
|
$
|
(75.4
|
)
|
$
|
(164.5
|
)
|
$
|
(59.2
|
)
|
$
|
(64.7
|
)
|
$
|
(38.8
|
)
|
$
|
(78.9
|
)
|
$
|
(36.5
|
)
|
||||||||
|
(1)
|
See Lump-Sum Payout below for further discussion
|
78
Lear Corporation and Subsidiaries
Notes to Consolidated Financial Statements (continued)
|
|
Pension
|
Other Postretirement
|
||||||||||||||||||||||||||||||
|
|
December 31, 2016
|
December 31, 2015
|
December 31, 2016
|
December 31, 2015
|
||||||||||||||||||||||||||||
|
|
U.S.
|
Foreign
|
U.S.
|
Foreign
|
U.S.
|
Foreign
|
U.S.
|
Foreign
|
||||||||||||||||||||||||
|
Amounts recognized in the consolidated balance sheet:
|
||||||||||||||||||||||||||||||||
|
Other long-term assets
|
$
|
—
|
|
$
|
40.3
|
|
$
|
—
|
|
$
|
43.7
|
|
$
|
—
|
|
$
|
—
|
|
$
|
—
|
|
$
|
—
|
|
||||||||
|
Accrued liabilities
|
(2.2
|
)
|
(2.7
|
)
|
(2.5
|
)
|
(3.4
|
)
|
(4.2
|
)
|
(1.5
|
)
|
(5.1
|
)
|
(1.6
|
)
|
||||||||||||||||
|
Other long-term liabilities
|
(133.4
|
)
|
(113.0
|
)
|
(162.0
|
)
|
(99.5
|
)
|
(60.5
|
)
|
(37.3
|
)
|
(73.8
|
)
|
(34.9
|
)
|
||||||||||||||||
Accumulated Benefit Obligation
As of
December 31, 2016
and
2015
, the accumulated benefit obligation for all of the Company’s pension plans was
$973.7 million
and
$1,099.2 million
, respectively.
As of
December 31, 2016
and
2015
, the majority of the Company's pension plans had accumulated benefit obligations in excess of plan assets. Information related to pension plans with accumulated benefit obligations in excess of plan assets is shown below (in millions):
|
December 31,
|
2016
|
2015
|
|||||
|
Projected benefit obligation
|
$
|
747.3
|
|
$
|
874.4
|
|
|
|
Accumulated benefit obligation
|
730.4
|
|
859.5
|
|
|||
|
Fair value of plan assets
|
496.0
|
|
607.0
|
|
|||
Lump-Sum Payout
In 2016, the Company initiated a limited lump-sum payout offer ("Lump-Sum Payout") to certain terminated vested plan participants of its U.S. defined benefit pension plans. The offer provided participants with the flexibility to receive their pension benefits early and reduces the Company's future administrative costs and risks related to its U.S. defined benefit pension plans. Under this offer, eligible plan participants were able to voluntarily elect an early payout of their pension benefits, primarily in the form of a lump-sum payment equal to the present value of the participant’s pension benefits. In connection with the Lump-Sum Payout, payments of
$154.9 million
were distributed from existing defined benefit pension plan assets, and the Company recognized a
$34.2 million
non-cash settlement charge. Payments under the Lump-Sum Payout are reflected as benefits paid in the reconciliations of the change in benefit obligation and the change in plan assets for the year ended December 31, 2016.
Other Comprehensive Income (Loss) and Accumulated Other Comprehensive Loss
Pretax amounts recognized in other comprehensive income (loss) for the years ended
December 31, 2016
and
2015
, are shown below (in millions):
|
|
Pension
|
Other Postretirement
|
||||||||||||||||||||||||||||||
|
|
December 31, 2016
|
December 31, 2015
|
December 31, 2016
|
December 31, 2015
|
||||||||||||||||||||||||||||
|
|
U.S.
|
Foreign
|
U.S.
|
Foreign
|
U.S.
|
Foreign
|
U.S.
|
Foreign
|
||||||||||||||||||||||||
|
Actuarial gains (losses) recognized:
|
||||||||||||||||||||||||||||||||
|
Reclassification adjustments
|
$
|
2.7
|
|
$
|
3.1
|
|
$
|
2.6
|
|
$
|
4.1
|
|
$
|
(1.3
|
)
|
$
|
0.2
|
|
$
|
(1.2
|
)
|
$
|
0.5
|
|
||||||||
|
Effect of settlement
|
33.2
|
|
0.4
|
|
—
|
|
—
|
|
—
|
|
—
|
|
—
|
|
—
|
|
||||||||||||||||
|
Actuarial gain (loss) arising during the period
|
(10.1
|
)
|
(30.0
|
)
|
(0.4
|
)
|
7.3
|
|
12.8
|
|
(0.8
|
)
|
3.1
|
|
3.9
|
|
||||||||||||||||
|
Prior service credit recognized:
|
||||||||||||||||||||||||||||||||
|
Reclassification adjustments
|
—
|
|
—
|
|
—
|
|
—
|
|
—
|
|
(0.3
|
)
|
—
|
|
(0.4
|
)
|
||||||||||||||||
|
Translation adjustment
|
—
|
|
(1.0
|
)
|
—
|
|
12.8
|
|
—
|
|
(0.1
|
)
|
—
|
|
1.2
|
|
||||||||||||||||
|
$
|
25.8
|
|
$
|
(27.5
|
)
|
$
|
2.2
|
|
$
|
24.2
|
|
$
|
11.5
|
|
$
|
(1.0
|
)
|
$
|
1.9
|
|
$
|
5.2
|
|
|||||||||
In addition, the Company recognized tax benefit (expense) in other comprehensive income (loss) related to its defined benefit plans of
($7.1) million
,
($8.3) million
and
$56.5 million
for the years ended
December 31, 2016
,
2015
and
2014
, respectively.
79
Lear Corporation and Subsidiaries
Notes to Consolidated Financial Statements (continued)
Pretax amounts recorded in accumulated other comprehensive loss not yet recognized in net periodic benefit cost (credit) as of
December 31, 2016
and
2015
, are shown below (in millions):
|
|
Pension
|
Other Postretirement
|
||||||||||||||||||||||||||||||
|
|
December 31, 2016
|
December 31, 2015
|
December 31, 2016
|
December 31, 2015
|
||||||||||||||||||||||||||||
|
|
U.S.
|
Foreign
|
U.S.
|
Foreign
|
U.S.
|
Foreign
|
U.S.
|
Foreign
|
||||||||||||||||||||||||
|
Net unrecognized actuarial
gain (loss) |
$
|
(110.1
|
)
|
$
|
(100.9
|
)
|
$
|
(135.9
|
)
|
$
|
(73.4
|
)
|
$
|
25.1
|
|
$
|
(6.1
|
)
|
$
|
13.6
|
|
$
|
(5.4
|
)
|
||||||||
|
Prior service credit
|
—
|
|
—
|
|
—
|
|
—
|
|
—
|
|
0.9
|
|
—
|
|
1.2
|
|
||||||||||||||||
|
$
|
(110.1
|
)
|
$
|
(100.9
|
)
|
$
|
(135.9
|
)
|
$
|
(73.4
|
)
|
$
|
25.1
|
|
$
|
(5.2
|
)
|
$
|
13.6
|
|
$
|
(4.2
|
)
|
|||||||||
Pretax amounts recorded in accumulated other comprehensive loss as of
December 31, 2016
, that are expected to be recognized as components of net periodic benefit cost (credit) in the year ending
December 31
,
2017
, are shown below (in millions):
|
|
Pension
|
Other Postretirement
|
||||||||||||||
|
|
U.S.
|
Foreign
|
U.S.
|
Foreign
|
||||||||||||
|
Net unrecognized actuarial gain (loss)
|
$
|
(2.6
|
)
|
$
|
(5.1
|
)
|
$
|
2.6
|
|
$
|
(0.3
|
)
|
||||
|
Prior service credit
|
—
|
|
—
|
|
—
|
|
0.3
|
|
||||||||
|
$
|
(2.6
|
)
|
$
|
(5.1
|
)
|
$
|
2.6
|
|
$
|
—
|
|
|||||
The Company uses the corridor approach when amortizing actuarial losses. Under the corridor approach, net unrecognized actuarial losses in excess of 10% of the greater of i) the projected benefit obligation or ii) the fair value of plan assets are amortized over future periods. For plans with little to no active participants, the amortization period is the remaining average life expectancy of the participants. For plans with active participants, the amortization period is the remaining average service period of the active participants. The amortization periods range from
5.9 years
to
29 years
for the Company's defined benefit pension plans and from
2.3 years
to
19 years
for the Company's other postretirement benefit plans.
Net Periodic Pension and Other Postretirement Benefit Cost (Credit)
The components of the Company’s net periodic pension benefit cost (credit) are shown below (in millions):
|
|
Year Ended December 31,
|
||||||||||||||||||||||
|
2016
|
2015
|
2014
|
|||||||||||||||||||||
|
Pension
|
U.S.
|
Foreign
|
U.S.
|
Foreign
|
U.S.
|
Foreign
|
|||||||||||||||||
|
Service cost
|
$
|
5.6
|
|
$
|
6.5
|
|
$
|
4.7
|
|
$
|
8.4
|
|
$
|
3.7
|
|
$
|
8.8
|
|
|||||
|
Interest cost
|
29.8
|
|
15.8
|
|
28.7
|
|
16.2
|
|
28.5
|
|
20.4
|
|
|||||||||||
|
Expected return on plan assets
|
(38.1
|
)
|
(23.2
|
)
|
(39.4
|
)
|
(25.7
|
)
|
(38.1
|
)
|
(27.0
|
)
|
|||||||||||
|
Amortization of actuarial (gain) loss
|
2.7
|
|
3.1
|
|
2.6
|
|
4.1
|
|
(0.3
|
)
|
1.3
|
|
|||||||||||
|
Curtailment loss
|
—
|
|
—
|
|
—
|
|
7.7
|
|
—
|
|
—
|
|
|||||||||||
|
Settlement loss
|
34.4
|
|
0.4
|
|
0.2
|
|
—
|
|
0.1
|
|
—
|
|
|||||||||||
|
Net periodic benefit cost (credit)
|
$
|
34.4
|
|
$
|
2.6
|
|
$
|
(3.2
|
)
|
$
|
10.7
|
|
$
|
(6.1
|
)
|
$
|
3.5
|
|
|||||
The components of the Company’s net periodic other postretirement benefit cost are shown below (in millions):
|
|
Year Ended December 31,
|
||||||||||||||||||||||
|
2016
|
2015
|
2014
|
|||||||||||||||||||||
|
Other Postretirement
|
U.S.
|
Foreign
|
U.S.
|
Foreign
|
U.S.
|
Foreign
|
|||||||||||||||||
|
Service cost
|
$
|
0.2
|
|
$
|
0.5
|
|
$
|
0.2
|
|
$
|
0.7
|
|
$
|
0.2
|
|
$
|
0.9
|
|
|||||
|
Interest cost
|
3.2
|
|
1.6
|
|
3.1
|
|
1.7
|
|
4.0
|
|
2.0
|
|
|||||||||||
|
Amortization of actuarial (gain) loss
|
(1.3
|
)
|
0.2
|
|
(1.2
|
)
|
0.5
|
|
(0.7
|
)
|
0.1
|
|
|||||||||||
|
Amortization of prior service credit
|
—
|
|
(0.3
|
)
|
—
|
|
(0.4
|
)
|
—
|
|
(0.4
|
)
|
|||||||||||
|
Special termination benefits
|
—
|
|
0.3
|
|
—
|
|
0.8
|
|
—
|
|
0.8
|
|
|||||||||||
|
Net periodic benefit cost
|
$
|
2.1
|
|
$
|
2.3
|
|
$
|
2.1
|
|
$
|
3.3
|
|
$
|
3.5
|
|
$
|
3.4
|
|
|||||
80
Lear Corporation and Subsidiaries
Notes to Consolidated Financial Statements (continued)
For the year ended December 31, 2016, the Company recognized a pension settlement loss of
$34.2 million
related to its Lump-Sum Payout described above.
For the year ended December 31, 2015, the Company recognized a pension curtailment loss of
$7.7 million
related to its restructuring actions (Note
4
, "
Restructuring
").
Assumptions
The weighted average actuarial assumptions used in determining the benefit obligations are shown below:
|
|
Pension
|
Other Postretirement
|
|||||
|
December 31,
|
2016
|
2015
|
2016
|
2015
|
|||
|
Discount rate:
|
|||||||
|
Domestic plans
|
4.1%
|
4.4%
|
3.9%
|
4.2%
|
|||
|
Foreign plans
|
3.3%
|
3.8%
|
3.9%
|
4.2%
|
|||
|
Rate of compensation increase:
|
|||||||
|
Foreign plans
|
3.3%
|
3.3%
|
N/A
|
N/A
|
|||
The weighted average actuarial assumptions used in determining the net periodic benefit cost (credit) are shown below:
|
For the year ended December 31,
|
2016
|
2015
|
2014
|
|||||
|
Pension
|
||||||||
|
Discount rate:
|
||||||||
|
Domestic plans
|
4.4
|
%
|
4.1
|
%
|
5.0
|
%
|
||
|
Foreign plans
|
3.8
|
%
|
3.6
|
%
|
4.7
|
%
|
||
|
Expected return on plan assets:
|
||||||||
|
Domestic plans
|
7.5
|
%
|
7.8
|
%
|
7.8
|
%
|
||
|
Foreign plans
|
6.3
|
%
|
6.5
|
%
|
6.7
|
%
|
||
|
Rate of compensation increase:
|
||||||||
|
Foreign plans
|
3.3
|
%
|
3.1
|
%
|
3.4
|
%
|
||
|
Other postretirement
|
||||||||
|
Discount rate:
|
||||||||
|
Domestic plans
|
4.2
|
%
|
3.9
|
%
|
4.5
|
%
|
||
|
Foreign plans
|
4.2
|
%
|
4.0
|
%
|
5.0
|
%
|
||
The expected return on plan assets is determined based on several factors, including adjusted historical returns, historical risk premiums for various asset classes and target asset allocations within the portfolio. Adjustments made to the historical returns are based on recent return experience in the equity and fixed income markets and the belief that deviations from historical returns are likely over the relevant investment horizon.
Healthcare Trend Rate
Assumed healthcare cost trend rates have a significant effect on the amounts reported for the postretirement benefit plans. The sensitivity to a 100 basis point ("bp") change in the assumed healthcare cost trend rates is shown below (in millions):
|
Postretirement Benefit Obligation
|
Net Periodic Postretirement Cost
|
||||||
|
100 bp increase in healthcare cost trend rates
|
$
|
14.2
|
|
$
|
0.8
|
|
|
|
100 bp decrease in healthcare cost trend rates
|
$
|
(11.6
|
)
|
$
|
(0.7
|
)
|
|
81
Lear Corporation and Subsidiaries
Notes to Consolidated Financial Statements (continued)
The assumed healthcare cost trend rates used to measure the postretirement benefit obligation as of
December 31, 2016
, are shown below:
|
U.S. Plans
|
Foreign Plans
|
||
|
Initial healthcare cost trend rate
|
7.0%
|
5.3%
|
|
|
Ultimate healthcare cost trend rate
|
4.5%
|
4.5%
|
|
|
Year ultimate healthcare cost trend rate achieved
|
2021
|
2031
|
|
Plan Assets
Fair value measurements and the related valuation techniques and fair value hierarchy level for the Company’s pension plan assets measured at fair value on a recurring basis as of
December 31, 2016
and
2015
, are shown below (in millions):
|
December 31, 2016
|
|||||||||||||||||
|
Total
|
Level 1
|
Level 2
|
Level 3
|
Valuation Technique
|
|||||||||||||
|
U.S. Plans:
|
|||||||||||||||||
|
Equity securities -
|
|
||||||||||||||||
|
Mutual funds
|
$
|
137.7
|
|
$
|
137.7
|
|
$
|
—
|
|
$
|
—
|
|
Market
|
||||
|
Common stock
|
77.5
|
|
51.1
|
|
26.4
|
|
—
|
|
Market
|
||||||||
|
Fixed income -
|
|||||||||||||||||
|
Mutual funds
|
86.5
|
|
86.5
|
|
—
|
|
—
|
|
Market
|
||||||||
|
Corporate bonds
|
18.1
|
|
—
|
|
18.1
|
|
—
|
|
Market
|
||||||||
|
Government obligations
|
29.9
|
|
—
|
|
29.9
|
|
—
|
|
Market
|
||||||||
|
Preferred stock
|
1.4
|
|
0.9
|
|
0.5
|
|
—
|
|
Market
|
||||||||
|
Cash and short-term investments
|
8.4
|
|
0.9
|
|
7.5
|
|
—
|
|
Market
|
||||||||
|
Assets at fair value
|
359.5
|
|
$
|
277.1
|
|
$
|
82.4
|
|
$
|
—
|
|
||||||
|
Investments measured at net asset value -
|
|||||||||||||||||
|
Alternative investments
|
53.1
|
|
|||||||||||||||
|
Assets at fair value
|
$
|
412.6
|
|
||||||||||||||
|
Foreign Plans:
|
|||||||||||||||||
|
Equity securities -
|
|
||||||||||||||||
|
Equity funds
|
$
|
132.6
|
|
$
|
27.0
|
|
$
|
105.6
|
|
$
|
—
|
|
Market
|
||||
|
Common stock
|
73.2
|
|
73.2
|
|
—
|
|
—
|
|
Market
|
||||||||
|
Fixed income -
|
|||||||||||||||||
|
Fixed income funds
|
31.2
|
|
31.2
|
|
—
|
|
—
|
|
Market
|
||||||||
|
Corporate bonds
|
37.1
|
|
—
|
|
37.1
|
|
—
|
|
Market
|
||||||||
|
Government obligations
|
53.8
|
|
—
|
|
53.8
|
|
—
|
|
Market
|
||||||||
|
Cash and short-term investments
|
6.0
|
|
3.2
|
|
2.8
|
|
—
|
|
Market
|
||||||||
|
Assets at fair value
|
333.9
|
|
$
|
134.6
|
|
$
|
199.3
|
|
$
|
—
|
|
||||||
|
Investments measured at net asset value -
|
|||||||||||||||||
|
Alternative investments
|
33.2
|
|
|||||||||||||||
|
Assets at fair value
|
$
|
367.1
|
|
||||||||||||||
82
Lear Corporation and Subsidiaries
Notes to Consolidated Financial Statements (continued)
|
December 31, 2015
|
|||||||||||||||||
|
Total
|
Level 1
|
Level 2
|
Level 3
|
Valuation Technique
|
|||||||||||||
|
U.S. Plans:
|
|||||||||||||||||
|
Equity securities -
|
|||||||||||||||||
|
Mutual funds
|
$
|
189.7
|
|
$
|
189.7
|
|
$
|
—
|
|
$
|
—
|
|
Market
|
||||
|
Common stock
|
112.4
|
|
72.5
|
|
39.9
|
|
—
|
|
Market
|
||||||||
|
Fixed income -
|
|||||||||||||||||
|
Mutual funds
|
87.8
|
|
87.8
|
|
—
|
|
—
|
|
Market
|
||||||||
|
Corporate bonds
|
22.1
|
|
—
|
|
22.1
|
|
—
|
|
Market
|
||||||||
|
Government obligations
|
18.8
|
|
—
|
|
18.8
|
|
—
|
|
Market
|
||||||||
|
Preferred stock
|
2.2
|
|
1.4
|
|
0.8
|
|
—
|
|
Market
|
||||||||
|
Cash and short-term investments
|
36.1
|
|
36.1
|
|
—
|
|
—
|
|
Market
|
||||||||
|
Assets at fair value
|
469.1
|
|
$
|
387.5
|
|
$
|
81.6
|
|
$
|
—
|
|
||||||
|
Investments measured at net asset value -
|
|||||||||||||||||
|
Alternative investments
|
53.0
|
|
|||||||||||||||
|
Assets at fair value
|
$
|
522.1
|
|
||||||||||||||
|
Foreign Plans:
|
|
||||||||||||||||
|
Equity securities -
|
|||||||||||||||||
|
Equity funds
|
$
|
129.8
|
|
$
|
28.0
|
|
$
|
101.8
|
|
$
|
—
|
|
Market
|
||||
|
Common stock
|
70.2
|
|
70.2
|
|
—
|
|
—
|
|
Market
|
||||||||
|
Fixed income -
|
|||||||||||||||||
|
Fixed income funds
|
33.1
|
|
33.1
|
|
—
|
|
—
|
|
Market
|
||||||||
|
Corporate bonds
|
40.2
|
|
—
|
|
40.2
|
|
—
|
|
Market
|
||||||||
|
Government obligations
|
55.5
|
|
—
|
|
55.5
|
|
—
|
|
Market
|
||||||||
|
Cash
|
5.4
|
|
2.8
|
|
2.6
|
|
—
|
|
Market
|
||||||||
|
Assets at fair value
|
334.2
|
|
$
|
134.1
|
|
$
|
200.1
|
|
$
|
—
|
|
||||||
|
Investments measured at net asset value -
|
|||||||||||||||||
|
Alternative investments
|
34.0
|
|
|||||||||||||||
|
Assets at fair value
|
$
|
368.2
|
|
||||||||||||||
For further information on the GAAP fair value hierarchy, see Note
13
, "
Financial Instruments
." Pension plan assets for the foreign plans relate to the Company’s pension plans primarily in Canada and the United Kingdom.
In 2015, the Financial Accounting Standards Board ("FASB") issued ASU 2015-07, "Disclosures for Investments in Certain Entities that Calculate Net Asset Value Per Share (or its Equivalent)." ASU 2015-07 removes the requirement to categorize, within the fair value hierarchy, investments for which fair values are estimated using the net asset value ("NAV") as a practical expedient as provided by Accounting Standards Codification 820, "Fair Value Measurement." In 2016, the Company early adopted the provisions of this update with respect to its defined benefit pension plan assets and retroactively applied the new presentation requirements to all periods presented. Accordingly, the alternative investments of the U.S. defined benefit pension plans, for which fair values are estimated using the NAV as a practical expedient, are no longer categorized and presented within the fair value hierarchy. These assets are shown below the fair value hierarchy in order to present total pension plan assets at fair value.
The Company’s investment policies incorporate an asset allocation strategy that emphasizes the long-term growth of capital. The Company believes that this strategy is consistent with the long-term nature of plan liabilities and ultimate cash needs of the plans. For the domestic portfolio, the Company targets an equity allocation of
50%
—
75%
of plan assets, a fixed income allocation of
15%
—
40%
, an alternative investment allocation of
0%
—
30%
and a cash allocation of
0%
—
10%
. For the foreign portfolio, the Company targets an equity allocation of
45%
—
65%
of plan assets, a fixed income allocation of
25%
—
45%
, an alternative investment allocation of
0%
—
25%
and a cash allocation of
0%
—
15%
. Differences in the target allocations of the domestic and foreign portfolios are reflective of differences in the underlying plan liabilities. Diversification within the investment portfolios is pursued by asset class and investment management style. The investment portfolios are
83
Lear Corporation and Subsidiaries
Notes to Consolidated Financial Statements (continued)
reviewed on a quarterly basis to maintain the desired asset allocations, given the market performance of the asset classes and investment management styles. Alternative investments are redeemable in the near term, generally with 60 days notice.
The Company utilizes investment management firms to manage these assets in accordance with the Company’s investment policies. Excluding alternative investments, mutual funds and ETFs, retained investment managers are provided investment guidelines which restrict the use of certain assets, including commodities contracts, futures contracts, options, venture capital, real estate, interest-only or principal-only strips and investments in the Company’s own debt or equity. Derivative instruments are also prohibited without the specific approval of the Company. Investment managers are limited in the maximum size of individual security holdings and the maximum exposure to any one industry relative to the total portfolio. Fixed income managers are provided further investment guidelines that indicate minimum credit ratings for debt securities and limitations on weighted average maturity and portfolio duration.
The Company evaluates investment manager performance against market indices which the Company believes are appropriate to the investment management style for which the investment manager has been retained. The Company’s investment policies incorporate an investment goal of aggregate portfolio returns which exceed the returns of the appropriate market indices by a reasonable spread over the relevant investment horizon.
Contributions
The Company's minimum required contributions to its domestic and foreign pension plans are expected to be approximately
$10 million
to
$15 million
in
2017
. The Company may elect to make contributions in excess of minimum funding requirements in response to investment performance or changes in interest rates or when the Company believes that it is financially advantageous to do so and based on its other cash requirements. The Company’s minimum funding requirements after
2017
will depend on several factors, including investment performance and interest rates. The Company’s minimum funding requirements may also be affected by changes in applicable legal requirements.
Benefit Payments
As of
December 31, 2016
, the Company’s estimate of expected benefit payments, excluding expected settlements relating to its restructuring actions, in each of the five succeeding years and in the aggregate for the five years thereafter are shown below (in millions):
|
|
Pension
|
Other Postretirement
|
||||||||||||||
|
Year
|
U.S.
|
Foreign
|
U.S.
|
Foreign
|
||||||||||||
|
2017
|
$
|
25.8
|
|
$
|
22.8
|
|
$
|
4.3
|
|
$
|
1.5
|
|
||||
|
2018
|
26.4
|
|
18.7
|
|
4.4
|
|
1.4
|
|
||||||||
|
2019
|
27.3
|
|
19.0
|
|
4.5
|
|
1.5
|
|
||||||||
|
2020
|
28.0
|
|
19.7
|
|
4.5
|
|
1.5
|
|
||||||||
|
2021
|
28.7
|
|
19.7
|
|
4.5
|
|
1.6
|
|
||||||||
|
Five years thereafter
|
148.4
|
|
124.2
|
|
21.8
|
|
9.5
|
|
||||||||
Multi-Employer Pension Plans
The Company currently participates in
two
multi-employer pension plans, the U.A.W. Labor-Management Group Pension Plan and UNITE Here National Retirement Fund, for certain of its employees. Contributions to these plans are based on
three
collective bargaining agreements.
One
of the agreements expires on April 24, 2020, and
two
of the agreements expire on July 3, 2020. Detailed information related to these plans is shown below (amounts in millions):
|
|
Pension Protection Act
Zone Status
|
|
|
Contributions to Multiemployer Pension Plans
|
|||||||||||||||
|
Employer Identification Number
|
December 31,
2016
Certification
|
December 31,
2015
Certification
|
FIP/RP
Pending or
Implemented
|
Surcharge
|
Year Ended December 31, 2016
|
Year Ended December 31, 2015
|
Year Ended December 31, 2014
|
||||||||||||
|
516099782-001
|
Red
|
Green
|
Yes
|
No
|
$
|
0.6
|
|
$
|
0.5
|
|
$
|
0.6
|
|
||||||
|
13-6130178
|
Red
|
Red
|
Yes
|
Yes
|
0.4
|
|
0.3
|
|
0.3
|
|
|||||||||
For its plan years 2016 and 2015, the Company's contributions to the U.A.W. Labor-Management Group Pension Plan represented more than
5%
of the plan's total contributions.
84
Lear Corporation and Subsidiaries
Notes to Consolidated Financial Statements (continued)
Defined Contribution Plan
The Company also sponsors defined contribution plans and participates in government-sponsored programs in certain foreign countries. Contributions are determined as a percentage of each covered employee’s salary. For the years ended
December 31, 2016
,
2015
and
2014
, the aggregate cost of the defined contribution plans was
$14.4 million
,
$13.3 million
and
$12.0 million
, respectively.
The Company also has a defined contribution retirement program for its salaried employees. Contributions to this program are determined as a percentage of each covered employee’s eligible compensation. For the years ended
December 31, 2016
,
2015
and
2014
, the Company recorded expense of
$21.2 million
,
$19.4 million
and
$17.8 million
, respectively, related to this program.
(
9
)
Capital Stock, Equity and Accumulated Other Comprehensive Loss
Common Stock
The Company is authorized to issue up to
300,000,000
shares of Common Stock. The Company’s Common Stock is listed on the New York Stock Exchange under the symbol "LEA" and has the following rights and privileges:
|
•
|
Voting Rights
– All shares of the Company’s common stock have identical rights and privileges. With limited exceptions, holders of common stock are entitled to
one
vote for each outstanding share of common stock held of record by each stockholder on all matters properly submitted for the vote of the Company’s stockholders.
|
|
•
|
Dividend Rights
– Subject to applicable law, any contractual restrictions and the rights of the holders of outstanding preferred stock, if any, holders of common stock are entitled to receive ratably such dividends and other distributions that the Company’s Board of Directors, in its discretion, declares from time to time.
|
|
•
|
Liquidation Rights
– Upon the dissolution, liquidation or winding up of the Company, subject to the rights of the holders of outstanding preferred stock, if any, holders of common stock are entitled to receive ratably the assets of the Company available for distribution to the Company’s stockholders in proportion to the number of shares of common stock held by each stockholder.
|
|
•
|
Conversion, Redemption and Preemptive Rights
– Holders of common stock have no conversion, redemption, sinking fund, preemptive, subscription or similar rights.
|
Common Stock Share Repurchase Program
Since the first quarter of 2011, the Company's Board of Directors has authorized
$3.4 billion
in share repurchases under its common stock share repurchase program. As of
December 31, 2016
, the Company has paid
$3.1 billion
in aggregate for repurchases of its common stock, at an average price of
$74.51
per share, excluding commissions and related fees.
In
2016
, the Company paid
$658.8 million
in aggregate for repurchases of its common stock (
5,816,363
shares repurchased at an average purchase price of
$113.26
per share, excluding commissions). In
2015
, the Company paid
$487.4 million
in aggregate for repurchases of its common stock, (
4,366,365
shares repurchased at an average purchase price of
$111.62
per share, excluding commissions). In
2014
, the Company paid
$411.4 million
in aggregate for repurchases of its common stock,
including
$355.9 million
of open market purchases (
3,805,114
shares repurchased at an average purchase price of
$93.52
per share, excluding commissions) and
$55.5 million
to settle an accelerated stock repurchase ("ASR") transaction that was entered into in 2013.
As of December 31, 2016, the Company has a remaining repurchase authorization of
$341.2 million
under its current common stock share repurchase program, which will expire on December 31, 2017. The Company may implement these share repurchases through a variety of methods, including, but not limited to, open market purchases, accelerated stock repurchase programs and structured repurchase transactions. The extent to which the Company will repurchase its outstanding common stock and the timing of such repurchases will depend upon its financial condition, prevailing market conditions, alternative uses of capital and other factors. In addition, the Company’s Credit Agreement places certain limitations on the Company’s ability to repurchase its common stock.
In addition to shares repurchased under the Company’s common stock share repurchase program described above, the Company classified shares withheld from the settlement of the Company’s restricted stock unit awards to cover minimum tax withholding requirements as common stock held in treasury in the accompanying consolidated balance sheets as of
December 31, 2016
and
2015
.
In 2014, the Company’s Board of Directors approved the retirement of
8 million
shares of common stock held in treasury. These retired shares are reflected as authorized, but not issued, in the accompanying consolidated balance sheets as of
85
Lear Corporation and Subsidiaries
Notes to Consolidated Financial Statements (continued)
December 31, 2016
and
2015
. The retirement of shares held in treasury resulted in a reduction in common stock, additional paid-in capital and retained earnings of
$0.1 million
,
$155.9 million
and
$363.9 million
, respectively. These reductions were offset by a corresponding reduction in shares held in treasury of
$519.9 million
. Accordingly, there was no effect on stockholders' equity as a result of this transaction.
Quarterly Dividend
In
2016
,
2015
and
2014
, the Company’s Board of Directors declared quarterly cash dividends of
$0.30
,
$0.25
and
$0.20
, respectively, per share of common stock. In
2016
, declared dividends totaled
$89.1 million
, and dividends paid totaled
$88.8 million
. In
2015
, declared dividends totaled
$79.4 million
, and dividends paid totaled
$78.5 million
. In
2014
, declared dividends totaled
$67.1 million
, and dividends paid totaled
$65.3 million
. Dividends payable on common shares to be distributed under the Company’s stock-based compensation program and common shares contemplated as part of the Company’s emergence from Chapter 11 bankruptcy proceedings will be paid when such common shares are distributed.
Accumulated Other Comprehensive Loss
Comprehensive income is defined as all changes in the Company’s net assets except changes resulting from transactions with stockholders. It differs from net income in that certain items recorded in equity are included in comprehensive income.
A summary of changes in accumulated other comprehensive loss, net of tax is shown below (in millions):
|
For the year ended December 31,
|
2016
|
2015
|
2014
|
||||||||
|
Defined benefit plans:
|
|||||||||||
|
Balance at beginning of year
|
$
|
(194.6
|
)
|
$
|
(219.2
|
)
|
$
|
(104.5
|
)
|
||
|
Reclassification adjustments (net of tax expense of $12.1 million in 2016 and $1.4 million in 2015)
|
25.9
|
|
4.2
|
|
0.1
|
|
|||||
|
Other comprehensive income (loss) recognized during the period (net of tax benefit (expense) of $5.0 million in 2016, ($6.9) million in 2015 and $56.5 million in 2014)
|
(24.1
|
)
|
20.4
|
|
(114.8
|
)
|
|||||
|
Balance at end of year
|
$
|
(192.8
|
)
|
$
|
(194.6
|
)
|
$
|
(219.2
|
)
|
||
|
Derivative instruments and hedging activities:
|
|||||||||||
|
Balance at beginning of year
|
$
|
(38.7
|
)
|
$
|
(33.2
|
)
|
$
|
(5.3
|
)
|
||
|
Reclassification adjustments (net of tax benefit (expense) of ($28.8) million in 2016, ($14.9) million in 2015 and $1.8 million in 2014)
|
57.9
|
|
23.7
|
|
(6.4
|
)
|
|||||
|
Other comprehensive loss recognized during the period (net of tax benefit of $32.7 million in 2016, $18.4 million in 2015 and $13.0 million in 2014)
|
(64.3
|
)
|
(29.2
|
)
|
(21.5
|
)
|
|||||
|
Balance at end of year
|
$
|
(45.1
|
)
|
$
|
(38.7
|
)
|
$
|
(33.2
|
)
|
||
|
Cumulative translation adjustments:
|
|||||||||||
|
Balance at beginning of year
|
$
|
(496.8
|
)
|
$
|
(249.6
|
)
|
$
|
(56.3
|
)
|
||
|
Other comprehensive loss recognized during the period (net of tax benefit of $1.1 million in 2016, $6.0 million in 2015 and $7.4 million in 2014)
|
(100.9
|
)
|
(247.2
|
)
|
(193.3
|
)
|
|||||
|
Balance at end of year
|
$
|
(597.7
|
)
|
$
|
(496.8
|
)
|
$
|
(249.6
|
)
|
||
For the years ended
December 31, 2016
,
2015
and
2014
, other comprehensive loss related to cumulative translation adjustments includes pretax losses related to intercompany transactions for which settlement is not planned or anticipated in the foreseeable future of
$0.2 million
,
$10.7 million
and
$18.7 million
, respectively.
Noncontrolling Interests
In 2016, the Company gained control of and consolidated an affiliate. For further information related to the consolidation, see Note
5
, "
Investments in Affiliates and Other Related Party Transactions
." Also in 2016, the Company acquired the outstanding noncontrolling interests in a consolidated subsidiary, Shenyang Lear Automotive Seating and Interior Systems Co., Ltd., for
$32.6 million
and now owns
100%
of the subsidiary.
In 2015, a noncontrolling interest was established in a new less than wholly owned consolidated subsidiary.
86
Lear Corporation and Subsidiaries
Notes to Consolidated Financial Statements (continued)
In 2014, the Company acquired the outstanding noncontrolling interests in certain of its consolidated subsidiaries. Also in 2014, the Company sold its controlling interest in a less than wholly owned consolidated subsidiary. There was no significant gain or loss recognized in connection with this transaction.
(
10
)
Stock-Based Compensation
The Company adopted the Lear Corporation 2009 Long-Term Stock Incentive Plan as of November 9, 2009 (as amended, the "2009 LTSIP"). The 2009 LTSIP reserves
11,815,748
shares of common stock for issuance under stock option, restricted stock, restricted stock unit, restricted unit, performance share, performance unit and stock appreciation right awards.
Under the 2009 LTSIP, the Company has granted restricted stock units and performance shares to certain of its employees. The restricted stock units and performance shares generally vest in
three years
following the grant date. For the years ended
December 31, 2016
,
2015
and
2014
, the Company recognized compensation expense related to the restricted stock unit and performance share awards of
$66.7 million
,
$64.5 million
and
$69.5 million
, respectively. Unrecognized compensation expense related to the restricted stock unit and performance share awards of
$65.0 million
will be recognized over the next
1.6
years on a weighted average basis. In accordance with the provisions of the restricted stock unit and performance share awards, the Company withholds shares from the settlement of such awards to cover minimum statutory tax withholding requirements. The withheld shares are classified as common stock held in treasury in the accompanying consolidated balance sheets as of
December 31, 2016
and
2015
. A summary of restricted stock unit and performance share transactions for the year ended
December 31, 2016
, is shown below:
|
Restricted
Stock Units
|
Weighted Average Grant Date
Fair Value
|
Performance
Shares
|
Weighted Average Grant Date
Fair Value
|
|||
|
Outstanding as of December 31, 2015
|
708,749
|
|
$74.68
|
2,230,336
|
|
$66.91
|
|
Granted
|
168,247
|
|
$120.42
|
405,342
|
|
$119.99
|
|
Distributed (vested)
|
(247,789
|
)
|
(1,011,759
|
)
|
||
|
Cancelled
|
(6,065
|
)
|
(168,865
|
)
|
||
|
Outstanding as of December 31, 2016
(1)
|
623,142
|
|
$92.54
|
1,455,054
|
|
$94.19
|
|
Vested or expected to vest as of December 31, 2016
|
623,142
|
|
1,389,628
|
|
||
|
(1)
|
Outstanding performance shares are reflected at the maximum possible payout that may be earned during the relevant performance periods.
|
The grant date fair values of restricted stock units and performance shares are based on the share price on the grant date. The weighted average grant date fair value of restricted stock units granted in
2015
and
2014
was
$104.46
and
$79.73
, respectively. The weighted average grant date fair value of performance shares granted in
2015
and
2014
was
$97.92
and
$73.85
, respectively.
(
11
)
Commitments and Contingencies
Legal and Other Contingencies
As of
December 31, 2016
and
2015
, the Company had recorded reserves for pending legal disputes, including commercial disputes and other matters, of
$11.0 million
and
$9.2 million
, respectively. Such reserves reflect amounts recognized in accordance with GAAP and typically exclude the cost of legal representation. Product liability and warranty reserves are recorded separately from legal reserves, as described below.
Commercial Disputes
The Company is involved from time to time in legal proceedings and claims, including, without limitation, commercial or contractual disputes with its customers, suppliers and competitors. These disputes vary in nature and are usually resolved by negotiations between the parties.
Product Liability and Warranty Matters
In the event that use of the Company’s products results in, or is alleged to result in, bodily injury and/or property damage or other losses, the Company may be subject to product liability lawsuits and other claims. Such lawsuits generally seek compensatory damages, punitive damages and attorneys’ fees and costs. In addition, if any of the Company’s products are, or are alleged to be, defective, the Company may be required or requested by its customers to participate in a recall or other
87
Lear Corporation and Subsidiaries
Notes to Consolidated Financial Statements (continued)
corrective action involving such products. Certain of the Company’s customers have asserted claims against the Company for costs related to recalls or other corrective actions involving its products. The Company can provide no assurances that it will not experience material claims in the future or that it will not incur significant costs to defend such claims.
To a lesser extent, the Company is a party to agreements with certain of its customers, whereby these customers may pursue claims against the Company for contribution of all or a portion of the amounts sought in connection with product liability and warranty claims.
In certain instances, allegedly defective products may be supplied by Tier 2 suppliers. The Company may seek recovery from its suppliers of materials or services included within the Company’s products that are associated with product liability and warranty claims. The Company carries insurance for certain legal matters, including product liability claims, but such coverage may be limited. The Company does not maintain insurance for product warranty or recall matters. Future dispositions with respect to the Company’s product liability claims that were subject to compromise under the Chapter 11 bankruptcy proceedings will be satisfied out of a common stock and warrant reserve established for that purpose.
The Company records product warranty reserves when liability is probable and related amounts are reasonably estimable.
A summary of the changes in reserves for product liability and warranty claims for each of the periods in the two years ended
December 31, 2016
, is shown below (in millions):
|
Balance as of January 1, 2015
|
$
|
28.9
|
|
|
Expense, net, including changes in estimates
|
15.4
|
|
|
|
Settlements
|
(10.0
|
)
|
|
|
Foreign currency translation and other
|
(1.3
|
)
|
|
|
Balance as of December 31, 2015
|
33.0
|
|
|
|
Expense, net, including changes in estimates
|
27.3
|
|
|
|
Settlements
|
(10.4
|
)
|
|
|
Foreign currency translation and other
|
(0.8
|
)
|
|
|
Balance as of December 31, 2016
|
$
|
49.1
|
|
Environmental Matters
The Company is subject to local, state, federal and foreign laws, regulations and ordinances which govern activities or operations that may have adverse environmental effects and which impose liability for clean-up costs resulting from past spills, disposals or other releases of hazardous wastes and environmental compliance. The Company’s policy is to comply with all applicable environmental laws and to maintain an environmental management program based on ISO 14001 to ensure compliance with this standard. However, the Company currently is, has been and in the future may become the subject of formal or informal enforcement actions or procedures.
As of
December 31, 2016
and
2015
, the Company had recorded environmental reserves of
$9.0 million
and
$9.1 million
, respectively. The Company does not believe that the environmental liabilities associated with its current and former properties will have a material adverse impact on its business, financial condition, results of operations or cash flows; however, no assurances can be given in this regard.
Other Matters
The Company is involved from time to time in various other legal proceedings and claims, including, without limitation, intellectual property matters, tax claims and employment matters. Although the outcome of any legal matter cannot be predicted with certainty, the Company does not believe that any of the other legal proceedings or claims in which the Company is currently involved, either individually or in the aggregate, will have a material adverse impact on its business, financial condition, results of operations or cash flows. However, no assurances can be given in this regard.
Although the Company records reserves for legal disputes, product liability and warranty claims and environmental and other matters in accordance with GAAP, the ultimate outcomes of these matters are inherently uncertain. Actual results may differ significantly from current estimates.
Employees
Approximately
52%
of the Company’s employees are members of industrial trade unions and are employed under the terms of various labor agreements. Labor agreements covering approximately
78%
of the Company’s unionized workforce of
88
Lear Corporation and Subsidiaries
Notes to Consolidated Financial Statements (continued)
approximately
77,000
employees, including approximately
2%
of the Company’s unionized workforce in the United States and Canada, are scheduled to expire in
2017
. Management does not anticipate any significant difficulties with respect to the renewal of these agreements.
Lease Commitments
A summary of lease commitments as of
December 31, 2016
, under non-cancelable operating leases with terms exceeding one year is shown below (in millions):
|
2017
|
$
|
109.0
|
|
|
2018
|
89.3
|
|
|
|
2019
|
85.0
|
|
|
|
2020
|
77.1
|
|
|
|
2021
|
65.0
|
|
|
|
Thereafter
|
138.3
|
|
|
|
Total
|
$
|
563.7
|
|
The Company’s operating leases cover principally buildings and transportation equipment. For the years ended
December 31, 2016
,
2015
and
2014
, rent expense was
$126.4 million
,
$126.2 million
and
$128.1 million
, respectively.
(
12
)
Segment Reporting
A summary of revenues from external customers and other financial information by reportable operating segment is shown below (in millions):
|
|
Year Ended December 31, 2016
|
||||||||||||||
|
|
Seating
|
E-Systems
|
Other
|
Consolidated
|
|||||||||||
|
Revenues from external customers
|
$
|
14,356.7
|
|
$
|
4,200.9
|
|
$
|
—
|
|
$
|
18,557.6
|
|
|||
|
Segment earnings
(1)
|
1,136.0
|
|
591.3
|
|
(300.1
|
)
|
1,427.2
|
|
|||||||
|
Depreciation and amortization
|
258.1
|
|
107.6
|
|
12.5
|
|
378.2
|
|
|||||||
|
Capital expenditures
|
341.6
|
|
162.4
|
|
24.3
|
|
528.3
|
|
|||||||
|
Total assets
|
6,199.2
|
|
1,675.9
|
|
2,025.5
|
|
9,900.6
|
|
|||||||
|
|
Year Ended December 31, 2015
|
||||||||||||||
|
|
Seating
|
E-Systems
|
Other
|
Consolidated
|
|||||||||||
|
Revenues from external customers
|
$
|
14,098.5
|
|
$
|
4,112.9
|
|
$
|
—
|
|
$
|
18,211.4
|
|
|||
|
Segment earnings
(1)
|
907.0
|
|
554.4
|
|
(274.6
|
)
|
1,186.8
|
|
|||||||
|
Depreciation and amortization
|
239.3
|
|
99.3
|
|
9.2
|
|
347.8
|
|
|||||||
|
Capital expenditures
|
317.2
|
|
134.4
|
|
34.2
|
|
485.8
|
|
|||||||
|
Total assets
|
5,780.7
|
|
1,572.9
|
|
2,052.2
|
|
9,405.8
|
|
|||||||
|
|
Year Ended December 31, 2014
|
||||||||||||||
|
|
Seating
|
E-Systems
|
Other
|
Consolidated
|
|||||||||||
|
Revenues from external customers
|
$
|
13,310.6
|
|
$
|
4,416.7
|
|
$
|
—
|
|
$
|
17,727.3
|
|
|||
|
Segment earnings
(1)
|
655.2
|
|
556.6
|
|
(282.6
|
)
|
929.2
|
|
|||||||
|
Depreciation and amortization
|
199.8
|
|
103.3
|
|
7.8
|
|
310.9
|
|
|||||||
|
Capital expenditures
|
268.9
|
|
138.4
|
|
17.4
|
|
424.7
|
|
|||||||
|
(1)
|
For a definition of segment earnings, see Note 2, "Summary of Significant Accounting Policies — Segment Reporting."
|
For the year ended
December 31, 2016
, segment earnings include restructuring charges of
$40.6 million
,
$20.1 million
and
$2.9 million
in the seating and E-Systems segments and in the other category, respectively (Note
4
, "
Restructuring
").
89
Lear Corporation and Subsidiaries
Notes to Consolidated Financial Statements (continued)
For the year ended
December 31, 2015
, segment earnings include restructuring charges of
$60.8 million
,
$13.9 million
and
$12.1 million
in the seating and E-Systems segments and in the other category, respectively (Note
4
, "
Restructuring
").
For the year ended
December 31, 2014
, segment earnings include restructuring charges of
$84.0 million
,
$10.3 million
and
$12.7 million
in the seating and E-Systems segments and in the other category, respectively (Note
4
, "
Restructuring
").
A reconciliation of segment earnings to consolidated income before provision for income taxes and equity in net income of affiliates is shown below (in millions):
|
For the year ended December 31,
|
2016
|
2015
|
2014
|
||||||||
|
Segment earnings
|
$
|
1,727.3
|
|
$
|
1,461.4
|
|
$
|
1,211.8
|
|
||
|
Corporate and regional headquarters and elimination of intercompany activity ("Other")
|
(300.1
|
)
|
(274.6
|
)
|
(282.6
|
)
|
|||||
|
Consolidated income before interest, other expense, provision for income taxes and equity in net income of affiliates
|
1,427.2
|
|
1,186.8
|
|
929.2
|
|
|||||
|
Interest expense
|
82.5
|
|
86.7
|
|
67.5
|
|
|||||
|
Other expense, net
|
6.4
|
|
68.6
|
|
74.3
|
|
|||||
|
Consolidated income before provision for income taxes and equity in net income of affiliates
|
$
|
1,338.3
|
|
$
|
1,031.5
|
|
$
|
787.4
|
|
||
Revenues from external customers and tangible long-lived assets for each of the geographic areas in which the Company operates is shown below (in millions):
|
For the year ended December 31,
|
2016
|
2015
|
2014
|
||||||||
|
Revenues from external customers
|
|||||||||||
|
United States
|
$
|
4,186.0
|
|
$
|
4,252.3
|
|
$
|
3,708.4
|
|
||
|
Mexico
|
2,684.4
|
|
2,777.3
|
|
2,373.9
|
|
|||||
|
China
|
2,277.6
|
|
2,141.9
|
|
2,092.9
|
|
|||||
|
Germany
|
2,076.0
|
|
1,987.3
|
|
2,327.7
|
|
|||||
|
Other countries
|
7,333.6
|
|
7,052.6
|
|
7,224.4
|
|
|||||
|
Total
|
$
|
18,557.6
|
|
$
|
18,211.4
|
|
$
|
17,727.3
|
|
||
|
December 31,
|
2016
|
2015
|
|||||
|
Tangible long-lived assets:
|
|||||||
|
United States
|
$
|
361.2
|
|
$
|
337.1
|
|
|
|
Mexico
|
466.5
|
|
374.6
|
|
|||
|
China
|
253.5
|
|
244.7
|
|
|||
|
Germany
|
147.5
|
|
129.9
|
|
|||
|
Other countries
|
790.6
|
|
740.2
|
|
|||
|
Total
|
$
|
2,019.3
|
|
$
|
1,826.5
|
|
|
The following is a summary of the percentage of revenues from major customers:
|
For the year ended December 31,
|
2016
|
2015
|
2014
|
||
|
Ford
|
21.0%
|
22.5%
|
20.6%
|
||
|
General Motors
|
20.9%
|
20.0%
|
22.0%
|
||
|
BMW
|
10.1%
|
10.5%
|
11.1%
|
||
In addition, a portion of the Company’s remaining revenues are from the above automotive manufacturing companies through various other automotive suppliers.
90
Lear Corporation and Subsidiaries
Notes to Consolidated Financial Statements (continued)
(
13
)
Financial Instruments
Debt Instruments
The carrying values of the Company’s debt instruments vary from their fair values. The fair values were determined by reference to the quoted market prices of these securities (Level 2 input based on the GAAP fair value hierarchy). The estimated fair value, as well as the carrying value, of the Company's debt instruments are shown below (in millions):
|
December 31
|
2016
|
2015
|
|||||
|
Estimated aggregate fair value
|
$
|
2,004.8
|
|
$
|
1,992.3
|
|
|
|
Aggregate carrying value
(1)
|
1,943.7
|
|
1,965.6
|
|
|||
|
(1)
|
Credit agreement and senior notes, excluding the impact of unamortized debt issuance costs.
|
Accounts Receivable Factoring
One of the Company's European subsidiaries has an uncommitted factoring agreement, which provides for aggregate purchases of specified customer accounts of up to
€200 million
. As of
December 31, 2016
and
2015
, there were
no
factored receivables outstanding. The Company cannot provide any assurances that this factoring facility will be available or utilized in the future.
Marketable Equity Securities
Included in other current assets in the accompanying consolidated balance sheets as of
December 31, 2016
and
2015
, are
$30.2 million
and
$23.0 million
, respectively, of marketable equity securities, which the Company accounts for under the fair value option. Accordingly, unrealized gains and losses arising from changes in the fair value of the marketable equity securities are recognized in the consolidated statement of income as a component of other expense, net. The fair value of the marketable equity securities is determined by reference to quoted market prices in active markets (Level 1 input based on the GAAP fair value hierarchy).
Derivative Instruments and Hedging Activities
Foreign Exchange
The Company uses forwards, swaps and other derivative contracts to reduce the effects of fluctuations in foreign exchange rates on known foreign currency exposures. Gains and losses on the derivative instruments are intended to offset gains and losses on the hedged transaction in an effort to reduce exposure to fluctuations in foreign exchange rates. The principal currencies hedged by the Company include the Mexican peso, various European currencies, the Thai baht, the Chinese renminbi, the Japanese yen and the Canadian dollar.
91
Lear Corporation and Subsidiaries
Notes to Consolidated Financial Statements (continued)
The notional amount, estimated fair value and related classification in the accompanying consolidated balance sheets of the Company's foreign currency derivative contracts are shown below (in millions, except for maturities):
|
December 31,
|
2016
|
2015
|
|||||
|
Fair value of contracts designated as cash flow hedges:
|
|||||||
|
Other current assets
|
$
|
11.2
|
|
$
|
8.2
|
|
|
|
Other long-term assets
|
0.5
|
|
0.3
|
|
|||
|
Other current liabilities
|
(58.3
|
)
|
(51.5
|
)
|
|||
|
Other long-term liabilities
|
(9.9
|
)
|
(3.4
|
)
|
|||
|
(56.5
|
)
|
(46.4
|
)
|
||||
|
Notional amount
|
$
|
1,275.0
|
|
$
|
1,394.6
|
|
|
|
Outstanding maturities in months, not to exceed
|
24
|
|
24
|
|
|||
|
Fair value of contracts not designated as hedging instruments:
|
|||||||
|
Other current assets
|
5.9
|
|
3.6
|
|
|||
|
Other current liabilities
|
(3.8
|
)
|
(8.1
|
)
|
|||
|
2.1
|
|
(4.5
|
)
|
||||
|
Notional amount
|
$
|
681.2
|
|
$
|
423.4
|
|
|
|
Outstanding maturities in months, not to exceed
|
12
|
|
12
|
|
|||
|
Total fair value
|
$
|
(54.4
|
)
|
$
|
(50.9
|
)
|
|
|
Total notional amount
|
$
|
1,956.2
|
|
$
|
1,818.0
|
|
|
Foreign currency derivative contracts not designated as hedging instruments consist principally of hedges of cash transactions, intercompany loans and certain other balance sheet exposures.
Pretax amounts related to foreign currency derivative contracts designated as cash flow hedges that were recognized in and reclassified from accumulated other comprehensive loss are shown below (in millions):
|
For the year ended December 31,
|
2016
|
2015
|
2014
|
||||||||
|
Losses recognized in accumulated other comprehensive loss
|
$
|
96.8
|
|
$
|
47.3
|
|
$
|
36.0
|
|
||
|
Gains (losses) reclassified from accumulated other comprehensive loss to:
|
|||||||||||
|
Net sales
|
(4.8
|
)
|
3.7
|
|
1.2
|
|
|||||
|
Cost of sales
|
(81.9
|
)
|
(42.3
|
)
|
7.0
|
|
|||||
|
Gains (losses) reclassified from accumulated other comprehensive loss
|
(86.7
|
)
|
(38.6
|
)
|
8.2
|
|
|||||
|
Comprehensive loss
|
$
|
10.1
|
|
$
|
8.7
|
|
$
|
44.2
|
|
||
Accumulated Other Comprehensive Loss - Derivative Instruments and Hedging Activities
As of
December 31, 2016
and
2015
, pretax net losses of approximately
$56.5 million
and
$46.4 million
, respectively, related to the Company’s derivative instruments and hedging activities were recorded in accumulated other comprehensive loss. During the next twelve month period, the Company expects to reclassify into earnings net losses of approximately
$47.1 million
recorded in accumulated other comprehensive loss as of
December 31, 2016
. Such losses will be reclassified at the time that the underlying hedged transactions are realized.
For the years ended
December 31, 2016
,
2015
and
2014
, amounts recognized in the accompanying consolidated statements of income related to changes in the fair value of cash flow and fair value hedges excluded from the Company’s effectiveness assessments and the ineffective portion of changes in the fair value of cash flow and fair value hedges were not material. In addition, the Company recognized tax benefits of
$3.9 million
,
$3.5 million
and
$14.8 million
in other comprehensive income (loss) related to its derivative instruments and hedging activities for the years ended
December 31, 2016
,
2015
and
2014
, respectively.
92
Lear Corporation and Subsidiaries
Notes to Consolidated Financial Statements (continued)
Fair Value Measurements
GAAP provides that fair value is an exit price, defined as a market-based measurement that represents the amount that would be received to sell an asset or paid to transfer a liability in an orderly transaction between market participants. Fair value measurements are based on one or more of the following three valuation techniques:
|
Market:
|
This approach uses prices and other relevant information generated by market transactions involving identical or comparable assets or liabilities.
|
|
|
Income:
|
This approach uses valuation techniques to convert future amounts to a single present value amount based on current market expectations.
|
|
|
Cost:
|
This approach is based on the amount that would be required to replace the service capacity of an asset (replacement cost).
|
|
Further, GAAP prioritizes the inputs and assumptions used in the valuation techniques described above into a three-tier fair value hierarchy as follows:
|
Level 1:
|
Observable inputs, such as quoted market prices in active markets for identical assets or liabilities that are accessible at the measurement date.
|
|
|
Level 2:
|
Inputs, other than quoted market prices included in Level 1, that are observable either directly or indirectly for the asset or liability.
|
|
|
Level 3:
|
Unobservable inputs that reflect the entity’s own assumptions about the exit price of the asset or liability. Unobservable inputs may be used if there is little or no market data for the asset or liability at the measurement date.
|
|
The Company discloses fair value measurements and the related valuation techniques and fair value hierarchy level for its assets and liabilities that are measured or disclosed at fair value.
Items Measured at Fair Value on a Recurring Basis
Fair value measurements and the related valuation techniques and fair value hierarchy level for the Company’s assets and liabilities measured at fair value on a recurring basis as of
December 31, 2016
and
2015
, are shown below (in millions):
|
December 31, 2016
|
|||||||||||||||||||
|
Frequency
|
Asset
(Liability)
|
Valuation
Technique
|
Level 1
|
Level 2
|
Level 3
|
||||||||||||||
|
Foreign currency derivative contracts, net
|
Recurring
|
$
|
(54.4
|
)
|
Market / Income
|
$
|
—
|
|
$
|
(54.4
|
)
|
$
|
—
|
|
|||||
|
Marketable equity securities
|
Recurring
|
30.2
|
|
Market
|
30.2
|
|
—
|
|
—
|
|
|||||||||
|
December 31, 2015
|
|||||||||||||||||||
|
Frequency
|
Asset
(Liability) |
Valuation
Technique
|
Level 1
|
Level 2
|
Level 3
|
||||||||||||||
|
Foreign currency derivative contracts, net
|
Recurring
|
$
|
(50.9
|
)
|
Market / Income
|
$
|
—
|
|
$
|
(50.9
|
)
|
$
|
—
|
|
|||||
|
Marketable equity securities
|
Recurring
|
23.0
|
|
Market
|
23.0
|
|
—
|
|
—
|
|
|||||||||
The Company determines the fair value of its derivative contracts using quoted market prices to calculate the forward values and then discounts such forward values to the present value. The discount rates used are based on quoted bank deposit or swap interest rates. If a derivative contract is in a net liability position, the Company adjusts these discount rates, if required, by an estimate of the credit spread that would be applied by market participants purchasing these contracts from the Company’s counterparties. If an estimate of the credit spread is required, the Company uses significant assumptions and factors other than quoted market rates, which would result in the classification of its derivative liabilities within Level 3 of the fair value
93
Lear Corporation and Subsidiaries
Notes to Consolidated Financial Statements (continued)
hierarchy. As of
December 31, 2016
and
2015
, there were no derivative contracts that were classified within Level 3 of the fair value hierarchy. In addition, there were no transfers in or out of Level 3 of the fair value hierarchy during
2016
and
2015
.
For further information on fair value measurements and the Company’s defined benefit pension plan assets, see Note
8
, "
Pension and Other Postretirement Benefit Plans
."
Items Measured at Fair Value on a Non-Recurring Basis
The Company measures certain assets and liabilities at fair value on a non-recurring basis, which are not included in the table above. As these non-recurring fair value measurements are generally determined using unobservable inputs, these fair value measurements are classified within Level 3 of the fair value hierarchy.
As a result of the acquisition of AccuMED and the consolidation of Beijing BAI, Level 3 fair value estimates related to property, plant and equipment of
$34.6 million
, intangible assets of
$87.0 million
and noncontrolling interests of
$41.0 million
are recorded in the accompanying consolidated balance sheet as of
December 31, 2016
. In addition, the consolidation of Beijing BAI required a Level 3 fair value estimate related to the Company's previously held equity interest of
$63.0 million
.
As a result of the acquisition of Eagle Ottawa in 2015, Level 3 fair value estimates related to property, plant and equipment of
$142.4 million
, intangible assets of
$211.3 million
and contingent consideration of
$25.0 million
are recorded in the accompanying consolidated balance sheet as of December 31, 2015.
Fair value estimates of property, plant and equipment were based on independent appraisals, giving consideration to the highest and best use of the assets. Key assumptions used in the appraisals were based on a combination of market and cost approaches, as appropriate. Fair value estimates of customer-based intangible assets were based on the present value of future earnings attributable to the asset group after recognition of required returns to other contributory assets. Fair value estimates of contingent consideration were based on an income approach. Fair value estimates of noncontrolling and equity interests were based on the present value of future cash flows and a value to earnings multiple approach and reflect discounts for the lack of control and the lack of marketability associated with noncontrolling and equity interests.
For further information on assets and liabilities measured at fair value on a non-recurring basis, see Note
2
, "
Summary of Significant Accounting Policies
," Note
3
, "
Acquisitions
," Note
4
, "
Restructuring
," and Note
5
, "
Investments in Affiliates and Other Related Party Transactions
."
(
14
)
Quarterly Financial Data (unaudited)
(In millions, except per share data)
|
|
Thirteen Weeks Ended
|
||||||||||||||
|
|
April 2,
2016 |
July 2,
2016 |
October 1,
2016 |
December 31,
2016 |
|||||||||||
|
Net sales
|
$
|
4,662.9
|
|
$
|
4,724.8
|
|
$
|
4,526.4
|
|
$
|
4,643.5
|
|
|||
|
Gross profit
|
535.7
|
|
540.4
|
|
513.9
|
|
512.1
|
|
|||||||
|
Consolidated net income
|
262.5
|
|
294.5
|
|
235.0
|
|
248.5
|
|
|||||||
|
Net income attributable to Lear
|
248.4
|
|
282.4
|
|
214.4
|
|
229.9
|
|
|||||||
|
Basic net income per share attributable to Lear
|
3.33
|
|
3.85
|
|
3.01
|
|
3.28
|
|
|||||||
|
Diluted net income per share attributable to Lear
|
3.29
|
|
3.82
|
|
2.98
|
|
3.24
|
|
|||||||
In the second quarter of 2016, the Company recognized a gain of
$30.3 million
related to the consolidation of an affiliate. In the fourth quarter of 2016, the Company recognized a
$34.2 million
non-cash settlement charge in connection with its lump-sum payout to certain terminated vested plan participants of its U.S. defined benefit pension plans. In the first, second, third and fourth quarters of 2016, the Company recognized
$5.0 million
,
$7.1 million
,
$2.4 million
and
$9.1 million
, respectively, of net tax benefits related to restructuring charges and various other items.
For further information see, Note
5
, "
Investments in Affiliates and Other Related Party Transactions
," Note
7
, "
Income Taxes
," and Note
8
, "
Pension and Other Postretirement Benefit Plans
."
94
Lear Corporation and Subsidiaries
Notes to Consolidated Financial Statements (continued)
|
|
Thirteen Weeks Ended
|
||||||||||||||
|
|
March 28,
2015 |
June 27,
2015 |
September 26,
2015 |
December 31,
2015 |
|||||||||||
|
Net sales
|
$
|
4,521.4
|
|
$
|
4,635.1
|
|
$
|
4,330.3
|
|
$
|
4,724.6
|
|
|||
|
Gross profit
|
425.7
|
|
450.2
|
|
453.2
|
|
490.7
|
|
|||||||
|
Consolidated net income
|
156.7
|
|
192.9
|
|
193.3
|
|
252.9
|
|
|||||||
|
Net income attributable to Lear
|
147.3
|
|
181.9
|
|
181.0
|
|
235.3
|
|
|||||||
|
Basic net income per share attributable to Lear
|
1.88
|
|
2.35
|
|
2.37
|
|
3.13
|
|
|||||||
|
Diluted net income per share attributable to Lear
|
1.86
|
|
2.33
|
|
2.34
|
|
3.07
|
|
|||||||
In the first quarter of 2015, the Company recognized a loss of
$14.3 million
related to the redemption of the remaining outstanding aggregate principal amount of the 2020 Notes. In the first, second, third and fourth quarters of 2015, the Company recognized
$14.0 million
,
$15.8 million
,
$2.2 million
and
$11.1 million
, respectively, of net tax benefits related to restructuring charges, debt redemption costs, acquisition costs and various other items.
For further information, see Note
7
, "
Income Taxes
," and Note
11
, "
Commitments and Contingencies
."
95
Lear Corporation and Subsidiaries
Notes to Consolidated Financial Statements (continued)
(
15
)
Accounting Pronouncements
The Company has considered the recent ASUs issued by the FASB summarized below, which could significantly impact its financial statements:
|
Standards Pending Adoption
|
Description
|
Effective Date
|
Anticipated Impact
|
|||
|
ASU 2016-09, Improvements to Employee Share-Based Payment Accounting
(1)
|
The standard simplifies several aspects of the accounting for share-based payment awards to employees and includes provisions related to income taxes, the liability or equity classification of share-based payment awards and statement of cash flows presentation. The income tax related provisions of this update are expected to significantly impact the Company and must be adopted through a cumulative effect adjustment to retained earnings as of the beginning of the period in which the update is adopted.
|
January 1, 2017
|
As of December 31, 2016, the Company had tax benefits related to share-based payment awards of $54.5 million, recorded as a reduction to long-term deferred tax assets. Upon adoption, this amount will be eliminated from other long-term assets with a corresponding increase to retained earnings.
|
|||
|
ASU 2014-09, Revenue from Contracts with Customers
(2)
|
The standard replaces existing revenue recognition guidance and requires additional financial statement disclosures. The provisions of these updates may be applied through either a full retrospective or a modified retrospective approach.
|
January 1, 2018
|
The Company is continuing to assess the potential effects of the standard. The Company’s current analysis indicates that the most significant effect of the new standard relates to the Company's accounting for contractually guaranteed reimbursement of pre-production engineering and development and tooling costs related to products produced for its customers under long-term supply agreements. Under current guidance, such reimbursement is recorded as a cost offset. Under the new standard, the Company anticipates recognizing such reimbursements as revenues. While the Company continues to assess the potential effects of the standard, the Company does not currently expect the adoption of the new standard to have a material impact on consolidated net income or the consolidated balance sheet. The Company has not yet selected a transition method and plans to adopt the new standard effective January 1, 2018.
|
|||
|
ASU 2016-02, Leases
|
The standard requires that a lessee recognize on its balance sheet right-of-use assets and corresponding liabilities resulting from leasing transactions, as well as additional financial statement disclosures. Currently, GAAP only requires balance sheet recognition for leases classified as capital leases. The provisions of this update apply to substantially all leased assets, with certain permitted exceptions, and must be adopted using a modified retrospective approach.
|
January 1, 2019
|
The Company is currently evaluating the impact of this update. For additional information on the Company’s operating lease commitments, see Note 11, "Commitments and Contingencies."
|
|||
(1)
Early adoption permitted.
(2)
Along with five subsequent ASUs amending and clarifying ASU 2014-09:
ASU 2015-14, "Revenue from Contracts with Customers (Topic 606): Deferral of the Effective Date"
ASU 2016-08, "Revenue from Contracts with Customers (Topic 606): Principal versus Agent Considerations (Reporting Revenue Gross versus Net)"
ASU 2016-10, "Revenue from Contracts with Customers (Topic 606): Identifying Performance Obligations and Licensing"
ASU 2016-12, "Revenue from Contracts with Customers (Topic 606): Narrow-Scope Improvements and Practical Expedients"
ASU 2016-20, "Revenue from Contracts with Customers (Topic 606): Technical Corrections and Improvements"
96
Lear Corporation and Subsidiaries
Notes to Consolidated Financial Statements (continued)
The Company adopted the ASUs summarized below in 2016. The effects of adoption did not significantly impact its financial statements:
|
Standards Adopted
|
Description
|
Effective Date
|
||
|
ASU 2015-01, Income Statement — Extraordinary and Unusual Items
|
The standard eliminates the concept of extraordinary items.
|
January 1, 2016
|
||
|
ASU 2015-02, Amendments to the Consolidation Analysis
|
The standard provides guidance related to the application of both the variable interest and voting interest consolidation models.
|
January 1, 2016
|
||
|
ASU 2015-05, Internal-Use Software
|
The standard provides guidance about whether a cloud computing arrangement includes a software license.
|
January 1, 2016
|
||
|
ASU 2015-07, Disclosures for Investments in Certain Entities that Calculate Net Asset Value Per Share
|
The standard removes the requirement to categorize, within the fair value hierarchy, investments for which fair values are estimated using the net asset value as a practical expedient. The Company early adopted the provisions of this standard with respect to its defined benefit pension plan assets. See Note 8, "Pension and Other Postretirement Benefit Plans."
|
January 1, 2016
|
||
|
ASU 2015-16, Simplifying the Accounting for Measurement-Period Adjustments
|
The standard eliminates the requirement for an acquirer in a business combination to account for measurement-period adjustments retrospectively.
|
January 1, 2016
|
||
|
ASU 2014-15, Presentation of Financial Statements — Going Concern
|
The standard requires management to make a going concern assessment for 24 months after the financial statement date. Previously, this assessment was made by the Company's independent registered public accounting firm.
|
December 31, 2016
|
||
The Company has considered the recently issued ASUs summarized below, none of which are expected to significantly impact its financial statements:
|
Standard
|
Description
|
Effective Date
|
||
|
ASU 2015-11, Simplifying the Measurement of Inventory
|
The standard requires entities to measure inventory at the lower of cost or net realizable value rather than at the lower of cost or market.
|
January 1, 2017
|
||
|
ASU 2016-05, Effects of Derivative Contract Novations on Existing Hedge Accounting Relationships and ASU 2016-06, Contingent Put and Call Options in Debt Instruments
|
The standards provide clarification when there is a change in a counterparty to a derivative hedging instrument and the steps required when assessing the economic characteristics of embedded put or call options.
|
January 1, 2017
|
||
|
ASU 2016-07, Simplifying the Transition to Equity Method of Accounting
|
The standard eliminates the retroactive application when investments become qualified for the equity method of accounting as a result of an increase in the level of ownership or degree of influence.
|
January 1, 2017
|
||
|
ASU 2016-17, Interests Held through Related Parties that Are under Common Control
|
The standard changes the evaluation of whether a reporting entity is the primary beneficiary of a variable interest entity in certain instances involving entities under common control.
|
January 1, 2017
|
||
|
ASU 2016-01, Recognition and Measurement of Financial Assets and Financial Liabilities
|
The standard requires equity investments and other ownership interests in unconsolidated entities (other than those accounted for using the equity method of accounting) to be measured at fair value through earnings. A practicability exception exists for equity investments without readily determinable fair values.
|
January 1, 2018
|
||
|
ASU 2016-15, Classification of Certain Cash Receipts and Cash Payments
|
The standard addresses the classification of cash flows related to various transactions, including debt prepayment and extinguishment costs, contingent consideration and proceeds from insurance claims.
|
January 1, 2018
|
||
|
ASU 2016-16, Income Taxes - Intra-Entity Transfers of Assets Other than Inventory
|
The standard requires the recognition of the income tax effects of intercompany sales and transfers (other than inventory) when the sales and transfers occur.
|
January 1, 2018
|
||
|
ASU 2016-18, Restricted Cash
|
The standard provides guidance on the presentation of restricted cash on the statement of cash flows.
|
January 1, 2018
|
||
|
ASU 2017-01, Clarifying the Definition of a Business
|
The standard provides a framework to use when determining if a set of assets and activities is a business.
|
January 1, 2018
|
||
|
ASU 2016-13, Measurement of Credit Losses on Financial Instruments
|
The standard changes the impairment model for most financial instruments to an "expected loss" model. The new model will generally result in earlier recognition of credit losses.
|
January 1, 2020
|
||
|
ASU 2017-04, Simplifying the Test for Goodwill Impairment
|
The standard simplifies the accounting for goodwill impairments and allows a goodwill impairment charge to be based on the amount of a reporting unit's carrying value in excess of its fair value. This will eliminate what is known as "Step 2" under the current guidance.
|
January 1, 2020
|
||
97
Lear Corporation and Subsidiaries
Notes to Consolidated Financial Statements (continued)
(16) Supplemental Guarantor Consolidating Financial Statements
|
December 31, 2016
|
|||||||||||||||||||
|
(in millions)
|
Lear
|
Guarantors
|
Non-
guarantors
|
Eliminations
|
Consolidated
|
||||||||||||||
|
Assets
|
|||||||||||||||||||
|
Current Assets:
|
|||||||||||||||||||
|
Cash and cash equivalents
|
$
|
480.4
|
|
$
|
0.3
|
|
$
|
790.9
|
|
$
|
—
|
|
$
|
1,271.6
|
|
||||
|
Accounts receivable
|
314.0
|
|
238.7
|
|
2,193.8
|
|
—
|
|
2,746.5
|
|
|||||||||
|
Inventories
|
67.9
|
|
364.7
|
|
588.0
|
|
—
|
|
1,020.6
|
|
|||||||||
|
Intercompany accounts
|
87.0
|
|
94.3
|
|
—
|
|
(181.3
|
)
|
—
|
|
|||||||||
|
Other
|
119.4
|
|
15.3
|
|
475.9
|
|
—
|
|
610.6
|
|
|||||||||
|
Total current assets
|
1,068.7
|
|
713.3
|
|
4,048.6
|
|
(181.3
|
)
|
5,649.3
|
|
|||||||||
|
Long-Term Assets:
|
|||||||||||||||||||
|
Property, plant and equipment, net
|
309.4
|
|
313.4
|
|
1,396.5
|
|
—
|
|
2,019.3
|
|
|||||||||
|
Goodwill
|
172.1
|
|
519.9
|
|
429.3
|
|
—
|
|
1,121.3
|
|
|||||||||
|
Investments in subsidiaries
|
4,002.3
|
|
903.4
|
|
—
|
|
(4,905.7
|
)
|
—
|
|
|||||||||
|
Intercompany loans receivable
|
308.9
|
|
1,206.9
|
|
91.1
|
|
(1,606.9
|
)
|
—
|
|
|||||||||
|
Other
|
456.6
|
|
146.8
|
|
525.1
|
|
(17.8
|
)
|
1,110.7
|
|
|||||||||
|
Total long-term assets
|
5,249.3
|
|
3,090.4
|
|
2,442.0
|
|
(6,530.4
|
)
|
4,251.3
|
|
|||||||||
|
Total assets
|
$
|
6,318.0
|
|
$
|
3,803.7
|
|
$
|
6,490.6
|
|
$
|
(6,711.7
|
)
|
$
|
9,900.6
|
|
||||
|
Liabilities and Equity
|
|||||||||||||||||||
|
Current Liabilities:
|
|||||||||||||||||||
|
Short-term borrowings
|
$
|
—
|
|
$
|
—
|
|
$
|
8.6
|
|
$
|
—
|
|
$
|
8.6
|
|
||||
|
Accounts payable and drafts
|
328.8
|
|
460.1
|
|
1,851.6
|
|
—
|
|
2,640.5
|
|
|||||||||
|
Accrued liabilities
|
228.6
|
|
197.5
|
|
1,071.5
|
|
—
|
|
1,497.6
|
|
|||||||||
|
Intercompany accounts
|
—
|
|
—
|
|
181.3
|
|
(181.3
|
)
|
—
|
|
|||||||||
|
Current portion of long-term debt
|
34.4
|
|
—
|
|
1.2
|
|
—
|
|
35.6
|
|
|||||||||
|
Total current liabilities
|
591.8
|
|
657.6
|
|
3,114.2
|
|
(181.3
|
)
|
4,182.3
|
|
|||||||||
|
Long-Term Liabilities:
|
|||||||||||||||||||
|
Long-term debt
|
1,893.5
|
|
—
|
|
4.5
|
|
—
|
|
1,898.0
|
|
|||||||||
|
Intercompany loans payable
|
504.9
|
|
48.7
|
|
1,053.3
|
|
(1,606.9
|
)
|
—
|
|
|||||||||
|
Other
|
270.6
|
|
13.2
|
|
361.4
|
|
(17.8
|
)
|
627.4
|
|
|||||||||
|
Total long-term liabilities
|
2,669.0
|
|
61.9
|
|
1,419.2
|
|
(1,624.7
|
)
|
2,525.4
|
|
|||||||||
|
Equity:
|
|||||||||||||||||||
|
Lear Corporation stockholders’ equity
|
3,057.2
|
|
3,084.2
|
|
1,821.5
|
|
(4,905.7
|
)
|
3,057.2
|
|
|||||||||
|
Noncontrolling interests
|
—
|
|
—
|
|
135.7
|
|
—
|
|
135.7
|
|
|||||||||
|
Equity
|
3,057.2
|
|
3,084.2
|
|
1,957.2
|
|
(4,905.7
|
)
|
3,192.9
|
|
|||||||||
|
Total liabilities and equity
|
$
|
6,318.0
|
|
$
|
3,803.7
|
|
$
|
6,490.6
|
|
$
|
(6,711.7
|
)
|
$
|
9,900.6
|
|
||||
98
Lear Corporation and Subsidiaries
Notes to Consolidated Financial Statements (continued)
(16) Supplemental Guarantor Consolidating Financial Statements
|
December 31, 2015
|
|||||||||||||||||||
|
(in millions)
|
Lear
|
Guarantors
|
Non-
guarantors
|
Eliminations
|
Consolidated
|
||||||||||||||
|
Assets
|
|||||||||||||||||||
|
Current Assets:
|
|||||||||||||||||||
|
Cash and cash equivalents
|
$
|
526.4
|
|
$
|
0.4
|
|
$
|
669.8
|
|
$
|
—
|
|
$
|
1,196.6
|
|
||||
|
Accounts receivable
|
334.5
|
|
246.4
|
|
2,009.1
|
|
—
|
|
2,590.0
|
|
|||||||||
|
Inventories
|
73.5
|
|
337.5
|
|
536.6
|
|
—
|
|
947.6
|
|
|||||||||
|
Intercompany accounts, net
|
53.0
|
|
72.4
|
|
—
|
|
(125.4
|
)
|
—
|
|
|||||||||
|
Other
|
122.3
|
|
17.5
|
|
412.6
|
|
—
|
|
552.4
|
|
|||||||||
|
Total current assets
|
1,109.7
|
|
674.2
|
|
3,628.1
|
|
(125.4
|
)
|
5,286.6
|
|
|||||||||
|
Long-Term Assets:
|
|||||||||||||||||||
|
Property, plant and equipment, net
|
257.5
|
|
294.3
|
|
1,274.7
|
|
—
|
|
1,826.5
|
|
|||||||||
|
Goodwill
|
172.1
|
|
519.1
|
|
362.6
|
|
—
|
|
1,053.8
|
|
|||||||||
|
Investments in subsidiaries
|
3,520.3
|
|
1,467.4
|
|
—
|
|
(4,987.7
|
)
|
—
|
|
|||||||||
|
Intercompany loans receivable
|
277.5
|
|
836.7
|
|
77.7
|
|
(1,191.9
|
)
|
—
|
|
|||||||||
|
Other
|
622.2
|
|
148.0
|
|
493.8
|
|
(25.1
|
)
|
1,238.9
|
|
|||||||||
|
Total long-term assets
|
4,849.6
|
|
3,265.5
|
|
2,208.8
|
|
(6,204.7
|
)
|
4,119.2
|
|
|||||||||
|
Total assets
|
$
|
5,959.3
|
|
$
|
3,939.7
|
|
$
|
5,836.9
|
|
$
|
(6,330.1
|
)
|
$
|
9,405.8
|
|
||||
|
Liabilities and Equity
|
|||||||||||||||||||
|
Current Liabilities:
|
|||||||||||||||||||
|
Accounts payable and drafts
|
$
|
322.7
|
|
$
|
436.5
|
|
$
|
1,745.2
|
|
$
|
—
|
|
$
|
2,504.4
|
|
||||
|
Accrued liabilities
|
233.3
|
|
187.7
|
|
891.1
|
|
—
|
|
1,312.1
|
|
|||||||||
|
Intercompany accounts, net
|
—
|
|
—
|
|
125.4
|
|
(125.4
|
)
|
—
|
|
|||||||||
|
Current portion of long-term debt
|
21.9
|
|
—
|
|
1.2
|
|
—
|
|
23.1
|
|
|||||||||
|
Total current liabilities
|
577.9
|
|
624.2
|
|
2,762.9
|
|
(125.4
|
)
|
3,839.6
|
|
|||||||||
|
Long-Term Liabilities:
|
|||||||||||||||||||
|
Long-term debt
|
1,925.3
|
|
—
|
|
6.4
|
|
—
|
|
1,931.7
|
|
|||||||||
|
Intercompany loans payable
|
221.6
|
|
23.5
|
|
946.8
|
|
(1,191.9
|
)
|
—
|
|
|||||||||
|
Other
|
307.1
|
|
22.1
|
|
312.7
|
|
(25.1
|
)
|
616.8
|
|
|||||||||
|
Total long-term liabilities
|
2,454.0
|
|
45.6
|
|
1,265.9
|
|
(1,217.0
|
)
|
2,548.5
|
|
|||||||||
|
Equity:
|
|||||||||||||||||||
|
Lear Corporation stockholders’ equity
|
2,927.4
|
|
3,269.9
|
|
1,717.8
|
|
(4,987.7
|
)
|
2,927.4
|
|
|||||||||
|
Noncontrolling interests
|
—
|
|
—
|
|
90.3
|
|
—
|
|
90.3
|
|
|||||||||
|
Equity
|
2,927.4
|
|
3,269.9
|
|
1,808.1
|
|
(4,987.7
|
)
|
3,017.7
|
|
|||||||||
|
Total liabilities and equity
|
$
|
5,959.3
|
|
$
|
3,939.7
|
|
$
|
5,836.9
|
|
$
|
(6,330.1
|
)
|
$
|
9,405.8
|
|
||||
99
Lear Corporation and Subsidiaries
Notes to Consolidated Financial Statements (continued)
(16) Supplemental Guarantor Consolidating Financial Statements
|
Year Ended December 31, 2016
|
|||||||||||||||||||
|
(in millions)
|
Lear
|
Guarantors
|
Non-
Guarantors
|
Eliminations
|
Consolidated
|
||||||||||||||
|
Net sales
|
$
|
3,595.1
|
|
$
|
4,843.0
|
|
$
|
15,415.9
|
|
$
|
(5,296.4
|
)
|
$
|
18,557.6
|
|
||||
|
Cost of sales
|
3,598.6
|
|
4,131.0
|
|
14,022.3
|
|
(5,296.4
|
)
|
16,455.5
|
|
|||||||||
|
Selling, general and administrative expenses
|
332.7
|
|
8.4
|
|
280.8
|
|
—
|
|
621.9
|
|
|||||||||
|
Intercompany operating (income) expense, net
|
(398.7
|
)
|
236.0
|
|
162.7
|
|
—
|
|
—
|
|
|||||||||
|
Amortization of intangible assets
|
8.2
|
|
16.0
|
|
28.8
|
|
—
|
|
53.0
|
|
|||||||||
|
Interest expense
|
92.4
|
|
(4.6
|
)
|
(5.3
|
)
|
—
|
|
82.5
|
|
|||||||||
|
Other expense, net
|
37.1
|
|
2.5
|
|
(33.2
|
)
|
—
|
|
6.4
|
|
|||||||||
|
Consolidated income before provision for income taxes and equity in net income of affiliates and subsidiaries
|
(75.2
|
)
|
453.7
|
|
959.8
|
|
—
|
|
1,338.3
|
|
|||||||||
|
Provision for income taxes
|
(29.7
|
)
|
170.2
|
|
229.7
|
|
—
|
|
370.2
|
|
|||||||||
|
Equity in net income of affiliates
|
(4.2
|
)
|
—
|
|
(68.2
|
)
|
—
|
|
(72.4
|
)
|
|||||||||
|
Equity in net income of subsidiaries
|
(1,016.4
|
)
|
(530.1
|
)
|
—
|
|
1,546.5
|
|
—
|
|
|||||||||
|
Consolidated net income
|
975.1
|
|
813.6
|
|
798.3
|
|
(1,546.5
|
)
|
1,040.5
|
|
|||||||||
|
Less: Net income attributable to noncontrolling interests
|
—
|
|
—
|
|
65.4
|
|
—
|
|
65.4
|
|
|||||||||
|
Net income attributable to Lear
|
$
|
975.1
|
|
$
|
813.6
|
|
$
|
732.9
|
|
$
|
(1,546.5
|
)
|
$
|
975.1
|
|
||||
|
Consolidated comprehensive income
|
$
|
869.6
|
|
$
|
813.3
|
|
$
|
662.2
|
|
$
|
(1,418.7
|
)
|
$
|
926.4
|
|
||||
|
Less: Comprehensive income attributable to noncontrolling interests
|
—
|
|
—
|
|
56.8
|
|
—
|
|
56.8
|
|
|||||||||
|
Comprehensive income attributable to Lear
|
$
|
869.6
|
|
$
|
813.3
|
|
$
|
605.4
|
|
$
|
(1,418.7
|
)
|
$
|
869.6
|
|
||||
|
Year Ended December 31, 2015
|
|||||||||||||||||||
|
(in millions)
|
Lear
|
Guarantors
|
Non-
Guarantors
|
Eliminations
|
Consolidated
|
||||||||||||||
|
Net sales
|
$
|
3,540.6
|
|
$
|
5,117.9
|
|
$
|
14,793.6
|
|
$
|
(5,240.7
|
)
|
$
|
18,211.4
|
|
||||
|
Cost of sales
|
3,544.6
|
|
4,483.9
|
|
13,603.8
|
|
(5,240.7
|
)
|
16,391.6
|
|
|||||||||
|
Selling, general and administrative expenses
|
274.0
|
|
47.7
|
|
258.8
|
|
—
|
|
580.5
|
|
|||||||||
|
Intercompany operating (income) expense, net
|
(297.0
|
)
|
158.4
|
|
138.6
|
|
—
|
|
—
|
|
|||||||||
|
Amortization of intangible assets
|
6.6
|
|
16.0
|
|
29.9
|
|
—
|
|
52.5
|
|
|||||||||
|
Interest expense
|
96.7
|
|
(2.8
|
)
|
(7.2
|
)
|
—
|
|
86.7
|
|
|||||||||
|
Other expense, net
|
25.8
|
|
1.0
|
|
41.8
|
|
—
|
|
68.6
|
|
|||||||||
|
Consolidated income before provision for income taxes and equity in net income of affiliates and subsidiaries
|
(110.1
|
)
|
413.7
|
|
727.9
|
|
—
|
|
1,031.5
|
|
|||||||||
|
Provision for income taxes
|
(53.6
|
)
|
155.6
|
|
183.5
|
|
—
|
|
285.5
|
|
|||||||||
|
Equity in net income of affiliates
|
(0.2
|
)
|
—
|
|
(49.6
|
)
|
—
|
|
(49.8
|
)
|
|||||||||
|
Equity in net income of subsidiaries
|
(801.8
|
)
|
(394.3
|
)
|
—
|
|
1,196.1
|
|
—
|
|
|||||||||
|
Consolidated net income
|
745.5
|
|
652.4
|
|
594.0
|
|
(1,196.1
|
)
|
795.8
|
|
|||||||||
|
Less: Net income attributable to noncontrolling interests
|
—
|
|
—
|
|
50.3
|
|
—
|
|
50.3
|
|
|||||||||
|
Net income attributable to Lear
|
$
|
745.5
|
|
$
|
652.4
|
|
$
|
543.7
|
|
$
|
(1,196.1
|
)
|
$
|
745.5
|
|
||||
|
Consolidated comprehensive income
|
$
|
517.4
|
|
$
|
634.5
|
|
$
|
366.8
|
|
$
|
(954.9
|
)
|
$
|
563.8
|
|
||||
|
Less: Comprehensive income attributable to noncontrolling interests
|
—
|
|
—
|
|
46.4
|
|
—
|
|
46.4
|
|
|||||||||
|
Comprehensive income attributable to Lear
|
$
|
517.4
|
|
$
|
634.5
|
|
$
|
320.4
|
|
$
|
(954.9
|
)
|
$
|
517.4
|
|
||||
100
Lear Corporation and Subsidiaries
Notes to Consolidated Financial Statements (continued)
(16) Supplemental Guarantor Consolidating Financial Statements
|
Year Ended December 31, 2014
|
|||||||||||||||||||
|
(in millions)
|
Lear
|
Guarantors
|
Non-
guarantors
|
Eliminations
|
Consolidated
|
||||||||||||||
|
Net sales
|
$
|
3,285.0
|
|
$
|
4,268.5
|
|
$
|
14,996.5
|
|
$
|
(4,822.7
|
)
|
$
|
17,727.3
|
|
||||
|
Cost of sales
|
3,300.4
|
|
3,830.9
|
|
13,925.9
|
|
(4,822.7
|
)
|
16,234.5
|
|
|||||||||
|
Selling, general and administrative expenses
|
241.1
|
|
22.6
|
|
266.2
|
|
—
|
|
529.9
|
|
|||||||||
|
Intercompany operating (income) expense, net
|
(376.6
|
)
|
215.6
|
|
161.0
|
|
—
|
|
—
|
|
|||||||||
|
Amortization of intangible assets
|
6.4
|
|
—
|
|
27.3
|
|
—
|
|
33.7
|
|
|||||||||
|
Interest expense
|
74.5
|
|
(3.3
|
)
|
(3.7
|
)
|
—
|
|
67.5
|
|
|||||||||
|
Other expense, net
|
26.5
|
|
1.0
|
|
46.8
|
|
—
|
|
74.3
|
|
|||||||||
|
Consolidated income before provision for income taxes and equity in net income of affiliates and subsidiaries
|
12.7
|
|
201.7
|
|
573.0
|
|
—
|
|
787.4
|
|
|||||||||
|
Provision for income taxes
|
1.0
|
|
71.6
|
|
48.8
|
|
—
|
|
121.4
|
|
|||||||||
|
Equity in net income of affiliates
|
(1.1
|
)
|
—
|
|
(35.2
|
)
|
—
|
|
(36.3
|
)
|
|||||||||
|
Equity in net income of subsidiaries
|
(659.6
|
)
|
(393.8
|
)
|
—
|
|
1,053.4
|
|
—
|
|
|||||||||
|
Consolidated net income
|
672.4
|
|
523.9
|
|
559.4
|
|
(1,053.4
|
)
|
702.3
|
|
|||||||||
|
Less: Net income attributable to noncontrolling interests
|
—
|
|
—
|
|
29.9
|
|
—
|
|
29.9
|
|
|||||||||
|
Net income attributable to Lear
|
$
|
672.4
|
|
$
|
523.9
|
|
$
|
529.5
|
|
$
|
(1,053.4
|
)
|
$
|
672.4
|
|
||||
|
Consolidated comprehensive income
|
$
|
336.5
|
|
$
|
497.1
|
|
$
|
318.6
|
|
$
|
(787.7
|
)
|
$
|
364.5
|
|
||||
|
Less: Comprehensive income attributable to noncontrolling interests
|
—
|
|
—
|
|
28.0
|
|
—
|
|
28.0
|
|
|||||||||
|
Comprehensive income attributable to Lear
|
$
|
336.5
|
|
$
|
497.1
|
|
$
|
290.6
|
|
$
|
(787.7
|
)
|
$
|
336.5
|
|
||||
101
Lear Corporation and Subsidiaries
Notes to Consolidated Financial Statements (continued)
(16) Supplemental Guarantor Consolidating Financial Statements
|
Year Ended December 31, 2016
|
|||||||||||||||||||
|
(in millions)
|
Lear
|
Guarantors
|
Non-
guarantors
|
Eliminations
|
Consolidated
|
||||||||||||||
|
Net Cash Provided by Operating Activities
|
$
|
290.9
|
|
$
|
345.3
|
|
$
|
1,035.9
|
|
$
|
(52.8
|
)
|
$
|
1,619.3
|
|
||||
|
Cash Flows from Investing Activities:
|
|
||||||||||||||||||
|
Additions to property, plant and equipment
|
(77.6
|
)
|
(111.0
|
)
|
(339.7
|
)
|
—
|
|
(528.3
|
)
|
|||||||||
|
Acquisitions
|
(149.0
|
)
|
—
|
|
(6.9
|
)
|
—
|
|
(155.9
|
)
|
|||||||||
|
Intercompany transactions
|
437.4
|
|
214.8
|
|
(13.4
|
)
|
(638.8
|
)
|
—
|
|
|||||||||
|
Other, net
|
(16.8
|
)
|
(1.4
|
)
|
65.3
|
|
—
|
|
47.1
|
|
|||||||||
|
Net cash used in investing activities
|
194.0
|
|
102.4
|
|
(294.7
|
)
|
(638.8
|
)
|
(637.1
|
)
|
|||||||||
|
Cash Flows from Financing Activities:
|
|
||||||||||||||||||
|
Credit agreement repayments
|
(21.9
|
)
|
—
|
|
—
|
|
—
|
|
(21.9
|
)
|
|||||||||
|
Short-term borrowings, net
|
—
|
|
—
|
|
9.1
|
|
—
|
|
9.1
|
|
|||||||||
|
Repurchase of common stock
|
(658.8
|
)
|
—
|
|
—
|
|
—
|
|
(658.8
|
)
|
|||||||||
|
Dividends paid to Lear Corporation stockholders
|
(88.8
|
)
|
—
|
|
—
|
|
—
|
|
(88.8
|
)
|
|||||||||
|
Dividends paid to noncontrolling interests
|
—
|
|
—
|
|
(33.3
|
)
|
—
|
|
(33.3
|
)
|
|||||||||
|
Change in intercompany accounts
|
283.3
|
|
(447.8
|
)
|
(527.1
|
)
|
691.6
|
|
—
|
|
|||||||||
|
Other, net
|
(44.7
|
)
|
—
|
|
(34.5
|
)
|
—
|
|
(79.2
|
)
|
|||||||||
|
Net cash used in financing activities
|
(530.9
|
)
|
(447.8
|
)
|
(585.8
|
)
|
691.6
|
|
(872.9
|
)
|
|||||||||
|
Effect of foreign currency translation
|
—
|
|
—
|
|
(34.3
|
)
|
—
|
|
(34.3
|
)
|
|||||||||
|
Net Change in Cash and Cash Equivalents
|
(46.0
|
)
|
(0.1
|
)
|
121.1
|
|
—
|
|
75.0
|
|
|||||||||
|
Cash and Cash Equivalents as of Beginning of Period
|
526.4
|
|
0.4
|
|
669.8
|
|
—
|
|
1,196.6
|
|
|||||||||
|
Cash and Cash Equivalents as of End of Period
|
$
|
480.4
|
|
$
|
0.3
|
|
$
|
790.9
|
|
$
|
—
|
|
$
|
1,271.6
|
|
||||
102
Lear Corporation and Subsidiaries
Notes to Consolidated Financial Statements (continued)
(16) Supplemental Guarantor Consolidating Financial Statements
|
Year Ended December 31, 2015
|
|||||||||||||||||||
|
(in millions)
|
Lear
|
Guarantors
|
Non-
guarantors
|
Eliminations
|
Consolidated
|
||||||||||||||
|
Net Cash Provided by Operating Activities
|
$
|
208.3
|
|
$
|
329.5
|
|
$
|
889.6
|
|
$
|
(156.3
|
)
|
$
|
1,271.1
|
|
||||
|
Cash Flows from Investing Activities:
|
|
||||||||||||||||||
|
Additions to property, plant and equipment
|
(68.4
|
)
|
(91.5
|
)
|
(325.9
|
)
|
—
|
|
(485.8
|
)
|
|||||||||
|
Acquisitions, net of cash acquired and use of $350 million restricted cash (see non-cash investing activities below) (Note 3)
|
(521.1
|
)
|
1.2
|
|
20.7
|
|
—
|
|
(499.2
|
)
|
|||||||||
|
Intercompany transactions
|
584.6
|
|
(267.9
|
)
|
134.9
|
|
(451.6
|
)
|
—
|
|
|||||||||
|
Other, net
|
(6.6
|
)
|
7.3
|
|
19.0
|
|
—
|
|
19.7
|
|
|||||||||
|
Net cash used in investing activities
|
(11.5
|
)
|
(350.9
|
)
|
(151.3
|
)
|
(451.6
|
)
|
(965.3
|
)
|
|||||||||
|
Cash Flows from Financing Activities:
|
|
||||||||||||||||||
|
Credit agreement borrowings
|
500.0
|
|
—
|
|
—
|
|
—
|
|
500.0
|
|
|||||||||
|
Credit agreement repayments
|
(9.4
|
)
|
—
|
|
—
|
|
—
|
|
(9.4
|
)
|
|||||||||
|
Repurchase of senior notes, net of use of $250 million restricted cash (see non-cash financing activities below) (Note 6)
|
(5.0
|
)
|
—
|
|
—
|
|
—
|
|
(5.0
|
)
|
|||||||||
|
Repurchase of common stock
|
(487.4
|
)
|
—
|
|
—
|
|
—
|
|
(487.4
|
)
|
|||||||||
|
Dividends paid to Lear Corporation stockholders
|
(78.5
|
)
|
—
|
|
—
|
|
—
|
|
(78.5
|
)
|
|||||||||
|
Dividends paid to noncontrolling interests
|
—
|
|
—
|
|
(27.8
|
)
|
—
|
|
(27.8
|
)
|
|||||||||
|
Intercompany transactions
|
82.7
|
|
21.8
|
|
(712.4
|
)
|
607.9
|
|
—
|
|
|||||||||
|
Other, net
|
(50.6
|
)
|
—
|
|
2.4
|
|
—
|
|
(48.2
|
)
|
|||||||||
|
Net cash used in financing activities
|
(48.2
|
)
|
21.8
|
|
(737.8
|
)
|
607.9
|
|
(156.3
|
)
|
|||||||||
|
Effect of foreign currency translation
|
—
|
|
—
|
|
(47.0
|
)
|
—
|
|
(47.0
|
)
|
|||||||||
|
Net Change in Cash and Cash Equivalents
|
148.6
|
|
0.4
|
|
(46.5
|
)
|
—
|
|
102.5
|
|
|||||||||
|
Cash and Cash Equivalents as of Beginning of Period
|
377.8
|
|
—
|
|
716.3
|
|
—
|
|
1,094.1
|
|
|||||||||
|
Cash and Cash Equivalents as of End of Period
|
$
|
526.4
|
|
$
|
0.4
|
|
$
|
669.8
|
|
$
|
—
|
|
$
|
1,196.6
|
|
||||
|
Non-cash Investing Activities:
|
|||||||||||||||||||
|
Cash restricted for use - acquisition of Eagle Ottawa
|
$
|
(350.0
|
)
|
$
|
—
|
|
$
|
—
|
|
$
|
—
|
|
$
|
(350.0
|
)
|
||||
|
Non-cash Financing Activities:
|
|||||||||||||||||||
|
Cash restricted for use - repurchase of senior notes
|
$
|
(250.0
|
)
|
$
|
—
|
|
$
|
—
|
|
$
|
—
|
|
$
|
(250.0
|
)
|
||||
103
Lear Corporation and Subsidiaries
Notes to Consolidated Financial Statements (continued)
(16) Supplemental Guarantor Consolidating Financial Statements
|
Year Ended December 31, 2014
|
|||||||||||||||||||
|
(in millions)
|
Lear
|
Guarantors
|
Non-
guarantors
|
Eliminations
|
Consolidated
|
||||||||||||||
|
Net Cash Provided by Operating Activities
|
$
|
142.4
|
|
$
|
211.8
|
|
$
|
586.2
|
|
$
|
(12.6
|
)
|
$
|
927.8
|
|
||||
|
Cash Flows from Investing Activities:
|
|
||||||||||||||||||
|
Additions to property, plant and equipment
|
(52.4
|
)
|
(61.4
|
)
|
(310.9
|
)
|
—
|
|
(424.7
|
)
|
|||||||||
|
Cash restricted for use - acquisition of Eagle Ottawa
|
(350.0
|
)
|
—
|
|
—
|
|
—
|
|
(350.0
|
)
|
|||||||||
|
Intercompany transactions
|
400.5
|
|
(17.0
|
)
|
(46.3
|
)
|
(337.2
|
)
|
—
|
|
|||||||||
|
Other, net
|
(5.0
|
)
|
13.3
|
|
(14.2
|
)
|
—
|
|
(5.9
|
)
|
|||||||||
|
Net cash used in investing activities
|
(6.9
|
)
|
(65.1
|
)
|
(371.4
|
)
|
(337.2
|
)
|
(780.6
|
)
|
|||||||||
|
Cash Flows from Financing Activities:
|
|
||||||||||||||||||
|
Proceeds from the issuance of senior notes
|
975.0
|
|
—
|
|
—
|
|
—
|
|
975.0
|
|
|||||||||
|
Repurchase of senior notes
|
(327.1
|
)
|
—
|
|
—
|
|
—
|
|
(327.1
|
)
|
|||||||||
|
Payment of debt issuance and other financing costs
|
(18.1
|
)
|
—
|
|
—
|
|
—
|
|
(18.1
|
)
|
|||||||||
|
Cash restricted for use - repurchase of senior notes
|
(250.0
|
)
|
—
|
|
—
|
|
—
|
|
(250.0
|
)
|
|||||||||
|
Repurchase of common stock
|
(411.4
|
)
|
—
|
|
—
|
|
—
|
|
(411.4
|
)
|
|||||||||
|
Dividends paid to Lear Corporation stockholders
|
(65.3
|
)
|
—
|
|
—
|
|
—
|
|
(65.3
|
)
|
|||||||||
|
Dividends paid to noncontrolling interests
|
—
|
|
—
|
|
(25.9
|
)
|
—
|
|
(25.9
|
)
|
|||||||||
|
Change in intercompany accounts
|
15.9
|
|
(146.8
|
)
|
(218.9
|
)
|
349.8
|
|
—
|
|
|||||||||
|
Other, net
|
(20.2
|
)
|
—
|
|
(17.8
|
)
|
—
|
|
(38.0
|
)
|
|||||||||
|
Net cash used in financing activities
|
(101.2
|
)
|
(146.8
|
)
|
(262.6
|
)
|
349.8
|
|
(160.8
|
)
|
|||||||||
|
Effect of foreign currency translation
|
—
|
|
—
|
|
(30.0
|
)
|
—
|
|
(30.0
|
)
|
|||||||||
|
Net Change in Cash and Cash Equivalents
|
34.3
|
|
(0.1
|
)
|
(77.8
|
)
|
—
|
|
(43.6
|
)
|
|||||||||
|
Cash and Cash Equivalents as of Beginning of Period
|
343.5
|
|
0.1
|
|
794.1
|
|
—
|
|
1,137.7
|
|
|||||||||
|
Cash and Cash Equivalents as of End of Period
|
$
|
377.8
|
|
$
|
—
|
|
$
|
716.3
|
|
$
|
—
|
|
$
|
1,094.1
|
|
||||
104
Lear Corporation and Subsidiaries
Notes to Consolidated Financial Statements (continued)
(16) Supplemental Guarantor Consolidating Financial Statements
Basis of Presentation
Certain of the Company’s domestic
100%
owned subsidiaries (the "Guarantors") have jointly and severally unconditionally guaranteed, on a senior unsecured basis, the performance and the full and punctual payment when due, whether at stated maturity, by acceleration or otherwise, of the Company’s obligations under the Credit Agreement and the indentures governing the Notes, including the Company’s obligations to pay principal, premium, if any, and interest with respect to the Notes. The Notes consist of
$500 million
in aggregate principal amount of
4.75%
senior unsecured notes due 2023,
$325 million
in aggregate principal amount of
5.375%
senior unsecured notes due 2024 and
$650 million
in aggregate principal amount of
5.25%
senior unsecured noted due 2025.
The Guarantors include Lear Corporation EEDS and Interiors and Lear Mexican Seating Corporation. In 2016, Guilford Mills, LLC and Lear Operations Corporation (previously guarantors) merged into Lear, and Eagle Ottawa North America, LLC was released as a guarantor. In lieu of providing separate financial statements for the Guarantors, the Company has included the supplemental guarantor consolidating financial statements above. These financial statements reflect the Guarantors listed above for all periods presented. Management does not believe that separate financial statements of the Guarantors are material to investors. Therefore, separate financial statements and other disclosures concerning the Guarantors are not presented.
The supplemental guarantor consolidating financial statements have been restated to reflect changes in the Guarantor entities, as well as certain changes to the equity investments of the Guarantors in
2015
and
2014
.
Distributions
There are no significant restrictions on the ability of the Guarantors to make distributions to the Company.
Selling, General and Administrative Expenses
Corporate and division selling, general and administrative expenses are allocated to the operating subsidiaries based on various factors, which estimate usage of particular corporate and division functions, and in certain instances, other relevant factors, such as the revenues or the number of employees of the Company’s subsidiaries. For the years ended
December 31, 2016
,
2015
and
2014
,
$87.1 million
,
$77.2 million
and
$77.7 million
, respectively, of selling, general and administrative expenses were allocated from Lear.
Long-Term Debt of Lear and the Guarantors
A summary of long-term debt of Lear and the Guarantors on a combined basis is shown below (in millions):
|
December 31,
|
2016
|
2015
|
|||||
|
Credit agreement
|
$
|
467.1
|
|
$
|
488.4
|
|
|
|
Senior notes
|
1,460.8
|
|
1,458.8
|
|
|||
|
1,927.9
|
|
1,947.2
|
|
||||
|
Less — Current portion
|
(34.4
|
)
|
(21.9
|
)
|
|||
|
Long-term debt
|
$
|
1,893.5
|
|
$
|
1,925.3
|
|
|
105
LEAR CORPORATION AND SUBSIDIARIES
SCHEDULE II – VALUATION AND QUALIFYING ACCOUNTS
(In millions)
|
Balance
as of Beginning
of Period
|
Additions
|
Retirements
|
Other
Changes
|
Balance
as of End
of Period
|
|||||||||||||||
|
For the year ended December 31, 2016
|
|||||||||||||||||||
|
Valuation of accounts deducted from related assets:
|
|||||||||||||||||||
|
Allowance for doubtful accounts
|
$
|
34.4
|
|
$
|
12.0
|
|
$
|
(12.7
|
)
|
$
|
(0.9
|
)
|
$
|
32.8
|
|
||||
|
Allowance for deferred tax assets
|
495.7
|
|
8.6
|
|
(53.6
|
)
|
(5.1
|
)
|
445.6
|
|
|||||||||
|
Total
|
$
|
530.1
|
|
$
|
20.6
|
|
$
|
(66.3
|
)
|
$
|
(6.0
|
)
|
$
|
478.4
|
|
||||
|
Balance
as of Beginning
of Period
|
Additions
|
Retirements
|
Other
Changes
|
Balance
as of End
of Period
|
|||||||||||||||
|
For the year ended December 31, 2015
|
|||||||||||||||||||
|
Valuation of accounts deducted from related assets:
|
|||||||||||||||||||
|
Allowance for doubtful accounts
|
$
|
27.5
|
|
$
|
14.1
|
|
$
|
(4.5
|
)
|
$
|
(2.7
|
)
|
$
|
34.4
|
|
||||
|
Allowance for deferred tax assets
|
508.5
|
|
51.9
|
|
(25.9
|
)
|
(38.8
|
)
|
495.7
|
|
|||||||||
|
Total
|
$
|
536.0
|
|
$
|
66.0
|
|
$
|
(30.4
|
)
|
$
|
(41.5
|
)
|
$
|
530.1
|
|
||||
|
Balance
as of Beginning
of Period
|
Additions
|
Retirements
|
Other
Changes
|
Balance
as of End
of Period
|
|||||||||||||||
|
For the year ended December 31, 2014
|
|||||||||||||||||||
|
Valuation of accounts deducted from related assets:
|
|||||||||||||||||||
|
Allowance for doubtful accounts
|
$
|
34.5
|
|
$
|
7.6
|
|
$
|
(10.0
|
)
|
$
|
(4.6
|
)
|
$
|
27.5
|
|
||||
|
Allowance for deferred tax assets
|
642.6
|
|
41.3
|
|
(117.0
|
)
|
(58.4
|
)
|
508.5
|
|
|||||||||
|
Total
|
$
|
677.1
|
|
$
|
48.9
|
|
$
|
(127.0
|
)
|
$
|
(63.0
|
)
|
$
|
536.0
|
|
||||
106
ACCOUNTING AND FINANCIAL DISCLOSURE
None.
|
(a)
|
Disclosure Controls and Procedures
|
The Company has evaluated, under the supervision and with the participation of the Company’s management, including the Company’s President and Chief Executive Officer along with the Company’s Senior Vice President and Chief Financial Officer, the effectiveness of the Company’s disclosure controls and procedures (as defined in Rules 13a-15(e) and 15d-15(e) under the Securities Exchange Act of 1934, as amended (the "Exchange Act")) as of the end of the period covered by this Report. The Company’s disclosure controls and procedures are designed to provide reasonable assurance of achieving their objectives. Because of the inherent limitations in all control systems, no evaluation of controls can provide absolute assurance that all control issues and instances of fraud, if any, within the Company have been detected. Based on the evaluation described above, the Company’s President and Chief Executive Officer along with the Company’s Senior Vice President and Chief Financial Officer have concluded that the Company’s disclosure controls and procedures were effective to provide reasonable assurance that the desired control objectives were achieved as of the end of the period covered by this Report.
|
(b)
|
Management’s Annual Report on Internal Control over Financial Reporting
|
The Company’s management is responsible for establishing and maintaining adequate internal control over financial reporting, as such term is defined in Exchange Act Rule 13a-15(f). Under the supervision and with the participation of the Company’s management, including the Company’s President and Chief Executive Officer along with the Company’s Senior Vice President and Chief Financial Officer, the Company conducted an evaluation of the effectiveness of internal control over financial reporting based on the Internal Control-Integrated Framework issued by the Committee of Sponsoring Organizations of the Treadway Commission (2013 framework). Based on this evaluation, management concluded that the Company’s internal control over financial reporting was effective as of
December 31, 2016
.
|
(c)
|
Attestation Report of the Registered Public Accounting Firm
|
The attestation report of the Company’s independent registered public accounting firm regarding internal control over financial reporting is set forth in Item 8, "Consolidated Financial Statements and Supplementary Data," under the caption "Report of Independent Registered Public Accounting Firm on Internal Control over Financial Reporting" and incorporated herein by reference.
|
(d)
|
Changes in Internal Control over Financial Reporting
|
There was no change in the Company’s internal control over financial reporting that occurred during the fiscal quarter ended
December 31, 2016
, that has materially affected, or is reasonably likely to materially affect, the Company’s internal control over financial reporting.
None.
107
The information required by Item 10 regarding our directors and corporate governance matters is incorporated by reference herein to the Proxy Statement sections entitled "Election of Directors" and "Directors and Corporate Governance." The information required by Item 10 regarding our executive officers appears as a supplementary item following Item 4 under Part I of this Report. The information required by Item 10 regarding compliance with section 16(a) of the Securities Exchange Act of 1934, as amended, is incorporated by reference herein to the Proxy Statement section entitled "Directors and Corporate Governance — Section 16(a) Beneficial Ownership Reporting Compliance."
Code of Ethics
We have adopted a code of ethics that applies to our executive officers, including our Principal Executive Officer, our Principal Financial Officer and our Principal Accounting Officer. This code of ethics is entitled "Specific Provisions for Executive Officers" within our Code of Business Conduct and Ethics, which can be found on our website at http://www.lear.com. We will post any amendment to or waiver from the provisions of the Code of Business Conduct and Ethics that applies to the executive officers above on the same website and will provide it to shareholders free of charge upon written request by contacting Lear Corporation at 21557 Telegraph Road, Southfield, Michigan 48033, Attention: Investor Relations.
The information required by Item 11 is incorporated by reference herein to the Proxy Statement sections entitled "Directors and Corporate Governance — Director Compensation," "Compensation Discussion and Analysis," "Executive Compensation," "Compensation Committee Interlocks and Insider Participation" and "Compensation Committee Report." Notwithstanding anything indicating the contrary set forth in this Report, the "Compensation Committee Report" section of the Proxy Statement shall be deemed to be "furnished" not "filed" for purposes of the Securities Exchange Act of 1934, as amended.
RELATED STOCKHOLDER MATTERS
Except as set forth herein, the information required by Item 12 is incorporated by reference herein to the Proxy Statement section entitled "Directors and Corporate Governance — Security Ownership of Certain Beneficial Owners, Directors and Management."
Equity Compensation Plan Information
|
As of December 31, 2016
|
Number of securities to be
issued upon exercise of
outstanding options,
warrants and rights
(a)
|
Weighted average
exercise price of
outstanding options,
warrants and rights
(b)
|
Number of securities
available for future
issuance under equity
compensation plans
(excluding securities
reflected in column (a))
(c)
|
||||||
|
Equity compensation plans approved by security holders
|
2,078,196
|
|
(1)
|
$
|
—
|
|
(2)
|
3,249,539
|
|
|
Equity compensation plans not approved by security holders
|
—
|
|
—
|
|
—
|
|
|||
|
Total
|
2,078,196
|
|
$
|
—
|
|
3,249,539
|
|
||
|
(1)
|
Includes
623,142
of outstanding restricted stock units and
1,455,054
of outstanding performance shares. Outstanding performance shares are reflected at the maximum possible payout that may be earned during the relevant performance periods.
|
|
(2)
|
Reflects outstanding restricted stock units and performance shares at a weighted average price of zero.
|
108
The information required by Item 13 is incorporated by reference herein to the Proxy Statement sections entitled "Certain Relationships and Related Party Transactions" and "Directors and Corporate Governance — Independence of Directors."
The information required by Item 14 is incorporated by reference herein to the Proxy Statement section entitled "Fees of Independent Accountants."
The following documents are filed as part of this Form 10-K.
|
(a)
|
1. Consolidated Financial Statements:
|
Reports of Ernst & Young LLP, Independent Registered Public Accounting Firm
Consolidated Balance Sheets as of
December 31, 2016
and
2015
Consolidated Statements of Income for the years ended
December 31, 2016
,
2015
and
2014
Consolidated Statements of Comprehensive Income for the years ended
December 31, 2016
,
2015
and
2014
Consolidated Statements of Equity for the years ended
December 31, 2016
,
2015
and
2014
Consolidated Statements of Cash Flows for the years ended
December 31, 2016
,
2015
and
2014
Notes to Consolidated Financial Statements
2. Financial Statement Schedule:
Schedule II — Valuation and Qualifying Accounts
All other financial statement schedules are omitted because such schedules are not required or the information required has been presented in the aforementioned financial statements.
|
3.
|
The exhibits listed on the "Index to Exhibits" on pages 111 through 113 are filed with this Form 10-K or incorporated by reference as set forth below.
|
|
(b)
|
The exhibits listed on the "Index to Exhibits" on pages 111 through 113 are filed with this Form 10-K or incorporated by reference as set forth below.
|
|
(c)
|
Additional Financial Statement Schedules
|
None.
109
Signatures
Pursuant to the requirements of Section 13 or 15(d) of the Securities Exchange Act of 1934, as amended, the registrant has duly caused this Report to be signed on its behalf by the undersigned, thereunto duly authorized on
February 7, 2017
.
|
Lear Corporation
|
||
|
By:
|
|
/s/ Matthew J. Simoncini
|
|
|
Matthew J. Simoncini
|
|
|
|
President and Chief Executive Officer and a Director (Principal Executive Officer)
|
|
Pursuant to the requirements of the Securities Exchange Act of 1934, as amended, this Report has been signed below by the following persons on behalf of Lear Corporation and in the capacities indicated on
February 7, 2017
.
|
/s/ Matthew J. Simoncini
|
|
/s/ Dr. Mary Lou Jepsen
|
|
Matthew J. Simoncini
|
|
Dr. Mary Lou Jepsen
|
|
President and Chief Executive Officer and a Director
|
|
a Director
|
|
(Principal Executive Officer)
|
|
|
|
/s/ Jeffrey H. Vanneste
|
|
/s/ Kathleen A. Ligocki
|
|
Jeffrey H. Vanneste
|
|
Kathleen A. Ligocki
|
|
Senior Vice President and Chief Financial Officer
|
|
a Director
|
|
(Principal Financial Officer )
|
|
|
|
/s/ James L. Murawski
|
|
/s/ Conrad L. Mallett, Jr.
|
|
James L. Murawski
|
|
Conrad L. Mallett, Jr.
|
|
Vice President, Corporate Controller and Chief
|
|
a Director
|
|
Accounting Officer (Principal Accounting Officer)
|
||
|
/s/ Richard H. Bott
|
|
/s/ Donald L. Runkle
|
|
Richard H. Bott
|
|
Donald L. Runkle
|
|
a Director
|
|
a Director
|
|
/s/ Thomas P. Capo
|
|
/s/ Gregory C. Smith
|
|
Thomas P. Capo
|
|
Gregory C. Smith
|
|
a Director
|
|
a Director
|
|
/s/ Jonathan F. Foster
|
|
/s/ Henry D.G. Wallace
|
|
Jonathan F. Foster
|
|
Henry D.G. Wallace
|
|
a Director
|
Non-Executive Chairman of the Board of Directors and
|
|
|
a Director
|
||
110
Index to Exhibits
|
Exhibit
Number
|
|
Exhibit
|
||
|
3.1
|
|
Amended and Restated Certificate of Incorporation of the Company (incorporated by reference to Exhibit 3.1 to the Company’s Current Report on Form 8-K dated November 9, 2009).
|
||
|
3.2
|
|
Amended and Restated Bylaws of the Company (incorporated by reference to Exhibit 3.2 to the Company’s Current Report on Form 8-K dated November 9, 2009).
|
||
|
4.1
|
|
Indenture, dated March 26, 2010, among the Company, the subsidiary guarantors party thereto and The Bank of New York Mellon Trust Company, N.A., as Trustee (incorporated by reference to Exhibit 4.1 to the Company’s Current Report on Form 8-K dated March 23, 2010).
|
||
|
4.2
|
|
Third Supplemental Indenture, dated as of January 17, 2013, by and among Lear Corporation, the Subsidiary Guarantors party thereto and The Bank of New York Mellon Trust Company, N.A. (incorporated by reference to Exhibit 4.1 to the Company’s Current Report on Form 8-K dated January 14, 2013).
|
||
|
4.3
|
|
Fourth Supplemental Indenture, dated as of March 14, 2014, by and among Lear Corporation, the Subsidiary Guarantors party thereto and The Bank of New York Mellon Trust Company, N.A. (incorporated by reference to Exhibit 4.1 to the Company’s Current Report on Form 8-K dated March 11, 2014).
|
||
|
4.4
|
|
Fifth Supplemental Indenture, dated November 21, 2014, among the Company, the Subsidiary Guarantors party thereto and The Bank of New York Mellon Trust Company, N.A. (incorporated by reference to Exhibit 4.1 to the Company’s Current Report on Form 8-K dated November 21, 2014).
|
||
|
4.5
|
|
Sixth Supplemental Indenture, dated June 25, 2015, among the Company, the Subsidiary Guarantors party thereto and The Bank of New York Mellon Trust Company, N.A., as Trustee (incorporated by reference to Exhibit 4.1 to the Company’s Quarterly Report on Form 10-Q for the quarter ended June 27, 2015).
|
||
|
10.1
|
|
Amended and Restated Credit Agreement, dated as of November 14, 2014, among the Company, the lenders party thereto and JPMorgan Chase Bank, N.A., as Administrative Agent (incorporated by reference to Exhibit 10.1 to the Company’s Current Report on Form 8-K dated November 14, 2014).
|
||
|
10.2
|
|
*
|
Lear Corporation 2009 Long-Term Stock Incentive Plan, amended and restated effective January 1, 2014 (incorporated by reference to Exhibit 10.2 to the Company’s Annual Report on Form 10-K for the year ended December 31, 2013).
|
|
|
10.3
|
|
*
|
Lear Corporation Pension Equalization Program, as amended through August 15, 2003 (incorporated by reference to Exhibit 10.37 to the Company’s Annual Report on Form 10-K for the year ended December 31, 2004).
|
|
|
10.4
|
|
*
|
First Amendment to the Lear Corporation Pension Equalization Program, dated as of December 21, 2006 (incorporated by reference to Exhibit 10.45 to the Company’s Annual Report on Form 10-K for the year ended December 31, 2006).
|
|
|
10.5
|
|
*
|
Second Amendment to the Lear Corporation Pension Equalization Program, dated as of May 9, 2007 (incorporated by reference to Exhibit 10.49 to the Company’s Annual Report on Form 10-K for the year ended December 31, 2007).
|
|
|
10.6
|
|
*
|
Third Amendment to the Lear Corporation Pension Equalization Program, effective as of December 18, 2007 (incorporated by reference to Exhibit 10.1 to the Company’s Current Report on Form 8-K dated December 18, 2007).
|
|
|
10.7
|
|
*
|
Lear Corporation Outside Directors Compensation Plan, amended and restated effective January 1, 2016 (incorporated by reference to Exhibit 10.7 to the Company’s Annual Report on Form 10-K for the year ended December 31, 2015).
|
|
|
10.8
|
|
*
|
Lear Corporation Outside Directors Compensation Plan – Form of Retainer and Stock Grant Deferral Elections (incorporated by reference to Exhibit 10.21 to the Company’s Annual Report on Form 10-K for the year ended December 31, 2011).
|
|
|
10.9
|
|
*
|
Form of 2014 Restricted Stock Unit Terms and Conditions under the Lear Corporation 2009 Long-Term Stock Incentive Plan (incorporated by reference to Exhibit 10.1 to the Company’s Quarterly Report on Form 10-Q for the quarter ended April 2, 2011).
|
|
111
|
10.10
|
|
*
|
Form of Performance Share Terms and Conditions under the Lear Corporation 2009 Long-Term Stock Incentive Plan (incorporated by reference to Exhibit 10.2 to the Company’s Quarterly Report on Form 10-Q for the quarter ended April 2, 2011).
|
|
|
10.11
|
|
*
|
Form of 2016 Restricted Stock Unit Terms and Conditions under the Lear Corporation 2009 Long-Term Stock Incentive Plan (incorporated by reference to Exhibit 10.11 to the Company’s Annual Report on Form 10-K for the year ended December 31, 2015).
|
|
|
10.12
|
|
*
|
Form of 2016 Performance Share Terms and Conditions under the Lear Corporation 2009 Long-Term Stock Incentive Plan (incorporated by reference to Exhibit 10.12 to the Company’s Annual Report on Form 10-K for the year ended December 31, 2015).
|
|
|
10.13
|
|
*
|
Lear Corporation Salaried Retirement Restoration Program (f/k/a Lear Corporation PSP Excess Plan), amended and restated effective January 1, 2013 (incorporated by reference to Exhibit 10.2 to the Company’s Current Report on Form 8-K dated November 14, 2012).
|
|
|
10.14
|
|
*
|
Form of Restricted Stock Unit "Career Shares" Award Agreement under the Lear Corporation 2009 Long-Term Stock Incentive Plan (incorporated by reference to Exhibit 10.14 to the Company’s Annual Report on Form 10-K for the year ended December 31, 2015).
|
|
|
10.15
|
|
*
|
Form of 2013 Restricted Stock Unit Terms and Conditions under the Lear Corporation 2009 Long-Term Stock Incentive Plan (incorporated by reference to Exhibit 10.2 to the Company’s Quarterly Report on Form 10-Q for the quarter ended March 30, 2013).
|
|
|
10.16
|
|
*
|
Amended and Restated Employment Agreement, dated as of August 9, 2011, between the Company and Matthew J. Simoncini (incorporated by reference to Exhibit 10.1 to the Company’s Quarterly Report on Form 10-Q for the quarter ended October 1, 2011).
|
|
|
10.17
|
|
*
|
Employment Agreement, dated March 15, 2012, between the Company and Jeffrey H. Vanneste (incorporated by reference to Exhibit 10.1 to the Company’s Quarterly Report on Form 10-Q for the quarter ended March 31, 2012).
|
|
|
10.18
|
|
*
|
Amended and Restated Employment Agreement, dated September 12, 2012, between the Company and Frank C. Orsini (incorporated by reference to Exhibit 10.1 to the Company’s Quarterly Report on Form 10-Q for the quarter ended September 29, 2012).
|
|
|
10.19
|
|
*
|
Amended and Restated Employment Agreement, dated September 11, 2013, between the Company and Raymond E. Scott (incorporated by reference to Exhibit 10.2 to the Company’s Quarterly Report on Form 10-Q for the quarter ended September 28, 2013).
|
|
|
10.20
|
|
*
|
Amended and Restated Employment Agreement, dated September 11, 2013, between the Company and Terrence B. Larkin (incorporated by reference to Exhibit 10.3 to the Company’s Quarterly Report on Form 10-Q for the quarter ended September 28, 2013).
|
|
|
10.21
|
|
*
|
Amended and Restated Employment Agreement, dated September 11, 2013, between the Company and Melvin L. Stephens (incorporated by reference to Exhibit 10.4 to the Company’s Quarterly Report on Form 10-Q for the quarter ended September 28, 2013).
|
|
|
10.22
|
|
Letter Agreement Re: Accelerated Share Repurchase between Citibank, N.A. and Lear Corporation, dated April 25, 2013 (incorporated by reference to Exhibit 10.1 to the Company’s Current Report on Form 8-K dated April 25, 2013).
|
||
|
10.23
|
|
*
|
Lear Corporation Annual Incentive Plan (Amended and Restated as of January 1, 2014) (incorporated by reference to Appendix B to the Company’s definitive proxy statement on Schedule 14A filed with the Securities and Exchange Commission on April 1, 2014).
|
|
|
10.24
|
|
*
|
First Amendment to the Lear Corporation Salaried Retirement Restoration Program (as amended and restated effective January 1, 2013 (incorporated by reference to Exhibit 10.25 to the Company's Annual Report on Form 10-K for the year ended December 31, 2014).
|
|
|
10.25
|
|
First Amendment, dated August 20, 2015, to the Amended and Restated Credit Agreement, dated as of November 14, 2014, among the Company, the lenders party thereto and JPMorgan Chase Bank, N.A., as Administrative Agent (incorporated by reference to Exhibit 10.1 to the Company’s Quarterly Report on Form 10-Q for the quarter ended September 26, 2015).
|
||
|
**12.1
|
|
Computation of ratios of earnings to fixed charges.
|
||
|
**21.1
|
|
List of subsidiaries of the Company.
|
||
|
**23.1
|
|
Consent of Ernst & Young LLP.
|
||
112
|
**31.1
|
|
Rule 13a-14(a)/15d-14(a) Certification of Principal Executive Officer.
|
||
|
**31.2
|
|
Rule 13a-14(a)/15d-14(a) Certification of Principal Financial Officer.
|
||
|
**32.1
|
|
Certification by Chief Executive Officer pursuant to 18 U.S.C. Section 1350, as adopted pursuant to Section 906 of the Sarbanes-Oxley Act of 2002.
|
||
|
**32.2
|
|
Certification by Chief Financial Officer pursuant to 18 U.S.C. Section 1350, as adopted pursuant to Section 906 of the Sarbanes-Oxley Act of 2002.
|
||
|
99.1
|
|
Debtors’ First Amended Joint Plan of Reorganization Under Chapter 11 of the Bankruptcy Code dated September 18, 2009 (incorporated by reference to Exhibit 99.1 to the Company’s Current Report on Form 8-K dated November 5, 2009).
|
||
|
***101.INS
|
|
XBRL Instance Document.
|
||
|
***101.SCH
|
|
XBRL Taxonomy Extension Schema Document.
|
||
|
***101.CAL
|
|
XBRL Taxonomy Extension Calculation Linkbase Document.
|
||
|
***101.LAB
|
|
XBRL Taxonomy Extension Label Linkbase Document.
|
||
|
***101.PRE
|
|
XBRL Taxonomy Extension Presentation Linkbase Document.
|
||
|
***101.DEF
|
|
XBRL Taxonomy Extension Definition Linkbase Document.
|
||
______________________
* Compensatory plan or arrangement.
** Filed herewith.
*** Submitted electronically with the Report.
113
TABLE OF CONTENTS
Part IItem 1 BusinessItem 7, "management S Discussion and Analysis Of Financial Condition and Results Of OperationsItem 1A Risk FactorsItem 1B Unresolved Staff CommentsItem 2 PropertiesItem 3 Legal ProceedingsItem 4 Mine Safety DisclosuresPart IIItem 5 Market For The Company S Common Equity,Item 6 Selected Financial DataItem 7 Management S Discussion and Analysis Of Financial Condition and Results Of OperationsItem 8 Consolidated Financial Statements andItem 9 Changes in and Disagreements with Accountants onItem 9A Controls and ProceduresItem 9B Other InformationPart IIIItem 10 Directors, Executive Officers and Corporate GovernanceItem 11 Executive CompensationItem 12 Security Ownership Of Certain Beneficial Owners and Management andItem 13 Certain Relationships and Related Transactions, and Director IndependenceItem 14 Principal Accounting Fees and ServicesPart IVItem 15 Exhibits and Financial Statement Schedule