LINCOLN ELECTRIC HOLDINGS INC
10-Ks and 10-Qs
|
|
|
|
|
|
|
|
|
|
|
|
|
|
|
|
|
|
|
|
|
|
|
|
|
|
|
|
|
|
|
|
|
|
|
|
|
|
|
|
|
|
|
|
|
|
|
|
|
|
|
|
|
|
|
|
QuickLinks
-- Click here to rapidly navigate through this document
UNITED STATES
SECURITIES AND EXCHANGE COMMISSION
WASHINGTON, D.C. 20549
FORM 10-K
ANNUAL REPORT PURSUANT TO SECTION 13 OR 15(d) OF
THE SECURITIES EXCHANGE ACT OF 1934
|
For the fiscal year ended December 31, 2015
|
|
Commission file number 0-1402
|
LINCOLN ELECTRIC HOLDINGS, INC.
(Exact name of registrant as specified in its charter)
|
Ohio
|
|
34-1860551
|
|
(State or other jurisdiction of
incorporation or organization)
|
(I.R.S. Employer Identification No.)
|
|
|
22801 St. Clair Avenue, Cleveland, Ohio
|
|
44117
|
|
(Address of principal executive offices)
|
(Zip Code)
|
|
|
(216) 481-8100
|
|
(Registrant's telephone number, including area code)
|
Securities registered pursuant to Section 12(b) of the Act:
|
Common Shares, without par value
|
The NASDAQ Stock Market LLC
|
|
|
(Title of each class)
|
|
(Name of each exchange on which registered)
|
Securities registered pursuant to Section 12(g) of the Act:
None
Indicate by check mark if the registrant is a well-known seasoned issuer, as defined in Rule 405 of the Securities Act. Yes
þ
No
¨
Indicate by check mark if the registrant is not required to file reports pursuant to Section 13 or Section 15(d) of the Act. Yes
¨
No
þ
Indicate by check mark whether the registrant (1) has filed all reports required to be filed by Section 13 or 15(d) of the Securities Exchange Act of 1934 during the preceding 12 months (or for such shorter period that the registrant was required to file such reports), and (2) has been subject to such filing requirements for the past 90 days. Yes
þ
No
¨
Indicate by check mark whether the registrant has submitted electronically and posted on its corporate Web site, if any, every Interactive Data File required to be submitted and posted pursuant to Rule 405 of Regulation S-T (§ 232.405 of this chapter) during the preceding 12 months (or for such shorter period that the registrant was required to submit and post such files). Yes
þ
No
¨
Indicate by check mark if disclosure of delinquent filers pursuant to Item 405 of Regulation S-K (§ 229.405 of this chapter) is not contained herein, and will not be contained, to the best of registrant's knowledge, in definitive proxy or information statements incorporated by reference in Part III of this Form 10-K or any amendment to this Form 10-K
þ
Indicate by check mark whether the registrant is a large accelerated filer, an accelerated filer, a non-accelerated filer, or a smaller reporting company. See the definitions of "large accelerated filer," "accelerated filer" and "smaller reporting company" in Rule 12b-2 of the Exchange Act.
|
þ
Large accelerated filer
|
¨
Accelerated filer
|
¨
Non-accelerated filer
(Do not check if a smaller reporting company)
|
¨
Smaller reporting company
|
|||
Indicate by check mark whether the registrant is a shell company (as defined in Rule 12b-2 of the Exchange Act). Yes
¨
No
þ
The aggregate market value of the common shares held by non-affiliates as of June 30,
2015
was
$4,448,640,206
(affiliates, for this purpose, have been deemed to be Directors and Executive Officers of the Company and certain significant shareholders).
The number of shares outstanding of the registrant's common shares as of
December 31, 2015
was
70,693,389
.
DOCUMENTS INCORPORATED BY REFERENCE
Part III of this Annual Report on Form 10-K incorporates by reference certain information from the registrant's definitive proxy statement with respect to the registrant's
2016
Annual Meeting of Shareholders.
General
As used in this Annual Report on Form 10-K, the term "Company," except as otherwise indicated by the context, means Lincoln Electric Holdings, Inc. and its wholly-owned and majority-owned subsidiaries for which it has a controlling interest. The Lincoln Electric Company began operations in 1895 and was incorporated under the laws of the State of Ohio in 1906. During 1998, The Lincoln Electric Company reorganized into a holding company structure, and Lincoln Electric Holdings, Inc. became the publicly-held parent of Lincoln Electric subsidiaries worldwide, including The Lincoln Electric Company.
The Company is one of only a few worldwide broad-line manufacturers of welding, cutting and brazing products. Welding products include arc welding power sources, plasma cutters, wire feeding systems, robotic welding packages, integrated automation systems, fume extraction equipment, consumable electrodes, fluxes and welding accessories. The Company's product offering also includes computer numeric controlled ("CNC") plasma and oxy-fuel cutting systems and regulators and torches used in oxy-fuel welding, cutting and brazing. In addition, the Company has a leading global position in the brazing and soldering alloys market.
The arc welding power sources and wire feeding systems manufactured by the Company range in technology from basic units used for light manufacturing and maintenance to highly sophisticated robotic applications for high volume production welding and fabrication. Three primary types of arc welding electrodes are produced: (1) coated manual or stick electrodes; (2) solid electrodes produced in coil, reel or drum forms for continuous feeding in mechanized welding; and (3) cored electrodes produced in coil form for continuous feeding in mechanized welding.
The Company has, through wholly-owned subsidiaries or joint ventures, manufacturing facilities located in the United States, Australia, Brazil, Canada, China, Colombia, France, Germany, India, Indonesia, Italy, Mexico, the Netherlands, Poland, Portugal, Russia, Turkey, the United Kingdom and Venezuela.
As of December 31, 2015, the Company's business units were aligned into five operating segments. The operating segments consist of North America Welding, Europe Welding, Asia Pacific Welding, South America Welding and The Harris Products Group. The North America Welding segment primarily includes welding operations in the United States, Canada and Mexico. The Europe Welding segment includes welding operations in Europe, Russia, Africa and the Middle East. The Asia Pacific Welding segment primarily includes welding operations in China and Australia. The South America Welding segment primarily includes welding operations in Brazil, Colombia and Venezuela. The Harris Products Group includes the Company's global cutting, soldering and brazing businesses as well as the retail business in the United States. See Note 5 to the Company's consolidated financial statements for segment and geographic area information, which is incorporated herein by reference.
During the first quarter of 2016, the Company realigned its organizational and leadership structure. The new structure will allow for further integration of operational and product development processes across regions and support growth strategies. In accordance with this organizational change, beginning with quarterly reporting for the three months ended March 31, 2016, the Company will report
three
operating segments as follows: Americas Welding, International Welding, and The Harris Products Group.
Customers
The Company's products are sold in both domestic and international markets. In North America, products are sold principally through industrial distributors, retailers and also directly to users of welding products. Outside of North America, the Company has an international sales organization comprised of Company employees and agents who sell products from the Company's various manufacturing sites to distributors and product users.
The Company's major end-user markets include:
|
•
|
general metal fabrication,
|
|
•
|
power generation and process industry,
|
|
•
|
structural steel construction (buildings and bridges),
|
|
•
|
heavy equipment fabrication (farming, mining and rail),
|
|
•
|
shipbuilding,
|
|
•
|
automotive,
|
|
•
|
pipe mills and pipelines, and
|
|
•
|
offshore oil and gas exploration and extraction.
|
1
The Company is not dependent on a single customer or a few customers and no individual customer currently accounts for more than ten percent of total Net sales. However, the loss of a large customer could have an adverse effect on the Company's business. The Company's operating results are sensitive to changes in general economic conditions. The arc welding and cutting industry is generally a mature industry in developed markets such as North America and Western Europe and is cyclical in nature. Overall demand for arc welding and cutting products is largely determined by economic cycles and the level of capital spending in manufacturing and other industrial sectors. The Company experiences some variability in reported period-to-period results as demand for the Company's products are mildly seasonal with generally higher demand in the second and third quarters. See "Item 1A. Risk Factors" for further discussion regarding risks associated with customers, general economic conditions and demand.
Competition
Conditions in the arc welding and cutting industry are highly competitive. The Company believes it is the world's largest manufacturer of consumables and equipment with relatively few major broad-line competitors worldwide, but numerous smaller competitors in specific geographic markets. The Company continues to pursue strategies to heighten its competitiveness in domestic and international markets, which includes positioning low cost manufacturing facilities in most geographical markets. Competition in the arc welding and cutting industry is based on brand preference, product quality, price, performance, warranty, delivery, service and technical support. The Company believes its performance against these factors has contributed to the Company's position as the leader in the industry.
Most of the Company's products may be classified as standard commercial articles and are manufactured for stock. The Company believes it has a competitive advantage in the marketplace because of its highly trained technical sales force and the support of its welding research and development staff to assist customers in optimizing their welding applications. This allows the Company to introduce its products to new users and to establish and maintain close relationships with its customers. This close relationship between the technical sales force and the direct customers, together with its supportive relationship with its distributors, who are particularly interested in handling the broad range of the Company's products, is an important element of the Company's market success and a valuable asset of the Company.
Raw Materials
The principal raw materials essential to the Company's business are steel, electronic components, engines, brass, copper, silver, aluminum alloys and various chemicals, all of which are normally available for purchase in the open market.
Patents and Trademarks
The Company holds many valuable patents, primarily in arc welding, and has increased the application process as research and development has progressed in both the United States and major international jurisdictions. The Company believes its trademarks are an important asset and aggressively pursues brand management.
Environmental Regulations
The Company's facilities are subject to environmental regulations. To date, compliance with these environmental regulations has not had a material adverse effect on the Company's earnings. The Company is ISO 14001 certified at most significant manufacturing facilities in North America and Europe and is progressing towards certification at its remaining facilities worldwide. In addition, the Company is ISO 9001 certified at
38
facilities worldwide.
International Operations
The Company conducts a significant amount of its business and has a number of operating facilities in countries outside the United States. As a result, the Company is subject to business risks inherent to non-U.S. activities, including political uncertainty, import and export limitations, exchange controls and currency fluctuations.
Research and Development
Research activities, which the Company believes provide a competitive advantage, relate to the development of new products and the improvement of existing products. Research activities are Company-sponsored. Refer to Note 1 to the Company's consolidated financial statements with respect to total costs of research and development, which is incorporated herein by reference.
Employees
The number of persons employed by the Company worldwide at
December 31, 2015
was approximately
10,000
. See "Part I, Item 1C" for information regarding the Company's executive officers, which is incorporated herein by reference.
2
Website Access
The Company's website, www.lincolnelectric.com, is used as a channel for routine distribution of important information, including news releases and financial information. The Company posts its filings as soon as reasonably practicable after they are electronically filed with, or furnished to, the SEC, including annual, quarterly and current reports on Forms 10-K, 10-Q and 8-K; proxy statements; and any amendments to those reports or statements. The Company also posts its Code of Corporate Conduct and Ethics on its website. All such postings and filings are available on the Company's website free of charge. In addition, this website allows investors and other interested persons to sign up to automatically receive e-mail alerts when news releases and financial information is posted on the website. The SEC also maintains a website, www.sec.gov, that contains reports, proxy and information statements and other information regarding issuers that file electronically with the SEC. The content on any website referred to in this Annual Report on Form 10-K is not incorporated by reference into this Annual Report unless expressly noted.
From time to time, information we provide, statements by our employees or information included in our filings with the SEC may contain forward-looking statements that are not historical facts. Those statements are "forward-looking" within the meaning of the Private Securities Litigation Reform Act of 1995. Forward-looking statements generally can be identified by the use of words such as "may," "will," "expect," "intend," "estimate," "anticipate," "believe," "forecast," "guidance" or words of similar meaning. Actual results may differ materially from such statements due to a variety of factors that could adversely affect the Company's operating results. Forward-looking statements, and our future performance, operating results, financial position and liquidity, are subject to a variety of factors that could materially affect results, including those risks described below. Any forward-looking statements made in this report or otherwise speak only as of the date of the statement, and, except as required by law, we undertake no obligation to update those statements. Comparisons of results for current and any prior periods are not intended to express any future trends or indications of future performance, unless expressed as such, and should only be viewed as historical data.
In the ordinary course of our business, we face various strategic, operating, compliance and financial risks. These risks could have a material impact on our business, financial condition, operating results and cash flows.
Our Enterprise Risk Management ("ERM") process seeks to identify and address significant risks. Our ERM process is a company-wide initiative that is designed with the intent of prioritizing risks and allocating appropriate resources to address such risks. We use the integrated risk framework of the Committee of Sponsoring Organizations to assess, manage and monitor risks.
Management has identified and prioritized critical risks based on the severity and likelihood of each risk and assigned an executive to address each major identified risk area and lead action plans to monitor and mitigate risks, where possible. Our Board of Directors provides oversight of the ERM process and systematically reviews identified critical risks. The Audit Committee also reviews major financial risk exposures and the steps management has taken to monitor and control them.
Our goal is to pro-actively manage risks in a structured approach and in conjunction with the strategic planning process, with the intent to preserve and enhance shareholder value. However, these and other risks and uncertainties could cause our results to vary materially from recent results or from our anticipated future results. The risk factors and uncertainties described below, together with information incorporated by reference or otherwise included elsewhere in this Annual Report on Form 10-K, should be carefully considered. Additional risks and uncertainties of which we are currently unaware or that we currently believe to be immaterial may also adversely affect our business.
General economic and market conditions may adversely affect our financial condition, results of operations and access to capital markets.
Our operating results are sensitive to changes in general economic conditions. Further recessionary economic cycles, higher interest rates, inflation, higher labor costs, trade barriers in the world markets, financial turmoil related to sovereign debt and changes in tax laws or other economic factors affecting the countries and industries in which we do business could adversely affect demand for our products. An adverse change in demand could impact our results of operations, collection of accounts receivable and our expected cash flow generation from current and acquired businesses, which may adversely impact our financial condition and access to capital markets.
3
Economic and supply disruptions associated with events beyond our control, such as war, acts of terror, political unrest, pandemic, labor disputes or natural disasters could adversely affect our supply chain and distribution channels or result in loss of sales and customers.
Our facilities and operations, and the facilities and operations of our suppliers and customers, could be disrupted by events beyond our control, such as war, political unrest, pandemic, labor disputes or natural disasters. Any such disruption could cause delays in the production and distribution of our products and the loss of sales and customers. Insurance proceeds may not adequately compensate the Company for the losses.
Availability of and volatility in energy costs or raw material prices may adversely affect our performance.
In the normal course of business, we are exposed to market risks related to the availability of and price fluctuations in the purchase of energy and commodities used in the manufacture of our products (primarily steel, brass, copper, silver, aluminum alloys, electronic components, electricity and natural gas). The availability and prices for energy costs and raw materials, including steel, nonferrous metals and chemicals, are subject to volatility and are influenced by worldwide economic conditions, speculative action, world supply and demand balances, inventory levels, availability of substitute materials, currency exchange rates, our competitors' production costs, anticipated or perceived shortages and other factors.
Increases in the cost of raw materials and components may adversely affect our profitability if we are unable to pass along to our customers these cost increases in the form of price increases or otherwise reduce our cost of goods sold. Although most of the raw materials and components used in our products are commercially available from a number of sources and in adequate supply, any disruption in the availability of such raw materials and components, our inability to timely or otherwise obtain substitutes for such items, or any deterioration in our relationships with or the financial viability of our suppliers could adversely affect our business.
We are a co-defendant in litigation alleging asbestos induced illness. Liabilities relating to such litigation could reduce our profitability and impair our financial condition.
As of
December 31, 2015
, we were a co-defendant in cases alleging asbestos induced illness involving claims by approximately
8,415
plaintiffs. In each instance, we are one of a large number of defendants. The asbestos claimants allege that exposure to asbestos contained in welding consumables caused the plaintiffs to develop adverse pulmonary diseases, including mesothelioma and other lung cancers.
Since January 1, 1995, we have been a co-defendant in asbestos cases that have been resolved as follows:
49,677
of those claims were dismissed,
22
were tried to defense verdicts,
seven
were tried to plaintiff verdicts (one of which was vacated on appeal),
one
was resolved by agreement for an immaterial amount and
748
were decided in favor of the Company following summary judgment motions.
The long-term impact of the asbestos loss contingency, in the aggregate, on operating results, operating cash flows and access to capital markets is difficult to assess, particularly since claims are in many different stages of development and we benefit significantly from cost-sharing with co-defendants and insurance carriers. While we intend to contest these lawsuits vigorously, and believe we have applicable insurance relating to these claims, there are several risks and uncertainties that may affect our liability for personal injury claims relating to exposure to asbestos, including the future impact of changing cost sharing arrangements or a change in our overall trial experience.
Asbestos use in welding consumables in the U.S. ceased in 1981.
We may incur material losses and costs as a result of product liability claims that may be brought against us.
Our business exposes us to potential product liability risks that are inherent in the design, manufacture, sale and application of our products and the products of third-party suppliers that we utilize or resell. Our products are used in a variety of applications, including infrastructure projects such as oil and gas pipelines and platforms, buildings, bridges and power generation facilities, the manufacture of transportation and heavy equipment and machinery and various other construction projects. We face risk of exposure to product liability claims in the event that accidents or failures on these projects result, or are alleged to result, in bodily injury or property damage. Further, our products are designed for use in specific applications, and if a product is used inappropriately, personal injury or property damage may result.
4
The occurrence of defects in or failures of our products, or the misuse of our products in specific applications, could cause termination of customer contracts, increased costs and losses to us, our customers and other end users. We cannot be assured that we will not experience any material product liability losses in the future or that we will not incur significant costs to defend those claims. Further, we cannot be assured that our product liability insurance coverage will be adequate for any liabilities that we may ultimately incur or that product liability insurance will continue to be available on terms acceptable to us. Even if we are successful defending such claims or product liability coverage is adequate, claims of this nature could cause customers to lose confidence in our products and our company. Warranty claims are not generally covered by insurance and we may incur significant warranty costs in the future for which we would not be reimbursed.
The cyclical nature and maturity of the arc welding and cutting industry in developed markets may adversely affect our performance.
The arc welding and cutting industry is generally a mature industry in developed markets such as North America and Western Europe and is cyclical in nature. Overall demand for arc welding and cutting products is largely determined by the level of capital spending in manufacturing and other industrial sectors, and the welding industry has historically experienced contraction during periods of slowing industrial activity. If economic, business and industry conditions deteriorate, capital spending in those sectors may be substantially decreased, which could reduce demand for our products, our revenues and our results of operations.
We may not be able to complete our acquisition or divestiture strategies, successfully integrate acquired businesses and in certain cases we may be required to retain liabilities for certain matters.
Part of our business strategy is to pursue targeted business acquisition opportunities, including foreign investment opportunities. For example, we have completed and continue to pursue acquisitions in emerging markets in order to strategically position resources to increase our presence in growing markets. We cannot be certain that we will be successful in pursuing potential acquisition candidates or that the consequences of any acquisition would be beneficial to us. Future acquisitions may expose us to unexpected liabilities and involve the expenditure of significant funds and management time. Further, we may not be able to successfully integrate any acquired business with our existing businesses or recognize the expected benefits from any completed acquisition.
Depending on the nature, size and timing of future acquisitions, we may be required to raise additional financing, which may not be available to us on acceptable terms. Our current operational cash flow is sufficient to fund our current acquisition plans, but a significant acquisition could require access to the capital markets.
Additionally, from time to time we may identify assets for strategic divestitures that would increase capital resources available for other activities and create organizational and operational efficiencies. Various factors could materially affect our ability to dispose of such assets or complete announced divestitures, including the receipt of approvals of governmental agencies or third parties and the availability of purchasers willing to acquire the interests or purchase the assets on terms and at prices acceptable to us.
Sellers typically retain certain liabilities or indemnify buyers for certain matters. The magnitude of any such retained liability or indemnification obligation may be difficult to quantify at the time of the transaction and ultimately may be material. Also, as is typical in divestitures, third parties may be unwilling to release us from guarantees or other credit support provided prior to the sale of the divested assets. As a result, after a divestiture, we may remain secondarily liable for the obligations guaranteed or supported to the extent that the buyer of the assets fails to perform these obligations.
If we cannot continue to develop, manufacture and market products that meet customer demands, continue to enforce the intellectual property rights on which our business depends or if third parties assert that we violate their intellectual property rights, our revenues, gross margins and results of operations may suffer.
Our continued success depends, in part, on our ability to continue to meet our customers' needs for welding and cutting products through the introduction of innovative new products and the enhancement of existing product design and performance characteristics. We must remain committed to product research and development and customer service in order to remain competitive. We cannot be assured that new products or product improvements, once developed, will meet with customer acceptance and contribute positively to our operating results, or that we will be able to continue our product development efforts at a pace to sustain future growth. Further, we may lose customers to our competitors if they demonstrate product design, development or manufacturing capabilities superior to ours.
5
We rely upon patent, trademark, copyright and trade secret laws in the United States and similar laws in foreign countries, as well as agreements with our employees, customers, suppliers and other third parties, to establish and maintain our intellectual property rights. However, any of our intellectual property rights could be challenged, invalidated or circumvented, or our intellectual property rights may not be sufficient to provide a competitive advantage. Further, the laws and their application in certain foreign countries do not protect our proprietary rights to the same extent as U.S. laws. Accordingly, in certain countries, we may be unable to protect our proprietary rights against unauthorized third-party copying or use, which could impact our competitive position.
Further, third parties may claim that we or our customers are infringing upon their intellectual property rights. Even if we believe that those claims are without merit, defending those claims and contesting the validity of patents can be time consuming and costly. Claims of intellectual property infringement also might require us to redesign affected products, enter into costly settlements or license agreements, pay costly damage awards or face a temporary or permanent injunction prohibiting us from manufacturing, marketing or selling certain of our products.
The competitive pressures we face could harm our revenue, gross margins and prospects.
We operate in a highly competitive global environment and compete in each of our businesses with other broad-line manufacturers and numerous smaller competitors specializing in particular products. We compete primarily on the basis of brand, product quality, price, performance, warranty, delivery, service and technical support. We have previously initiated, and may in the future initiate significant rationalization activities to align our business to market conditions and improve our overall competitiveness. Such rationalization activities could fail to deliver the desired competitive cost structure and could result in disruptions in customer service. If our products, services, support and cost structure do not enable us to compete successfully based on any of the criteria listed above, our operations, results and prospects could suffer.
Further, in the past decade, the arc welding industry in the United States and other developed countries has been subject to increased levels of foreign competition as low cost imports have become more readily available. Our competitive position could also be harmed if new or emerging competitors become more active in the arc welding business. For example, while steel manufacturers traditionally have not been significant competitors in the domestic arc welding industry, some foreign integrated steel producers manufacture selected consumable arc welding products. In addition, in certain markets of the world, distributors manufacture and sell arc welding products. Our sales and results of operations, as well as our plans to expand in some foreign countries, could be adversely affected by this practice.
We conduct our sales and distribution operations on a worldwide basis and maintain manufacturing facilities in a number of foreign countries, which subjects us to risks associated with doing business outside the United States.
Our long-term strategy is to continue to increase our market share in growing international markets. The share of sales and profits we derive from our international operations and exports from the United States is significant. This trend increases our exposure to the performance of many developing economies in addition to the developed economies outside of the United States. If international economies were to experience significant slowdowns, it could adversely affect our financial condition, results of operations and cash flows.
There are a number of risks in doing business internationally, which may impede our ability to achieve our strategic objectives relating to our foreign operations. Many developing countries have a significant degree of political and economic uncertainty and social turmoil that may impede our ability to implement and achieve our international growth objectives. Conducting business internationally subjects us to corporate governance and management challenges in consideration of the numerous U.S. and foreign laws and regulations, including regulations relating to import-export control, technology transfer restrictions, repatriation of earnings and funds, exchange controls, labor regulations, nationalization, anti-boycott provisions and anti-bribery laws (such as the Foreign Corrupt Practices Act and the Organization for Economic Cooperation and Development Convention). Failure by the Company or its sales representatives, agents or distributors to comply with these laws and regulations could result in administrative, civil or criminal liabilities, all or any of which could negatively impact our business and reputation. Our foreign operations also subject us to the risks of international terrorism and hostilities.
In particular, the economic and political environment in Venezuela exposes us to various risks. Currency exchange restrictions limit our ability to convert bolivars to U.S. dollars, which impacts our ability to repatriate earnings and to purchase goods and services necessary to operate our Venezuelan business. The restrictions could cause a slowdown, temporary shutdown or complete shutdown of operations at our Venezuelan subsidiary, which could negatively affect our earnings and cash flows.
6
In the future, the Company may need to deconsolidate its Venezuelan operations as a result of an inability to exchange bolivar-denominated cash coupled with an acute degradation in the ability to make key operational decisions due to government regulations in Venezuela. The Company monitors factors such as its ability to access various exchange mechanisms; the impact of government regulations on the Company’s ability to manage its Venezuelan operation’s capital structure, purchasing, product pricing, and labor relations; and the current political and economic situation within Venezuela. Based upon such factors as of
December 31, 2015
, the Company continues to consolidate its Venezuelan subsidiary. As of
December 31, 2015
, the Company's total investment in Venezuela was approximately
$35,000
, which includes intercompany payables.
Our operations depend on maintaining a skilled workforce, and any interruption in our workforce could negatively impact our results of operations and financial condition.
Our success depends in part on the efforts and abilities of our management team and key employees. Their skills, experience and industry knowledge significantly benefit our operations and performance. Our future success will also depend on our ability to identify, attract and retain highly qualified managerial and technical (including research and development) personnel. Competition for these individuals is intense, and we may not succeed in identifying, attracting or retaining qualified personnel. With our strategy to expand internationally into developing markets, we may incur additional risks as some developing economies lack a sufficiently trained labor pool.
Any interruption of our workforce, including interruptions due to unionization efforts, changes in labor relations or shortages of appropriately skilled individuals could impact our results of operations and financial condition.
Our defined benefit pension plans are subject to financial market trends, such as changes in discount rates and actual investment return on pension assets, which could adversely affect our results of operations and cash flows.
The performance of the financial markets and interest rates impact our funding obligations under our defined benefit pension plans. Significant changes in discount rates, decreases in the fair value of plan assets and investment losses on plan assets may increase our benefit obligations and adversely impact our results of operations, shareholders' equity and cash flows through our annual measurement of plan assets and liabilities. For a discussion regarding how the financial statements have been affected by significant changes in
2015
, refer to the pension related disclosure under "Part II, Item 7 – Critical Accounting Policies" and Note 11 to the Company's consolidated financial statements.
We are subject to changes in the global regulatory environment, which could adversely affect our results of operations, cash flows and financial condition.
Our businesses, results of operations or financial condition could be adversely affected if laws, regulations or standards relating to us, our products or the markets in which we operate are newly implemented or changed. New or revised laws, regulations or standards could increase our cost of doing business or restrict our ability to operate our business and execute our strategies.
A significant fluctuation between the U.S. dollar and other currencies could adversely impact our operating income.
Although our financial results are reported in U.S. dollars, a significant portion of our sales and operating costs are realized in other currencies. Our profitability is affected by movements of the U.S. dollar against other foreign currencies in which we generate revenues and incur expenses. Significant fluctuations in relative currency values, in particular an increase in the value of the U.S. dollar against foreign currencies, could have an adverse effect on our profitability and financial condition.
We also face risks arising from the imposition of exchange controls and currency devaluations. Exchange controls may limit our ability to convert currencies into U.S. dollars or to remit dividend and other payments by our foreign subsidiaries within a country imposing controls. Currency devaluations result in diminished value of funds denominated in the currency of the country instituting the devaluation.
Changes in tax rates or exposure to additional income tax liabilities could affect profitability.
Our business is subject to income taxes in the United States and various foreign jurisdictions. Domestic and international tax liabilities are subject to the allocation of income among various tax jurisdictions. Our effective tax rate could be adversely affected by changes in the mix among earnings in countries with differing statutory tax rates, changes in the valuation allowances of deferred tax assets or changes in tax laws.
The amount of income taxes paid is subject to ongoing audits by United States federal, state and local tax authorities and by foreign tax authorities. If these audits result in assessments different from amounts reserved, future financial results may include unfavorable adjustments which could have a material adverse effect on our results of operations.
7
We are subject to risks relating to our information technology systems.
The conduct and management of our business relies extensively on information technology systems, which contain confidential information related to our customers, suppliers and employees and other proprietary business information. We maintain some of these systems and are also dependent on a number of critical corporate infrastructure services provided by third parties relating to, among other things, human resources, electronic communication services and finance functions. If these systems are damaged, cease to function properly or are subject to a significant cyber security breach, we may suffer an interruption in our ability to manage and operate the business and our results of operations and financial condition could be adversely affected. Furthermore, a security breach could result in unfavorable publicity, damage to our reputation, loss of our trade secrets and other competitive information, allegations by our customers that we have not performed our contractual obligations, litigation by affected parties and fines and other sanctions resulting from any related breaches of data privacy regulations. Any of these could have an adverse effect on our results of operations and financial condition.
Our global operations are subject to increasingly complex environmental regulatory requirements.
We are subject to increasingly complex environmental regulations affecting international manufacturers, including those related to air and water emissions, waste management and climate change. Some environmental laws impose strict, retroactive and joint and several liability for the remediation of the release of hazardous substances, even for conduct that was lawful at the time it occurred, or for the conduct of or conditions caused by prior operators, predecessors or third parties. Failure to comply with environmental laws could expose us to penalties or clean-up costs, civil or criminal liability and sanctions on certain of our activities, as well as damage to property or natural resources. These liabilities, sanctions, damages and remediation efforts related to any non-compliance with such laws and regulations could negatively impact our ability to conduct our operations and our financial condition and results of operations. In addition, there can be no assurances that we will not be adversely affected by costs, liabilities or claims with respect to existing or subsequently acquired operations or under present laws and regulations or those that may be adopted or imposed in the future.
Changes in environmental laws or regulations could result in higher expenses and payments, and uncertainty relating to environmental laws or regulations may also affect how we conduct our operations and structure our investments and could limit our ability to enforce our rights. Changes in environmental and climate change laws or regulations, including laws relating to greenhouse gas emissions, could subject us to additional costs and restrictions, including increased energy and raw material costs. If environmental laws or regulations are either changed or adopted and impose significant operational restrictions and compliance requirements upon us or our products, they could negatively impact our business, capital expenditures, results of operations, financial condition and competitive position.
It is our policy to apply strict standards for environmental protection to all of our operations inside and outside of the United States, even when we are not subject to local government regulations. We may incur substantial costs, including cleanup costs, fines and civil or criminal sanctions, liabilities resulting from third-party property damage or personal injury claims, or our products could be enjoined from entering certain jurisdictions, if we were to violate or become liable under environmental laws or if our products become non-compliant with environmental laws.
We also face increasing complexity in our products design and procurement operations as we adjust to new and future requirements relating to the design, production and labeling of our products that are sold worldwide in multiple jurisdictions. The ultimate costs under environmental laws and the timing of these costs are difficult to predict.
We may incur additional restructuring charges as we continue to contemplate rationalization actions in an effort to optimize our cost structure and may not achieve the anticipated savings and benefits of these actions.
Throughout 2015, we implemented rationalization plans and incurred employee severance and other related costs totaling
$13,719
. For more information regarding our rationalization plans, refer to the rationalization and asset impairment related disclosure under Note 6 to the Company's consolidated financial statements. We may take additional actions in the future to further optimize our cost structure and improve the efficiency of our operations, which will reduce our profitability in the periods incurred. As a result of these actions, we will likely continue to incur charges, which may include but are not be limited to asset impairments, employee severance costs, charges for pension and other postretirement contractual benefits and pension settlements, any of which could be significant, and could adversely affect our financial condition and results of operations. In addition, we may not realize anticipated savings or benefits from past or future rationalization plans in full or in part or within the time periods we expect. Failure to realize anticipated savings or benefits from our cost reduction actions could have a material adverse effect on our business, financial condition, liquidity, results of operations and cash flows.
None.
8
EXECUTIVE OFFICERS OF THE REGISTRANT
|
Name
|
Age
|
Position
|
|||
|
Christopher L. Mapes
|
54
|
|
Chairman of the Board effective December 21, 2013. President and Chief Executive Officer effective December 31, 2012; Chief Operating Officer from September 1, 2011 to December 31, 2012; Director since February 2010. Prior to his service with the Company, Mr. Mapes was an Executive Vice President of A.O. Smith Corporation (a global manufacturer with a water heating and water treatment technologies business), a position he held from 2004 through August 2011, and the President of its former Electrical Products unit, a position he held from September 2004 through August 2011.
|
||
|
Vincent K. Petrella
|
55
|
|
Executive Vice President, Chief Financial Officer and Treasurer since February 19, 2014; Senior Vice President, Chief Financial Officer and Treasurer from October 7, 2005 to February 19, 2014.
|
||
|
Frederick G. Stueber
|
62
|
|
Executive Vice President, General Counsel and Secretary since February 19, 2014; Senior Vice President, General Counsel and Secretary from 1996 to February 19, 2014.
|
||
|
George D. Blankenship
|
53
|
|
Executive Vice President, President, Americas Welding since February 18, 2016; Executive Vice President, President, Lincoln Electric North America from February 19, 2014 to February 18, 2016; Senior Vice President; President, Lincoln Electric North America from July 30, 2009 to February 19, 2014; Senior Vice President, Global Engineering from October 7, 2005 to July 30, 2009; Senior Vice President; President, Lincoln Cleveland of The Lincoln Electric Company from January 8, 2008 to July 30, 2009; Senior Vice President, U.S. Operations of The Lincoln Electric Company from October 7, 2005 to January 8, 2008.
|
||
|
Gabriel Bruno
|
48
|
|
Executive Vice President, Chief Human Resources Officer & Interim Chief Information Officer since February 18, 2016; Executive Vice President, Chief Information Officer & Interim Chief Human Resources Officer from March 7, 2015 to February 18, 2016; Executive Vice President, Chief Information Officer since February 19, 2014; Vice President, Chief Information Officer from May 1, 2012 to February 19, 2014; Vice President, Corporate Controller from 2005 to May 1, 2012.
|
||
|
Geoffrey P. Allman
|
45
|
|
Senior Vice President, Corporate Controller since January 14, 2014; Corporate Controller from July 1, 2012 to January 14, 2014; Director, Regional Finance North America from October 1, 2009 to June 30, 2012.
|
||
|
Thomas A. Flohn
|
55
|
|
Senior Vice President, President, Asia Pacific Region since February 19, 2014; Vice President, Regional President, Lincoln Electric Asia Pacific Region from November 4, 2013 to January 14, 2014. Vice President; President, Lincoln Electric Europe, Middle East & Africa (EMEA) from July 1, 2010 to November 4, 2013; Vice President; President, Lincoln Asia Pacific from January 1, 2005 to June 30, 2010.
|
||
|
Mathias Hallmann
|
53
|
|
Senior Vice President, President, International Welding since February 9, 2016; Senior Vice President, President, LE Europe from February 19, 2014 to February 9, 2016; Vice President; President, Lincoln Electric Europe from November 4, 2013 to February 19, 2014. Prior to his service with the Company, Mr. Hallmann was Chief Executive Officer of Bohler Welding Holding GmbH (a leading manufacturer and provider of auxiliary materials and consumables for industrial welding and soldering applications) from December 2008 to March 2012, and its Chief Operating Officer from April 2008 to November 2008.
|
||
|
Steven B. Hedlund
|
49
|
|
Senior Vice President and President, Global Automation since January 22, 2015; Senior Vice President, Strategy & Business Development from February 19, 2014 to January 22, 2015; Vice President, Strategy and Business Development from September 15, 2008 to February 19, 2014. Prior to his service with the Company, Mr. Hedlund was the Vice President, Growth and Innovations with Master Lock, LLC (a security products company) from June 1, 2005 to July 1, 2008.
|
||
|
David J. Nangle
|
59
|
|
Senior Vice President, President, Harris Products Group since February 19, 2014; Vice President, Group President of Brazing, Cutting and Retail Subsidiaries from January 12, 2006 to February 19, 2014.
|
||
The Company has been advised that there is no arrangement or understanding among any one of the officers listed and any other persons pursuant to which he or she was elected as an officer. The executive officers are elected by the Board of Directors normally for a term of one year and/or until the election of their successors.
9
The Company's corporate headquarters and principal United States manufacturing facilities are located in the Cleveland, Ohio area. Total Cleveland area property consists of
233
acres, of which present manufacturing facilities comprise an area of approximately
2,940,000
square feet.
The Company has
48
manufacturing facilities, including operations and joint ventures in
19
countries, the significant locations (grouped by operating segment) of which are as follows:
|
North America Welding:
|
|
|
|
United States
|
Cleveland and Fort Loramie, Ohio; San Diego and Anaheim, California; Reno, Nevada; Ladson, South Carolina; Chattanooga, Tennessee; Detroit, Michigan; Fort Collins, Colorado.
|
|
|
Canada
|
Toronto; Mississauga; Hamilton.
|
|
|
Mexico
|
Mexico City; Torreon.
|
|
|
Europe Welding:
|
|
|
|
France
|
Grand-Quevilly.
|
|
|
Germany
|
Essen.
|
|
|
Italy
|
Corsalone.
|
|
|
Netherlands
|
Nijmegen.
|
|
|
Poland
|
Bielawa; Dzierzoniow.
|
|
|
Portugal
|
Lisbon.
|
|
|
Russia
|
Mtsensk.
|
|
|
Turkey
|
Istanbul.
|
|
|
United Kingdom
|
Sheffield and Chertsey, England.
|
|
|
Asia Pacific Welding:
|
|
|
|
China
|
Shanghai; Jinzhou; Nanjing; Zhengzhou; Luan County.
|
|
|
India
|
Chennai.
|
|
|
Indonesia
|
Cikarang.
|
|
|
South America Welding:
|
|
|
|
Brazil
|
Guarulhos.
|
|
|
Colombia
|
Bogota.
|
|
|
Venezuela
|
Maracay.
|
|
|
The Harris Products Group:
|
|
|
|
United States
|
Mason, Ohio; Gainesville, Georgia; Santa Fe Springs, California.
|
|
|
Brazil
|
Sao Paulo.
|
|
|
Mexico
|
Tijuana.
|
|
|
Poland
|
Dzierzoniow.
|
|
All properties relating to the Company's Cleveland, Ohio headquarters and manufacturing facilities are owned by the Company. Most of the Company's foreign subsidiaries own manufacturing facilities in the country where they are located. The Company believes that its existing properties are in good condition and are suitable for the conduct of its business.
In addition, the Company maintains operating leases for some manufacturing facilities, distribution centers and sales offices throughout the world. See Note 16 to the Company's consolidated financial statements for information regarding the Company's lease commitments.
10
The Company is subject, from time to time, to a variety of civil and administrative proceedings arising out of its normal operations, including, without limitation, product liability claims, regulatory claims and health, safety and environmental claims. Among such proceedings are the cases described below.
As of
December 31, 2015
, the Company was a co-defendant in cases alleging asbestos induced illness involving claims by approximately
8,415
plaintiffs, which is a net decrease of
486
claims from those previously reported. In each instance, the Company is one of a large number of defendants. The asbestos claimants seek compensatory and punitive damages, in most cases for unspecified sums. Since January 1, 1995, the Company has been a co-defendant in other similar cases that have been resolved as follows:
49,677
of those claims were dismissed,
22
were tried to defense verdicts,
seven
were tried to plaintiff verdicts (one of which was vacated on appeal),
one
was resolved by agreement for an immaterial amount and
748
were decided in favor of the Company following summary judgment motions.
Not applicable.
11
The Company's common shares are traded on The NASDAQ Global Select Market under the symbol "LECO." The number of record holders of common shares at
December 31, 2015
was 1,741.
The total amount of dividends paid in
2015
was
$87.0 million
. During
2015
, dividends were paid on January 15, April 15, July 15 and October 15.
Quarterly high and low stock prices and dividends declared per share for the last two years were:
|
2015
|
2014
|
|||||||||||||||||||||||
|
Stock Price
|
Dividends
Declared
|
Stock Price
|
Dividends
Declared
|
|||||||||||||||||||||
|
High
|
Low
|
High
|
Low
|
|||||||||||||||||||||
|
First quarter
|
$
|
72.50
|
|
$
|
63.90
|
|
$
|
0.29
|
|
$
|
76.26
|
|
$
|
66.68
|
|
$
|
0.23
|
|
||||||
|
Second quarter
|
71.15
|
|
60.85
|
|
0.29
|
|
72.88
|
|
63.23
|
|
0.23
|
|
||||||||||||
|
Third quarter
|
62.94
|
|
51.74
|
|
0.29
|
|
73.75
|
|
65.44
|
|
0.23
|
|
||||||||||||
|
Fourth quarter
|
62.95
|
|
49.71
|
|
0.32
|
|
75.49
|
|
61.12
|
|
0.29
|
|
||||||||||||
Issuer purchases of equity securities for the fourth quarter
2015
were:
|
Period
|
Total Number of
Shares Repurchased
|
Average Price
Paid Per Share
|
Total Number of
Shares Repurchased
as Part of Publicly
Announced Plans or
Programs
|
Maximum Number of Shares that May Yet be Purchased Under the Plans or Programs
(2)
|
|||||||||
|
October 1-31, 2015
|
821,060
|
|
(1)
|
$
|
55.30
|
|
820,904
|
|
5,769,776
|
|
|||
|
November 1-30, 2015
|
414,672
|
|
57.00
|
|
414,672
|
|
5,355,104
|
|
|||||
|
December 1-31, 2015
|
608,088
|
|
(1)
|
53.70
|
|
607,183
|
|
4,747,921
|
|
||||
|
Total
|
1,843,820
|
|
55.15
|
|
1,842,759
|
|
|||||||
|
(1)
|
The above share repurchases include the surrender of
156
and
905
shares in October and December, respectively, of the Company's common shares in connection with the vesting of restricted awards.
|
|
(2)
|
In 2013, the Company's Board of Directors authorized a new share repurchase program, which increased the total number of the Company’s common shares authorized to be repurchased to
45 million
shares. Total shares purchased through the share repurchase program were
40,252,079
shares at a cost of
$1.3 billion
for a weighted average cost of
$32.24
per share through
December 31, 2015
.
|
12
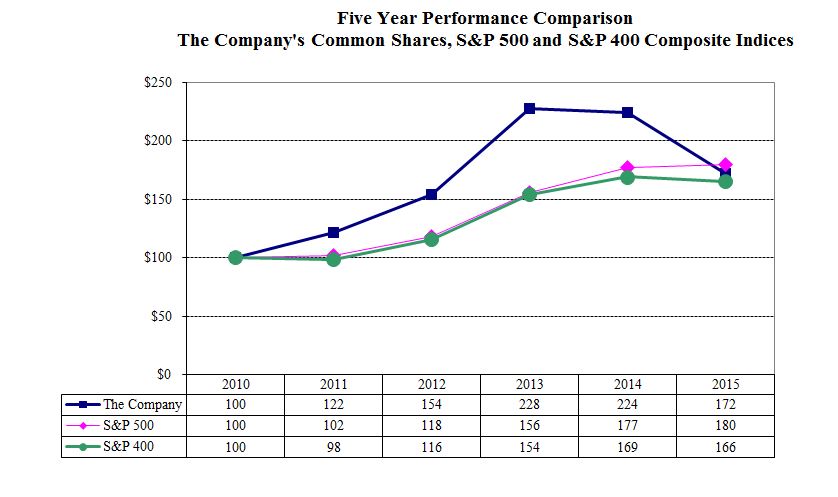
The following line graph compares the yearly percentage change in the cumulative total shareholder return on the Company's common stock against the cumulative total return of the S&P Composite 500 Stock Index ("S&P 500") and the S&P 400 MidCap Index ("S&P 400") for the five-year calendar period commencing January 1, 2011 and ending
December 31, 2015
. This graph assumes that $100 was invested on December 31, 2010 in each of the Company's common shares, the S&P 500 and the S&P 400. A peer-group index for the welding industry, in general, is not readily available because the industry is comprised of a large number of privately held competitors and competitors that are smaller parts of large publicly traded companies.
13
(Dollars in thousands, except per share amounts)
|
Year Ended December 31,
|
||||||||||||||||||||
|
2015
(1)
|
2014
(2)
|
2013
(3)
|
2012
(4)
|
2011
(5)
|
||||||||||||||||
|
Net sales
|
$
|
2,535,791
|
|
$
|
2,813,324
|
|
$
|
2,852,671
|
|
$
|
2,853,367
|
|
$
|
2,694,609
|
|
|||||
|
Net income
|
127,478
|
|
254,686
|
|
293,780
|
|
257,411
|
|
217,186
|
|
||||||||||
|
Basic earnings per share
|
1.72
|
|
3.22
|
|
3.58
|
|
3.10
|
|
2.60
|
|
||||||||||
|
Diluted earnings per share
|
1.70
|
|
3.18
|
|
3.54
|
|
3.06
|
|
2.56
|
|
||||||||||
|
Cash dividends declared per share
|
1.190
|
|
0.980
|
|
0.830
|
|
0.710
|
|
0.635
|
|
||||||||||
|
Total assets
|
1,784,171
|
|
1,939,215
|
|
2,151,867
|
|
2,089,863
|
|
1,976,776
|
|
||||||||||
|
Long-term debt
|
350,347
|
|
2,488
|
|
3,791
|
|
1,599
|
|
1,960
|
|
||||||||||
|
(1)
|
Results for 2015 include
$13,719
(
$11,943
after-tax) of rationalization charges and non-cash net impairment charges of
$6,239
(
$6,239
after-tax). Results also include pension settlement charges of
$142,738
(
$87,310
after-tax) and charges of
$27,214
(
$27,214
after-tax) related to Venezuelan remeasurement losses. Long-term debt in 2015 includes the issuance of Senior Unsecured Notes in the aggregate principal amount of
$350,000
through a private placement.
|
|
(2)
|
Results for 2014 include
$32,742
($32,706 after-tax) of non-cash asset impairment charges partially offset by gains of $3,930 ($2,754 after-tax) related to the sale of assets. Associated with the impairment of long-lived assets is an offsetting special item of $805 representing portions attributable to non-controlling interests. Results also include charges of $21,133 ($21,133 after-tax) related to Venezuelan remeasurement losses.
|
|
(3)
|
Results for 2013 include $3,658 ($2,965 after-tax) of rationalization charges and impairment charges net of gains on disposals of $4,805 ($4,608 after-tax). Results also include a charge of $12,198 ($12,198 after-tax) related to the devaluation of the Venezuelan currency and a loss of $705 ($705 after-tax) related to the sale of land. Associated with the impairment of long-lived assets and loss on the sale of land is an offsetting special item of $1,068 representing portions attributable to non-controlling interests.
|
|
(4)
|
Results for 2012 include $7,512 ($6,153 after-tax) of rationalization charges and asset disposal and impairment charges of $1,842 ($1,289 after-tax). Results also include a charge of $1,381 ($906 after-tax) related to a change in Venezuelan labor law, which provides for increased employee severance obligations.
|
|
(5)
|
Results for 2011 include net rationalization and asset impairment charges of $282 ($237 after-tax) resulting from rationalization activities primarily initiated in 2009 and a gain of $4,844 related to a favorable adjustment for tax audit settlements.
|
14
(Dollars in thousands, except per share amounts)
This Management's Discussion and Analysis of Financial Condition and Results of Operations should be read together with "Selected Financial Data," the Company's consolidated financial statements and other financial information included elsewhere in this Annual Report on Form 10-K. This Annual Report on Form 10-K contains forward-looking statements that involve risks and uncertainties. Actual results may differ materially from those indicated in the forward-looking statements. See "Item 1A. Risk Factors" for more information regarding forward-looking statements.
General
The Company is the world's largest designer and manufacturer of arc welding and cutting products, manufacturing a broad line of arc welding equipment, consumable welding products and other welding and cutting products.
The Company is one of only a few worldwide broad-line manufacturers of welding, cutting and brazing products. Welding products include arc welding power sources, plasma cutters, wire feeding systems, robotic welding packages, integrated automation systems, fume extraction equipment, consumable electrodes, fluxes and welding accessories. The Company's product offering also includes CNC plasma and oxy-fuel cutting systems and regulators and torches used in oxy-fuel welding, cutting and brazing. In addition, the Company has a leading global position in the brazing and soldering alloys market.
The Company invests in the research and development of arc welding products in order to continue its market leading product offering. The Company continues to invest in technologies that improve the quality and productivity of welding products. In addition, the Company continues to actively increase its patent application process in order to secure its technology advantage in the United States and other major international jurisdictions. The Company believes its significant investment in research and development and its highly trained technical sales force coupled with its extensive distributor network provide a competitive advantage in the marketplace.
The Company's products are sold in both domestic and international markets. In North America, products are sold principally through industrial distributors, retailers and also directly to users of welding products. Outside of North America, the Company has an international sales organization comprised of Company employees and agents who sell products from the Company's various manufacturing sites to distributors and product users.
The Company's major end-user markets include:
|
•
|
general metal fabrication,
|
|
•
|
power generation and process industry,
|
|
•
|
structural steel construction (buildings and bridges),
|
|
•
|
heavy equipment fabrication (farming, mining and rail),
|
|
•
|
shipbuilding,
|
|
•
|
automotive,
|
|
•
|
pipe mills and pipelines, and
|
|
•
|
offshore oil and gas exploration and extraction.
|
The Company has, through wholly-owned subsidiaries or joint ventures, manufacturing facilities located in the United States, Australia, Brazil, Canada, China, Colombia, France, Germany, India, Indonesia, Italy, Mexico, the Netherlands, Poland, Portugal, Russia, Turkey, the United Kingdom and Venezuela.
As of December 31, 2015, the Company's business units were aligned into five operating segments. The operating segments consist of North America Welding, Europe Welding, Asia Pacific Welding, South America Welding and The Harris Products Group. The North America Welding segment primarily includes welding operations in the United States, Canada and Mexico. The Europe Welding segment includes welding operations in Europe, Russia, Africa and the Middle East. The Asia Pacific Welding segment primarily includes welding operations in China and Australia. The South America Welding segment primarily includes welding operations in Brazil, Colombia and Venezuela. The Harris Products Group includes the Company's global cutting, soldering and brazing businesses as well as the retail business in the United States. See Note 5 to the Company's consolidated financial statements for segment and geographic area information.
During the first quarter of 2016, the Company realigned its organizational and leadership structure. The new structure will allow for further integration of operational and product development processes across regions and support growth strategies. In accordance with this organizational change, beginning with quarterly reporting for the three months ended March 31, 2016, the Company will report
three
operating segments as follows: Americas Welding, International Welding, and The Harris Products Group.
15
The principal raw materials essential to the Company's business are steel, electronic components, engines, brass, copper, silver, aluminum alloys and various chemicals, all of which are normally available for purchase in the open market.
The Company's facilities are subject to environmental regulations. To date, compliance with these environmental regulations has not had a material adverse effect on the Company's earnings. The Company is ISO 14001 certified at most significant manufacturing facilities in North America and Europe and is progressing towards certification at its remaining facilities worldwide. In addition, the Company is ISO 9001 certified at
38
facilities worldwide.
Key Indicators
Key economic measures relevant to the Company include industrial production trends, steel consumption, purchasing manager indices, capacity utilization within durable goods manufacturers and consumer confidence indicators. Key industries which provide a relative indication of demand drivers to the Company include steel, farm machinery and equipment, construction and transportation, fabricated metals, electrical equipment, ship and boat building, defense, truck manufacturing, energy and railroad equipment. Although these measures provide key information on trends relevant to the Company, the Company does not have available a more direct correlation of leading indicators which can provide a forward-looking view of demand levels in the markets which ultimately use the Company's welding products.
Key operating measures utilized by the operating units to manage the Company include orders, sales, inventory and fill-rates, all of which provide key indicators of business trends. These measures are reported on various cycles including daily, weekly and monthly depending on the needs established by operating management.
Key financial measures utilized by the Company's executive management and operating units in order to evaluate the results of its business and in understanding key variables impacting the current and future results of the Company include: sales; gross profit; selling, general and administrative expenses; operating income; earnings before interest and taxes; earnings before interest, taxes and bonus; net income; adjusted operating income; adjusted earnings before interest and income taxes, adjusted net income; adjusted diluted earnings per share; operating cash flows; and capital expenditures, including applicable ratios such as return on invested capital and average operating working capital to sales. These measures are reviewed at monthly, quarterly and annual intervals and compared with historical periods, as well as objectives established by the Board of Directors of the Company.
Results of Operations
The following table shows the Company's results of operations:
|
|
Year Ended December 31,
|
||||||||||||||||||||
|
|
2015
|
2014
|
2013
|
||||||||||||||||||
|
|
Amount
|
% of Sales
|
Amount
|
% of Sales
|
Amount
|
% of Sales
|
|||||||||||||||
|
Net sales
|
$
|
2,535,791
|
|
100.0
|
%
|
$
|
2,813,324
|
|
100.0
|
%
|
$
|
2,852,671
|
|
100.0
|
%
|
||||||
|
Cost of goods sold
|
1,694,647
|
|
66.8
|
%
|
1,864,027
|
|
66.3
|
%
|
1,910,017
|
|
67.0
|
%
|
|||||||||
|
Gross profit
|
841,144
|
|
33.2
|
%
|
949,297
|
|
33.7
|
%
|
942,654
|
|
33.0
|
%
|
|||||||||
|
Selling, general & administrative
expenses
|
496,748
|
|
19.6
|
%
|
545,497
|
|
19.4
|
%
|
527,206
|
|
18.5
|
%
|
|||||||||
|
Rationalization and asset impairment
charges
|
19,958
|
|
0.8
|
%
|
30,053
|
|
1.1
|
%
|
8,463
|
|
0.3
|
%
|
|||||||||
|
Pension settlement charges
|
142,738
|
|
5.6
|
%
|
—
|
|
—
|
|
—
|
|
—
|
|
|||||||||
|
Operating income
|
181,700
|
|
7.2
|
%
|
373,747
|
|
13.3
|
%
|
406,985
|
|
14.3
|
%
|
|||||||||
|
Interest income
|
2,714
|
|
0.1
|
%
|
3,093
|
|
0.1
|
%
|
3,320
|
|
0.1
|
%
|
|||||||||
|
Equity earnings in affiliates
|
3,015
|
|
0.1
|
%
|
5,412
|
|
0.2
|
%
|
4,806
|
|
0.2
|
%
|
|||||||||
|
Other income
|
4,182
|
|
0.2
|
%
|
3,995
|
|
0.1
|
%
|
4,194
|
|
0.1
|
%
|
|||||||||
|
Interest expense
|
(21,824
|
)
|
(0.9
|
%)
|
(10,434
|
)
|
(0.4
|
%)
|
(2,864
|
)
|
(0.1
|
%)
|
|||||||||
|
Income before income taxes
|
169,787
|
|
6.7
|
%
|
375,813
|
|
13.4
|
%
|
416,441
|
|
14.6
|
%
|
|||||||||
|
Income taxes
|
42,375
|
|
1.7
|
%
|
121,933
|
|
4.3
|
%
|
124,754
|
|
4.4
|
%
|
|||||||||
|
Net income including non-controlling
interests
|
127,412
|
|
5.0
|
%
|
253,880
|
|
9.0
|
%
|
291,687
|
|
10.2
|
%
|
|||||||||
|
Non-controlling interests in
subsidiaries' loss
|
(66
|
)
|
—
|
|
(806
|
)
|
—
|
|
(2,093
|
)
|
(0.1
|
%)
|
|||||||||
|
Net income
|
$
|
127,478
|
|
5.0
|
%
|
$
|
254,686
|
|
9.1
|
%
|
$
|
293,780
|
|
10.3
|
%
|
||||||
16
2015
Compared with
2014
Net Sales:
Net sales for
2015
decreased
9.9%
from
2014
. The sales decrease reflects volume decreases of
8.0%
, price increases of
4.0%
, increases from acquisitions of
2.2%
and unfavorable impacts from foreign exchange of
8.1%
. Sales volumes decreased as a result of softer demand associated with the current economic environment and weakness in oil & gas and U.S. export markets. Product pricing increased from prior year levels, reflecting the highly inflationary environment in Venezuela partially offset by pricing declines in The Harris Products Group due to decreases in the costs of silver and copper. Net sales for
2015
include
$84,662
in sales from the Company's Venezuelan operations compared with
$71,793
in sales from the Company's Venezuelan operations in
2014
.
Gross Profit:
Gross profit
decreased
11.4%
to
$841,144
during
2015
compared with
$949,297
in
2014
. As a percentage of Net sales, Gross profit
decreased
to
33.2%
in
2015
compared with
33.7%
in
2014
. The year ended
December 31, 2015
includes
$22,880
, or
0.9%
of sales, of inventory charges reflecting remeasurement losses in Venezuela related to the adoption of a new foreign exchange mechanism and higher warranty costs of $5,934. The year ended
December 31, 2015
also includes a LIFO credit of
$11,545
compared with a charge of
$429
in the prior year period. The prior year period also includes a gain of
$3,946
from an insurance settlement. Foreign currency exchange rates had a
$62,330
unfavorable translation impact in
2015
.
Selling, General & Administrative ("SG&A") Expenses:
SG&A expenses
decreased
8.9%
to
$496,748
during
2015
compared with
$545,497
in
2014
. The decrease was primarily due to lower bonus expense of
$28,705
and lower foreign exchange transaction losses of
$17,030
, partially offset by higher general and administrative spending of
$24,720
and incremental SG&A expenses from acquisitions of
$8,780
. Foreign exchange transaction losses in
2015
include a charge of
$4,334
, compared with a charge of
$17,665
in
2014
, relating to Venezuelan foreign exchange remeasurement losses as a result of the adoption of a new foreign exchange mechanism. Foreign currency exchange rates had a
$33,229
favorable translation impact on SG&A expenses in
2015
.
Rationalization and Asset Impairment Charges:
In
2015
, the Company recorded
$19,958
in charges
primarily related to
employee severance and other related costs and
non-cash goodwill and asset impairment charges
. See "Rationalization and Asset Impairments" for additional information.
Pension Settlement Charges:
In
2015
, the Company recorded non-cash pension settlement charges of
$142,738
,
$87,310
after-tax, primarily related to the purchase of a group annuity contract. See Note 11, "Retirement Annuity and Guaranteed Continuous Employment Plans" for additional information.
Equity Earnings in Affiliates:
Equity earnings in affiliates were
$3,015
in
2015
compared with earnings of
$5,412
in
2014
. The decrease was primarily due to a decrease in earnings in Turkey.
Interest Expense:
Interest expense increased to
$21,824
in
2015
from
$10,434
in
2014
. The increase was due to an adjustment to the consideration expected to be paid to acquire additional ownership interests of a majority-owned subsidiary and interest accrued on higher borrowings.
Income Taxes:
The Company recorded
$42,375
of tax expense on pre-tax income of
$169,787
, resulting in an effective tax rate of
25.0%
for
2015
compared with an effective income tax rate of
32.4%
for
2014
. The effective income tax rate is lower in
2015
as compared to
2014
primarily due to higher U.S. tax credits in 2015 and changes in the mix of earnings between tax rate jurisdictions.
Net Income:
Net income for
2015
was
$127,478
compared with
$254,686
in the prior year. Diluted earnings per share for
2015
were
$1.70
compared with diluted earnings of
$3.18
per share in
2014
. Net income for
2015
includes non-cash pension settlement charges of
$87,310
, non-cash Venezuelan remeasurement losses of
$27,214
related to the adoption of a new foreign exchange mechanism and net rationalization and asset impairment charges of
$18,182
. Foreign currency exchange rate movements had an unfavorable translation effect of
$11,390
on Net income for
2015
.
17
Segment Results
Net Sales:
The table below summarizes the impacts of volume, acquisitions, price and foreign currency exchange rates on Net sales for the twelve months ended
December 31, 2015
:
|
|
|
Change in Net Sales due to:
|
|
|||||||||||||||||||||
|
|
Net Sales
2014
|
Volume
|
Acquisitions
|
Price
|
Foreign Exchange
|
Net Sales
2015
|
||||||||||||||||||
|
Operating Segments
|
|
|
|
|
|
|
|
|
|
|
|
|
||||||||||||
|
North America Welding
|
$
|
1,700,924
|
|
$
|
(129,921
|
)
|
$
|
57,333
|
|
$
|
14,944
|
|
$
|
(32,923
|
)
|
$
|
1,610,357
|
|
||||||
|
Europe Welding
|
425,775
|
|
(18,179
|
)
|
—
|
|
(2,285
|
)
|
(68,487
|
)
|
336,824
|
|
||||||||||||
|
Asia Pacific Welding
|
243,800
|
|
(49,501
|
)
|
5,295
|
|
(2,511
|
)
|
(10,468
|
)
|
186,615
|
|
||||||||||||
|
South America Welding
|
148,595
|
|
(24,240
|
)
|
—
|
|
116,765
|
|
(103,106
|
)
|
138,014
|
|
||||||||||||
|
The Harris Products Group
|
294,230
|
|
(2,168
|
)
|
—
|
|
(15,746
|
)
|
(12,335
|
)
|
263,981
|
|
||||||||||||
|
Consolidated
|
$
|
2,813,324
|
|
$
|
(224,009
|
)
|
$
|
62,628
|
|
$
|
111,167
|
|
$
|
(227,319
|
)
|
$
|
2,535,791
|
|
||||||
|
Consolidated (excluding Venezuela)
|
$
|
2,741,531
|
|
$
|
(211,098
|
)
|
$
|
62,628
|
|
$
|
(2,598
|
)
|
$
|
(139,334
|
)
|
$
|
2,451,129
|
|
||||||
|
% Change
|
|
|
|
|
|
|
|
|
|
|
|
|
||||||||||||
|
North America Welding
|
|
|
(7.6
|
%)
|
3.4
|
%
|
0.9
|
%
|
(1.9
|
%)
|
(5.3
|
%)
|
||||||||||||
|
Europe Welding
|
|
|
(4.3
|
%)
|
—
|
|
(0.5
|
%)
|
(16.1
|
%)
|
(20.9
|
%)
|
||||||||||||
|
Asia Pacific Welding
|
|
|
(20.3
|
%)
|
2.2
|
%
|
(1.0
|
%)
|
(4.3
|
%)
|
(23.5
|
%)
|
||||||||||||
|
South America Welding
|
|
|
(16.3
|
%)
|
—
|
|
78.6
|
%
|
(69.4
|
%)
|
(7.1
|
%)
|
||||||||||||
|
The Harris Products Group
|
|
|
(0.7
|
%)
|
—
|
|
(5.4
|
%)
|
(4.2
|
%)
|
(10.3
|
%)
|
||||||||||||
|
Consolidated
|
|
|
(8.0
|
%)
|
2.2
|
%
|
4.0
|
%
|
(8.1
|
%)
|
(9.9
|
%)
|
||||||||||||
|
Consolidated (excluding Venezuela)
|
(7.7
|
%)
|
2.3
|
%
|
(0.1
|
%)
|
(5.1
|
%)
|
(10.6
|
%)
|
||||||||||||||
Net sales volumes for
2015
decreased for all operating segments due to softer demand associated with the current economic environment and weakness in oil & gas and U.S. export markets. The decrease in net sales volumes in Asia Pacific Welding is also due to continued strategic repositioning in the market. Product pricing in South America Welding reflects a highly inflationary environment, particularly in Venezuela. Product pricing decreased for The Harris Products Group because of decreases in the costs of silver and copper as compared to the prior year period. The increase in Net sales from acquisitions was due to the acquisition of Rimrock Holdings Corporation and Easom Automation Systems, Inc. ("Easom") within North America Welding (see Note 3 to the consolidated financial statements for a discussion of the Company's recent acquisitions). With respect to changes in Net sales due to foreign exchange, all segments decreased due to a stronger U.S. dollar.
18
Earnings Before Interest and Income Taxes (“EBIT”), as Adjusted:
Segment performance is measured and resources are allocated based on a number of factors, the primary profit measure being EBIT, as adjusted. The following table presents EBIT, as adjusted for
2015
by segment compared with
2014
:
|
Twelve Months Ended
|
||||||||||||||
|
December 31,
|
||||||||||||||
|
2015
|
2014
|
$ Change
|
% Change
|
|||||||||||
|
North America Welding:
|
||||||||||||||
|
Net sales
|
$
|
1,610,357
|
|
$
|
1,700,924
|
|
(90,567
|
)
|
(5.3
|
%)
|
||||
|
Inter-segment sales
|
100,770
|
|
124,732
|
|
(23,962
|
)
|
(19.2
|
%)
|
||||||
|
Total Sales
|
$
|
1,711,127
|
|
$
|
1,825,656
|
|
(114,529
|
)
|
(6.3
|
%)
|
||||
|
EBIT, as adjusted
|
$
|
306,746
|
|
$
|
335,465
|
|
(28,719
|
)
|
(8.6
|
%)
|
||||
|
As a percent of total sales
|
17.9
|
%
|
18.4
|
%
|
(0.5
|
%)
|
||||||||
|
Europe Welding:
|
||||||||||||||
|
Net sales
|
$
|
336,824
|
|
$
|
425,775
|
|
(88,951
|
)
|
(20.9
|
%)
|
||||
|
Inter-segment sales
|
15,922
|
|
19,586
|
|
(3,664
|
)
|
(18.7
|
%)
|
||||||
|
Total Sales
|
$
|
352,746
|
|
$
|
445,361
|
|
(92,615
|
)
|
(20.8
|
%)
|
||||
|
EBIT, as adjusted
|
$
|
31,317
|
|
$
|
48,822
|
|
(17,505
|
)
|
(35.9
|
%)
|
||||
|
As a percent of total sales
|
8.9
|
%
|
11.0
|
%
|
(2.1
|
%)
|
||||||||
|
Asia Pacific Welding:
|
||||||||||||||
|
Net sales
|
$
|
186,615
|
|
$
|
243,800
|
|
(57,185
|
)
|
(23.5
|
%)
|
||||
|
Inter-segment sales
|
10,510
|
|
14,820
|
|
(4,310
|
)
|
(29.1
|
%)
|
||||||
|
Total Sales
|
$
|
197,125
|
|
$
|
258,620
|
|
(61,495
|
)
|
(23.8
|
%)
|
||||
|
EBIT, as adjusted
|
$
|
7,392
|
|
$
|
1,321
|
|
6,071
|
|
459.6
|
%
|
||||
|
As a percent of total sales
|
3.7
|
%
|
0.5
|
%
|
3.2
|
%
|
||||||||
|
South America Welding:
|
||||||||||||||
|
Net sales
|
$
|
138,014
|
|
$
|
148,595
|
|
(10,581
|
)
|
(7.1
|
%)
|
||||
|
Inter-segment sales
|
174
|
|
144
|
|
30
|
|
20.8
|
%
|
||||||
|
Total Sales
|
$
|
138,188
|
|
$
|
148,739
|
|
(10,551
|
)
|
(7.1
|
%)
|
||||
|
EBIT, as adjusted
|
$
|
5,569
|
|
$
|
15,953
|
|
(10,384
|
)
|
(65.1
|
%)
|
||||
|
As a percent of total sales
|
4.0
|
%
|
10.7
|
%
|
(6.7
|
%)
|
||||||||
|
The Harris Products Group:
|
||||||||||||||
|
Net sales
|
$
|
263,981
|
|
$
|
294,230
|
|
(30,249
|
)
|
(10.3
|
%)
|
||||
|
Inter-segment sales
|
9,312
|
|
8,210
|
|
1,102
|
|
13.4
|
%
|
||||||
|
Total Sales
|
$
|
273,293
|
|
$
|
302,440
|
|
(29,147
|
)
|
(9.6
|
%)
|
||||
|
EBIT, as adjusted
|
$
|
27,882
|
|
$
|
28,563
|
|
(681
|
)
|
(2.4
|
%)
|
||||
|
As a percent of total sales
|
10.2
|
%
|
9.4
|
%
|
0.8
|
%
|
||||||||
EBIT, as adjusted as a percent of total sales decreased for North America Welding in
2015
as compared with
2014
due to volume decreases. The decrease in Europe Welding is primarily due to unfavorable foreign exchange translation. The Asia Pacific Welding increase was due to lower raw material costs and operational efficiencies partially offset by volume decreases. The South America Welding decrease was a result of lower margins in Venezuela, as well as lower volumes and unfavorable foreign exchange translation in the segment.
19
In
2015
, EBIT, as adjusted, excluded net charges of
$3,298
and
$1,507
in North America Welding and Europe Welding, respectively, primarily related to employee severance and other related costs. North America Welding special items also include non-cash charges of
$6,315
related to the impairment of goodwill and non-cash charges of
$3,417
related to the impairment of long-lived assets. Asia Pacific Welding special items reflect net charges of
$5,432
primarily related to employee severance and other costs and adjustments to reclassify a potential divestiture that was previously held-for-sale. South America Welding special items reflect Venezuelan foreign exchange remeasurement losses of
$27,214
related to the adoption of a new foreign exchange mechanism. In addition to special items listed above,
2015
EBIT, as adjusted excludes non-cash pension settlement charges of
$142,738
primarily related to the purchase of a group annuity contract.
In
2014
, EBIT, as adjusted, excluded net charges primarily related to employee severance and other costs associated with the consolidation of manufacturing operations. Asia Pacific Welding EBIT, as adjusted, also excluded charges of
$32,742
related to impairment of long-lived assets and a gain of
$3,930
related to the sale of assets. South America Welding EBIT, as adjusted, excluded special item charges of
$21,133
, related to the adoption of a new foreign exchange mechanism.
2014
Compared with
2013
Net Sales:
Net sales for
2014
decreased
1.4%
from
2013
. The sales decrease reflects volume decreases of
2.0%
, price increases of
1.8%
, increases from acquisitions of
1.5%
and unfavorable impacts from foreign exchange of
2.6%
. Sales volumes decreased primarily as a result of softer volumes in South America Welding. Product pricing increased from prior year levels, reflecting the highly inflationary environment in Venezuela partially offset by pricing declines in The Harris Products Group due to decreases in the costs of silver and copper. Net sales for
2014
include
$71,793
in sales from the Company's Venezuelan operations compared with
$109,139
in sales from the Company's Venezuelan operations in 2013.
Gross Profit:
Gross profit increased
0.7%
to
$949,297
during
2014
compared with
$942,654
in
2013
. As a percentage of Net sales, Gross profit increased to
33.7%
in
2014
compared with
33.0%
in
2013
. The increase was the result of geographic mix and operations improvements. Foreign currency exchange rates had a
$28,377
unfavorable translation impact in
2014
, which includes
$3,468
related to the liquidation of Venezuelan inventory valued at a historical exchange rate.
SG&A Expenses:
SG&A expenses increased
3.5%
to
$545,497
during
2014
compared with
$527,206
in
2013
. The increase was primarily due to higher foreign exchange transaction losses of
$16,472
, incremental SG&A expenses from acquisition of
$8,051
and higher bonus expense of
$5,511
. Foreign exchange transaction losses in
2014
include a charge of
$17,665
relating to a Venezuelan remeasurement loss compared with a charge of
$8,081
in
2013
due to a devaluation of the Venezuelan currency. Foreign currency exchange rates had a
$14,627
favorable translation impact on SG&A expenses in
2014
.
Rationalization and Asset Impairment Charges:
In
2014
, the Company recorded
$30,053
in charges primarily related to non-cash long-lived asset impairment charges partially offset by gains on the sales of assets. See "Rationalization and Asset Impairments" for additional information.
Equity Earnings in Affiliates:
Equity earnings in affiliates were
$5,412
in
2014
compared with earnings of
$4,806
in
2013
. The increase was primarily due to an increase in earnings in Turkey.
Interest Expense:
Interest expense increased to
$10,434
in
2014
from
$2,864
in
2013
. The increase was due to an adjustment to the consideration expected to be paid to acquire additional ownership interests of a majority-owned subsidiary.
Income Taxes:
The Company recorded
$121,933
of tax expense on pre-tax income of
$375,813
, resulting in an effective tax rate of
32.4%
for
2014
compared with an effective tax rate of
30.0%
for
2013
. The effective income tax rate is lower in
2013
as compared with
2014
primarily due to income earned in lower tax rate jurisdictions.
Net Income:
Net income for
2014
was
$254,686
compared with
$293,780
in the prior year. Diluted earnings per share for
2014
were
$3.18
compared with diluted earnings of
$3.54
per share in
2013
. Net income for 2014 included a loss of $8,238, or $0.10 per diluted share, from the Company's Venezuelan operations compared with Net income of
$25,614
, or
$0.31
per diluted share, from the Company's Venezuelan operations in 2013. Foreign currency exchange rate movements had an unfavorable translation effect of
$8,258
for
2014
.
20
Segment Results
Net Sales:
The table below summarizes the impacts of volume, acquisitions, price and foreign currency exchange rates on Net sales for the twelve months ended December 31,
2014
:
|
|
|
Change in Net Sales due to:
|
|
|||||||||||||||||||||
|
|
Net Sales
2013
|
Volume
|
Acquisitions
|
Price
|
Foreign
Exchange
|
Net Sales
2014
|
||||||||||||||||||
|
Operating Segments
|
|
|
|
|
|
|
||||||||||||||||||
|
North America Welding
|
$
|
1,652,769
|
|
$
|
4,335
|
|
$
|
42,184
|
|
$
|
13,247
|
|
$
|
(11,611
|
)
|
$
|
1,700,924
|
|
||||||
|
Europe Welding
|
429,548
|
|
8,107
|
|
—
|
|
(3,722
|
)
|
(8,158
|
)
|
425,775
|
|
||||||||||||
|
Asia Pacific Welding
|
266,282
|
|
(17,516
|
)
|
—
|
|
1,351
|
|
(6,317
|
)
|
243,800
|
|
||||||||||||
|
South America Welding
|
195,895
|
|
(59,554
|
)
|
—
|
|
57,461
|
|
(45,207
|
)
|
148,595
|
|
||||||||||||
|
The Harris Products Group
|
308,177
|
|
6,722
|
|
—
|
|
(18,411
|
)
|
(2,258
|
)
|
294,230
|
|
||||||||||||
|
Consolidated
|
$
|
2,852,671
|
|
$
|
(57,906
|
)
|
$
|
42,184
|
|
$
|
49,926
|
|
$
|
(73,551
|
)
|
$
|
2,813,324
|
|
||||||
|
Consolidated (excluding Venezuela)
|
$
|
2,743,532
|
|
$
|
(3,840
|
)
|
$
|
42,184
|
|
$
|
(3,997
|
)
|
$
|
(36,348
|
)
|
$
|
2,741,531
|
|
||||||
|
% Change
|
|
|
|
|
|
|
||||||||||||||||||
|
North America Welding
|
|
|
0.3
|
%
|
2.6
|
%
|
0.8
|
%
|
(0.7
|
%)
|
2.9
|
%
|
||||||||||||
|
Europe Welding
|
|
|
1.9
|
%
|
—
|
|
(0.9
|
%)
|
(1.9
|
%)
|
(0.9
|
%)
|
||||||||||||
|
Asia Pacific Welding
|
|
|
(6.6
|
%)
|
—
|
|
0.5
|
%
|
(2.4
|
%)
|
(8.4
|
%)
|
||||||||||||
|
South America Welding
|
|
|
(30.4
|
%)
|
—
|
|
29.3
|
%
|
(23.1
|
%)
|
(24.1
|
%)
|
||||||||||||
|
The Harris Products Group
|
|
|
2.2
|
%
|
—
|
|
(6.0
|
%)
|
(0.7
|
%)
|
(4.5
|
%)
|
||||||||||||
|
Consolidated
|
|
|
(2.0
|
%)
|
1.5
|
%
|
1.8
|
%
|
(2.6
|
%)
|
(1.4
|
%)
|
||||||||||||
|
Consolidated (excluding Venezuela)
|
(0.1
|
%)
|
1.5
|
%
|
(0.1
|
%)
|
(1.3
|
%)
|
(0.1
|
%)
|
||||||||||||||
Net sales volumes for 2014 decreased for South America Welding due to the lack of available raw materials in Venezuela and Asia Pacific Welding due to lower demand and strategic repositioning in the market. North America Welding, Europe Welding and The Harris Products Group increased as a result of stronger end market demand in those geographies. Product pricing in South America Welding reflects a highly inflationary environment, particularly in Venezuela. Product pricing decreased for The Harris Products Group because of decreases in the costs of silver and copper. The increase in Net sales from acquisitions was due to the acquisitions of Easom, Robolution GmbH ("Robolution") and Burlington Automation Corporation ("Burlington") within North America Welding (see Note 3 to the consolidated financial statements for additional information regarding the acquisitions). With respect to changes in Net sales due to foreign exchange, all segments decreased due to a stronger U.S. dollar.
21
EBIT, as Adjusted:
Segment performance is measured and resources are allocated based on a number of factors, the primary profit measure being EBIT, as adjusted. The following table presents EBIT, as adjusted for
2014
by segment compared with
2013
:
|
Twelve Months Ended
|
||||||||||||||
|
December 31,
|
||||||||||||||
|
2014
|
2013
|
$ Change
|
% Change
|
|||||||||||
|
North America Welding:
|
||||||||||||||
|
Net sales
|
$
|
1,700,924
|
|
$
|
1,652,769
|
|
48,155
|
|
2.9
|
%
|
||||
|
Inter-segment sales
|
124,732
|
|
127,254
|
|
(2,522
|
)
|
(2.0
|
%)
|
||||||
|
Total Sales
|
$
|
1,825,656
|
|
$
|
1,780,023
|
|
45,633
|
|
2.6
|
%
|
||||
|
EBIT, as adjusted
|
$
|
335,465
|
|
$
|
318,507
|
|
16,958
|
|
5.3
|
%
|
||||
|
As a percent of total sales
|
18.4
|
%
|
17.9
|
%
|
0.5
|
%
|
||||||||
|
Europe Welding:
|
||||||||||||||
|
Net sales
|
$
|
425,775
|
|
$
|
429,548
|
|
(3,773
|
)
|
(0.9
|
%)
|
||||
|
Inter-segment sales
|
19,586
|
|
19,911
|
|
(325
|
)
|
(1.6
|
%)
|
||||||
|
Total Sales
|
$
|
445,361
|
|
$
|
449,459
|
|
(4,098
|
)
|
(0.9
|
%)
|
||||
|
EBIT, as adjusted
|
$
|
48,822
|
|
$
|
36,247
|
|
12,575
|
|
34.7
|
%
|
||||
|
As a percent of total sales
|
11.0
|
%
|
8.1
|
%
|
2.9
|
%
|
||||||||
|
Asia Pacific Welding:
|
||||||||||||||
|
Net sales
|
$
|
243,800
|
|
$
|
266,282
|
|
(22,482
|
)
|
(8.4
|
%)
|
||||
|
Inter-segment sales
|
14,820
|
|
14,906
|
|
(86
|
)
|
(0.6
|
%)
|
||||||
|
Total Sales
|
$
|
258,620
|
|
$
|
281,188
|
|
(22,568
|
)
|
(8.0
|
%)
|
||||
|
EBIT, as adjusted
|
$
|
1,321
|
|
$
|
1,815
|
|
(494
|
)
|
(27.2
|
%)
|
||||
|
As a percent of total sales
|
0.5
|
%
|
0.6
|
%
|
(0.1
|
%)
|
||||||||
|
South America Welding:
|
||||||||||||||
|
Net sales
|
$
|
148,595
|
|
$
|
195,895
|
|
(47,300
|
)
|
(24.1
|
%)
|
||||
|
Inter-segment sales
|
144
|
|
233
|
|
(89
|
)
|
(38.2
|
%)
|
||||||
|
Total Sales
|
$
|
148,739
|
|
$
|
196,128
|
|
(47,389
|
)
|
(24.2
|
%)
|
||||
|
EBIT, as adjusted
|
$
|
15,953
|
|
$
|
57,306
|
|
(41,353
|
)
|
(72.2
|
%)
|
||||
|
As a percent of total sales
|
10.7
|
%
|
29.2
|
%
|
(18.5
|
%)
|
||||||||
|
The Harris Products Group:
|
||||||||||||||
|
Net sales
|
$
|
294,230
|
|
$
|
308,177
|
|
(13,947
|
)
|
(4.5
|
%)
|
||||
|
Inter-segment sales
|
8,210
|
|
9,605
|
|
(1,395
|
)
|
(14.5
|
%)
|
||||||
|
Total Sales
|
$
|
302,440
|
|
$
|
317,782
|
|
(15,342
|
)
|
(4.8
|
%)
|
||||
|
EBIT, as adjusted
|
$
|
28,563
|
|
$
|
27,826
|
|
737
|
|
2.6
|
%
|
||||
|
As a percent of total sales
|
9.4
|
%
|
8.8
|
%
|
0.6
|
%
|
||||||||
EBIT, as adjusted as a percent of total sales increased for North America Welding in
2014
as compared with
2013
due to operational improvements and lower pension expense, partially offset by higher SG&A expenses. The increase for Europe Welding is primarily due to volume increases, lower manufacturing costs and improved product mix, partially offset by higher SG&A expenses. The South America Welding decrease was a result of lower volumes related to disruptions of manufacturing operations due to the lack of available raw materials in Venezuela and higher SG&A expenses due to foreign exchange losses in Venezuela. The South America Welding
2013
results include the effect of the highly inflationary environment in Venezuela.
22
In
2014
, EBIT, as adjusted, excluded net charges primarily related to employee severance and other costs associated with the consolidation of manufacturing operations. Asia Pacific Welding EBIT, as adjusted, also excluded charges of
$32,742
related to impairment of long-lived assets and a gain of
$3,930
related to the sale of assets. South America Welding EBIT, as adjusted, excluded special item charges of
$21,133
related to the adoption of a new foreign exchange mechanism.
In
2013
, EBIT, as adjusted, excluded special items charges primarily related to employee severance and other costs associated with the consolidation of manufacturing operations. Asia Pacific Welding EBIT, as adjusted, also excluded charges of $4,444 related to impairment of long-lived assets and a charge of
$705
related to a loss on the sale of land. South America Welding EBIT, as adjusted, excluded special item charges of
$12,198
related to the devaluation of the Venezuelan currency.
Non-GAAP Financial Measures
The Company reviews Adjusted operating income, Adjusted net income, Adjusted diluted earnings per share and Return on invested capital, all non-GAAP financial measures, in assessing and evaluating the Company's underlying operating performance. These non-GAAP financial measures exclude the impact of special items on the Company's reported financial results. Non-GAAP financial measures should be read in conjunction with the generally accepted accounting principles in the United States ("GAAP") financial measures, as non-GAAP measures are a supplement to, and not a replacement for, GAAP financial measures. From time to time management evaluates and discloses to investors the non-GAAP measure Free cash flow ("FCF"). FCF is defined as Net cash provided by operating activities less Capital expenditures.
The following table presents a reconciliation of Operating income as reported to Adjusted operating income:
|
|
Year Ended December 31,
|
|||||||||||
|
|
2015
|
2014
|
2013
|
|||||||||
|
Operating income as reported
|
$
|
181,700
|
|
$
|
373,747
|
|
$
|
406,985
|
|
|||
|
Special items (pre-tax):
|
|
|
|
|||||||||
|
Rationalization and asset impairment charges
|
19,958
|
|
30,053
|
|
8,463
|
|
||||||
|
Venezuela remeasurement losses
|
27,214
|
|
21,133
|
|
12,198
|
|
||||||
|
Pension settlement charges
|
142,738
|
|
—
|
|
—
|
|
||||||
|
Loss on the sale of land
|
—
|
|
—
|
|
705
|
|
||||||
|
Adjusted operating income
|
$
|
371,610
|
|
$
|
424,933
|
|
$
|
427,646
|
|
|||
Special items included in Operating income during
2015
include net rationalization and asset impairment charges which primarily consist of
employee severance and other related costs of
$13,719
,
a non-cash goodwill impairment charge of
$6,315
and net
non-cash asset impairment charges. Special items for
2015
also include pension settlement charges and Venezuelan foreign exchange remeasurement losses related to the adoption of a new foreign exchange mechanism.
Special items included in Operating income during
2014
include net rationalization and asset impairment charges primarily consisting of non-cash asset impairment charges of
$32,742
offset by gains of
$3,930
related to the sale of assets. Special items for
2014
also include Venezuelan remeasurement losses related to the adoption of a new foreign exchange mechanism.
Special items included in Operating income during
2013
include net rationalization and asset impairment charges primarily related to employee severance and other costs associated with the consolidation of manufacturing operations and impairment of long-lived assets. Special items for
2013
also include charges related to the devaluation of the Venezuelan currency and a loss on the sale of land.
23
The following table presents reconciliations of Net income and Diluted earnings per share as reported to Adjusted net income and Adjusted diluted earnings per share:
|
Year Ended December 31,
|
||||||||||||
|
2015
|
2014
|
2013
|
||||||||||
|
Net income as reported
|
$
|
127,478
|
|
$
|
254,686
|
|
$
|
293,780
|
|
|||
|
Special items (after-tax):
|
|
|
|
|||||||||
|
Rationalization and asset impairment charges
|
18,182
|
|
30,914
|
|
7,573
|
|
||||||
|
Venezuela remeasurement losses
|
27,214
|
|
21,133
|
|
12,198
|
|
||||||
|
Pension settlement charges
|
87,310
|
|
—
|
|
—
|
|
||||||
|
Loss on the sale of land
|
—
|
|
—
|
|
705
|
|
||||||
|
Special items attributable to non-controlling interests
|
—
|
|
(805
|
)
|
(1,068
|
)
|
||||||
|
Adjusted net income
|
$
|
260,184
|
|
$
|
305,928
|
|
$
|
313,188
|
|
|||
|
Diluted earnings per share as reported
|
$
|
1.70
|
|
$
|
3.18
|
|
$
|
3.54
|
|
|||
|
Special items per share
|
1.78
|
|
0.64
|
|
0.23
|
|
||||||
|
Adjusted diluted earnings per share
|
$
|
3.48
|
|
$
|
3.82
|
|
$
|
3.77
|
|
|||
Net income for
2015
includes net rationalization and asset impairment which primarily consist of
employee severance and other related costs of
$11,943
, a
non-cash goodwill impairment charge of
$6,315
and net
non-cash asset impairment charges. Special items for
2015
also include pension settlement charges and Venezuelan remeasurement losses related to the adoption of a new foreign exchange mechanism. Adjusted net income for
2015
includes
$3,209
, or
$0.05
per diluted share, from the Company's Venezuelan operations.
Net income for
2014
includes net rationalization and asset impairment charges primarily consisting of non-cash asset impairme
nt charges of
$32,706
partially offset by gains of
$2,754
related
to the sale of assets.
Associated with the impairment of long-lived assets is an offsetting special item of
$805
attributable to non-controlling interests. Special items for
2014
also include Venezuelan remeasurement losses related to the adoption of a new foreign exchange mechanism. Adjusted net income for
2014
includes
$13,279
, or
$0.17
per diluted share, from the Company's Venezuelan operations.
Net income for
2013
includes net rationalization and asset impairment charges primarily related to employee severance and other costs associated with the consolidation of manufacturing operations and impairment of long-lived assets and a loss on the sale of land. Associated with the impairment of long-lived assets and loss on the sale of land is an offsetting special item of
$1,068
attributable to non-controlling interests. Special items for
2013
also include charges related to the devaluation of the Venezuelan currency. Adjusted net income for
2013
includes
$37,812
, or
$0.46
per diluted share, from the Company's Venezuelan operations.
Liquidity and Capital Resources
The Company's cash flow from operations can be cyclical. Operational cash flow is a key driver of liquidity, providing cash and access to capital markets. In assessing liquidity, the Company reviews working capital measurements to define areas for improvement. Management anticipates the Company will be able to satisfy cash requirements for its ongoing businesses for the foreseeable future primarily with cash generated by operations, existing cash balances, borrowings under its existing credit facilities and raising debt in capital markets.
The Company continues to expand globally and periodically looks at transactions that would involve significant investments. The Company can fund its global expansion plans with operational cash flow, but a significant acquisition may require access to capital markets, in particular, the long-term debt market, as well as the syndicated bank loan market. The Company’s financing strategy is to fund itself at the lowest after-tax cost of funding. Where possible, the Company utilizes operational cash flows and raises capital in the most efficient market, usually the United States, and then lends funds to the specific subsidiary that requires funding. If additional acquisitions providing appropriate financial benefits become available, additional expenditures may be made.
24
The following table reflects changes in key cash flow measures:
|
Year Ended December 31,
|
$ Change
|
|||||||||||||||||||
|
2015
|
2014
|
2013
|
2015 vs. 2014
|
2014 vs. 2013
|
||||||||||||||||
|
Cash provided by operating activities
|
$
|
310,858
|
|
$
|
401,702
|
|
$
|
338,894
|
|
$
|
(90,844
|
)
|
$
|
62,808
|
|
|||||
|
Cash used by investing activities:
|
(85,352
|
)
|
(78,985
|
)
|
(129,500
|
)
|
(6,367
|
)
|
50,515
|
|
||||||||||
|
Capital expenditures
|
(50,507
|
)
|
(72,990
|
)
|
(76,015
|
)
|
22,483
|
|
3,025
|
|
||||||||||
|
Acquisition of businesses, net of cash acquired
|
(37,076
|
)
|
(24,230
|
)
|
(53,161
|
)
|
(12,846
|
)
|
28,931
|
|
||||||||||
|
Cash used by financing activities:
|
(169,908
|
)
|
(314,355
|
)
|
(194,184
|
)
|
144,447
|
|
(120,171
|
)
|
||||||||||
|
Proceeds from (payments on) short-term borrowings, net
|
(34,229
|
)
|
47,876
|
|
(1,451
|
)
|
(82,105
|
)
|
49,327
|
|
||||||||||
|
Proceeds from (payments on) long-term borrowings, net
|
350,835
|
|
5,455
|
|
(389
|
)
|
345,380
|
|
5,844
|
|
||||||||||
|
Proceeds from exercise of stock options
|
5,996
|
|
9,116
|
|
20,297
|
|
(3,120
|
)
|
(11,181
|
)
|
||||||||||
|
Excess tax benefit from stock-based compensation
|
1,974
|
|
5,967
|
|
10,602
|
|
(3,993
|
)
|
(4,635
|
)
|
||||||||||
|
Purchase of shares for treasury
|
(399,494
|
)
|
(307,178
|
)
|
(167,879
|
)
|
(92,316
|
)
|
(139,299
|
)
|
||||||||||
|
Cash dividends paid to shareholders
|
(86,968
|
)
|
(73,261
|
)
|
(49,277
|
)
|
(13,707
|
)
|
(23,984
|
)
|
||||||||||
|
Increase (decrease) in Cash and cash equivalents
|
25,804
|
|
(21,446
|
)
|
13,361
|
|
|
|
|
|
||||||||||
Cash and cash equivalents
increased
9.3%
, or
$25,804
, to
$304,183
during the twelve months ended
December 31, 2015
, from
$278,379
as of
December 31, 2014
. This increase was predominantly due to the cash provided from operating activities and proceeds from the issuance of Senior Unsecured Notes (the "Notes") of $350,000 (see the "Debt" section below for additional information) partially offset by purchases of common shares for treasury of
$399,494
. At
December 31, 2015
,
$223,567
of Cash and cash equivalents was held by international subsidiaries and may be subject to U.S. income taxes and foreign withholding taxes if repatriated to the U.S.
Cash provided by operating activities
decreased
$90,844
for the
twelve months ended December 31, 2015
compared with the
twelve months ended December 31, 2014
. The decrease was predominantly due to higher contributions to U.S. pension plans of $25,949, lower cash refunds from a Canadian tax deposit of $25,306 and lower earnings offset by less investment in net operating working capital of $63,604. Net operating working capital is defined as the sum of Accounts receivable and Total inventory less Trade accounts payable. Net operating working capital to sales, defined as net operating working capital divided by annualized rolling three months of Net sales, remained consistent at
17.1%
at
December 31, 2015
compared with
17.1%
at
December 31, 2014
. Days sales in inventory
decreased
to
89.2
days at
December 31, 2015
from
94.7
days at
December 31, 2014
. Accounts receivable days
decreased
to
46.9
days at
December 31, 2015
from
47.8
days at
December 31, 2014
. Average days in accounts payable
decreased
to
38.7
days at
December 31, 2015
from
46.6
days at
December 31, 2014
.
Cash used by investing activities
increased
by
$6,367
in the
twelve months ended December 31, 2015
compared with the
twelve months ended December 31, 2014
. The increase was predominantly due to
an increase
in the acquisition of businesses of
$12,846
and a decrease in proceeds from the sale of property, plant and equipment of
$15,147
offset by a decrease in capital expenditures of $22,483. The Company anticipates capital expenditures of
$65,000
to
$75,000
in
2016
. Anticipated capital expenditures reflect investments for capital maintenance to improve operational effectiveness and the Company's continuing international expansion. Management critically evaluates all proposed capital expenditures and requires each project to increase efficiency, reduce costs, promote business growth, or to improve the overall safety and environmental conditions of the Company's facilities.
Cash used by financing activities
decreased
$144,447
in the
twelve months ended December 31, 2015
compared with the
twelve months ended December 31, 2014
. The
decrease
was predominantly due to proceeds from the Notes of $350,000 offset by increased net payments of short-term borrowings of $82,105, higher purchases of common shares for treasury of $92,316 and higher cash dividends paid to shareholders of $13,707.
The Company's debt levels
increased
from
$70,654
at
December 31, 2014
to
$354,625
at
December 31, 2015
due to the issuance of the Notes. Debt to total invested capital
increased
to
27.6%
at
December 31, 2015
from
5.2%
at
December 31, 2014
.
The Company paid
$86,968
and
$73,261
in cash dividends to its shareholders in the
twelve months ended December 31, 2015
and
2014
, respectively.
25
The Company has a share repurchase program for up to 45 million of the Company's common shares. At management's discretion, the Company repurchases its common shares from time to time in the open market, depending on market conditions, stock price and other factors. During the
twelve months ended December 31, 2015
, the Company purchased a total of
6.6 million
shares at a cost of
$399,494
. As of December 31,
2015
,
4.7 million
shares remained available for repurchase under the stock repurchase program. The Company currently anticipates share repurchases of approximately $400,000 in 2016.
The Company made voluntary contributions to its U.S. defined benefit plans of
$47,124
,
$21,175
and
$75,216
in
2015
,
2014
and
2013
, respectively. The Company expects to voluntarily contribute
$20,000
to U.S. plans in
2016
. Based on current pension funding rules, the Company does not anticipate that contributions to the plans would be required in
2016
.
Canada - Notice of Reassessment
In July 2012, the Company received a Notice of Reassessment (the "Reassessments") from the Canada Revenue Agency in respect to its 2004 to 2010 taxation years to disallow the deductibility of inter-company dividends. The Company appealed the Reassessments to the Tax Court of Canada. As part of the appeals process to the Tax Court of Canada, the Company had elected to deposit the entire amount of the dispute in order to suspend continuing interest charges.
In September 2014, the Department of Justice Canada consented to a judgment, wholly in the Company's favor. In vacating the reassessment, this tax litigation is concluded. In December 2014, the Company received a partial refund of the cash deposit. In the first quarter of 2015, the Company received a refund of
$24,976
which was substantially all of the remaining cash deposit. The Company also received interest on the deposit of
$1,596
.
Rationalization and Asset Impairments
In
2015
, the Company recorded net rationalization and asset impairment charges of
$19,958
resulting from rationalization activities. The
2015
net charges include
$13,719
primarily related to employee severance and other related costs and
$6,315
in an impairment charge to the carrying value of goodwill
In
2014
, the Company recorded net rationalization and asset impairment charges of
$30,053
resulting from rationalization activities. The
2014
net charges include
$1,241
primarily related to employee severance and other related costs and
$32,742
in asset impairment charges, partially offset by gains from sales of assets of
$3,930
.
In
2013
, the Company recorded net rationalization and asset impairment charges of $8,463 resulting from rationalization activities. The
2013
net charges include $3,658 primarily related to employee severance and other related costs and $4,961 in asset impairment charges, partially offset by gains from sales of assets $156.
Fair values of impaired assets were determined using projected discounted cash flows.
Acquisitions
Refer to Note 3 to the consolidated financial statements for a discussion of the Company's recent acquisitions.
At December 31,
2015
and
2014
, the fair value of long-term debt, including the current portion, was approximately
$342,602
and
$9,323
, respectively, which was determined using available market information and methodologies requiring judgment. Since considerable judgment is required in interpreting market information, the fair value of the debt is not necessarily the amount which could be realized in a current market exchange.
Senior Unsecured Notes
On April 1, 2015, the Company entered into a Note Purchase Agreement pursuant to which it agreed to issue the Notes in the aggregate principal amount of $350,000 through a private placement. At
December 31, 2015
, $349,147, net of debt issuance costs of $853, was outstanding and recorded in Long-term debt, less current portion. The proceeds are being used for general corporate purposes. The Notes have maturities ranging from 10 to 30 years with a weighted average effective interest rate of 3.5%, excluding accretion of original issuance costs, and an average tenure of 19 years. Interest is payable semi-annually. The Notes contain certain affirmative and negative covenants. As of
December 31, 2015
, the Company was in compliance with all of its debt covenants.
26
Revolving Credit Agreement
The Company has a line of credit totaling
$400,000
through the Amended and Restated Credit Agreement (the “Credit Agreement”), which was entered into on
September 12, 2014
. The Credit Agreement contains customary affirmative, negative and financial covenants for credit facilities of this type, including limitations on the Company and its subsidiaries with respect to liens, investments, distributions, mergers and acquisitions, dispositions of assets, transactions with affiliates and a fixed charges coverage ratio and total leverage ratio.
As of December 31, 2015, the Company was in compliance with all of its covenants
and had no outstanding borrowings under the Credit Agreement. The Credit Agreement has a
five
-year term and may be increased, subject to certain conditions, by an additional amount up to
$100,000
. The interest rate on borrowings is based on either LIBOR or the prime rate, plus a spread based on the Company’s leverage ratio, at the Company’s election.
Short-term Borrowings
The Company's short-term borrowings included in Amounts due banks were
$2,822
and
$61,155
at December 31,
2015
and
2014
, respectively. Amounts due banks included the outstanding borrowings under the Credit Agreement and the borrowings of foreign subsidiaries at weighted average interest rates of
24.1%
and
3.1%
at
December 31, 2015
and
2014
, respectively.
Return on Invested Capital
The Company reviews return on invested capital ("ROIC") in assessing and evaluating the Company's underlying operating performance. ROIC is a non-GAAP financial measure that the Company believes is a meaningful metric to investors in evaluating the Company’s financial performance and may be different than the method used by other companies to calculate ROIC. ROIC is defined as rolling 12 months of Adjusted net income excluding tax-effected interest income and expense divided by invested capital. Invested capital is defined as total debt, which includes Amounts due banks, Current portion of long-term debt and Long-term debt, less current portions, plus Total equity.
ROIC for the years ended
December 31, 2015
,
2014
and
2013
were as follows:
|
Return on Invested Capital
|
2015
|
2014
|
2013
|
|||||||||
|
Adjusted net income
(1)
|
$
|
260,184
|
|
$
|
305,928
|
|
$
|
313,188
|
|
|||
|
Plus: Interest expense (after-tax)
|
13,469
|
|
6,439
|
|
1,767
|
|
||||||
|
Less: Interest income (after-tax)
|
1,675
|
|
1,909
|
|
2,049
|
|
||||||
|
Net operating profit after taxes
|
271,978
|
|
310,458
|
|
312,906
|
|
||||||
|
Invested capital
|
1,287,073
|
|
1,356,435
|
|
1,549,775
|
|
||||||
|
Return on invested capital
|
21.1
|
%
|
22.9
|
%
|
20.2
|
%
|
||||||
_______________________________________________________________________________
|
(1)
|
See “Non-GAAP Financial Measures” section for a tabular reconciliation of Net income to Adjusted net income.
|
Contractual Obligations and Commercial Commitments
The Company's contractual obligations and commercial commitments as of
December 31, 2015
are as follows:
|
|
Payments Due By Period
|
|||||||||||||||||||
|
|
Total
|
2016
|
2017 to
2018 |
2019 to
2020 |
2021 and
Beyond |
|||||||||||||||
|
Long-term debt, including current portion
|
$
|
352,545
|
|
$
|
1,400
|
|
$
|
630
|
|
$
|
200
|
|
$
|
350,315
|
|
|||||
|
Interest on long-term debt
|
235,968
|
|
12,649
|
|
24,733
|
|
24,679
|
|
173,907
|
|
||||||||||
|
Capital lease obligations
|
111
|
|
62
|
|
44
|
|
5
|
|
—
|
|
||||||||||
|
Short-term debt
|
2,822
|
|
2,822
|
|
—
|
|
—
|
|
—
|
|
||||||||||
|
Interest on short-term debt
|
341
|
|
341
|
|
—
|
|
—
|
|
—
|
|
||||||||||
|
Operating leases
|
41,683
|
|
12,160
|
|
15,357
|
|
8,582
|
|
5,584
|
|
||||||||||
|
Purchase commitments
(1)
|
125,332
|
|
124,228
|
|
909
|
|
195
|
|
—
|
|
||||||||||
|
Total
|
$
|
758,802
|
|
$
|
153,662
|
|
$
|
41,673
|
|
$
|
33,661
|
|
$
|
529,806
|
|
|||||
|
(1)
|
Purchase commitments include contractual obligations for raw materials and services.
|
27
As of
December 31, 2015
, there was
$14,332
of tax liabilities related to unrecognized tax benefits and a
$23,201
liability for deferred compensation. Because of the high degree of uncertainty regarding the timing of future cash outflows associated with these liabilities, the Company is unable to estimate the years in which settlement will occur. See Note 12 and Note 14 to the Company's consolidated financial statements for further discussion. Additionally, in connection with prior acquisitions, there were liabilities with fair values as of
December 31, 2015
of
$9,184
for a contingent consideration arrangement and
$26,484
for a forward contract to acquire an additional ownership interest in a majority owned subsidiary. The amount of future cash flows associated with these liabilities will be contingent upon actual results of the acquired entities. See Note 14 to the Company’s consolidated financial statements for further discussion.
The Company expects to voluntarily contribute
$20,000
to the U.S. defined benefit plans in
2016
.
Stock-Based Compensation
On April 23, 2015, the shareholders of the Company approved the 2015 Equity and Incentive Compensation Plan ("Employee Plan"), which replaced the 2006 Equity and Performance Incentive Plan, as amended ("EPI Plan"). The Employee Plan provides for the granting of options, appreciation rights, restricted shares, restricted stock units and performance-based awards up to an additional
5,400,000
of the Company's common shares. In addition, on April 23, 2015, the shareholders of the Company approved the 2015 Stock Plan for Non-Employee Directors ("2015 Director Plan"), which replaced the 2006 Stock Plan for Non-Employee Directors ("2006 Director Plan"). The 2015 Director Plan provides for the granting of options, restricted shares and restricted stock units up to an additional
300,000
of the Company's common shares. At
December 31, 2015
, there were
5,600,763
common shares available for future grant under all plans.
Under these plans, options, restricted shares and restricted stock units granted were
411,406
in
2015
,
22,909
in
2014
and
357,494
in
2013
. The Company issued common shares from treasury upon all exercises of stock options and the granting of restricted stock awards in
2015
,
2014
and
2013
.
Expense is recognized for all awards of stock-based compensation by allocating the aggregate grant date fair value over the vesting period. No expense is recognized for any stock options, restricted or deferred shares or restricted stock units ultimately forfeited because recipients fail to meet vesting requirements. Total stock-based compensation expense recognized in the Consolidated Statements of Income for
2015
,
2014
and
2013
was
$7,932
,
$8,416
and
$9,734
, respectively, with a related tax benefit of
$3,037
,
$3,222
and
$3,727
, respectively. As of December 31,
2015
, total unrecognized stock-based compensation expense related to non-vested stock options, restricted shares and restricted stock units was
$15,371
, which is expected to be recognized over a weighted average period of approximately
2.9 years
.
The aggregate intrinsic value of options outstanding and exercisable which would have been received by the optionees had all awards been exercised at
December 31, 2015
was
$30,121
and
$30,121
, respectively. The total intrinsic value of options exercised during
2015
,
2014
and
2013
was
$6,879
,
$14,647
and
$26,288
respectively.
Product Liability Costs
Product liability costs incurred are volatile and are largely related to trial activity. The costs associated with these claims are predominantly defense costs which are recognized in the periods incurred.
The long-term impact of the asbestos loss contingency, in the aggregate, on operating results, operating cash flows and access to capital markets is difficult to assess, particularly since claims are in many different stages of development and the Company benefits significantly from cost sharing with co-defendants and insurance carriers. Moreover, the Company has been largely successful to date in its defense of these claims.
Off-Balance Sheet Arrangements
The Company utilizes letters of credit to back certain payment and performance obligations. Letters of credit are subject to limits based on amounts outstanding under the Company's Credit Agreement.
New Accounting Pronouncements
Refer to Note 1 to the consolidated financial statements for a discussion of new accounting pronouncements.
28
Critical Accounting Policies and Estimates
The Company's consolidated financial statements are based on the selection and application of significant accounting policies, which require management to make estimates and assumptions. These estimates and assumptions are reviewed periodically by management and compared to historical trends to determine the accuracy of estimates and assumptions used. If warranted, these estimates and assumptions may be changed as current trends are assessed and updated. Historically, the Company's estimates have been determined to be reasonable. No material changes to the Company's accounting policies were made during
2015
. The Company believes the following accounting policies are some of the more critical judgment areas affecting its financial condition and results of operations.
Legal and Tax Contingencies
The Company, like other manufacturers, is subject from time to time to a variety of civil and administrative proceedings arising in the ordinary course of business. Such claims and litigation include, without limitation, product liability claims, regulatory claims and health, safety and environmental claims, some of which relate to cases alleging asbestos induced illnesses. The costs associated with these claims are predominantly defense costs, which are recognized in the periods incurred. Insurance reimbursements mitigate these costs and, where reimbursements are probable, they are recognized in the applicable period. With respect to costs other than defense costs (i.e., for liability and/or settlement or other resolution), reserves are recorded when it is probable that the contingencies will have an unfavorable outcome. The Company accrues its best estimate of the probable costs after a review of the facts with management and counsel and taking into account past experience. If an unfavorable outcome is determined to be reasonably possible but not probable, or if the amount of loss cannot be reasonably estimated, disclosure would be provided for material claims or litigation. Many of the current cases are in differing procedural stages and information on the circumstances of each claimant, which forms the basis for judgments as to the validity or ultimate disposition of such actions, varies greatly. Therefore, in many situations a range of possible losses cannot be made. Reserves are adjusted as facts and circumstances change and related management assessments of the underlying merits and the likelihood of outcomes change. Moreover, reserves only cover identified and/or asserted claims. Future claims could, therefore, give rise to increases to such reserves.
The Company is subject to taxation from U.S. federal, state, municipal and international jurisdictions. The calculation of current income tax expense is based on the best information available and involves significant management judgment. The actual income tax liability for each jurisdiction in any year can in some instances be ultimately determined several years after the financial statements are published.
The Company maintains reserves for estimated income tax exposures for many jurisdictions. Exposures are settled primarily through the completion of audits within each individual tax jurisdiction or the closing of a statute of limitation. Exposures can also be affected by changes in applicable tax law or other factors, which may cause management to believe a revision of past estimates is appropriate. Management believes that an appropriate liability has been established for income tax exposures; however, actual results may materially differ from these estimates. See Note 12 to the Company's consolidated financial statements for further discussion of tax contingencies.
Translation of Foreign Currencies
Asset and liability accounts are translated into U.S. dollars using exchange rates in effect at the dates of the Consolidated Balance Sheets; revenue and expense accounts are translated at average monthly exchange rates. Translation adjustments are reflected as a component of Total equity. For subsidiaries operating in highly inflationary economies, both historical and current exchange rates are used in translating balance sheet accounts and translation adjustments are included in Net income.
The translation of assets and liabilities originally denominated in foreign currencies into U.S. dollars is for consolidation purposes, and does not necessarily indicate that the Company could realize or settle the reported value of those assets and liabilities in U.S. dollars. Additionally, such a translation does not necessarily indicate that the Company could return or distribute the reported U.S. dollar value of the net equity of its foreign operations to shareholders.
Foreign currency transaction losses are included in Selling, general & administrative expenses and were
$6,023
,
$22,351
and
$7,759
in
2015
,
2014
and
2013
, respectively.
29
Venezuela – Highly Inflationary Economy
Venezuela is a highly inflationary economy under U.S. GAAP. As a result, the financial statements of the Company's Venezuelan operation are reported under highly inflationary accounting rules as of January 1, 2010. Under highly inflationary accounting, the financial statements of the Company's Venezuelan operation have been remeasured into the Company's reporting currency and exchange gains and losses from the remeasurement of monetary assets and liabilities are reflected in current earnings. On February 8, 2013, the Venezuelan government announced the devaluation of its currency relative to the U.S. dollar. Effective February 13, 2013 the official rate moved from
4.3
to
6.3
bolivars to the U.S. dollar. In 2013, the devaluation of the bolivar resulted in a foreign currency transaction loss of
$8,081
in Selling, general & administrative expenses and higher Cost of goods sold of
$4,117
due to the liquidation of inventory valued at the historical exchange rate.
In January 2014, the Venezuela government announced the formation of the National Center of Foreign Trade (“CENCOEX”) to replace the Commission for the Administration of Currency Exchange (“CADIVI”). Effective January 24, 2014, the exchange rate applicable to the settlement of certain transactions through CENCOEX, including payments of dividends and royalties, changed to utilize the Complementary System of Foreign Currency Administration ("SICAD") auction-based exchange rate (the "SICAD rate") as opposed to the official rate. Further, in January 2014, the Venezuelan government enacted the "Fair Prices Law" limiting prices and establishing a maximum profit margin on goods and services. In February 2014, the government announced a new market based foreign exchange system, the SICAD II. The exchange rate established through SICAD II fluctuated daily and was significantly higher than both the official rate and the SICAD rate.
As of March 31, 2014, the Company determined that the rate used in remeasuring the Venezuelan operation's financial statements into U.S. dollars would change to the SICAD rate as future remittances for dividend payments could be transacted at the SICAD rate. As of March 31, 2014, the SICAD rate was
10.7
bolivars to the U.S. dollar, which resulted in a remeasurement loss on the bolivar-denominated monetary net asset position of
$17,665
which was recorded in Selling, general & administrative expenses in the three months ended March 31, 2014. Additionally, the Company incurred higher Cost of goods sold of
$3,468
during the second quarter of 2014 related to the adoption of the SICAD rate.
In February 2015, the Venezuelan government eliminated the SICAD II rate and announced a new exchange market called the Marginal Currency System ("SIMADI"), which allows for trading based on supply and demand. At September 30, 2015, the Company determined that the rate used in remeasuring the Venezuelan operation's financial statements into U.S. dollars would change to the SIMADI rate as it most appropriately approximates the rates used to transact business in its Venezuelan operations. At September 30, 2015, the SIMADI rate was
199.4
bolivars to the U.S. dollar, resulting in a remeasurement charge on the bolivar-denominated monetary net liability position of
$4,334
. This foreign exchange loss was recorded in Selling, general & administrative expenses during the three months ended September 30, 2015. Additionally, the Company recorded lower of cost or net realizable value inventory adjustments of
$22,880
within Cost of goods sold, related to the adoption of the SIMADI rate. As of
December 31, 2015
, the SIMADI rate was
198.7
bolivars to the U.S dollar. If the Company were to convert bolivars at a rate other than the SIMADI rate, the Company may realize additional losses or gains to earnings.
At
December 31, 2015
, the amount of bolivar requests awaiting government approval to be paid in U.S. dollars at the SIMADI rate include
$1,550
for dividend payments, of which
$510
have been outstanding for more than a year, and
$7,871
to be paid at the official rate, all of which have been outstanding for more than a year.
In
2015
, the Company’s Venezuela operations contributed
$84,662
to Net sales for the Company. Net income included a loss of
$24,005
, or
$0.32
per diluted share from Venezuela. Adjusted net income for
2015
included
$3,209
, or
$0.05
per diluted share, from Venezuela. In
2014
, the Company’s Venezuela operations contributed
$71,793
to Net sales for the Company. Net income included a loss of
$8,238
, or
$0.10
per diluted share, from Venezuela. Adjusted net income for
2014
included
$13,279
, or
$0.17
per diluted share, from Venezuela. Future impacts to earnings of applying highly inflationary accounting for Venezuela on the Company’s consolidated financial statements will be dependent upon the applied currency exchange mechanisms, the movements in the applicable exchange rates between the bolivar and the U.S. dollar and the amount of monetary assets and liabilities included in the Company’s Venezuelan operation’s balance sheet. The bolivar-denominated monetary net asset position was
$32
at
December 31, 2015
, which includes
$642
of cash and cash equivalents and the bolivar-denominated monetary net liability position was
$1,264
at
December 31, 2014
, which includes
$2,124
of cash and cash equivalents.
The Company’s ability to effectively manage sales and profit levels in Venezuela will be impacted by several factors. In addition to those factors previously mentioned, these include the Company’s ability to mitigate the effect of any potential future devaluation and Venezuelan government price or exchange controls. The various restrictions on the distribution of foreign currency by the Venezuelan government could also affect the Company’s ability to pay obligations and maintain normal production levels in Venezuela.
30
In the future, the Company may need to deconsolidate its Venezuelan operations as a result of an inability to exchange bolivar-denominated cash coupled with an acute degradation in the ability to make key operational decisions due to government regulations in Venezuela. The Company monitors factors such as its ability to access various exchange mechanisms; the impact of government regulations on the Company’s ability to manage its Venezuelan operation’s capital structure, purchasing, product pricing and labor relations; and the current political and economic situation within Venezuela. Based upon such factors as of
December 31, 2015
, the Company continues to consolidate its Venezuelan subsidiary. As of
December 31, 2015
, the Company's total investment in Venezuela was approximately
$35,000
, which includes intercompany payables.
Deferred Income Taxes
Deferred income taxes are recognized at currently enacted tax rates for temporary differences between the GAAP and income tax basis of assets and liabilities and operating loss and tax credit carry-forwards. The Company does not provide deferred income taxes on unremitted earnings of certain non-U.S. subsidiaries, which are deemed permanently reinvested. It is not practicable to calculate the deferred taxes associated with the remittance of these earnings. Deferred income taxes associated with earnings that are not expected to be permanently reinvested were not significant. At
December 31, 2015
, the Company had approximately
$92,537
of gross deferred tax assets related to deductible temporary differences and tax loss and credit carry-forwards which may reduce taxable income in future years.
In assessing the realizability of deferred tax assets, the Company assesses whether it is more likely than not that a portion or all of the deferred tax assets will not be realized. The Company considers the scheduled reversal of deferred tax liabilities, tax planning strategies and projected future taxable income in making this assessment. At
December 31, 2015
, a valuation allowance of
$51,294
was recorded against these deferred tax assets based on this assessment. The Company believes it is more likely than not that the tax benefit of the remaining net deferred tax assets will be realized. The amount of net deferred tax assets considered realizable could be increased or reduced in the future if the Company's assessment of future taxable income or tax planning strategies changes.
Pensions
The Company maintains a number of defined benefit ("Pension") and defined contribution plans to provide retirement benefits for employees. These plans are maintained and contributions are made in accordance with the Employee Retirement Income Security Act of 1974 ("ERISA"), local statutory law or as determined by the Board of Directors. The plans generally provide benefits based upon years of service and compensation. Pension plans are funded except for a domestic non-qualified pension plan for certain key employees and certain foreign plans.
A substantial portion of the Company's pension amounts relate to its defined benefit plan in the United States. The fair value of plan assets is determined at December 31 of each year.
A significant element in determining the Company's pension expense is the expected return on plan assets. At the end of each year, the expected return on plan assets is determined based on the weighted average expected return of the various asset classes in the plan's portfolio and the targeted allocation of plan assets. The asset class return is developed using historical asset return performance as well as current market conditions such as inflation, interest rates and equity market performance. The Company determined this rate to be
6.3%
and
7.3%
at
December 31, 2015
and
2014
, respectively. The assumed long-term rate of return on assets is applied to the market value of plan assets. This produces the expected return on plan assets included in pension expense. The difference between this expected return and the actual return on plan assets is deferred and amortized over the average remaining service period of active employees expected to receive benefits under the plan. The amortization of the net deferral of past losses will increase future pension expense. During
2015
, investment returns were
0.9%
compared with a return of
11.5%
in
2014
. A 25 basis point change in the expected return on plan assets would increase or decrease pension expense by approximately
$2,000
.
Another significant element in determining the Company's pension expense is the discount rate for plan liabilities. To develop the discount rate assumption, the Company refers to the yield derived from matching projected pension payments with maturities of a portfolio of available non-callable bonds rated AA or an equivalent quality. The Company determined this rate to be
4.5%
at
December 31, 2015
and
4.1%
at
December 31, 2014
. A 10 basis point change in the discount rate would increase or decrease pension expense by approximately
$1,500
.
Pension expense relating to the Company's defined benefit plans was
$162,815
,
$12,395
and
$29,908
in
2015
,
2014
and
2013
, respectively. Pension expense in 2015 includes $142,738 in settlement charges. The Company expects
2016
defined benefit pension expense, excluding the effect of settlements, to decrease by a range of approximately
$1,000
to
$3,000
.
The Accumulated other comprehensive loss, excluding tax effects, recognized on the Consolidated Balance Sheet was
$154,756
as of
December 31, 2015
and
$314,411
as of
December 31, 2014
. The
decrease
is primarily the result of pension settlement charges recorded in 2015 related to the purchase of a group annuity contract. Refer to Note 11 to the Consolidated Financial Statements for additional information.
31
The Company made voluntary contributions to its U.S. defined benefit plans of
$47,124
,
$21,175
and
$75,216
in
2015
,
2014
and
2013
, respectively. The Company expects to voluntarily contribute
$20,000
to the U.S. plans in
2016
. Based on current pension funding rules, the Company does not anticipate that contributions to the plans would be required in
2016
.
Inventories
Inventories are valued at the lower of cost or net realizable value. Fixed manufacturing overhead costs are allocated to inventory based on normal production capacity and abnormal manufacturing costs are recognized as period costs. For most domestic inventories, cost is determined principally by the last-in, first-out ("LIFO") method, and for non-U.S. inventories, cost is determined by the first-in, first-out ("FIFO") method. The valuation of LIFO inventories is made at the end of each year based on inventory levels and costs at that time. Accordingly, interim LIFO calculations are based on management's estimates of expected year-end inventory levels and costs. Actual year-end costs and inventory levels may differ from interim LIFO inventory valuations. The excess of current cost over LIFO cost was
$59,765
at
December 31, 2015
and
$71,311
at
December 31, 2014
.
The Company reviews the net realizable value of inventory on an on-going basis, with consideration given to deterioration, obsolescence and other factors. If actual market conditions differ from those projected by management, and the Company's estimates prove to be inaccurate, write-downs of inventory values and adjustments to Cost of goods sold may be required. Historically, the Company's reserves have approximated actual experience.
Accounts Receivable
The Company maintains an allowance for doubtful accounts for estimated losses from the failure of its customers to make required payments for products delivered. The Company estimates this allowance based on the age of the related receivable, knowledge of the financial condition of customers, review of historical receivables and reserve trends and other pertinent information. If the financial condition of customers deteriorates or an unfavorable trend in receivable collections is experienced in the future, additional allowances may be required. Historically, the Company's reserves have approximated actual experience.
Long-Lived Assets
The Company periodically evaluates whether current facts or circumstances indicate that the carrying value of its depreciable long-lived assets to be held and used may not be recoverable. If such circumstances are determined to exist, an estimate of undiscounted future cash flows produced by the long-lived asset, or the appropriate grouping of assets, is compared to the carrying value to determine whether impairment exists. If an asset is determined to be impaired, a loss is recognized to the extent that carrying value exceeds fair value. Fair value is measured based on quoted market prices in active markets, if available. If quoted market prices are not available, the estimate of fair value is based on various valuation techniques, including the discounted value of estimated future cash flows.
Due to the presence of impairment indicators during the third quarter of 2015, the Company performed an impairment test of certain long-lived assets of a business unit. The Company determined that for certain long-lived assets the carrying value of the assets exceeded the fair value, resulting in a
$3,417
non-cash impairment charge. This result was considered a possible indication of goodwill impairment, therefore, the Company performed an interim goodwill impairment test, using a combination of income and market valuation approaches, resulting in a
$6,315
non-cash impairment charge to the carrying value of goodwill.
Goodwill and Intangibles
The Company performs an annual impairment test of goodwill and indefinite-lived intangible assets in the fourth quarter using the same dates each year or more frequently if changes in circumstances or the occurrence of events indicate potential impairment. The fair value of each indefinite-lived intangible asset is compared to its carrying value and an impairment charge is recorded if the carrying value exceeds the fair value. Goodwill is tested by comparing the fair value of each reporting unit with its carrying value. If the carrying value of the reporting unit exceeds its fair value, the implied value of goodwill is compared to its carrying value and impairment is recognized to the extent that the carrying value exceeds the implied fair value.
Fair values are determined using established business valuation techniques and models developed by the Company that incorporate allocations of certain assets and cash flows among reporting units, estimates of market participant assumptions of future cash flows, future growth rates and the applicable discount rates to value estimated cash flows. Changes in economic and operating conditions impacting these assumptions could result in asset impairments in future periods.
The fair value of goodwill for all of the Company's reporting units exceeded its carrying value by at least 20% as of the testing date during the fourth quarter of 2015. Key assumptions in estimating the reporting unit's fair value include assumed market participant assumptions of revenue growth, operating margins and the rate used to discount future cash flows. Actual revenue growth and operating margins below the assumed market participant assumptions or an increase in the discount rate would have a negative impact on the fair value of the reporting unit that could result in a goodwill impairment charge in a future period.
32
Stock-Based Compensation
The Company uses the Black-Scholes option pricing model for estimating fair values of options. The Black-Scholes model requires assumptions regarding the volatility of the Company's common shares, the expected life of the stock award and the Company's dividend yield. The Company utilizes historical data in determining these assumptions. An increase or decrease in the assumptions or economic events outside of management's control could have an impact on the Black-Scholes model.
The Company's primary financial market risks include fluctuations in currency exchange rates, commodity prices and interest rates. The Company manages these risks by using derivative financial instruments in accordance with established policies and procedures. The Company does not enter into derivatives or other financial instruments for trading or speculative purposes.
Included below is a sensitivity analysis based upon a hypothetical
10%
weakening or strengthening in the U.S. dollar compared to foreign currency exchange rates at
December 31, 2015
, a
10%
change in commodity prices, and a
100
basis point increase in effective interest rates. The contractual derivative, borrowing and investment arrangements in effect at
December 31, 2015
were compared to the hypothetical foreign exchange, commodity price, or interest rates in the sensitivity analysis to determine the effect on income before taxes, interest expense, or accumulated other comprehensive loss. The analysis takes into consideration any offset that would result from changes in the value of the hedged asset or liability.
Foreign Currency Exchange Risk
The Company enters into forward foreign exchange contracts principally to hedge the currency fluctuations in transactions denominated in foreign currencies, thereby limiting the Company's risk that would otherwise result from changes in exchange rates. At
December 31, 2015
, the Company hedged certain third-party and inter-company purchases and sales. At
December 31, 2015
, the Company had foreign exchange contracts with a notional value of approximately
$30,388
. At
December 31, 2015
, a hypothetical
10%
weakening of the U.S. dollar would not materially affect the Company's financial statements.
Commodity Price Risk
From time to time, the Company uses various hedging arrangements to manage exposures to price risk from commodity purchases. These hedging arrangements have the effect of fixing for specified periods the prices the Company will pay for the volume to which the hedge relates. A hypothetical
10%
adverse change in commodity prices on the Company's open commodity futures at
December 31, 2015
would not materially affect the Company's financial statements.
Interest Rate Risk
The Company's debt portfolio contains variable rate debt, inherently exposing the Company to interest rate risk. A hypothetical 1.0% increase in interest rates would not materially affect the Company's financial statements. The Company uses interest rate derivatives to manage interest rate risk. The Company had no interest rate derivatives outstanding during
2015
or
2014
.
The Company's return on cash and cash equivalents are also subject to interest rate risk. As of
December 31, 2015
, the Company had
$304,183
in cash and cash equivalents. A hypothetical change of 1.0% in interest rates would not materially affect the Company's financial statements. The fair value of the Company's Cash and cash equivalents at
December 31, 2015
approximated carrying value. The Company's financial instruments are subject to concentrations of credit risk. The Company has minimized this risk by entering into investments with a number of major banks and financial institutions and investing in high-quality instruments. The Company does not expect any counter-parties to fail to meet their obligations.
The response to this item is submitted in a separate section of this Annual Report on Form 10-K following the signature page.
None.
33
Conclusion Regarding the Effectiveness of Disclosure Controls and Procedures
Under the supervision and with the participation of management, including the Chief Executive Officer and Chief Financial Officer, the Company conducted an evaluation of disclosure controls and procedures, as such term is defined in Rule 13a-15(e) of the Exchange Act. Based on this evaluation, the Chief Executive Officer and Chief Financial Officer concluded that the Company's disclosure controls and procedures were effective as of the end of the period covered by this Annual Report on Form 10-K.
Management's Report on Internal Control Over Financial Reporting
The Company's management is responsible for establishing and maintaining adequate internal control over financial reporting, as such term is defined in Exchange Act Rule 13a-15(f). Under the supervision and with the participation of the Company's management, including the Chief Executive Officer and Chief Financial Officer, the Company conducted an evaluation of the effectiveness of internal control over financial reporting as of
December 31, 2015
based on the 2013 framework in "Internal Control – Integrated Framework" issued by the Committee of Sponsoring Organizations of the Treadway Commission. Based on the Company's evaluation under such framework, management concluded that the Company's internal control over financial reporting was effective as of
December 31, 2015
.
The effectiveness of the Company's internal control over financial reporting as of
December 31, 2015
has been audited by Ernst & Young LLP, an independent registered public accounting firm, as stated in their report, which is included elsewhere in this Annual Report on Form 10-K and is incorporated herein by reference.
Changes in Internal Control Over Financial Reporting
There have been no changes in the Company's internal control over financial reporting that occurred during the fourth quarter of
2015
that materially affected, or are reasonably likely to materially affect, the Company's internal control over financial reporting.
None.
34
The Company is expected to file its
2016
proxy statement pursuant to Regulation 14A of the Exchange Act prior to April 29,
2016
.
Except for the information set forth within Part I, Item 1C section of this Annual Report on Form 10-K concerning our Executive Officers, the information required by this item is incorporated by reference from the
2016
proxy statement.
The information required by this item is incorporated by reference from the
2016
proxy statement.
The information required by this item is incorporated by reference from the
2016
proxy statement.
For further information on the Company's equity compensation plans, see Note 1 and Note 9 to the Company's consolidated financial statements.
The information required by this item is incorporated by reference from the
2016
proxy statement.
The information required by this item is incorporated by reference from the
2016
proxy statement.
35
(a)(1) Financial Statements
The following consolidated financial statements of the Company are included in a separate section of this report following the signature page and certifications:
Report of Independent Registered Public Accounting Firm
Report of Independent Registered Public Accounting Firm on Internal Control Over Financial Reporting
Consolidated Balance Sheets –
December 31, 2015
and
2014
Consolidated Statements of Income – Years ended
December 31, 2015
,
2014
and
2013
Consolidated Statements of Comprehensive Income – Years ended
December 31, 2015
,
2014
and
2013
Consolidated Statements of Equity – Years ended
December 31, 2015
,
2014
and
2013
Consolidated Statements of Cash Flows – Years ended
December 31, 2015
,
2014
and
2013
Notes to Consolidated Financial Statements
(a)(2) Financial Statement Schedules
The following consolidated financial statement schedule of the Company is included in a separate section of this report
following the signature page:
Schedule II – Valuation and Qualifying Accounts
All other schedules for which provision is made in the applicable accounting regulation of the Securities and Exchange
Commission are not required under the related instructions or are inapplicable, and therefore, have been omitted.
(a)(3) Exhibits
|
Exhibit No.
|
Description
|
|
|
3.1
|
Amended and Restated Code of Regulations of Lincoln Electric Holdings, Inc. (filed as Exhibit 3.1 to Form 8-K of Lincoln Electric Holdings, Inc. filed on April 29, 2014, SEC file No. 0-1402 and incorporated herein by reference and made a part hereof).
|
|
|
3.2
|
Amended and Restated Articles of Incorporation of Lincoln Electric Holdings, Inc. (filed as Exhibit 3.1 to Form 8-K of Lincoln Electric Holdings, Inc. filed on September 27, 2011, SEC file No. 0-1402 and incorporated herein by reference and made a part hereof).
|
|
|
10.1
|
Amended and Restated Credit Agreement, dated as of September 12, 2014, by and among Lincoln Electric Holdings, Inc., The Lincoln Electric Company, Lincoln Electric International Holding Company, J.W. Harris Co., Inc., Techalloy, Inc., Wayne Trail Technologies, Inc., Lincoln Global, Inc., the Lenders and KeyBank National Association (filed as Exhibit 10.1 to Form 8-K of Lincoln Electric Holdings, Inc. filed on September 17, 2014, SEC File No. 0-1402 and incorporated herein by reference and made a part hereof).
|
|
|
10.2
|
Note Purchase Agreement, dated as of April 1, 2015, by and among Lincoln Electric Holdings, Inc., The Lincoln Electric Company, Lincoln Electric International Holding Company, J.W. Harris Co., Inc., Lincoln Global, Inc., Techalloy, Inc., Wayne Trail Technologies, Inc. and the purchasers party thereto (filed as Exhibit 10.1 to Form 8-K of Lincoln Electric Holdings, Inc. filed on April 2, 2015, SEC File No. 0-1402 and incorporated herein by reference and made a part hereof).
|
|
|
10.3*
|
Supplemental Executive Retirement Plan (Amended and Restated as of December 31, 2008) (filed as Exhibit 10.1 to Form 8-K of Lincoln Electric Holdings, Inc. filed on January 7, 2009, SEC File No. 0-1402 and incorporated herein by reference and made part hereof).
|
|
|
10.4*
|
Deferred Compensation Plan for Certain Retention Agreements and Other Contractual Arrangements (Amended and Restated as of January 1, 2004) (filed as Exhibit 10(i) to Form 10-K of Lincoln Electric Holdings, Inc. for the year ended December 31, 2003, SEC File No. 0-1402 and incorporated herein by reference and made a part hereof).
|
|
|
10.5*
|
Non-Employee Directors' Deferred Compensation Plan (Amended and Restated as of December 31, 2008) (filed as Exhibit 10.3 to Form 8-K of Lincoln Electric Holdings, Inc. filed on January 7, 2009, SEC File No. 0-1402 and incorporated herein by reference and made a part hereof).
|
|
|
10.6*
|
2005 Deferred Compensation Plan for Executives (Amended and Restated as of January 1, 2016) (filed herewith).
|
|
36
|
Exhibit No.
|
Description
|
|
|
10.7*
|
Form of Severance Agreement (as entered into by the Company and its executive officers) (filed as Exhibit 10.1 to Form 10-Q of Lincoln Electric Holdings, Inc. for the three months ended June 30, 2009, SEC File No. 0-1402 and incorporated herein by reference and made a part hereof).
|
|
|
10.8*
|
2006 Equity and Performance Incentive Plan (Restated as of March 3, 2011) (filed as Annex A to the Lincoln Electric Holdings, Inc. proxy statement filed on March 18, 2011, SEC File No. 0-1402 and incorporated herein by reference and made a part hereof).
|
|
|
10.9*
|
2006 Stock Plan for Non-Employee Directors (filed as Appendix C to the Lincoln Electric Holdings, Inc. proxy statement dated March 28, 2006, SEC File No. 0-1402 and incorporated herein by reference and made a part hereof).
|
|
|
10.10*
|
Amendment No. 1 to the 2006 Stock Plan for Non-Employee Directors dated October 20, 2006 (filed as Exhibit 10.2 to Form 10-Q of Lincoln Electric Holdings, Inc. for the three months ended March 31, 2007, SEC file No. 0-1402 and incorporated herein by reference and made a part hereof).
|
|
|
10.11*
|
Amendment No. 2 to the 2006 Stock Plan for Non-Employee Directors dated July 26, 2007 (filed as Exhibit 10.1 to Form 10-Q of Lincoln Electric Holdings, Inc. for the three months ended September 30, 2007, SEC file No. 0-1402 and incorporated herein by reference and made a part hereof).
|
|
|
10.12*
|
Amendment No. 3 to the 2006 Stock Plan for Non-Employee Directors dated December 15, 2014 (filed as Exhibit 10.20 to Form 10-K of Lincoln Electric Holdings, Inc. for the year ended December 31, 2014, SEC file No. 0-1402 and incorporated herein by reference and made a part hereof).
|
|
|
10.13*
|
2015 Equity and Incentive Compensation Plan (filed as Appendix B to the Lincoln Electric Holdings, Inc. definitive proxy statement filed on March 18, 2015, SEC File No. 0-1402, and incorporated herein by reference and made a part hereof).
|
|
|
10.14*
|
2015 Stock Plan for Non-Employee Directors (filed as Appendix C to the Lincoln Electric Holdings, Inc. definitive proxy statement filed on March 18, 2015, SEC File No. 0-1402, and incorporated herein by reference and made a part hereof).
|
|
|
10.15*
|
Form of Stock Option Agreement for Executive Officers (for awards made before December 2010) (filed as Exhibit 10.4 to Form 10-Q of Lincoln Electric Holdings, Inc. for the three months ended September 30, 2010, SEC File No. 0-1402 and incorporated herein by reference and made a part hereof).
|
|
|
10.16*
|
Form of Stock Option Agreement for Executive Officers (for awards made on or after December 1, 2010) (filed as Exhibit 10.37 to Form 10-K of the Lincoln Electric Holdings, Inc. for the year ended December 31, 2010, SEC File No. 0-1402 and incorporated herein by reference and made a part hereof).
|
|
|
10.17*
|
Form of Restricted Stock Unit Agreement for Executive Officers (for awards made prior to December 2013) (filed as Exhibit 10.2 to Form 8-K of Lincoln Electric Holdings, Inc. filed on August 4, 2011, SEC File No. 0-1402 and incorporated herein by reference and made a part thereof).
|
|
|
10.18*
|
Form of Amendment to Restricted Stock Unit Agreement for Executive Officers (for awards made prior to December 2013) (filed as Exhibit 10.2 to Form 8-K of Lincoln Electric Holdings, Inc. filed on December 20, 2013, SEC File No. 0-1402 and incorporated herein by reference and made a part hereof).
|
|
|
10.19*
|
Form of Restricted Stock Unit Agreement for Executive Officers (for awards made on or after December 2013 - October 2015) (filed as Exhibit 10.33 to Form 10-K of Lincoln Electric Holdings, Inc. for the year ended December 31, 2013, SEC File No. 0-1402 and incorporated herein by reference and made a part hereof).
|
|
|
10.20*
|
Form of Restricted Share Agreement for Non-Employee Directors (filed as Exhibit 10.1 to Form 8-K of Lincoln Electric Holdings, Inc. filed on July 29, 2015, SEC File No. 0-1402 and incorporated herein by reference and made a part hereof).
|
|
|
10.21*
|
Form of Restricted Stock Unit Agreement for Executive Officers (for awards made on or after October 2015) (filed herewith)
|
|
|
10.22*
|
Form of Performance Share Award Agreement for Executive Officers (filed herewith)
|
|
|
10.23*
|
Form of Officer Indemnification Agreement (effective February 23, 2012) (filed as Exhibit 10.1 to Form 8-K of Lincoln Electric Holdings, Inc. filed on February 29, 2012, SEC File No. 0-1402 and incorporated herein by reference and made a part hereof).
|
|
|
10.24*
|
Form of Director Indemnification Agreement (effective February 23, 2012) (filed as Exhibit 10.1 to Form 8-K of Lincoln Electric Holdings, Inc. filed on February 29, 2012, SEC File No. 0-1402 and incorporated herein by reference and made a part hereof).
|
|
|
21
|
Subsidiaries of the Registrant.
|
|
|
23
|
Consent of Independent Registered Public Accounting Firm.
|
|
|
24
|
Powers of Attorney.
|
|
37
|
Exhibit No.
|
Description
|
|
|
31.1
|
Certification by the Chairman, President and Chief Executive Officer pursuant to Rule 13a-14(a) of the Securities Exchange Act of 1934.
|
|
|
31.2
|
Certification by the Executive Vice President, Chief Financial Officer and Treasurer pursuant to Rule 13a-14(a) of the Securities Exchange Act of 1934.
|
|
|
32.1
|
Certifications pursuant to 18 U.S.C. Section 1350, as adopted pursuant to Section 906 of the Sarbanes-Oxley Act of 2002.
|
|
|
101.INS
|
XBRL Instance Document
|
|
|
101.SCH
|
XBRL Taxonomy Extension Schema Document
|
|
|
101.CAL
|
XBRL Taxonomy Extension Calculation Linkbase Document
|
|
|
101.LAB
|
XBRL Taxonomy Extension Label Linkbase Document
|
|
|
101.PRE
|
XBRL Taxonomy Extension Presentation Linkbase Document
|
|
|
101.DEF
|
XBRL Taxonomy Extension Definition Linkbase Document
|
|
|
*
|
Reflects management contract or other compensatory arrangement required to be filed as an exhibit pursuant to Item 15(b) of this report.
|
38
SIGNATURES
Pursuant to the requirements of Section 13 or 15(d) of the Securities Exchange Act of 1934, the registrant has duly caused this report to be signed on its behalf by the undersigned, thereunto duly authorized.
|
|
LINCOLN ELECTRIC HOLDINGS, INC.
|
|
|
|
By:
|
/s/ GEOFFREY P. ALLMAN
|
|
Geoffrey P. Allman
Senior Vice President, Corporate Controller
(principal accounting officer)
February 24, 2016
|
||
39
Pursuant to the requirements of the Securities Exchange Act of 1934, this report has been signed below by the following persons on behalf of the registrant and in the capacities and on the dates indicated.
|
/s/ CHRISTOPHER L. MAPES
|
/s/ VINCENT K. PETRELLA
|
|
|
Christopher L. Mapes,
Chairman, President and Chief Executive Officer
(principal executive officer)
February 24, 2016
|
Vincent K. Petrella,
Executive Vice President, Chief Financial Officer and Treasurer (principal financial officer) February 24, 2016 |
|
|
/s/ GEOFFREY P. ALLMAN
|
/s/ GEOFFREY P. ALLMAN
|
|
|
Geoffrey P. Allman,
Senior Vice President, Corporate Controller (principal accounting officer) February 24, 2016 |
Geoffrey P. Allman as
Attorney-in-Fact for Curtis E. Espeland, Director February 24, 2016 |
|
|
/s/ GEOFFREY P. ALLMAN
|
/s/ GEOFFREY P. ALLMAN
|
|
|
Geoffrey P. Allman as
Attorney-in-Fact for David H. Gunning, Director February 24, 2016 |
Geoffrey P. Allman as
Attorney-in-Fact for Stephen G. Hanks, Director February 24, 2016 |
|
|
/s/ GEOFFREY P. ALLMAN
|
/s/ GEOFFREY P. ALLMAN
|
|
|
Geoffrey P. Allman as
Attorney-in-Fact for Michael F. Hilton, Director February 24, 2016 |
Geoffrey P. Allman as
Attorney-in-Fact for G. Russell Lincoln, Director February 24, 2016 |
|
|
/s/ GEOFFREY P. ALLMAN
|
/s/ GEOFFREY P. ALLMAN
|
|
|
Geoffrey P. Allman as
Attorney-in-Fact for Kathryn Jo Lincoln, Director February 24, 2016 |
Geoffrey P. Allman as
Attorney-in-Fact for William E. MacDonald, III, Director February 24, 2016 |
|
|
/s/ GEOFFREY P. ALLMAN
|
/s/ GEOFFREY P. ALLMAN
|
|
|
Geoffrey P. Allman as
Attorney-in-Fact for Phillip J. Mason, Director February 24, 2016 |
Geoffrey P. Allman as
Attorney-in-Fact for Hellene S. Runtagh, Director February 24, 2016 |
|
|
/s/ GEOFFREY P. ALLMAN
|
||
|
Geoffrey P. Allman as
Attorney-in-Fact for George H. Walls, Jr., Director February 24, 2016 |
||
40
Report of Independent Registered Public Accounting Firm
The Board of Directors and Shareholders of Lincoln Electric Holdings, Inc.
We have audited the accompanying consolidated balance sheets of Lincoln Electric Holdings, Inc. and subsidiaries as of December 31,
2015
and
2014
, and the related consolidated statements of income, comprehensive income, equity, and cash flows for each of the three years in the period ended
December 31, 2015
. Our audits also included the financial statement schedule listed in the Index as Item 15 (a) (2). These financial statements and schedule are the responsibility of the Company's management. Our responsibility is to express an opinion on these financial statements and schedule based on our audits.
We conducted our audits in accordance with the standards of the Public Company Accounting Oversight Board (United States). Those standards require that we plan and perform the audit to obtain reasonable assurance about whether the financial statements are free of material misstatement. An audit includes examining, on a test basis, evidence supporting the amounts and disclosures in the financial statements. An audit also includes assessing the accounting principles used and significant estimates made by management, as well as evaluating the overall financial statement presentation. We believe that our audits provide a reasonable basis for our opinion.
In our opinion, the financial statements referred to above present fairly, in all material respects, the consolidated financial position of Lincoln Electric Holdings, Inc. and subsidiaries at
December 31, 2015
and
2014
, and the consolidated results of their operations and their cash flows for each of the three years in the period ended
December 31, 2015
, in conformity with U.S. generally accepted accounting principles. Also, in our opinion, the related financial statement schedule, when considered in relation to the basic financial statements taken as a whole, presents fairly in all material respects, the information set forth therein.
We also have audited, in accordance with the standards of the Public Company Accounting Oversight Board (United States), Lincoln Electric Holdings, Inc. and subsidiaries' internal control over financial reporting as of
December 31, 2015
, based on criteria established in Internal Control-Integrated Framework issued by the Committee of Sponsoring Organizations of the Treadway Commission (2013 framework) and our report dated
February 24, 2016
expressed an unqualified opinion thereon.
/s/ Ernst & Young LLP
Cleveland, Ohio
February 24, 2016
F-1
Report of Independent Registered Public Accounting Firm
The Board of Directors and Shareholders of Lincoln Electric Holdings, Inc.
We have audited Lincoln Electric Holdings, Inc. and subsidiaries' internal control over financial reporting as of
December 31, 2015
, based on criteria established in Internal Control – Integrated Framework issued by the Committee of Sponsoring Organizations of the Treadway Commission (2013 framework) (the COSO criteria). Lincoln Electric Holdings, Inc. and subsidiaries' management is responsible for maintaining effective internal control over financial reporting, and for its assessment of the effectiveness of internal control over financial reporting included in the accompanying Management's Report on Internal Control over Financial Reporting in Item 9A. Our responsibility is to express an opinion on the company's internal control over financial reporting based on our audit.
We conducted our audit in accordance with the standards of the Public Company Accounting Oversight Board (United States). Those standards require that we plan and perform the audit to obtain reasonable assurance about whether effective internal control over financial reporting was maintained in all material respects. Our audit included obtaining an understanding of internal control over financial reporting, assessing the risk that a material weakness exists, testing and evaluating the design and operating effectiveness of internal control based on the assessed risk, and performing such other procedures as we considered necessary in the circumstances. We believe that our audit provides a reasonable basis for our opinion.
A company's internal control over financial reporting is a process designed to provide reasonable assurance regarding the reliability of financial reporting and the preparation of financial statements for external purposes in accordance with generally accepted accounting principles. A company's internal control over financial reporting includes those policies and procedures that (1) pertain to the maintenance of records that, in reasonable detail, accurately and fairly reflect the transactions and dispositions of the assets of the company; (2) provide reasonable assurance that transactions are recorded as necessary to permit preparation of financial statements in accordance with generally accepted accounting principles, and that receipts and expenditures of the company are being made only in accordance with authorizations of management and directors of the company; and (3) provide reasonable assurance regarding prevention or timely detection of unauthorized acquisition, use, or disposition of the company's assets that could have a material effect on the financial statements.
Because of its inherent limitations, internal control over financial reporting may not prevent or detect misstatements. Also, projections of any evaluation of effectiveness to future periods are subject to the risk that controls may become inadequate because of changes in conditions, or that the degree of compliance with the policies or procedures may deteriorate.
In our opinion, Lincoln Electric Holdings, Inc. and subsidiaries maintained, in all material respects, effective internal control over financial reporting as of
December 31, 2015
, based on the COSO criteria.
We also have audited, in accordance with the standards of the Public Company Accounting Oversight Board (United States), the consolidated balance sheets of Lincoln Electric Holdings, Inc. and subsidiaries as of
December 31, 2015
and
2014
, and the related consolidated statements of income, comprehensive income, equity, and cash flows for each of the three years in the period ended
December 31, 2015
of Lincoln Electric Holdings, Inc. and subsidiaries and our report dated
February 24, 2016
expressed an unqualified opinion thereon.
/s/ Ernst & Young LLP
Cleveland, Ohio
February 24, 2016
F-2
LINCOLN ELECTRIC HOLDINGS, INC.
(Dollars in thousands)
|
|
December 31,
|
|||||||
|
|
2015
|
2014
|
||||||
|
ASSETS
|
|
|
||||||
|
Current Assets
|
|
|
||||||
|
Cash and cash equivalents
|
$
|
304,183
|
|
$
|
278,379
|
|
||
|
Accounts receivable (less allowance for doubtful accounts of $7,299 in
2015; $7,858 in 2014)
|
264,715
|
|
337,664
|
|
||||
|
Inventories
|
|
|
||||||
|
Raw materials
|
87,919
|
|
112,408
|
|
||||
|
Work-in-process
|
39,555
|
|
41,156
|
|
||||
|
Finished goods
|
148,456
|
|
187,493
|
|
||||
|
Total inventory
|
275,930
|
|
341,057
|
|
||||
|
Deferred income taxes
|
—
|
|
9,164
|
|
||||
|
Other current assets
|
91,167
|
|
129,938
|
|
||||
|
Total Current Assets
|
935,995
|
|
1,096,202
|
|
||||
|
Property, Plant and Equipment
|
|
|
||||||
|
Land
|
45,775
|
|
46,553
|
|
||||
|
Buildings
|
362,325
|
|
371,400
|
|
||||
|
Machinery and equipment
|
696,849
|
|
711,737
|
|
||||
|
Property, plant and equipment
|
1,104,949
|
|
1,129,690
|
|
||||
|
Less accumulated depreciation
|
693,626
|
|
690,944
|
|
||||
|
Property, Plant and Equipment, Net
|
411,323
|
|
438,746
|
|
||||
|
Other Assets
|
|
|
||||||
|
Prepaid pensions
|
38,201
|
|
1,240
|
|
||||
|
Equity investments in affiliates
|
27,241
|
|
27,481
|
|
||||
|
Intangibles, net
|
120,719
|
|
132,689
|
|
||||
|
Goodwill
|
187,504
|
|
180,127
|
|
||||
|
Long-term investments
|
32,093
|
|
31,119
|
|
||||
|
Deferred income taxes
|
8,683
|
|
2,940
|
|
||||
|
Other non-current assets
|
22,412
|
|
28,671
|
|
||||
|
Total Other Assets
|
436,853
|
|
404,267
|
|
||||
|
TOTAL ASSETS
|
$
|
1,784,171
|
|
$
|
1,939,215
|
|
||
See notes to these consolidated financial statements.
F-3
LINCOLN ELECTRIC HOLDINGS, INC.
CONSOLIDATED BALANCE SHEETS
(Dollars in thousands)
|
|
December 31,
|
|||||||
|
|
2015
|
2014
|
||||||
|
LIABILITIES AND EQUITY
|
|
|
||||||
|
Current Liabilities
|
|
|
||||||
|
Amounts due banks
|
$
|
2,822
|
|
$
|
61,155
|
|
||
|
Trade accounts payable
|
152,620
|
|
209,745
|
|
||||
|
Accrued employee compensation and benefits
|
65,571
|
|
66,653
|
|
||||
|
Accrued expenses
|
33,522
|
|
30,126
|
|
||||
|
Accrued taxes, including income taxes
|
16,599
|
|
18,947
|
|
||||
|
Accrued pensions
|
5,026
|
|
2,971
|
|
||||
|
Dividends payable
|
22,622
|
|
22,329
|
|
||||
|
Accrued bonuses
|
29,011
|
|
29,973
|
|
||||
|
Customer advances
|
16,112
|
|
26,517
|
|
||||
|
Other current liabilities
|
24,761
|
|
16,968
|
|
||||
|
Current portion of long-term debt
|
1,456
|
|
7,011
|
|
||||
|
Total Current Liabilities
|
370,122
|
|
492,395
|
|
||||
|
Long-Term Liabilities
|
|
|
||||||
|
Long-term debt, less current portion
|
350,347
|
|
2,488
|
|
||||
|
Accrued pensions
|
15,243
|
|
32,803
|
|
||||
|
Deferred income taxes
|
46,662
|
|
40,761
|
|
||||
|
Accrued taxes
|
19,674
|
|
25,571
|
|
||||
|
Other long-term liabilities
|
49,675
|
|
59,416
|
|
||||
|
Total Long-Term Liabilities
|
481,601
|
|
161,039
|
|
||||
|
Shareholders' Equity
|
|
|
||||||
|
Preferred shares, without par value – at stated capital amount;
authorized – 5,000,000 shares; issued and outstanding – none
|
—
|
|
—
|
|
||||
|
Common shares, without par value – at stated capital amount;
authorized – 240,000,000 shares; issued – 98,581,434 shares in 2015 and 2014;
outstanding – 70,693,389 shares in 2015 and 76,997,161 shares in 2014
|
9,858
|
|
9,858
|
|
||||
|
Additional paid-in capital
|
272,908
|
|
258,816
|
|
||||
|
Retained earnings
|
2,125,838
|
|
2,086,174
|
|
||||
|
Accumulated other comprehensive loss
|
(296,267
|
)
|
(288,622
|
)
|
||||
|
Treasury shares, at cost – 27,888,045 shares in 2015 and 21,584,273 shares in 2014
|
(1,180,750
|
)
|
(783,677
|
)
|
||||
|
Total Shareholders' Equity
|
931,587
|
|
1,282,549
|
|
||||
|
Non-controlling interests
|
861
|
|
3,232
|
|
||||
|
Total Equity
|
932,448
|
|
1,285,781
|
|
||||
|
TOTAL LIABILITIES AND EQUITY
|
$
|
1,784,171
|
|
$
|
1,939,215
|
|
||
See notes to these consolidated financial statements.
F-4
LINCOLN ELECTRIC HOLDINGS, INC.
(In thousands, except per share amounts)
|
|
Year Ended December 31,
|
|||||||||||
|
|
2015
|
2014
|
2013
|
|||||||||
|
Net sales
|
$
|
2,535,791
|
|
$
|
2,813,324
|
|
$
|
2,852,671
|
|
|||
|
Cost of goods sold
|
1,694,647
|
|
1,864,027
|
|
1,910,017
|
|
||||||
|
Gross profit
|
841,144
|
|
949,297
|
|
942,654
|
|
||||||
|
Selling, general & administrative expenses
|
496,748
|
|
545,497
|
|
527,206
|
|
||||||
|
Rationalization and asset impairment charges
|
19,958
|
|
30,053
|
|
8,463
|
|
||||||
|
Pension settlement charges
|
142,738
|
|
—
|
|
—
|
|
||||||
|
Operating income
|
181,700
|
|
373,747
|
|
406,985
|
|
||||||
|
Other income (expense):
|
|
|
|
|||||||||
|
Interest income
|
2,714
|
|
3,093
|
|
3,320
|
|
||||||
|
Equity earnings in affiliates
|
3,015
|
|
5,412
|
|
4,806
|
|
||||||
|
Other income
|
4,182
|
|
3,995
|
|
4,194
|
|
||||||
|
Interest expense
|
(21,824
|
)
|
(10,434
|
)
|
(2,864
|
)
|
||||||
|
Total other income (expense)
|
(11,913
|
)
|
2,066
|
|
9,456
|
|
||||||
|
Income before income taxes
|
169,787
|
|
375,813
|
|
416,441
|
|
||||||
|
Income taxes
|
42,375
|
|
121,933
|
|
124,754
|
|
||||||
|
Net income including non-controlling interests
|
127,412
|
|
253,880
|
|
291,687
|
|
||||||
|
Non-controlling interests in subsidiaries' loss
|
(66
|
)
|
(806
|
)
|
(2,093
|
)
|
||||||
|
Net income
|
$
|
127,478
|
|
$
|
254,686
|
|
$
|
293,780
|
|
|||
|
Basic earnings per share
|
$
|
1.72
|
|
$
|
3.22
|
|
$
|
3.58
|
|
|||
|
Diluted earnings per share
|
$
|
1.70
|
|
$
|
3.18
|
|
$
|
3.54
|
|
|||
|
Cash dividends declared per share
|
$
|
1.19
|
|
$
|
0.98
|
|
$
|
0.83
|
|
|||
See notes to these consolidated financial statements.
F-5
LINCOLN ELECTRIC HOLDINGS, INC.
CONSOLIDATED STATEMENTS OF COMPREHENSIVE INCOME
(In thousands)
|
|
Year Ended December 31,
|
|||||||||||
|
|
2015
|
2014
|
2013
|
|||||||||
|
Net income including non-controlling interests
|
$
|
127,412
|
|
$
|
253,880
|
|
$
|
291,687
|
|
|||
|
Other comprehensive income (loss), net of tax:
|
||||||||||||
|
Unrealized gain (loss) on derivatives designated and qualifying as cash flow hedges, net of tax of $336 in 2015; $(121) in 2014; $(141) in 2013
|
557
|
|
(378
|
)
|
289
|
|
||||||
|
Defined pension plan activity, net of tax of $61,538 in 2015; $(20,951) in 2014; $60,556 in 2013
|
98,117
|
|
(37,200
|
)
|
101,151
|
|
||||||
|
Currency translation adjustment
|
(106,935
|
)
|
(98,365
|
)
|
(19,955
|
)
|
||||||
|
Transactions with non-controlling interests
|
(7
|
)
|
(4
|
)
|
155
|
|
||||||
|
Other comprehensive income (loss)
|
(8,268
|
)
|
(135,947
|
)
|
81,640
|
|
||||||
|
Comprehensive income
|
119,144
|
|
117,933
|
|
373,327
|
|
||||||
|
Comprehensive loss attributable to non-controlling interests
|
(689
|
)
|
(72
|
)
|
(3,912
|
)
|
||||||
|
Comprehensive income attributable to shareholders
|
$
|
119,833
|
|
$
|
118,005
|
|
$
|
377,239
|
|
|||
See notes to these consolidated financial statements.
F-6
LINCOLN ELECTRIC HOLDINGS, INC.
CONSOLIDATED STATEMENTS OF EQUITY
(In thousands, except per share amounts)
|
Common
Shares
Outstanding
|
Common
Shares
|
Additional
Paid-In
Capital
|
Retained
Earnings
|
Accumulated
Other
Comprehensive
Income (Loss)
|
Treasury
Shares
|
Non-controlling
Interests
|
Total
|
|||||||||||||||||||||||
|
Balance at December 31, 2012
|
82,945
|
|
$
|
9,858
|
|
$
|
205,124
|
|
$
|
1,682,668
|
|
$
|
(235,400
|
)
|
$
|
(319,877
|
)
|
$
|
15,948
|
|
$
|
1,358,321
|
|
|||||||
|
Net income
|
293,780
|
|
(2,093
|
)
|
291,687
|
|
||||||||||||||||||||||||
|
Unrecognized amounts from defined benefit pension plans, net of tax
|
|
|
|
|
|
|
|
101,151
|
|
|
|
101,151
|
|
|||||||||||||||||
|
Unrealized gain (loss) on derivatives designated and qualifying as cash flow hedges, net of tax
|
|
|
|
|
|
|
|
289
|
|
|
|
|
|
289
|
|
|||||||||||||||
|
Currency translation adjustment
|
|
|
|
|
|
|
|
(18,136
|
)
|
|
|
(1,819
|
)
|
(19,955
|
)
|
|||||||||||||||
|
Cash dividends declared – $0.83 per share
|
|
|
|
|
|
|
(67,986
|
)
|
|
|
|
|
|
|
(67,986
|
)
|
||||||||||||||
|
Issuance of shares under benefit plans
|
787
|
|
|
|
33,693
|
|
|
|
|
|
7,460
|
|
|
|
41,153
|
|
||||||||||||||
|
Purchase of shares for treasury
|
(2,722
|
)
|
|
|
|
|
|
|
|
|
(167,879
|
)
|
|
|
(167,879
|
)
|
||||||||||||||
|
Transactions with non-controlling interests
|
1,702
|
|
155
|
|
(7,950
|
)
|
(6,093
|
)
|
||||||||||||||||||||||
|
Balance at December 31, 2013
|
81,010
|
|
9,858
|
|
240,519
|
|
1,908,462
|
|
(151,941
|
)
|
(480,296
|
)
|
4,086
|
|
1,530,688
|
|
||||||||||||||
|
Net income
|
254,686
|
|
(806
|
)
|
253,880
|
|
||||||||||||||||||||||||
|
Unrecognized amounts from defined benefit pension plans, net of tax
|
|
|
|
|
|
|
|
(37,200
|
)
|
|
|
|
|
(37,200
|
)
|
|||||||||||||||
|
Unrealized gain (loss) on derivatives designated and qualifying as cash flow hedges, net of tax
|
|
|
|
|
|
|
|
(378
|
)
|
|
|
|
|
(378
|
)
|
|||||||||||||||
|
Currency translation adjustment
|
|
|
|
|
|
|
|
(99,099
|
)
|
|
|
734
|
|
(98,365
|
)
|
|||||||||||||||
|
Cash dividends declared – $0.98 per share
|
|
|
|
|
|
|
(76,974
|
)
|
|
|
|
|
|
|
(76,974
|
)
|
||||||||||||||
|
Issuance of shares under benefit plans
|
385
|
|
|
|
19,781
|
|
|
|
|
|
3,797
|
|
|
|
23,578
|
|
||||||||||||||
|
Purchase of shares for treasury
|
(4,398
|
)
|
|
|
|
|
|
|
|
|
(307,178
|
)
|
|
|
(307,178
|
)
|
||||||||||||||
|
Transactions with non-controlling interests
|
(1,484
|
)
|
(4
|
)
|
(782
|
)
|
(2,270
|
)
|
||||||||||||||||||||||
|
Balance at December 31, 2014
|
76,997
|
|
9,858
|
|
258,816
|
|
2,086,174
|
|
(288,622
|
)
|
(783,677
|
)
|
3,232
|
|
1,285,781
|
|
||||||||||||||
|
Net income
|
127,478
|
|
(66
|
)
|
127,412
|
|
||||||||||||||||||||||||
|
Unrecognized amounts from defined benefit pension plans, net of tax
|
|
|
|
|
|
|
|
98,117
|
|
|
|
|
|
98,117
|
|
|||||||||||||||
|
Unrealized gain (loss) on derivatives designated and qualifying as cash flow hedges, net of tax
|
|
|
|
|
|
|
|
557
|
|
|
|
|
|
557
|
|
|||||||||||||||
|
Currency translation adjustment
|
|
|
|
|
|
|
|
(106,312
|
)
|
|
|
(623
|
)
|
(106,935
|
)
|
|||||||||||||||
|
Cash dividends declared – $1.19 per share
|
|
|
|
|
|
|
(87,814
|
)
|
|
|
|
|
|
|
(87,814
|
)
|
||||||||||||||
|
Issuance of shares under benefit plans
|
274
|
|
|
|
14,092
|
|
|
|
|
|
2,421
|
|
|
|
16,513
|
|
||||||||||||||
|
Purchase of shares for treasury
|
(6,578
|
)
|
|
|
|
|
|
|
|
|
(399,494
|
)
|
|
|
(399,494
|
)
|
||||||||||||||
|
Transactions with non-controlling interests
|
(7
|
)
|
(1,682
|
)
|
(1,689
|
)
|
||||||||||||||||||||||||
|
Balance at December 31, 2015
|
70,693
|
|
$
|
9,858
|
|
$
|
272,908
|
|
$
|
2,125,838
|
|
$
|
(296,267
|
)
|
$
|
(1,180,750
|
)
|
$
|
861
|
|
$
|
932,448
|
|
|||||||
See notes to these consolidated financial statements.
F-7
LINCOLN ELECTRIC HOLDINGS, INC.
(In thousands)
|
|
Year Ended December 31,
|
|||||||||||
|
|
2015
|
2014
|
2013
|
|||||||||
|
CASH FLOWS FROM OPERATING ACTIVITIES
|
|
|
|
|||||||||
|
Net income
|
$
|
127,478
|
|
$
|
254,686
|
|
$
|
293,780
|
|
|||
|
Non-controlling interests in subsidiaries' loss
|
(66
|
)
|
(806
|
)
|
(2,093
|
)
|
||||||
|
Net income including non-controlling interests
|
127,412
|
|
253,880
|
|
291,687
|
|
||||||
|
Adjustments to reconcile Net income including non-controlling interests to Net cash provided by operating activities:
|
|
|
|
|||||||||
|
Rationalization and asset impairment charges
|
6,269
|
|
29,574
|
|
5,092
|
|
||||||
|
Depreciation and amortization
|
64,007
|
|
69,607
|
|
68,883
|
|
||||||
|
Equity earnings in affiliates, net
|
(530
|
)
|
(1,848
|
)
|
(1,660
|
)
|
||||||
|
Deferred income taxes
|
(55,728
|
)
|
17,887
|
|
17,817
|
|
||||||
|
Stock-based compensation
|
7,932
|
|
8,416
|
|
9,734
|
|
||||||
|
Pension expense and settlement charges
|
162,815
|
|
12,395
|
|
29,774
|
|
||||||
|
Pension contributions and payments
|
(53,547
|
)
|
(36,072
|
)
|
(87,356
|
)
|
||||||
|
Other, net
|
958
|
|
18,095
|
|
1,910
|
|
||||||
|
Changes in operating assets and liabilities, net of effects from acquisitions:
|
|
|
|
|||||||||
|
Decrease (increase) in accounts receivable
|
56,741
|
|
5,876
|
|
(5,437
|
)
|
||||||
|
Decrease (increase) in inventories
|
56,067
|
|
(5,718
|
)
|
13,310
|
|
||||||
|
(Increase) decrease in other current assets
|
(19,972
|
)
|
32,081
|
|
2,811
|
|
||||||
|
(Decrease) increase in accounts payable
|
(46,911
|
)
|
2,135
|
|
794
|
|
||||||
|
Decrease in other current liabilities
|
(463
|
)
|
(3,736
|
)
|
(7,785
|
)
|
||||||
|
Net change in other long-term assets and liabilities
|
5,808
|
|
(870
|
)
|
(680
|
)
|
||||||
|
NET CASH PROVIDED BY OPERATING ACTIVITIES
|
310,858
|
|
401,702
|
|
338,894
|
|
||||||
|
CASH FLOWS FROM INVESTING ACTIVITIES
|
|
|
|
|||||||||
|
Capital expenditures
|
(50,507
|
)
|
(72,990
|
)
|
(76,015
|
)
|
||||||
|
Acquisition of businesses, net of cash acquired
|
(37,076
|
)
|
(24,230
|
)
|
(53,161
|
)
|
||||||
|
Proceeds from sale of property, plant and equipment
|
2,310
|
|
17,457
|
|
1,393
|
|
||||||
|
Other investing activities
|
(79
|
)
|
778
|
|
(1,717
|
)
|
||||||
|
NET CASH USED BY INVESTING ACTIVITIES
|
(85,352
|
)
|
(78,985
|
)
|
(129,500
|
)
|
||||||
|
CASH FLOWS FROM FINANCING ACTIVITIES
|
|
|
|
|||||||||
|
Proceeds from short-term borrowings
|
12,505
|
|
11,124
|
|
1,230
|
|
||||||
|
Payments on short-term borrowings
|
(9,268
|
)
|
(12,226
|
)
|
(2,164
|
)
|
||||||
|
Amounts due banks, net
|
(37,466
|
)
|
48,978
|
|
(517
|
)
|
||||||
|
Proceeds from long-term borrowings
|
357,780
|
|
8,754
|
|
61
|
|
||||||
|
Payments on long-term borrowings
|
(6,945
|
)
|
(3,299
|
)
|
(450
|
)
|
||||||
|
Proceeds from exercise of stock options
|
5,996
|
|
9,116
|
|
20,297
|
|
||||||
|
Excess tax benefit from stock-based compensation
|
1,974
|
|
5,967
|
|
10,602
|
|
||||||
|
Purchase of shares for treasury
|
(399,494
|
)
|
(307,178
|
)
|
(167,879
|
)
|
||||||
|
Cash dividends paid to shareholders
|
(86,968
|
)
|
(73,261
|
)
|
(49,277
|
)
|
||||||
|
Other financing activities
|
(8,022
|
)
|
(2,330
|
)
|
(6,087
|
)
|
||||||
|
NET CASH USED BY FINANCING ACTIVITIES
|
(169,908
|
)
|
(314,355
|
)
|
(194,184
|
)
|
||||||
|
Effect of exchange rate changes on cash and cash equivalents
|
(29,794
|
)
|
(29,808
|
)
|
(1,849
|
)
|
||||||
|
INCREASE (DECREASE) IN CASH AND CASH EQUIVALENTS
|
25,804
|
|
(21,446
|
)
|
13,361
|
|
||||||
|
Cash and cash equivalents at beginning of year
|
278,379
|
|
299,825
|
|
286,464
|
|
||||||
|
CASH AND CASH EQUIVALENTS AT END OF YEAR
|
$
|
304,183
|
|
$
|
278,379
|
|
$
|
299,825
|
|
|||
See notes to these consolidated financial statements.
F-8
LINCOLN ELECTRIC HOLDINGS, INC.
NOTES TO CONSOLIDATED FINANCIAL STATEMENTS
(Dollars in thousands, except share and per share amounts)
Principles of Consolidation
The consolidated financial statements include the accounts of Lincoln Electric Holdings, Inc. and its wholly-owned and majority-owned subsidiaries for which it has a controlling interest (the "Company") after elimination of all inter-company accounts, transactions and profits.
General Information
The Company is a manufacturer of welding, cutting and brazing products. Welding products include arc welding power sources, plasma cutters, wire feeding systems, robotic welding packages, integrated automation systems, fume extraction equipment, consumable electrodes, fluxes and welding accessories. The Company's product offering also includes computer numeric controlled ("CNC") plasma and oxy-fuel cutting systems, regulators and torches used in oxy-fuel welding, cutting and brazing and consumables used in the brazing and soldering alloys market.
Translation of Foreign Currencies
Asset and liability accounts are translated into U.S. dollars using exchange rates in effect at the dates of the Consolidated Balance Sheets; revenue and expense accounts are translated at average monthly exchange rates. Translation adjustments are reflected as a component of Total equity. For subsidiaries operating in highly inflationary economies, both historical and current exchange rates are used in translating balance sheet accounts and translation adjustments are included in Net income.
The translation of assets and liabilities originally denominated in foreign currencies into U.S. dollars is for consolidation purposes, and does not necessarily indicate that the Company could realize or settle the reported value of those assets and liabilities in U.S. dollars. Additionally, such a translation does not necessarily indicate that the Company could return or distribute the reported U.S. dollar value of the net equity of its foreign operations to shareholders.
Foreign currency transaction losses are included in Selling, general & administrative expenses and were
$6,023
,
$22,351
and
$7,759
in
2015
,
2014
and
2013
, respectively.
Venezuela – Highly Inflationary Economy
Venezuela is a highly inflationary economy under U.S. generally accepted accounting principles ("GAAP"). As a result, the financial statements of the Company's Venezuelan operation are reported under highly inflationary accounting rules as of January 1, 2010. Under highly inflationary accounting, the financial statements of the Company's Venezuelan operation have been remeasured into the Company's reporting currency and exchange gains and losses from the remeasurement of monetary assets and liabilities are reflected in current earnings. On February 8, 2013, the Venezuelan government announced the devaluation of its currency relative to the U.S. dollar. Effective February 13, 2013 the official rate moved from
4.3
to
6.3
bolivars to the U.S. dollar. In 2013, the devaluation of the bolivar resulted in a foreign currency transaction loss of
$8,081
in Selling, general & administrative expenses and higher Cost of goods sold of
$4,117
due to the liquidation of inventory valued at the historical exchange rate.
In January 2014, the Venezuela government announced the formation of the National Center of Foreign Trade (“CENCOEX”) to replace the Commission for the Administration of Currency Exchange (“CADIVI”). Effective January 24, 2014, the exchange rate applicable to the settlement of certain transactions through CENCOEX, including payments of dividends and royalties, changed to utilize the Complementary System of Foreign Currency Administration ("SICAD") auction-based exchange rate (the "SICAD rate") as opposed to the official rate. Further, in January 2014, the Venezuelan government enacted the "Fair Prices Law" limiting prices and establishing a maximum profit margin on goods and services. In February 2014, the government announced a new market based foreign exchange system, the SICAD II. The exchange rate established through SICAD II fluctuated daily and was significantly higher than both the official rate and the SICAD rate.
As of March 31, 2014, the Company determined that the rate used in remeasuring the Venezuelan operation's financial statements into U.S. dollars would change to the SICAD rate as future remittances for dividend payments could be transacted at the SICAD rate. As of March 31, 2014, the SICAD rate was
10.7
bolivars to the U.S. dollar, which resulted in a remeasurement loss on the bolivar-denominated monetary net asset position of
$17,665
which was recorded in Selling, general & administrative expenses in the three months ended March 31, 2014. Additionally, the Company incurred higher Cost of goods sold of
$3,468
during the second quarter of 2014 related to the adoption of the SICAD rate.
F-9
LINCOLN ELECTRIC HOLDINGS, INC.
NOTES TO CONSOLIDATED FINANCIAL STATEMENTS (Continued)
(Dollars in thousands, except share and per share amounts)
In February 2015, the Venezuelan government eliminated the SICAD II rate and announced a new exchange market called the Marginal Currency System (“SIMADI”), which allows for trading based on supply and demand. At September 30, 2015, the Company determined that the rate used in remeasuring the Venezuelan operation's financial statements into U.S. dollars would change to the SIMADI rate as it most appropriately approximates the rates used to transact business in its Venezuelan operations. At September 30, 2015, the SIMADI rate was
199.4
bolivars to the U.S. dollar, resulting in a remeasurement charge on the bolivar-denominated monetary net liability position of
$4,334
. This foreign exchange loss was recorded in Selling, general & administrative expenses during the three months ended September 30, 2015. Additionally, the Company recorded a lower of cost or net realizable value inventory adjustments of
$22,880
within Cost of goods sold, related to the adoption of the SIMADI rate. As of
December 31, 2015
, the SIMADI rate was
198.7
bolivars to the U.S dollar. If the Company were to convert bolivars at a rate other than the SIMADI rate, the Company may realize additional losses or gains to earnings.
Future impacts to earnings of applying highly inflationary accounting for Venezuela on the Company’s consolidated financial statements will be dependent upon the applied currency exchange mechanisms, the movements in the applicable exchange rates between the bolivar and the U.S. dollar and the amount of monetary assets and liabilities included in the Company’s Venezuelan operation’s balance sheet. The bolivar-denominated monetary net asset position was
$32
at
December 31, 2015
, including
$642
of cash and cash equivalents and the bolivar-denominated monetary net liability position was
$1,264
at
December 31, 2014
, including
$2,124
of cash and cash equivalents.
Cash Equivalents
The Company considers all highly liquid investments with a maturity of three months or less when purchased to be cash equivalents.
Accounts Receivable
The Company maintains an allowance for doubtful accounts for estimated losses from the failure of its customers to make required payments for products delivered. The Company estimates this allowance based on the age of the related receivable, knowledge of the financial condition of customers, review of historical receivables and reserve trends and other pertinent information. If the financial condition of customers deteriorates or an unfavorable trend in receivable collections is experienced in the future, additional allowances may be required. Historically, the Company's reserves have approximated actual experience.
Inventories
Inventories are valued at the lower of cost or net realizable value. Fixed manufacturing overhead costs are allocated to inventory based on normal production capacity and abnormal manufacturing costs are recognized as period costs. For most domestic inventories, cost is determined principally by the last-in, first-out ("LIFO") method, and for non-U.S. inventories, cost is determined by the first-in, first-out ("FIFO") method.
Reserves are maintained for estimated obsolescence or excess inventory equal to the difference between the cost of inventory and the estimated net realizable value based upon assumptions about future demand and market conditions. Historically, the Company's reserves have approximated actual experience.
Equity Investments
Investments in businesses in which the Company does not have a controlling interest and holds between a
20%
and
50%
ownership interest are accounted for using the equity method of accounting. The Company's
50%
ownership interest in equity investments includes investments in Turkey and Chile. The amount of retained earnings that represents undistributed earnings of
50%
or less owned equity investments was
$19,072
at
December 31, 2015
and
$18,542
at
December 31, 2014
.
Property, Plant and Equipment
Property, plant and equipment are stated at cost and include improvements which significantly increase capacities or extend the useful lives of existing plant and equipment. Depreciation and amortization are computed using a straight-line method over useful lives ranging from
three
to
20
years for machinery, tools and equipment, and up to
40
years for buildings. Net gains or losses related to asset dispositions are recognized in earnings in the period in which dispositions occur.
Routine maintenance, repairs and replacements are expensed as incurred. The Company capitalizes interest costs associated with long-term construction in progress.
F-10
LINCOLN ELECTRIC HOLDINGS, INC.
NOTES TO CONSOLIDATED FINANCIAL STATEMENTS (Continued)
(Dollars in thousands, except share and per share amounts)
Goodwill and Intangibles
Goodwill is recorded when the cost of acquired businesses exceeds the fair value of the identifiable net assets acquired. Intangible assets other than goodwill are recorded at fair value at the time acquired or at cost, if applicable. Intangible assets that do not have indefinite lives are amortized in line with the pattern in which the economic benefits of the intangible asset are consumed. If the pattern of economic benefit cannot be reliably determined, the intangible assets are amortized on a straight-line basis over the shorter of the legal or estimated life.
Goodwill and indefinite-lived intangibles assets are not amortized, but are tested for impairment in the fourth quarter using the same dates each year or more frequently if changes in circumstances or the occurrence of events indicate potential impairment. The fair value of each indefinite-lived intangible asset is compared to its carrying value and an impairment charge is recorded if the carrying value exceeds the fair value. Goodwill is tested by comparing the fair value of each reporting unit with its carrying value. If the carrying value of the reporting unit exceeds its fair value, the implied value of goodwill is compared to its carrying value and impairment is recognized to the extent that the carrying value exceeds the implied fair value.
Fair values are determined using established business valuation techniques and models developed by the Company that incorporate allocations of certain assets and cash flows among reporting units, estimates of market participant assumptions of future cash flows, future growth rates and the applicable discount rates to value estimated cash flows. Changes in economic and operating conditions impacting these assumptions could result in asset impairments in future periods.
Long-Lived Assets
The Company periodically evaluates whether current facts or circumstances indicate that the carrying value of its depreciable long-lived assets to be held and used may not be recoverable. If such circumstances are determined to exist, an estimate of undiscounted future cash flows produced by the long-lived asset, or the appropriate grouping of assets, is compared to the carrying value to determine whether impairment exists. If an asset is determined to be impaired, a loss is recognized to the extent that carrying value exceeds fair value. Fair value is measured based on quoted market prices in active markets, if available. If quoted market prices are not available, the estimate of fair value is based on various valuation techniques, including the discounted value of estimated future cash flows.
Fair Value Measurements
Financial assets and liabilities, such as the Company's defined benefit pension plan assets and derivative contracts, are valued at fair value using the market and income valuation approaches. Fair value is defined as the price that would be received to sell an asset or paid to transfer a liability in an orderly transaction between market participants at the measurement date (exit price). The Company uses the market approach to value similar assets and liabilities in active markets and the income approach that consists of discounted cash flow models that take into account the present value of future cash flows under the terms of the contracts using current market information as of the reporting date. The following hierarchy is used to classify the inputs used to measure fair value:
|
Level 1
|
Inputs to the valuation methodology are unadjusted quoted prices for identical assets or liabilities in active markets.
|
|
|
Level 2
|
Inputs to the valuation methodology include:
|
|
|
|
• Quoted prices for similar assets or liabilities in active markets;
|
|
|
|
• Quoted prices for identical or similar assets or liabilities in inactive markets;
|
|
|
|
• Inputs other than quoted prices that are observable for the asset or liability; and
|
|
|
|
• Inputs that are derived principally from or corroborated by observable market data by correlation or other means.
|
|
|
|
If the asset or liability has a specific (contractual) term, the Level 2 input must be observable for substantially the full term of the asset or liability.
|
|
|
Level 3
|
Inputs to the valuation methodology are unobservable and significant to the fair value measurement.
|
|
Product Warranties
The Company accrues for product warranty claims based on historical experience and the expected material and labor costs to provide warranty service. Warranty services are generally provided for periods up to
three
years from the date of sale. The accrual for product warranty claims is included in Accrued expenses.
F-11
LINCOLN ELECTRIC HOLDINGS, INC.
NOTES TO CONSOLIDATED FINANCIAL STATEMENTS (Continued)
(Dollars in thousands, except share and per share amounts)
Revenue Recognition
Substantially all of the Company's revenues are recognized when the risks and rewards of ownership and title to the product have transferred to the customer, which generally occurs at point of shipment. The Company recognizes any discounts, credits, returns, rebates and incentive programs based on reasonable estimates as a reduction of Sales to arrive at Net sales at the same time the related revenue is recorded.
For contracts accounted for under the percentage of completion method, revenue recognition is based upon the ratio of costs incurred to date compared with estimated total costs to complete. The cumulative impact of revisions to total estimated costs is reflected in the period of the change, including anticipated losses.
Distribution Costs
Distribution costs, including warehousing and freight related to product shipments, are included in Cost of goods sold.
Stock-Based Compensation
Expense is recognized for all awards of stock-based compensation by allocating the aggregate grant date fair value over the vesting period. No expense is recognized for any stock options, restricted or deferred shares or restricted stock units ultimately forfeited because the recipients fail to meet vesting requirements.
Common stock issuable upon the exercise of employee stock options is excluded from the calculation of diluted earnings per share when the calculation of option equivalent shares is anti-dilutive.
Financial Instruments
The Company uses derivative instruments to manage exposures to interest rates, commodity prices and currency exchange rate fluctuations on certain purchase and sales transactions, balance sheet and net investment exposures. Derivative contracts to hedge currency and commodity exposures are generally written on a short-term basis but may cover exposures for up to
two
years while interest rate contracts may cover longer periods consistent with the terms of the underlying debt. The Company does not enter into derivatives for trading or speculative purposes.
All derivatives are recognized at fair value on the Company's Consolidated Balance Sheets. The accounting for gains and losses resulting from changes in fair value depends on the use of the derivative and whether it is designated and qualifies for hedge accounting. The Company formally documents the relationship of the hedge with the hedged item as well as the risk-management strategy for all designated hedges. Both at inception and on an ongoing basis, the hedging instrument is assessed as to its effectiveness, when applicable. If and when a derivative is determined not to be highly effective as a hedge, the underlying hedged transaction is no longer likely to occur, or the derivative is terminated, hedge accounting is discontinued. The cash flows from settled derivative contracts are recognized in operating activities in the Company's Consolidated Statements of Cash Flows.
The Company is subject to the credit risk of the counterparties to derivative instruments. Counterparties include a number of major banks and financial institutions. The Company manages individual counterparty exposure by monitoring the credit rating of the counterparty and the size of financial commitments and exposures between the Company and the counterparty.
Cash flow hedges
Certain foreign currency forward contracts are qualified and designated as cash flow hedges (i.e., hedging the exposure to variability in expected future cash flows). The effective portion of the fair value unrealized gain or loss on cash flow hedges are reported as a component of Accumulated other comprehensive income ("AOCI") with offsetting amounts recorded as Other current assets, Other non-current assets, Other current liabilities or Other long-term liabilities depending on the position and the duration of the contract. At settlement, the realized gain or loss is recorded in Cost of goods sold or Sales for hedges of purchases and sales, respectively, in the same period or periods during which the hedged transaction affects earnings. The ineffective portion on cash flow hedges is recognized in current earnings.
Net investment hedges
For derivative instruments that qualify as a net investment hedge (i.e., hedging the foreign currency exposure of a net investment in a foreign operation), the effective portion of the fair value gains or losses are recognized in AOCI with offsetting amounts recorded as Other current assets, Other non-current assets, Other current liabilities or Other long-term liabilities depending on the position and the duration of the contract. The gains or losses are subsequently reclassified to Selling, general, and administrative expenses, as the underlying hedged investment is liquidated.
F-12
LINCOLN ELECTRIC HOLDINGS, INC.
NOTES TO CONSOLIDATED FINANCIAL STATEMENTS (Continued)
(Dollars in thousands, except share and per share amounts)
Derivatives not designated as hedging instruments
The Company has certain derivative instruments which are not designated as hedging instruments including foreign exchange forward contracts and commodity price contracts. Foreign exchange forward contracts are held as economic hedges of certain balance sheet exposures and qualify as fair value hedges (i.e., hedging the exposure to changes in the fair value of an asset or a liability). The gains or losses on
t
hese contracts are recognized in Selling, general and administrative expenses, offsetting the losses or gains on the exposures being hedged. Short-term commodity price contracts are not designated as hedges. Realized and unrealized gains and losses on these contracts are recognized in Costs of goods sold.
Research and Development
Research and development costs are charged to Selling, general & administrative expenses as incurred and totaled
$47,182
,
$43,256
and
$42,126
in
2015
,
2014
and
2013
, respectively.
Bonus
Included in Selling, general & administrative expenses are the costs related to the Company's discretionary employee bonus programs, which for certain U.S.-based employees are net of hospitalization costs. Bonus costs were
$98,651
in
2015
,
$128,478
in
2014
and
$123,571
in
2013
.
Income Taxes
Deferred income taxes are recognized at currently enacted tax rates for temporary differences between the GAAP and income tax basis of assets and liabilities and operating loss and tax credit carry-forwards. In assessing the realizability of deferred tax assets, the Company assesses whether it is more likely than not that a portion or all of the deferred tax assets will not be realized.
Estimates
The preparation of financial statements in conformity with GAAP requires management to make estimates and assumptions in certain circumstances that affect the amounts reported in the accompanying consolidated financial statements and notes. Actual results could differ from these estimates.
Reclassification
Certain reclassifications have been made to prior year financial statements to conform to current year classifications.
New Accounting Pronouncements
New Accounting Pronouncements Adopted:
In November 2015, the Financial Accounting Standards Board ("FASB") issued Accounting Standard Update ("ASU") No. 2015-17,
"Income Taxes (Topic 740): Balance Sheet Classification of Deferred Taxes."
ASU 2015-17 requires deferred tax liabilities and assets to be classified as non-current in a classified statement of financial position. The amendments may be applied prospectively to all deferred tax liabilities and assets or retrospectively to all periods presented. ASU 2015-17 is effective for financial statements issued for fiscal years beginning after December 15, 2016 and interim periods within those annual periods. ASU 2015-17 was early adopted by the Company effective October 1, 2015 to improve Company disclosures and was applied prospectively. As such, prior periods have not been retrospectively adjusted.
In July 2015, the FASB issued ASU No. 2015-11,
"Inventory (Topic 330): Simplifying the Measurement of Inventory."
ASU 2015-11 applies to all inventory that is measured using the first-in, first-out and average cost valuation methods. ASU 2015-11 requires entities to measure inventory at lower of cost and net realizable value. Subsequent measurement is unchanged for inventory measured using last-in, first-out or the retail inventory method. The amendments should be applied prospectively and are effective for financial statements issued for fiscal years beginning after December 15, 2016, and interim periods within those fiscal years. ASU 2015-11 was early adopted by the Company effective July 1, 2015 and did not have a significant impact on the Company's financial statements.
F-13
LINCOLN ELECTRIC HOLDINGS, INC.
NOTES TO CONSOLIDATED FINANCIAL STATEMENTS (Continued)
(Dollars in thousands, except share and per share amounts)
In April 2015, the FASB issued ASU 2015-03,
"Interest - Imputation of Interest (Subtopic 835-30)."
ASU 2015-03 requires debt issuance costs related to a recognized debt liability to be presented in the balance sheet as a direct deduction from the carrying amount of the debt liability, consistent with debt discounts. The recognition and measurement guidance for debt issuance costs are not affected by the new amendment. The new guidance will be applied on a retrospective basis to each prior reporting period presented. Upon transition, the Company is required to comply with applicable disclosures for a change in accounting principle. The amendment is effective for financial statements issued for fiscal years beginning after December 15, 2015, and interim periods within those fiscal years. ASU 2015-03 was early adopted by the Company effective October 1, 2015 resulting in debt issuance costs being presented as a direct deduction to the Company's Long-term debt, less current portion in the Consolidated Balance Sheet as of
December 31, 2015
. Refer to Note 8 - Debt for additional details. The Company has applied the provisions of ASU 2015-15,
"Interest - Imputation of Interest (Subtopic 835-30)"
and presents costs associated with its line of credit agreements as an asset in the Consolidated Balance Sheet.
New Accounting Pronouncements to be Adopted:
In September 2015, the FASB issued ASU No. 2015-16,
"Business Combinations (Topic 805): Simplifying the Accounting for Measurement-Period Adjustments."
ASU 2015-16 requires an acquiring entity to recognize adjustments to provisional amounts that are identified during the measurement period in the reporting period in which the adjustment amounts are determined. The amendments also require an entity to record the effect on earnings of changes in depreciation, amortization, or other income effects, if any, as a result of the change to the provisional amounts, calculated as if the accounting had been completed at the acquisition date. An entity must present separately on the face of the statement of operations or disclose in the notes the portion of the amount recorded in current-period earnings by line item that would have been recorded in previous reporting periods if the adjustment to the provisional amounts had been recognized as of the acquisition date. The amendments should be applied prospectively and are effective for financial statements issued for fiscal years beginning after December 15, 2015, including interim periods within those fiscal years.
In May 2015, the FASB issued ASU No. 2015-07,
"Fair Value Measurement (Topic 820): Disclosures for Investments in Certain Entities That Calculate Net Asset Value per Share."
ASU 2015-07 removes the requirement to categorize within the fair value hierarchy all investments for which fair value is measured using the net asset value per share practical expedient and removes the requirement to make certain disclosures for these investments. The amendment should be applied retrospectively and is effective for financial statements issued for fiscal years beginning after December 15, 2015, and interim periods within those fiscal years. Early adoption is permitted. The Company is currently evaluating the impact of the adoption of ASU 2015-07 on the Company's financial statement disclosures.
In May 2014, the FASB issued ASU No. 2014-09,
"Revenue from Contracts with Customers (Topic 606)."
ASU 2014-09 requires an entity to recognize revenue in a manner that depicts the transfer of promised goods or services to customers in an amount that reflects the consideration to which the entity expects to be entitled in exchange for those goods or services. To achieve that core principle, the amendment provides five steps that an entity should apply when recognizing revenue. The amendment also specifies the accounting of some costs to obtain or fulfill a contract with a customer and expands the disclosure requirements around contracts with customers. An entity can either adopt this amendment retrospectively to each prior reporting period presented or retrospectively with the cumulative effect of initially applying the update recognized at the date of initial application. In August 2015, the FASB issued ASU 2015-14, "
Revenue from Contracts with Customers (Topic 606): Deferral of the Effective Date,"
which deferred the effective date of ASU 2014-09 to annual reporting periods beginning after December 15, 2017, and interim periods within those fiscal years. Early adoption is permitted as of annual reporting periods beginning after December 15, 2016. The Company is currently evaluating the impact of the adoption of ASU 2014-09 on the Company's financial statements.
F-14
LINCOLN ELECTRIC HOLDINGS, INC.
NOTES TO CONSOLIDATED FINANCIAL STATEMENTS (Continued)
(Dollars in thousands, except share and per share amounts)
The following table sets forth the computation of basic and diluted earnings per share:
|
Year Ended December 31,
|
|||||||||||
|
2015
|
2014
|
2013
|
|||||||||
|
Numerator:
|
|||||||||||
|
Net income
|
$
|
127,478
|
|
$
|
254,686
|
|
$
|
293,780
|
|
||
|
Denominator:
|
|||||||||||
|
Basic weighted average shares outstanding
|
74,111
|
|
79,185
|
|
81,978
|
|
|||||
|
Effect of dilutive securities - Stock options and awards
|
743
|
|
911
|
|
1,064
|
|
|||||
|
Diluted weighted average shares outstanding
|
74,854
|
|
80,096
|
|
83,042
|
|
|||||
|
Basic earnings per share
|
$
|
1.72
|
|
$
|
3.22
|
|
$
|
3.58
|
|
||
|
Diluted earnings per share
|
$
|
1.70
|
|
$
|
3.18
|
|
$
|
3.54
|
|
||
For the years ended
December 31, 2015
,
2014
and
2013
, common shares subject to equity-based awards of
522,471
,
260,090
and
45,850
, respectively, were excluded from the computation of diluted earnings per share because the effect of their exercise would be anti-dilutive.
During August 2015, the Company acquired Specialised Welding Products ("SWP"). SWP, based in Melbourne, Australia, is a provider of specialty welding consumables and fabrication, maintenance and repair services for alloy and wear resistant products commonly used in mining and energy sector applications. The acquisition broadens the Company's presence and specialty alloy offering in Australia and New Zealand.
Also in August 2015, the Company acquired Rimrock Holdings Corporation ("Rimrock"). Rimrock is a manufacturer of industrial automation products and robotic systems with two divisions, Wolf Robotics LLC, based in Fort Collins, Colorado, and Rimrock Corporation, based in Columbus, Ohio. Wolf Robotics integrates robotic welding and cutting systems predominantly for heavy fabrication and transportation OEMs and suppliers. The acquisition advances the Company's leadership position in automated welding and cutting solutions. Rimrock Corporation designs and manufactures automated spray systems and turnkey robotic systems for the die casting, foundry and forging markets. The Company is currently reviewing strategic options for Rimrock Corporation.
Combined annual revenues for SWP and Rimrock at the dates of acquisition were approximately
$56,000
.
During October 2014, the Company acquired substantially all of the assets of Easom Automation Systems, Inc. ("Easom"). Easom, based in Detroit, Michigan, is an integrator and manufacturer of automation and positioning solutions, serving heavy fabrication, aerospace and automotive OEMs and suppliers. The acquisition advances the Company's leadership position in automated welding and cutting solutions. Easom has annual sales of approximately
$30,000
. In addition, during 2014, the Company acquired the remaining interest in its majority-owned joint venture, Harris Soldas Especiais S.A.
During November 2013, the Company completed the acquisition of Robolution GmbH ("Robolution"). Robolution, based outside of Frankfurt, Germany, is a leading European provider of robotic arc welding systems. The acquisition added to the Company's growing automation business and enables the Company to better support automation customers across three continents.
Also in November 2013, the Company acquired an ownership interest in Burlington Automation Corporation ("Burlington"). Burlington, based in Hamilton, Ontario, Canada, is a leader in the design and manufacture of 3D robotic plasma cutting systems whose products are sold under the brand name Python X
®
. The acquisition broadens the Company's portfolio of automated cutting and welding process solutions.
Combined revenues for Robolution and Burlington in 2013 were approximately
$35,000
. In addition, during 2013, the Company acquired a greater interest in its majority-owned joint venture, Lincoln Electric Heli (Zhengzhou) Welding Materials Company Ltd.
Pro forma information related to these acquisitions has not been presented because the impact on the Company's Consolidated Statements of Income is not material. Acquired companies are included in the Company's consolidated financial statements as of the date of acquisition.
F-15
LINCOLN ELECTRIC HOLDINGS, INC.
NOTES TO CONSOLIDATED FINANCIAL STATEMENTS (Continued)
(Dollars in thousands, except share and per share amounts)
The changes in the carrying amount of goodwill by reportable segments for the years ended December 31,
2015
and
2014
were as follows:
|
North
America
Welding
|
Europe
Welding
|
Asia
Pacific
Welding
|
South
America
Welding
|
The Harris
Products
Group
|
Consolidated
|
|||||||||||||||||||
|
Balance as of December 31, 2013
|
$
|
130,439
|
|
$
|
24,430
|
|
$
|
5,359
|
|
$
|
562
|
|
$
|
13,925
|
|
$
|
174,715
|
|
||||||
|
Additions and adjustments
|
18,014
|
—
|
|
—
|
|
—
|
|
(381
|
)
|
17,633
|
|
|||||||||||||
|
Foreign currency translation
|
(3,859)
|
(7,700
|
)
|
(97
|
)
|
(106
|
)
|
(459
|
)
|
(12,221
|
)
|
|||||||||||||
|
Balance as of December 31, 2014
|
144,594
|
|
16,730
|
|
5,262
|
|
456
|
|
13,085
|
|
180,127
|
|
||||||||||||
|
Additions and adjustments
|
19,700
|
—
|
|
3,846
|
|
—
|
|
(301
|
)
|
23,245
|
|
|||||||||||||
|
Impairment charges
|
(6,315
|
)
|
—
|
|
—
|
|
—
|
|
—
|
|
(6,315
|
)
|
||||||||||||
|
Foreign currency translation
|
(5,986)
|
(2,384
|
)
|
(109
|
)
|
(114
|
)
|
(960
|
)
|
(9,553
|
)
|
|||||||||||||
|
Balance as of December 31, 2015
|
$
|
151,993
|
|
$
|
14,346
|
|
$
|
8,999
|
|
$
|
342
|
|
$
|
11,824
|
|
$
|
187,504
|
|
||||||
Additions to goodwill primarily reflect goodwill recognized in the acquisitions of Rimrock and SWP in 2015 and Easom in 2014 (see Note 3). During the third quarter of 2015, the Company determined that for certain long-lived assets of a business unit, the carrying value of the assets exceeded the fair value resulting in impairment (see Note 6). This result was considered a possible indication of goodwill impairment, therefore, the Company performed an interim goodwill impairment test, using a combination of income and market valuation approaches resulting in a
$6,315
non-cash impairment charge to the carrying value of goodwill. The reductions to goodwill include the tax benefit attributable to the amortization of tax deductible goodwill in excess of goodwill recorded for financial reporting purposes.
Gross carrying values and accumulated amortization of intangible assets other than goodwill by asset class as of December 31,
2015
and
2014
were as follows:
|
|
December 31, 2015
|
December 31, 2014
|
||||||||||||||
|
|
Gross
Amount
|
Accumulated
Amortization
|
Gross
Amount |
Accumulated
Amortization |
||||||||||||
|
Intangible assets not subject to amortization
|
||||||||||||||||
|
Trademarks and trade names
|
$
|
15,919
|
|
$
|
16,273
|
|
||||||||||
|
Intangible assets subject to amortization
|
||||||||||||||||
|
Trademarks and trade names
|
$
|
36,754
|
|
$
|
18,243
|
|
$
|
34,064
|
|
$
|
14,253
|
|
||||
|
Customer relationships
|
77,590
|
|
33,932
|
|
77,671
|
|
26,935
|
|
||||||||
|
Patents
|
24,208
|
|
6,884
|
|
24,195
|
|
6,509
|
|
||||||||
|
Other
|
54,586
|
|
29,279
|
|
54,992
|
|
26,809
|
|
||||||||
|
Total intangible assets subject to amortization
|
$
|
193,138
|
|
$
|
88,338
|
|
$
|
190,922
|
|
$
|
74,506
|
|
||||
Increases in gross intangible assets primarily reflect the acquisitions of Rimrock and SWP in 2015. During the third quarter of 2015, the Company recognized non-cash impairment charges of
$3,417
related to trademarks and trade names, customer relationships and other definite lived intangible assets (see Note 6). All impairment charges have been recorded within Rationalization and asset impairment charges.
F-16
LINCOLN ELECTRIC HOLDINGS, INC.
NOTES TO CONSOLIDATED FINANCIAL STATEMENTS (Continued)
(Dollars in thousands, except share and per share amounts)
During 2015, the Company acquired intangible assets, either individually or as part of a group of assets, with an initial purchase price allocation and weighted-average lives as follows:
|
Year Ended December 31, 2015
|
||||||
|
Purchase Price Allocation
|
Weighted
Average Life
|
|||||
|
Acquired intangible assets not subject to amortization
|
||||||
|
Trademarks and trade names
|
$
|
615
|
|
|||
|
Acquired intangible assets subject to amortization
|
||||||
|
Trademarks and trade names
|
2,155
|
|
10
|
|||
|
Customer relationships
|
4,479
|
|
10
|
|||
|
Patents
|
2,377
|
|
20
|
|||
|
Other
|
2,694
|
|
11
|
|||
|
Total acquired intangible assets subject to amortization
|
$
|
11,705
|
|
|||
Aggregate amortization expense was
$13,296
,
$13,869
and
$13,342
for
2015
,
2014
and
2013
, respectively. Estimated annual amortization expense for intangible assets for each of the next five years is
$13,950
in
2016
,
$12,790
in
2017
,
$11,928
in
2018
,
$10,788
in
2019
and
$10,360
in
2020
.
The Company's primary business is the design and manufacture of arc welding and cutting products, manufacturing a broad line of arc welding equipment, consumable welding products and other welding and cutting products. The Company also has a leading global position in the brazing and soldering alloys market. As of December 31, 2015, the Company's business units were aligned into
five
operating segments. The operating segments consists of North America Welding, Europe Welding, Asia Pacific Welding, South America Welding and The Harris Products Group. The North America Welding segment primarily includes welding operations in the United States, Canada and Mexico. The Europe Welding segment includes welding operations in Europe, Russia, Africa and the Middle East. The Asia Pacific Welding segment primarily includes welding operations in China and Australia. The South America Welding segment primarily includes welding operations in Brazil, Colombia and Venezuela. The Harris Products Group includes the Company's global cutting, soldering and brazing businesses as well as the retail business in the United States.
During the first quarter of 2016, the Company realigned its organizational and leadership structure. The new structure will allow for further integration of operational and product development processes across regions and support growth strategies. In accordance with this organizational change, beginning with quarterly reporting for the three months ended March 31, 2016, the Company will report
three
operating segments as follows: Americas Welding, International Welding, and The Harris Products Group.
Segment performance is measured and resources are allocated based on a number of factors, the primary profit measure being earnings before interest and income taxes ("EBIT"), as adjusted. EBIT is defined as Operating income plus Equity earnings in affiliates and Other income. Segment EBIT is adjusted for special items as determined by management such as the impact of rationalization activities, certain asset impairment charges and gains or losses on disposals of assets. The accounting principles applied at the operating segment level are generally the same as those applied at the consolidated financial statement level with the exception of LIFO. Segment assets include inventories measured on a FIFO basis while consolidated inventories include inventories reported on a LIFO basis. Segment and consolidated income before interest and income taxes include the effect of inventories reported on a LIFO basis. At December 31,
2015
,
2014
and
2013
, approximately
40%
,
40%
and
38%
, respectively, of total inventories were valued using the LIFO method. LIFO is used for certain domestic inventories included in North America Welding. Inter-segment sales are recorded at agreed upon prices that approximate arm's length prices and are eliminated in consolidation. Corporate-level expenses are allocated to the operating segments.
F-17
LINCOLN ELECTRIC HOLDINGS, INC.
NOTES TO CONSOLIDATED FINANCIAL STATEMENTS (Continued)
(Dollars in thousands, except share and per share amounts)
Financial information for the reportable segments follows:
|
North
America
Welding
|
Europe
Welding
|
Asia
Pacific
Welding
|
South
America
Welding
|
The Harris
Products
Group
|
Corporate /
Eliminations
|
Consolidated
|
|||||||||||||||||||||
|
For the Year Ended
December 31, 2015
|
|||||||||||||||||||||||||||
|
Net sales
|
$
|
1,610,357
|
|
$
|
336,824
|
|
$
|
186,615
|
|
$
|
138,014
|
|
$
|
263,981
|
|
$
|
—
|
|
$
|
2,535,791
|
|
||||||
|
Inter-segment sales
|
100,770
|
|
15,922
|
|
10,510
|
|
174
|
|
9,312
|
|
(136,688
|
)
|
$
|
—
|
|
||||||||||||
|
Total
|
$
|
1,711,127
|
|
$
|
352,746
|
|
$
|
197,125
|
|
$
|
138,188
|
|
$
|
273,293
|
|
$
|
(136,688
|
)
|
$
|
2,535,791
|
|
||||||
|
EBIT, as adjusted
|
$
|
306,746
|
|
$
|
31,317
|
|
$
|
7,392
|
|
$
|
5,569
|
|
$
|
27,882
|
|
$
|
(99
|
)
|
$
|
378,807
|
|
||||||
|
Special items charge (gain)
|
155,757
|
|
1,507
|
|
5,432
|
|
27,214
|
|
—
|
|
—
|
|
$
|
189,910
|
|
||||||||||||
|
EBIT
|
$
|
150,989
|
|
$
|
29,810
|
|
$
|
1,960
|
|
$
|
(21,645
|
)
|
$
|
27,882
|
|
$
|
(99
|
)
|
$
|
188,897
|
|
||||||
|
Interest income
|
2,714
|
|
|||||||||||||||||||||||||
|
Interest expense
|
(21,824
|
)
|
|||||||||||||||||||||||||
|
Income before income taxes
|
$
|
169,787
|
|
||||||||||||||||||||||||
|
Total assets
|
$
|
1,101,056
|
|
$
|
298,825
|
|
$
|
239,382
|
|
$
|
82,575
|
|
$
|
143,905
|
|
$
|
(81,572
|
)
|
$
|
1,784,171
|
|
||||||
|
Equity investments in affiliates
|
—
|
|
23,450
|
|
—
|
|
3,791
|
|
—
|
|
—
|
|
$
|
27,241
|
|
||||||||||||
|
Capital expenditures
|
31,578
|
|
6,508
|
|
5,480
|
|
4,214
|
|
2,727
|
|
—
|
|
$
|
50,507
|
|
||||||||||||
|
Depreciation and amortization
|
44,344
|
|
8,296
|
|
7,026
|
|
1,765
|
|
2,596
|
|
(20
|
)
|
$
|
64,007
|
|
||||||||||||
|
For the Year Ended
December 31, 2014
|
|||||||||||||||||||||||||||
|
Net sales
|
$
|
1,700,924
|
|
$
|
425,775
|
|
$
|
243,800
|
|
$
|
148,595
|
|
$
|
294,230
|
|
$
|
—
|
|
$
|
2,813,324
|
|
||||||
|
Inter-segment sales
|
124,732
|
|
19,586
|
|
14,820
|
|
144
|
|
8,210
|
|
(167,492
|
)
|
$
|
—
|
|
||||||||||||
|
Total
|
$
|
1,825,656
|
|
$
|
445,361
|
|
$
|
258,620
|
|
$
|
148,739
|
|
$
|
302,440
|
|
$
|
(167,492
|
)
|
$
|
2,813,324
|
|
||||||
|
EBIT, as adjusted
|
$
|
335,465
|
|
$
|
48,822
|
|
$
|
1,321
|
|
$
|
15,953
|
|
$
|
28,563
|
|
$
|
4,216
|
|
$
|
434,340
|
|
||||||
|
Special items charge (gain)
|
(68
|
)
|
904
|
|
28,635
|
|
21,715
|
|
—
|
|
—
|
|
$
|
51,186
|
|
||||||||||||
|
EBIT
|
$
|
335,533
|
|
$
|
47,918
|
|
$
|
(27,314
|
)
|
$
|
(5,762
|
)
|
$
|
28,563
|
|
$
|
4,216
|
|
$
|
383,154
|
|
||||||
|
Interest income
|
3,093
|
|
|||||||||||||||||||||||||
|
Interest expense
|
(10,434
|
)
|
|||||||||||||||||||||||||
|
Income before income taxes
|
$
|
375,813
|
|
||||||||||||||||||||||||
|
Total assets
|
$
|
1,111,065
|
|
$
|
359,337
|
|
$
|
284,573
|
|
$
|
138,114
|
|
$
|
147,990
|
|
$
|
(101,864
|
)
|
$
|
1,939,215
|
|
||||||
|
Equity investments in affiliates
|
—
|
|
23,902
|
|
—
|
|
3,579
|
|
—
|
|
—
|
|
$
|
27,481
|
|
||||||||||||
|
Capital expenditures
|
51,691
|
|
5,619
|
|
3,959
|
|
10,896
|
|
825
|
|
—
|
|
$
|
72,990
|
|
||||||||||||
|
Depreciation and amortization
|
43,659
|
|
10,823
|
|
9,799
|
|
2,085
|
|
3,512
|
|
(271
|
)
|
$
|
69,607
|
|
||||||||||||
|
For the Year Ended
December 31, 2013
|
|||||||||||||||||||||||||||
|
Net sales
|
$
|
1,652,769
|
|
$
|
429,548
|
|
$
|
266,282
|
|
$
|
195,895
|
|
$
|
308,177
|
|
$
|
—
|
|
$
|
2,852,671
|
|
||||||
|
Inter-segment sales
|
127,254
|
|
19,911
|
|
14,906
|
|
233
|
|
9,605
|
|
(171,909
|
)
|
$
|
—
|
|
||||||||||||
|
Total
|
$
|
1,780,023
|
|
$
|
449,459
|
|
$
|
281,188
|
|
$
|
196,128
|
|
$
|
317,782
|
|
$
|
(171,909
|
)
|
$
|
2,852,671
|
|
||||||
|
EBIT, as adjusted
|
$
|
318,507
|
|
$
|
36,247
|
|
$
|
1,815
|
|
$
|
57,306
|
|
$
|
27,826
|
|
$
|
(4,350
|
)
|
$
|
437,351
|
|
||||||
|
Special items charge (gain)
|
1,052
|
|
2,045
|
|
6,071
|
|
12,198
|
|
—
|
|
—
|
|
$
|
21,366
|
|
||||||||||||
|
EBIT
|
$
|
317,455
|
|
$
|
34,202
|
|
$
|
(4,256
|
)
|
$
|
45,108
|
|
$
|
27,826
|
|
$
|
(4,350
|
)
|
$
|
415,985
|
|
||||||
|
Interest income
|
3,320
|
|
|||||||||||||||||||||||||
|
Interest expense
|
(2,864
|
)
|
|||||||||||||||||||||||||
|
Income before income taxes
|
$
|
416,441
|
|
||||||||||||||||||||||||
|
Total assets
|
$
|
1,048,412
|
|
$
|
403,094
|
|
$
|
325,656
|
|
$
|
169,027
|
|
$
|
162,496
|
|
$
|
43,182
|
|
$
|
2,151,867
|
|
||||||
|
Equity investments in affiliates
|
—
|
|
23,315
|
|
—
|
|
3,303
|
|
—
|
|
—
|
|
$
|
26,618
|
|
||||||||||||
|
Capital expenditures
|
41,181
|
|
10,305
|
|
2,073
|
|
20,840
|
|
3,931
|
|
(2,315
|
)
|
$
|
76,015
|
|
||||||||||||
|
Depreciation and amortization
|
39,086
|
|
10,933
|
|
13,559
|
|
1,893
|
|
3,636
|
|
(224
|
)
|
$
|
68,883
|
|
||||||||||||
F-18
LINCOLN ELECTRIC HOLDINGS, INC.
NOTES TO CONSOLIDATED FINANCIAL STATEMENTS (Continued)
(Dollars in thousands, except share and per share amounts)
In 2015, special items in North America Welding, Europe Welding and Asia Pacific Welding include rationalization charges primarily related to employee severance and other related costs. North America Welding special items also include charges of
$3,417
related to the impairment of long-lived assets and
$6,315
related to the impairment to the carrying value of goodwill. Special items in 2015 also include pension settlement charges of
$142,738
, primarily related to the purchase of a group annuity contract. South America Welding special items reflect Venezuelan foreign exchange remeasurement losses related to the adoption of a new foreign exchange mechanism.
In 2014, special items include net rationalization charges primarily related to employee severance and other costs associated with the consolidation of manufacturing operations. Asia Pacific Welding special items also include net charges of
$32,742
related to the impairment of long-lived assets partially offset by gains of
$3,293
related to the sale of assets. South America Welding special items also include Venezuelan foreign exchange remeasurement losses of
$21,133
related to the adoption of a new foreign exchange mechanism.
In 2013, special items in North America Welding, Europe Welding and Asia Pacific Welding reflect rationalization charges primarily related to employee severance and other costs associated with the consolidation of manufacturing operations. Asia Pacific Welding special items also include charges of
$4,444
related to the impairment of long-lived assets and a charge of
$705
related to a loss on the sale of land. South America Welding special items represent a charge related to the devaluation of the Venezuelan foreign currency.
Export sales (excluding inter-company sales) from the United States were
$175,049
in
2015
,
$210,325
in
2014
and
$260,195
in
2013
. No individual customer comprised more than
10%
of the Company's total revenues for any of the three years ended
December 31, 2015
.
The geographic split of the Company's Net sales, based on the location of the customer, and property, plant and equipment were as follows:
|
|
Year Ended December 31,
|
|||||||||||
|
|
2015
|
2014
|
2013
|
|||||||||
|
Net sales:
|
|
|
|
|||||||||
|
United States
|
$
|
1,387,882
|
|
$
|
1,417,750
|
|
$
|
1,350,309
|
|
|||
|
China
|
137,101
|
|
190,035
|
|
219,490
|
|
||||||
|
Other foreign countries
|
1,010,808
|
|
1,205,539
|
|
1,282,872
|
|
||||||
|
Total
|
$
|
2,535,791
|
|
$
|
2,813,324
|
|
$
|
2,852,671
|
|
|||
|
|
December 31,
|
|||||||||||
|
|
2015
|
2014
|
2013
|
|||||||||
|
Property, plant and equipment, net:
|
|
|
|
|||||||||
|
United States
|
$
|
173,974
|
|
$
|
171,746
|
|
$
|
162,357
|
|
|||
|
China
|
53,673
|
|
57,783
|
|
83,416
|
|
||||||
|
Other foreign countries
|
184,045
|
|
209,640
|
|
238,685
|
|
||||||
|
Eliminations
|
(369
|
)
|
(423
|
)
|
(453
|
)
|
||||||
|
Total
|
$
|
411,323
|
|
$
|
438,746
|
|
$
|
484,005
|
|
|||
The Company recorded rationalization net charges of
$19,958
,
$30,053
and
$8,463
for the years ended
December 31, 2015
,
2014
and
2013
, respectively. The
2015
net charges include
$13,719
primarily related to employee severance and other related costs and
$6,239
in asset impairment charges. A description of each restructuring plan and the related costs follows:
North America Welding Plans:
During 2015, the Company initiated a rationalization plan within North America Welding that includes a voluntary separation incentive program covering certain U.S.-based employees. The Company recorded rationalization charges of
$3,298
for the year ended
December 31, 2015
related to the program, which represent employee severance and other related costs. The Company does not expect further costs associated with these actions to be material as they were substantially completed and paid during 2015.
F-19
LINCOLN ELECTRIC HOLDINGS, INC.
NOTES TO CONSOLIDATED FINANCIAL STATEMENTS (Continued)
(Dollars in thousands, except share and per share amounts)
Due to the presence of impairment indicators during 2015, the Company performed an impairment test of certain long-lived assets of a business unit. The Company determined that for certain long-lived assets the carrying value of the assets exceeded the fair value, resulting in a
$3,417
non-cash impairment charge. This result was considered a possible indication of goodwill impairment, therefore, the Company performed an interim goodwill impairment test, using a combination of income and market valuation approaches, resulting in a
$6,315
non-cash impairment charge to the carrying value of goodwill.
Europe Welding Plans:
During 2015, the Company initiated a rationalization plan within Europe Welding. The plan includes headcount restructuring to better align the cost structures with economic conditions and operating needs. During the year ended
December 31, 2015
, the Company recorded charges relating to the Europe Welding plans of
$1,507
, which represent employee severance and other related costs. The Company does not expect further costs associated with these actions to be material as they were substantially completed and paid during 2015.
Asia Pacific Welding Plans:
During 2014, the Company identified net assets within the segment for planned divestiture which were classified as held for sale. During 2015, the Company initiated a rationalization plan to restructure headcount and better align the cost structures with economic conditions and operating needs. As part of this plan, the net assets held for sale were reclassified as held for use as the sale was no longer deemed probable. During the year ended
December 31, 2015
, the Company recorded net charges relating to these actions of
$5,421
, which primarily represent employee severance and other related costs partially offset by costs and adjustments to reclassify a potential divestiture that was previously held-for-sale. The Company does not expect additional charges related to the completion of these actions to be material. At
December 31, 2015
, liabilities relating to the Asia Pacific Welding plan of
$7,440
were recognized in Other current liabilities.
The following tables summarize the activity related to the rationalization liabilities by segment for the year ended
December 31, 2015
:
|
North America Welding
|
Europe
Welding
|
Asia
Pacific
Welding
|
South America Welding
|
Consolidated
|
||||||||||||||||
|
Balance at December 31, 2013
|
$
|
466
|
|
$
|
2,435
|
|
$
|
375
|
|
$
|
—
|
|
$
|
3,276
|
|
|||||
|
Payments and other adjustments
|
(398
|
)
|
(3,041
|
)
|
(191
|
)
|
(582
|
)
|
(4,212
|
)
|
||||||||||
|
Charged (credited) to expense
|
(68
|
)
|
911
|
|
(184
|
)
|
582
|
|
1,241
|
|
||||||||||
|
Balance at December 31, 2014
|
$
|
—
|
|
$
|
305
|
|
$
|
—
|
|
$
|
—
|
|
$
|
305
|
|
|||||
|
Payments and other adjustments
|
(3,231
|
)
|
(1,654
|
)
|
(1,474
|
)
|
—
|
|
(6,359
|
)
|
||||||||||
|
Charged (credited) to expense
|
3,298
|
|
1,507
|
|
8,914
|
|
—
|
|
13,719
|
|
||||||||||
|
Balance at December 31, 2015
|
$
|
67
|
|
$
|
158
|
|
$
|
7,440
|
|
$
|
—
|
|
$
|
7,665
|
|
|||||
The Company believes the rationalization actions will positively impact future results of operations and will not have a material effect on liquidity and sources and uses of capital. The Company continues evaluating its cost structure and additional rationalization actions may result in charges in future periods.
F-20
LINCOLN ELECTRIC HOLDINGS, INC.
NOTES TO CONSOLIDATED FINANCIAL STATEMENTS (Continued)
(Dollars in thousands, except share and per share amounts)
The following tables set forth the total changes in AOCI by component, net of taxes, for the years ended
December 31, 2015
and
2014
:
|
Unrealized gain (loss) on derivatives designated and qualifying as cash flow hedges
|
Defined benefit pension plan activity
|
Currency translation adjustment
|
Total
|
|||||||||||||
|
Balance at December 31, 2013
|
$
|
369
|
|
$
|
(160,693
|
)
|
$
|
8,383
|
|
$
|
(151,941
|
)
|
||||
|
Other comprehensive income (loss) before reclassification
|
(720
|
)
|
(48,803
|
)
|
2
|
(99,103
|
)
|
3
|
(148,626
|
)
|
||||||
|
Amounts reclassified from AOCI
|
342
|
|
1
|
11,603
|
|
2
|
—
|
|
11,945
|
|
||||||
|
Net current-period other comprehensive income (loss)
|
(378
|
)
|
(37,200
|
)
|
(99,103
|
)
|
(136,681
|
)
|
||||||||
|
Balance at December 31, 2014
|
$
|
(9
|
)
|
$
|
(197,893
|
)
|
$
|
(90,720
|
)
|
$
|
(288,622
|
)
|
||||
|
Other comprehensive income (loss) before reclassification
|
979
|
|
(1,632
|
)
|
2
|
(106,319
|
)
|
3
|
(106,972
|
)
|
||||||
|
Amounts reclassified from AOCI
|
(422
|
)
|
1
|
99,749
|
|
2
|
—
|
|
99,327
|
|
||||||
|
Net current-period other comprehensive income (loss)
|
557
|
|
98,117
|
|
(106,319
|
)
|
(7,645
|
)
|
||||||||
|
Balance at December 31, 2015
|
$
|
548
|
|
$
|
(99,776
|
)
|
$
|
(197,039
|
)
|
$
|
(296,267
|
)
|
||||
_______________________________________________________________________________
|
1
|
During
2015
, this AOCI reclassification is a component of Net sales of
$(1,191)
(net of tax of
$(547)
) and Cost of goods sold of
$771
(net of tax of
$549
); during
2014
, the reclassification is a component of Net sales of
$(80)
(net of tax of
$(65)
), Cost of goods sold of
$422
(net of tax of
$205
). (See Note 13 - Derivatives for additional details.)
|
|
2
|
This AOCI component is included in the computation of net periodic pension costs (net of tax of
$61,538
and
$(20,951)
during the years ended December 31,
2015
and
2014
, respectively). (See Note 11 - Retirement and Postretirement Benefit Plans for additional details.)
|
|
3
|
The Other comprehensive income before reclassifications excludes
$(623)
and
$734
attributable to Non-controlling interests in the years ended December 31,
2015
and
2014
, respectively. The reclassified AOCI component is included in the computation of Non-controlling interests. (See Consolidated Statements of Equity for additional details.)
|
F-21
LINCOLN ELECTRIC HOLDINGS, INC.
NOTES TO CONSOLIDATED FINANCIAL STATEMENTS (Continued)
(Dollars in thousands, except share and per share amounts)
At December 31,
2015
and
2014
, debt consisted of the following:
|
|
December 31,
|
|||||||
|
|
2015
|
2014
|
||||||
|
Long-term debt
|
|
|
||||||
|
Senior Unsecured Notes due through 2045, interest at 3.2% to 4.0% (net of debt issuance costs of $853 at December 31, 2015)
|
$
|
349,147
|
|
$
|
—
|
|
||
|
Capital leases due through 2019, interest at 0.3% to 8.0%
|
111
|
|
198
|
|
||||
|
Other borrowings due through 2023, interest up to 18.0%
|
2,545
|
|
9,301
|
|
||||
|
351,803
|
|
9,499
|
|
|||||
|
Less current portion
|
1,456
|
|
7,011
|
|
||||
|
Long-term debt, less current portion
|
350,347
|
|
2,488
|
|
||||
|
Short-term debt
|
|
|
||||||
|
Amounts due banks, interest at 24.1% (3.1% in 2014)
|
2,822
|
|
61,155
|
|
||||
|
Current portion long-term debt
|
1,456
|
|
7,011
|
|
||||
|
Total short-term debt
|
4,278
|
|
68,166
|
|
||||
|
Total debt
|
$
|
354,625
|
|
$
|
70,654
|
|
||
At
December 31, 2015
and
2014
, the fair value of long-term debt, including the current portion, was approximately
$342,602
and
$9,323
, respectively, which was determined using available market information and methodologies requiring judgment. Since considerable judgment is required in interpreting market information, the fair value of the debt is not necessarily the amount which could be realized in a current market exchange.
Senior Unsecured Notes
On April 1, 2015, the Company entered into a Note Purchase Agreement pursuant to which it agreed to issue Senior Unsecured Notes (the "Notes") in the aggregate principal amount of
$350,000
through a private placement. At
December 31, 2015
,
$349,147
, net of debt issuance costs of
$853
, was outstanding and recorded in Long-term debt, less current portion. The proceeds are being used for general corporate purposes. The Notes, as shown in the table below, have maturities ranging from
10
to
30
years with a weighted average effective interest rate of
3.5%
, excluding accretion of original issuance costs, and an average tenure of
19
years. Interest is payable semi-annually. The Notes contain certain affirmative and negative covenants. As of
December 31, 2015
, the Company was in compliance with all of its debt covenants.
The maturity and interest rates of the Notes are as follows:
|
Amount
|
Maturity Date
|
Interest Rate
|
||||||
|
Series A
|
$
|
100,000
|
|
August 20, 2025
|
3.15
|
%
|
||
|
Series B
|
100,000
|
|
August 20, 2030
|
3.35
|
%
|
|||
|
Series C
|
50,000
|
|
April 1, 2035
|
3.61
|
%
|
|||
|
Series D
|
100,000
|
|
April 1, 2045
|
4.02
|
%
|
|||
Revolving Credit Agreement
The Company has a line of credit totaling
$400,000
through the Amended and Restated Credit Agreement (the “Credit Agreement”), which was entered into on
September 12, 2014
. The Credit Agreement contains customary affirmative, negative and financial covenants for credit facilities of this type, including limitations on the Company and its subsidiaries with respect to liens, investments, distributions, mergers and acquisitions, dispositions of assets, transactions with affiliates and a fixed charges coverage ratio and total leverage ratio.
As of December 31, 2015, the Company was in compliance with all of its covenants
and had no outstanding borrowings under the Credit Agreement. The Credit Agreement has a
five
-year term and may be increased, subject to certain conditions, by an additional amount up to
$100,000
. The interest rate on borrowings is based on either LIBOR or the prime rate, plus a spread based on the Company’s leverage ratio, at the Company’s election.
F-22
LINCOLN ELECTRIC HOLDINGS, INC.
NOTES TO CONSOLIDATED FINANCIAL STATEMENTS (Continued)
(Dollars in thousands, except share and per share amounts)
Short-term Borrowings
The Company's short-term borrowings included in Amounts due banks were
$2,822
and
$61,155
at
December 31, 2015
and
2014
, respectively. Amounts due banks included the outstanding borrowings under the Credit Agreement and the borrowings of foreign subsidiaries at weighted average interest rates of
24.1%
and
3.1%
at
December 31, 2015
and
2014
, respectively.
Capital Leases
At
December 31, 2015
and
2014
,
$111
and
$198
of capital lease indebtedness was secured by property, plant and equipment, respectively.
Other
Maturities of long-term debt, including payments under capital leases and amounts due banks, for the five years succeeding
December 31, 2015
are
$4,284
in
2016
,
$569
in
2017
,
$105
in
2018
,
$104
in
2019
,
$101
in
2020
and
$350,315
thereafter. Total interest paid was
$5,631
in
2015
,
$2,190
in
2014
and
$2,864
in
2013
. The differences between interest expense and interest paid in 2015 and 2014 is due to an adjustment to the consideration expected to be paid to acquire additional ownership interests of a majority-owned subsidiary and the accretion of the related liability, and the accrual of interest associated with the Notes in 2015.
On April 23, 2015, the shareholders of the Company approved the 2015 Equity and Incentive Compensation Plan ("Employee Plan"), which replaced the 2006 Equity and Performance Incentive Plan, as amended ("EPI Plan"). The Employee Plan provides for the granting of options, appreciation rights, restricted shares, restricted stock units and performance-based awards up to an additional
5,400,000
of the Company's common shares. In addition, on April 23, 2015, the shareholders of the Company approved the 2015 Stock Plan for Non-Employee Directors ("2015 Director Plan"), which replaced the 2006 Stock Plan for Non-Employee Directors ("2006 Director Plan"). The 2015 Director Plan provides for the granting of options, restricted shares and restricted stock units up to an additional
300,000
of the Company's common shares. At
December 31, 2015
, there were
5,600,763
common shares available for future grant under all plans.
Stock Options
The following table summarizes stock option activity for the years ended
December 31, 2015
,
2014
and
2013
, under all Plans:
|
|
Year Ended December 31,
|
||||||||||||||||||||
|
|
2015
|
2014
|
2013
|
||||||||||||||||||
|
|
Options
|
Weighted
Average
Exercise
Price
|
Options
|
Weighted
Average
Exercise
Price
|
Options
|
Weighted
Average
Exercise
Price
|
|||||||||||||||
|
Balance at beginning of year
|
2,087,193
|
|
$
|
37.80
|
|
2,452,648
|
|
$
|
36.52
|
|
3,060,944
|
|
$
|
30.98
|
|
||||||
|
Options granted
|
323,130
|
|
69.14
|
|
5,121
|
|
69.61
|
|
273,105
|
|
70.88
|
|
|||||||||
|
Options exercised
|
(197,582
|
)
|
30.35
|
|
(329,986
|
)
|
27.63
|
|
(774,783
|
)
|
26.20
|
|
|||||||||
|
Options canceled
|
(18,092
|
)
|
66.51
|
|
(40,590
|
)
|
47.21
|
|
(106,618
|
)
|
40.54
|
|
|||||||||
|
Balance at end of year
|
2,194,649
|
|
42.85
|
|
2,087,193
|
|
37.80
|
|
2,452,648
|
|
36.52
|
|
|||||||||
|
Exercisable at end of year
|
1,807,427
|
|
37.15
|
|
1,818,218
|
|
33.89
|
|
1,837,014
|
|
29.93
|
|
|||||||||
Options granted under both the Employee Plan and its predecessor plans may be outstanding for a maximum of
10 years
from the date of grant. The majority of options granted vest ratably over a period of
three years
from the grant date. The exercise prices of all options were equal to the quoted market price of the Company's common shares at the date of grant. The Company issued shares of common stock from treasury upon all exercises of stock options in
2015
,
2014
and
2013
. In 2015,
16,970
options were issued under the Employee Plan,
306,160
options were issued under the EPI Plan and all options issued in 2014 and 2013 were under the EPI Plan.
F-23
LINCOLN ELECTRIC HOLDINGS, INC.
NOTES TO CONSOLIDATED FINANCIAL STATEMENTS (Continued)
(Dollars in thousands, except share and per share amounts)
The Company uses the Black-Scholes option pricing model for estimating fair values of options. In estimating the fair value of options granted, the expected option life is based on the Company's historical experience. The expected volatility is based on historical volatility. The weighted average assumptions for each of the three years ended
December 31, 2015
were as follows:
|
|
Year Ended December 31,
|
|||||||||||
|
|
2015
|
2014
|
2013
|
|||||||||
|
Expected volatility
|
30.73
|
%
|
32.21
|
%
|
32.97
|
%
|
||||||
|
Dividend yield
|
1.48
|
%
|
1.41
|
%
|
1.40
|
%
|
||||||
|
Risk-free interest rate
|
1.32
|
%
|
1.61
|
%
|
1.52
|
%
|
||||||
|
Expected option life (years)
|
4.5
|
|
4.4
|
|
4.4
|
|
||||||
|
Weighted average fair value per option granted during the year
|
$
|
16.35
|
|
$
|
17.52
|
|
$
|
18.14
|
|
|||
The following table summarizes non-vested stock options for the year ended
December 31, 2015
:
|
|
Year Ended December 31, 2015
|
||||||
|
|
Number of
Options
|
Weighted
Average Fair
Value at Grant
Date
|
|||||
|
Balance at beginning of year
|
268,975
|
|
$
|
17.48
|
|
||
|
Granted
|
323,130
|
|
16.35
|
|
|||
|
Vested
|
(189,681
|
)
|
17.26
|
|
|||
|
Forfeited
|
(15,202
|
)
|
17.15
|
|
|||
|
Balance at end of year
|
387,222
|
|
16.66
|
|
|||
The aggregate intrinsic value of options outstanding and exercisable which would have been received by the optionees had all awards been exercised at
December 31, 2015
was
$30,121
and
$30,121
, respectively. The total intrinsic value of awards exercised during
2015
,
2014
and
2013
was
$6,879
,
$14,647
and
$26,288
, respectively. The total fair value of options that vested during
2015
,
2014
and
2013
was
$3,273
,
$5,104
and
$5,131
, respectively.
The following table summarizes information about awards outstanding as of
December 31, 2015
:
|
|
Outstanding
|
Exercisable
|
||||||||||||||||
|
Exercise Price Range
|
Number of
Stock
Options
|
Weighted
Average
Exercise
Price
|
Weighted
Average Remaining Life (years) |
Number of
Stock
Options
|
Weighted
Average
Exercise
Price
|
Weighted
Average
Remaining
Life (years)
|
||||||||||||
|
Under $29.99
|
491,072
|
|
$
|
24.56
|
|
3.5
|
491,072
|
|
$
|
24.56
|
|
3.5
|
||||||
|
$30.00 - $39.99
|
825,161
|
|
33.18
|
|
4.4
|
825,161
|
|
33.18
|
|
4.4
|
||||||||
|
Over $40.00
|
878,416
|
|
62.15
|
|
8.0
|
491,194
|
|
56.40
|
|
7.3
|
||||||||
|
2,194,649
|
|
|
|
5.7
|
1,807,427
|
|
|
|
5.0
|
|||||||||
F-24
LINCOLN ELECTRIC HOLDINGS, INC.
NOTES TO CONSOLIDATED FINANCIAL STATEMENTS (Continued)
(Dollars in thousands, except share and per share amounts)
Restricted Share Awards ("RSAs")
The following table summarizes restricted share award activity for the years ended
December 31, 2015
,
2014
and
2013
, under all Plans:
|
|
Year Ended December 31,
|
||||||||||||||||||||
|
|
2015
|
2014
|
2013
|
||||||||||||||||||
|
|
Shares
|
Weighted
Average
Grant Date
Fair Value
|
Shares
|
Weighted
Average
Grant Date
Fair Value
|
Shares
|
Weighted
Average
Grant Date
Fair Value
|
|||||||||||||||
|
Balance at beginning of year
|
49,490
|
|
$
|
60.14
|
|
115,316
|
|
$
|
39.55
|
|
336,808
|
|
$
|
28.49
|
|
||||||
|
Shares granted
|
20,476
|
|
53.94
|
|
14,927
|
|
66.32
|
|
14,464
|
|
70.88
|
|
|||||||||
|
Shares vested
|
(20,745
|
)
|
49.37
|
|
(80,753
|
)
|
31.88
|
|
(224,021
|
)
|
25.68
|
|
|||||||||
|
Shares forfeited
|
(4,592
|
)
|
64.61
|
|
—
|
|
—
|
|
(11,935
|
)
|
25.76
|
|
|||||||||
|
Balance at end of year
|
44,629
|
|
61.84
|
|
49,490
|
|
60.14
|
|
115,316
|
|
39.55
|
|
|||||||||
RSAs are valued at the quoted market price on the grant date. The majority of RSAs vest over a period of
three
to
five
years. The Company issued common shares from treasury upon the granting of RSAs in
2015
,
2014
and
2013
. Restricted shares issued in
2015
were under the 2015 Director Plan and all restricted shares issued in
2014
and
2013
were under the the 2006 Director Plan. The remaining weighted average vesting period of all non-vested RSAs is
2.1
years as of December 31,
2015
.
Restricted Stock Units ("RSUs")
The following table summarizes restricted stock unit activity for the years ended
December 31, 2015
,
2014
and
2013
, under all Plans:
|
|
Year Ended December 31,
|
||||||||||||||||||||
|
2015
|
2014
|
2013
|
|||||||||||||||||||
|
|
Units
|
Weighted
Average
Grant Date
Fair Value
|
Units
|
Weighted
Average
Grant Date
Fair Value
|
Units
|
Weighted
Average
Grant Date
Fair Value
|
|||||||||||||||
|
Balance at beginning of year
|
241,496
|
|
$
|
49.34
|
|
283,944
|
|
$
|
47.38
|
|
288,669
|
|
$
|
40.83
|
|
||||||
|
Units granted
|
67,800
|
|
68.82
|
|
2,861
|
|
70.71
|
|
69,925
|
|
67.17
|
|
|||||||||
|
Units vested
|
(76,996
|
)
|
37.21
|
|
(40,035
|
)
|
36.59
|
|
(33,698
|
)
|
39.20
|
|
|||||||||
|
Units forfeited
|
(10,768
|
)
|
57.98
|
|
(5,274
|
)
|
52.19
|
|
(40,952
|
)
|
41.70
|
|
|||||||||
|
Balance at end of year
|
221,532
|
|
59.10
|
|
241,496
|
|
49.34
|
|
283,944
|
|
47.38
|
|
|||||||||
RSUs are valued at the quoted market price on the grant date. The majority of RSUs vest over a period of
three
to
five
years. The Company will issue shares of common stock from treasury upon the vesting of RSUs and any earned dividend equivalents. Conversion of
18,022
RSUs to common shares in
2015
were deferred as part of the 2005 Deferred Compensation Plan for Executives (the "2005 Plan"). As of
December 31, 2015
,
66,024
RSUs, including related dividend equivalents, have been deferred under the 2005 Plan. These units are reflected within dilutive shares in the calculation of earnings per share. In 2015,
4,915
RSUs were issued under the Employee Plan,
62,885
RSUs were issued under the EPI plan and all RSUs issued in
2014
and
2013
were under the the EPI Plan. The remaining weighted average vesting period of all non-vested RSUs is
3.2
years as of December 31,
2015
.
Stock-Based Compensation Expense
Expense is recognized for all awards of stock-based compensation by allocating the aggregate grant date fair value over the vesting period. No expense is recognized for any stock options, restricted or deferred shares or restricted stock units ultimately forfeited because recipients fail to meet vesting requirements. Total stock-based compensation expense recognized in the Consolidated Statements of Income for
2015
,
2014
and
2013
was
$7,932
,
$8,416
and
$9,734
, respectively. The related tax benefit for
2015
,
2014
and
2013
was
$3,037
,
$3,222
and
$3,727
, respectively. As of December 31,
2015
, total unrecognized stock-based compensation expense related to non-vested stock options, restricted shares and restricted stock units was
$15,371
, which is expected to be recognized over a weighted average period of approximately
2.9 years
.
F-25
LINCOLN ELECTRIC HOLDINGS, INC.
NOTES TO CONSOLIDATED FINANCIAL STATEMENTS (Continued)
(Dollars in thousands, except share and per share amounts)
Lincoln Stock Purchase Plan
The 1995 Lincoln Stock Purchase Plan provides employees the ability to purchase open market shares on a commission-free basis up to a limit of
ten thousand
dollars annually. Under this plan,
800,000
shares have been authorized to be purchased. Shares purchased were
16,012
in
2015
,
5,511
in
2014
and
4,653
in
2013
.
The Company has a share repurchase program for up to
45 million
of the Company's common shares. At management's discretion, the Company repurchases its common shares from time to time in the open market, depending on market conditions, stock price and other factors. During the year ended December 31,
2015
, the Company purchased a total of
6.6 million
shares at an average cost per share of
$60.70
. As of December 31,
2015
,
4.7 million
shares remained available for repurchase under the stock repurchase program. The treasury shares have not been retired.
The Company maintains a number of defined benefit and defined contribution plans to provide retirement benefits for employees. These plans are maintained and contributions are made in accordance with the Employee Retirement Income Security Act of 1974 ("ERISA"), local statutory law or as determined by the Board of Directors. The plans generally provide benefits based upon years of service and compensation. Pension plans are funded except for a domestic non-qualified pension plan for certain key employees and certain foreign plans. The Company uses a December 31 measurement date for its plans.
The Company does not have, and does not provide for, any postretirement or postemployment benefits other than pensions and certain non-U.S. statutory termination benefits.
F-26
LINCOLN ELECTRIC HOLDINGS, INC.
NOTES TO CONSOLIDATED FINANCIAL STATEMENTS (Continued)
(Dollars in thousands, except share and per share amounts)
Defined Benefit Plans
Contributions are made in amounts sufficient to fund current service costs on a current basis and to fund past service costs, if any, over various amortization periods.
Obligations and Funded Status
|
|
December 31,
|
|||||||
|
|
2015
|
2014
|
||||||
|
Change in benefit obligations
|
|
|
||||||
|
Benefit obligations at beginning of year
|
$
|
1,045,471
|
|
$
|
941,442
|
|
||
|
Service cost
|
19,933
|
|
19,062
|
|
||||
|
Interest cost
|
36,002
|
|
42,485
|
|
||||
|
Plan participants' contributions
|
185
|
|
215
|
|
||||
|
Plan amendments
|
—
|
|
45
|
|
||||
|
Acquisitions
|
6,170
|
|
—
|
|
||||
|
Actuarial (gain) loss
|
(42,640
|
)
|
117,881
|
|
||||
|
Benefits paid
|
(32,217
|
)
|
(60,582
|
)
|
||||
|
Settlements/curtailments
|
(463,943
|
)
|
(7,172
|
)
|
||||
|
Currency translation
|
(10,792
|
)
|
(7,905
|
)
|
||||
|
Benefit obligations at end of year
|
558,169
|
|
1,045,471
|
|
||||
|
Change in plan assets
|
|
|
||||||
|
Fair value of plan assets at beginning of year
|
1,010,937
|
|
939,995
|
|
||||
|
Actual return on plan assets
|
9,298
|
|
108,060
|
|
||||
|
Employer contributions
|
50,468
|
|
27,550
|
|
||||
|
Plan participants' contributions
|
185
|
|
215
|
|
||||
|
Acquisitions
|
5,995
|
|
—
|
|
||||
|
Benefits paid
|
(30,358
|
)
|
(59,196
|
)
|
||||
|
Settlement
|
(462,601
|
)
|
—
|
|
||||
|
Currency translation
|
(7,823
|
)
|
(5,687
|
)
|
||||
|
Fair value of plan assets at end of year
|
576,101
|
|
1,010,937
|
|
||||
|
Funded status at end of year
|
17,932
|
|
(34,534
|
)
|
||||
|
Unrecognized actuarial net loss
|
156,019
|
|
316,296
|
|
||||
|
Unrecognized prior service cost
|
(1,304
|
)
|
(1,930
|
)
|
||||
|
Unrecognized transition assets, net
|
41
|
|
45
|
|
||||
|
Net amount recognized
|
$
|
172,688
|
|
$
|
279,877
|
|
||
The actuarial gain arising during 2015 was primarily attributable to a higher discount rate. The actuarial loss during 2014 was primarily attributable to a lower discount rate.
In August 2015, the Lincoln Electric Company, plan sponsor of the Lincoln Electric Retirement Annuity Program ("RAP") and subsidiary of the Company, entered into an agreement to purchase a group annuity contract from The Principal Financial Group ("Principal"). Under the agreement, Principal assumed the obligation to pay future pension benefits for specified U.S. retirees and surviving beneficiaries who retired on or before June 1, 2015 and are currently receiving payments from the RAP. The transaction will not change the amount of the monthly pension benefit received by affected retirees and surviving beneficiaries. The purchase was funded by existing plan assets and required no additional cash contribution. The Company recorded pension settlement charges of
$142,738
for the year ended December 31, 2015, primarily related to the purchase of the group annuity contract.
F-27
LINCOLN ELECTRIC HOLDINGS, INC.
NOTES TO CONSOLIDATED FINANCIAL STATEMENTS (Continued)
(Dollars in thousands, except share and per share amounts)
The after-tax amounts of unrecognized actuarial net loss, prior service costs and transition assets included in Accumulated other comprehensive loss at
December 31, 2015
were
$101,288
,
$(1,548)
and
$36
, respectively. The actuarial loss represents changes in the estimated obligation not yet recognized in the Consolidated Income Statement. The pre-tax amounts of unrecognized actuarial net loss, prior service credits and transition obligations expected to be recognized as components of net periodic benefit cost during
2016
are
$10,367
,
$(398)
and
$3
, respectively.
Amounts Recognized in Consolidated Balance Sheets
|
|
December 31,
|
|||||||
|
|
2015
|
2014
|
||||||
|
Prepaid pensions
|
$
|
38,201
|
|
$
|
1,240
|
|
||
|
Accrued pension liability, current
|
(5,026
|
)
|
(2,971
|
)
|
||||
|
Accrued pension liability, long-term
|
(15,243
|
)
|
(32,803
|
)
|
||||
|
Accumulated other comprehensive loss, excluding tax effects
|
154,756
|
|
314,411
|
|
||||
|
Net amount recognized in the balance sheets
|
$
|
172,688
|
|
$
|
279,877
|
|
||
Components of Pension Cost for Defined Benefit Plans
|
|
Year Ended December 31,
|
|||||||||||
|
|
2015
|
2014
|
2013
|
|||||||||
|
Service cost
|
$
|
19,933
|
|
$
|
19,062
|
|
$
|
23,188
|
|
|||
|
Interest cost
|
36,002
|
|
42,485
|
|
37,225
|
|
||||||
|
Expected return on plan assets
|
(54,638
|
)
|
(67,953
|
)
|
(61,244
|
)
|
||||||
|
Amortization of prior service cost
|
(626
|
)
|
(616
|
)
|
(613
|
)
|
||||||
|
Amortization of net loss
|
19,406
|
|
17,644
|
|
30,929
|
|
||||||
|
Settlement/curtailment loss
|
142,738
|
|
1,773
|
|
423
|
|
||||||
|
Pension cost for defined benefit plans
|
$
|
162,815
|
|
$
|
12,395
|
|
$
|
29,908
|
|
|||
The Company's defined benefit plans costs increased in
2015
primarily as a result of pension settlement charges related to the purchase of the group annuity contract.
Pension Plans with Accumulated Benefit Obligations in Excess of Plan Assets
|
|
December 31,
|
|||||||
|
|
2015
|
2014
|
||||||
|
U.S. pension plans
|
|
|
||||||
|
Projected benefit obligation
|
$
|
16,822
|
|
$
|
34,066
|
|
||
|
Accumulated benefit obligation
|
15,223
|
|
30,202
|
|
||||
|
Fair value of plan assets
|
—
|
|
11,638
|
|
||||
|
Non-U.S. pension plans
|
|
|
||||||
|
Projected benefit obligation
|
$
|
3,393
|
|
$
|
5,573
|
|
||
|
Accumulated benefit obligation
|
2,831
|
|
3,372
|
|
||||
The total accumulated benefit obligation for all plans was
$523,728
as of
December 31, 2015
and
$1,003,296
as of
December 31, 2014
.
Contributions to Plans
The Company expects to contribute
$20,000
to the defined benefit plans in the United States in
2016
. The actual amounts to be contributed in
2016
will be determined at the Company's discretion.
F-28
LINCOLN ELECTRIC HOLDINGS, INC.
NOTES TO CONSOLIDATED FINANCIAL STATEMENTS (Continued)
(Dollars in thousands, except share and per share amounts)
Benefit Payments for Plans
Benefits expected to be paid for the U.S. plans are as follows:
|
Estimated Payments
|
|
||
|
2016
|
$
|
31,461
|
|
|
2017
|
31,195
|
|
|
|
2018
|
25,629
|
|
|
|
2019
|
30,671
|
|
|
|
2020
|
27,385
|
|
|
|
2021 through 2025
|
164,307
|
|
|
Assumptions
Weighted average assumptions used to measure the benefit obligation for the Company's significant defined benefit plans as of
December 31, 2015
and
2014
were as follows:
|
|
December 31,
|
|||||
|
|
2015
|
2014
|
||||
|
Discount Rate
|
4.5
|
%
|
4.1
|
%
|
||
|
Rate of increase in compensation
|
2.7
|
%
|
2.8
|
%
|
||
Weighted average assumptions used to measure the net periodic benefit cost for the Company's significant defined benefit plans for each of the three years ended
December 31, 2015
were as follows:
|
|
December 31,
|
||||||||
|
|
2015
|
2014
|
2013
|
||||||
|
Discount rate
|
4.0
|
%
|
4.7
|
%
|
3.8
|
%
|
|||
|
Rate of increase in compensation
|
2.7
|
%
|
4.1
|
%
|
4.1
|
%
|
|||
|
Expected return on plan assets
|
6.3
|
%
|
7.3
|
%
|
7.4
|
%
|
|||
To develop the discount rate assumption to be used for U.S. plans, the Company refers to the yield derived from matching projected pension payments with maturities of bonds rated AA or an equivalent quality. The expected long-term rate of return assumption is based on the weighted average expected return of the various asset classes in the plans' portfolio and the targeted allocation of plan assets. The asset class return is developed using historical asset return performance as well as current market conditions such as inflation, interest rates and equity market performance. The rate of compensation increase is determined by the Company based upon annual reviews.
Pension Plans' Assets
The primary objective of the pension plans' investment policy is to ensure sufficient assets are available to provide benefit obligations when such obligations mature. Investment management practices must comply with ERISA or any other applicable regulations and rulings. The overall investment strategy for the defined benefit pension plans' assets is to achieve a rate of return over a normal business cycle relative to an acceptable level of risk that is consistent with the long-term objectives of the portfolio. The target allocation for plan assets is
45%
to
55%
equity securities and
45%
to
55%
debt securities.
F-29
LINCOLN ELECTRIC HOLDINGS, INC.
NOTES TO CONSOLIDATED FINANCIAL STATEMENTS (Continued)
(Dollars in thousands, except share and per share amounts)
The following table sets forth, by level within the fair value hierarchy, the pension plans' assets as of
December 31, 2015
:
|
|
Pension Plans' Assets at Fair Value as of December 31, 2015
|
|||||||||||||||
|
|
Quoted Prices
in Active Markets
for Identical
Assets
(Level 1)
|
Significant Other
Observable Inputs
(Level 2)
|
Significant
Unobservable
Inputs
(Level 3)
|
Total
|
||||||||||||
|
Cash and cash equivalents
|
$
|
5,740
|
|
$
|
—
|
|
$
|
—
|
|
$
|
5,740
|
|
||||
|
Equity securities
(1)
|
3,569
|
|
—
|
|
—
|
|
3,569
|
|
||||||||
|
Fixed income securities
(2)
|
||||||||||||||||
|
U.S. government bonds
|
11,603
|
|
—
|
|
—
|
|
11,603
|
|
||||||||
|
Corporate debt and other obligations
|
—
|
|
120,470
|
|
—
|
|
120,470
|
|
||||||||
|
Common trusts and 103-12 investments
(3)
|
||||||||||||||||
|
Cash and cash equivalents
|
—
|
|
5,841
|
|
—
|
|
5,841
|
|
||||||||
|
Common trusts and 103-12 investments
|
—
|
|
388,477
|
|
—
|
|
388,477
|
|
||||||||
|
Private equity funds
(4)
|
—
|
|
—
|
|
40,401
|
|
40,401
|
|
||||||||
|
Total assets at fair value
|
$
|
20,912
|
|
$
|
514,788
|
|
$
|
40,401
|
|
$
|
576,101
|
|
||||
The following table sets forth, by level within the fair value hierarchy, the pension plans' assets as of
December 31, 2014
:
|
|
Pension Plans' Assets at Fair Value as of December 31, 2014
|
|||||||||||||||
|
|
Quoted Prices
in Active Markets
for Identical
Assets
(Level 1)
|
Significant Other
Observable Inputs
(Level 2)
|
Significant
Unobservable
Inputs
(Level 3)
|
Total
|
||||||||||||
|
Cash and cash equivalents
|
$
|
4,873
|
|
$
|
—
|
|
$
|
—
|
|
$
|
4,873
|
|
||||
|
Fixed income securities
(2)
|
|
|||||||||||||||
|
U.S. government bonds
|
27,305
|
|
—
|
|
—
|
|
27,305
|
|
||||||||
|
Corporate debt and other obligations
|
—
|
|
212,326
|
|
—
|
|
212,326
|
|
||||||||
|
Common trusts and 103-12 investments
(3)
|
||||||||||||||||
|
Cash and cash equivalents
|
—
|
|
7,499
|
|
—
|
|
7,499
|
|
||||||||
|
Common trusts and 103-12 investments
|
—
|
|
720,919
|
|
—
|
|
720,919
|
|
||||||||
|
Private equity funds
(4)
|
—
|
|
—
|
|
38,015
|
|
38,015
|
|
||||||||
|
Total assets at fair value
|
$
|
32,178
|
|
$
|
940,744
|
|
$
|
38,015
|
|
$
|
1,010,937
|
|
||||
_______________________________________________________________________________
|
(1)
|
Equity securities are primarily comprised of corporate stock and mutual funds directly held by the plans. Equity securities are valued using the closing price reported on the active market on which the individual securities are traded.
|
|
(2)
|
Fixed income securities are primarily comprised of governmental and corporate bonds directly held by the plans. Governmental and corporate bonds are valued using both market observable inputs for similar assets that are traded on an active market and the closing price on the active market on which the individual securities are traded.
|
|
(3)
|
Common trusts and 103-12 investments (collectively "Trusts") are comprised of a number of investment funds that invest in a diverse portfolio of assets including equity securities, corporate and governmental bonds, equity and credit indexes, and money markets. Trusts are valued at the net asset value ("NAV") as determined by their custodian. NAV represents the accumulation of the unadjusted quoted close prices on the reporting date for the underlying investments divided by the total shares outstanding at the reporting dates.
|
|
(4)
|
Private equity funds consist of four funds seeking capital appreciation by investing in private equity investment partnerships and venture capital companies. Funds are comprised of unrestricted and restricted publicly traded securities and privately held securities. Unrestricted securities are valued at the closing market price on the reporting date. Restricted securities may be valued at a discount from such closing public market price, depending on facts and circumstances. Privately held securities are valued at fair value as determined by the fund directors and general partners.
|
F-30
LINCOLN ELECTRIC HOLDINGS, INC.
NOTES TO CONSOLIDATED FINANCIAL STATEMENTS (Continued)
(Dollars in thousands, except share and per share amounts)
The table below sets forth a summary of changes in the fair value of the Level 3 pension plans' assets for the year ended
December 31, 2015
:
|
Private
Equity
Funds
|
||||
|
Balance at the beginning of year
|
$
|
38,015
|
|
|
|
Purchases, sales, issuances and settlements
|
(2,253
|
)
|
||
|
Realized and unrealized gains
|
4,639
|
|
||
|
Balance at the end of year
|
$
|
40,401
|
|
|
|
The amount of total gains during the period attributable to the change in unrealized gains relating to Level 3 net assets still held at the reporting date
|
$
|
1,111
|
|
|
Supplemental Executive Retirement Plan
The Company maintains a domestic unfunded supplemental executive retirement plan ("SERP") under which non-qualified supplemental pension benefits are paid to certain employees in addition to amounts received under the Company's qualified retirement plan which is subject to Internal Revenue Service ("IRS") limitations on covered compensation. The annual cost of this program has been included in the determination of total net pension costs shown above and was
$1,703
,
$3,012
and
$2,329
in
2015
,
2014
and
2013
, respectively. The projected benefit obligation associated with this plan is also included in the pension disclosure shown above and was
$14,643
,
$17,953
and
$22,877
at December 31,
2015
,
2014
and
2013
, respectively.
Defined Contribution Plans
Substantially all U.S. employees are covered under defined contribution plans. The Lincoln Electric Employee Savings Plan, a 401(k) savings plan which represents a majority of defined contribution plan expense, allows employees to invest
1%
or more of eligible compensation, limited to maximum amounts as determined by the IRS. For most participants the plan provides for Company matching contributions of
35%
of the first
6%
of employee compensation contributed to the plan. During the third quarter 2015, the Company suspended the 401(k) match provision as part of the Company's actions to reduce costs in light of existing market conditions.
The plan also includes a feature in which all participants hired after November 1, 1997 receive an annual Company contribution of
2%
of their base pay. The plan allowed employees hired before November 1, 1997, at their election, to receive this contribution in exchange for forfeiting certain benefits under the pension plan. In 2006, the plan was amended to include a feature in which all participants receive an annual Company contribution ranging from
4%
to
10%
of base pay based on years of service.
The annual costs recognized for defined contribution plans were
$10,082
,
$11,088
and
$10,812
in
2015
,
2014
and
2013
, respectively.
Multi-Employer Plans
The Company participates in multi-employer plans for several of its operations in Europe. Costs for these plans are recognized as contributions are funded. The Company's risk of participating in these plans is limited to the annual premium as determined by the plan. The annual costs of these programs were
$830
,
$1,068
and
$1,048
in
2015
,
2014
and
2013
, respectively.
Other Benefits
The Cleveland, Ohio, area operations have a Guaranteed Continuous Employment Plan covering substantially all employees which, in general, provides that the Company will provide work for at least
75%
of every standard work week (presently
40
hours). This plan does not guarantee employment when the Company's ability to continue normal operations is seriously restricted by events beyond the control of the Company. The Company has reserved the right to terminate this plan effective at the end of a calendar year by giving notice of such termination not less than
six
months prior to the end of such year.
F-31
LINCOLN ELECTRIC HOLDINGS, INC.
NOTES TO CONSOLIDATED FINANCIAL STATEMENTS (Continued)
(Dollars in thousands, except share and per share amounts)
The components of income before income taxes for the three years ended
December 31, 2015
were as follows:
|
|
Year Ended December 31,
|
|||||||||||
|
|
2015
|
2014
|
2013
|
|||||||||
|
U.S.
|
$
|
118,037
|
|
$
|
303,933
|
|
$
|
281,724
|
|
|||
|
Non-U.S.
|
51,750
|
|
71,880
|
|
134,717
|
|
||||||
|
Total
|
$
|
169,787
|
|
$
|
375,813
|
|
$
|
416,441
|
|
|||
The components of income tax expense (benefit) for the three years ended
December 31, 2015
were as follows:
|
|
Year Ended December 31,
|
|||||||||||
|
|
2015
|
2014
|
2013
|
|||||||||
|
Current:
|
|
|
|
|||||||||
|
Federal
|
$
|
60,500
|
|
$
|
71,601
|
|
$
|
58,099
|
|
|||
|
Non-U.S.
|
28,046
|
|
24,210
|
|
40,348
|
|
||||||
|
State and local
|
9,557
|
|
8,235
|
|
8,490
|
|
||||||
|
98,103
|
|
104,046
|
|
106,937
|
|
|||||||
|
Deferred:
|
|
|
|
|||||||||
|
Federal
|
(47,902
|
)
|
15,175
|
|
21,946
|
|
||||||
|
Non-U.S.
|
(3,362
|
)
|
1,370
|
|
(5,734
|
)
|
||||||
|
State and local
|
(4,464
|
)
|
1,342
|
|
1,605
|
|
||||||
|
(55,728
|
)
|
17,887
|
|
17,817
|
|
|||||||
|
Total
|
$
|
42,375
|
|
$
|
121,933
|
|
$
|
124,754
|
|
|||
The differences between total income tax expense and the amount computed by applying the statutory federal income tax rate to income before income taxes for the three years ended
December 31, 2015
were as follows:
|
|
Year Ended December 31,
|
|||||||||||
|
|
2015
|
2014
|
2013
|
|||||||||
|
Statutory rate of 35% applied to pre-tax income
|
$
|
59,426
|
|
$
|
131,534
|
|
$
|
145,754
|
|
|||
|
Effect of state and local income taxes, net of federal tax benefit
|
1,868
|
|
6,694
|
|
7,124
|
|
||||||
|
Asset impairments
|
2,184
|
|
11,674
|
|
1,735
|
|
||||||
|
Taxes less than the U.S. tax rate on non-U.S. earnings, including utilization of tax loss carry-forwards, losses with no benefit and changes in non-U.S. valuation allowance
|
(8,499
|
)
|
(16,950
|
)
|
(20,214
|
)
|
||||||
|
Venezuela devaluation
|
11,396
|
|
5,603
|
|
1,126
|
|
||||||
|
Manufacturing deduction
|
(9,207
|
)
|
(7,316
|
)
|
(6,386
|
)
|
||||||
|
U.S. tax cost (benefit) of foreign source income
|
(8,754
|
)
|
(514
|
)
|
745
|
|
||||||
|
Other
|
(6,039
|
)
|
(8,792
|
)
|
(5,130
|
)
|
||||||
|
Total
|
$
|
42,375
|
|
$
|
121,933
|
|
$
|
124,754
|
|
|||
|
Effective tax rate
|
24.96
|
%
|
32.45
|
%
|
29.96
|
%
|
||||||
The
2015
effective tax rate is impacted by impairment charges, the geographic mix of earnings and taxes at lower rates in foreign jurisdictions, including Canada, Mexico, Poland and the United Kingdom, as well as loss utilization in other foreign jurisdictions. Total income tax payments, net of refunds, were
$101,939
in
2015
,
$119,102
in
2014
and
$84,567
in
2013
.
F-32
LINCOLN ELECTRIC HOLDINGS, INC.
NOTES TO CONSOLIDATED FINANCIAL STATEMENTS (Continued)
(Dollars in thousands, except share and per share amounts)
Deferred Taxes
Significant components of deferred tax assets and liabilities at
December 31, 2015
and
2014
, were as follows:
|
|
December 31,
|
|||||||
|
|
2015
|
2014
|
||||||
|
Deferred tax assets:
|
|
|
||||||
|
Tax loss and credit carry-forwards
|
$
|
44,925
|
|
$
|
46,112
|
|
||
|
Inventory
|
1,607
|
|
1,931
|
|
||||
|
Other accruals
|
17,874
|
|
15,427
|
|
||||
|
Employee benefits
|
21,859
|
|
20,750
|
|
||||
|
Pension obligations
|
2,477
|
|
4,969
|
|
||||
|
Other
|
3,795
|
|
5,608
|
|
||||
|
Deferred tax assets, gross
|
92,537
|
|
94,797
|
|
||||
|
Valuation allowance
|
(51,294
|
)
|
(48,840
|
)
|
||||
|
Deferred tax assets, net
|
41,243
|
|
45,957
|
|
||||
|
Deferred tax liabilities:
|
|
|
||||||
|
Property, plant and equipment
|
33,627
|
|
37,352
|
|
||||
|
Intangible assets
|
16,105
|
|
18,642
|
|
||||
|
Inventory
|
10,770
|
|
9,623
|
|
||||
|
Pension obligations
|
9,897
|
|
1,731
|
|
||||
|
Other
|
8,800
|
|
10,018
|
|
||||
|
Deferred tax liabilities
|
79,199
|
|
77,366
|
|
||||
|
Total deferred taxes
|
$
|
(37,956
|
)
|
$
|
(31,409
|
)
|
||
At
December 31, 2015
, certain subsidiaries had tax loss carry-forwards of approximately
$78,237
that will expire in various years from
2016
through
2032
, plus
$82,049
for which there is no expiration date.
In assessing the realizability of deferred tax assets, the Company assesses whether it is more likely than not that a portion or all of the deferred tax assets will not be realized. The Company considers the scheduled reversal of deferred tax liabilities, tax planning strategies and projected future taxable income in making this assessment. At
December 31, 2015
, a valuation allowance of
$51,294
was recorded against certain deferred tax assets based on this assessment. The Company believes it is more likely than not that the tax benefit of the remaining net deferred tax assets will be realized. The amount of net deferred tax assets considered realizable could be increased or reduced in the future if the Company's assessment of future taxable income or tax planning strategies changes.
The Company does not provide deferred income taxes on unremitted earnings of certain non-U.S. subsidiaries which are deemed permanently reinvested. It is not practicable to calculate the deferred taxes associated with the remittance of these earnings. Deferred income taxes associated with earnings that are not expected to be permanently reinvested were not significant.
Unrecognized Tax Benefits
Liabilities for unrecognized tax benefits are classified as Accrued taxes non-current unless expected to be paid in one year. The Company recognizes interest and penalties related to unrecognized tax benefits in Income taxes. Current income tax expense included income of
$940
for the year ended
December 31, 2015
and
$1,406
for the year ended
December 31, 2014
for interest and penalties. For those same years, the Company's accrual for interest and penalties related to unrecognized tax benefits totaled
$6,080
and
$8,019
, respectively.
F-33
LINCOLN ELECTRIC HOLDINGS, INC.
NOTES TO CONSOLIDATED FINANCIAL STATEMENTS (Continued)
(Dollars in thousands, except share and per share amounts)
The following table summarizes the activity related to unrecognized tax benefits:
|
2015
|
2014
|
|||||||
|
Balance at beginning of year
|
$
|
18,389
|
|
$
|
25,907
|
|
||
|
Increase related to current year tax provisions
|
1,021
|
|
700
|
|
||||
|
Increase (decrease) related to prior years' tax positions
|
317
|
|
(848
|
)
|
||||
|
Decrease related to settlements with taxing authorities
|
(157
|
)
|
(1,216
|
)
|
||||
|
Resolution of and other decreases in prior years' tax liabilities
|
(3,323
|
)
|
(3,727
|
)
|
||||
|
Other
|
(1,915
|
)
|
(2,427
|
)
|
||||
|
Balance at end of year
|
$
|
14,332
|
|
$
|
18,389
|
|
||
The total amount of unrecognized tax benefits that, if recognized, would affect the effective tax rate was
$8,369
at
December 31, 2015
and
$9,132
at
December 31, 2014
.
The Company files income tax returns in the U.S. and various state, local and foreign jurisdictions. With few exceptions, the Company is no longer subject to U.S. federal, state and local or non-U.S. income tax examinations by tax authorities for years before 2011. The Company is currently subject to various U.S. state audits and non-U.S. income tax audits. The Company is generally not able to precisely estimate the ultimate settlement amounts or timing until after the close of an audit. The Company evaluates its tax positions and establishes liabilities for uncertain tax positions that may be challenged by local authorities and may not be fully sustained.
Unrecognized tax benefits are reviewed on an ongoing basis and are adjusted for changing facts and circumstances, including progress of tax audits and closing of statutes of limitations. Based on information currently available, management believes that additional audit activity could be completed and/or statutes of limitations may close relating to existing unrecognized tax benefits. It is reasonably possible there could be a further reduction of
$2,312
in prior years' unrecognized tax benefits in
2016
.
In July 2012, the Company received a Notice of Reassessment (the "Reassessments") from the Canada Revenue Agency in respect to its 2004 to 2010 taxation years to disallow the deductibility of inter-company dividends. The Company appealed the Reassessments to the Tax Court of Canada. As part of the appeals process to the Tax Court of Canada, the Company had elected to deposit the entire amount of the dispute in order to suspend continuing interest charges.
In September 2014, the Department of Justice Canada consented to a judgment, wholly in the Company's favor. In vacating the reassessment, this tax litigation is concluded. In December 2014 the Company received a partial refund of the cash deposit. In the first quarter of 2015, the Company received a refund of
$24,976
which was substantially all of the remaining cash deposit. The Company also received interest on the deposit of
$1,596
.
The Company uses derivative investments to manage exposures to currency exchange rates, interest rates and commodity prices arising in the normal course of business. Both at inception and on an ongoing basis, the derivative instruments that qualify for hedge accounting are assessed as to their effectiveness, when applicable.
Hedge ineffectiveness was immaterial for the three years ended December 31, 2015.
The Company is subject to the credit risk of the counterparties to derivative instruments. Counterparties include a number of major banks and financial institutions. None of the concentrations of risk with any individual counterparty was considered significant at December 31,
2015
. The Company does not expect any counterparties to fail to meet their obligations.
Cash flow hedges
Certain foreign currency forward contracts are qualified and designated as cash flow hedges. The dollar equivalent gross notional amount of these short-term contracts was
$30,388
at December 31,
2015
and
$27,265
at December 31,
2014
.
Net investment hedges
The Company had foreign currency forward contracts that were qualified and designated as net investment hedges. The dollar equivalent gross notional amount of these short-term contracts was
$60,734
at December 31,
2014
.
F-34
LINCOLN ELECTRIC HOLDINGS, INC.
NOTES TO CONSOLIDATED FINANCIAL STATEMENTS (Continued)
(Dollars in thousands, except share and per share amounts)
Derivatives not designated as hedging instruments
The Company has certain foreign exchange forward contracts which are not designated as hedges. These derivatives are held as economic hedges of certain balance sheet exposures. The dollar equivalent gross notional amount of these contracts was
$267,626
at December 31,
2015
and
$280,949
at December 31,
2014
.
The Company had short-term silver forward contracts with notional amounts of
$2,804
at December 31,
2015
. At
December 31, 2014
, the Company had short-term silver and copper forward contracts with notional amounts of
$4,467
and
$1,066
, respectively.
Fair values of derivative instruments in the Company's Consolidated Balance Sheets follow:
|
|
December 31, 2015
|
December 31, 2014
|
||||||||||||||
|
Derivatives by hedge designation
|
Other
Current
Assets
|
Other
Current
Liabilities
|
Other
Current
Assets
|
Other
Current
Liabilities
|
||||||||||||
|
Designated as hedging instruments:
|
|
|
|
|
||||||||||||
|
Foreign exchange contracts
|
$
|
178
|
|
$
|
731
|
|
$
|
468
|
|
$
|
935
|
|
||||
|
Net investment contracts
|
—
|
|
—
|
|
1,091
|
|
469
|
|
||||||||
|
Not designated as hedging instruments:
|
||||||||||||||||
|
Foreign exchange contracts
|
625
|
|
2,303
|
|
482
|
|
3,638
|
|
||||||||
|
Commodity contracts
|
40
|
|
8
|
|
47
|
|
69
|
|
||||||||
|
Total derivatives
|
$
|
843
|
|
$
|
3,042
|
|
$
|
2,088
|
|
$
|
5,111
|
|
||||
The effects of undesignated derivative instruments on the Company's Consolidated Statements of Income for the years ended December 31,
2015
and
2014
consisted of the following:
|
|
|
Year Ended December 31,
|
||||||||
|
Derivatives by hedge designation
|
Classification of gains (losses)
|
2015
|
2014
|
|||||||
|
Not designated as hedges:
|
|
|
|
|||||||
|
Foreign exchange contracts
|
Selling, general & administrative expenses
|
$
|
18,875
|
|
$
|
(10,427
|
)
|
|||
|
Commodity contracts
|
Cost of goods sold
|
440
|
|
702
|
|
|||||
The effects of designated cash flow hedges on AOCI and the Company's Consolidated Statements of Income for the years ended December 31,
2015
and
2014
consisted of the following:
|
|
December 31,
|
|||||||
|
Total gain (loss) recognized in AOCI, net of tax
|
2015
|
2014
|
||||||
|
Foreign exchange contracts
|
$
|
(551
|
)
|
$
|
(9
|
)
|
||
|
Net investment contracts
|
$
|
1,099
|
|
$
|
—
|
|
||
The Company expects a loss of
$551
related to existing contracts to be reclassified from AOCI, net of tax, to earnings over the next
12 months
as the hedged transactions are realized.
|
|
|
Year Ended December 31,
|
||||||||
|
Derivative type
|
Gain (loss) reclassified from AOCI to:
|
2015
|
2014
|
|||||||
|
Foreign exchange contracts
|
Sales
|
$
|
(1,191
|
)
|
$
|
(80
|
)
|
|||
|
Cost of goods sold
|
771
|
|
422
|
|
||||||
F-35
LINCOLN ELECTRIC HOLDINGS, INC.
NOTES TO CONSOLIDATED FINANCIAL STATEMENTS (Continued)
(Dollars in thousands, except share and per share amounts)
The following table provides a summary of fair value assets and liabilities as of
December 31, 2015
measured at fair value on a recurring basis:
|
Description
|
Balance as of December 31, 2015
|
Quoted Prices in
Active Markets for
Identical Assets or
Liabilities
(Level 1)
|
Significant Other
Observable Inputs
(Level 2)
|
Significant
Unobservable
Inputs (Level 3)
|
||||||||||||
|
Assets:
|
|
|
|
|
||||||||||||
|
Foreign exchange contracts
|
$
|
803
|
|
$
|
—
|
|
$
|
803
|
|
$
|
—
|
|
||||
|
Commodity contracts
|
40
|
|
—
|
|
40
|
|
—
|
|
||||||||
|
Total assets
|
$
|
843
|
|
$
|
—
|
|
$
|
843
|
|
$
|
—
|
|
||||
|
Liabilities:
|
|
|
|
|
||||||||||||
|
Foreign exchange contracts
|
$
|
3,034
|
|
$
|
—
|
|
$
|
3,034
|
|
$
|
—
|
|
||||
|
Commodity contracts
|
8
|
|
—
|
|
8
|
|
—
|
|
||||||||
|
Contingent consideration
|
9,184
|
|
—
|
|
—
|
|
9,184
|
|
||||||||
|
Forward contract
|
26,484
|
|
—
|
|
—
|
|
26,484
|
|
||||||||
|
Deferred compensation
|
23,201
|
|
—
|
|
23,201
|
|
—
|
|
||||||||
|
Total liabilities
|
$
|
61,911
|
|
$
|
—
|
|
$
|
26,243
|
|
$
|
35,668
|
|
||||
The following table provides a summary of fair value assets and liabilities as of
December 31, 2014
measured at fair value on a recurring basis:
|
Description
|
Balance as of December 31, 2014
|
Quoted Prices in
Active Markets for
Identical Assets or
Liabilities
(Level 1)
|
Significant Other
Observable Inputs
(Level 2)
|
Significant
Unobservable
Inputs (Level 3)
|
||||||||||||
|
Assets:
|
|
|
|
|
||||||||||||
|
Foreign exchange contracts
|
$
|
950
|
|
$
|
—
|
|
$
|
950
|
|
$
|
—
|
|
||||
|
Commodity contracts
|
47
|
|
—
|
|
47
|
|
—
|
|
||||||||
|
Net investment contracts
|
1,091
|
|
—
|
|
$
|
1,091
|
|
—
|
|
|||||||
|
Total assets
|
$
|
2,088
|
|
$
|
—
|
|
$
|
2,088
|
|
$
|
—
|
|
||||
|
Liabilities:
|
|
|
|
|
|
|
|
|
||||||||
|
Foreign exchange contracts
|
$
|
4,573
|
|
$
|
—
|
|
$
|
4,573
|
|
$
|
—
|
|
||||
|
Commodity contracts
|
69
|
|
—
|
|
69
|
|
—
|
|
||||||||
|
Net investment contracts
|
469
|
|
—
|
|
469
|
|
—
|
|
||||||||
|
Contingent consideration
|
6,912
|
|
—
|
|
—
|
|
6,912
|
|
||||||||
|
Forward contract
|
25,268
|
|
—
|
|
—
|
|
25,268
|
|
||||||||
|
Deferred compensation
|
21,839
|
|
—
|
|
21,839
|
|
—
|
|
||||||||
|
Total liabilities
|
$
|
59,130
|
|
$
|
—
|
|
$
|
26,950
|
|
$
|
32,180
|
|
||||
The Company's derivative contracts are valued at fair value using the market approach. The Company measures the fair value of foreign exchange contracts using Level 2 inputs based on observable spot and forward rates in active markets. The Company measures the fair value of commodity contracts using Level 2 inputs through observable market transactions in active markets provided by financial institutions. During the year ended
December 31, 2015
, there were no transfers between Levels 1, 2 or 3.
In connection with acquisitions, the Company recorded contingent considerations fair valued at
$9,184
as of
December 31, 2015
. Under the contingent consideration agreements the amounts to be paid are based upon actual financial results of the acquired entity for specified future periods. The fair value of the contingent considerations are a Level 3 valuation and fair valued using a probability weighted discounted cash flow analysis.
F-36
LINCOLN ELECTRIC HOLDINGS, INC.
NOTES TO CONSOLIDATED FINANCIAL STATEMENTS (Continued)
(Dollars in thousands, except share and per share amounts)
In connection with an acquisition, the Company obtained a controlling financial interest in the acquired entity and at the same time entered into a contract to obtain the remaining financial interest in the entity over a
three
-year period. The amount to be paid to obtain the remaining financial interest will be based upon actual financial results of the acquired entity. A liability was recorded for the Canadian dollar denominated forward contract at a fair value of
$26,484
as of
December 31, 2015
. The change in the liability from December 31, 2014 was primarily the result of a
$7,140
payment to acquire an additional financial interest in the entity offset by additional accruals of
$12,142
for the twelve months ended
December 31, 2015
. The fair value of the contract is a Level 3 valuation and is based on the present value of the expected future payments. The expected future payments are based on a multiple of forecast earnings and cash flows over the three-year period ending December 31, 2016, present valued utilizing a risk based discount rates of
3.5%
reflective of the Company's cost of debt and
14.1%
as a risk adjusted cost of capital.
The deferred compensation liability is the Company's obligation under its executive deferred compensation plan. The Company measures the fair value of the liability using the market values of the participants' underlying investment fund elections.
The Company has various financial instruments, including cash and cash equivalents, short and long-term debt and forward contracts. While these financial instruments are subject to concentrations of credit risk, the Company has minimized this risk by entering into arrangements with a number of major banks and financial institutions and investing in several high-quality instruments. The Company does not expect any counterparties to fail to meet their obligations. The fair value of Cash and cash equivalents, Accounts receivable, Amounts due banks and Trade accounts payable approximated book value due to the short-term nature of these instruments at both
December 31, 2015
and
December 31, 2014
. See Note 8 for the fair value estimate of debt.
The valuation of LIFO inventories is made at the end of each year based on inventory levels and costs at that time. Accordingly, interim LIFO calculations are based on management’s estimates of expected year-end inventory levels and costs. Actual year-end costs and inventory levels may differ from interim LIFO inventory valuations. At December 31,
2015
and
2014
, approximately
40%
of total inventories were valued using the LIFO method. The excess of current cost over LIFO cost was
$59,765
at
December 31, 2015
and
$71,311
at
December 31, 2014
.
The Company leases sales offices, manufacturing facilities, warehouses and distribution centers, transportation equipment, office equipment and information technology equipment. Such leases, some of which are noncancelable and, in many cases, include renewals, expire at various dates. The Company pays most insurance, maintenance and taxes relating to leased assets. Rental expense was
$16,703
in
2015
,
$18,103
in
2014
and
$18,642
in
2013
.
At
December 31, 2015
, total future minimum lease payments for noncancelable operating leases were
$12,160
in
2016
,
$8,735
in
2017
,
$6,623
in
2018
,
$5,025
in
2019
,
$3,557
in
2020
and
$5,584
thereafter. Assets held under capital leases are included in property, plant and equipment and are immaterial.
The Company, like other manufacturers, is subject from time to time to a variety of civil and administrative proceedings arising in the ordinary course of business. Such claims and litigation include, without limitation, product liability claims, regulatory claims and health, safety and environmental claims, some of which relate to cases alleging asbestos induced illnesses. The claimants in the asbestos cases seek compensatory and punitive damages, in most cases for unspecified amounts. The Company believes it has meritorious defenses to these claims and intends to contest such suits vigorously.
The Company accrues its best estimate of the probable costs, after a review of the facts with management and counsel and taking into account past experience. If an unfavorable outcome is determined to be reasonably possible but not probable, or if the amount of loss cannot be reasonably estimated, disclosure would be provided for material claims or litigation. Many of the current cases are in differing procedural stages and information on the circumstances of each claimant, which forms the basis for judgments as to the validity or ultimate disposition of such actions, varies greatly. Therefore, in many situations a range of possible losses cannot be made. Reserves are adjusted as facts and circumstances change and related management assessments of the underlying merits and the likelihood of outcomes change. Moreover, reserves only cover identified and/or asserted claims. Future claims could, therefore, give rise to increases to such reserves.
Based on the Company's historical experience in litigating product liability claims, including a significant number of dismissals, summary judgments and defense verdicts in many cases and immaterial settlement amounts, as well as the Company's current assessment of the underlying merits of the claims and applicable insurance, the Company believes resolution of these claims and proceedings, individually or in the aggregate, will not have a material effect on the Company's consolidated financial statements.
The changes in product warranty accruals for
2015
,
2014
and
2013
were as follows:
|
|
December 31,
|
|||||||||||
|
|
2015
|
2014
|
2013
|
|||||||||
|
Balance at beginning of year
|
$
|
15,579
|
|
$
|
15,180
|
|
$
|
15,304
|
|
|||
|
Accruals for warranties
|
19,824
|
|
12,368
|
|
12,786
|
|
||||||
|
Settlements
|
(15,458
|
)
|
(11,495
|
)
|
(12,794
|
)
|
||||||
|
Foreign currency translation
|
(476
|
)
|
(474
|
)
|
(116
|
)
|
||||||
|
Balance at end of year
|
$
|
19,469
|
|
$
|
15,579
|
|
$
|
15,180
|
|
|||
|
First
|
Second
|
Third
|
Fourth
|
|||||||||||||
|
2015
|
|
|
|
|
||||||||||||
|
Net sales
|
$
|
657,900
|
|
$
|
664,740
|
|
$
|
645,166
|
|
$
|
567,985
|
|
||||
|
Gross profit
|
220,390
|
|
225,781
|
|
198,894
|
|
196,079
|
|
||||||||
|
Income (loss) before income taxes
|
92,707
|
|
94,434
|
|
(88,526
|
)
|
71,172
|
|
||||||||
|
Net income (loss)
|
68,354
|
|
70,898
|
|
(60,466
|
)
|
48,692
|
|
||||||||
|
Basic earnings (loss) per share
|
$
|
0.90
|
|
$
|
0.95
|
|
$
|
(0.82
|
)
|
$
|
0.68
|
|
||||
|
Diluted earnings (loss) per share
|
$
|
0.89
|
|
$
|
0.94
|
|
$
|
(0.82
|
)
|
$
|
0.68
|
|
||||
|
2014
|
|
|
|
|
||||||||||||
|
Net sales
|
$
|
685,062
|
|
$
|
728,531
|
|
$
|
715,777
|
|
$
|
683,954
|
|
||||
|
Gross profit
|
226,336
|
|
250,267
|
|
241,609
|
|
231,085
|
|
||||||||
|
Income before income taxes
|
82,426
|
|
114,866
|
|
77,785
|
|
100,736
|
|
||||||||
|
Net income
|
56,453
|
|
77,332
|
|
45,689
|
|
75,212
|
|
||||||||
|
Basic earnings per share
|
$
|
0.70
|
|
$
|
0.97
|
|
$
|
0.58
|
|
$
|
0.97
|
|
||||
|
Diluted earnings per share
|
$
|
0.69
|
|
$
|
0.96
|
|
$
|
0.57
|
|
$
|
0.96
|
|
||||
The quarter ended December 31, 2015 includes net rationalization charges of
$434
(
$450
after-tax) primarily related to employee severance and other related costs. Special items also include pension settlement charges of
$6,407
(
$3,969
after-tax) and Venezuelan foreign exchange remeasurement losses of
$708
related to the adoption of a new foreign exchange mechanism.
The quarter ended September 30, 2015 includes net rationalization and asset impairment charges of
$18,285
(
$16,832
after-tax) primarily related to employee severance and other costs. Impairment charges include a non-cash charge to the carrying value of goodwill of
$6,315
and non-cash long-lived asset impairment charges of
$3,417
. Special items also include pension settlement charges of
$136,331
(
$83,341
after-tax) primarily related to the purchase of a group annuity contract and Venezuelan foreign exchange remeasurement losses of
$26,506
related to the adoption of a new foreign exchange mechanism.
The quarter ended June 30, 2015 includes net rationalization charges of
$1,239
(
$900
after-tax) primarily related to employee severance and other costs.
The quarter ended December 31, 2014 includes net rationalization and asset impairment charges of
$166
(
$167
after-tax) primarily related to employee severance and other costs associated with the consolidation of manufacturing operations.
F-37
LINCOLN ELECTRIC HOLDINGS, INC.
NOTES TO CONSOLIDATED FINANCIAL STATEMENTS (Continued)
(Dollars in thousands, except share and per share amounts)
The quarter ended September 30, 2014 includes net rationalization and asset impairment charges of
$29,068
(
$30,056
after-tax). The net impairment charges during the quarter primarily consist of non-cash asset impairment charges of
$32,448
partially offset by a gain of
$3,911
related to the sale of real estate at a rationalized operation. Associated with the impairment of long-lived assets is an offsetting special item of
$805
attributable to non-controlling interests.
The quarter ended June 30, 2014 includes net rationalization and asset impairment charges of
$836
(
$698
after-tax) primarily related to employee severance and other costs associated with the consolidation of manufacturing operations and charges of
$3,468
related to a Venezuelan remeasurement loss.
The quarter ended March 31, 2014 includes net rationalization and asset impairment charges of
$17
(
$7
after-tax) primarily related to employee severance and other costs associated with the consolidation of manufacturing operations and charges of
$17,665
related to a Venezuelan remeasurement loss.
The quarterly earnings per share ("EPS") amounts are each calculated independently. Therefore, the sum of the quarterly EPS amounts may not equal the annual totals.
F-38
SCHEDULE II – VALUATION AND QUALIFYING ACCOUNTS
LINCOLN ELECTRIC HOLDINGS, INC.
(In thousands)
|
|
|
Additions
|
|
|
||||||||||||||||
|
Description
|
Balance at
Beginning
of Period
|
Charged to
Costs and
Expenses
|
(1)
Charged (Credited) to
Other Accounts
|
(2)
Deductions
|
Balance at End of Period
|
|||||||||||||||
|
Allowance for doubtful accounts:
|
|
|
|
|
|
|||||||||||||||
|
Year Ended December 31, 2015
|
$
|
7,858
|
|
$
|
1,969
|
|
$
|
(1,046
|
)
|
$
|
1,482
|
|
$
|
7,299
|
|
|||||
|
Year Ended December 31, 2014
|
8,398
|
|
2,064
|
|
(867
|
)
|
1,737
|
|
7,858
|
|
||||||||||
|
Year Ended December 31, 2013
|
8,654
|
|
2,671
|
|
49
|
|
2,976
|
|
8,398
|
|
||||||||||
|
(1)
|
Currency translation adjustment.
|
|
(2)
|
Uncollectible accounts written-off, net of recoveries.
|
F-39
QuickLinks
TABLE OF CONTENTS
Part IItem 1. BusinessItem 1A. Risk FactorsItem 1B. Unresolved Staff CommentsItem 1C. Executive Officers Of The RegistrantItem 2. PropertiesItem 3. Legal ProceedingsItem 4. Mine Safety DisclosuresPart IIItem 5. Market For Registrant's Common Equity, Related Stockholder Matters and Issuer Purchases Of Equity SecuritiesItem 6. Selected Financial DataItem 7. Management's Discussion and Analysis Of Financial Condition and Results Of OperationsItem 7A. Quantitative and Qualitative Disclosures About Market RiskItem 8. Financial Statements and Supplementary DataItem 9. Changes in and Disagreements with Accountants on Accounting and Financial DisclosuresItem 9A. Controls and ProceduresItem 9B. Other InformationPart IIIItem 10. Directors, Executive Officers and Corporate GovernanceItem 11. Executive CompensationItem 12. Security Ownership Of Certain Beneficial Owners and Management and Related Stockholder MattersItem 13. Certain Relationships and Related Transactions, and Director IndependenceItem 14. Principal Accountant Fees and ServicesPart IVItem 15. Exhibits and Financial Statement SchedulesNote 1 Significant Accounting PoliciesNote 2 - Earnings Per ShareNote 3 AcquisitionsNote 4 Goodwill and IntangiblesNote 5 Segment InformationNote 6 Rationalization and Asset ImpairmentsNote 7 Accumulated Other Comprehensive Income (loss) ("aoci")Note 8 DebtNote 9 Stock PlansNote 10 Common Stock Repurchase ProgramNote 11 Retirement Annuity and Guaranteed Continuous Employment PlansNote 12 Income TaxesNote 13 DerivativesNote 14 Fair ValueNote 15 InventoryNote 16 LeasesNote 17 ContingenciesNote 18 Product Warranty CostsNote 19 Quarterly Financial Data (unaudited)