LEGGETT & PLATT INC
10-Ks and 10-Qs
|
|
|
|
|
|
|
|
|
|
|
|
|
|
|
|
|
|
|
|
|
|
|
|
|
|
|
|
|
|
|
|
|
|
|
|
|
|
|
|
|
|
|
|
|
|
|
|
|
|
|
|
|
UNITED STATES
SECURITIES AND EXCHANGE COMMISSION
Washington, D.C. 20549
FORM 10-K
|
(Mark One)
|
|
|
ý
|
ANNUAL REPORT PURSUANT TO SECTION 13 OR 15(d) OF THE
SECURITIES EXCHANGE ACT OF 1934
|
For the fiscal year ended
December 31, 2014
OR
|
¨
|
TRANSITION REPORT PURSUANT TO SECTION 13 OR 15(d) OF THE SECURITIES EXCHANGE ACT OF 1934
|
For the transition period from to .
Commission File Number 001-07845
LEGGETT & PLATT, INCORPORATED
(Exact name of registrant as specified in its charter)
|
Missouri
|
|
44-0324630
|
|
(State or other jurisdiction of
incorporation or organization)
|
|
(I.R.S. Employer
Identification No.)
|
|
No. 1 Leggett Road
Carthage, Missouri
|
|
64836
|
|
(Address of principal executive offices)
|
|
(Zip code)
|
Registrant’s telephone number, including area code: (417) 358-8131
SECURITIES REGISTERED PURSUANT TO SECTION 12(b) OF THE ACT:
|
Title of Each Class
|
|
Name of each exchange on
which registered
|
|
Common Stock, $.01 par value
|
|
New York Stock Exchange
|
Indicate by check mark if the registrant is a well-known seasoned issuer, as defined in Rule 405 of the Securities Act. Yes
ý
No
¨
Indicate by check mark if the registrant is not required to file reports pursuant to Section 13 or Section 15(d) of the Act. Yes
¨
No
ý
Indicate by check mark whether the registrant (1) has filed all reports required to be filed by Section 13 or 15(d) of the Securities Exchange Act of 1934 during the preceding 12 months (or for such shorter period that the registrant was required to file such reports), and (2) has been subject to such filing requirements for the past 90 days. Yes
ý
No
¨
Indicate by check mark whether the registrant has submitted electronically and posted on its corporate Web site, if any, every Interactive Data File required to be submitted and posted pursuant to Rule 405 of Regulation S-T (§232.405 of this chapter) during the preceding 12 months (or for such shorter period that the registrant was required to submit and post such files). Yes
ý
No
¨
Indicate by check mark if disclosure of delinquent filers pursuant to Item 405 of Regulation S-K (§229.405 of this chapter) is not contained herein, and will not be contained, to the best of registrant’s knowledge, in definitive proxy or information statements incorporated by reference in Part III of this Form 10-K or any amendment to this Form 10-K.
¨
Indicate by check mark whether the registrant is a large accelerated filer, an accelerated filer, a non-accelerated filer, or a smaller reporting company. See the definitions of “large accelerated filer,” “accelerated filer” and “smaller reporting company” in Rule 12b-2 of the Exchange Act.
|
Large accelerated filer
|
x
|
|
Accelerated filer
¨
|
|
Non-accelerated filer
|
¨
|
(Do not check if a smaller reporting company)
|
Smaller reporting company
¨
|
Indicate by check mark whether the registrant is a shell company (as defined in Rule 12b-2 of the Act). Yes
¨
No
ý
The aggregate market value of the voting stock held by non-affiliates of the registrant (based on the closing price of our common stock on the New York Stock Exchange) on June 30, 2014 was $ 4,510,540,015.
There were 138,344,572 shares of the registrant’s common stock outstanding as of February 13, 2015.
DOCUMENTS INCORPORATED BY REFERENCE
Part of Item 10, and all of Items 11, 12, 13 and 14 of Part III are incorporated by reference from the Company’s definitive Proxy Statement for the Annual Meeting of Shareholders to be held on May 5, 2015.
TABLE OF CONTENTS
LEGGETT & PLATT, INCORPORATED—FORM 10-K
FOR THE YEAR ENDED
December 31, 2014
|
|
Page
Number
|
||
|
1
|
|
||
|
PART I
|
|||
|
Item 1.
|
2
|
|
|
|
Item 1A.
|
15
|
|
|
|
Item 1B.
|
18
|
|
|
|
Item 2.
|
18
|
|
|
|
Item 3.
|
19
|
|
|
|
Item 4.
|
19
|
|
|
|
Supp. Item.
|
20
|
|
|
|
PART II
|
|||
|
Item 5.
|
22
|
|
|
|
Item 6.
|
24
|
|
|
|
Item 7.
|
25
|
|
|
|
Item 7A.
|
59
|
|
|
|
Item 8.
|
60
|
|
|
|
Item 9.
|
60
|
|
|
|
Item 9A.
|
60
|
|
|
|
Item 9B.
|
61
|
|
|
|
PART III
|
|||
|
Item 10.
|
62
|
|
|
|
Item 11.
|
65
|
|
|
|
Item 12.
|
65
|
|
|
|
Item 13.
|
65
|
|
|
|
Item 14.
|
65
|
|
|
|
PART IV
|
|||
|
Item 15.
|
66
|
|
|
|
121
|
|
||
|
123
|
|
||
Forward-Looking Statements
This Annual Report on Form 10-K and our other public disclosures, whether written or oral, may contain “forward-looking” statements including, but not limited to: projections of revenue, income, earnings, capital expenditures, dividends, capital structure, cash flows or other financial items; possible plans, goals, objectives, prospects, strategies or trends concerning future operations; statements concerning future economic performance, possible goodwill or other asset impairment; and the underlying assumptions relating to the forward-looking statements. These statements are identified either by the context in which they appear or by use of words such as “anticipate,” “believe,” “estimate,” “expect,” “intend,” “may,” “plan,” “project,” “should” or the like. All such forward-looking statements, whether written or oral, and whether made by us or on our behalf, are expressly qualified by the cautionary statements described in this provision.
Any forward-looking statement reflects only the beliefs of the Company or its management at the time the statement is made. Because all forward-looking statements deal with the future, they are subject to risks, uncertainties and developments which might cause actual events or results to differ materially from those envisioned or reflected in any forward-looking statement. Moreover, we do not have, and do not undertake, any duty to update or revise any forward-looking statement to reflect events or circumstances after the date on which the statement was made. For all of these reasons, forward-looking statements should not be relied upon as a prediction of actual future events, objectives, strategies, trends or results.
Readers should review Item 1A Risk Factors in this Form 10-K for a description of important factors that could cause actual events or results to differ materially from forward-looking statements. It is not possible to anticipate and list all risks, uncertainties and developments which may affect the future operations or performance of the Company, or which otherwise may cause actual events or results to differ materially from forward-looking statements. However, the known, material risks and uncertainties include the following:
|
•
|
factors that could affect the industries or markets in which we participate, such as growth rates and opportunities in those industries;
|
|
•
|
adverse changes in inflation, currency, political risk, U.S. or foreign laws or regulations (including tax law changes), consumer sentiment, housing turnover, employment levels, interest rates, trends in capital spending and the like;
|
|
•
|
factors that could impact raw materials and other costs, including the availability and pricing of steel scrap and rod and other raw materials, the availability of labor, wage rates and energy costs;
|
|
•
|
our ability to pass along raw material cost increases through increased selling prices;
|
|
•
|
price and product competition from foreign (particularly Asian and European) and domestic competitors;
|
|
•
|
our ability to improve operations and realize cost savings (including our ability to fix under-performing operations and to generate future earnings from restructuring-related activities);
|
|
•
|
our ability to maintain profit margins if our customers change the quantity and mix of our components in their finished goods;
|
|
•
|
our ability to realize 25-35% contribution margin on incremental unit volume growth;
|
|
•
|
our ability to achieve expected levels of cash flow;
|
|
•
|
our ability to maintain and grow the profitability of acquired companies;
|
|
•
|
our ability to maintain the proper functioning of our internal business processes and information systems and avoid modification or interruption of such systems, through cyber-security breaches or otherwise;
|
|
•
|
a decline in the long-term outlook for any of our reporting units that could result in asset impairment;
|
|
•
|
our ability to control expenses related to "conflict mineral" regulations and to effectively manage our supply chains to avoid loss of customers;
|
|
•
|
The loss of one or more of our significant customers; and
|
|
•
|
litigation accruals related to various contingencies including antitrust, intellectual property, product liability and warranty, taxation, environmental and workers’ compensation expense.
|
1
PART I
PART I
Item 1. Business.
Summary
Leggett & Platt, Incorporated was founded as a partnership in Carthage, Missouri in 1883 and was incorporated in 1901. The Company, a pioneer of the steel coil bedspring, has become an international diversified manufacturer that conceives, designs and produces a wide range of engineered components and products found in many homes, offices, automobiles and commercial aircraft. As discussed below, our continuing operations are organized into 18 business units, which are divided into 9 groups under our four segments: Residential Furnishings; Commercial Fixturing & Components; Industrial Materials; and Specialized Products.
Overview of Our Segments
Residential Furnishings Segment
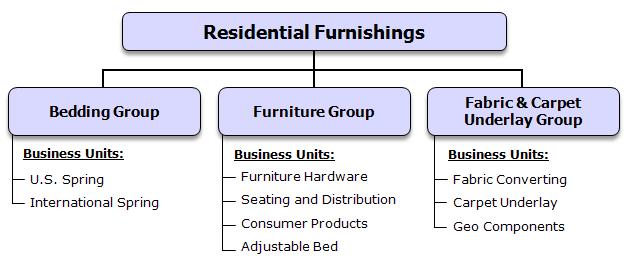
Our Residential Furnishings segment began in 1883 with the manufacture of steel coiled bedsprings. Today, we supply a variety of components used by bedding and upholstered furniture manufacturers in the assembly of their finished products. Our range of products offers our customers a single source for many of their component needs.
Efficient manufacturing methods, internal production of key raw materials and machinery, and numerous manufacturing and assembly locations allow us to supply many customers with components at a lower cost than they can produce themselves. In addition to cost savings, sourcing components from us allows our customers to focus on designing, merchandising and marketing their products.
Products
Bedding Group
|
•
|
Innersprings (sets of steel coils, bound together, that form the core of a mattress)
|
|
•
|
Wire forms for mattress foundations
|
2
PART I
Furniture Group
|
•
|
Steel mechanisms and hardware (enabling furniture to recline, tilt, swivel, rock and elevate) for reclining chairs and sleeper sofas
|
|
•
|
Springs and seat suspensions for chairs, sofas and love seats
|
|
•
|
Steel tubular seat frames
|
|
•
|
Bed frames and ornamental beds
|
|
•
|
Adjustable beds
|
Fabric & Carpet Underlay Group
|
•
|
Structural fabrics for mattresses, residential furniture and industrial uses
|
|
•
|
Carpet underlay materials (bonded scrap foam, fiber, rubber and prime foam)
|
|
•
|
Geo components (synthetic fabrics and various other products used in ground stabilization, drainage protection, erosion and weed control, as well as silt fencing)
|
Customers
|
•
|
Manufacturers of finished bedding (mattresses and foundations) and upholstered furniture
|
|
•
|
Retailers and distributors of adjustable and ornamental beds, bed frames and carpet underlay
|
|
•
|
Contractors, landscapers, road construction companies and government agencies using geo components
|
Commercial Fixturing & Components Segment
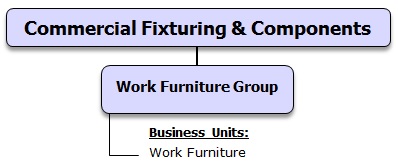
Our Work Furniture group designs, manufactures, and distributes a wide range of engineered components and products primarily for the office seating market.
Products
|
•
|
Bases, columns, back rests, casters and frames for office chairs, and control devices that allow office chairs to tilt, swivel and elevate
|
|
•
|
Select lines of private label finished furniture
|
Customers
|
•
|
Office, institutional and commercial furniture manufacturers
|
3
PART I
Industrial Materials Segment
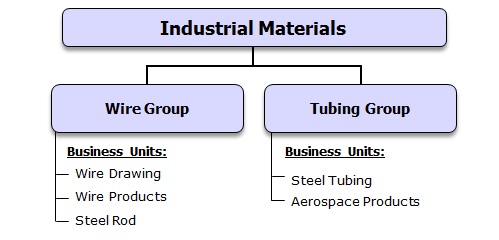
We believe that the quality of our products and services, together with low cost, have made us the leading U.S. supplier of drawn steel wire. Our Wire group operates a steel rod mill with an annual output of approximately 500,000 tons, of which a substantial majority is used by our own wire mills. We have three wire mills that supply virtually all the wire consumed by our other domestic businesses. Our Steel Tubing business unit also supplies a portion of our internal needs for welded steel tubing. In addition to supporting our internal requirements, we supply many external customers with wire and steel tubing products.
In 2012, we completed the acquisition of Western Pneumatic Tube (Western). Western is a leading provider of integral components for critical aircraft systems, and formed the Aerospace Products business unit within the Tubing Group. Western specializes in fabricating thin-walled, large diameter, welded tubing and specialty formed products from titanium, nickel and other specialty materials for leading aerospace suppliers and OEMs. In 2013, we expanded our Aerospace Products business unit with the acquisition of two companies. The first was a UK-based business that extended our capability in aerospace tube fabrication. The second was a French company that added small-diameter, high-pressure seamless tubing to our product portfolio. For further information about acquisitions, see Note R on page 109 of the Notes to Consolidated Financial Statements.
Products
Wire Group
|
•
|
Steel rod
|
|
•
|
Drawn wire
|
|
•
|
Steel billets
|
|
•
|
Fabricated wire products
|
Tubing Group
|
•
|
Welded steel tubing
|
|
•
|
Fabricated tube components
|
|
•
|
Titanium and nickel tubing for the aerospace industry
|
Customers
We use about two-thirds of our wire output and roughly 15-20% of our steel tubing output to manufacture our own products. For example, we use our wire and steel tubing to make:
|
•
|
Bedding and furniture components
|
|
•
|
Motion furniture mechanisms
|
|
•
|
Automotive seat components
|
4
PART I
The Industrial Materials segment also has a diverse group of external customers, including:
|
•
|
Bedding and furniture makers
|
|
•
|
Automotive seating manufacturers
|
|
•
|
Aerospace suppliers and OEMs
|
|
•
|
Mechanical spring makers
|
|
•
|
Waste recyclers and waste removal businesses
|
Specialized Products Segment
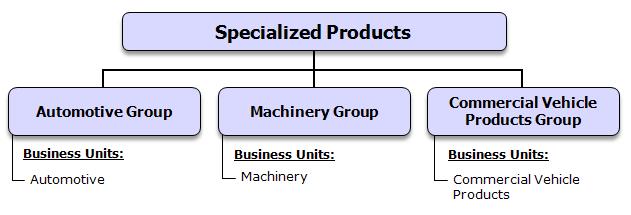
Our Specialized Products segment designs, manufactures and sells products including automotive seating components, specialized machinery and equipment, and service van interiors. Our established design capability and focus on product development have made us a leader in innovation. We also benefit from our broad geographic presence and our internal production of key raw materials and components.
Products
Automotive Group
|
•
|
Manual and power lumbar support and massage systems for automotive seating
|
|
•
|
Seat suspension systems
|
|
•
|
Automotive control cables
|
|
•
|
Low voltage motors and motion assemblies
|
|
•
|
Formed metal and wire components for seat frames
|
Machinery Group
|
•
|
Full range of quilting machines for mattress covers
|
|
•
|
Machines used to shape wire into various types of springs
|
|
•
|
Industrial sewing/finishing machines
|
Commercial Vehicle Products Group
|
•
|
Van interiors (the racks, shelving and cabinets installed in service vans)
|
Customers
|
•
|
Automobile seating manufacturers
|
|
•
|
Bedding manufacturers
|
|
•
|
Various Leggett operations (for spring forming equipment)
|
|
•
|
Telecommunication, cable, home service and delivery companies
|
5
PART I
Strategic Direction
Key Financial Metric
Total Shareholder Return (TSR), relative to peer companies, is the key financial measure that we use to assess long-term performance. TSR = (Change in Stock Price + Dividends)/Beginning Stock Price. Our goal is to achieve TSR in the top 1/3 of the S&P 500 companies over rolling three-year periods through a balanced approach that employs four TSR sources: revenue growth, margin expansion, dividends, and share repurchases. For the three-year measurement period that ended December 31, 2014 we generated TSR of 28% per year on average, which placed us in the top quarter of the S&P 500.
Our incentive programs reward return generation and profitable growth. Senior executives participate in a TSR-based incentive program (based on our performance compared to a group of approximately 320 peers). Business unit bonuses emphasize the achievement of higher returns on the assets under the unit’s direct control.
Returning Cash to Shareholders
During the past three years, we generated $1.25 billion of operating cash, and we returned much of this cash to shareholders in the form of dividends and share repurchases. Dividends and share repurchases are expected to remain significant contributors to long-term TSR.
We currently pay a quarterly dividend of $.31 per share. Our dividend payout target is 50-60% of earnings; however we have been above that target in recent years. Our dividend payout ratio (dividends declared per share/earnings per share) was 67%, 88% and 179% in 2012, 2013 and 2014, respectively. The earnings per share component of the dividend payout ratio was impacted by goodwill impairment charges in 2013 and 2014, and a litigation accrual in 2014. As our markets continue to recover, we expect to move into our target payout range. In the meantime, we expect to generate enough cash to continue to pay and modestly grow the dividend. The Company has consistently (for over 25 years) generated operating cash in excess of our annual requirement for capital expenditures and dividends.
We expect to use cash (after repayment of debt and funding capital expenditures, dividends, and growth opportunities) for share repurchases. Share repurchases were significant in 2013 and 2014. During those two years, we repurchased a total of 11.4 million shares of our stock and issued 7.1 million shares through employee benefit and stock purchase plans. Consistent with our stated plans to repurchase fewer shares in years when acquisition spending is higher, our share repurchases in 2012 were much lower, given the $188 million we invested to acquire Western Pneumatic Tube. In that year, our outstanding shares increased as we repurchased 2.0 million shares and issued 4.7 million shares through employee programs. For the three years combined, we repurchased a total of 13.4 million shares of our stock and issued 11.8 million shares, reducing outstanding shares by 1.1%. In 2014, we repurchased 5.4 million shares (at an average of $33.76) and issued 3.9 million shares (at an average of $22.73). Issuances were largely related to employee stock option exercises.
Portfolio Management
We utilize a rigorous strategic planning process to help guide decisions regarding business unit roles, capital allocation priorities, and new areas in which to grow. We review the portfolio classification of each unit on an annual basis to determine its appropriate role (Grow, Core, Fix, or Divest). This review includes criteria such as competitive position, market attractiveness, business unit size, and fit within our overall objectives, as well as financial indicators such as growth of EBIT (earnings before interest and taxes) and EBITDA (earnings before interest, taxes, depreciation and amortization), operating cash flows, and return on assets. Business units in the
6
PART I
Grow category should provide avenues for profitable growth from competitively advantaged positions in attractive markets. Core business units are expected to enhance productivity, maintain market share, and generate cash flow from operations while using minimal capital. To remain in the portfolio, business units are expected to consistently generate after-tax returns in excess of our cost of capital. Business units that fail to consistently attain minimum return goals will be moved to the Fix or Divest categories.
Disciplined Growth
Long-term, we aim to achieve consistent, profitable growth of 4-5% annually. To attain this goal, we will need to supplement the approximate 2-3% growth that our markets typically produce (in normal economic times) with two additional areas of opportunity. First, we must enhance our success rate at developing and commercializing innovative new products within markets in which we already enjoy strong competitive positions. Second, we need to uncover new growth platforms: opportunities in markets new to us containing margins and growth higher than the Company's average, and in which we would possess a competitive advantage.
Our long-term 4-5% annual growth objective envisions periodic acquisitions. We primarily seek acquisitions within our Grow businesses, and look for opportunities to enter new, higher growth markets (carefully screened for sustainable competitive advantage). We expect all acquisitions to (a) have a clear strategic rationale, a sustainable competitive advantage, a strong fit with the Company, and be in an attractive and growing market; (b) create value by enhancing Total Shareholder Return; (c) for stand-alone businesses: generally possess revenue in excess of $50 million, strong management and future growth opportunity with a strong market position in a market growing faster than GDP; and (d) for add-on businesses: generally possess revenue in excess of $15 million, significant synergies, and a strategic fit with an existing business unit.
Acquisitions
In 2014, we purchased Tempur Sealy's three U.S. innerspring component production facilities for a purchase price of $44.5 million. In conjunction with this purchase, we also expanded and extended our supply relationship and became the exclusive long-term provider in the U.S. and Canada of wire-based innersprings for Tempur Sealy, and boxsprings for Sealy.
We also acquired Kintec-Solution, a German designer and distributor of high-end, European-styled motion components which became part of our Furniture Hardware business for a purchase price of $16.8 million. This business allows us to meet varying design preferences and broadens the range of our furniture component products.
In 2013, we expanded our Aerospace Products business unit with the acquisition of two companies. The first was a UK-based business acquired for $11.7 million that extended our capability in aerospace tube fabrication. The second was a French company acquired for $14.5 million that added small-diameter, high-pressure seamless tubing to our product portfolio.
In 2012, we acquired Western Pneumatic Tube for a cash purchase price of $188 million and formed the Aerospace Products business unit. Western produces thin-walled, large diameter, welded tubing and specialty formed products from titanium, nickel, stainless steel, and other high strength metals for leading aerospace suppliers and OEMs.
For further information about acquisitions, see Note R on page 109 of the Notes to Consolidated Financial Statements.
7
PART I
Divestitures
In 2014, we divested the majority of the Store Fixtures group for total consideration of $59 million. We continue to pursue the sale of the remaining portion of the group, which is classified as discontinued operations. The Store Fixtures group was previously part of the Commercial Fixturing & Components segment.
There were no significant divestitures in 2012 or 2013.
For further information about divestitures and discontinued operations, see Note B on page 77 of the Notes to Consolidated Financial Statements.
Segment Financial Information
For information about sales to external customers, sales by product line, EBIT, and total assets of each of our segments, refer to Note F on page 84 of the Notes to Consolidated Financial Statements.
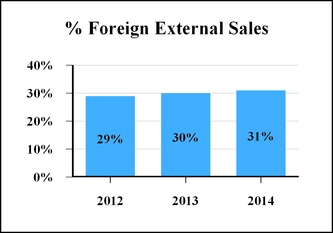
Foreign Operations
The percentages of our external sales in continuing operations related to products manufactured outside the United States for the previous three years are shown below.
Our international continuing operations are principally located in Europe, China, Canada and Mexico. The products we make in these countries primarily consist of:
Europe
|
•
|
Innersprings for mattresses
|
|
•
|
Wire and wire products
|
|
•
|
Recliner mechanisms
|
|
•
|
Seamless tubing and specialty formed products for aerospace applications
|
|
•
|
Lumbar and seat suspension systems for automotive seating
|
|
•
|
Machinery and equipment designed to manufacture innersprings for mattresses
|
8
PART I
China
|
•
|
Innersprings for mattresses
|
|
•
|
Recliner mechanisms and bases for upholstered furniture
|
|
•
|
Formed wire for upholstered furniture
|
|
•
|
Office furniture components, including chair bases and casters
|
|
•
|
Lumbar, seat suspension systems and formed metal products for automotive seating
|
|
•
|
Cables and small electric motors for automotive applications
|
Canada
|
•
|
Fabricated wire for the furniture and automotive industries
|
|
•
|
Office chair controls, chair bases and table bases
|
|
•
|
Lumbar supports for automotive seats
|
|
•
|
Wire and steel storage systems and racks for service vans and utility vehicles
|
Mexico
|
•
|
Innersprings and fabricated wire for the bedding industry
|
|
•
|
Automotive control cable systems and seating components
|
|
•
|
Shafts for the appliance industry
|
Our international expansion strategy is to locate our operations where we believe we would possess a competitive advantage and where demand for components is growing. Also, in instances where our customers move the production of their finished products overseas, we have located facilities nearby to supply them more efficiently.
Our international operations face the risks associated with any operation in a foreign country. These risks include:
|
•
|
Foreign currency fluctuation
|
|
•
|
Foreign legal systems that make it difficult to protect intellectual property and enforce contract rights
|
|
•
|
Credit risks
|
|
•
|
Increased costs due to tariffs, customs and shipping rates
|
|
•
|
Potential problems obtaining raw materials, and disruptions related to the availability of electricity and transportation during times of crisis or war
|
|
•
|
Inconsistent interpretation and enforcement, at times, of foreign tax laws
|
|
•
|
Political instability in certain countries
|
Our Specialized Products segment, which derives roughly 81% of its trade sales from foreign operations, is particularly subject to the above risks. These and other foreign-related risks could result in cost increases, reduced profits, the inability to carry on our foreign operations and other adverse effects on our business.
9
PART I
Geographic Areas of Operation
We have continuing operations manufacturing facilities in countries around the world, as shown below.
|
|
Residential
Furnishings
|
|
Commercial
Fixturing &
Components
|
|
Industrial
Materials
|
|
Specialized
Products
|
|
North America
|
|
|
|
|
|
|
|
|
Canada
|
n
|
|
n
|
|
|
|
n
|
|
Mexico
|
n
|
|
|
|
n
|
|
n
|
|
United States
|
n
|
|
n
|
|
n
|
|
n
|
|
Europe
|
|
|
|
|
|
|
|
|
Austria
|
|
|
|
|
|
|
n
|
|
Belgium
|
|
|
|
|
|
|
n
|
|
Croatia
|
n
|
|
|
|
|
|
n
|
|
Denmark
|
n
|
|
|
|
|
|
|
|
France
|
n
|
||||||
|
Germany
|
n
|
|
|
|
|
|
n
|
|
Hungary
|
|
|
|
|
|
|
n
|
|
Italy
|
|
|
n
|
|
|
|
n
|
|
Switzerland
|
|
|
|
|
|
|
n
|
|
United Kingdom
|
n
|
|
|
|
n
|
|
n
|
|
South America
|
|
|
|
|
|
|
|
|
Brazil
|
n
|
|
|
|
|
|
|
|
Asia
|
|
|
|
|
|
|
|
|
China
|
n
|
|
n
|
|
|
|
n
|
|
India
|
|
|
|
|
|
|
n
|
|
South Korea
|
|
|
|
|
|
|
n
|
|
Africa
|
|
|
|
|
|
|
|
|
South Africa
|
n
|
|
|
|
|
|
|
For further information concerning our continuing operations external sales related to products manufactured outside the United States and our tangible long-lived assets outside the United States, refer to Note F on page 87 of the Notes to Consolidated Financial Statements.
Sales by Product Line
The following table shows our approximate percentage of continuing operations external sales by classes of similar products for the last three years:
|
Product Line
|
2014
|
2013
|
2012
|
|||||||
|
Bedding Group
|
21
|
%
|
19
|
|
%
|
19
|
|
%
|
||
|
Furniture Group
|
19
|
19
|
|
20
|
|
|||||
|
Fabric & Carpet Underlay Group
|
18
|
18
|
|
17
|
|
|||||
|
Automotive Group
|
16
|
15
|
|
14
|
|
|||||
|
Wire Group
|
10
|
12
|
|
13
|
|
|||||
|
Tubing Group
|
5
|
5
|
|
5
|
|
|||||
|
Work Furniture Group
|
5
|
5
|
|
5
|
|
|||||
|
Commercial Vehicle Products Group
|
3
|
3
|
|
4
|
|
|||||
|
Machinery Group
|
3
|
4
|
|
3
|
|
|||||
10
PART I
Distribution of Products
In each of our segments, we sell and distribute our products primarily through our own personnel. However, many of our businesses have relationships and agreements with outside sales representatives and distributors. We do not believe any of these agreements or relationships would, if terminated, have a material adverse effect on the consolidated financial condition, operating cash flows or results of operations of the Company.
Raw Materials
The products we manufacture require a variety of raw materials. We believe that worldwide supply sources are readily available for all the raw materials we use. Among the most important are:
|
•
|
Various types of steel, including scrap, rod, wire, sheet, stainless and angle iron
|
|
•
|
Foam scrap
|
|
•
|
Woven and non-woven fabrics
|
|
•
|
Titanium and nickel-based alloys and other high strength metals
|
We supply our own raw materials for many of the products we make. For example, we produce steel rod that we make into steel wire, which we then use to manufacture:
|
•
|
Innersprings and foundations for mattresses
|
|
•
|
Springs and seat suspensions for chairs and sofas
|
|
•
|
Automotive seating components
|
We supply a substantial majority of our domestic steel rod requirements through our own rod mill. Our wire drawing mills supply nearly all of our U.S. requirements for steel wire. We also produce welded steel tubing, both for our own consumption and for sale to external customers.
Customer Concentration
We serve thousands of customers worldwide, sustaining many long-term business relationships. In 2014, our largest customer accounted for approximately 7% of our consolidated continuing operations revenues. Our top 10 customers accounted for approximately 27% of these consolidated continuing operations revenues. The loss of one or more of these customers could have a material adverse effect on the Company, as a whole, or on the respective segment in which the customer’s sales are reported, including our Residential Furnishings, Commercial Fixturing & Components and Specialized Products segments.
11
PART I
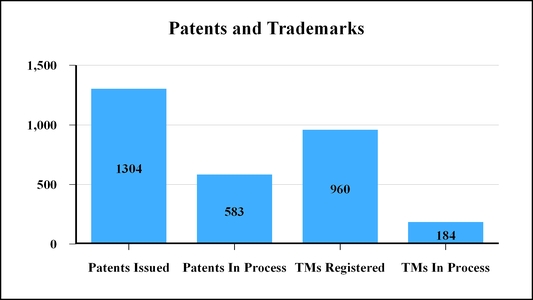
Patents and Trademarks
The chart below shows the approximate number of patents issued, patents in process, trademarks registered and trademarks in process held by our continuing operations as of December 31, 2014. No single patent or group of patents, or trademark or group of trademarks, is material to our operations, as a whole. Most of our patents relate to products sold in the Specialized Products segment, while a substantial majority of our trademarks relate to products sold in the Residential Furnishings and Specialized Products segments.
Some of our most significant trademarks include:
|
•
|
Semi-Flex
®
(box spring components and foundations)
|
|
•
|
ComfortCore
®
,
Mira-Coil
®
, VertiCoil
®
, Lura-Flex
®
,
and
Superlastic
®
(mattress innersprings)
|
|
•
|
Active Support Technology
®
(mattress innersprings)
|
|
•
|
Wall Hugger
®
(recliner chair mechanisms)
|
|
•
|
Super Sagless
®
(motion and sofa sleeper mechanisms)
|
|
•
|
No-Sag
®
(wire forms used in seating)
|
|
•
|
Tack & Jump
®
and
Pattern Link
®
(quilting machines)
|
|
•
|
Hanes
®
(fabric materials)
|
|
•
|
Schukra
®
, Pullmaflex
®
and
Flex-O-Lator
®
(automotive seating products)
|
|
•
|
Spuhl
®
(mattress innerspring manufacturing machines)
|
|
•
|
Gribetz
®
and
Porter
®
(quilting and sewing machines)
|
|
•
|
Masterack
®
(equipment and accessories for vans and trucks)
|
Product Development
One of our strongest performing product categories across the company is ComfortCore
®
, our fabric-encased spring coils used in hybrid and other mattresses. Many mattress producers have moved to higher valued innersprings like ComfortCore
®
in more of their product lines, typically replacing foam cores or traditional innersprings. Our ComfortCore
®
volume has doubled in just two years, representing 17% of our total U.S. innerspring units in 2014.
12
PART I
Research and Development
We maintain research, development and testing centers in Carthage, Missouri and at many of our other facilities. We are unable to calculate precisely the cost of research and development because the personnel involved in product and machinery development also spend portions of their time in other areas. However, we estimate the cost of research and development was $22 million in 2012, $24 million in 2013 and $26 million in 2014.
Employees
As of December 31, 2014, we had approximately 19,000 employees in continuing operations, of which roughly 13,500 were engaged in production. Of the 19,000, approximately 9,600 were international employees (5,400 in China). Roughly 15% of our employees in continuing operations are represented by labor unions that collectively bargain for work conditions, wages or other issues. We did not experience any material work stoppage related to contract negotiations with labor unions during 2014. Management is not aware of any circumstances likely to result in a material work stoppage related to contract negotiations with labor unions during 2015. The chart below shows the approximate number of continuing operations employees by segment.
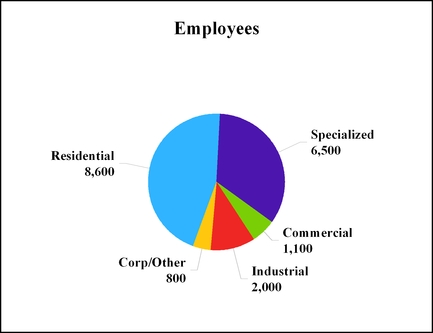
As of December 31, 2013, we had approximately 18,800 employees in continuing operations.
Competition
Many companies offer products that compete with those we manufacture and sell. The number of competing companies varies by product line, but many of the markets for our products are highly competitive. We tend to attract and retain customers through product quality, innovation, competitive pricing and customer service. Many of our competitors try to win business primarily on price but, depending upon the particular product, we experience competition based on quality, performance and availability as well. In general, our competitors tend to be smaller, private companies.
We believe we are the largest U.S. manufacturer, in terms of revenue, of the following:
|
•
|
Components for residential furniture and bedding
|
|
•
|
Carpet underlay
|
|
•
|
Adjustable bed bases
|
13
PART I
|
•
|
Components for office furniture
|
|
•
|
Drawn steel wire
|
|
•
|
Automotive seat support and lumbar systems
|
|
•
|
Bedding industry machinery
|
|
•
|
Thin-walled, titanium, nickel and other specialty tubing for the aerospace industry
|
We continue to face pressure from foreign competitors as some of our customers source a portion of their components and finished products offshore. In addition to lower labor rates, foreign competitors benefit (at times) from lower raw material costs. They may also benefit from currency factors and more lenient regulatory climates. We typically remain price competitive, even versus many foreign manufacturers, as a result of our efficient operations, low labor content, vertical integration in steel and wire, logistics and distribution efficiencies, and large scale purchasing of raw materials and commodities. However, we have also reacted to foreign competition in certain cases by selectively adjusting prices, and by developing new proprietary products that help our customers reduce total costs.
Since 2009, there have been antidumping duty orders on innerspring imports from China, South Africa and Vietnam, ranging from 116% to 234%.
In March 2014, the Department of Commerce (DOC) and the International Trade Commission (ITC) determined that the duties should be continued. In April 2014, the DOC published its final order continuing the duties through February 2019 (for China) and December 2018 (for South Africa and Vietnam). Also, a case brought in January 2014 by major U.S. steel wire rod producers resulted in a ruling in December 2014, and the implementation of antidumping duties of 106% to 110% and countervailing duties of 178% to 193% on imports of Chinese steel wire rod through December 2019.
Because of the documented evasion of antidumping orders by certain importers, typically shipping goods through third countries and falsely identifying the countries of origin, Leggett, along with several U.S. manufacturers have formed a coalition and are working with members of Congress, the DOC, and U.S. Customs and Border Protection to seek stronger enforcement of existing antidumping and/or countervailing duty orders.
Seasonality
As a diversified manufacturer, we generally have not experienced significant seasonality. However, unusual economic factors in any given year, along with acquisitions and dispositions, can create sales variability and obscure the underlying seasonality of our businesses. Historically, for the Company as a whole, the second and third quarters typically have slightly higher sales, while the first and fourth quarters have generally been lower. Segment level seasonality has also been relatively limited, however the Residential Furnishings segment usually has lower sales in the fourth quarter and the Specialized Products segment typically experiences lower sales in the third quarter.
Backlog
Our customer relationships and our manufacturing and inventory practices do not create a material amount of backlog orders for any of our segments. Production and inventory levels are geared primarily to the level of incoming orders and projected demand based on customer relationships.
Working Capital Items
For information regarding working capital items, see the discussion of “Cash from Operations” in Item 7, Management’s Discussion and Analysis of Financial Condition and Results of Operations on page 38.
14
PART I
Government Contracts
The Company does not have a material amount of sales derived from government contracts subject to renegotiation of profits or termination at the election of any government.
Environmental Regulation
Our operations are subject to federal, state, and local laws and regulations related to the protection of the environment. We have policies intended to ensure that our operations are conducted in compliance with applicable laws. While we cannot predict policy changes by various regulatory agencies, management expects that compliance with these laws and regulations will not have a material adverse effect on our competitive position, capital expenditures, financial condition, liquidity or results of operations.
Internet Access to Information
We routinely post information for investors to our website (www.leggett.com) under the Investor Relations section. Our annual reports on Form 10-K, quarterly reports on Form 10-Q, current reports on Form 8-K, and all amendments to those reports are made available, free of charge, on our website as soon as reasonably practicable after electronically filed with, or furnished to, the SEC. In addition to these reports, the Company’s Financial Code of Ethics, Code of Business Conduct and Ethics, and Corporate Governance Guidelines, as well as charters for the Audit, Compensation, and Nominating & Corporate Governance Committees of our Board of Directors, can be found on our website under the Corporate Governance section. Information contained on our website does not constitute part of this Annual Report on Form 10-K.
Discontinued Operations
For the periods presented, we classified some of our businesses as discontinued operations since (i) the operations and cash flows of the businesses were clearly distinguished and have been or will be eliminated from our ongoing operations; (ii) the businesses have either been disposed of or are classified as held for sale; and (iii) we will not have any significant continuing involvement in the operations of the businesses after the disposal transactions.
A substantial portion of our Store Fixtures business was sold in the fourth quarter of 2014. It has been classified as a discontinued operation. This business designed, produced, installed and managed customers' store fixture projects. It manufactured custom-designed, full store fixture packages for retailers, including shelving, counters, showcases and garment racks. It also produced standard shelving used by large retailers, grocery stores and discount chains. For more information on discontinued operations, see Note B on page 77 of the Notes to Consolidated Financial Statements.
Item 1A. Risk Factors.
Investing in our securities involves risk. Set forth below and elsewhere in this report are risk factors that could cause actual results to differ materially from the results contemplated by the forward-looking statements contained in this report. We may amend or supplement these risk factors from time to time by other reports we file with the SEC.
Costs of raw materials could negatively affect our profit margins and earnings.
Raw material cost increases (and our ability to respond to cost increases through selling price increases) can significantly impact our earnings. We typically have short-term commitments from our suppliers; therefore, our raw
15
PART I
material costs generally move with the market. When we experience significant increases in raw material costs, we typically implement price increases to recover the higher costs. Inability to recover cost increases (or a delay in the recovery time) can negatively impact our earnings. Conversely, if raw material costs decrease, we generally pass through reduced selling prices to our customers. Reduced selling prices combined with higher cost inventory can reduce our segment margins and earnings.
Steel is our principal raw material. The global steel markets are cyclical in nature and have been volatile in recent years. This volatility can result in large swings in pricing and margins from year to year. Our operations can also be impacted by changes in the cost of fabrics and foam scrap. We experienced significant fluctuations in the cost of these commodities in recent years.
As a producer of steel rod, we are also impacted by volatility in metal margins (the difference between the cost of steel scrap and the market price for steel rod). If market conditions cause scrap costs and rod pricing to change at different rates (both in terms of timing and amount), metal margins could be compressed and this would negatively impact our results of operations.
Higher raw material costs in past years led some of our customers to modify their product designs, changing the quantity and mix of our components in their finished goods. In some cases, higher cost components were replaced with lower cost components. This primarily impacted our Residential Furnishings and Industrial Materials product mix and decreased profit margins. If this was to occur again it could negatively impact our results of operations.
Competition could adversely affect our market share, sales, profit margins and earnings.
We operate in markets that are highly competitive. We believe that most companies in our lines of business compete primarily on price, but, depending upon the particular product, we experience competition based on quality, performance and availability as well. We face ongoing pressure from foreign competitors as some of our customers source a portion of their components and finished products from Asia and Europe. In addition to lower labor rates, foreign competitors benefit (at times) from lower raw material costs. They may also benefit from currency factors and more lenient regulatory climates. If we are unable to purchase key raw materials, such as steel, at prices competitive with those of foreign suppliers, our ability to maintain market share and profit margins could be harmed by foreign competitors.
We are exposed to contingencies related to certain foam antitrust proceedings that, if realized, could have a material negative impact on our financial condition, results of operations and cash flows.
We previously disclosed that we are a party to a series of civil antitrust lawsuits involving the sale of polyurethane foam products. We have reached a tentative settlement in the U.S. direct purchaser class action cases by agreeing to pay an aggregate pre-tax amount of $39.8 million, inclusive of plaintiff attorneys’ fees and costs. We paid $4.0 million of this amount in the fourth quarter of 2014. We continue to deny all allegations in all of the cases, but have settled the direct purchaser class proceedings (and various other proceedings) to avoid the risk, uncertainty, expense and distraction of litigation. The settlement is subject to Court approval.
We remain a defendant in other previously disclosed antitrust cases involving the sale of polyurethane foam. We will vigorously defend ourselves and believe that we have valid bases to contest all claims. However, we have established an incremental accrual for the estimated amount that we believe is necessary to resolve all antitrust matters. We also believe and expect, based on current facts and circumstances, that any reasonably possible loss incremental to the recorded accruals will not have a material impact on our consolidated financial position, results of operations or cash flows. Provided, however, if our assumptions or analysis regarding these contingencies is incorrect, or if facts and circumstances change, we could realize loss in excess of the recorded accruals which could have a material negative impact on our financial condition, results of operations and cash flows. For more
16
PART I
information regarding our legal contingencies, See Footnote T “Contingencies” on page 113 of the Notes to Consolidated Financial Statements.
We are exposed to foreign currency risk which may negatively impact our competitiveness, profit margins and earnings.
We expect that international sales will continue to represent a significant percentage of our total sales, which exposes us to currency exchange rate fluctuations. In 2014, 31% of our sales were generated by international operations. The revenues and expenses of our foreign operations are generally denominated in local currencies; however, certain of our operations experience currency-related gains and losses where sales or purchases are denominated in currencies other than their local currency. Further, our competitive position may be affected by the relative strength of the currencies in countries where our products are sold. Foreign currency exchange risks inherent in doing business in foreign countries may have a material adverse effect on our future operations and financial results.
Our goodwill and other long-lived assets are subject to potential impairment which could negatively impact our earnings.
A significant portion of our assets consists of goodwill and other long-lived assets, the carrying value of which may be reduced if we determine that those assets are impaired. At December 31, 2014, goodwill and other intangible assets represented $1.02 billion, or 33% of our total assets. In addition, net property, plant and equipment and sundry assets totaled $687.3 million, or 22% of total assets. If actual results differ from the assumptions and estimates used in the goodwill and long-lived asset valuation calculations, we could incur impairment charges, which could negatively impact our earnings.
We review our reporting units for potential goodwill impairment in June as part of our annual goodwill impairment testing, and more often if an event or circumstance occurs making it likely that impairment exists. In addition, we test for the recoverability of long-lived assets at year end, and more often if an event or circumstance indicates the carrying value may not be recoverable. We conduct impairment testing based on our current business strategy in light of present industry and economic conditions, as well as future expectations. If we are not able to achieve projected performance levels, future impairments could be possible, which would negatively impact our earnings.
Technology failures or cyber security breaches could have a material adverse effect on our operations.
We rely on information systems to obtain, process, analyze and manage data, as well as to facilitate the manufacture and distribution of inventory to and from our facilities. We receive, process and ship orders, manage the billing of, and collections from, our customers, and manage the accounting for, and payment to, our vendors. Security breaches of this infrastructure can create system disruptions or unauthorized disclosure of confidential information. If this occurs, our operations could be disrupted, or we may suffer financial loss because of lost or misappropriated information. We cannot be certain that advances in criminal capabilities or new discoveries in the field of cryptography will not compromise our technology protecting information systems. If these systems are interrupted or damaged by these events or fail for any extended period of time, then our results of operations could be adversely affected.
We may not be able to realize deferred tax assets on our balance sheet depending upon the amount and source of future taxable income.
Our ability to realize deferred tax assets on our balance sheet is dependent upon the amount and source of future taxable income. Economic uncertainty or tax law changes could impact our underlying assumptions on which valuation reserves are established and negatively affect future period earnings and balance sheets.
17
PART I
We have exposure to economic and other factors that affect market demand for our products which may negatively impact our sales, operating cash flow and earnings.
As a supplier of products to a variety of industries, we are adversely affected by general economic downturns. Our operating performance is heavily influenced by market demand for our components and products. Market demand for the majority of our products is most heavily influenced by consumer confidence. To a lesser extent, market demand is impacted by other broad economic factors, including disposable income levels, employment levels, housing turnover and interest rates. All of these factors influence consumer spending on durable goods, and drive demand for our components and products. Some of these factors also influence business spending on facilities and equipment, which impacts approximately one-quarter of our sales.
Demand weakness in our markets can lead to lower unit orders, sales and earnings in our businesses. Several factors, including a weak global economy, low consumer confidence, or a depressed housing market could contribute to conservative spending habits by consumers around the world. Short lead times in most of our markets allow for limited visibility into demand trends. If economic and market conditions deteriorate, we may experience material negative impacts on our business, financial condition, operating cash flows and results of operations.
Item 1B. Unresolved Staff Comments.
None.
Item 2. Properties.
The Company’s corporate office is located in Carthage, Missouri. We currently have 133 manufacturing locations in continuing operations, of which 84 are located across the United States and 49 are located in 17 foreign countries. We also have various sales, warehouse and administrative facilities. However, our manufacturing plants are our most important properties.
Manufacturing Locations by Segment
|
|
Company-
Wide
|
Subtotals by Segment
|
||||||||
|
Manufacturing Locations
|
Residential
Furnishings
|
Commercial
Fixturing &
Components
|
Industrial
Materials
|
Specialized
Products
|
||||||
|
United States
|
84
|
54
|
4
|
12
|
14
|
|||||
|
Europe
|
18
|
4
|
1
|
3
|
10
|
|||||
|
Asia
|
16
|
4
|
1
|
—
|
11
|
|||||
|
Canada
|
8
|
2
|
2
|
—
|
4
|
|||||
|
Mexico
|
5
|
2
|
—
|
1
|
2
|
|||||
|
Other
|
2
|
2
|
—
|
—
|
—
|
|||||
|
Total
|
133
|
68
|
8
|
16
|
41
|
|||||
__________________________________________________________
Manufacturing locations that we own produced approximately 70% of our sales in 2014. We also lease many of our manufacturing, warehouse and other facilities on terms that vary by lease (including purchase options, renewals and maintenance costs). For additional information regarding lease obligations, see Note K on page 92 of the Notes to Consolidated Financial Statements.
18
PART I
In the opinion of management, the Company’s owned and leased facilities are suitable and adequate for the manufacture, assembly and distribution of our products. Our properties are located to allow quick and efficient delivery of products and services to our diverse customer base. Our productive capacity, in general, continues to exceed current operating levels. However, utilization has increased in many of our businesses with improving market demand, and we are investing to support rapid growth in a few of our businesses, including Automotive, U.S. Spring and Adjustable Bed.
Item 3. Legal Proceedings.
The information in Note T beginning on page 113 of the Notes to Consolidated Financial Statements is incorporated into this section by reference.
Environmental Matter Involving Potential Monetary Sanctions of $100,000 or More
On March 27, 2013, Region 5 of the U.S. Environmental Protection Agency issued a Notice of Violation("NOV") alleging that our subsidiary, Sterling Steel Company, violated the Clean Air Act and the Illinois State Implementation Plan currently in place. Sterling operates a steel rod mill in Sterling, Illinois. The NOV alleges that Sterling, since 2008, has exceeded the allowable annual particulate matter and manganese emission limits for its arc furnace. Sterling requested a conference with the EPA to discuss the alleged violations. The conference was held on May 20, 2013. On July 23, 2013, the EPA issued a Finding of Violation alleging that Sterling violated the opacity limitations of its air permit and Federal and state regulations. A conference to discuss the Finding of Violation occurred in the third quarter of 2013. There have been no material updates with respect to these matters since the third quarter of 2013.
Sterling intends to vigorously defend these matters in any enforcement action that may be pursued by the EPA. The EPA did not specify any amount of penalty or injunctive relief being sought in the NOV, Finding of Violation, or in any conference. Any settlement or adverse finding could result in the payment by Sterling of fines, penalties, capital expenditures, or some combination thereof. Although the outcome of these matters cannot be predicted with certainty, we do not expect them, either individually or in the aggregate, to have a material adverse effect on our financial position, cash flows or results of operations.
Item 4. Mine Safety Disclosures.
Not applicable.
19
PART I
Supplemental Item. Executive Officers of the Registrant.
The following information is included in accordance with the provisions of Part III, Item 10 of Form 10-K and Item 401(b) of Regulation S-K.
The table below sets forth the names, ages and positions of all executive officers of the Company. Executive officers are normally appointed annually by the Board of Directors.
|
Name
|
Age
|
Position
|
||
|
David S. Haffner
|
62
|
Board Chair and Chief Executive Officer
|
||
|
Karl G. Glassman
|
56
|
President and Chief Operating Officer
|
||
|
Matthew C. Flanigan
|
53
|
Executive Vice President and Chief Financial Officer
|
||
|
Jack D. Crusa
|
60
|
Senior Vice President, Specialized Products
|
||
|
Perry E. Davis
|
55
|
Senior Vice President, Residential Furnishings
|
||
|
David M. DeSonier
|
56
|
Senior Vice President, Strategy & Investor Relations
|
||
|
Scott S. Douglas
|
55
|
Senior Vice President, General Counsel
|
||
|
Joseph D. Downes, Jr.
|
70
|
Senior Vice President, Industrial Materials
|
||
|
Russell J. Iorio
|
45
|
Senior Vice President, Mergers & Acquisitions
|
||
|
John G. Moore
|
54
|
Senior Vice President, Chief Legal & HR Officer and Secretary
|
||
|
Dennis S. Park
|
60
|
Senior Vice President, Commercial Fixturing & Components
|
||
|
William S. Weil
|
56
|
Senior Vice President, Controller and Chief Accounting Officer
|
||
______________________________
Subject to the employment and severance benefit agreements with Mr. Haffner, Mr. Glassman and Mr. Flanigan, listed as exhibits to this Report, the executive officers generally serve at the pleasure of the Board of Directors. Our employment agreement with Mr. Haffner provides that he may terminate the agreement if not nominated as a director and appointed to the Board's executive committee. Employment agreements with Mr. Glassman and Mr. Flanigan provide that they may terminate their agreements if not nominated as a director of the Company. In addition, each may terminate their respective agreement if not elected to their current executive officer position. See Exhibit Index on page 123 for reference to the agreements.
David S. Haffner was elected Board Chair of the Company in 2013 and continues to serve as Chief Executive Officer since his appointment in 2006. He previously served as President from 2002 to 2013, Chief Operating Officer from 1999 to 2006, and as Executive Vice President from 1995 to 2002. He has served the Company in various capacities since 1983.
Karl G. Glassman was appointed President of the Company in 2013 and has served as Chief Operating Officer since 2006. He previously served as Executive Vice President from 2002 to 2013, President of Residential Furnishings from 1999 to 2006, Senior Vice President from 1999 to 2002 and in various capacities since 1982.
Matthew C. Flanigan was appointed Executive Vice President of the Company in 2013 and has served as Chief Financial Officer since 2003. He previously served as Senior Vice President from 2005 to 2013, Vice President from 1999 to 2005, President of the Office Furniture Components Group from 1999 to 2003 and in various capacities since 1997.
Jack D. Crusa was appointed Senior Vice President in 1999 and President of Specialized Products in 2004. He previously served as President of Industrial Materials from 1999 to 2004, and President of the Automotive Group from 1996 to 1999. He has served the Company in various capacities since 1986. Upon the retirement of Joseph D. Downes, Jr. effective April 5, 2015, as discussed below, Mr. Crusa will assume the additional position of President of Industrial Materials.
20
Perry E. Davis was appointed Senior Vice President and President of Residential Furnishings in 2012. He previously served as Vice President of the Company, President—Bedding Group from 2006 to 2012, as Vice President of the Company, Executive VP of the Bedding Group and President—U.S. Spring beginning in 2005. He also served as Executive VP of the Bedding Group and President—U.S. Spring from 2004 to 2005, President—Central Division Bedding Group from 2000 to 2004, and in various capacities since 1981.
David M. DeSonier was appointed Senior Vice President—Strategy & Investor Relations in 2011. He previously served as Vice President—Strategy & Investor Relations from 2007 to 2011 and served as Vice President—Investor Relations and Assistant Treasurer from 2002 to 2007. He joined the Company as Vice President—Investor Relations in 2000.
Scott S. Douglas was appointed Senior Vice President—General Counsel in 2011. He previously served the Company as Vice President beginning in 2008, and General Counsel beginning in 2010. He also served as Vice President—Law and Deputy General Counsel from 2008 to 2010, Associate General Counsel—Mergers & Acquisitions from 2001 to 2007, and Assistant General Counsel from 1991 to 2001. He has served the Company in various legal capacities since 1987.
Joseph D. Downes, Jr. was appointed Senior Vice President of the Company in 2005 and President of the Industrial Materials Segment in 2004. He previously served the Company as President of the Wire Group from 1999 to 2004 and in various capacities since 1976. Mr. Downes will retire from his position as Senior Vice President, President of Industrial Materials, effective April 5, 2015. He will remain as an employee with lesser responsibilities until December 31, 2015.
Russell J. Iorio was appointed Senior Vice President, Mergers & Acquisitions in 2014. He previously served the Company as Vice President, Mergers & Acquisitions from 2005 to 2014, and Director of Mergers, Acquisitions & Strategic Planning from 2002 to 2005.
John G. Moore was appointed Senior Vice President, Chief Legal and HR Officer and Secretary in 2011. He was appointed Secretary in 2010, Chief Legal and HR Officer in 2009 and Vice President—Corporate Affairs & Human Resources in 2008. He served as Vice President—Corporate Governance from 2006 to 2008, Vice President and Associate General Counsel from 2001 to 2006, and as Managing Counsel and Assistant General Counsel from 1998 to 2001. He has served the Company in various legal capacities since 1993.
Dennis S. Park was appointed Senior Vice President and President of Commercial Fixturing & Components in 2006. He previously served as Vice President and President of Home Furniture and Consumer Products from 2004 to 2006, and Vice President and President of Home Furniture Components from 1996 to 2004. He has served the Company in various capacities since 1977.
William S. Weil was appointed Senior Vice President in 2014, Chief Accounting Officer in 2004, Vice President in 2000 and Corporate Controller in 1991. He previously served the Company in various other accounting capacities since 1983. Mr. Weil will retire from the Company effective May 5, 2015. Tammy M. Trent will assume his duties as Chief Accounting Officer at that time.
21
PART II
PART II
Our common stock is traded on the New York Stock Exchange (symbol LEG). The table below highlights quarterly and annual stock market information for the last two years.
|
|
Price Range
|
Volume of
Shares Traded
(in Millions)
|
Dividend
Declared
|
|||||||||||
|
|
High
|
Low
|
||||||||||||
|
2014
|
|
|
|
|||||||||||
|
First Quarter
|
$
|
32.75
|
|
$
|
28.90
|
|
59.4
|
|
$
|
0.30
|
|
|||
|
Second Quarter
|
34.80
|
|
31.54
|
|
55.2
|
|
0.30
|
|
||||||
|
Third Quarter
|
35.94
|
|
32.53
|
|
52.7
|
|
0.31
|
|
||||||
|
Fourth Quarter
|
43.15
|
|
32.64
|
|
72.8
|
|
0.31
|
|
||||||
|
For the Year
|
$
|
43.15
|
|
$
|
28.90
|
|
240.1
|
|
$
|
1.22
|
|
|||
|
2013
|
|
|
|
|
||||||||||
|
First Quarter
|
$
|
33.80
|
|
$
|
27.24
|
|
74.0
|
|
$
|
0.29
|
|
|||
|
Second Quarter
|
34.28
|
|
29.59
|
|
74.7
|
|
0.29
|
|
||||||
|
Third Quarter
|
32.52
|
|
28.59
|
|
63.1
|
|
0.30
|
|
||||||
|
Fourth Quarter
|
31.33
|
|
28.00
|
|
65.2
|
|
0.30
|
|
||||||
|
For the Year
|
$
|
34.28
|
|
$
|
27.24
|
|
277.0
|
|
$
|
1.18
|
|
|||
______________________________
Price and volume data reflect composite transactions; price range reflects intra-day prices; data source is Bloomberg.
Shareholders and Dividends
As of February 13, 2015, we had 8,942 shareholders of record.
We expect to continue to pay dividends on our common stock and we are targeting a dividend payout ratio (dividends declared per share/earnings per share) of 50-60%, though it has been and will likely be higher for the near term. Our dividend payout ratio was 67%, 88% and 179% in 2012, 2013 and 2014, respectively. The 2013 and 2014 earnings per share component of the dividend payout ratio was impacted by goodwill impairment charges in both years and a litigation accrual in 2014. See the discussion of the Company’s targeted dividend payout ratio under “Pay Dividends” in Item 7, Management’s Discussion and Analysis of Financial Condition and Results of Operations on page 42.
During 2012, the Company declared four quarterly dividends, but paid five of them, given its decision to accelerate the first quarter 2013 dividend payment into December 2012 in anticipation of tax rate increases on individual taxpayers. For 2013, the Company returned to its typical practice and paid the fourth quarter dividend in January 2014. The five dividend payments in 2012 utilized approximately $200 million of cash while the three payments in 2013 utilized roughly $125 million of cash.
22
PART II
Issuer Purchases of Equity Securities
The table below is a listing of our purchases of the Company’s common stock during each calendar month of the fourth quarter of 2014.
|
Period
|
Total Number of
Shares Purchased(1)
|
Average
Price
Paid per
Share
|
Total Number of Shares
Purchased as Part of
Publicly Announced
Plans or Programs(2)
|
Maximum Number of
Shares that May Yet
Be Purchased Under the
Plans or Programs(2)
|
|||||||||
|
October 2014
|
44,859
|
|
$
|
38.78
|
|
—
|
|
6,525,263
|
|
||||
|
November 2014
|
213,654
|
|
$
|
40.88
|
|
85,999
|
|
6,439,264
|
|
||||
|
December 2014
|
350,006
|
|
$
|
41.76
|
|
254,484
|
|
6,184,780
|
|
||||
|
Total
|
608,519
|
|
$
|
41.23
|
|
340,483
|
|
||||||
______________________________
|
(1)
|
This number includes 268,036 shares which were not repurchased as part of a publicly announced plan or program, all of which were shares surrendered in transactions permitted under the Company’s benefit plans. It does not include shares withheld for taxes on option exercises and stock unit conversions.
|
|
(2)
|
On August 4, 2004, the Board authorized management to repurchase up to 10 million shares each calendar year beginning January 1, 2005. This standing authorization was first reported in the quarterly report on Form 10-Q for the period ended June 30, 2004, filed August 5, 2004, and will remain in force until repealed by the Board of Directors. As such, effective January 1, 2015, the Company was authorized by the Board of Directors to repurchase up to 10 million shares in 2015. No specific repurchase schedule has been established.
|
23
PART II
|
(Unaudited)
|
2014
1
|
2013
2
|
2012
3
|
2011
4
|
2010
|
||||||||||||||
|
(Dollar amounts in millions, except per share data)
|
|
|
|
||||||||||||||||
|
Summary of Operations
|
|
|
|
||||||||||||||||
|
Net Sales from Continuing Operations
|
$
|
3,782
|
|
$
|
3,477
|
|
$
|
3,415
|
|
$
|
3,303
|
|
$
|
2,980
|
|
||||
|
Earnings from Continuing Operations
|
225
|
|
186
|
|
231
|
|
173
|
|
177
|
|
|||||||||
|
(Earnings) Attributable to Noncontrolling Interest, net of tax
|
(3
|
)
|
(2
|
)
|
(2
|
)
|
(3
|
)
|
(6
|
)
|
|||||||||
|
Earnings (loss) from Discontinued Operations, net of tax
|
(124
|
)
|
13
|
|
19
|
|
(17
|
)
|
6
|
|
|||||||||
|
Net Earnings
|
98
|
|
197
|
|
248
|
|
153
|
|
177
|
|
|||||||||
|
Earnings per share from Continuing Operations
|
|
|
|
|
|
||||||||||||||
|
Basic
|
1.57
|
|
1.27
|
|
1.59
|
|
1.16
|
|
1.13
|
|
|||||||||
|
Diluted
|
1.55
|
|
1.25
|
|
1.57
|
|
1.15
|
|
1.11
|
|
|||||||||
|
Earnings (Loss) per share from Discontinued Operations
|
|
|
|
|
|
||||||||||||||
|
Basic
|
(.88
|
)
|
.09
|
|
.13
|
|
(.11
|
)
|
.04
|
|
|||||||||
|
Diluted
|
(.87
|
)
|
.09
|
|
.13
|
|
(.11
|
)
|
.04
|
|
|||||||||
|
Net Earnings (Loss) per share
|
|
|
|
|
|
||||||||||||||
|
Basic
|
.69
|
|
1.36
|
|
1.72
|
|
1.05
|
|
1.17
|
|
|||||||||
|
Diluted
|
.68
|
|
1.34
|
|
1.70
|
|
1.04
|
|
1.15
|
|
|||||||||
|
Cash Dividends declared per share
|
1.22
|
|
1.18
|
|
1.14
|
|
1.10
|
|
1.06
|
|
|||||||||
|
Summary of Financial Position
|
|
|
|
|
|
||||||||||||||
|
Total Assets
|
$
|
3,141
|
|
$
|
3,108
|
|
$
|
3,255
|
|
$
|
2,915
|
|
$
|
3,001
|
|
||||
|
Long-term Debt, including capital leases
|
$
|
767
|
|
$
|
688
|
|
$
|
854
|
|
$
|
833
|
|
$
|
762
|
|
||||
______________________________
|
1
|
Net earnings from Continuing Operations for 2014 includes $54 million (pretax) associated with litigation accruals. Discontinued Operations includes the following pretax items: $108 million of goodwill impairment, a $9 million loss on the sale of the majority of our Store Fixtures unit, and $35 million associated with litigation accruals.
|
|
2
|
Net earnings from Continuing Operations for 2013 include pretax charges of $67 million related to the Commercial Vehicle Products group ($63 million goodwill impairment charge and $4 million accelerated amortization of a customer-related intangible asset), and a $9 million bargain purchase gain related to an acquisition.
|
|
3
|
Net earnings from Continuing Operations for 2012 include a $27 million net tax benefit primarily related to the release of valuation allowances on certain Canadian deferred tax assets, partially offset by deferred withholding taxes on earnings in China.
|
|
4
|
The Company incurred pretax asset impairment and restructuring-related charges totaling $44 million in 2011. Of these charges, $20 million were associated with continuing operations and $24 million were related to discontinued operations.
|
24
PART II
2014 HIGHLIGHTS
Sales from continuing operations grew significantly in 2014. Same location sales improved 6% reflecting strong volume gains in Automotive and most of our Residential Furnishings businesses. Acquisitions also contributed 3% to sales growth.
Earnings from continuing operations increased (versus 2013) reflecting several factors, including the benefit from higher sales and non-recurrence of prior year goodwill impairment and other charges related to the Commercial Vehicle Products business, partially offset by higher foam litigation accruals in 2014.
A major component of our strategy since 2007 has been the optimization of our portfolio of businesses, by increasing investments in businesses that possess strong competitive advantage and reducing our exposure to businesses and markets that are less attractive. In 2014, we made good progress on both fronts. In July, we acquired Tempur Sealy's three innerspring component production facilities. During the year, we also expanded our operations in China to support rapid growth of our Automotive business and invested in machinery to support the significant growth of ComfortCore
®
innersprings. Additionally, in late 2014, we completed the divestiture of the majority of our Store Fixtures business.
Operating cash for the full year was strong. We again generated more than enough cash from operations to comfortably fund dividends and capital expenditures, something we've accomplished for over 25 years.
2014 marked the 43rd consecutive annual dividend increase for the company, with a compound annual growth rate of 13% over that time period. Only one other S&P 500 company can claim as high a rate of dividend growth for as many years.
Our financial profile remains strong. We ended 2014 with net debt to net capital comfortably within our long-standing targeted range. In November we issued $300 million of notes and repaid $180 million of notes that matured. We ended the year with all of our $600 million commercial paper program and revolver facility available.
We assess our overall performance by comparing our Total Shareholder Return (TSR) to that of peer companies on a rolling three-year basis. We target TSR in the top one-third of the S&P 500 over the long term. For the three years ended December 31, 2014, we generated TSR of 28% per year on average. That placed us in the top quarter of the S&P 500, exceeding our top one-third goal.
These topics are discussed in more detail in the sections that follow.
25
PART II
INTRODUCTION
Total Shareholder Return
Total Shareholder Return (TSR), relative to peer companies, is the key financial measure that we use to assess long-term performance. TSR is driven by the change in our share price and the dividends we pay [TSR = (Change in Stock Price + Dividends) / Beginning Stock Price]. We seek to achieve TSR in the top one-third of the S&P 500 over the long-term through a balanced approach that employs four TSR sources: revenue growth, margin expansion, dividends, and share repurchases.
We monitor our TSR performance (relative to the S&P 500) on a rolling three-year basis. For the three-year measurement period that ended December 31, 2014, we generated TSR of 28% per year on average. That performance placed us in the top quarter of the S&P 500 companies, exceeding our top one-third goal.
Customers
We serve a broad suite of customers, with our largest customer representing approximately 7% of our sales. Many are companies whose names are widely recognized. They include most producers of residential furniture and bedding, auto and office seating manufacturers, and a variety of other companies.
Major Factors That Impact Our Business
Many factors impact our business, but those that generally have the greatest impact are market demand, raw material cost trends, and competition.
Market Demand
Market demand (including product mix) is impacted by several economic factors, with consumer confidence being most significant. Other important factors include disposable income levels, employment levels, housing turnover, and interest rates. All of these factors influence consumer spending on durable goods, and therefore affect demand for our components and products. Some of these factors also influence business spending on facilities and equipment, which impacts approximately one-quarter of our sales.
We continue to retain more production capacity than we currently utilize, and with our meaningful operating leverage, earnings should further benefit as market demand continues to improve. For each additional $100 million of sales from incremental unit volume produced utilizing this spare capacity, we expect to generate approximately $25 million to $35 million of additional pre-tax earnings.
Raw Material Costs
In many of our businesses, we enjoy a cost advantage from being vertically integrated into steel wire and rod. This is a benefit that our competitors do not have. We also experience favorable purchasing leverage from buying large quantities of raw materials. Still, our costs can vary significantly as market prices for raw materials (many of which are commodities) fluctuate.
We typically have short-term commitments from our suppliers; accordingly, our raw material costs generally move with the market. Our ability to recover higher costs (through selling price increases) is crucial. When we experience significant increases in raw material costs, we typically implement price increases to recover the higher costs. Conversely, when costs decrease significantly, we generally pass those lower costs through to our customers. The timing of our price increases or decreases is important; we typically experience a lag in recovering higher costs, so we also expect to realize a lag as costs decline.
26
PART II
Steel is our principal raw material. At various times in past years we have experienced significant cost fluctuations in this commodity. In most cases, the major changes (both increases and decreases) were passed through to customers with selling price adjustments. As we begin 2015, market prices for steel scrap in the U.S. are decreasing. This is leading to downward pricing pressure on steel rod and other types of steel materials. We expect, in certain cases, to pass the lower costs through to our customers. However, our margins could experience some short-term pressure if steel deflation causes us to reduce our selling prices before we consume our higher cost inventories.
As a producer of steel rod, we are also impacted by changes in metal margins (the difference between the cost of steel scrap and the market price for steel rod). Metal margins within the steel industry have been volatile during certain periods in recent years. In late 2013 and early 2014, metal margins decreased significantly as market conditions did not allow full recovery of higher scrap costs. An antidumping and countervailing duty case filed in January 2014 by major U.S. steel wire rod producers was concluded in December 2014, resulting in the implementation of duties on imports of Chinese steel wire rod. The antidumping duties range from 106% to 110% and the countervailing duties range from 178% to 193%. Both remain in effect through December 2019.
Our other raw materials include woven and non-woven fabrics, foam scrap, and chemicals. We have experienced changes in the cost of these materials in recent years, and in most years, have been able to pass them through to our customers.
When we raise our prices to recover higher raw material costs, this sometimes causes customers to modify their product designs and replace higher cost components with lower cost components. We must continue to find ways to assist our customers in improving the functionality and reducing the cost of their products, while providing higher margin and profit contribution for our operations.
Competition
Many of our markets are highly competitive, with the number of competitors varying by product line. In general, our competitors tend to be smaller, private companies. Many of our competitors, both domestic and foreign, compete primarily on the basis of price. Our success has stemmed from the ability to remain price competitive, while delivering better product quality, innovation, and customer service.
We continue to face pressure from foreign competitors as some of our customers source a portion of their components and finished products offshore. In addition to lower labor rates, foreign competitors benefit (at times) from lower raw material costs. They may also benefit from currency factors and more lenient regulatory climates. We typically remain price competitive, even versus many foreign manufacturers, as a result of our highly efficient operations, low labor content, vertical integration in steel and wire, logistics and distribution efficiencies, and large scale purchasing of raw materials and commodities. However, we have also reacted to foreign competition in certain cases by selectively adjusting prices, and by developing new proprietary products that help our customers reduce total costs.
Since 2009, there have been antidumping duty orders on innerspring imports from China, South Africa and Vietnam, ranging from 116% to 234%. In March 2014, the Department of Commerce (DOC) and the International Trade Commission (ITC) determined that the duties should be continued. In April 2014, the DOC published its final order continuing the duties through February 2019 (for China) and December 2018 (for South Africa and Vietnam).
Because of the documented evasion of antidumping orders by certain importers, typically shipping goods through third countries and falsely identifying the countries of origin, Leggett, along with several U.S. manufacturers have formed a coalition and are working with members of Congress, the DOC, and U.S. Customs and Border Protection to seek stronger enforcement of existing antidumping and/or countervailing duty orders.
27
PART II
Tentative Settlement of Polyurethane Foam Litigation
We previously disclosed that we are a defendant in a series of civil antitrust lawsuits involving the sale of polyurethane foam. We have reached a tentative settlement in the U.S. direct purchaser class action cases by agreeing to pay an aggregate amount of $39.8 million, inclusive of plaintiff attorneys’ fees and costs. We continue to deny all allegations in all of the cases, but have settled the direct purchaser class cases to avoid the risk, uncertainty, expense and distraction of litigation. The settlement is subject to Court approval. In the fourth quarter of 2014, we paid $4 million to the Court related to the settlement. A final fairness hearing was held on February 3, 2015, but we have not yet received a ruling.
We recorded a $39.8 million (pre-tax) accrual for this tentative settlement in the third quarter of 2014. Since the payment is partially attributable to our former Prime Foam Products business, which was sold in 2007, $8.3 million of the charge was reflected in discontinued operations.
Accrual for Loss Contingencies
Although we deny liability in all threatened or pending litigation proceedings and believe that we have valid bases to contest all claims made against us, we recorded an additional aggregate litigation accrual in continuing operations of $22 million (pre-tax) in the fourth quarter of 2014, which represents our reasonable estimate of unrecorded probable loss for all pending and threatened litigation proceedings impacting continuing operations. We also recorded an additional $27 million (pre-tax) litigation contingency accrual in discontinued operations in the fourth quarter based upon the same facts, circumstances and analysis. By far the largest portion of these accruals relates to the foam antitrust litigation. We believe, based on current facts, that these accruals are adequate to resolve all pending antitrust matters.
We expect to incur the majority of the resulting cash payments in 2015, with the remainder expected to be paid in 2016. Although there are a number of uncertainties and potential outcomes associated with all of our pending or threatened litigation proceedings, we believe, based on current facts and circumstances, that additional legal contingency losses (other than those quantified and disclosed in Note T to the Consolidated Financial Statements on page 113) are not expected to materially affect our consolidated financial position, results of operations, or cash flows.
Discontinued Operations
Some of our prior businesses, including the Store Fixtures business, are disclosed in our financial statements as discontinued operations since (i) the operations and cash flows of the businesses were clearly distinguished and have been or will be eliminated from our ongoing operations; (ii) the businesses have either been disposed of or are classified as held for sale; and (iii) we will not have any significant continuing involvement in the operations of the businesses after the disposal transactions. The Store Fixtures business was previously reported as part of the Commercial Fixturing & Components segment. These operations manufacture and distribute custom-designed, complete store fixture packages for major retailers, including metal and wood shelving, counters, and showcases.
For more information on discontinued operations, see Note B to the Consolidated Financial Statements on page 77.
Goodwill Impairment of Store Fixtures Group
A significant portion of our assets consists of goodwill and other long-lived assets, the carrying value of which may be reduced if we determine that those assets are impaired. We review our reporting units for potential goodwill impairment in June of each year, and more often if an event or circumstance occurs making it likely that impairment exists. We performed our annual goodwill impairment review in June 2014, and on July 14, 2014, concluded that an impairment charge of $108 million ($93 million after tax) was required for our Store Fixtures group. This non-cash impairment charge reflects the complete write-off of the goodwill associated with the Store Fixtures group and was recognized in discontinued operations.
28
PART II
The Store Fixtures group was dependent upon capital spending by retailers on both new stores and remodeling of existing stores. Because of the seasonal nature of the fixture and display industry (where revenue and profitability were typically expected to increase in the second and third quarters assuming the normal historical pattern of heavy shipments during those months) we reasonably anticipated being awarded significant customer orders in the second quarter of 2014. However, as the second quarter progressed, anticipated orders did not materialize and the Store Fixtures business deteriorated, with declines most pronounced in May and June. Taking these developments into account, we lowered our projection of future margins and growth rates (the 10-year compound growth rate for Earnings Before Interest and Taxes plus Depreciation and Amortization (EBITDA) was reduced to .5% from 4.8% in the prior year's review) and increased the discount rate to 12% from 10.5%, causing fair value to fall below carrying value. The lower expectations of future revenue and profitability were due to reduced overall market demand for shelving, counters, showcases and garment racks as many retailers are reducing their investments in traditional store space and focusing more on e-commerce initiatives.
As indicated in the second quarter 10-Q, we engaged an investment banker to assist with the sale of the Store Fixtures group.
Divestiture of Store Fixtures Operations
On November 1, 2014, we sold the majority of the Store Fixtures business for $59 million. These divested operations represented approximately three-quarters of the business unit's revenues. The transaction resulted in an after-tax loss of $5 million, which was recognized in discontinued operations. We continue to pursue the sale of the two remaining Store Fixtures facilities and do not expect a significant cash impact from these exit activities.
Future Change in Segment Reporting
Our reportable segments are the same as our operating segments, which also correspond with our management organizational structure. Because of the recent divestiture of the majority of the Store Fixtures business (formerly in the Commercial Fixturing & Components segment) along with the pending retirement of the Senior Operating Vice President of the Industrial Materials segment, our management organizational structure and all related internal reporting will change during the first quarter of 2015. As a result, the composition of our four segments will also change to reflect the new structure beginning in the first quarter 2015.
29
PART II
RESULTS OF OPERATIONS—2014 vs. 2013
Sales from continuing operations grew 9% in 2014 from a combination of strong organic growth in many of our major businesses and acquisitions. Earnings from continuing operations increased in 2014, largely due to sales growth. Other items in 2013 and 2014 essentially offset.
Further details about our consolidated and segment results are discussed below.
Consolidated Results (continuing operations)
The following table shows the changes in sales and earnings from continuing operations during 2014, and identifies the major factors contributing to the changes.
|
(Dollar amounts in millions, except per share data)
|
Amount
|
%
|
||||
|
Net sales (continuing operations):
|
|
|
||||
|
Year ended December 31, 2013
|
$
|
3,477
|
|
|
||
|
Same location sales - primarily unit volume growth
|
189
|
|
6
|
%
|
||
|
Acquisition sales growth
|
116
|
|
3
|
%
|
||
|
Year ended December 31, 2014
|
$
|
3,782
|
|
9
|
%
|
|
|
Earnings from continuing operations:
|
|
|
||||
|
(Dollar amounts, net of tax)
|
|
|
||||
|
Year ended December 31, 2013
|
$
|
186
|
|
|
||
|
Non-recurrence of Commercial Vehicle Products impairment and related charges
|
45
|
|
|
|||
|
Non-recurrence of acquisition-related bargain purchase gain
|
(9
|
)
|
||||
|
Litigation accrual
|
(33
|
)
|
||||
|
Other factors, including benefit from higher sales
|
36
|
|
|
|||
|
Year ended December 31, 2014
|
$
|
225
|
|
|
||
|
Earnings Per Share (continuing operations)—2013
|
$
|
1.25
|
|
|
||
|
Earnings Per Share (continuing operations)—2014
|
$
|
1.55
|
|
|
||
Same location sales (from continuing operations) grew 6%, reflecting strong volume gains in Automotive and in most of the company's Residential Furnishings businesses. These improvements were partially offset by weak demand in Commercial Vehicle Products.
Sales growth in 2014 also benefited from the acquisition of Tempur Sealy's three innerspring component production facilities and other smaller acquisitions. In conjunction with the purchase of the facilities from Tempur Sealy, we expanded and extended our supply relationship and became the exclusive long-term provider in the U.S. and Canada of wire-based innersprings for Tempur Sealy and boxsprings for Sealy.
Earnings from continuing operations increased in 2014, with several items contributing to the year-over-year comparison. Operationally, earnings growth resulted primarily from higher sales, however this benefit was partially offset by higher stock compensation expense that resulted in large part from the significant increase in Leggett & Platt share price versus the market in late 2014. Reduced metal margins in our steel rod and wire operations and weather-related costs and inefficiencies early in the year also offset some of the earnings benefit from higher sales.
As indicated in the table above, a few additional items impacted the year-over-year earnings comparison. In 2013, earnings from continuing operations reflected non-cash impairment and other charges related to the goodwill and other intangible assets of our CVP business, and an acquisition-related bargain purchase gain. This gain related to the acquisition of an aerospace tubing business in the Industrial Materials segment, and is further discussed in the
30
PART II
segment comments on page 37. Earnings from continuing operations in 2014 were negatively impacted by litigation accruals, which primarily related to the foam antitrust cases discussed on page 28.
LIFO Impact
All of our segments use the first-in, first-out (FIFO) method for valuing inventory. In our consolidated financials, an adjustment is made at the corporate level (i.e., outside the segments) to convert about 50% of our inventories to the last-in, first-out (LIFO) method. These are primarily our domestic, steel-related inventories. Steel inflation in late 2013 resulted in full-year LIFO expense of $4 million. In 2014, steel costs were relatively stable and we ended the year with LIFO expense of $1 million.
For further discussion of inventories, see Note A to the Consolidated Financial Statements on page 74.
Interest and Income Taxes
Net interest expense in 2014 decreased slightly versus 2013.
Our 2014 worldwide effective income tax rate on continuing operations was 24%, compared to 22% for 2013. The 2014 tax rate benefited from $14 million of favorable adjustments, including additional Domestic Production Activities Deduction tax benefits for the current and prior years, incremental deferred foreign tax credits, and net favorable adjustments related to prior year tax return filings. The 2013 tax rate includes $17 million of favorable adjustments primarily related to the impact of Mexico tax law changes, the settlement of certain foreign and state tax audits, and a non-taxable bargain purchase gain.
31
PART II
Segment Results (continuing operations)
In the following section we discuss 2014 sales and EBIT (earnings before interest and taxes) from continuing operations for each of our segments. We provide additional detail about segment results and a reconciliation of segment EBIT to consolidated EBIT in Note F to the Consolidated Financial Statements on page 84. For further information about discontinued operations, see Note B to the Consolidated Financial Statements on page 77.
|
(Dollar amounts in millions)
|
2014
|
2013
|
Change in Sales
|
% Change
Same Location
Sales (1)
|
|
|||||||||||||||
|
$
|
%
|
|||||||||||||||||||
|
Sales (continuing operations)
|
|
|
|
|
|
|
||||||||||||||
|
Residential Furnishings
|
$
|
2,223
|
|
$
|
1,967
|
|
$
|
256
|
|
13
|
%
|
9
|
%
|
|
||||||
|
Commercial Fixturing & Components
|
199
|
|
187
|
|
12
|
|
7
|
%
|
7
|
%
|
|
|||||||||
|
Industrial Materials
|
865
|
|
844
|
|
21
|
|
3
|
%
|
(1
|
)%
|
|
|||||||||
|
Specialized Products
|
862
|
|
790
|
|
72
|
|
9
|
%
|
9
|
%
|
|
|||||||||
|
Total
|
4,149
|
|
3,788
|
|
361
|
|
|
|
|
|||||||||||
|
Intersegment sales elimination
|
(367
|
)
|
(311
|
)
|
(56
|
)
|
|
|
|
|||||||||||
|
External sales
|
$
|
3,782
|
|
$
|
3,477
|
|
$
|
305
|
|
9
|
%
|
6
|
%
|
|
||||||
|
|
2014
|
2013
|
Change in EBIT
|
EBIT Margins (2)
|
||||||||||||||||
|
$
|
%
|
2014
|
2013
|
|||||||||||||||||
|
EBIT (continuing operations)
|
|
|
|
|
|
|
||||||||||||||
|
Residential Furnishings
|
$
|
161
|
|
$
|
170
|
|
$
|
(9
|
)
|
(5
|
)%
|
7.3
|
%
|
8.6
|
%
|
|||||
|
Commercial Fixturing & Components
|
13
|
|
11
|
|
2
|
|
18
|
%
|
6.5
|
%
|
5.7
|
%
|
||||||||
|
Industrial Materials
|
56
|
|
71
|
|
(15
|
)
|
(21
|
)%
|
6.5
|
%
|
8.4
|
%
|
||||||||
|
Specialized Products
|
118
|
|
26
|
|
92
|
|
354
|
%
|
13.6
|
%
|
3.3
|
%
|
||||||||
|
Intersegment eliminations & other
|
(15
|
)
|
1
|
|
(16
|
)
|
|
|
|
|||||||||||
|
Change in LIFO reserve
|
(1
|
)
|
(4
|
)
|
3
|
|
|
|
|
|||||||||||
|
Total
|
$
|
332
|
|
$
|
275
|
|
$
|
57
|
|
21
|
%
|
8.8
|
%
|
7.9
|
%
|
|||||
______________________________
|
(1)
|
This is the change in sales not attributable to acquisitions or divestitures. These are sales that come from the same plants and facilities that we owned one year earlier.
|
|
(2)
|
Segment margins are calculated on total sales. Overall company margin is calculated on external sales.
|
Residential Furnishings
Residential Furnishings sales increased 13% in 2014, from unit volume growth in most product categories and acquisitions (including the purchase of the three Tempur Sealy innerspring production facilities). Volume grew in Bedding, Adjustable Bed, Home Furniture, Geo Components, Fabric Converting, and Carpet Underlay, from a combination of market share gains and broadly improving market demand in the second half of the year. Within our U.S. Spring business, we experienced significant growth in ComfortCore
®
(our pocketed coil innerspring), with unit volume in that product category up 52%. Mattress producers continue to integrate these higher-valued innersprings into more of their product lines, in many cases replacing lower-valued innersprings. Demand was also extremely strong in our Adjustable Bed business, with unit volume increasing 56% from a combination of new programs and strength in ongoing customer programs. In our Furniture Hardware business, unit volume increased 10% as consumer demand for reclining chairs and sofas continues to grow.
EBIT and EBIT margins decreased in 2014, with the benefit from higher sales more than offset by a $54 million accrual related to the foam litigation discussed on page 28, and higher stock compensation expense.
32
PART II
Commercial Fixturing & Components
Sales in Commercial Fixturing & Components increased 7% in 2014 due to market share gains and improved market demand in our Work Furniture business.
EBIT and EBIT margins improved slightly in 2014, with the benefit from higher sales partially offset by operational challenges with a Chinese joint venture.
Industrial Materials
Sales in the segment increased 3% in 2014, primarily from aerospace acquisitions completed in the prior year. Same location sales were down slightly from a combination of reduced trade sales from our rod mill and lower wire volume.
EBIT and EBIT margins declined versus 2013, primarily due to reduced metal margin in our steel rod and wire operations, and weather-related costs and inefficiencies early in 2014.
Specialized Products
In Specialized Products, sales increased 9% in 2014. Our Automotive business continued to experience strong growth, with sales up 17% from a combination of factors, including expanded component content (via upgraded features), participation in new vehicle platforms, and demand strength in each of the major markets. Partially offsetting this growth, CVP sales declined 21%, reflecting delayed vehicle replacement by major fleet operators and a change in an OEM incentive program. Machinery sales increased modestly for the year.
EBIT and EBIT margins increased due to higher sales and the non-recurrence of impairment and other charges (of $67 million) related to the goodwill and other intangible assets of our CVP business that were recognized in 2013.
Results from Discontinued Operations
Full year earnings from discontinued operations, net of tax, decreased to a loss of $124 million in 2014 (versus earnings of $13 million in 2013). This significant decline is primarily due to an impairment charge of $93 million related to the goodwill of the Store Fixtures business discussed on page 28, and foam litigation accruals of $22 million discussed on page 28. Weak capital spending by retailers in 2014 led to lower volume in the Store Fixtures business, and also contributed to reduced earnings. The divestiture of the majority of that business late in 2014 resulted in an additional loss of $5 million. Earnings in 2013 reflected an $8 million tax benefit attributable to another small operation.
33
PART II
RESULTS OF OPERATIONS—2013 vs. 2012
Sales from continuing operations grew modestly in 2013 from a combination of slightly higher unit volume and acquisitions, partially offset by lower trade sales from our rod mill (sales shifted from trade to intra-segment).
Earnings from continuing operations decreased in 2013 (versus 2012) as a result of impairment and other charges related to the goodwill and other intangible assets of our CVP business, and the non-recurrence of a significant tax benefit from 2012.
Further details about our consolidated and segment results are discussed below. Reported amounts for 2012 have been retrospectively adjusted to reflect only continuing operations.
Consolidated Results (continuing operations)
The following table shows the changes in sales and earnings from continuing operations during 2013, and identifies the major factors contributing to the changes.
|
(Dollar amounts in millions, except per share data)
|
Amount
|
%
|
||||
|
Net sales (continuing operations):
|
|
|
||||
|
Year ended December 31, 2012
|
$
|
3,415
|
|
|
||
|
Same location sales:
|
|
|
|
|
||
|
Lower steel mill trade sales
|
(33
|
)
|
(1
|
)%
|
||
|
Approximate unit volume increase
|
52
|
|
2
|
%
|
||
|
Same location sales increase
|
19
|
|
1
|
%
|
||
|
Acquisition sales growth
|
43
|
|
1
|
%
|
||
|
Year ended December 31, 2013
|
$
|
3,477
|
|
2
|
%
|
|
|
Earnings from continuing operations:
|
|
|
||||
|
(Dollar amounts, net of tax)
|
|
|
||||
|
Year ended December 31, 2012
|
$
|
232
|
|
|
||
|
CVP impairment and related charges
|
(45
|
)
|
|
|||
|
Non-recurrence of 2012 significant net tax benefit
|
(27
|
)
|
||||
|
Acquisition-related bargain purchase gain
|
9
|
|
||||
|
Lower effective tax rate
|
12
|
|
|
|||
|
Other factors, including higher sales and acquisition earnings largely offset by higher raw material costs
|
5
|
|
|
|||
|
Year ended December 31, 2013
|
$
|
186
|
|
|
||
|
Earnings Per Share (continuing operations)—2012
|
$
|
1.57
|
|
|
||
|
Earnings Per Share (continuing operations)—2013
|
$
|
1.25
|
|
|
||
Same location sales (from continuing operations) grew slightly, with 2% unit volume growth partially offset by a 1% revenue decline from lower trade sales at our rod mill. Sales grew primarily from market strength and new program awards in Automotive and raw material-related price increases in Carpet Underlay. These improvements were partially offset by declines in CVP and Adjustable Bed. The decrease in trade sales of steel rod during 2013 was offset by an increase in intra-segment rod sales, and the rod mill continued to operate at full capacity.
34
PART II
Earnings from continuing operations decreased as a result of non-cash impairment and other charges related to the goodwill and other intangible assets of our CVP business, and the non-recurrence of a significant tax benefit from 2012. Operationally, the earnings benefit from modest unit volume growth and acquisitions was largely offset by an increase in steel costs late in the year that resulted in higher LIFO expense. The other items detailed in the table above also contributed to the change in earnings.
2013 earnings from continuing operations also benefited $8 million ($5 million after tax) from gains on asset sales. These gains are primarily comprised of a $3 million gain related to a hurricane insurance claim, and $3 million for several different properties associated with the closing of various operations in prior years.
LIFO Impact
All of our segments use the first-in, first-out (FIFO) method for valuing inventory. In our consolidated financials, an adjustment is made at the corporate level (i.e., outside the segments) to convert about 50% of our inventories to the last-in, first-out (LIFO) method. These are primarily our domestic, steel-related inventories. In 2012, lower commodity costs led to a LIFO benefit of $13 million. Steel inflation in late 2013 resulted in a significant change in our full-year LIFO estimates (interim expectations for a full-year LIFO benefit of $12 million changed instead to a full year expense of $4 million as steel costs increased late in the year) and a concentration of LIFO expense in the fourth quarter.
For further discussion of inventories, see Note A to the Consolidated Financial Statements on page 74.
Interest and Income Taxes
Net interest expense in 2013 was flat with 2012.
The 2013 worldwide effective income tax rate on our continuing operations was 22%, compared to 19% for 2012. In both years the tax rate reflects necessary tax reserve reductions and other tax benefits that lowered the overall rate. The 2013 tax rate includes $17
million of favorable adjustments primarily related to the impact of Mexico tax law changes, the settlement of certain foreign and state tax audits, and a non-taxable bargain purchase gain. The impact of these items on the tax rate was magnified by our fourth quarter CVP impairment. In 2012, the tax rate benefited from the release of a $38 million valuation allowance on certain Canadian deferred tax assets, partially offset by the accrual of $11 million of China withholding taxes.
35
PART II
Segment Results (continuing operations)
In the following section we discuss 2013 sales and EBIT from continuing operations for each of our segments. We provide additional detail about segment results and a reconciliation of segment EBIT to consolidated EBIT in Note F to the Consolidated Financial Statements on page 84. Reported amounts for 2012 have been retrospectively adjusted to reflect only continuing operations. For further information about discontinued operations, see Note B to the Consolidated Financial Statements on page 77.
|
(Dollar amounts in millions)
|
2013
|
2012
|
Change in Sales
|
% Change
Same Location
Sales (1)
|
|
|||||||||||||||
|
$
|
%
|
|||||||||||||||||||
|
Sales (continuing operations)
|
|
|
|
|
|
|
||||||||||||||
|
Residential Furnishings
|
$
|
1,967
|
|
$
|
1,904
|
|
$
|
63
|
|
3
|
%
|
3
|
%
|
|
||||||
|
Commercial Fixturing & Components
|
187
|
|
191
|
|
(4
|
)
|
(2
|
)%
|
(2
|
)%
|
|
|||||||||
|
Industrial Materials
|
844
|
|
871
|
|
(27
|
)
|
(3
|
)%
|
(8
|
)%
|
|
|||||||||
|
Specialized Products
|
790
|
|
757
|
|
33
|
|
4
|
%
|
4
|
%
|
|
|||||||||
|
Total
|
3,788
|
|
3,723
|
|
65
|
|
|
|
|
|||||||||||
|
Intersegment sales elimination
|
(311
|
)
|
(308
|
)
|
(3
|
)
|
|
|
|
|||||||||||
|
External sales
|
$
|
3,477
|
|
$
|
3,415
|
|
$
|
62
|
|
2
|
%
|
1
|
%
|
|
||||||
|
|
2013
|
2012
|
Change in EBIT
|
EBIT Margins (2)
|
||||||||||||||||
|
$
|
%
|
2013
|
2012
|
|||||||||||||||||
|
EBIT (continuing operations)
|
|
|
|
|
|
|
||||||||||||||
|
Residential Furnishings
|
$
|
170
|
|
$
|
152
|
|
$
|
18
|
|
12
|
%
|
8.6
|
%
|
8.0
|
%
|
|||||
|
Commercial Fixturing & Components
|
11
|
|
15
|
|
(4
|
)
|
(27
|
)%
|
5.7
|
%
|
7.9
|
%
|
||||||||
|
Industrial Materials
|
71
|
|
65
|
|
6
|
|
9
|
%
|
8.4
|
%
|
7.5
|
%
|
||||||||
|
Specialized Products
|
26
|
|
86
|
|
(60
|
)
|
(70
|
)%
|
3.3
|
%
|
11.4
|
%
|
||||||||
|
Intersegment eliminations & other
|
1
|
|
(7
|
)
|
8
|
|
|
|
|
|||||||||||
|
Change in LIFO reserve
|
(4
|
)
|
13
|
|
(17
|
)
|
|
|
|
|||||||||||
|
Total
|
$
|
275
|
|
$
|
324
|
|
$
|
(49
|
)
|
(15
|
)%
|
7.9
|
%
|
9.5
|
%
|
|||||
______________________________
|
(1)
|
This is the change in sales not attributable to acquisitions or divestitures. These are sales that come from the same plants and facilities that we owned one year earlier.
|
|
(2)
|
Segment margins are calculated on total sales. Overall company margin is calculated on external sales.
|
Residential Furnishings
Residential Furnishings sales increased 3% in 2013 from unit volume growth in certain product categories and raw material-related price increases in Carpet Underlay. Volume grew primarily in European spring, seating components, sofa sleepers, and carpet underlay. These gains were partially offset by lower adjustable bed volume. Within our U.S. Spring business, we experienced unit volume growth in boxsprings and ComfortCore
®
(which is our pocketed coil innerspring), however total domestic innerspring units decreased modestly. Furniture hardware unit volume also decreased for the full year.
EBIT and EBIT margins increased in 2013, primarily due to higher sales, cost improvements, and favorable product mix in U.S. Spring.
36
PART II
Commercial Fixturing & Components
Sales in Commercial Fixturing & Components decreased 2% in 2013 due to lower demand in the office seating market which negatively impacted our Work Furniture business.
EBIT and EBIT margins decreased in 2013, primarily from lower sales, unfavorable product mix, and weak performance by our Chinese joint venture operation.
Industrial Materials
Sales in the segment decreased 3% in 2013, with revenue from acquisitions more than offset by lower trade sales from our rod mill and steel-related price deflation. The decrease in trade sales of steel rod during the year was more than offset by an increase in intra-segment rod sales, and the rod mill continued to operate at full capacity. A change in the mix of rod sales from trade to intra-segment is generally positive to earnings since that change tends to also shift the production mix to higher-value high carbon rods.
EBIT and EBIT margins improved versus 2012, primarily due to the absence of acquisition-related costs at Western Pneumatic Tube and earnings from acquisitions. These gains were partially offset by lower metal margins in steel rod in the second half of 2013.
We expanded our Aerospace Products business unit in 2013 with the acquisition of two companies. The first was a U.K.-based business acquired in May that extended our capability in aerospace tube fabrication. We recorded $6 million of goodwill related to this acquisition. The second was a French company acquired in July that added small diameter, high pressure seamless tubing to our product portfolio. This business was acquired at a price less than fair value of the net identifiable assets, and we recorded a $9 million non-taxable bargain purchase gain (reflected in the "Intersegment eliminations and other" line of the table above). The Aerospace Products business unit, which now has annual revenues in excess of $120 million, continues to perform very well and earnings should further benefit as we fully integrate these acquisitions.
Specialized Products
In Specialized Products, sales increased 4% in 2013, with growth in Automotive partially offset by a decline in Commercial Vehicle Products. Machinery sales grew modestly. Our Automotive business continued to experience strong growth from a combination of factors, including market strength in North America and Asia, participation in additional vehicle platforms, and expanded component content (via upgraded features).
EBIT decreased $60 million in 2013. We recognized impairment and other charges (of $67 million) related to the goodwill and other intangible assets of our CVP business, and this was partially offset by the positive impact from higher sales.
We continue to assess strategic alternatives for our CVP group, including possible divestiture of the business. Late in 2013, performance of the business deteriorated. As a result, it became apparent that current market values for certain CVP assets had fallen below recorded book values, and impairment charges related to the goodwill and other intangible assets were recognized. This decline in current market values of the assets resulted from lower expectations of future revenue and profitability, reflecting reduced market demand for the racks, shelving, and cabinets used in telecom, cable, and delivery vans.
Results from Discontinued Operations
Full year earnings from discontinued operations, net of tax, decreased to $13 million in 2013 from $19 million in 2012. Weak capital spending by retailers in 2013 led to lower volume in the Store Fixtures business, and contributed to lower earnings. Earnings in 2013 and 2012 also reflected $8 million and $6 million of tax benefits, respectively, attributable to a small operation. In addition, 2012 included a $2 million gain from a litigation settlement associated with a previously divested business.
37
PART II
LIQUIDITY AND CAPITALIZATION
Our operations provide most of the cash we require, and debt may also be used to fund a portion of our needs. Cash from operations was once again strong in 2014. For over 25 years, our operations have provided more than enough cash to fund both capital expenditures and dividend payments. We expect this to again be the case in 2015.
Capital expenditures increased in 2014, driven in part by investments to support strong growth in Automotive and U.S. Spring. We also completed five acquisitions, the largest of which included the three Tempur Sealy innerspring facilities, and bought back 5.4 million shares of our stock during the year. We ended 2014 with net debt to net capital at 31.5%, within our long-standing targeted range of 30-40%. The calculation of net debt as a percent of net capital is presented on page 44.
In November 2014, we issued $300 million of 3.8% notes and repaid $180 million of 4.65% notes that matured. We ended the year with all of our $600 million commercial paper program available.
Cash from Operations
Cash from operations is our primary source of funds. Earnings and changes in working capital levels are the two broad factors that generally have the greatest impact on our cash from operations.
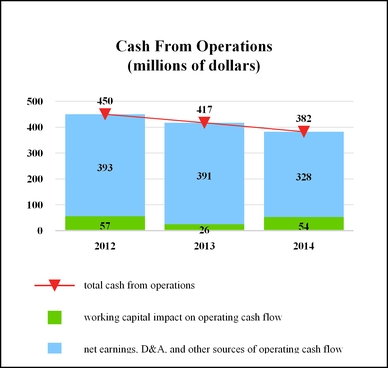
Cash from operations decreased in 2014 from a combination of factors. Net earnings declined primarily due to a goodwill impairment charge (which was a non-cash item) and increased litigation accruals. This decrease in earnings was partially offset by a net reduction in working capital that resulted from the increased litigation accruals (a significant portion of which was not paid in 2014), partially offset by higher accounts receivable associated with increased sales volume late in the year.
38
PART II
We continue to closely monitor our working capital levels, and ended 2014 with adjusted working capital at 7.9% of annualized sales from continuing operations
1
. The table below shows this non-GAAP calculation. We eliminate cash and current debt maturities from working capital to monitor our performance related to operating efficiency and believe this provides a more useful measurement. We also exclude working capital associated with discontinued operations to monitor operating performance of our ongoing businesses. The decrease in adjusted working capital as a percent of annualized sales reflects increased litigation accruals in late 2014.
|
(Dollar amounts in millions)
|
2014
|
2013
|
|||||
|
Current assets
|
$
|
1,430
|
|
$
|
1,282
|
|
|
|
Current liabilities
|
(992
|
)
|
(829
|
)
|
|||
|
Working capital
|
438
|
|
453
|
|
|||
|
Cash and cash equivalents
|
(333
|
)
|
(273
|
)
|
|||
|
Current debt maturities
|
202
|
|
181
|
|
|||
|
Less: Store Fixtures working capital
|
(5
|
)
|
(41
|
)
|
|||
|
Adjusted working capital
|
$
|
302
|
|
$
|
320
|
|
|
|
Annualized sales from continuing operations
1
|
$
|
3,812
|
|
$
|
3,436
|
|
|
|
Adjusted working capital as a percent of annualized sales
|
7.9
|
%
|
9.3
|
%
|
|||
|
Working capital as a percent of annualized sales
|
11.5
|
%
|
13.2
|
%
|
|||
___________________________________________
|
1.
|
Annualized sales from continuing operations equal 4th quarter sales from continuing operations ($953 million in 2014 and $859 million in 2013) multiplied by 4. We believe measuring our working capital against this sales metric is more useful, since efficient management of working capital includes adjusting those net asset levels to reflect current business volume.
|
The following table presents dollar amounts of key working capital components at the end of the past two years.
|
|
Amount (in millions)
|
||||||||||
|
|
2014
|
2013
|
Change
|
||||||||
|
Trade Receivables, net
|
$
|
470
|
|
$
|
435
|
|
$
|
35
|
|
||
|
Inventory, net
|
482
|
|
496
|
|
(14
|
)
|
|||||
|
Accounts Payable
|
370
|
|
339
|
|
31
|
|
|||||
Trade Receivables increased in 2014 from a combination of strong sales late in the year and acquisitions, partially offset by the divestiture of Store Fixtures.
Inventory decreased in 2014, as increases driven by sales growth and acquisitions were more than offset by the divestiture of Store Fixtures.
Accounts Payable also increased primarily due to the timing of raw material purchases, more favorable payment terms with vendors, and acquisitions, partially offset by the divestiture of Store Fixtures.
39
PART II
The next chart shows recent trends in key working capital components (expressed in numbers of days at the end of the past five quarters). These amounts have been retrospectively adjusted to reflect only continuing operations.
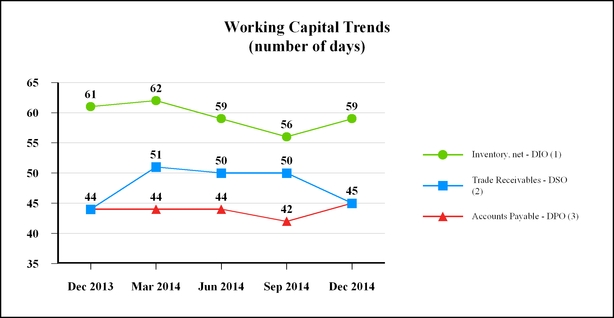
|
1.
|
The inventory ratio represents days of inventory on hand calculated as: ending net inventory ÷ (quarterly cost of goods sold ÷ number of days in the quarter).
|
|
2.
|
The trade receivables ratio represents the days of sales outstanding calculated as: ending net trade receivables ÷ (quarterly net sales ÷ number of days in the quarter).
|
|
3.
|
The accounts payable ratio represents the days of payables outstanding calculated as: ending accounts payable ÷ (quarterly cost of goods sold ÷ number of days in the quarter).
|
Changes in the quarterly Days Sales Outstanding (DSO) reflect normal seasonal fluctuations due to the timing of cash collection and other factors. Changes in the DSO reflected in the table above are consistent with our historical range, and are not indicative of changes in payment trends or credit-worthiness of customers. We experienced a slight increase in DSO during 2014 related to growth in businesses that typically have longer payment terms. However, over the last few years our DSO has generally decreased as a result of improved payment patterns of several large customers and other programs with incentives for early payment offered in conjunction with third parties. Payment trends by major customers remained stable in 2014, with slight improvements in full-year bad debt expense compared to 2013 levels.
Our Days Inventory on Hand (DIO) typically fluctuates within a reasonably narrow range as a result of differences in the timing of sales, production levels, and inventory purchases. Expense associated with slow moving and obsolete inventories in 2014 was generally in line with that of 2013.
We actively strive to optimize payment terms with our vendors, and we have also implemented various programs with our vendors and third parties that allow flexible payment options. As a result of these activities, we have increased our Days Payable Outstanding (DPO) by more than ten days over the past several years. We continue to optimize accounts payable levels, but the rate of incremental improvement has slowed.
40
PART II
Uses of Cash
Finance Capital Requirements
Cash is readily available to fund selective growth, both internally (through capital expenditures) and externally (through acquisitions).
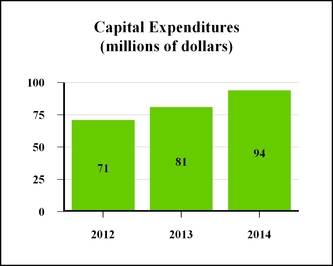
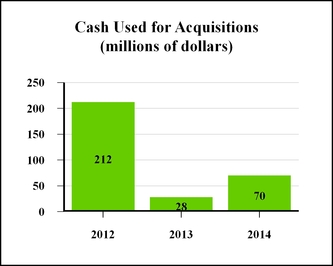
Capital expenditures include investments we make to maintain, modernize, and expand manufacturing capacity. We also invest to support new product introductions and specific product categories that are rapidly growing. The increase in capital expenditures during 2014 primarily related to continued global growth in Automotive, capacity additions to support growth of ComfortCore
®
innersprings (fabric encased coils), and process and quality improvements at our steel rod mill. In 2015, we expect capital expenditures to approximate $120 million as we continue to support growth and opportunities in these businesses. Our incentive plans emphasize returns on capital, which include net fixed assets and working capital. This emphasis heightens the focus on asset utilization and helps ensure that we are investing additional capital dollars where attractive return potential exists.
Our strategic, long-term, 4-5% annual growth objective envisions periodic acquisitions. We are seeking acquisitions primarily within our Grow businesses, and are looking for opportunities to enter new, higher growth markets (carefully screened for sustainable competitive advantage). In January 2012, we purchased Western Pneumatic Tube for $188 million. This acquisition aligns extremely well with our strategy to seek businesses with secure, leading positions in growing, profitable, attractive markets. Western established for us a strong competitive position in the higher return, higher growth aerospace market. In 2013, we acquired two smaller, complementary businesses in this aerospace tubing platform.
On July 1, 2014, we purchased the three Tempur Sealy U.S. innerspring component production facilities for $45 million. This additional volume should enhance our economies of scale, benefit from our vertical integration in steel rod and wire, and allow manufacturing optimization across a broad asset base. In 2014, we also acquired Kintec-Solution, a German designer and distributor of high-end, European-styled motion components for residential furniture.
Additional details about these and other smaller acquisitions can be found in Note R to the Consolidated Financial Statements on page 109.
41
PART II
Pay Dividends
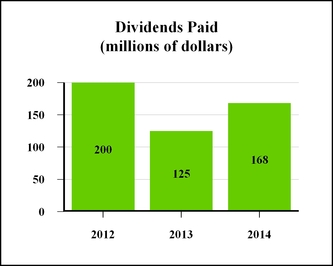
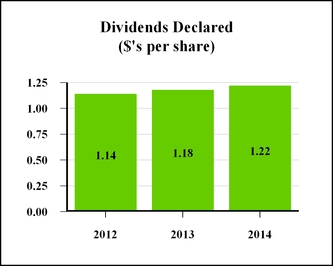
Dividends are one of the primary means by which we return cash to shareholders. During 2012, we declared four quarterly dividends, but paid five, given our decision to accelerate into December 2012 the dividend typically paid in January 2013 (of $41 million) in anticipation of tax rate increases on individual taxpayers. The chart above reflects that accelerated dividend payment. In 2013, we returned to our prior practice and paid the fourth quarter dividend in January 2014. Therefore, the cash requirement for dividends in 2013 was lower, at $125 million.
Maintaining and increasing the dividend remains a high priority. In 2014, we increased the quarterly dividend to $.31 per share and extended to 43 years our record of consecutive annual dividend increases, at an average compound growth rate of 13%. Our targeted dividend payout ratio is approximately 50-60% of net earnings. The actual payout ratio has been higher in recent years, but as earnings grow, we expect to move into that target range.
Repurchase Stock
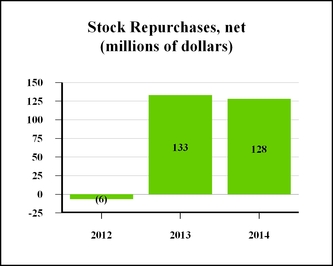
Stock repurchases are the other means by which we return cash to shareholders. As shown in the chart above, share repurchases were significant in 2013 and 2014. During those two years, we repurchased a total of 11.4 million shares of our stock and issued 7.1 million shares through employee benefit and stock purchase plans. Consistent with our stated plans to repurchase fewer shares in years when acquisition spending is higher, our share repurchases in 2012 were much lower, given the $188 million we invested to acquire Western Pneumatic Tube. In that year, our
42
PART II
outstanding shares increased as we repurchased 2.0 million shares and issued 4.7 million shares through employee programs. For the three years combined, we repurchased a total of 13.4 million shares of our stock and issued 11.8 million shares, reducing outstanding shares by 1.1%. In 2014, we repurchased 5.4 million shares (at an average of $33.76) and issued 3.9 million shares (at an average of $22.73). Issuances were largely related to employee stock option exercises.
Consistent with our stated priorities, we expect to use remaining operating cash (after funding capital expenditures, dividends, and acquisitions) to prudently buy back our stock, subject to the outlook for the economy, our level of cash generation, and potential opportunities to strategically grow the company. We have been authorized by the Board to repurchase up to 10 million shares each year, but we have established no specific repurchase commitment or timetable.
Capitalization
This table presents key debt and capitalization statistics at the end of the three most recent years.
|
(Dollar amounts in millions)
|
2014
|
2013
|
2012
|
||||||||
|
Long-term debt outstanding:
|
|
|
|
||||||||
|
Scheduled maturities
|
$
|
767
|
|
$
|
673
|
|
$
|
854
|
|
||
|
Average interest rates
(1)
|
4.6
|
%
|
4.6
|
%
|
4.7
|
%
|
|||||
|
Average maturities in years
(1)
|
6.4
|
|
4.7
|
|
4.9
|
|
|||||
|
Revolving credit/commercial paper
|
—
|
|
16
|
|
—
|
|
|||||
|
Average interest rate
|
—
|
|
.2
|
%
|
—
|
|
|||||
|
Total long-term debt
|
767
|
|
689
|
|
854
|
|
|||||
|
Deferred income taxes and other liabilities
|
226
|
|
191
|
|
228
|
|
|||||
|
Equity
|
1,155
|
|
1,399
|
|
1,442
|
|
|||||
|
Total capitalization
|
$
|
2,148
|
|
$
|
2,279
|
|
$
|
2,524
|
|
||
|
Unused committed credit:
|
|
|
|
||||||||
|
Long-term
|
$
|
600
|
|
$
|
584
|
|
$
|
600
|
|
||
|
Short-term
|
—
|
|
—
|
|
—
|
|
|||||
|
Total unused committed credit
|
$
|
600
|
|
$
|
584
|
|
$
|
600
|
|
||
|
Current maturities of long-term debt
|
$
|
202
|
|
$
|
181
|
|
$
|
202
|
|
||
|
Cash and cash equivalents
|
$
|
333
|
|
$
|
273
|
|
$
|
359
|
|
||
|
Ratio of earnings to fixed charges
(2)
|
6.0 x
|
|
4.8 x
|
|
5.8 x
|
|
|||||
___________________________________________
|
(1)
|
These rates include current maturities, but exclude commercial paper to reflect the averages of outstanding debt with scheduled maturities. The rates also include amortization of interest rate swaps.
|
|
(2)
|
Fixed charges include interest expense, capitalized interest, plus implied interest included in operating leases. Earnings consist principally of income from continuing operations before income taxes, plus fixed charges.
|
43
PART II
The next table shows the percent of long-term debt to total capitalization at December 31, 2014 and 2013, calculated in two ways:
|
•
|
Long-term debt to total capitalization as reported in the previous table.
|
|
•
|
Long-term debt to total capitalization each reduced by total cash and increased by current maturities of long-term debt.
|
We believe that adjusting this measure for cash and current maturities allows a more useful comparison to periods during which cash fluctuates significantly. We use these adjusted measures to monitor our financial leverage.
|
(Dollar amounts in millions)
|
2014
|
2013
|
|||||
|
Long-term debt
|
$
|
767
|
|
$
|
689
|
|
|
|
Current debt maturities
|
202
|
|
181
|
|
|||
|
Cash and cash equivalents
|
(333
|
)
|
(273
|
)
|
|||
|
Net debt
|
$
|
636
|
|
$
|
597
|
|
|
|
Total capitalization
|
$
|
2,148
|
|
$
|
2,279
|
|
|
|
Current debt maturities
|
202
|
|
181
|
|
|||
|
Cash and cash equivalents
|
(333
|
)
|
(273
|
)
|
|||
|
Net capitalization
|
$
|
2,017
|
|
$
|
2,187
|
|
|
|
Long-term debt to total capitalization
|
35.7
|
%
|
30.2
|
%
|
|||
|
Net debt to net capitalization
|
31.5
|
%
|
27.3
|
%
|
|||
Total debt (which includes long-term debt and current debt maturities) increased $99 million in 2014. In November, we issued $300 million aggregate principal of 10-year notes at a rate of 3.8% per year, and repaid $180 million of 4.65% notes that matured. We also repaid outstanding commercial paper.
In 2013, we repaid $200 million of 4.7% notes that matured. We funded the payoff with a combination of cash and commercial paper.
In August 2012, we issued $300 million of 10-year notes at a rate of 3.4% per year. As a part of this issuance, we also settled forward starting interest swaps and recognized a loss that will be amortized over the life of the notes. The fully weighted effective interest rate associated with these notes is 5.0%.
44
PART II
Short Term Borrowings
We can raise cash by issuing up to $600 million in commercial paper through a program that is backed by a $600 million revolving credit agreement with a syndicate of 12 lenders. This agreement expires in 2019. The credit agreement allows us to issue letters of credit totaling up to $250 million. When we issue letters of credit in this manner, our capacity under the agreement, and consequently, our ability to issue commercial paper, is reduced by a corresponding amount. Amounts outstanding related to our commercial paper program were:
|
(Dollar amounts in millions)
|
2014
|
2013
|
2012
|
||||||||
|
Total program authorized
|
$
|
600
|
|
$
|
600
|
|
$
|
600
|
|
||
|
Commercial paper outstanding (classified as long-term debt)
|
—
|
|
(16
|
)
|
—
|
|
|||||
|
Letters of credit issued under the credit agreement
|
—
|
|
—
|
|
—
|
|
|||||
|
Total program usage
|
—
|
|
(16
|
)
|
—
|
|
|||||
|
Total program available
|
$
|
600
|
|
$
|
584
|
|
$
|
600
|
|
||
The average and maximum amount of commercial paper outstanding during 2014 was $156 million and $300 million, respectively. During the fourth quarter, the average and maximum amounts outstanding were $61 million and $167 million respectively. At year end, we had no letters of credit outstanding under the credit agreement, but we had $69 million of stand-by letters of credit outside the agreement to take advantage of more attractive fee pricing.
In August 2015, we have $200 million of 5.0% notes that mature. With operating cash flows, our commercial paper program, and our ability to issue debt in the capital markets, we believe we have sufficient funds available to repay maturing debt, as well as support our ongoing operations, pay dividends, fund future growth, and repurchase stock.
Accessibility of Cash
At December 31, 2014, we had cash and cash equivalents of $333 million primarily invested in interest-bearing bank accounts and in bank time deposits with original maturities of three months or less.
A substantial portion of these funds are held in the international accounts of our foreign operations. Though we do not rely on this foreign cash as a source of funds to support our ongoing domestic liquidity needs, we believe we could bring most of this cash back to the U.S. over a period of two to three years without material cost. However, due to capital requirements in various jurisdictions, approximately $89 million of this cash is currently inaccessible for repatriation. Additionally, if we had to bring all of the foreign cash back immediately in the form of dividends, we would incur incremental tax expense of up to approximately $82 million. In 2014, 2013, and 2012, we brought back $129 million, $119 million, and $50 million (respectively) of cash, in each case at little to no added tax cost.
45
PART II
CONTRACTUAL OBLIGATIONS
The following table summarizes our future contractual cash obligations and commitments at December 31, 2014:
|
|
|
Payments Due by Period
|
|||||||||||||||||
|
Contractual Obligations
|
Total
|
Less
Than 1
Year
|
1-3
Years
|
3-5
Years
|
More
Than 5
Years
|
||||||||||||||
|
(Dollar amounts in millions)
|
|
|
|||||||||||||||||
|
Long-term debt ¹
|
$
|
963
|
|
$
|
201
|
|
$
|
4
|
|
$
|
152
|
|
$
|
606
|
|
||||
|
Capitalized leases
|
5
|
|
1
|
|
3
|
|
1
|
|
—
|
|
|||||||||
|
Operating leases
|
130
|
|
38
|
|
48
|
|
23
|
|
21
|
|
|||||||||
|
Purchase obligations ²
|
287
|
|
287
|
|
—
|
|
—
|
|
—
|
|
|||||||||
|
Interest payments ³
|
222
|
|
35
|
|
57
|
|
47
|
|
83
|
|
|||||||||
|
Deferred income taxes
|
42
|
|
—
|
|
—
|
|
—
|
|
42
|
|
|||||||||
|
Other obligations (including pensions and net reserves for tax contingencies)
4
|
194
|
|
4
|
|
37
|
|
15
|
|
138
|
|
|||||||||
|
Total contractual cash obligations
|
$
|
1,843
|
|
$
|
566
|
|
$
|
149
|
|
$
|
238
|
|
$
|
890
|
|
||||
_______________________________________________________________________________
|
1.
|
The long-term debt payment schedule presented above could be accelerated if we were not able to make the principal and interest payments when due.
|
|
2.
|
Purchase obligations primarily include open short-term (30-120 days) purchase orders that arise in the normal course of operating our facilities.
|
|
3.
|
Interest payments are calculated on debt outstanding at December 31, 2014 at rates in effect at the end of the year.
|
|
4.
|
Other obligations include our net reserves for tax contingencies in the "More Than 5 Years" column because these obligations are long-term in nature and actual payment dates can not be specifically determined. Other obligations also include our current estimate of minimum contributions to defined benefit pension plans.
|
46
PART II
CRITICAL ACCOUNTING POLICIES AND ESTIMATES
We prepare our consolidated financial statements in accordance with accounting principles generally accepted in the United States of America. To do so, we must make estimates and judgments that affect the reported amounts of assets, liabilities, revenues, expenses, and disclosures. If we used different estimates or judgments our financial statements would change, and some of those changes could be significant. Our estimates are frequently based upon historical experience and are considered by management, at the time they are made, to be reasonable and appropriate. Estimates are adjusted for actual events, as they occur.
“Critical accounting estimates” are those that are: a) subject to uncertainty and change, and b) of material impact to our financial statements. Listed below are the estimates and judgments which we believe could have the most significant effect on our financial statements.
We provide additional details regarding our significant accounting policies in Note A to the Consolidated Financial Statements on page 74.
|
Description
|
|
Judgments and
Uncertainties
|
|
Effect if Actual Results
Differ From Assumptions
|
|
Goodwill
|
|
|
|
|
|
Goodwill is assessed for impairment annually as of June 30 and as triggering events occur.
In July 2014, we concluded that an impairment was required related to the goodwill of the Store Fixtures group, which was formerly part of the Commercial Fixturing & Components segment and is now reported in discontinued operations. A non-cash charge of $108 million was recorded in the second quarter of 2014 for the complete write-off of the goodwill associated with this business.
In December 2013, we concluded that an impairment was required relating to the goodwill of the Commercial Vehicle Products (CVP) group. A non-cash charge of $63 million was recorded in the fourth quarter of 2013.
|
|
In order to assess goodwill for potential impairment, judgment is required to estimate the fair market value of each reporting unit (which is one level below reportable segments) using the combination of a discounted cash flow model and a market approach using price to earnings ratios for comparable publicly traded companies with characteristics similar to the reporting unit.
The cash flow model contains uncertainties related to the forecast of future results as many outside economic and competitive factors can influence future performance. Margins, sales growth, and discount rates are the most critical estimates in determining enterprise values using the cash flow model.
The market approach requires judgment to determine the appropriate price to earnings ratio. Ratios are derived from comparable publicly-traded companies that operate in the same or similar industry as the reporting unit.
|
|
The remaining goodwill associated with the CVP reporting unit is $13 million. A further decline in the long-term outlook for the business could result in future impairments.
At December 31, 2014, all reporting units have fair values that exceed carrying value by more than 40%, and have goodwill of $819 million. Information regarding material assumptions used to determine if a goodwill impairment exists can be found in Note C to the Consolidated Financial Statements on page 79. |
47
PART II
|
Description
|
|
Judgments and
Uncertainties
|
|
Effect if Actual Results
Differ From Assumptions
|
|
Other Long-lived Assets
|
|
|
|
|
|
Other long-lived assets are tested for recoverability at year-end and whenever events or circumstances indicate the carrying value may not be recoverable.
For other long-lived assets we estimate fair value at the lowest level where cash flows can be measured (usually at a branch level).
|
|
Impairments of other long-lived assets usually occur when major restructuring activities take place, or we decide to discontinue product lines completely.
Our impairment assessments have uncertainties because they require estimates of future cash flows to determine if undiscounted cash flows are sufficient to recover carrying values of these assets.
For assets where future cash flows are not expected to recover carrying value, fair value is estimated which requires an estimate of market value based upon asset appraisals for like assets.
|
|
These impairments are unpredictable. Impairments were $1 million in 2014, and $2 million in 2013 and 2012.
|
|
Inventory Reserves
|
|
|
|
|
|
We reduce the carrying value of inventories to reflect an estimate of net realizable value for obsolete and slow-moving inventory.
We value inventory at net realizable value (what we think we will recover.) Generally a reserve is not required unless we have more than a one-year's supply of the product. If we have had no sales of a given product for 12 months, those items are generally deemed to have no value and are written down completely.
|
|
Our inventory reserve contains uncertainties because the calculation requires management to make assumptions about the value of products that are obsolete or slow-moving (i.e. not selling very quickly).
Changes in customer behavior and requirements can cause inventory to quickly become obsolete or slow moving.
The calculation also uses an estimate of the ultimate recoverability of items identified as slow moving based upon historical experience (65% on average).
|
|
At December 31, 2014, the reserve for obsolete and slow-moving inventory was $30 million (approximately 6% of FIFO inventories). This is consistent with the December 31, 2013 and 2012 reserves of $36 million in each year, representing 6% of FIFO inventories.
Additions to inventory reserves in 2014 were $10 million, which were comparable to the previous year. We do not expect obsolescence to change from current levels.
|
48
PART II
|
Description
|
|
Judgments and
Uncertainties
|
|
Effect if Actual Results
Differ From Assumptions
|
|
Workers’ Compensation
|
|
|
|
|
|
We are substantially self-insured for costs related to workers’ compensation, and this requires us to estimate the liability associated with this obligation.
|
|
Our estimates of self-insured reserves contain uncertainties regarding the potential amounts we might have to pay (since we are self-insured). We consider a number of factors, including historical claim experience, demographic factors, and potential recoveries from third party insurance carriers.
|
|
Over the past five years, we have incurred, on average, $9 million annually for costs associated with workers’ compensation. Average year-to-year variation over the past five years has been approximately $1 million. At December 31, 2014, we had accrued $36 million to cover future self-insurance liabilities.
Internal safety statistics and cost trends have improved in the last several years and are expected to remain at current lower levels for the foreseeable future.
|
|
Credit Losses
|
|
|
|
|
|
For accounts and notes receivable, we estimate a bad debt reserve for the amount that will ultimately be uncollectible.
When we become aware of a specific customer’s potential inability to pay, we record a bad debt reserve for the amount we believe may not be collectible.
|
|
Our bad debt reserve contains uncertainties because it requires management to estimate the amount uncollectible based upon an evaluation of several factors such as the length of time that receivables are past due, the financial health of the customer, industry and macroeconomic considerations, and historical loss experience.
Our customers are diverse and many are small-to-medium sized companies, with some being highly leveraged. Bankruptcy can occur with some of these customers relatively quickly and with little warning.
|
|
A significant change in the financial status of a large customer could impact our estimates.
The average annual amount of customer-related bad debt expense was $5 million (less than 1% of annual net sales) over the last three years. At December 31, 2014, our reserves for doubtful accounts totaled $17 million (about 3% of our accounts and customer-related notes receivable of $488 million).
We have not experienced any significant individual customer bankruptcies in the past three years. We believe the financial health of our major customers has modestly improved, but some are highly leveraged, and this could cause circumstances to change in the future.
At December 31, 2014, we had $4 million of non-customer notes receivable, primarily related to divested businesses, and have recorded reserves of less than $1 million for these notes. Most of these notes are to be paid by highly leveraged entities, which could result in the need for additional reserves in the future.
|
49
PART II
|
Description
|
|
Judgments and
Uncertainties
|
|
Effect if Actual Results
Differ From Assumptions
|
|
Pension Accounting
|
|
|
|
|
|
For our pension plans, we must estimate the cost of benefits to be provided (well into the future) and the current value of those benefit obligations.
|
|
The pension liability calculation contains uncertainties because it requires management to estimate an appropriate discount rate to calculate the present value of future benefits paid, which also impacts current year pension expense.
Determination of pension expense requires an estimate of expected return on pension assets based upon the mix of investments held (bonds and equities).
Other assumptions include rates of compensation increases, withdrawal and mortality rates, and retirement ages. These estimates impact the pension expense or income we recognize and our reported benefit obligations. |
|
The discount rates used to calculate the pension liability for our most significant plans decreased approximately 80 basis points in 2014 due to lower corporate bond yields. Each 25 basis point decrease in the discount rate increases pension expense by $.6 million and increases the plans’ benefit obligation by $12 million.
The expected return on assets was 6.7% in 2014, and 6.6% in 2013 and 2012. A 25 basis point reduction in the expected return on assets would increase pension expense by $.6 million, but have no effect on the plans’ funded status. Assuming a long-term investment horizon, we do not expect a material change to the return on asset assumption.
Mortality assumptions represent our best estimate of the duration of future benefit payments at the measurement date. These estimates are based on each plans' demographics and other relevant facts and circumstances. Longer life expectancies increased our pension liability for our most significant plans by approximately $20 million in 2014.
|
50
PART II
|
Contingencies
|
|
|
|
|
|
We evaluate various legal, environmental, and other potential claims against us to determine if an accrual or disclosure of the contingency is appropriate. If it is probable that an ultimate loss will be incurred, we accrue a liability for the reasonable estimate of the ultimate loss.
|
Our disclosure and accrual of loss contingencies (i.e., losses that may or may not occur) contain uncertainties because they are based on our assessment of the likelihood that the expenses will actually occur, and our estimate of the likely cost. Our estimates and judgments are subjective and can involve matters in litigation, the results of which are generally unpredictable.
|
Legal contingencies are related to numerous lawsuits and claims described beginning on page 53. In the four years prior to 2014, the largest annual cost for litigation claims was $6 million (excluding legal fees).
We recorded expense during 2014 for various proceedings and other claims. By far the largest portion of these accruals was associated with a group of antitrust lawsuits related to alleged price fixing of prime foam and carpet underlay products as discussed in Note T to the Consolidated Financial Statements on page 113. In August 2014, we reached a tentative settlement in the U.S. direct purchaser class action cases by agreeing to pay an aggregate amount of $39.8 million, inclusive of attorneys' fees and costs. Because this accrual is partially attributable to our former Prime Foam Products business sold in 2007, $8.3 million is reflected in discontinued operations.
In addition to the above, we recorded litigation accruals in continuing operations of $22 million in the fourth quarter of 2014 which represents our reasonable estimate of unrecorded probable loss for all pending and threatened litigation proceedings impacting continuing operations. We also recorded an additional $27 million litigation contingency accrual in discontinued operations during the fourth quarter.
|
||
51
PART II
|
Description
|
|
Judgments and
Uncertainties
|
|
Effect if Actual Results
Differ From Assumptions
|
|
Income Taxes
|
|
|
|
|
|
In the ordinary course of business, we must make estimates of the tax treatment of many transactions, even though the ultimate tax outcome may remain uncertain for some time. These estimates become part of the annual income tax expense reported in our financial statements. Subsequent to year end, we finalize our tax analysis and file income tax returns. Tax authorities periodically audit these income tax returns and examine our tax filing positions, including (among other things) the timing and amounts of deductions, and the allocation of income among tax jurisdictions. If necessary, we adjust income tax expense in our financial statements in the periods in which the actual outcome becomes more certain.
|
|
Our tax liability for unrecognized tax benefits contains uncertainties because management is required to make assumptions and to apply judgment to estimate the exposures related to our various filing positions.
Our effective tax rate is also impacted by changes in tax laws, the current mix of earnings by taxing jurisdiction, and the results of current tax audits and assessments.
At December 31, 2014 and 2013, we had $34 million and $45 million, respectively, of net deferred tax assets on our balance sheet related to net operating losses and other tax carryforwards. The ultimate realization of these deferred tax assets is dependent upon the amount, source, and timing of future taxable income. Valuation allowances are established against future potential tax benefits to reflect the amounts we believe have no more than a 50% probability of being realized. In addition, assumptions have been made regarding the non-repatriation of earnings from certain subsidiaries. Those assumptions may change in the future, thereby affecting future period results for the tax impact of possible repatriation. |
|
Potential changes in tax laws could impact assumptions related to the non-repatriation of certain foreign earnings. If all non-repatriated earnings were taxed at current rates, we would incur additional taxes of approximately $82 million.
Audits by various taxing authorities continue as governments look for ways to raise additional revenue. Based upon past audit experience, we do not expect any material changes to our tax liability as a result of this audit activity; however, we could incur additional tax expense if we have audit adjustments higher than recent historical experience.
The likelihood of recovery of net operating losses and other tax carryforwards has been closely evaluated and is based upon such factors as the time remaining before expiration, viable tax planning strategies, and future taxable earnings expectations. We believe that appropriate valuation allowances have been recorded as necessary. However, if earnings expectations or other assumptions change such that additional valuation allowances are required, we could incur additional tax expense. Likewise, if fewer valuation allowances are needed, we could incur reduced tax expense. |
52
PART II
CONTINGENCIES
We are a party to various proceedings and matters involving employment, antitrust, intellectual property, environmental, taxation and other laws. When it is probable, in management’s judgment, that we may incur monetary damages or other costs resulting from these proceedings or other claims, and we can reasonably estimate the amounts, we record appropriate liabilities in the financial statements and make charges against earnings. For all periods presented, we have recorded no material charges against earnings other than as indicated below.
Foam Antitrust Lawsuits
We deny all allegations in all pending antitrust proceedings. We will vigorously defend ourselves in all proceedings and believe that we have valid bases to contest all claims. However, we have established an accrual for the estimated amount that we believe is necessary to resolve all antitrust matters. We also believe and expect, based on current facts and circumstances, that any reasonably possible losses incremental to the recorded accrual will not have a material impact on our consolidated financial position, results of operations or cash flows. For specific information regarding accruals please see “Accrual for Loss Contingencies” below.
Beginning in August 2010, a series of civil lawsuits was initiated in several U.S. federal courts and in Canada against several defendants alleging that competitors of our carpet underlay business unit and other manufacturers of polyurethane foam products had engaged in price fixing in violation of U.S. and Canadian antitrust laws.
U.S. Direct Purchaser Class Action Cases.
We were named as a defendant in three pending direct purchaser class action cases (the first on November 15, 2010) on behalf of a class of all direct purchasers of polyurethane foam products. The direct purchaser class action cases were all filed in or were transferred to the U.S. District Court for the Northern District of Ohio under the name
In re: Polyurethane Foam Antitrust Litigation
, Case No. 1:10-MD-2196.
The plaintiffs, on behalf of themselves and/or a class of direct purchasers, seek three times the amount of damages allegedly suffered as a result of alleged overcharges in the price of polyurethane foam products from at least 1999 to the present. Each plaintiff also seeks attorney fees, pre-judgment and post-judgment interest, court costs, and injunctive relief against future violations. We filed motions to dismiss the U.S. direct purchaser class actions in the consolidated case in Ohio, for failure to state a legally valid claim, which were denied by the Ohio Court. A motion for class certification was filed on behalf of the direct purchasers. A hearing on the motion was held and the Court certified the direct purchaser class. We filed a Petition for Permission to Appeal from Class Certification Order to the United States Court of Appeals for the Sixth Circuit which was denied. The Court ordered all parties to attend non-binding mediation with a mediator of their choosing.
Tentative Settlement of U.S. Direct Purchaser Class Action Cases.
We reached a tentative settlement in the U.S. direct purchaser class action cases on August 14, 2014, by agreeing to pay an aggregate amount of $39.8 million, inclusive of plaintiff attorneys' fees and costs. We continue to deny all allegations in the cases, but settled the direct purchaser class cases to avoid the risk, uncertainty, expense and distraction of litigation. The settlement is subject to Court approval. We recorded a $39.8 million (pre-tax) accrual for the settlement in the third quarter 2014. In the fourth quarter of 2014, we paid $4 million to the Court related to the tentative settlement. Since the accrual is partially attributable to our former Prime Foam Products business, which was sold in the first quarter of 2007, $8.3 million of expense is reflected in discontinued operations. The deadline for direct purchasers to exclude themselves from the litigation and settlement classes was January 26, 2015. A final fairness hearing was held on February 3, 2015, but we have not yet received a ruling.
U.S. Indirect Purchaser Class Action Cases.
We were named as a defendant in an indirect purchaser class consolidated amended complaint filed on March 21, 2011 and were subsequently sued in an indirect purchaser class action case filed on May 23, 2011, in the U.S. District Court for the Northern District of Ohio under the name
In re: Polyurethane Foam Antitrust Litigation
, Case No. 1:10-MD-2196. The plaintiffs, on behalf of themselves and/or a
53
PART II
class of indirect purchasers, bring damages claims under various states’ antitrust and consumer protection statutes, and are seeking three times an amount of damages allegedly suffered as a result of alleged overcharges in the price of polyurethane foam products from at least 1999 to the present. Each plaintiff also seeks attorney fees, pre-judgment and post-judgment interest, court costs, and injunctive relief against future violations. We filed motions to dismiss the indirect purchaser class action, for failure to state a legally valid claim. The Ohio Court denied the motions to dismiss. Discovery is substantially complete in this case. A motion for class certification was filed on behalf of the indirect purchasers. A hearing on the motion was held and the Court certified the indirect purchaser class. We filed a Petition for Permission to Appeal from Class Certification Order to the United States Court of Appeals for the Sixth Circuit, which was denied. On November 18, 2014, we filed a Petition for a Writ of Certiorari in the U.S. Supreme Court where it remains pending. The Ohio Court ordered all parties to attend non-binding mediation with a mediator of their choosing.
U.S. Individual Direct Purchaser Cases.
We have been named as a defendant in 35 individual direct purchaser cases filed between March 22, 2011 and October 16, 2013, which were filed in or transferred to the U.S. District Court for the Northern District of Ohio under the name
In re: Polyurethane Foam Antitrust Litigation
, Case No. 1:10-MD-2196. The claims in the individual direct purchaser cases are generally the same as those asserted in the direct purchaser class action case, with the exception of one case that also alleges an indirect purchaser claim. Additionally, several individual direct purchaser plaintiffs bring state claims under individual states’ consumer protection and/or antitrust statutes in addition to their federal claims. Once pretrial practice concludes, some of the individual direct purchaser cases are scheduled to be tried in the U.S. District Court for the Northern District of Ohio and others will be remanded back to the federal district courts where the cases were originally filed for trial.
Kansas Restraint of Trade Act Cases.
We have been named as a defendant in
two individual cases alleging direct and indirect purchaser claims under the Kansas Restraint of Trade Act, one filed on November 29, 2012 and the other on April 11, 2013. These two cases were filed in the U.S. District Court for the District of Kansas and then transferred to the U.S. District Court for the Northern District of Ohio under the name
In re: Polyurethane Foam Antitrust Litigation
, Case No. 1:10-MD-2196. The claims and allegations of these plaintiffs are generally the same as the other direct and indirect purchaser plaintiffs, with the exception that the Kansas plaintiffs seek full consideration damages (their total purchase amounts for the allegedly price-fixed polyurethane foam products). Once pretrial practice concludes, this case will be remanded back to the District of Kansas federal district court for trial.
Canadian Class Action Cases.
We were named in two Canadian class action cases (for direct and indirect purchasers of polyurethane foam products), both under the name
Hi Neighbor Floor Covering Co. Limited and Hickory Springs Manufacturing Company, et.al.
in the Ontario Superior Court of Justice (Windsor), Court File Nos. CV-10-15164 (amended November 2, 2011) and CV-11-17279 (issued December 30, 2011). In each of these Canadian cases, the plaintiffs, on behalf of themselves and/or a class of purchasers, seek from over 13 defendants restitution of the amount allegedly overcharged, general and special damages in the amount of $100 million, punitive damages of $10 million, pre-judgment and post-judgment interest, and the costs of the investigation and the action. The first issued class action is on behalf of a class of purchasers of polyurethane foam. The second issued class action is on behalf of purchasers of carpet underlay. We are not yet required to file our defenses in these or any other Canadian actions. In addition, on July 10, 2012, plaintiff in a class action case (for direct and indirect purchasers of polyurethane foam products) styled
Option Consommateurs and Karine Robillard v. Produits Vitafoam Canada Limitée, et. al.
in the Quebec Superior Court of Justice (Montréal), Court File No. 500-6-524-104, filed an amended motion for authorization seeking to add us and other manufacturers of polyurethane foam products as defendants in this case, which was granted. This action has a pending motion for certification, which has been postponed indefinitely. We also were notified in June 2014 of two motions to add us as parties to two class proceedings in British Columbia. Those proceedings are similar to the Ontario proceedings in that one proposes a class of purchasers of polyurethane foam (
Majestic Mattress Mfg. Ltd. v. Vitafoam Products et al
., No. VLC-S-S-106362 Vancouver Registry) and one proposes a class of purchasers of carpet underlay (
Trillium Project Management Ltd. v. Hickory Springs Manufacturing Company et al
., No.S106213 Vancouver Registry). The motion to add us as parties to these actions has been scheduled to be heard with the motions for certification in the two actions in April 2015. The British Columbia actions involve British Columbia purchasers only whereas the Ontario
54
PART II
actions propose classes of Canadian purchasers. No certification motions will be brought in the Ontario actions until after the British Columbia motions for certification have been determined.
Missouri Class Action Case.
On June 22, 2012, we were made a party to a lawsuit brought in the 16
th
Judicial Circuit Court, Jackson County, Missouri, Case Number 1216-CV15179 under the caption “
Dennis Baker, on Behalf of Himself and all Others Similarly Situated vs. Leggett & Platt, Incorporated.
” The plaintiff, on behalf of himself and/or a class of indirect purchasers of polyurethane foam products in the State of Missouri, alleged that we violated the Missouri Merchandising Practices Act based upon our alleged illegal price inflation of flexible polyurethane foam products. The plaintiff seeks unspecified actual damages, punitive damages and the recovery of reasonable attorney fees. We filed a motion to dismiss this action, which was denied. Discovery has commenced and plaintiff has filed a motion for class certification. A hearing on the motion was held but we have yet to receive any ruling.
Brazilian Value-Added Tax Matters
We deny all of the allegations in all of the below Brazilian actions. We believe that we have valid bases upon which to contest such actions and will vigorously defend ourselves. However, these contingencies are subject to many uncertainties, and based on current facts and circumstances, we believe that it is reasonably possible (but not probable) that we may incur losses with respect to these assessments. Therefore, no accrual has been recorded for Brazilian VAT matters.
Brazilian Federal Cases.
On December 22, 2011, the Brazilian Finance Ministry, Federal Revenue Office issued a notice of violation against our wholly-owned subsidiary, Leggett & Platt do Brasil Ltda. (“L&P Brazil”) in the amount of $2.7 million, under Case No. 10855.724660/2011-43. The Brazilian Revenue Office claimed that for the period beginning November 2006 and continuing through December 2007, L&P Brazil used an incorrect tariff code for the collection and payment of value-added tax primarily on the sale of mattress innerspring units in Brazil. L&P Brazil responded to the notice of violation denying the violation. The Federal Revenue Office denied L&P Brazil’s defenses and upheld the assessment at the first administrative level. L&P Brazil has filed an appeal.
On December 29, 2011, L&P received another assessment in the amount of $.1 million, under case No. 10855.724509/2011-13 on the same subject matter in connection to certain import transactions carried out between 2007 and 2011. L&P has filed its defense.
On December 17, 2012, the Brazilian Revenue Office issued an additional notice of violation in the amount of $4.7 million under MPF Case No. 10855.725260/2012-36 covering the period from January 1, 2008 through December 31, 2010 on the same subject matter. L&P Brazil responded to the notice of violation denying the violation. The Brazilian Revenue Office denied L&P Brazil's defenses and upheld the assessment at the first administrative level. L&P Brazil has appealed this decision, but the appeal was denied by the second administrative level on January 27, 2015.
In addition, L&P Brazil received assessments on December 22, 2011, and June 26, July 2 and November 5, 2012, and September 13, 2013 from the Brazilian Federal Revenue Office where the Revenue Office challenged L&P Brazil’s use of certain tax credits in the years 2005 through 2010. Such credits are generated based upon the tariff classification and rate used by L&P Brazil for value-added tax on the sale of mattress innersprings. On September 4, 2014, the tax authorities issued five additional assessments regarding this same issue (use of credits), covering certain periods of 2011 and 2012. L&P Brazil has filed its defense to all of these assessments. Combined with the prior assessments, L&P Brazil has received assessments totaling $3.1 million on the same or similar denial of tax credit matters.
On February 1, 2013, the Brazilian Finance Ministry filed a Tax Collection action against L&P Brazil in the Camanducaia Judicial District Court, Case No. 0002222-35.2013.8.13.0878, alleging the untimely payment of $.2 million of social contributions (social security and social assistance payments) for the period September to October 2010. L&P Brazil filed its response, a Motion to Stay of Execution. L&P Brazil argued the payments were not required to be made because of the application of certain tax credits that were generated by L&P Brazil's use of a
55
PART II
correct tariff code for the classification of value-added tax on the sale of mattress innersprings (i.e., the same underlying issue at stake in the other Brazilian matters).
On June 26, 2014, the Brazilian Revenue Office issued a new notice of violation against L&P Brazil in the amount of $.9 million, under Case No. 10660.721523/2014-87, covering the period from 2011 through 2012 on the same subject matter. L&P Brazil has filed its defense denying the assessments.
On July 1, 2014, the Brazilian Finance Ministry rendered a preliminary decision to reject certain offsetting requests presented by L&P Brazil, which originated with Administrative Proceeding No. 10660.720850/2014-11. The Brazilian Finance Ministry alleges that L&P Brazil improperly offset $.1 million of social contributions otherwise due in 2011. L&P Brazil filed its response denying the allegations. L&P Brazil is defending on the basis that the social contribution debts were correctly offset with certain tax credits that were generated by L&P Brazil's use of a correct tariff code classification for value-added tax on the sale of mattress innersprings (i.e., the same underlying issue at stake in the other Federal Brazilian matters).
On September 4, 2014, the Brazilian Federal Revenue issued an assessment against L&P Brazil in the amount of $.2 million, for the period of April 2011 through June 2012, as a penalty for L&P Brazil’s requests to offset certain tax credits. We have filed our defense.
State of São Paulo, Brazil Cases.
L&P Brazil is party to a proceeding involving the State of São Paulo, Brazil where the State of São Paulo, on April 16, 2009, issued a Notice of Tax Assessment and Imposition of Fine to L&P Brazil seeking $2.1 million for the tax years 2006 and 2007, under Case No. 3.111.006 (DRT n°.04-256.169/2009). The State of São Paulo argued that L&P Brazil was using an incorrect tariff code for the collection and payment of value-added tax on sales of mattress innerspring units in the State of São Paulo. The Court of Tax and Fees of the State of São Paulo ruled in favor of L&P Brazil nullifying the tax assessment. The State filed a special appeal and the Special Appeals court remanded the case back to the Court of Tax and Fees for further findings. The Court of Tax and Fees again ruled in favor of L&P Brazil and nullified the tax assessment. The State filed another special appeal. On April 17, 2014, the Court of Tax and Fees ruled in the State's favor upholding the original assessment of $2.1 million. On July 31, 2014, L&P Brazil filed an annulment action, Case No. 101712346.2014.8260602 in the Sorocaba State Court, seeking to have the Court of Tax and Fees ruling annulled for an updated assessment amount of $4.2 million. On December 3, 2014, the State of São Paulo filed a Tax Collection action against L&P Brazil in Sorocaba Judicial District Court, Case No. 1501115-34.2014.8.26.0602, seeking to collect the same amounts at issue in annulment action No. 101712346.2014.8260602. The original assessment amount of $4.2 million was increased by 10% to include attorneys' fees.
On October 4, 2012, the State of São Paulo issued a Tax Assessment under Procedure Number 4.003.484 against L&P Brazil in the amount of $1.7 million for the tax years 2009 through 2011. Similar to the 2009 assessment, the State of São Paulo argues that L&P Brazil was using an incorrect tax rate for the collection and payment of value-added tax on sales of mattress innerspring units in the State of São Paulo. On June 21, 2013, the State of São Paulo's attorneys converted the Tax Assessment No. 4.003.484 to a tax collection action against L&P Brazil in the amount of $2.2 million, under Sorocaba Judicial District Court, Case No. 3005528-50.2013.8.26.0602. L&P Brazil filed its response, a Motion to Stay of Execution denying the allegations.
L&P Brazil also received a Notice of Tax Assessment and Imposition of a Fine from the State of São Paulo dated March 27, 2014, under Procedure Number 4.038.746-0 against L&P Brazil in the amount of $1.1 million for the tax years January 2011 through August 2012 regarding the same subject matter. L&P filed its response denying the allegations. The first administrative level denied L&P Brazil’s defense and upheld the assessment. L&P Brazil filed its appeal of this decision.
State of Minas Gerais, Brazil Cases.
On December 18, 2012, the State of Minas Gerais, Brazil issued a tax assessment to L&P Brazil relating to L&P Brazil's classifications of innersprings for the collection and payment of value-added tax on the sale of mattress innersprings in Minas Gerais from March 1, 2008 through August 31, 2012 in the amount of $.5 million, under PTA Case No. 01.000.182756-62. L&P Brazil filed its response denying any violation. The first administrative level ruled against us but did reduce the tax to $.3 million (plus interest and
56
PART II
penalties). We appealed to the second administrative level, which affirmed the first administrative level ruling. The case will now proceed judicially under Case No. 0003673-61.2014.8.13.0878 in Camanducaia Judicial District Court for the updated amount of $.5 million. L&P Brazil filed its response, a Motion to Stay of Execution, on June 5, 2014.
Patent Infringement Claim
At this time, we do not expect that the outcome of this matter will have a material adverse effect on our consolidated financial condition, results of operations or cash flows.
First Lawsuit.
On January 24, 2012, in a case in the United States District Court for the Central District of California, the jury entered a verdict against us in the amount of $5 million based upon an allegation by plaintiff that we infringed three patents on an automatic stapling machine and on methods used to assemble boxsprings. This action was originally filed on October 4, 2010, as case number CV10-7416 RGK (SSx) under the caption Imaginal Systematic, LLC v. Leggett & Platt, Incorporated; Simmons Bedding Company; and Does 1 through 10, inclusive. Leggett is contractually obligated to defend and indemnify Simmons Bedding Company against a claim for infringement.
On summary judgment motions, we unsuccessfully disputed each patent’s validity and denied that we infringed any patent. At the jury trial on damages issues, the plaintiff alleged damages of $16.2 million. The court denied plaintiff’s attempt to win an attorney fee award and triple the pre-verdict damages. We appealed the case to the Federal Circuit Court of Appeals. Oral argument was held before a three judge appeal panel in the Federal Circuit in Washington D.C. The Court of Appeals issued a judgment affirming the $5 million verdict against us, which was fully accrued for in the first quarter of 2013 and then paid in the second quarter of 2013. We filed a petition for a rehearing of the Court of Appeals decision which was denied.
The plaintiff requested royalties for post-verdict use of the machines, and requested pre-judgment interest in the amount of $.7 million. The District Court ruled that the plaintiff was not entitled to additional ongoing royalties for our continued use of the machines, but did award pre-judgment interest of $.5 million. Both parties filed a notice of appeal of this order to the Federal Circuit Court of Appeals, but plaintiff has since withdrawn its appeal.
We also filed reexamination proceedings in the Patent Office (Case Nos. 95/001,543 filed February 11, 2011; 95/001,546 and 95/001,547 filed February 16, 2011), challenging the validity of each patent at issue in the lawsuit the plaintiff brought. The Patent Office examiner ruled in our favor on the key claims of one of the three patents. The Patent Office examiner initially ruled in our favor on the pertinent claims of the second of the patents, but subsequently reversed that decision. With respect to the third patent, the Patent Office examiner's decision upheld the validity of all claims. All three of these proceedings were appealed to the Board of Patent Appeals. The plaintiff filed petitions to terminate all re-examination proceedings based on the final ruling of the Federal Circuit Court of Appeals. We opposed those petitions. The Patent Office terminated all three re-examination proceedings, and we requested an ex parte reexamination as to one of the patents. The Patent Office did not accept our request.
Second Lawsuit.
On July 29, 2013, the plaintiff filed a second lawsuit in the United States District Court for the Central District of California, Case No. CV13-05463 alleging that we and Simmons Bedding Company have continued to infringe the three patents on an automatic stapling machine and the methods used to assemble boxsprings, and that the plaintiff is entitled to additional damages from January 24, 2012 forward. Leggett and Simmons Bedding Company filed their answers, and the Court granted summary judgment finding that the use of an earlier version of the automatic stapling machines constituted infringement, but also finding that use of a redesigned version of the machine does not infringe any Imaginal patent. On October 17, 2014, the parties entered into a Confidential Settlement Agreement and Limited Release, whereby Leggett agreed to pay Imaginal a cash payment, which is not material to the Company, to settle the part of the case concerning the machines found to infringe. Imaginal is appealing the summary judgment ruling that the redesigned stapling machines do not infringe to the U.S. Court of Appeals for the Federal Circuit. The appeal is currently pending.
57
PART II
Accrual for Loss Contingencies
Although the Company denies liability in all threatened or pending litigation proceedings in which it is or may be a party and believes that it has valid bases to contest all claims threatened or made against it, we recorded, in addition to previously recognized unpaid accruals disclosed above, an additional aggregate (pre-tax) litigation accrual in continuing operations of $22 million in the fourth quarter of 2014 which represents our reasonable estimate of unrecorded probable loss for all pending and threatened litigation proceedings impacting continuing operations. We expect to make most of these cash payments in 2015 with the remainder expected to be paid in 2016. We have relied on several facts and circumstances that have changed since the filing of our last periodic report, most significantly in January 2015, to conclude that some loss is probable with respect to certain proceedings and matters, to arrive at a reasonable estimate of loss and record the accrual, including: the maturation of the pending proceedings and matters; our experience in settlement negotiations and mediation; comparative settlements of other companies in similar proceedings; discovery becoming substantially complete in certain proceedings; certain quantitative metrics used to value probable loss contingencies; and our willingness to settle certain proceedings to forgo the cost and risk of litigation and distraction to our senior executives. We also recorded an additional $27 million litigation contingency accrual in discontinued operations in the fourth quarter based upon the same facts, circumstances and analysis as described above. We expect to make most of these cash payments in 2015 with the remainder expected to be paid in 2016. By far the largest portion of the accruals is for the foam antitrust proceedings.
Although there are a number of uncertainties and potential outcomes associated with all of our pending or threatened litigation proceedings, we believe, based on current facts and circumstances, that additional reasonably possible losses (other than those Brazilian VAT matters quantified and disclosed above), are not expected to materially affect our consolidated financial position, results of operations or cash flows.
For more information regarding discontinued operations, please refer to Note B on page 77 of our Notes to Consolidated Financial Statements.
NEW ACCOUNTING STANDARDS
As discussed in Note A to the Consolidated Financial Statements on page 77, the FASB has issued accounting guidance effective for current and future periods. We are currently evaluating the newly issued guidance and the impact on our future financial statements.
58
PART II
(
Unaudited)
(Dollar amounts in millions)
Interest Rates
The table below provides information about the Company’s debt obligations sensitive to changes in interest rates. Substantially all of the debt shown in the table below is denominated in United States dollars. The fair value of fixed rate debt was not materially different than its $950 carrying value at December 31, 2014, and less than its $830 carrying value by $3.2 at December 31, 2013. The increase in the fair market value of the Company’s debt is primarily due to the issuance of $300 of notes in 2014 (offset by $180 note maturing), the increase in credit spreads as compared to the prior year end, increased interest rates, and the timing of interest payments. The fair value of fixed rate debt was calculated using a Bloomberg secondary market rate, as of December 31, 2014 for similar remaining maturities, plus an estimated “spread” over such Treasury securities representing the Company’s interest costs for its medium-term notes. The fair value of variable rate debt is not significantly different from its recorded amount.
|
|
Scheduled Maturity Date
|
|
|
||||||||||||||||||||||||||||
|
Long-term debt as of December 31,
|
2015
|
2016
|
2017
|
2018
|
2019
|
Thereafter
|
2014
|
2013
|
|||||||||||||||||||||||
|
Principal fixed rate debt
|
$
|
200.0
|
|
$
|
—
|
|
$
|
—
|
|
$
|
150.0
|
|
$
|
—
|
|
$
|
600.0
|
|
$
|
950.0
|
|
$
|
830.0
|
|
|||||||
|
Average interest rate
1
|
5.00
|
%
|
—
|
|
—
|
|
4.40
|
%
|
—
|
|
3.60
|
%
|
4.02
|
%
|
4.24
|
%
|
|||||||||||||||
|
Principal variable rate debt
|
—
|
|
2.3
|
|
2.3
|
|
2.4
|
|
—
|
|
7.8
|
|
14.7
|
|
19.9
|
|
|||||||||||||||
|
Average interest rate
|
—
|
|
.22
|
%
|
.17
|
%
|
.17
|
%
|
—
|
|
.17
|
%
|
.18
|
%
|
.24
|
%
|
|||||||||||||||
|
Miscellaneous debt
2
|
|
|
|
|
|
|
3.7
|
|
19.6
|
|
|||||||||||||||||||||
|
Total debt
|
|
|
|
|
|
|
968.4
|
|
869.5
|
|
|||||||||||||||||||||
|
Less: current maturities
|
|
|
|
|
|
|
(201.7
|
)
|
(181.1
|
)
|
|||||||||||||||||||||
|
Total long-term debt
|
|
|
|
|
|
|
$
|
766.7
|
|
$
|
688.4
|
|
|||||||||||||||||||
_______________________________________________________________________________
|
1.
|
These rates exclude the amortization of interest rate swap.
|
|
2.
|
Includes $0 and $16 of commercial paper in 2014 and 2013, respectively, supported by a $600 revolving credit agreement which terminates in 2019.
|
Derivative Financial Instruments
The Company is subject to market and financial risks related to interest rates, foreign currency, and commodities. In the normal course of business, the Company utilizes derivative instruments (individually or in combinations) to reduce or eliminate these risks. The Company seeks to use derivative contracts that qualify for hedge accounting treatment; however, some instruments may not qualify for hedge accounting treatment. It is the Company’s policy not to speculate using derivative instruments. Information regarding cash flow hedges and fair value hedges is provided in Note S on page 111 to the Notes to the Consolidated Financial Statements and is incorporated by reference into this section.
Investment in Foreign Subsidiaries
The Company views its investment in foreign subsidiaries as a long-term commitment, and does not hedge translation exposures. The investment in a foreign subsidiary may take the form of either permanent capital or notes. The Company’s net investment (i.e., total assets less total liabilities subject to translation exposure) in foreign subsidiaries at December 31 is as follows:
59
PART II
|
Functional Currency
|
2014
|
2013
|
||||||
|
European Currencies
|
$
|
329.4
|
|
$
|
374.2
|
|
||
|
Chinese Renminbi
|
286.6
|
|
257.6
|
|
||||
|
Canadian Dollar
|
192.7
|
|
240.2
|
|
||||
|
Mexican Peso
|
29.2
|
|
34.6
|
|
||||
|
Other
|
55.8
|
|
51.1
|
|
||||
|
Total
|
$
|
893.7
|
|
$
|
957.7
|
|
||
The Consolidated Financial Statements and Notes, Financial Statement Schedule and supplementary financial information included in this Report are listed and included in Item 15, and are incorporated by reference into this item.
Not applicable.
Effectiveness of the Company’s Disclosure Controls and Procedures
An evaluation as of December 31, 2014, was carried out by the Company’s management, with the participation of the Company’s Chief Executive Officer and Chief Financial Officer, of the effectiveness of the Company’s disclosure controls and procedures (as defined in Rule 13a-15(e) under the Securities Exchange Act of 1934, as amended (the “Exchange Act”)). Based upon this evaluation, the Chief Executive Officer and Chief Financial Officer have concluded the Company’s disclosure controls and procedures were effective, as of December 31, 2014, to provide assurance that information required to be disclosed by the Company in the reports that it files or submits under the Exchange Act is recorded, processed, summarized, and reported, within the time periods specified by the Securities and Exchange Commission’s rules and forms. Disclosure controls and procedures, include without limitation, controls and procedures designed to ensure that information required to be disclosed by the Company in the reports that it files or submits under the Exchange Act is accumulated and communicated to the Company’s management, including its Chief Executive Officer and Chief Financial Officer, or persons performing similar functions, as appropriate to allow timely decisions regarding required disclosure.
Management’s Annual Report on Internal Control over Financial Reporting and Auditor’s Attestation Report
Management’s Annual Report on Internal Control over Financial Reporting can be found on page 67, and the Report of Independent Registered Public Accounting Firm regarding the effectiveness of the Company’s internal control over financial reporting can be found on page 68 of this Form 10-K. Each is incorporated by reference into this Item 9A.
60
Changes in the Company’s Internal Control Over Financial Reporting
There were no changes in the Company’s internal control over financial reporting (as such term is defined in Exchange Act Rule 13a-15(f)) that occurred during the quarter ended December 31, 2014 that have materially affected, or are reasonably likely to materially affect, the Company’s internal control over financial reporting.
None.
61
PART III
PART III
The subsections entitled “Proposal 1—Election of Directors,” “Corporate Governance,” “Board and Committee Composition and Meetings,” “Consideration of Director Nominees and Diversity,” “Section 16(a) Beneficial Ownership Reporting Compliance” and “Director Independence” in the Company’s definitive Proxy Statement for the Company’s Annual Meeting of Shareholders to be held on May 5, 2015, are incorporated by reference.
Directors of the Company
Directors are normally elected annually at the Annual Meeting of Shareholders and hold office until the next annual meeting of shareholders or until their successors are elected and qualified. Except for Ralph W. Clark, all current directors have been nominated for re-election at the Company’s Annual Meeting of Shareholders to be held May 5, 2015.
In order to be nominated for election as a director, a nominee must submit a contingent resignation to the Nominating & Corporate Governance Committee (N&CG Committee). The resignation will become effective only if (i) the director nominee fails to receive an affirmative majority of the votes cast in the director election; and (ii) the Board accepts the resignation. If a nominee fails to receive an affirmative majority of the votes cast in the director election, the N&CG Committee will make a recommendation to the Board of Directors whether to accept or reject the director’s resignation and whether any other action should be taken. If a director’s resignation is not accepted, that director will continue to serve until the Company’s next annual meeting or until his or her successor is duly elected and qualified. If the Board accepts the director’s resignation, it may, in its sole discretion, either fill the resulting vacancy or decrease the size of the Board to eliminate the vacancy.
The Company’s Bylaws and Corporate Governance Guidelines set the director retirement age at 72; however, the Board Chair, CEO or President may request a waiver for any director. At the request of Leggett’s CEO, the N&CG Committee recommended, and the full Board granted, retirement age waivers for Directors Enloe and Fisher so they may stand for re-election at the 2015 annual meeting.
Brief biographies of the Company’s Board of Directors are provided below. Our employment agreement with Mr. Haffner provides that he may terminate the agreement if not nominated as a director and appointed to the Board's executive committee. Employment agreements with Mr. Glassman and Mr. Flanigan provide that they may terminate their agreements if not nominated as a director. See the Exhibit Index on page 123 for reference to the agreements.
Robert E. Brunner,
age 57, was the Executive Vice President of Illinois Tool Works (ITW), a diversified manufacturer of advanced industrial technology, from 2006 until his retirement in 2012. He previously served ITW as President—Global Auto beginning in 2005 and President—North American Auto from 2003. Mr. Brunner holds a degree in finance from the University of Illinois and a master’s degree in business administration from Baldwin-Wallace College. He currently serves as a director of NN, Inc., a global manufacturer of precision bearings and plastic, rubber and metal components, and Lindsay Corporation, a global manufacturer of irrigation equipment and road safety products. Mr. Brunner’s experience and leadership with ITW, a diversified manufacturer with a global footprint, provides valuable insight to our Board on operational and international issues. He was first elected as a director of the Company in 2009.
Ralph W. Clark,
age 74, held various executive positions at International Business Machines Corporation (IBM) from 1988 until 1994, including Division President—General and Public Sector. He also served as Chairman of Frontec AMT Inc., a software company, from 1994 until his retirement in 1998 when the company was sold. Mr. Clark holds a master’s degree in economics from the University of Missouri. Through Mr. Clark’s career with
62
PART III
IBM and Frontec and his current board service with privately-held companies, he has valuable experience in general management, marketing, information technology, finance and strategic planning. He was first elected as a director of the Company in 2000. The Board did not nominate Mr. Clark to stand for re-election at the 2015 shareholders meeting.
Robert G. Culp, III,
age 68, is the co-founder of Culp, Inc., an upholstery and bedding fabrics designer and manufacturer, where he has been the Chairman since 1990 and served as CEO from 1988 to 2007. Mr. Culp holds a degree in economics from the University of North Carolina - Chapel Hill and an MBA from the Wharton School of the University of Pennsylvania. Mr. Culp is the lead independent director of Old Dominion Freight Line, Inc., a national motor transportation and logistics company, and previously served as a director of Stanley Furniture Company, Inc., a manufacturer and importer of wooden residential furniture, until 2011. His experience in the bedding and furniture industries provides valuable insight into a number of the Company's key markets. Through his leadership of Culp, Inc., a publicly-traded company with an international scope, he understands the complexities of the financial and regulatory requirements facing U.S. companies, as well as the challenges and opportunities of developing global operations. He was first elected as a director of the Company in 2013.
R. Ted Enloe, III,
age 76, has been Managing General Partner of Balquita Partners, Ltd., a family securities and real estate investment partnership, since 1996. Previously, he served as President and Chief Executive Officer of Optisoft, Inc., a manufacturer of intelligent traffic systems, from 2003 to 2005. His former positions include Vice Chairman of the Board and member of the Office of the Chief Executive for Compaq Computer Corporation and President of Lomas Financial Corporation and Liberte Investors. He holds a degree in petroleum engineering from Louisiana Polytechnic University and a law degree from Southern Methodist University. Mr. Enloe currently serves as a director of Silicon Laboratories Inc., a designer of mixed-signal integrated circuits, and Live Nation, Inc., a venue operator, promoter and producer of live entertainment events. Mr. Enloe’s professional background and experience, previously held senior-executive level positions, financial expertise and service on other company boards, qualifies him to serve as a member of our Board of Directors. Further, his wide-ranging experience combined with his intimate knowledge of the Company from over 40 years on the Board provides an exceptional mix of familiarity and objectivity. He was first elected as a director of the Company in 1969.
Manuel A. Fernandez
, age 68, co-founded SI Ventures, a venture capital firm focusing on IT and communications infrastructure, and served as the managing director from 1998 until his retirement in 2014. Mr. Fernandez was the Executive Chairman of Sysco Corporation, a marketer and distributor of foodservice products, from 2012 until his retirement in November 2013. He previously served Sysco as Non-executive Chairman from 2009 and as a director from 2006. His previous positions include Chairman and CEO of Gartner, Inc. and CEO of Dataquest, Inc. Mr. Fernandez holds a degree in electrical engineering from the University of Florida, and completed post-graduate work in solid-state engineering at the University of Florida and in business administration at the Florida Institute of Technology. Mr. Fernandez currently serves as lead independent director of Brunswick Corporation, a market leader in the marine, fitness, bowling and billiards industries, and as a director of Time Inc., a global media company. He was previously a director of Flowers Foods, Inc., a national producer and marketer of packaged bakery foods, Tibco, a global leader in infrastructure and business intelligence software, and Black & Decker, a manufacturer of power tools, hardware and home improvement products. Mr. Fernandez' venture capital experience, leadership of several technology companies as CEO and service on a number of public company boards offers Leggett outstanding insight into corporate strategy and development, information technology, international growth, and corporate governance. He was appointed as a director in May 2014.
Richard T. Fisher,
age 76, has been Managing Director of Oppenheimer & Co., an investment banking firm, since 2002. He served as Managing Director of CIBC World Markets Corp., an investment banking firm, from 1990 to 2002. Mr. Fisher holds a degree in economics from the Wharton School of the University of Pennsylvania. Mr. Fisher’s career in investment banking provides the Board with a unique perspective on the Company’s strategic initiatives, financial outlook and investor markets. His valuable business skills and long-term perspective of the Company bolster his leadership as the Company’s Lead Independent Director. He served as the independent Board Chair from 2008 until May 2013, when he was elected as Lead Independent Director. He was first elected as a director of the Company in 1972.
63
PART III
Matthew C. Flanigan,
age 53, was appointed Executive Vice President of the Company in 2013 and has served as Chief Financial Officer since 2003. He previously served as Senior Vice President from 2005 to 2013, Vice President from 1999 to 2005, President of the Office Furniture Components Group from 1999 to 2003 and in various capacities since 1997. Mr. Flanigan holds a degree in finance and business administration from the University of Missouri. He serves as the lead director of Jack Henry & Associates, Inc., a provider of core information processing solutions for financial institutions. As the Company’s CFO, Mr. Flanigan adds valuable knowledge of the Company’s finance, risk and compliance functions to the Board. In addition, his prior experience as one of the Company’s group presidents provides valuable operations insight. He was first elected as a director of the Company in 2010.
Karl G. Glassman,
age 56, was appointed President of the Company in 2013 and has served as Chief Operating Officer since 2006. He previously served as Executive Vice President from 2002 to 2013, President of Residential Furnishings from 1999 to 2006, Senior Vice President from 1999 to 2002 and in various capacities since 1982. Mr. Glassman holds a degree in business management and finance from California State University—Long Beach. He serves as a director of Remy International, Inc., a manufacturer, re-manufacturer, and distributor of light and heavy duty starters, alternators and hybrid power technology for the automotive and transportation industries. With over two decades experience leading the Company’s largest segment and serving as its Chief Operating Officer, Mr. Glassman provides in-depth operational knowledge to the Board and is a key interface between the Board’s oversight and strategic planning and its implementation at all levels of the Company around the world. He also serves on the Board of Directors of the National Association of Manufacturers. Mr. Glassman was first elected as a director of the Company in 2002.
David S. Haffner,
age 62, was elected Board Chair of the Company in 2013 and continues to serve as Chief Executive Officer since his appointment in 2006. He previously served as President from 2002 to 2013, Chief Operating Officer from 1999 to 2006, and as Executive Vice President from 1995 to 2002. He has served the Company in various capacities since 1983. He holds a degree in engineering from the University of Missouri and an MBA from the University of Wisconsin-Oshkosh. Mr. Haffner serves as a director of Bemis Company, Inc., a manufacturer of flexible packaging and pressure sensitive materials. As the Company’s CEO, Mr. Haffner provides comprehensive insight to the Board across the spectrum from strategic planning to implementation to execution and reporting, as well as its relationships with investors, the finance community and other key stakeholders. Mr. Haffner was first elected as a director of the Company in 1995.
Joseph W. McClanathan,
age 62, served as President and Chief Executive Officer of the Energizer Household Products Division of Energizer Holdings, Inc., a manufacturer of portable power solutions, from 2007 through his retirement in 2012. Previously, he served Energizer as President and Chief Executive Officer of the Energizer Battery Division from 2004 to 2007, as President—North America from 2002 to 2004, and as Vice President—North America from 2000 to 2002. Mr. McClanathan holds a degree in management from Arizona State University. Through his leadership experience at Energizer and as a former director of the Retail Industry Leaders Association, Mr. McClanathan offers an exceptional perspective to the Board on manufacturing operations, marketing and development of international capabilities. He was first elected as a director of the Company in 2005.
Judy C. Odom,
age 62, served, until her retirement in 2002, as Chief Executive Officer and Board Chair at Software Spectrum, Inc., a global business to business software services company which she co-founded in 1983. Prior to founding Software Spectrum, she was a partner with the international accounting firm, Grant Thornton. Ms. Odom is a licensed Certified Public Accountant and holds a degree in business administration from Texas Tech University. She is a director of Harte-Hanks, a direct marketing service company, and Sabre, Inc., which provides technology solutions for the global travel and tourism industry. Ms. Odom’s director experience with several companies offers a broad leadership perspective on strategic and operating issues. Her experience co-founding Software Spectrum and growing it to a global Fortune 1000 enterprise before selling it to another public company provides the insight of a long-serving CEO with international operating experience. Ms. Odom was first elected as a director of the Company in 2002.
Phoebe A. Wood,
age 61, has been a principal in CompaniesWood, a consulting firm specializing in early stage investments, since her 2008 retirement as Vice Chairman and Chief Financial Officer of Brown-Forman
64
Corporation, a diversified consumer products manufacturer, where she served since 2001. Ms. Wood previously held various positions at Atlantic Richfield Company, an oil and gas company, from 1976 to 2000. She holds a degree in psychology from Smith College and an MBA from UCLA. Ms. Wood is a director of Invesco, Ltd., an independent global investment manager, Coca-Cola Enterprises, Inc., a major bottler and distributor of Coca-Cola products, and Pioneer Natural Resources, an independent oil and gas company. From her career in business and various directorships, Ms. Wood provides the Board with a wealth of understanding of the strategic, financial, and accounting issues the Board faces in its oversight role. Ms. Wood was first elected as a director of the Company in 2005.
Please see the “Supplemental Item” in Part I hereof, for a listing of and a description of the positions and offices held by the executive officers of the Company.
The Company has adopted a code of ethics that applies to its chief executive officer, chief financial officer, principal accounting officer and corporate controller called the Leggett & Platt, Incorporated Financial Code of Ethics. The Company has also adopted a Code of Business Conduct and Ethics for directors, officers and employees and Corporate Governance Guidelines. The Financial Code of Ethics, the Code of Business Conduct and Ethics and the Corporate Governance Guidelines are available on the Company’s website at www.leggett-search.com/governance. Each of these documents is available in print to any person, without charge, upon request. Such requests may be made to the Company’s Secretary at Leggett & Platt, Incorporated, No. 1 Leggett Road, Carthage, Missouri 64836.
The Company intends to satisfy the disclosure requirement under Item 5.05 of Form 8-K by posting any applicable amendment or waiver to its Financial Code of Ethics, within four business days, on its website at the above address for at least a 12 month period. We routinely post important information to our website. However, the Company’s website does not constitute part of this Annual Report on Form 10-K.
The subsections entitled “Board’s Oversight of Risk Management,” “Director Compensation,” “Compensation Committee Interlocks and Insider Participation” together with the entire section entitled “Executive Compensation and Related Matters” in the Company’s definitive Proxy Statement for the Company’s Annual Meeting of Shareholders to be held on May 5, 2015, are incorporated by reference.
The entire sections entitled “Security Ownership” and “Equity Compensation Plan Information” in the Company’s definitive Proxy Statement for the Company’s Annual Meeting of Shareholders to be held on May 5, 2015, are incorporated by reference.
The subsections entitled “Transactions with Related Persons,” “Director Independence” and “Board and Committee Composition and Meetings” in the Company’s definitive Proxy Statement for the Company’s Annual Meeting of Shareholders to be held on May 5, 2015, are incorporated by reference.
The subsections entitled “Audit and Non-Audit Fees” and “Pre-Approval Procedures for Audit and Non-Audit Services” in the Company’s definitive Proxy Statement for the Company’s Annual Meeting of Shareholders to be held on May 5, 2015, are incorporated by reference.
65
PART IV
PART IV
(a) Financial Statements and Financial Statement Schedules.
The Reports, Financial Statements and Notes, supplementary financial information and Financial Statement Schedule listed below are included in this Form 10-K:
|
|
Page No.
|
|
67
|
|
|
68
|
|
|
69
|
|
|
70
|
|
|
71
|
|
|
72
|
|
|
73
|
|
|
74
|
|
|
119
|
|
|
120
|
|
We have omitted other information schedules because the information is inapplicable, not required, or in the financial statements or notes.
(b) Exhibits—See Exhibit Index beginning on page 123.
We did not file other long-term debt instruments because the total amount of securities authorized under all of these instruments does not exceed ten percent of the total assets of the Company and its subsidiaries on a consolidated basis. The Company agrees to furnish a copy of such instruments to the SEC upon request.
66
PART IV
Management’s Annual Report on Internal Control Over Financial Reporting
Management of Leggett & Platt, Incorporated is responsible for establishing and maintaining adequate internal control over financial reporting as defined in Exchange Act Rule 13a-15(f). Leggett & Platt’s internal control over financial reporting is a process designed to provide reasonable assurance regarding the reliability of financial reporting and the preparation of financial statements for external purposes in accordance with accounting principles generally accepted in the United States of America. The Company’s internal control over financial reporting includes those policies and procedures that:
|
•
|
Pertain to the maintenance of records that, in reasonable detail, accurately and fairly reflect the transactions and dispositions of the assets of Leggett & Platt;
|
|
•
|
Provide reasonable assurance that transactions are recorded as necessary to permit preparation of financial statements in accordance with accounting principles generally accepted in the United States of America, and that receipts and expenditures of Leggett & Platt are being made only in accordance with authorizations of management and directors of Leggett & Platt; and
|
|
•
|
Provide reasonable assurance regarding prevention or timely detection of unauthorized acquisition, use or disposition of Leggett & Platt assets that could have a material effect on the financial statements.
|
Because of its inherent limitations, internal control over financial reporting may not prevent or detect misstatements. Also, projections of any evaluation of effectiveness to future periods are subject to the risk that controls may become inadequate because of changes in conditions, or that the degree of compliance with the policies or procedures may deteriorate.
Under the supervision and with the participation of management (including ourselves), we conducted an evaluation of the effectiveness of Leggett & Platt’s internal control over financial reporting, as of
December 31, 2014
, based on the criteria in
Internal Control—Integrated Framework
(2013)
issued by the Committee of Sponsoring Organizations of the Treadway Commission. Based on the evaluation under this framework, we concluded that Leggett & Platt’s internal control over financial reporting was effective as of
December 31, 2014
.
Leggett & Platt’s internal control over financial reporting, as of
December 31, 2014
, has been audited by PricewaterhouseCoopers LLP, an independent registered public accounting firm, as stated in their report appearing on page 68 of this Form 10-K.
|
/s/ DAVID S. HAFFNER
|
|
|
|
/s/ MATTHEW C. FLANIGAN
|
|
David S. Haffner
Board Chair and Chief Executive Officer
|
|
|
|
Matthew C. Flanigan
Executive Vice President and
Chief Financial Officer
|
|
February 26, 2015
|
|
|
|
February 26, 2015
|
67
Report of Independent Registered Public Accounting Firm
To the Board of Directors and Shareholders of
Leggett & Platt, Incorporated:
In our opinion, the consolidated financial statements listed in the accompanying index appearing under Item 15(a) present fairly, in all material respects, the financial position of Leggett & Platt, Incorporated and its subsidiaries at
December 31, 2014
and
2013
, and the results of their operations and their cash flows for each of the three years in the period ended
December 31, 2014
in conformity with accounting principles generally accepted in the United States of America. In addition, in our opinion, the financial statement schedule listed in the index appearing under Item 15(a) presents fairly, in all material respects, the information set forth therein when read in conjunction with the related consolidated financial statements. Also in our opinion, the Company maintained, in all material respects, effective internal control over financial reporting as of
December 31, 2014
, based on criteria established in
Internal Control—Integrated Framework
(2013)
issued by the Committee of Sponsoring Organizations of the Treadway Commission (COSO). The Company’s management is responsible for these financial statements and financial statement schedule, for maintaining effective internal control over financial reporting and for its assessment of the effectiveness of internal control over financial reporting, included in the accompanying Management’s Annual Report on Internal Control over Financial Reporting. Our responsibility is to express opinions on these financial statements, on the financial statement schedule, and on the Company’s internal control over financial reporting based on our integrated audits. We conducted our audits in accordance with the standards of the Public Company Accounting Oversight Board (United States). Those standards require that we plan and perform the audits to obtain reasonable assurance about whether the financial statements are free of material misstatement and whether effective internal control over financial reporting was maintained in all material respects. Our audits of the financial statements included examining, on a test basis, evidence supporting the amounts and disclosures in the financial statements, assessing the accounting principles used and significant estimates made by management, and evaluating the overall financial statement presentation. Our audit of internal control over financial reporting included obtaining an understanding of internal control over financial reporting, assessing the risk that a material weakness exists, and testing and evaluating the design and operating effectiveness of internal control based on the assessed risk. Our audits also included performing such other procedures as we considered necessary in the circumstances. We believe that our audits provide a reasonable basis for our opinions.
A company’s internal control over financial reporting is a process designed to provide reasonable assurance regarding the reliability of financial reporting and the preparation of financial statements for external purposes in accordance with generally accepted accounting principles. A company’s internal control over financial reporting includes those policies and procedures that (i) pertain to the maintenance of records that, in reasonable detail, accurately and fairly reflect the transactions and dispositions of the assets of the company; (ii) provide reasonable assurance that transactions are recorded as necessary to permit preparation of financial statements in accordance with generally accepted accounting principles, and that receipts and expenditures of the company are being made only in accordance with authorizations of management and directors of the company; and (iii) provide reasonable assurance regarding prevention or timely detection of unauthorized acquisition, use, or disposition of the company’s assets that could have a material effect on the financial statements.
Because of its inherent limitations, internal control over financial reporting may not prevent or detect misstatements. Also, projections of any evaluation of effectiveness to future periods are subject to the risk that controls may become inadequate because of changes in conditions, or that the degree of compliance with the policies or procedures may deteriorate.
/s/ PRICEWATERHOUSECOOPERS LLP
St. Louis, MO
February 26, 2015
68
LEGGETT & PLATT, INCORPORATED
|
|
|||||||||||
|
|
Year Ended December 31
|
||||||||||
|
(Amounts in millions, except per share data)
|
2014
|
2013
|
2012
|
||||||||
|
Net sales
|
$
|
3,782.3
|
|
$
|
3,477.2
|
|
$
|
3,414.5
|
|
||
|
Cost of goods sold
|
2,991.9
|
|
2,767.3
|
|
2,718.9
|
|
|||||
|
Gross profit
|
790.4
|
|
709.9
|
|
695.6
|
|
|||||
|
Selling and administrative expenses
|
449.6
|
|
367.9
|
|
348.1
|
|
|||||
|
Amortization of intangibles
|
19.7
|
|
25.4
|
|
25.1
|
|
|||||
|
Goodwill impairment
|
—
|
|
63.0
|
|
—
|
|
|||||
|
Other (income) expense, net
|
(10.4
|
)
|
(21.0
|
)
|
(2.0
|
)
|
|||||
|
Earnings from continuing operations before interest and income taxes
|
331.5
|
|
274.6
|
|
324.4
|
|
|||||
|
Interest expense
|
41.8
|
|
44.7
|
|
43.4
|
|
|||||
|
Interest income
|
5.8
|
|
7.7
|
|
6.5
|
|
|||||
|
Earnings from continuing operations before income taxes
|
295.5
|
|
237.6
|
|
287.5
|
|
|||||
|
Income taxes
|
70.3
|
|
51.3
|
|
55.7
|
|
|||||
|
Earnings from continuing operations
|
225.2
|
|
186.3
|
|
231.8
|
|
|||||
|
Earnings (loss) from discontinued operations, net of tax
|
(124.0
|
)
|
13.4
|
|
18.7
|
|
|||||
|
Net earnings
|
101.2
|
|
199.7
|
|
250.5
|
|
|||||
|
(Earnings) attributable to noncontrolling interest, net of tax
|
(3.2
|
)
|
(2.4
|
)
|
(2.3
|
)
|
|||||
|
Net earnings attributable to Leggett & Platt, Inc. common shareholders
|
$
|
98.0
|
|
$
|
197.3
|
|
$
|
248.2
|
|
||
|
Earnings per share from continuing operations attributable to Leggett & Platt, Inc. common shareholders
|
|
|
|
||||||||
|
Basic
|
$
|
1.57
|
|
$
|
1.27
|
|
$
|
1.59
|
|
||
|
Diluted
|
$
|
1.55
|
|
$
|
1.25
|
|
$
|
1.57
|
|
||
|
Earnings (loss) per share from discontinued operations attributable to Leggett & Platt, Inc. common shareholders
|
|
|
|
||||||||
|
Basic
|
$
|
(.88
|
)
|
$
|
.09
|
|
$
|
.13
|
|
||
|
Diluted
|
$
|
(.87
|
)
|
$
|
.09
|
|
$
|
.13
|
|
||
|
Net earnings per share attributable to Leggett & Platt, Inc. common shareholders
|
|
|
|
||||||||
|
Basic
|
$
|
.69
|
|
$
|
1.36
|
|
$
|
1.72
|
|
||
|
Diluted
|
$
|
.68
|
|
$
|
1.34
|
|
$
|
1.70
|
|
||
The accompanying notes are an integral part of these financial statements.
69
LEGGETT & PLATT, INCORPORATED
Consolidated Statements of Comprehensive Income (Loss)
|
|
Year Ended December 31
|
||||||||||
|
(Amounts in millions)
|
2014
|
2013
|
2012
|
||||||||
|
Net earnings
|
$
|
101.2
|
|
$
|
199.7
|
|
$
|
250.5
|
|
||
|
Other comprehensive income (loss), net of tax:
|
|||||||||||
|
Foreign currency translation adjustments
|
(71.7
|
)
|
(5.0
|
)
|
16.0
|
|
|||||
|
Cash flow hedges
|
3.4
|
|
2.0
|
|
(4.0
|
)
|
|||||
|
Defined benefit pension plans
|
(29.0
|
)
|
26.7
|
|
(6.1
|
)
|
|||||
|
Other comprehensive income (loss)
|
(97.3
|
)
|
23.7
|
|
5.9
|
|
|||||
|
Comprehensive income
|
3.9
|
|
223.4
|
|
256.4
|
|
|||||
|
Less: comprehensive (income) attributable to noncontrolling interest
|
(3.0
|
)
|
(2.6
|
)
|
(2.4
|
)
|
|||||
|
Comprehensive income attributable to Leggett & Platt, Inc.
|
$
|
.9
|
|
$
|
220.8
|
|
$
|
254.0
|
|
||
The accompanying notes are an integral part of these financial statements.
70
LEGGETT & PLATT, INCORPORATED
|
|
December 31
|
||||||
|
(Amounts in millions, except per share data)
|
2014
|
2013
|
|||||
|
ASSETS
|
|
|
|||||
|
Current Assets
|
|
|
|||||
|
Cash and cash equivalents
|
$
|
332.8
|
|
$
|
272.7
|
|
|
|
Trade receivables, net
|
470.4
|
|
434.8
|
|
|||
|
Other receivables, net
|
52.9
|
|
32.6
|
|
|||
|
Total receivables, net
|
523.3
|
|
467.4
|
|
|||
|
Inventories
|
|||||||
|
Finished goods
|
252.1
|
|
270.5
|
|
|||
|
Work in process
|
55.5
|
|
59.3
|
|
|||
|
Raw materials and supplies
|
247.0
|
|
239.4
|
|
|||
|
LIFO reserve
|
(73.0
|
)
|
(73.3
|
)
|
|||
|
Total inventories, net
|
481.6
|
|
495.9
|
|
|||
|
Other current assets
|
91.9
|
|
45.7
|
|
|||
|
Total current assets
|
1,429.6
|
|
1,281.7
|
|
|||
|
Property, Plant and Equipment—at cost
|
|||||||
|
Machinery and equipment
|
1,161.5
|
|
1,184.5
|
|
|||
|
Buildings and other
|
551.1
|
|
612.2
|
|
|||
|
Land
|
40.1
|
|
44.5
|
|
|||
|
Total property, plant and equipment
|
1,752.7
|
|
1,841.2
|
|
|||
|
Less accumulated depreciation
|
1,193.8
|
|
1,266.6
|
|
|||
|
Net property, plant and equipment
|
558.9
|
|
574.6
|
|
|||
|
Other Assets
|
|||||||
|
Goodwill
|
819.0
|
|
926.8
|
|
|||
|
Other intangibles, less accumulated amortization of $129.7 and $114.4 at December 31, 2014 and 2013, respectively
|
204.7
|
|
203.4
|
|
|||
|
Sundry
|
128.4
|
|
121.6
|
|
|||
|
Total other assets
|
1,152.1
|
|
1,251.8
|
|
|||
|
TOTAL ASSETS
|
$
|
3,140.6
|
|
$
|
3,108.1
|
|
|
|
LIABILITIES AND EQUITY
|
|||||||
|
Current Liabilities
|
|||||||
|
Current maturities of long-term debt
|
$
|
201.7
|
|
$
|
181.1
|
|
|
|
Accounts payable
|
369.8
|
|
339.3
|
|
|||
|
Accrued expenses
|
337.6
|
|
229.7
|
|
|||
|
Other current liabilities
|
83.1
|
|
79.4
|
|
|||
|
Total current liabilities
|
992.2
|
|
829.5
|
|
|||
|
Long-term Liabilities
|
|||||||
|
Long-term debt
|
766.7
|
|
688.4
|
|
|||
|
Other long-term liabilities
|
185.0
|
|
127.7
|
|
|||
|
Deferred income taxes
|
41.8
|
|
63.3
|
|
|||
|
Total long-term liabilities
|
993.5
|
|
879.4
|
|
|||
|
Commitments and Contingencies
|
|
|
|
|
|||
|
Equity
|
|||||||
|
Capital stock: Preferred stock—authorized, 100.0 shares; none issued; Common stock—authorized, 600.0 shares of $.01 par value; 198.8 shares issued
|
2.0
|
|
2.0
|
|
|||
|
Additional contributed capital
|
502.4
|
|
479.1
|
|
|||
|
Retained earnings
|
2,061.3
|
|
2,136.4
|
|
|||
|
Accumulated other comprehensive income (loss)
|
(2.6
|
)
|
94.5
|
|
|||
|
Less treasury stock—at cost (61.0 and 59.4 shares at December 31, 2014 and 2013, respectively)
|
(1,416.6
|
)
|
(1,320.7
|
)
|
|||
|
Total Leggett & Platt, Inc. equity
|
1,146.5
|
|
1,391.3
|
|
|||
|
Noncontrolling interest
|
8.4
|
|
7.9
|
|
|||
|
Total equity
|
1,154.9
|
|
1,399.2
|
|
|||
|
TOTAL LIABILITIES AND EQUITY
|
$
|
3,140.6
|
|
$
|
3,108.1
|
|
|
The accompanying notes are an integral part of these financial statements.
71
LEGGETT & PLATT, INCORPORATED
|
|
Year Ended December 31
|
||||||||||
|
(Amounts in millions)
|
2014
|
2013
|
2012
|
||||||||
|
Operating Activities
|
|
|
|
||||||||
|
Net earnings
|
$
|
101.2
|
|
$
|
199.7
|
|
$
|
250.5
|
|
||
|
Adjustments to reconcile net earnings to net cash provided by operating activities:
|
|||||||||||
|
Depreciation
|
89.9
|
|
90.1
|
|
90.4
|
|
|||||
|
Amortization of intangibles and debt issuance costs
|
28.0
|
|
32.5
|
|
28.6
|
|
|||||
|
Long-lived asset impairments
|
1.3
|
|
2.4
|
|
1.7
|
|
|||||
|
Goodwill impairment
|
108.0
|
|
63.0
|
|
—
|
|
|||||
|
Provision for losses on accounts and notes receivable
|
4.9
|
|
6.1
|
|
4.9
|
|
|||||
|
Writedown of inventories
|
10.0
|
|
11.8
|
|
10.2
|
|
|||||
|
Net loss (gain) from sales of assets and businesses
|
4.2
|
|
(8.6
|
)
|
(3.3
|
)
|
|||||
|
Bargain purchase gain from acquisition
|
—
|
|
(8.8
|
)
|
—
|
|
|||||
|
Deferred income tax benefit
|
(39.8
|
)
|
(32.9
|
)
|
(21.9
|
)
|
|||||
|
Stock-based compensation
|
41.6
|
|
36.3
|
|
33.8
|
|
|||||
|
Excess tax benefits from stock-based compensation
|
(10.6
|
)
|
(6.6
|
)
|
(6.7
|
)
|
|||||
|
Other, net
|
(10.4
|
)
|
5.5
|
|
4.1
|
|
|||||
|
Other changes, excluding effects from acquisitions and divestitures:
|
|||||||||||
|
(Increase) decrease in accounts and other receivables
|
(97.7
|
)
|
(13.3
|
)
|
60.6
|
|
|||||
|
Increase in inventories
|
(21.9
|
)
|
(4.1
|
)
|
(39.1
|
)
|
|||||
|
Decrease (increase) in other current assets
|
1.4
|
|
(1.0
|
)
|
(2.9
|
)
|
|||||
|
Increase in accounts payable
|
47.5
|
|
35.0
|
|
27.4
|
|
|||||
|
Increase in accrued expenses and other current liabilities
|
124.3
|
|
9.8
|
|
11.4
|
|
|||||
|
Net Cash Provided by Operating Activities
|
381.9
|
|
416.9
|
|
449.7
|
|
|||||
|
Investing Activities
|
|
|
|
|
|||||||
|
Additions to property, plant and equipment
|
(94.1
|
)
|
(80.6
|
)
|
(71.0
|
)
|
|||||
|
Purchases of companies, net of cash acquired
|
(70.4
|
)
|
(27.9
|
)
|
(211.6
|
)
|
|||||
|
Proceeds from sales of assets and businesses
|
76.5
|
|
18.9
|
|
15.8
|
|
|||||
|
Liquidation of (investment in) unconsolidated entity
|
—
|
|
21.2
|
|
(22.4
|
)
|
|||||
|
Other, net
|
(14.7
|
)
|
(6.9
|
)
|
(4.8
|
)
|
|||||
|
Net Cash Used for Investing Activities
|
(102.7
|
)
|
(75.3
|
)
|
(294.0
|
)
|
|||||
|
Financing Activities
|
|
|
|
|
|||||||
|
Additions to long-term debt
|
299.3
|
|
—
|
|
299.2
|
|
|||||
|
Payments on long-term debt
|
(188.1
|
)
|
(203.7
|
)
|
(11.8
|
)
|
|||||
|
Change in commercial paper and short-term debt
|
(24.2
|
)
|
23.3
|
|
(85.8
|
)
|
|||||
|
Dividends paid
|
(167.5
|
)
|
(124.9
|
)
|
(199.5
|
)
|
|||||
|
Issuances of common stock
|
21.8
|
|
36.9
|
|
35.6
|
|
|||||
|
Purchases of common stock
|
(149.7
|
)
|
(169.4
|
)
|
(30.0
|
)
|
|||||
|
Liquidation of interest rate swap agreement
|
—
|
|
—
|
|
(42.7
|
)
|
|||||
|
Excess tax benefits from stock-based compensation
|
10.6
|
|
6.6
|
|
6.7
|
|
|||||
|
Other, net
|
(5.8
|
)
|
(3.1
|
)
|
(8.3
|
)
|
|||||
|
Net Cash Used for Financing Activities
|
(203.6
|
)
|
(434.3
|
)
|
(36.6
|
)
|
|||||
|
Effect of Exchange Rate Changes on Cash
|
(15.5
|
)
|
6.3
|
|
3.7
|
|
|||||
|
Increase (decrease) in Cash and Cash Equivalents
|
60.1
|
|
(86.4
|
)
|
122.8
|
|
|||||
|
Cash and Cash Equivalents—Beginning of Year
|
272.7
|
|
359.1
|
|
236.3
|
|
|||||
|
Cash and Cash Equivalents—End of Year
|
$
|
332.8
|
|
$
|
272.7
|
|
$
|
359.1
|
|
||
|
Supplemental Information
|
|
|
|
||||||||
|
Interest paid (net of amounts capitalized)
|
$
|
40.1
|
|
$
|
45.2
|
|
$
|
38.2
|
|
||
|
Income taxes paid
|
84.6
|
|
71.1
|
|
76.3
|
|
|||||
|
Property, plant and equipment acquired through capital leases
|
3.7
|
|
1.1
|
|
2.4
|
|
|||||
The accompanying notes are an integral part of these financial statements.
72
LEGGETT & PLATT, INCORPORATED
Consolidated Statements of Changes in Equity
|
(Amounts in millions, except per
share data)
|
Common Stock
|
Additional
Contributed
Capital
|
Retained
Earnings
|
Accumulated
Other
Comprehensive
Income
|
Treasury Stock
|
Non-controlling
Interest
|
Total
Equity
|
||||||||||||||||||||||||||
|
Shares
|
Amount
|
Shares
|
Amount
|
||||||||||||||||||||||||||||||
|
Balance, December 31, 2011
|
198.8
|
|
$
|
2.0
|
|
$
|
456.9
|
|
$
|
2,027.4
|
|
$
|
65.2
|
|
(59.4
|
)
|
$
|
(1,254.3
|
)
|
$
|
10.5
|
|
$
|
1,307.7
|
|
||||||||
|
Net earnings
|
—
|
|
—
|
|
—
|
|
250.5
|
|
—
|
|
—
|
|
—
|
|
—
|
|
250.5
|
|
|||||||||||||||
|
(Earnings) attributable to noncontrolling interest, net of tax
|
—
|
|
—
|
|
—
|
|
(2.3
|
)
|
—
|
|
—
|
|
—
|
|
2.3
|
|
—
|
|
|||||||||||||||
|
Dividends declared (A)
|
—
|
|
—
|
|
5.5
|
|
(166.0
|
)
|
—
|
|
—
|
|
—
|
|
—
|
|
(160.5
|
)
|
|||||||||||||||
|
Dividends paid to noncontrolling interest
|
—
|
|
—
|
|
—
|
|
—
|
|
—
|
|
—
|
|
—
|
|
(5.2
|
)
|
(5.2
|
)
|
|||||||||||||||
|
Treasury stock purchased
|
—
|
|
—
|
|
—
|
|
—
|
|
—
|
|
(2.0
|
)
|
(51.8
|
)
|
—
|
|
(51.8
|
)
|
|||||||||||||||
|
Treasury stock issued
|
—
|
|
—
|
|
(32.1
|
)
|
—
|
|
—
|
|
4.7
|
|
99.4
|
|
—
|
|
67.3
|
|
|||||||||||||||
|
Foreign currency translation adjustments
|
—
|
|
—
|
|
—
|
|
—
|
|
15.9
|
|
—
|
|
—
|
|
.1
|
|
16.0
|
|
|||||||||||||||
|
Cash flow hedges, net of tax
|
—
|
|
—
|
|
—
|
|
—
|
|
(4.0
|
)
|
—
|
|
—
|
|
—
|
|
(4.0
|
)
|
|||||||||||||||
|
Defined benefit pension plans, net of tax
|
—
|
|
—
|
|
—
|
|
—
|
|
(6.1
|
)
|
—
|
|
—
|
|
—
|
|
(6.1
|
)
|
|||||||||||||||
|
Stock options and benefit plan transactions, net of tax
|
—
|
|
—
|
|
28.3
|
|
—
|
|
—
|
|
—
|
|
—
|
|
—
|
|
28.3
|
|
|||||||||||||||
|
Balance, December 31, 2012
|
198.8
|
|
$
|
2.0
|
|
$
|
458.6
|
|
$
|
2,109.6
|
|
$
|
71.0
|
|
(56.7
|
)
|
$
|
(1,206.7
|
)
|
$
|
7.7
|
|
$
|
1,442.2
|
|
||||||||
|
Net earnings
|
—
|
|
—
|
|
—
|
|
199.7
|
|
—
|
|
—
|
|
—
|
|
—
|
|
199.7
|
|
|||||||||||||||
|
(Earnings) attributable to noncontrolling interest, net of tax
|
—
|
|
—
|
|
—
|
|
(2.4
|
)
|
—
|
|
—
|
|
—
|
|
2.4
|
|
—
|
|
|||||||||||||||
|
Dividends declared (A)
|
—
|
|
—
|
|
3.5
|
|
(170.5
|
)
|
—
|
|
—
|
|
—
|
|
—
|
|
(167.0
|
)
|
|||||||||||||||
|
Dividends paid to noncontrolling interest
|
—
|
|
—
|
|
—
|
|
—
|
|
—
|
|
—
|
|
—
|
|
(2.4
|
)
|
(2.4
|
)
|
|||||||||||||||
|
Treasury stock purchased
|
—
|
|
—
|
|
—
|
|
—
|
|
—
|
|
(5.9
|
)
|
(183.6
|
)
|
—
|
|
(183.6
|
)
|
|||||||||||||||
|
Treasury stock issued
|
—
|
|
—
|
|
(12.8
|
)
|
—
|
|
—
|
|
3.2
|
|
69.6
|
|
—
|
|
56.8
|
|
|||||||||||||||
|
Foreign currency translation adjustments
|
—
|
|
—
|
|
—
|
|
—
|
|
(5.2
|
)
|
—
|
|
—
|
|
.2
|
|
(5.0
|
)
|
|||||||||||||||
|
Cash flow hedges, net of tax
|
—
|
|
—
|
|
—
|
|
—
|
|
2.0
|
|
—
|
|
—
|
|
—
|
|
2.0
|
|
|||||||||||||||
|
Defined benefit pension plans, net of tax
|
—
|
|
—
|
|
—
|
|
—
|
|
26.7
|
|
—
|
|
—
|
|
—
|
|
26.7
|
|
|||||||||||||||
|
Stock options and benefit plan transactions, net of tax
|
—
|
|
—
|
|
29.8
|
|
—
|
|
—
|
|
—
|
|
—
|
|
—
|
|
29.8
|
|
|||||||||||||||
|
Balance, December 31, 2013
|
198.8
|
|
$
|
2.0
|
|
$
|
479.1
|
|
$
|
2,136.4
|
|
$
|
94.5
|
|
(59.4
|
)
|
$
|
(1,320.7
|
)
|
$
|
7.9
|
|
$
|
1,399.2
|
|
||||||||
|
Net earnings
|
—
|
|
—
|
|
—
|
|
101.2
|
|
—
|
|
—
|
|
—
|
|
—
|
|
101.2
|
|
|||||||||||||||
|
(Earnings) attributable to noncontrolling interest, net of tax
|
—
|
|
—
|
|
—
|
|
(3.2
|
)
|
—
|
|
—
|
|
—
|
|
3.2
|
|
—
|
|
|||||||||||||||
|
Dividends declared (A)
|
—
|
|
—
|
|
4.9
|
|
(173.1
|
)
|
—
|
|
—
|
|
—
|
|
—
|
|
(168.2
|
)
|
|||||||||||||||
|
Dividends paid to noncontrolling interest
|
—
|
|
—
|
|
—
|
|
—
|
|
—
|
|
—
|
|
—
|
|
(2.5
|
)
|
(2.5
|
)
|
|||||||||||||||
|
Treasury stock purchased
|
—
|
|
—
|
|
—
|
|
—
|
|
—
|
|
(5.4
|
)
|
(183.9
|
)
|
—
|
|
(183.9
|
)
|
|||||||||||||||
|
Treasury stock issued
|
—
|
|
—
|
|
(16.0
|
)
|
—
|
|
—
|
|
3.8
|
|
88.0
|
|
—
|
|
72.0
|
|
|||||||||||||||
|
Foreign currency translation adjustments
|
—
|
|
—
|
|
—
|
|
—
|
|
(71.5
|
)
|
—
|
|
—
|
|
(.2
|
)
|
(71.7
|
)
|
|||||||||||||||
|
Cash flow hedges, net of tax
|
—
|
|
—
|
|
—
|
|
—
|
|
3.4
|
|
—
|
|
—
|
|
—
|
|
3.4
|
|
|||||||||||||||
|
Defined benefit pension plans, net of tax
|
—
|
|
—
|
|
—
|
|
—
|
|
(29.0
|
)
|
—
|
|
—
|
|
—
|
|
(29.0
|
)
|
|||||||||||||||
|
Stock options and benefit plan transactions, net of tax
|
—
|
|
—
|
|
34.4
|
|
—
|
|
—
|
|
—
|
|
—
|
|
—
|
|
34.4
|
|
|||||||||||||||
|
Balance, December 31, 2014
|
198.8
|
|
$
|
2.0
|
|
$
|
502.4
|
|
$
|
2,061.3
|
|
$
|
(2.6
|
)
|
(61.0
|
)
|
$
|
(1,416.6
|
)
|
$
|
8.4
|
|
$
|
1,154.9
|
|
||||||||
______________________________
(A) – Cash dividends declared (per share:
2014
—
$1.22
;
2013
—
$1.18
;
2012
—
$1.14
)
The accompanying notes are an integral part of these financial statements.
73
Leggett & Platt, Incorporated
Notes to Consolidated Financial Statements
(Dollar amounts in millions, except per share data)
December 31, 2014
,
2013
and
2012
A—Summary of Significant Accounting Policies
PRINCIPLES OF CONSOLIDATION: The consolidated financial statements include the accounts of Leggett & Platt, Incorporated and its majority-owned subsidiaries (“we” or “our”). Management does not expect foreign exchange restrictions to significantly impact the ultimate realization of amounts consolidated in the accompanying financial statements for subsidiaries located outside the United States. All intercompany transactions and accounts have been eliminated in consolidation.
ESTIMATES: The preparation of financial statements in conformity with generally accepted accounting principles in the United States of America ("GAAP") requires management to make estimates and assumptions that affect the reported amounts of assets, liabilities, revenues and expenses and the disclosure of contingencies. Legal costs are accrued when a loss is probable and reasonably estimable. If a range of outcomes are possible, the most likely outcome is used to accrue these costs. Any insurance recovery is recorded separately if it is determined that a recovery is probable. Legal fees are accrued when incurred.
CASH EQUIVALENTS: Cash equivalents include cash in excess of daily requirements which is invested in various financial instruments with original maturities of three months or less.
TRADE AND OTHER RECEIVABLES AND ALLOWANCE FOR DOUBTFUL ACCOUNTS: Trade receivables are recorded at the invoiced amount and generally do not bear interest. Credit is also occasionally extended in the form of a note receivable to facilitate our customers’ operating cycles. Other notes receivable are established in special circumstances, such as in partial payment for the sale of a business. Other notes receivable generally bear interest at market rates commensurate with the corresponding credit risk on the date of origination.
The allowance for doubtful accounts is an estimate of the amount of probable credit losses. Interest income is not recognized for nonperforming accounts that are placed on nonaccrual status. Allowances and nonaccrual status designations are determined by individual account reviews by management, and are based on several factors such as the length of time that receivables are past due, the financial health of the companies involved, industry and macroeconomic considerations, and historical loss experience. Interest income is recorded on the date of cash receipt for nonaccrual status accounts. Account balances are charged off against the allowance when it is probable the receivable will not be recovered.
INVENTORIES: All inventories are stated at the lower of cost or market. We generally use standard costs which include materials, labor and production overhead at normal production capacity. The cost for approximately
50%
of our inventories is determined by the last-in, first-out (LIFO) method and is primarily used to value domestic inventories with raw material content consisting of steel, wire, chemicals and foam scrap. For the remainder of the inventories, we principally use the first-in, first-out (FIFO) method, which is representative of our standard costs. For these inventories, the FIFO cost for the periods presented approximated expected replacement cost.
Inventories are reviewed at least quarterly for slow-moving and potentially obsolete items using actual inventory turnover, and if necessary, are written down to estimated net realizable value. We have had no material changes in inventory writedowns or slow-moving and obsolete inventory reserves in any of the years presented.
DIVESTITURES: Significant accounting policies associated with a decision to dispose of a business are discussed below:
Discontinued Operations
—For the periods presented, a business has been classified as a discontinued operation when (i) the operations and cash flows of the business can be clearly distinguished and have been or will be eliminated from our ongoing operations; (ii) the business has either been disposed of or is classified as held for sale; and (iii) we will not have any significant continuing involvement in the operations of the business after the disposal transactions. Significant judgments are involved in determining whether a business meets the criteria for discontinued operations reporting and the period in which these criteria are met.
If a business is reported as a discontinued operation, the results of operations through the date of sale, including any gain or loss recognized on the disposition, are presented on a separate line of the income statement. Interest on debt directly attributable to the discontinued operation is allocated to discontinued operations. Gains and losses related to the sale of
74
businesses that do not meet the discontinued operation criteria are reported in continuing operations and separately disclosed if significant.
Assets Held for Sale
—An asset or business is classified as held for sale when (i) management commits to a plan to sell and it is actively marketed; (ii) it is available for immediate sale and the sale is expected to be completed within one year; and (iii) it is unlikely significant changes to the plan will be made or that the plan will be withdrawn. In isolated instances, assets held for sale may exceed one year due to events or circumstances beyond our control. Upon being classified as held for sale, the recoverability of the carrying value must be assessed. Evaluating the recoverability of the assets of a business classified as held for sale follows a defined order in which property and intangible assets subject to amortization are considered only after the recoverability of goodwill and other assets are assessed. After the valuation process is completed, the assets held for sale are reported at the lower of the carrying value or fair value less cost to sell, and the assets are no longer depreciated or amortized. An impairment charge is recognized if the carrying value exceeds the fair value less cost to sell. The assets and related liabilities are aggregated and reported on separate lines of the balance sheet.
Assets Held for Use
—If a decision to dispose of an asset or a business is made and the held for sale criteria are not met, it is considered held for use. Assets of the business are evaluated for recoverability in the following order: (i) assets other than goodwill, property and intangibles; (ii) property and intangibles subject to amortization; and (iii) goodwill. In evaluating the recoverability of property and intangible assets subject to amortization, the carrying value is first compared to the sum of the undiscounted cash flows expected to result from the use and eventual disposition. If the carrying value exceeds the undiscounted expected cash flows, then a fair value analysis is performed. An impairment charge is recognized if the carrying value exceeds the fair value.
PROPERTY, PLANT AND EQUIPMENT: Property, plant and equipment is stated at cost, less accumulated depreciation. Assets are depreciated by the straight-line method and salvage value, if any, is assumed to be minimal. The table below presents the depreciation periods of the estimated useful lives of our property, plant and equipment. Accelerated methods are used for tax purposes.
|
|
Useful Life Range
|
Weighted
Average Life
|
|
|
Machinery and equipment
|
3-20 years
|
|
10 years
|
|
Buildings
|
10-40 years
|
|
28 years
|
|
Other items
|
3-15 years
|
|
8 years
|
Property is reviewed for recoverability at year end and whenever events or changes in circumstances indicate that its carrying value may not be recoverable as discussed above.
GOODWILL: Goodwill results from the acquisition of existing businesses and is not amortized; it is assessed for impairment annually and as triggering events may occur. We perform our annual review in the second quarter of each year. Recoverability of goodwill is evaluated using a two-step process. The first step involves a comparison of the fair value of a reporting unit with its carrying value. Our reporting units are the business groups one level below the operating segment level for which discrete financial information is available and reviewed by segment management.
If the carrying value of the group exceeds its fair value, the second step of the process is necessary and involves a comparison of the implied fair value and the carrying value of the goodwill of that group. If the carrying value of the goodwill of a group exceeds the implied fair value of that goodwill, an impairment loss is recognized in an amount equal to the excess.
In evaluating the recoverability of goodwill, it is necessary to estimate the fair values of the reporting units. In making this assessment, we estimate the fair market values of our reporting units using a discounted cash flow model and comparable market values for similar entities using price-to-earnings ratios. Key assumptions and estimates used in the cash flow model include discount rate, sales growth, margins, capital expenditure requirements, and working capital requirements. Recent performance of the group is an important factor, but not the only factor, in our assessment. There are inherent assumptions and judgments required in the analysis of goodwill impairment. It is possible that assumptions underlying the impairment analysis will change in such a manner that impairment in value may occur in the future.
OTHER INTANGIBLE ASSETS: Substantially all other intangible assets are amortized using the straight-line method over their estimated useful lives and are evaluated for impairment using a process similar to that used in evaluating the recoverability of property, plant and equipment.
75
|
|
Useful Life Range
|
|
Weighted
Average Life
|
|
Other intangible assets
|
1-40 years
|
|
15 years
|
STOCK-BASED COMPENSATION: The cost of employee services received in exchange for all equity awards granted is based on the fair market value of the award as of the grant date. Expense is recognized net of an estimated forfeiture rate using the straight-line method over the vesting period of the award.
SALES RECOGNITION: We recognize sales when title and risk of loss pass to the customer. The terms of our sales are split approximately evenly between FOB shipping point and FOB destination. The timing of our recognition of FOB destination sales is determined based on shipping date and distance to the destination. We have no significant or unusual price protection, right of return or acceptance provisions with our customers. Sales allowances, discounts and rebates can be reasonably estimated throughout the period and are deducted from sales in arriving at net sales.
SHIPPING AND HANDLING FEES AND COSTS: Shipping and handling costs are included as a component of “Cost of goods sold.”
RESTRUCTURING COSTS: Restructuring costs are items such as employee termination, contract termination, plant closure and asset relocation costs related to exit activities. Restructuring-related items are inventory writedowns and gains or losses from sales of assets recorded as the result of exit activities. We recognize a liability for costs associated with an exit or disposal activity when the liability is incurred. Certain termination benefits for which employees are required to render service are recognized ratably over the respective future service periods.
INCOME TAXES: The provision for income taxes is determined using the asset and liability approach of accounting for income taxes. Under this approach, deferred taxes represent the future tax consequences expected to occur when the reported amounts of assets and liabilities are recovered or paid. The provision for income taxes represents income taxes paid or payable for the current year plus the change in deferred taxes during the year. Deferred taxes result from differences between the financial and tax basis of our assets and liabilities and are adjusted for changes in tax rates and laws, as appropriate. A valuation allowance is provided to reduce deferred tax assets when management cannot conclude that it is more likely than not that a tax benefit will be realized. A provision is also made for incremental taxes on undistributed earnings of foreign subsidiaries and related companies to the extent that such earnings are not deemed to be indefinitely invested.
The calculation of our U.S., state, and foreign tax liabilities involves dealing with uncertainties in the application of complex global tax laws. We recognize potential liabilities for anticipated tax issues which might arise in the U.S. and other tax jurisdictions based on management’s estimate of whether, and the extent to which, additional taxes will be due. If payment of these amounts ultimately proves to be unnecessary, the reversal of the liabilities would result in tax benefits being recognized in the period when we determine the liabilities are no longer necessary. Conversely, if the estimate of tax liabilities proves to be less than the ultimate tax assessment, a further charge to tax expense would result.
CONCENTRATION OF CREDIT RISKS, EXPOSURES AND FINANCIAL INSTRUMENTS: We manufacture, market, and distribute products for the various end markets described in Note F. Our operations are principally located in the United States, although we also have operations in China, Europe, Canada, Mexico and other various countries.
We maintain allowances for potential credit losses. We perform ongoing credit evaluations of our customers’ financial conditions and generally require no collateral from our customers, some of which are highly leveraged. Management also monitors the financial condition and status of other notes receivable. Other notes receivable primarily consist of notes accepted as partial payment for the divestiture of a business. Some of these companies are highly leveraged and the notes are not fully collateralized.
We have no material guarantees or liabilities for product warranties which require disclosure.
From time to time, we will enter into contracts to hedge foreign currency denominated transactions, natural gas purchases, and interest rates related to our debt. To minimize the risk of counterparty default, only highly-rated financial institutions that meet certain requirements are used. We do not anticipate that any of the financial institution counterparties will default on their obligations.
The carrying value of cash and short-term financial instruments approximates fair value due to the short maturity of those instruments.
76
OTHER RISKS: Although we obtain insurance for workers’ compensation, automobile, product and general liability, property loss and medical claims, we have elected to retain a significant portion of expected losses through the use of deductibles. Accrued liabilities include estimates for unpaid reported claims and for claims incurred but not yet reported. Provisions for losses are recorded based upon reasonable estimates of the aggregate liability for claims incurred utilizing our prior experience and information provided by our third-party administrators and insurance carriers.
DERIVATIVE FINANCIAL INSTRUMENTS: We utilize derivative financial instruments to manage market and financial risks related to interest rates, foreign currency and commodities. We seek to use derivative contracts that qualify for hedge accounting treatment; however some instruments that economically manage currency risk may not qualify for hedge accounting treatment. It is our policy not to speculate using derivative instruments.
Under hedge accounting, we formally document our hedge relationships, including identification of the hedging instruments and the hedged items, as well as our risk management objectives and strategies for entering into the hedge transaction. The process includes designating derivative instruments as hedges of specific assets, liabilities, firm commitments or forecasted transactions. We also formally assess both at inception and on a quarterly basis thereafter, whether the derivatives used in hedging transactions are highly effective in offsetting changes in either the fair value or cash flows of the hedged item. If it is determined that a derivative ceases to be highly effective, deferred gains or losses are recorded in the Consolidated Statements of Operations.
On the date the contract is entered into, we designate the derivative as one of the following types of hedging instruments and account for it as follows:
Cash Flow Hedge—
The hedge of a forecasted transaction or of the variability of cash flows to be received or paid related to a recognized asset or liability or anticipated transaction is designated as a cash flow hedge. The effective portion of the change in fair value is recorded in accumulated other comprehensive income. When the hedged item impacts the income statement, the gain or loss included in other comprehensive income is reported on the same line of the Consolidated Statements of Operations as the hedged item to match the gain or loss on the derivative to the gain or loss on the hedged item. Any ineffective portion of the changes in the fair value is immediately reported in the Consolidated Statements of Operations on the same line as the hedged item. Settlements associated with the sale or production of product are presented in operating cash flows and settlements associated with debt issuance are presented in financing cash flows.
Fair Value Hedge—
The hedge of a recognized asset or liability or an unrecognized firm commitment is designated as a fair value hedge. For fair value hedges, both the effective and ineffective portions of the changes in fair value of the derivative, along with the gain or loss on the hedged item that is attributable to the hedged risk, are recorded in earnings and reported in the Consolidated Statements of Operations on the same line as the hedged item. Cash flows from settled contracts are presented in the category consistent with the nature of the item being hedged.
FOREIGN CURRENCY TRANSLATION: The functional currency for most foreign operations is the local currency. The translation of foreign currencies into U.S. dollars is performed for balance sheet accounts using current exchange rates in effect at the balance sheet date and for income and expense accounts using monthly average exchange rates. The cumulative effects of translating the functional currencies into the U.S. dollar are included in comprehensive income.
RECLASSIFICATIONS: Certain reclassifications have been made to the prior years’ consolidated financial statements to conform to the 2014 presentation.
NEW ACCOUNTING GUIDANCE: In April 2014, the Financial Accounting Standards Board (FASB) issued updated guidance, Reporting Discontinued Operations and Disclosures of Disposals of Components of an entity. This guidance changes the criteria for determining which disposals can be presented as discontinued operations and modifies related disclosure requirements. We adopted this guidance on January 1, 2015, and we do not believe it will have a material impact on our future financial statements.
In May 2014, the FASB issued new authoritative literature, Revenue from Contracts with Customers, which supersedes much of the existing authoritative literature for revenue recognition. This guidance will be effective January 1, 2017. We are currently evaluating the newly issued guidance and the impact on our future financial statements.
B—Discontinued Operations
During 2014, we engaged an investment banker and began exploring strategic alternatives regarding the Store Fixtures reporting unit, including the possibility of divestiture of this business. During the third quarter of 2014, all of the criteria to classify this unit as held for sale and discontinued operations were met. During the fourth quarter of 2014, we sold the majority
77
of the Store Fixtures reporting unit for total consideration of
$59.2
and recorded an after-tax loss of
$4.7
, which is recognized in discontinued operations. We continue to pursue the sale of the remaining portion of the reporting unit. Store Fixtures was previously part of the Commercial Fixturing & Components Segment and is classified as discontinued operations, net of income taxes, in the Consolidated Statements of Operations for all periods presented.
In 2013, we exited
three
small operations that were also recorded in discontinued operations for all periods presented:
|
•
|
We closed our final location that produced wire dishwasher racks, thereby discontinuing that line of business. This operation was previously in our Industrial Materials segment. We also incurred impairment charges related to these operations in 2012 as discussed in Note C. Tax benefits related to this business were recorded in both 2012 and 2013.
|
|
•
|
We divested the specialty trailers portion of the Commercial Vehicle Products (CVP) unit. This branch was previously part of the Specialized Products segment. No significant gains or losses were realized on the sale of this business.
|
|
•
|
We closed a cotton-based erosion control products operation that was previously part of the Industrial Materials segment. Charges of
$1.9
were recorded in 2013 to reflect estimates of fair value less costs to sell, including
$1.5
of fixed asset impairments as discussed in Note C.
|
The table below includes activity related to these operations:
|
Year Ended
|
|||||||||||
|
2014
|
2013
|
2012
|
|||||||||
|
External sales:
|
|
|
|||||||||
|
Commercial Fixturing & Components - Store Fixtures
|
$
|
167.4
|
|
$
|
268.8
|
|
$
|
291.6
|
|
||
|
Industrial Materials:
|
|||||||||||
|
Wire dishwasher racks
|
—
|
|
4.1
|
|
11.1
|
|
|||||
|
Cotton-based erosion control products
|
—
|
|
.1
|
|
.1
|
|
|||||
|
Specialized Products - the specialty trailers portion of the CVP unit
|
—
|
|
.5
|
|
3.5
|
|
|||||
|
Total external sales
|
$
|
167.4
|
|
$
|
273.5
|
|
$
|
306.3
|
|
||
|
Earnings (loss):
|
|
|
|||||||||
|
Commercial Fixturing & Components - Store Fixtures (1)
|
$
|
(120.9
|
)
|
$
|
10.2
|
|
$
|
19.0
|
|
||
|
Industrial Materials:
|
|||||||||||
|
Wire dishwasher racks
|
—
|
|
1.0
|
|
(.1
|
)
|
|||||
|
Cotton-based erosion control products
|
—
|
|
(3.1
|
)
|
(1.2
|
)
|
|||||
|
Specialized Products - the specialty trailers portion of the CVP unit
|
—
|
|
(.7
|
)
|
(.8
|
)
|
|||||
|
Subsequent activity related to divestitures completed prior to 2011 (2)
|
(35.4
|
)
|
.5
|
|
3.9
|
|
|||||
|
Earnings (loss) before interest and income taxes (EBIT)
|
(156.3
|
)
|
7.9
|
|
20.8
|
|
|||||
|
Income tax benefit (3)
|
32.3
|
|
5.5
|
|
(2.1
|
)
|
|||||
|
Earnings (loss) from discontinued operations, net of tax
|
$
|
(124.0
|
)
|
$
|
13.4
|
|
$
|
18.7
|
|
||
______________________________
|
(1)
|
This includes goodwill impairment charges of
$108.0
in 2014 as discussed in Note E.
|
|
(2)
|
Subsequent activity for businesses divested in prior years has been reported as discontinued operations in the table above, including a 2014 antitrust litigation settlement of
$35.3
, associated with our former Prime Foam Products unit. Also reflected above is an unrelated cash litigation settlement of
$3.9
received in 2012 associated with our Prime Foam Products unit. This unit was sold in March 2007 and was previously part of the Residential Furnishings segment.
|
|
(3)
|
The 2014 tax benefit is primarily related to the Store Fixtures goodwill impairment and the Prime Foam litigation. The 2013 and 2012 tax amounts include benefits related to a worthless stock deduction and the excess outside tax basis of the subsidiary that produced wire dishwasher racks, respectively.
|
78
Net assets held for sale by segment at December 31 were as follows:
|
|
2014
|
2013
|
|||||||||||||
|
Assets
|
Liabilities
|
Net Assets
|
Assets
|
||||||||||||
|
Residential
|
$
|
4.1
|
|
$
|
—
|
|
$
|
4.1
|
|
$
|
8.0
|
|
|||
|
Commercial Fixturing & Components
|
20.1
|
|
5.6
|
|
14.5
|
|
2.3
|
|
|||||||
|
Aluminum Products
|
—
|
|
—
|
|
—
|
|
.4
|
|
|||||||
|
Industrial Materials
|
3.4
|
|
—
|
|
3.4
|
|
2.6
|
|
|||||||
|
Specialized Products
|
5.2
|
|
—
|
|
5.2
|
|
5.8
|
|
|||||||
|
$
|
32.8
|
|
$
|
5.6
|
|
$
|
27.2
|
|
$
|
19.1
|
|
||||
The major classes of assets and liabilities held for sale at December 31 included in the Consolidated Balance Sheet line items noted below were as follows:
|
|
2014
|
2013
|
|||||
|
Included in Other current assets:
|
|||||||
|
Trade receivables, net
|
$
|
7.0
|
|
$
|
—
|
|
|
|
Other receivables, net
|
.3
|
|
—
|
|
|||
|
Inventories, net
|
3.0
|
|
—
|
|
|||
|
Other current assets
|
.1
|
|
—
|
|
|||
|
Total current assets held for sale
|
10.4
|
|
—
|
|
|||
|
Included in Sundry assets:
|
|||||||
|
Property, plant and equipment, net *
|
20.4
|
|
19.1
|
|
|||
|
Other intangibles, net
|
.6
|
|
—
|
|
|||
|
Sundry
|
1.4
|
|
—
|
|
|||
|
Total non-current assets held for sale
|
22.4
|
|
19.1
|
|
|||
|
Total assets held for sale
|
32.8
|
|
19.1
|
|
|||
|
Included in Other current liabilities:
|
|||||||
|
Accounts payable
|
3.7
|
|
—
|
|
|||
|
Accrued expenses
|
1.5
|
|
—
|
|
|||
|
Other current liabilities
|
.3
|
|
—
|
|
|||
|
Total current liabilities held for sale
|
5.5
|
|
—
|
|
|||
|
Included in Other long-term liabilities:
|
|||||||
|
Deferred income tax
|
.1
|
|
—
|
|
|||
|
Total liabilities held for sale
|
5.6
|
|
—
|
|
|||
|
Net assets held for sale
|
$
|
27.2
|
|
$
|
19.1
|
|
|
______________________
* This table includes
$15.2
and
$19.1
of property, plant and equipment held for sale at December 31, 2014 and 2013, respectively, primarily associated with the closings of various operations and prior year restructurings.
C—Impairment Charges
Pre-tax impact of impairment charges is summarized in the following table.
Other long-lived asset impairments are reported in "Other (income) expense, net." Charges associated with discontinued operations are reported on the Statements of Operations in “Earnings (loss) from discontinued operations, net of tax.”
79
|
Year Ended
|
|||||||||||||||||||||||||||
|
2014
|
2013
|
2012
|
|||||||||||||||||||||||||
|
|
Goodwill Impairment
|
Other Long-Lived Asset Impairments
|
Total Impairments
|
Goodwill Impairment
|
Other Long-Lived Asset Impairments
|
Total Impairments
|
Other Long-Lived Asset Impairments
|
||||||||||||||||||||
|
Continuing operations:
|
|
|
|
||||||||||||||||||||||||
|
Residential Furnishings
|
$
|
—
|
|
$
|
1.2
|
|
$
|
1.2
|
|
$
|
—
|
|
$
|
.8
|
|
$
|
.8
|
|
$
|
.1
|
|
||||||
|
Industrial Materials
|
—
|
|
—
|
|
—
|
|
—
|
|
—
|
|
—
|
|
.6
|
|
|||||||||||||
|
Specialized Products:
|
|
|
|
|
|
|
|||||||||||||||||||||
|
CVP unit
|
—
|
|
—
|
|
—
|
|
63.0
|
|
—
|
|
63.0
|
|
—
|
|
|||||||||||||
|
Other units
|
—
|
|
.1
|
|
.1
|
|
—
|
|
—
|
|
—
|
|
.1
|
|
|||||||||||||
|
Total continuing operations
|
—
|
|
1.3
|
|
1.3
|
|
63.0
|
|
.8
|
|
63.8
|
|
.8
|
|
|||||||||||||
|
Discontinued operations:
|
|
|
|
||||||||||||||||||||||||
|
Commercial Fixturing & Components - Store Fixtures
|
108.0
|
|
—
|
|
108.0
|
|
—
|
|
—
|
|
—
|
|
—
|
|
|||||||||||||
|
Industrial Materials:
|
|||||||||||||||||||||||||||
|
Cotton-based erosion control products
|
—
|
|
—
|
|
—
|
|
—
|
|
1.5
|
|
1.5
|
|
—
|
|
|||||||||||||
|
Wire dishwasher racks
|
—
|
|
—
|
|
—
|
|
—
|
|
—
|
|
—
|
|
.9
|
|
|||||||||||||
|
Subsequent activity related to divestitures completed prior to 2012
|
—
|
|
—
|
|
—
|
|
—
|
|
.1
|
|
.1
|
|
—
|
|
|||||||||||||
|
Total discontinued operations
|
108.0
|
|
—
|
|
108.0
|
|
—
|
|
1.6
|
|
1.6
|
|
.9
|
|
|||||||||||||
|
Total impairment charges
|
$
|
108.0
|
|
$
|
1.3
|
|
$
|
109.3
|
|
$
|
63.0
|
|
$
|
2.4
|
|
$
|
65.4
|
|
$
|
1.7
|
|
||||||
Other Long-Lived Assets
As discussed in Note A, we test other long-lived assets for recoverability at year end and whenever events or changes in circumstances indicate that the carrying value may not be recoverable. Fair value and the resulting impairment charges noted above were based primarily upon offers from potential buyers or third party estimates of fair value less selling costs.
Goodwill
Goodwill is required to be tested for impairment at least once a year and as triggering events may occur. We perform our annual goodwill impairment review in the second quarter of each year as discussed in Note A.
Fair value of reporting units is determined using a combination of two valuation methods: a market approach and an income approach. Each method is generally given equal weight in determining the fair value assigned to each reporting unit. Absent an indication of fair value from a potential buyer or similar specific transaction, we believe that the use of these two methods provides a reasonable estimate of a reporting unit’s fair value. Assumptions common to both methods are operating plans and economic projections, which are used to project future revenues, earnings, and after-tax cash flows for each reporting unit. These assumptions are applied consistently for both methods.
The market approach estimates fair value by first determining price-to-earnings ratios for comparable publicly-traded companies with similar characteristics of the reporting unit. The price-to-earnings ratio for comparable companies is based upon current enterprise value compared to projected earnings for the next two years. The enterprise value is based upon current market capitalization and includes a
25%
control premium. Projected earnings are based upon market analysts’ projections. The earnings ratios are applied to the projected earnings of the comparable reporting unit to estimate fair value. Management believes this approach is appropriate because it provides a fair value estimate using multiples from entities with operations and economic characteristics comparable to our reporting units.
The income approach is based on projected future (debt-free) cash flow that is discounted to present value using factors that consider the timing and risk of future cash flows. Management believes that this approach is appropriate because it provides a fair value estimate based upon the reporting unit’s expected long-term operating cash flow performance. Discounted
80
cash flow projections are based on
10
-year financial forecasts developed from operating plans and economic projections noted above, sales growth, estimates of future expected changes in operating margins, terminal value growth rates, future capital expenditures and changes in working capital requirements.
If a triggering event occurs, special consideration is given to the new circumstances when determining the fair value of the impacted reporting unit.
2014 Goodwill Impairment Review
We performed our annual goodwill impairment review in June 2014, and on July 14, 2014, concluded that a goodwill impairment charge was required for one reporting unit, Store Fixtures which is now recorded as discontinued operations, and was previously part of the Commercial Fixturing and Components segment.
The Store Fixtures reporting unit was dependent upon capital spending by retailers on both new stores and remodeling of existing stores. Because of the seasonal nature of the fixture and display industry (where revenue and profitability were typically expected to increase in the second and third quarters assuming the normal historical pattern of heavy shipments during these months) we reasonably anticipated being awarded significant customer orders in the second quarter of 2014. However, as the second quarter progressed, anticipated orders did not materialize and the Store Fixtures business deteriorated, with declines most pronounced in May and June. Taking these recent developments into account, we lowered our projection of future margins and growth rates (from
4.8%
in prior year's review to
.5%
in the current year for 10-year compound annual growth rate for EBIT plus depreciation and amortization (EBITDA)) and increased the discount rate from
10.5%
to
12%
, causing fair value to fall below carrying value. The lower expectations of future revenue and profitability were due to reduced overall market demand for the shelving, counters, showcases and garment racks as many retailers are reducing their investments in traditional store space and focusing more on e-commerce initiatives.
Because the fair value of the Store Fixtures reporting unit had fallen below recorded book values, we performed the second step of the test which requires a fair value assessment of all assets and liabilities of the reporting unit to calculate an implied goodwill amount. This resulted in a
$108.0
goodwill impairment charge that was recorded in the second quarter of 2014. This charge reflects the complete impairment of all goodwill associated with the Store Fixtures reporting unit.
As a result of the above circumstances, we also determined a triggering event had occurred in the second quarter to test other long-lived assets which were evaluated for impairment under the held for use model. No long-lived asset impairments (excluding goodwill) were indicated during this review. During the third quarter of 2014, all of the criteria to classify this unit as held for sale and discontinued operations were met as discussed in Note B.
2013 Goodwill Impairment Reviews
During 2013, we began considering strategic alternatives for our CVP unit, including possible divestiture of the business. Potential buyers' initial indications of value received during the second and third quarters were reasonably consistent with our fair value estimates used for the annual goodwill impairment test performed in June 2013. During 2013's fourth quarter, performance of the business deteriorated. It became apparent in December 2013 that current market values for CVP's assets had fallen below recorded book values. This decline in market values of the assets resulted from lower expectations of future revenue and profitability, reflecting reduced market demand for the racks, shelving, and cabinets used in telecom, cable and delivery vans.
The events of the fourth quarter were considered a triggering event, which required us to perform an impairment review. Because the held for sale criteria for the CVP unit was not met, it was evaluated for impairment in December under the held for use model. No long-lived asset impairments (excluding goodwill) were indicated during the fourth quarter review. However, we also evaluated the remaining useful life for the intangible assets resulting in accelerated amortization of
$3.8
in the fourth quarter of 2013 for selected CVP customer-related intangible assets.
We determined fair value for the first step of the interim goodwill impairment test based upon market multiples of comparable publicly-traded companies with similar characteristics as well as multiples derived from offers received during potential sale negotiations. These multiples were applied to lower profitability estimates, which was the result of CVP's fourth quarter business deterioration. Because fair value had fallen below recorded book values, we performed the second step of the test which requires a fair value assessment of all assets and liabilities of the reporting unit to calculate an implied goodwill amount, and a
$63.0
goodwill impairment charge was recognized in the fourth quarter of 2013.
81
The fair values of reporting units in relation to their respective carrying values and significant assumptions used in the June 2014 review are presented in the table below. The information below excludes Store Fixtures, as this unit had no goodwill remaining after the second quarter 2014 impairment.
|
Percentage of Fair Value in Excess of Carrying Value
|
December 31,
2014
Goodwill Value
|
10-year
Compound
Annual Growth
Rate Range for Sales
|
Terminal
Values Long-
term Growth
Rate for Debt-Free Cash Flow
|
Discount Rate
Ranges
|
||||||
|
< 25%
|
$
|
—
|
|
|||||||
|
25-49%
|
203.4
|
|
2.0% - 5.5%
|
3.0
|
%
|
9.5% - 10.0%
|
||||
|
50% - 74%
|
383.2
|
|
.5% - 3.8%
|
3.0
|
%
|
9.0% - 12.0%
|
||||
|
75%+
|
232.4
|
|
3.7% - 8.2%
|
3.0
|
%
|
9.0% - 9.5%
|
||||
|
|
$
|
819.0
|
|
.5% - 8.2%
|
3.0
|
%
|
9.0% - 12.0%
|
|||
D—Restructuring
We have historically implemented various cost reduction initiatives to improve our operating cost structures. These cost initiatives have, among other actions, included workforce reductions and the closure or consolidation of certain operations. Our total restructuring-related costs for the three years ended December 31 were comprised of:
|
|
Year Ended December 31
|
||||||||||
|
|
2014
|
2013
|
2012
|
||||||||
|
Continuing operations:
|
|
|
|
||||||||
|
Charged to other (income) expense, net:
|
|
|
|
||||||||
|
Severance and other restructuring costs
|
$
|
.9
|
|
$
|
2.1
|
|
$
|
3.2
|
|
||
|
(Gain) loss from sale of assets
|
(.1
|
)
|
(.2
|
)
|
.3
|
|
|||||
|
Total continuing operations
|
.8
|
|
1.9
|
|
3.5
|
|
|||||
|
Discontinued operations:
|
|
|
|
||||||||
|
Severance and other restructuring costs
|
1.8
|
|
.2
|
|
4.3
|
|
|||||
|
Loss (gain) from sale of assets
|
8.6
|
|
(.5
|
)
|
(2.1
|
)
|
|||||
|
Total discontinued operations
|
10.4
|
|
(.3
|
)
|
2.2
|
|
|||||
|
Total restructuring and restructuring-related cost
|
$
|
11.2
|
|
$
|
1.6
|
|
$
|
5.7
|
|
||
|
Portion of total that represents cash charges
|
$
|
2.7
|
|
$
|
2.3
|
|
$
|
7.5
|
|
||
Restructuring and restructuring-related charges (income) by segment were as follows:
|
|
Year Ended December 31
|
||||||||||
|
|
2014
|
2013
|
2012
|
||||||||
|
Continuing operations:
|
|
|
|
||||||||
|
Residential Furnishings
|
$
|
—
|
|
$
|
1.7
|
|
$
|
2.3
|
|
||
|
Industrial Materials
|
.1
|
|
(.1
|
)
|
.6
|
|
|||||
|
Specialized Products
|
.7
|
|
.3
|
|
.6
|
|
|||||
|
Total continuing operations
|
.8
|
|
1.9
|
|
3.5
|
|
|||||
|
Discontinued operations
|
10.4
|
|
(.3
|
)
|
2.2
|
|
|||||
|
Total
|
$
|
11.2
|
|
$
|
1.6
|
|
$
|
5.7
|
|
||
82
The accrued liability associated with our total restructuring initiatives consisted of the following:
|
Balance at
December 31,
2012
|
2013
Charges
|
2013
Payments
|
Balance at
December 31,
2013
|
2014
Charges
|
2014 Payments
|
Balance at
December 31,
2014
|
|||||||||||||||||||||
|
Termination benefits
|
$
|
1.1
|
|
$
|
.3
|
|
$
|
1.3
|
|
$
|
.1
|
|
$
|
2.6
|
|
$
|
1.6
|
|
$
|
1.1
|
|
||||||
|
Contract termination costs
|
.6
|
|
.1
|
|
.7
|
|
—
|
|
—
|
|
—
|
|
—
|
|
|||||||||||||
|
Other restructuring costs
|
.4
|
|
1.9
|
|
1.6
|
|
.7
|
|
.1
|
|
.3
|
|
.5
|
|
|||||||||||||
|
|
$
|
2.1
|
|
$
|
2.3
|
|
$
|
3.6
|
|
$
|
.8
|
|
$
|
2.7
|
|
$
|
1.9
|
|
$
|
1.6
|
|
||||||
E—Goodwill and Other Intangible Assets
The changes in the carrying amounts of goodwill are as follows:
|
Residential
Furnishings
|
Commercial
Fixturing &
Components
|
Industrial
Materials
|
Specialized
Products
|
Total
|
|||||||||||||||
|
Net goodwill as of January 1, 2013
|
$
|
390.0
|
|
$
|
199.4
|
|
$
|
127.8
|
|
$
|
274.3
|
|
$
|
991.5
|
|
||||
|
Additions for current year acquisitions
|
—
|
|
—
|
|
6.1
|
|
—
|
|
6.1
|
|
|||||||||
|
Adjustments to prior year acquisitions
|
—
|
|
—
|
|
(.4
|
)
|
—
|
|
(.4
|
)
|
|||||||||
|
Reductions for sale of business
|
—
|
|
—
|
|
—
|
|
(.3
|
)
|
(.3
|
)
|
|||||||||
|
Impairment charge (1)
|
—
|
|
—
|
|
—
|
|
(63.0
|
)
|
(63.0
|
)
|
|||||||||
|
Foreign currency translation adjustment/other
|
(3.9
|
)
|
(2.9
|
)
|
.7
|
|
(1.0
|
)
|
(7.1
|
)
|
|||||||||
|
Net goodwill as of December 31, 2013
|
386.1
|
|
196.5
|
|
134.2
|
|
210.0
|
|
926.8
|
|
|||||||||
|
Additions for current year acquisitions
|
19.0
|
|
—
|
|
—
|
|
—
|
|
19.0
|
|
|||||||||
|
Adjustments to prior year acquisitions
|
.1
|
|
—
|
|
(.1
|
)
|
—
|
|
—
|
|
|||||||||
|
Impairment charge (2)
|
—
|
|
(108.0
|
)
|
—
|
|
—
|
|
(108.0
|
)
|
|||||||||
|
Foreign currency translation adjustment/other
|
(7.6
|
)
|
(1.6
|
)
|
(.6
|
)
|
(9.0
|
)
|
(18.8
|
)
|
|||||||||
|
Net goodwill as of December 31, 2014
|
$
|
397.6
|
|
$
|
86.9
|
|
$
|
133.5
|
|
$
|
201.0
|
|
$
|
819.0
|
|
||||
|
Net goodwill as of December 31, 2014 is comprised of:
|
|||||||||||||||||||
|
Gross goodwill
|
$
|
397.6
|
|
$
|
337.5
|
|
$
|
133.5
|
|
$
|
264.0
|
|
$
|
1,132.6
|
|
||||
|
Accumulated impairment losses
|
—
|
|
(250.6
|
)
|
—
|
|
(63.0
|
)
|
(313.6
|
)
|
|||||||||
|
Net goodwill as of December 31, 2014
|
$
|
397.6
|
|
$
|
86.9
|
|
$
|
133.5
|
|
$
|
201.0
|
|
$
|
819.0
|
|
||||
_________________
(1) We recorded a goodwill impairment charge related to the CVP unit as outlined in Note C.
(2) We recorded a goodwill impairment charge related to the Store Fixture unit as outlined in Note C.
83
The gross carrying amount and accumulated amortization by major amortized intangible asset class and intangible assets acquired during the period presented included in "Other intangibles" on the Consolidated Balance Sheets are as follows:
|
|
Debt
Issue
Costs
|
Patents
and
Trademarks
|
Non-compete
Agreements
|
Customer- Related Intangibles
|
Supply
Agreements
and Other
|
Total
|
|||||||||||||||||
|
2014
|
|||||||||||||||||||||||
|
Gross carrying amount
|
$
|
10.1
|
|
$
|
57.8
|
|
$
|
7.6
|
|
$
|
223.9
|
|
$
|
35.0
|
|
$
|
334.4
|
|
|||||
|
Accumulated amortization
|
4.2
|
|
29.7
|
|
1.4
|
|
78.8
|
|
15.6
|
|
129.7
|
|
|||||||||||
|
Net other intangibles as of December 31, 2014
|
$
|
5.9
|
|
$
|
28.1
|
|
$
|
6.2
|
|
$
|
145.1
|
|
$
|
19.4
|
|
$
|
204.7
|
|
|||||
|
|
|
|
|
|
|
||||||||||||||||||
|
Acquired during 2014:
|
|||||||||||||||||||||||
|
Acquired related to business acquisitions
|
$
|
—
|
|
$
|
5.0
|
|
$
|
5.5
|
|
$
|
1.1
|
|
$
|
2.5
|
|
$
|
14.1
|
|
|||||
|
Acquired outside business acquisitions
|
2.9
|
|
1.4
|
|
.2
|
|
2.3
|
|
7.3
|
|
14.1
|
|
|||||||||||
|
Total acquired in 2014
|
$
|
2.9
|
|
$
|
6.4
|
|
$
|
5.7
|
|
$
|
3.4
|
|
$
|
9.8
|
|
$
|
28.2
|
|
|||||
|
Weighted average amortization period in years for items acquired in 2014
|
10.0
|
|
11.3
|
|
5.0
|
|
11.2
|
|
7.1
|
|
8.4
|
|
|||||||||||
|
2013
|
|||||||||||||||||||||||
|
Gross carrying amount
|
$
|
9.5
|
|
$
|
53.8
|
|
$
|
7.7
|
|
$
|
221.9
|
|
$
|
24.9
|
|
$
|
317.8
|
|
|||||
|
Accumulated amortization
|
5.5
|
|
28.2
|
|
5.2
|
|
63.9
|
|
11.6
|
|
114.4
|
|
|||||||||||
|
Net other intangibles as of December 31, 2013
|
$
|
4.0
|
|
$
|
25.6
|
|
$
|
2.5
|
|
$
|
158.0
|
|
$
|
13.3
|
|
$
|
203.4
|
|
|||||
|
|
|
||||||||||||||||||||||
|
Acquired during 2013:
|
|||||||||||||||||||||||
|
Acquired related to business acquisitions
|
$
|
—
|
|
$
|
.7
|
|
$
|
.5
|
|
$
|
9.7
|
|
$
|
1.4
|
|
$
|
12.3
|
|
|||||
|
Acquired outside business acquisitions
|
—
|
|
1.6
|
|
—
|
|
5.9
|
|
5.3
|
|
12.8
|
|
|||||||||||
|
Total acquired in 2013
|
$
|
—
|
|
$
|
2.3
|
|
$
|
.5
|
|
$
|
15.6
|
|
$
|
6.7
|
|
$
|
25.1
|
|
|||||
|
Weighted average amortization period in years for items acquired in 2013
|
0.0
|
|
16.3
|
|
4.8
|
|
9.6
|
|
6.1
|
|
9.2
|
|
|||||||||||
Estimated amortization expense for items included in our December 31, 2014 balance sheet in each of the next five years is as follows:
|
Year ended December 31
|
|
||
|
2015
|
$
|
24
|
|
|
2016
|
23
|
|
|
|
2017
|
22
|
|
|
|
2018
|
20
|
|
|
|
2019
|
19
|
|
|
F—Segment Information
We have four operating segments that supply a wide range of products:
|
•
|
Residential Furnishings—components for bedding, furniture and other furnishings, as well as related consumer products
|
|
•
|
Commercial Fixturing & Components—components and products for the office seating market
|
|
•
|
Industrial Materials—drawn steel wire, specialty wire products, titanium and nickel tubing for the aerospace industry and welded steel tubing
|
|
•
|
Specialized Products—automotive seating components, specialized machinery and equipment, and commercial vehicle interiors
|
84
Our reportable segments are the same as our operating segments, which also correspond with our management organizational structure. Each reportable segment has a senior operating vice-president that reports to the chief operating officer. The chief operating officer in turn reports directly to the chief operating decision maker. The operating results and financial information reported through the segment structure are regularly reviewed and used by the chief operating decision maker to evaluate segment performance, allocate overall resources and determine management incentive compensation.
Separately, we also utilize a role-based approach (Grow, Core, Fix or Divest) as a supplemental management tool to ensure capital (which is a subset of the overall resources referred to above) is efficiently allocated within the reportable segment structure.
The accounting principles used in the preparation of the segment information are the same as those used for the consolidated financial statements, except that the segment assets and income reflect the FIFO basis of accounting for inventory. Certain inventories are accounted for using the LIFO basis in the consolidated financial statements. We evaluate performance based on EBIT. Intersegment sales are made primarily at prices that approximate market-based selling prices. Centrally incurred costs are allocated to the segments based on estimates of services used by the segment. Certain of our general and administrative costs and miscellaneous corporate income and expenses are allocated to the segments based on sales. These allocated corporate costs include depreciation and other costs and income related to assets that are not allocated or otherwise included in the segment assets.
A summary of segment results for the periods presented are as follows:
|
|
Year Ended December 31
|
||||||||||||||
|
|
External
Sales
|
Inter-
Segment
Sales
|
Total
Sales
|
EBIT
|
|||||||||||
|
2014
|
|
|
|
|
|||||||||||
|
Residential Furnishings
|
$
|
2,183.4
|
|
$
|
39.8
|
|
$
|
2,223.2
|
|
$
|
161.3
|
|
|||
|
Commercial Fixturing & Components
|
194.3
|
|
4.6
|
|
198.9
|
|
13.0
|
|
|||||||
|
Industrial Materials
|
605.3
|
|
259.7
|
|
865.0
|
|
55.8
|
|
|||||||
|
Specialized Products
|
799.3
|
|
62.4
|
|
861.7
|
|
117.4
|
|
|||||||
|
Intersegment eliminations and other
|
|
|
|
(15.1
|
)
|
||||||||||
|
Adjustment to LIFO method
|
|
|
|
(.9
|
)
|
||||||||||
|
|
$
|
3,782.3
|
|
$
|
366.5
|
|
$
|
4,148.8
|
|
$
|
331.5
|
|
|||
|
2013
|
|
|
|
|
|||||||||||
|
Residential Furnishings
|
$
|
1,944.0
|
|
$
|
23.0
|
|
$
|
1,967.0
|
|
$
|
169.4
|
|
|||
|
Commercial Fixturing & Components
|
182.5
|
|
4.0
|
|
186.5
|
|
10.7
|
|
|||||||
|
Industrial Materials
|
612.8
|
|
231.0
|
|
843.8
|
|
71.3
|
|
|||||||
|
Specialized Products
|
737.9
|
|
52.5
|
|
790.4
|
|
26.2
|
|
|||||||
|
Intersegment eliminations and other
|
|
|
|
.9
|
|
||||||||||
|
Adjustment to LIFO method
|
|
|
|
(3.9
|
)
|
||||||||||
|
|
$
|
3,477.2
|
|
$
|
310.5
|
|
$
|
3,787.7
|
|
$
|
274.6
|
|
|||
|
2012
|
|
|
|
|
|||||||||||
|
Residential Furnishings
|
$
|
1,895.0
|
|
$
|
8.8
|
|
$
|
1,903.8
|
|
$
|
152.2
|
|
|||
|
Commercial Fixturing & Components
|
186.7
|
|
3.8
|
|
190.5
|
|
15.0
|
|
|||||||
|
Industrial Materials
|
621.7
|
|
249.4
|
|
871.1
|
|
65.1
|
|
|||||||
|
Specialized Products
|
711.1
|
|
45.9
|
|
757.0
|
|
86.1
|
|
|||||||
|
Intersegment eliminations and other
|
|
|
|
(6.8
|
)
|
||||||||||
|
Adjustment to LIFO method
|
|
|
|
12.8
|
|
||||||||||
|
|
$
|
3,414.5
|
|
$
|
307.9
|
|
$
|
3,722.4
|
|
$
|
324.4
|
|
|||
85
Average assets for our segments are shown in the table below and reflect the basis for return measures used by management to evaluate segment performance. These segment totals include working capital (all current assets and current liabilities) plus net property, plant and equipment. Segment assets for all years are reflected at their estimated average for the year. Acquired companies’ long-lived assets as disclosed below include property, plant and equipment and other long-term assets.
|
|
Year Ended December 31
|
||||||||||||||
|
|
Assets
|
Additions
to
Property,
Plant and
Equipment
|
Acquired
Companies’
Long-Lived
Assets
|
Depreciation
And
Amortization
|
|||||||||||
|
2014
|
|
|
|
|
|||||||||||
|
Residential Furnishings
|
$
|
595.2
|
|
$
|
47.8
|
|
$
|
60.5
|
|
$
|
48.1
|
|
|||
|
Commercial Fixturing & Components
|
49.2
|
|
2.1
|
|
—
|
|
3.5
|
|
|||||||
|
Industrial Materials
|
256.2
|
|
13.7
|
|
—
|
|
23.1
|
|
|||||||
|
Specialized Products
|
245.1
|
|
27.5
|
|
—
|
|
24.3
|
|
|||||||
|
Other (1)
|
90.4
|
|
1.4
|
|
—
|
|
2.9
|
|
|||||||
|
Average current liabilities included in segment numbers above
|
520.2
|
|
—
|
|
—
|
|
—
|
|
|||||||
|
Unallocated assets (2)
|
1,451.4
|
|
1.6
|
|
—
|
|
16.0
|
|
|||||||
|
Difference between average assets and year-end balance sheet
|
(67.1
|
)
|
—
|
|
—
|
|
—
|
|
|||||||
|
|
$
|
3,140.6
|
|
$
|
94.1
|
|
$
|
60.5
|
|
$
|
117.9
|
|
|||
|
2013
|
|
|
|
|
|||||||||||
|
Residential Furnishings
|
$
|
586.5
|
|
$
|
36.5
|
|
$
|
.6
|
|
$
|
47.2
|
|
|||
|
Commercial Fixturing & Components
|
48.7
|
|
1.5
|
|
—
|
|
3.7
|
|
|||||||
|
Industrial Materials
|
248.0
|
|
12.6
|
|
31.0
|
|
21.8
|
|
|||||||
|
Specialized Products
|
225.0
|
|
26.7
|
|
3.3
|
|
27.7
|
|
|||||||
|
Other (1)
|
96.2
|
|
1.1
|
|
—
|
|
6.1
|
|
|||||||
|
Average current liabilities included in segment numbers above
|
460.6
|
|
—
|
|
—
|
|
—
|
|
|||||||
|
Unallocated assets (2)
|
1,492.4
|
|
2.2
|
|
—
|
|
16.1
|
|
|||||||
|
Difference between average assets and year-end balance sheet
|
(49.3
|
)
|
—
|
|
—
|
|
—
|
|
|||||||
|
|
$
|
3,108.1
|
|
$
|
80.6
|
|
$
|
34.9
|
|
$
|
122.6
|
|
|||
|
2012
|
|
|
|
|
|||||||||||
|
Residential Furnishings
|
$
|
602.9
|
|
$
|
22.5
|
|
$
|
12.9
|
|
$
|
46.4
|
|
|||
|
Commercial Fixturing & Components
|
51.1
|
|
2.0
|
|
—
|
|
4.3
|
|
|||||||
|
Industrial Materials
|
237.1
|
|
14.3
|
|
182.4
|
|
22.8
|
|
|||||||
|
Specialized Products
|
225.4
|
|
23.4
|
|
—
|
|
24.6
|
|
|||||||
|
Other (1)
|
116.2
|
|
3.2
|
|
—
|
|
7.6
|
|
|||||||
|
Average current liabilities included in segment numbers above
|
440.7
|
|
—
|
|
—
|
|
—
|
|
|||||||
|
Unallocated assets (2)
|
1,678.2
|
|
5.6
|
|
—
|
|
13.3
|
|
|||||||
|
Difference between average assets and year-end balance sheet
|
(96.7
|
)
|
—
|
|
—
|
|
—
|
|
|||||||
|
|
$
|
3,254.9
|
|
$
|
71.0
|
|
$
|
195.3
|
|
$
|
119.0
|
|
|||
______________________________
|
(1)
|
Businesses sold or classified as discontinued operations during the years presented.
|
|
(2)
|
Unallocated assets consist primarily of goodwill, other intangibles, cash and deferred tax assets. Unallocated depreciation and amortization consists primarily of depreciation of non-operating assets and amortization of debt issue costs.
|
86
Revenues from external customers, by product line, are as follows:
|
|
Year Ended December 31
|
||||||||||
|
|
2014
|
2013
|
2012
|
||||||||
|
Residential Furnishings
|
|
|
|
||||||||
|
Bedding group
|
$
|
802.2
|
|
$
|
660.9
|
|
$
|
657.6
|
|
||
|
Furniture group
|
708.9
|
|
673.2
|
|
676.9
|
|
|||||
|
Fabric & Carpet Underlay group
|
672.3
|
|
609.9
|
|
560.5
|
|
|||||
|
|
2,183.4
|
|
1,944.0
|
|
1,895.0
|
|
|||||
|
Commercial Fixturing & Components
|
|
|
|
||||||||
|
Work Furniture group
|
194.3
|
|
182.5
|
|
186.7
|
|
|||||
|
|
194.3
|
|
182.5
|
|
186.7
|
|
|||||
|
Industrial Materials
|
|
|
|
||||||||
|
Wire group
|
387.0
|
|
428.0
|
|
457.9
|
|
|||||
|
Tubing group
|
218.3
|
|
184.8
|
|
163.8
|
|
|||||
|
|
605.3
|
|
612.8
|
|
621.7
|
|
|||||
|
Specialized Products
|
|
|
|
||||||||
|
Automotive group
|
589.4
|
|
502.7
|
|
463.5
|
|
|||||
|
Commercial Vehicle Products group
|
110.4
|
|
109.0
|
|
137.7
|
|
|||||
|
Machinery group
|
99.5
|
|
126.2
|
|
109.9
|
|
|||||
|
|
799.3
|
|
737.9
|
|
711.1
|
|
|||||
|
|
$
|
3,782.3
|
|
$
|
3,477.2
|
|
$
|
3,414.5
|
|
||
Our principal operations outside of the United States are presented in the following geographic information, based on the area of manufacture.
|
Year Ended December 31
|
|||||||||||
|
|
2014
|
2013
|
2012
|
||||||||
|
External sales
|
|
|
|
||||||||
|
United States
|
$
|
2,599.0
|
|
$
|
2,449.9
|
|
$
|
2,430.2
|
|
||
|
Europe
|
422.7
|
|
351.7
|
|
326.2
|
|
|||||
|
China
|
390.0
|
|
335.5
|
|
311.9
|
|
|||||
|
Canada
|
206.5
|
|
201.6
|
|
213.2
|
|
|||||
|
Mexico
|
90.1
|
|
69.6
|
|
64.5
|
|
|||||
|
Other
|
74.0
|
|
68.9
|
|
68.5
|
|
|||||
|
|
$
|
3,782.3
|
|
$
|
3,477.2
|
|
$
|
3,414.5
|
|
||
|
Tangible long-lived assets
|
|
|
|
||||||||
|
United States
|
$
|
347.2
|
|
$
|
363.6
|
|
$
|
383.9
|
|
||
|
Europe
|
124.3
|
|
124.5
|
|
102.7
|
|
|||||
|
China
|
40.5
|
|
35.7
|
|
35.9
|
|
|||||
|
Canada
|
25.6
|
|
25.0
|
|
21.1
|
|
|||||
|
Mexico
|
9.8
|
|
11.8
|
|
12.9
|
|
|||||
|
Other
|
11.5
|
|
14.0
|
|
16.3
|
|
|||||
|
|
$
|
558.9
|
|
$
|
574.6
|
|
$
|
572.8
|
|
||
87
G—Earnings Per Share
Basic and diluted earnings per share were calculated as follows:
|
|
Year Ended December 31
|
||||||||||
|
|
2014
|
2013
|
2012
|
||||||||
|
Earnings:
|
|
|
|
||||||||
|
Earnings from continuing operations
|
$
|
225.2
|
|
$
|
186.3
|
|
$
|
231.8
|
|
||
|
(Earnings) attributable to noncontrolling interest, net of tax
|
(3.2
|
)
|
(2.4
|
)
|
(2.3
|
)
|
|||||
|
Net earnings from continuing operations attributable to Leggett & Platt common shareholders
|
222.0
|
|
183.9
|
|
229.5
|
|
|||||
|
Earnings (loss) from discontinued operations, net of tax
|
(124.0
|
)
|
13.4
|
|
18.7
|
|
|||||
|
Net earnings attributable to Leggett & Platt common shareholders
|
$
|
98.0
|
|
$
|
197.3
|
|
$
|
248.2
|
|
||
|
Weighted average number of shares (in millions):
|
|
|
|
||||||||
|
Weighted average number of common shares used in basic EPS
|
141.4
|
|
145.2
|
|
144.3
|
|
|||||
|
Dilutive effect of equity-based compensation
|
1.8
|
|
2.1
|
|
1.7
|
|
|||||
|
Weighted average number of common shares and dilutive potential common shares used in diluted EPS
|
143.2
|
|
147.3
|
|
146.0
|
|
|||||
|
Basic and Diluted EPS:
|
|
|
|
||||||||
|
Basic EPS attributable to Leggett & Platt common shareholders
|
|
|
|
||||||||
|
Continuing operations
|
$
|
1.57
|
|
$
|
1.27
|
|
$
|
1.59
|
|
||
|
Discontinued operations
|
(.88
|
)
|
.09
|
|
.13
|
|
|||||
|
Basic EPS attributable to Leggett & Platt common shareholders
|
$
|
.69
|
|
$
|
1.36
|
|
$
|
1.72
|
|
||
|
Diluted EPS attributable to Leggett & Platt common shareholders
|
|
|
|
||||||||
|
Continuing operations
|
$
|
1.55
|
|
$
|
1.25
|
|
$
|
1.57
|
|
||
|
Discontinued operations
|
(.87
|
)
|
.09
|
|
.13
|
|
|||||
|
Diluted EPS attributable to Leggett & Platt common shareholders
|
$
|
.68
|
|
$
|
1.34
|
|
$
|
1.70
|
|
||
|
Other information:
|
|
|
|
||||||||
|
Anti-dilutive shares excluded from diluted EPS computation
|
—
|
|
—
|
|
1.9
|
|
|||||
88
H—Accounts and Other Receivables
Accounts and other receivables at December 31 consisted of the following:
|
|
2014
|
2013
|
|||||||||||||
|
|
Current
|
Long-term
|
Current
|
Long-term
|
|||||||||||
|
Trade accounts receivable
|
$
|
484.0
|
|
$
|
—
|
|
$
|
447.4
|
|
$
|
—
|
|
|||
|
Trade notes receivable
|
1.1
|
|
2.9
|
|
2.6
|
|
2.3
|
|
|||||||
|
Total trade receivables
|
485.1
|
|
2.9
|
|
450.0
|
|
2.3
|
|
|||||||
|
Other notes receivable:
|
|||||||||||||||
|
Notes received as partial payment for divestitures
|
.9
|
|
—
|
|
.5
|
|
5.4
|
|
|||||||
|
Other
|
—
|
|
3.3
|
|
3.0
|
|
1.6
|
|
|||||||
|
Income tax receivables
|
14.0
|
|
—
|
|
2.7
|
|
—
|
|
|||||||
|
Other receivables
|
38.0
|
|
—
|
|
26.4
|
|
—
|
|
|||||||
|
Subtotal other receivables
|
52.9
|
|
3.3
|
|
32.6
|
|
7.0
|
|
|||||||
|
Total trade and other receivables
|
538.0
|
|
6.2
|
|
482.6
|
|
9.3
|
|
|||||||
|
Allowance for doubtful accounts:
|
|||||||||||||||
|
Trade accounts receivable
|
(14.7
|
)
|
—
|
|
(14.6
|
)
|
—
|
|
|||||||
|
Trade notes receivable
|
—
|
|
(2.1
|
)
|
(.6
|
)
|
(1.3
|
)
|
|||||||
|
Total trade receivables
|
(14.7
|
)
|
(2.1
|
)
|
(15.2
|
)
|
(1.3
|
)
|
|||||||
|
Other notes receivable
|
—
|
|
(.4
|
)
|
—
|
|
(1.1
|
)
|
|||||||
|
Total allowance for doubtful accounts
|
(14.7
|
)
|
(2.5
|
)
|
(15.2
|
)
|
(2.4
|
)
|
|||||||
|
Total net receivables
|
$
|
523.3
|
|
$
|
3.7
|
|
$
|
467.4
|
|
$
|
6.9
|
|
|||
Notes that were past due more than 90 days or had been placed on non-accrual status were not significant for the periods presented.
Activity related to the allowance for doubtful accounts is reflected below:
|
Balance at
December 31, 2012 |
2013
Charges* |
2013
Charge-offs, Net of Recoveries |
Balance at
December 31, 2013 |
2014
Charges* |
2014
Charge-offs, Net of Recoveries |
Balance at
December 31, 2014 |
|||||||||||||||||||||
|
Trade accounts receivable
|
$
|
18.9
|
|
$
|
4.1
|
|
$
|
8.4
|
|
$
|
14.6
|
|
$
|
4.7
|
|
$
|
4.6
|
|
$
|
14.7
|
|
||||||
|
Trade notes receivable
|
.8
|
|
1.9
|
|
.8
|
|
1.9
|
|
.2
|
|
—
|
|
2.1
|
|
|||||||||||||
|
Total trade receivables
|
19.7
|
|
6.0
|
|
9.2
|
|
16.5
|
|
4.9
|
|
4.6
|
|
16.8
|
|
|||||||||||||
|
Other notes receivable:
|
|
|
|
|
|
|
|
||||||||||||||||||||
|
Other
|
.9
|
|
.1
|
|
(.1
|
)
|
1.1
|
|
—
|
|
.7
|
|
.4
|
|
|||||||||||||
|
Subtotal other receivables
|
.9
|
|
.1
|
|
(.1
|
)
|
1.1
|
|
—
|
|
.7
|
|
.4
|
|
|||||||||||||
|
Total allowance for doubtful accounts
|
$
|
20.6
|
|
$
|
6.1
|
|
$
|
9.1
|
|
$
|
17.6
|
|
$
|
4.9
|
|
$
|
5.3
|
|
$
|
17.2
|
|
||||||
________________________
* Includes charges associated with discontinued operations of
$.1
for 2014 and
$.2
for 2013
89
I—Supplemental Balance Sheet Information
Additional supplemental balance sheet details at December 31 consisted of the following:
|
2014
|
2013
|
||||||
|
Other current assets
|
|||||||
|
Deferred taxes (see Note N)
|
$
|
42.3
|
|
$
|
12.1
|
|
|
|
Other prepaids
|
39.2
|
|
33.6
|
|
|||
|
Current assets held for sale (see Note B)
|
10.4
|
|
—
|
|
|||
|
$
|
91.9
|
|
$
|
45.7
|
|
||
|
Sundry assets
|
|
|
|||||
|
Deferred taxes (see Note N)
|
$
|
36.5
|
|
$
|
46.9
|
|
|
|
Assets held for sale (see Note B)
|
22.4
|
|
19.1
|
|
|||
|
Diversified investments associated with stock-based compensation plans (see Note L)
|
17.5
|
|
11.7
|
|
|||
|
Investment in associated companies
|
6.7
|
|
6.6
|
|
|||
|
Notes receivable (see Note H)
|
3.7
|
|
6.9
|
|
|||
|
Pension plan assets (see Note M)
|
—
|
|
1.4
|
|
|||
|
Other
|
41.6
|
|
29.0
|
|
|||
|
|
$
|
128.4
|
|
$
|
121.6
|
|
|
|
Accrued expenses
|
|
|
|||||
|
Contingency accruals
|
$
|
83.9
|
|
$
|
3.7
|
|
|
|
Wages and commissions payable
|
67.3
|
|
64.2
|
|
|||
|
Workers’ compensation, medical, auto and product liability
|
54.7
|
|
54.5
|
|
|||
|
Sales promotions
|
30.7
|
|
25.2
|
|
|||
|
Liabilities associated with stock-based compensation plans (see Note L)
|
23.7
|
|
8.8
|
|
|||
|
Accrued interest
|
12.3
|
|
11.9
|
|
|||
|
General taxes, excluding income taxes
|
11.6
|
|
14.6
|
|
|||
|
Other
|
53.4
|
|
46.8
|
|
|||
|
|
$
|
337.6
|
|
$
|
229.7
|
|
|
|
Other current liabilities
|
|
|
|||||
|
Dividends payable
|
$
|
42.7
|
|
$
|
42.0
|
|
|
|
Customer deposits
|
12.7
|
|
13.1
|
|
|||
|
Sales tax payable
|
10.4
|
|
6.8
|
|
|||
|
Current liabilities associated with assets held for sale (see Note B)
|
5.5
|
|
—
|
|
|||
|
Derivative financial instruments (see Note S)
|
2.4
|
|
.9
|
|
|||
|
Liabilities associated with stock-based compensation plans (see Note L)
|
1.3
|
|
1.7
|
|
|||
|
Outstanding checks in excess of book balances
|
.9
|
|
9.1
|
|
|||
|
Other
|
7.2
|
|
5.8
|
|
|||
|
|
$
|
83.1
|
|
$
|
79.4
|
|
|
|
Other long-term liabilities
|
|
|
|||||
|
Liability for pension benefits (see Note M)
|
$
|
83.7
|
|
$
|
39.9
|
|
|
|
Liabilities associated with stock-based compensation plans (see Note L)
|
27.9
|
|
15.4
|
|
|||
|
Net reserves for tax contingencies
|
25.1
|
|
29.2
|
|
|||
|
Deferred compensation
|
14.7
|
|
15.4
|
|
|||
|
Other liabilities associated with assets held for sale (see Note B)
|
.1
|
|
—
|
|
|||
|
Other
|
33.5
|
|
27.8
|
|
|||
|
|
$
|
185.0
|
|
$
|
127.7
|
|
|
90
Long-term debt, weighted average interest rates and due dates at December 31 are as follows:
|
|
2014
|
2013
|
|||||||||||||||
|
|
Stated Interest
Rate
|
Due Date
Through
|
Balance
|
Stated Interest
Rate
|
Due Date
Through
|
Balance
|
|||||||||||
|
Term notes
|
4.7
|
%
|
2024
|
$
|
948.0
|
|
4.8
|
%
|
2022
|
$
|
828.4
|
|
|||||
|
Industrial development bonds, principally variable interest rates
|
.2
|
%
|
2030
|
14.7
|
|
.2
|
%
|
2030
|
19.9
|
|
|||||||
|
Commercial paper
|
.2
|
%
|
2019
|
—
|
|
.2
|
%
|
2017
|
16.0
|
|
|||||||
|
Capitalized leases (primarily machinery, vehicle and office equipment)
|
|
|
5.2
|
|
|
|
4.4
|
|
|||||||||
|
Other, partially secured
|
|
|
.5
|
|
|
|
.8
|
|
|||||||||
|
|
|
|
968.4
|
|
|
|
869.5
|
|
|||||||||
|
Less current maturities
|
|
|
201.7
|
|
|
|
181.1
|
|
|||||||||
|
|
|
|
$
|
766.7
|
|
|
|
$
|
688.4
|
|
|||||||
Maturities of long-term debt are as follows:
|
Year ended December 31
|
|
||
|
2015
|
$
|
201.7
|
|
|
2016
|
3.3
|
|
|
|
2017
|
3.3
|
|
|
|
2018
|
153.4
|
|
|
|
2019
|
—
|
|
|
|
Thereafter
|
606.7
|
|
|
|
|
$
|
968.4
|
|
We can raise cash by issuing up to
$600
of commercial paper through a program that is backed by a
$600
revolving credit agreement with a syndicate of
12
lenders. This agreement expires in 2019. The credit agreement allows us to issue total letters of credit up to
$250
. When we issue letters of credit in this manner, our capacity under the agreement, and consequently, our ability to issue commercial paper, is reduced by a corresponding amount. We had no outstanding letters of credit under the agreement at year end for the periods presented.
Amounts outstanding at December 31 related to our commercial paper program were:
|
2014
|
2013
|
||||||
|
Total program authorized
|
$
|
600.0
|
|
$
|
600.0
|
|
|
|
Commercial paper outstanding (classified as long-term debt)
|
—
|
|
(16.0
|
)
|
|||
|
Letters of credit issued under the credit agreement
|
—
|
|
—
|
|
|||
|
Total program usage
|
—
|
|
(16.0
|
)
|
|||
|
Total program available
|
$
|
600.0
|
|
$
|
584.0
|
|
|
The revolving credit agreement and certain other long-term debt contain restrictive covenants which, among other things, limit a) the total amount of indebtedness to
60%
of our total capitalization (each as defined in the revolving credit agreement), b) the amount of total secured debt to
15%
of our total consolidated assets, and c) the amount of assets sold, transferred or disposed of in any trailing four quarter period to
25%
of total consolidated assets. We have remained well within compliance with all such covenants.
91
We may elect one of four types of borrowing under the revolving credit agreement, which determines the rate of interest to be paid on the outstanding principal balance. The interest rate would be commensurate with the currency borrowed and the term of the borrowing, as well as either i.) a competitive variable or fixed rate, or ii.) various published rates plus a pre-defined spread.
We are required to periodically pay accrued interest on any outstanding principal balance under the revolving credit agreement at different time intervals based upon the elected interest rate and the elected interest period. Any outstanding principal under this agreement will be due upon the maturity date. We may also terminate or reduce the lending commitments under this agreement, in whole or in part, upon three business days’ notice.
K—Lease Obligations
We lease certain operating facilities, most of our automotive and trucking equipment and various other assets. Lease terms, including purchase options, renewals and maintenance costs, vary by lease.
Total rental expense for the periods presented was as follows:
|
2014
|
2013
|
2012
|
|||||||||
|
Continuing operations
|
$
|
48.9
|
|
$
|
45.4
|
|
$
|
44.6
|
|
||
|
Discontinued operations
|
$
|
2.1
|
|
$
|
4.1
|
|
$
|
3.4
|
|
||
Future minimum rental commitments for all long-term non-cancelable operating leases are as follows:
|
Year ended December 31
|
|
||
|
2015
|
$
|
37.7
|
|
|
2016
|
27.6
|
|
|
|
2017
|
20.3
|
|
|
|
2018
|
14.5
|
|
|
|
2019
|
8.7
|
|
|
|
Thereafter
|
20.7
|
|
|
|
|
$
|
129.5
|
|
The above lease obligations expire at various dates through 2024. Aggregate rental commitments above include renewal amounts where it is our intention to renew the lease.
L—Stock-Based Compensation
We use various forms of share-based compensation which are summarized below.
One
stock unit is equivalent to one common share for accounting and earnings per share purposes. Shares are issued from treasury for the majority of our stock plans’ activity. All share information is presented in millions.
Stock options and stock units are granted pursuant to our Flexible Stock Plan (the "Plan"). On May 10, 2012 the Plan changed the way awards granted under the Plan are charged against the number of available shares. Under the 2012 Plan modification, each option counts as
one
share against the shares available under the Plan, but each share granted for any other awards will count as
three
shares against the Plan.
At December 31, 2014, the following common shares were authorized for issuance under the Flexible Stock Plan:
|
|
Shares Available for Issuance
|
Maximum Number of Authorized Shares
|
|||
|
Unexercised options
|
3.7
|
|
3.7
|
|
|
|
Outstanding stock units—vested
|
4.0
|
|
6.4
|
|
|
|
Outstanding stock units—unvested
|
1.9
|
|
4.6
|
|
|
|
Available for grant
|
4.4
|
|
4.4
|
|
|
|
Authorized for issuance at December 31, 2014
|
14.0
|
|
19.1
|
|
|
92
The following table recaps the impact of stock-based compensation (including discontinued operations) on the results of operations for each of the periods presented:
|
Year Ended December 31
|
|||||||||||||||||||||||
|
2014
|
2013
|
2012
|
|||||||||||||||||||||
|
To Be Settled With Stock
|
To Be Settled In Cash
|
To Be Settled With Stock
|
To Be Settled In Cash
|
To Be Settled With Stock
|
To Be Settled In Cash
|
||||||||||||||||||
|
Options (1):
|
|||||||||||||||||||||||
|
Amortization of the grant date fair value
|
$
|
.6
|
|
$
|
—
|
|
$
|
1.6
|
|
$
|
—
|
|
$
|
4.4
|
|
$
|
—
|
|
|||||
|
Cash payments in lieu of options
|
—
|
|
.8
|
|
—
|
|
.8
|
|
—
|
|
.3
|
|
|||||||||||
|
Stock-based retirement plans contributions (2)
|
6.1
|
|
1.4
|
|
6.5
|
|
1.2
|
|
6.6
|
|
1.0
|
|
|||||||||||
|
Discounts on various stock awards:
|
|
|
|
|
|
|
|||||||||||||||||
|
Deferred Stock Compensation Program (1)
|
2.2
|
|
—
|
|
1.5
|
|
—
|
|
1.2
|
|
—
|
|
|||||||||||
|
Stock-based retirement plans (2)
|
1.9
|
|
—
|
|
1.1
|
|
—
|
|
1.2
|
|
—
|
|
|||||||||||
|
Discount Stock Plan (6)
|
1.0
|
|
—
|
|
.9
|
|
—
|
|
.9
|
|
—
|
|
|||||||||||
|
Performance Stock Unit awards (3)
|
6.4
|
|
13.9
|
|
6.4
|
|
1.1
|
|
6.5
|
|
5.1
|
|
|||||||||||
|
Restricted Stock Units awards (4)
|
3.4
|
|
—
|
|
4.2
|
|
—
|
|
2.2
|
|
—
|
|
|||||||||||
|
Profitable Growth Incentive awards (5)
|
4.4
|
|
4.4
|
|
.6
|
|
.6
|
|
—
|
|
—
|
|
|||||||||||
|
Other, primarily non-employee directors restricted stock
|
1.3
|
|
—
|
|
1.3
|
|
—
|
|
1.0
|
|
—
|
|
|||||||||||
|
Total stock-related compensation expense
|
27.3
|
|
$
|
20.5
|
|
24.1
|
|
$
|
3.7
|
|
24.0
|
|
$
|
6.4
|
|
||||||||
|
Employee contributions for above stock plans
|
14.3
|
|
12.2
|
|
9.8
|
|
|||||||||||||||||
|
Total stock-based compensation
|
$
|
41.6
|
|
$
|
36.3
|
|
$
|
33.8
|
|
||||||||||||||
|
Recognized tax benefits on stock-based compensation expense
|
$
|
10.4
|
|
$
|
9.2
|
|
$
|
9.1
|
|
||||||||||||||
The following table recaps the impact of stock-based compensation on assets and liabilities for each of the periods presented:
|
2014
|
2013
|
||||||||||||||||||||||
|
Current
|
Long-term
|
Total
|
Current
|
Long-term
|
Total
|
||||||||||||||||||
|
Assets:
|
|||||||||||||||||||||||
|
Diversified investments associated with the stock-based retirement plans (2)
|
$
|
1.3
|
|
$
|
17.5
|
|
$
|
18.8
|
|
$
|
1.7
|
|
$
|
11.7
|
|
$
|
13.4
|
|
|||||
|
Liabilities:
|
|||||||||||||||||||||||
|
Stock-based retirement plans (2)
|
$
|
1.3
|
|
$
|
17.3
|
|
$
|
18.6
|
|
$
|
1.7
|
|
$
|
11.6
|
|
$
|
13.3
|
|
|||||
|
Performance Stock Unit award (3)
|
10.0
|
|
6.6
|
|
16.6
|
|
2.8
|
|
2.6
|
|
5.4
|
|
|||||||||||
|
Profitable Growth Incentive award (5)
|
6.1
|
|
4.0
|
|
10.1
|
|
—
|
|
1.2
|
|
1.2
|
|
|||||||||||
|
Other - primarily timing differences between employee withholdings and related employer contributions to be submitted to various plans' trust accounts
|
7.6
|
|
—
|
|
7.6
|
|
6.0
|
|
—
|
|
6.0
|
|
|||||||||||
|
Total liabilities associated with stock-based compensation
|
$
|
25.0
|
|
$
|
27.9
|
|
$
|
52.9
|
|
$
|
10.5
|
|
$
|
15.4
|
|
$
|
25.9
|
|
|||||
93
When the tax deduction for an exercised stock option or converted stock unit exceeds the compensation cost that has been recognized in income, a “windfall” tax benefit is created. The windfall benefit is not recognized in income, but rather on the balance sheet as additional contributed capital. When the current tax deduction for an exercised stock option or converted stock unit is less than the deferred tax asset recorded in regard to the compensation cost that has been recognized in income, a tax “shortfall” is created. To the extent we have accumulated tax windfalls, the shortfall is recognized on the balance sheet as a reduction of additional contributed capital. Net windfall is presented below:
|
Balance at
December 31, 2013 |
Net Windfall
Resulting From
Exercises and
Conversions
|
Balance at
December 31,
2014
|
|||||||||
|
Accumulated tax windfall in additional contributed capital
|
$
|
41.9
|
|
$
|
10.5
|
|
$
|
52.4
|
|
||
(1) Stock Option Grants
We have granted stock options in the following areas:
|
•
|
On a discretionary basis to a broad group of employees
|
|
•
|
In conjunction with our Deferred Compensation Program
|
|
•
|
As compensation of outside directors
|
Options granted to a broad group of employees on a discretionary basis
Starting in 2013, we discontinued the annual broad-based option grant, and replaced options with cash awards, RSU's, or, for certain key management employees, participation in the Profitable Growth Incentive (PGI). Options are now offered only in conjunction with the Deferred Compensation Program discussed below.
Prior to 2013, we granted stock options annually on a discretionary basis to a broad group of employees. Options generally become exercisable in one-third increments at
18 months
,
30 months
and
42 months
after the date of grant. Options have a maximum term of
ten
years and the exercise prices are equal to Leggett’s closing stock price on the grant date.
Grant date fair values are calculated using the Black-Scholes option pricing model and are amortized by the straight-line method over the options’ total vesting period, except for employees who terminate due to retirement. A “retirement” termination occurs if the employee is age
65
, or age
55
with
20
years of Company service at termination. For retirement terminations, options continue to vest and remain exercisable for
three years
.
In connection with the January 2012 option grants, we offered
two
different option choice programs.
One
group of employees was offered the choice to receive stock options or to receive a cash payment in lieu of options, with the cash alternative being equal to approximately one-half of the Black-Scholes value of the option grant foregone. Another group of employees, generally higher level employees, were offered a choice between stock options or restricted stock units (RSUs), on a ratio of
four
options foregone for every one RSU offered. The stock units vest in one-third increments at
12 months
,
24 months
and
36 months
after the date of grant.
Deferred Compensation Program
We offer a Deferred Compensation Program under which key managers and outside directors may elect to receive stock options, stock units or interest-bearing cash deferrals in lieu of cash compensation:
|
•
|
Stock options under this program are granted on the last business day of the year prior to the year the compensation is earned. The number of options granted equals the deferred compensation times
five
, divided by the stock’s market price on the date of grant. The option has a
10
-year term. It vests as the associated compensation is earned and becomes exercisable beginning
15 months
after the grant date. Stock is issued when the option is exercised.
|
|
•
|
Deferred stock units (DSU) under this program are acquired every
two
weeks (when the compensation would have otherwise been paid) at a
20%
discount to the market price of our common stock on each acquisition date and they vest immediately. Expense is recorded as the compensation is earned. Stock units earn dividends at the same rate as cash dividends paid on our common stock. These dividends are used to acquire stock units at a
20%
discount. Stock units are converted to common stock and distributed in accordance with the participant’s pre-set election. However, stock units may be settled in cash at our discretion. Participants must begin receiving distributions no later than
ten
years after the effective date of the deferral and installment distributions cannot exceed
ten
years.
|
94
|
•
|
Interest-bearing cash deferrals under this program are reported in Other long-term liabilities on the balance sheet and are disclosed in Note I.
|
|
Options
|
Units
|
Cash
|
|||||||||
|
Aggregate amount of compensation deferred during 2014
|
$
|
.1
|
|
$
|
6.9
|
|
$
|
1.2
|
|
||
STOCK OPTIONS SUMMARY
Stock option information for the plans discussed above for the periods presented is as follows:
|
Employee
Stock
Options
|
Deferred
Compensation
Options
|
Other-Primarily Outside Directors'
Options**
|
Total
Options
|
Weighted
Average
Exercise
Price per
Share
|
Weighted
Average
Remaining
Contractual
Life in Years
|
Aggregate
Intrinsic
Value
|
|||||||||||||||
|
Outstanding at December 31, 2013
|
5.1
|
|
1.2
|
|
.1
|
|
6.4
|
|
$
|
21.61
|
|
|
|
||||||||
|
Exercised *
|
(1.6
|
)
|
(1.0
|
)
|
(.1
|
)
|
(2.7
|
)
|
22.82
|
|
|
|
|||||||||
|
Outstanding at December 31, 2014
|
3.5
|
|
.2
|
|
—
|
|
3.7
|
|
$
|
20.79
|
|
4.4
|
$
|
81.2
|
|
||||||
|
Vested or expected to vest
|
|
|
|
3.7
|
|
$
|
20.78
|
|
4.4
|
$
|
81.2
|
|
|||||||||
|
Exercisable (vested) at December 31, 2014
|
|
|
|
3.4
|
|
$
|
20.60
|
|
4.2
|
$
|
75.9
|
|
|||||||||
______________________________
|
*
|
Prior to 2005, we granted options with a below market exercise price under the terms of our Deferred Compensation Program. During 2014, there were no significant options exercised at a below market exercise price, and
.1
of these options remain outstanding at December 31, 2014. In 2005, we amended the Program to provide only “at market” stock options.
|
|
**
|
A small amount of options related to this plan (less than .1) were outstanding at December 31, 2014.
|
Additional information related to stock option activity for the periods presented is as follows:
|
|
Year Ended December 31
|
||||||||||
|
|
2014
|
2013
|
2012
|
||||||||
|
Total intrinsic value of stock options exercised
|
$
|
35.2
|
|
$
|
18.4
|
|
$
|
24.9
|
|
||
|
Cash received from stock options exercised
|
21.8
|
|
36.9
|
|
35.6
|
|
|||||
|
Total fair value of stock options vested
|
2.9
|
|
4.4
|
|
4.5
|
|
|||||
The following table summarizes fair values calculated (and assumptions utilized) using the Black-Scholes option pricing model.
|
|
Year Ended December 31 *
|
|||||||
|
|
2014
|
2012
|
||||||
|
Aggregate grant date fair value
|
$
|
.1
|
|
$
|
4.0
|
|
||
|
Weighted-average per share grant date fair value
|
$
|
7.30
|
|
$
|
4.68
|
|
||
|
Risk-free interest rate
|
2.1
|
%
|
1.9
|
%
|
||||
|
Expected life in years
|
6.0
|
|
7.2
|
|
||||
|
Expected volatility (over expected life)
|
35.1
|
%
|
34.4
|
%
|
||||
|
Expected dividend yield (over expected life)
|
3.9
|
%
|
4.8
|
%
|
||||
__________________________________
|
*
|
No
options were granted in 2013
|
The risk-free rate is determined based on U.S. Treasury yields in effect at the time of grant for maturities equivalent to the expected life of the option. The expected life of the option (estimated average period of time the option will be outstanding) is estimated based on the historical exercise behavior of employees, with executives displaying somewhat longer holding periods than other employees. Expected volatility is based on historical volatility through the grant date, measured daily for a time period equal to the option’s expected life. The expected dividend yield is estimated based on the dividend yield at the time of grant.
95
(2) Stock-Based Retirement Plans
We have
two
stock-based retirement plans: the tax-qualified Stock Bonus Plan (SBP) for non-highly compensated employees, and the non-qualified Executive Stock Unit Program (ESUP) for highly compensated employees. We make matching contributions to both plans. In addition to the automatic
50%
match, we will make another matching contribution of up to
50%
of the employee’s contributions for the year if certain profitability levels, as defined in the SBP and the ESUP, are obtained.
|
•
|
Participants in the SBP may contribute up to
6%
of their compensation above a certain threshold to purchase Leggett stock or other investment alternatives at market prices. We immediately match
50%
of the employee contributions. Employees are allowed to fully diversify their employee deferral accounts immediately and their employer accounts after
three
years of service. Dividends earned on Company stock held in the SBP are reinvested or paid in cash at the participant’s election.
|
|
•
|
Participants in the ESUP may contribute up to
10%
(depending upon salary level) of their compensation above the same threshold applicable to the SBP. Participant contributions are credited to a diversified investment account established for the participant, and we make premium contributions to the diversified investment accounts equal to
17.65%
of the participant’s contribution. A participant’s diversified investment account balance is adjusted to mirror the investment experience, whether positive or negative, of the diversified investments selected by the participant. Participants may change investment elections in the diversified investment accounts, but cannot purchase Company common stock or stock units. The diversified investment accounts consist of various mutual funds and retirement target funds and are unfunded, unsecured obligations of the Company that will be settled in cash. Both the assets and liabilities associated with this program are presented in the table above and are adjusted to fair value at each reporting period.
|
We immediately match
50%
of the employee contributions in the form of stock units. Company contributions to the ESUP, including dividend equivalents, are used to acquire stock units at
85%
of the common stock market price on the acquisition date. Stock units are converted to common stock at a
1-to-1 ratio
upon distribution from the program and may be settled in cash at our discretion.
Company matches in the SBP and ESUP fully vest upon
three
and
five
years, respectively, of cumulative service, subject to certain participation requirements. Distributions under both plans are triggered by an employee’s retirement, death, disability or separation from Leggett.
Information for the year ended December 31 for these plans was as follows:
|
SBP
2014 |
ESUP
2014 |
||||||
|
Employee contributions
|
$
|
3.0
|
|
$
|
4.3
|
|
|
|
Less diversified contributions
|
.7
|
|
4.3
|
|
|||
|
Total employee stock contributions
|
$
|
2.3
|
|
$
|
—
|
|
|
|
Employer premium contribution to diversified investment accounts
|
|
|
$
|
.8
|
|
||
|
Shares purchased by employees
|
.1
|
|
|||||
|
Shares of company match
|
.1
|
|
|||||
Details regarding stock unit activity for the ESUP plan are reflected in the stock units summary table below.
(3) Performance Stock Unit Awards
We also grant Performance Stock Unit (PSU) awards in the first quarter of each year to selected officers and other key managers. These awards contain the following conditions:
|
•
|
A service requirement—Awards generally “cliff” vest
three
years following the grant date; and
|
|
•
|
A market condition—Awards are based on our Total Shareholder Return [TSR = (Change in Stock Price + Dividends) / Beginning Stock Price] as compared to the TSR of a group of peer companies. The peer group consists of all the companies in the Industrial, Materials and Consumer Discretionary sectors of the S&P 500 and S&P Midcap 400 (approximately
320
companies). Participants will earn from
0%
to
175%
of the base award depending upon how our TSR ranks within the peer group at the end of the
3
-year performance period.
|
96
Grant date fair values are calculated using a Monte Carlo simulation of stock and volatility data for Leggett and each of the comparator companies. Grant date fair values are amortized using the straight-line method over the
three
-year vesting period.
Below is a summary of the number of shares and related grant date fair value of PSU’s for the periods presented:
|
|
Year Ended December 31,
|
||||||||||
|
|
2014
|
2013
|
2012
|
||||||||
|
Total shares base award
|
.2
|
|
.2
|
|
.3
|
|
|||||
|
Grant date per share fair value
|
$
|
30.45
|
|
$
|
27.60
|
|
$
|
23.79
|
|
||
|
Risk-free interest rate
|
.8
|
%
|
.4
|
%
|
.4
|
%
|
|||||
|
Expected life in years
|
3.0
|
|
3.0
|
|
3.0
|
|
|||||
|
Expected volatility (over expected life)
|
25.9
|
%
|
29.1
|
%
|
35.0
|
%
|
|||||
|
Expected dividend yield (over expected life)
|
3.9
|
%
|
4.2
|
%
|
4.8
|
%
|
|||||
|
Three-Year Performance Cycle
|
||||||||||
|
Award Year
|
Completion Date
|
TSR Performance
Relative to the Peer Group (1%=Best)
|
Payout as a
Percent of the
Base Award
|
Number of Shares
Distributed
|
Distribution Date
|
|||||
|
2010
|
December 31, 2012
|
46th percentile
|
91.0%
|
.3
|
January 2013
|
|||||
|
2011
|
December 31, 2013
|
55th percentile
|
64.2%
|
.2
|
January 2014
|
|||||
|
2012
|
December 31, 2014
|
30th percentile
|
157.0%
|
.4
|
January 2015
|
|||||
Beginning with the 2010 award (that was settled in January 2013), thirty-five percent (
35%
) of awards will be paid out in cash. We intend to pay out the remaining sixty-five percent (
65%
) in shares of our common stock, although we reserve the right to pay up to one hundred percent (
100%
) in cash. The
35%
portion is recorded as a liability and is adjusted to fair value at each reporting period.
(4) Restricted Stock Unit Awards
RSU awards are generally granted as follows:
|
•
|
To managers in lieu of annual option grants
|
|
•
|
On a discretionary basis to selected managers
|
|
•
|
To selected executive officers in connection with employment agreements
|
|
•
|
As compensation for outside directors, who have a choice to receive RSUs or restricted stock
|
The value of these awards is determined by the stock price on the day of the award, and expense is recognized over the vesting period.
(5) Profitable Growth Incentive Awards
Starting in 2013, certain key management employees participated in a new PGI program in lieu of the annual option grant. The PGI awards are issued as growth performance stock units (GPSUs). The GPSUs vest (
0%
to
250%
) at the end of a
two
-year performance period. Vesting is based on the Company's or applicable profit center's revenue growth (adjusted by a GDP factor when applicable) and EBITDA margin at the end of a two-year performance period. The 2013 and 2014 base target PGI award was
.1
shares. If earned, we intend to pay half in shares of our common stock and half in cash, although we reserve the right to pay up to
100%
in cash. Both components are recorded as liabilities and adjusted to fair value at each reporting period.
|
Two-Year Performance Cycle
|
||||||||
|
Award Year
|
Performance Period Ending
|
Average Payout as a Percent of the Base Award
|
Estimated Number of Shares
|
Expected Distribution Date
|
||||
|
2013
|
December 31, 2014
|
127.0%
|
.1
|
March 2015
|
||||
97
STOCK UNITS SUMMARY
Stock unit information for the plans discussed above is presented in the table below.
|
DSU
|
ESUP
|
PSU*
|
RSU
|
PGI**
|
Total Units
|
Weighted
Average
Grant Date
Fair Value
per Unit
|
Aggregate
Intrinsic
Value
|
||||||||||||||||||
|
Non-vested at December 31, 2013
|
—
|
|
—
|
|
1.3
|
|
.3
|
|
.2
|
|
1.8
|
|
$
|
14.87
|
|
|
|||||||||
|
Granted based on current service
|
.2
|
|
.3
|
|
—
|
|
.1
|
|
—
|
|
.6
|
|
33.92
|
|
|
||||||||||
|
Granted based on future conditions
|
—
|
|
—
|
|
.4
|
|
—
|
|
.1
|
|
.5
|
|
24.89
|
|
|||||||||||
|
Vested
|
(.2
|
)
|
(.3
|
)
|
(.2
|
)
|
(.1
|
)
|
—
|
|
(.8
|
)
|
30.44
|
|
|||||||||||
|
Forfeited
|
—
|
|
—
|
|
(.1
|
)
|
—
|
|
—
|
|
(.1
|
)
|
14.53
|
|
|||||||||||
|
Difference between maximum and actual payout
|
—
|
|
—
|
|
(.1
|
)
|
—
|
|
—
|
|
(.1
|
)
|
—
|
|
|||||||||||
|
Total non-vested at December 31, 2014
|
—
|
|
—
|
|
1.3
|
|
.3
|
|
.3
|
|
1.9
|
|
$
|
18.40
|
|
$
|
80.3
|
|
|||||||
|
Fully vested shares available for issuance at December 31, 2014
|
4.0
|
|
$
|
171.6
|
|
||||||||||||||||||||
______________________________
|
*
|
PSU awards are presented at
175%
(i.e. maximum) payout
|
** PGI awards are presented at
250%
(i.e. maximum) payout
|
|
Year Ended December 31
|
||||||||||
|
|
2014
|
2013
|
2012
|
||||||||
|
Total intrinsic value of vested stock units converted to common stock
|
$
|
9.2
|
|
$
|
7.0
|
|
$
|
4.7
|
|
||
STOCK-BASED COMPENSATION COST NOT YET RECOGNIZED
As of December 31, 2014, the unrecognized cost of non-vested stock options and units that are not adjusted to fair value at each reporting period was as follows:
|
Options
|
Units
|
||||||
|
Unrecognized cost of non-vested stock
|
$
|
.2
|
|
$
|
7.3
|
|
|
|
Weighted-average remaining contractual life in years
|
0.4
|
|
1.4
|
|
|||
(6) Discount Stock Plan
Under the Discount Stock Plan (DSP), a tax-qualified §423 stock purchase plan, eligible employees may purchase shares of Leggett common stock at
85%
of the closing market price on the last business day of each month. Shares are purchased and issued on the last business day of each month and generally cannot be sold or transferred for one year.
|
Average 2014 purchase price per share (net of discount)
|
$
|
29.61
|
|
|
2014 number of shares purchased by employees
|
.1
|
|
|
|
Shares purchased since inception in 1982
|
22.5
|
|
|
|
Maximum shares under the plan
|
23.0
|
|
|
M—Employee Benefit Plans
The accompanying balance sheets reflect a net liability for the funded status of our domestic and foreign defined benefit pension plans. Our U.S. plans (comprised primarily of three significant plans) represent approximately
87%
of our pension
98
benefit obligation in each of the periods presented. Participants in one of the significant domestic plans have stopped earning benefits; this plan is referred to as "frozen" in the following narrative.
A summary of our pension obligations and funded status as of December 31 is as follows:
|
2014
|
2013
|
2012
|
|||||||||
|
Change in Benefit Obligation
|
|
|
|
||||||||
|
Benefit obligation, beginning of period
|
$
|
287.0
|
|
$
|
316.5
|
|
$
|
290.1
|
|
||
|
Service cost
|
3.0
|
|
3.2
|
|
3.0
|
|
|||||
|
Interest cost
|
12.9
|
|
11.9
|
|
12.6
|
|
|||||
|
Plan participants’ contributions
|
.6
|
|
.5
|
|
.5
|
|
|||||
|
Actuarial loss (gain)
|
58.1
|
|
(30.3
|
)
|
25.4
|
|
|||||
|
Benefits paid
|
(15.6
|
)
|
(14.8
|
)
|
(16.4
|
)
|
|||||
|
Foreign currency exchange rate changes
|
(3.0
|
)
|
—
|
|
1.3
|
|
|||||
|
Benefit obligation, end of period (1)
|
343.0
|
|
287.0
|
|
316.5
|
|
|||||
|
Change in Plan Assets
|
|
|
|
||||||||
|
Fair value of plan assets, beginning of period
|
248.0
|
|
240.3
|
|
223.2
|
|
|||||
|
Actual return on plan assets
|
23.9
|
|
20.0
|
|
24.3
|
|
|||||
|
Employer contributions
|
4.1
|
|
1.9
|
|
7.8
|
|
|||||
|
Plan participants’ contributions
|
.6
|
|
.5
|
|
.5
|
|
|||||
|
Benefits paid
|
(15.6
|
)
|
(14.8
|
)
|
(16.4
|
)
|
|||||
|
Foreign currency exchange rate changes
|
(2.1
|
)
|
.1
|
|
.9
|
|
|||||
|
Fair value of plan assets, end of period
|
258.9
|
|
248.0
|
|
240.3
|
|
|||||
|
Net funded status
|
$
|
(84.1
|
)
|
$
|
(39.0
|
)
|
$
|
(76.2
|
)
|
||
|
Funded status recognized in the Consolidated Balance Sheets
|
|
|
|
||||||||
|
Other assets—sundry
|
$
|
—
|
|
$
|
1.4
|
|
$
|
—
|
|
||
|
Other current liabilities
|
(.4
|
)
|
(.5
|
)
|
(.4
|
)
|
|||||
|
Other long-term liabilities
|
(83.7
|
)
|
(39.9
|
)
|
(75.8
|
)
|
|||||
|
Net funded status
|
$
|
(84.1
|
)
|
$
|
(39.0
|
)
|
$
|
(76.2
|
)
|
||
________________________
(1) The benefit obligation at December 31, 2014 increased as compared to December 31, 2013 primarily due to changes in mortality assumptions and a decrease in the discount rate.
Accumulated and projected benefit obligation information at December 31 is recapped below:
|
2014
|
2013
|
2012
|
|||||||||
|
Aggregated plans with accumulated benefit obligations in excess of plan assets:
|
|
|
|
||||||||
|
Projected benefit obligation
|
$
|
343.0
|
|
$
|
230.3
|
|
$
|
316.5
|
|
||
|
Accumulated benefit obligation
|
338.5
|
|
228.7
|
|
312.3
|
|
|||||
|
Fair value of plan assets
|
258.9
|
|
190.2
|
|
240.3
|
|
|||||
|
Aggregated plans with projected benefit obligations in excess of plan assets:
|
|||||||||||
|
Projected benefit obligation
|
343.0
|
|
233.8
|
|
316.5
|
|
|||||
|
Fair value of plan assets
|
258.9
|
|
193.4
|
|
240.3
|
|
|||||
|
Accumulated benefit obligation for all defined benefit plans
|
338.5
|
|
283.5
|
|
312.3
|
|
|||||
Included in the above plans is a subsidiary’s unfunded supplemental executive retirement plan. This is a non-qualified plan, and these benefits are secured by insurance policies that are not included in the plan’s assets. Cash surrender values associated with these policies at December 31 were as follows:
|
2014
|
2013
|
2012
|
|||||||||
|
Cash surrender values
|
$
|
2.2
|
|
$
|
2.1
|
|
$
|
2.1
|
|
||
99
Comprehensive Income
Amounts and activity included in accumulated other comprehensive income associated with pensions are reflected below:
|
December 31,
2013 |
2014
Amortization |
2014
Net Actuarial loss |
2014
Foreign currency exchange rates change |
2014
Income taxes change |
December 31,
2014 |
||||||||||||||||||
|
Net loss (gain) (before tax)
|
$
|
63.1
|
|
$
|
(2.8
|
)
|
$
|
50.0
|
|
$
|
(.6
|
)
|
$
|
(.2
|
)
|
$
|
109.5
|
|
|||||
|
Net prior service cost (before tax)
|
.3
|
|
(.3
|
)
|
—
|
|
—
|
|
—
|
|
—
|
|
|||||||||||
|
Deferred income taxes
|
(23.1
|
)
|
—
|
|
—
|
|
.1
|
|
(17.2
|
)
|
(40.2
|
)
|
|||||||||||
|
Accumulated other comprehensive income (net of tax)
|
$
|
40.3
|
|
$
|
(3.1
|
)
|
$
|
50.0
|
|
$
|
(.5
|
)
|
$
|
(17.4
|
)
|
$
|
69.3
|
|
|||||
Of the amounts in accumulated other comprehensive income as of December 31, 2014, the portions expected to be recognized as components of net periodic pension cost in 2015 are as follows:
|
Net loss
|
$
|
5.5
|
|
|
Net prior service cost
|
—
|
|
|
Net Pension (Expense) Income
Components of net pension (expense) income for the years ended December 31 were as follows:
|
2014
|
2013
|
2012
|
|||||||||
|
Service cost
|
$
|
(3.0
|
)
|
$
|
(3.2
|
)
|
$
|
(3.0
|
)
|
||
|
Interest cost
|
(12.9
|
)
|
(11.9
|
)
|
(12.6
|
)
|
|||||
|
Expected return on plan assets
|
15.9
|
|
15.2
|
|
14.5
|
|
|||||
|
Amortization of prior service cost
|
(.3
|
)
|
(.2
|
)
|
(.3
|
)
|
|||||
|
Recognized net actuarial loss
|
(2.8
|
)
|
(6.4
|
)
|
(6.0
|
)
|
|||||
|
Net pension (expense) income
|
$
|
(3.1
|
)
|
$
|
(6.5
|
)
|
$
|
(7.4
|
)
|
||
|
Weighted average assumptions for pension costs:
|
|
|
|
||||||||
|
Discount rate used in net pension costs
|
4.6
|
%
|
3.8
|
%
|
4.4
|
%
|
|||||
|
Rate of compensation increase used in pension costs
|
3.8
|
%
|
3.8
|
%
|
3.8
|
%
|
|||||
|
Expected return on plan assets
|
6.7
|
%
|
6.6
|
%
|
6.6
|
%
|
|||||
|
Weighted average assumptions for benefit obligation:
|
|||||||||||
|
Discount rate used in benefit obligation
|
3.8
|
%
|
4.6
|
%
|
3.8
|
%
|
|||||
|
Rate of compensation increase used in benefit obligation
|
3.5
|
%
|
3.8
|
%
|
3.8
|
%
|
|||||
Assumptions used for U.S. and international plans were not significantly different.
We use the average of the Citigroup Pension Discount Curve rate and Merrill Lynch AA-AAA 10-year Bond Index rate to determine the discount rate used for our significant pension plans (rounded to the nearest 25 basis points). The Citigroup Pension Discount Curve rate is a calculated rate using yearly spot rates matched against expected future benefit payments. The Merrill Lynch Index rate is based on the weighted average yield of a portfolio of high grade Corporate Bonds with an average duration approximating the plans’ projected benefit payments, adjusted for any callable bonds included in the portfolio. The discount rates used for our other, primarily foreign, plans are based on rates appropriate for the respective country and the plan obligations.
The overall, expected long-term rate of return is based on each plan’s historical experience and our expectations of future returns based upon each plan’s investment holdings, as discussed below.
Pension Plan Assets
The fair value of our major categories of pension plan assets is disclosed below using a three level valuation hierarchy that separates fair value valuation techniques into the following categories:
100
|
•
|
Level 1: Quoted prices for identical assets or liabilities in active markets.
|
|
•
|
Level 2: Other significant inputs observable either directly or indirectly (including quoted prices for similar securities, interest rates, yield curves, credit risk, etc.).
|
|
•
|
Level 3: Unobservable inputs that are not corroborated by market data.
|
Presented below are our major categories of investments for the periods presented:
|
|
Year Ended December 31, 2014
|
Year Ended December 31, 2013
|
|||||||||||||||||||||||||||||
|
|
Level 1
|
Level 2
|
Level 3
|
Total
|
Level 1
|
Level 2
|
Level 3
|
Total
|
|||||||||||||||||||||||
|
Mutual and pooled funds
|
|
|
|
|
|
|
|
|
|||||||||||||||||||||||
|
Fixed income
|
$
|
67.3
|
|
$
|
—
|
|
$
|
—
|
|
$
|
67.3
|
|
$
|
96.1
|
|
$
|
—
|
|
$
|
—
|
|
$
|
96.1
|
|
|||||||
|
Equities
|
136.8
|
|
—
|
|
—
|
|
136.8
|
|
148.7
|
|
—
|
|
—
|
|
148.7
|
|
|||||||||||||||
|
Stable value funds
|
—
|
|
45.9
|
|
—
|
|
45.9
|
|
—
|
|
—
|
|
—
|
|
—
|
|
|||||||||||||||
|
Money market funds, cash and other
|
8.9
|
|
—
|
|
—
|
|
8.9
|
|
3.2
|
|
—
|
|
—
|
|
3.2
|
|
|||||||||||||||
|
Total investments at fair value
|
$
|
213.0
|
|
$
|
45.9
|
|
$
|
—
|
|
$
|
258.9
|
|
$
|
248.0
|
|
$
|
—
|
|
$
|
—
|
|
$
|
248.0
|
|
|||||||
Plan assets are invested in diversified portfolios of equity, debt and government securities, as well as a stable value fund. The aggregate allocation of these investments is as follows:
|
2014
|
2013
|
||||
|
Asset Category
|
|
|
|||
|
Equity securities
|
53
|
%
|
60
|
%
|
|
|
Debt securities
|
26
|
|
39
|
|
|
|
Stable value funds
|
18
|
|
—
|
|
|
|
Other, including cash
|
3
|
|
1
|
|
|
|
Total
|
100
|
%
|
100
|
%
|
|
Our investment policy and strategies are established with a long-term view in mind. We strive for a sufficiently diversified asset mix to minimize the risk of a material loss to the portfolio value due to the devaluation of any single investment. In determining the appropriate asset mix, our financial strength and ability to fund potential shortfalls that might result from poor investment performance are considered. Approximately
60%
of our significant plans (the "frozen plans") are employing a Liability Driven Investment strategy and have a target allocation of
60%
fixed income and
40%
equities. The remaining significant plans (the "active" plans) have a target allocation of
75%
equities and
25%
fixed income, as historical equity returns have tended to exceed bond returns over the long term.
Assets of our domestic plans represent the majority of plan assets and are allocated to
seven
different investments.
Six are mutual funds, all of which are passively managed low-cost index funds, and include:
|
•
|
Total Stock Market Index: Large -, mid-, and small-cap equity diversified across growth and value styles.
|
|
•
|
Large-Cap Index: Large-cap equity diversified across growth and value styles.
|
|
•
|
Small-Cap Index: Small-cap equity diversified across growth and value styles.
|
|
•
|
FTSE All World ex US Index: International equity; broad exposure across developed and emerging non-US equity markets around the world.
|
|
•
|
Long-term Bond Index: Diversified exposure to the long-term, investment-grade U.S. bond market.
|
|
•
|
Extended Duration Treasury Index: Diversified exposure to the long-term Treasury STRIPS market.
|
The Stable value fund consists of a fixed income portfolio offering consistent return and protection against interest rate volatility.
Future Contributions and Benefit Payments
We expect to contribute
$1.9
to our defined benefit pension plans in 2015.
101
Estimated benefit payments, expected over the next ten years are as follows:
|
2015
|
$
|
15.1
|
|
|
2016
|
15.8
|
|
|
|
2017
|
16.2
|
|
|
|
2018
|
16.4
|
|
|
|
2019
|
16.8
|
|
|
|
2020-2024
|
91.3
|
|
|
Other Benefit Plans
Total expense from continuing operations for defined contribution plans was as follows:
|
2014
|
2013
|
2012
|
|||||||||
|
Defined contribution plans
|
$
|
7.3
|
|
$
|
6.4
|
|
$
|
6.1
|
|
||
We have limited participation in
two
union-sponsored, defined benefit, multi-employer pension plans. These plans are not administered by us, and contributions are determined in accordance with provisions of negotiated labor contracts. Aggregate contributions to these plans were less than
$.6
for each of the years presented.
In addition to regular contributions, we could be obligated to pay additional contributions (known as complete or partial withdrawal liabilities) if a plan has unfunded vested benefits. Factors that could impact the funded status of these plans include investment performance, changes in the participant demographics, financial stability of contributing employers and changes in actuarial assumptions. Withdrawal liability triggers could include a plan's termination, a withdrawal of substantially all employers, or our voluntary withdrawal from the plan (such as decision to close a facility or the dissolution of a collective bargaining unit.) We have a very small share of the liability among the participants of these plans. Based upon the information available from plan administrators, both of the multi-employer plans in which we participate are underfunded and estimate our aggregate share of potential withdrawal liability for both plans to be
$23.2
. We have not recorded any material withdrawal liabilities for the years presented.
N—Income Taxes
The components of earnings from continuing operations before income taxes are as follows:
|
|
Year Ended December 31
|
||||||||||
|
|
2014
|
2013
|
2012
|
||||||||
|
Domestic
|
$
|
142.1
|
|
$
|
111.2
|
|
$
|
179.2
|
|
||
|
Foreign
|
153.4
|
|
126.4
|
|
108.3
|
|
|||||
|
|
$
|
295.5
|
|
$
|
237.6
|
|
$
|
287.5
|
|
||
102
Income tax expense from continuing operations is comprised of the following components:
|
|
Year Ended December 31
|
||||||||||
|
|
2014
|
2013
|
2012
|
||||||||
|
Current
|
|
|
|
||||||||
|
Federal
|
$
|
38.4
|
|
$
|
59.8
|
|
$
|
45.8
|
|
||
|
State and local
|
3.3
|
|
5.9
|
|
4.0
|
|
|||||
|
Foreign
|
29.8
|
|
24.2
|
|
22.1
|
|
|||||
|
|
71.5
|
|
89.9
|
|
71.9
|
|
|||||
|
Deferred
|
|
|
|
||||||||
|
Federal
|
(6.1
|
)
|
(26.4
|
)
|
9.3
|
|
|||||
|
State and local
|
2.1
|
|
(1.8
|
)
|
(.5
|
)
|
|||||
|
Foreign
|
2.8
|
|
(10.4
|
)
|
(25.0
|
)
|
|||||
|
|
(1.2
|
)
|
(38.6
|
)
|
(16.2
|
)
|
|||||
|
|
$
|
70.3
|
|
$
|
51.3
|
|
$
|
55.7
|
|
||
Income tax expense from continuing operations, as a percentage of earnings before income taxes, differs from the statutory federal income tax rate as follows:
|
|
Year Ended December 31
|
|||||||
|
|
2014
|
2013
|
2012
|
|||||
|
Statutory federal income tax rate
|
35.0
|
%
|
35.0
|
%
|
35.0
|
%
|
||
|
Increases (decreases) in rate resulting from:
|
|
|
|
|||||
|
State taxes, net of federal benefit
|
1.0
|
|
1.4
|
|
1.2
|
|
||
|
Tax effect of foreign operations
|
(7.5
|
)
|
(8.6
|
)
|
(5.8
|
)
|
||
|
Deferred tax on undistributed foreign earnings
|
.4
|
|
(.5
|
)
|
3.7
|
|
||
|
Change in valuation allowance
|
.2
|
|
(1.4
|
)
|
(12.7
|
)
|
||
|
Change in uncertain tax positions, net
|
(.6
|
)
|
(1.1
|
)
|
.6
|
|
||
|
Domestic Production Activities Deduction
|
(3.4
|
)
|
(2.0
|
)
|
(1.2
|
)
|
||
|
Other permanent differences, net
|
(.7
|
)
|
(.6
|
)
|
(.3
|
)
|
||
|
Other, net
|
(.6
|
)
|
(.6
|
)
|
(1.1
|
)
|
||
|
Effective tax rate
|
23.8
|
%
|
21.6
|
%
|
19.4
|
%
|
||
For all periods presented, the tax rate benefited from income earned in various foreign jurisdictions at rates lower than the U.S. federal statutory rate, primarily related to China and Luxembourg. Significant items impacting each year's tax rate are:
•
2014: We recognized tax benefits totaling
$13.9
, primarily related to additional Domestic Production Activities Deductions for the current and prior years, incremental deferred foreign tax credits, and net favorable provision-to-return adjustments related to prior year taxes.
•
2013: We recognized tax benefits totaling
$17.5
, primarily related to the impact of Mexico tax law changes, the settlement of certain foreign and state audits, and a non-taxable bargain purchase gain.
•
2012: The tax rate benefited from the elimination of a
$36.9
valuation allowance on our Canadian net operating losses and other deferred tax assets. As a result of an increase in operating earnings in Canada, the amalgamation of
two
Canadian subsidiaries, and the restructuring of intercompany debt attributable in part to a change in Canadian tax law, we now expect those carryforwards and other deferred tax assets to be utilized in future years. The 2012 benefit was partially offset by the accrual of
$11.2
of deferred withholding taxes in China on earnings that are no longer indefinitely reinvested in China.
We recognized net excess tax benefits of approximately
$10.1
,
$4.6
, and
$5.5
, and in 2014, 2013, and 2012, respectively, related to stock plan activity, which have been recorded to additional contributed capital. These amounts include net windfall tax benefits as discussed in Note L.
103
We file tax returns in each jurisdiction where we are required to do so. In these jurisdictions, a statute of limitations period exists. After a statute period expires, the tax authorities can no longer assess additional income tax for the expired period. In addition, once the statute expires we are no longer eligible to file claims for refund for any tax that we may have overpaid.
Unrecognized Tax Benefits
The total amount of our gross unrecognized tax benefits at December 31, 2014, is
$28.2
, of which
$15.8
would impact our effective tax rate, if recognized. A reconciliation of the beginning and ending balance of our gross unrecognized tax benefits for the periods presented is as follows:
|
2014
|
2013
|
2012
|
|||||||||
|
Gross unrecognized tax benefits, January 1
|
$
|
24.4
|
|
$
|
26.6
|
|
$
|
25.7
|
|
||
|
Gross increases—tax positions in prior periods
|
.1
|
|
4.5
|
|
4.8
|
|
|||||
|
Gross decreases—tax positions in prior periods
|
(2.4
|
)
|
(1.5
|
)
|
(2.3
|
)
|
|||||
|
Gross increases—current period tax positions
|
1.3
|
|
1.0
|
|
1.1
|
|
|||||
|
Change due to exchange rate fluctuations
|
(1.0
|
)
|
(.4
|
)
|
.3
|
|
|||||
|
Settlements
|
(.6
|
)
|
(2.8
|
)
|
(1.7
|
)
|
|||||
|
Lapse of statute of limitations
|
(2.0
|
)
|
(3.0
|
)
|
(1.3
|
)
|
|||||
|
Gross unrecognized tax benefits, December 31
|
$
|
19.8
|
|
$
|
24.4
|
|
$
|
26.6
|
|
||
|
Interest
|
7.6
|
|
7.6
|
|
8.0
|
|
|||||
|
Penalties
|
.8
|
|
.9
|
|
.9
|
|
|||||
|
Total gross unrecognized tax benefits, December 31
|
$
|
28.2
|
|
$
|
32.9
|
|
$
|
35.5
|
|
||
We recognize interest and penalties related to unrecognized tax benefits as part of income tax expense in the Consolidated Statements of Operations, which is consistent with prior reporting periods.
As of December 31, 2014,
four
tax years were subject to audit by the United States Internal Revenue Service (IRS), covering the years 2011 through 2014. In 2012, refunds resulting from the IRS examination of our 2004 through 2008 tax returns were received, aggregating
$15.6
. There are no current IRS examinations in process nor are we aware of any forthcoming.
Additionally, at December 31, 2014,
eight
tax years were either subject to or undergoing audit by the Canada Revenue Agency, covering the periods 2007 through 2014. The examinations in process are at various stages of completion, but to date we are not aware of any likely material adjustments. During 2014, we concluded our audit for the 2011 year and released
$.2
of unrecognized tax benefits. The Canada Revenue Agency also issued an assessment in 2014 with respect to the 2007 and 2008 years in the amount of
$2.9
, related to transfer pricing issues. We disagree with the findings and are appealing this assessment. In 2013, due to Canada Revenue Agency examinations of our 2005 and 2006 tax years, we released
$1.1
of unrecognized tax benefits.
Various state and other foreign jurisdiction tax years also remain open to examination, though we believe assessments (if any) would be immaterial to our consolidated financial statements.
It is reasonably possible that resolution of certain tax audits could reduce our unrecognized tax benefits within the next 12 months, as certain tax positions may be sustained on audit, or we may agree to certain adjustments. It is not expected that any change would have a material impact on our Consolidated Financial Statements.
Deferred Income Taxes
Deferred income taxes are provided for the temporary differences between the financial reporting basis and the tax basis of our assets and liabilities. The major temporary differences and their associated deferred tax assets or liabilities are as follows:
104
|
|
December 31
|
||||||||||||||
|
|
2014
|
2013
|
|||||||||||||
|
|
Assets
|
Liabilities
|
Assets
|
Liabilities
|
|||||||||||
|
Property, plant and equipment
|
$
|
13.6
|
|
$
|
(56.6
|
)
|
$
|
13.2
|
|
$
|
(60.0
|
)
|
|||
|
Inventories
|
2.2
|
|
(14.1
|
)
|
1.6
|
|
(16.4
|
)
|
|||||||
|
Accrued expenses
|
120.9
|
|
—
|
|
89.7
|
|
(.8
|
)
|
|||||||
|
Net operating losses and other tax carryforwards
|
58.7
|
|
—
|
|
69.2
|
|
—
|
|
|||||||
|
Pension cost and other post-retirement benefits
|
33.6
|
|
(.8
|
)
|
16.0
|
|
(.9
|
)
|
|||||||
|
Intangible assets
|
1.9
|
|
(102.1
|
)
|
2.3
|
|
(108.5
|
)
|
|||||||
|
Derivative financial instruments
|
12.8
|
|
(1.9
|
)
|
14.2
|
|
(1.7
|
)
|
|||||||
|
Tax on undistributed earnings
|
—
|
|
(11.2
|
)
|
—
|
|
(10.1
|
)
|
|||||||
|
Uncertain tax positions
|
9.3
|
|
—
|
|
11.2
|
|
—
|
|
|||||||
|
Other
|
5.5
|
|
(9.0
|
)
|
6.8
|
|
(6.3
|
)
|
|||||||
|
Gross deferred tax assets (liabilities)
|
258.5
|
|
(195.7
|
)
|
224.2
|
|
(204.7
|
)
|
|||||||
|
Valuation allowance
|
(27.1
|
)
|
—
|
|
(25.4
|
)
|
—
|
|
|||||||
|
Total deferred taxes
|
$
|
231.4
|
|
$
|
(195.7
|
)
|
$
|
198.8
|
|
$
|
(204.7
|
)
|
|||
|
Net deferred tax (liability)
|
|
$
|
35.7
|
|
|
$
|
(5.9
|
)
|
|||||||
Significant fluctuations in our deferred taxes from 2013 to 2014 are:
•
A significant portion of our increase in accrued expenses relates to a
$31.8
deferred tax asset established in 2014 in connection with our Foam antitrust litigation accrual.
•
Net operating losses and other tax carryforwards have decreased in large part from the utilization of Canadian net operating losses in 2014, which reduced the tax asset by
$6.0
.
•
Deferred tax assets associated with pension costs and other post-retirement benefits have increased primarily from changes in actuarial assumptions in 2014 totaling
$17.2
, as discussed in Note M.
The valuation allowance primarily relates to net operating loss, tax credit, and capital loss carryforwards for which utilization is uncertain. Cumulative tax losses in certain state and foreign jurisdictions during recent years, limited carryforward periods in certain jurisdictions, future reversals of existing taxable temporary differences, and reasonable tax planning strategies were among the factors considered in determining the valuation allowance. Individually, none of these tax carryforwards presents a material exposure.
These tax carryforwards have expiration dates that vary generally over the next
20
years, with no amount greater than
$10
expiring in any one year.
Deferred income taxes and withholding taxes have been provided on earnings of our foreign subsidiaries to the extent it is anticipated that the earnings will be remitted in the future as dividends. The tax effect of most distributions would be significantly offset by available foreign tax credits. As of December 31, 2014, we have accrued
$11.2
(
$.6
related to discontinued operations) of deferred taxes associated with the undistributed earnings of foreign subsidiaries.
Deferred income taxes and withholding taxes have not been provided on foreign earnings which are indefinitely reinvested. The cumulative undistributed earnings which are indefinitely reinvested as of December 31, 2014, are
$485.8
. If such earnings were distributed, we estimate that the resulting incremental tax expense would be approximately
$82.2
based on present income tax laws, which are subject to change. In 2014, the foreign earnings we repatriated were immaterial, and resulted in no significant net tax benefit or cost. Although we have not changed our assertion with respect to amounts permanently reinvested outside the U.S., in 2014 and 2012 we recorded
$1.1
and
$11.2
(
$.4
related to discontinued operations), respectively, for incremental withholding taxes in China, since we no longer have specific plans to reinvest all of our Chinese earnings within China. The 2012 withholding tax amount was reduced by a net
$1.1
(a
$1.3
decrease in continuing operations and a
$.2
increase in discontinued operations) in 2013. These taxes would be due on dividends from certain of our China subsidiaries to their foreign parent, a subsidiary of the U.S. company. These earnings are still permanently reinvested outside the U.S. and are included in the undistributed earnings and incremental taxes discussed above.
105
Deferred tax assets (liabilities) included in the consolidated balance sheets are as follows:
|
|
December 31
|
||||||
|
|
2014
|
2013
|
|||||
|
Other current assets
|
$
|
42.3
|
|
$
|
12.1
|
|
|
|
Sundry
|
36.5
|
|
46.9
|
|
|||
|
Other current liabilities
|
(1.3
|
)
|
(1.6
|
)
|
|||
|
Deferred income taxes
|
(41.8
|
)
|
(63.3
|
)
|
|||
|
|
$
|
35.7
|
|
$
|
(5.9
|
)
|
|
O—Other (Income) Expense
The components of other (income) expense from continuing operations were as follows:
|
|
Year Ended December 31
|
||||||||||
|
|
2014
|
2013
|
2012
|
||||||||
|
Gain on asset sales
|
$
|
(5.1
|
)
|
$
|
(7.8
|
)
|
$
|
(.4
|
)
|
||
|
Bargain purchase gain from acquisitions (see Note R)
|
—
|
|
(8.8
|
)
|
—
|
|
|||||
|
Restructuring charges (see Note D)
|
.9
|
|
2.1
|
|
3.2
|
|
|||||
|
Asset impairments (see Note C)
|
1.3
|
|
.8
|
|
.8
|
|
|||||
|
Currency loss
|
.3
|
|
1.8
|
|
2.1
|
|
|||||
|
Royalty income
|
(1.0
|
)
|
(1.4
|
)
|
(1.6
|
)
|
|||||
|
(Gain) loss from diversified investments associated with stock-based compensation plans (see Note L)
|
(1.2
|
)
|
(1.9
|
)
|
(.5
|
)
|
|||||
|
Other income
|
(5.6
|
)
|
(5.8
|
)
|
(5.6
|
)
|
|||||
|
|
$
|
(10.4
|
)
|
$
|
(21.0
|
)
|
$
|
(2.0
|
)
|
||
106
P—Accumulated Other Comprehensive Income (Loss)
The following table sets forth the changes in each component of accumulated other comprehensive income (loss):
|
Foreign
Currency
Translation
Adjustments
|
Cash
Flow
Hedges
|
Defined
Benefit
Pension
Plans
|
Accumulated
Other
Comprehensive
Income (Loss)
|
||||||||||||
|
Balance January 1, 2012
|
$
|
147.6
|
|
$
|
(21.5
|
)
|
$
|
(60.9
|
)
|
$
|
65.2
|
|
|||
|
Other comprehensive income (loss) before reclassifications, pretax
|
15.3
|
|
(10.1
|
)
|
(16.0
|
)
|
(10.8
|
)
|
|||||||
|
Amounts reclassified from accumulated other comprehensive income, pretax:
|
|||||||||||||||
|
Cost of goods sold; selling and administrative expenses
|
—
|
|
1.9
|
|
6.3
|
|
8.2
|
|
|||||||
|
Interest expense
|
—
|
|
1.8
|
|
—
|
|
1.8
|
|
|||||||
|
Other income/expense, net
|
.7
|
|
—
|
|
—
|
|
.7
|
|
|||||||
|
Subtotal of reclassifications, pretax
|
.7
|
|
3.7
|
|
6.3
|
|
10.7
|
|
|||||||
|
Other comprehensive income (loss), pretax
|
16.0
|
|
(6.4
|
)
|
(9.7
|
)
|
(.1
|
)
|
|||||||
|
Income tax effect
|
—
|
|
2.4
|
|
3.6
|
|
6.0
|
|
|||||||
|
Attributable to noncontrolling interest
|
(.1
|
)
|
—
|
|
—
|
|
(.1
|
)
|
|||||||
|
Balance December 31, 2012
|
163.5
|
|
(25.5
|
)
|
(67.0
|
)
|
71.0
|
|
|||||||
|
Other comprehensive income (loss) before reclassifications, pretax
|
(5.0
|
)
|
(1.0
|
)
|
35.2
|
|
29.2
|
|
|||||||
|
Amounts reclassified from accumulated other comprehensive income, pretax:
|
|||||||||||||||
|
Cost of goods sold; selling and administrative expenses
|
—
|
|
.5
|
|
6.6
|
|
7.1
|
|
|||||||
|
Interest expense
|
—
|
|
3.9
|
|
—
|
|
3.9
|
|
|||||||
|
Subtotal of reclassifications, pretax
|
—
|
|
4.4
|
|
6.6
|
|
11.0
|
|
|||||||
|
Other comprehensive income (loss), pretax
|
(5.0
|
)
|
3.4
|
|
41.8
|
|
40.2
|
|
|||||||
|
Income tax effect
|
—
|
|
(1.4
|
)
|
(15.1
|
)
|
(16.5
|
)
|
|||||||
|
Attributable to noncontrolling interest
|
(.2
|
)
|
—
|
|
—
|
|
(.2
|
)
|
|||||||
|
Balance December 31, 2013
|
158.3
|
|
(23.5
|
)
|
(40.3
|
)
|
94.5
|
|
|||||||
|
Other comprehensive income (loss) before reclassifications, pretax
|
(71.7
|
)
|
.8
|
|
(49.5
|
)
|
(120.4
|
)
|
|||||||
|
Amounts reclassified from accumulated other comprehensive income, pretax:
|
|||||||||||||||
|
Net Sales
|
—
|
|
.4
|
|
—
|
|
.4
|
|
|||||||
|
Cost of goods sold; selling and administrative expenses
|
—
|
|
—
|
|
3.1
|
|
3.1
|
|
|||||||
|
Interest expense
|
—
|
|
4.0
|
|
—
|
|
4.0
|
|
|||||||
|
Subtotal of reclassifications, pretax
|
—
|
|
4.4
|
|
3.1
|
|
7.5
|
|
|||||||
|
Other comprehensive income (loss), pretax
|
(71.7
|
)
|
5.2
|
|
(46.4
|
)
|
(112.9
|
)
|
|||||||
|
Income tax effect
|
—
|
|
(1.8
|
)
|
17.4
|
|
15.6
|
|
|||||||
|
Attributable to noncontrolling interest
|
.2
|
|
—
|
|
—
|
|
.2
|
|
|||||||
|
Balance December 31, 2014
|
$
|
86.8
|
|
$
|
(20.1
|
)
|
$
|
(69.3
|
)
|
$
|
(2.6
|
)
|
|||
Q—Fair Value
We utilize fair value measures for both financial and non-financial assets and liabilities.
Items measured at fair value on a recurring basis
The areas in which we utilize fair value measures of financial assets and liabilities are presented in the table below.
Fair value measurements are established using a three level valuation hierarchy that prioritizes the inputs to valuation techniques used to measure fair value into the following categories:
107
|
•
|
Level 1: Quoted prices for identical assets or liabilities in active markets.
|
|
•
|
Level 2: Inputs other than quoted prices included in Level 1 that are observable for the asset or liability either directly or indirectly. Short-term investments in this category are valued using discounted cash flow techniques with all significant inputs derived from or corroborated by observable market data. Derivative assets and liabilities in this category are valued using models that consider various assumptions and information from market-corroborated sources. The models used are primarily industry-standard models that consider items such as quoted prices, market interest rate curves applicable to the instruments being valued as of the end of each period, discounted cash flows, volatility factors, current market and contractual prices for the underlying instruments, as well as other relevant economic measures. Substantially all of these assumptions are observable in the marketplace, can be derived from observable data or are supported by observable levels at which transactions are executed in the marketplace.
|
|
•
|
Level 3: Unobservable inputs that are not corroborated by market data.
|
|
|
As of December 31, 2014
|
||||||||||||||
|
|
Level 1
|
Level 2
|
Level 3
|
Total
|
|||||||||||
|
Assets:
|
|
|
|
|
|||||||||||
|
Cash equivalents:
|
|
|
|
|
|||||||||||
|
Bank time deposits with original maturities of three months or less
|
$
|
—
|
|
$
|
140.7
|
|
$
|
—
|
|
$
|
140.7
|
|
|||
|
Derivative assets (see Note S)
|
—
|
|
2.0
|
|
—
|
|
2.0
|
|
|||||||
|
Diversified investments associated with the ESUP* (see Note L)
|
18.8
|
|
—
|
|
—
|
|
18.8
|
|
|||||||
|
Total assets
|
$
|
18.8
|
|
$
|
142.7
|
|
$
|
—
|
|
$
|
161.5
|
|
|||
|
Liabilities:
|
|
|
|
|
|||||||||||
|
Derivative liabilities (see Note S)
|
$
|
—
|
|
$
|
2.7
|
|
$
|
—
|
|
$
|
2.7
|
|
|||
|
Liabilities associated with the ESUP* (see Note L)
|
18.6
|
|
—
|
|
—
|
|
18.6
|
|
|||||||
|
Total liabilities
|
$
|
18.6
|
|
$
|
2.7
|
|
$
|
—
|
|
$
|
21.3
|
|
|||
|
|
As of December 31, 2013
|
||||||||||||||
|
|
Level 1
|
Level 2
|
Level 3
|
Total
|
|||||||||||
|
Assets:
|
|
|
|
|
|||||||||||
|
Cash equivalents:
|
|
|
|
|
|||||||||||
|
Bank time deposits with original maturities of three months or less
|
$
|
—
|
|
$
|
114.8
|
|
$
|
—
|
|
$
|
114.8
|
|
|||
|
Derivative assets (see Note S)
|
—
|
|
.6
|
|
—
|
|
.6
|
|
|||||||
|
Diversified investments associated with the ESUP* (see Note L)
|
13.4
|
|
—
|
|
—
|
|
13.4
|
|
|||||||
|
Total assets
|
$
|
13.4
|
|
$
|
115.4
|
|
$
|
—
|
|
$
|
128.8
|
|
|||
|
Liabilities:
|
|
|
|
|
|||||||||||
|
Derivative liabilities (see Note S)
|
$
|
—
|
|
$
|
.9
|
|
$
|
—
|
|
$
|
.9
|
|
|||
|
Liabilities associated with the ESUP* (see Note L)
|
13.3
|
|
—
|
|
—
|
|
13.3
|
|
|||||||
|
Total liabilities
|
$
|
13.3
|
|
$
|
.9
|
|
$
|
—
|
|
$
|
14.2
|
|
|||
______________________________________________
* Includes both current and long-term amounts combined.
The fair value for fixed rate debt (Level 2) was not significantly different from its
$950.0
carrying value at December 31, 2014 and less than its
$830.0
carrying value by
$3.2
at December 31, 2013. We value this debt using discounted cash flow and secondary market rates provided by Bloomberg.
Items measured at fair value on a non-recurring basis
The primary areas in which we utilize fair value measures of non-financial assets and liabilities are allocating purchase price to the assets and liabilities of acquired companies as discussed in Note R and evaluating long-term assets (including goodwill) for potential impairment as discussed in Note C. Determining fair values for these items requires significant judgment and includes a variety of methods and models that utilize significant Level 3 inputs.
108
Long-lived assets, acquisitions and the second step of a goodwill impairment test utilize the following methodologies in determining fair value: (i) Buildings and machinery are valued at an estimated replacement cost for an asset of comparable age and condition. Market pricing of comparable assets are used to estimate replacement cost where available. (ii) The most common identified intangible assets are customer relationships and tradenames. Customer relationships are valued using an excess earnings method, using various inputs such as the estimated customer attrition rate, future earnings forecast, the amount of contributory asset charges, and a discount rate. Tradenames are valued using a relief from royalty method, which is based upon comparable market royalty rates for tradenames of similar value. (iii) Inventory is valued at current replacement cost for raw materials, with a step-up for work in process and finished goods items that reflects the amount of ultimate profit earned as of the valuation date. (iv) Other working capital items are generally recorded at face value, unless there are known conditions that would impact the ultimate settlement amount of the particular item.
R—Acquisitions
The following table contains the estimated fair values of the assets acquired and liabilities assumed at the date of acquisition for all acquisitions during the periods presented, and any additional consideration paid for prior years’ acquisitions. The majority of the goodwill included in the table below is expected to provide an income tax benefit.
|
2014
|
2013
|
2012
|
|||||||||
|
Accounts receivable
|
$
|
7.9
|
|
$
|
12.7
|
|
$
|
11.5
|
|
||
|
Inventory
|
16.5
|
|
15.0
|
|
21.1
|
|
|||||
|
Property, plant and equipment
|
27.1
|
|
16.1
|
|
15.7
|
|
|||||
|
Goodwill (see Note E)
|
19.0
|
|
6.1
|
|
60.2
|
|
|||||
|
Other intangible assets (see Note E)
|
14.1
|
|
12.3
|
|
109.8
|
|
|||||
|
Other current and long-term assets
|
4.1
|
|
.4
|
|
10.2
|
|
|||||
|
Current liabilities
|
(14.1
|
)
|
(19.5
|
)
|
(7.6
|
)
|
|||||
|
Long-term liabilities
|
(3.1
|
)
|
(6.4
|
)
|
(9.5
|
)
|
|||||
|
Additional consideration for prior years’ acquisitions
|
—
|
|
—
|
|
.2
|
|
|||||
|
Fair value of net identifiable assets
|
71.5
|
36.7
|
|
211.6
|
|
||||||
|
Less: Bargain purchase gain
|
—
|
|
8.8
|
|
—
|
|
|||||
|
Less: Non-cash consideration
|
1.1
|
|
—
|
|
—
|
|
|||||
|
Net cash consideration
|
$
|
70.4
|
|
$
|
27.9
|
|
$
|
211.6
|
|
||
The following table summarizes acquisitions for the periods presented.
|
Year Ended
|
Number of
Acquisitions
|
Segment
|
Product/Service
|
|||
|
December 31, 2014
|
5
|
Residential Furnishings
|
Innersprings; Home furniture components; Geotextile products; Fabric converting for furniture and bedding; Foam carpet underlay
|
|||
|
December 31, 2013
|
4
|
Residential Furnishings (1); Industrial Materials (2); Specialized Products (1)
|
Tubing for the aerospace industry (2); Innerspring unit wire-forming machines; Geotextile products
|
|||
|
December 31, 2012
|
5
|
Residential Furnishings (2); Industrial Materials (3)
|
Tubing for the aerospace industry; Wire partitions; Gel components; Tubing fabrication; Warehouse/distribution services
|
|||
We are finalizing all of the information required to complete the purchase price allocations related to the most recent acquisitions and do not anticipate any material modifications.
The results of operations of the above acquired companies have been included in the consolidated financial statements since the dates of acquisition. The unaudited pro forma consolidated net sales, net earnings and earnings per share as though the 2014 and 2013 acquisitions had occurred on January 1 of each year presented are not materially different from the amounts reflected in the accompanying financial statements. Certain of our acquisition agreements provide for additional consideration to be paid in cash at a later date and are recorded as a liability at the acquisition date. At December 31, 2014, there was no substantial remaining consideration payable.
109
A brief description of our most significant acquisitions by year is included below.
2014
On June 30, we acquired Tempur Sealy's three U.S. innerspring component production facilities for a purchase price of
$44.5
. This additional volume should enhance our economies of scale, benefit from our vertical integration in steel rod and wire, and allow manufacturing optimization across a broad asset base. These factors contributed to the recognition of
$6.6
in goodwill from this acquisition.
We also acquired Kintec-Solution, a German designer and distributor of high-end, European-styled motion components which became part of our motion hardware business for a purchase price of
$16.8
. This business allows us to meet varying design preferences and broadens the range of our furniture component products, which contributed to the recognition of
$4.4
in goodwill from this acquisition.
2013
We expanded our Aerospace Products business unit with the acquisition of two companies:
The first was a UK-based business that extended our capability in aerospace tube fabrication. This business was acquired for a purchase price of
$11.7
, and
$6.1
of goodwill was recorded related to this acquisition. Factors that contributed to a purchase price resulting in the recognition of goodwill included its international presence and complimentary fit with our Aerospace Products business unit.
The second was a French company that added small-diameter, high-pressure seamless tubing to our product portfolio for a cash purchase price of
$14.5
. This business was acquired at a price less than fair value of the net identifiable assets, and we recorded an
$8.8
non-taxable bargain purchase gain. The bargain purchase gain is reported in the "Other (income) expense, net" line of our income statement. Prior to recognizing a bargain purchase gain, we reassessed whether all assets acquired and liabilities assumed had been correctly identified, the key valuation assumptions and business combination accounting procedures for this acquisition. After careful consideration and review, we concluded that the recognition of a bargain purchase gain was appropriate for this acquisition. Factors that contributed to the bargain purchase price were:
• The transaction was completed with a motivated seller that desired to restructure its operations in order to focus on its core competencies and exit in an expedient manner non-core businesses that no longer fit its strategy.
• We were able to complete the acquisition in an expedient manner, with a cash payment and without a financial contingency, which was a key attribute for the seller. The relatively small size of the transaction for us, the lack of required third-party financing and our expertise in completing similar transactions in the past gave the seller confidence that we could complete the transaction quickly and without difficultly.
• Because the seller of this business will continue to purchase these products in the future it was important to the seller that the acquiring company was a financially sound, integrated manufacturer that could provide a stable supply of high quality product for many years into the future. Due to the unique nature of the products and limited number of potential buyers for this business, the seller found it advantageous to accept our purchase price based upon our demonstrated ability to operate similar businesses, and financial strength that will enable us to be a long-term supplier of quality products into the future.
2012
We acquired Western Pneumatic Tube Holding, LLC (Western) for a cash purchase price of
$188.2
forming the Aerospace Products business unit within the Tubing Group. Western is a leading provider of integral components for critical aircraft systems, and specializes in fabricating thin-walled, large diameter, welded tubing and specialty formed products from titanium, nickel and other specialty materials for leading aerospace suppliers and OEMs. Factors that contributed to a purchase price resulting in the recognition of goodwill included Western's competitive position, and its fit with our strategy to seek businesses with secure, leading positions in growing, profitable, attractive markets.
In addition, during 2012 we invested
$22.4
to acquire an interest in an unconsolidated entity related to a potential acquisition. We had no contractual right or obligation to make any additional investment and liquidated our position for
$21.2
, plus
$1.8
in interest during 2013.
110
S—Derivative Financial Instruments
Risk Management Strategy & Objectives
We are subject to market and financial risks related to interest rates, foreign currency, and commodities. In the normal course of business, we utilize derivative instruments (individually or in combinations) to manage these risks. We seek to use derivative contracts that qualify for hedge accounting treatment; however, some instruments may not qualify for hedge accounting treatment. It is our policy not to speculate using derivative instruments.
Cash Flow Hedges
Derivative financial instruments that we use to hedge forecasted transactions and anticipated cash flows are as follows:
|
•
|
Commodity Cash Flow Hedges
—We have historically used commodity cash flow hedges primarily to manage natural gas commodity price risk. Our last natural gas commodity hedge expired during 2013.
|
|
•
|
Interest Rate Cash Flow Hedges
—On August 12, 2012, we issued
$300
of
10
-year notes with a coupon rate of
3.40%
. As a part of this transaction, we settled our
$200
forward starting interest rate swaps we had entered into during 2010 and recognized a loss of
$42.7
, which will be amortized out of accumulated other comprehensive income to interest expense over the life of the notes.
|
In anticipation of the issuance of new debt, we entered into a treasury lock agreement in October 2014. The treasury lock managed benchmark treasury interest rate risk associated with
$50
of the additional
$300
debt issued in November 2014 and was therefore settled on that same date. The treasury lock had an interest rate of
2.36%
. The settlement of the treasury lock did not result in a material gain or loss.
|
•
|
Currency Cash Flow Hedges
—The foreign currency hedges manage risk associated with exchange rate volatility of various currencies.
|
The effective changes in fair value of unexpired contracts are recorded in accumulated other comprehensive income and reclassified to income or expense in the period in which earnings are impacted. Cash flows from settled contracts are presented in the category consistent with the nature of the item being hedged. (Settlements associated with the sale or production of product are presented in operating cash flows and settlements associated with debt issuance are presented in financing cash flows.)
Fair Value Hedges
Our fair value hedges typically manage foreign currency risk associated with subsidiaries’ assets and liabilities. Hedges designated as fair value hedges recognize gain or loss currently in earnings. Cash flows from settled contracts are presented in the category consistent with the nature of the item being hedged.
Hedge Effectiveness
We have deemed ineffectiveness to be immaterial, and as a result, have not recorded any amounts for ineffectiveness. If a hedge was not highly effective, the portion of the change in fair value considered to be ineffective would be recognized immediately in the consolidated statements of operations.
We have recorded the following assets and liabilities representing the fair value for our most significant derivative financial instruments. The fair values of the derivatives reflect the change in the market value of the derivative from the date of the trade execution, and do not consider the offsetting underlying hedged item.
111
|
|
Expiring at various dates through:
|
Total USD
Equivalent
Notional
Amount
|
As of December 31, 2014
|
|||||||||||||||
|
Derivatives Designated as Hedging Instruments
|
Assets
|
Liabilities
|
||||||||||||||||
|
Other Current
Assets
|
Other Current
Liabilities
|
Other Long-Term
Liabilities
|
||||||||||||||||
|
Cash flow hedges:
|
|
|
|
|
||||||||||||||
|
Currency hedges:
|
||||||||||||||||||
|
-Future USD sales of Canadian and Chinese subsidiaries
|
Dec 2016
|
$
|
153.3
|
|
$
|
.3
|
|
$
|
1.0
|
|
$
|
.2
|
|
|||||
|
-Future USD purchases of Canadian and European subsidiaries
|
Dec 2015
|
10.4
|
|
.9
|
|
—
|
|
—
|
|
|||||||||
|
-Future USD purchases of a USD subsidiary
|
Dec 2016
|
5.3
|
|
—
|
|
.3
|
|
.1
|
|
|||||||||
|
-Future JPY sales of Chinese subsidiary
|
Dec 2015
|
6.9
|
|
.5
|
|
—
|
|
—
|
|
|||||||||
|
-Future EUR Sales of Chinese Subsidiary
|
Dec 2015
|
6.0
|
|
.3
|
|
—
|
|
—
|
|
|||||||||
|
Total cash flow hedges
|
|
2.0
|
|
1.3
|
|
.3
|
|
|||||||||||
|
Fair value hedges:
|
|
|
|
|
||||||||||||||
|
USD inter-company note receivable on a Swiss subsidiary
|
Sep 2015
|
18.5
|
—
|
|
1.1
|
|
—
|
|
||||||||||
|
|
|
$
|
2.0
|
|
$
|
2.4
|
|
$
|
.3
|
|
||||||||
|
|
Expiring at various dates through:
|
Total USD
Equivalent
Notional
Amount
|
As of December 31, 2013
|
|||||||||||
|
Derivatives Designated as Hedging Instruments
|
Assets
|
Liabilities
|
||||||||||||
|
Other Current
Assets
|
Other Current
Liabilities
|
|||||||||||||
|
Cash flow hedges:
|
||||||||||||||
|
Currency hedges:
|
||||||||||||||
|
-Future USD sales of Canadian and Chinese subsidiaries
|
Dec 2015
|
$
|
133.9
|
|
$
|
.1
|
|
$
|
.8
|
|
||||
|
-Future JPY sales of Chinese subsidiary
|
Dec 2014
|
5.1
|
|
.1
|
|
—
|
|
|||||||
|
-Future EUR Sales of Chinese Subsidiary
|
Feb 2015
|
4.7
|
|
—
|
|
.1
|
|
|||||||
|
Total cash flow hedges
|
.2
|
|
.9
|
|
||||||||||
|
Fair value hedges:
|
||||||||||||||
|
USD inter-company note receivables on a Swiss subsidiary
|
Mar 2014
|
14.5
|
|
.4
|
|
—
|
|
|||||||
|
$
|
.6
|
|
$
|
.9
|
|
|||||||||
112
The following table sets forth the pre-tax (gains) losses from continuing operations for our hedging activities for the years presented. This schedule includes reclassifications from accumulated other comprehensive income as well as derivative settlements recorded directly to income or expense.
|
|
Income Statement
Caption
|
Amount of (Gain) Loss
Recorded in Income
for the Year Ended
December 31
|
||||||||||||
|
Derivatives Designated as Hedging Instruments
|
2014
|
2013
|
2012
|
|||||||||||
|
Commodity cash flow hedges
|
Cost of goods sold
|
$
|
—
|
|
$
|
.4
|
|
$
|
2.4
|
|
||||
|
Interest rate cash flow hedges
|
Interest expense
|
4.0
|
|
3.9
|
|
1.8
|
|
|||||||
|
Currency cash flow hedges
|
Net sales *
|
2.1
|
|
(1.5
|
)
|
(.6
|
)
|
|||||||
|
Currency cash flow hedges
|
Cost of goods sold
|
(.3
|
)
|
.1
|
|
(.5
|
)
|
|||||||
|
Currency cash flow hedges
|
Other (income) expense, net
|
.4
|
|
.2
|
|
.2
|
|
|||||||
|
Total cash flow hedges
|
|
6.2
|
|
3.1
|
|
3.3
|
|
|||||||
|
Fair value hedges
|
Other (income) expense, net
|
2.7
|
|
(3.2
|
)
|
(.2
|
)
|
|||||||
|
Derivatives Not Designated as Hedging Instruments
|
|
|
|
|
||||||||||
|
Hedge of EUR assets (including inter-company note receivables)-UK and USD subsidiaries
|
Other (income) expense, net
|
—
|
|
—
|
|
(.8
|
)
|
|||||||
|
Hedge of steel purchases - US subsidiary
|
Other (income) expense, net
|
—
|
|
—
|
|
.1
|
|
|||||||
|
Hedge of EUR inter-company note receivable- USD denominated subsidiary
|
Interest expense
|
—
|
|
—
|
|
.1
|
|
|||||||
|
Total derivative instruments
|
|
$
|
8.9
|
|
$
|
(.1
|
)
|
$
|
2.5
|
|
||||
|
* Discontinued operations amounts included in the above:
|
$
|
.1
|
|
$
|
.2
|
|
$
|
—
|
|
|||||
T—Contingencies
We are a party to various proceedings and matters involving employment, antitrust, intellectual property, environmental, taxation and other laws. When it is probable, in management's judgment, that we may incur monetary damages or other costs resulting from these proceedings or other claims, and we can reasonably estimate the amounts, we record appropriate liabilities in the financial statements and make charges against earnings. For all periods presented, we have recorded no material charges against earnings other than as indicated below.
Foam Antitrust Lawsuits
We deny all allegations in all pending antitrust proceedings. We will vigorously defend ourselves in all proceedings and believe that we have valid bases to contest all claims. However, we have established an accrual for the estimated amount that we believe is necessary to resolve all antitrust matters. We also believe and expect, based on current facts and circumstances, that any reasonably possible losses incremental to the recorded accrual will not have a material impact on our consolidated financial position, results of operations or cash flows. For specific information regarding accruals please see “Accrual for Loss Contingencies” below.
Beginning in August 2010, a series of civil lawsuits was initiated in several U.S. federal courts and in Canada against several defendants alleging that competitors of our carpet underlay business unit and other manufacturers of polyurethane foam products had engaged in price fixing in violation of U.S. and Canadian antitrust laws.
U.S. Direct Purchaser Class Action Cases.
We were named as a defendant in
three
pending direct purchaser class action cases (the first on November 15, 2010) on behalf of a class of all direct purchasers of polyurethane foam products. The direct purchaser class action cases were all filed in or were transferred to the U.S. District Court for the Northern District of Ohio under the name
In re: Polyurethane Foam Antitrust Litigation
, Case No. 1:10-MD-2196.
113
The plaintiffs, on behalf of themselves and/or a class of direct purchasers, seek three times the amount of damages allegedly suffered as a result of alleged overcharges in the price of polyurethane foam products from at least 1999 to the present. Each plaintiff also seeks attorney fees, pre-judgment and post-judgment interest, court costs, and injunctive relief against future violations. We filed motions to dismiss the U.S. direct purchaser class actions in the consolidated case in Ohio, for failure to state a legally valid claim, which were denied by the Ohio Court. A motion for class certification was filed on behalf of the direct purchasers. A hearing on the motion was held and the Court certified the direct purchaser class. We filed a Petition for Permission to Appeal from Class Certification Order to the United States Court of Appeals for the Sixth Circuit which was denied. The Court ordered all parties to attend non-binding mediation with a mediator of their choosing.
Tentative Settlement of U.S. Direct Purchaser Class Action Cases.
We reached a tentative settlement in the U.S. direct purchaser class action cases on August 14, 2014, by agreeing to pay an aggregate amount of
$39.8
, inclusive of plaintiff attorneys' fees and costs. We continue to deny all allegations in the cases, but settled the direct purchaser class cases to avoid the risk, uncertainty, expense and distraction of litigation. The settlement is subject to Court approval. We recorded a
$39.8
(pre-tax) accrual for the settlement in the third quarter 2014. In the fourth quarter of 2014, we paid
$4
to the Court related to the tentative settlement. Since the accrual is partially attributable to our former Prime Foam Products business, which was sold in the first quarter of 2007,
$8.3
of expense is reflected in discontinued operations. The deadline for direct purchasers to exclude themselves from the litigation and settlement classes was January 26, 2015. A final fairness hearing was held on February 3, 2015, but we have not yet received a ruling.
U.S. Indirect Purchaser Class Action Cases.
We were named as a defendant in an indirect purchaser class consolidated amended complaint filed on March 21, 2011 and were subsequently sued in an indirect purchaser class action case filed on May 23, 2011, in the U.S. District Court for the Northern District of Ohio under the name
In re: Polyurethane Foam Antitrust Litigation
, Case No. 1:10-MD-2196. The plaintiffs, on behalf of themselves and/or a class of indirect purchasers, bring damages claims under various states’ antitrust and consumer protection statutes, and are seeking three times an amount of damages allegedly suffered as a result of alleged overcharges in the price of polyurethane foam products from at least 1999 to the present. Each plaintiff also seeks attorney fees, pre-judgment and post-judgment interest, court costs, and injunctive relief against future violations. We filed motions to dismiss the indirect purchaser class action, for failure to state a legally valid claim. The Ohio Court denied the motions to dismiss. Discovery is substantially complete in this case. A motion for class certification was filed on behalf of the indirect purchasers. A hearing on the motion was held and the Court certified the indirect purchaser class. We filed a Petition for Permission to Appeal from Class Certification Order to the United States Court of Appeals for the Sixth Circuit, which was denied. On November 18, 2014, we filed a Petition for a Writ of Certiorari in the U.S. Supreme Court where it remains pending. The Ohio Court ordered all parties to attend non-binding mediation with a mediator of their choosing.
U.S. Individual Direct Purchaser Cases.
We have been named as a defendant in
35
individual direct purchaser cases filed between March 22, 2011 and October 16, 2013, which were filed in or transferred to the U.S. District Court for the Northern District of Ohio under the name
In re: Polyurethane Foam Antitrust Litigation
, Case No. 1:10-MD-2196. The claims in the individual direct purchaser cases are generally the same as those asserted in the direct purchaser class action case, with the exception of one case that also alleges an indirect purchaser claim. Additionally, several individual direct purchaser plaintiffs bring state claims under individual states’ consumer protection and/or antitrust statutes in addition to their federal claims. Once pretrial practice concludes, some of the individual direct purchaser cases are scheduled to be tried in the U.S. District Court for the Northern District of Ohio and others will be remanded back to the federal district courts where the cases were originally filed for trial.
Kansas Restraint of Trade Act Cases.
We have been named as a defendant in
two
individual cases alleging direct and indirect purchaser claims under the Kansas Restraint of Trade Act, one filed on November 29, 2012 and the other on April 11, 2013. These two cases were filed in the U.S. District Court for the District of Kansas and then transferred to the U.S. District Court for the Northern District of Ohio under the name
In re: Polyurethane Foam Antitrust Litigation
, Case No. 1:10-MD-2196. The claims and allegations of these plaintiffs are generally the same as the other direct and indirect purchaser plaintiffs, with the exception that the Kansas plaintiffs seek full consideration damages (their total purchase amounts for the allegedly price-fixed polyurethane foam products). Once pretrial practice concludes, this case will be remanded back to the District of Kansas federal district court for trial.
Canadian Class Action Cases.
We were named in
two
Canadian class action cases (for direct and indirect purchasers of polyurethane foam products), both under the name
Hi Neighbor Floor Covering Co. Limited and Hickory Springs Manufacturing Company, et.al.
in the Ontario Superior Court of Justice (Windsor), Court File Nos. CV-10-15164 (amended November 2, 2011) and CV-11-17279 (issued December 30, 2011). In each of these Canadian cases, the plaintiffs, on behalf of themselves and/or a class of purchasers, seek from over
13
defendants restitution of the amount allegedly overcharged, general
114
and special damages in the amount of
$100
, punitive damages of
$10
, pre-judgment and post-judgment interest, and the costs of the investigation and the action. The first issued class action is on behalf of a class of purchasers of polyurethane foam. The second issued class action is on behalf of purchasers of carpet underlay. We are not yet required to file our defenses in these or any other Canadian actions. In addition, on July 10, 2012, plaintiff in a class action case (for direct and indirect purchasers of polyurethane foam products) styled
Option Consommateurs and Karine Robillard v. Produits Vitafoam Canada Limitée, et. al.
in the Quebec Superior Court of Justice (Montréal), Court File No. 500-6-524-104, filed an amended motion for authorization seeking to add us and other manufacturers of polyurethane foam products as defendants in this case, which was granted. This action has a pending motion for certification, which has been postponed indefinitely. We also were notified in June 2014 of two motions to add us as parties to two class proceedings in British Columbia. Those proceedings are similar to the Ontario proceedings in that one proposes a class of purchasers of polyurethane foam (
Majestic Mattress Mfg. Ltd. v. Vitafoam Products et al
., No. VLC-S-S-106362 Vancouver Registry) and one proposes a class of purchasers of carpet underlay (
Trillium Project Management Ltd. v. Hickory Springs Manufacturing Company et al
., No.S106213 Vancouver Registry). The motion to add us as parties to these actions has been scheduled to be heard with the motions for certification in the two actions in April 2015. The British Columbia actions involve British Columbia purchasers only whereas the Ontario actions propose classes of Canadian purchasers. No certification motions will be brought in the Ontario actions until after the British Columbia motions for certification have been determined.
Missouri Class Action Case.
On June 22, 2012, we were made a party to a lawsuit brought in the 16
th
Judicial Circuit Court, Jackson County, Missouri, Case Number 1216-CV15179 under the caption “
Dennis Baker, on Behalf of Himself and all Others Similarly Situated vs. Leggett & Platt, Incorporated.
” The plaintiff, on behalf of himself and/or a class of indirect purchasers of polyurethane foam products in the State of Missouri, alleged that we violated the Missouri Merchandising Practices Act based upon our alleged illegal price inflation of flexible polyurethane foam products. The plaintiff seeks unspecified actual damages, punitive damages and the recovery of reasonable attorney fees. We filed a motion to dismiss this action, which was denied. Discovery has commenced and plaintiff has filed a motion for class certification. A hearing on the motion was held but we have yet to receive any ruling.
Brazilian Value-Added Tax Matters
We deny all of the allegations in all of the below Brazilian actions. We believe that we have valid bases upon which to contest such actions and will vigorously defend ourselves. However, these contingencies are subject to many uncertainties, and based on current facts and circumstances, we believe that it is reasonably possible (but not probable) that we may incur losses with respect to these assessments. Therefore, no accrual has been recorded for Brazilian VAT matters.
Brazilian Federal Cases.
On December 22, 2011, the Brazilian Finance Ministry, Federal Revenue Office issued a notice of violation against our wholly-owned subsidiary, Leggett & Platt do Brasil Ltda. (“L&P Brazil”) in the amount of
$2.7
, under Case No. 10855.724660/2011-43. The Brazilian Revenue Office claimed that for the period beginning November 2006 and continuing through December 2007, L&P Brazil used an incorrect tariff code for the collection and payment of value-added tax primarily on the sale of mattress innerspring units in Brazil. L&P Brazil responded to the notice of violation denying the violation. The Federal Revenue Office denied L&P Brazil’s defenses and upheld the assessment at the first administrative level. L&P Brazil has filed an appeal.
On December 29, 2011, L&P received another assessment in the amount of
$.1
, under case No. 10855.724509/2011-13 on the same subject matter in connection to certain import transactions carried out between 2007 and 2011. L&P has filed its defense.
On December 17, 2012, the Brazilian Revenue Office issued an additional notice of violation in the amount of
$4.7
under MPF Case No. 10855.725260/2012-36 covering the period from January 1, 2008 through December 31, 2010 on the same subject matter. L&P Brazil responded to the notice of violation denying the violation. The Brazilian Revenue Office denied L&P Brazil's defenses and upheld the assessment at the first administrative level. L&P Brazil has appealed this decision, but the appeal was denied by the second administrative level on January 27, 2015.
In addition, L&P Brazil received assessments on December 22, 2011, and June 26, July 2 and November 5, 2012, and September 13, 2013 from the Brazilian Federal Revenue Office where the Revenue Office challenged L&P Brazil’s use of certain tax credits in the years 2005 through 2010. Such credits are generated based upon the tariff classification and rate used by L&P Brazil for value-added tax on the sale of mattress innersprings. On September 4, 2014, the tax authorities issued five additional assessments regarding this same issue (use of credits), covering certain periods of 2011 and 2012. L&P Brazil has filed its defense to all of these assessments. Combined with the prior assessments, L&P Brazil has received assessments totaling
$3.1
on the same or similar denial of tax credit matters.
115
On February 1, 2013, the Brazilian Finance Ministry filed a Tax Collection action against L&P Brazil in the Camanducaia Judicial District Court, Case No. 0002222-35.2013.8.13.0878, alleging the untimely payment of
$.2
of social contributions (social security and social assistance payments) for the period September to October 2010. L&P Brazil filed its response, a Motion to Stay of Execution. L&P Brazil argued the payments were not required to be made because of the application of certain tax credits that were generated by L&P Brazil's use of a correct tariff code for the classification of value-added tax on the sale of mattress innersprings (i.e., the same underlying issue at stake in the other Brazilian matters).
On June 26, 2014, the Brazilian Revenue Office issued a new notice of violation against L&P Brazil in the amount of
$.9
, under Case No. 10660.721523/2014-87, covering the period from 2011 through 2012 on the same subject matter. L&P Brazil has filed its defense denying the assessments.
On July 1, 2014, the Brazilian Finance Ministry rendered a preliminary decision to reject certain offsetting requests presented by L&P Brazil, which originated with Administrative Proceeding No. 10660.720850/2014-11. The Brazilian Finance Ministry alleges that L&P Brazil improperly offset
$.1
of social contributions otherwise due in 2011. L&P Brazil filed its response denying the allegations. L&P Brazil is defending on the basis that the social contribution debts were correctly offset with certain tax credits that were generated by L&P Brazil's use of a correct tariff code classification for value-added tax on the sale of mattress innersprings (i.e., the same underlying issue at stake in the other Federal Brazilian matters).
On September 4, 2014, the Brazilian Federal Revenue issued an assessment against L&P Brazil in the amount of
$.2
, for the period of April 2011 through June 2012, as a penalty for L&P Brazil’s requests to offset certain tax credits. We have filed our defense.
State of S
ã
o Paulo, Brazil Cases.
L&P Brazil is party to a proceeding involving the State of S
ã
o Paulo, Brazil where the State of S
ã
o Paulo, on April 16, 2009, issued a Notice of Tax Assessment and Imposition of Fine to L&P Brazil seeking
$2.1
for the tax years 2006 and 2007, under Case No. 3.111.006 (DRT n°.04-256.169/2009). The State of S
ã
o Paulo argued that L&P Brazil was using an incorrect tariff code for the collection and payment of value-added tax on sales of mattress innerspring units in the State of S
ã
o Paulo. The Court of Tax and Fees of the State of S
ã
o Paulo ruled in favor of L&P Brazil nullifying the tax assessment. The State filed a special appeal and the Special Appeals court remanded the case back to the Court of Tax and Fees for further findings. The Court of Tax and Fees again ruled in favor of L&P Brazil and nullified the tax assessment. The State filed another special appeal. On April 17, 2014, the Court of Tax and Fees ruled in the State's favor upholding the original assessment of
$2.1
. On July 31, 2014, L&P Brazil filed an annulment action, Case No. 101712346.2014.8260602 in the Sorocaba State Court, seeking to have the Court of Tax and Fees ruling annulled for an updated assessment amount of
$4.2
. On December 3, 2014, the State of S
ã
o Paulo filed a Tax Collection action against L&P Brazil in Sorocaba Judicial District Court, Case No. 1501115-34.2014.8.26.0602, seeking to collect the same amounts at issue in annulment action No. 101712346.2014.8260602. The original assessment amount of
$4.2
was increased by 10% to include attorneys' fees.
On October 4, 2012, the State of S
ã
o Paulo issued a Tax Assessment under Procedure Number 4.003.484 against L&P Brazil in the amount of
$1.7
for the tax years 2009 through 2011. Similar to the 2009 assessment, the State of S
ã
o Paulo argues that L&P Brazil was using an incorrect tax rate for the collection and payment of value-added tax on sales of mattress innerspring units in the State of S
ã
o Paulo. On June 21, 2013, the State of S
ã
o Paulo's attorneys converted the Tax Assessment No. 4.003.484 to a tax collection action against L&P Brazil in the amount of
$2.2
, under Sorocaba Judicial District Court, Case No. 3005528-50.2013.8.26.0602. L&P Brazil filed its response, a Motion to Stay of Execution denying the allegations.
L&P Brazil also received a Notice of Tax Assessment and Imposition of a Fine from the State of S
ã
o Paulo dated March 27, 2014, under Procedure Number 4.038.746-0 against L&P Brazil in the amount of
$1.1
for the tax years January 2011 through August 2012 regarding the same subject matter. L&P filed its response denying the allegations. The first administrative level denied L&P Brazil’s defense and upheld the assessment. L&P Brazil filed its appeal of this decision.
State of Minas Gerais, Brazil Cases.
On December 18, 2012, the State of Minas Gerais, Brazil issued a tax assessment to L&P Brazil relating to L&P Brazil's classifications of innersprings for the collection and payment of value-added tax on the sale of mattress innersprings in Minas Gerais from March 1, 2008 through August 31, 2012 in the amount of
$.5
, under PTA Case No. 01.000.182756-62. L&P Brazil filed its response denying any violation. The first administrative level ruled against us but did reduce the tax to
$.3
(plus interest and penalties). We appealed to the second administrative level, which affirmed the first administrative level ruling. The case will now proceed judicially under Case No. 0003673-61.2014.8.13.0878 in Camanducaia Judicial District Court for the updated amount of
$.5
. L&P Brazil filed its response, a Motion to Stay of Execution, on June 5, 2014.
116
Patent Infringement Claim
At this time, we do not expect that the outcome of this matter will have a material adverse effect on our consolidated financial condition, results of operations or cash flows.
First Lawsuit.
On January 24, 2012, in a case in the United States District Court for the Central District of California, the jury entered a verdict against us in the amount of
$5
based upon an allegation by plaintiff that we infringed three patents on an automatic stapling machine and on methods used to assemble boxsprings. This action was originally filed on October 4, 2010, as case number CV10-7416 RGK (SSx) under the caption Imaginal Systematic, LLC v. Leggett & Platt, Incorporated; Simmons Bedding Company; and Does 1 through 10, inclusive. Leggett is contractually obligated to defend and indemnify Simmons Bedding Company against a claim for infringement.
On summary judgment motions, we unsuccessfully disputed each patent’s validity and denied that we infringed any patent. At the jury trial on damages issues, the plaintiff alleged damages of
$16.2
. The court denied plaintiff’s attempt to win an attorney fee award and triple the pre-verdict damages. We appealed the case to the Federal Circuit Court of Appeals. Oral argument was held before a three judge appeal panel in the Federal Circuit in Washington D.C. The Court of Appeals issued a judgment affirming the
$5
verdict against us, which was fully accrued for in the first quarter of 2013 and then paid in the second quarter of 2013. We filed a petition for a rehearing of the Court of Appeals decision which was denied.
The plaintiff requested royalties for post-verdict use of the machines, and requested pre-judgment interest in the amount of
$.7
. The District Court ruled that the plaintiff was not entitled to additional ongoing royalties for our continued use of the machines, but did award pre-judgment interest of
$.5
. Both parties filed a notice of appeal of this order to the Federal Circuit Court of Appeals, but plaintiff has since withdrawn its appeal.
We also filed reexamination proceedings in the Patent Office (Case Nos. 95/001,543 filed February 11, 2011; 95/001,546 and 95/001,547 filed February 16, 2011), challenging the validity of each patent at issue in the lawsuit the plaintiff brought. The Patent Office examiner ruled in our favor on the key claims of one of the three patents. The Patent Office examiner initially ruled in our favor on the pertinent claims of the second of the patents, but subsequently reversed that decision. With respect to the third patent, the Patent Office examiner's decision upheld the validity of all claims. All three of these proceedings were appealed to the Board of Patent Appeals. The plaintiff filed petitions to terminate all re-examination proceedings based on the final ruling of the Federal Circuit Court of Appeals. We opposed those petitions. The Patent Office terminated all three re-examination proceedings, and we requested an ex parte reexamination as to one of the patents. The Patent Office did not accept our request.
Second Lawsuit.
On July 29, 2013, the plaintiff filed a second lawsuit in the United States District Court for the Central District of California, Case No. CV13-05463 alleging that we and Simmons Bedding Company have continued to infringe the three patents on an automatic stapling machine and the methods used to assemble boxsprings, and that the plaintiff is entitled to additional damages from January 24, 2012 forward. Leggett and Simmons Bedding Company filed their answers, and the Court granted summary judgment finding that the use of an earlier version of the automatic stapling machines constituted infringement, but also finding that use of a redesigned version of the machine does not infringe any Imaginal patent. On October 17, 2014, the parties entered into a Confidential Settlement Agreement and Limited Release, whereby Leggett agreed to pay Imaginal a cash payment, which is not material to the Company, to settle the part of the case concerning the machines found to infringe. Imaginal is appealing the summary judgment ruling that the redesigned stapling machines do not infringe to the U.S. Court of Appeals for the Federal Circuit. The appeal is currently pending.
Accrual for Loss Contingencies
Although the Company denies liability in all threatened or pending litigation proceedings in which it is or may be a party and believes that it has valid bases to contest all claims threatened or made against it, we recorded, in addition to previously recognized unpaid accruals disclosed above, an additional aggregate (pre-tax) litigation accrual in continuing operations of
$22
in the fourth quarter of 2014 which represents our reasonable estimate of unrecorded probable loss for all pending and threatened litigation proceedings impacting continuing operations. We expect to make most of these cash payments in 2015 with the remainder expected to be paid in 2016. We have relied on several facts and circumstances that have changed since the filing of our last periodic report, most significantly in January 2015, to conclude that some loss is probable with respect to certain proceedings and matters, to arrive at a reasonable estimate of loss and record the accrual, including: the maturation of the pending proceedings and matters; our experience in settlement negotiations and mediation; comparative settlements of other companies in similar proceedings; discovery becoming substantially complete in certain proceedings; certain quantitative metrics used to value probable loss contingencies; and our willingness to settle certain proceedings to forgo the cost and risk of
117
litigation and distraction to our senior executives. We also recorded an additional
$27
litigation contingency accrual in discontinued operations in the fourth quarter based upon the same facts, circumstances and analysis as described above. We expect to make most of these cash payments in 2015 with the remainder expected to be paid in 2016. By far the largest portion of the accruals is for the foam antitrust proceedings.
Although there are a number of uncertainties and potential outcomes associated with all of our pending or threatened litigation proceedings, we believe, based on current facts and circumstances, that additional reasonably possible losses (other than those Brazilian VAT matters quantified and disclosed above), are not expected to materially affect our consolidated financial position, results of operations or cash flows.
For more information regarding discontinued operations, please refer to footnote B on page 77 of our Notes to Consolidated Financial Statements.
118
Quarterly Summary of Earnings
Leggett & Platt, Incorporated
(Unaudited)
(Dollar amounts in millions, except per share data)
|
Year ended December 31
|
First
|
Second
1
|
Third
2,4
|
Fourth
3,5
|
Total
|
||||||||||||||
|
2014
|
|
|
|
|
|
||||||||||||||
|
Net sales
|
$
|
875.5
|
|
$
|
956.1
|
|
$
|
997.4
|
|
$
|
953.3
|
|
$
|
3,782.3
|
|
||||
|
Gross profit
|
176.8
|
|
200.7
|
|
209.1
|
|
203.8
|
|
790.4
|
|
|||||||||
|
Earnings from continuing operations before income taxes
|
76.8
|
|
93.2
|
|
66.5
|
|
59.0
|
|
295.5
|
|
|||||||||
|
Earnings from continuing operations
|
$
|
56.0
|
|
$
|
69.6
|
|
$
|
53.4
|
|
$
|
46.2
|
|
$
|
225.2
|
|
||||
|
Earnings (loss) from discontinued operations, net of tax
|
(2.3
|
)
|
(92.7
|
)
|
(4.4
|
)
|
(24.6
|
)
|
(124.0
|
)
|
|||||||||
|
Net earnings
|
53.7
|
|
(23.1
|
)
|
49.0
|
|
21.6
|
|
101.2
|
|
|||||||||
|
(Earnings) attributable to noncontrolling interest, net of tax
|
(.6
|
)
|
(.8
|
)
|
(.8
|
)
|
(1.0
|
)
|
(3.2
|
)
|
|||||||||
|
Net earnings attributable to Leggett & Platt, Inc. common shareholders
|
$
|
53.1
|
|
$
|
(23.9
|
)
|
$
|
48.2
|
|
$
|
20.6
|
|
$
|
98.0
|
|
||||
|
Earnings per share from continuing operations attributable to Leggett & Platt, Inc. common shareholders
|
|
|
|
|
|||||||||||||||
|
Basic
|
$
|
.39
|
|
$
|
.49
|
|
$
|
.37
|
|
$
|
.32
|
|
$
|
1.57
|
|
||||
|
Diluted
|
$
|
.38
|
|
$
|
.48
|
|
$
|
.37
|
|
$
|
.32
|
|
$
|
1.55
|
|
||||
|
Earnings (loss) per share from discontinued operations attributable to Leggett & Platt, Inc. common shareholders
|
|
|
|
|
|
||||||||||||||
|
Basic
|
$
|
(.02
|
)
|
$
|
(.66
|
)
|
$
|
(.03
|
)
|
$
|
(.17
|
)
|
$
|
(.88
|
)
|
||||
|
Diluted
|
$
|
(.02
|
)
|
$
|
(.65
|
)
|
$
|
(.03
|
)
|
$
|
(.17
|
)
|
$
|
(.87
|
)
|
||||
|
Net earnings per share attributable to Leggett & Platt, Inc. common shareholders
|
|
|
|
|
|
||||||||||||||
|
Basic
|
$
|
.37
|
|
$
|
(.17
|
)
|
$
|
.34
|
|
$
|
.15
|
|
$
|
.69
|
|
||||
|
Diluted
|
$
|
.37
|
|
$
|
(.17
|
)
|
$
|
.34
|
|
$
|
.14
|
|
$
|
.68
|
|
||||
|
2013
|
|
|
|
|
|
||||||||||||||
|
Net sales
|
$
|
860.8
|
|
$
|
879.6
|
|
$
|
877.6
|
|
$
|
859.2
|
|
$
|
3,477.2
|
|
||||
|
Gross profit
|
179.9
|
|
185.3
|
|
179.6
|
|
165.1
|
|
709.9
|
|
|||||||||
|
Earnings from continuing operations before income taxes
|
68.4
|
|
82.4
|
|
90.5
|
|
(3.7
|
)
|
237.6
|
|
|||||||||
|
Earnings from continuing operations
|
$
|
49.7
|
|
$
|
59.6
|
|
$
|
66.5
|
|
$
|
10.5
|
|
$
|
186.3
|
|
||||
|
Earnings (loss) from discontinued operations, net of tax
|
(.2
|
)
|
12.3
|
|
5.5
|
|
(4.2
|
)
|
13.4
|
|
|||||||||
|
Net earnings
|
49.5
|
|
71.9
|
|
72.0
|
|
6.3
|
|
199.7
|
|
|||||||||
|
(Earnings) attributable to noncontrolling interest, net of tax
|
(.4
|
)
|
(.6
|
)
|
(.7
|
)
|
(.7
|
)
|
(2.4
|
)
|
|||||||||
|
Net earnings attributable to Leggett & Platt, Inc. common shareholders
|
$
|
49.1
|
|
$
|
71.3
|
|
$
|
71.3
|
|
$
|
5.6
|
|
$
|
197.3
|
|
||||
|
Earnings per share from continuing operations attributable to Leggett & Platt, Inc. common shareholders
|
|
|
|
|
|
||||||||||||||
|
Basic
|
$
|
.34
|
|
$
|
.41
|
|
$
|
.45
|
|
$
|
.07
|
|
$
|
1.27
|
|
||||
|
Diluted
|
$
|
.33
|
|
$
|
.40
|
|
$
|
.45
|
|
$
|
.07
|
|
$
|
1.25
|
|
||||
|
Earnings (loss) per share from discontinued operations attributable to Leggett & Platt, Inc. common shareholders
|
|
|
|
|
|
||||||||||||||
|
Basic
|
$
|
—
|
|
$
|
.08
|
|
$
|
.04
|
|
$
|
(.03
|
)
|
$
|
.09
|
|
||||
|
Diluted
|
$
|
—
|
|
$
|
.08
|
|
$
|
.04
|
|
$
|
(.03
|
)
|
$
|
.09
|
|
||||
|
Net earnings per share attributable to Leggett & Platt, Inc. common shareholders
|
|
|
|
|
|
||||||||||||||
|
Basic
|
$
|
.34
|
|
$
|
.49
|
|
$
|
.49
|
|
$
|
.04
|
|
$
|
1.36
|
|
||||
|
Diluted
|
$
|
.33
|
|
$
|
.48
|
|
$
|
.49
|
|
$
|
.04
|
|
$
|
1.34
|
|
||||
__________________________________
|
1.
|
Second quarter 2014 Earnings from discontinued operations include pretax goodwill impairment charges of
$108
associated with the Store Fixtures operation. See Note B and Note E.
|
|
2.
|
Third quarter 2014 Earnings from continuing operations includes pretax charges of
$32
associated with litigation accruals. Discontinued operations includes pretax charges of
$8
for litigation accruals. See Note T.
|
|
3.
|
Fourth quarter 2014 Earnings from continuing operations include pretax charges of
$22
for litigation accruals. Discontinued operations includes the following pretax items:
$27
litigation accruals and a
$9
loss on the sale of the majority of our Store Fixtures unit. See Note B and Note T.
|
|
4.
|
In the third quarter of 2013 we recorded a
$9
bargain purchase gain related to an acquisition. See Note R.
|
|
5.
|
In the fourth quarter of 2013 we incurred pretax charges of
$67
related to the Commercial Vehicle Products group (
$63
goodwill impairment charge and
$4
accelerated amortization of a customer-related intangible asset.) See Note C.
|
119
LEGGETT & PLATT, INCORPORATED
SCHEDULE II—VALUATION AND QUALIFYING ACCOUNTS AND RESERVES
(Amounts in millions)
|
Column A
|
Column B
|
Column C
|
Column D
|
|
Column E
|
||||||||||
|
Description
|
Balance
at
Beginning
of Period
|
Additions
Charged
to Cost
and
Expenses
|
Deductions
|
|
Balance
at End of
Period
|
||||||||||
|
Year ended December 31, 2014
|
|
|
|
|
|
||||||||||
|
Allowance for doubtful receivables
|
$
|
17.6
|
|
$
|
4.9
|
|
$
|
5.3
|
|
(1)
|
$
|
17.2
|
|
||
|
Excess and obsolete inventory reserve, LIFO basis
|
$
|
21.9
|
|
$
|
10.0
|
|
$
|
10.0
|
|
|
$
|
21.9
|
|
||
|
Tax valuation allowance
|
$
|
25.4
|
|
$
|
1.0
|
|
$
|
(.7
|
)
|
$
|
27.1
|
|
|||
|
Year ended December 31, 2013
|
|
|
|
|
|
||||||||||
|
Allowance for doubtful receivables
|
$
|
20.6
|
|
$
|
6.1
|
|
$
|
9.1
|
|
(1)
|
$
|
17.6
|
|
||
|
Excess and obsolete inventory reserve, LIFO basis
|
$
|
19.4
|
|
$
|
11.8
|
|
$
|
9.3
|
|
|
$
|
21.9
|
|
||
|
Tax valuation allowance
|
$
|
32.2
|
|
$
|
(3.4
|
)
|
$
|
3.4
|
|
|
$
|
25.4
|
|
||
|
Year ended December 31, 2012
|
|
|
|
|
|
||||||||||
|
Allowance for doubtful receivables
|
$
|
26.0
|
|
$
|
4.9
|
|
$
|
10.3
|
|
(1)
|
$
|
20.6
|
|
||
|
Excess and obsolete inventory reserve, LIFO basis
|
$
|
20.2
|
|
$
|
10.2
|
|
$
|
11.0
|
|
|
$
|
19.4
|
|
||
|
Tax valuation allowance
|
$
|
69.1
|
|
$
|
(36.3
|
)
|
$
|
.6
|
|
(2)
|
$
|
32.2
|
|
||
______________________________
|
(1)
|
Uncollectible accounts charged off, net of recoveries.
|
|
(2)
|
As discussed in Note N, 2012 includes a $36.9 tax benefit primarily related to the release of valuation allowances on certain Canadian deferred tax assets.
|
120
SIGNATURES
Pursuant to the requirements of Section 13 or 15(d) of the Securities Exchange Act of 1934, the registrant has duly caused this report to be signed on its behalf by the undersigned, thereunto duly authorized.
|
LEGGETT & PLATT, INCORPORATED
|
||
|
By:
|
/s/ D
AVID
S. H
AFFNER
|
|
|
|
David S. Haffner
|
|
|
|
Board Chair and Chief Executive Officer
|
|
|
|
||
Dated: February 26, 2015
Pursuant to the requirements of the Securities Exchange Act of 1934, this report has been signed below by the following persons on behalf of the registrant and in the capacities and on the dates indicated.
|
Signature
|
|
Title
|
|
Date
|
|
(a) Principal Executive Officer:
|
|
|
|
|
|
/
S
/ D
AVID
S. H
AFFNER
|
|
Board Chair and Chief Executive Officer
|
|
February 26, 2015
|
|
David S. Haffner
|
||||
|
(b) Principal Financial Officer:
|
|
|
|
|
|
/
S
/ M
ATTHEW
C. F
LANIGAN
|
|
Executive Vice President, Chief Financial Officer and Director
|
|
February 26, 2015
|
|
Matthew C. Flanigan
|
||||
|
(c) Principal Accounting Officer:
|
|
|
|
|
|
/
S
/ W
ILLIAM
S. W
EIL
|
|
Senior Vice President, Controller and Chief Accounting Officer
|
|
February 26, 2015
|
|
William S. Weil
|
||||
|
(d) Directors:
|
|
|
|
|
|
R
OBERT
E. B
RUNNER*
|
|
Director
|
|
|
|
Robert E. Brunner
|
||||
|
R
ALPH
W. C
LARK
*
|
|
Director
|
|
|
|
Ralph W. Clark
|
||||
|
Robert G. Culp, III*
|
Director
|
|||
|
Robert G. Culp, III
|
||||
121
|
Signature
|
|
Title
|
|
Date
|
|
R. T
ED
E
NLOE
, III*
|
|
Director
|
|
|
|
R. Ted Enloe, III
|
||||
|
Manuel A. Fernandez*
|
|
Director
|
|
|
|
Manuel A. Fernandez
|
||||
|
R
ICHARD
T. F
ISHER
*
|
|
Vice Chair and Lead Director
|
|
|
|
Richard T. Fisher
|
||||
|
K
ARL
G. G
LASSMAN
*
|
|
Director
|
|
|
|
Karl G. Glassman
|
||||
|
Joseph W. McClanathan*
|
Director
|
|||
|
Joseph W. McClanathan
|
|
|||
|
J
UDY
C. O
DOM
*
|
|
Director
|
||
|
Judy C. Odom
|
||||
|
P
HOEBE
A. W
OOD
*
|
|
Director
|
||
|
Phoebe A. Wood
|
||||
|
*By:
|
/s/
J
OHN
G. M
OORE
|
|
February 26, 2015
|
|
|
John G. Moore
|
|
|
|
|
Attorney-in-Fact
Under Power-of-Attorney
dated February 25, 2015
|
|
|
122
EXHIBIT INDEX
|
Exhibit No.
|
|
Document Description
|
|
2.1
|
|
Purchase Agreement for Western Pneumatic Tube Holding, LLC by and among Leggett & Platt, Incorporated; Tinicum Capital Partners II, L.P.; Tinicum Capital Partners II Parallel Fund, L.P.; Tinicum Capital Partners II Executive Fund, L.L.C.; and various other entities and individuals named on the signature pages of the Purchase Agreement, dated December 20, 2011, filed December 21, 2011 as Exhibit 2.1 to the Company’s Form 8-K, is incorporated by reference. (SEC File No. 001-07845) Schedules to the Purchase Agreement have been omitted pursuant to Item 601(b)(2) of Regulation S-K. Exhibit 2.1 contains a list briefly identifying the contents of all omitted schedules. The Company agrees to furnish supplementally a copy of any omitted schedule to the SEC upon request.
|
|
3.1
|
|
Restated Articles of Incorporation of the Company as of May 13, 1987, with Amendments dated May 12, 1993 and May 20, 1999; filed March 11, 2004 as Exhibit 3.1 to the Company’s Form 10-K for the year ended December 31, 2003, are incorporated by reference. (SEC File No. 001-07845)
|
|
3.2
|
|
Bylaws of the Company, as amended through February 26, 2014, filed March 3, 2014 as Exhibit 3.2.1 to the Company’s Form 8-K, are incorporated by reference. (SEC File No. 001-07845)
|
|
4.1
|
|
Article III of the Company’s Restated Articles of Incorporation, as amended, filed as Exhibit 3.1 hereto, is incorporated by reference.
|
|
4.2
|
|
Indenture, dated as of November 24, 1999 between the Company and U.S. Bank National Association (successor in interest to The Bank of New York Mellon Trust Company, NA which was successor in interest to JPMorgan Chase Bank (formerly known as The Chase Manhattan Bank)), as Trustee, and Form of Note included therein under Sections 202 and 203 filed November 5, 1999 as Exhibit 4.1 to Registration Statement No. 333-90443 on Form S-3, is incorporated by reference. (SEC File No. 001-07845)
|
|
4.2.1
|
|
Tri-Party Agreement under the November 24, 1999 Indenture, between the Company, The Bank of New York Mellon Trust Company, NA (successor in interest to The Chase Manhattan Bank) (as Prior Trustee) and U.S. Bank National Association (as Successor Trustee), dated February 20, 2009, filed February 25, 2009 as Exhibit 4.2.1 to the Company’s Form 10-K for the year ended December 31, 2008, is incorporated by reference. (SEC File No. 001-07845)
|
|
4.3
|
|
Senior Indenture dated May 6, 2005 between the Company and U.S. Bank National Association (successor in interest to The Bank of New York Mellon Trust Company, NA which was successor in interest to JPMorgan Chase Bank, N.A.), as Trustee, filed May 10, 2005 as Exhibit 4.1 to the Company’s Form 8-K, is incorporated by reference. (SEC File No. 001-07845)
|
|
4.3.1
|
|
Tri-Party Agreement under the May 6, 2005 Senior Indenture, between the Company, The Bank of New York Mellon Trust Company, NA (successor in interest to JPMorgan Chase Bank, N.A.) (as Prior Trustee) and U.S. Bank National Association (as Successor Trustee), dated February 20, 2009, filed February 25, 2009 as Exhibit 4.3.1 to the Company’s Form 10-K for the year ended December 31, 2008, is incorporated by reference. (SEC File No. 001-07845)
|
|
4.4
|
Form of $300,000,000 3.40% Senior Notes due 2022, issued pursuant to the Senior Indenture dated May 6, 2005, and filed August 15, 2012 as Exhibit 4.3 to the Company's Form 8-K, is incorporated by reference. (SEC File No. 001-07845)
|
|
|
4.5
|
Form of $200,000,000 4.7% Senior Notes retired in 2013, issued pursuant to the Indenture dated November 24, 1999, and filed March 20, 2003 as Exhibit 4.1 to the Company's Form 8-K, is incorporated by reference. (SEC File No. 001-07845)
|
|
123
|
Exhibit No.
|
|
Document Description
|
|
4.6
|
|
Form of $150,000,000 4.4% Notes due 2018 issued pursuant to the Indenture dated November 24, 1999, and filed June 20, 2003 as Exhibit 4.1 to the Company’s Form 8-K, is incorporated by reference. (SEC File No. 001-07845)
|
|
4.7
|
|
Form of $180,000,000 4.65% Notes retired in 2014 issued pursuant to the Indenture dated November 24, 1999, and filed November 9, 2004 as Exhibit 4.1 to the Company’s Form 8-K, is incorporated by reference. (SEC File No. 001-07845)
|
|
4.8
|
|
Form of $200,000,000 5.00% Notes due 2015 issued pursuant to the Senior Indenture dated May 6, 2005, and filed August 11, 2005 as Exhibit 4.1 to the Company’s Form 8-K, is incorporated by reference. (SEC File No. 001-07845)
|
|
4.9
|
Form of $300,000,000 3.8% Notes due 2024 issued pursuant to the Senior Indenture dated May 6, 2005, and filed November 10, 2014 as Exhibit 4.3 to the Company's Form 8-K, is incorporated by reference. (SEC File No. 001-07845)
|
|
|
10.1*
|
|
Employment Agreement between the Company and David S. Haffner, dated March 1, 2013, filed March 6, 2013 as Exhibit 10.2 to the Company’s Form 8-K, is incorporated by reference. (SEC File No. 001-07845)
|
|
10.2*
|
|
Employment Agreement between the Company and Karl G. Glassman, dated March 1, 2013, filed March 6, 2013 as Exhibit 10.3 to the Company’s Form 8-K, is incorporated by reference. (SEC File No. 001-07845)
|
|
10.3*
|
|
Employment Agreement between the Company and Matthew C. Flanigan, dated March 1, 2013, filed March 6, 2013 as Exhibit 10.4 to the Company’s Form 8-K, is incorporated by reference. (SEC File No. 001-07845)
|
|
10.4*
|
|
Amended and Restated Severance Benefit Agreement between the Company and David S. Haffner, dated March 1, 2013, filed March 6, 2013 as Exhibit 10.5 to the Company’s Form 8-K, is incorporated by reference. (SEC File No. 001-07845)
|
|
10.5*
|
|
Amended and Restated Severance Benefit Agreement between the Company and Karl G. Glassman, dated March 1, 2013, filed March 6, 2013 as Exhibit 10.6 to the Company’s Form 8-K, is incorporated by reference. (SEC File No. 001-07845)
|
|
10.6*
|
Severance Benefit Agreement between the Company and Matthew C. Flanigan, dated March 1, 2013, filed March 6, 2013 as Exhibit 10.7 to the Company's Form 8-K, is incorporated by reference. (SEC File No. 001-07845)
|
|
|
10.7*
|
|
Form of Indemnification Agreement approved by the shareholders of the Company and entered into between the Company and its directors and executive officers, filed March 28, 2002, as Exhibit 10.11 to the Company’s Form 10-K for the year ended December 31, 2001, is incorporated by reference. (SEC File No. 001-07845)
|
|
10.8*
|
|
Summary Sheet for Executive Cash Compensation, filed March 31. 2014, as Exhibit 10.2 to the Company’s Form 8-K, is incorporated by reference. (SEC File No. 001-07845)
|
|
10.9*
|
|
Summary Sheet of Director Compensation, filed May 12, 2014 as Exhibit 10.2 to the Company’s Form 8-K, is incorporated by reference. (SEC File No. 001-07845)
|
|
10.10*
|
|
The Company’s Flexible Stock Plan, amended and restated, effective as of May 10, 2012, filed March 30, 2012 as Appendix A to the Company’s Proxy Statement, is incorporated by reference. (SEC File No. 001-07845)
|
|
10.10.1*
|
|
Form of Non-Qualified Stock Option Award Agreement pursuant to the Company’s Flexible Stock Plan, filed November 4, 2014 as Exhibit 10.1 to the Company’s Form 8-K, is incorporated by reference. (SEC File No. 001-07845)
|
124
|
Exhibit No.
|
|
Document Description
|
|
10.10.2*
|
|
2011 Form of Performance Stock Unit Award Agreement pursuant to the Company’s Flexible Stock Plan, (applicable to 2011 grants through 2014 grants), filed January 6, 2011 as Exhibit 10.1 to the Company’s Form 8-K, is incorporated by reference. (SEC File No. 001-07845)
|
|
10.10.3*
|
2015 Form of Performance Stock Unit Award Agreement pursuant to the Company’s Flexible Stock Plan, (applicable to 2015 grants and all grants thereafter), filed November 4, 2014 as Exhibit 10.2 to the Company’s Form 8-K, is incorporated by reference. (SEC File No. 001-07845)
|
|
|
10.10.4*
|
|
Form of Director Restricted Stock Agreement pursuant to the Company’s Flexible Stock Plan, filed August 7, 2008 as Exhibit 10.1 to the Company’s Form 10-Q for the quarter ended June 30, 2008, is incorporated by reference. (SEC File No. 001-07845)
|
|
10.10.5*
|
|
Form of Director Restricted Stock Unit Award Agreement pursuant to the Company’s Flexible Stock Plan, filed February 24, 2012 as Exhibit 10.9.7 to the Company's Form 10-K for the year ended December 31, 2011, is incorporated by reference. (SEC File No. 001-07845)
|
|
10.10.6*
|
|
Form of Restricted Stock Unit Award pursuant to the Company’s Flexible Stock Plan, filed March 6, 2013 as Exhibit 10.1 to the Company’s Form 8-K, is incorporated by reference. (SEC File No. 001-07845)
|
|
10.10.7*
|
2014 Form of Profitable Growth Incentive Award Agreement and Terms and Conditions (applicable to 2014 awards), filed March 3, 2014 as Exhibit 10.1 to the Company's Form 8-K, is incorporated by reference. (SEC File No. 001-07845)
|
|
|
10.10.7.1*
|
Award Formula for 2014-2015 Profitable Growth Incentive Program, filed March 3, 2014 as Exhibit 10.2 to the Company's Form 8-K, is incorporated by reference. (SEC File No. 001-07845)
|
|
|
10.10.8*
|
2013 Form of Profitable Growth Incentive Award Agreement and Terms and Conditions (applicable to 2013 awards), filed March 6, 2013 as Exhibit 10.8 to the Company's Form 8-K, is incorporated by reference. (SEC File No. 001-07845)
|
|
|
10.10.8.1*
|
Award Formula for 2013-2014 Profitable Growth Incentive Program, filed March 6, 2013 as Exhibit 10.9 to the Company's Form 8-K, is incorporated by reference. (SEC File No. 001-07845)
|
|
|
10.11*
|
The Company’s 2014 Key Officers Incentive Plan, effective January 1, 2014, filed March 25, 2014 as Appendix A to the Company’s Proxy Statement, is incorporated by reference. (SEC File No. 001-07845)
|
|
|
10.11.1*
|
|
2014 Award Formula under the Company’s 2014 Key Officers Incentive Plan, filed March 31, 2014 as Exhibit 10.1 to the Company's Form 8-K, is incorporated by reference. (SEC File No. 001-07845)
|
|
10.12*
|
The Company’s 2009 Key Officers Incentive Plan, effective January 1, 2009, filed March 26, 2009 as Appendix B to the Company’s Proxy Statement, is incorporated by reference. (SEC File No. 001-07845)
|
|
|
10.12.1*
|
|
2013 Award Formula under the Company’s 2009 Key Officers Incentive Plan, filed April 1, 2013 as Exhibit 10.1 to the Company's Form 8-K, is incorporated by reference. (SEC File No. 001-07845)
|
|
10.13*
|
|
The Company’s Director Stock Option Plan, as amended and restated November 13, 2002, filed March 18, 2003 as Exhibit 10.13 to the Company’s Form 10-K for the year ended December 31, 2002, is incorporated by reference. (SEC File No. 001-07845)
|
125
|
Exhibit No.
|
|
Document Description
|
|
10.14*
|
|
The Company’s Deferred Compensation Program, Effective as of December 1, 2011, filed February 24, 2012 as Exhibit 10.13 to the Company's Form 10-K for the year ended December 31, 2011, is incorporated by reference. (SEC File No. 001-07845)
|
|
10.15*
|
|
The Company’s Executive Deferred Stock Program, filed March 31, 1999 as Exhibit 10.16 to the Company’s Form 10-K for the year ended December 31, 1998, is incorporated by reference. (SEC File No. 001-07845)
|
|
10.16*
|
|
The Company’s 2005 Executive Stock Unit Program, as amended and restated, effective December 31, 2012, filed February 28, 2013 as Exhibit 10.16 to the Company's Form 10-K for the year ended December 31, 2012, is incorporated by reference. (SEC File No. 001-07845)
|
|
10.17*
|
|
Description of long-term disability arrangements between the Company and certain executives filed February 24, 2011 as Exhibit 10.17 to the Company’s Form 10-K for the year ended December 31, 2010, is incorporated by reference. (SEC File No. 001-07845)
|
|
10.18*
|
|
The Company’s Retirement K Excess Program, amended and restated on November 26, 2007, effective as of January 1, 2007, filed February 26, 2008 as Exhibit 10.19 to the Company’s Form 10-K for the year ended December 31, 2007, is incorporated by reference. (SEC File No. 001-07845)
|
|
10.19
|
|
Credit Agreement, dated August 19, 2011 among the Company, JPMorgan Chase Bank, N.A. as administrative agent, and the participating banking institutions named therein, filed August 19, 2011 as Exhibit 10.1 to the Company’s Form 8-K, is incorporated by reference. (SEC File No. 001-07845)
|
|
10.19.1
|
First Amendment to Credit Agreement, dated August 22, 2013, among the Company, JPMorgan Chase Bank, N.A. as administrative agent, and the participating banking institutions named therein, filed August 26, 2013 as Exhibit 10.2 to the Company's Form 8-K, is incorporated by reference. (SEC File No. 001-07845)
|
|
|
10.19.2
|
Second Amendment to Credit Agreement, dated August 15, 2014, among the Company, JPMorgan Chase Bank, N.A. as administrative agent, and the participating banking institutions named therein, filed August 19, 2014 as Exhibit 10.3 to the Company's Form 8-K, is incorporated by reference. (SEC File No. 001-07845)
|
|
|
10.20
|
Commercial Paper Issuing and Paying Agent Agreement between U.S. Bank National Association and the Company, dated December 2, 2014, including Master Note, filed December 5, 2014 as Exhibit 10.1 to the Company's Form 8-K, is incorporated by reference. (SEC File No. 001-07845)
|
|
|
10.20.1
|
Form of Amended and Restated Commercial Paper Dealer Agreement filed December 5, 2014 as Exhibit 10.2 to the Company's Form 8-K, is incorporated by reference. (SEC File No. 001-08745)
|
|
|
12**
|
|
Computation of Ratio of Earnings to Fixed Charges.
|
|
21**
|
|
Schedule of Subsidiaries of the Company.
|
|
23**
|
|
Consent of Independent Registered Public Accounting Firm.
|
|
24**
|
|
Power of Attorney executed by members of the Company’s Board of Directors regarding this Form 10-K.
|
|
31.1**
|
|
Certification of David S. Haffner, pursuant to Rule 13a-14(a), as adopted pursuant to Section 302 of the Sarbanes-Oxley Act of 2002, dated February 26, 2015.
|
|
31.2**
|
|
Certification of Matthew C. Flanigan, pursuant to Rule 13a-14(a), as adopted pursuant to Section 302 of the Sarbanes-Oxley Act of 2002, dated February 26, 2015.
|
126
|
Exhibit No.
|
|
Document Description
|
|
32.1**
|
|
Certification of David S. Haffner, pursuant to 18 U.S.C. Section 1350, as adopted pursuant to Section 906 of the Sarbanes-Oxley Act of 2002, dated February 26, 2015.
|
|
32.2**
|
|
Certification of Matthew C. Flanigan, pursuant to 18 U.S.C. Section 1350, as adopted pursuant to Section 906 of the Sarbanes-Oxley Act of 2002, dated February 26, 2015.
|
|
101.INS***
|
|
XBRL Instance Document.
|
|
101.SCH***
|
|
XBRL Taxonomy Extension Schema.
|
|
101.CAL***
|
|
XBRL Taxonomy Extension Calculation Linkbase.
|
|
101.DEF***
|
|
XBRL Taxonomy Extension Definition Linkbase.
|
|
101.LAB***
|
|
XBRL Taxonomy Extension Label Linkbase.
|
|
101.PRE***
|
|
XBRL Taxonomy Extension Presentation Linkbase.
|
______________________________
|
*
|
Denotes management contract or compensatory plan or arrangement.
|
|
**
|
Denotes filed or furnished herewith.
|
|
***
|
Exhibit 101 to this report includes the following formatted in XBRL (eXtensible Business Reporting Language): (i) Consolidated Statements of Operations for each year in the three year period ended December 31, 2014; (ii) Consolidated Statements of Comprehensive Income (Loss) for each year in the three year period ended December 31, 2014; (iii) Consolidated Balance Sheets at December 31, 2014 and December 31, 2013; (iv) Consolidated Statements of Cash Flows for each year in the three year period ended December 31, 2014; (v) Consolidated Statements of Changes in Equity for each year in the three year period ended December 31, 2014; and (vi) Notes to Consolidated Financial Statements.
|
127
TABLE OF CONTENTS
Part IPart IIItem 5. Market For Registrant S Common Equity, Related Stockholder Matters and Issuer Purchases Of Equity SecuritiesItem 6. Selected Financial DataItem 7. Management S Discussion and Analysis Of Financial Condition and Results Of OperationsItem 7A. Quantitative and Qualitative Disclosures About Market RiskItem 8. Financial Statements and Supplementary DataItem 9. Changes in and Disagreements with Accountants on Accounting and Financial DisclosureItem 9A. Controls and ProceduresItem 9B. Other InformationPart IIIItem 10. Directors, Executive Officers and Corporate GovernanceItem 11. Executive CompensationItem 12. Security Ownership Of Certain Beneficial Owners and Management and Related Stockholder MattersItem 13. Certain Relationships and Related Transactions, and Director IndependenceItem 14. Principal Accounting Fees and ServicesPart IVItem 15. Exhibits, Financial Statement Schedules