LEGGETT & PLATT INC
10-Ks and 10-Qs
|
|
|
|
|
|
|
|
|
|
|
|
|
|
|
|
|
|
|
|
|
|
|
|
|
|
|
|
|
|
|
|
|
|
|
|
|
|
|
|
|
|
|
|
|
|
|
|
|
|
|
|
|
UNITED STATES
SECURITIES AND EXCHANGE COMMISSION
Washington, D.C. 20549
Form 10-Q
(Mark One)
|
ý
|
QUARTERLY REPORT PURSUANT TO SECTION 13 OR 15(d) OF THE SECURITIES EXCHANGE ACT OF 1934
|
For the quarterly period ended
June 30, 2015
OR
|
¨
|
TRANSITION REPORT PURSUANT TO SECTION 13 OR 15(d) OF THE SECURITIES EXCHANGE ACT OF 1934
|
for the transition period from to
Commission File Number 001-07845
LEGGETT & PLATT, INCORPORATED
(Exact name of registrant as specified in its charter)
|
Missouri
|
|
44-0324630
|
|
(State or other jurisdiction of
incorporation or organization)
|
|
(I.R.S. Employer
Identification No.)
|
|
No. 1 Leggett Road
Carthage, Missouri
|
64836
|
|
|
(Address of principal executive offices)
|
(Zip Code)
|
|
Registrant’s telephone number, including area code (417) 358-8131
Indicate by check mark whether the registrant (1) has filed all reports required to be filed by Section 13 or 15(d) of the Securities Exchange Act of 1934 during the preceding 12 months (or for such shorter period that the registrant was required to file such reports), and (2) has been subject to such filing requirements for the past 90 days. Yes
ý
No
¨
Indicate by check mark whether the registrant has submitted electronically and posted on its corporate Web site, if any, every Interactive Data File required to be submitted and posted pursuant to Rule 405 of Regulation S-T (§ 232.405 of this chapter) during the preceding 12 months (or for such shorter period that the registrant was required to submit and post such files). Yes
ý
No
¨
Indicate by check mark whether the registrant is a large accelerated filer, an accelerated filer, a non-accelerated filer, or a smaller reporting company. See the definitions of “large accelerated filer,” “accelerated filer” and “smaller reporting company” in Rule 12b-2 of the Exchange Act.
|
Large accelerated filer
|
|
ý
|
|
Accelerated filer
|
|
¨
|
|
Non-accelerated filer
|
|
¨
(Do not check if a smaller reporting company)
|
|
Smaller reporting company
|
|
¨
|
Indicate by check mark whether the registrant is a shell company (as defined in Rule 12b-2 of the Exchange Act). Yes
¨
No
ý
Common stock outstanding as of July 24, 2015:
136,829,118
LEGGETT & PLATT, INCORPORATED
|
(Amounts in millions)
|
June 30,
2015 |
December 31,
2014 |
|||||
|
CURRENT ASSETS
|
|||||||
|
Cash and cash equivalents
|
$
|
275.1
|
|
$
|
332.8
|
|
|
|
Trade receivables, net
|
486.6
|
|
470.4
|
|
|||
|
Other receivables, net
|
63.0
|
|
52.9
|
|
|||
|
Total receivables, net
|
549.6
|
|
523.3
|
|
|||
|
Inventories
|
|||||||
|
Finished goods
|
264.8
|
|
251.9
|
|
|||
|
Work in process
|
44.1
|
|
55.5
|
|
|||
|
Raw materials and supplies
|
259.1
|
|
247.0
|
|
|||
|
LIFO reserve
|
(57.2
|
)
|
(73.0
|
)
|
|||
|
Total inventories, net
|
510.8
|
|
481.4
|
|
|||
|
Other current assets
|
100.7
|
|
91.8
|
|
|||
|
Total current assets
|
1,436.2
|
|
1,429.3
|
|
|||
|
PROPERTY, PLANT AND EQUIPMENT—AT COST
|
|||||||
|
Machinery and equipment
|
1,097.9
|
|
1,151.4
|
|
|||
|
Buildings and other
|
552.7
|
|
551.1
|
|
|||
|
Land
|
40.1
|
|
40.1
|
|
|||
|
Total property, plant and equipment
|
1,690.7
|
|
1,742.6
|
|
|||
|
Less accumulated depreciation
|
1,152.1
|
|
1,193.8
|
|
|||
|
Net property, plant and equipment
|
538.6
|
|
548.8
|
|
|||
|
OTHER ASSETS
|
|||||||
|
Goodwill
|
822.7
|
|
829.4
|
|
|||
|
Other intangibles, less accumulated amortization of $135.8 and $129.7 as of June 30, 2015 and December 31, 2014, respectively
|
207.0
|
|
204.7
|
|
|||
|
Sundry
|
139.2
|
|
128.4
|
|
|||
|
Total other assets
|
1,168.9
|
|
1,162.5
|
|
|||
|
TOTAL ASSETS
|
$
|
3,143.7
|
|
$
|
3,140.6
|
|
|
|
CURRENT LIABILITIES
|
|||||||
|
Current maturities of long-term debt
|
$
|
201.7
|
|
$
|
201.7
|
|
|
|
Accounts payable
|
358.6
|
|
369.8
|
|
|||
|
Accrued expenses
|
316.1
|
|
337.6
|
|
|||
|
Other current liabilities
|
87.6
|
|
83.1
|
|
|||
|
Total current liabilities
|
964.0
|
|
992.2
|
|
|||
|
LONG-TERM LIABILITIES
|
|||||||
|
Long-term debt
|
831.7
|
|
766.7
|
|
|||
|
Other long-term liabilities
|
187.3
|
|
185.0
|
|
|||
|
Deferred income taxes
|
50.7
|
|
41.8
|
|
|||
|
Total long-term liabilities
|
1,069.7
|
|
993.5
|
|
|||
|
COMMITMENTS AND CONTINGENCIES
|
|
|
|||||
|
EQUITY
|
|||||||
|
Common stock
|
2.0
|
|
2.0
|
|
|||
|
Additional contributed capital
|
513.8
|
|
502.4
|
|
|||
|
Retained earnings
|
2,123.0
|
|
2,061.3
|
|
|||
|
Accumulated other comprehensive loss
|
(36.3
|
)
|
(2.6
|
)
|
|||
|
Treasury stock
|
(1,502.9
|
)
|
(1,416.6
|
)
|
|||
|
Total Leggett & Platt, Inc. equity
|
1,099.6
|
|
1,146.5
|
|
|||
|
Noncontrolling interest
|
10.4
|
|
8.4
|
|
|||
|
Total equity
|
1,110.0
|
|
1,154.9
|
|
|||
|
TOTAL LIABILITIES AND EQUITY
|
$
|
3,143.7
|
|
$
|
3,140.6
|
|
|
See accompanying notes to consolidated condensed financial statements.
2
LEGGETT & PLATT, INCORPORATED
(Unaudited)
|
Six Months Ended
|
Three Months Ended
|
||||||||||||||
|
|
June 30,
|
June 30,
|
|||||||||||||
|
(Amounts in millions, except per share data)
|
2015
|
2014
|
2015
|
2014
|
|||||||||||
|
Net sales
|
$
|
1,963.5
|
|
$
|
1,831.6
|
|
$
|
997.3
|
|
$
|
956.1
|
|
|||
|
Cost of goods sold
|
1,515.0
|
|
1,454.1
|
|
766.6
|
|
755.4
|
|
|||||||
|
Gross profit
|
448.5
|
|
377.5
|
|
230.7
|
|
200.7
|
|
|||||||
|
Selling and administrative expenses
|
204.1
|
|
186.2
|
|
106.6
|
|
94.1
|
|
|||||||
|
Amortization of intangibles
|
10.4
|
|
9.6
|
|
5.2
|
|
4.8
|
|
|||||||
|
Goodwill impairment
|
4.1
|
|
—
|
|
—
|
|
—
|
|
|||||||
|
Other (income) expense, net
|
(1.0
|
)
|
(6.3
|
)
|
(.3
|
)
|
(.4
|
)
|
|||||||
|
Earnings (loss) from continuing operations before interest and income taxes
|
230.9
|
|
188.0
|
|
119.2
|
|
102.2
|
|
|||||||
|
Interest expense
|
22.2
|
|
20.8
|
|
11.2
|
|
10.4
|
|
|||||||
|
Interest income
|
2.3
|
|
2.8
|
|
1.0
|
|
1.4
|
|
|||||||
|
Earnings from continuing operations before income taxes
|
211.0
|
|
170.0
|
|
109.0
|
|
93.2
|
|
|||||||
|
Income taxes
|
61.0
|
|
44.4
|
|
32.3
|
|
23.6
|
|
|||||||
|
Earnings from continuing operations
|
150.0
|
|
125.6
|
|
76.7
|
|
69.6
|
|
|||||||
|
Earnings (loss) from discontinued operations, net of tax
|
1.3
|
|
(95.0
|
)
|
1.8
|
|
(92.7
|
)
|
|||||||
|
Net earnings (loss)
|
151.3
|
|
30.6
|
|
78.5
|
|
(23.1
|
)
|
|||||||
|
(Earnings) attributable to noncontrolling interest, net of tax
|
(1.9
|
)
|
(1.4
|
)
|
(.8
|
)
|
(.8
|
)
|
|||||||
|
Net earnings (loss) attributable to Leggett & Platt, Inc. common shareholders
|
$
|
149.4
|
|
$
|
29.2
|
|
$
|
77.7
|
|
$
|
(23.9
|
)
|
|||
|
Earnings (loss) per share from continuing operations attributable to Leggett & Platt, Inc. common shareholders
|
|||||||||||||||
|
Basic
|
$
|
1.04
|
|
$
|
.88
|
|
$
|
.54
|
|
$
|
.49
|
|
|||
|
Diluted
|
$
|
1.03
|
|
$
|
.86
|
|
$
|
.53
|
|
$
|
.48
|
|
|||
|
Earnings (loss) per share from discontinued operations attributable to Leggett & Platt, Inc. common shareholders
|
|||||||||||||||
|
Basic
|
$
|
.01
|
|
$
|
(.67
|
)
|
$
|
.01
|
|
$
|
(.66
|
)
|
|||
|
Diluted
|
$
|
.01
|
|
$
|
(.66
|
)
|
$
|
.01
|
|
$
|
(.65
|
)
|
|||
|
Net earnings (loss) per share attributable to Leggett & Platt, Inc. common shareholders
|
|||||||||||||||
|
Basic
|
$
|
1.05
|
|
$
|
.21
|
|
$
|
.55
|
|
$
|
(.17
|
)
|
|||
|
Diluted
|
$
|
1.04
|
|
$
|
.20
|
|
$
|
.54
|
|
$
|
(.17
|
)
|
|||
|
Cash dividends declared per share
|
$
|
.62
|
|
$
|
.60
|
|
$
|
.31
|
|
$
|
.30
|
|
|||
|
Average shares outstanding
|
|||||||||||||||
|
Basic
|
141.7
|
|
141.9
|
|
141.4
|
|
141.4
|
|
|||||||
|
Diluted
|
143.6
|
|
143.6
|
|
143.4
|
|
143.1
|
|
|||||||
See accompanying notes to consolidated condensed financial statements.
3
LEGGETT & PLATT, INCORPORATED
CONSOLIDATED CONDENSED STATEMENTS OF COMPREHENSIVE INCOME (LOSS)
(Unaudited)
|
Six Months Ended
|
Three Months Ended
|
||||||||||||||
|
June 30,
|
June 30,
|
||||||||||||||
|
(Amounts in millions)
|
2015
|
2014
|
2015
|
2014
|
|||||||||||
|
Net earnings
|
$
|
151.3
|
|
$
|
30.6
|
|
$
|
78.5
|
|
$
|
(23.1
|
)
|
|||
|
Other comprehensive (loss) income, net of tax:
|
|||||||||||||||
|
Foreign currency translation adjustments
|
(35.0
|
)
|
(4.3
|
)
|
2.8
|
|
10.8
|
|
|||||||
|
Cash flow hedges
|
(.4
|
)
|
1.8
|
|
1.3
|
|
1.9
|
|
|||||||
|
Defined benefit pension plans
|
1.8
|
|
.7
|
|
.5
|
|
.1
|
|
|||||||
|
Other comprehensive (loss) income
|
(33.6
|
)
|
(1.8
|
)
|
4.6
|
|
12.8
|
|
|||||||
|
Comprehensive income
|
117.7
|
|
28.8
|
|
83.1
|
|
(10.3
|
)
|
|||||||
|
Less: comprehensive (income) attributable to noncontrolling interest
|
(2.0
|
)
|
(1.2
|
)
|
(.9
|
)
|
(.8
|
)
|
|||||||
|
Comprehensive income attributable to Leggett & Platt, Inc.
|
$
|
115.7
|
|
$
|
27.6
|
|
$
|
82.2
|
|
$
|
(11.1
|
)
|
|||
See accompanying notes to consolidated condensed financial statements.
4
LEGGETT & PLATT, INCORPORATED
(Unaudited)
|
|
Six Months Ended June 30,
|
||||||
|
(Amounts in millions)
|
2015
|
2014
|
|||||
|
OPERATING ACTIVITIES
|
|||||||
|
Net earnings
|
$
|
151.3
|
|
$
|
30.6
|
|
|
|
Adjustments to reconcile net earnings to net cash provided by operating activities:
|
|||||||
|
Depreciation
|
41.7
|
|
44.7
|
|
|||
|
Amortization of intangibles and debt issuance costs
|
14.8
|
|
13.7
|
|
|||
|
Provision for losses on accounts and notes receivable
|
2.9
|
|
1.8
|
|
|||
|
Writedown of inventories
|
5.1
|
|
4.5
|
|
|||
|
Goodwill impairment
|
4.1
|
|
108.0
|
|
|||
|
Long-lived asset impairments
|
2.4
|
|
1.0
|
|
|||
|
Net gain from sales of assets and businesses
|
(5.3
|
)
|
(4.7
|
)
|
|||
|
Deferred income tax expense (benefit)
|
17.9
|
|
(6.1
|
)
|
|||
|
Stock-based compensation
|
23.4
|
|
20.2
|
|
|||
|
Excess tax benefits from stock-based compensation
|
(13.6
|
)
|
(2.0
|
)
|
|||
|
Other, net
|
(1.3
|
)
|
(2.0
|
)
|
|||
|
Increases/decreases in, excluding effects from acquisitions and divestitures:
|
|||||||
|
Accounts and other receivables
|
(40.9
|
)
|
(136.9
|
)
|
|||
|
Inventories
|
(43.0
|
)
|
(25.2
|
)
|
|||
|
Other current assets
|
(3.5
|
)
|
(4.5
|
)
|
|||
|
Accounts payable
|
(9.3
|
)
|
41.8
|
|
|||
|
Accrued expenses and other current liabilities
|
(19.8
|
)
|
(1.5
|
)
|
|||
|
NET CASH PROVIDED BY OPERATING ACTIVITIES
|
126.9
|
|
83.4
|
|
|||
|
INVESTING ACTIVITIES
|
|||||||
|
Additions to property, plant and equipment
|
(51.3
|
)
|
(38.4
|
)
|
|||
|
Purchases of companies, net of cash acquired
|
(11.1
|
)
|
(51.2
|
)
|
|||
|
Proceeds from sales of assets and businesses
|
15.5
|
|
9.8
|
|
|||
|
Other, net
|
(6.3
|
)
|
(14.6
|
)
|
|||
|
NET CASH USED FOR INVESTING ACTIVITIES
|
(53.2
|
)
|
(94.4
|
)
|
|||
|
FINANCING ACTIVITIES
|
|||||||
|
Payments on long-term debt
|
(3.6
|
)
|
(6.7
|
)
|
|||
|
Additions to long-term debt
|
.4
|
|
—
|
|
|||
|
Change in commercial paper and short-term debt
|
66.2
|
|
244.4
|
|
|||
|
Dividends paid
|
(85.5
|
)
|
(83.7
|
)
|
|||
|
Issuances of common stock
|
5.2
|
|
8.8
|
|
|||
|
Purchases of common stock
|
(119.8
|
)
|
(118.1
|
)
|
|||
|
Excess tax benefits from stock-based compensation
|
13.6
|
|
2.0
|
|
|||
|
Other, net
|
(2.0
|
)
|
(.4
|
)
|
|||
|
NET CASH (USED FOR) PROVIDED BY FINANCING ACTIVITIES
|
(125.5
|
)
|
46.3
|
|
|||
|
EFFECT OF EXCHANGE RATE CHANGES ON CASH
|
(5.9
|
)
|
(3.8
|
)
|
|||
|
(DECREASE)/INCREASE IN CASH AND CASH EQUIVALENTS
|
(57.7
|
)
|
31.5
|
|
|||
|
CASH AND CASH EQUIVALENTS—January 1,
|
332.8
|
|
272.7
|
|
|||
|
CASH AND CASH EQUIVALENTS—June 30,
|
$
|
275.1
|
|
$
|
304.2
|
|
|
See accompanying notes to consolidated condensed financial statements.
5
LEGGETT & PLATT, INCORPORATED
NOTES TO CONSOLIDATED CONDENSED FINANCIAL STATEMENTS
(Unaudited)
(Amounts in millions, except per share data)
1. INTERIM PRESENTATION
The interim financial statements of Leggett & Platt, Incorporated (“we”, “us” or “our”) included herein have not been audited by an independent registered public accounting firm. The statements include all adjustments, including normal recurring accruals, which management considers necessary for a fair presentation of our financial position and operating results for the periods presented. We have prepared the statements pursuant to the rules and regulations of the Securities and Exchange Commission. Accordingly, certain information and footnote disclosures normally included in financial statements prepared in conformity with generally accepted accounting principles have been condensed or omitted pursuant to such rules and regulations. The operating results for interim periods are not necessarily indicative of results to be expected for an entire year.
The December 31, 2014 financial position data included herein was derived from the audited consolidated financial statements included in Form 10-K, but does not include all disclosures required by accounting principles generally accepted in the United States of America ("GAAP"). For further information, refer to the financial statements and footnotes included in our annual report on Form 10-K for the year ended December 31, 2014.
Reclassifications
Certain reclassifications have been made to the prior year's information in the Consolidated Condensed Financial Statements and related notes to conform to the second quarter 2015 presentation as a result of changes in our management organizational structure and all related internal reporting (See Note 4 - Segment Information), and for a balance sheet reclassification between Machinery and Equipment and Goodwill associated with a measurement period adjustment related to an acquisition.
2. NEW ACCOUNTING GUIDANCE
In April 2015, the Financial Accounting Standards Board (FASB) issued Accounting Standard Update 2015-03, Simplifying the Presentation of Debt Issuance Costs, which requires those costs to be presented in the balance sheet as a direct deduction from the associated debt liability. We will adopt this guidance on January 1, 2016, and we do not believe it will have a material impact on our future financial statements.
In May 2014, the FASB issued new authoritative literature, Revenue from Contracts with Customers, which supersedes much of the existing authoritative literature for revenue recognition. This guidance will be effective January 1, 2018. We are currently evaluating the newly issued guidance and the impact on our future financial statements.
3. INVENTORIES
About
50%
of our inventories are valued using the Last-In, First-Out (LIFO) cost method and the remainder using the First-In, First-Out (FIFO) cost method. We calculate our LIFO reserve (the excess of FIFO cost over LIFO cost) on an annual basis. During interim periods, we estimate the current year annual change in the LIFO reserve (i.e., the annual LIFO expense or benefit) and allocate that change ratably to the four quarters. Because accurately predicting inventory prices for the year is difficult, the change in the LIFO reserve for the full year could be significantly different from the amount currently estimated. In addition, a variation in expected ending inventory levels could also impact total change in the LIFO reserve for the year. Any change in the annual LIFO estimate will be reflected in future quarters.
The following table contains the LIFO benefit (expense) included in continuing operations for each of the periods presented.
|
|
Six Months Ended June 30,
|
Three Months Ended June 30,
|
|||||||||||||
|
|
2015
|
2014
|
2015
|
2014
|
|||||||||||
|
LIFO benefit (expense)
|
$
|
10.0
|
|
$
|
(.4
|
)
|
$
|
5.0
|
|
$
|
(.2
|
)
|
|||
6
LEGGETT & PLATT, INCORPORATED
NOTES TO CONSOLIDATED CONDENSED FINANCIAL STATEMENTS—(Continued)
(Unaudited)
4. SEGMENT INFORMATION
Our reportable segments are the same as our operating segments, which also correspond with our management organizational structure. Because of the recent divestiture of the majority of the Store Fixtures business unit (formerly in the Commercial Products segment) along with the retirement of the senior operating vice president of the Industrial Materials segment, our management organizational structure and all related internal reporting changed during the first quarter of 2015. As a result, the composition of our
four
reportable segments changed to reflect the new structure beginning in the first quarter of 2015. The segment changes include: (i) the Adjustable Bed and Fashion Bed (formerly named Consumer Products) business units moved from Residential Furnishings to Commercial Products; (ii) the Aerospace Products business unit moved from Industrial Materials to Specialized Products; and (iii) the Spuhl machinery division moved from Specialized Products to Residential Furnishings. These segment changes were retrospectively applied to all prior periods presented.
We have
four
operating segments that supply a wide range of products:
|
•
|
Residential Furnishings—components for bedding and furniture, fabric and carpet cushion
|
|
•
|
Commercial Products—components for office and institutional furnishings, adjustable beds and consumer products
|
|
•
|
Industrial Materials—drawn steel wire, fabricated wire products, steel rod and welded steel tubing
|
|
•
|
Specialized Products—automotive seating components, titanium, nickel alloy and stainless steel tubing for the aerospace industry, specialized machinery and equipment, and commercial vehicle interiors
|
Each reportable segment has a senior operating vice-president that reports to the chief operating officer. The chief operating officer in turn reports directly to the chief operating decision maker. The operating results and financial information reported through the segment structure are regularly reviewed and used by the chief operating decision maker to evaluate segment performance, allocate overall resources and determine management incentive compensation.
Separately, we also utilize a role-based approach (Grow, Core, Fix or Divest) as a supplemental management tool to ensure capital (which is a subset of the overall resources referred to above) is efficiently allocated within the reportable segment structure.
The accounting principles used in the preparation of the segment information are the same as those used for the consolidated financial statements, except that the segment assets and income reflect the FIFO basis of accounting for inventory. Certain inventories are accounted for using the LIFO basis in the consolidated financial statements. We evaluate performance based on earnings from operations before interest and income taxes (EBIT). Intersegment sales are made primarily at prices that approximate market-based selling prices. Centrally incurred costs are allocated to the segments based on estimates of services used by the segment. Certain of our general and administrative costs and miscellaneous corporate income and expenses are allocated to the segments based on sales. These allocated corporate costs include depreciation and other costs and income related to assets that are not allocated or otherwise included in the segment assets.
A summary of segment results from continuing operations are shown in the following tables.
|
External
Sales
|
Inter-
Segment
Sales
|
Total
Sales
|
EBIT
|
||||||||||||
|
Three Months Ended June 30, 2015
|
|||||||||||||||
|
Residential Furnishings
|
$
|
522.2
|
|
$
|
17.7
|
|
$
|
539.9
|
|
$
|
51.2
|
|
|||
|
Commercial Products
|
135.4
|
|
24.1
|
|
159.5
|
|
10.8
|
|
|||||||
|
Industrial Materials
|
106.3
|
|
66.0
|
|
172.3
|
|
14.8
|
|
|||||||
|
Specialized Products
|
233.4
|
|
9.8
|
|
243.2
|
|
37.7
|
|
|||||||
|
Intersegment eliminations and other
|
(.3
|
)
|
|||||||||||||
|
Change in LIFO reserve
|
5.0
|
|
|||||||||||||
|
$
|
997.3
|
|
$
|
117.6
|
|
$
|
1,114.9
|
|
$
|
119.2
|
|
||||
|
Three Months Ended June 30, 2014
|
|||||||||||||||
|
Residential Furnishings
|
$
|
474.9
|
|
$
|
17.0
|
|
$
|
491.9
|
|
$
|
49.6
|
|
|||
|
Commercial Products
|
112.7
|
|
11.6
|
|
124.3
|
|
7.6
|
|
|||||||
|
Industrial Materials
|
133.6
|
|
56.6
|
|
190.2
|
|
9.0
|
|
|||||||
|
Specialized Products
|
234.9
|
|
7.6
|
|
242.5
|
|
36.4
|
|
|||||||
|
Intersegment eliminations and other
|
(.2
|
)
|
|||||||||||||
|
Change in LIFO reserve
|
(.2
|
)
|
|||||||||||||
|
$
|
956.1
|
|
$
|
92.8
|
|
$
|
1,048.9
|
|
$
|
102.2
|
|
||||
7
LEGGETT & PLATT, INCORPORATED
NOTES TO CONSOLIDATED CONDENSED FINANCIAL STATEMENTS—(Continued)
(Unaudited)
|
External
Sales
|
Inter-
Segment
Sales
|
Total
Sales
|
EBIT
|
||||||||||||
|
Six Months Ended June 30, 2015
|
|||||||||||||||
|
Residential Furnishings
|
$
|
1,033.9
|
|
$
|
35.5
|
|
$
|
1,069.4
|
|
$
|
103.3
|
|
|||
|
Commercial Products
|
258.9
|
|
41.6
|
|
300.5
|
|
18.8
|
|
|||||||
|
Industrial Materials
|
218.3
|
|
146.4
|
|
364.7
|
|
22.8
|
|
|||||||
|
Specialized Products
|
452.4
|
|
19.3
|
|
471.7
|
|
77.0
|
|
|||||||
|
Intersegment eliminations and other
|
(1.0
|
)
|
|||||||||||||
|
Change in LIFO reserve
|
10.0
|
|
|||||||||||||
|
$
|
1,963.5
|
|
$
|
242.8
|
|
$
|
2,206.3
|
|
$
|
230.9
|
|
||||
|
Six Months Ended June 30, 2014
|
|||||||||||||||
|
Residential Furnishings
|
$
|
907.7
|
|
$
|
32.6
|
|
$
|
940.3
|
|
$
|
96.4
|
|
|||
|
Commercial Products
|
224.1
|
|
16.8
|
|
240.9
|
|
13.3
|
|
|||||||
|
Industrial Materials
|
256.8
|
|
114.1
|
|
370.9
|
|
16.7
|
|
|||||||
|
Specialized Products
|
443.0
|
|
15.4
|
|
458.4
|
|
64.0
|
|
|||||||
|
Intersegment eliminations and other
|
(2.0
|
)
|
|||||||||||||
|
Change in LIFO reserve
|
(.4
|
)
|
|||||||||||||
|
$1,831.6
|
$
|
178.9
|
|
$
|
2,010.5
|
|
$
|
188.0
|
|
||||||
Average assets for our segments are shown in the table below and reflect the basis for return measures used by management to evaluate segment performance. These segment totals include working capital (all current assets and current liabilities) plus net property, plant and equipment. Segment assets for all years are reflected at their estimated average for the periods presented.
|
June 30,
2015 |
December 31,
2014 |
||||||
|
Residential Furnishings
|
$
|
635.9
|
|
$
|
588.1
|
|
|
|
Commercial Products
|
102.0
|
|
96.2
|
|
|||
|
Industrial Materials
|
186.7
|
|
200.9
|
|
|||
|
Specialized Products
|
260.8
|
|
261.2
|
|
|||
|
Other (1)
|
36.8
|
|
90.4
|
|
|||
|
Average current liabilities included in segment numbers above
|
527.4
|
|
520.8
|
|
|||
|
Unallocated assets (2)
|
1,371.0
|
|
1,448.0
|
|
|||
|
Difference between average assets and period-end balance sheet
|
23.1
|
|
(65.0
|
)
|
|||
|
Total assets
|
$
|
3,143.7
|
|
$
|
3,140.6
|
|
|
|
(1)
|
Businesses sold or classified as discontinued operations.
|
|
(2)
|
Unallocated assets consist primarily of goodwill, other intangibles, cash and deferred tax assets.
|
8
LEGGETT & PLATT, INCORPORATED
NOTES TO CONSOLIDATED CONDENSED FINANCIAL STATEMENTS—(Continued)
(Unaudited)
5. DISCONTINUED OPERATIONS AND ASSETS HELD FOR SALE
During 2014 we engaged an investment banker and began exploring strategic alternatives regarding the Store Fixtures reporting unit, including the possibility of divestiture of this business. Activity related to Store Fixtures is:
|
•
|
During the third quarter of 2014, all of the criteria to classify this unit as held for sale and discontinued operations were met. Store Fixtures was previously part of the Commercial Products segment.
|
|
•
|
During the fourth quarter of 2014, we sold the majority of the Store Fixtures reporting unit for total consideration of
$59.2
and recorded an after-tax loss of
$4.7
.
|
|
•
|
During the second quarter 2015 we sold our metal store fixtures operation in China, and recorded an after-tax gain of
$2.9
.
|
|
•
|
We have
one
remaining small Store Fixtures business, and we are actively pursuing the sale of this business.
|
The table below includes activity related to these operations:
|
|
Six Months Ended June 30,
|
Three Months Ended June 30,
|
|||||||||||||
|
|
2015
|
2014
|
2015
|
2014
|
|||||||||||
|
External sales:
|
|
|
|
|
|||||||||||
|
Commercial Products - Store Fixtures
|
$
|
12.3
|
|
$
|
89.1
|
|
$
|
6.1
|
|
$
|
45.5
|
|
|||
|
Earnings (loss):
|
|||||||||||||||
|
Commercial Products - Store Fixtures (1)
|
3.3
|
|
(112.4
|
)
|
2.9
|
|
(109.1
|
)
|
|||||||
|
Subsequent activity related to previous divestitures
|
(1.5
|
)
|
—
|
|
(.7
|
)
|
—
|
|
|||||||
|
Earnings (loss) before interest and income taxes
|
1.8
|
|
(112.4
|
)
|
2.2
|
|
(109.1
|
)
|
|||||||
|
Income tax (expense) benefit
|
(.5
|
)
|
17.4
|
|
(.4
|
)
|
16.4
|
|
|||||||
|
Earnings (loss) from discontinued operations, net of tax
|
$
|
1.3
|
|
$
|
(95.0
|
)
|
$
|
1.8
|
|
$
|
(92.7
|
)
|
|||
(1) This includes goodwill impairment charges of
$108.0
as discussed in Note 6.
9
LEGGETT & PLATT, INCORPORATED
NOTES TO CONSOLIDATED CONDENSED FINANCIAL STATEMENTS—(Continued)
(Unaudited)
The major classes of assets and liabilities held for sale included in the Consolidated Condensed Balance Sheets were as follows:
|
|
June 30, 2015
|
December 31, 2014
|
|||||
|
Current assets associated with discontinued operations:
|
|||||||
|
Trade receivables, net
|
$
|
5.7
|
|
$
|
7.0
|
|
|
|
Other receivables, net
|
—
|
|
.3
|
|
|||
|
Inventories, net
|
1.7
|
|
3.0
|
|
|||
|
Other current assets
|
.1
|
|
.1
|
|
|||
|
Total current assets held for sale associated with discontinued operations
|
7.5
|
|
10.4
|
|
|||
|
Current assets held for sale not associated with discontinued operations (1)
|
20.8
|
|
—
|
|
|||
|
Total current assets held for sale (included in "Other current assets")
|
28.3
|
|
10.4
|
|
|||
|
Non-current assets associated with discontinued operations:
|
|||||||
|
Property, plant and equipment, net
|
.3
|
|
5.2
|
|
|||
|
Other intangibles, net
|
—
|
|
.6
|
|
|||
|
Sundry
|
—
|
|
1.4
|
|
|||
|
Total non-current assets held for sale associated with discontinued operations
|
.3
|
|
7.2
|
|
|||
|
Non-current assets held for sale not associated with discontinued operations (1) (2)
|
28.2
|
|
15.2
|
|
|||
|
Total non-current assets held for sale (included in "Sundry")
|
28.5
|
|
22.4
|
|
|||
|
Total assets held for sale
|
56.8
|
|
32.8
|
|
|||
|
Current liabilities associated with discontinued operations:
|
|||||||
|
Accounts payable
|
1.8
|
|
3.7
|
|
|||
|
Accrued expenses
|
.7
|
|
1.5
|
|
|||
|
Other current liabilities
|
.4
|
|
.3
|
|
|||
|
Total current liabilities held for sale associated with discontinued operations
|
2.9
|
|
5.5
|
|
|||
|
Total current liabilities held for sale not associated with discontinued operations (1)
|
8.5
|
|
—
|
|
|||
|
Total current liabilities held for sale (included in "Other current liabilities")
|
11.4
|
|
5.5
|
|
|||
|
Long term liabilities associated with discontinued operations:
|
|||||||
|
Deferred income tax (included in "Other long-term liabilities")
|
—
|
|
.1
|
|
|||
|
Total liabilities held for sale
|
11.4
|
|
5.6
|
|
|||
|
Net assets held for sale
|
$
|
45.4
|
|
$
|
27.2
|
|
|
(1) The Steel Tubing business reached held for sale status in the first quarter of 2015, but did not qualify for discontinued operations treatment.
(2) This table includes
$14.4
and
$15.2
of property, plant and equipment held for sale at June 30, 2015, and December 31, 2014, respectively, primarily associated with the closings of various operations and prior year restructurings.
Net assets held for sale by segment were as follows:
|
|
June 30, 2015
|
December 31, 2014
|
|||||||||||||||||||||
|
Assets
|
Liabilities
|
Net Assets
|
Assets
|
Liabilities
|
Net Assets
|
||||||||||||||||||
|
Residential Furnishings
|
$
|
2.5
|
|
$
|
—
|
|
$
|
2.5
|
|
$
|
4.1
|
|
$
|
—
|
|
$
|
4.1
|
|
|||||
|
Commercial Products
|
11.7
|
|
2.9
|
|
8.8
|
|
20.1
|
|
5.6
|
|
14.5
|
|
|||||||||||
|
Industrial Materials
|
37.4
|
|
8.5
|
|
28.9
|
|
3.4
|
|
—
|
|
3.4
|
|
|||||||||||
|
Specialized Products
|
5.2
|
|
—
|
|
5.2
|
|
5.2
|
|
—
|
|
5.2
|
|
|||||||||||
|
$
|
56.8
|
|
$
|
11.4
|
|
$
|
45.4
|
|
$
|
32.8
|
|
$
|
5.6
|
|
$
|
27.2
|
|
||||||
10
LEGGETT & PLATT, INCORPORATED
NOTES TO CONSOLIDATED CONDENSED FINANCIAL STATEMENTS—(Continued)
(Unaudited)
6. IMPAIRMENT CHARGES
Pre-tax impact of impairment charges is summarized in the following table.
Other long-lived asset impairments are reported in "Other (income) expense, net." Charges associated with discontinued operations are reported on the Statements of Operations in “Earnings (loss) from discontinued operations, net of tax.”
|
Six Months Ended June 30,
|
Three Months Ended June 30,
|
||||||||||||||||||||||||||
|
2015
|
2014
|
2015
|
2014
|
||||||||||||||||||||||||
|
|
Goodwill
|
Other Long-Lived Assets
|
Goodwill
|
Other Long-Lived Assets
|
Goodwill
|
Other Long-Lived Assets
|
Goodwill
|
Other Long-Lived Assets
|
|||||||||||||||||||
|
Continuing operations:
|
|
|
|
||||||||||||||||||||||||
|
Residential Furnishings
|
$
|
—
|
|
$
|
.2
|
|
$
|
—
|
|
$
|
.9
|
|
$
|
—
|
|
$
|
—
|
|
$
|
—
|
|
$
|
.6
|
|
|||
|
Industrial Materials - Steel Tubing
|
4.1
|
|
1.4
|
|
—
|
|
—
|
|
—
|
|
—
|
|
—
|
|
—
|
|
|||||||||||
|
Specialized Products - Commercial Vehicles Products Group
|
—
|
|
.6
|
|
—
|
|
—
|
|
—
|
|
.6
|
|
—
|
|
—
|
|
|||||||||||
|
Total continuing operations
|
4.1
|
|
2.2
|
|
—
|
|
.9
|
|
—
|
|
.6
|
|
—
|
|
.6
|
|
|||||||||||
|
Discontinued operations:
|
|
|
|
||||||||||||||||||||||||
|
Commercial Products - Store Fixtures
|
—
|
|
—
|
|
108.0
|
|
—
|
|
—
|
|
—
|
|
108.0
|
|
—
|
|
|||||||||||
|
Subsequent activity related to previous divestitures
|
—
|
|
.2
|
|
—
|
|
.1
|
|
—
|
|
—
|
|
—
|
|
—
|
|
|||||||||||
|
Total discontinued operations
|
—
|
|
.2
|
|
|
108.0
|
|
.1
|
|
—
|
|
—
|
|
108.0
|
|
—
|
|
||||||||||
|
Total impairment charges
|
$
|
4.1
|
|
$
|
2.4
|
|
$
|
108.0
|
|
$
|
1.0
|
|
$
|
—
|
|
$
|
.6
|
|
$
|
108.0
|
|
$
|
.6
|
|
|||
Other Long-Lived Assets
We test other long-lived assets for recoverability at year-end and whenever events or changes in circumstances indicate that the carrying value may not be recoverable. Fair value and the resulting impairment charges noted above were based primarily upon offers from potential buyers or third party estimates of fair value less selling costs.
2015 Goodwill Impairment Review
Goodwill is required to be tested for impairment at least once a year and as triggering events may occur. We perform our annual goodwill impairment review in the second quarter of each year. The 2015 goodwill impairment review indicated no goodwill impairments.
As discussed in Note 4, our internal management organizational structure and all related internal reporting changed during the first quarter of 2015. We reassigned the assets and liabilities of the reporting units affected, and also reassigned goodwill using a relative fair value approach for our first quarter 2015 reporting. We performed the 2015 impairment test utilizing the revised structure.
The Steel Tubing unit met the held for sale criteria during the first quarter of 2015, and is not reflected in the table below. Because fair value less costs to sell had fallen below recorded book value, we fully impaired this unit's goodwill and incurred a
$4.1
goodwill impairment charge in the first quarter of 2015.
The fair values of reporting units in relation to their respective carrying values and significant assumptions used in the second quarter 2015 review are presented in the table below.
11
LEGGETT & PLATT, INCORPORATED
NOTES TO CONSOLIDATED CONDENSED FINANCIAL STATEMENTS—(Continued)
(Unaudited)
|
Excess of Fair Value over Carrying Value as a Percentage of Fair Value
|
June 30, 2015
Goodwill Value
|
10-year
Compound
Annual Growth
Rate Range for Sales
|
Terminal
Values Long-
term Growth
Rate for Debt-Free Cash Flow
|
Discount Rate
Ranges
|
||||||||
|
< 25%
|
$
|
—
|
|
—
|
|
—
|
|
—
|
|
|||
|
25% - 49%
|
—
|
|
—
|
|
—
|
|
—
|
|
||||
|
50% - 74%
|
598.5
|
|
.6% - 7.0%
|
|
3.0
|
%
|
8.0% - 12.5%
|
|
||||
|
75%+
|
224.2
|
|
3.1% - 10.9%
|
|
3.0
|
%
|
8.0% - 9.0%
|
|
||||
|
$
|
822.7
|
|
.6% - 10.9%
|
|
3.0
|
%
|
8.0% - 12.5%
|
|
||||
2014 Goodwill Impairment Reviews
We performed our annual goodwill impairment review in June 2014, and on July 14, 2014, concluded that a goodwill impairment charge was required for
one
reporting unit, Store Fixtures which is now reported in discontinued operations, and was previously part of the Commercial Products segment.
The Store Fixtures reporting unit was dependent upon capital spending by retailers on both new stores and remodeling of existing stores. Because of the seasonal nature of the fixture & display industry (where revenue and profitability are typically expected to increase in the second and third quarters assuming the normal historical pattern of heavy shipments during these months) we reasonably anticipated being awarded significant customer orders in the second quarter of 2014. However, as the second quarter progressed, anticipated orders did not materialize and the Store Fixtures business deteriorated, with declines most pronounced in May and June. Taking these recent developments into account, we lowered our projection of future margins and growth rates (from
4.8%
in prior year's review to
.5%
in the current year for
10
-year compound annual growth rate for EBIT plus depreciation and amortization) and increased the discount rate from
10.5%
to
12%
, causing fair value to fall below carrying value. The lower expectations of future revenue and profitability were due to reduced overall market demand for the shelving, counters, showcases and garment racks as many retailers are reducing their investments in traditional store space and focusing more on e-commerce initiatives.
Because the fair value of the Store Fixtures reporting unit had fallen below recorded book values, we performed the second step of the test which requires a fair value assessment of all assets and liabilities of the reporting unit to calculate an implied goodwill amount. This resulted in a
$108.0
goodwill impairment charge that was recorded in the second quarter of 2014. This charge reflects the complete impairment of all goodwill associated with the Store Fixtures reporting unit.
As a result of the above circumstances, we also determined a triggering event had occurred in the second quarter to test other long-lived assets which were evaluated for impairment under the held for use model. No long-lived asset impairments (excluding goodwill) were indicated during the review. During the third quarter of 2014, all of the criteria to classify this unit as held for sale and discontinued operations were met as discussed in Note 5.
12
LEGGETT & PLATT, INCORPORATED
NOTES TO CONSOLIDATED CONDENSED FINANCIAL STATEMENTS—(Continued)
(Unaudited)
7. EARNINGS PER SHARE
Basic and diluted earnings per share were calculated as follows:
|
|
Six Months Ended
June 30, |
Three Months Ended
June 30, |
|||||||||||||
|
|
2015
|
2014
|
2015
|
2014
|
|||||||||||
|
Earnings:
|
|
|
|
|
|||||||||||
|
Earnings from continuing operations
|
$
|
150.0
|
|
$
|
125.6
|
|
$
|
76.7
|
|
$
|
69.6
|
|
|||
|
(Earnings) attributable to noncontrolling interest, net of tax
|
(1.9
|
)
|
(1.4
|
)
|
(.8
|
)
|
(.8
|
)
|
|||||||
|
Net earnings from continuing operations attributable to Leggett & Platt, Inc. common shareholders
|
148.1
|
|
124.2
|
|
75.9
|
|
68.8
|
|
|||||||
|
Earnings (loss) from discontinued operations, net of tax
|
1.3
|
|
(95.0
|
)
|
1.8
|
|
(92.7
|
)
|
|||||||
|
Net earnings attributable to Leggett & Platt, Inc. common shareholders
|
$
|
149.4
|
|
$
|
29.2
|
|
$
|
77.7
|
|
$
|
(23.9
|
)
|
|||
|
Weighted average number of shares (in millions):
|
|
|
|
|
|||||||||||
|
Weighted average number of common shares used in basic EPS
|
141.7
|
|
141.9
|
|
141.4
|
|
141.4
|
|
|||||||
|
Dilutive effect of equity-based compensation
|
1.9
|
|
1.7
|
|
2.0
|
|
1.7
|
|
|||||||
|
Weighted average number of common shares and dilutive potential common shares used in diluted EPS
|
143.6
|
|
143.6
|
|
143.4
|
|
143.1
|
|
|||||||
|
Basic and Diluted EPS:
|
|
|
|
|
|||||||||||
|
Basic EPS attributable to Leggett & Platt, Inc. common shareholders
|
|
|
|
|
|||||||||||
|
Continuing operations
|
$
|
1.04
|
|
$
|
.88
|
|
$
|
.54
|
|
$
|
.49
|
|
|||
|
Discontinued operations
|
.01
|
|
(.67
|
)
|
.01
|
|
(.66
|
)
|
|||||||
|
Basic EPS attributable to Leggett & Platt, Inc. common shareholders
|
$
|
1.05
|
|
$
|
.21
|
|
$
|
.55
|
|
$
|
(.17
|
)
|
|||
|
Diluted EPS attributable to Leggett & Platt, Inc. common shareholders
|
|
|
|
|
|||||||||||
|
Continuing operations
|
$
|
1.03
|
|
$
|
.86
|
|
$
|
.53
|
|
$
|
.48
|
|
|||
|
Discontinued operations
|
.01
|
|
(.66
|
)
|
.01
|
|
(.65
|
)
|
|||||||
|
Diluted EPS attributable to Leggett & Platt, Inc. common shareholders
|
$
|
1.04
|
|
$
|
.20
|
|
$
|
.54
|
|
$
|
(.17
|
)
|
|||
|
Other information:
|
|
|
|
|
|||||||||||
|
Anti-dilutive shares excluded from diluted EPS computation
|
—
|
|
—
|
|
—
|
|
—
|
|
|||||||
13
LEGGETT & PLATT, INCORPORATED
NOTES TO CONSOLIDATED CONDENSED FINANCIAL STATEMENTS—(Continued)
(Unaudited)
8. ACCOUNTS AND OTHER RECEIVABLES
Accounts and other receivables consisted of the following:
|
|
June 30, 2015
|
December 31, 2014
|
|||||||||||||
|
|
Current
|
Long-term
|
Current
|
Long-term
|
|||||||||||
|
Trade accounts receivable
|
$
|
497.3
|
|
$
|
—
|
|
$
|
484.0
|
|
$
|
—
|
|
|||
|
Trade notes receivable
|
.4
|
|
.3
|
|
1.1
|
|
2.9
|
|
|||||||
|
Total trade receivables
|
497.7
|
|
.3
|
|
485.1
|
|
2.9
|
|
|||||||
|
Other notes receivable:
|
|||||||||||||||
|
Notes received as partial payment for divestitures
|
—
|
|
—
|
|
.9
|
|
—
|
|
|||||||
|
Other
|
—
|
|
3.3
|
|
—
|
|
3.3
|
|
|||||||
|
Income tax receivables
|
25.8
|
|
—
|
|
14.0
|
|
—
|
|
|||||||
|
Other receivables
|
37.2
|
|
—
|
|
38.0
|
|
—
|
|
|||||||
|
Subtotal other receivables
|
63.0
|
|
3.3
|
|
52.9
|
|
3.3
|
|
|||||||
|
Total trade and other receivables
|
560.7
|
|
3.6
|
|
538.0
|
|
6.2
|
|
|||||||
|
Allowance for doubtful accounts:
|
|||||||||||||||
|
Trade accounts receivable
|
(11.0
|
)
|
—
|
|
(14.7
|
)
|
—
|
|
|||||||
|
Trade notes receivable
|
(.1
|
)
|
(.2
|
)
|
—
|
|
(2.1
|
)
|
|||||||
|
Total trade receivables
|
(11.1
|
)
|
(.2
|
)
|
(14.7
|
)
|
(2.1
|
)
|
|||||||
|
Other notes receivable
|
—
|
|
(.4
|
)
|
—
|
|
(.4
|
)
|
|||||||
|
Total allowance for doubtful accounts
|
(11.1
|
)
|
(.6
|
)
|
(14.7
|
)
|
(2.5
|
)
|
|||||||
|
Total net receivables
|
$
|
549.6
|
|
$
|
3.0
|
|
$
|
523.3
|
|
$
|
3.7
|
|
|||
Notes that were past due more than
90
days or had been placed on non-accrual status were not significant for the periods presented.
Activity related to the allowance for doubtful accounts is reflected below:
|
Balance at December 31, 2014
|
2015
Charges
|
2015
Charge-
offs,
Net of
Recoveries
|
Balance at June 30, 2015
|
||||||||||||
|
Trade accounts receivable
|
$
|
14.7
|
|
$
|
2.6
|
|
$
|
6.3
|
|
$
|
11.0
|
|
|||
|
Trade notes receivable
|
2.1
|
|
.3
|
|
2.1
|
|
.3
|
|
|||||||
|
Total trade receivables
|
16.8
|
|
2.9
|
|
8.4
|
|
11.3
|
|
|||||||
|
Other notes receivable
|
.4
|
|
—
|
|
—
|
|
.4
|
|
|||||||
|
Total allowance for doubtful accounts
|
$
|
17.2
|
|
$
|
2.9
|
|
$
|
8.4
|
|
$
|
11.7
|
|
|||
14
LEGGETT & PLATT, INCORPORATED
NOTES TO CONSOLIDATED CONDENSED FINANCIAL STATEMENTS—(Continued)
(Unaudited)
9. STOCK-BASED COMPENSATION
The following table recaps the components of stock-based and stock-related compensation for each period presented:
|
|
Six Months Ended
June 30, 2015 |
Six Months Ended
June 30, 2014 |
|||||||||||||
|
To be settled with stock
|
To be settled in cash
|
To be settled with stock
|
To be settled in cash
|
||||||||||||
|
Options:
|
|||||||||||||||
|
Amortization of the grant date fair value
|
$
|
.2
|
|
$
|
—
|
|
$
|
.4
|
|
$
|
—
|
|
|||
|
Cash payments in lieu of options
|
—
|
|
1.0
|
|
—
|
|
.9
|
|
|||||||
|
Stock-based retirement plans contributions
|
3.9
|
|
.7
|
|
3.3
|
|
.8
|
|
|||||||
|
Discounts on various stock awards:
|
|
|
|||||||||||||
|
Deferred Stock Compensation Program
|
1.1
|
|
—
|
|
1.3
|
|
—
|
|
|||||||
|
Stock-based retirement plans
|
.7
|
|
—
|
|
1.2
|
|
—
|
|
|||||||
|
Discount Stock Plan
|
.5
|
|
—
|
|
.5
|
|
—
|
|
|||||||
|
Performance Stock Unit awards (1)
|
3.3
|
|
5.8
|
|
3.1
|
|
2.4
|
|
|||||||
|
Restricted Stock Unit awards
|
1.7
|
|
—
|
|
1.7
|
|
—
|
|
|||||||
|
Profitable Growth Incentive awards (2)
|
3.9
|
|
3.7
|
|
.8
|
|
.8
|
|
|||||||
|
Other, primarily non-employee directors restricted stock
|
.7
|
|
—
|
|
.6
|
|
—
|
|
|||||||
|
Total stock-related compensation expense
|
16.0
|
|
$
|
11.2
|
|
12.9
|
|
$
|
4.9
|
|
|||||
|
Employee contributions for above stock plans
|
7.4
|
|
7.3
|
|
|||||||||||
|
Total stock-based compensation
|
$
|
23.4
|
|
$
|
20.2
|
|
|||||||||
|
Recognized tax benefits on stock-based compensation expense
|
$
|
6.1
|
|
$
|
4.9
|
|
|||||||||
|
|
Three Months Ended
|
Three Months Ended
|
|||||||||||||
|
June 30, 2015
|
June 30, 2014
|
||||||||||||||
|
To be settled with stock
|
To be settled in cash
|
To be settled with stock
|
To be settled in cash
|
||||||||||||
|
Options:
|
|||||||||||||||
|
Amortization of the grant date fair value
|
$
|
.1
|
|
$
|
—
|
|
$
|
.2
|
|
$
|
—
|
|
|||
|
Cash payments in lieu of options
|
—
|
|
—
|
|
—
|
|
—
|
|
|||||||
|
Stock-based retirement plans contributions
|
1.7
|
|
.3
|
|
1.7
|
|
.3
|
|
|||||||
|
Discounts on various stock awards:
|
|||||||||||||||
|
Deferred Stock Compensation Program
|
.5
|
|
—
|
|
.6
|
|
—
|
|
|||||||
|
Stock-based retirement plans
|
.3
|
|
—
|
|
.5
|
|
—
|
|
|||||||
|
Discount Stock Plan
|
.2
|
|
—
|
|
.2
|
|
—
|
|
|||||||
|
Performance Stock Unit awards (1)
|
1.7
|
|
2.9
|
|
1.6
|
|
1.2
|
|
|||||||
|
Restricted Stock Unit awards
|
.8
|
|
—
|
|
.9
|
|
—
|
|
|||||||
|
Profitable Growth Incentive awards (2)
|
2.0
|
|
2.0
|
|
.4
|
|
.4
|
|
|||||||
|
Other, primarily non-employee directors restricted stock
|
.3
|
|
—
|
|
.3
|
|
—
|
|
|||||||
|
Total stock-related compensation expense
|
7.6
|
|
$
|
5.2
|
|
6.4
|
|
$
|
1.9
|
|
|||||
|
Employee contributions for above stock plans
|
3.6
|
|
3.3
|
|
|||||||||||
|
Total stock-based compensation
|
$
|
11.2
|
|
$
|
9.7
|
|
|||||||||
|
Recognized tax benefits on stock-based compensation expense
|
$
|
2.9
|
|
$
|
2.4
|
|
|||||||||
Included below is the activity in our most significant stock-based plans:
15
LEGGETT & PLATT, INCORPORATED
NOTES TO CONSOLIDATED CONDENSED FINANCIAL STATEMENTS—(Continued)
(Unaudited)
(1) Performance Stock Unit Awards
We grant Performance Stock Unit (PSU) awards in the first quarter of each year to selected officers and other key managers. These awards contain the following conditions:
|
•
|
A service requirement—Awards generally “cliff” vest
three
years following the grant date; and
|
|
•
|
A market condition—Awards are based on our Total Shareholder Return [TSR = (Change in Stock Price + Dividends) / Beginning Stock Price] as compared to the TSR of a group of peer companies. The peer group consists of all the companies in the Industrial, Materials and Consumer Discretionary sectors of the S&P 500 and S&P Midcap 400 (approximately
320
companies). Participants will earn from
0%
to
175%
of the base award depending upon how our Total Shareholder Return ranks within the peer group at the end of the
3
-year performance period.
|
Grant date fair values are calculated using a Monte Carlo simulation of stock and volatility data for Leggett and each of the comparator companies. Grant date fair values are amortized using the straight-line method over the
three
-year vesting period.
Below is a summary of the number of shares and related grant date fair value of PSU’s for the periods presented.
|
|
Six Months Ended June 30,
|
||||||
|
|
2015
|
2014
|
|||||
|
Total shares base award
|
.2
|
|
.2
|
|
|||
|
Grant date per share fair value
|
$
|
42.22
|
|
$
|
30.45
|
|
|
|
Risk-free interest rate
|
1.1
|
%
|
.8
|
%
|
|||
|
Expected life in years
|
3.0
|
|
3.0
|
|
|||
|
Expected volatility (over expected life)
|
19.8
|
%
|
25.9
|
%
|
|||
|
Expected dividend yield (over expected life)
|
2.9
|
%
|
3.9
|
%
|
|||
|
Three-Year Performance Cycle
|
||||||||||
|
Award Year
|
Completion Date
|
TSR Performance
Relative to the Peer Group (1%=Best)
|
Payout as a
Percent of the
Base Award
|
Number of Shares
Distributed
|
Distribution Date
|
|||||
|
2011
|
December 31, 2013
|
55th percentile
|
64.2%
|
.2 million
|
January 2014
|
|||||
|
2012
|
December 31, 2014
|
30th percentile
|
157.0%
|
.4 million
|
January 2015
|
|||||
The above information represents the
65%
portion of the award that was settled in shares of our common stock. For outstanding awards, we intend to pay
65%
in shares of our common stock, although we reserve the right to pay up to
100%
in cash. The additional amount that represents
35%
of the award will be settled in cash, and is recorded as a liability and adjusted to fair value at each reporting period.
(2) Profitable Growth Incentive Awards
Starting in 2013, certain key management employees participated in a new Profitable Growth Incentive (PGI) program in lieu of the annual option grant. The PGI awards are issued as growth performance stock units (GPSUs). The GPSUs vest (
0%
to
250%
) at the end of a
two
-year performance period. Vesting is based on the Company's or applicable profit center's revenue growth (adjusted by a GDP factor when applicable) and EBITDA margin at the end of a
two
-year performance period. The 2015 and 2014 base target PGI awards were each
.1
shares. If earned, we intend to pay half in shares of our common stock and half in cash, although we reserve the right to pay up to
100%
in cash. Both components are adjusted to fair value at each reporting period.
|
Two-Year Performance Cycle
|
||||||||||||
|
Award Year
|
Completion Date
|
Average Payout as a
Percent of the
Base Award
|
Number of Shares
Distributed
|
Cash Portion
|
Distribution Date
|
|||||||
|
2013
|
December 31, 2014
|
127.0%
|
.1 million
|
$
|
3.5
|
|
February 2015
|
|||||
16
LEGGETT & PLATT, INCORPORATED
NOTES TO CONSOLIDATED CONDENSED FINANCIAL STATEMENTS—(Continued)
(Unaudited)
10. ACQUISITIONS
The following table contains the estimated fair values (using inputs as discussed in Note 13) of the assets acquired and liabilities assumed at the date of acquisition for all acquisitions during the periods presented, and any additional consideration paid for prior years’ acquisitions. We are finalizing all the information required to complete the purchase price allocations related to certain recent acquisitions and do not anticipate any material modifications.
|
|
Six Months Ended June 30,
|
||||||
|
|
2015
|
2014
|
|||||
|
Accounts receivable
|
$
|
3.7
|
|
$
|
1.0
|
|
|
|
Inventory
|
4.8
|
|
11.2
|
|
|||
|
Property, plant and equipment
|
2.3
|
|
17.2
|
|
|||
|
Goodwill (1)
|
8.3
|
|
23.9
|
|
|||
|
Other intangible assets
|
14.7
|
|
2.3
|
|
|||
|
Other current and long-term assets
|
.1
|
|
4.1
|
|
|||
|
Current liabilities
|
(11.2
|
)
|
(7.3
|
)
|
|||
|
Long-term liabilities
|
(10.4
|
)
|
—
|
|
|||
|
Additional consideration paid (received) for prior years’ acquisitions
|
(1.2
|
)
|
—
|
|
|||
|
Fair value of net identifiable assets
|
11.1
|
|
52.4
|
|
|||
|
Less: Non-cash consideration
|
—
|
|
1.2
|
|
|||
|
Net cash consideration
|
$
|
11.1
|
|
$
|
51.2
|
|
|
(1) Goodwill associated with the 2015 and 2014 acquisitions are expected to provide an income tax benefit.
The following table summarizes acquisitions for the periods presented.
|
Six Months Ended
|
Number of Acquisitions
|
Segment
|
Product/Service
|
|||
|
June 30, 2015
|
1
|
Commercial Products
|
Upholstered office furniture
|
|||
|
June 30, 2014
|
3
|
Residential Furnishings
|
Foam carpet underlay; Fabric converting for furniture and bedding; Innersprings
|
|||
In March 2015, we acquired a
70%
interest in a European private-label manufacturer of high-end upholstered furniture for office, commercial and other settings for a purchase price of
$22.7
. This business, which is included in the Work Furniture Group of our Commercial Products segment, is complementary to our North American private-label operation and allows us to support our Work Furniture customers as they expand globally. We will acquire the remaining
30%
over the next five years, per the terms of the agreement, and have recorded a long-term liability of approximately
$10
for the future payments.
On June 30, 2014, we acquired Tempur Sealy's
three
U.S. innerspring component production facilities for a purchase price of
$44.5
. Factors contributing to the recognition of
$17.8
in goodwill from the acquisition included: additional production that enhances economies of scale; benefits from our vertical integration in steel rod and wire; and the optimization of manufacturing across a broad asset base.
The results of operations of the above acquired companies have been included in the consolidated financial statements since the dates of acquisition. The unaudited pro forma consolidated net sales, net earnings and earnings per share as though the 2015 and 2014 acquisitions had occurred on January 1 of each year presented are not materially different from the amounts reflected in the accompanying financial statements. Certain of our acquisition agreements provide for additional consideration to be paid in cash at a later date and are recorded as a liability at the acquisition date. At June 30, 2015, there was no substantial remaining consideration payable other than the liability discussed above.
17
LEGGETT & PLATT, INCORPORATED
NOTES TO CONSOLIDATED CONDENSED FINANCIAL STATEMENTS—(Continued)
(Unaudited)
11. EMPLOYEE BENEFIT PLANS
The following table provides interim information as to our domestic and foreign defined benefit pension plans. Expected 2015 employer contributions are not significantly different than the
$1.9
previously reported at December 31, 2014.
|
|
Six Months Ended
June 30, |
Three Months Ended June 30,
|
|||||||||||||
|
|
2015
|
2014
|
2015
|
2014
|
|||||||||||
|
Components of net pension expense
|
|||||||||||||||
|
Service cost
|
$
|
2.0
|
|
$
|
1.5
|
|
$
|
1.0
|
|
$
|
.8
|
|
|||
|
Interest cost
|
6.5
|
|
6.4
|
|
3.3
|
|
3.2
|
|
|||||||
|
Expected return on plan assets
|
(8.3
|
)
|
(7.8
|
)
|
(4.2
|
)
|
(3.9
|
)
|
|||||||
|
Recognized net actuarial loss
|
3.0
|
|
1.6
|
|
1.5
|
|
.8
|
|
|||||||
|
Net pension expense
|
$
|
3.2
|
|
$
|
1.7
|
|
$
|
1.6
|
|
$
|
.9
|
|
|||
18
LEGGETT & PLATT, INCORPORATED
NOTES TO CONSOLIDATED CONDENSED FINANCIAL STATEMENTS—(Continued)
(Unaudited)
12. STATEMENT OF CHANGES IN EQUITY AND ACCUMULATED OTHER COMPREHENSIVE INCOME
|
|
Six Months Ended June 30, 2015
|
||||||||||||||||||||||
|
|
Total
Equity
|
Retained
Earnings
|
Common
Stock &
Additional
Contributed
Capital
|
Treasury
Stock
|
Noncontrolling
Interest
|
Accumulated
Other
Comprehensive
Income
|
|||||||||||||||||
|
Beginning balance, January 1, 2015
|
$
|
1,154.9
|
|
$
|
2,061.3
|
|
$
|
504.4
|
|
$
|
(1,416.6
|
)
|
$
|
8.4
|
|
$
|
(2.6
|
)
|
|||||
|
Net earnings
|
151.3
|
|
151.3
|
|
—
|
|
—
|
|
—
|
|
—
|
|
|||||||||||
|
(Earnings) loss attributable to noncontrolling interest, net of tax
|
—
|
|
(1.9
|
)
|
—
|
|
—
|
|
1.9
|
|
—
|
|
|||||||||||
|
Dividends declared
|
(85.2
|
)
|
(87.7
|
)
|
2.5
|
|
—
|
|
—
|
|
—
|
|
|||||||||||
|
Treasury stock purchased
|
(127.8
|
)
|
—
|
|
—
|
|
(127.8
|
)
|
—
|
|
—
|
|
|||||||||||
|
Treasury stock issued
|
21.1
|
|
—
|
|
(20.4
|
)
|
41.5
|
|
—
|
|
—
|
|
|||||||||||
|
Foreign currency translation adjustments
|
(35.0
|
)
|
—
|
|
—
|
|
—
|
|
.1
|
|
(35.1
|
)
|
|||||||||||
|
Cash flow hedges, net of tax
|
(.4
|
)
|
—
|
|
—
|
|
—
|
|
—
|
|
(.4
|
)
|
|||||||||||
|
Defined benefit pension plans, net of tax
|
1.8
|
|
—
|
|
—
|
|
—
|
|
—
|
|
1.8
|
|
|||||||||||
|
Stock options and benefit plan transactions, net of tax
|
29.3
|
|
—
|
|
29.3
|
|
—
|
|
—
|
|
—
|
|
|||||||||||
|
Ending balance, June 30, 2015
|
$
|
1,110.0
|
|
$
|
2,123.0
|
|
$
|
515.8
|
|
$
|
(1,502.9
|
)
|
$
|
10.4
|
|
$
|
(36.3
|
)
|
|||||
|
|
Six Months Ended June 30, 2014
|
||||||||||||||||||||||
|
|
Total
Equity
|
Retained
Earnings
|
Common
Stock &
Additional
Contributed
Capital
|
Treasury
Stock
|
Noncontrolling
Interest
|
Accumulated
Other
Comprehensive
Income
|
|||||||||||||||||
|
Beginning balance, January 1, 2014
|
$
|
1,399.2
|
|
$
|
2,136.4
|
|
$
|
481.1
|
|
$
|
(1,320.7
|
)
|
$
|
7.9
|
|
$
|
94.5
|
|
|||||
|
Net earnings
|
30.6
|
|
30.6
|
|
—
|
|
—
|
|
—
|
|
—
|
|
|||||||||||
|
(Earnings) loss attributable to noncontrolling interest, net of tax
|
—
|
|
(1.4
|
)
|
—
|
|
—
|
|
1.4
|
|
—
|
|
|||||||||||
|
Dividends declared
|
(82.7
|
)
|
(85.1
|
)
|
2.4
|
|
—
|
|
—
|
|
—
|
|
|||||||||||
|
Treasury stock purchased
|
(124.3
|
)
|
—
|
|
—
|
|
(124.3
|
)
|
—
|
|
—
|
|
|||||||||||
|
Treasury stock issued
|
26.7
|
|
—
|
|
(11.9
|
)
|
38.6
|
|
—
|
|
—
|
|
|||||||||||
|
Foreign currency translation adjustments
|
(4.3
|
)
|
—
|
|
—
|
|
—
|
|
(.2
|
)
|
(4.1
|
)
|
|||||||||||
|
Cash flow hedges, net of tax
|
1.8
|
|
—
|
|
—
|
|
—
|
|
—
|
|
1.8
|
|
|||||||||||
|
Defined benefit pension plans, net of tax
|
.7
|
|
—
|
|
—
|
|
—
|
|
—
|
|
.7
|
|
|||||||||||
|
Stock options and benefit plan transactions, net of tax
|
14.7
|
|
—
|
|
14.7
|
|
—
|
|
—
|
|
—
|
|
|||||||||||
|
Ending balance, June 30, 2014
|
$
|
1,262.4
|
|
$
|
2,080.5
|
|
$
|
486.3
|
|
$
|
(1,406.4
|
)
|
$
|
9.1
|
|
$
|
92.9
|
|
|||||
19
LEGGETT & PLATT, INCORPORATED
NOTES TO CONSOLIDATED CONDENSED FINANCIAL STATEMENTS—(Continued)
(Unaudited)
The following tables set forth the components of and changes in each component of accumulated other comprehensive income (loss) for each of the periods presented:
|
Foreign
Currency
Translation
Adjustments
|
Cash
Flow
Hedges
|
Defined
Benefit
Pension
Plans
|
Accumulated
Other
Comprehensive
Income (Loss)
|
||||||||||||
|
Beginning balance, January 1, 2015
|
$
|
86.8
|
|
$
|
(20.1
|
)
|
$
|
(69.3
|
)
|
$
|
(2.6
|
)
|
|||
|
Other comprehensive income (loss) before reclassifications, pretax
|
(31.4
|
)
|
(1.3
|
)
|
(.1
|
)
|
(32.8
|
)
|
|||||||
|
Amounts reclassified from accumulated other comprehensive income, pretax:
|
|
|
|
|
|||||||||||
|
Net Sales
|
—
|
|
(.7
|
)
|
—
|
|
(.7
|
)
|
|||||||
|
Cost of goods sold; selling and administrative expenses
|
—
|
|
—
|
|
3.0
|
|
3.0
|
|
|||||||
|
Interest expense
|
—
|
|
2.0
|
|
—
|
|
2.0
|
|
|||||||
|
Earnings (loss) from discontinued operations, net of tax
|
(3.6
|
)
|
—
|
|
—
|
|
(3.6
|
)
|
|||||||
|
Subtotal of reclassifications, pretax
|
(3.6
|
)
|
1.3
|
|
3.0
|
|
.7
|
|
|||||||
|
Other comprehensive income (loss), pretax
|
(35.0
|
)
|
—
|
|
2.9
|
|
(32.1
|
)
|
|||||||
|
Income tax effect
|
—
|
|
(.4
|
)
|
(1.1
|
)
|
(1.5
|
)
|
|||||||
|
Attributable to noncontrolling interest
|
(.1
|
)
|
—
|
|
—
|
|
(.1
|
)
|
|||||||
|
Ending balance, June 30, 2015
|
$
|
51.7
|
|
$
|
(20.5
|
)
|
$
|
(67.5
|
)
|
$
|
(36.3
|
)
|
|||
|
Beginning balance, January 1, 2014
|
$
|
158.3
|
|
$
|
(23.5
|
)
|
$
|
(40.3
|
)
|
$
|
94.5
|
|
|||
|
Other comprehensive income (loss) before reclassifications, pretax
|
(4.3
|
)
|
.6
|
|
(.5
|
)
|
(4.2
|
)
|
|||||||
|
Amounts reclassified from accumulated other comprehensive income, pretax:
|
|
|
|
|
|||||||||||
|
Net Sales
|
—
|
|
.2
|
|
—
|
|
.2
|
|
|||||||
|
Cost of goods sold; selling and administrative expenses
|
—
|
|
—
|
|
1.6
|
|
1.6
|
|
|||||||
|
Interest expense
|
—
|
|
2.0
|
|
—
|
|
2.0
|
|
|||||||
|
Subtotal of reclassifications, pretax
|
—
|
|
2.2
|
|
1.6
|
|
3.8
|
|
|||||||
|
Other comprehensive income (loss), pretax
|
(4.3
|
)
|
2.8
|
|
1.1
|
|
(0.4
|
)
|
|||||||
|
Income tax effect
|
—
|
|
(1.0
|
)
|
(.4
|
)
|
(1.4
|
)
|
|||||||
|
Attributable to noncontrolling interest
|
.2
|
|
—
|
|
—
|
|
.2
|
|
|||||||
|
Ending balance, June 30, 2014
|
$
|
154.2
|
|
$
|
(21.7
|
)
|
$
|
(39.6
|
)
|
$
|
92.9
|
|
|||
13. FAIR VALUE
We utilize fair value measures for both financial and non-financial assets and liabilities.
Items measured at fair value on a recurring basis
The areas in which we utilize fair value measures of financial assets and liabilities are presented in the table below.
Fair value measurements are established using a three level valuation hierarchy that prioritizes the inputs to valuation techniques used to measure fair value into the following categories:
|
•
|
Level 1: Quoted prices for identical assets or liabilities in active markets.
|
|
•
|
Level 2: Inputs other than quoted prices included in Level 1 that are observable for the asset or liability either directly or indirectly. Short-term investments in this category are valued using discounted cash flow techniques with all significant inputs derived from or corroborated by observable market data. Derivative assets and liabilities in this category are valued using models that consider various assumptions and information from market-corroborated sources. The models used are primarily industry-standard models that consider items such as quoted prices, market interest rate curves applicable to the instruments being valued as of the end of each period, discounted cash flows, volatility factors, current market and contractual prices for the underlying instruments, as well as other relevant economic measures. Substantially all of these assumptions are observable in the marketplace, can be derived from observable data or are supported by observable levels at which transactions are executed in the marketplace.
|
|
•
|
Level 3: Unobservable inputs that are not corroborated by market data.
|
20
LEGGETT & PLATT, INCORPORATED
NOTES TO CONSOLIDATED CONDENSED FINANCIAL STATEMENTS—(Continued)
(Unaudited)
|
|
As of June 30, 2015
|
||||||||||||||
|
|
Level 1
|
Level 2
|
Level 3
|
Total
|
|||||||||||
|
Assets:
|
|||||||||||||||
|
Cash equivalents:
|
|||||||||||||||
|
Bank time deposits with original maturities of three months or less
|
$
|
—
|
|
$
|
103.9
|
|
$
|
—
|
|
$
|
103.9
|
|
|||
|
Derivative assets (Note 14)
|
—
|
|
2.3
|
|
—
|
|
2.3
|
|
|||||||
|
Diversified investments associated with the Executive Stock Unit Program (ESUP)* (Note 9)
|
21.4
|
|
—
|
|
—
|
|
21.4
|
|
|||||||
|
Total assets
|
$
|
21.4
|
|
$
|
106.2
|
|
$
|
—
|
|
$
|
127.6
|
|
|||
|
Liabilities:
|
|||||||||||||||
|
Derivative liabilities* (Note 14)
|
$
|
—
|
|
$
|
4.2
|
|
$
|
—
|
|
$
|
4.2
|
|
|||
|
Liabilities associated with the ESUP* (Note 9)
|
21.5
|
|
—
|
|
—
|
|
21.5
|
|
|||||||
|
Total liabilities
|
$
|
21.5
|
|
$
|
4.2
|
|
$
|
—
|
|
$
|
25.7
|
|
|||
|
|
As of December 31, 2014
|
||||||||||||||
|
|
Level 1
|
Level 2
|
Level 3
|
Total
|
|||||||||||
|
Assets:
|
|||||||||||||||
|
Cash equivalents:
|
|||||||||||||||
|
Bank time deposits with original maturities of three months or less
|
$
|
—
|
|
$
|
140.7
|
|
$
|
—
|
|
$
|
140.7
|
|
|||
|
Derivative assets (Note 14)
|
—
|
|
2.0
|
|
—
|
|
2.0
|
|
|||||||
|
Diversified investments associated with the ESUP* (Note 9)
|
18.8
|
|
—
|
|
—
|
|
18.8
|
|
|||||||
|
Total assets
|
$
|
18.8
|
|
$
|
142.7
|
|
$
|
—
|
|
$
|
161.5
|
|
|||
|
Liabilities:
|
|||||||||||||||
|
Derivative liabilities* (Note 14)
|
$
|
—
|
|
$
|
2.7
|
|
$
|
—
|
|
$
|
2.7
|
|
|||
|
Liabilities associated with the ESUP* (Note 9)
|
18.6
|
|
—
|
|
—
|
|
18.6
|
|
|||||||
|
Total liabilities
|
$
|
18.6
|
|
$
|
2.7
|
|
$
|
—
|
|
$
|
21.3
|
|
|||
* - Includes both current and long-term amounts combined.
There were
no
transfers between Level 1 and Level 2 for any of the periods presented.
The fair value for fixed rate debt (Level 2) was greater than its
$950
carrying value by
$6
at June 30, 2015 and was not significantly different from its
$950
carrying value at December 31, 2014. We value this debt using discounted cash flow and secondary market rates provided by Bloomberg.
Items measured at fair value on a non-recurring basis
The primary areas in which we use fair value measurements of non-financial assets and liabilities are allocating purchase price to the assets and liabilities of acquired companies as discussed in Note 10, and evaluating long-term assets (including goodwill) for potential impairment as discussed in Note 6. Determination of fair values for these items requires significant judgment and are calculated utilizing a variety of methods and models that utilize significant Level 3 inputs.
Long lived assets, acquisitions and the second step of a goodwill impairment test utilize the following methodologies in determining fair value: (i) Buildings and machinery are valued at an estimated replacement cost for an asset of comparable age and condition. Market pricing of comparable assets is used to estimate replacement cost where available. (ii) The most common identified intangible assets are customer relationships and tradenames. Customer relationships are valued using an excess earnings method, using various inputs such as the estimated customer attrition rate, future earnings forecast, the amount of contributory asset charges, and a discount rate. Tradenames are valued using a relief from royalty method, which is based upon comparable market royalty rates for tradenames of similar value. (iii) Inventory is valued at current replacement cost for raw materials, with a step-up for work in process and finished goods items that reflects the amount of ultimate profit earned as of the valuation date. (iv) Other working capital items are generally recorded at face value, unless there are known conditions that would impact the ultimate settlement amount of the particular item.
21
LEGGETT & PLATT, INCORPORATED
NOTES TO CONSOLIDATED CONDENSED FINANCIAL STATEMENTS—(Continued)
(Unaudited)
14. RISK MANAGEMENT AND DERIVATIVE FINANCIAL INSTRUMENTS
Risk Management Strategy & Objectives
We are subject to market and financial risks related to interest rates, foreign currency, and commodities. In the normal course of business, we utilize derivative instruments (individually or in combinations) to manage these risks. We seek to use derivative contracts that qualify for hedge accounting treatment; however, some instruments may not qualify for this treatment. It is our policy not to speculate using derivative instruments.
Cash Flow Hedges
Derivative financial instruments that we use to hedge forecasted transactions and anticipated cash flows are as follows:
|
•
|
Interest Rate Cash Flow Hedges -
In August 2012, we issued
$300
of
10
-year notes with a coupon rate of
3.40%
. As a part of this transaction, we settled our
$200
forward starting interest rate swaps we had entered into during 2010 and recognized a loss of
$42.7
, which will be amortized out of accumulated other comprehensive income to interest expense over the life of the notes.
|
|
•
|
Currency Cash Flow Hedges
—The foreign currency hedges manage risk associated with exchange rate volatility of various currencies.
|
The effective changes in fair value of unexpired contracts are recorded in accumulated other comprehensive income and reclassified to income or expense in the period in which earnings are impacted. Cash flows from settled contracts are presented in the category consistent with the nature of the item being hedged. (Settlements associated with the sale or production of product are presented in operating cash flows and settlements associated with debt issuance are presented in financing cash flows.)
Fair Value Hedges
Our fair value hedges typically manage foreign currency risk associated with subsidiaries’ inter-company assets and liabilities. Hedges designated as fair value hedges recognize gain or loss currently in earnings. Cash flows from settled contracts are presented in the category consistent with the nature of the item being hedged.
Hedge Effectiveness
We have deemed ineffectiveness to be immaterial, and as a result, have not recorded any amounts for ineffectiveness. If a hedge was not highly effective, the portion of the change in fair value considered to be ineffective would be recognized immediately in the consolidated statements of operations.
We have recorded the following assets and liabilities representing the fair value for our most significant derivative financial instruments. The fair values of the derivatives reflect the change in the market value of the derivative from the date of the trade execution, and do not consider the offsetting underlying hedged item.
22
LEGGETT & PLATT, INCORPORATED
NOTES TO CONSOLIDATED CONDENSED FINANCIAL STATEMENTS—(Continued)
(Unaudited)
|
|
Expiring at various dates through:
|
Total USD
Equivalent
Notional
Amount
|
As of June 30, 2015
|
||||||||||||||||||
|
|
Assets
|
Liabilities
|
|||||||||||||||||||
|
Other
Current
Assets
|
Sundry
|
Other Current
Liabilities
|
Other Long-Term Liabilities
|
||||||||||||||||||
|
Derivatives designated as hedging instruments
|
|||||||||||||||||||||
|
Cash flow hedges:
|
|||||||||||||||||||||
|
Currency Hedges:
|
|||||||||||||||||||||
|
-Future USD sales of Canadian, Chinese and Swiss subsidiaries
|
Dec 2016
|
$
|
231.0
|
|
$
|
.9
|
|
$
|
.1
|
|
$
|
2.2
|
|
$
|
.9
|
|
|||||
|
-Future MXN purchases of a USD subsidiary
|
Dec 2017
|
14.4
|
|
—
|
|
—
|
|
.4
|
|
.3
|
|
||||||||||
|
-Future USD purchases of Canadian, European, and Korean subsidiaries
|
Dec 2016
|
11.0
|
|
.6
|
|
—
|
|
—
|
|
—
|
|
||||||||||
|
-Future EUR sales of Chinese and Swiss subsidiaries
|
Aug 2016
|
8.7
|
|
.5
|
|
—
|
|
—
|
|
—
|
|
||||||||||
|
-Future DKK sales of Polish subsidiary
|
Dec 2015
|
10.2
|
|
—
|
|
—
|
|
.1
|
|
—
|
|
||||||||||
|
-Future JPY sales of Chinese subsidiary
|
Dec 2015
|
3.7
|
|
.1
|
|
—
|
|
—
|
|
—
|
|
||||||||||
|
Total cash flow hedges
|
2.1
|
|
.1
|
|
2.7
|
|
1.2
|
|
|||||||||||||
|
Fair value hedges:
|
|||||||||||||||||||||
|
USD inter-company note receivable on a CAD subsidiary
|
July 2015
|
10.0
|
|
—
|
|
—
|
|
.2
|
|
—
|
|
||||||||||
|
USD inter-company note receivable on a Swiss subsidiary
|
Sep 2015
|
18.5
|
|
—
|
|
—
|
|
.1
|
|
—
|
|
||||||||||
|
Total fair value hedges
|
—
|
|
—
|
|
.3
|
|
—
|
|
|||||||||||||
|
Derivatives not designated as hedging instruments
|
|||||||||||||||||||||
|
Non-deliverable hedge on USD exposure to CNY
|
Apr 2016
|
8.0
|
|
.1
|
|
—
|
|
—
|
|
—
|
|
||||||||||
|
$
|
2.2
|
|
$
|
.1
|
|
$
|
3.0
|
|
$
|
1.2
|
|
||||||||||
23
LEGGETT & PLATT, INCORPORATED
NOTES TO CONSOLIDATED CONDENSED FINANCIAL STATEMENTS—(Continued)
(Unaudited)
|
|
Expiring at various dates through:
|
Total USD
Equivalent
Notional
Amount
|
As of December 31, 2014
|
||||||||||||||
|
|
Assets
|
Liabilities
|
|||||||||||||||
|
Other Current
Assets
|
Other Current
Liabilities
|
Other Long-Term Liabilities
|
|||||||||||||||
|
Derivatives designated as hedging instruments
|
|||||||||||||||||
|
Cash flow hedges:
|
|||||||||||||||||
|
Currency Hedges:
|
|||||||||||||||||
|
-Future USD sales of Canadian and Chinese subsidiaries
|
Dec 2016
|
$
|
153.3
|
|
$
|
.3
|
|
$
|
1.0
|
|
$
|
.2
|
|
||||
|
-Future USD purchases of Canadian and European subsidiaries
|
Dec 2015
|
10.4
|
|
.9
|
|
—
|
|
—
|
|
||||||||
|
-Future MXN purchases of a USD subsidiary
|
Dec 2016
|
5.3
|
|
—
|
|
.3
|
|
.1
|
|
||||||||
|
-Future JPY sales of a Chinese subsidiary
|
Dec 2015
|
6.9
|
|
.5
|
|
—
|
|
—
|
|
||||||||
|
-Future EUR sales of a Chinese subsidiary
|
Dec 2015
|
6.0
|
|
.3
|
|
—
|
|
—
|
|
||||||||
|
Total cash flow hedges
|
2.0
|
|
1.3
|
|
.3
|
|
|||||||||||
|
Fair value hedges:
|
|||||||||||||||||
|
USD inter-company note receivable on a Swiss subsidiary
|
Sep 2015
|
18.5
|
|
—
|
|
1.1
|
|
—
|
|
||||||||
|
$
|
2.0
|
|
$
|
2.4
|
|
$
|
.3
|
|
|||||||||
The following table sets forth the pre-tax (gains) losses from continuing operations for our hedging activities for the years presented. This schedule includes reclassifications from accumulated other comprehensive income (see Note 12) as well as derivative settlements recorded directly to income or expense.
24
LEGGETT & PLATT, INCORPORATED
NOTES TO CONSOLIDATED CONDENSED FINANCIAL STATEMENTS—(Continued)
(Unaudited)
|
|
Income Statement
Caption
|
Amount of (Gain) Loss
Recorded in Income
Six Months Ended
June 30
|
Amount of (Gain) Loss
Recorded in Income
Three Months Ended
June 30
|
||||||||||||||
|
2015
|
2014
|
2015
|
2014
|
||||||||||||||
|
Derivatives designated as hedging instruments
|
|||||||||||||||||
|
Interest rate cash flow hedges
|
Interest expense
|
2.0
|
|
2.0
|
|
$
|
1.0
|
|
$
|
1.0
|
|
||||||
|
Foreign currency cash flow hedges
|
Net sales *
|
(.5
|
)
|
1.0
|
|
(.5
|
)
|
.7
|
|
||||||||
|
Foreign currency cash flow hedges
|
Cost of goods sold
|
(.8
|
)
|
—
|
|
(.4
|
)
|
—
|
|
||||||||
|
Foreign currency cash flow hedges
|
Other (income) expense, net
|
—
|
|
.1
|
|
—
|
|
—
|
|
||||||||
|
Total cash flow hedges
|
.7
|
|
3.1
|
|
.1
|
|
1.7
|
|
|||||||||
|
Fair value hedges
|
Other (income) expense, net
|
(.2
|
)
|
(.1
|
)
|
(.9
|
)
|
.4
|
|
||||||||
|
Derivatives not designated as hedging instruments
|
|||||||||||||||||
|
Hedge of USD cash-UK and Swiss subsidiaries
|
Other (income) expense, net
|
(.1
|
)
|
—
|
|
—
|
|
—
|
|
||||||||
|
Hedge of EUR cash-UK and Swiss subsidiaries
|
Other (income) expense, net
|
.9
|
|
.2
|
|
—
|
|
||||||||||
|
Hedge of DKK cash-USD subsidiary
|
Other (income) expense, net
|
(.1
|
)
|
—
|
|
(.1
|
)
|
—
|
|
||||||||
|
Non-deliverable hedge on USD exposure to CNY
|
Other (income) expense, net
|
(.1
|
)
|
—
|
|
(.1
|
)
|
—
|
|
||||||||
|
Total derivative instruments
|
$
|
1.1
|
|
$
|
3.0
|
|
$
|
(.8
|
)
|
$
|
2.1
|
|
|||||
|
* Discontinued operations amounts included in above:
|
$
|
—
|
|
$
|
.1
|
|
$
|
—
|
|
$
|
.1
|
|
|||||
15. CONTINGENCIES
We are a party to various proceedings and matters involving employment, antitrust, intellectual property, environmental, taxation and other laws. When it is probable, in management's judgment, that we may incur monetary damages or other costs resulting from these proceedings or other claims, and we can reasonably estimate the amounts, we record appropriate accruals in the financial statements and make charges against earnings. For all periods presented, we have recorded no material charges against earnings other than as indicated below. Also, when it is reasonably possible that we may incur additional loss in excess of accruals and we can reasonably estimate the additional losses or range of losses, we disclose such additional reasonably possible losses in these notes.
Foam Antitrust Lawsuits
We deny all allegations in all pending antitrust proceedings. We will vigorously defend ourselves in all proceedings and believe that we have valid bases to contest all claims. However, we have established an accrual for the estimated amount that we believe is necessary to resolve all antitrust matters. We also believe, based on current facts and circumstances, it is reasonably possible that we may incur losses in excess of recorded accruals associated with the pending antitrust proceedings. For specific information regarding accruals, and reasonably possible losses in excess of accruals please see “Accruals and Reasonably Possible Losses in Excess of Accruals” below.
Beginning in August 2010, a series of civil lawsuits was initiated in several U.S. federal courts and in Canada against several defendants alleging that competitors of our carpet underlay business unit and other manufacturers of polyurethane foam products had engaged in price fixing in violation of U.S. and Canadian antitrust laws.
U.S. Direct Purchaser Class Action Cases.
We were named as a defendant in
three
pending direct purchaser class action cases (the first on November 15, 2010) on behalf of a class of all direct purchasers of polyurethane foam products. The direct purchaser class action cases were all filed in or were transferred to the U.S. District Court for the Northern District of Ohio under the name
In re: Polyurethane Foam Antitrust Litigation
, Case No. 1:10-MD-2196. The plaintiffs, on behalf of themselves and/or a class of direct purchasers, seek
three
times the amount of damages allegedly suffered as
25
LEGGETT & PLATT, INCORPORATED
NOTES TO CONSOLIDATED CONDENSED FINANCIAL STATEMENTS—(Continued)
(Unaudited)
a result of alleged overcharges in the price of polyurethane foam products from at least 1999 to the present. Each plaintiff also seeks attorney fees, pre-judgment and post-judgment interest, court costs, and injunctive relief against future violations. We filed motions to dismiss the U.S. direct purchaser class actions, for failure to state a legally valid claim, which were denied by the Ohio Court. A motion for class certification was filed on behalf of the direct purchasers. A hearing on the motion was held and the Court certified the direct purchaser class. We filed a Petition for Permission to Appeal from Class Certification Order to the United States Court of Appeals for the Sixth Circuit which was denied. The Court ordered all parties to attend non-binding mediation with a mediator of their choosing.
Settlement of U.S. Direct Purchaser Class Action Cases.
We reached a tentative settlement of the U.S. direct purchaser class action cases on August 14, 2014, by agreeing to pay an aggregate amount of
$39.8
, inclusive of plaintiff attorneys' fees and costs. We continue to deny all allegations in the cases, but settled the direct purchaser class cases to avoid the risk, uncertainty, expense and distraction of litigation. The settlement was subject to Court approval. We recorded a
$39.8
(pre-tax) accrual for the settlement in the third quarter 2014. In the fourth quarter of 2014, we paid
$4
to the Court related to the settlement. The deadline for direct purchasers to exclude themselves from the litigation and settlement classes was January 26, 2015. A final fairness hearing was held on February 3, 2015, and on February 26, 2015, the Court entered a memorandum opinion and order granting the motion for final approval of the class settlement. Subsequently, final judgments of dismissal with prejudice were entered on March 13, 2015. On March 20, 2015, an objector filed a notice of appeal of the order approving the class settlement to the Federal Circuit Court of Appeals. On March 27, 2015, the direct purchaser class plaintiffs filed a motion to dismiss or, in the alternative, transfer the appeal. On May 1, 2015, the Federal Circuit Court of Appeals denied the motion to dismiss and transferred the appeal to the United States Court of Appeals for the Sixth Circuit. We expect to make the final payment of
$35.8
to resolve this matter in the next twelve months.
U.S. Indirect Purchaser Class Action Cases.
We were named as a defendant in an indirect purchaser class consolidated amended complaint filed on March 21, 2011 and were subsequently sued in an indirect purchaser class action case filed on May 23, 2011, in the U.S. District Court for the Northern District of Ohio under the name
In re: Polyurethane Foam Antitrust Litigation
, Case No. 1:10-MD-2196. The plaintiffs, on behalf of themselves and/or a class of indirect purchasers, bring damages claims under various states’ antitrust and consumer protection statutes, and are seeking
three
times an amount of damages allegedly suffered as a result of alleged overcharges in the price of polyurethane foam products from at least 1999 to the present. Each plaintiff also seeks attorney fees, pre-judgment and post-judgment interest, court costs, and injunctive relief against future violations. We filed motions to dismiss the indirect purchaser class action, for failure to state a legally valid claim. The Ohio Court denied the motions to dismiss. Discovery is substantially complete in this case. A motion for class certification was filed on behalf of the indirect purchasers. A
hearing on the motion was held and the Court certified the indirect purchaser class. The deadline for indirect purchasers to exclude themselves from the litigation was March 13, 2015. We filed a Petition for Permission to Appeal from Class Certification Order to the United States Court of Appeals for the Sixth Circuit, which was denied. On November 18, 2014, we filed a Petition for a Writ of Certiorari in the U.S. Supreme Court, which was denied on March 2, 2015. The Ohio Court ordered all parties to attend non-binding mediation with a mediator of their choosing.
Tentative Settlement of U.S. Indirect Purchaser Class Action Cases.
We reached a tentative settlement in the U.S. Indirect Class Action cases on May 18, 2015, by agreeing to pay an amount not materially different from the amount previously accrued for this claim. We continue to deny all allegations in the cases, but settled the indirect purchaser class cases to avoid the risk, uncertainty, expense and distraction of litigation. The settlement is subject to Court approval. The Court preliminarily approved the class settlement on July 31, 2015. A final fairness hearing is scheduled for December 15, 2015. We expect to make payment of the settlement amount into escrow in the third quarter of 2015.
U.S. Individual Direct Purchaser Cases.
We have been named as a defendant in
34
pending or recently pending individual direct purchaser cases filed between March 22, 2011 and October 16, 2013, which were filed in or transferred to the U.S. District Court for the Northern District of Ohio under the name
In re: Polyurethane Foam Antitrust Litigation
, Case No. 1:10-MD-2196. Of those
34
cases, we remain a defendant in
6
cases, the remaining cases having been settled and dismissed with prejudice. None of the remaining
6
cases in which the Company remains a defendant are presently scheduled for trial. The claims in the individual direct purchaser cases are generally the same as those asserted in the direct purchaser class action case. Additionally, several individual direct purchaser plaintiffs bring state claims under individual states’ consumer protection and/or antitrust statutes in addition to their federal claims. Once pretrial practice concludes, some of the individual direct purchaser cases are scheduled to be tried in the U.S. District Court for the Northern District of Ohio and others will be remanded back to the federal district courts where the cases were originally filed for trial. Settlements reached in the individual direct purchaser cases in the aggregate, were not materially different than the previously recorded accruals allocated to the settled cases.
26
LEGGETT & PLATT, INCORPORATED
NOTES TO CONSOLIDATED CONDENSED FINANCIAL STATEMENTS—(Continued)
(Unaudited)
Kansas Restraint of Trade Act Cases.
We have been named as a defendant in
two
individual cases alleging direct and indirect purchaser claims under the Kansas Restraint of Trade Act,
one
filed on November 29, 2012 in the United States District Court of Kansas under the name Lacrosse Furniture Company v. Future Foam, Inc., et al., Case No. 12-cv-2748 KHV/JPO and the other on April 11, 2013 in the District Court of Kansas under the name Cap Carpet, Inc. v. Future Foam, Inc., Case No. 13-cv-1140-JAR-KGG. These
two
cases were previously transferred to the U.S. District Court for the Northern District of Ohio under the name
In re: Polyurethane Foam Antitrust Litigation
, Case No. 1:10-MD-2196. The claims and allegations of these plaintiffs are generally the same as the other direct and indirect purchaser plaintiffs, with the exception that the Kansas plaintiffs seek full consideration damages (their total purchase amounts for the allegedly price-fixed polyurethane foam products). On April 6, 2015, the plaintiffs in these
two
actions filed a motion for immediate remand of those actions back to the District Court of Kansas for further pretrial practice and trial. On May 5, 2015, the Ohio Court entered an order suggesting to the U.S. Judicial Panel on Multidistrict Litigation that the Kansas cases be remanded to the U.S. District Court for the District of Kansas. On May 15, 2015, the Panel remanded the cases, which are now again pending in the District of Kansas.
Canadian Class Action Cases.
We were named in
two
Canadian class action cases (for direct and indirect purchasers of polyurethane foam products), both under the name
Hi Neighbor Floor Covering Co. Limited and Hickory Springs Manufacturing Company, et.al.
in the Ontario Superior Court of Justice (Windsor), Court File Nos. CV-10-15164 (amended November 2, 2011) and CV-11-17279 (issued December 30, 2011). In each of these Canadian cases, the plaintiffs, on behalf of themselves and/or a class of purchasers, seek from over
13
defendants restitution of the amount allegedly overcharged, general and special damages in the amount of
$100
, punitive damages of
$10
, pre-judgment and post-judgment interest, and the costs of the investigation and the action. The first issued class action is on behalf of a class of purchasers of polyurethane foam. The second issued class action is on behalf of purchasers of carpet underlay. We are not yet required to file our defenses in these or any other Canadian actions. In addition, on July 10, 2012, plaintiff in a class action case (for direct and indirect purchasers of polyurethane foam products) styled
Option Consommateurs and Karine Robillard v. Produits Vitafoam Canada Limitée, et. al.
in the Quebec Superior Court of Justice (Montréal), Court File No. 500-6-524-104, filed an amended motion for authorization seeking to add us and other manufacturers of polyurethane foam products as defendants in this case, which was granted. This action has a pending motion for certification, which has been postponed indefinitely. We also were notified in June 2014 of
two
motions to add us as parties to
two
class proceedings in British Columbia. Those proceedings are similar to the Ontario proceedings in that
one
proposes a class of purchasers of polyurethane foam (
Majestic Mattress Mfg. Ltd. v. Vitafoam Products et al
., No. VLC-S-S-106362 Vancouver Registry) and
one
proposes a class of purchasers of carpet underlay (
Trillium Project Management Ltd. v. Hickory Springs Manufacturing Company et al
., No.S106213 Vancouver Registry). The motion to add us as parties to these actions was heard on April 7, 2015 and the British Columbia Supreme Court ordered our addition as parties to the
two
actions in British Columbia. The British Columbia actions involve British Columbia purchasers only whereas the Ontario actions propose classes of Canadian purchasers.
Tentative Settlement of Canadian Class Action Cases.
We reached a tentative settlement in all Canadian Class Action cases on June 12, 2015 by agreeing to pay an amount not materially different than the amount previously accrued for these claims. We continue to deny all allegations in the cases, but settled the direct and indirect purchaser class cases to avoid the risk, uncertainty, expense and distraction of litigation. The settlement is subject to Court approval. We made payment of the settlement amount into escrow.
Missouri Class Action Case.
On June 22, 2012, we were made a party to a lawsuit brought in the 16
th
Judicial Circuit Court, Jackson County, Missouri, Case Number 1216-CV15179 under the caption “
Dennis Baker, on Behalf of Himself and all Others Similarly Situated vs. Leggett & Platt, Incorporated.
” The plaintiff, on behalf of himself and/or a class of indirect purchasers of polyurethane foam products in the State of Missouri, alleged that we violated the Missouri Merchandising Practices Act based upon our alleged illegal price inflation of flexible polyurethane foam products. The plaintiff seeks unspecified actual damages, punitive damages and the recovery of reasonable attorney fees. We filed a motion to dismiss this action, which was denied. Discovery has commenced and plaintiff has filed a motion for class certification. A hearing on the motion was held, and the Court subsequently entered an order denying plaintiff's motion for
class certification on March 18, 2015. Plaintiff filed a motion for reconsideration of that order on March 30, 2015, which was also denied. Plaintiff did not timely appeal this ruling. Plaintiff intends to pursue the claims individually. A case management conference is scheduled for September 14, 2015, during which the Court and parties will discuss remaining pre-trial and trial deadlines.
27
LEGGETT & PLATT, INCORPORATED
NOTES TO CONSOLIDATED CONDENSED FINANCIAL STATEMENTS—(Continued)
(Unaudited)
Brazilian Value-Added Tax Matters
We deny all of the allegations in all of the below Brazilian actions. We believe that we have valid bases upon which to contest such actions and will vigorously defend ourselves. However, these contingencies are subject to many uncertainties, and based on current facts and circumstances, we believe that it is reasonably possible (but not probable) that we may incur losses of approximately
$17
plus interest and attorney fees of approximately
$4
with respect to these assessments. Therefore, because it is not probable we will incur a loss, no accrual has been recorded for Brazilian VAT matters. For specific information regarding accruals, and reasonably possible losses in excess of accruals please see
"Accruals and Reasonably Possible Losses in Excess of Accruals"
below.
We have
$13.1
on deposit with the Brazilian government to partially mitigate interest and penalties that may accrue while we work through these matters. If we are successful in our defense of these assessments, the deposits are refundable with interest. These deposits are recorded as a long-term asset on our balance sheet.
Brazilian Federal Cases.
On December 22, 2011, the Brazilian Finance Ministry, Federal Revenue Office issued a notice of violation against our wholly-owned subsidiary, Leggett & Platt do Brasil Ltda. (“L&P Brazil”) in the amount of
$2.3
, under Case No. 10855.724660/2011-43. The Brazilian Revenue Office claimed that for the period beginning November 2006 and continuing through December 2007, L&P Brazil used an incorrect tariff code for the collection and payment of value-added tax primarily on the sale of mattress innerspring units in Brazil. L&P Brazil responded to the notice of violation denying the violation. The Federal Revenue Office denied L&P Brazil’s defenses and upheld the assessment at the first administrative level. L&P Brazil has filed an appeal.
On December 29, 2011, L&P Brazil received another assessment in the amount of
$.1
, under case No. 10855.724509/2011-13 on the same subject matter in connection to certain import transactions carried out between 2007 and 2011. L&P Brazil has filed its defense.
On December 17, 2012, the Brazilian Revenue Office issued an additional notice of violation in the amount of
$4.0
, under MPF Case No. 10855.725260/2012-36 covering the period from January 1, 2008 through December 31, 2010 on the same subject matter. L&P Brazil responded to the notice of violation denying the violation. The Brazilian Revenue Office denied L&P Brazil's defenses and upheld the assessment at the first administrative level. L&P Brazil has appealed this decision, but the appeal was denied by the second administrative level on January 27, 2015. L&P Brazil filed a motion for clarification on March 27, 2015.
In addition, L&P Brazil received assessments on December 22, 2011, and June 26, July 2 and November 5, 2012, and September 13, 2013 from the Brazilian Federal Revenue Office where the Revenue Office challenged L&P Brazil’s use of certain tax credits in the years 2005 through 2010. Such credits are generated based upon the tariff classification and rate used by L&P Brazil for value-added tax on the sale of mattress innersprings. On September 4, 2014, the tax authorities issued
five
additional assessments regarding this same issue (use of credits), covering certain periods of 2011 and 2012. L&P Brazil has filed its defense to all of these assessments. Combined with the prior assessments, L&P Brazil has received assessments totaling
$2.7
on the same or similar denial of tax credit matters.
On February 1, 2013, the Brazilian Finance Ministry filed a Tax Collection action against L&P Brazil in the Camanducaia Judicial District Court, Case No. 0002222-35.2013.8.13.0878, alleging the untimely payment of
$.1
of social contributions (social security and social assistance payments) for the period September to October 2010. L&P Brazil filed its response, a Motion to Stay of Execution. L&P Brazil argued the payments were not required to be made because of the application of certain tax credits that were generated by L&P Brazil's use of a correct tariff code for the classification of value-added tax on the sale of mattress innersprings (i.e., the same underlying issue at stake in the other Brazilian matters).
On June 26, 2014, the Brazilian Revenue Office issued a new notice of violation against L&P Brazil in the amount of
$.8
, under Case No. 10660.721523/2014-87, covering the period from 2011 through 2012 on the same subject matter. L&P Brazil has filed its defense denying the assessments.
On July 1, 2014, the Brazilian Finance Ministry rendered a preliminary decision to reject certain offsetting requests presented by L&P Brazil, which originated with Administrative Proceeding No. 10660.720850/2014-11. The Brazilian Finance Ministry alleges that L&P Brazil improperly offset
$.1
of social contributions otherwise due in 2011. L&P Brazil filed its response denying the allegations. L&P Brazil is defending on the basis that the social contribution debts were correctly offset with certain tax credits that were generated by L&P Brazil's use of a correct tariff code classification for value-added tax on the sale of mattress innersprings (i.e., the same underlying issue at stake in the other Federal Brazilian matters).
28
LEGGETT & PLATT, INCORPORATED
NOTES TO CONSOLIDATED CONDENSED FINANCIAL STATEMENTS—(Continued)
(Unaudited)
On September 4, 2014, the Brazilian Federal Revenue issued an assessment against L&P Brazil in the amount of
$.1
, No. 10660.722021/2014-73 for the period of April 2011 through June 2012, as a penalty for L&P Brazil’s requests to offset certain tax credits. We have filed our defense.
State of S
ã
o Paulo, Brazil Cases.
L&P Brazil is party to a proceeding involving the State of S
ã
o Paulo, Brazil where the State of S
ã
o Paulo, on April 16, 2009, issued a Notice of Tax Assessment and Imposition of Fine to L&P Brazil seeking
$1.9
for the tax years 2006 and 2007, under Case No. 3.111.006 (DRT n°.04-256.169/2009). The State of S
ã
o Paulo argued that L&P Brazil was using an incorrect tariff code for the collection and payment of value-added tax on sales of mattress innerspring units in the State of S
ã
o Paulo. The Court of Tax and Fees of the State of S
ã
o Paulo ruled in favor of L&P Brazil nullifying the tax assessment. The State filed a special appeal and the Special Appeals Court remanded the case back to the Court of Tax and Fees for further findings. The Court of Tax and Fees again ruled in favor of L&P Brazil and nullified the tax assessment. The State filed another special appeal. On April 17, 2014, the Court of Tax and Fees ruled in the State's favor upholding the original assessment of
$2.0
. On July 31, 2014, L&P Brazil filed an annulment action, Case No. 101712346.2014.8260602 in the Sorocaba State Court, seeking to have the Court of Tax and Fees ruling annulled for an updated assessment amount of
$3.7
(which included interest from the original assessment date). On December 3, 2014, the State of S
ã
o Paulo filed a Tax Collection action against L&P Brazil in Sorocaba Judicial District Court, Case No. 1501115-34.2014.8.26.0602, seeking to collect the same amounts at issue in annulment action No. 101712346.2014.8260602. The updated assessment amount of
$3.7
was increased by
20%
to include attorneys' fees.
On October 4, 2012, the State of S
ã
o Paulo issued a Tax Assessment under Procedure Number 4.003.484 against L&P Brazil in the amount of
$1.5
for the tax years 2009 through 2011. Similar to the 2009 assessment, the State of S
ã
o Paulo argues that L&P Brazil was using an incorrect tax rate for the collection and payment of value-added tax on sales of mattress innerspring units in the State of S
ã
o Paulo. On June 21, 2013, the State of S
ã
o Paulo's attorneys converted the Tax Assessment No. 4.003.484 to a tax collection action against L&P Brazil in the amount of
$2.0
, under Sorocaba Judicial District Court, Case No. 3005528-50.2013.8.26.0602. L&P Brazil filed its response, a Motion to Stay of Execution denying the allegations.
L&P Brazil also received a Notice of Tax Assessment and Imposition of a Fine from the State of S
ã
o Paulo dated March 27, 2014, under Procedure Number 4.038.746-0 against L&P Brazil in the amount of
$0.9
for the tax years January 2011 through August 2012 regarding the same subject matter. L&P filed its response denying the allegations. The first administrative level denied L&P Brazil’s defense and upheld the assessment. L&P Brazil filed its appeal of this decision but the appeal was denied by the second administrative level on July 16, 2015. L&P Brazil will continue to defend against this assessment.
State of Minas Gerais, Brazil Cases.
On December 18, 2012, the State of Minas Gerais, Brazil issued a tax assessment to L&P Brazil relating to L&P Brazil's classifications of innersprings for the collection and payment of value-added tax on the sale of mattress innersprings in Minas Gerais from March 1, 2008 through August 31, 2012 in the amount of
$.5
, under PTA Case No. 01.000.182756-62. L&P Brazil filed its response denying any violation. The first administrative level ruled against us. We appealed to the second administrative level, which affirmed the first administrative level ruling. The case is now proceeding judicially under Case No. 0003673-61.2014.8.13.0878 in Camanducaia Judicial District Court for the updated amount of
$.5
. L&P Brazil filed its response, a Motion to Stay of Execution, on June 5, 2014.
Patent Infringement Claim
We deny the allegations in the below patent infringement proceedings. We believe that we have valid bases upon which to contest the remaining action and will vigorously defend ourselves. However, these contingencies are subject to many uncertainties, and based on current facts and circumstances, we believe that it is reasonably possible (but not probable) that we may incur losses with respect to these claims. Because these losses are not probable, no accrual has been recorded for the patent infringement claim. At this time, we do not expect that the outcome of this matter will have a material adverse effect on our consolidated financial condition, results of operations or cash flows. For specific information regarding accruals, and reasonably possible losses in excess of accruals please see
"Accruals and Reasonably Possible Losses in Excess of Accruals"
below.
First Lawsuit.
On January 24, 2012, in a case in the United States District Court for the Central District of California, the jury entered a verdict against us in the amount of
$5
based upon an allegation by plaintiff that we infringed
three
patents on an automatic stapling machine and on methods used to assemble boxsprings. This action was originally filed on October 4, 2010, as case number CV10-7416 RGK (SSx) under the caption Imaginal Systematic, LLC v. Leggett
29
LEGGETT & PLATT, INCORPORATED
NOTES TO CONSOLIDATED CONDENSED FINANCIAL STATEMENTS—(Continued)
(Unaudited)
& Platt, Incorporated; Simmons Bedding Company; and Does 1 through 10, inclusive. Leggett is contractually obligated to defend and indemnify Simmons Bedding Company against a claim for infringement.
On summary judgment motions, we unsuccessfully disputed each patent’s validity and denied that we infringed any patent. At the jury trial on damages issues, the plaintiff alleged damages of
$16.2
. The court denied plaintiff’s attempt to win an attorney fee award and triple the pre-verdict damages. We appealed the case to the Federal Circuit Court of Appeals. Oral argument was held before a
three
judge appeal panel in the Federal Circuit in Washington D.C. The Court of Appeals issued a judgment affirming the
$5
verdict against us, which was fully accrued for in the first quarter of 2013 and then paid in the second quarter of 2013. We filed a petition for a rehearing of the Court of Appeals decision which was denied.
The plaintiff requested royalties for post-verdict use of the machines, and requested pre-judgment interest in the amount of
$.7
. The District Court ruled that the plaintiff was not entitled to additional ongoing royalties for our continued use of the machines, but did award pre-judgment interest of
$.5
. Both parties filed a notice of appeal of this order to the Federal Circuit Court of Appeals, but plaintiff later withdrew its appeal.
We also filed reexamination proceedings in the Patent Office (Case Nos. 95/001,543 filed February 11, 2011; 95/001,546 and 95/001,547 filed February 16, 2011), challenging the validity of each patent at issue in the lawsuit the plaintiff brought. The Patent Office examiner ruled in our favor on the key claims of
one
of the
three
patents. The Patent Office examiner initially ruled in our favor on the pertinent claims of the second of the patents, but subsequently reversed that decision. With respect to the third patent, the Patent Office examiner's decision upheld the validity of all claims. All
three
of these proceedings were appealed to the Board of Patent Appeals. The plaintiff filed petitions to terminate all re-examination proceedings based on the final ruling of the Federal Circuit Court of Appeals. We opposed those petitions. The Patent Office terminated all
three
re-examination proceedings, and we requested an ex parte reexamination as to
one
of the patents. The Patent Office did not accept our request.
Second Lawsuit.
On July 29, 2013, the plaintiff filed a second lawsuit in the United States District Court for the Central District of California, Case No. CV13-05463 alleging that we and Simmons Bedding Company have continued to infringe the
three
patents on an automatic stapling machine and the methods used to assemble boxsprings, and that the plaintiff is entitled to additional damages from January 24, 2012 forward. Leggett and Simmons Bedding Company filed their answers, and the Court granted summary judgment finding that the use of an earlier version of the automatic stapling machines constituted infringement, but also finding that use of a redesigned version of the machine does not infringe any Imaginal patent. On October 17, 2014, the parties entered into a Confidential Settlement Agreement and Limited Release, whereby Leggett agreed to pay Imaginal a cash payment, which is not material to the Company, to settle the part of the case concerning the machines found to infringe and the pre-judgment interest issue from the first lawsuit. Imaginal is appealing the summary judgment ruling that the redesigned stapling machines do not infringe to the U.S. Court of Appeals for the Federal Circuit. The appeal is currently pending. Oral argument was held on July 8, 2015, and we are awaiting the Federal Circuit's ruling. We don't expect this lawsuit to materially affect our consolidated financial position, results of operations or cash flows.
Accruals and Reasonably Possible Losses in Excess of Accruals
Accruals for Probable Losses
Although the Company denies liability in all threatened or pending litigation proceedings in which it is or may be a party and believes that it has valid bases to contest all claims threatened or made against it, we have recorded a litigation contingency accrual for our reasonable estimate of probable loss for pending and threatened litigation proceedings, in aggregate, as follows:
30
LEGGETT & PLATT, INCORPORATED
NOTES TO CONSOLIDATED CONDENSED FINANCIAL STATEMENTS—(Continued)
(Unaudited)
|
|
Six Months Ended June 30,
|
Three Months Ended June 30,
|
|||||||||||||
|
|
2015
|
2014
|
2015
|
2014
|
|||||||||||
|
Contingency accrual - Beginning of period
|
$
|
83.9
|
|
$
|
3.7
|
|
$
|
82.1
|
|
$
|
3.6
|
|
|||
|
Adjustment to accruals - expense (income) - Continuing operations
|
1.5
|
|
.4
|
|
1.5
|
|
.1
|
|
|||||||
|
Adjustment to accruals - expense (income) - Discontinued operations
|
.7
|
|
—
|
|
.7
|
|
—
|
|
|||||||
|
Cash payments
|
(17.2
|
)
|
(.5
|
)
|
(15.4
|
)
|
(.1
|
)
|
|||||||
|
Contingency accrual - End of period
|
$
|
68.9
|
|
$
|
3.6
|
|
$
|
68.9
|
|
$
|
3.6
|
|
|||
We expect to pay the majority of the accrual balance within the next twelve months. At June 30, 2015, all of the above accrual was related to antitrust proceedings. The above litigation contingency accrual does not include accrued expenses related to worker's compensation, automobile, product and general liability claims, taxation issues and environmental matters, some of which may contain a portion of litigation expense. However, any litigation expense associated with these categories are not anticipated to have a material effect on our financial condition, results of operation or cash flows. For more information regarding accrued expenses, see Footnote I - Supplemental Balance Sheet Information under "Accrued expenses" in the Company's Form 10-K filed February 26, 2015.
We have relied on several facts and circumstances to conclude that some loss is probable with respect to certain proceedings and matters, to arrive at a reasonable estimate of loss or range of loss and record the accruals, including: the maturation of the pending proceedings and matters; our experience in settlement negotiations and mediation; comparative settlements of other companies in similar proceedings; discovery becoming substantially complete in certain proceedings; certain quantitative metrics used to value probable loss contingencies; and our willingness to settle certain proceedings to forgo the cost and risk of litigation and distraction to our senior executives.
Reasonably Possible Losses in Excess of Accruals
Based upon current facts and circumstances, as of June 30, 2015, aggregate reasonably possible (but not probable) losses in excess of the accruals noted above are estimated to be approximately
$38
. Although there are a number of uncertainties and potential outcomes associated with all of our pending or threatened litigation proceedings, we believe, based on current facts and circumstances, that additional losses, if any (other than approximately
$17
plus interest and attorney fees of approximately
$4
of reasonably possible losses associated with those Brazilian VAT matters disclosed above and approximately
$17
of reasonably possible losses related to antitrust, patent infringement, and other matters), are not expected to materially affect our consolidated financial position, results of operations or cash flows.
What We Do
Leggett & Platt is a diversified manufacturer, and member of the S&P 500 index, that conceives, designs, and produces a wide range of engineered components and products found in many homes, offices, automobiles, and commercial airplanes. We make components that are often hidden within, but integral to, our customers’ products.
We are the leading U.S. manufacturer of: components for residential furniture and bedding, adjustable bed bases, carpet cushion, components for office furniture, drawn steel wire, thin-walled titanium and nickel tubing for the aerospace industry, automotive lumbar support and seat suspension systems, and bedding industry machinery.
Our Segments
Our continuing operations are comprised of 18 business units in four segments, with approximately 20,000 employees, and 130 production facilities located in 19 countries around the world. Our segments are described below.
Residential Furnishings:
This segment supplies a variety of components used by bedding and upholstered furniture manufacturers in the assembly of their finished products. We also produce or distribute carpet cushion and geo components. This segment generated 48% of total sales during the first six months of 2015.
31
Commercial Products:
Operations in this segment supply chair controls, bases, and other components for office furniture manufacturers, as well as select lines of private-label finished furniture, adjustable bed bases, fashion beds, and bed frames. This segment contributed 14% of total sales in the first half of 2015.
Industrial Materials:
These operations primarily supply drawn steel wire, steel rod, steel billets, and welded steel tubing to our other operations and to external customers. Our customers use this wire and tubing to make bedding, furniture, automotive seats, mechanical springs, and many other end products. This segment generated 17% of our total sales during the first six months of 2015.
Specialized Products:
From this segment we supply lumbar support and seat suspension systems used by automotive seating manufacturers. We also produce and distribute titanium and nickel tubing for the aerospace industry, quilting and sewing equipment for bedding manufacturers, and racks, shelving and cabinets used to outfit commercial vehicles. This segment contributed 21% of our total sales in the first half of 2015.
Total Shareholder Return
Total Shareholder Return (TSR), relative to peer companies, is the key financial measure that we use to assess long-term performance. TSR is driven by the change in our share price and the dividends we pay [TSR = (Change in Stock Price + Dividends) / Beginning Stock Price]. We seek to achieve TSR in the top third of the S&P 500 over the long-term through a balanced approach that employs four TSR drivers: revenue growth, margin expansion, dividends, and share repurchases.
We monitor our TSR performance (relative to the S&P 500) on a rolling three-year basis. At June 30, for the three-year measurement period that will end on December 31, 2015, we have so far generated TSR of 31% per year on average, which placed us in the top 18% of the S&P 500, exceeding our goal over that same time frame.
Senior executives participate in a TSR-based incentive program (based on our performance compared to the performance of a group of approximately 320 peers). Business unit bonuses emphasize the achievement of higher returns on the assets under the unit’s direct control.
Customers
We serve a broad suite of customers, with our largest customer representing approximately 7% of our sales in 2014. Many are companies whose names are widely recognized. They include most producers of residential furniture and bedding, automotive and office seating manufacturers, and a variety of other companies.
Major Factors That Impact Our Business
Many factors impact our business, but those that generally have the greatest impact are market demand, raw material cost trends, and competition.
Market Demand
Market demand (including product mix) is impacted by several economic factors, with consumer confidence being most significant. Other important factors include disposable income levels, employment levels, housing turnover, and interest rates. All of these factors influence consumer spending on durable goods, and therefore affect demand for our components and products. Some of these factors also influence business spending on facilities and equipment, which impacts approximately one-quarter of our sales.
Raw Material Cost Trends
In many of our businesses, we enjoy a cost advantage from being vertically integrated into steel wire and rod. This is a benefit that our competitors do not have. We also experience favorable purchasing leverage from buying large quantities of raw materials. Still, our costs can vary significantly as market prices for raw materials (many of which are commodities) fluctuate.
We typically have short-term commitments from our suppliers; accordingly, our raw material costs generally move with the market. Our ability to recover higher costs (through selling price increases) is crucial. When we experience significant increases in raw material costs, we typically implement price increases to recover the higher costs. Conversely, when costs decrease significantly, we generally pass those lower costs through to our customers. The timing of our price increases or decreases is important; we typically experience a lag in recovering higher costs, so we also expect to realize a lag as costs decline.
32
Steel is our principal raw material. At various times in past years we have experienced significant cost fluctuations in this commodity. In most cases, the major changes (both increases and decreases) were passed through to customers with selling price adjustments. During the first half of 2015, market prices for steel scrap in the U.S. have been decreasing. This has led to downward pricing pressure on steel rod and other types of steel materials.
As a producer of steel rod, we are also impacted by volatility in metal margins (the difference in the cost of steel scrap and the market price for steel rod). Metal margins within the steel industry have been volatile during certain periods in recent years. In late 2013 and early 2014, metal margins decreased significantly as market conditions did not allow full recovery of higher scrap costs. An antidumping and countervailing duty case filed in January 2014 by major U.S. steel rod producers was concluded in December 2014, resulting in the implementation of duties on imports of Chinese steel wire rod. The antidumping duties range from 106% to 110% and the countervailing duties range from 178% to 193%. Both remain in effect through December 2019.
Our other raw materials include woven and non-woven fabrics, foam scrap, and chemicals. We have experienced changes in the cost of these materials in recent years and, in most years, have been able to pass them through to our customers.
When we raise our prices to recover higher raw material costs, this sometimes causes customers to modify their product designs and replace higher cost components with lower cost components. We must continue to find ways to assist our customers in improving the functionality and reducing the cost of their products, while providing higher margin and profit contribution for our operations.
Competition
Many of our markets are highly competitive, with the number of competitors varying by product line. In general, our competitors tend to be smaller, private companies. Many of our competitors, both domestic and foreign, compete primarily on the basis of price. Our success has stemmed from the ability to remain price competitive, while delivering product quality, innovation, and customer service.
We continue to face pressure from foreign competitors as some of our customers source a portion of their components and finished products offshore. In addition to lower labor rates, foreign competitors benefit (at times) from lower raw material costs. They may also benefit from currency factors and more lenient regulatory climates. We typically remain price competitive, even versus many foreign manufacturers, as a result of our highly efficient operations, low labor content, vertical integration in steel and wire, logistics and distribution efficiencies, and large scale purchasing of raw materials and commodities. However, we have reacted to foreign competition in certain cases by selectively adjusting prices, and by developing new proprietary products that help our customers reduce total costs.
Since 2009, there have been antidumping duty orders on innerspring imports from China, South Africa and Vietnam, ranging from 116% to 234%. In March 2014, the Department of Commerce (DOC) and the International Trade Commission (ITC) determined that the duties should be continued. In April 2014, the DOC published its final order continuing the duties through February 2019 (for China) and December 2018 (for South Africa and Vietnam).
Because of the documented evasion of antidumping orders by certain importers, typically shipping goods through third countries and falsely identifying the countries of origin, Leggett & Platt, along with several U.S. manufacturers have formed a coalition and are working with members of Congress, the DOC, and U.S. Customs and Border Protection to seek stronger enforcement of existing antidumping and/or countervailing duty orders.
Accrual for Litigation Contingencies and Reasonably Possible Losses in Excess of Accruals
Although we deny liability in all threatened or pending litigation proceedings and believe we have a valid basis to contest all claims made against us, we have recorded an aggregate litigation contingency accrual of $68.9 million. We increased the accrual by $2.2 million during the second quarter ($1.5 million in Continuing Operations and $.7 million in Discontinued Operations). We made $15.4 million in cash payments for litigation settlements during the quarter. We expect to pay most of the outstanding accrual balance in the next twelve months. At June 30, 2015, all of the accrual was related to antitrust proceedings. Based upon current facts and circumstances, aggregate reasonably possible (but not probable) losses in excess of recorded accruals for litigation contingencies (which include Brazilian VAT, antitrust, patent and other matters) is estimated to be approximately $38 million. For more information regarding our litigation contingency accruals and reasonably possible losses in excess of accruals, please refer to Note 15 on page 25 of our Notes to Consolidated Condensed Financial Statements.
33
Discontinued Operations
Some of our prior businesses, including the Store Fixtures business, are disclosed in our financial statements as discontinued operations. The Store Fixtures business was previously reported as part of the Commercial Products segment. These operations manufacture and distribute custom-designed, complete store fixture packages for major retailers, including metal and wood shelving, counters, and showcases. For more information on discontinued operations, see Note 5 to the Consolidated Condensed Financial Statements on page 9.
Change in Segment Reporting
Our reportable segments are the same as our operating segments, which also correspond with our management organizational structure. Because of the divestiture of the majority of the Store Fixtures business in late 2014, along with the retirement of the Senior Operating Vice President of the Industrial Materials segment, our management organizational structure and all related internal reporting changed during the first quarter of 2015.
The Adjustable Bed and Fashion Bed (formerly named Consumer Products) businesses were moved from Residential Furnishings to Commercial Products. The Aerospace business was moved from Industrial Materials to Specialized Products. Additionally, the Spuhl machinery operation (which produces wire forming equipment primarily for our internal use) was moved from Specialized Products to Residential Furnishings. These segment changes were retrospectively applied to all prior periods presented.
Acquisitions and Divestitures
On June 15, 2015, we divested a metal store fixtures operation in China and recorded a $2.9 million after-tax gain from the sale in discontinued operations during the second quarter.
On March 5, 2015, we acquired a 70% interest in a European private-label manufacturer of high-end upholstered furniture for office, commercial and other settings for a purchase price of $22.7 million. This business, which is included in the Work Furniture Group of our Commercial Products segment, is complementary to our North American private-label operation and allows us to support our Work Furniture customers as they expand globally. We will acquire the remaining 30% over the next five years, per the terms of our agreement, and have recorded a long-term liability of approximately $10 million for the future payments. See Note 10 to the Consolidated Condensed Financial Statements on page 17 for additional information regarding acquisitions.
Restructuring
There were no significant restructuring-related costs in the first six months of 2015 or 2014.
Future Pension Plan Distributions
We currently intend to modify our U.S. defined benefit pension plans, provide a benefit alternative to participants, and reduce pension-related operational expenses over the long-term by offering a one-time voluntary lump sum pension payment to former employees who have not yet begun to collect benefits, who meet certain eligibility criteria. These payments will reduce the size of our pension benefit obligation, and therefore reduce volatility of our contribution requirements in future years. We anticipate the payments to occur in the fourth quarter of 2015, and in our judgment, taking in account, among other things, actuarial guidance we expect to incur special non-cash pretax charges of approximately $10 million to $15 million during 2015's fourth quarter. This amount could vary significantly based upon the participant response rate, the vested benefits owed to those participants who elect to receive a lump sum payment, and the discount rate during the fourth quarter of 2015. Because these payments will be paid from plan assets, we believe this event will be neutral to the company's cash and the plan's funded status position. Although we expect to benefit from reduced operational expenses over the long-term, the lump sum payments are not expected to significantly impact future pension expense.
RESULTS OF OPERATIONS
Discussion of Consolidated Results (Continuing Operations)
The following discussion of consolidated results reflects only continuing operations. Prior year amounts have been retrospectively adjusted to reflect the reclassification of Store Fixtures to discontinued operations.
34
Second Quarter:
Earnings per share (EPS) from continuing operations were $.53, up 10% versus the $.48 per share we earned in second quarter of 2014. Current quarter earnings benefited primarily from higher unit volumes and pricing discipline, partially offset by a higher effective tax rate.
Sales grew to $997 million, a 4% increase versus the same quarter last year. Sales volume grew 9%, roughly half from same location unit volume and half from acquisitions, but was partially offset by a 5% impact from raw material-related price deflation and currency translation.
Earnings Before Interest and Taxes (EBIT) increased 17%, to $119 million, and EBIT margin improved to 12.0%, up 130 basis points from the second quarter of 2014. This improvement primarily reflects the benefit from higher sales and pricing discipline.
LIFO/FIFO and the Effect of Changing Prices
All of our segments use the first-in, first-out (FIFO) method for valuing inventory. In our consolidated financials, an adjustment is made at the corporate level (i.e., outside the segments) to convert about 50% of our inventories to the last-in, first-out (LIFO) method.
For the full year 2015, we estimate $20 million of LIFO benefit in continuing operations. This estimate incorporates certain assumptions about year-end steel prices and inventory levels. Therefore, the LIFO estimate for the full year could be significantly different from that currently estimated.
The following table contains the LIFO benefit (expense) included in continuing operations for each of the periods presented:
|
|
Six Months Ended
June 30, |
Three Months Ended
June 30, |
|||||||||||||
|
|
2015
|
2014
|
2015
|
2014
|
|||||||||||
|
LIFO benefit (expense)
|
$
|
10.0
|
|
$
|
(.4
|
)
|
$
|
5.0
|
|
$
|
(.2
|
)
|
|||
Interest Expense and Income Taxes
Second quarter 2015 interest expense was slightly higher than second quarter of 2014, primarily due to the issuance of $300 million of 10-year notes in November 2014.
The second quarter effective tax rate on continuing operations was 30%, compared to 25% for the same quarter last year. The 2014 rate benefited from $4 million of small, favorable discrete items which did not recur in 2015. We anticipate an effective tax rate on continuing operations for 2015 of about 29%. That rate is contingent upon factors such as our overall profitability, the mix of earnings among tax jurisdictions, the type of income earned, the impact of tax audits and other discrete items, and the effect of tax law changes and prudent tax planning strategies.
Discussion of Segment Results
Second Quarter Discussion
A description of the products included in each segment, along with segment financial data, appear in Note 4 of the Notes to Consolidated Condensed Financial Statements on page 7. A summary of segment results are shown in the following tables. All prior periods presented have been retrospectively adjusted to move Store Fixtures to discontinued operations and to reflect the change in segment structure discussed on page 34.
|
Net Sales (Dollar amounts in millions)
|
Three Months ended
June 30, 2015
|
Three Months ended
June 30, 2014
|
Change in Net Sales
|
% Change in
Same Location
Sales(1)
|
|||||||||||||
|
$
|
%
|
||||||||||||||||
|
Residential Furnishings
|
$
|
539.9
|
|
$
|
491.9
|
|
$
|
48.0
|
|
9.8
|
%
|
2.7
|
%
|
||||
|
Commercial Products
|
159.5
|
|
124.3
|
|
35.2
|
|
28.3
|
|
18.0
|
|
|||||||
|
Industrial Materials
|
172.3
|
|
190.2
|
|
(17.9
|
)
|
(9.4
|
)
|
(9.4
|
)
|
|||||||
|
Specialized Products
|
243.2
|
|
242.5
|
|
.7
|
|
.3
|
|
.3
|
|
|||||||
|
Total
|
1,114.9
|
|
1,048.9
|
|
66.0
|
|
6.3
|
|
|||||||||
|
Intersegment sales
|
(117.6
|
)
|
(92.8
|
)
|
(24.8
|
)
|
|||||||||||
|
External sales
|
$
|
997.3
|
|
$
|
956.1
|
|
$
|
41.2
|
|
4.3
|
%
|
(0.7
|
)%
|
||||
35
|
|
Three Months
ended
June 30,
2015
|
Three Months
ended
June 30,
2014
|
Change in EBIT
|
EBIT Margins(2)
|
||||||||||||||||
|
EBIT (Dollar amounts in millions)
|
$
|
%
|
Three Months
ended
June 30,
2015
|
Three Months
ended
June 30,
2014
|
||||||||||||||||
|
Residential Furnishings
|
$
|
51.2
|
|
$
|
49.6
|
|
$
|
1.6
|
|
3.2
|
%
|
9.5
|
%
|
10.1
|
%
|
|||||
|
Commercial Products
|
10.8
|
|
7.6
|
|
3.2
|
|
42.1
|
|
6.8
|
|
6.1
|
|
||||||||
|
Industrial Materials
|
14.8
|
|
9.0
|
|
5.8
|
|
64.4
|
|
8.6
|
|
4.7
|
|
||||||||
|
Specialized Products
|
37.7
|
|
36.4
|
|
1.3
|
|
3.6
|
|
15.5
|
|
15.0
|
|
||||||||
|
Intersegment eliminations & other
|
(.3
|
)
|
(.2
|
)
|
(.1
|
)
|
||||||||||||||
|
Change in LIFO reserve
|
5.0
|
|
(.2
|
)
|
5.2
|
|
||||||||||||||
|
Total
|
$
|
119.2
|
|
$
|
102.2
|
|
$
|
17.0
|
|
16.6
|
%
|
12.0
|
%
|
10.7
|
%
|
|||||
|
(1)
|
The change in same location sales excludes the effect of acquisitions or divestitures. These are sales that come from the same plants and facilities that we owned one year earlier.
|
|
(2)
|
Segment margins are calculated on total sales. Overall company margin is calculated on external sales.
|
Residential Furnishings
Total sales increased $48 million, or 10%. Same location sales improved 3%, with higher unit volume in most product categories, partially offset by the impact of raw material-related price deflation and currency translation. Acquisitions increased sales by 7%.
Segment EBIT increased slightly in the quarter, but EBIT margin declined, with the benefit from higher unit volume largely offset by other factors including increased performance-based compensation expense. EBIT margin also reflects the impact of higher adjustable bed pass-through sales and acquired facilities, both of which have lower than segment average margins.
Commercial Products
Second quarter total sales increased $35 million, or 28%. Same location sales grew 18%, primarily from continued strong demand in Adjustable Bed. Acquisitions increased sales by 10%.
Segment EBIT and EBIT margin increased in the second quarter primarily due to higher sales. We are rapidly expanding production capacity in our Adjustable Bed business to support continued strong demand in that category.
Industrial Materials
Total sales decreased $18 million, or 9%, due to steel-related price reductions. Unit volumes were essentially flat.
EBIT and EBIT margin increased significantly during the quarter primarily due to cost reductions and pricing discipline.
Specialized Products
Second quarter sales were flat, with volume gains in Automotive, Aerospace, and Machinery offset by currency translation impacts and volume declines in Commercial Vehicle Products.
Segment EBIT and EBIT margin grew slightly, with the benefit from higher volume largely offset by increased performance-based compensation expense and several smaller factors.
Discontinued Operations
Earnings from discontinued operations, net of tax, were $1.8 million in the second quarter of 2015, versus a loss of $92.7 million in the same quarter of 2014. Current year results include a $2.9 million gain on the sale of our metal store fixtures operation in China. Prior year results primarily reflect an impairment charge of $92.5 million (net of tax) to write off the goodwill associated with the Store Fixtures business. For further information about discontinued operations, see Note 5 of the Notes to Consolidated Condensed Financial Statements on page 9.
Six Month Discussion
A description of the products included in each segment, along with segment financial data, appear in Note 4 of the Notes to Consolidated Condensed Financial Statements on page 7. A summary of segment results are shown in the following tables. All prior periods presented have been retrospectively adjusted to move Store Fixtures to discontinued operations and to reflect the change in segment structure discussed on page 34.
36
|
Six Months ended
June 30, 2015
Net Sales
|
Six Months ended
June 30, 2014
Net Sales
|
Change in Net Sales
|
% Change in
Same Location
Sales(1)
|
||||||||||||||
|
$
|
%
|
||||||||||||||||
|
Residential Furnishings
|
$
|
1,069.4
|
|
$
|
940.3
|
|
$
|
129.1
|
|
13.7
|
%
|
6.1
|
%
|
||||
|
Commercial Products
|
300.5
|
|
240.9
|
|
59.6
|
|
24.7
|
|
17.6
|
|
|||||||
|
Industrial Materials
|
364.7
|
|
370.9
|
|
(6.2
|
)
|
(1.7
|
)
|
(1.7
|
)
|
|||||||
|
Specialized Products
|
471.7
|
|
458.4
|
|
13.3
|
|
2.9
|
|
2.9
|
|
|||||||
|
Total
|
2,206.3
|
|
2,010.5
|
|
195.8
|
|
9.7
|
|
|||||||||
|
Intersegment sales
|
(242.8
|
)
|
(178.9
|
)
|
(63.9
|
)
|
|||||||||||
|
External sales
|
$
|
1,963.5
|
|
$
|
1,831.6
|
|
$
|
131.9
|
|
7.2
|
%
|
2.3
|
%
|
||||
|
|
Six Months
ended
June 30,
2015
EBIT
|
Six Months
ended
June 30,
2014
EBIT
|
Change in EBIT
|
EBIT Margins(2)
|
||||||||||||||||
|
$
|
%
|
Six Months
ended
June 30,
2015
|
Six Months
ended
June 30,
2014
|
|||||||||||||||||
|
Residential Furnishings
|
$
|
103.3
|
|
$
|
96.4
|
|
$
|
6.9
|
|
7.2
|
%
|
9.7
|
%
|
10.3
|
%
|
|||||
|
Commercial Products
|
18.8
|
|
13.3
|
|
5.5
|
|
41.4
|
|
6.3
|
|
5.5
|
|
||||||||
|
Industrial Materials
|
22.8
|
|
16.7
|
|
6.1
|
|
36.5
|
|
6.3
|
|
4.5
|
|
||||||||
|
Specialized Products
|
77.0
|
|
64.0
|
|
13.0
|
|
20.3
|
|
16.3
|
|
14.0
|
|
||||||||
|
Intersegment eliminations & other
|
(1.0
|
)
|
(2.0
|
)
|
1.0
|
|
||||||||||||||
|
Change in LIFO reserve
|
10.0
|
|
(.4
|
)
|
10.4
|
|
||||||||||||||
|
Total
|
$
|
230.9
|
|
$
|
188.0
|
|
$
|
42.9
|
|
22.8
|
%
|
11.8
|
%
|
10.3
|
%
|
|||||
|
(1)
|
The change in same location sales excludes the effect of acquisitions or divestitures. These are sales that come from the same plants and facilities that we owned one year earlier.
|
|
(2)
|
Segment margins are calculated on total sales. Overall company margin is calculated on external sales.
|
Residential Furnishings
Total sales increased $129 million, or 14%. Same location sales increased 6%, from strong unit volume growth partially offset by raw material-related price deflation and currency translation impact.
EBIT increased $7 million, with the benefit from higher unit volume partially offset by increased performance-based compensation expense, the non-recurrence of last year's $4 million gain on sale of a building, and other smaller factors. EBIT margin declined in the current year, primarily reflecting the impact of higher adjustable bed pass-through sales and acquired innerspring facilities, both of which have lower than segment average margins.
Commercial Products
Total sales increased 25%, including the Work Furniture acquisition discussed on page 34. Same location sales increased 18%, primarily from continued strong demand in Adjustable Bed.
Segment EBIT increased $6 million and EBIT margin improved versus the prior year due to higher sales. We are rapidly expanding production capacity in our Adjustable Bed business to support continued strong demand in that category.
Industrial Materials
Total sales decreased $6 million, or 2%, with growth in Drawn Wire unit volume (driven by strong bedding demand) more than offset by steel-related price decreases.
EBIT and EBIT margin increased during the period, primarily from higher unit volume, cost reductions, and pricing discipline, partially offset by a first quarter 2015 impairment charge of $6 million related to the Steel Tubing business.
Specialized Products
Total sales grew 3%, with volume improvements in Automotive, Aerospace and Machinery, partially offset by currency translation impact and volume declines in Commercial Vehicle Products.
The segment’s EBIT and EBIT margin grew primarily due to higher volume.
37
Discontinued Operations
Earnings from discontinued operations, net of tax, were $1.3 million in six months ended June 30, 2015, versus a loss of $95.0 million in the same period of 2014. Current year results include a $2.9 million gain on the sale of our metal store fixtures operation in China. Prior year results reflect an impairment charge of $92.5 million (net of tax) to write off the goodwill associated with the Store Fixtures business. For further information about discontinued operations, see Note 5 of the Notes to Consolidated Condensed Financial Statements on page 9.
LIQUIDITY AND CAPITALIZATION
Cash from Operations
Cash from operations is our primary source of funds. Earnings and changes in working capital levels are the two broad factors that generally have the greatest impact on our cash from operations. For 2015, we expect cash from operations to exceed $350 million.
Cash from operations for the second quarter of 2015 was $95 million compared to $103 million for the second quarter of 2014. Cash from operations for the six months ended June 30, 2015 and 2014 was $127 million and $83 million, respectively. For the first six months of the year, cash from operations increased $44 million, or 52%, due to higher earnings and a smaller increase in working capital, which was primarily related to accounts receivable.
We closely monitor our working capital levels, and ended the quarter with adjusted working capital at 9.9% of annualized sales. The table below shows this non-GAAP calculation. We eliminate cash and current debt maturities from working capital to monitor our performance related to operating efficiency and believe this provides a more useful measurement. We also exclude working capital associated with discontinued operations to monitor operating performance of our ongoing businesses.
|
(Amounts in millions)
|
June 30, 2015
|
December 31,
2014
|
|||||
|
Current assets
|
$
|
1,436
|
|
$
|
1,430
|
|
|
|
Current liabilities
|
(964
|
)
|
(992
|
)
|
|||
|
Working capital
|
472
|
|
438
|
|
|||
|
Cash and cash equivalents
|
(275
|
)
|
(333
|
)
|
|||
|
Current debt maturities
|
202
|
|
202
|
|
|||
|
Less: Store Fixtures working capital
|
(4
|
)
|
(5
|
)
|
|||
|
Adjusted working capital
|
$
|
395
|
|
$
|
302
|
|
|
|
Annualized sales (1)
|
$
|
3,988
|
|
$
|
3,812
|
|
|
|
Adjusted working capital as a percent of annualized sales
|
9.9
|
%
|
7.9
|
%
|
|||
|
Working capital as a percent of annualized sales
|
11.8
|
%
|
11.5
|
%
|
|||
(1) Annualized sales equal 2nd quarter 2015 sales of $997 million and 4th quarter 2014 sales of $953 million multiplied by 4. We believe measuring our working capital against this sales metric is more useful, since efficient management of working capital includes adjusting those net asset levels to reflect current business volume.
38
Working Capital Trends
The following chart presents key working capital trends for the last five quarters. These amounts have been retrospectively adjusted to reflect only continuing operations.
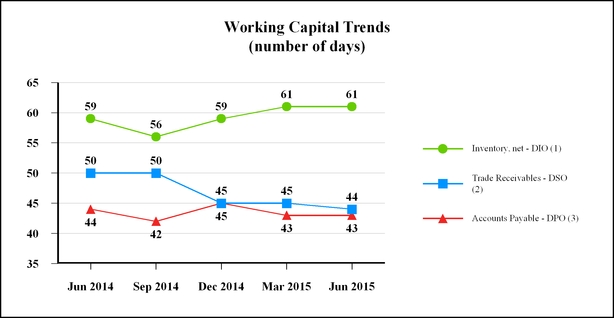
|
(Dollar amounts in millions)
|
Jun-14 (4)
|
Sep-14
|
Dec-14
|
Mar-15
|
Jun-15
|
||||||||||||||
|
Trade Receivables, net
|
$
|
528.0
|
|
$
|
539.2
|
|
$
|
470.4
|
|
$
|
482.5
|
|
$
|
486.6
|
|
||||
|
Inventory, net
|
$
|
490.5
|
|
$
|
476.5
|
|
$
|
481.4
|
|
$
|
506.0
|
|
$
|
510.8
|
|
||||
|
Accounts Payable
|
$
|
362.4
|
|
$
|
356.9
|
|
$
|
369.8
|
|
$
|
357.5
|
|
$
|
358.6
|
|
||||
|
(1)
|
The inventory ratio represents days of inventory on hand calculated as: ending net inventory ÷ (quarterly cost of goods sold ÷ number of days in the quarter).
|
|
(2)
|
The trade receivables ratio represents the days of sales outstanding calculated as: ending net trade receivables ÷ (quarterly net sales ÷ number of days in the quarter).
|
|
(3)
|
The accounts payable ratio represents the days of payables outstanding calculated as: ending accounts payable ÷ (quarterly cost of goods sold ÷ number of days in the quarter).
|
|
(4)
|
Amounts have been retrospectively adjusted to move the Store Fixtures unit to held for sale and discontinued operations in the third quarter of 2014.
|
Changes in the quarterly Days Sales Outstanding (DSO) reflect normal seasonal fluctuations due to the timing of cash collection and other factors. Changes in the DSO reflected in the table above are consistent with our historical range, and are not indicative of changes in payment trends or credit-worthiness of customers. However, over the last few years our DSO has generally decreased as a result of improved payment patterns of several large customers and other programs with incentives for early payment offered in conjunction with third parties. Payment trends by major customers remained stable in the second quarter of 2015.
Our Days Inventory on Hand (DIO) typically fluctuates within a reasonably narrow range as a result of differences in the timing of sales, production levels, and inventory purchases. Expense associated with slow moving and obsolete inventories in the second quarter of 2015 was generally in line with that of 2014.
We actively strive to optimize payment terms with our vendors, and we have also implemented various programs with our vendors and third parties that allow flexible payment options. As a result of these activities, we have increased our Days Payable Outstanding (DPO) by more than ten days over the past several years.
39
Uses of Cash
Finance Capital Requirements
Cash is readily available to fund selective growth, both internally (through capital expenditures) and externally (through acquisitions). We expect capital expenditures of approximately $120 million in 2015.
Since the recession in 2009, we have spoken about the earnings leverage from incremental volume produced utilizing excess capacity. With market share gains and higher market demand, our capacity utilization has increased. The margin improvement that we have realized over the past few years reflects, in part, that higher utilization. We still have available capacity to accommodate additional volume in many of our businesses, but there is less today than just a few quarters ago. In certain of our businesses and product lines we have little to no excess capacity, and we are investing meaningful capital dollars to support continued growth. In Automotive, we are expanding capacity to support new programs that will begin production in 2016 and later years. In Bedding, we are investing in equipment (that we build in our own Swiss operation) to support ongoing growth in Comfort Core innersprings. In Adjustable Bed, which operated a single large location just a year ago, we are adding new locations to broaden our geographic scope and expect to be operating four facilities in North America by the end of 2015. We are very pleased to be making these investments since they are directly associated with our expectation for continued growth in some of our strongest performing businesses.
We will continue to make investments to support growth in businesses and product lines where sales are strong, and for efficiency improvement and maintenance. Our incentive plans emphasize returns on capital, which include net fixed assets and working capital. This emphasis heightens the focus on asset utilization and helps insure that we are investing additional capital dollars where attractive return potential exists.
Our strategic, long-term, 4-5% annual growth objective envisions periodic acquisitions. We are seeking acquisitions primarily within our businesses designated as Grow businesses, and are looking for opportunities to enter new, higher growth markets (carefully screened for sustainable competitive advantage). We completed one acquisition in the first six months of 2015 and that business is discussed on page 34.
Pay Dividends
Dividends are one of the primary means by which we return cash to shareholders. The cash requirement for dividends in 2015 should approximate $170 million.
Maintaining and increasing the dividend remains a high priority. In May, we declared a quarterly dividend of $.31 per share. 2015 marks our 44th consecutive annual dividend increase at an average compound annual growth rate of 13%. Our targeted dividend payout is approximately 50-60% of annual net earnings. Actual payout has been higher in recent years, but as earnings grow, we expect to move into that target range.
Repurchase Stock
Share repurchases are the other means by which we return cash to shareholders. During the second quarter, we repurchased 1.2 million shares of our stock (at an average price of $48.04 per share) and issued .2 million shares through employee benefit plans and option exercises. The number of shares outstanding decreased to 136.8 million. For the full year, we currently expect to repurchase between 3 and 5 million shares and to issue approximately 2.5 million shares through employee benefit plans and option exercises.
Consistent with our stated priorities, we expect to use remaining cash (after funding capital expenditures, dividends, and competitively advantaged acquisitions) to prudently buy back our stock, subject to the outlook for the economy, our level of cash generation, and other potential opportunities to strategically grow the company. We have been authorized by the Board of Directors to repurchase up to 10 million shares each year, however no specific repurchase commitment or timetable has been established.
40
Capitalization
The following table presents Leggett’s key debt and capitalization statistics:
|
(Dollar amounts in millions)
|
June 30, 2015
|
December 31,
2014
|
|||||
|
Long-term debt outstanding:
|
|||||||
|
Scheduled maturities
|
$
|
767
|
|
$
|
767
|
|
|
|
Average interest rates (1)
|
4.0
|
%
|
4.6
|
%
|
|||
|
Average maturities in years (1)
|
6.0
|
|
6.4
|
|
|||
|
Revolving credit/commercial paper
|
65
|
|
—
|
|
|||
|
Average interest rate
|
.4
|
%
|
—
|
%
|
|||
|
Total long-term debt
|
832
|
|
767
|
|
|||
|
Deferred income taxes and other liabilities
|
238
|
|
226
|
|
|||
|
Shareholders’ equity and noncontrolling interest
|
1,110
|
|
1,155
|
|
|||
|
Total capitalization
|
$
|
2,180
|
|
|
$
|
2,148
|
|
|
Unused committed credit:
|
|||||||
|
Long-term
|
$
|
535
|
|
$
|
600
|
|
|
|
Short-term
|
—
|
|
—
|
|
|||
|
Total unused committed credit
|
$
|
535
|
|
$
|
600
|
|
|
|
Current maturities of long-term debt
|
$
|
202
|
|
$
|
202
|
|
|
|
Cash and cash equivalents
|
$
|
275
|
|
$
|
333
|
|
|
|
Ratio of earnings to fixed charges (2)
|
7.6 x
|
|
6.0 x
|
|
|||
|
(1)
|
These rates include current maturities, but exclude commercial paper to reflect the averages of outstanding debt with scheduled maturities. The rates also include amortization of interest rate swaps.
|
|
(2)
|
As presented in Exhibit 12, fixed charges include interest expense, capitalized interest, plus implied interest included in operating leases. Earnings consist principally of income from continuing operations before income taxes, plus fixed charges.
|
The next table shows the percentage of long-term debt to total capitalization, calculated in two ways:
|
•
|
Long-term debt to total capitalization as reported in the previous table.
|
|
•
|
Long-term debt to total capitalization each reduced by total cash and increased by current maturities of long-term debt.
|
We believe that adjusting this measure for cash and current maturities allows a more meaningful comparison to periods during which cash fluctuates significantly. We use these adjusted (non-GAAP) measures to monitor our financial leverage. Our long-term target is to have net debt as a percent of net capital in the 30%-40% range.
|
(Amounts in millions)
|
June 30, 2015
|
December 31,
2014
|
|||||
|
Debt to total capitalization:
|
|||||||
|
Long-term debt
|
$
|
832
|
|
$
|
767
|
|
|
|
Current debt maturities
|
202
|
|
202
|
|
|||
|
Cash and cash equivalents
|
(275
|
)
|
(333
|
)
|
|||
|
Net debt
|
$
|
759
|
|
$
|
636
|
|
|
|
Total Capitalization
|
$
|
2,180
|
|
$
|
2,148
|
|
|
|
Current debt maturities
|
202
|
|
202
|
|
|||
|
Cash and cash equivalents
|
(275
|
)
|
(333
|
)
|
|||
|
Net capitalization
|
$
|
2,107
|
|
$
|
2,017
|
|
|
|
Long-term debt to total capitalization
|
38.2
|
%
|
35.7
|
%
|
|||
|
Net debt to net capitalization
|
36.0
|
%
|
31.5
|
%
|
|||
41
Total debt (which includes long-term debt and current debt maturities) grew $65 million versus year-end 2014 levels, due entirely from an increase in commercial paper borrowing.
Short Term Borrowings
We can raise cash by issuing up to $600 million in commercial paper through a program that is backed by a $600 million revolving credit agreement with a syndicate of 12 lenders. This agreement expires in August 2019. The credit agreement allows us to issue letters of credit totaling up to $250 million. When we issue letters of credit in this manner, our capacity under the agreement, and consequently, our ability to issue commercial paper, is reduced by a corresponding amount. Amounts outstanding related to our commercial paper program were:
|
(Amounts in millions)
|
June 30, 2015
|
December 31,
2014
|
|||||
|
Total program authorized
|
$
|
600
|
|
$
|
600
|
|
|
|
Commercial paper outstanding (classified as long-term debt)
|
(65
|
)
|
—
|
|
|||
|
Letters of credit issued under the credit agreement
|
—
|
|
—
|
|
|||
|
Total program usage
|
(65
|
)
|
—
|
|
|||
|
Total program available
|
$
|
535
|
|
$
|
600
|
|
|
The average and maximum amount of commercial paper outstanding during the second quarter of 2015 was $22 million and $65 million, respectively. At quarter end, we had no letters of credit outstanding under the credit agreement, but we had $76 million of stand-by letters of credit outside the agreement to take advantage of more attractive fee pricing.
We have $200 million of 5.0% notes that mature in August 2015. With our commercial paper program, cash on hand, and cash from operations, and our ability to issue debt in the capital markets, we believe we have sufficient funds available to repay maturing debt, as well as support our ongoing operations, pay dividends, fund future growth, and repurchase stock.
Accessibility of Cash
At June 30, 2015 we had cash and cash equivalents of $275 million primarily invested in interest-bearing bank accounts and in bank time deposits with original maturities of three months or less.
A substantial portion of these funds are held in the international accounts of our foreign operations. Though we do not rely on this foreign cash as a source of funds to support our ongoing domestic liquidity needs, we believe we could bring most of this cash back to the U.S. over a period of two to three years without material cost. However, due to capital requirements in various jurisdictions, approximately $60 million of this cash is currently inaccessible for repatriation. Additionally, if we had to bring all foreign earnings back immediately in the form of dividends, we would incur incremental tax expense of up to approximately $96 million. During the first two quarters of 2015 and for the full year 2014, we brought back $40 million and $129 million (respectively) of cash, in each case at little to no added tax cost.
NEW ACCOUNTING GUIDANCE
In April 2015, the Financial Accounting Standards Board (FASB) issued Accounting Standard Update 2015-03, Simplifying the Presentation of Debt Issuance Costs, which requires those costs to be presented in the balance sheet as a direct deduction from the associated debt liability. We will adopt this guidance on January 1, 2016, and we do not believe it will have a material impact on our future financial statements.
In May 2014, the FASB issued new authoritative literature, Revenue from Contracts with Customers, which supersedes much of the existing authoritative literature for revenue recognition. This guidance will be effective January 1, 2018. We are currently evaluating the newly issued guidance and the impact on our future financial statements.
QUANTITATIVE AND QUALITATIVE DISCLOSURES ABOUT MARKET RISK
Interest rate
Substantially all of our debt is denominated in United States dollars. The fair value for fixed rate debt was greater than its $950 million carrying value by $6 million at June 30, 2015 and was not significantly different from its $950 million carrying value at December 31, 2014. The fair value of fixed rate debt at June 30, 2015 and December 31, 2014 was valued using discounted cash flow and secondary market rates provided by Bloomberg. The fair value of variable rate debt is not significantly different from its recorded amount.
42
Investment in Foreign Subsidiaries
We view our investment in foreign subsidiaries as a long-term commitment, and do not hedge translation exposures. The investment in a foreign subsidiary may take the form of either permanent capital or notes. Our net investment (i.e., total assets less total liabilities subject to translation exposure) in foreign subsidiaries was $886 million at June 30, 2015, compared to $894 million at December 31, 2014.
FORWARD-LOOKING STATEMENTS
This Quarterly Report on Form 10-Q and our other public disclosures, whether written or oral, may contain “forward-looking” statements including, but not limited to: projections of revenue, income, earnings, capital expenditures, dividends, capital structure, cash flows or other financial items; possible plans, goals, objectives, prospects, strategies or trends concerning future operations; statements concerning future economic performance; possible goodwill or other asset impairment; and the underlying assumptions relating to the forward-looking statements. These statements are identified either by the context in which they appear or by use of words such as “anticipate,” “believe,” “estimate,” “expect,” “intend,” “may,” “plan,” “project,” “should” or the like. All such forward-looking statements, whether written or oral, and whether made by us or on our behalf, are expressly qualified by the cautionary statements described in this provision.
Any forward-looking statement reflects only the beliefs of the Company or its management at the time the statement is made. Because all forward-looking statements deal with the future, they are subject to risks, uncertainties and developments which might cause actual events or results to differ materially from those envisioned or reflected in any forward-looking statement. Moreover, we do not have, and do not undertake, any duty to update or revise any forward-looking statement to reflect events or circumstances after the date on which the statement was made. For all of these reasons, forward-looking statements should not be relied upon as a prediction of actual future events, objectives, strategies, trends or results.
Readers should review Item 1A Risk Factors in our Form 10-K, filed February 26, 2015 and in this Form 10-Q for a description of important factors that could cause actual events or results to differ materially from forward-looking statements. It is not possible to anticipate and list all risks, uncertainties and developments which may affect the future operations or performance of the Company, or which otherwise may cause actual events or results to differ materially from forward-looking statements. However, the known, material risks and uncertainties include the following:
|
•
|
factors that could affect the industries or markets in which we participate, such as growth rates and opportunities in those industries;
|
|
•
|
adverse changes in inflation, currency, political risk, U.S. or foreign laws or regulations (including tax law changes), consumer sentiment, housing turnover, employment levels, interest rates, trends in capital spending and the like;
|
|
•
|
factors that could impact raw materials and other costs, including the availability and pricing of steel scrap and rod and other raw materials, the availability of labor, wage rates and energy costs;
|
|
•
|
our ability to pass along raw material cost increases through increased selling prices;
|
|
•
|
price and product competition from foreign (particularly Asian and European) and domestic competitors;
|
|
•
|
our ability to improve operations and realize cost savings (including our ability to fix under-performing operations and to generate future earnings from restructuring-related activities);
|
|
•
|
our ability to maintain profit margins if our customers change the quantity and mix of our components in their finished goods;
|
|
•
|
our ability to realize 25-35% contribution margin on incremental unit volume growth;
|
|
•
|
our ability to achieve expected levels of cash flow;
|
|
•
|
our ability to maintain and grow the profitability of acquired companies;
|
|
•
|
our ability to maintain the proper functioning of our internal business processes and information systems and avoid modification or interruption of such systems, through cyber-security breaches or otherwise;
|
|
•
|
a decline in the long-term outlook for any of our reporting units that could result in asset impairment;
|
|
•
|
the loss of one or more of our significant customers; and
|
|
•
|
litigation accruals related to various contingencies including antitrust, intellectual property, product liability and warranty, taxation, environmental and workers’ compensation expense.
|
See the “Quantitative and Qualitative Disclosures About Market Risk” section under Item 2, Management’s Discussion and Analysis of Financial Condition and Results of Operations.
43
An evaluation as of June 30, 2015 was carried out by the Company’s management, with participation of the Company’s Chief Executive Officer and Chief Financial Officer, of the effectiveness of the Company’s disclosure controls and procedures (as defined in Rule 13a-15(e) under the Securities Exchange Act of 1934, as amended (the “Exchange Act”)). Based upon this evaluation, the Chief Executive Officer and Chief Financial Officer have concluded the Company’s disclosure controls and procedures are effective, as of June 30, 2015, to provide assurance that information required to be disclosed by the Company in the reports that it files or submits under the Exchange Act, is recorded, processed, summarized, and reported within the time periods specified by the Securities and Exchange Commission’s rules and forms. Disclosure controls and procedures include, without limitation, controls and procedures designed to ensure that information required to be disclosed by the Company in the reports that it files or submits under the Exchange Act is accumulated and communicated to the Company’s management, including its Chief Executive Officer and Chief Financial Officer, or persons performing similar functions, as appropriate to allow timely decisions regarding required disclosure.
There was no change in the Company’s internal control over financial reporting that occurred during the quarter ending June 30, 2015 that has materially affected, or is reasonably likely to materially affect, the Company’s internal control over financial reporting.
44
The information in Note 15 beginning on page 25 of our Notes to Consolidated Condensed Financial Statements is incorporated into this section by reference.
Environmental Matter Involving Potential Monetary Sanctions
On March 27, 2013, Region 5 of the U.S. Environmental Protection Agency (EPA) issued a Notice of Violation/Finding of Violation ("NOV/FOV") alleging that our subsidiary, Sterling Steel Company, violated the Clean Air Act and the Illinois State Implementation Plan currently in place. Sterling operates a steel rod mill in Sterling, Illinois. The NOV/FOV alleges that Sterling, since 2008, has exceeded the allowable annual particulate matter and manganese emission limits for its arc furnace. Sterling requested a conference with the EPA to discuss the alleged violations. The conference was held on May 20, 2013.
On July 23, 2013, the EPA issued a Finding of Violation alleging that Sterling violated the opacity limitations of its air permit and Federal and state regulations. A conference to discuss the Finding of Violation occurred in the third quarter of 2013.
There had been no material updates with respect to these matters until mid-July 2015 when the Company learned from counsel for the EPA that the matters had been referred to the U.S. Department of Justice (DOJ). To date, we have not been contacted by the DOJ. Sterling intends to vigorously defend these matters in any enforcement action that may be pursued by the EPA or DOJ. The EPA did not specify any amount of penalty or injunctive relief being sought in the NOV/FOV, Finding of Violation or in any conference. Any settlement or adverse finding could result in the payment by Sterling of fines, penalties, capital expenditures, or some combination thereof. Although the outcome of these matters cannot be predicted with certainty, we do not expect them, either individually or in the aggregate, to have a material adverse effect on our financial position, cash flows or results of operations.
Leggett's Claim for Alleged Antitrust Violations
On October 17, 2008, the Company, along with Carpenter Co., Flexible Foam Products, Inc., Foam Supplies, Inc., Hickory Springs Manufacturing Company, J.M. Huber Corporation, Lubrizol Advanced Materials, Inc., The Sherwin-Williams Company, Skypark Manufacturing, LLC, Vitafoam Incorporated; and their respective affiliates, as plaintiffs, filed a complaint in the United States District Court for the District of New Jersey under the caption Carpenter Co., et al. v. BASF SE, et al., Case No. 2:08-cv-05169 against BASF Corporation, The Dow Chemical Company, Huntsman International LLC, Lyondell Chemical Company, and their affiliates, alleging that defendants conspired to fix prices and allocate customers and markets for certain polyurethane foam products. The Company previously settled its claims against certain defendants for immaterial amounts and all other defendants have been dismissed except for The Dow Chemical Company.
The Company, along with co-plaintiffs, seeks to recover three times the amount of damages suffered as a result of the alleged overcharges in the price of the polyurethane foam products purchased from the defendant from at least 1994 through at least 2004. The plaintiffs also seek attorney fees, pre-judgment interest and injunctive relief. The defendant denies the claims. Based on the maturation of the proceeding, our experience in settlement negotiations and mediation, discovery becoming substantially complete, and the anticipated trial date in early 2016, the Company now believes that it is reasonably likely that it may recover material damages from the defendant. However, because of uncertainties, the Company cannot estimate the amount of recovery. Also, because of these uncertainties, it is possible that the Company may recover only an immaterial amount of the alleged damages, or recover no damages at all.
Our 2014 Annual Report on Form 10-K filed February 26, 2015 includes a detailed discussion of our risk factors in Item 1A “Risk Factors.” The information presented below updates and should be read in conjunction with the risk factors and information disclosed in that Form 10-K.
Investing in our securities involves risk. Set forth below and elsewhere in this report are risk factors that could cause actual results to differ materially from the results contemplated by the forward-looking statements contained in this report. We may amend or supplement these risk factors from time to time by other reports we file with the SEC.
45
We are exposed to contingencies related to certain antitrust proceedings that, if realized, could have a material negative impact on our financial condition, results of operations and cash flows.
We previously disclosed that we are a party to a series of civil antitrust lawsuits involving the sale of polyurethane foam products. We continue to deny all allegations in all of the cases, but have settled some of these cases to avoid the risk, uncertainty, expense and distraction of litigation. We remain a defendant in various other antitrust cases involving the sale of polyurethane foam. We will vigorously defend ourselves and believe that we have valid bases to contest all claims. We have established an aggregate litigation contingency accrual in the amount of $68.9 million. At June 30, 2015, all of the accrual was related to foam antitrust proceedings. We also believe, based on current facts and circumstances that aggregate reasonably possible (but not probable) losses in excess of accruals for litigation contingencies (which include Brazilian VAT, antitrust, patent and other matters) are estimated to be approximately $38 million.
If our assumptions or analyses regarding these contingencies are incorrect, or if facts or circumstances change, we could realize loss greater than the recorded accruals, and greater than our estimate of reasonably possible losses in excess of the recorded accruals. These losses could have a material negative impact on our financial condition, results of operations and cash flows. For more information regarding our litigation contingency accruals and reasonably possible losses in excess of accruals, See Note 15 “Contingencies” on page 25 of the Notes to Consolidated Condensed Financial Statements.
Our goodwill and other long-lived assets are subject to potential impairment which could negatively impact our earnings.
A significant portion of our assets consists of goodwill and other long-lived assets, the carrying value of which may be reduced if we determine that those assets are impaired. If actual results differ from the assumptions and estimates used in the goodwill and long-lived asset valuation calculations, we could incur impairment charges, which could negatively impact our earnings.
|
(Dollar amounts in millions)
|
June 30,
2015 Book Value
|
% of Total
Assets
|
||||
|
Goodwill
|
$
|
822.7
|
|
|||
|
Other intangibles
|
207.0
|
|
||||
|
Total goodwill and other intangibles
|
$
|
1,029.7
|
|
33
|
%
|
|
|
Net property, plant and equipment
|
$
|
538.6
|
|
|||
|
Other long-lived assets
|
139.2
|
|
||||
|
Total net property, plant and equipment and other long- lived assets
|
$
|
677.8
|
|
22
|
%
|
|
We review our eleven reporting units for potential goodwill impairment in June as part of our annual goodwill impairment testing, and more often if an event or circumstance occurs making it likely that impairment exists. In addition, we test for the recoverability of long-lived assets at year end, and more often if an event or circumstance indicates the carrying value may not be recoverable. We conduct impairment testing based on our current business strategy in light of present industry and economic conditions, as well as future expectations.
The 2015 goodwill impairment review performed in the second quarter of 2015 indicated no goodwill impairments.
As discussed in Note 4, our internal management organizational structure and all related internal reporting changed during the first quarter of 2015. We reassigned the assets and liabilities of the reporting units affected, and also reassigned goodwill using a relative fair value approach for our first quarter 2015 reporting. We performed the 2015 impairment test utilizing the revised structure.
The Steel Tubing unit met the held for sale criteria during the first quarter of 2015, and is not reflected in the table below. Because fair value less costs to sell had fallen below recorded book value, we fully impaired this unit's goodwill and incurred a $4.1 million goodwill impairment charge in the first quarter of 2015. We also incurred a long-lived asset impairment charge of $1.4 million related to this business in the first quarter of 2015.
The fair values of reporting units in relation to their respective carrying values and significant assumptions used in the June 2015 review are presented in the table below. If actual results differ from estimates used in these calculations, we could incur future impairment charges.
46
|
Excess of Fair Value over Carrying Value as a Percentage of Fair Value
|
June 30, 2015
Goodwill Value
|
10-year
Compound
Annual Growth
Rate Range for Sales
|
Terminal
Values Long-
term Growth
Rate for Debt-Free Cash Flow
|
Discount Rate
Ranges
|
||||||||
|
< 25%
|
$
|
—
|
|
—
|
|
—
|
|
—
|
|
|||
|
25% - 49%
|
—
|
|
—
|
|
—
|
|
—
|
|
||||
|
50% - 74%
|
598.5
|
|
.6% - 7.0%
|
|
3.0
|
%
|
8.0% - 12.5%
|
|
||||
|
75%+
|
224.2
|
|
3.1% - 10.9%
|
|
3.0
|
%
|
8.0% - 9.0%
|
|
||||
|
$
|
822.7
|
|
.6% - 10.9%
|
|
3.0
|
%
|
8.0% - 12.5%
|
|
||||
We performed our 2014 annual goodwill impairment review in June 2014, and on July 14, 2014, concluded that an impairment charge of $108 million was required for our Store Fixtures group, which is now reported in Discontinued Operations and was previously part of the Commercial Products segment. No long-lived asset impairments (excluding goodwill) were indicated during this review.
Issuer Purchases of Equity Securities
The table below is a listing of our purchases of the Company’s common stock by calendar month during the second quarter of 2015.
|
Period
|
Total
Number of
Shares
Purchased
(1)
|
Average
Price
Paid
per
Share
|
Total
Number of
Shares
Purchased
as Part of
Publicly
Announced
Plans or
Programs
(2)
|
Maximum
Number of
Shares that
may yet be
Purchased
Under the
Plans or
Programs
(2)
|
||||||||
|
April 2015
|
1,798
|
|
$
|
44.56
|
|
3
|
|
8,997,120
|
|
|||
|
May 2015
|
427,162
|
|
$
|
46.92
|
|
416,715
|
|
8,580,405
|
|
|||
|
June 2015
|
771,897
|
|
$
|
48.71
|
|
771,897
|
|
7,808,508
|
|
|||
|
Total
|
1,200,857
|
|
$
|
48.07
|
|
1,188,615
|
|
|||||
|
(1)
|
This number includes 12,242 shares which were not repurchased as part of a publicly announced plan or program, all of which were outstanding shares surrendered to exercise stock options. It does not include shares withheld for taxes in option exercises and stock unit conversions during the quarter.
|
|
(2)
|
On August 4, 2004, the Board authorized management to repurchase up to 10 million shares each calendar year beginning January 1, 2005. This standing authorization was first reported in the quarterly report on Form 10-Q for the period ended June 30, 2004, filed August 5, 2004, and shall remain in force until repealed by the Board of Directors.
|
47
|
ITEM 6.
|
EXHIBITS
|
|
Exhibit
|
||
|
Exhibit 10.1*
|
-
|
Summary Sheet of Director Compensation.
|
|
Exhibit 10.2
|
-
|
The Company's Flexible Stock Plan, Amended and Restated Effective as of May 5, 2015, filed March 25, 2015 as Appendix A to the Company's Proxy Statement, is incorporated by reference. (SEC File No. 001-07845)
|
|
Exhibit 10.3
|
-
|
The Company's Discount Stock Plan, as amended and restated in its entirety on May 5, 2015, filed March 25, 2015 as Appendix B to the Company's Proxy Statement, is incorporated by reference. (SEC File No. 001-07845)
|
|
Exhibit 12*
|
-
|
Computation of Ratio of Earnings to Fixed Charges.
|
|
Exhibit 31.1*
|
-
|
Certification of David S. Haffner, pursuant to Rule 13a-14(a), as adopted pursuant to Section 302 of the Sarbanes-Oxley Act of 2002, dated August 5, 2015.
|
|
Exhibit 31.2*
|
-
|
Certification of Matthew C. Flanigan, pursuant to Rule 13a-14(a), as adopted pursuant to Section 302 of the Sarbanes-Oxley Act of 2002, dated August 5, 2015.
|
|
Exhibit 32.1*
|
-
|
Certification of David S. Haffner, pursuant to 18 U.S.C. Section 1350, as adopted pursuant to Section 906 of the Sarbanes-Oxley Act of 2002, dated August 5, 2015.
|
|
Exhibit 32.2*
|
-
|
Certification of Matthew C. Flanigan, pursuant to 18 U.S.C. Section 1350, as adopted pursuant to Section 906 of the Sarbanes-Oxley Act of 2002, dated August 5, 2015.
|
|
Exhibit 101.INS**
|
-
|
XBRL Instance Document.
|
|
Exhibit 101.SCH**
|
-
|
XBRL Taxonomy Extension Schema.
|
|
Exhibit 101.CAL**
|
-
|
XBRL Taxonomy Extension Calculation Linkbase.
|
|
Exhibit 101.DEF**
|
-
|
XBRL Taxonomy Extension Definition Linkbase.
|
|
Exhibit 101.LAB**
|
-
|
XBRL Taxonomy Extension Label Linkbase.
|
|
Exhibit 101.PRE**
|
-
|
XBRL Taxonomy Extension Presentation Linkbase.
|
|
*
|
Denotes filed herewith.
|
|
**
|
Filed as Exhibit 101 to this report are the following formatted in XBRL (eXtensible Business Reporting Language):
|
|
(i) Consolidated Condensed Balance Sheets at June 30, 2015 and December 31, 2014; (ii) Consolidated Condensed Statements of Operations for the three months and six months ended June 30, 2015 and June 30, 2014; (iii) Consolidated Condensed Statements of Comprehensive Income (Loss) for the three months and six months ended June 30, 2015 and June 30, 2014; (iv) Consolidated Condensed Statements of Cash Flows for the six months ended June 30, 2015 and June 30, 2014; and (v) Notes to Consolidated Condensed Financial Statements.
|
|
48
SIGNATURES
Pursuant to the requirements of the Securities Exchange Act of 1934, the Registrant has duly caused this report to be signed on its behalf by the undersigned thereunto duly authorized.
|
|
|
LEGGETT & PLATT, INCORPORATED
|
||
|
DATE: August 5, 2015
|
|
By:
|
|
/s/ DAVID S. HAFFNER
|
|
|
|
David S. Haffner
Board Chair and Chief Executive Officer
|
||
|
DATE: August 5, 2015
|
|
By:
|
|
/s/ MATTHEW C. FLANIGAN
|
|
|
|
Matthew C. Flanigan
Executive Vice President and Chief Financial Officer
|
||
EXHIBIT INDEX
|
Exhibit
|
||
|
Exhibit 10.1*
|
Summary Sheet of Director Compensation.
|
|
|
Exhibit 10.2
|
-
|
The Company's Flexible Stock Plan, Amended and Restated Effective as of May 5, 2015, filed March 25, 2015 as Appendix A to the Company's Proxy Statement, is incorporated by reference. (SEC File No. 001-07845)
|
|
Exhibit 10.3
|
-
|
The Company's Discount Stock Plan, as amended and restated in its entirety on May 5, 2015, filed March 25, 2015 as Appendix B to the Company's Proxy Statement, is incorporated by reference. (SEC File No. 001-07845)
|
|
Exhibit 12*
|
Computation of Ratio of Earnings to Fixed Charges.
|
|
|
Exhibit 31.1*
|
Certification of David S. Haffner, pursuant to Rule 13a-14(a), as adopted pursuant to Section 302 of the Sarbanes-Oxley Act of 2002, dated August 5, 2015.
|
|
|
Exhibit 31.2*
|
Certification of Matthew C. Flanigan, pursuant to Rule 13a-14(a), as adopted pursuant to Section 302 of the Sarbanes-Oxley Act of 2002, dated August 5, 2015.
|
|
|
Exhibit 32.1*
|
Certification of David S. Haffner, pursuant to 18 U.S.C. Section 1350, as adopted pursuant to Section 906 of the Sarbanes-Oxley Act of 2002, dated August 5, 2015.
|
|
|
Exhibit 32.2*
|
Certification of Matthew C. Flanigan, pursuant to 18 U.S.C. Section 1350, as adopted pursuant to Section 906 of the Sarbanes-Oxley Act of 2002, dated August 5, 2015.
|
|
|
Exhibit 101.INS**
|
XBRL Instance Document.
|
|
|
Exhibit 101.SCH**
|
XBRL Taxonomy Extension Schema.
|
|
|
Exhibit 101.CAL**
|
XBRL Taxonomy Extension Calculation Linkbase.
|
|
|
Exhibit 101.DEF**
|
XBRL Taxonomy Extension Definition Linkbase.
|
|
|
Exhibit 101.LAB**
|
XBRL Taxonomy Extension Label Linkbase.
|
|
|
Exhibit 101.PRE**
|
XBRL Taxonomy Extension Presentation Linkbase.
|
|
|
*
|
Denotes filed herewith.
|
|
**
|
Filed as Exhibit 101 to this report are the following formatted in XBRL (eXtensible Business Reporting Language):
|
|
(i) Consolidated Condensed Balance Sheets at June 30, 2015 and December 31, 2014; (ii) Consolidated Condensed Statements of Operations for the three months and six months ended June 30, 2015 and June 30, 2014; (iii) Consolidated Condensed Statements of Comprehensive Income (Loss) for the three months and six months ended June 30, 2015 and June 30, 2014; (iv) Consolidated Condensed Statements of Cash Flows for the six months ended June 30, 2015 and June 30, 2014; and (v) Notes to Consolidated Condensed Financial Statements.
|
|
TABLE OF CONTENTS
Part I. Financial InformationItem 1. Financial StatementsItem 2. Management S Discussion and Analysis Of Financial Condition and Results Of OperationsItem 3. Quantitative and Qualitative Disclosures About Market RiskItem 4. Controls and ProceduresPart II. Other InformationItem 1. Legal ProceedingsItem 1A. Risk FactorsItem 2. Unregistered Sales Of Equity Securities and Use Of ProceedsItem 6. Exhibits