LENNAR CORP /NEW/
10-Ks and 10-Qs
|
|
|
|
|
|
|
|
|
|
|
|
|
|
|
|
|
|
|
|
|
|
|
|
|
|
|
|
|
|
|
|
|
|
|
|
|
|
|
|
|
|
|
|
|
|
|
|
|
|
|
|
|
|
|
|
|
|
|
UNITED STATES
SECURITIES AND EXCHANGE COMMISSION
Washington, D.C. 20549
FORM 10-K
ANNUAL REPORT PURSUANT TO SECTION 13 OR 15(d) OF
THE SECURITIES EXCHANGE ACT OF 1934
For the fiscal year ended
November 30, 2014
Commission file number 1-11749

Lennar Corporation
(Exact name of registrant as specified in its charter)
|
Delaware
|
95-4337490
|
|
|
(State or other jurisdiction of
incorporation or organization)
|
(I.R.S. Employer
Identification No.)
|
|
700 Northwest 107th Avenue, Miami, Florida 33172
(Address of principal executive offices) (Zip Code)
Registrant’s telephone number, including area code (305) 559-4000
Securities registered pursuant to Section 12(b) of the Act:
|
Title of each class
|
Name of each exchange on which registered
|
|
|
Class A Common Stock, par value 10¢
|
New York Stock Exchange
|
|
|
Class B Common Stock, par value 10¢
|
New York Stock Exchange
|
|
Securities registered pursuant to Section 12(g) of the Act:
NONE
Indicate by check mark if the registrant is a well-known seasoned issuer, as defined in Rule 405 of the Securities Act. YES
ý
NO
¨
Indicate by check mark if the registrant is not required to file reports pursuant to Section 13 or Section 15(d) of the Act. YES
¨
NO
ý
Indicate by check mark whether the registrant (1) has filed all reports required to be filed by Section 13 or 15(d) of the Securities Exchange Act of 1934 during the preceding 12 months (or for such shorter period that the registrant was required to file such reports), and (2) has been subject to such filing requirements for the past 90 days. YES
ý
NO
¨
Indicate by check mark whether the registrant has submitted electronically and posted on its corporate Website, if any, every Interactive Data File required to be submitted and posted pursuant to Rule 405 of Regulation S-T during the preceding 12 months (or for such shorter period that the registrant was required to submit and post such files). YES
ý
NO
¨
Indicate by check mark if disclosure of delinquent filers pursuant to Item 405 of Regulation S-K is not contained herein, and will not be contained, to the best of registrant’s knowledge, in definitive proxy or information statements incorporated by reference in Part III of this Form 10-K or any amendment to this Form 10-K.
ý
Indicate by check mark whether the registrant is a large accelerated filer, an accelerated filer, a non-accelerated filer, or a smaller reporting company. See definition of “large accelerated filer,” “accelerated filer” and “smaller reporting company” in Rule 12b-2 of the Exchange Act.
|
Large accelerated filer
ý
|
Accelerated filer
¨
|
Non-accelerated filer
¨
|
Smaller reporting company
¨
|
|
(Do not check if a smaller reporting company)
|
|||
Indicate by check mark whether the registrant is a shell company (as defined in Rule 12b-2 of the Act). YES
¨
NO
ý
The aggregate market value of the registrant’s Class A and Class B common stock held by non-affiliates of the registrant (
168,333,343
shares of Class A common stock and
9,705,207
shares of Class B common stock) as of May 31, 2014, based on the closing sale price per share as reported by the New York Stock Exchange on such date, was
$7,219,372,214
.
As of November 30,
2014
, the registrant had outstanding
173,736,150
shares of Class A common stock and
31,303,195
shares of Class B common stock.
DOCUMENTS INCORPORATED BY REFERENCE:
|
Related Section
|
Documents
|
|
III
|
Definitive Proxy Statement to be filed pursuant to Regulation 14A on or before March 30, 2015.
|
|
Item 1.
|
Business
|
Overview of Lennar Corporation
We are one of the nation’s largest homebuilders, a provider of real estate related financial services, a commercial real estate investment, investment management and finance company through our Rialto segment and a developer of multifamily rental properties in select U.S. markets primarily through unconsolidated entities.
Our homebuilding operations are the most substantial part of our business, comprising
$7.0 billion
in revenues, or approximately
90%
of consolidated revenues in fiscal 2014. We have grouped our homebuilding activities into five reportable segments, which we refer to as Homebuilding East, Homebuilding Central, Homebuilding West, Homebuilding Southeast Florida and Homebuilding Houston. Information about homebuilding activities in states in which our homebuilding activities are not economically similar to those in other states in the same geographic area is grouped under “Homebuilding Other.” Our reportable homebuilding segments and Homebuilding Other have operations located in:
East:
Florida
(1)
, Georgia, Maryland, New Jersey, North Carolina, South Carolina and Virginia
Central:
Arizona, Colorado and Texas
(2)
West:
California and Nevada
Southeast Florida
: Southeast Florida
Houston
: Houston, Texas
Other:
Illinois, Minnesota, Tennessee, Oregon and Washington
|
(1)
|
Florida in the East reportable segment excludes Southeast Florida, which is its own reportable segment.
|
|
(2)
|
Texas in the Central reportable segment excludes Houston, Texas, which is its own reportable segment.
|
Our other reportable segments are Lennar Financial Services, Rialto and Lennar Multifamily.
For financial information about our Homebuilding, Lennar Financial Services, Rialto and Lennar Multifamily operations, you should review Management’s Discussion and Analysis of Financial Condition and Results of Operations, which is Item 7 of this Report, and our consolidated financial statements and the notes to our consolidated financial statements, which are included in Item 8 of this Report.
A Brief History of Our Company
We are a national homebuilder that operates in various states with deliveries of
21,003
new homes in
2014
. Our company was founded as a local Miami homebuilder in 1954. We completed our initial public offering in 1971 and listed our common stock on the New York Stock Exchange in 1972. During the 1980s and 1990s, we entered and expanded operations in a number of homebuilding markets, including California, Florida and Texas, through both organic growth and acquisitions, such as Pacific Greystone Corporation in 1997. In 1997, we completed the spin-off of our then commercial real estate business, LNR Property Corporation. In 2000, we acquired U.S. Home Corporation, which expanded our operations into New Jersey, Maryland, Virginia, Minnesota and Colorado and strengthened our position in other states. From 2002 through 2005, we acquired several regional homebuilders, which brought us into new markets and strengthened our position in several existing markets. From 2010 through 2013, we started and expanded our homebuilding operations in the Atlanta, Oregon, Seattle and Nashville markets. More recently, we have been strengthening and expanding our competitive position through the development of land that was strategically purchased at favorable prices during the real estate market downturn, and through a focus on our ancillary and complementary platforms, including Rialto, Lennar Multifamily and FivePoint, a consolidated joint venture that was formed to manage master planned mixed use developments.
Homebuilding Operations
Overview
Our homebuilding operations include the construction and sale of single-family attached and detached homes, as well as the purchase, development and sale of residential land directly and through unconsolidated entities in which we have investments. We primarily sell single-family attached and detached homes in communities targeted to first-time, move-up and active adult homebuyers. We operate primarily under the Lennar brand name. Our homebuilding mission is focused on the profitable development of these residential communities. Key elements of our strategy include:
|
•
|
Strong Operating Margins -
We believe our operating leverage combined with our attractive land purchases position us for strong operating margins.
|
|
•
|
Everything’s Included
®
Approach
- We are focused on distinguishing our products, including through our Everything’s Included
®
approach, which maximizes our purchasing power to include luxury features as standard items in our homes.
|
1
|
•
|
Innovative Homebuilding -
We are constantly innovating the homes we build to create products that meet our customers' needs. Our latest innovation, NextGen homes, or a home within a home, provides a unique new home solution for multi-generational households as homebuyers often need to accommodate children and parents to share the cost of their mortgage and other living expenses.
|
|
•
|
Flexible Operating Structure
- Our local operating structure gives us the flexibility to make operating decisions based on local homebuilding conditions and customer preferences, while our centralized management structure provides oversight for our homebuilding operations.
|
Diversified Program of Property Acquisition
We generally acquire land for development and for the construction of homes that we sell to homebuyers. Land purchases are subject to specified underwriting criteria and are made through our diversified program of property acquisition, which may consist of the following:
|
•
|
Acquiring land directly from individual land owners/developers or homebuilders;
|
|
•
|
Acquiring local or regional homebuilders that own, or have options to purchase, land in strategic markets;
|
|
•
|
Acquiring land through option contracts, which generally enables us to control portions of properties owned by third parties (including land funds) and unconsolidated entities in which we have investments until we have determined whether to exercise the options;
|
|
•
|
Acquiring parcels of land through joint ventures, which among other factors, limits the amount of our capital invested in land while increasing our access to potential future homesites and allowing us to participate in strategic ventures;
|
|
•
|
Acquiring land in conjunction with Lennar Multifamily and Lennar Commercial; and
|
|
•
|
Acquiring distressed assets from banks and opportunity funds, often through relationships established by our Rialto segment.
|
At
November 30, 2014
, we owned
132,679
homesites and had access through option contracts to an additional
31,890
homesites, of which
24,855
homesites were through option contracts with third parties and
7,035
homesites were through option contracts with unconsolidated entities in which we have investments. At
November 30, 2013
, we owned
125,643
homesites and had access through option contracts to an additional
28,133
homesites, of which
20,966
homesites were through option contracts with third parties and
7,167
homesites were through option contracts with unconsolidated entities in which we have investments.
Construction and Development
Through our own efforts and those of unconsolidated entities in which Lennar Homebuilding has investments, we are involved in all phases of planning and building in our residential communities, including land acquisition, site planning, preparation and improvement of land and design, construction and marketing of homes. We use independent subcontractors for most aspects of home construction. At
November 30, 2014
, we were actively building and marketing homes in
625
communities, including
3
communities being developed by unconsolidated entities.
We generally supervise and control the development of land and the design and building of our residential communities with a relatively small labor force. We hire subcontractors for site improvements and virtually all of the work involved in the construction of homes. Arrangements with our subcontractors generally provide that our subcontractors will complete specified work in accordance with price schedules and in compliance with applicable building codes and laws. The price schedules may be subject to change to meet changes in labor and material costs or for other reasons. We believe that the sources and availability of raw materials to our subcontractors are adequate for our current and planned levels of operation. We generally do not own heavy construction equipment. We finance construction and land development activities primarily with cash generated from operations and debt issuances.
For additional information about our investments in and relationships with unconsolidated entities, see Management’s Discussion and Analysis of Financial Condition and Results of Operations in Item 7 of this Report.
Marketing
We offer a diversified line of homes for first-time, move-up and active adult homebuyers in a variety of environments ranging from urban infill communities to golf course communities. Our Everything’s Included
®
marketing program simplifies the home buying experience by including the most desirable features as standard items. This marketing program enables us to differentiate our homes from those of our competitors by creating value through standard upgrades and competitive pricing, while reducing construction and overhead costs through a simplified manufacturing process, product standardization and volume purchasing. In addition, our innovative NextGen homes and our advances in including solar powered technology in
2
certain of the homes we sell, enhance our image and improve our marketing and sales efforts. We sell our homes primarily from models that we have designed and constructed.
We employ sales associates who are paid salaries, commissions or both to conduct on-site sales of homes. We also sell homes through independent brokers. Our marketing strategy is focused on advertising through digital and social media, including through our Internet website, www.lennar.com, which has allowed us to attract more knowledgeable homebuyers. However, we also continue to advertise through more traditional media, including newspapers, radio advertisements and other local and regional publications and on billboards. We tailor our marketing strategy based on the community being advertised, such as advertising our active adult communities in areas where prospective active adult homebuyers live.
Quality Service
We strive to continually improve homeowner customer satisfaction throughout the pre-sale, sale, construction, closing and post-closing periods. We strive to create a quality home buying experience for our customers through the participation of sales associates, on-site construction supervisors and customer care associates, all working in a team effort, which we believe leads to enhanced customer retention and referrals. The quality of our homes is substantially affected by the efforts of on-site management and others engaged in the construction process, by the materials we use in particular homes and by other similar factors.
We warrant our new homes against defective materials and workmanship for a minimum period of one year after the date of closing. Although we subcontract virtually all segments of construction to others and our contracts call for the subcontractors to repair or replace any deficient items related to their trades, we are primarily responsible to the homebuyers for the correction of any deficiencies.
Local Operating Structure and Centralized Management
We balance a local operating structure with centralized corporate level management. Our local operating structure consists of homebuilding divisions across the country, which are generally managed by a division president, a controller, management personnel focused on land entitlement, acquisition and development, sales, construction, customer service and purchasing. We decentralize our homebuilding operations to give our division presidents and their teams, who generally have significant experience in the homebuilding industry, and in most instances, in their particular markets, the flexibility to make local operating decisions, including land identification, entitlement and development, the management of inventory levels for our current sales volume, community development, home design, construction and marketing of our homes.
We centralize at the corporate level decisions related to our overall strategy, acquisitions of land and businesses, risk management, financing, cash management and information systems.
Deliveries
We primarily sell single-family attached and detached homes in communities targeted to first-time, move-up and active adult homebuyers. The average sales price of a Lennar home was
$326,000
in fiscal
2014
, compared to
$290,000
in fiscal
2013
and
$255,000
in fiscal
2012
.
The table below indicates the number of deliveries for each of our current reportable homebuilding segments and Homebuilding Other during our last three fiscal years:
|
|
Years Ended November 30,
|
|||||||
|
|
2014
|
2013
|
2012
|
|||||
|
East
|
7,824
|
|
6,941
|
|
5,440
|
|
||
|
Central
|
3,156
|
|
2,814
|
|
2,154
|
|
||
|
West
|
4,141
|
|
3,323
|
|
2,301
|
|
||
|
Southeast Florida
|
2,086
|
|
1,741
|
|
1,314
|
|
||
|
Houston
|
2,482
|
|
2,266
|
|
1,917
|
|
||
|
Other
|
1,314
|
|
1,205
|
|
676
|
|
||
|
Total
|
21,003
|
|
18,290
|
|
13,802
|
|
||
Of the total home deliveries listed above,
32
,
56
and
95
represent deliveries from unconsolidated entities for the years ended
November 30, 2014
,
2013
and
2012
, respectively.
3
Backlog
Backlog represents the number of homes under sales contracts. Homes are sold using sales contracts, which are generally accompanied by deposits. In some instances, purchasers are permitted to cancel sales contracts if they fail to qualify for financing or under certain other circumstances. We experienced a cancellation rate of
17%
in
2014
, compared to
16%
and
17%
in
2013
and
2012
, respectively. The cancellation rate for the year ended
November 30, 2014
was within a range that is consistent with historical cancellation rates and below those we experienced from 2006 through 2009. We expect that substantially all homes currently in backlog will be delivered in fiscal year
2015
. We do not recognize revenue on homes under sales contracts until the sales are closed and title passes to the new homeowners.
The table below indicates the backlog dollar value for each of our current reportable homebuilding segments and Homebuilding Other as of the end of each of our last three fiscal years:
|
|
November 30,
|
||||||||
|
(In thousands)
|
2014
|
2013
|
2012
|
||||||
|
East
|
$
|
672,204
|
|
600,257
|
|
368,361
|
|
||
|
Central
|
310,726
|
|
195,762
|
|
168,912
|
|
|||
|
West
|
437,492
|
|
257,498
|
|
202,959
|
|
|||
|
Southeast Florida
|
214,606
|
|
215,988
|
|
141,146
|
|
|||
|
Houston
|
225,737
|
|
180,665
|
|
135,282
|
|
|||
|
Other
|
113,563
|
|
169,431
|
|
143,725
|
|
|||
|
Total
|
$
|
1,974,328
|
|
1,619,601
|
|
1,160,385
|
|
||
Of the total dollar value of homes in backlog listed above,
$39.8 million
,
$2.5 million
and
$3.5 million
represent the dollar value of homes in backlog from unconsolidated entities at
November 30, 2014
,
2013
and
2012
, respectively.
Lennar Homebuilding Investments in Unconsolidated Entities
We create and participate in joint ventures that acquire and develop land for our homebuilding operations, for sale to third parties or for use in their own homebuilding operations. Through these joint ventures, we reduce the amount we invest in order to assure access to potential future homesites, thereby mitigating certain risks associated with land acquisitions, and, in some instances, we obtain access to land to which we could not otherwise have obtained access or could not have obtained access on as favorable terms. As of
November 30, 2014
and
2013
, we had
35
and 36 Lennar Homebuilding unconsolidated joint ventures, respectively, in which we were participating, and our maximum recourse debt exposure related to Lennar Homebuilding unconsolidated joint ventures was
$24.5 million
and
$41.0 million
, respectively.
Ancillary Businesses
We have ancillary business activities that are related to our homebuilding business, but are not components of our core homebuilding operations.
FivePoint Communities
- In 2011, we transferred the management of several large properties in California to FivePoint Communities Management, Inc., a consolidated joint venture. FivePoint Communities is currently undertaking six master planned mixed use developments, three in Southern California and three in or near San Francisco. These developments are planned for a total of 50,000 homesites and 20 million square feet of commercial space, as well as parks and sports and entertainment venues.
Lennar Commercial
- Lennar Commercial is focused on the development, investment and management of retail, office and mixed-use projects generally in the same states as our homebuilding operations.
Sunstreet
- Lennar’s solar business is currently focused on providing homeowners in California and Colorado through its solar power purchase program, a high-efficiency solar system that generates most of a home's annual expected energy needs at a cost below current utility rates for the average homeowner.
4
Lennar Financial Services Operations
Mortgage Financing
We primarily offer conforming conventional, FHA-insured and VA-guaranteed residential mortgage loan products and other products to buyers of our homes and others through our financial services subsidiary, Universal American Mortgage Company, LLC, which includes Universal American Mortgage Company, LLC, d/b/a Eagle Home Mortgage, from locations in most of the states in which we have homebuilding operations, as well as some other states. In
2014
, our financial services subsidiaries provided loans to
78%
of our homebuyers who obtained mortgage financing in areas where we offered services. Because of the availability of mortgage loans from our financial services subsidiaries, as well as from independent mortgage lenders, we believe almost all creditworthy purchasers of our homes have access to financing.
During
2014
, we originated approximately
23,300
residential mortgage loans totaling
$6.0 billion
, compared to
22,300
residential mortgage loans totaling
$5.3 billion
during
2013
. Substantially all of the residential mortgage loans we originate are sold within a short period in the secondary mortgage market, the majority of which are sold on a servicing released, non-recourse basis. After the loans are sold, we retain potential liability for possible claims by purchasers that we breached certain limited industry-standard representations and warranties in the loan sale agreements. Therefore, we have limited direct exposure related to the residential mortgages we originate.
We finance our mortgage loan activities with borrowings under our financial services warehouse facilities or from our operating funds. At
November 30, 2014
, our financial services warehouse facilities had a maximum aggregate commitment of
$925 million
including
$150 million
of accordion features. The facilities have various maturity dates and we expect the facilities to be renewed or replaced with other facilities when they mature. We have a corporate risk management policy under which we hedge our interest rate risk on rate-locked loan commitments and loans held-for-sale to mitigate exposure to interest rate fluctuations.
Title Insurance and Closing Services
We provide title insurance and closing services to our homebuyers and others. During
2014
, we provided title and closing services for approximately
90,700
real estate transactions, and issued approximately
220,400
title insurance policies through our underwriter, North American Title Insurance Company, compared to
101,200
real estate transactions and
192,400
title insurance policies during
2013
. Title and closing services are provided by agency subsidiaries in Arizona, California, Colorado, Delaware, District of Columbia, Florida, Illinois, Indiana, Maryland, Minnesota, Nevada, New Jersey, New York, Pennsylvania, Texas, Utah, Virginia and Wisconsin. Title insurance services are provided in 40 states.
Rialto Operations
The Rialto segment is a commercial real estate investment, investment management, and finance company. Rialto’s primary focus is to manage third-party capital and to originate commercial mortgage loans which it sells into securitizations. It also has invested its own capital in mortgage loans, properties and real estate related securities.
Rialto is the sponsor of and an investor in private equity vehicles that invest in and manage real estate related assets. This includes:
|
•
|
Rialto Real Estate Fund, LP ("Fund I") that was formed in 2010 to invest in distressed real estate assets and other related investments to which investors have committed and contributed a total of
$700 million
of equity (including
$75 million
by us);
|
|
•
|
Rialto Real Estate Fund II, LP ("Fund II") that was formed in 2012 to invest in distressed real estate assets and other related investments to which investors have committed
$1.3 billion
(including
$100 million
by us); and
|
|
•
|
Rialto Mezzanine Partners Fund (the "Mezzanine Fund") that was formed in 2013 with a target of raising
$300 million
in capital (including
$27 million
committed by us) to invest in performing mezzanine commercial loans that have expected durations of one to two years and are secured by equity interests in the borrowing entity owning the real estate assets.
|
Rialto also earns fees for its role as a manager of these vehicles and for providing asset management and other services to those vehicles and other third parties. In addition, Rialto owns general partner interests in each of the funds, which entitle it to a share of the sums distributed by the funds after investors have recovered their investments and received specified internal rates of return on those investments. For both Fund I and Fund II, in order to protect investors in the Funds, we agreed that while the Funds were seeking investments (which no longer is the case with regard to Fund I) we would not make investments that are suitable for the applicable Fund, except to the extent an Advisory Committee of the Fund decides that the Fund should not make particular investments, with an exception enabling us to purchase properties for use in connection with our homebuilding operations.
5
During 2013, Rialto Mortgage Finance ("RMF") was formed and began originating and selling into securitizations five, seven and ten year commercial first mortgage loans, generally with principal amounts between
$2 million
and
$75 million
, which are secured by income producing properties. RMF has secured two warehouse repurchase financing agreements that mature in fiscal year 2015 with commitments totaling
$650 million
to help finance the loans it makes. This business has become a significant contributor to the Rialto segment's revenues.
In 2010, our Rialto segment also acquired distressed residential and commercial real estate loans and real estate owned ("REO") properties from three financial institutions (“Bank Portfolios”). We paid
$310 million
for the Bank Portfolios, of which
$124 million
was financed through a 5-year senior unsecured note provided by one of the selling institutions.
In 2010, our Rialto segment also acquired indirectly
40%
managing member equity interests in two limited liability companies (“LLCs”), in partnership with the Federal Deposit Insurance Corporation (“FDIC”), which retained
60%
equity interest in the LLCs, for approximately
$243 million
(net of transaction costs and a
$22 million
working capital reserve). The LLCs held performing and non-performing distressed residential and commercial real estate loans (“FDIC Portfolios”). If the LLCs exceed expectations and meet certain internal rate of return and distribution threshold, our equity interest in the LLCs could be reduced from
40%
down to
30%
, with a corresponding increase to the FDIC’s equity interest from
60%
up to
70%
. As these thresholds have not been met, distributions continue being shared
60%
/
40%
with the FDIC.
Lennar Multifamily Operations
We are actively involved, primarily through unconsolidated entities, in the development of multifamily rental properties. Our Lennar Multifamily segment focuses on developing a geographically diversified portfolio of institutional quality multifamily rental properties in select U.S. markets. We currently use third-party management companies to rent the apartments though we anticipate renting the apartments through our own entities in the future.
Our net investment in the Lennar Multifamily segment as of
November 30, 2014
and
2013
was
$203.7 million
and
$105.6 million
, respectively. Our Lennar Multifamily segment was participating in
26
and
13
unconsolidated entities as of
November 30, 2014
and
2013
, respectively. During 2014, our Lennar Multifamily segment sold two operating properties through unconsolidated entities. As of
November 30, 2014
, it had interests in
24
communities with development costs of approximately
$1.5 billion
, of which
one
community was completed and operating,
three
communities were partially completed and leasing,
19
communities were under construction and
one
was under development. Our Lennar Multifamily segment had a pipeline of future projects totaling
$4.3 billion
in assets across a number of states that will be developed by unconsolidated entities. We are exploring opportunities to create a fund, which we would manage and in which we would make an investment, to provide funding for the rental communities we develop.
For additional information about our investments in and relationships with unconsolidated entities, see Management’s Discussion and Analysis of Financial Condition and Results of Operations in Item 7 of this Report.
Seasonality
We historically have experienced, and expect to continue to experience, variability in quarterly results. Our homebuilding business is seasonal in nature and generally reflects higher levels of new home order activity in our second fiscal quarter and increased deliveries in the second half of our fiscal year. However, periods of economic downturn in the industry, such as we experienced in recent years, can alter seasonal patterns.
Competition
The residential homebuilding industry is highly competitive. We compete for homebuyers in each of the market regions where we operate with numerous national, regional and local homebuilders, as well as with resales of existing homes and with the rental housing market. In recent years, lenders’ efforts to sell foreclosed homes have been a significant competitive factor within the home sales industry. We compete for homebuyers on the basis of a number of interrelated factors including location, price, reputation, amenities, design, quality and financing. In addition to competition for homebuyers, we also compete with other homebuilders for desirable properties, raw materials and access to reliable, skilled labor. We compete for land buyers with third parties in our efforts to sell land to homebuilders and others. We believe we are competitive in the market regions where we operate primarily due to our:
|
•
|
Financial position, where we continue to focus on inventory management and liquidity;
|
|
•
|
Access to land, particularly in land-constrained markets;
|
|
•
|
Access to distressed assets, primarily through relationships established by our Rialto segment;
|
|
•
|
Pricing to current market conditions through sales incentives offered to homebuyers;
|
|
•
|
Cost efficiencies realized through our national purchasing programs and production of value-engineered homes;
|
|
•
|
Quality construction and home warranty programs, which are supported by a responsive customer care team; and
|
6
|
•
|
Everything’s Included
®
marketing program, which simplifies the home buying experience by including most desirable features as standard items.
|
Our financial services operations compete with other mortgage lenders, including national, regional and local mortgage bankers and brokers, banks, savings and loan associations and other financial institutions, in the origination and sale of residential mortgage loans. Principal competitive factors include interest rates and other features of mortgage loan products available to the consumer. We compete with other title insurance agencies and underwriters for closing services and title insurance. Principal competitive factors include service and price.
The business of Rialto, and the funds it manages, of purchasing distressed real estate related assets is highly competitive and fragmented. A number of entities and funds have been formed in recent years for the purpose of acquiring real estate related assets at discounted prices and it is likely that additional entities and funds will be formed for this purpose during the next several years. We compete with these and other purchasers of distressed assets. We compete in the marketplace for distressed real estate related asset portfolios based on many factors, including purchase price, representations, warranties and indemnities, timeliness of purchase decisions and reputation. We believe that the major factor distinguishing us from the competition is that our team is made up of already in place managers who are already working out loans and dealing with similar borrowers. Additionally, because of the high number of loans made to developers, we believe having our homebuilding team participating in the underwriting process provides us with a distinct advantage in our evaluation of these assets. We believe that these factors, together with our ownership of a mortgage services firm, puts us ahead of many of our competitors and has us well positioned to take advantage of the large pipeline of opportunity that has been building. In marketing the real estate investment funds it sponsors, Rialto competes with a large variety of asset managers, including investment banks and other financial institutions and real estate investment firms.
Rialto’s RMF business competes with other commercial mortgage lenders in a competitive market and its profitability depends on our ability to originate and sell into securitizations commercial real estate loans at attractive prices. Some of our competitors may have a lower cost of funds than we do and access to funding sources that may not be available to us. In addition, some of our competitors may have higher risk tolerances or make different risk assessments, than we do, which could allow them to consider a wider variety of investments and establish more relationships than us. We believe that our major distinction from many of our competitors is that our team is made up of highly seasoned managers who have been originating and securitizing loans for over 25 years with long-standing relationships and can leverage Rialto’s/Lennar’s infrastructure facilities for a rapid market entrance as well as Rialto’s current underwriting platform.
Our multifamily operations compete with other multifamily apartment developers and operators, including REITs, across the United States. In addition, our multifamily operations compete in securing capital, partners and equity, and in securing tenants within the large supply of already existing rental apartments. Principal competitive factors include location, rental price and quality, and management of the apartment buildings.
Regulation
The residential communities and multifamily apartment developments that we build are subject to a large variety of local, state and federal statutes, ordinances, rules and regulations relating to, among other things, zoning, construction permits or entitlements, construction materials, density, building design and property elevation, building codes and handling of waste. These include laws requiring the use of construction materials that reduce the need for energy-consuming heating and cooling systems. These laws and regulations are subject to frequent change and often increase construction costs. In some instances, we must comply with laws that require commitments from us to provide roads and other offsite infrastructure, and may require them to be in place prior to the commencement of new construction. These laws and regulations are usually administered by counties and municipalities and may result in fees and assessments or building moratoriums. In addition, certain new development projects are subject to assessments for schools, parks, streets and highways and other public improvements, the costs of which can be substantial. Also, some states are attempting to make homebuilders responsible for violations of wage and other labor laws by their subcontractors.
Residential homebuilding and apartment development are also subject to a variety of local, state and federal statutes, ordinances, rules and regulations concerning the protection of health and the environment. These environmental laws include such areas as storm water and surface water management, soil, groundwater and wetlands protection, subsurface conditions and air quality protection and enhancement. Environmental laws and existing conditions may result in delays, may cause us to incur substantial compliance and other costs and may prohibit or severely restrict homebuilding activity in environmentally sensitive regions or areas.
In recent years, several cities and counties in which we have developments have submitted to voters “slow growth” initiatives and other ballot measures that could impact the affordability and availability of land suitable for residential development within those localities. Although many of these initiatives have been defeated, we believe that if similar initiatives were approved, residential construction by us and others within certain cities or counties could be seriously impacted.
7
In order to make it possible for some of our homebuyers to obtain FHA-insured or VA-guaranteed mortgages, we must construct the homes they buy in compliance with regulations promulgated by those agencies. Various states have statutory disclosure requirements relating to the marketing and sale of new homes. These disclosure requirements vary widely from state-to-state. In addition, some states require that each new home be registered with the state at or before the time title is transferred to a buyer (e.g., the Texas Residential Construction Commission Act). In some states, we are required to be registered as a licensed contractor and comply with applicable rules and regulations. In various states, our new home consultants are required to be registered as licensed real estate agents and to adhere to the laws governing the practices of real estate agents.
Our mortgage and title subsidiaries must comply with applicable real estate laws and regulations. The subsidiaries are licensed in the states in which they do business and must comply with laws and regulations in those states. These laws and regulations include provisions regarding capitalization, operating procedures, investments, lending and privacy disclosures, forms of policies and premiums. The Dodd-Frank Wall Street Reform and Consumer Protection Act contains a number of new requirements relating to mortgage lending and securitizations. These include, among others, minimum standards for lender practices, limitations on certain fees and a requirement that the originator of loans that are securitized retain a portion of the risk, either directly or by holding interests in the securitizations.
Several federal, state and local laws, rules, regulations and ordinances, including, but not limited to, the Federal Fair Debt Collection Practices Act (“FDCPA”) and the Federal Trade Commission Act and comparable state statutes, regulate consumer debt collection activity. Although, for a variety of reasons, we may not be specifically subject to the FDCPA or certain state statutes that govern debt collectors, it is our policy to comply with applicable laws in our collection activities. To the extent that some or all of these laws apply to our collection activities our failure to comply with such laws could have a material adverse effect on us. We are also subject to regulations promulgated by the Federal Consumer Financial Protection Bureau regarding residential mortgage loans.
Because Rialto manages two real estate asset investment funds, one mezzanine loan fund and two entities partly owned by the FDIC, a Rialto segment entity is registered as an investment adviser under the Investment Advisers Act of 1940. This Act has requirements related to dealings between investment advisers and the entities they advise and imposes record keeping and disclosure obligations on investment advisers. Our RMF subsidiary must comply with laws and regulations applicable to commercial mortgage lending. It or its subsidiaries must be licensed in states in which they make loans and must comply with laws and regulations in those states.
Associates
At
November 30, 2014
, we employed 6,825 individuals of whom 3,578 were involved in the Lennar Homebuilding operations, 2,707 were involved in the Lennar Financial Services operations, 383 were involved in the Rialto operations and 157 were involved in the Lennar Multifamily operations, compared to
November 30, 2013
, when we employed 5,708 individuals of whom 2,944 were involved in the Lennar Homebuilding operations, 2,377 were involved in the Lennar Financial Services operations, 300 were involved in the Rialto operations and 87 were involved in the Lennar Multifamily operations. We do not have collective bargaining agreements relating to any of our associates. However, we subcontract many phases of our homebuilding operations and some of the subcontractors we use have employees who are represented by labor unions.
NYSE Certification
On April 9, 2014, we submitted our Annual CEO Certification to the New York Stock Exchange ("NYSE") in accordance with NYSE's listing standards. The certification was not qualified in any respect.
8
Available Information
Our corporate website is www.lennar.com. We make available on our website, free of charge, our Annual Report on Form 10-K, quarterly reports on Form 10-Q, current reports on Form 8-K and any amendments to these reports filed or furnished pursuant to section 13(a) or 15(d) of the Securities Exchange Act of 1934, as amended, as soon as reasonably practicable after we electronically file these documents with, or furnish them to, the Securities and Exchange Commission. Information on our website is not part of this document.
Our website also includes printable versions of our Corporate Governance Guidelines, our Code of Business Conduct and Ethics and the charters for each of the Audit, Compensation and Nominating and Corporate Governance Committees of our Board of Directors. Each of these documents is also available in print to any stockholder who requests a copy by addressing a request to:
Lennar Corporation
Attention: Office of the General Counsel
700 Northwest 107
th
Avenue
Miami, Florida 33172
|
Item 1A.
|
Risk Factors.
|
The following are what we believe to be the principal risks that might materially affect us and our businesses.
Market and Economic Risks
The homebuilding recovery has continued its progression at a slow and steady pace, however a downturn in the recovery or decline in economic conditions could adversely affect our operations.
In fiscal 2014, we experienced a steadily improving housing market, and in our business saw a strong recovery in the number of new sales contracts signed and improved gross margins compared with the prior year. However, demand for new homes is sensitive to changes in economic conditions such as the level of employment, consumer confidence, consumer income, the availability of financing and interest rate levels. The economic downturn that began in 2007 was one of the most severe in U.S. history, and severely affected both the numbers of homes we could sell and the prices for which we could sell them. We cannot predict whether the recovery in the housing market will continue. If the recovery were to slow or stop, or economic conditions were to worsen, the demand for new homes would likely decline, negatively impacting our business, results of operations, cash flows and financial condition.
For several years we had to take significant write-downs on the carrying values of land we owned and of option expenses. A future decline in land values could result in similar write-downs.
Inventory risks are substantial for our homebuilding business. There are risks inherent in controlling, owning and developing land and if housing demand declines, we may own land or lots at a cost we will not be able to recover fully, or on which we cannot build and sell homes profitably. Also, there can be significant fluctuations in the value of our owned undeveloped land, building lots and housing inventories related to changes in market conditions. As a result, our deposits for building lots controlled under option or similar contracts may be put at risk, we may have to sell homes or land for a lower than anticipated profit margin or we may have to record inventory impairment charges with regard to our developed and undeveloped land and lots. When demand for homes fell during the recent recession, we were required to take significant write-downs of the carrying value of our land inventory and we elected not to exercise many options to purchase land, even though that required us to forfeit deposits and write-off pre-acquisition costs. If market conditions were to deteriorate significantly in the future, we could again be required to make significant write downs with regard to our land inventory, which would decrease the asset values reflected on our balance sheet and adversely affect our earnings and our stockholders' equity.
Inflation may adversely affect us by increasing costs that we may not be able to recover.
Inflation can adversely affect us by increasing costs of land, materials and labor. In addition, significant inflation is often accompanied by higher interest rates, which have a negative impact on demand for our homes. In a highly inflationary environment, depending on industry and other economic conditions, we may be precluded from raising home prices enough to keep up with the rate of inflation, which would reduce our profit margins. Although the rate of inflation has been low for the last several years, we have been experiencing increases in the prices of labor and materials and there could be a significant increase in inflation in the future.
9
Homebuilding, mortgage lending, distressed asset investing and multifamily rentals are very competitive industries, and competitive conditions could adversely affect our business or financial results.
Homebuilding.
The homebuilding industry is highly competitive. Homebuilders compete not only for homebuyers, but also for desirable land, financing, raw materials, skilled management and labor resources. We compete in each of our markets with numerous national, regional and local homebuilders. We also compete with sellers of existing homes, including foreclosed homes, and with rental housing. These competitive conditions can reduce the number of homes we deliver, negatively impact our selling prices, reduce our profit margins, and cause impairments in the value of our inventory or other assets. Competition can also affect our ability to acquire suitable land, raw materials and skilled labor at acceptable costs or terms.
Lennar Financial Services
. Our Lennar Financial Services business competes with other mortgage lenders, including national, regional and local banks and other financial institutions, many of which are far larger, and some of which are subject to fewer government regulations, than our financial services subsidiaries. Mortgage lenders who are subject to fewer regulations than we are or have greater access to low cost funds or different lending criteria than we do may be able to offer more attractive financing to potential customers than we can.
Lennar Multifamily
. Our multifamily rental business competes with other multifamily apartment developers and operators across the United States. We also compete in securing capital, partners and equity, and in securing tenants with the large supply of already existing rental apartments. These competitive conditions could negatively impact the ability of the ventures in which we are participating to find renters for the apartments they are building or the prices for which those apartments can be rented.
Rialto
. There are many firms and investment funds that compete with Rialto in trying to acquire distressed mortgage debt, foreclosed properties and other real estate related assets that have been adversely affected by the recent recession. At least some of the firms with which Rialto competes, or will compete, for investment opportunities have, or will have, a cost of funds that is lower than that of Rialto or the funds it manages, and therefore those firms may be able to pay more for investment opportunities than would be prudent for Rialto or the funds it manages. Our RMF business competes with national and regional banks as well as smaller community banks within the various markets in which we operate and non-bank lenders, many of which are far larger than RMF or have access to lower cost funds than we do.
Operational Risks
We may be subject to significant potential liabilities as a result of warranty and liability claims made against us.
As a homebuilder, we are subject in the ordinary course of our business to warranty and construction defect claims. We are also subject to claims for injuries that occur in the course of construction activities. We record warranty and other reserves for the homes we sell based on historical experience in our markets and our judgment of the qualitative risks associated with the types of homes we build. We have, and many of our subcontractors have, general liability, property, workers compensation and other business insurance. These insurance policies are intended to protect us against a portion of our risk of loss from claims, subject to certain self-insured retentions, deductibles and other coverage limits. However, it is possible that this insurance will not be adequate to address all warranty, construction defect and liability claims to which we are subject. Additionally, the coverage offered and the availability of general liability insurance for construction defects are currently limited and policies that can be obtained are costly and often include exclusions based upon past losses those insurers suffered as a result of use of defective Chinese drywall and other products in homes we and many other homebuilders built. As a result, an increasing number of our subcontractors are unable to obtain insurance, and we have in many cases had to waive our customary insurance requirements, which increases our and our insurers’ exposure to claims and increases the possibility that our insurance will not be adequate to protect us for all the costs we incur.
Products supplied to us and work done by subcontractors can expose us to risks that could adversely affect our business.
We rely on subcontractors to perform the actual construction of our homes, and in many cases, to select and obtain building materials. Despite our detailed specifications and quality control procedures, in some cases, subcontractors may use improper construction processes or defective materials, such as defective Chinese drywall that at one time was installed by subcontractors in homes built for us and for many other homebuilders in Florida and elsewhere. Although our subcontractors have principal responsibility for defects in the work they do, we have ultimate responsibility to the homebuyers. Defective products widely used by the homebuilding industry can result in the need to perform extensive repairs to large numbers of homes. The cost of complying with our warranty obligations may be significant if we are unable to recover the cost of repairs from subcontractors, materials suppliers and insurers.
We also can suffer damage to our reputation, and may be exposed to possible liability, if subcontractors fail to comply with applicable laws, including laws involving things that are not within our control. When we learn about possibly improper practices by subcontractors, we try to cause the subcontractors to discontinue them. However, we are not always able to do that, and even when we can, it may not avoid claims against us relating to what the subcontractors already did.
10
Supply shortages and risks related to the demand for skilled labor and building materials could increase costs and delay deliveries.
Increased costs or shortages of skilled labor and/or lumber, framing, concrete, steel and other building materials could cause increases in construction costs and construction delays. During 2014, we experienced increases in the prices of some building materials and shortages of skilled labor in some areas. We generally are unable to pass on increases in construction costs to customers who have already entered into purchase contracts, as those contracts generally fix the price of the homes at the time the contracts are signed, which may be well in advance of the construction of the homes. Sustained increases in construction costs may, over time, erode our margins, particularly if pricing competition restricts our ability to pass additional costs of materials and labor on to homebuyers.
Reduced numbers of home sales extend the time it takes us to recover land purchase and property development costs.
We incur many costs even before we begin to build homes in a community. Depending on the stage of development a land parcel is in when we acquire it, these may include costs of preparing land, finishing and entitling lots, installing roads, sewers, water systems and other utilities, taxes and other costs related to ownership of the land on which we plan to build homes. If the rate at which we sell and deliver homes slows, or if we delay the opening of new home communities, we may incur additional pre-construction costs and it may take longer for us to recover our costs.
Increased demand for homes could require us to increase our corporate credit line, and our inability to do that could limit our ability to take full advantage of market opportunities.
Our business requires that we be able to finance the development of our residential communities. One of the ways we do this is with bank borrowings. At November 30, 2014, we had a
$1.5 billion
Credit Facility, subject in part to additional commitments. If market conditions strengthen to the point that we need additional funding but we are not able to increase our Credit Facility or obtain funds from other types of financings, that could prevent us from taking full advantage of the enhanced market opportunities.
Failure to comply with the covenants and conditions imposed by our credit facilities could restrict future borrowing or cause our debt to become immediately due and payable.
We have a Credit Facility that is available for us to use to help finance our homebuilding, acquisitions and other activities. The agreement governing our Credit Facility (the “Credit Agreement”) makes it a default for us if we fail to pay principal or interest when it is due (subject in some instances to grace periods) or to comply with covenants, including covenants regarding various financial ratios. In addition, our Lennar Financial Services segment has warehouse facilities to finance its lending activities and our Rialto segment has warehouse facilities to finance its mortgage origination activities. If we default under the Credit Agreement or our warehouse facilities, the lenders will have the right to terminate their commitments to lend and to require immediate repayment of all outstanding borrowings. This could reduce our available funds at a time when we are having difficulty generating all the funds we need from our operations, in capital markets or otherwise, and restrict our ability to obtain financing in the future. Further, Rialto's 7.00% Senior Notes due 2018 contain restrictive covenants imposing operational and financial restrictions on our Rialto segment, including restrictions that may limit Rialto’s ability to sell assets, pay dividends or make other distributions, enter into transactions with affiliates or incur additional indebtedness. In addition, if we default under the Credit Agreement or our warehouse facilities, it could result in the amounts outstanding under our senior notes and convertible senior notes to become immediately due and payable, which would have a material adverse impact on our consolidated financial condition.
We have a substantial level of indebtedness which may have an adverse effect on our business or limit our ability to take advantage of business, strategic or financing opportunities.
As of
November 30, 2014
, our consolidated debt, excluding amounts outstanding under our credit facilities, was $5.2 billion. The indentures governing our senior notes and convertible senior notes do not restrict the incurrence of future secured or unsecured debt by us, and the agreement governing our Credit Facility allows us to incur a substantial amount of future unsecured debt. Our substantial level of indebtedness increases the possibility that we may be unable to generate cash sufficient to pay the principal, interest or other amounts due on our indebtedness. Our reliance on debt to help support our operations exposes us to a number of risks, including:
|
•
|
we may be more vulnerable to general adverse economic and industry conditions;
|
|
•
|
we may have to pay higher interest rates upon refinancing or on our variable rate indebtedness if interest rates rise, thereby reducing our cash flows;
|
|
•
|
we may find it difficult to, or may be unable to, obtain additional financing to fund future working capital, capital expenditures and other general corporate requirements that would be in our best long-term interests;
|
|
•
|
we may be required to dedicate a substantial portion of our cash flow from operations to the payment of principal and interest on our debt, reducing the cash flow available to fund operations and investments;
|
11
|
•
|
we may have reduced flexibility in planning for, or reacting to, changes in our businesses or the industries in which they are conducted;
|
|
•
|
we may have a competitive disadvantage relative to other companies in our industry that are less leveraged; and
|
|
•
|
we may be required to sell debt or equity securities or sell some of our core assets, possibly on unfavorable terms, in order to meet payment obligations.
|
Our Lennar Financial Services segment and RMF have warehouse facilities that mature in 2015, and if we cannot renew or replace these facilities, we may have to reduce our mortgage lending activities.
Our Lennar Financial Services segment has an aggregate committed and uncommitted amount under four warehouse repurchase credit facilities that totaled
$925 million
as of
November 30, 2014
, all of which will mature during 2015. Our Lennar Financial Services segment uses these facilities to finance its mortgage lending activities until the mortgage loans it originates are sold to investors. In addition, RMF, the commercial mortgage lender in our Rialto segment, has an aggregate committed amount under two warehouse repurchase credit facilities that totaled
$650 million
as of
November 30, 2014
both of which will mature during 2015. RMF uses these facilities to finance its mortgage origination activities. We expect these facilities to be renewed or replaced with other facilities when they mature. If we were unable to renew or replace these facilities on favorable terms or at all when they mature, that could seriously impede the activities of our Lennar Financial Services segment and RMF, as applicable, which would have a material adverse impact on our financial results.
We conduct some of our operations through joint ventures with independent third parties and we can be adversely impacted by our joint venture partners' failures to fulfill their obligations or decisions to act contrary to our wishes.
In our Homebuilding and Lennar Multifamily segments, we participate in joint ventures in order to acquire attractive land positions, to manage our risk profile and to leverage our capital base. In certain circumstances, the joint venture participants, including ourselves, are required to provide guarantees of obligations relating to the joint ventures, such as completion and environmental guarantees. If a joint venture partner does not perform its obligations, we may be required to bear more than our proportional share of the cost of fulfilling them. For example, as part of our Lennar Multifamily business, and its joint ventures, we and the other venturers have assumed certain obligations to complete construction of multifamily residential buildings at agreed upon costs, which could make us and the other venture participants responsible for cost overruns. Although all the participants in a venture are normally responsible for sharing the costs of fulfilling obligations of that type, if some of the venture participants are unable or unwilling to meet their share of the obligations, we may be held responsible for some or all of the defaulted payments. In addition, because we do not have a controlling interest in most of the joint ventures in which we participate, we may not be able to sell assets, return invested capital or take other actions without the consent of at least one of our joint venture partners when such action may be in our best interest.
Several of the joint ventures in which we participate will in the relatively near future be required to repay, refinance, renegotiate or extend their loans. If any of those joint ventures are unable to do this, we could be required to provide at least a portion of the funds the joint ventures need to be able to repay the loans and to conduct the activities for which they were formed, which could adversely affect our financial position.
Our new businesses may not be as successful as we anticipate, and could disrupt our ongoing businesses and adversely affect our operations.
We have invested and expect to continue to invest in new business opportunities. In July 2013, we began commercial mortgage loan origination activities through RMF. In addition, during 2012 and 2013, we began our Lennar Multifamily business in which we have invested substantial resources to participate in the development of multifamily rental properties. Further, under our Homebuilding umbrella, we are investing in a solar business and a business focused on the development, investment and management of commercial properties. As with any new businesses, these endeavors, and others we may undertake in the future, are likely to involve significant risks and uncertainties, including significant start-up costs and the possibility that the new businesses will not be profitable or will not generate the expected returns on our investments, and the new businesses may require attention from our senior management that reduces their ability to focus on our core activities.
The loss of the services of members of our senior management or a significant number of our employees could negatively affect our business.
Our success depends to a significant extent upon the performance and active participation of our senior management, many of whom have been with the Company for a significant number of years. If we were to lose members of our senior management, we might not be able to find appropriate replacements on a timely basis and our operations could be negatively affected. Also, the loss of a significant number of operating employees and our inability to hire qualified replacements could have a material adverse effect on our business.
12
Our access to capital and our ability to obtain additional financing could be affected by any downgrade of our credit ratings.
Our corporate credit rating and ratings of our senior notes and convertible senior notes affect, among other things, our ability to access new capital, especially debt. A substantial portion of our access to capital is through the issuance of senior notes and convertible senior notes, of which we have
$4.3 billion
outstanding as of November 30, 2014. Among other things, we rely on proceeds of debt issuances to pay the principal of existing senior notes when they mature. Negative changes in the ratings of our senior notes could make it difficult for us to sell senior notes in the future and could result in more stringent covenants and higher interest rates with regard to new senior notes we issue.
Natural disasters and severe weather conditions could delay deliveries and increase costs of new homes in affected areas, which could harm our sales and results of operations.
Many of our homebuilding operations are conducted in areas that are subject to natural disasters, including hurricanes, earthquakes, droughts, floods, wildfires and severe weather. The occurrence of natural disasters or severe weather conditions can delay new home deliveries, increase costs by damaging inventories and lead to shortages of labor and materials in areas affected by the disasters, and can negatively impact the demand for new homes in affected areas. If our insurance does not fully cover business interruptions or losses resulting from these events, our results of operations could be adversely affected.
If our homebuyers are not able to obtain suitable financing, that would reduce demand for our homes and our home sales revenues.
Many purchasers of our homes obtain mortgage loans to finance a substantial portion of the purchase price of the homes they purchase. The uncertainties in the mortgage markets, including the tightening of credit standards and increased government regulation, could adversely affect the ability of potential homebuyers to obtain financing for a home purchase, thus preventing them from purchasing our homes. Changes made by Fannie Mae, Freddie Mac and FHA/VA to sponsored mortgage programs, as well as changes made by private mortgage insurance companies, have reduced the ability of many potential homebuyers to qualify for mortgages. Principal among these have been tighter lending standards such as higher income requirements, larger required down payments, increased reserves and higher required credit scores. In addition, there continues to be substantial uncertainty regarding the future of Fannie Mae and Freddie Mac, including proposals that they reduce or terminate their role as the principal sources of liquidity in the secondary market for mortgage loans. It is not clear how, if Fannie Mae and Freddie Mac curtail their secondary market mortgage loan purchases, the liquidity they provide would be replaced. There is a substantial possibility that substituting an alternate source of liquidity would increase mortgage interest rates, which would increase the buyer's effective cost of the homes we sell, and therefore could reduce demand for our homes and adversely affect our results of operations.
Changes in tax laws can increase the after tax cost of owning a home, and further tax law changes could adversely affect demand for the homes we build.
Under current tax law certain significant expenses of owning a home, including mortgage loan interest costs and real estate taxes, generally are deductible expenses for the purpose of calculating an individual’s federal, and in some cases state, tax liability. However, the American Taxpayer Relief Act of 2012, which was signed into law in January 2013, resulted in higher income tax rates and limits the amount of mortgage interest individuals can deduct in computing their income tax liability. The limit on deductibility of mortgage interest can increase the after-tax cost of owning a home for some individuals. Any additional increases in personal income tax rates and/or additional tax deduction limits could adversely impact demand for new homes, including homes we build, which could adversely affect our results of operations.
Our Lennar Financial Services segment can be adversely affected by reduced demand for our homes or by a slowdown in mortgage refinancings.
Approximately 57% of the mortgage loans made by our Lennar Financial Services segment in 2014 were made to buyers of homes we built. Therefore, a decrease in the demand for our homes would adversely affect the revenues of this segment of our business. In addition, the revenues of our Lennar Financial Services segment would be adversely affected by a decrease in refinance transactions, such as the decrease that we experienced during the first half of fiscal 2014.
If our ability to sell mortgages into the secondary market is impaired, that could significantly reduce our ability to sell homes unless we are willing to become a long-term investor in loans we originate.
Substantially all of the residential mortgage loans we originate are sold within a short period in the secondary mortgage market on a servicing released, non-recourse basis. If we became unable to sell loans into the secondary mortgage market or directly to Fannie Mae and Freddie Mac, we would have to either curtail our origination of mortgage loans, which among other things, could significantly reduce our ability to sell homes, or commit our own funds to long term investments in mortgage loans, which, in addition to requiring us to deploy substantial amounts of our own funds, could delay the time when we recognize revenues from home sales on our statements of operations.
13
If real estate Rialto acquired through foreclosures is not properly valued when it is acquired, we could be required to take valuation charge-offs, which would reduce our earnings.
When a loan is foreclosed upon and we take title to the property, we obtain a valuation of the property and base its book value on that valuation. The book value of the foreclosed property is periodically compared to its updated market value (or its updated market value less estimated selling costs if the foreclosed property is classified as held-for-sale), and a charge-off is recorded for any excess of the property's book value over its fair value. If the revised valuation we establish for a property proves to be too high, we may have to record additional charge-offs in subsequent periods. Material charge-offs could have an adverse effect on our results of operations, and possibly even on our financial condition.
The ability of our Rialto segment to profit from the investments it makes may depend to a significant extent on its ability to manage resolutions of distressed mortgages and other real estate related assets.
A principal factor in a prospective purchaser's decision regarding the price it will pay for a portfolio of mortgage loans or other real estate related assets is the cash flow the prospective purchaser expects the portfolio to generate. The cash flow a portfolio of distressed mortgage loans and related assets will generate can be affected by the way the assets in the portfolio are managed. We believe the backgrounds and experience of the personnel in our Rialto segment enable the Rialto segment to generate better cash flows from the distressed assets it manages than what is generally expected with regard to similar assets. When Rialto decides whether it or a fund it manages should purchase particular distressed assets and what it or the fund should be willing to pay for them, one consideration is whether, and to what extent, Rialto thinks it will be able to obtain above average returns in resolving the assets. If Rialto is not able to achieve its anticipated returns, it or the fund it manages will not realize the expected return on its investment.
Regulatory Risks
We may be adversely impacted by legal and regulatory changes.
We are subject with regard to almost all of our activities to a variety of federal, state and local laws and regulations. Laws and regulations, and policies under or interpretations of existing laws and regulations, change frequently. Our businesses could be adversely affected by changes in laws, regulations, policies or interpretations or by our inability to comply with them without making significant changes in our businesses.
We may be adversely impacted by laws and regulations directed at the financial industry.
New or modified regulations and related regulatory guidance focused on the financial industry may have adverse effects on aspects of our businesses. For example, in October 2014, final rules were promulgated under the Dodd-Frank Wall Street Reform Act that requires mortgage lenders or third-party B-piece buyers to retain a portion of the credit risk related to securitized loans. We have determined that these rules do not affect our residential mortgage lending operations at this time; however, the new rules may adversely impact our commercial mortgage lending operations in our RMF business. While we are still assessing the impact of the new rules on the market, we believe that the rules may reduce the price of commercial mortgage-backed securities ("CMBS") and limit the overall volume of CMBS related loan purchases, which could impact the financial results of our RMF business. In addition, if our residential mortgage lending operations became subject to these rules in the future, that would substantially increase the amount we would have to invest in our mortgage lending operations and increase our risks with regard to loans we originate and sell in the secondary mortgage market.
Governmental regulations regarding land use and environmental matters could increase the cost and limit the availability of our development and homebuilding projects and adversely affect our business or financial results.
We are subject to extensive and complex laws and regulations that affect the land development, homebuilding and apartment development process, including laws and regulations related to zoning, permitted land uses, levels of density, building design, elevation of properties, water and waste disposal and use of open spaces. These regulations often provide broad discretion to the administering governmental authorities as to the conditions we must meet prior to development or construction being approved, if they are approved at all. We are also subject to determinations by governmental authorities as to the adequacy of water or sewage facilities, roads and other local services with regard to particular residential communities. New housing developments may also be subject to various assessments for schools, parks, streets and other public improvements. In addition, in many markets government authorities have implemented no growth or growth control initiatives. Any of these can limit, delay, or increase the costs of land development or home construction.
We are also subject to a variety of local, state and federal laws and regulations concerning protection of the environment. In some of the markets where we operate, we are required by law to pay environmental impact fees, use energy-saving construction materials and give commitments to municipalities to provide infrastructure such as roads and sewage systems. We generally are required to obtain permits, entitlements and approvals from local authorities to commence and carry out residential development or home construction. These permits, entitlements and approvals may, from time-to-time, be
14
opposed or challenged by local governments, environmental advocacy groups, neighboring property owners or other possibly interested parties, adding delays, costs and risks of non-approval to the process. Violations of environmental laws and regulations can result in injunctions, civil penalties, remediation expenses, and other costs. In addition, some environmental laws impose strict liability, which means that we may be held liable for unlawful environmental conditions on property we own which we did not create.
We are also subject to laws and regulations related to workers' health and safety, and there are efforts to subject us to other labor related laws or rules, some of which may make us responsible for things done by our subcontractors over which we have little or no control. In addition, our residential mortgage subsidiary is subject to various state and federal statutes, rules and regulations, including those that relate to lending operations and other areas of mortgage origination and loan servicing. The impact of those statutes, rules and regulations can increase our homebuyers’ costs of financing, and our cost of doing business, as well as restricting our homebuyers’ access to some types of loans.
Our obligation to comply with the laws and regulations under which we operate, and our need to ensure that our associates, subcontractors and other agents comply with these laws and regulations, could result in delays in construction and land development, cause us to incur substantial costs and prohibit or restrict land development and homebuilding activity in certain areas in which we operate. Budget reductions by state and local governmental agencies may increase the time it takes to obtain required approvals and therefore may aggravate the delays we could encounter. Government agencies also routinely initiate audits, reviews or investigations of our business practices to ensure compliance with applicable laws and regulations, which can cause us to incur costs or create other disruptions in our businesses that can be significant.
We can be injured by improper acts of persons over whom we do not have control.
Although we expect all of our associates (i.e., employees), officers and directors to comply at all times with all applicable laws, rules and regulations, there may be instances in which subcontractors or others through whom we do business engage in practices that do not comply with applicable laws, regulations or governmental guidelines. When we learn of practices that do not comply with applicable laws or regulations, including practices relating to homes, buildings or multifamily rental properties we build or finance, we move actively to stop the non-complying practices as soon as possible and we have taken disciplinary action with regard to associates of ours who were aware of non-complying practices and did not take steps to address them, including in some instances terminating their employment. However, regardless of the steps we take after we learn of practices that do not comply with applicable laws or regulations, we can in some instances be subject to fines or other governmental penalties, and our reputation can be injured, due to the practices' having taken place.
Our ability to collect upon mortgage loans may be limited by the application of state laws.
Our mortgage loans typically permit us to accelerate the debt upon default by the borrower. The courts of all states will enforce acceleration clauses in the event of a material payment default, subject in some cases to a right of the court to revoke the acceleration and reinstate the mortgage loan if a payment default is cured. The equity courts of a state, however, may refuse to allow the foreclosure of a mortgage or to permit the acceleration of the indebtedness in instances in which they decide that the exercise of those remedies would be inequitable or unjust or the circumstances would render an acceleration unconscionable.
Further, the ability to collect upon mortgage loans may be limited by the application of state and federal laws. For example, Nevada has enacted a law providing that if the amount an assignee of a mortgage note paid to acquire the note is less than the face amount of the note, the creditor cannot recover more through a deficiency action than the amount it paid for the note. If the Nevada law is upheld, or similar laws are enacted in other jurisdictions, it could materially and adversely affect our ability and the ability of funds we manage to profit from purchases of distressed debt.
Other Risks
Our results of operations could be adversely affected if legal claims are brought against us and are not resolved in our favor.
In the ordinary course of our business, we are subject to legal claims by homebuyers, borrowers against whom we have instituted foreclosure proceedings, persons with whom we have land purchase contracts and a variety of other persons. We establish reserves against legal claims and we believe that, in general, they will not have a material adverse effect on our business or financial condition. However, if the amounts we are required to pay as a result of claims against us substantially exceed the sums anticipated by our reserves, the need to pay those amounts could have a material adverse effect on our results of operations for the periods when we are required to make the payments.
15
Information technology failures and data security breaches could harm our business.
We rely extensively on information technology (IT) systems, including Internet sites, data hosting facilities and other hardware and platforms, some of which are hosted by third parties, to assist in conducting our businesses. Our IT systems, like those of most companies, may be vulnerable to a variety of interruptions, including, but not limited to, natural disasters, telecommunications failures, hackers, and other security issues. Moreover, our computer systems, like those of most companies, are subjected to computer viruses or other malicious codes, and to cyber or phishing-attacks. Although we have implemented administrative and technical controls and taken other actions to minimize the risk of cyber incidents and protect our information technology, computer intrusion efforts are becoming increasingly sophisticated, and even the enhanced controls we have installed might be breached. If our IT systems cease to function properly, we could suffer interruptions in our operations. If our cyber-security is breached, unauthorized persons may gain access to proprietary or confidential information, including information about purchasers of our homes or borrowers from our mortgage lending subsidiaries. This could damage our reputation and require us to incur significant costs to repair or restore the security of our computer systems.
Increases in the rate of cancellations of home sale agreements could have an adverse effect on our business.
Our backlog reflects agreements of sale with our homebuyers for homes that have not yet been delivered. We have received a deposit from our home buyer for each home reflected in our backlog, and generally we have the right to retain the deposit if the home buyer does not complete the purchase. In some cases, however, a home buyer may cancel the agreement of sale and receive a complete or partial refund of the deposit for reasons such as state and local laws, the home buyer’s inability to obtain mortgage financing, his or her inability to sell his or her current home or our inability to complete and deliver the home within the specified time. If there is a downturn in the housing market, or if mortgage financing becomes even less available than it currently is, more homebuyers may cancel their agreements of sale with us, which would have an adverse effect on our business and results of operations.
Our success depends on our ability to acquire land suitable for residential homebuilding at reasonable prices, in accordance with our land investment criteria.
There is strong competition among homebuilders for land that is suitable for residential development. The future availability of finished and partially finished developed lots and undeveloped land that meet our internal criteria depends on a number of factors outside our control, including land availability in general, competition with other homebuilders and land buyers for desirable property, inflation in land prices, zoning, allowable housing density, and other regulatory requirements. Should suitable lots or land become less available, the number of homes we could build and sell could be reduced, and the cost of land could be increased, perhaps substantially, which could adversely impact our results of operations.
Expansion of our services and investments into international markets through our Rialto segment subjects us to risks inherent in international operations.
In December 2014, Fund II, of which our Rialto segment owns an interest and for which it performs asset management services, acquired an interest in a joint venture which holds real estate assets in Spain. Expansion of our services and investments into Spain and any expansion into other international markets in the future, could result in operational problems not typically experienced in the United States. Our activities outside the United States will be subject to risks associated with doing business internationally, including fluctuations in currency exchange rates, changes in a specific country’s or region’s political or economic conditions, and competitive disadvantages due to our need to comply with U.S. anti-bribery laws. There also are tax consequences of doing business outside the U.S., both under U.S. tax laws and under the tax laws of the countries in which we do business.
We could suffer adverse tax and other financial consequences if we are unable to utilize our net operating loss ("NOL") carryforwards.
At
November 30, 2014
, we had state tax NOL carryforwards totaling
$113.8 million
that will expire between
2015 and 2034
. As of
November 30, 2014
, state tax NOL carryforwards totaling
$2.0 million
will expire over the next twelve months, if sufficient taxable income is not generated in the applicable states to utilize the net operating losses. At
November 30, 2014
, we had a valuation allowance of
$8.0 million
against our state NOL carryforwards because we believe it is more likely than not that a portion of our state NOL carryforwards will not be realized due to the limited carryforward periods in certain states. If we are unable to use our NOLs, we may have to record charges or reduce our deferred tax assets, which could have an adverse effect on our results of operations.
We experience variability in our operating results on a quarterly basis and, as a result, our historical performance may not be a meaningful indicator of future results.
We historically have experienced, and expect to continue to experience, variability in quarterly results. As a result of such variability, our short-term performance may not be a meaningful indicator of future results. Our homebuilding business is seasonal in nature and generally reflects higher levels of new home order activity in our second fiscal quarter and increased deliveries in
16
the second half of our fiscal year. Our quarterly results of operations may continue to fluctuate in the future as a result of a variety of factors, including, among others, seasonal home buying patterns, the timing of home closings and land sales and weather-related problems.
We have a stockholder who can exercise significant influence over matters that are brought to a vote of our stockholders.
Stuart A. Miller, our Chief Executive Officer and a Director, has voting control, through personal holdings and holdings by family-owned entities, of Class B, and to a lesser extent Class A, common stock that enables Mr. Miller to cast approximately
44%
of the votes that can be cast by the holders of all our outstanding Class A and Class B common stock combined. That effectively gives Mr. Miller the power to control the election of our directors and the approval of matters that are presented to our stockholders. Mr. Miller's voting power might discourage someone from seeking to acquire us or from making a significant equity investment in us, even if we needed the investment to meet our obligations or to operate our business. Also, because of his voting power, Mr. Miller could be able to authorize actions that are contrary to our other stockholders' desires.
The trading price of our Class B common stock normally is lower than that of our Class A common stock.
The only difference between our Class A common stock and our Class B common stock is that the Class B common stock entitles the holders to 10 votes per share, while the Class A common stock entitles holders to only one vote per share. However, the trading price of the Class B common stock on the New York Stock Exchange ("NYSE") normally is lower than the NYSE trading price of our Class A common stock. We believe this is because only a relatively small number of shares of Class B common stock are available for trading, which reduces the liquidity of the market for our Class B common stock to a point where many investors are reluctant to invest in it. The limited liquidity could make it difficult for a holder of a significant number of shares of our Class B common stock to dispose of the stock without materially reducing the trading price of the Class B common stock.
Changes in global or regional environmental conditions and governmental actions in response to such changes may adversely affect us by increasing the costs of or restricting our planned or future growth activities.
There is growing concern from many members of the scientific community and the general public that an increase in global average temperatures due to emissions of greenhouse gases and other human activities have caused, or will cause, significant changes in weather patterns and increase the frequency and severity of natural disasters. Government mandates, standards or regulations intended to reduce greenhouse gas emissions or projected climate change impacts could result in restrictions on land development in certain areas and increased energy, transportation and raw material costs, or cause us to incur compliance expenses that we will be unable fully to recover, which could reduce our housing gross profit margins and adversely affect our results of operations.
|
Item 1B.
|
Unresolved Staff Comments.
|
Not applicable.
Executive Officers of Lennar Corporation
The following individuals are our executive officers as of
January 23, 2015
:
|
Name
|
Position
|
Age
|
|
Stuart A. Miller
|
Chief Executive Officer
|
57
|
|
Richard Beckwitt
|
President
|
55
|
|
Jonathan M. Jaffe
|
Vice President and Chief Operating Officer
|
55
|
|
Bruce E. Gross
|
Vice President and Chief Financial Officer
|
56
|
|
Diane J. Bessette
|
Vice President and Treasurer
|
54
|
|
Mark Sustana
|
Secretary and General Counsel
|
53
|
|
David M. Collins
|
Controller
|
45
|
Mr. Miller is one of our Directors and has served as our Chief Executive Officer since 1997. Mr. Miller served as our President from 1997 to April 2011. Before 1997, Mr. Miller held various executive positions with us.
Mr. Beckwitt served as our Executive Vice President from March 2006 to 2011. Since April 2011, Mr. Beckwitt has served as our President. As our Executive Vice President and then our President, Mr. Beckwitt has been involved in all operational aspects of our company. Mr. Beckwitt served on the Board of Directors of D.R. Horton, Inc. from 1993 to November 2003. From 1993 to March 2000, he held various executive officer positions at D.R. Horton, including President of the company.
17
Mr. Jaffe has served as Vice President since 1994 and has served as our Chief Operating Officer since December 2004. Before that time, Mr. Jaffe served as a Regional President in our Homebuilding operations. Additionally, prior to his appointment as Chief Operating Officer, Mr. Jaffe was one of our Directors from 1997 through June 2004.
Mr. Gross has served as Vice President and our Chief Financial Officer since 1997. Before that, Mr. Gross was Senior Vice President, Controller and Treasurer of Pacific Greystone Corporation, which we acquired in 1997.
Ms. Bessette joined us in 1995 and served as our Controller from 1997 to 2008. Since February 2008, she has served as our Treasurer. She was appointed a Vice President in 2000.
Mr. Sustana has served as our Secretary and General Counsel since 2005.
Mr. Collins joined us in 1998 and has served as our Controller since February 2008. Before becoming Controller, Mr. Collins served as our Executive Director of Financial Reporting.
|
Item 2.
|
Properties.
|
We lease and maintain our executive offices in an office complex in Miami, Florida. Our homebuilding, financial services, Rialto and multifamily offices are located in the markets where we conduct business, primarily in leased space. We believe that our existing facilities are adequate for our current and planned levels of operation.
Because of the nature of our homebuilding operations, significant amounts of property are held as inventory in the ordinary course of our homebuilding business. We discuss these properties in the discussion of our homebuilding operations in Item 1 of this Report.
|
Item 3.
|
Legal Proceedings.
|
We are party to various claims and lawsuits which arise in the ordinary course of business, but we do not consider the volume of our claims and lawsuits unusual given the number of homes we deliver and the fact that the lawsuits often relate to homes delivered several years before the lawsuits are commenced. Although the specific allegations in the lawsuits differ, they most commonly involve claims that we failed to construct homes in particular communities in accordance with plans and specifications or applicable construction codes and seek reimbursement for sums allegedly needed to remedy the alleged deficiencies, assert contract issues or relate to personal injuries. Lawsuits of these types are common within the homebuilding industry. We are a plaintiff in many cases in which we seek contribution from our subcontractors for home repair costs. The costs incurred by us in construction defect lawsuits may be offset by warranty reserves, our third-party insurers, subcontractor insurers and indemnity contributions from subcontractors. We are also a party to various lawsuits involving purchases and sales of real property. These lawsuits include claims regarding representations and warranties made in connection with the transfer of the property and disputes regarding the obligation to purchase or sell the property. We do not believe that the ultimate resolution of these claims or lawsuits will have a material adverse effect on our business or financial position. However, the financial effect of litigation concerning purchases and sales of property may depend upon the value of the subject property, which may have changed from the time the agreement for purchase or sale was entered into. From time-to-time, we also receive notices from environmental agencies or other regulators regarding alleged violations of environmental or other laws. We typically settle these matters before they reach litigation for amounts that are not material to us.
We have been engaged in litigation since 2008 in the United States District Court for the District of Maryland (U.S. Home Corporation v. Settlers Crossing, LLC, et al., Civil Action No. DKC 08-1863) regarding whether we are required by a contract we entered into in 2005 to purchase a property in Maryland. After entering into the contract, we later renegotiated the purchase price, reducing it from
$200 million
to
$134 million
,
$20 million
of which has been paid and subsequently written off, leaving a balance of
$114 million
. In July 2014, the Court ruled that we may be obligated to purchase the property. As a result of changes in zoning for the property during the litigation, the Court ordered further proceedings to determine whether the sellers are entitled to specific performance and, if so, whether a further reduction in the purchase price is required.
In January 2015, the Court rendered a decision ordering us to purchase the property for the $114 million balance of the contract price, to pay interest at the rate of 12% per annum from May 27, 2008, and to reimburse the seller for real estate taxes and attorneys’ fees. We believe the decision is contrary to applicable law and will appeal the decision.
In December 2013, we were awarded by a civil jury $802 million in compensatory damages and $200 million in punitive damages against Nicolas Marsch III and his company, Briarwood Capital LLC, on court findings of defamation and conspiracy to extort money from us in 2008 and 2009 (Lennar Corp. v. Briarwood Capital LLC, 2008-055741-CA-01, Florida Circuit Court, Miami-Dade County). We do not expect to be able to collect the amount awarded to us.
|
Item 4.
|
Mine Safety Disclosures.
|
Not applicable.
18
|
Item 5.
|
Market for Registrant’s Common Equity, Related Stockholder Matters and Issuer Purchases of Equity Securities.
|
Our Class A and Class B common stock are listed on the New York Stock Exchange under the symbols “LEN” and “LEN.B,” respectively. The following table shows the high and low sales prices for our Class A and Class B common stock for the periods indicated, as reported by the NYSE, and cash dividends declared per share:
|
|
Class A Common Stock
High/Low Prices
|
Cash Dividends
Per Class A Share
|
|||||
|
Fiscal Quarter
|
2014
|
2013
|
2014
|
2013
|
|||
|
First
|
$44.40 - 34.09
|
$43.22 - 35.51
|
4¢
|
4¢
|
|||
|
Second
|
$44.30 - 37.32
|
$44.40 - 36.76
|
4¢
|
4¢
|
|||
|
Third
|
$42.67 - 35.74
|
$39.97 - 31.35
|
4¢
|
4¢
|
|||
|
Fourth
|
$48.00 - 37.50
|
$37.84 - 31.09
|
4¢
|
4¢
|
|||
|
|
Class B Common Stock
High/Low Prices
|
Cash Dividends
Per Class B Share
|
|||||
|
Fiscal Quarter
|
2014
|
2013
|
2014
|
2013
|
|||
|
First
|
$36.56 - 28.65
|
$34.87 - 28.28
|
4¢
|
4¢
|
|||
|
Second
|
$36.31 - 31.63
|
$34.73 - 28.55
|
4¢
|
4¢
|
|||
|
Third
|
$35.98 - 30.06
|
$31.25 - 25.18
|
4¢
|
4¢
|
|||
|
Fourth
|
$38.58 - 30.96
|
$30.94 - 25.38
|
4¢
|
4¢
|
|||
As of December 31,
2014
, the last reported sale price of our Class A common stock was $44.81 and the last reported sale price of our Class B common stock was $36.11. As of December 31,
2014
, there were approximately 803 and 575 holders of record of our Class A and Class B common stock, respectively.
On January 14,
2015
, our Board of Directors declared a quarterly cash dividend of $0.04 per share for both our Class A and Class B common stock, which is payable on February 12,
2015
, to holders of record at the close of business on January 29,
2015
. Our Board of Directors evaluates each quarter the decision whether to declare a dividend and the amount of the dividend.
The following table provides information about the Company's repurchases of common stock during the three months ended
November 30, 2014
:
|
Period:
|
Total Number of Shares Purchased (1)
|
Average Price Paid Per Share
|
Total Number of Shares Purchased as Part of Publicly Announced Plans or Programs (2)
|
Maximum Number of Shares that may yet be Purchased under the Plans or Programs (2)
|
||||||||
|
September 1 to September 30, 2014
|
—
|
|
$
|
—
|
|
—
|
|
6,218,968
|
|
|||
|
October 1 to October 31, 2014
|
—
|
|
$
|
—
|
|
—
|
|
6,218,968
|
|
|||
|
November 1 to November 30, 2014
|
173,858
|
|
$
|
47.24
|
|
—
|
|
6,218,968
|
|
|||
|
(1)
|
Represents shares of Class A common stock withheld by us to cover withholding taxes due, at the election of certain holders of nonvested shares, with market value approximating the amount of withholding taxes due.
|
|
(2)
|
In June 2001, our Board of Directors authorized a stock repurchase program under which we were authorized to purchase up to
20 million
shares of our outstanding Class A common stock or Class B common stock. This repurchase authorization has no expiration date.
|
The information required by Item 201(d) of Regulation S-K is provided in Item 12 of this Report.
19
Performance Graph
The following graph compares the five-year cumulative total return of our Class A common stock with the Dow Jones U.S. Home Construction Index and the Dow Jones U.S. Total Market Index. The graph assumes $100 invested on November 30, 2009 in our Class A common stock, the Dow Jones U.S. Home Construction Index and the Dow Jones U.S. Total Market Index, and the reinvestment of all dividends.
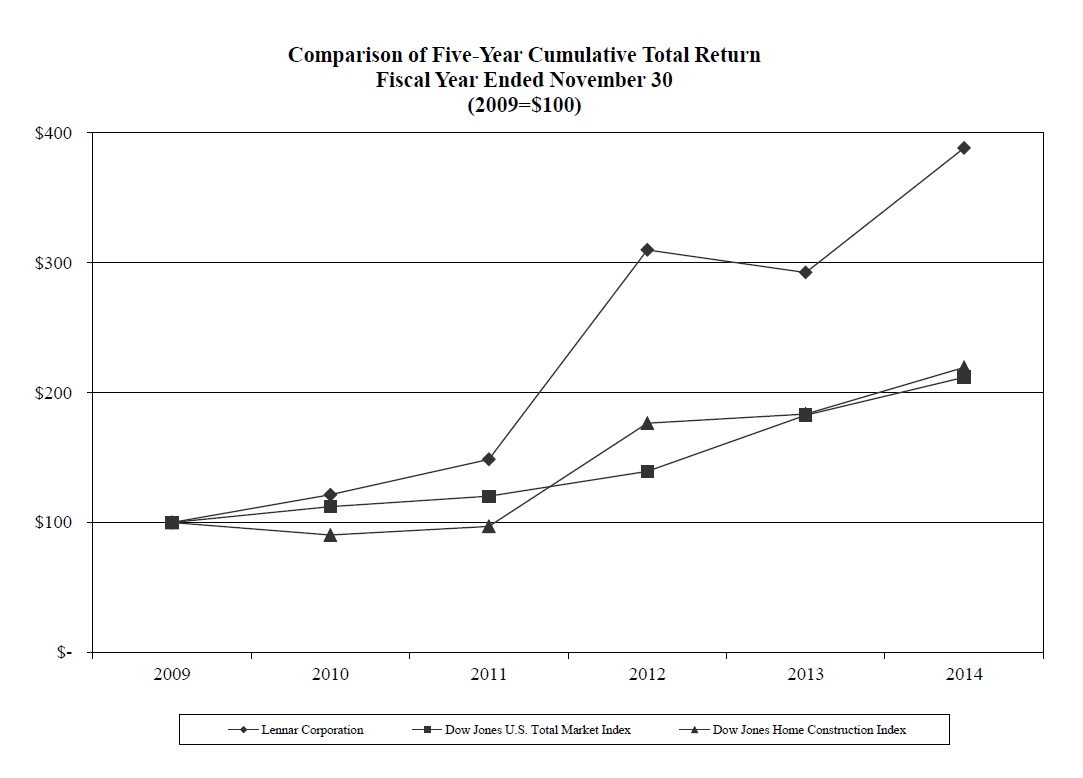
|
2009
|
2010
|
2011
|
2012
|
2013
|
2014
|
|||||||||||||
|
Lennar Corporation
|
$
|
100
|
|
121
|
|
149
|
|
310
|
|
293
|
|
388
|
|
|||||
|
Dow Jones U.S. Home Construction Index
|
$
|
100
|
|
90
|
|
97
|
|
177
|
|
184
|
|
220
|
|
|||||
|
Dow Jones U.S. Total Market Index
|
$
|
100
|
|
112
|
|
120
|
|
139
|
|
183
|
|
212
|
|
|||||
20
|
Item 6.
|
Selected Financial Data.
|
The following table sets forth our selected consolidated financial and operating information as of or for each of the years ended November 30, 2010 through
2014
. The information presented below is based upon our historical financial statements.
|
At or for the Years Ended November 30,
|
|||||||||||||||
|
(Dollars in thousands, except per share amounts)
|
2014
|
2013
|
2012
|
2011
|
2010
|
||||||||||
|
Results of Operations:
|
|||||||||||||||
|
Revenues:
|
|||||||||||||||
|
Lennar Homebuilding
|
$
|
7,025,130
|
|
5,354,947
|
|
3,581,232
|
|
2,675,124
|
|
2,705,639
|
|
||||
|
Lennar Financial Services
|
$
|
454,381
|
|
427,342
|
|
384,618
|
|
255,518
|
|
275,786
|
|
||||
|
Rialto
|
$
|
230,521
|
|
138,060
|
|
138,856
|
|
164,743
|
|
92,597
|
|
||||
|
Lennar Multifamily
|
$
|
69,780
|
|
14,746
|
|
426
|
|
—
|
|
—
|
|
||||
|
Total revenues
|
$
|
7,779,812
|
|
5,935,095
|
|
4,105,132
|
|
3,095,385
|
|
3,074,022
|
|
||||
|
Operating earnings (loss):
|
|||||||||||||||
|
Lennar Homebuilding (1)
|
$
|
1,033,721
|
|
733,075
|
|
258,985
|
|
109,505
|
|
100,060
|
|
||||
|
Lennar Financial Services
|
$
|
80,138
|
|
85,786
|
|
84,782
|
|
20,729
|
|
31,284
|
|
||||
|
Rialto
|
$
|
44,079
|
|
26,128
|
|
11,569
|
|
63,457
|
|
57,307
|
|
||||
|
Lennar Multifamily
|
$
|
(10,993
|
)
|
(16,988
|
)
|
(5,884
|
)
|
(461
|
)
|
—
|
|
||||
|
Corporate general and administrative expenses
|
$
|
177,161
|
|
146,060
|
|
127,338
|
|
95,256
|
|
93,926
|
|
||||
|
Earnings before income taxes
|
$
|
969,784
|
|
681,941
|
|
222,114
|
|
97,974
|
|
94,725
|
|
||||
|
Net earnings attributable to Lennar (2)
|
$
|
638,916
|
|
479,674
|
|
679,124
|
|
92,199
|
|
95,261
|
|
||||
|
Diluted earnings per share
|
$
|
2.80
|
|
2.15
|
|
3.11
|
|
0.48
|
|
0.51
|
|
||||
|
Cash dividends declared per each - Class A and
Class B common stock
|
$
|
0.16
|
|
0.16
|
|
0.16
|
|
0.16
|
|
0.16
|
|
||||
|
Financial Position:
|
|||||||||||||||
|
Total assets
|
$
|
12,958,267
|
|
11,273,247
|
|
10,362,206
|
|
9,154,671
|
|
8,787,851
|
|
||||
|
Debt:
|
|||||||||||||||
|
Lennar Homebuilding
|
$
|
4,690,213
|
|
4,194,432
|
|
4,005,051
|
|
3,362,759
|
|
3,128,154
|
|
||||
|
Rialto
|
$
|
623,246
|
|
441,883
|
|
574,480
|
|
765,541
|
|
752,302
|
|
||||
|
Lennar Financial Services
|
$
|
704,143
|
|
374,166
|
|
457,994
|
|
410,134
|
|
271,678
|
|
||||
|
Lennar Multifamily
|
$
|
—
|
|
13,858
|
|
—
|
|
—
|
|
—
|
|
||||
|
Stockholders’ equity
|
$
|
4,827,020
|
|
4,168,901
|
|
3,414,764
|
|
2,696,468
|
|
2,608,949
|
|
||||
|
Total equity
|
$
|
5,251,302
|
|
4,627,470
|
|
4,001,208
|
|
3,303,525
|
|
3,194,383
|
|
||||
|
Shares outstanding (000s)
|
205,039
|
|
204,412
|
|
191,548
|
|
188,403
|
|
186,636
|
|
|||||
|
Stockholders’ equity per share
|
$
|
23.54
|
|
20.39
|
|
17.83
|
|
14.31
|
|
13.98
|
|
||||
|
Lennar Homebuilding Data (including unconsolidated entities):
|
|||||||||||||||
|
Number of homes delivered
|
21,003
|
|
18,290
|
|
13,802
|
|
10,845
|
|
10,955
|
|
|||||
|
New orders
|
22,029
|
|
19,043
|
|
15,684
|
|
11,412
|
|
10,928
|
|
|||||
|
Backlog of home sales contracts
|
5,832
|
|
4,806
|
|
4,053
|
|
2,171
|
|
1,604
|
|
|||||
|
Backlog dollar value
|
$
|
1,974,328
|
|
1,619,601
|
|
1,160,385
|
|
560,659
|
|
407,292
|
|
||||
|
(1)
|
Lennar Homebuilding operating earnings include
$9.9 million
,
$7.5 million
,
$15.6 million
, $38.0 million and $51.3 million of inventory valuation adjustments for the years ended November 30, 2014, 2013, 2012, 2011 and 2010, respectively. In addition, operating earnings include
$4.6 million
,
$12.1 million
, $8.9 million and $10.5 million of our share of valuation adjustments related to assets of unconsolidated entities in which we have investments for the years ended November 30,
2014
, 2012, 2011 and 2010, respectively, and $10.5 million and $1.7 million of valuation adjustments to our investments in unconsolidated entities for the years ended November 30, 2011 and 2010, respectively.
|
|
(2)
|
Net earnings attributable to Lennar for the year ended November 30, 2014 includes
$341.1 million
tax provision for income taxes related to pre-tax earnings of the period, compared to a
$177.0 million
net tax provision in the year ended
November 30, 2013
, which included a tax benefit of
$67.1 million
for a valuation allowance reversal. Net earnings attributable to Lennar for the year ended November 30, 2012 includes $435.2 million of benefit for income taxes, which includes a reversal of the majority of our deferred tax asset valuation allowance of $491.5 million, partially offset by a tax provision for fiscal year 2012 pre-tax earnings. Net earnings attributable to Lennar for the years ended November 30, 2011 and 2010 include $14.6 million and $25.7 million, respectively, of benefit for income taxes, primarily due to settlements with various taxing authorities.
|
21
|
Item 7.
|
Management’s Discussion and Analysis of Financial Condition and Results of Operations.
|
The following discussion and analysis of our financial condition and results of operations should be read in conjunction with “Selected Financial Data” and our audited consolidated financial statements and accompanying notes included elsewhere in this Report.
Special Note Regarding Forward-Looking Statements
This annual report on Form 10-K contains “forward-looking statements” within the meaning of the Private Securities Litigation Reform Act of 1995. These statements concern expectations, beliefs, projections, plans and strategies, anticipated events or trends and similar expressions concerning matters that are not historical facts. The forward-looking statements in this annual report include statements regarding: our belief that we are still in the early stages of a protracted slow growth housing recovery, our belief regarding the drivers of such recovery, and our belief that we are well positioned to benefit from the recovery; our belief that the recovery will continue to benefit the rental market; our expectation that will see some margin contraction in 2015; our belief regarding the impact of the decline in oil prices on our Homebuilding operations; our expectation that we will continue to invest in carefully underwritten strategic land acquisitions; our expectation that we will start generating positive cash flows in fiscal 2016; our expectation that our Financial Services segment's earnings will increase in fiscal 2015; our expectation that Rialto's RMF business will begin to generate a more predictable and recurring component of earnings for Rialto; our expectation that the Multifamily segment will complete the construction of its development pipeline over the next four years, that we will sell our rental properties once rents and occupancies have stabilized, and that we will sell another five communities towards the end of fiscal 2015; our expectation that FivePoint Communities will continue to mature as a long-term strategy; our belief that our main driver of earnings will continue to be our homebuilding and Financial Services operations; our belief that we are well positioned to deliver between 23,500 and 24,000 homes with gross margins expected to average about 24% during fiscal 2015; our belief that we are on track to achieve another year of substantial profitability in fiscal 2015; our intent to settle the face value of the 2.75% convertible senior notes due 2020 in cash; our expectation regarding our variability in our quarterly results; our expectations regarding the renewal or replacement of our warehouse facilities; our belief regarding draws upon our bonds or letters of credit, and our belief regarding the impact to the Company if there were such a draw; our expectation that substantially all homes currently in backlog will be delivered in fiscal year 2015; our belief that our operations and borrowing resources will provide for our current and long-term capital requirements at our anticipated levels of activity; our belief regarding legal proceedings in which we are involved; and our estimates regarding certain tax matters and accounting valuations, including our expectations regarding the result of anticipated settlements with various taxing authorities.
These forward-looking statements reflect our current views about future events and are subject to risks, uncertainties and assumptions. We wish to caution readers that certain important factors may have affected and could in the future affect our actual results and could cause actual results to differ significantly from those expressed in any forward-looking statement. The most important factors that could prevent us from achieving our goals, and cause the assumptions underlying forward-looking statements and the actual results to differ materially from those expressed in or implied by those forward-looking statements include, but are not limited to, the following: a slowdown in the recovery of real estate markets across the nation, or any downturn in such markets; changes in general economic and financial conditions, and demographic trends, in the U.S. leading to decreased demand for our services and homes, lower profit margins and reduced access to credit; unfavorable or unanticipated outcomes in legal proceedings that substantially exceed our expectations; the possibility that we will incur nonrecurring costs that may not have a material adverse effect on our business or financial condition, but may have a material adverse effect on our consolidated financial statements for a particular reporting period; decreased demand for our Multifamily rental properties, and our ability to successfully sell our rental properties once rents and occupancies have stabilized; our ability to acquire land and pursue real estate opportunities at anticipated prices; increased competition for home sales from other sellers of new and resale homes; conditions in the capital, credit and financial markets, including mortgage lending standards, the availability of mortgage financing and mortgage foreclosure rates; changes in interest and unemployment rates, and inflation; a decline in the value of the land and home inventories we maintain or possible future write-downs of the carrying value of our real estate assets; increases in operating costs, including costs related to real estate taxes, construction materials, labor and insurance, and our ability to manage our cost structure, both in our Homebuilding and Multifamily businesses; our inability to maintain anticipated pricing levels and our inability to predict the effect of interest rates on demand; the ability and willingness of the participants in various joint ventures to honor their commitments; our ability to successfully and timely obtain land-use entitlements and construction financing, and address issues that arise in connection with the use and development of our land; natural disasters and other unforeseen damage for which our insurance may not provide adequate coverage; our inability to successfully grow our ancillary businesses; potential liability under environmental or construction laws, or other laws or regulations affecting our business; regulatory changes that adversely affect the profitability of our businesses; our ability to comply with the terms of our debt instruments; and our ability to successfully estimate the impact of certain regulatory, accounting and tax matters.
22
Please see “Item 1A-Risk Factors” of this Annual Report for a further discussion of these and other risks and uncertainties which could affect our future results. We undertake no obligation to publicly revise any forward-looking statements to reflect events or circumstances after the date of those statements or to reflect the occurrence of anticipated or unanticipated events, except to the extent we are legally required to disclose certain matters in SEC filings or otherwise.
Outlook
We continue to believe that we are still in the early stages of a protracted slow growth housing recovery. The housing market's recovery has continued its progression at a slow and steady pace, moving upward in a fairly narrow channel as we enter fiscal 2015. The recovery has been supported on the downside by the significant production deficit that has resulted from the extremely low volumes of dwellings, both single family and multifamily, that has been built over the past seven years. At the same time, the recovery has been constrained by a limited supply of available homes on the market, limited supply of land available to add to the supply of homes and constrained demand from purchasers who would like to buy but are unable to access the mortgage market. We believe the recovery will also continue to benefit the rental market as first time home purchasers find limited access to the for sale market as a result of high down payments and strict underwriting standards.
Looking back, fiscal 2014 was an excellent year for Lennar, with revenues and pretax earnings attributable to Lennar increasing 31% and 49%, respectively, from 2013. In fiscal 2014, our gross margin increased 50 basis points to 25.4%. This gross margin, combined with our selling, general and administrative expenses of 10.5%, increased our operating margin 60 basis points to 14.9% during fiscal 2014. During fiscal 2014, labor and material costs increased by 7%, which represents a slowing pace of costs increases from the past two years. In addition, we ended the year with a strong sales backlog, up 21% in homes and 22% in dollar value, which gives us a great start for fiscal 2015.
During fiscal 2014, we also had strong performances from our other business segments. Our Financial Services segment produced $80.1 million of pretax earnings. Rialto generated $66.6 million of operating earnings net of earnings attributable to noncontrolling interests, benefiting from the Rialto Mortgage Finance ("RMF") business and earnings from its real estate funds. Our Multifamily rental business continued to grow during fiscal 2014, as it sold two completed rental properties and ended the year with
19
communities under construction,
one
completed and fully leased,
three
partially completed and leasing and
one
under development. Finally, our FivePoint Communities is well positioned, managing the entitlement and development of some of the most desirable real estate assets in Southern and Northern California.
In fiscal 2015, our principal focus in our homebuilding operations will continue to be on generating strong operating margins on the homes we sell by delivering homes from our excellent land positions, although we expect to see some margin contraction due to competitive pressures and the inclusion of some additional previously mothballed land assets being developed. In addition, the significant decline in oil prices may negatively impact our Houston segment in fiscal 2015, however this decline could potentially have offsetting benefits. Thus we cannot project the impact of declining oil prices at this time. We will continue to carefully balance pricing power, sales incentives, brokerage commissions and advertising expenses to maximize our results. In addition, we plan to continue to invest in carefully underwritten strategic land acquisitions in well-positioned markets that we expect will continue to support our homebuilding operations going forward and help us increase operating leverage as our deliveries increase. In fiscal 2014, land purchases were $1.4 billion compared to $1.8 billion in fiscal 2013. For fiscal 2015, we are continuing our pivot towards a land lighter model in homebuilding with the focus of becoming cash flow positive and deleveraging our balance sheet. We expect to start generating positive cash flows in fiscal 2016.
During fiscal 2015, we expect our Financial Services segment's earnings to increase as the segment will continue to benefit as our homebuilding business expands and the number of non-Lennar purchasers using our mortgage company continues to grow in various markets. We are also focused on our multiple platforms including Rialto, Multifamily, and FivePoint. As Rialto continues to grow as a blue chip capital investment management company and commercial real estate capital provider, we expect contributions from Rialto's RMF business will begin to generate a more predictable and recurring component of earnings for Rialto. In fiscal 2015, Rialto will continue its transition into an asset light, fund model. Our Multifamily segment anticipates that the construction of its development pipeline will be completed over the next four years, and as a merchant builder of apartments, we plan to sell our apartments once rents and occupancies have stabilized. We are well positioned and expect to sell another five communities towards the end of fiscal 2015. In addition, we expect FivePoint Communities to continue to mature as a long-term strategy as it develops land in premium California locations to fill the growing demand for well-located approved and developed homesites.
In conclusion, we believe that our Company remains well positioned to benefit from the housing market's recovery. We expect that our Company's main driver of earnings will continue to be our homebuilding and Financial Services operations, as we are currently well positioned to deliver between 23,500 and 24,000 homes with gross margins expected to average about 24% during fiscal 2015. We are also focused on our multiple platforms including Rialto, Multifamily, and FivePoint, as such ancillary business continue to mature and expand their franchises providing longer-term opportunities that we expect will enhance shareholder value. Overall, we are on track to achieve another year of substantial profitability in fiscal 2015, as the
23
housing market recovery continues and we will continue to benefit from our strategic land acquisitions and new community openings.
Results of Operations
Overview
Our net earnings attributable to Lennar in
2014
were
$638.9 million
, or
$2.80
per diluted share (
$3.12
per basic share), compared to
$479.7 million
, or
$2.15
per diluted share (
$2.48
per basic share), in
2013
. Our
2014
earnings before taxes were
$969.8 million
, compared to
$681.9 million
in
2013
.
The following table sets forth financial and operational information for the years indicated related to our operations.
|
Years Ended November 30,
|
|||||||||
|
(Dollars in thousands)
|
2014
|
2013
|
2012
|
||||||
|
Lennar Homebuilding revenues:
|
|||||||||
|
Sales of homes
|
$
|
6,839,642
|
|
5,292,072
|
|
3,492,177
|
|
||
|
Sales of land
|
185,488
|
|
62,875
|
|
89,055
|
|
|||
|
Total Lennar Homebuilding revenues
|
7,025,130
|
|
5,354,947
|
|
3,581,232
|
|
|||
|
Lennar Homebuilding costs and expenses:
|
|||||||||
|
Cost of homes sold
|
5,103,409
|
|
3,973,812
|
|
2,698,831
|
|
|||
|
Cost of land sold
|
143,797
|
|
45,834
|
|
78,808
|
|
|||
|
Selling, general and administrative
|
714,823
|
|
559,462
|
|
438,727
|
|
|||
|
Total Lennar Homebuilding costs and expenses
|
5,962,029
|
|
4,579,108
|
|
3,216,366
|
|
|||
|
Lennar Homebuilding operating margins
|
1,063,101
|
|
775,839
|
|
364,866
|
|
|||
|
Lennar Homebuilding equity in earnings (loss) from unconsolidated entities
|
(355
|
)
|
23,803
|
|
(26,672
|
)
|
|||
|
Lennar Homebuilding other income, net
|
7,526
|
|
27,346
|
|
15,144
|
|
|||
|
Other interest expense
|
(36,551
|
)
|
(93,913
|
)
|
(94,353
|
)
|
|||
|
Lennar Homebuilding operating earnings
|
$
|
1,033,721
|
|
733,075
|
|
258,985
|
|
||
|
Lennar Financial Services revenues
|
$
|
454,381
|
|
427,342
|
|
384,618
|
|
||
|
Lennar Financial Services costs and expenses
|
374,243
|
|
341,556
|
|
299,836
|
|
|||
|
Lennar Financial Services operating earnings
|
$
|
80,138
|
|
85,786
|
|
84,782
|
|
||
|
Rialto revenues
|
$
|
230,521
|
|
138,060
|
|
138,856
|
|
||
|
Rialto costs and expenses
|
249,114
|
|
151,072
|
|
138,990
|
|
|||
|
Rialto equity in earnings from unconsolidated entities
|
59,277
|
|
22,353
|
|
41,483
|
|
|||
|
Rialto other income (expense), net
|
3,395
|
|
16,787
|
|
(29,780
|
)
|
|||
|
Rialto operating earnings
|
$
|
44,079
|
|
26,128
|
|
11,569
|
|
||
|
Lennar Multifamily revenues
|
69,780
|
|
14,746
|
|
426
|
|
|||
|
Lennar Multifamily costs and expenses
|
95,227
|
|
31,463
|
|
6,306
|
|
|||
|
Lennar Multifamily equity in earnings (loss) from unconsolidated entities
|
14,454
|
|
(271
|
)
|
(4
|
)
|
|||
|
Lennar Multifamily operating loss
|
$
|
(10,993
|
)
|
(16,988
|
)
|
(5,884
|
)
|
||
|
Total operating earnings
|
$
|
1,146,945
|
|
828,001
|
|
349,452
|
|
||
|
Corporate general administrative expenses
|
177,161
|
|
146,060
|
|
127,338
|
|
|||
|
Earnings before income taxes
|
$
|
969,784
|
|
681,941
|
|
222,114
|
|
||
|
Net earnings attributable to Lennar
|
$
|
638,916
|
|
479,674
|
|
679,124
|
|
||
|
Gross margin as a % of revenue from home sales
|
25.4
|
%
|
24.9
|
%
|
22.7
|
%
|
|||
|
S,G&A expenses as a % of revenues from home sales
|
10.5
|
%
|
10.6
|
%
|
12.6
|
%
|
|||
|
Operating margin as a % of revenues from home sales
|
14.9
|
%
|
14.3
|
%
|
10.2
|
%
|
|||
|
Average sales price
|
$
|
326,000
|
|
290,000
|
|
255,000
|
|
||
24
2014
versus
2013
Revenues from home sales increased
29%
in the year ended
November 30, 2014
to
$6.8 billion
from
$5.3 billion
in
2013
. Revenues were higher primarily due to a
15%
increase in the number of home deliveries, excluding unconsolidated entities, and a 12% increase in the average sales price of homes delivered. New home deliveries, excluding unconsolidated entities, increased to
20,971
homes in the year ended
November 30, 2014
from
18,234
homes last year. There was an increase in home deliveries in all of our Homebuilding segments and Homebuilding Other, which was primarily driven by an increase in active communities over the last year. The average sales price of homes delivered increased to
$326,000
in the year ended
November 30, 2014
from
$290,000
in the year ended
November 30, 2013
, primarily due to increased pricing in many of our markets as the market recovery continues. Sales incentives offered to homebuyers were
$21,400
per home delivered in the year ended
November 30, 2014
, or
6.2%
as a percentage of home sales revenue, compared to
$20,500
per home delivered in the year ended
November 30, 2013
, or
6.6%
as a percentage of home sales revenue. Currently, our biggest competition is from the sales of existing and foreclosed homes. We differentiate our new homes from those homes by issuing new home warranties, updated floor plans, our Everything's Included marketing program, community amenities and in certain markets by emphasizing energy efficiency and new technologies.
Gross margins on home sales were
$1.7 billion
, or
25.4%
, in the year ended
November 30, 2014
, compared to gross margins on home sales of
$1.3 billion
, or
24.9%
, in the year ended
November 30, 2013
. Gross margin percentage on home sales improved compared to the year ended
November 30, 2013
, primarily due to an increase in the average sales price of homes delivered, a decrease in sales incentives offered to homebuyers as a percentage of revenue from home sales and $20.9 million of insurance recoveries and other nonrecurring items, partially offset by an increase in materials, labor and land costs.
Gross profits on land sales totaled
$41.7 million
in the year ended
November 30, 2014
, compared to
$17.0 million
in the year ended
November 30, 2013
. Gross profits on land sales in the year ended
November 30, 2013
included a $4.8 million recovery of an option deposit previously written-off.
Selling, general and administrative expenses were
$714.8 million
in the year ended
November 30, 2014
, compared to
$559.5 million
in the year ended
November 30, 2013
. As a percentage of revenues from home sales, selling, general and administrative expenses improved to
10.5%
in the year ended
November 30, 2014
, from
10.6%
in the year ended
November 30, 2013
.
Lennar Homebuilding equity in earnings (loss) from unconsolidated entities was
($0.4) million
in the year ended
November 30, 2014
, compared to
$23.8 million
in the year ended
November 30, 2013
. In the year ended
November 30, 2014
, Lennar Homebuilding equity in loss from unconsolidated entities related to our share of operating losses of Lennar Homebuilding unconsolidated entities, which included
$4.6 million
of our share of valuation adjustments related to assets of Lennar Homebuilding unconsolidated entities, partially offset by our share of operating earnings of
$4.7 million
related to a third-party land sale by one unconsolidated entity. In the year ended
November 30, 2013
, Lennar Homebuilding equity in earnings from unconsolidated entities included our share of operating earnings of
$19.8 million
primarily related to sales of homesites to third parties by one unconsolidated entity for approximately
$204 million
resulting in a gross profit of approximately
$67 million
.
Lennar Homebuilding other income, net, totaled
$7.5 million
in the year ended
November 30, 2014
, compared to
$27.3 million
in the year ended
November 30, 2013
. In the year ended
November 30, 2013
, Lennar Homebuilding other income, net was primarily due to management fees and the sale of a rental operating property by one of our consolidated joint ventures that resulted in a gain of $14.4 million (the transaction resulted in a net loss of $3.2 million after considering the impact of noncontrolling interests totaling $17.6 million), partially offset by other expenses.
Lennar Homebuilding interest expense was
$201.5 million
in the year ended
November 30, 2014
(
$161.4 million
was included in cost of homes sold,
$3.6 million
in cost of land sold and
$36.6 million
in other interest expense), compared to
$214.3 million
in the year ended
November 30, 2013
(
$117.8 million
was included in cost of homes sold,
$2.6 million
in cost of land sold and
$93.9 million
in other interest expense). Interest expense decreased due to an increase in qualifying assets eligible for interest capitalization, partially offset by an increase in our outstanding debt and home deliveries.
Operating earnings for our Lennar Financial Services segment were
$80.1 million
in the year ended
November 30, 2014
, compared to operating earnings of
$85.8 million
in the year ended
November 30, 2013
. The decrease in profitability was primarily due to a more competitive environment as a result of a significant decrease in refinance transactions, which resulted in lower profit per transaction in the segment's mortgage operations.
Operating earnings for our Rialto segment were
$66.6 million
in the year ended
November 30, 2014
(which included
$44.1 million
of operating earnings and an add back of
$22.5 million
of net loss attributable to noncontrolling interests), compared to operating earnings of
$19.9 million
(which included
$26.1 million
of operating earnings, partially offset by
$6.2 million
of net earnings attributable to noncontrolling interests) in the year ended
November 30, 2013
.
25
Rialto revenues were
$230.5 million
in the year ended
November 30, 2014
, compared to revenues of
$138.1 million
in the year ended
November 30, 2013
. Revenues increased primarily due to the receipt of a $34.7 million advanced distribution with regard to Rialto's carried interest in Rialto Real Estate Fund, LP (“Fund I”) in order to cover the income tax obligation which resulted from allocations of taxable income due to Rialto’s general partner interest in Fund I. In addition, revenues increased due to an increase in securitization revenue and interest income from Rialto Mortgage Finance (“RMF”), partially offset by a decrease in interest income associated with Rialto’s portfolio of real estate loans.
Rialto expenses were
$249.1 million
in the year ended
November 30, 2014
, compared to expenses of
$151.1 million
in the year ended
November 30, 2013
. Expenses increased primarily due to an increase in loan impairments of $41.0 million due to changes in estimated cash flows expected to be collected on the segment’s loan portfolios and the change from the accretable yield income method to a cost recovery basis method in the fourth quarter of 2014. We made this determination in order to better reflect the performance of the loan portfolios due to the uncertainty in estimating the timing and amount of future cash flows. In addition, expenses increased due to an increase in interest expense and other general administrative expenses.
Rialto equity in earnings from unconsolidated entities was
$59.3 million
and
$22.4 million
in the years ended
November 30, 2014
and
2013
, respectively, primarily related to our share of earnings from the Rialto real estate funds. The higher equity in earnings related to increases in fair value and recognition of gains related to certain assets in the Rialto real estate funds.
In the year ended
November 30, 2014
, Rialto other income, net was
$3.4 million
, which consisted primarily of net realized gains on the sale of real estate owned ("REO") of
$43.7 million
and rental and other income, partially offset by expenses related to owning and maintaining REO, $19.3 million of impairments on REO and other expenses. In the year ended
November 30, 2013
, Rialto other income, net, was
$16.8 million
, which consisted primarily of net realized gains on the sale of REO of
$48.8 million
, a gain of $8.5 million related to a bargain purchase acquisition, which included cash and a loan receivable as consideration, and rental income, partially offset by expenses related to owning and maintaining REO and $16.1 million of impairments on REO.
Operating loss for our Lennar Multifamily segment was
$11.0 million
in the year ended
November 30, 2014
, compared to
$17.0 million
in the year ended
November 30, 2013
. In the year ended
November 30, 2014
, the operating loss in Lennar Multifamily primarily related to general and administrative expenses, partially offset by the segment's share of gains of
$14.7 million
as a result of the sale of two operating properties by Lennar Multifamily unconsolidated entities and management fee income. In the year ended
November 30, 2013
, the operating loss in Lennar Multifamily primarily related to general and administrative expenses, partially offset by gross profit on a land sale and management fee income.
Corporate general and administrative expenses were
$177.2 million
, or
2.3%
as a percentage of total revenues, in the year ended
November 30, 2014
, compared to
$146.1 million
, or
2.5%
as a percentage of total revenues, in the year ended
November 30, 2013
. As a percentage of total revenues, corporate general and administrative expenses improved due to increased operating leverage.
Net earnings (loss) attributable to noncontrolling interests were
($10.2) million
and
$25.3 million
in the years ended
November 30, 2014
and
2013
, respectively. Net loss attributable to noncontrolling interests in the year ended
November 30, 2014
was primarily due to a net loss related to the FDIC's interest in the portfolio of real estate loans that we acquired in partnership with the FDIC, partially offset by a strategic transaction by one of our Lennar Homebuilding's consolidated joint ventures that impacted noncontrolling interests by $5.6 million. In the year ended
November 30, 2013
, net earnings attributable to noncontrolling interests were primarily attributable to a transaction by one of our consolidated joint ventures that decreased noncontrolling interests by $17.6 million.
During the year ended
November 30, 2014
, we had a
$341.1 million
tax provision related to pre-tax earnings of the period, compared to a
$177.0 million
net tax provision in the year ended
November 30, 2013
, which included a tax benefit of
$67.1 million
for a valuation allowance reversal. Our overall effective tax rates were
34.80%
and
26.96%
for the years ended
November 30, 2014
and
2013
, respectively. The difference in effective tax rates was primarily related to the reversal of our valuation allowance in the year ended
November 30, 2013
.
26
2013
versus
2012
Revenues from home sales increased 52% in the year ended November 30, 2013 to $5.3 billion from $3.5 billion in 2012. Revenues were higher primarily due to a 33% increase in the number of home deliveries, excluding unconsolidated entities, and a 14% increase in the average sales price of homes delivered. New home deliveries, excluding unconsolidated entities, increased to 18,234 homes in the year ended November 30, 2013 from 13,707 homes in the year ended November 30, 2012. There was an increase in home deliveries in all of our Homebuilding segments and Homebuilding Other. The average sales price of homes delivered increased to $290,000 in the year ended November 30, 2013 from $255,000 in the year ended November 30, 2012, driven primarily by an increase in the average sales price of home deliveries in all of our Homebuilding segments, primarily due to increased pricing in many of our markets as the market recovery continued. Sales incentives offered to homebuyers were $20,500 per home delivered in the year ended November 30, 2013, or 6.6% as a percentage of home sales revenue, compared to $28,300 per home delivered in the year ended November 30, 2012, or 10.0% as a percentage of home sales revenue.
Gross margins on home sales were $1,318.3 million, or 24.9%, in the year ended November 30, 2013, compared to gross margins on home sales of $793.3 million, or 22.7%, in the year ended November 30, 2012. Gross margin percentage on home sales improved in the year ended November 30, 2013 compared to the year ended November 30, 2012, primarily due to a decrease in sales incentives offered to homebuyers as a percentage of revenue from home sales, an increase in the average sales price of homes delivered and a greater percentage of deliveries from our new higher margin communities (communities where land was acquired subsequent to November 30, 2008) which made up 61% of our 2013 deliveries, partially offset by an increase in materials, labor and land costs.
Gross profits on land sales totaled $17.0 million in the year ended November 30, 2013, compared to gross profits on land sales of $10.2 million in the year ended November 30, 2012.
Selling, general and administrative expenses were $559.5 million in the year ended November 30, 2013, compared to selling, general and administrative expenses of $438.7 million in the year ended November 30, 2012. Selling, general and administrative expenses as a percentage of revenues from home sales improved to 10.6% in the year ended November 30, 2013, from 12.6% in 2012, due to improved operating leverage as a result of increased absorption per community and more active communities.
Lennar Homebuilding equity in earnings from unconsolidated entities was $23.8 million in the year ended November 30, 2013, related to our share of operating earnings of Lennar Homebuilding unconsolidated entities, primarily as a result of sales of approximately 500 homesites to third parties by one unconsolidated entity for approximately $204 million, resulting in a gross profit of approximately $67 million. Our share of equity in earnings for the year ended November 30, 2013 related to the sales of those homesites was $19.8 million. This compared to Lennar Homebuilding equity in loss of $26.7 million in the year ended November 30, 2012, primarily related to our share of operating losses of Lennar Homebuilding unconsolidated entities, which included $12.1 million of valuation adjustments primarily related to strategic asset sales at Lennar Homebuilding's unconsolidated entities.
Lennar Homebuilding other income, net, totaled $27.3 million in the year ended November 30, 2013, primarily due to management fees and the sale of an operating property by one of our consolidating homebuilding joint ventures that resulted in a $14.4 million of other income (the transaction resulted in a net loss of $3.2 million after considering the impact of noncontrolling interests totaling $17.6 million), partially offset by other expenses. This compared to Lennar Homebuilding other income, net, of $15.1 million in the year ended November 30, 2012, which included a $15.0 million gain on the sale of an operating property, partially offset by a pre-tax loss of $6.5 million related to the repurchase of $204.7 million aggregate principal amount of our 5.95% senior notes due 2013 through a tender offer.
Homebuilding interest expense was $214.3 million in the year ended November 30, 2013 ($117.8 million was included in cost of homes sold, $2.6 million in cost of land sold and $93.9 million in other interest expense), compared to $181.4 million in the year ended November 30, 2012 ($85.1 million was included in cost of homes sold, $1.9 million in cost of land sold and $94.4 million in other interest expense). Interest expense increased due to an increase in our weighted average outstanding debt and an increase in deliveries, partially offset by a lower weighted average interest rate compared to the year ended November 30, 2012.
Operating earnings for our Lennar Financial Services segment were $85.8 million in the year ended November 30, 2013, compared to operating earnings of $84.8 million in the year ended November 30, 2012. The operating earnings were consistent year over year, which was driven by an increase in profit in the title operations as a result of a higher profit per transaction, offset by a slight decrease in profitability in the mortgage operations.
In the year ended November 30, 2013, operating earnings attributable to Lennar for the Rialto segment were $19.9 million (which included $26.1 million of operating earnings, offset by $6.2 million of net earnings attributable to noncontrolling interests), compared to operating earnings attributable to Lennar of $26.0 million (which was comprised of
27
$11.6 million of operating earnings and an add back of $14.4 million of net loss attributable to noncontrolling interests) in the year ended November 30, 2012.
In the year ended November 30, 2013, revenues in the Rialto segment were $138.1 million, which consisted primarily of accretable interest income associated with the segment’s portfolio of real estate loans, gains from securitization transactions and interest income from the new RMF business and fees for managing and servicing assets, compared to revenues of $138.9 million in the year ended November 30, 2012. Revenues decreased primarily due to lower interest income as a result of a decrease in the segment's portfolio of loans, offset by gains from securitization transactions and interest income from Rialto's new RMF business.
In the year ended November 30, 2013, expenses in the Rialto segment were $151.1 million, which consisted primarily of costs related to its portfolio operations, the new RMF business, loan impairments of $16.1 million primarily associated with the segment's FDIC loan portfolio (before noncontrolling interests) and other general and administrative expenses, compared to expenses of $139.0 million in the year ended November 30, 2012, which consisted primarily of costs related to its portfolio operations, loan impairments of $28.0 million primarily associated with the segment's FDIC loan portfolio (before noncontrolling interests), and other general and administrative expenses.
In the year ended November 30, 2013, the Rialto segment also had equity in earnings from unconsolidated entities of $22.4 million, which primarily included $21.9 million of equity in earnings related to our share of earnings from the Rialto real estate funds. This compared to equity in earnings from unconsolidated entities of $41.5 million in the year ended November 30, 2012, which primarily included $17.0 million of net gains primarily related to realized gains from the sale of investments in the portfolio underlying the the AllianceBernstein L.P. (“AB”) fund formed under the Federal government’s Public-Private Investment Program (“PPIP”), $6.1 million of interest income earned by the AB PPIP fund and $21.0 million of equity in earnings related to our share of earnings from Rialto Real Estate Fund, LP, a real estate investments fund managed by the Rialto segment.
In the year ended November 30, 2013, Rialto other income, net was $16.8 million, which consisted primarily of net realized gains on the sale of REO of $48.8 million, an $8.5 million gain related to a bargain purchase acquisition which included cash and a loan receivable as consideration, and rental income, partially offset by expenses related to owning and maintaining REO and impairments on REO of $16.1 million. In the year ended November 30, 2012, Rialto other expense, net, was $29.8 million, which consisted primarily of expenses related to owning and maintaining REO and impairments on REO, partially offset by net realized gains from sales of REO of $21.6 million and rental income.
Our Lennar Multifamily segment had a start-up operating loss of $17.0 million in the year ended November 30, 2013, compared to an operating loss of $5.9 million in the year ended November 30, 2012. The operating loss in Lennar Multifamily primarily relates to general and administrative expenses of the segment, partially offset by gross profit on a land sale and management fee income.
In the year ended November 30, 2013, corporate general and administrative expenses were $146.1 million, or 2.5% as a percentage of total revenues, compared to $127.3 million, or 3.1% as a percentage of total revenues, in the year ended November 30, 2012. As a percentage of total revenues, corporate general and administrative expenses improved due to increased operating leverage.
Net earnings (loss) attributable to noncontrolling interests were $25.3 million and ($21.8) million in the years ended November 30, 2013 and 2012, respectively. Net earnings attributable to noncontrolling interests for the year ended November 30, 2013 was primarily attributable to a transaction by one of our homebuilding consolidated joint ventures that decreased noncontrolling interests by $17.6 million. Net loss attributable to noncontrolling interests for the year ended November 30, 2012 was primarily related to our homebuilding operations and the FDIC's interest in the portfolio of real estate loans.
During the years ended November 30, 2013 and 2012, we concluded that it was more likely than not that the majority of our deferred tax assets would be utilized. In 2013, additional positive evidence included actual and forecasted profitability, as well as generating cumulative pre-tax earnings over a rolling four year period including the pre-tax earnings achieved during 2013. Accordingly, for the year ended November 30, 2013, we reversed $67.1 million of our valuation allowance primarily against our state deferred tax assets. This reversal was offset by a tax provision of $244.1 million, primarily related to pre-tax earnings during the year ended November 30, 2013, resulting in a $177.0 million provision for income taxes for the year ended November 30, 2013. As of November 30, 2013, our remaining valuation allowance against our deferred tax assets was $12.7 million, which is primarily related to state net operating loss carryforwards that are expected to expire due to short carryforward periods. For the year ended November 30, 2012, we reversed $491.5 million of our valuation allowance against our deferred tax assets. This reversal was partially offset by a tax provision of $25.9 million, primarily related to pre-tax earnings during the year ended November 30, 2012, resulting in a $435.2 million benefit for income taxes for the year ended November 30, 2012. Our overall effective tax rates were 26.96% and (178.43%) for the years ended November 30, 2013 and 2012, respectively. The low effective tax rate and the negative effective tax rate were primarily related to the reversal of our valuation allowance and special tax credits taken in the years ended November 30, 2013 and 2012, respectively.
28
During the year ended November 30, 2013, we had significant transactions involving three of our consolidated joint ventures. In the first joint venture transaction, we bought out our 50% partners for $82.3 million, paying $18.8 million in cash and financing the remainder with a short-term note. Our consolidated joint venture then contributed certain assets to a new unconsolidated joint venture and brought in a new, long-term partner for $125 million, or a 31.25% interest. Additionally, if the new unconsolidated entity meets certain cash flow thresholds, the partner's equity interest in the unconsolidated entity could be decreased to 16.25% or increased to 46.25% with a corresponding increase or decrease in our equity interest percentage. During the year ended November 30, 2013, the new unconsolidated joint venture subsequently distributed $125 million of cash to us as a return of capital.
In the second joint venture transaction, we purchased our partner's interest for $153.2 million and the inventories are now wholly-owned assets, which we plan to develop and build homes. During the year ended November 30, 2013, there was a third joint venture transaction where we paid off the bank debt of the consolidated joint venture and assumed the partner's interest, resulting in the entity becoming wholly-owned.
These transactions did not impact our net earnings for the year ended November 30, 2013 but our consolidated balance sheet as of November 30, 2013 was affected as follows: cash was reduced by approximately $47 million, inventory decreased by approximately $225 million, investments in unconsolidated entities increased by $98 million, deferred tax assets were increased by $40 million, additional paid-in capital (equity) was reduced by $62 million, net of tax, and non-controlling interests were reduced by $134 million.
Homebuilding Segments
Our Homebuilding operations construct and sell homes primarily for first-time, move-up and active adult homebuyers primarily under the Lennar brand name. In addition, our homebuilding operations purchase, develop and sell land to third parties. In certain circumstances, we diversify our operations through strategic alliances and attempt to minimize our risks by investing with third parties in joint ventures.
As of and for the year ended
November 30, 2014
, we have grouped our homebuilding activities into five reportable segments, which we refer to as Homebuilding East, Homebuilding Central, Homebuilding West, Homebuilding Southeast Florida and Homebuilding Houston. Information about homebuilding activities in states in which our homebuilding activities are not economically similar to other states in the same geographic area is grouped under “Homebuilding Other,” which is not considered a reportable segment. Reference in this Management’s Discussion and Analysis of Financial Condition and Results of Operations to homebuilding segments are to those reportable segments.
At
November 30, 2014
, our reportable homebuilding segments and Homebuilding Other consisted of homebuilding divisions located in:
East:
Florida
(1)
, Georgia, Maryland, New Jersey, North Carolina, South Carolina and Virginia
Central:
Arizona, Colorado and Texas
(2)
West:
California and Nevada
Southeast Florida
: Southeast Florida
Houston
: Houston, Texas
Other:
Illinois, Minnesota, Oregon, Tennessee and Washington
|
(1)
|
Florida in the East reportable segment excludes Southeast Florida, which is its own reportable segment.
|
|
(2)
|
Texas in the Central reportable segment excludes Houston, Texas, which is its own reportable segment.
|
29
The following tables set forth selected financial and operational information related to our homebuilding operations for the years indicated:
Selected Financial and Operational Data
|
Years Ended November 30,
|
|||||||||
|
(In thousands)
|
2014
|
2013
|
2012
|
||||||
|
Revenues:
|
|||||||||
|
East:
|
|||||||||
|
Sales of homes
|
$
|
2,228,469
|
|
1,828,543
|
|
1,283,441
|
|
||
|
Sales of land
|
19,212
|
|
13,619
|
|
16,539
|
|
|||
|
Total East
|
2,247,681
|
|
1,842,162
|
|
1,299,980
|
|
|||
|
Central:
|
|||||||||
|
Sales of homes
|
908,195
|
|
736,557
|
|
487,317
|
|
|||
|
Sales of land
|
28,745
|
|
6,918
|
|
19,071
|
|
|||
|
Total Central
|
936,940
|
|
743,475
|
|
506,388
|
|
|||
|
West:
|
|||||||||
|
Sales of homes
|
1,761,762
|
|
1,160,842
|
|
683,267
|
|
|||
|
Sales of land
|
34,613
|
|
490
|
|
14,022
|
|
|||
|
Total West
|
1,796,375
|
|
1,161,332
|
|
697,289
|
|
|||
|
Southeast Florida:
|
|||||||||
|
Sales of homes
|
686,994
|
|
502,175
|
|
353,841
|
|
|||
|
Sales of land
|
5,904
|
|
—
|
|
13,800
|
|
|||
|
Total Southeast Florida
|
692,898
|
|
502,175
|
|
367,641
|
|
|||
|
Houston:
|
|||||||||
|
Sales of homes
|
675,927
|
|
604,212
|
|
449,580
|
|
|||
|
Sales of land
|
37,186
|
|
36,949
|
|
22,043
|
|
|||
|
Total Houston
|
713,113
|
|
641,161
|
|
471,623
|
|
|||
|
Other
|
|||||||||
|
Sales of homes
|
578,295
|
|
459,743
|
|
234,731
|
|
|||
|
Sales of land
|
59,828
|
|
4,899
|
|
3,580
|
|
|||
|
Total Other
|
638,123
|
|
464,642
|
|
238,311
|
|
|||
|
Total homebuilding revenues
|
$
|
7,025,130
|
|
5,354,947
|
|
3,581,232
|
|
||
30
|
Years Ended November 30,
|
|||||||||
|
(In thousands)
|
2014
|
2013
|
2012
|
||||||
|
Operating earnings (loss):
|
|||||||||
|
East:
|
|||||||||
|
Sales of homes
|
$
|
341,461
|
|
279,561
|
|
137,231
|
|
||
|
Sales of land
|
5,193
|
|
1,255
|
|
2,472
|
|
|||
|
Equity in earnings from unconsolidated entities
|
2,254
|
|
678
|
|
542
|
|
|||
|
Other income (expense), net
|
2,867
|
|
(5,354
|
)
|
(166
|
)
|
|||
|
Other interest expense
|
(11,667
|
)
|
(25,023
|
)
|
(26,082
|
)
|
|||
|
Total East
|
340,108
|
|
251,117
|
|
113,997
|
|
|||
|
Central:
|
|||||||||
|
Sales of homes (1)
|
81,182
|
|
68,743
|
|
39,388
|
|
|||
|
Sales of land
|
6,911
|
|
773
|
|
909
|
|
|||
|
Equity in loss from unconsolidated entities
|
(131
|
)
|
(87
|
)
|
(514
|
)
|
|||
|
Other expense, net (2)
|
(6,971
|
)
|
(1,809
|
)
|
(1,529
|
)
|
|||
|
Other interest expense
|
(5,406
|
)
|
(12,417
|
)
|
(13,427
|
)
|
|||
|
Total Central
|
75,585
|
|
55,203
|
|
24,827
|
|
|||
|
West:
|
|||||||||
|
Sales of homes
|
286,393
|
|
190,582
|
|
39,941
|
|
|||
|
Sales of land
|
11,851
|
|
3,442
|
|
388
|
|
|||
|
Equity in earnings (loss) from unconsolidated entities (3)
|
(1,647
|
)
|
22,039
|
|
(25,415
|
)
|
|||
|
Other income, net (4)
|
7,652
|
|
27,832
|
|
2,393
|
|
|||
|
Other interest expense
|
(11,530
|
)
|
(32,740
|
)
|
(31,334
|
)
|
|||
|
Total West
|
292,719
|
|
211,155
|
|
(14,027
|
)
|
|||
|
Southeast Florida:
|
|||||||||
|
Sales of homes
|
158,951
|
|
107,733
|
|
65,745
|
|
|||
|
Sales of land
|
3,967
|
|
(188
|
)
|
(354
|
)
|
|||
|
Equity in loss from unconsolidated entities
|
(576
|
)
|
(152
|
)
|
(961
|
)
|
|||
|
Other income, net (5)
|
2,318
|
|
7,778
|
|
15,653
|
|
|||
|
Other interest expense
|
(2,697
|
)
|
(8,282
|
)
|
(9,026
|
)
|
|||
|
Total Southeast Florida
|
161,963
|
|
106,889
|
|
71,057
|
|
|||
|
Houston:
|
|||||||||
|
Sales of homes (6)
|
99,066
|
|
73,024
|
|
43,423
|
|
|||
|
Sales of land
|
10,202
|
|
10,749
|
|
6,182
|
|
|||
|
Equity in earnings (loss) from unconsolidated entities
|
121
|
|
2,079
|
|
(35
|
)
|
|||
|
Other income (expense), net
|
(201
|
)
|
(503
|
)
|
1,328
|
|
|||
|
Other interest expense
|
(1,566
|
)
|
(4,530
|
)
|
(4,623
|
)
|
|||
|
Total Houston
|
107,622
|
|
80,819
|
|
46,275
|
|
|||
|
Other:
|
|||||||||
|
Sales of homes
|
54,357
|
|
39,155
|
|
28,891
|
|
|||
|
Sales of land (7)
|
3,567
|
|
1,010
|
|
650
|
|
|||
|
Equity in loss from unconsolidated entities
|
(376
|
)
|
(754
|
)
|
(289
|
)
|
|||
|
Other income (expense), net
|
1,861
|
|
(598
|
)
|
(2,535
|
)
|
|||
|
Other interest expense
|
(3,685
|
)
|
(10,921
|
)
|
(9,861
|
)
|
|||
|
Total Other
|
55,724
|
|
27,892
|
|
16,856
|
|
|||
|
Total homebuilding operating earnings
|
$
|
1,033,721
|
|
733,075
|
|
258,985
|
|
||
|
(1)
|
Sales of homes for the year ended November 30, 2014 included $6.4 million of insurance recoveries and other nonrecurring items.
|
|
(2)
|
Other expense, net for the year ended November 30, 2014 included
$2.0 million
in write-offs of other receivables.
|
|
(3)
|
Lennar Homebuilding equity in loss for the year ended November 30, 2014 included our share of operating losses of Lennar Homebuilding unconsolidated entities, which included
$4.6 million
of our share of valuation adjustments related to assets of Lennar Homebuilding's unconsolidated entities, partially offset by our share of operating earnings of
$4.7 million
related to third-party land sales
|
31
by one unconsolidated entity. For the year ended November 30, 2013, Lennar Homebuilding equity in earnings from unconsolidated entities included our share of operating earnings of
$19.8 million
primarily related to the sales of approximately 500 homesites to third parties by one unconsolidated entity for approximately
$204 million
, resulting in a gross profit of approximately
$67 million
. Equity in earnings recognized by us related to the sale of land by our unconsolidated entities may vary significantly from period to period depending on the timing of those land sales and other transactions entered into by our unconsolidated entities in which we have investments. For the year ended November 30, 2012, equity in loss from unconsolidated entities included
$12.1 million
of our share of valuation adjustments primarily related to strategic asset sales at Lennar Homebuilding unconsolidated entities.
|
(4)
|
Other income, net for the year ended November 30, 2013, included a
$14.4 million
gain on the sale of an operating property.
|
|
(5)
|
Other income, net for the year ended November 30, 2014 included
$1.0 million
of valuation adjustments to other assets. Other income, net for the year ended November 30, 2012, included a
$15.0 million
gain on the sale of an operating property.
|
|
(6)
|
Sales of homes for the year ended November 30, 2014 included a $5.5 million insurance recovery.
|
|
(7)
|
Sales of land for the year ended November 30, 2014 included
$1.5 million
in write-offs of option deposits and pre-acquisition costs.
|
Summary of Homebuilding Data
Deliveries:
|
Years Ended November 30,
|
||||||||
|
Homes
|
||||||||
|
2014
|
2013
|
2012
|
||||||
|
East
|
7,824
|
|
6,941
|
|
5,440
|
|
||
|
Central
|
3,156
|
|
2,814
|
|
2,154
|
|
||
|
West
|
4,141
|
|
3,323
|
|
2,301
|
|
||
|
Southeast Florida
|
2,086
|
|
1,741
|
|
1,314
|
|
||
|
Houston
|
2,482
|
|
2,266
|
|
1,917
|
|
||
|
Other
|
1,314
|
|
1,205
|
|
676
|
|
||
|
Total
|
21,003
|
|
18,290
|
|
13,802
|
|
||
Of the total home deliveries above,
32
,
56
and
95
represent deliveries from unconsolidated entities for the years ended
November 30, 2014
,
2013
and
2012
, respectively.
|
Years Ended November 30,
|
|||||||||||||||||||
|
Dollar Value (In thousands)
|
Average Sales Price
|
||||||||||||||||||
|
2014
|
2013
|
2012
|
2014
|
2013
|
2012
|
||||||||||||||
|
East
|
$
|
2,234,086
|
|
1,834,794
|
|
1,290,549
|
|
$
|
286,000
|
|
264,000
|
|
237,000
|
|
|||||
|
Central
|
908,195
|
|
736,558
|
|
487,317
|
|
288,000
|
|
262,000
|
|
226,000
|
|
|||||||
|
West
|
1,775,587
|
|
1,190,385
|
|
728,092
|
|
429,000
|
|
358,000
|
|
316,000
|
|
|||||||
|
Southeast Florida
|
686,994
|
|
502,175
|
|
353,841
|
|
329,000
|
|
288,000
|
|
269,000
|
|
|||||||
|
Houston
|
675,927
|
|
604,212
|
|
449,580
|
|
272,000
|
|
267,000
|
|
235,000
|
|
|||||||
|
Other
|
578,295
|
|
459,743
|
|
234,731
|
|
440,000
|
|
382,000
|
|
347,000
|
|
|||||||
|
Total
|
$
|
6,859,084
|
|
5,327,867
|
|
3,544,110
|
|
$
|
327,000
|
|
291,000
|
|
257,000
|
|
|||||
Of the total dollar value of home deliveries above,
$19.4 million
,
$35.8 million
and
$51.9 million
represent the dollar value of home deliveries from unconsolidated entities for the years ended
November 30, 2014
,
2013
and
2012
, respectively. The home deliveries from unconsolidated entities had an average sales price of
$608,000
,
$639,000
and
$547,000
for the years ended
November 30, 2014
,
2013
and
2012
, respectively.
Sales Incentives (1):
|
Years Ended November 30,
|
|||||||||
|
(In thousands)
|
|||||||||
|
2014
|
2013
|
2012
|
|||||||
|
East
|
$
|
176,726
|
|
163,039
|
|
169,779
|
|
||
|
Central
|
71,533
|
|
51,557
|
|
49,028
|
|
|||
|
West
|
59,148
|
|
29,542
|
|
48,341
|
|
|||
|
Southeast Florida
|
54,529
|
|
47,504
|
|
41,529
|
|
|||
|
Houston
|
62,935
|
|
64,216
|
|
62,497
|
|
|||
|
Other
|
24,286
|
|
17,230
|
|
17,050
|
|
|||
|
Total
|
$
|
449,157
|
|
373,088
|
|
388,224
|
|
||
32
|
Years Ended November 30,
|
||||||||||||||||||
|
Average Sales Incentives Per
Home Delivered
|
Sales Incentives as a
% of Revenue
|
|||||||||||||||||
|
2014
|
2013
|
2012
|
2014
|
2013
|
2012
|
|||||||||||||
|
East
|
$
|
22,600
|
|
23,600
|
|
31,300
|
|
7.4
|
%
|
8.2
|
%
|
11.7
|
%
|
|||||
|
Central
|
22,700
|
|
18,300
|
|
22,800
|
|
7.3
|
%
|
6.5
|
%
|
9.1
|
%
|
||||||
|
West
|
14,300
|
|
9,000
|
|
21,700
|
|
3.2
|
%
|
2.5
|
%
|
6.6
|
%
|
||||||
|
Southeast Florida
|
26,100
|
|
27,300
|
|
31,600
|
|
7.4
|
%
|
8.6
|
%
|
10.5
|
%
|
||||||
|
Houston
|
25,400
|
|
28,300
|
|
32,600
|
|
8.5
|
%
|
9.6
|
%
|
12.2
|
%
|
||||||
|
Other
|
18,500
|
|
14,300
|
|
25,200
|
|
4.0
|
%
|
3.6
|
%
|
6.8
|
%
|
||||||
|
Total
|
$
|
21,400
|
|
20,500
|
|
28,300
|
|
6.2
|
%
|
6.6
|
%
|
10.0
|
%
|
|||||
|
(1)
|
Sales incentives relate to home deliveries during the period, excluding deliveries by unconsolidated entities.
|
New Orders (2):
|
Years Ended November 30,
|
||||||||
|
Homes
|
||||||||
|
2014
|
2013
|
2012
|
||||||
|
East
|
8,068
|
|
7,533
|
|
5,868
|
|
||
|
Central
|
3,473
|
|
2,805
|
|
2,498
|
|
||
|
West
|
4,516
|
|
3,231
|
|
2,711
|
|
||
|
Southeast Florida
|
2,055
|
|
1,879
|
|
1,617
|
|
||
|
Houston
|
2,643
|
|
2,419
|
|
2,078
|
|
||
|
Other
|
1,274
|
|
1,176
|
|
912
|
|
||
|
Total
|
22,029
|
|
19,043
|
|
15,684
|
|
||
Of the new orders above,
95
,
55
and
98
represent new orders from unconsolidated entities for the years ended
November 30, 2014
,
2013
and
2012
, respectively.
|
Years Ended November 30,
|
|||||||||||||||||||
|
Dollar Value (In thousands)
|
Average Sales Price
|
||||||||||||||||||
|
2014
|
2013
|
2012
|
2014
|
2013
|
2012
|
||||||||||||||
|
East
|
$
|
2,303,916
|
|
2,066,065
|
|
1,438,268
|
|
$
|
286,000
|
|
274,000
|
|
245,000
|
|
|||||
|
Central
|
1,021,839
|
|
763,895
|
|
591,677
|
|
294,000
|
|
272,000
|
|
237,000
|
|
|||||||
|
West
|
1,956,157
|
|
1,243,831
|
|
834,426
|
|
433,000
|
|
385,000
|
|
308,000
|
|
|||||||
|
Southeast Florida
|
685,536
|
|
576,781
|
|
441,311
|
|
334,000
|
|
307,000
|
|
273,000
|
|
|||||||
|
Houston
|
720,453
|
|
649,472
|
|
505,579
|
|
273,000
|
|
268,000
|
|
243,000
|
|
|||||||
|
Other
|
522,411
|
|
485,699
|
|
333,232
|
|
410,000
|
|
413,000
|
|
365,000
|
|
|||||||
|
Total
|
$
|
7,210,312
|
|
5,785,743
|
|
4,144,493
|
|
$
|
327,000
|
|
304,000
|
|
264,000
|
|
|||||
Of the total dollar value of new orders above,
$56.8 million
,
$34.8 million
and
$54.4 million
represent the dollar value of new orders from unconsolidated entities for the years ended
November 30, 2014
,
2013
and
2012
, respectively. The new orders from unconsolidated entities had an average sales price of
$598,000
,
$632,000
and
$556,000
for the years ended
November 30, 2014
,
2013
and
2012
, respectively.
|
(2)
|
New orders represent the number of new sales contracts executed by homebuyers, net of cancellations, during the years ended
November 30, 2014
,
2013
and
2012
.
|
33
Backlog:
|
November 30,
|
||||||||
|
Homes
|
||||||||
|
2014
|
2013
|
2012
|
||||||
|
East
|
2,212
|
|
1,968
|
|
1,376
|
|
||
|
Central
|
961
|
|
644
|
|
653
|
|
||
|
West
|
991
|
|
616
|
|
708
|
|
||
|
Southeast Florida
|
576
|
|
607
|
|
469
|
|
||
|
Houston
|
830
|
|
669
|
|
516
|
|
||
|
Other
|
262
|
|
302
|
|
331
|
|
||
|
Total
|
5,832
|
|
4,806
|
|
4,053
|
|
||
Of the total homes in backlog above,
67
,
4
and
5
represent homes in backlog from unconsolidated entities at
November 30, 2014
,
2013
and
2012
, respectively.
|
November 30,
|
|||||||||||||||||||
|
Dollar Value (In thousands)
|
Average Sales Price
|
||||||||||||||||||
|
2014
|
2013
|
2012
|
2014
|
2013
|
2012
|
||||||||||||||
|
East
|
$
|
672,204
|
|
600,257
|
|
368,361
|
|
$
|
304,000
|
|
305,000
|
|
268,000
|
|
|||||
|
Central
|
310,726
|
|
195,762
|
|
168,912
|
|
323,000
|
|
304,000
|
|
259,000
|
|
|||||||
|
West
|
437,492
|
|
257,498
|
|
202,959
|
|
441,000
|
|
418,000
|
|
287,000
|
|
|||||||
|
Southeast Florida
|
214,606
|
|
215,988
|
|
141,146
|
|
373,000
|
|
356,000
|
|
301,000
|
|
|||||||
|
Houston
|
225,737
|
|
180,665
|
|
135,282
|
|
272,000
|
|
270,000
|
|
262,000
|
|
|||||||
|
Other
|
113,563
|
|
169,431
|
|
143,725
|
|
433,000
|
|
561,000
|
|
434,000
|
|
|||||||
|
Total
|
$
|
1,974,328
|
|
1,619,601
|
|
1,160,385
|
|
$
|
339,000
|
|
337,000
|
|
286,000
|
|
|||||
Of the total dollar value of homes in backlog above,
$39.8 million
,
$2.5 million
and
$3.5 million
represent the dollar value of homes in backlog from unconsolidated entities at
November 30, 2014
,
2013
and
2012
, respectively. The homes in backlog from unconsolidated entities had an average sales price of
$595,000
,
$624,000
and
$704,000
at
November 30, 2014
,
2013
and
2012
, respectively.
Backlog represents the number of homes under sales contracts. Homes are sold using sales contracts, which are generally accompanied by sales deposits. In some instances, purchasers are permitted to cancel sales if they fail to qualify for financing or under certain other circumstances. We do not recognize revenue on homes under sales contracts until the sales are closed and title passes to the new homeowners.
We experienced cancellation rates in our homebuilding segments and Homebuilding Other as follows:
|
Years Ended November 30,
|
||||||||
|
2014
|
2013
|
2012
|
||||||
|
East
|
17
|
%
|
16
|
%
|
18
|
%
|
||
|
Central
|
20
|
%
|
18
|
%
|
18
|
%
|
||
|
West
|
14
|
%
|
15
|
%
|
17
|
%
|
||
|
Southeast Florida
|
13
|
%
|
12
|
%
|
12
|
%
|
||
|
Houston
|
24
|
%
|
21
|
%
|
23
|
%
|
||
|
Other
|
13
|
%
|
13
|
%
|
8
|
%
|
||
|
Total
|
17
|
%
|
16
|
%
|
17
|
%
|
||
34
Active Communities:
|
November 30,
|
||||||||
|
2014
|
2013
|
2012
|
||||||
|
East
|
233
|
|
197
|
|
167
|
|
||
|
Central
|
117
|
|
101
|
|
74
|
|
||
|
West
|
111
|
|
80
|
|
61
|
|
||
|
Southeast Florida
|
32
|
|
30
|
|
31
|
|
||
|
Houston
|
78
|
|
79
|
|
70
|
|
||
|
Other
|
54
|
|
50
|
|
56
|
|
||
|
Total
|
625
|
|
537
|
|
459
|
|
||
Of the total active communities listed above,
3
communities represent active communities being developed by unconsolidated entities as of
November 30, 2014
. Of the total active communities listed above,
2
communities represent active communities being developed by unconsolidated entities as of both November 30, 2013 and
2012
.
Deliveries from New Higher Margin Communities (3):
|
Years Ended November 30,
|
||||||||
|
Homes
|
||||||||
|
2014
|
2013
|
2012
|
||||||
|
East
|
5,533
|
|
4,781
|
|
3,014
|
|
||
|
Central
|
2,313
|
|
1,356
|
|
884
|
|
||
|
West
|
2,871
|
|
2,090
|
|
1,375
|
|
||
|
Southeast Florida
|
1,666
|
|
1,137
|
|
933
|
|
||
|
Houston
|
1,177
|
|
756
|
|
330
|
|
||
|
Other
|
1,076
|
|
962
|
|
343
|
|
||
|
Total
|
14,636
|
|
11,082
|
|
6,879
|
|
||
|
Years Ended November 30,
|
|||||||||||||||||||
|
Dollar Value (In thousands)
|
Average Sales Price
|
||||||||||||||||||
|
2014
|
2013
|
2012
|
2014
|
2013
|
2012
|
||||||||||||||
|
East
|
$
|
1,591,060
|
|
1,265,141
|
|
687,361
|
|
$
|
288,000
|
|
265,000
|
|
228,000
|
|
|||||
|
Central
|
654,860
|
|
346,917
|
|
201,334
|
|
283,000
|
|
256,000
|
|
228,000
|
|
|||||||
|
West
|
1,101,430
|
|
649,675
|
|
411,833
|
|
384,000
|
|
311,000
|
|
300,000
|
|
|||||||
|
Southeast Florida
|
593,798
|
|
374,420
|
|
271,978
|
|
356,000
|
|
329,000
|
|
292,000
|
|
|||||||
|
Houston
|
356,971
|
|
222,641
|
|
75,884
|
|
303,000
|
|
294,000
|
|
230,000
|
|
|||||||
|
Other
|
431,537
|
|
353,496
|
|
134,127
|
|
401,000
|
|
367,000
|
|
391,000
|
|
|||||||
|
Total
|
$
|
4,729,656
|
|
3,212,290
|
|
1,782,517
|
|
$
|
323,000
|
|
290,000
|
|
259,000
|
|
|||||
|
(3)
|
Deliveries from new higher margin communities represent deliveries from communities where land was acquired subsequent to November 30, 2008, and is a subset of the deliveries included in the preceding deliveries table.
|
35
The following table details our gross margins on home sales for the years ended
November 30, 2014
,
2013
and
2012
for each of our reportable homebuilding segments and Homebuilding Other:
|
Years Ended November 30,
|
||||||||||
|
(In thousands)
|
2014
|
2013
|
2012
|
|||||||
|
East:
|
||||||||||
|
Sales of homes
|
$
|
2,228,469
|
|
1,828,543
|
|
1,283,441
|
|
|||
|
Cost of homes sold
|
1,639,328
|
|
1,353,048
|
|
979,219
|
|
||||
|
Gross margins on home sales
|
589,141
|
|
26.4%
|
475,495
|
|
26.0%
|
304,222
|
|
23.7%
|
|
|
Central:
|
||||||||||
|
Sales of homes
|
908,195
|
|
736,557
|
|
487,317
|
|
||||
|
Cost of homes sold
|
721,494
|
|
591,611
|
|
390,823
|
|
||||
|
Gross margins on home sales
|
186,701
|
|
20.6%
|
144,946
|
|
19.7%
|
96,494
|
|
19.8%
|
|
|
West:
|
||||||||||
|
Sales of homes
|
1,761,762
|
|
1,160,842
|
|
683,267
|
|
||||
|
Cost of homes sold
|
1,305,208
|
|
840,619
|
|
540,982
|
|
||||
|
Gross margins on home sales
|
456,554
|
|
25.9%
|
320,223
|
|
27.6%
|
142,285
|
|
20.8%
|
|
|
Southeast Florida:
|
||||||||||
|
Sales of homes
|
686,994
|
|
502,175
|
|
353,841
|
|
||||
|
Cost of homes sold
|
473,146
|
|
352,684
|
|
256,672
|
|
||||
|
Gross margins on home sales
|
213,848
|
|
31.1%
|
149,491
|
|
29.8%
|
97,169
|
|
27.5%
|
|
|
Houston:
|
||||||||||
|
Sales of homes
|
675,927
|
|
604,212
|
|
449,580
|
|
||||
|
Cost of homes sold
|
504,144
|
|
464,612
|
|
354,981
|
|
||||
|
Gross margins on home sales
|
171,783
|
|
25.4%
|
139,600
|
|
23.1%
|
94,599
|
|
21.0%
|
|
|
Other
|
||||||||||
|
Sales of homes
|
578,295
|
|
459,743
|
|
234,731
|
|
||||
|
Cost of homes sold
|
460,089
|
|
371,238
|
|
176,154
|
|
||||
|
Gross margins on home sales
|
118,206
|
|
20.4%
|
88,505
|
|
19.3%
|
58,577
|
|
25.0%
|
|
|
Total gross margins on home sales
|
$
|
1,736,233
|
|
25.4%
|
1,318,260
|
|
24.9%
|
793,346
|
|
22.7%
|
2014
versus
2013
East:
Homebuilding revenues increased in
2014
, compared to
2013
, primarily due to an increase in the number of home deliveries in all the states of the segment, except New Jersey and an increase in the average sales price of homes delivered in all the states of the segment, except Georgia. The increase in the number of deliveries was primarily driven by an increase in active communities over the last year. The decrease in home deliveries in New Jersey was primarily due to the timing of deliveries in certain communities. The increase in the average sales price of homes delivered was primarily because we have been able to increase the sales price of homes delivered and/or reduce sales incentives in certain of our communities as the market recovery continues. The decrease in the average sales price of homes delivered in Georgia was primarily driven by a change in product mix due to the timing of deliveries in certain of our communities. Gross margin percentage on homes increased, compared to last year, primarily due to an increase in the average sales price of homes delivered and a decrease in sales incentives offered to homebuyers as a percentage of revenues from home sales, partially offset by an 8% increase in direct construction and land costs per home due to an increase in labor, materials and land costs.
Central:
Homebuilding revenues increased in
2014
, compared to
2013
, primarily due to an increase in the number of home deliveries and in the average sales price of homes delivered in all the states of the segment. The increase in the number of deliveries was primarily driven by an increase in active communities over the last year. The increase in the average sales price of homes delivered was primarily because we have been able to increase the sales price of homes delivered as the market recovery continues. Gross margin percentage on homes increased, compared to last year, primarily due to an increase in the average sales price of homes delivered and $6.4 million of insurance recoveries and other nonrecurring items, partially offset by an increase in sales incentives offered to homebuyers as a percentage of revenues from home sales and a 12% increase in direct construction and land costs per home due to increases in labor, material and land costs.
West:
Homebuilding revenues increased in
2014
, compared to
2013
, primarily due to an increase in the number of home deliveries and in the average sales price of homes delivered in all the states of the segment. The increase in the number of
36
deliveries was primarily driven by an increase in active communities over the last year. The increase in the average sales price of homes delivered was primarily a result of a change in product mix due to the timing of deliveries and because we have been able to increase the sales price of homes delivered as the market recovery continues. Gross margin percentage on homes decreased, compared to last year, primarily due to a 20% increase in direct construction costs per home as a result of a change in product mix due to the timing of deliveries and increases in labor, material and land costs, and an increase in sales incentives offered to homebuyers as a percentage of revenues from home sales. This was partially offset by an increase in the average sales price of homes delivered.
Southeast Florida:
Homebuilding revenues increased in
2014
, compared to
2013
, primarily due to an increase in the number of home deliveries and in the average sales price of homes delivered in this segment. The increase in the number of deliveries was primarily driven by a lower mix of start-up communities, which are earlier in the life cycle of delivering homes than non start-up communities. The increase in the average sales price of homes delivered was primarily because we have been able to increase the sales price of homes delivered and/or reduce sales incentives in certain of our communities as the market recovery continues. Gross margin percentage on homes sales increased, compared to last year, primarily due to an increase in the average sales price of homes delivered and a decrease in sales incentives offered to homebuyers as a percentage of revenues from home sales, partially offset by a 6% increase in direct construction and land costs per home due to increases in labor, material and land costs.
Houston
: Homebuilding revenues increased in
2014
, compared to
2013
, primarily due to an increase in the number of home deliveries in this segment. The increase in the number of deliveries was primarily driven by higher demand as the number of deliveries per active community increased. Gross margin percentage on homes sales increased, compared to last year, primarily due to a decrease in sales incentives offered to homebuyers as a percentage of revenues from home sales and a $5.5 million insurance recovery, partially offset by a 2% increase in direct construction and land costs per home due to increases in labor, material and land costs.
Other:
Homebuilding revenues increased in
2014
, compared to
2013
, primarily due to an increase in the number of home deliveries in Oregon and Tennessee, which the latter is a new operation, partially offset by a decrease in the number of home deliveries in Washington. Homebuilding revenues also increased due to an increase in the average sales price of homes delivered in all the states of Homebuilding Other. The increase in the number of home deliveries in Oregon was primarily driven by higher demand as the number of home deliveries per active community increased. The decrease in the number of home deliveries in Washington was primarily due to a higher mix of start-up communities, which are earlier in the life cycle of delivering homes than non start-up communities. The increase in the average sales price of homes delivered was primarily because we have been able to increase the sales price of homes delivered in certain of our communities as the market recovery continues. Gross margin percentage on homes sales increased, compared to last year, primarily due to an increase in the average sales price of homes delivered, partially offset by an increase in sales incentives offered to homebuyers as a percentage of revenues from home sales and a 14% increase in direct construction and land costs per home due to increases in labor, material and land costs.
2013
versus
2012
East:
Homebuilding revenues increased in 2013, compared to 2012, primarily due to an increase in the number of home deliveries and in the average sales price of homes delivered in all the states of the segment. The increase in the number of deliveries was primarily driven by an increase in our backlog demand as demand continued to outpace supply, which is constrained by limited land availability and fewer competing homebuilders. The increase in the average sales price of homes delivered was primarily because we have been able to increase the sales price of homes delivered and/or reduce sales incentives in certain of our communities as the market recovery continued. Gross margin percentage on homes increased, compared to 2012, primarily due to a greater percentage of deliveries from our new higher margin communities, a decrease in sales incentives offered to homebuyers as a percentage of revenues from home sales and lower valuation adjustments, partially offset by a 9% increase in direct construction and land costs per home due to an increase in labor, materials and land costs.
Central:
Homebuilding revenues increased in 2013, compared to 2012, primarily due to an increase in the number of home deliveries and in the average sales price of homes delivered in all the states of the segment. The increase in the number of deliveries was primarily driven by an increase in our backlog demand as demand continued to outpace supply, which is constrained by limited land availability and fewer competing homebuilders. The increase in the average sales price of homes delivered was primarily because we have been able to increase the sales price of homes delivered and/or reduce sales incentives in certain of our communities as the market recovery continued. Gross margin percentage on homes decreased slightly, compared to 2012, primarily due to a 15% increase in direct construction and land costs per home due to increases in labor, material and land costs, partially offset by a greater percentage of deliveries from our new higher margin communities and a decrease in sales incentives offered to homebuyers as a percentage of revenues from home sales.
West:
Homebuilding revenues increased in 2013, compared to 2012, primarily due to an increase in the number of home deliveries and in the average sales price of homes delivered in all the states of the segment. The increase in the number of
37
deliveries was primarily driven by an increase in our backlog demand as demand continued to outpace supply, which is constrained by limited land availability and fewer competing homebuilders. The increase in the average sales price of homes delivered was primarily because we have been able to increase the sales price of homes delivered and/or reduce sales incentives in certain of our communities as the market recovery continued. Gross margin percentage on homes increased, compared to 2012, primarily due to a greater percentage of deliveries from our new higher margin communities and a decrease in sales incentives offered to homebuyers as a percentage of revenues from home sales and lower valuation adjustments, partially offset by a 7% increase in direct construction costs per home due to increases in labor and material costs.
Southeast Florida:
Homebuilding revenues increased in 2013, compared to 2012, primarily due to an increase in the number of home deliveries and in the average sales price of homes delivered in this segment. The increase in the number of home deliveries was primarily driven by an increase in our backlog demand as demand continued to outpace supply, which is constrained by limited land availability and fewer competing homebuilders. The increase in the average sales price of homes delivered was primarily because we have been able to increase the sales price of homes delivered and/or reduce sales incentives in certain of our communities as the market recovery continued. Gross margin percentage on homes sales increased, compared to 2012, primarily due to greater gross margin percentage in our new higher margin communities and a decrease in sales incentives offered to homebuyers as a percentage of revenues from home sales, partially offset by a 4% net increase in direct construction and land costs per home due to increases in labor and material costs.
Houston
: Homebuilding revenues increased in 2013, compared to 2012, primarily due to an increase in the number of home deliveries and in the average sales price in this segment. The increase in the number of deliveries was primarily driven by an increase in our backlog demand as demand continued to outpace supply, which is constrained by limited land availability and fewer competing homebuilders. The increase in the average sales price of homes delivered was primarily because we have been able to increase the sales price of homes delivered and/or reduce sales incentives in certain of our communities as the market recovery continued. Gross margin percentage on homes sales increased, compared to 2012, primarily due to a greater percentage of deliveries from our new higher margin communities and a decrease in sales incentives offered to homebuyers as a percentage of revenues from home sales, partially offset by a 12% increase in direct construction and land costs per home due to increases in labor, material and land costs.
Other:
Homebuilding revenues increased in 2013, compared to 2012, primarily due to an increase in the number of home deliveries and in the average sales price in all the states of Homebuilding Other, except for Illinois, which had insignificant activity and Oregon where the average sales price was flat year over year. The increase in the number of deliveries was primarily driven by an increase in our backlog demand as demand continued to outpace supply, which is constrained by limited land availability and fewer competing homebuilders. The increase in the average sales price of homes delivered was primarily because we have been able to increase the sales price of homes delivered and/or reduce sales incentives in certain of our communities as the market recovery continued. Gross margin percentage on home sales decreased, compared to 2012, due to a 15% increase in direct construction and land costs per home due to increases in labor, material and land costs, partially offset by a decrease in sales incentives offered to homebuyers as a percentage of revenues from home sales and lower valuation adjustments.
38
Lennar Financial Services Segment
Our Lennar Financial Services reportable segment provides mortgage financing, title insurance and closing services for both buyers of our homes and others. Our Lennar Financial Services segment sells substantially all of the loans it originates within a short period in the secondary mortgage market, the majority of which are sold on a servicing released, non-recourse basis. After the loans are sold, we retain potential liability for possible claims by purchasers that we breached certain limited industry-standard representations and warranties in the loan sale agreements.
The following table sets forth selected financial and operational information relating to our Lennar Financial Services segment:
|
Years Ended November 30,
|
|||||||||
|
(Dollars in thousands)
|
2014
|
2013
|
2012
|
||||||
|
Revenues
|
$
|
454,381
|
|
427,342
|
|
384,618
|
|
||
|
Costs and expenses
|
374,243
|
|
341,556
|
|
299,836
|
|
|||
|
Operating earnings
|
$
|
80,138
|
|
85,786
|
|
84,782
|
|
||
|
Dollar value of mortgages originated
|
$
|
5,950,000
|
|
5,282,000
|
|
4,431,000
|
|
||
|
Number of mortgages originated
|
23,300
|
|
22,300
|
|
19,700
|
|
|||
|
Mortgage capture rate of Lennar homebuyers
|
78
|
%
|
77
|
%
|
77
|
%
|
|||
|
Number of title and closing service transactions
|
90,700
|
|
101,200
|
|
108,200
|
|
|||
|
Number of title policies issued
|
220,400
|
|
192,400
|
|
149,300
|
|
|||
Rialto Segment
Our Rialto reportable segment is a commercial real estate investment, investment management, and finance company focused on raising, investing and managing third-party capital, originating and selling into securitizations commercial mortgage loans as well as investing our own capital in real estate related mortgage loans, properties and related securities. Rialto utilizes its vertically-integrated investment and operating platform to underwrite, diligence, acquire, manage, workout and add value to diverse portfolios of real estate loans, properties and securities as well as providing strategic real estate capital. Rialto's primary focus is to manage third-party capital and to originate and sell into securitizations commercial mortgage loans. Rialto has commenced the workout and/or oversight of billions of dollars of real estate assets across the United States, including commercial and residential real estate loans and properties as well as mortgage backed securities with the objective of generating superior, risk-adjusted returns. To date, many of the investment and management opportunities have arisen from the dislocation in the United States real estate markets and the restructuring and recapitalization of those markets.
Rialto's operating earnings were as follows:
|
Years Ended November 30,
|
|||||||||
|
(In thousands)
|
2014
|
2013
|
2012
|
||||||
|
Revenues
|
$
|
230,521
|
|
138,060
|
|
138,856
|
|
||
|
Costs and expenses (1)
|
249,114
|
|
151,072
|
|
138,990
|
|
|||
|
Rialto equity in earnings from unconsolidated entities
|
59,277
|
|
22,353
|
|
41,483
|
|
|||
|
Rialto other income (expense), net
|
3,395
|
|
16,787
|
|
(29,780
|
)
|
|||
|
Operating earnings (2)
|
$
|
44,079
|
|
26,128
|
|
11,569
|
|
||
|
(1)
|
Costs and expenses for the years ended
November 30, 2014
,
2013
and
2012
included loan impairments of
$57.1 million
,
$16.1 million
and
$28.0 million
, respectively, primarily associated with the segment's FDIC loans portfolio (before noncontrolling interests).
|
|
(2)
|
Operating earnings for the years ended
November 30, 2014
,
2013
and
2012
included
($22.5) million
,
$6.2 million
and
($14.4) million
, respectively, of net earnings (loss) attributable to noncontrolling interests.
|
39
The following is a detail of Rialto other income (expense), net:
|
Years Ended November 30,
|
|||||||||
|
(In thousands)
|
2014
|
2013
|
2012
|
||||||
|
Realized gains on REO sales, net
|
$
|
43,671
|
|
48,785
|
|
21,649
|
|
||
|
Unrealized losses on transfer of loans receivable to REO and impairments, net
|
(26,107
|
)
|
(16,517
|
)
|
(11,160
|
)
|
|||
|
REO and other expenses
|
(58,067
|
)
|
(44,282
|
)
|
(56,745
|
)
|
|||
|
Rental and other income
|
43,898
|
|
20,269
|
|
16,476
|
|
|||
|
Gain on bargain purchase acquisition
|
—
|
|
8,532
|
|
—
|
|
|||
|
Rialto other income (expense), net
|
$
|
3,395
|
|
16,787
|
|
(29,780
|
)
|
||
Loans Receivable
In February 2010, our Rialto segment acquired indirectly
40%
managing member equity interests in two limited liability companies (“LLCs”), in partnership with the FDIC, which retained
60%
equity interest in the LLCs, for approximately
$243 million
(net of transaction costs and a
$22 million
working capital reserve). The LLCs hold performing and non-performing loans formerly owned by
22
failed financial institutions and when our Rialto segment acquired its interests in the LLCs, the two portfolios consisted of approximately
5,500
distressed residential and commercial real estate loans (“FDIC Portfolios”). If the LLCs exceed expectations and meet certain internal rate of return and distribution thresholds, our equity interest in the LLCs could be reduced from
40%
down to
30%
, with a corresponding increase to the FDIC’s equity interest from
60%
up to
70%
. As these thresholds have not been met, distributions continue being shared
60%
/
40%
with the FDIC. During the years ended
November 30, 2014
and
2013
, the LLCs distributed
$184.9 million
and
$46.7 million
, respectively, of which
$110.9 million
and
$28.4 million
, respectively, was distributed to the FDIC and
$74.0 million
and
$18.3 million
, respectively, was distributed to Rialto, the parent company.
The LLCs meet the accounting definition of VIEs and since we were determined to be the primary beneficiary, we consolidated the LLCs. We were determined to be the primary beneficiary because we have the power to direct the activities of the LLCs that most significantly impact the LLCs’ performance through Rialto's management and servicer contracts. At
November 30, 2014
, these consolidated LLCs had total combined assets and liabilities of
$508.4 million
and
$21.5 million
, respectively. At
November 30, 2013
, these consolidated LLCs had total combined assets and liabilities of
$727.1 million
and
$20.2 million
, respectively.
In September 2010, our Rialto segment acquired approximately
400
distressed residential and commercial real estate loans (“Bank Portfolios”) and over
300
REO properties from three financial institutions. We paid
$310.0 million
for the distressed real estate and real estate related assets of which
$124 million
was financed through a
5
-year senior unsecured note provided by one of the selling institutions. As of
November 30, 2014
and
2013
, there was
$60.6 million
and
$90.9 million
outstanding, respectively.
Rialto Mortgage Finance
In 2013, RMF was formed and began originating and selling into securitizations five, seven and ten year commercial first mortgage loans, generally with principal amounts between
$2 million
and
$75 million
, which are secured by income producing properties. This business has become a significant contributor to the Rialto segment's revenues.
During the year ended
November 30, 2014
, RMF had originated loans with a total principal balance of
$1.6 billion
and sold
$1.3 billion
of loans into
eight
separate securitizations. During the year ended
November 30, 2013
, RMF had originated loans with a principal balance of
$690.3 million
and sold
$537.0 million
of loans into three separate securitizations. As of
November 30, 2014
and
2013
,
$147.2 million
and
$109.3 million
, respectively, of these originated loans were sold into a securitization trust but not settled and thus were included as receivables, net on the Rialto segment's consolidated balance sheet.
Investments
Rialto is the sponsor of and an investor in private equity vehicles that invest in and manage real estate related assets. This includes:
|
•
|
Rialto Real Estate Fund, LP ("Fund I") that was formed in 2010 to invest in distressed real estate assets and other related investments to which investors have committed and contributed a total of
$700 million
of equity (including
$75 million
by us);
|
|
•
|
Rialto Real Estate Fund II, LP ("Fund II") that was formed in 2012 to invest in distressed real estate assets and other related investments to which investors have committed
$1.3 billion
(including
$100 million
by us); and
|
40
|
•
|
Rialto Mezzanine Partners Fund (the "Mezzanine Fund") that was formed in 2013 with a target of raising
$300 million
in capital (including
$27 million
committed by us) to invest in performing mezzanine commercial loans that have expected durations of one to two years and are secured by equity interests in the borrowing entity owning the real estate assets.
|
Rialto also earns fees for its role as a manager of these vehicles and for providing asset management and other services to those vehicles and other third parties.
Rialto's share of earnings from unconsolidated entities was as follows:
|
Years Ended November 30,
|
|||||||||
|
(In thousands)
|
2014
|
2013
|
2012
|
||||||
|
Rialto Real Estate Fund, LP
|
$
|
30,612
|
|
19,391
|
|
21,026
|
|
||
|
Rialto Real Estate Fund II, LP
|
15,929
|
|
2,523
|
|
—
|
|
|||
|
Rialto Mezzanine Partners Fund
|
1,913
|
|
354
|
|
—
|
|
|||
|
Other investments
|
10,823
|
|
85
|
|
20,457
|
|
|||
|
Rialto equity in earnings from unconsolidated entities
|
$
|
59,277
|
|
22,353
|
|
41,483
|
|
||
In 2010, our Rialto segment invested in non-investment grade commercial mortgage-backed securities (“CMBS”) at a
55%
discount to par value. The carrying value of the investment securities at
November 30, 2014
and
2013
was
$17.3 million
and
$16.1 million
, respectively. Our Rialto segment classified these securities as held-to-maturity based on its intent and ability to hold the securities until maturity.
Lennar Multifamily Segment
We have been actively involved, primarily through unconsolidated entities, in the development of multifamily rental properties. Our Lennar Multifamily segment focuses on developing a geographically diversified portfolio of institutional quality multifamily rental properties in select U.S. markets.
As of
November 30, 2014
and
2013
, our balance sheet had
$268.0 million
and
$147.1 million
, respectively, of assets related to our Lennar Multifamily segment, which includes investments in unconsolidated entities of
$105.7 million
and
$46.3 million
, respectively. Our net investment in the Lennar Multifamily segment as of
November 30, 2014
and
2013
was
$203.7 million
and
$105.6 million
, respectively. During 2014, our Lennar Multifamily segment sold two operating properties through unconsolidated entities resulting in
$14.7 million
Lennar Multifamily's share of gains included in Lennar Multifamily equity in earnings (loss) from unconsolidated entities. Our Lennar Multifamily segment had
26
and
13
, unconsolidated entities as of
November 30, 2014
and
2013
, respectively. As of
November 30, 2014
, our Lennar Multifamily segment had interests in
24
communities with development costs of approximately
$1.5 billion
, of which
one
community was completed and operating,
three
communities were partially completed and leasing,
19
communities were under construction and
one
was under development. Our Lennar Multifamily segment had a pipeline of future projects totaling
$4.3 billion
in assets across a number of states that will be developed by unconsolidated entities.
Financial Condition and Capital Resources
At
November 30, 2014
, we had cash and cash equivalents related to our homebuilding, financial services, Rialto and multifamily operations of
$1.3 billion
, compared to
$970.5 million
and
$1.3 billion
at
November 30, 2013
and
2012
, respectively.
We finance all of our activities including Homebuilding, financial services, Rialto, multifamily and general operating needs primarily with cash generated from our operations, debt issuances and equity offerings as well as cash borrowed under our warehouse lines of credit and our credit facility.
Operating Cash Flow Activities
During
2014
,
2013
and
2012
, cash used in operating activities totaled
$788.5 million
,
$807.7 million
and
$424.6 million
, respectively. During
2014
, cash used in operating activities was impacted by an increase in inventories due to strategic land purchases and land development costs, an increase in Lennar Financial Services loans held-for-sale due to increased home deliveries towards the end of 2014 compared to 2013 and an increase in receivables, partially offset by our net earnings and an increase in accounts payable and other liabilities.
During
2013
, cash used in operating activities was impacted by an increase in inventories due to strategic land purchases and an increase in Rialto loans held-for-sale related to RMF, partially offset by our increased revenues, an increase in accounts payable and other liabilities and a decrease in Lennar Financial Services loans held-for-sale.
41
During 2012, cash used in operating activities was impacted by an increase in Lennar Financial Services loans held-for-sale due to increased home deliveries towards the end of 2012 and an increase in inventories due to strategic land purchases, partially offset by our net earnings (net of our deferred income tax benefit).
Investing Cash Flow Activities
During
2014
,
2013
and 2012, cash provided by investing activities totaled
$438.4 million
,
$689.2 million
and
$245.3 million
, respectively. During
2014
, we received
$269.7 million
of proceeds from the sales of REO,
$143.5 million
of distributions of capital from Lennar Homebuilding unconsolidated entities,
$66.9 million
of distributions of capital from Lennar Multifamily unconsolidated entities,
$68.9 million
of distributions of capital from Rialto unconsolidated entities comprised of
$32.5 million
distributed by Fund I,
$9.0 million
distributed by Fund II,
$16.5 million
distributed by Mezzanine Fund and
$10.9 million
distributed by other investments,
$43.9 million
of proceeds from the sale of a Lennar Homebuilding operating property and
$51.9 million
of proceeds from the sales of Lennar Homebuilding investments available-for-sale. This was partially offset by
$87.5 million
of cash contributions to Lennar Homebuilding unconsolidated entities primarily for working capital,
$41.5 million
of cash contributions to Rialto unconsolidated entities comprised of
$7.6 million
contributed to Fund II,
$18.1 million
contributed to the Mezzanine Fund and
$15.8 million
contributed to other investments,
$30.8 million
of cash contributions to Lennar Multifamily unconsolidated entities primarily for working capital and
$21.3 million
for purchases of Lennar Homebuilding investment available-for-sale.
During
2013
, our cash provided by investing activities was primarily related to the receipt of
$239.2 million
of proceeds from the sale of REO and
$66.8 million
of principal payments on Rialto loans receivable. In addition, cash provided by investing activities increased due to
$158.1 million
of distributions of capital from Lennar Homebuilding unconsolidated entities, primarily related to a distribution from a new unconsolidated joint venture,
$42.6 million
of distributions of capital from Rialto unconsolidated entities, primarily related to Fund I, a
$223.8 million
decrease in Rialto's defeasance cash by two consolidated minority-owned LLCs to repay a loan from the FDIC, and
$140.6 million
of proceeds from the sale of a Lennar Homebuilding operating property. This was partially offset by
$57.1 million
of cash contributions to Lennar Homebuilding unconsolidated entities primarily for working capital and
$67.0 million
of cash contributions to Rialto unconsolidated entities comprised of
$50.6 million
contributed to Fund II and
$16.4 million
contributed to the Mezzanine Fund.
During 2012, our cash provided by investing activities was primarily related to the receipt of
$183.9 million
of proceeds from the sale of REO,
$81.6 million
of principal payments on Rialto loans receivable and
$34.0 million
of distributions of capital from Lennar Homebuilding unconsolidated entities. This was offset by
$72.6 million
of cash contributions to Lennar Homebuilding unconsolidated entities primarily for working capital and debt reduction,
$43.6 million
of cash contributions to Rialto unconsolidated entities and
$51.1 million
for Lennar Financial Services purchases of held-to-maturity investment securities that mature at various dates within one year.
We are continually exploring various types of transactions to manage our leverage and liquidity positions, take advantage of market opportunities and increase our revenues. These transactions may include the issuance of additional indebtedness, the repurchase of our outstanding indebtedness for cash or equity, the acquisition of homebuilders and other companies, the sale of our assets or lines of business, the issuance of common stock or securities convertible into shares of common stock, and/or pursuing other financing alternatives. In connection with some of our more recently formed businesses, such as Rialto and Multifamily, and our consolidated joint venture FivePoint Communities, we may also consider other types of transactions such as restructurings, joint ventures, spin-offs or initial public offerings. We are exploring opportunities to create a fund, which we would manage and in which we would make an investment, to provide funding for the rental communities we develop. If any of these transactions are implemented, they could materially impact the amount and composition of our indebtedness outstanding, increase our interest expense, dilute our existing stockholders and/or affect the book value of our assets. At
November 30, 2014
, we had no agreements or understandings regarding any significant transactions.
Financing Cash Flow Activities
During
2014
,
2013
and 2012, our cash provided by (used in) financing activities totaled
$661.4 million
,
($221.8) million
and
$326.5 million
, respectively. During
2014
, our cash provided by financing activities was primarily attributed to the receipt of proceeds related to the sale of $500 million aggregate principal amount of
4.500%
senior notes due June 2019, proceeds related to the sale of
$350 million
aggregate principal amount of
4.50%
senior notes due November 2019, proceeds related to the sale of
$100 million
aggregate principal amount of Rialto's
7.00%
senior notes due 2018 (the "
7.00%
Senior Notes"),
$94.4 million
of proceeds related to the issuance of Rialto's structured note offering (the "Structured Notes") and net borrowings under our Lennar Financial Services' 364-day warehouse repurchase facilities and our Rialto's warehouse repurchase facilities. The cash provided by financing activities was partially offset by the
$250.0 million
redemption of our 5.50% senior notes due 2014,
$299.7 million
of principal payments on other borrowings and
$155.6 million
of payments related to noncontrolling interests.
During
2013
, our cash used in financing activities was attributed to
$471.3 million
of principal payments of our Rialto notes payable,
$83.8 million
of net repayments under our Lennar Financial Services' 364-day warehouse repurchase facilities,
42
$287.4 million
of principal payments on other borrowings, the
$63.8 million
redemption of our 5.95% senior notes due 2013 and
$201.7 million
of payments related to buyouts of our partners' noncontrolling interests, primarily related to two of our consolidated joint ventures. This was partially offset by the receipt of proceeds related to the sale of $275 million aggregate principal amount of our 4.125% senior notes due 2018, the sale of an additional $225 million aggregate principal amount of our 4.750% senior notes due 2022 and the sale of
$250 million
aggregate principal amount of Rialto's
7.00%
senior notes,
$76.0 million
of net borrowings under Rialto's warehouse repurchase facilities related to RMF and
$92.6 million
of proceeds from other borrowings.
During 2012, our cash provided by financing activities was primarily attributed to the receipt of proceeds related to the sale of
$400 million
of 4.75% senior notes due 2017, $350 million of 4.750% senior notes due 2022 and the sale of an additional $50 million aggregate principal amount of our 3.25% convertible senior notes due 2021 that the initial purchasers acquired to cover over-allotments. This was partially offset by the partial redemption of our 5.95% senior notes due 2013, principal repayments on Rialto's notes payable and principal payments on other borrowings.
During 2013, we exercised certain land option contracts from a land investment venture to which we had sold land in 2007, reducing the liabilities reflected on our consolidated balance sheet related to consolidated inventory not owned by
$28.9 million
. Due to our continuing involvement, the 2007 transaction did not qualify as a sale under GAAP; thus, the inventory remained on our balance sheet in consolidated inventory not owned. In 2014, we entered into a new agreement with the joint venture, which required
$155.0 million
of inventory assets to remain consolidated due to the existence of option contracts on substantially all of the homesites and were reclassified into land and land under development. The remaining
$70.3 million
of inventory assets no longer under option by us were deconsolidated.
Debt to total capital ratios are financial measures commonly used in the homebuilding industry and are presented to assist in understanding the leverage of our Lennar Homebuilding operations. Lennar Homebuilding debt to total capital and net Lennar Homebuilding debt to total capital were calculated as follows:
|
November 30,
|
||||||
|
(Dollars in thousands)
|
2014
|
2013
|
||||
|
Lennar Homebuilding debt
|
$
|
4,690,213
|
|
4,194,432
|
|
|
|
Stockholders’ equity
|
4,827,020
|
|
4,168,901
|
|
||
|
Total capital
|
$
|
9,517,233
|
|
8,363,333
|
|
|
|
Lennar Homebuilding debt to total capital
|
49.3
|
%
|
50.2
|
%
|
||
|
Lennar Homebuilding debt
|
$
|
4,690,213
|
|
4,194,432
|
|
|
|
Less: Lennar Homebuilding cash and cash equivalents
|
885,729
|
|
695,424
|
|
||
|
Net Lennar Homebuilding debt
|
$
|
3,804,484
|
|
3,499,008
|
|
|
|
Net Lennar Homebuilding debt to total capital (1)
|
44.1
|
%
|
45.6
|
%
|
||
|
(1)
|
Net Lennar Homebuilding debt to total capital is a non-GAAP financial measure defined as net Lennar Homebuilding debt (Lennar Homebuilding debt less Lennar Homebuilding cash and cash equivalents) divided by total capital (net Lennar Homebuilding debt plus stockholders' equity). We believe the ratio of net Lennar Homebuilding debt to total capital is relevant and a useful financial measure to investors in understanding the leverage employed in our Lennar Homebuilding operations. However, because net Lennar Homebuilding debt to total capital is not calculated in accordance with GAAP, this financial measure should not be considered in isolation or as an alternative to financial measures prescribed by GAAP. Rather, this non-GAAP financial measure should be used to supplement the our GAAP results.
|
At
November 30, 2014
, Lennar Homebuilding debt to total capital was lower compared to the prior year period, primarily as a result of an increase in stockholder’s equity primarily related to our net earnings, partially offset by an increase in Lennar Homebuilding debt due to the issuance of senior notes.
In addition to the use of capital in our homebuilding, financial services, Rialto and multifamily operations, we actively evaluate various other uses of capital. This may include acquisitions of, or investments in, other entities, the payment of dividends or repurchases of our outstanding common stock or debt. These activities may be funded through any combination of our credit facility, warehouse lines of credit, cash generated from operations, sales of assets or the issuance into capital markets of debt, common stock or preferred stock.
43
The following table summarizes our Lennar Homebuilding senior notes and other debts payable:
|
November 30,
|
||||||
|
(Dollars in thousands)
|
2014
|
2013
|
||||
|
5.60% senior notes due 2015
|
$
|
500,272
|
|
500,527
|
|
|
|
6.50% senior notes due 2016
|
249,923
|
|
249,886
|
|
||
|
12.25% senior notes due 2017
|
396,278
|
|
395,312
|
|
||
|
4.75% senior notes due 2017
|
399,250
|
|
399,250
|
|
||
|
6.95% senior notes due 2018
|
248,485
|
|
248,167
|
|
||
|
4.125% senior notes due 2018
|
274,995
|
|
274,995
|
|
||
|
4.500% senior notes due 2019
|
500,477
|
|
—
|
|
||
|
4.50% senior notes due 2019
|
350,000
|
|
—
|
|
||
|
2.75% convertible senior notes due 2020
|
431,042
|
|
416,041
|
|
||
|
3.25% convertible senior notes due 2021
|
400,000
|
|
400,000
|
|
||
|
4.750% senior notes due 2022
|
571,439
|
|
571,012
|
|
||
|
5.50% senior notes due 2014
|
—
|
|
249,640
|
|
||
|
Mortgages notes on land and other debt
|
368,052
|
|
489,602
|
|
||
|
$
|
4,690,213
|
|
4,194,432
|
|
||
Our Lennar Homebuilding average debt outstanding was $4.7 billion with an average rate for interest incurred of 5.2% for the year ended
November 30, 2014
, compared to $4.4 billion with an average rate for interest incurred of 5.1% for the year ended
November 30, 2013
. Interest incurred related to Lennar Homebuilding debt for the year ended
November 30, 2014
was
$273.4 million
, compared to
$261.5 million
in
2013
. The majority of our short-term financing needs, including financings for land acquisition and development activities and general operating needs, are met with cash generated from operations, proceeds from debt, as well as borrowings under our unsecured revolving credit facility (the "Credit Facility").
The terms of each of our senior and convertible senior notes outstanding at
November 30, 2014
were as follows:
|
Senior and Convertible Senior Notes Outstanding (1)
|
Principal Amount
|
Net Proceeds (2)
|
Price
|
Dates Issued
|
|||||||||
|
(Dollars in thousands)
|
|||||||||||||
|
5.60% senior notes due 2015
|
$
|
500,000
|
|
$
|
501,400
|
|
(3)
|
|
April 2005, July 2005
|
||||
|
6.50% senior notes due 2016
|
250,000
|
|
248,900
|
|
99.873
|
%
|
April 2006
|
||||||
|
12.25% senior notes due 2017
|
400,000
|
|
386,700
|
|
98.098
|
%
|
April 2009
|
||||||
|
4.75% senior notes due 2017
|
400,000
|
|
395,900
|
|
100
|
%
|
July 2012, August 2012
|
||||||
|
6.95% senior notes due 2018
|
250,000
|
|
243,900
|
|
98.929
|
%
|
May 2010
|
||||||
|
4.125% senior notes due 2018 (4)
|
275,000
|
|
271,718
|
|
99.998
|
%
|
February 2013
|
||||||
|
4.500% senior notes due 2019
|
500,000
|
|
495,725
|
|
(5)
|
|
February 2014
|
||||||
|
4.50% senior notes due 2019
|
350,000
|
|
347,016
|
|
100
|
%
|
November 2014
|
||||||
|
2.75% convertible senior notes due 2020
|
446,000
|
|
436,400
|
|
100
|
%
|
November 2010
|
||||||
|
3.25% convertible senior notes due 2021
|
400,000
|
|
391,600
|
|
100
|
%
|
November 2011, December 2011
|
||||||
|
4.750% senior notes due 2022 (4)
|
575,000
|
|
567,585
|
|
(6)
|
|
October 2012, February 2013, April 2013
|
||||||
|
(1)
|
Interest is payable semi-annually for each of the series of senior and convertible senior notes. The senior and convertible senior notes are unsecured and unsubordinated, but are guaranteed by substantially all of our 100% owned homebuilding subsidiaries.
|
|
(2)
|
We generally use the net proceeds of the sales for working capital and general corporate purposes, which can include the repayment or repurchase of other outstanding senior notes.
|
|
(3)
|
We issued
$300 million
aggregate principal amount at a price of
99.771%
and
$200 million
aggregate principal amount at a price of
101.407%
.
|
|
(4)
|
During 2013, we incurred additional interest with respect to the 4.125% senior notes due 2018 and to the 4.750% senior notes due 2022 because the registration statements relating to the notes did not became effective by, and the exchange offers were not consummated by, the dates specified in the Registration Rights Agreement related to such notes.
|
|
(5)
|
We issued
$400 million
aggregate principal amount at a price of
100%
and
$100 million
aggregate principal amount at a price of
100.5%
.
|
44
|
(6)
|
We issued
$350 million
aggregate principal amount at a price of
100%
,
$175 million
aggregate principal amount at a price of
98.073%
and
$50 million
aggregate principal amount at a price of
98.250%
.
|
In September 2014, we retired our
$250 million
5.50% senior notes due September 2014 for 100% of the outstanding principal amount, plus accrued and unpaid interest as of the maturity date.
The
3.25%
convertible senior notes due 2021 (the "
3.25%
Convertible Senior Notes") are convertible into shares of Class A common stock at any time prior to maturity or redemption at the initial conversion rate of
42.5555
shares of Class A common stock per
$1,000
principal amount of the
3.25%
Convertible Senior Notes or
17,022,200
shares of Class A common stock if all the
3.25%
Convertible Senior Notes are converted, which is equivalent to an initial conversion price of approximately
$23.50
per share of Class A common stock, subject to anti-dilution adjustments. The shares are included in the calculation of diluted earnings per share. Holders of the 3.25% Convertible Senior Notes have the right to require us to repurchase them for cash equal to 100% of their principal amount, plus accrued but unpaid interest on November 15, 2016. We have the right to redeem the 3.25% Convertible Senior Notes at any time on or after November 20, 2016 for 100% of their principal amount, plus accrued but unpaid interest.
The
2.75%
convertible senior notes due 2020 (the "
2.75%
Convertible Senior Notes") are convertible into cash, shares of Class A common stock or a combination of both, at our election. However, it is our intent to settle the face value of the
2.75%
Convertible Senior Notes in cash. Holders may convert the
2.75%
Convertible Senior Notes at the initial conversion rate of
45.1794
shares of Class A common stock per
$1,000
principal amount or
20,150,012
shares of Class A common stock if all the
2.75%
Convertible Senior Notes are converted, which is equivalent to an initial conversion price of approximately
$22.13
per share of Class A common stock, subject to anti-dilution adjustments. For the years ended
November 30, 2014
and 2013, our volume weighted average stock price was
$39.96
and
$37.06
, respectively, which exceeded the conversion price, thus
9.0 million
shares and
8.2 million
shares, respectively, were included in the calculation of diluted earnings per share.
Holders of the
2.75%
Convertible Senior Notes have the right to convert them, during any fiscal quarter (and only during such fiscal quarter), if the last reported sale price of our Class A common stock for at least
20
trading days (whether or not consecutive) during a period of
30
consecutive trading days ending on the last trading day of the immediately preceding fiscal quarter is greater than or equal to
130%
of the conversion price on each applicable trading day. Holders of the 2.75% Convertible Senior Notes have the right to require us to repurchase them for cash equal to 100% of their principal amount, plus accrued but unpaid interest, on December 15, 2015. We have the right to redeem the 2.75% Convertible Senior Notes at any time on or after December 20, 2015 for 100% of their principal amount, plus accrued but unpaid interest.
For our
2.75%
Convertible Senior Notes, we will be required to pay contingent interest with regard to any interest period beginning with the interest period commencing December 20, 2015 and ending June 14, 2016, and for each subsequent
six
-month period commencing on an interest payment date to, but excluding, the next interest payment date, if the average trading price of the
2.75%
Convertible Senior Notes during the
five
consecutive trading days ending on the second trading day immediately preceding the first day of the applicable interest period exceeds
120%
of the principal amount of the
2.75%
Convertible Senior Notes. The amount of contingent interest payable per
$1,000
principal amount of notes during the applicable interest period will equal
0.75%
per year of the average trading price of such
$1,000
principal amount of
2.75%
Convertible Senior Notes during the five trading day reference period.
Certain provisions under Accounting Standards Codification (“ASC”) 470,
Debt
, require the issuer of certain convertible debt instruments that may be settled in cash on conversion to separately account for the liability and equity components of the instrument in a manner that reflects the issuer’s non-convertible debt borrowing rate. We have applied these provisions to our
2.75%
Convertible Senior Notes. At issuance, we estimated the fair value of the
2.75%
Convertible Senior Notes using similar debt instruments that did not have a conversion feature and allocated the residual value to an equity component that represented the estimated fair value of the conversion feature at issuance. The debt discount of the
2.75%
Convertible Senior Notes is being amortized over five years and the annual effective interest rate is
7.1%
after giving effect to the amortization of the discount and deferred financing costs. At both
November 30, 2014
and
2013
, the principal amount of the
2.75%
Convertible Senior Notes was
$446.0 million
. At
November 30, 2014
and
2013
, the carrying amount of the equity component included in stockholders’ equity was
$15.0 million
and
$30.0 million
, respectively, and the net carrying amount of the
2.75%
Convertible Senior Notes included in Lennar Homebuilding senior notes and other debts payable was
$431.0 million
and
$416.0 million
, respectively. During the years ended
November 30, 2014
and
2013
, the amount of interest recognized relating to both the contractual interest and amortization of the discount was
$27.3 million
and
$26.5 million
, respectively.
Currently, substantially all of our 100% owned homebuilding subsidiaries are guaranteeing all our Senior Notes (the “Guaranteed Notes”). The guarantees are full and unconditional. The principal reason our 100% owned homebuilding subsidiaries are guaranteeing the Guaranteed Notes is so holders of the Guaranteed Notes will have rights at least as great with regard to our subsidiaries as any other holders of a material amount of our unsecured debt. Therefore, the guarantees of the Guaranteed Notes will remain in effect only while the guarantor subsidiaries guarantee a material amount of the debt of Lennar Corporation, as a separate entity, to others. At any time when a guarantor subsidiary is no longer guaranteeing at least $75 million of Lennar Corporation’s debt other than the Guaranteed Notes, either directly or by guaranteeing other subsidiaries’
45
obligations as guarantors of Lennar Corporation’s debt, the guarantor subsidiary’s guarantee of the Guaranteed Notes will be suspended. Therefore, if the guarantor subsidiaries cease guaranteeing Lennar Corporation’s obligations under our Credit Facility and our letter of credit facilities and are not guarantors of any new debt, the guarantor subsidiaries’ guarantees of the Guaranteed Notes will be suspended until such time, if any, as they again are guaranteeing at least $75 million of Lennar Corporation’s debt other than the Guaranteed Notes.
If our guarantor subsidiaries are guaranteeing revolving credit lines totaling at least $75 million, we will treat the guarantees of the Guaranteed Notes as remaining in effect even during periods when Lennar Corporation’s borrowings under the revolving credit lines are less than $75 million. In addition, a subsidiary will be released from its guarantee and any other obligations it may have regarding the senior notes if all or substantially all its assets, or all of its capital stock, are sold or otherwise disposed of.
At
November 30, 2014
, we had a
$1.5 billion
Credit Facility, which includes a
$248 million
accordion feature, subject to additional commitments, with certain financial institutions that matures in
June 2018
. The proceeds available under the Credit Facility, which are subject to specified conditions for borrowing, may be used for working capital and general corporate purposes. The Credit Facility agreement also provides that up to
$500 million
in commitments may be used for letters of credit. As of both
November 30, 2014
and
2013
, we had
no
outstanding borrowings under the Credit Facility. We may from time to time, borrow from and repay the Credit Facility. Consequently, the amount outstanding under the Credit Facility at the end of the period may not be reflective of the total amounts outstanding during the period. We believe that we were in compliance with our debt covenants at
November 30, 2014
. In addition, we had
$125 million
letter of credit facilities with a financial institution and a
$140 million
letter of credit facility with a different financial institution.
Our performance letters of credit outstanding were
$234.1 million
and
$160.6 million
at
November 30, 2014
and
2013
, respectively. Our financial letters of credit outstanding were
$190.4 million
and
$212.8 million
at
November 30, 2014
and
2013
, respectively. Performance letters of credit are generally posted with regulatory bodies to guarantee the performance of certain development and construction activities. Financial letters of credit are generally posted in lieu of cash deposits on option contracts, for insurance risks, credit enhancements and as other collateral.
Under the amended Credit Facility agreement executed in June 2014 (the "Credit Agreement"), as of the end of each fiscal quarter, we are required to maintain minimum consolidated tangible net worth of approximately $1.5 billion plus the sum of 50% of the cumulative consolidated net income from February 29, 2012, if positive, and 50% of the net cash proceeds from any equity offerings from and after February 29, 2012. We are required to maintain a leverage ratio that shall not exceed 65% and may be reduced by 2.5% per quarter if our interest coverage ratio is less than 2.25:1.00 for two consecutive fiscal calendar quarters. The leverage ratio will have a floor of 60%. If our interest coverage ratio subsequently exceeds 2.25:1.00 for two consecutive fiscal calendar quarters, the leverage ratio we will be required to maintain will be increased by 2.5% per quarter to a maximum of 65%. As of the end of each fiscal quarter, we are also required to maintain either (1) liquidity in an amount equal to or greater than 1.00x consolidated interest incurred for the last twelve months then ended or (2) an interest coverage ratio equal to or greater than 1.50:1.00 for the last twelve months then ended.
The following are computations of our compliance with the minimum net worth test, maximum leverage ratio, and liquidity test, as calculated per the Credit Agreement as of
November 30, 2014
:
|
(Dollars in thousands)
|
Covenant Level
|
Level Achieved as of November 30, 2014
|
||||
|
Minimum net worth test (1)
|
$
|
2,248,047
|
|
4,099,856
|
|
|
|
Maximum leverage ratio (2)
|
65.0
|
%
|
44.2
|
%
|
||
|
Liquidity test (3)
|
1.00
|
|
3.31
|
|
||
46
The terms of the minimum net worth test, maximum leverage ratio and liquidity test used in the Credit Agreement are specifically calculated per the Credit Agreement and differ in specified ways from comparable GAAP or common usage terms. Our minimum net worth test, maximum leverage ratio and liquidity test were calculated for purposes of the Credit Agreement as of
November 30, 2014
as follows:
|
(1)
|
The minimum consolidated tangible net worth and the consolidated tangible net worth as calculated per the Credit Agreement were as follows:
|
|
Minimum consolidated tangible net worth
|
|||
|
(In thousands)
|
As of November 30, 2014
|
||
|
Stated minimum consolidated tangible net worth per the Credit Agreement
|
$
|
1,459,657
|
|
|
Plus: 50% of cumulative consolidated net income as calculated per the Credit Agreement, if positive
|
788,390
|
|
|
|
Required minimum consolidated tangible net worth per the Credit Agreement
|
$
|
2,248,047
|
|
|
Consolidated tangible net worth
|
|||
|
(In thousands)
|
As of November 30, 2014
|
||
|
Total equity
|
$
|
5,251,302
|
|
|
Less: Intangible assets (a)
|
(51,246
|
)
|
|
|
Tangible net worth as calculated per the Credit Agreement
|
5,200,056
|
|
|
|
Less: Consolidated equity of mortgage banking, Rialto and other designated subsidiaries (b)
|
(972,494
|
)
|
|
|
Less: Lennar Homebuilding and Lennar Multifamily noncontrolling interests
|
(127,706
|
)
|
|
|
Consolidated tangible net worth as calculated per the Credit Agreement
|
$
|
4,099,856
|
|
(a)
Intangible assets represent the Financial Services segment's title operations goodwill and title plant assets.
|
(b)
|
Consolidated equity of mortgage banking subsidiaries represents the equity of the Lennar Financial Services segment's mortgage banking operations. Consolidated equity of other designated subsidiaries represents the equity of certain subsidiaries included within the Lennar Financial Services segment's title operations that are prohibited from being guarantors under the Credit Agreement. The consolidated equity of Rialto, as calculated per the Credit Agreement, represents Rialto's total assets minus Rialto's total liabilities as disclosed in Note 8 of the notes to our consolidated financial statements as of
November 30, 2014
. The consolidated equity of mortgage banking subsidiaries, Rialto and other designated subsidiaries are included in equity in our consolidated balance sheet as of
November 30, 2014
.
|
|
(2)
|
The leverage ratio as calculated per the Credit Agreement was as follows:
|
|
Leverage ratio:
|
|||
|
(Dollars in thousands)
|
As of November 30, 2014
|
||
|
Lennar Homebuilding senior notes and other debts payable
|
$
|
4,690,213
|
|
|
Less: Debt of Lennar Homebuilding consolidated entities (a)
|
(80,351
|
)
|
|
|
Funded debt as calculated per the Credit Agreement
|
4,609,862
|
|
|
|
Plus: Financial letters of credit (b)
|
190,491
|
|
|
|
Plus: Lennar's recourse exposure related to Lennar Homebuilding unconsolidated/consolidated entities, net (c)
|
43,281
|
|
|
|
Consolidated indebtedness as calculated per the Credit Agreement
|
4,843,634
|
|
|
|
Less: Unrestricted cash and cash equivalents in excess of required liquidity per the Credit Agreement (d)
|
(892,291
|
)
|
|
|
Numerator as calculated per the Credit Agreement
|
$
|
3,951,343
|
|
|
Denominator as calculated per the Credit Agreement
|
$
|
8,943,490
|
|
|
Leverage ratio (e)
|
44.2
|
%
|
|
|
(a)
|
Debt of our Lennar Homebuilding consolidated joint ventures is included in Lennar Homebuilding senior notes and other debts payable in our consolidated balance sheet as of
November 30, 2014
.
|
|
(b)
|
As of
November 30, 2014
, our financial letters of credit outstanding include
$190.4 million
disclosed in Note 6 of the notes to our consolidated financial statements and $0.1 million of financial letters of credit related to the Financial Services segment's title operations.
|
|
(c)
|
Lennar's recourse exposure related to the Lennar Homebuilding unconsolidated and consolidated entities, net includes
$24.5 million
of net recourse exposure related to Lennar Homebuilding unconsolidated entities and $18.8 million of recourse exposure related to Lennar Homebuilding consolidated entities, which is included in Lennar Homebuilding senior notes and other debts payable in our consolidated balance sheet as of
November 30, 2014
.
|
47
|
(d)
|
As of
November 30, 2014
, unrestricted cash and cash equivalents include
$885.7 million
of Lennar Homebuilding cash and cash equivalents,
$2.2 million
of Lennar Multifamily cash and cash equivalents and $14.4 million of Lennar Financial Services cash and cash equivalents, excluding cash and cash equivalents from mortgage banking subsidiaries and other designated subsidiaries within the Lennar Financial Services segment.
|
|
(e)
|
Leverage ratio consists of the numerator as calculated per the Credit Agreement divided by the denominator as calculated per the Credit Agreement (consolidated indebtedness as calculated per the Credit Agreement, plus consolidated tangible net worth as calculated per the Credit Agreement).
|
|
(3)
|
Liquidity as calculated per the Credit Agreement was as follows:
|
|
Liquidity test
|
|||
|
(Dollars in thousands)
|
As of November 30, 2014
|
||
|
Unrestricted cash and cash equivalents as calculated per the Credit Agreement (a)
|
$
|
890,545
|
|
|
Consolidated interest incurred as calculated per the Credit Agreement (b)
|
$
|
269,131
|
|
|
Liquidity (c)
|
3.31
|
|
|
|
(a)
|
Unrestricted cash and cash and cash equivalents at
November 30, 2014
for the liquidity test calculation includes
$885.7 million
of Lennar Homebuilding cash and cash equivalents, plus
$2.2 million
of Lennar Multifamily cash and cash equivalents, plus $14.4 million of Lennar Financial Services cash and cash equivalents, excluding cash and cash equivalents from mortgage banking subsidiaries and other designated subsidiaries within the Lennar Financial Services segment, minus $11.7 million of cash and cash equivalents of Lennar Homebuilding and Multifamily consolidated joint ventures.
|
|
(b)
|
Consolidated interest incurred as calculated per the Credit Agreement for the twelve months ended
November 30, 2014
includes Lennar Homebuilding interest incurred of $273.4 million, plus Lennar Financial Services interest incurred, excluding interest incurred from mortgage banking subsidiaries and other designated subsidiaries within the Lennar Financial Services operations, minus (1) interest incurred related to our partner's share of Lennar Homebuilding consolidated joint ventures included within Lennar Homebuilding interest incurred, (2) Lennar Homebuilding interest income included within Lennar Homebuilding other income, net, and (3) Lennar Financial Services interest income, excluding interest income from mortgage banking subsidiaries and other designated subsidiaries within the Lennar Financial Services operations.
|
|
(c)
|
We are only required to maintain either (1) liquidity in an amount equal to or greater than 1.00x consolidated interest incurred for the last twelve months then ended or (2) an interest coverage ratio of equal to or greater than 1.50:1.00 for the last twelve months then ended. Although we are in compliance with our debt covenants for both calculations, we have only disclosed the detailed calculation of our liquidity test.
|
Our Financial Services segment's warehouse facilities at
November 30, 2014
, were as follows:
|
(In thousands)
|
Maximum Aggregate Commitment
|
||
|
364-day warehouse repurchase facility that matures December 2014 (1)
|
$
|
325,000
|
|
|
364-day warehouse repurchase facility that matures January 2015 (2)
|
300,000
|
|
|
|
364-day warehouse repurchase facility that matures February 2015
|
150,000
|
|
|
|
364-day warehouse repurchase facility that matures June 2015 (3)
|
150,000
|
|
|
|
Total
|
$
|
925,000
|
|
|
(1)
|
In December 2014, our Lennar Financial Services segment amended its 364-day warehouse repurchase facility that matured in December 2014 increasing the maximum aggregate commitment from
$325 million
to
$350 million
through the second quarter of fiscal 2015 and to
$450 million
for the third and fourth quarter of fiscal 2015. The maturity date was extended to December 2015.
|
|
(2)
|
Maximum aggregate commitment includes a
$100 million
accordion feature that is usable 10 days prior to fiscal quarter-end through 20 days after fiscal quarter-end.
|
|
(3)
|
Maximum aggregate commitment includes a
$50 million
accordion feature that is available beginning on the tenth (10th) calendar day immediately preceding the first day of a fiscal quarter through 20 days after fiscal quarter-end.
|
Our Lennar Financial Services segment uses these facilities to finance its lending activities until the mortgage loans are sold to investors and the proceeds are collected. The facilities are expected to be renewed or replaced with other facilities when they mature. Borrowings under the facilities and their prior year predecessors were
$698.4 million
and
$374.2 million
, at
November 30, 2014
and
2013
, respectively, and were collateralized by mortgage loans and receivables on loans sold to investors but not yet paid for with outstanding principal balances of
$732.1 million
and
$452.5 million
, at
November 30, 2014
and
2013
, respectively. The combined effective interest rate on the facilities at
November 30, 2014
was
2.5%
. Without the facilities, our Lennar Financial Services segment would have to use cash from operations and other funding sources to finance its lending activities. Since our Lennar Financial Services segment’s borrowings under the warehouse repurchase facilities are generally repaid with the proceeds from the sale of mortgage loans and receivables on loans that secure those borrowings, the facilities are not likely to be a call on our current cash or future cash resources. If the facilities are not renewed or replaced, the
48
borrowings under the lines of credit will be paid off by selling mortgage loans held-for-sale to investors and by collecting on receivables on loans sold but not yet paid.
As of
November 30, 2014
and
2013
, RMF had
two
warehouse repurchase financing agreements that mature in fiscal year 2015 with commitments totaling
$650 million
and
$500 million
, respectively, to help finance the loans it makes. Rialto uses these warehouse repurchase financing agreements to finance five, seven and ten year commercial first mortgage loans that are originated by RMF, generally with principal amounts between
$2 million
and
$75 million
, which are secured by income producing properties. Borrowings under these facilities were
$141.3 million
and
$76.0 million
as of
November 30, 2014
and
2013
, respectively.
In November 2013, our Rialto segment issued
$250 million
aggregate principal amount of the
7.00%
Senior Notes, at a price of
100%
in a private placement. Proceeds from the offering, after payment of expenses, were approximately
$245 million
. Rialto used a majority of the net proceeds of the sale of the
7.00%
Senior Notes as working capital for RMF and used
$100 million
to repay sums that had been advanced to RMF from Lennar to enable it to begin originating and securitizing commercial mortgage loans. In March 2014, the Rialto segment issued an additional
$100 million
of the
7.00%
Senior Notes at a price of
102.25%
of their face value in a private placement. Proceeds from the offering, after payment of expenses, were approximately
$102 million
. Rialto used the net proceeds of the offering to provide additional working capital for RMF, and to make investments in the funds that Rialto manages, as well as for general corporate purposes. Interest on the
7.00%
Senior Notes is due semi-annually. At
November 30, 2014
and
2013
, the carrying amount of the
7.00%
Senior Notes was
$351.9 million
and
$250.0 million
, respectively. Under the indenture, Rialto is subject to certain covenants limiting, among other things, Rialto’s ability to incur indebtedness, to make investments, to make distributions to, or enter into transactions with, Lennar or to create liens, subject to certain exceptions and qualifications. Rialto also has quarterly and annual reporting requirements, similar to an SEC registrant, to holders of the
7.00%
Senior Notes. We believe Rialto was in compliance with its debt covenants at
November 30, 2014
.
In May 2014, Rialto issued
$73.8 million
principal amount of the Structured Notes collateralized by certain assets originally acquired in the Bank Portfolios transaction at a price of 100%, with an annual coupon rate of 2.85%. Proceeds from the offering, after payment of expenses and hold backs for a cash reserve, were
$69.1 million
. In November 2014, Rialto issued an additional
$20.8 million
of the Structured Notes at a price of
99.5%
, with an annual coupon rate of
5.0%
. Proceeds from the offering, after payment of expenses, were
$20.7 million
. The estimated final payment date of the Structured Notes is December 15, 2015. As of
November 30, 2014
, there was
$58.0 million
outstanding related to the Structured Notes.
Changes in Capital Structure
We have a stock repurchase program adopted in 2006, which originally authorized us to purchase up to
20 million
shares of our outstanding common stock. During the years ended
November 30, 2014
,
2013
and
2012
, there were
no
share repurchases of common stock under the stock repurchase program. As of
November 30, 2014
, the remaining authorized shares that can be purchased under the stock repurchase program were
6.2 million
shares of common stock.
During the year ended
November 30, 2014
, treasury stock decreased by
11.6 million
shares of Class A common stock primarily due to the retirement of
11.7 million
shares of Class A common stock authorized by our Board of Directors, partially offset by activity related to our equity compensation plan. During the year ended
November 30, 2013
, treasury stock decreased by
0.4 million
shares of Class A common stock due to activity related to our equity compensation plan.
During the years ended
November 30, 2014
,
2013
and
2012
, our Class A and Class B common stockholders received a per share annual dividend of
$0.16
.
Based on our current financial condition and credit relationships, we believe that our operations and borrowing resources will provide for our current and long-term capital requirements at our anticipated levels of activity.
49
Off-Balance Sheet Arrangements
Lennar Homebuilding - Investments in Unconsolidated Entities
At
November 30, 2014
, we had equity investments in
35
homebuilding and land unconsolidated entities (of which 5
had recourse debt, 6 had non-recourse debt and 24 had no debt), compared to 36 homebuilding and land unconsolidated entities at
November 30, 2013
. Historically, we invested in unconsolidated entities that acquired and developed land (1) for our homebuilding operations or for sale to third parties or (2) for the construction of homes for sale to third-party homebuyers. Through these entities, we primarily sought to reduce and share our risk by limiting the amount of our capital invested in land, while obtaining access to potential future homesites and allowing us to participate in strategic ventures. The use of these entities also, in some instances, enabled us to acquire land to which we could not otherwise obtain access, or could not obtain access on as favorable terms, without the participation of a strategic partner. Participants in these joint ventures have been land owners/developers, other homebuilders and financial or strategic partners. Joint ventures with land owners/developers have given us access to homesites owned or controlled by our partners. Joint ventures with other homebuilders have provided us with the ability to bid jointly with our partners for large land parcels. Joint ventures with financial partners have allowed us to combine our homebuilding expertise with access to our partners’ capital. Joint ventures with strategic partners have allowed us to combine our homebuilding expertise with the specific expertise (e.g. commercial or infill experience) of our partner. Each joint venture is governed by an executive committee consisting of members from the partners.
Although the strategic purposes of our joint ventures and the nature of our joint ventures partners vary, the joint ventures are generally designed to acquire, develop and/or sell specific assets during a limited life-time. The joint ventures are typically structured through non-corporate entities in which control is shared with our venture partners. Each joint venture is unique in terms of its funding requirements and liquidity needs. We and the other joint venture participants typically make pro-rata cash contributions to the joint venture. In many cases, our risk is limited to our equity contribution and potential future capital contributions. Additionally, most joint ventures obtain third-party debt to fund a portion of the acquisition, development and construction costs of their communities. The joint venture agreements usually permit, but do not require, the joint ventures to make additional capital calls in the future. However, capital calls relating to the repayment of joint venture debt under payment or maintenance guarantees generally is required.
Under the terms of our joint venture agreements, we generally have the right to share in earnings and distributions of the entities on a pro-rata basis based on our ownership percentage. Some joint venture agreements provide for a different allocation of profit and cash distributions if and when the cumulative results of the joint venture exceed specified targets (such as a specified internal rate of return). Lennar Homebuilding equity in earnings (loss) from unconsolidated entities excludes our pro-rata share of joint ventures’ earnings resulting from land sales to our homebuilding divisions. Instead, we account for those earnings as a reduction of our costs of purchasing the land from the joint ventures. This in effect defers recognition of our share of the joint ventures’ earnings related to these sales until we deliver a home and title passes to a third-party homebuyer.
In many instances, we are designated as the manager of a venture under the direction of a management committee that has shared power amongst the partners of the unconsolidated entity and we receive fees for such services. In addition, we often enter into option and purchase contracts to acquire properties from our joint ventures, generally for market prices at specified dates in the future. Option contracts generally require us to make deposits using cash or irrevocable letters of credit toward the exercise price. These option deposits are generally negotiated on a case by case basis.
We regularly monitor the results of our unconsolidated joint ventures and any trends that may affect their future liquidity or results of operations. Joint ventures in which we have investments may be subject to a variety of financial and non-financial debt covenants related primarily to equity maintenance, fair value of collateral and minimum homesite takedown or sale requirements. We monitor the performance of joint ventures in which we have investments on a regular basis to assess compliance with debt covenants. For those joint ventures not in compliance with the debt covenants, we evaluate and assess possible impairment of our investment.
Our arrangements with joint ventures generally do not restrict our activities or those of the other participants. However, in certain instances, we agree not to engage in some types of activities that may be viewed as competitive with the activities of these ventures in the localities where the joint ventures do business.
As discussed above, the joint ventures in which we invest generally supplement equity contributions with third-party debt to finance their activities. In some instances, the debt financing is non-recourse, thus neither we nor the other equity partners are a party to the debt instruments. In other cases, we and the other partners agree to provide credit support in the form of repayment or maintenance guarantees.
Material contractual obligations of our unconsolidated joint ventures primarily relate to the debt obligations described above. The joint ventures generally do not enter into lease commitments because the entities are managed either by us, or another of the joint venture participants, who supply the necessary facilities and employee services in exchange for market-based management fees. However, they do enter into management contracts with the participants who manage them. Some joint
50
ventures also enter into agreements with developers, which may be us or other joint venture participants, to develop raw land into finished homesites or to build homes.
The joint ventures often enter into option or purchase agreements with buyers, which may include us or other joint venture participants, to deliver homesites or parcels in the future at market prices. Option deposits are recorded by the joint ventures as liabilities until the exercise dates at which time the deposit and remaining exercise proceeds are recorded as revenue. Any forfeited deposit is recognized as revenue at the time of forfeiture. Our unconsolidated joint ventures generally do not enter into off-balance sheet arrangements.
As described above, the liquidity needs of joint ventures in which we have investments vary on an entity-by-entity basis depending on each entity’s purpose and the stage in its life cycle. During formation and development activities, the entities generally require cash, which is provided through a combination of equity contributions and debt financing, to fund acquisition and development of properties. As the properties are completed and sold, cash generated is available to repay debt and for distribution to the joint venture’s members. Thus, the amount of cash available for a joint venture to distribute at any given time is primarily a function of the scope of the joint venture’s activities and the stage in the joint venture’s life cycle.
We track our share of cumulative earnings and cumulative distributions of our joint ventures. For purposes of classifying distributions received from joint ventures in our statements of cash flows, cumulative distributions are treated as returns
on
capital to the extent of cumulative earnings and included in our consolidated statements of cash flows as cash flow from operating activities. Cumulative distributions in excess of our share of cumulative earnings are treated as returns
of
capital and included in our consolidated statements of cash flows as cash flows from investing activities.
Summarized financial information on a combined 100% basis related to Lennar Homebuilding’s unconsolidated entities that are accounted for by the equity method was as follows:
|
Statement of Operations and Selected Information
|
|||||||||
|
Years Ended November 30,
|
|||||||||
|
(Dollars in thousands)
|
2014
|
2013
|
2012
|
||||||
|
Revenues
|
$
|
263,395
|
|
570,910
|
|
353,902
|
|
||
|
Costs and expenses
|
291,993
|
|
425,282
|
|
418,905
|
|
|||
|
Other income
|
—
|
|
14,602
|
|
10,515
|
|
|||
|
Net earnings (loss) of unconsolidated entities
|
$
|
(28,598
|
)
|
160,230
|
|
(54,488
|
)
|
||
|
Our share of net earnings (loss)
|
$
|
(1,323
|
)
|
32,815
|
|
(27,206
|
)
|
||
|
Lennar Homebuilding equity in earnings (loss) from unconsolidated entities (1)
|
$
|
(355
|
)
|
23,803
|
|
(26,672
|
)
|
||
|
Our cumulative share of net earnings - deferred at November 30
|
$
|
6,593
|
|
13,191
|
|
1,621
|
|
||
|
Our investments in unconsolidated entities
|
$
|
656,837
|
|
716,949
|
|
562,234
|
|
||
|
Equity of the unconsolidated entities
|
$
|
2,278,941
|
|
2,513,329
|
|
2,111,173
|
|
||
|
Our investment % in the unconsolidated entities
|
29
|
%
|
29
|
%
|
27
|
%
|
|||
|
(1)
|
For the year ended November 30, 2014, Lennar Homebuilding equity in loss from unconsolidated entities related primarily to our share of operating losses of our Lennar Homebuilding unconsolidated entities, which included
$4.6 million
of valuation adjustments related to assets of Lennar Homebuilding's unconsolidated entities, partially offset by
$4.7 million
of equity in earnings as a result of third-party land sales by one unconsolidated entity. For the year ended
November 30, 2013
, Lennar Homebuilding equity in earnings from unconsolidated entities included
$19.8 million
of equity in earnings primarily as a result of sales of homesites to third parties by one unconsolidated entity. For the year ended
November 30, 2012
, Lennar Homebuilding equity in loss included
$12.1 million
of valuation adjustments primarily related to strategic asset sales at Lennar Homebuilding's unconsolidated entities.
|
51
|
Balance Sheets
|
||||||
|
November 30,
|
||||||
|
(In thousands)
|
2014
|
2013
|
||||
|
Assets:
|
||||||
|
Cash and cash equivalents
|
$
|
243,597
|
|
184,521
|
|
|
|
Inventories
|
2,889,267
|
|
2,904,795
|
|
||
|
Other assets
|
155,470
|
|
147,410
|
|
||
|
$
|
3,288,334
|
|
3,236,726
|
|
||
|
Liabilities and equity:
|
||||||
|
Accounts payable and other liabilities
|
$
|
271,638
|
|
272,940
|
|
|
|
Debt
|
737,755
|
|
450,457
|
|
||
|
Equity
|
2,278,941
|
|
2,513,329
|
|
||
|
$
|
3,288,334
|
|
3,236,726
|
|
||
As of
November 30, 2014
and
2013
, our recorded investments in Lennar Homebuilding unconsolidated entities were
$656.8 million
and
$716.9 million
, respectively, while the underlying equity in Lennar Homebuilding unconsolidated entities partners’ net assets as of
November 30, 2014
and
2013
was
$722.6 million
and
$829.5 million
, respectively. The basis difference is primarily as a result of us buying an interest in a partner's equity in a Lennar Homebuilding unconsolidated entity at a discount to book value and contributing non-monetary assets to an unconsolidated entity with a higher fair value than book value.
In fiscal 2007, we sold a portfolio of land to a strategic land investment venture with Morgan Stanley Real Estate Fund II, L.P., an affiliate of Morgan Stanley & Co., Inc., in which we have a
20%
ownership interest and
50%
voting rights. Due to the nature of our continuing involvement, the transaction did not qualify as a sale under GAAP; thus, the inventory remained on our consolidated balance sheet in consolidated inventory not owned. As of
November 30, 2013
, the portfolio of land (including land development costs) of
$241.8 million
was also reflected as inventory in the summarized condensed financial information related to Lennar Homebuilding’s unconsolidated entities above. In 2014, we entered into a new agreement with the joint venture, which required
$155.0 million
of inventory assets to remain consolidated due to the existence of option contracts on substantially all of the homesites and were reclassified into land and land under development. The remaining
$70.3 million
of inventory assets no longer under option by us were deconsolidated.
The Lennar Homebuilding unconsolidated entities in which we have investments usually finance their activities with a combination of partner equity and debt financing. In some instances, we and our partners have guaranteed debt of certain unconsolidated entities.
Debt to total capital of the Lennar Homebuilding unconsolidated entities in which we have investments was calculated as follows:
|
November 30,
|
||||||
|
(Dollars in thousands)
|
2014
|
2013
|
||||
|
Debt
|
$
|
737,755
|
|
450,457
|
|
|
|
Equity
|
2,278,941
|
|
2,513,329
|
|
||
|
Total capital
|
$
|
3,016,696
|
|
2,963,786
|
|
|
|
Debt to total capital of our unconsolidated entities
|
24.5
|
%
|
15.2
|
%
|
||
Our investments in Lennar Homebuilding unconsolidated entities by type of venture were as follows:
|
November 30,
|
||||||
|
(In thousands)
|
2014
|
2013
|
||||
|
Land development
|
$
|
535,960
|
|
537,548
|
|
|
|
Homebuilding
|
120,877
|
|
179,401
|
|
||
|
Total investments
|
$
|
656,837
|
|
716,949
|
|
|
52
Indebtedness of an unconsolidated entity is secured by its own assets. Some unconsolidated entities own multiple properties and other assets. There is no cross collateralization of debt of different unconsolidated entities. We also do not use our investment in one unconsolidated entity as collateral for the debt in another unconsolidated entity or commingle funds among Lennar Homebuilding unconsolidated entities.
In connection with loans to a Lennar Homebuilding unconsolidated entity, we and our partners often guarantee to a lender, either jointly and severally or on a several basis, any or all of the following: (i) the completion of the development, in whole or in part, (ii) indemnification of the lender from environmental issues, (iii) indemnification of the lender from “bad boy acts” of the unconsolidated entity (or full recourse liability in the event of an unauthorized transfer or bankruptcy) and (iv) that the loan to value and/or loan to cost will not exceed a certain percentage (maintenance or remargining guarantee) or that a percentage of the outstanding loan will be repaid (repayment guarantee).
In connection with loans to an unconsolidated entity where there is a joint and several guarantee, we sometimes have a reimbursement agreement with our partner. The reimbursement agreement provides that neither party is responsible for more than its proportionate share of the guarantee. However, if our joint venture partner does not have adequate financial resources to meet its obligations under the reimbursement agreement, we may be liable for more than our proportionate share, up to our maximum exposure, which is the full amount covered by the joint and several guarantee.
The total debt of Lennar Homebuilding unconsolidated entities in which we have investments, including Lennar's maximum recourse exposure, were as follows:
|
November 30,
|
||||||
|
(In thousands)
|
2014
|
2013
|
||||
|
Lennar’s net recourse exposure
|
$
|
24,481
|
|
27,496
|
|
|
|
Reimbursement agreements from partners
|
—
|
|
13,500
|
|
||
|
Lennar’s maximum recourse exposure
|
$
|
24,481
|
|
40,996
|
|
|
|
Non-recourse bank debt and other debt (partner’s share of several recourse)
|
$
|
56,573
|
|
61,008
|
|
|
|
Non-recourse land seller debt or other debt
|
4,022
|
|
20,454
|
|
||
|
Non-recourse debt with completion guarantees
|
442,854
|
|
245,821
|
|
||
|
Non-recourse debt without completion guarantees
|
209,825
|
|
82,178
|
|
||
|
Non-recourse debt to Lennar
|
713,274
|
|
409,461
|
|
||
|
Total debt
|
$
|
737,755
|
|
450,457
|
|
|
|
Lennar’s maximum recourse exposure as a % of total JV debt
|
3
|
%
|
9
|
%
|
||
During the year ended
November 30, 2014
, our maximum recourse exposure related to indebtedness of Lennar Homebuilding unconsolidated entities decreased by
$16.5 million
, as a result of
$1.5 million
paid by us primarily through capital contributions to unconsolidated entities and
$15.0 million
primarily related to the joint ventures selling assets.
The recourse debt exposure in the previous table represents our maximum exposure to loss from guarantees and does not take into account the underlying value of the collateral or the other assets of the borrowers that are available to repay debt or to reimburse us for any payments on our guarantees. The Lennar Homebuilding unconsolidated entities that have recourse debt have a significant amount of assets and equity. The summarized balance sheets of the Lennar Homebuilding unconsolidated entities with recourse debt were as follows:
|
November 30,
|
||||||
|
(In thousands)
|
2014
|
2013
|
||||
|
Assets
|
$
|
1,669,285
|
|
1,656,065
|
|
|
|
Liabilities
|
$
|
557,261
|
|
470,975
|
|
|
|
Equity
|
$
|
1,112,024
|
|
1,185,090
|
|
|
In addition, in most instances in which we have guaranteed debt of a Lennar Homebuilding unconsolidated entity, our partners have also guaranteed that debt and are required to contribute their share of the guarantee payment. Historically, we have had repayment guarantees and maintenance guarantees. In a repayment guarantee, we and our venture partners guarantee repayment of a portion or all of the debt in the event of a default before the lender would have to exercise its rights against the collateral. In the event of default, if our venture partner does not have adequate financial resources to meet its obligation under our reimbursement agreement, we may be liable for more than our proportionate share, up to our maximum recourse exposure, which is the full amount covered by the joint and several guarantee. As of both
November 30, 2014
and
2013
, we did not have
any maintenance guarantees related to our Lennar Homebuilding unconsolidated entities. The maintenance guarantees only apply if the value of the collateral (generally land and improvements) is less than a specified percentage of the loan balance.
53
In connection with many of the loans to Lennar Homebuilding unconsolidated entities, we and our joint venture partners (or entities related to them) have been required to give guarantees of completion to the lenders. Those completion guarantees may require that the guarantors complete the construction of the improvements for which the financing was obtained. If the construction is to be done in phases, the guarantee generally is limited to completing only the phases as to which construction has already commenced and for which loan proceeds were used.
If we are required to make a payment under any guarantee, the payment would generally constitute a capital contribution or loan to the Lennar Homebuilding unconsolidated entity and increase our share of any funds the unconsolidated entity distributes.
As of
November 30, 2014
, the fair values of the repayment guarantees and completion guarantees were not material. We believe that as of
November 30, 2014
, in the event we become legally obligated to perform under a guarantee of an obligation of a Lennar Homebuilding unconsolidated entity due to a triggering event under a guarantee, most of the time the collateral should be sufficient to repay at least a significant portion of the obligation or we and our partners would contribute additional capital into the venture. In certain instances, we placed performance letters of credit and surety bonds with municipalities for our joint ventures (see Note 6 of the notes to our consolidated financial statements).
In view of recent credit market conditions, it is not uncommon for lenders to real estate developers, including joint ventures in which we have interests, to assert non-monetary defaults (such as failure to meet construction completion deadlines or declines in the market value of collateral below required amounts) or technical monetary defaults against the real estate developers. In most instances, those asserted defaults are resolved by modifications of the loan terms, additional equity investments or other concessions by the borrowers. In addition, in some instances, real estate developers, including joint ventures in which we have interests, are forced to request temporary waivers of covenants in loan documents or modifications of loan terms, which are often, but not always obtained. However, in some instances developers, including joint ventures in which we have interests, are not able to meet their monetary obligations to lenders, and are thus declared in default. Because we sometimes guarantee all or portions of the obligations to lenders of joint ventures in which we have interests, when these joint ventures default on their obligations, lenders may or may not have claims against us. Normally, we do not make payments with regard to guarantees of joint venture obligations while the joint ventures are contesting assertions regarding sums due to their lenders. When it is determined that a joint venture is obligated to make a payment that we have guaranteed and the joint venture will not be able to make that payment, we accrue the amounts probable to be paid by us as a liability. Although we generally fulfill our guarantee obligations within a reasonable time after we determine that we are obligated with regard to them, at any point in time it is likely that we will have some balance of unpaid guarantee liability. At both
November 30, 2014
and
2013
, we had no liabilities accrued for unpaid guarantees of joint venture indebtedness on our consolidated balance sheets.
The following table summarizes the principal maturities of our Lennar Homebuilding unconsolidated entities (“JVs”) debt as per current debt arrangements as of
November 30, 2014
and does not necessarily reflect estimates of future cash payments that will be made to reduce debt balances. Many JV loans have extension options in the loan agreements that would allow the loans to be extended into future years.
|
Principal Maturities of Unconsolidated JVs by Period
|
|||||||||||||||||||
|
(In thousands)
|
Total JV
Debt
|
2015
|
2016
|
2017
|
Thereafter
|
Other
Debt (1)
|
|||||||||||||
|
Maximum recourse debt exposure to Lennar
|
$
|
24,481
|
|
1,320
|
|
1,629
|
|
10,276
|
|
11,256
|
|
—
|
|
||||||
|
Debt without recourse to Lennar
|
713,274
|
|
11,853
|
|
112,585
|
|
41,655
|
|
542,890
|
|
4,291
|
|
|||||||
|
Total
|
$
|
737,755
|
|
13,173
|
|
114,214
|
|
51,931
|
|
554,146
|
|
4,291
|
|
||||||
|
(1)
|
Represents land seller debt and other debt
|
54
The table below indicates the assets, debt and equity of our 10 largest Lennar Homebuilding unconsolidated joint venture investments as of
November 30, 2014
:
|
(Dollars in thousands)
|
Lennar’s
Investment
|
Total JV
Assets
|
Maximum
Recourse
Debt
Exposure
to Lennar
|
Total
Debt
Without
Recourse
to Lennar
|
Total JV
Debt
|
Total JV
Equity
|
JV Debt
to Total
Capital
Ratio
|
||||||||||||||
|
Top Ten JVs (1):
|
|||||||||||||||||||||
|
Heritage Fields El Toro
|
$
|
182,252
|
|
1,503,865
|
|
11,256
|
|
386,608
|
|
397,864
|
|
1,004,910
|
|
28
|
%
|
||||||
|
Central Park West Holdings
|
60,683
|
|
57,649
|
|
—
|
|
—
|
|
—
|
|
52,969
|
|
—
|
|
|||||||
|
Newhall Land Development
|
60,657
|
|
467,417
|
|
—
|
|
340
|
|
340
|
|
353,187
|
|
—
|
|
|||||||
|
Runkle Canyon
|
56,152
|
|
113,653
|
|
—
|
|
—
|
|
—
|
|
112,304
|
|
—
|
|
|||||||
|
Shipyard Communities (Hunters Point)
|
48,618
|
|
399,528
|
|
—
|
|
221,071
|
|
221,071
|
|
150,242
|
|
60
|
%
|
|||||||
|
Ballpark Village
|
42,381
|
|
140,983
|
|
—
|
|
47,000
|
|
47,000
|
|
92,972
|
|
34
|
%
|
|||||||
|
Treasure Island Community Development
|
28,690
|
|
63,174
|
|
—
|
|
—
|
|
—
|
|
57,411
|
|
—
|
|
|||||||
|
MS Rialto Residential Holdings
|
23,208
|
|
88,157
|
|
—
|
|
—
|
|
—
|
|
82,581
|
|
—
|
|
|||||||
|
Krome Grove Land Trust
|
21,326
|
|
90,622
|
|
9,276
|
|
19,761
|
|
29,037
|
|
58,759
|
|
33
|
%
|
|||||||
|
Willow Springs Properties
|
18,960
|
|
34,098
|
|
—
|
|
—
|
|
—
|
|
32,187
|
|
—
|
|
|||||||
|
10 largest JV investments
|
542,927
|
|
2,959,146
|
|
20,532
|
|
674,780
|
|
695,312
|
|
1,997,522
|
|
26
|
%
|
|||||||
|
Other JVs
|
113,910
|
|
329,188
|
|
3,949
|
|
34,203
|
|
38,152
|
|
281,419
|
|
12
|
%
|
|||||||
|
Total
|
$
|
656,837
|
|
3,288,334
|
|
24,481
|
|
708,983
|
|
733,464
|
|
2,278,941
|
|
24
|
%
|
||||||
|
Land seller debt and other debt
|
—
|
|
4,291
|
|
4,291
|
|
|||||||||||||||
|
Total JV debt
|
24,481
|
|
713,274
|
|
737,755
|
|
|||||||||||||||
|
(1)
|
All of the joint ventures presented in the table above operate in our Homebuilding West segment except for Krome Groves Land Trust, which operates in our Homebuilding Southeast Florida segment and Willow Springs Properties, which operates in our Homebuilding Central segment.
|
The table below indicates the percentage of assets, debt and equity of our 10 largest Lennar Homebuilding unconsolidated joint venture investments as of
November 30, 2014
:
|
% of
Total JV
Assets
|
% of Maximum
Recourse Debt
Exposure to
to Lennar
|
% of Total
Debt Without
Recourse to
Lennar
|
% of
Total JV
Equity
|
||||||||
|
10 largest JVs
|
90
|
%
|
84
|
%
|
95
|
%
|
88
|
%
|
|||
|
Other JVs
|
10
|
%
|
16
|
%
|
5
|
%
|
12
|
%
|
|||
|
Total
|
100
|
%
|
100
|
%
|
100
|
%
|
100
|
%
|
|||
Rialto - Investments in Unconsolidated Entities
The following table reflects Rialto's investments in funds that invest in and manage real estate related assets and other investments:
|
November 30,
2014 |
November 30,
2014 |
November 30,
2013 |
||||||||||||||||||||||
|
(Dollars in thousands)
|
Inception Year
|
Equity Commitments
|
Equity Commitments Called
|
Commitment to fund by the Company
|
Funds contributed by the Company
|
Investment
|
||||||||||||||||||
|
Rialto Real Estate Fund, LP
|
2010
|
$
|
700,006
|
|
$
|
700,006
|
|
$
|
75,000
|
|
$
|
75,000
|
|
$
|
71,831
|
|
75,729
|
|
||||||
|
Rialto Real Estate Fund II, LP
|
2012
|
1,305,000
|
|
760,058
|
|
100,000
|
|
58,242
|
|
67,652
|
|
53,103
|
|
|||||||||||
|
Rialto Mezzanine Partners Fund
|
2013
|
251,100
|
|
188,600
|
|
27,299
|
|
20,504
|
|
20,226
|
|
16,724
|
|
|||||||||||
|
Other investments
|
15,991
|
|
9,017
|
|
||||||||||||||||||||
|
$
|
175,700
|
|
154,573
|
|
||||||||||||||||||||
55
Rialto's share of earnings from unconsolidated entities was as follows:
|
Years Ended November 30,
|
|||||||||
|
(In thousands)
|
2014
|
2013
|
2012
|
||||||
|
Rialto Real Estate Fund, LP
|
$
|
30,612
|
|
19,391
|
|
21,026
|
|
||
|
Rialto Real Estate Fund II, LP
|
15,929
|
|
2,523
|
|
—
|
|
|||
|
Rialto Mezzanine Partners Fund
|
1,913
|
|
354
|
|
—
|
|
|||
|
Other investments
|
10,823
|
|
85
|
|
20,457
|
|
|||
|
Rialto equity in earnings from unconsolidated entities
|
$
|
59,277
|
|
22,353
|
|
41,483
|
|
||
As manager of Fund I, we are entitled to receive additional revenue through a carried interest if Fund I meets certain performance thresholds. If Fund I had ceased operations and liquidated all its investments at their estimated fair values on
November 30, 2014
, we would have received
$110.0 million
with regard to our carried interest. However, Fund I did not cease operations and liquidate its investments on
November 30, 2014
, and therefore the ultimate sum we will receive with regard to our carried interest in Fund I may be substantially higher or lower than
$110.0 million
. During the year ended November 30, 2014, Rialto received a $34.7 million advanced tax distribution with regard to its carried interest in order to cover the income tax obligation, which resulted from allocations of taxable income to Rialto's general partner interest.
In addition to the acquisition and management of the FDIC and Bank portfolios, an affiliate in the Rialto segment was a sub-advisor to the AllianceBernstein L.P. (“AB”) fund formed under the Federal government’s Public-Private Investment Program (“PPIP”) to purchase real estate related securities from banks and other financial institutions. The sub-advisor received management fees for sub-advisory services. At the end of 2012, the AB PPIP fund finalized the last sales of the underlying securities in the fund and made substantially all of the final liquidating distributions to the partners, including us. As our role as sub-advisor to the AB PPIP fund has been completed, no further management fees will be received for these services. During the year ended November 30, 2012, we contributed
$1.9 million
and received distributions of
$87.6 million
. Of the distributions received during the year ended November 30, 2012,
$83.5 million
related to the unwinding of the AB PPIP fund's operations. During the year ended November 30, 2013, we also earned
$9.1 million
in fees from the segment's role as a sub-advisor to the AB PPIP fund, which were included in Rialto revenues.
Summarized condensed financial information on a combined 100% basis related to Rialto’s investments in unconsolidated entities that are accounted for by the equity method was as follows:
|
November 30,
|
||||||
|
(In thousands)
|
2014
|
2013
|
||||
|
Assets:
|
||||||
|
Cash and cash equivalents
|
$
|
141,609
|
|
332,968
|
|
|
|
Loans receivable
|
512,034
|
|
523,249
|
|
||
|
Real estate owned
|
378,702
|
|
285,565
|
|
||
|
Investment securities
|
795,306
|
|
381,555
|
|
||
|
Investments in partnerships
|
311,037
|
|
149,350
|
|
||
|
Other assets
|
45,451
|
|
191,624
|
|
||
|
$
|
2,184,139
|
|
1,864,311
|
|
||
|
Liabilities and equity:
|
||||||
|
Accounts payable and other liabilities
|
$
|
20,573
|
|
108,514
|
|
|
|
Notes payable
|
395,654
|
|
398,445
|
|
||
|
Partner loans
|
—
|
|
163,940
|
|
||
|
Equity
|
1,767,912
|
|
1,193,412
|
|
||
|
$
|
2,184,139
|
|
1,864,311
|
|
||
56
|
Years Ended November 30,
|
|||||||||
|
(In thousands)
|
2014
|
2013
|
2012
|
||||||
|
Revenues
|
$
|
150,452
|
|
251,533
|
|
414,027
|
|
||
|
Costs and expenses
|
95,629
|
|
252,563
|
|
243,483
|
|
|||
|
Other income, net (1)
|
479,929
|
|
187,446
|
|
713,710
|
|
|||
|
Net earnings of unconsolidated entities
|
$
|
534,752
|
|
186,416
|
|
884,254
|
|
||
|
Rialto equity in earnings from unconsolidated entities
|
$
|
59,277
|
|
22,353
|
|
41,483
|
|
||
|
(1)
|
Other income, net for the year ended November 30, 2014 included Fund I, Fund II, Mezzanine Fund and other investments realized and unrealized gains on investments as well as other income from REO. Other income, net for the year ended November 30, 2013 included Fund I, Fund II and other investments realized and unrealized gains on investments as well as other income from REO. Other income, net for the year ended November 30, 2012 included the AB PPIP Fund’s mark-to-market unrealized gains and losses, and realized gains from the sale of investments in the portfolio underlying the AB PPIP fund, all of which the Company's portion was a small percentage.
|
In 2010, the Rialto segment invested in non-investment grade CMBS at a
55%
discount to par value. The carrying value of the investment securities at
November 30, 2014
and
2013
was
$17.3 million
and
$16.1 million
, respectively. These securities bear interest at a coupon rate of
4%
and have a stated and assumed final distribution date of November 2020 and a stated maturity date of October 2057. The Rialto segment classified these securities as held-to-maturity based on its intent and ability to hold the securities until maturity.
In January 2014, the Rialto segment acquired 100% of the loan servicing business segment of a financial services company (the “Servicer Provider”) in which a subsidiary of Rialto had an approximately
5%
investment, in exchange for its investment interest. The Servicer Provider has a business segment that provides service and infrastructure to the residential home loan market, which provides loan servicing support for all of Rialto's owned and managed portfolios and asset management services for Rialto's small balance loan program. At acquisition date, the fair value of the assets acquired was
$20.8 million
, the goodwill recorded was
$5.1 million
and the fair value of the liabilities assumed was
$17.6 million
. As of
November 30, 2013
, the carrying value of the investment in the Servicer Provider was
$8.3 million
.
Lennar Multifamily - Investments in Unconsolidated Entities
At
November 30, 2014
and
2013
, we had equity investments in
26
and
13
unconsolidated entities, respectively, (all of which had non-recourse debt). We invest in unconsolidated entities that acquire and develop land to construct multifamily rental properties. Through these entities, we are focusing on developing a geographically diversified portfolio of institutional quality multifamily rental properties in select U.S. markets. Participants in these joint ventures have been financial partners. Joint ventures with financial partners have allowed us to combine our development and construction expertise with access to our partners’ capital. Each joint venture is governed by an operating agreement that provides significant substantive participating voting rights on major decisions to our partners.
The joint ventures are typically structured through non-corporate entities in which control is shared with our venture partners. Each joint venture is unique in terms of its funding requirements and liquidity needs. We and the other joint venture participants typically make pro-rata cash contributions to the joint venture except for cost overruns relating to the construction of the project. In all cases, we have been required to provide guarantees of completion and cost over-runs to the lenders and partners. These completion guarantees may require us to complete the improvements for which the financing was obtained. Therefore, our risk is limited to our equity contribution, draws on letters of credit and potential future payments under the guarantees of completion and cost over-runs. In certain instances, payments made under the cost over-run guarantee is considered a capital contribution.
Additionally, the joint ventures obtain third-party debt to fund a portion of the acquisition, development and construction costs of the rental projects. The joint venture agreements usually permit, but do not require, the joint ventures to make additional capital calls in the future. However, the joint venture debt does not have payment or maintenance guarantees. Neither we nor the other equity partners are a party to the debt instruments. In some cases, we agree to provide credit support in the form of a letter of credit provided to the bank.
We regularly monitor the results of our unconsolidated joint ventures and any trends that may affect their future liquidity or results of operations. We also monitor the performance of joint ventures in which we have investments on a regular basis to assess compliance with debt covenants. For those joint ventures not in compliance with the debt covenants, we evaluate and assess possible impairment of our investment. All of the joint ventures were in compliance with their debt covenants at
November 30, 2014
.
Under the terms of our joint venture agreements, we generally have the right to share in earnings and distributions of the entities on a pro-rata basis based on our ownership percentages. Most joint venture agreements provide for a different
57
allocation of profit and cash distributions if and when the cumulative results of the joint venture exceed specified targets (such as a specified internal rate of return).
In many instances, we are designated as the development manager and/or the general contractor of the unconsolidated entity and receive fees for such services. In addition, we do not plan to enter into option and purchase contracts to acquire properties from our joint ventures.
Our arrangements with joint ventures generally do not restrict our activities or those of the other participants. However, in certain instances, we agree not to engage in some types of activities that may be viewed as competitive with the activities of these ventures in the localities where the joint ventures do business.
Material contractual obligations of our unconsolidated joint ventures primarily relate to the debt obligations described above. The joint ventures generally do not enter into lease commitments because the entities are managed either by us or the other partners, who supply the necessary facilities and employee services in exchange for market-based management fees. However, they do enter into management contracts with the participants who manage them.
As described above, the liquidity needs of joint ventures in which we have investments vary on an entity-by-entity basis depending on each entity’s purpose and the stage in its life cycle. During formation and development activities, the entities generally require cash, which is provided through a combination of equity contributions and debt financing, to fund acquisition, development and construction of multifamily rental properties. As the properties are completed and sold, cash generated will be available to repay debt and for distribution to the joint venture’s members. Thus, the amount of cash available for a joint venture to distribute at any given time is primarily a function of the scope of the joint venture’s activities and the stage in the joint venture’s life cycle.
We track our share of cumulative earnings and cumulative distributions of our joint ventures. For purposes of classifying distributions received from joint ventures in our statements of cash flows, cumulative distributions are treated as returns
on
capital to the extent of cumulative earnings and included in our consolidated statements of cash flows as cash flows from operating activities. Cumulative distributions in excess of our share of cumulative earnings are treated as returns
of
capital and included in our consolidated statements of cash flows as cash flows from investing activities.
Summarized financial information on a combined 100% basis related to Lennar Multifamily’s unconsolidated entities that are accounted for by the equity method was as follows:
Balance Sheet
|
|
November 30,
|
|||||
|
(In thousands)
|
2014
|
2013
|
||||
|
Assets:
|
||||||
|
Cash and cash equivalents
|
$
|
25,319
|
|
5,800
|
|
|
|
Operating properties and equipment
|
637,259
|
|
236,528
|
|
||
|
Other assets
|
14,742
|
|
3,460
|
|
||
|
$
|
677,320
|
|
245,788
|
|
||
|
Liabilities and equity:
|
||||||
|
Accounts payable and other liabilities
|
$
|
87,151
|
|
11,147
|
|
|
|
Notes payable
|
163,376
|
|
51,604
|
|
||
|
Equity
|
426,793
|
|
183,037
|
|
||
|
$
|
677,320
|
|
245,788
|
|
||
58
Statements of Operations and Selected Information
|
Years Ended November 30,
|
|||||||||
|
(In thousands)
|
2014
|
2013
|
2012
|
||||||
|
Revenues
|
$
|
4,855
|
|
—
|
|
—
|
|
||
|
Costs and expenses
|
7,435
|
|
1,493
|
|
29
|
|
|||
|
Other income, net (1)
|
35,068
|
|
—
|
|
—
|
|
|||
|
Net earnings (loss) of unconsolidated entities
|
$
|
32,488
|
|
(1,493
|
)
|
(29
|
)
|
||
|
Lennar Multifamily equity in earnings (loss) from unconsolidated entities (2)
|
$
|
14,454
|
|
(271
|
)
|
(4
|
)
|
||
|
Our investments in unconsolidated entities
|
$
|
105,674
|
|
46,301
|
|
3,126
|
|
||
|
Equity of the unconsolidated entities
|
$
|
426,793
|
|
183,037
|
|
18,872
|
|
||
|
Our investment % in the unconsolidated entities
|
25
|
%
|
25
|
%
|
17
|
%
|
|||
|
(1)
|
Other income, net, included the gains related to the sale of two operating properties during the year ended
November 30, 2014
.
|
|
(2)
|
For the year ended
November 30, 2014
, Lennar Multifamily equity in earnings from unconsolidated entities included Lennar Multifamily's share of gains totaling
$14.7 million
related to the sale of two operating properties by unconsolidated entities. Our share of profits and cash distributions from the sales of the two operating properties was higher compared to our ownership interests in the two unconsolidated entities due to the achievement of specified internal rate of return milestones.
|
Option Contracts
We have access to land through option contracts, which generally enables us to control portions of properties owned by third parties (including land funds) and unconsolidated entities until we have determined whether to exercise the option.
A majority of our option contracts require a non-refundable cash deposit or irrevocable letter of credit based on a percentage of the purchase price of the land. Until recently, these option deposits generally have approximated 10% of the exercise price.
Sometimes, we are required to undertake property development during the option period, which increases the amounts we lose if we do no exercise particular options.
Our option contracts sometimes include price adjustment provisions, which adjust the purchase price of the land to its approximate fair value at the time of acquisition or are based on fair value at the time of takedown. The exercise periods of our option contracts generally range from one to ten years.
Our investments in option contracts are recorded at cost unless those investments are determined to be impaired, in which case our investments are written down to fair value. We review option contracts for indicators of impairment during each reporting period. The most significant indicator of impairment is a decline in the fair value of the optioned property such that the purchase and development of the optioned property would no longer meet our targeted return on investment. Such declines could be caused by a variety of factors including increased competition, decreases in demand or changes in local regulations that adversely impact the cost of development. Changes in any of these factors would cause us to re-evaluate the likelihood of exercising our land options.
Some option contracts contain a predetermined take-down schedule for the optioned land parcels. However, in almost all instances, we are not required to purchase land in accordance with those take-down schedules. In substantially all instances, we have the right and ability to not exercise our option and forfeit our deposit without further penalty, other than termination of the option and loss of any unapplied portion of our deposit and pre-acquisition costs. Therefore, in substantially all instances, we do not consider the take-down price to be a firm contractual obligation.
When we intend not to exercise an option, we write-off any deposit and pre-acquisition costs associated with the option contract. For the years ended
November 30, 2014
,
2013
and
2012
, we wrote-off
$4.6 million
,
$1.9 million
and
$2.4 million
, respectively, of option deposits and pre-acquisition costs related to homesites under option that we do not intend to purchase.
59
The table below indicates the number of homesites owned and homesites to which we had access through option contracts with third parties (“optioned”) or unconsolidated JVs (i.e., controlled homesites) at
November 30, 2014
and
2013
:
|
Controlled Homesites
|
||||||||||||||
|
November 30, 2014
|
Optioned
|
JVs
|
Total
|
Owned
Homesites
|
Total
Homesites
|
|||||||||
|
East
|
9,649
|
|
93
|
|
9,742
|
|
45,489
|
|
55,231
|
|
||||
|
Central
|
5,582
|
|
1,135
|
|
6,717
|
|
20,704
|
|
27,421
|
|
||||
|
West
|
2,867
|
|
5,358
|
|
8,225
|
|
38,222
|
|
46,447
|
|
||||
|
Southeast Florida
|
2,860
|
|
446
|
|
3,306
|
|
9,507
|
|
12,813
|
|
||||
|
Houston
|
1,746
|
|
3
|
|
1,749
|
|
11,788
|
|
13,537
|
|
||||
|
Other
|
2,151
|
|
—
|
|
2,151
|
|
6,969
|
|
9,120
|
|
||||
|
Total homesites
|
24,855
|
|
7,035
|
|
31,890
|
|
132,679
|
|
164,569
|
|
||||
|
Controlled Homesites
|
||||||||||||||
|
November 30, 2013
|
Optioned
|
JVs
|
Total
|
Owned
Homesites
|
Total
Homesites
|
|||||||||
|
East
|
6,364
|
|
172
|
|
6,536
|
|
41,660
|
|
48,196
|
|
||||
|
Central
|
6,837
|
|
1,135
|
|
7,972
|
|
20,297
|
|
28,269
|
|
||||
|
West
|
2,794
|
|
5,471
|
|
8,265
|
|
35,609
|
|
43,874
|
|
||||
|
Southeast Florida
|
1,270
|
|
326
|
|
1,596
|
|
8,757
|
|
10,353
|
|
||||
|
Houston
|
2,035
|
|
63
|
|
2,098
|
|
12,075
|
|
14,173
|
|
||||
|
Other
|
1,666
|
|
—
|
|
1,666
|
|
7,245
|
|
8,911
|
|
||||
|
Total homesites
|
20,966
|
|
7,167
|
|
28,133
|
|
125,643
|
|
153,776
|
|
||||
We evaluate all option contracts for land to determine whether they are VIEs and, if so, whether we are the primary beneficiary of certain of these option contracts. Although we do not have legal title to the optioned land, if we are deemed to be the primary beneficiary or make a significant deposit for optioned land, we may need to consolidate the land under option at the purchase price of the optioned land. Due to the new agreement with Morgan Stanley & Co., Inc.,
$155.0 million
of consolidated inventory not owned was reclassified to land and land under development and
$70.3 million
of consolidated inventory not owned was deconsolidated during the year ended
November 30, 2014
.
In addition to this transaction, during the year ended
November 30, 2014
, consolidated inventory not owned decreased by
$182.4 million
with a corresponding decrease to liabilities related to consolidated inventory not owned in the accompanying consolidated balance sheet as of
November 30, 2014
. The decrease was primarily due to the purchase of land that was the subject of a previously consolidated option contract. To reflect the purchase price of the inventory consolidated, we had a net reclass related to option deposits from consolidated inventory not owned to land under development in the accompanying consolidated balance sheet as of
November 30, 2014
. The liabilities related to consolidated inventory not owned primarily represent the difference between the option exercise prices for the optioned land and our cash deposits.
Our exposure to loss related to our option contracts with third parties and unconsolidated entities consisted of our non-refundable option deposits and pre-acquisition costs totaling
$85.6 million
and
$129.2 million
at
November 30, 2014
and
2013
, respectively. Additionally, we had posted
$34.5 million
and
$29.9 million
of letters of credit in lieu of cash deposits under certain option contracts as of
November 30, 2014
and
2013
, respectively.
60
Contractual Obligations and Commercial Commitments
The following table summarizes certain of our contractual obligations at
November 30, 2014
:
|
Payments Due by Period
|
|||||||||||||||
|
(In thousands)
|
Total
|
Less than
1 year
|
1 to 3
years
|
3 to 5
years
|
More than
5 years
|
||||||||||
|
Lennar Homebuilding - Senior notes and other debts payable (1)
|
$
|
4,690,213
|
|
659,378
|
|
829,906
|
|
1,776,470
|
|
1,424,459
|
|
||||
|
Lennar Financial Services - Notes and other debts payable
|
704,143
|
|
698,446
|
|
5,697
|
|
—
|
|
—
|
|
|||||
|
Rialto - Notes and other debts payable (2)
|
623,246
|
|
144,665
|
|
125,467
|
|
353,114
|
|
—
|
|
|||||
|
Interest commitments under interest bearing debt (3)
|
1,016,560
|
|
259,522
|
|
412,249
|
|
217,886
|
|
126,903
|
|
|||||
|
Operating leases
|
137,114
|
|
34,358
|
|
52,219
|
|
33,879
|
|
16,658
|
|
|||||
|
Other contractual obligations (4)
|
162,553
|
|
162,553
|
|
—
|
|
—
|
|
—
|
|
|||||
|
Total contractual obligations (5)
|
$
|
7,333,829
|
|
1,958,922
|
|
1,425,538
|
|
2,381,349
|
|
1,568,020
|
|
||||
|
(1)
|
Some of the senior notes and other debts payable are convertible senior notes, which have been included in this table based on maturity dates, but they are putable to, or callable by, us at earlier dates than the maturity dates disclosed in this table. The puts are described in the detail description of each of the convertible senior notes in the financial condition and capital resources section of this M,D&A.
|
|
(2)
|
Amount includes notes payable and other debts payable of
$351.9 million
related to Rialto's
7.00%
Senior Notes,
$60.6 million
related to Rialto's
5
-year senior unsecured note,
$141.3 million
related to the RMF warehouse repurchase financing agreements and
$58.0 million
related to Rialto's Structured Notes with an estimated final payment date of December 15, 2015.
|
|
(3)
|
Interest commitments on variable interest-bearing debt are determined based on the interest rate as of
November 30, 2014
.
|
|
(4)
|
Amount includes $41.8 million of commitments to fund Rialto's Fund II, $6.8 million of commitments to fund Rialto's Mezzanine Fund, $44.0 million of commitments to fund loans to RMF and
$70.0 million
of remaining commitments to fund a homebuilding unconsolidated entity that was formed in 2013 for further expenses up until the unconsolidated entity obtains permanent financing.
|
|
(5)
|
Total contractual obligations excludes our gross unrecognized tax benefits and accrued interest and penalties totaling
$38.7 million
as of
November 30, 2014
, because we are unable to make reasonable estimates as to the period of cash settlement with the respective taxing authorities.
|
We are subject to the usual obligations associated with entering into contracts (including option contracts) for the purchase, development and sale of real estate in the routine conduct of our business. Option contracts for the purchase of land generally enable us to defer acquiring portions of properties owned by third parties and unconsolidated entities until we have determined whether to exercise our options. This reduces our financial risk associated with land holdings. At
November 30, 2014
, we had access to
31,890
homesites through option contracts with third parties and unconsolidated entities in which we have investments. At
November 30, 2014
, we had
$85.6 million
of non-refundable option deposits and pre-acquisition costs related to certain of these homesites and had posted
$34.5 million
of letters of credit in lieu of cash deposits under certain option contracts.
At
November 30, 2014
, we had letters of credit outstanding in the amount of
$424.6 million
(which included the
$34.5 million
of letters of credit discussed above). These letters of credit are generally posted either with regulatory bodies to guarantee our performance of certain development and construction activities, or in lieu of cash deposits on option contracts, for insurance risks, credit enhancements and as other collateral. Additionally, at
November 30, 2014
, we had outstanding performance and surety bonds related to site improvements at various projects (including certain projects of our joint ventures) of
$923.3 million
. Although significant development and construction activities have been completed related to these site improvements, these bonds are generally not released until all of the development and construction activities are completed. As of
November 30, 2014
, there were approximately
$363.7 million
, or
39%
, of costs to complete related to these site improvements. We do not presently anticipate any draws upon these bonds, but if any such draws occur, we do not believe they would have a material effect on our financial position, results of operations or cash flows.
Our Lennar Financial Services segment had a pipeline of loan applications in process of $1.5 billion at
November 30, 2014
. Loans in process for which interest rates were committed to the borrowers totaled approximately $395.2 million as of
November 30, 2014
. Substantially all of these commitments were for periods of 60 days or less. Since a portion of these commitments is expected to expire without being exercised by the borrowers or borrowers may not meet certain criteria at the time of closing, the total commitments do not necessarily represent future cash requirements.
Our Lennar Financial Services segment uses mandatory mortgage-backed securities (“MBS”) forward commitments, option contracts and investor commitments to hedge our mortgage-related interest rate exposure. These instruments involve, to varying degrees, elements of credit and interest rate risk. Credit risk associated with MBS forward commitments, option contracts and loan sales transactions is managed by limiting our counterparties to investment banks, federally regulated bank affiliates and other investors meeting our credit standards. Our risk, in the event of default by the purchaser, is the difference
61
between the contract price and fair value of the MBS forward commitments and option contracts. At
November 30, 2014
, we had open commitments amounting to
$771.0 million
to sell MBS with varying settlement dates through February 2015.
The following sections discuss market and financing risk, seasonality and interest rates and changing prices that may have an impact on our business:
Market and Financing Risk
We finance our contributions to JVs, land acquisition and development activities, construction activities, financial services activities, Rialto activities, Lennar Multifamily activities and general operating needs primarily with cash generated from operations, debt and equity issuances, as well as borrowings under our Credit Facility and warehouse repurchase facilities. We also purchase land under option agreements, which enables us to control homesites until we have determined whether to exercise the option. We tried to manage the financial risks of adverse market conditions associated with land holdings by what we believed to be prudent underwriting of land purchases in areas we viewed as desirable growth markets, careful management of the land development process and, until recent years, limitation of risks by using partners to share the costs of purchasing and developing land as well as obtaining access to land through option contracts. Although we believed our land underwriting standards were conservative, we did not anticipate the severe decline in land values and the sharply reduced demand for new homes encountered from 2007 to 2010.
Seasonality
We historically have experienced, and expect to continue to experience, variability in quarterly results. Our homebuilding business is seasonal in nature and generally reflects higher levels of new home order activity in our second fiscal quarter and increased deliveries in the second half of our fiscal year. However, periods of economic downturn in the industry, such as we have experienced in previous years, will typically alter seasonal patterns.
Interest Rates and Changing Prices
Inflation can have a long-term impact on us because increasing costs of land, materials and labor result in a need to increase the sales prices of homes. In addition, inflation is often accompanied by higher interest rates, which can have a negative impact on housing demand and the costs of financing land development activities and housing construction. Rising interest rates as well as increased materials and labor costs, may reduce gross margins. An increase in material and labor costs is particularly a problem during a period of declining home prices. Conversely, deflation can impact the value of real estate and make it difficult for us to recover our land costs. Therefore, either inflation or deflation could adversely impact our future results of operations.
New Accounting Pronouncements
See Note 1 of the notes to our consolidated financial statements for a comprehensive list of new accounting pronouncements.
Critical Accounting Policies and Estimates
Our accounting policies are more fully described in Note 1 of the notes to our consolidated financial statements included in Item 8 of this document. As discussed in Note 1, the preparation of financial statements in conformity with accounting principles generally accepted in the United States of America requires management to make estimates and assumptions about future events that affect the amounts reported in our consolidated financial statements and accompanying notes. Future events and their effects cannot be determined with absolute certainty. Therefore, the determination of estimates requires the exercise of judgment. Actual results could differ from those estimates, and such differences may be material to our consolidated financial statements. Listed below are those policies and estimates that we believe are critical and require the use of significant judgment in their application.
Valuation of Deferred Tax Assets
We record income taxes under the asset and liability method, whereby deferred tax assets and liabilities are recognized based on the future tax consequences attributable to temporary differences between the financial statement carrying amounts of existing assets and liabilities and their respective tax bases and attributable to operating loss and tax credit carryforwards. Deferred tax assets and liabilities are measured using enacted tax rates expected to apply in the years in which the temporary differences are expected to be recovered or paid. The effect on deferred tax assets and liabilities of a change in tax rates is recognized in earnings in the period when the changes are enacted. Interest related to unrecognized tax benefits is recognized in the financial statements as a component of income tax expense.
62
A reduction of the carrying amounts of deferred tax assets by a valuation allowance is required if, based on the available evidence, it is more likely than not that such assets will not be realized. Accordingly, the need to establish valuation allowances for deferred tax assets is assessed each reporting period by us based on the consolidation of all available positive and negative evidence using a "more-likely-than-not" standard with respect to whether deferred tax assets will be realized. This assessment considers, among other matters, the nature, frequency and severity of current and cumulative losses, actual earnings, forecasts of future profitability, the duration of statutory carryforward periods, our experience with loss carryforwards not expiring unused and tax planning alternatives.
We believe that the accounting estimate for the valuation of deferred tax assets is a critical accounting estimate because of the judgment required in assessing the likely future tax consequences of events that have been recognized in our financial statements or tax returns. We base our estimate of deferred tax assets and liabilities on current tax laws and rates and, in certain cases, business plans and other expectations about future outcomes. Changes in existing tax laws or rates could affect actual tax results and future business results, which may affect the amount of deferred tax liabilities or the valuation of deferred tax assets over time. Our accounting for deferred tax consequences represents our best estimate of future events.
Goodwill
At
November 30, 2014
and
2013
, our goodwill was
$44.3 million
and
$34.0 million
. Goodwill represents the excess of the purchase price paid over the fair value of the net assets acquired in business combinations. Evaluating goodwill for impairment involves the determination of the fair value of our reporting units in which we have recorded goodwill. A reporting unit is a component of an operating segment for which discrete financial information is available and reviewed by management on a regular basis. Inherent in the determination of fair value of our reporting units are certain estimates and judgments, including the interpretation of current economic indicators and market valuations as well as our strategic plans with regard to our operations. To the extent additional information arises or our strategies change, it is possible that our conclusion regarding goodwill impairment could change, which could have a material effect on our financial position and results of operations. For these reasons, we believe that the accounting estimate related to goodwill impairment is a critical accounting estimate.
We review goodwill annually (or whenever indicators of impairment exist) for impairment. We evaluated the carrying value of our Lennar Financial Services and Rialto segments' goodwill in the fourth quarter of
2014
. We estimated the fair value of our Lennar Financial Services title and and mortgage operations and Rialto operations based on the income approach and concluded that a goodwill impairment was not required for
2014
. During the years ended
November 30, 2014
,
2013
and
2012
, we did not record goodwill impairment charges.
The income approach establishes fair value by methods which discount or capitalize earnings and/or cash flow by a discount or capitalization rate that reflects market rate of return expectations, market conditions and the risk of the relative investment. We used a discounted cash flow method when applying the income approach. This analysis includes operating income, interest expense, taxes and incremental working capital as well as other factors. The projections used in the analysis are for a five-year period and represent what we consider to be normalized earnings.
In determining the fair value of our Lennar Financial Services title and mortgage operations and Rialto operations under the income approach, our expected cash flows are affected by various assumptions. The most significant assumptions affecting our expected cash flows are the discount rate, projected revenue growth rate and operating profit margin. The impact of a change in any of our significant underlying assumptions +/- 1% would not result in a materially different fair value.
As of both
November 30, 2014
and
2013
, there were
no
significant identifiable intangible assets, other than goodwill.
Lennar Homebuilding and Lennar Multifamily Operations
Lennar Homebuilding Revenue Recognition
Revenues from sales of homes are recognized when the sales are closed and title passes to the new homeowner, the new homeowner’s initial and continuing investment is adequate to demonstrate a commitment to pay for the home, the new homeowner’s receivable is not subject to future subordination and we do not have a substantial continuing involvement with the new home. Revenues from sales of land are recognized when a significant down payment is received, the earnings process is complete, title passes and collectability of the receivable is reasonably assured. We believe that the accounting policy related to revenue recognition is a critical accounting policy because of the significance of revenue.
Lennar Multifamily Revenue Recognition
Our Lennar Multifamily segment provides management services with respect to the development, construction and management of rental projects in joint ventures in which we have investments. As a result, our Lennar Multifamily segment earns and receives fees, which are based upon a stated percentage of development and construction costs. These fees are included in Lennar Multifamily revenue and are recorded over the period in which the services are performed, fees are determinable and collectability is reasonably assured. In addition, our Lennar Multifamily segment provides general contractor
63
services for the construction of some of its rental projects and recognizes the revenue over the period in which the services are performed under the percentage of completion method. We believe that the accounting policy related to Lennar Multifamily revenue recognition is a critical accounting policy because it represents a significant portion of our Lennar Multifamily's revenues and is expected to continue to grow in the future as the segment construct more rental properties.
Inventories
Inventories are stated at cost unless the inventory within a community is determined to be impaired, in which case the impaired inventory is written down to fair value. Inventory costs include land, land development and home construction costs, real estate taxes, deposits on land purchase contracts and interest related to development and construction. We review our inventory for indicators of impairment by evaluating each community during each reporting period. The inventory within each community is categorized as finished homes and construction in progress or land under development based on the development state of the community. There were
622
and
535
active communities, excluding unconsolidated entities, as of
November 30, 2014
and
2013
, respectively. If the undiscounted cash flows expected to be generated by a community are less than its carrying amount, an impairment charge is recorded to write down the carrying amount of such community to its estimated fair value.
In conducting our review for indicators of impairment on a community level, we evaluate, among other things, the margins on homes that have been delivered, margins on homes under sales contracts in backlog, projected margins with regard to future home sales over the life of the community, projected margins with regard to future land sales, and the estimated fair value of the land itself. We pay particular attention to communities in which inventory is moving at a slower than anticipated absorption pace and communities whose average sales price and/or margins are trending downward and are anticipated to continue to trend downward. From this review, we identify communities whose carrying values exceed their undiscounted cash flows. For the year ended
November 30, 2014
, revenues and gross margins have increased for all of our homebuilding segments and Homebuilding Other, except for the gross margins of our Lennar Homebuilding West segment, compared to the year ended
November 30, 2013
, primarily due to an increase in home deliveries and an increase in the average sales price of homes delivered .
We estimate the fair value of our communities using a discounted cash flow model. The projected cash flows for each community are significantly impacted by estimates related to market supply and demand, product type by community, homesite sizes, sales pace, sales prices, sales incentives, construction costs, sales and marketing expenses, the local economy, competitive conditions, labor costs, costs of materials and other factors for that particular community. Every division evaluates the historical performance of each of its communities as well as current trends in the market and economy impacting the community and its surrounding areas. These trends are analyzed for each of the estimates listed above. For example, during the downturn in the housing market, we found ways to reduce our construction costs in many communities, and this reduction in construction costs in addition to changes in product type in many communities impacted future estimated cash flows.
Each of the homebuilding markets in which we operate is unique, as homebuilding has historically been a local business driven by local market conditions and demographics. Each of our homebuilding markets has specific supply and demand relationships reflective of local economic conditions. Our projected cash flows are impacted by many assumptions. Some of the most critical assumptions in our cash flow models are our projected absorption pace for home sales, sales prices and costs to build and deliver our homes on a community by community basis.
In order to arrive at the assumed absorption pace for home sales included in our cash flow models, we analyze our historical absorption pace in the community as well as other comparable communities in the geographical area. In addition, we consider internal and external market studies and trends, which generally include, but are not limited to, statistics on population demographics, unemployment rates and availability of competing product in the geographic area where the community is located. When analyzing our historical absorption pace for home sales and corresponding internal and external market studies, we place greater emphasis on more current metrics and trends such as the absorption pace realized in our most recent quarters as well as forecasted population demographics, unemployment rates and availability of competing product. Generally, if we notice a variation from historical results over a span of two fiscal quarters, we consider such variation to be the establishment of a trend and adjust our historical information accordingly in order to develop assumptions on the projected absorption pace in the cash flow model for a community.
In order to determine the assumed sales prices included in our cash flow models, we analyze the historical sales prices realized on homes we delivered in the community and other comparable communities in the geographical area as well as the sales prices included in our current backlog for such communities. In addition, we consider internal and external market studies and trends, which generally include, but are not limited to, statistics on sales prices in neighboring communities and sales prices on similar products in non-neighboring communities in the geographic area where the community is located. When analyzing our historical sales prices and corresponding market studies, we also place greater emphasis on more current metrics and trends such as future forecasted sales prices in neighboring communities as well as future forecasted sales prices for similar product in non-neighboring communities. Generally, if we notice a variation from historical results over a span of two fiscal quarters, we
64
consider such variation to be the establishment of a trend and adjust our historical information accordingly in order to develop assumptions on the projected sales prices in the cash flow model for a community.
In order to arrive at our assumed costs to build and deliver our homes, we generally assume a cost structure reflecting contracts currently in place with our vendors adjusted for any anticipated cost reduction initiatives or increases in cost structure. Those costs assumed are used in our cash flow models for our communities.
Since the estimates and assumptions included in our cash flow models are based upon historical results and projected trends, they do not anticipate unexpected changes in market conditions or strategies that may lead to us incurring additional impairment charges in the future.
Using all the available information, we calculate our best estimate of projected cash flows for each community. While many of the estimates are calculated based on historical and projected trends, all estimates are subjective and change from market to market and community to community as market and economic conditions change. The determination of fair value also requires discounting the estimated cash flows at a rate we believe a market participant would determine to be commensurate with the inherent risks associated with the assets and related estimated cash flow streams. The discount rate used in determining each asset’s fair value depends on the community’s projected life and development stage. We generally use a discount rate of approximately
20%
, subject to the perceived risks associated with the community’s cash flow streams relative to its inventory.
We estimate the fair value of inventory evaluated for impairment based on market conditions and assumptions made by management at the time the inventory is evaluated, which may differ materially from actual results if market conditions or our assumptions change. For example, market deterioration or changes in our assumptions may lead us to incur additional impairment charges on previously impaired inventory, as well as on inventory not currently impaired, but for which indicators of impairment may arise if market deterioration occurs.
We also have access to land inventory through option contracts, which generally enables us to defer acquiring portions of properties owned by third parties and unconsolidated entities until we have determined whether to exercise our option. A majority of our option contracts require a non-refundable cash deposit or irrevocable letter of credit based on a percentage of the purchase price of the land. Our option contracts are recorded at cost. In determining whether to walk-away from an option contract, we evaluate the option primarily based upon the expected cash flows from the property under option. If we intend to walk-away from an option contract, we record a charge to earnings in the period such decision is made for the deposit amount and any related pre-acquisition costs associated with the option contract.
We believe that the accounting related to inventory valuation and impairment is a critical accounting policy because: (1) assumptions inherent in the valuation of our inventory are highly subjective and susceptible to change and (2) the impact of recognizing impairments on our inventory has been and could continue to be material to our consolidated financial statements. Our evaluation of inventory impairment, as discussed above, includes many assumptions. The critical assumptions include the timing of the home sales within a community, management’s projections of selling prices and costs and the discount rate applied to estimate the fair value of the homesites within a community on the balance sheet date. Our assumptions on the timing of home sales are critical because the homebuilding industry has historically been cyclical and sensitive to changes in economic conditions such as interest rates, credit availability, unemployment levels and consumer sentiment. Changes in these economic conditions could materially affect the projected sales price, costs to develop the homesites and/or absorption rate in a community. Our assumptions on discount rates are critical because the selection of a discount rate affects the estimated fair value of the homesites within a community. A higher discount rate reduces the estimated fair value of the homesites within the community, while a lower discount rate increases the estimated fair value of the homesites within a community. Because of changes in economic and market conditions and assumptions and estimates required of management in valuing inventory during changing market conditions, actual results could differ materially from management’s assumptions and may require material inventory impairment charges to be recorded in the future.
Product Warranty
Although we subcontract virtually all aspects of construction to others and our contracts call for the subcontractors to repair or replace any deficient items related to their trades, we are primarily responsible to homebuyers to correct any deficiencies. Additionally, in some instances, we may be held responsible for the actions of or losses incurred by subcontractors. Warranty and similar reserves for homes are established at an amount estimated to be adequate to cover potential costs for materials and labor with regard to warranty-type claims expected to be incurred subsequent to the delivery of a home. Reserves are determined based upon historical data and trends with respect to similar product types and geographical areas. We believe the accounting estimate related to the reserve for warranty costs is a critical accounting estimate because the estimate requires a large degree of judgment.
At
November 30, 2014
, the reserve for warranty costs was
$115.9 million
, which included
$12.7 million
of adjustments to pre-existing warranties from changes in estimates during the current year primarily related to specific claims
65
related to certain of our homebuilding communities and other adjustments. While we believe that the reserve for warranty costs is adequate, there can be no assurances that historical data and trends will accurately predict our actual warranty costs. Additionally, there can be no assurances that future economic or financial developments might not lead to a significant change in the reserve.
Lennar Homebuilding and Lennar Multifamily Investments in Unconsolidated Entities
We strategically invest in unconsolidated entities that acquire and develop land (1) for our homebuilding operations or for sale to third parties, (2) for construction of homes for sale to third-party homebuyers or (3) for the construction of multifamily rental properties. Our Lennar Homebuilding partners generally are unrelated homebuilders, land owners/developers and financial or other strategic partners. Our Lennar Multifamily partners are all financial partners.
Most of the unconsolidated entities through which we acquire and develop land are accounted for by the equity method of accounting because we are not the primary beneficiary, and we have a significant, but less than controlling, interest in the entities. We record our investments in these entities in our consolidated balance sheets as “Lennar Homebuilding or Lennar Multifamily Investments in Unconsolidated Entities” and our pro-rata share of the entities’ earnings or losses in our consolidated statements of operations as “Lennar Homebuilding or Lennar Multifamily Equity in Earnings (Loss) from Unconsolidated Entities,” as described in Note 4 and Note 9 of the notes to our consolidated financial statements. For most unconsolidated entities, we generally have the right to share in earnings and distributions on a pro-rata basis based upon ownership percentages. However, certain Lennar Homebuilding unconsolidated entities and all of our Lennar Multifamily unconsolidated entities provide for a different allocation of profit and cash distributions if and when cumulative results of the joint venture exceed specified targets (such as a specified internal rate of return). Advances to these entities are included in the investment balance.
Management looks at specific criteria and uses its judgment when determining if we are the primary beneficiary of, or have a controlling interest in, an unconsolidated entity. Factors considered in determining whether we have significant influence or we have control include risk and reward sharing, experience and financial condition of the other partners, voting rights, involvement in day-to-day capital and operating decisions and continuing involvement. The accounting policy relating to the use of the equity method of accounting is a critical accounting policy due to the judgment required in determining whether we are the primary beneficiary or have control or significant influence.
As of
November 30, 2014
, we believe that the equity method of accounting is appropriate for our investments in unconsolidated entities where we are not the primary beneficiary and we do not have a controlling interest, but rather share control with our partners. At
November 30, 2014
, the Lennar Homebuilding unconsolidated entities in which we had investments had total assets of
$3.3 billion
and total liabilities of
$1.0 billion
. At
November 30, 2014
, the Lennar Multifamily unconsolidated entities in which we had investments had total assets of
$677.3 million
and total liabilities of
$250.5 million
.
We evaluate our investments in unconsolidated entities for indicators of impairment during each reporting period. A series of operating losses of an investee or other factors may indicate that a decrease in the fair value of our investment in the unconsolidated entity below its carrying amount has occurred which is other-than-temporary. The amount of impairment recognized is the excess of the investment’s carrying amount over its estimated fair value.
The evaluation of our investment in unconsolidated entities includes certain critical assumptions: (1) projected future distributions from the unconsolidated entities, (2) discount rates applied to the future distributions and (3) various other factors.
Our assumptions on the projected future distributions from the Lennar Homebuilding unconsolidated entities are dependent on market conditions. Specifically, distributions are dependent on cash to be generated from the sale of inventory by the Lennar Homebuilding unconsolidated entities or assets by Lennar Multifamily unconsolidated entities. Such inventory is also reviewed for potential impairment by the unconsolidated entities. The review for inventory impairment performed by the unconsolidated entities is materially consistent with our process, as discussed above, for evaluating our own inventory as of the end of a reporting period. The unconsolidated entities generally also use a discount rate of approximately
20%
in their reviews for impairment, subject to the perceived risks associated with the community’s cash flow streams relative to its inventory. If a valuation adjustment is recorded by an unconsolidated entity related to its assets, our proportionate share is reflected in our Lennar Homebuilding or Lennar Multifamily equity in earnings (loss) from unconsolidated entities with a corresponding decrease to our Lennar Homebuilding or Lennar Multifamily investment in unconsolidated entities. In certain instances, we may be required to record additional losses relating to our investment in unconsolidated entities; if our investment in the unconsolidated entity, or a portion thereof, is deemed to be other than temporarily impaired. These losses are included in Lennar Homebuilding other income (expense), net or Lennar Multifamily costs and expenses. We believe our assumptions on the projected future distributions from the unconsolidated entities are critical because the operating results of the unconsolidated entities from which the projected distributions are derived are dependent on the status of the homebuilding industry, which has historically been cyclical and sensitive to changes in economic conditions such as interest rates, credit availability, unemployment levels and consumer sentiment. Changes in these economic conditions could materially affect the projected operational results of the unconsolidated entities from which the distributions are derived.
66
Additionally, we consider various qualitative factors to determine if a decrease in the value of our investment is other-than-temporary. These factors include age of the venture, intent and ability for us to recover our investment in the entity, financial condition and long-term prospects of the unconsolidated entity, short-term liquidity needs of the unconsolidated entity, trends in the general economic environment of the land, entitlement status of the land held by the unconsolidated entity, overall projected returns on investments, defaults under contracts with third parties (including bank debt), recoverability of the investment through future cash flows and relationships with the other partners and banks. If we believe that the decline in the fair value of the investment is temporary, then no impairment is recorded.
In addition, we believe our assumptions on discount rates are critical accounting policies because the selection of the discount rates affects the estimated fair value of our investments in unconsolidated entities. A higher discount rate reduces the estimated fair value of our investments in unconsolidated entities, while a lower discount rate increases the estimated fair value of our investments in unconsolidated entities. Because of changes in economic conditions, actual results could differ materially from management’s assumptions and may require material valuation adjustments to our investments in unconsolidated entities to be recorded in the future.
Consolidation of Variable Interest Entities
GAAP requires the consolidation of VIEs in which an enterprise has a controlling financial interest. A controlling financial interest will have both of the following characteristics: (a) the power to direct the activities of a VIE that most significantly impact the VIE’s economic performance and (b) the obligation to absorb losses of the VIE that could potentially be significant to the VIE or the right to receive benefits from the VIE that could potentially be significant to the VIE.
Our variable interest in VIEs may be in the form of (1) equity ownership, (2) contracts to purchase assets, (3) management services and development agreements between us and a VIE, (4) loans provided by us to a VIE or other partner and/or (5) guarantees provided by members to banks and other third parties. We examine specific criteria and use our judgment when determining if we are the primary beneficiary of a VIE. Factors considered in determining whether we are the primary beneficiary include risk and reward sharing, experience and financial condition of other partner(s), voting rights, involvement in day-to-day capital and operating decisions, representation on a VIE’s executive committee, existence of unilateral kick-out rights or voting rights, level of economic disproportionality between us and the other partner(s) and contracts to purchase assets from VIEs.
Generally, all major decision making in our joint ventures is shared among all partners. In particular, business plans and budgets are generally required to be unanimously approved by all partners. Usually, management and other fees earned by us are nominal and believed to be at market and there is no significant economic disproportionality between us and other partners. Generally, we purchase less than a majority of the JV’s assets and the purchase prices under our option contracts are believed to be at market.
Generally, our Lennar Homebuilding unconsolidated entities become VIEs and consolidate when the other partner(s) lack the intent and financial wherewithal to remain in the entity. As a result, we continue to fund operations and debt paydowns through partner loans or substituted capital contributions. The accounting policy relating to variable interest entities is a critical accounting policy because the determination whether an entity is a VIE and, if so, whether we are primary beneficiary may require us to exercise significant judgment.
Lennar Financial Services Operations
Revenue Recognition
Title premiums on policies issued directly by us are recognized as revenue on the effective date of the title policies and escrow fees and loan origination revenues are recognized at the time the related real estate transactions are completed, usually upon the close of escrow. Revenues from title policies issued by independent agents are recognized as revenue when notice of issuance is received from the agent, which is generally when cash payment is received by us. Expected gains and losses from the sale of loans and their related servicing rights are included in the measurement of all written loan commitments that are accounted for at fair value through earnings at the time of commitment. Interest income on loans held-for-sale and loans held-for-investment is recognized as earned over the terms of the mortgage loans based on the contractual interest rates. We believe that the accounting policy related to revenue recognition is a critical accounting policy because of the significance of revenue.
Loan Origination Liabilities
Substantially all of the loans our Lennar Financial Services segment originates are sold within a short period in the secondary mortgage market on a servicing released, non-recourse basis. After the loans are sold, we retain potential liability for possible claims by purchasers that we breached certain limited industry-standard representations and warranties related to loan sales. During recent years there has been an increased industry-wide effort by purchasers to defray their losses by purporting to have found inaccuracies related to sellers’ representations and warranties in particular loan sale agreements.
67
Our mortgage operations have established reserves for possible losses associated with mortgage loans previously originated and sold to investors. We establish reserves for such possible losses based upon, among other things, an analysis of repurchase requests received, an estimate of potential repurchase claims not yet received and actual past repurchases and losses through the disposition of affected loans, as well as previous settlements. While we believe that we have adequately reserved for known losses and projected repurchase requests, given the volatility in the mortgage industry and the uncertainty regarding the ultimate resolution of these claims, if either actual repurchases or the losses incurred resolving those repurchases exceed our expectations, additional recourse expense may be incurred. This allowance requires management’s judgment and estimate. For these reasons, we believe that the accounting estimate related to the loan origination losses is a critical accounting estimate.
Rialto Operations
Management Fees Revenue
Our Rialto segment provides services to a variety of legal entities and investment vehicles such as funds, joint ventures, co-invests, and other private equity structures to manage their respective investments. As a result, Rialto earns and receives management fees, underwriting fees and due diligence fees. These fees related to our Rialto segment are included in Rialto revenues and are recorded over the period in which the services are performed, fees are determinable and collectability is reasonably assured. Rialto receives investment management fees from investment vehicles based on 1) a percentage of committed capital during the commitment period and after the commitment period ends and 2) a percentage of of invested capital less the portion of such invested capital utilized to acquire investments that have been sold (in whole or in part) or liquidated. Fees earned for underwriting and due diligence services are based on actual costs incurred. In certain situations, Rialto may earn additional fees when the return on assets managed exceeds contractually established thresholds. Such revenue is only booked when the contract terms are met, the contract is at, or near, completion and the amounts are known and collectability is reasonably assured. Since such revenue is recognized at the end of the life of the investment vehicle, after substantially all of the assets have been sold and investment gains and losses realized, the possibility of claw backs is limited. We believe the way we record Rialto management fees revenue is a significant accounting policy because it represents a significant portion of our Rialto segment's revenues and is expected to continue to grow in the future as the segment manages more assets.
Loans Receivable - Revenue Recognition
All of the acquired loans for which (1) there was evidence of credit quality deterioration since origination and (2) for which it was deemed probable that we would be unable to collect all contractually required principal and interest payments were accounted for under ASC 310-30,
Loans and Debt Securities Acquired with Deteriorated Credit Quality
, (“ASC 310-30”). For loans accounted for under ASC 310-30, management determined upon acquisition the loan’s value based on due diligence regarding each of the loans, the underlying properties and the borrowers. We determined fair value by discounting the cash flows expected to be collected adjusted for factors that a market participant would consider when determining fair value. Factors considered in the valuation were projected cash flows for the loans, type of loan and related collateral, classification status and current discount rates. Since the estimates are based on projections, all estimates are subjective and can change due to unexpected changes in economic conditions or loan performance.
Under ASC 310-30, loans were pooled together according to common risk characteristics. A pool is then accounted for as a single asset with a single component interest rate and as aggregate expectation of cash flows. The excess of the cash flows expected to be collected over the cost of the loans acquired is referred to as the accretable yield and is recognized in interest income over the remaining life of the loans using the effective yield method. The difference between the contractually required payments and the cash flows expected to be collected at acquisition is referred to as the nonaccretable difference. This difference is neither accreted into income nor recorded on our consolidated balance sheets. Changes in the expected cash flows of loans receivable from the date of acquisition will either impact the accretable yield or result in a charge to the provision for loan losses in the period in which the changes become probable. Prepayments are treated as a reduction of cash flows expected to be collected and a reduction of contractually required payments such that the nonaccretable difference is not affected. Subsequent significant decreases to the expected cash flows will generally result in a charge to the provision for loan losses, resulting in an increase to the allowance for loan losses, and a reclassification from accretable yield to nonaccretable difference. Subsequent probable and significant increases in the cash flows will result in a recovery of any previously recorded allowance for loan losses, to the extent applicable, and a reclassification from nonaccretable difference to accretable yield. Amounts related to the ASC 310-30 loans are estimates and may change as we obtain additional information related to the respective loans and the inherent uncertainty associated with estimating the amount and timing of the expected cash flows associated with distressed residential and commercial real estate loans. The timing and amount of expected cash flows and related accretable yield can also be impacted by disposal of loans, loan payoffs or expected foreclosures, which result in removal of the loans from the pools. Since the cash flows are based on projections, they are subjective and can change due to unexpected changes in economic conditions and loan performance. During the fourth quarter of 2014, in an effort to better reflect the performance of the loan portfolios, we changed from recording accretable yield income on a loan pool basis to recording income on a cost
68
recovery basis per loan as expected cash flows on the remaining loan portfolios could no longer be reasonably estimated. At
November 30, 2014
, these loans were classified as nonaccrual loans.
We believe that the accounting related to loans with deteriorated credit quality and that the accounting for accretable yield are critical accounting policies because of the significant judgment involved.
Nonaccrual Loans - Revenue Recognition and Impairment
For loans in which forecasted principal and interest could not be reasonably estimated at the loan acquisition date, management classified these loans as nonaccrual and accounts for these assets in accordance with ASC 310-10,
Receivables, (
“ASC 310-10”). When a loan is classified as nonaccrual, any subsequent cash receipt is accounted for using the recovery method. In accordance with ASC 310-10, a loan is considered impaired when based on current information and events; it is probable that all amounts due according to the contractual terms of the loan agreement will not be collected.
A provision for loan losses is recognized when the recorded investments in the loan is in excess of its fair value. The fair value of the loan is determined by using either the present value of expected future cash flows discounted at the loan's effective interest rate or the fair value of the collateral less estimated costs to sell.
We believe that the accounting for nonaccrual loans is a critical accounting estimate because of the significant judgment involved.
As described above, during the fourth quarter of 2014, in an effort to better reflect the performance of the loan portfolios accounted under ASC 310-30, we changed from recording accretable yield income on a loan pool basis to recording income on a cost recovery basis per loan as expected cash flows on the remaining loan portfolios could no longer be reasonable estimated. At
November 30, 2014
, those loans that were accounted under ASC 310-30 were classified as nonaccrual loans.
Real Estate Owned
REO represents real estate that our Rialto segment has taken control or has effective control of in partial or full satisfaction of loans receivable. At the time of acquisition of a property through foreclosure of a loan, REO is recorded at fair value less estimated costs to sell if classified as held-for-sale or at fair value if classified as held-and-used, which becomes the property’s new basis. The fair values of these assets are determined in part by placing reliance on third-party appraisals of the properties and/or internally prepared analyses of recent offers or prices on comparable properties in the proximate vicinity. The third-party appraisals and internally developed analyses are significantly impacted by the local market economy, market supply and demand, competitive conditions and prices on comparable properties, adjusted for date of sale, location, property size, and other factors. Each REO is unique and is analyzed in the context of the particular market where the property is located. In order to establish the significant assumptions for a particular REO, we analyze historical trends, including trends achieved by our local homebuilding operations, if applicable, and current trends in the market and economy impacting the REO. Using available trend information, we then calculate our best estimate of fair value, which can include projected cash flows discounted at a rate we believe a market participant would determine to be commensurate with the inherent risks associated with the assets and related estimated cash flow streams.
Changes in economic factors, consumer demand and market conditions, among other things, could materially impact estimates used in the third-party appraisals and/or internally prepared analyses of recent offers or prices on comparable properties. Thus, estimates can differ significantly from the amounts ultimately realized by our Rialto segment from disposition of these assets. The amount by which the recorded investment in the loan is less than the REO’s fair value (net of estimated cost to sell if held-for-sale), is recorded as an unrealized gain on foreclosure in our consolidated statement of operations. The amount by which the recorded investment in the loan is greater than the REO’s fair value (net of estimated cost to sell if held-for-sale) is initially recorded as an impairment in our consolidated statement of operations.
Subsequent to obtaining REO via foreclosure or directly from a financial institution, management periodically performs valuations using the methodologies described above such that the real estate is carried at the lower of its carrying value or current fair value, less estimated costs to sell if classified as held-for-sale. Held-and-used assets are tested for recoverability whenever changes in circumstances indicate that the carrying value may not be recoverable, and impairment losses are recorded for any amount by which the carrying value exceeds its fair value. Any subsequent impairment losses, operating expenses or income, and gains and losses on disposition of such properties are also recognized in our Rialto other income (expense), net. REO assets classified as held-and-used are depreciated using a useful life of forty years for commercial properties and twenty seven and a half years for residential properties. REO assets classified as held-for-sale are not depreciated. Occasionally an asset will require certain improvements to yield a higher return. In accordance with ASC 970-340-25,
Real Estate
, construction costs incurred prior to acquisition or during development of the asset may be capitalized.
We believe that the accounting related to REO is a critical accounting policy because of the significant judgment required in the third-party appraisals and/or internally prepared analysis of recent offers or prices of comparable properties in the proximate vicinity used to estimate the fair value of REOs.
69
Rialto Mortgage Finance - Loans Held-for Sale
The originated mortgage loans are classified as loans held-for-sale on the consolidated balance sheets and are recorded at fair value. We elected the fair value option for RMF's loans held-for-sale in accordance with ASC 825,
Financial Instruments
, which permits entities to measure various financial instruments and certain other items at fair value on a contract-by-contract basis. Changes in fair values of the loans are reflected in our Rialto revenues in the accompanying consolidated statements of operations. Interest income on these loans is calculated based on the interest rate of the loan and is recorded within Rialto revenues in the accompanying consolidated statements of operations. Substantially all of the mortgage loans originated are sold within a short period of time in a securitization on a servicing released, non-recourse basis; although, we remain liable for certain limited industry-standard representations and warranties related to loan sales. We recognize revenue on the sale of loans into securitizations trusts when control of the loans has been relinquished.
We believe this is a critical accounting policy due to the significant judgment involved in estimating the fair values of loans held-for-sale during the period between time the loan is originated and the time the loan is sold and of its significance to our Rialto segment.
Consolidations of Variable Interest Entities
In 2010, our Rialto segment acquired indirectly 40% managing member equity interests in two limited liability companies (“LLCs”), in partnership with the FDIC. We determined that each of the LLCs met the definition of a variable interest entity (“VIE”) and we were the primary beneficiary. In accordance with ASC 810-10-65-2,
Consolidations
, (“ASC 810-10-65-2”), we identified the activities that most significantly impact the LLCs’ economic performance and determined that we have the power to direct those activities. The economic performance of the LLCs is most significantly impacted by the performance of the LLCs’ portfolios of assets, which consist primarily of distressed residential and commercial mortgage loans. Thus, the activities that most significantly impact the LLCs’ economic performance are the servicing and disposition of mortgage loans and real estate obtained through foreclosure of loans, restructuring of loans, or other planned activities associated with the monetizing of loans.
The FDIC does not have the unilateral power to terminate our role in managing the LLCs and servicing the loan portfolios. While the FDIC has the right to prevent certain types of transactions (i.e., bulk sales, selling assets with recourse back to the selling entity, selling assets with representations and warranties and financing the sales of assets without the FDIC’s approval), the FDIC does not have full voting or blocking rights over the LLCs’ activities, making their voting rights protective in nature, not substantive participating voting rights. Other than as described in the preceding sentence, which are not the primary activities of the LLCs, we can cause the LLCs to enter into both the disposition and restructuring of loans without any involvement of the FDIC. Additionally, the FDIC has no voting rights with regard to the operation/management of the operating properties that are acquired upon foreclosure of loans (e.g. REO) and no voting rights over the business plans of the LLCs. The FDIC can make suggestions regarding the business plans, but we can decide not to follow the FDIC’s suggestions and not to incorporate them in the business plans. Since the FDIC’s voting rights are protective in nature and not substantive participating voting rights, we have the power to direct the activities that most significantly impact the LLCs’ economic performance.
In accordance with ASC 810-10-65-2, we determined that we had an obligation to absorb losses of the LLCs that could potentially be significant to the LLCs or the right to receive benefits from the LLCs that could potentially be significant to the LLCs based on the following factors:
|
•
|
Rialto/Lennar owns 40% of the equity of the LLCs and has the power to direct the activities of the LLCs that most significantly impact their economic performance through loan resolutions and the sale of REO.
|
|
•
|
Rialto/Lennar has a management/servicer contract under which we earn a 0.5% servicing fee.
|
|
•
|
Rialto/Lennar has guaranteed, as the servicer, its obligations under the servicing agreement up to $10 million.
|
We are aware that the FDIC, as the owner of 60% of the equity of each of the LLCs, may also have an obligation to absorb losses of the LLCs that could potentially be significant to the LLCs. However, in accordance with ASC 810-10-25-38A, only one enterprise, if any, is expected to be identified as the primary beneficiary of a VIE.
Since both criteria for consolidation in ASC 810-10-65-2 are met, we consolidated the LLCs. We believe that our assessment that we are the primary beneficiary of the LLCs is a critical accounting policy because of the significant judgment required in evaluating all of the key factors and circumstances in determining the primary beneficiary.
|
Item 7A.
|
Quantitative and Qualitative Disclosures About Market Risk.
|
We are exposed to market risks related to fluctuations in interest rates on our investments, debt obligations, loans held-for-sale and loans held-for-investment. We utilize forward commitments and option contracts to mitigate the risks associated with our mortgage loan portfolio. The table below provides information at
November 30, 2014
about our significant financial instruments that are sensitive to changes in interest rates. For loans held-for-sale, loans held-for-investment, net and investments held-to-maturity, senior notes and other debts payable and notes and other debts payable, the table presents
70
principal cash flows and related weighted average effective interest rates by expected maturity dates and estimated fair values at
November 30, 2014
. Weighted average variable interest rates are based on the variable interest rates at
November 30, 2014
. Rialto loans receivable, net are not included in the table below because these loans were acquired having deteriorated credit quality, thus, we believe they are not sensitive to changes in interest rates. See Management’s Discussion and Analysis of Financial Condition and Results of Operations in Item 7 and Notes 1 and 15 of the notes to consolidated financial statements in Item 8 for a further discussion of these items and our strategy of mitigating our interest rate risk.
Information Regarding Interest Rate Sensitivity
Principal (Notional) Amount by
Expected Maturity and Average Interest Rate
November 30, 2014
|
|
Years Ending November 30,
|
|
|
Fair Value at
November 30,
|
||||||||||||||||||||
|
(Dollars in millions)
|
2015
|
2016
|
2017
|
2018
|
2019
|
Thereafter
|
Total
|
2014
|
||||||||||||||||
|
ASSETS
|
||||||||||||||||||||||||
|
Rialto:
|
||||||||||||||||||||||||
|
Investments held-to-maturity:
|
||||||||||||||||||||||||
|
Fixed rate
|
$
|
—
|
|
—
|
|
—
|
|
—
|
|
—
|
|
17.3
|
|
17.3
|
|
17.2
|
|
|||||||
|
Average interest rate
|
—
|
|
—
|
|
—
|
|
—
|
|
—
|
|
4.0
|
%
|
4.0
|
%
|
—
|
|
||||||||
|
Loans held-for-sale:
|
||||||||||||||||||||||||
|
Fixed rate
|
$
|
—
|
|
—
|
|
—
|
|
—
|
|
—
|
|
113.6
|
|
113.6
|
|
113.6
|
|
|||||||
|
Average interest rate
|
—
|
|
—
|
|
—
|
|
—
|
|
—
|
|
4.7
|
%
|
4.7
|
%
|
—
|
|
||||||||
|
Lennar Financial Services:
|
||||||||||||||||||||||||
|
Loans held-for-sale:
|
||||||||||||||||||||||||
|
Fixed rate
|
$
|
—
|
|
—
|
|
—
|
|
—
|
|
—
|
|
676.2
|
|
676.2
|
|
676.2
|
|
|||||||
|
Average interest rate
|
—
|
|
—
|
|
—
|
|
—
|
|
—
|
|
4.1
|
%
|
4.1
|
%
|
—
|
|
||||||||
|
Variable rate
|
$
|
—
|
|
—
|
|
—
|
|
—
|
|
—
|
|
62.2
|
|
62.2
|
|
62.2
|
|
|||||||
|
Average interest rate
|
—
|
|
—
|
|
—
|
|
—
|
|
—
|
|
3.2
|
%
|
3.2
|
%
|
—
|
|
||||||||
|
Loans held-for-investment, net and investments held-to-maturity:
|
||||||||||||||||||||||||
|
Fixed rate
|
$
|
20.2
|
|
13.3
|
|
6.2
|
|
0.8
|
|
1.8
|
|
26.2
|
|
68.5
|
|
68.3
|
|
|||||||
|
Average interest rate
|
1.2
|
%
|
1.2
|
%
|
2.0
|
%
|
5.5
|
%
|
3.6
|
%
|
5.3
|
%
|
3.0
|
%
|
—
|
|
||||||||
|
Variable rate
|
$
|
0.1
|
|
0.1
|
|
0.1
|
|
0.1
|
|
0.1
|
|
2.9
|
|
3.4
|
|
3.5
|
|
|||||||
|
Average interest rate
|
4.0
|
%
|
4.0
|
%
|
4.0
|
%
|
4.0
|
%
|
4.0
|
%
|
4.0
|
%
|
4.0
|
%
|
—
|
|
||||||||
|
LIABILITIES
|
||||||||||||||||||||||||
|
Lennar Homebuilding:
|
||||||||||||||||||||||||
|
Senior notes and other debts payable:
|
||||||||||||||||||||||||
|
Fixed rate
|
$
|
614.0
|
|
294.9
|
|
401.2
|
|
651.0
|
|
1,125.5
|
|
1,424.4
|
|
4,511.0
|
|
5,576.1
|
|
|||||||
|
Average interest rate
|
5.4
|
%
|
6.1
|
%
|
12.1
|
%
|
5.6
|
%
|
4.4
|
%
|
3.8
|
%
|
5.3
|
%
|
—
|
|
||||||||
|
Variable rate
|
$
|
45.4
|
|
122.9
|
|
10.9
|
|
—
|
|
—
|
|
—
|
|
179.2
|
|
184.0
|
|
|||||||
|
Average interest rate
|
3.3
|
%
|
2.2
|
%
|
2.5
|
%
|
—
|
|
—
|
|
—
|
|
2.5
|
%
|
—
|
|
||||||||
|
Rialto:
|
||||||||||||||||||||||||
|
Notes and other debts payable:
|
||||||||||||||||||||||||
|
Fixed rate
|
$
|
3.4
|
|
63.7
|
|
1.1
|
|
353.1
|
|
—
|
|
—
|
|
421.3
|
|
441.7
|
|
|||||||
|
Average interest rate
|
7.3
|
%
|
3.8
|
%
|
5.9
|
%
|
5.2
|
%
|
—
|
|
—
|
|
5.0
|
%
|
—
|
|
||||||||
|
Variable rate
|
$
|
141.3
|
|
30.3
|
|
30.3
|
|
—
|
|
—
|
|
—
|
|
201.9
|
|
198.6
|
|
|||||||
|
Average interest rate
|
2.5
|
%
|
4.5
|
%
|
4.5
|
%
|
—
|
|
—
|
|
—
|
|
3.1
|
%
|
—
|
|
||||||||
|
Lennar Financial Services:
|
||||||||||||||||||||||||
|
Notes and other debts payable:
|
||||||||||||||||||||||||
|
Variable rate
|
$
|
698.4
|
|
—
|
|
5.7
|
|
—
|
|
—
|
|
—
|
|
704.1
|
|
704.1
|
|
|||||||
|
Average interest rate
|
2.5
|
%
|
—
|
|
10.0
|
%
|
—
|
|
—
|
|
—
|
|
2.5
|
%
|
—
|
|
||||||||
71
|
Item 8.
|
Financial Statements and Supplementary Data.
|
REPORT OF INDEPENDENT REGISTERED PUBLIC ACCOUNTING FIRM
To the Board of Directors and Stockholders of Lennar Corporation
We have audited the accompanying consolidated balance sheets of Lennar Corporation and subsidiaries (the “Company”) as of
November 30, 2014
and
2013
, and the related consolidated statements of operations, equity, and cash flows for each of the three years in the period ended
November 30, 2014
. These financial statements are the responsibility of the Company’s management. Our responsibility is to express an opinion on these financial statements based on our audits.
We conducted our audits in accordance with the standards of the Public Company Accounting Oversight Board (United States). Those standards require that we plan and perform the audit to obtain reasonable assurance about whether the financial statements are free of material misstatement. An audit includes examining, on a test basis, evidence supporting the amounts and disclosures in the financial statements. An audit also includes assessing the accounting principles used and significant estimates made by management, as well as evaluating the overall financial statement presentation. We believe that our audits provide a reasonable basis for our opinion.
In our opinion, such consolidated financial statements present fairly, in all material respects, the financial position of Lennar Corporation and subsidiaries as of
November 30, 2014
and
2013
, and the results of their operations and their cash flows for each of the three years in the period ended
November 30, 2014
, in conformity with accounting principles generally accepted in the United States of America.
We have also audited, in accordance with the standards of the Public Company Accounting Oversight Board (United States), the Company’s internal control over financial reporting as of
November 30, 2014
, based on the criteria established in
Internal Control — Integrated Framework
(1992) issued by the Committee of Sponsoring Organizations of the Treadway Commission and our report dated
January 23, 2015
expressed an unqualified opinion on the Company’s internal control over financial reporting.
/s/ DELOITTE & TOUCHE LLP
Certified Public Accountants
Miami, Florida
January 23, 2015
72
LENNAR CORPORATION AND SUBSIDIARIES
CONSOLIDATED BALANCE SHEETS
November 30, 2014
and
2013
|
2014 (1)
|
2013 (1)
|
|||||
|
(Dollars in thousands, except shares and per share amounts)
|
||||||
|
ASSETS
|
||||||
|
Lennar Homebuilding:
|
||||||
|
Cash and cash equivalents
|
$
|
885,729
|
|
695,424
|
|
|
|
Restricted cash
|
9,849
|
|
36,150
|
|
||
|
Receivables, net
|
93,444
|
|
51,935
|
|
||
|
Inventories:
|
||||||
|
Finished homes and construction in progress
|
3,082,345
|
|
2,269,116
|
|
||
|
Land and land under development
|
4,601,802
|
|
3,871,773
|
|
||
|
Consolidated inventory not owned
|
52,453
|
|
460,159
|
|
||
|
Total inventories
|
7,736,600
|
|
6,601,048
|
|
||
|
Investments in unconsolidated entities
|
656,837
|
|
716,949
|
|
||
|
Other assets
|
672,589
|
|
748,629
|
|
||
|
10,055,048
|
|
8,850,135
|
|
|||
|
Rialto:
|
||||||
|
Cash and cash equivalents
|
303,889
|
|
201,496
|
|
||
|
Restricted cash
|
46,975
|
|
2,593
|
|
||
|
Receivables, net
|
153,773
|
|
111,833
|
|
||
|
Loans receivable, net
|
130,105
|
|
278,392
|
|
||
|
Loans held-for-sale
|
113,596
|
|
44,228
|
|
||
|
Real estate owned - held-for-sale
|
190,535
|
|
197,851
|
|
||
|
Real estate owned - held-and-used, net
|
255,795
|
|
428,989
|
|
||
|
Investments in unconsolidated entities
|
175,700
|
|
154,573
|
|
||
|
Other assets
|
87,784
|
|
59,358
|
|
||
|
1,458,152
|
|
1,479,313
|
|
|||
|
Lennar Financial Services
|
1,177,053
|
|
796,710
|
|
||
|
Lennar Multifamily
|
268,014
|
|
147,089
|
|
||
|
Total assets
|
$
|
12,958,267
|
|
11,273,247
|
|
|
|
(1)
|
Under certain provisions of Accounting Standards Codification (“ASC”) Topic 810, Consolidations, (“ASC 810”) the Company is required to separately disclose on its consolidated balance sheets the assets of consolidated variable interest entities (“VIEs”) that are owned by the consolidated VIEs and liabilities of consolidated VIEs as to which there is no recourse against the Company.
|
As of
November 30, 2014
, total assets include
$929.1 million
related to consolidated VIEs of which
$11.7 million
is included in Lennar Homebuilding cash and cash equivalents,
$0.3 million
in restricted cash,
$0.2 million
in Lennar Homebuilding receivables, net,
$0.2 million
in Lennar Homebuilding finished homes and construction in progress,
$208.2 million
in Lennar Homebuilding land and land under development,
$52.5 million
in Lennar Homebuilding consolidated inventory not owned,
$23.9 million
in Lennar Homebuilding investments in unconsolidated entities,
$104.6 million
in Lennar Homebuilding other assets,
$75.8 million
in Rialto cash and cash equivalents,
$128.9 million
in Rialto loans receivable, net,
$128.2 million
in Rialto real estate owned held-for-sale,
$172.7 million
in Rialto real estate owned held-and-used, net,
$0.7 million
in Rialto investments in unconsolidated entities,
$2.1 million
in Rialto other assets and
$19.2 million
in Lennar Multifamily assets.
As of
November 30, 2013
, total assets include
$1,195.3 million
related to consolidated VIEs of which
$8.3 million
is included in Lennar Homebuilding cash and cash equivalents,
$17.7 million
in restricted cash,
$2.4 million
in Lennar Homebuilding receivables, net,
$94.8 million
in Lennar Homebuilding land and land under development,
$243.6 million
in Lennar Homebuilding consolidated inventory not owned,
$14.7 million
in Lennar Homebuilding investments in unconsolidated entities,
$86.8 million
in Lennar Homebuilding other assets,
$44.8 million
in Rialto cash and cash equivalents,
$244.0 million
in Rialto loans receivable, net,
$122.0 million
in Rialto real estate owned held-for-sale,
$313.8 million
in Rialto real estate owned held-and-used, net,
$0.7 million
in Rialto investments in unconsolidated entities and
$1.8 million
in Rialto other assets.
See accompanying notes to consolidated financial statements.
73
LENNAR CORPORATION AND SUBSIDIARIES
CONSOLIDATED BALANCE SHEETS
November 30, 2014
and
2013
|
2014 (2)
|
2013 (2)
|
|||||
|
(Dollars in thousands, except shares and per share amounts)
|
||||||
|
LIABILITIES AND EQUITY
|
||||||
|
Lennar Homebuilding:
|
||||||
|
Accounts payable
|
$
|
412,558
|
|
271,365
|
|
|
|
Liabilities related to consolidated inventory not owned
|
45,028
|
|
384,876
|
|
||
|
Senior notes and other debts payable
|
4,690,213
|
|
4,194,432
|
|
||
|
Other liabilities
|
863,236
|
|
712,931
|
|
||
|
6,011,035
|
|
5,563,604
|
|
|||
|
Rialto
|
747,044
|
|
497,008
|
|
||
|
Lennar Financial Services
|
896,643
|
|
543,639
|
|
||
|
Lennar Multifamily
|
52,243
|
|
41,526
|
|
||
|
Total liabilities
|
7,706,965
|
|
6,645,777
|
|
||
|
Stockholders’ equity:
|
||||||
|
Preferred stock
|
—
|
|
—
|
|
||
|
Class A common stock of $0.10 par value per share; Authorized: 2014 and 2013 - 300,000,000 shares; Issued: 2014 - 174,241,570 shares; 2013 - 184,833,120 shares
|
17,424
|
|
18,483
|
|
||
|
Class B common stock of $0.10 par value per share; Authorized: 2014 and 2013 - 90,000,000 shares, Issued: 2014 - 32,982,815 shares; 2013 - 32,982,815 shares
|
3,298
|
|
3,298
|
|
||
|
Additional paid-in capital
|
2,239,704
|
|
2,721,246
|
|
||
|
Retained earnings
|
2,660,034
|
|
2,053,893
|
|
||
|
Treasury stock, at cost; 2014 - 505,420 shares of Class A common stock and 1,679,620 shares of Class B common stock; 2013 - 12,063,466 shares of Class A common stock and 1,679,620 shares of Class B common stock
|
(93,440
|
)
|
(628,019
|
)
|
||
|
Total stockholders’ equity
|
4,827,020
|
|
4,168,901
|
|
||
|
Noncontrolling interests
|
424,282
|
|
458,569
|
|
||
|
Total equity
|
5,251,302
|
|
4,627,470
|
|
||
|
Total liabilities and equity
|
$
|
12,958,267
|
|
11,273,247
|
|
|
|
(2)
|
As of
November 30, 2014
, total liabilities include
$149.8 million
related to consolidated VIEs as to which there was no recourse against the Company, of which
$6.8 million
is included in Lennar Homebuilding accounts payable,
$45.0 million
in Lennar Homebuilding liabilities related to consolidated inventory not owned,
$61.6 million
in Lennar Homebuilding senior notes and other debts payable,
$14.8 million
in Lennar Homebuilding other liabilities and
$21.5 million
in Rialto liabilities.
|
As of
November 30, 2013
, total liabilities include
$294.8 million
related to consolidated VIEs as to which there was no recourse against the Company, of which
$3.0 million
is included in Lennar Homebuilding accounts payable,
$191.6 million
in Lennar Homebuilding liabilities related to consolidated inventory not owned,
$75.1 million
in Lennar Homebuilding senior notes and other debts payable,
$4.9 million
in Lennar Homebuilding other liabilities and
$20.2 million
in Rialto liabilities.
See accompanying notes to consolidated financial statements.
74
LENNAR CORPORATION AND SUBSIDIARIES
CONSOLIDATED STATEMENTS OF OPERATIONS
Years Ended
November 30, 2014
,
2013
and
2012
|
2014
|
2013
|
2012
|
|||||||
|
(Dollars in thousands, except per share amounts)
|
|||||||||
|
Revenues:
|
|||||||||
|
Lennar Homebuilding
|
$
|
7,025,130
|
|
5,354,947
|
|
3,581,232
|
|
||
|
Lennar Financial Services
|
454,381
|
|
427,342
|
|
384,618
|
|
|||
|
Rialto
|
230,521
|
|
138,060
|
|
138,856
|
|
|||
|
Lennar Multifamily
|
69,780
|
|
14,746
|
|
426
|
|
|||
|
Total revenues
|
7,779,812
|
|
5,935,095
|
|
4,105,132
|
|
|||
|
Cost and expenses:
|
|||||||||
|
Lennar Homebuilding (1)
|
5,962,029
|
|
4,579,108
|
|
3,216,366
|
|
|||
|
Lennar Financial Services
|
374,243
|
|
341,556
|
|
299,836
|
|
|||
|
Rialto
|
249,114
|
|
151,072
|
|
138,990
|
|
|||
|
Lennar Multifamily
|
95,227
|
|
31,463
|
|
6,306
|
|
|||
|
Corporate general and administrative
|
177,161
|
|
146,060
|
|
127,338
|
|
|||
|
Total costs and expenses
|
6,857,774
|
|
5,249,259
|
|
3,788,836
|
|
|||
|
Lennar Homebuilding equity in earnings (loss) from unconsolidated entities (2)
|
(355
|
)
|
23,803
|
|
(26,672
|
)
|
|||
|
Lennar Homebuilding other income, net (3)
|
7,526
|
|
27,346
|
|
15,144
|
|
|||
|
Other interest expense
|
(36,551
|
)
|
(93,913
|
)
|
(94,353
|
)
|
|||
|
Rialto equity in earnings from unconsolidated entities
|
59,277
|
|
22,353
|
|
41,483
|
|
|||
|
Rialto other income (expense), net
|
3,395
|
|
16,787
|
|
(29,780
|
)
|
|||
|
Lennar Multifamily equity in earnings (loss) from unconsolidated entities
|
14,454
|
|
(271
|
)
|
(4
|
)
|
|||
|
Earnings before income taxes
|
969,784
|
|
681,941
|
|
222,114
|
|
|||
|
(Provision) benefit for income taxes
|
(341,091
|
)
|
(177,015
|
)
|
435,218
|
|
|||
|
Net earnings (including net earnings (loss) attributable to noncontrolling interests)
|
628,693
|
|
504,926
|
|
657,332
|
|
|||
|
Less: Net earnings (loss) attributable to noncontrolling interests (4)
|
(10,223
|
)
|
25,252
|
|
(21,792
|
)
|
|||
|
Net earnings attributable to Lennar
|
$
|
638,916
|
|
479,674
|
|
679,124
|
|
||
|
Basic earnings per share
|
$
|
3.12
|
|
2.48
|
|
3.58
|
|
||
|
Diluted earnings per share
|
$
|
2.80
|
|
2.15
|
|
3.11
|
|
||
|
Comprehensive earnings attributable to Lennar
|
$
|
638,916
|
|
479,674
|
|
679,124
|
|
||
|
Comprehensive earnings (loss) attributable to noncontrolling interests
|
$
|
(10,223
|
)
|
25,252
|
|
(21,792
|
)
|
||
|
(1)
|
Lennar Homebuilding costs and expenses included
$9.9 million
,
$7.5 million
and
$15.6 million
, respectively, of inventory valuation adjustments and write-offs of option deposits and pre-acquisition costs for the years ended
November 30, 2014
,
2013
and
2012
.
|
|
(2)
|
Lennar Homebuilding equity in earnings (loss) from unconsolidated entities included
$4.6 million
and
$12.1 million
of the Company’s share of valuation adjustments related to assets of unconsolidated entities for the years ended November 30, 2014 and 2012, respectively.
|
|
(3)
|
Lennar Homebuilding other income, net included
$3.2 million
in write-offs of other receivables and valuation adjustments of other assets for the year ended
November 30, 2014
.
|
|
(4)
|
Net earnings (loss) attributable to noncontrolling interests for the years ended
November 30, 2014
,
2013
and
2012
included
($22.5) million
,
$6.2 million
and
($14.4) million
, respectively, of net earnings (loss) related to the FDIC’s interest in the portfolio of real estate loans that the Company acquired in partnership with the FDIC.
|
See accompanying notes to consolidated financial statements.
75
LENNAR CORPORATION AND SUBSIDIARIES
CONSOLIDATED STATEMENTS OF EQUITY
Years Ended
November 30, 2014
,
2013
and
2012
|
2014
|
2013
|
2012
|
|||||||
|
(Dollars in thousands)
|
|||||||||
|
Class A common stock:
|
|||||||||
|
Beginning balance
|
$
|
18,483
|
|
17,240
|
|
16,910
|
|
||
|
Employee stock and director plans
|
114
|
|
243
|
|
330
|
|
|||
|
Retirement of treasury stock
|
(1,173
|
)
|
—
|
|
—
|
|
|||
|
Conversion of 2.00% convertible senior notes due 2020 to shares of Class A common stock
|
—
|
|
1,000
|
|
—
|
|
|||
|
Balance at November 30,
|
17,424
|
|
18,483
|
|
17,240
|
|
|||
|
Class B common stock
|
3,298
|
|
3,298
|
|
3,298
|
|
|||
|
Additional paid-in capital:
|
|||||||||
|
Beginning balance
|
2,721,246
|
|
2,421,941
|
|
2,341,079
|
|
|||
|
Employee stock and director plans
|
1,514
|
|
17,423
|
|
29,006
|
|
|||
|
Retirement of treasury stock
|
(541,019
|
)
|
—
|
|
—
|
|
|||
|
Tax benefit from employee stock plans, vesting of restricted stock and conversion of 2.00% convertible senior notes due 2020
|
17,382
|
|
17,162
|
|
22,544
|
|
|||
|
Amortization of restricted stock and performance-based stock options
|
40,581
|
|
33,559
|
|
29,312
|
|
|||
|
Conversion of 2.00% convertible senior notes due 2020 to shares of Class A common stock
|
—
|
|
293,106
|
|
—
|
|
|||
|
Equity adjustment related to purchase of noncontrolling interests
|
—
|
|
(61,945
|
)
|
—
|
|
|||
|
Balance at November 30,
|
2,239,704
|
|
2,721,246
|
|
2,421,941
|
|
|||
|
Retained Earnings:
|
|||||||||
|
Beginning balance
|
2,053,893
|
|
1,605,131
|
|
956,401
|
|
|||
|
Net earnings attributable to Lennar
|
638,916
|
|
479,674
|
|
679,124
|
|
|||
|
Cash dividends - Class A common stock
|
(27,766
|
)
|
(25,635
|
)
|
(25,387
|
)
|
|||
|
Cash dividends - Class B common stock
|
(5,009
|
)
|
(5,277
|
)
|
(5,007
|
)
|
|||
|
Balance at November 30,
|
2,660,034
|
|
2,053,893
|
|
1,605,131
|
|
|||
|
Treasury stock, at cost:
|
|||||||||
|
Beginning balance
|
(628,019
|
)
|
(632,846
|
)
|
(621,220
|
)
|
|||
|
Employee stock and directors plans
|
(7,613
|
)
|
4,827
|
|
(17,149
|
)
|
|||
|
Retirement of treasury stock
|
542,192
|
|
—
|
|
—
|
|
|||
|
Reissuance of treasury stock
|
—
|
|
—
|
|
5,523
|
|
|||
|
Balance at November 30,
|
(93,440
|
)
|
(628,019
|
)
|
(632,846
|
)
|
|||
|
Total stockholders’ equity
|
4,827,020
|
|
4,168,901
|
|
3,414,764
|
|
|||
|
Noncontrolling interests:
|
|||||||||
|
Beginning balance
|
458,569
|
|
586,444
|
|
607,057
|
|
|||
|
Net earnings (loss) attributable to noncontrolling interests
|
(10,223
|
)
|
25,252
|
|
(21,792
|
)
|
|||
|
Receipts related to noncontrolling interests
|
12,859
|
|
8,236
|
|
1,659
|
|
|||
|
Payments related to noncontrolling interests
|
(155,625
|
)
|
(201,655
|
)
|
(480
|
)
|
|||
|
Non-cash consolidations
|
118,272
|
|
2,242
|
|
—
|
|
|||
|
Non-cash purchase or activity of noncontrolling interests
|
430
|
|
(63,500
|
)
|
—
|
|
|||
|
Equity adjustment related to purchase of noncontrolling interests
|
—
|
|
101,550
|
|
—
|
|
|||
|
Balance at November 30,
|
424,282
|
|
458,569
|
|
586,444
|
|
|||
|
Total equity
|
$
|
5,251,302
|
|
4,627,470
|
|
4,001,208
|
|
||
See accompanying notes to consolidated financial statements.
76
LENNAR CORPORATION AND SUBSIDIARIES
Years Ended
November 30, 2014
,
2013
and
2012
|
2014
|
2013
|
2012
|
|||||||
|
|
(Dollars in thousands)
|
||||||||
|
Cash flows from operating activities:
|
|||||||||
|
Net earnings (including net earnings (loss) attributable to noncontrolling interests)
|
$
|
628,693
|
|
504,926
|
|
657,332
|
|
||
|
Adjustments to reconcile net earnings to net cash used in operating activities:
|
|||||||||
|
Depreciation and amortization
|
38,542
|
|
30,349
|
|
28,081
|
|
|||
|
Amortization of discount/premium on debt, net
|
21,387
|
|
23,497
|
|
21,450
|
|
|||
|
Lennar Homebuilding equity in (earnings) loss from unconsolidated entities
|
355
|
|
(23,803
|
)
|
26,672
|
|
|||
|
Distributions of earnings from Lennar Homebuilding unconsolidated entities
|
5,316
|
|
3,381
|
|
1,005
|
|
|||
|
Rialto equity in earnings from unconsolidated entities
|
(59,277
|
)
|
(22,353
|
)
|
(41,483
|
)
|
|||
|
Distributions of earnings from Rialto unconsolidated entities
|
2,466
|
|
648
|
|
18,399
|
|
|||
|
Lennar Multifamily equity in (earnings) loss from unconsolidated entities
|
(14,454
|
)
|
271
|
|
4
|
|
|||
|
Distributions of earnings from Lennar Multifamily unconsolidated entities
|
14,469
|
|
—
|
|
—
|
|
|||
|
Share-based compensation expense
|
40,718
|
|
33,689
|
|
31,745
|
|
|||
|
Tax benefit from share-based awards
|
—
|
|
17,162
|
|
22,544
|
|
|||
|
Excess tax benefits from share-based awards
|
(7,497
|
)
|
(10,148
|
)
|
(10,814
|
)
|
|||
|
Deferred income tax (benefit) expense
|
75,324
|
|
151,619
|
|
(467,561
|
)
|
|||
|
Gain on retirement of Lennar Homebuilding debt
|
—
|
|
(1,000
|
)
|
(988
|
)
|
|||
|
Gain on retirement of Rialto notes payable
|
(4,555
|
)
|
—
|
|
—
|
|
|||
|
Gain on sale of operating property and equipment
|
—
|
|
(14,432
|
)
|
—
|
|
|||
|
Loss on retirement of Lennar Homebuilding senior notes
|
—
|
|
—
|
|
6,510
|
|
|||
|
Unrealized and realized gains on Rialto real estate owned, net
|
(36,901
|
)
|
(48,358
|
)
|
(19,771
|
)
|
|||
|
Unrealized gain on Rialto bargain purchase acquisition
|
—
|
|
(8,532
|
)
|
—
|
|
|||
|
Impairments of Rialto loans receivable and real estate owned, net
|
76,450
|
|
32,229
|
|
37,248
|
|
|||
|
Valuation adjustments and write-offs of option deposits and pre-acquisition costs, other receivables and other assets
|
13,088
|
|
8,435
|
|
16,647
|
|
|||
|
Changes in assets and liabilities:
|
|||||||||
|
(Increase) decrease in restricted cash
|
(18,930
|
)
|
(6,430
|
)
|
3,841
|
|
|||
|
(Increase) decrease in receivables
|
(113,001
|
)
|
(62,708
|
)
|
17,370
|
|
|||
|
Increase in inventories, excluding valuation adjustments and write-offs of option deposits and pre-acquisition costs
|
(1,367,415
|
)
|
(1,627,136
|
)
|
(563,051
|
)
|
|||
|
(Increase) decrease in other assets
|
(13,990
|
)
|
4,279
|
|
(35,041
|
)
|
|||
|
Increase in Rialto loans held-for-sale
|
(69,269
|
)
|
(44,000
|
)
|
—
|
|
|||
|
(Increase) decrease in Lennar Financial Services loans held-for-sale
|
(326,094
|
)
|
86,130
|
|
(202,916
|
)
|
|||
|
Increase in accounts payable and other liabilities
|
326,087
|
|
164,571
|
|
28,129
|
|
|||
|
Net cash used in operating activities
|
(788,488
|
)
|
(807,714
|
)
|
(424,648
|
)
|
|||
|
Cash flows from investing activities:
|
|||||||||
|
Decrease (increase) in restricted cash related to LOCs
|
$
|
37
|
|
(21,527
|
)
|
—
|
|
||
|
Net additions of operating properties and equipment
|
(22,599
|
)
|
(8,126
|
)
|
(2,822
|
)
|
|||
|
Proceeds from the sale of operating properties and equipment
|
43,937
|
|
140,564
|
|
—
|
|
|||
|
Investments in and contributions to Lennar Homebuilding unconsolidated entities
|
(87,501
|
)
|
(57,067
|
)
|
(72,611
|
)
|
|||
|
Distributions of capital from Lennar Homebuilding unconsolidated entities
|
143,451
|
|
158,076
|
|
34,030
|
|
|||
|
Investments in and contributions to Rialto unconsolidated entities
|
(41,523
|
)
|
(66,953
|
)
|
(43,555
|
)
|
|||
|
Distributions of capital from Rialto unconsolidated entities
|
68,914
|
|
42,556
|
|
83,368
|
|
|||
|
Investments in and contributions to Lennar Multifamily unconsolidated entities
|
(30,759
|
)
|
(22,748
|
)
|
—
|
|
|||
|
Distributions of capital from Lennar Multifamily unconsolidated entities
|
66,941
|
|
38,857
|
|
10,626
|
|
|||
|
Decrease (increase) in Rialto defeasance cash to retire notes payable
|
—
|
|
223,813
|
|
(4,427
|
)
|
|||
|
Receipts of principal payments on Rialto loans receivable
|
24,019
|
|
66,788
|
|
81,648
|
|
|||
|
Proceeds from sales of Rialto real estate owned
|
269,698
|
|
239,215
|
|
183,883
|
|
|||
|
Purchases of commercial mortgage-backed securities bond
|
(8,705
|
)
|
—
|
|
—
|
|
|||
|
Proceeds from sale of commercial mortgage-backed securities bond
|
9,171
|
|
—
|
|
—
|
|
|||
|
Improvements to Rialto real estate owned
|
(14,278
|
)
|
(9,407
|
)
|
(13,945
|
)
|
|||
|
Purchases of loans receivables
|
—
|
|
(5,450
|
)
|
—
|
|
|||
|
Purchases of Lennar Homebuilding investments available-for-sale
|
(21,274
|
)
|
(28,708
|
)
|
(11,403
|
)
|
|||
|
Proceeds from sales of Lennar Homebuilding investments available-for-sale
|
51,934
|
|
5,906
|
|
14,486
|
|
|||
|
Acquisitions, net of cash acquired
|
(5,489
|
)
|
(5,623
|
)
|
—
|
|
|||
|
Increase in Rialto loans held-for-investment, net
|
(7,000
|
)
|
—
|
|
—
|
|
|||
|
Decrease (increase) in Lennar Financial Services loans held-for-investment, net
|
1,102
|
|
(730
|
)
|
2,919
|
|
|||
|
Purchases of Lennar Financial Services investment securities
|
(40,627
|
)
|
(30,333
|
)
|
(51,138
|
)
|
|||
|
Proceeds from maturities of Lennar Financial Services investments securities
|
38,910
|
|
30,146
|
|
34,232
|
|
|||
|
Net cash provided by investing activities
|
438,359
|
|
689,249
|
|
245,291
|
|
|||
See accompanying notes to consolidated financial statements.
77
LENNAR CORPORATION AND SUBSIDIARIES
CONSOLIDATED STATEMENTS OF CASH FLOWS—(Continued)
Years Ended
November 30, 2014
,
2013
and
2012
|
2014
|
2013
|
2012
|
|||||||
|
|
(Dollars in thousands)
|
||||||||
|
Cash flows from financing activities:
|
|||||||||
|
Net borrowings (repayments) under Lennar Financial Services debt
|
$
|
324,281
|
|
(83,828
|
)
|
47,860
|
|
||
|
Net borrowings under Rialto warehouse repurchase facilities
|
65,254
|
|
76,017
|
|
—
|
|
|||
|
Proceeds from Lennar Homebuilding senior notes
|
850,500
|
|
500,000
|
|
750,000
|
|
|||
|
Proceeds from Lennar Homebuilding convertible senior notes
|
—
|
|
—
|
|
50,000
|
|
|||
|
Proceeds from Rialto senior notes
|
104,525
|
|
250,000
|
|
—
|
|
|||
|
Proceeds from Rialto structured notes
|
94,444
|
|
—
|
|
—
|
|
|||
|
Debt issuance costs of senior notes and convertible senior notes
|
(9,989
|
)
|
(12,935
|
)
|
(9,118
|
)
|
|||
|
Redemption and partial redemption of senior notes
|
(250,000
|
)
|
(63,751
|
)
|
(210,862
|
)
|
|||
|
Principal payments on Rialto structured notes
|
(36,509
|
)
|
—
|
|
—
|
|
|||
|
Principal repayments on Rialto notes payable
|
(39,370
|
)
|
(471,255
|
)
|
(191,221
|
)
|
|||
|
Proceeds from other borrowings
|
34,424
|
|
92,596
|
|
41,500
|
|
|||
|
Principal payments on other borrowings
|
(299,713
|
)
|
(287,359
|
)
|
(97,891
|
)
|
|||
|
Exercise of land option contracts from an unconsolidated land investment venture
|
(1,540
|
)
|
(28,869
|
)
|
(50,396
|
)
|
|||
|
Receipts related to noncontrolling interests
|
12,859
|
|
8,236
|
|
1,659
|
|
|||
|
Payments related to noncontrolling interests
|
(155,625
|
)
|
(201,655
|
)
|
(480
|
)
|
|||
|
Excess tax benefits from share-based awards
|
7,497
|
|
10,148
|
|
10,814
|
|
|||
|
Common stock:
|
|||||||||
|
Issuances
|
13,599
|
|
34,114
|
|
32,174
|
|
|||
|
Repurchases
|
(20,424
|
)
|
(12,320
|
)
|
(17,149
|
)
|
|||
|
Dividends
|
(32,775
|
)
|
(30,912
|
)
|
(30,394
|
)
|
|||
|
Net cash provided by (used in) financing activities
|
661,438
|
|
(221,773
|
)
|
326,496
|
|
|||
|
Net increase (decrease) in cash and cash equivalents
|
311,309
|
|
(340,238
|
)
|
147,139
|
|
|||
|
Cash and cash equivalents at beginning of year
|
970,505
|
|
1,310,743
|
|
1,163,604
|
|
|||
|
Cash and cash equivalents at end of year
|
$
|
1,281,814
|
|
970,505
|
|
1,310,743
|
|
||
|
Summary of cash and cash equivalents:
|
|||||||||
|
Lennar Homebuilding
|
$
|
885,729
|
|
695,424
|
|
1,146,302
|
|
||
|
Lennar Financial Services
|
90,010
|
|
73,066
|
|
58,566
|
|
|||
|
Rialto
|
303,889
|
|
201,496
|
|
105,310
|
|
|||
|
Lennar Multifamily
|
2,186
|
|
519
|
|
565
|
|
|||
|
$
|
1,281,814
|
|
970,505
|
|
1,310,743
|
|
|||
|
Supplemental disclosures of cash flow information:
|
|||||||||
|
Cash paid for interest, net of amounts capitalized
|
$
|
68,366
|
|
112,694
|
|
108,879
|
|
||
|
Cash paid for income taxes, net
|
$
|
202,374
|
|
11,433
|
|
26,687
|
|
||
|
Supplemental disclosures of non-cash investing and financing activities:
|
|||||||||
|
Lennar Homebuilding and Lennar Multifamily:
|
|||||||||
|
Purchases of inventories, land under development and other assets financed by sellers
|
$
|
129,881
|
|
167,134
|
|
89,063
|
|
||
|
Non-cash contributions to Lennar Homebuilding unconsolidated entities
|
$
|
10,844
|
|
227,243
|
|
720
|
|
||
|
Inventory acquired in satisfaction of other assets including investments available-for-sale
|
$
|
—
|
|
—
|
|
103,114
|
|
||
|
Non-cash purchases of investments available-for-sale
|
$
|
—
|
|
—
|
|
12,520
|
|
||
|
Non-cash reduction of equity due to purchase of noncontrolling interest
|
$
|
—
|
|
101,550
|
|
—
|
|
||
|
Non-cash purchase of noncontrolling interests
|
$
|
—
|
|
63,500
|
|
—
|
|
||
|
Non-cash contributions to Lennar Multifamily unconsolidated entities
|
$
|
95,288
|
|
59,555
|
|
13,674
|
|
||
|
Rialto:
|
|||||||||
|
Real estate owned acquired in satisfaction/partial satisfaction of loans receivable
|
$
|
57,390
|
|
70,237
|
|
183,911
|
|
||
|
Real estate owned acquired in bargain purchase acquisition
|
$
|
—
|
|
31,818
|
|
—
|
|
||
|
Net liabilities assumed in bargain purchase acquisition
|
$
|
—
|
|
6,200
|
|
—
|
|
||
|
Non-cash acquisition of Servicer Provider
|
$
|
8,317
|
|
—
|
|
—
|
|
||
|
Reductions in loans receivable from deficiency settlements
|
$
|
—
|
|
619
|
|
3,068
|
|
||
|
Lennar Financial Services:
|
|||||||||
|
Purchase of mortgage servicing rights financed by seller
|
$
|
5,697
|
|
—
|
|
—
|
|
||
|
Consolidation/deconsolidation of unconsolidated/consolidated entities, net:
|
|||||||||
|
Inventories
|
$
|
155,021
|
|
—
|
|
—
|
|
||
|
Investments in unconsolidated entities
|
$
|
(30,647
|
)
|
—
|
|
—
|
|
||
|
Other assets
|
$
|
(7,218
|
)
|
—
|
|
—
|
|
||
|
Noncontrolling interests
|
$
|
(117,156
|
)
|
—
|
|
—
|
|
||
78
LENNAR CORPORATION AND SUBSIDIARIES
NOTES TO CONSOLIDATED FINANCIAL STATEMENTS
1. Summary of Significant Accounting Policies
Basis of Consolidation
The accompanying consolidated financial statements include the accounts of Lennar Corporation and all subsidiaries, partnerships and other entities in which Lennar Corporation has a controlling interest and VIEs (see Note 16) in which Lennar Corporation is deemed the primary beneficiary (the “Company”). The Company’s investments in both unconsolidated entities in which a significant, but less than controlling, interest is held and in VIEs in which the Company is not deemed to be the primary beneficiary are accounted for by the equity method. All intercompany transactions and balances have been eliminated in consolidation.
Use of Estimates
The preparation of financial statements in conformity with accounting principles generally accepted in the United States of America (“GAAP”) requires management to make estimates and assumptions that affect the amounts reported in the consolidated financial statements and accompanying notes. Actual results could differ from those estimates.
Revenue Recognition
Revenues from sales of homes are recognized when the sales are closed and title passes to the new homeowner, the new homeowner’s initial and continuing investment is adequate to demonstrate a commitment to pay for the home, the new homeowner’s receivable is not subject to future subordination and the Company does not have a substantial continuing involvement with the new home. Revenues from sales of land are recognized when a significant down payment is received, the earnings process is complete, title passes and collectability of the receivable is reasonably assured. See Lennar Financial Services, Rialto and Lennar Multifamily within this Note for disclosure of other revenue recognition policies related to those segments.
Advertising Costs
The Company expenses advertising costs as incurred. Advertising costs were
$45.2 million
,
$31.9 million
and
$33.0 million
for the years ended
November 30, 2014
,
2013
and
2012
, respectively.
Share-Based Payments
The Company has share-based awards outstanding under the 2007 Equity Incentive Plan (the "Plan"), which provides for the granting of stock options, stock appreciation rights, restricted common stock (“nonvested shares”) and other shared based awards to officers, associates and directors. The exercise prices of stock options may not be less than the market value of the common stock on the date of the grant. Exercises are permitted in installments determined when options are granted. Each stock option will expire on a date determined at the time of the grant, but not more than
ten
years after the date of the grant. The Company accounts for stock option awards and nonvested share awards granted under the Plan based on the estimated grant date fair value.
Cash and Cash Equivalents
The Company considers all highly liquid investments purchased with original maturities of three months or less to be cash equivalents. Due to the short maturity period of cash equivalents, the carrying amounts of these instruments approximate their fair values. Cash and cash equivalents as of
November 30, 2014
and
2013
included
$263.2 million
and
$172.3 million
, respectively, of cash held in escrow for approximately
three
days.
Restricted Cash
Lennar Homebuilding restricted cash consists of customer deposits on home sales held in restricted accounts until title transfers to the homebuyer, as required by the state and local governments in which the homes were sold, as well as funds on deposit to secure and support performance obligations. Rialto restricted cash consists of cash held in escrow by the Company's loan servicer provider on behalf of customers and lenders and is disbursed in accordance with agreements between transacting parties.
79
LENNAR CORPORATION AND SUBSIDIARIES
NOTES TO CONSOLIDATED FINANCIAL STATEMENTS—(Continued)
Inventories
Finished homes and construction in progress are included within inventories. Inventories are stated at cost unless the inventory within a community is determined to be impaired, in which case the impaired inventory is written down to fair value. Inventory costs include land, land development and home construction costs, real estate taxes, deposits on land purchase contracts and interest related to development and construction. Construction overhead and selling expenses are expensed as incurred. Homes held-for-sale are classified as inventories until delivered. Land, land development, amenities and other costs are accumulated by specific area and allocated to homes within the respective areas. The Company reviews its inventory for indicators of impairment by evaluating each community during each reporting period. The inventory within each community is categorized as finished homes and construction in progress or land under development based on the development state of the community. There were
622
and
535
active communities, excluding unconsolidated entities, as of
November 30, 2014
and
2013
, respectively. If the undiscounted cash flows expected to be generated by a community are less than its carrying amount, an impairment charge is recorded to write down the carrying amount of such community to its estimated fair value.
In conducting its review for indicators of impairment on a community level, the Company evaluates, among other things, the margins on homes that have been delivered, margins on homes under sales contracts in backlog, projected margins with regard to future home sales over the life of the community, projected margins with regard to future land sales and the estimated fair value of the land itself. The Company pays particular attention to communities in which inventory is moving at a slower than anticipated absorption pace and communities whose average sales price and/or margins are trending downward and are anticipated to continue to trend downward. From this review, the Company identifies communities whose carrying values exceed their undiscounted cash flows.
The Company estimates the fair value of its communities using a discounted cash flow model. The projected cash flows for each community are significantly impacted by estimates related to market supply and demand, product type by community, homesite sizes, sales pace, sales prices, sales incentives, construction costs, sales and marketing expenses, the local economy, competitive conditions, labor costs, costs of materials and other factors for that particular community. Every division evaluates the historical performance of each of its communities as well as current trends in the market and economy impacting the community and its surrounding areas. These trends are analyzed for each of the estimates listed above. For example, during the downturn in the housing market, the Company found ways to reduce its construction costs in many communities, and this reduction in construction costs in addition to changes in product type in many communities impacted future estimated cash flows.
Each of the homebuilding markets in which the Company operates is unique, as homebuilding has historically been a local business driven by local market conditions and demographics. Each of the Company’s homebuilding markets has specific supply and demand relationships reflective of local economic conditions. The Company’s projected cash flows are impacted by many assumptions. Some of the most critical assumptions in the Company’s cash flow model are projected absorption pace for home sales, sales prices and costs to build and deliver homes on a community by community basis.
In order to arrive at the assumed absorption pace for home sales included in the Company’s cash flow model, the Company analyzes its historical absorption pace in the community as well as other comparable communities in the geographical area. In addition, the Company considers internal and external market studies and trends, which generally include, but are not limited to, statistics on population demographics, unemployment rates and availability of competing product in the geographic area where the community is located. When analyzing the Company’s historical absorption pace for home sales and corresponding internal and external market studies, the Company places greater emphasis on more current metrics and trends such as the absorption pace realized in its most recent quarters as well as forecasted population demographics, unemployment rates and availability of competing product. Generally, if the Company notices a variation from historical results over a span of two fiscal quarters, the Company considers such variation to be the establishment of a trend and adjusts its historical information accordingly in order to develop assumptions on the projected absorption pace in the cash flow model for a community.
In order to determine the assumed sales prices included in its cash flow models, the Company analyzes the historical sales prices realized on homes it delivered in the community and other comparable communities in the geographical area as well as the sales prices included in its current backlog for such communities. In addition, the Company considers internal and external market studies and trends, which generally include, but are not limited to, statistics on sales prices in neighboring communities and sales prices on similar products in non-neighboring communities in the geographic area where the community is located. When analyzing its historical sales prices and corresponding market studies, the Company also places greater emphasis on more current metrics and trends such as future forecasted sales prices in neighboring communities as well as future forecasted sales prices for similar products in non-neighboring communities. Generally, if the Company notices a variation from historical results over a span of two fiscal quarters, the Company considers such variation to be the establishment of a
80
LENNAR CORPORATION AND SUBSIDIARIES
NOTES TO CONSOLIDATED FINANCIAL STATEMENTS—(Continued)
trend and adjusts its historical information accordingly in order to develop assumptions on the projected sales prices in the cash flow model for a community.
In order to arrive at the Company’s assumed costs to build and deliver homes, the Company generally assumes a cost structure reflecting contracts currently in place with its vendors adjusted for any anticipated cost reduction initiatives or increases in cost structure. Those costs assumed are used in the cash flow model for the Company’s communities.
Since the estimates and assumptions included in the Company’s cash flow models are based upon historical results and projected trends, they do not anticipate unexpected changes in market conditions or strategies that may lead the Company to incur additional impairment charges in the future.
Using all available information, the Company calculates its best estimate of projected cash flows for each community. While many of the estimates are calculated based on historical and projected trends, all estimates are subjective and change from market to market and community to community as market and economic conditions change. The determination of fair value also requires discounting the estimated cash flows at a rate the Company believes a market participant would determine to be commensurate with the inherent risks associated with the assets and related estimated cash flow streams. The discount rate used in determining each asset’s fair value depends on the community’s projected life and development stage. The Company generally uses a discount rate of approximately
20%
, subject to the perceived risks associated with the community’s cash flow streams relative to its inventory.
The Company estimates the fair value of inventory evaluated for impairment based on market conditions and assumptions made by management at the time the inventory is evaluated, which may differ materially from actual results if market conditions or assumptions change. For example, market deterioration or changes in assumptions may lead the Company to incur additional impairment charges on previously impaired inventory, as well as on inventory not currently impaired but for which indicators of impairment may arise if market deterioration occurs.
For
November 30, 2014
, the Company reviewed its communities for potential indicators of impairments and identified
26
homebuilding communities with
1,774
homesites and a carrying value of
$145.3 million
as having potential indicators of impairment. Of those communities, the Company recorded valuation adjustments of
$2.9 million
on
120
homesites in
one
community with a carrying value of
$8.1 million
.
For
November 30, 2013
, the Company reviewed its communities for potential indicators of impairments and identified
35
homebuilding communities with
1,515
homesites and a carrying value of
$130.5 million
as having potential indicators of impairment. Of those communities, the Company recorded valuation adjustments of
$4.5 million
on
99
homesites in
3
communities with a carrying value of
$16.5 million
.
The table below summarizes the most significant unobservable inputs used in the Company's discounted cash flow model to determine the fair value of its communities for which the Company recorded valuation adjustments during the years ended
November 30, 2014
,
2013
and
2012
:
|
November 30,
|
|||||||||||||||
|
2014
|
2013
|
2012
|
|||||||||||||
|
Unobservable inputs
|
Range
|
Range
|
|||||||||||||
|
Average selling price
|
|
$164,000
|
|
|
$163,000
|
|
-
|
$279,000
|
|
$83,000
|
|
-
|
$340,000
|
||
|
Absorption rate per quarter (homes)
|
12
|
2
|
|
-
|
34
|
1
|
|
-
|
20
|
||||||
|
Discount rate
|
20%
|
20%
|
20%
|
||||||||||||
The Company also has access to land inventory through option contracts, which generally enables the Company to defer acquiring portions of properties owned by third parties and unconsolidated entities until it has determined whether to exercise its option. A majority of the Company’s option contracts require a non-refundable cash deposit or irrevocable letter of credit based on a percentage of the purchase price of the land. The Company’s option contracts are recorded at cost. In determining whether to walk away from an option contract, the Company evaluates the option primarily based upon its expected cash flows from the property under option. If the Company intends to walk away from an option contract, it records a charge to earnings in the period such decision is made for the deposit amount and any related pre-acquisition costs associated with the option contract.
81
LENNAR CORPORATION AND SUBSIDIARIES
NOTES TO CONSOLIDATED FINANCIAL STATEMENTS—(Continued)
Lennar Homebuilding and Lennar Multifamily Investments in Unconsolidated Entities
The Company evaluates its investments in unconsolidated entities for indicators of impairment during each reporting period. A series of operating losses of an investee or other factors may indicate that a decrease in the fair value of the Company’s investment in the unconsolidated entity below its carrying amount has occurred which is other-than-temporary. The amount of impairment recognized is the excess of the investment’s carrying amount over its estimated fair value.
The evaluation of the Company’s investments in unconsolidated entities includes certain critical assumptions made by management: (1) projected future distributions from the unconsolidated entities, (2) discount rates applied to the future distributions and (3) various other factors.
The Company’s assumptions on the projected future distributions from the unconsolidated entities are dependent on market conditions. Specifically, distributions are dependent on cash to be generated from the sale of inventory by the Lennar Homebuilding unconsolidated entities or assets by Lennar Multifamily unconsolidated entities. Such inventory is also reviewed for potential impairment by the unconsolidated entities. The unconsolidated entities generally use a discount rate of approximately
20%
in their reviews for impairment, subject to the perceived risks associated with the community’s cash flow streams relative to its inventory. If a valuation adjustment is recorded by an unconsolidated entity related to its assets, the Company’s proportionate share is reflected in the Company's Lennar Homebuilding or Lennar Multifamily equity in earnings (loss) from unconsolidated entities with a corresponding decrease to its Lennar Homebuilding or Lennar Multifamily investment in unconsolidated entities. In certain instances, the Company may be required to record additional losses relating to its investment in unconsolidated entities, if the Company’s investment in the unconsolidated entity, or a portion thereof, is deemed to be other than temporarily impaired. These losses are included in Lennar Homebuilding other income, net or in Lennar Multifamily costs and expenses.
Additionally, the Company considers various qualitative factors to determine if a decrease in the value of an investment is other-than-temporary. These factors include age of the venture, intent and ability for the Company to recover its investment in the entity, financial condition and long-term prospects of the unconsolidated entity, short-term liquidity needs of the unconsolidated entity, trends in the general economic environment of the land, entitlement status of the land held by the unconsolidated entity, overall projected returns on investment, defaults under contracts with third parties (including bank debt), recoverability of the investment through future cash flows and relationships with the other partners and banks. If the Company believes that the decline in the fair value of the investment is temporary, then no impairment is recorded.
The Company tracks its share of cumulative earnings and distributions of its joint ventures (“JVs”). For purposes of classifying distributions received from JVs in the Company’s consolidated statements of cash flows, cumulative distributions are treated as returns
on
capital to the extent of cumulative earnings and included in the Company’s consolidated statements of cash flows as operating activities. Cumulative distributions in excess of the Company’s share of cumulative earnings are treated as returns of capital and included in the Company’s consolidated statements of cash flows as investing activities.
Consolidation of Variable Interest Entities
GAAP requires the consolidation of VIEs in which an enterprise has a controlling financial interest. A controlling financial interest will have both of the following characteristics: (a) the power to direct the activities of a VIE that most significantly impact the VIE’s economic performance and (b) the obligation to absorb losses of the VIE that could potentially be significant to the VIE or the right to receive benefits from the VIE that could potentially be significant to the VIE.
The Company’s variable interest in VIEs may be in the form of (1) equity ownership, (2) contracts to purchase assets, (3) management and development agreements between the Company and a VIE, (4) loans provided by the Company to a VIE or other partner and/or (5) guarantees provided by members to banks and other third parties. The Company examines specific criteria and uses its judgment when determining if it is the primary beneficiary of a VIE. Factors considered in determining whether the Company is the primary beneficiary include risk and reward sharing, experience and financial condition of other partner(s), voting rights, involvement in day-to-day capital and operating decisions, representation on a VIE’s executive committee, existence of unilateral kick-out rights or voting rights, level of economic disproportionality, if any, between the Company and the other partner(s) and contracts to purchase assets from VIEs. The determination whether an entity is a VIE and, if so, whether the Company is the primary beneficiary may require it to exercise significant judgment.
Generally, all major decision making in the Company’s joint ventures is shared among all partners. In particular, business plans and budgets are generally required to be unanimously approved by all partners. Usually, management and other fees earned by the Company are nominal and believed to be at market and there is no significant economic disproportionality between the Company and other partners. Generally, the Company purchases less than a majority of the JV’s assets and the purchase prices under its option contracts are believed to be at market.
82
LENNAR CORPORATION AND SUBSIDIARIES
NOTES TO CONSOLIDATED FINANCIAL STATEMENTS—(Continued)
Generally, Lennar Homebuilding unconsolidated entities become VIEs and consolidate when the other partner(s) lack the intent and financial wherewithal to remain in the entity. As a result, the Company continues to fund operations and debt paydowns through partner loans or substituted capital contributions.
Operating Properties and Equipment
Operating properties and equipment are recorded at cost and are included in other assets in the consolidated balance sheets. The assets are depreciated over their estimated useful lives using the straight-line method. At the time operating properties and equipment are disposed of, the asset and related accumulated depreciation are removed from the accounts and any resulting gain or loss is credited or charged to earnings. The estimated useful life for operating properties is
thirty years
, for furniture, fixtures and equipment is
two
to
ten
years and for leasehold improvements is
five
years or the life of the lease, whichever is shorter. Operating properties are reviewed for possible impairment if there are indicators that their carrying amounts are not recoverable.
Investment Securities
Investment securities are classified as available-for-sale unless they are classified as trading or held-to-maturity. Securities classified as trading are carried at fair value and unrealized holding gains and losses are recorded in earnings. Available-for-sale securities are recorded at fair value. Any unrealized holding gains or losses on available-for-sale securities are reported as accumulated other comprehensive gain or loss, which is a separate component of stockholders’ equity, net of tax, until realized. Securities classified as held-to-maturity are carried at amortized cost because they are purchased with the intent and ability to hold to maturity.
At
November 30, 2014
and
2013
, the Lennar Homebuilding segment had available-for-sale securities totaling
$0.5 million
and
$40.0 million
, respectively, included in Lennar Homebuilding other assets, which consist primarily of investments in community development district bonds that mature in
2039
. Certain of these bonds are in default by the borrower, which may allow the Company to foreclose on the underlying real estate collateral. Unrealized holding gain (losses) during the years ended
November 30, 2014
and
2013
were deferred as a result of the Company's continuing involvement in the underlying collateral, thus no gains were recognized during the years ended
November 30, 2014
and
2013
. At
November 30, 2014
and
2013
, the Lennar Financial Services segment had investment securities classified as held-to-maturity totaling
$45.0 million
and
$62.3 million
, respectively. The Lennar Financial Services held-to-maturity securities consist mainly of corporate bonds, certificates of deposit and U.S. treasury securities that mature at various dates within a year. In addition, at
November 30, 2014
and
2013
, the Rialto segment had investment securities classified as held-to-maturity totaling
$17.3 million
and
$16.1 million
, respectively. The Rialto segment held-to-maturity securities consist of commercial mortgage-backed securities (“CMBS”). At both
November 30, 2014
and
2013
, the Company had
no
investment securities classified as trading.
Goodwill
Goodwill represents the excess of the purchase price over the fair value of the net assets acquired in business combinations. Evaluating goodwill for impairment involves the determination of the fair value of the Company’s reporting units in which the Company has recorded goodwill. A reporting unit is a component of an operating segment for which discrete financial information is available and reviewed by the Company’s management on a regular basis. Inherent in the determination of fair value of the Company’s reporting units are certain estimates and judgments, including the interpretation of current economic indicators and market valuations as well as the Company’s strategic plans with regard to its operations. To the extent additional information arises or the Company’s strategies change, it is possible that the Company’s conclusion regarding goodwill impairment could change, which could have an effect on the Company’s financial position and results of operations.
The Company reviews goodwill annually (or whenever indicators of impairment exist) for impairment. The Company evaluated the carrying value of the Lennar Financial Services and Rialto segments' goodwill in the fourth quarter of
2014
. The Company estimated the fair value of Lennar Financial Services title and mortgage operations and Rialto operations based on the income approach and concluded that a goodwill impairment was not required for
2014
. As of both
November 30, 2014
and
2013
, there were
no
significant identifiable intangible assets, other than goodwill.
At both
November 30, 2014
and
2013
, accumulated goodwill impairments totaled
$217.4 million
, which includes
$27.2 million
and
$190.2 million
of previous Lennar Financial Services and Lennar Homebuilding goodwill impairments, respectively. At
November 30, 2014
, goodwill was
$44.3 million
, of which
$38.9 million
related to the Lennar Financial Services segment and
$5.4 million
related to the Rialto segment. At November 30, 2013, goodwill was
$34.0 million
, all of which related to the Lennar Financial Services segment. The changes in goodwill were due to the acquisitions of a Colorado-based mortgage company by Lennar Financial Services and of the
100%
acquisition of the loan servicing business segment of a financial services company (the "Servicer Provider") in which a subsidiary of Rialto had an approximately
5%
investment at the time of acquisition.
83
LENNAR CORPORATION AND SUBSIDIARIES
NOTES TO CONSOLIDATED FINANCIAL STATEMENTS—(Continued)
Interest and Real Estate Taxes
Interest and real estate taxes attributable to land and homes are capitalized as inventory costs while they are being actively developed. Interest related to homebuilding and land, including interest costs relieved from inventories, is included in cost of homes sold and cost of land sold. Interest expense related to the Lennar Financial Services operations is included in its costs and expenses.
During the years ended
November 30, 2014
,
2013
and
2012
, interest incurred by the Company’s homebuilding operations related to homebuilding debt was
$273.4 million
,
$261.5 million
and
$222.0 million
, respectively; interest capitalized into inventories was
$236.9 million
,
$167.6 million
and
$127.7 million
, respectively.
Interest expense was included in cost of homes sold, cost of land sold and other interest expense as follows:
|
Years Ended November 30,
|
|||||||||
|
(In thousands)
|
2014
|
2013
|
2012
|
||||||
|
Interest expense in cost of homes sold
|
$
|
161,371
|
|
117,781
|
|
85,125
|
|
||
|
Interest expense in cost of land sold
|
3,617
|
|
2,562
|
|
1,907
|
|
|||
|
Other interest expense
|
36,551
|
|
93,913
|
|
94,353
|
|
|||
|
Total interest expense
|
$
|
201,539
|
|
214,256
|
|
181,385
|
|
||
Income Taxes
The Company records income taxes under the asset and liability method, whereby deferred tax assets and liabilities are recognized based on the future tax consequences attributable to temporary differences between the financial statement carrying amounts of existing assets and liabilities and their respective tax bases and attributable to operating loss and tax credit carryforwards. Deferred tax assets and liabilities are measured using enacted tax rates expected to apply in the years in which the temporary differences are expected to be recovered or paid. The effect on deferred tax assets and liabilities of a change in tax rates is recognized in earnings in the period when the changes are enacted. Interest related to unrecognized tax benefits is recognized in the financial statements as a component of income tax expense.
A reduction of the carrying amounts of deferred tax assets by a valuation allowance is required if, based on the available evidence, it is more likely than not that such assets will not be realized. Accordingly, the need to establish valuation allowances for deferred tax assets is assessed each reporting period by the Company based on the consideration of all available positive and negative evidence using a "more-likely-than-not" standard with respect to whether deferred tax assets will be realized. This assessment considers, among other matters, the nature, frequency and severity of current and cumulative losses, actual earnings, forecasts of future profitability, the duration of statutory carryforward periods, the Company’s experience with loss carryforwards not expiring unused and tax planning alternatives.
Based on the analysis of positive and negative evidence, the Company believed that there was enough positive evidence for the Company to conclude that it was more likely than not that the Company would realize the majority of its deferred tax assets. As of
November 30, 2014
and
2013
, the Company's net deferred tax assets included a valuation allowance of
$8.0 million
and
$12.7 million
, respectively. See Note 10 for additional information.
84
LENNAR CORPORATION AND SUBSIDIARIES
NOTES TO CONSOLIDATED FINANCIAL STATEMENTS—(Continued)
Product Warranty
Warranty and similar reserves for homes are established at an amount estimated to be adequate to cover potential costs for materials and labor with regard to warranty-type claims expected to be incurred subsequent to the delivery of a home. Reserves are determined based on historical data and trends with respect to similar product types and geographical areas. The Company regularly monitors the warranty reserve and makes adjustments to its pre-existing warranties in order to reflect changes in trends and historical data as information becomes available. Warranty reserves are included in Lennar Homebuilding other liabilities in the consolidated balance sheets. The activity in the Company’s warranty reserve was as follows:
|
November 30,
|
||||||
|
(In thousands)
|
2014
|
2013
|
||||
|
Warranty reserve, beginning of period
|
$
|
102,580
|
|
84,188
|
|
|
|
Warranties issued
|
60,856
|
|
50,695
|
|
||
|
Adjustments to pre-existing warranties from changes in estimates (1)
|
12,685
|
|
19,687
|
|
||
|
Payments
|
(60,194
|
)
|
(51,990
|
)
|
||
|
Warranty reserve, end of period
|
$
|
115,927
|
|
102,580
|
|
|
|
(1)
|
The adjustments to pre-existing warranties from changes in estimates during the year ended
November 30, 2014
and
2013
primarily related to specific claims related to certain of our homebuilding communities and other adjustments.
|
Self-Insurance
Certain insurable risks such as construction defects, general liability, medical and workers’ compensation are self-insured by the Company up to certain limits. Undiscounted accruals for claims under the Company’s self-insurance program are based on claims filed and estimates for claims incurred but not yet reported. The Company’s self-insurance reserve as of
November 30, 2014
and
2013
was
$103.2 million
and
$108.7 million
, respectively, of which
$69.3 million
and
$74.5 million
, respectively, was included in Lennar Financial Services’ other liabilities in the respective years. Amounts incurred in excess of the Company's self-insurance occurrence or aggregate retention limits are covered by insurance up to the Company's purchased coverage levels. The Company's insurance policies are maintained with highly-rated underwriters for whom the Company believes counterparty default risk is not significant.
Earnings per Share
Basic earnings per share is computed by dividing net earnings attributable to common stockholders by the weighted average number of common shares outstanding for the period. Diluted earnings per share reflects the potential dilution that could occur if securities or other contracts to issue common stock were exercised or converted into common stock or resulted in the issuance of common stock that then shared in earnings of the Company.
All outstanding nonvested shares that contain non-forfeitable rights to dividends or dividend equivalents that participate in undistributed earnings with common stock are considered participating securities and are included in computing earnings per share pursuant to the two-class method. The two-class method is an earnings allocation formula that determines earnings per share for each class of common stock and participating securities according to dividends or dividend equivalents and participation rights in undistributed earnings. The Company’s restricted common stock (“nonvested shares”) are considered participating securities.
Lennar Financial Services
Revenue Recognition
Title premiums on policies issued directly by the Company are recognized as revenue on the effective date of the title policies and escrow fees and loan origination revenues are recognized at the time the related real estate transactions are completed, usually upon the close of escrow. Revenues from title policies issued by independent agents are recognized as revenue when notice of issuance is received from the agent, which is generally when cash payment is received by the Company. Expected gains and losses from the sale of loans and their related servicing rights are included in the measurement of all written loan commitments that are accounted for at fair value through earnings at the time of commitment. Interest income on loans held-for-sale and loans held-for-investment is recognized as earned over the terms of the mortgage loans based on the contractual interest rates.
85
LENNAR CORPORATION AND SUBSIDIARIES
NOTES TO CONSOLIDATED FINANCIAL STATEMENTS—(Continued)
Loans Held-for-Sale
Loans held-for-sale by the Lennar Financial Services segment are carried at fair value and changes in fair value are reflected in earnings. Premiums and discounts recorded on these loans are presented as an adjustment to the carrying amount of the loans and are not amortized. Management believes carrying loans held-for-sale at fair value improves financial reporting by mitigating volatility in reported earnings caused by measuring the fair value of the loans and the derivative instruments used to economically hedge them without having to apply complex hedge accounting provisions.
In addition, the Lennar Financial Services segment recognizes the fair value of its rights to service a mortgage loan as revenue upon entering into an interest rate lock loan commitment with a borrower. The fair value of these servicing rights is included in the Company’s loans held-for-sale and Financial Services other assets as of
November 30, 2014
and
2013
. Fair value of the servicing rights is determined based on values in the Company’s servicing sales contracts. At
November 30, 2014
and
2013
, loans held-for-sale, all of which were accounted for at fair value, had an aggregate fair value of
$738.4 million
and
$414.2 million
, respectively, and an aggregate outstanding principal balance of
$706.0 million
and
$399.0 million
at
November 30, 2014
and
2013
, respectively.
Provision for Losses
Substantially all of the loans the Lennar Financial Services segment originates are sold within a short period in the secondary mortgage market on a servicing released, non-recourse basis. After the loans are sold, the Company retains potential liability for possible claims by purchasers that it breached certain limited industry-standard representations and warranties in the loan sale agreement. During recent years there has been an increased industry-wide effort by purchasers to defray their losses by purporting to have found inaccuracies related to sellers’ representations and warranties in particular loan sale agreements. The Company’s mortgage operations have established reserves for possible losses associated with mortgage loans previously originated and sold to investors. The Company establishes reserves for such possible losses based upon, among other things, an analysis of repurchase requests received, an estimate of potential repurchase claims not yet received and actual past repurchases and losses through the disposition of affected loans, as well as previous settlements. While the Company believes that it has adequately reserved for known losses and projected repurchase requests, given the volatility in the mortgage industry and the uncertainty regarding the ultimate resolution of these claims, if either actual repurchases or the losses incurred resolving those repurchases exceed the Company’s expectations, additional recourse expense may be incurred. Loan origination liabilities are included in Lennar Financial Services’ liabilities in the consolidated balance sheets. The activity in the Company’s loan origination liabilities was as follows:
|
November 30,
|
||||||
|
(In thousands)
|
2014
|
2013
|
||||
|
Loan origination liabilities, beginning of year
|
$
|
9,311
|
|
7,250
|
|
|
|
Provision for losses (1)
|
2,908
|
|
2,427
|
|
||
|
Payments/settlements
|
(401
|
)
|
(366
|
)
|
||
|
Loan origination liabilities, end of year
|
$
|
11,818
|
|
9,311
|
|
|
|
(1)
|
Provision for losses included adjustments to pre-existing provisions for losses from changes in estimates. For the year ended November 30, 2013, provision for losses included an adjustment for additional repurchase requests that were received beyond the estimated provision that was recorded due to an increase in potential issues identified by certain investors.
|
The Lennar Financial Services segment also provides an allowance for loan losses. The provision recorded and the adequacy of the related allowance is determined by management’s continuing evaluation of the loan portfolio in light of past loan loss experience, credit worthiness and nature of underlying collateral, present economic conditions and other factors considered relevant by the Company’s management. Anticipated changes in economic factors, which may influence the level of the allowance, are considered in the evaluation by the Company’s management when the likelihood of the changes can be reasonably determined. While the Company’s management uses the best information available to make such evaluations, future adjustments to the allowance may be necessary as a result of future economic and other conditions that may be beyond management’s control.
Loans Held-for-Investment, Net
Loans for which the Company has the positive intent and ability to hold to maturity consist of mortgage loans carried at lower of cost, net of unamortized discounts or fair value on a nonrecurring basis. Discounts are amortized over the estimated lives of the loans using the interest method.
For Lennar Financial Services loans held-for-investment, net, a loan is deemed impaired when, based on current information and events, it is probable that the Company will be unable to collect all amounts due according to the contractual
86
LENNAR CORPORATION AND SUBSIDIARIES
NOTES TO CONSOLIDATED FINANCIAL STATEMENTS—(Continued)
terms of the loan agreement. Interest income is not accrued or recognized on impaired loans unless payment is received. Impaired loans are written-off if and when the loan is no longer secured by collateral. The total unpaid principal balance of the impaired loans was as follows:
|
November 30,
|
||||||
|
(In thousands)
|
2014
|
2013
|
||||
|
Impaired loans unpaid principal balance
|
$
|
7,576
|
|
7,897
|
|
|
|
Valuation allowance
|
(3,730
|
)
|
(3,891
|
)
|
||
|
Investment in impaired loans
|
$
|
3,846
|
|
4,006
|
|
|
The average recorded investment in impaired loans totaled approximately
$3.9 million
and
$3.5 million
, for the years ended
November 30, 2014
and
2013
, respectively.
Derivative Financial Instruments
The Lennar Financial Services segment, in the normal course of business, uses derivative financial instruments to reduce its exposure to fluctuations in mortgage-related interest rates. The segment uses mortgage-backed securities (“MBS”) forward commitments, option contracts and investor commitments to protect the value of fixed rate-locked loan commitments and loans held-for-sale from fluctuations in mortgage-related interest rates. These derivative financial instruments are carried at fair value with the changes in fair value included in Lennar Financial Services revenues.
Rialto
Management Fees Revenue
The Rialto segment provides services to a variety of legal entities and investment vehicles such as funds, joint ventures, co-invests, and other private equity structures to manage their respective investments. As a result, Rialto earns and receives management fees, underwriting fees and due diligence fees. These fees related to the Rialto segment are included in Rialto revenues and are recorded over the period in which the services are performed, fees are determinable and collectability is reasonably assured. Rialto receives investment management fees from investment vehicles based on 1) a percentage of committed capital during the commitment period and after the commitment period ends and 2) a percentage of invested capital less the portion of such invested capital utilized to acquire investments that have been sold (in whole or in part) or liquidated. Fees earned for underwriting and due diligence services are based on actual costs incurred. In certain situations, Rialto may earn additional fees when the return on assets managed exceeds contractually established thresholds. Such revenue is only booked when the contract terms are met, the contract is at, or near, completion and the amounts are known and collectability is reasonably assured. Since such revenue is recognized at the end of the life of the investment vehicle, after substantially all of the assets have been sold and investment gains and losses realized, the possibility of claw backs is limited.
Loans Receivable – Revenue Recognition
All of the acquired loans for which (1) there was evidence of credit quality deterioration since origination and (2) for which it was deemed probable that the Company would be unable to collect all contractually required principal and interest payments were accounted for under ASC 310-30,
Loans and Debt Securities Acquired with Deteriorated Credit Quality
, (“ASC 310-30”). For loans accounted for under ASC 310-30, management determined upon acquisition the loan’s value based on due diligence regarding each of the loans, the underlying properties and the borrowers. The Company determined fair value by discounting the cash flows expected to be collected adjusted for factors that a market participant would consider when determining fair value. Factors considered in the valuation were projected cash flows for the loans, type of loan and related collateral, classification status and current discount rates. Since the estimates are based on projections, all estimates are subjective and can change due to unexpected changes in economic conditions or loan performance.
Under ASC 310-30, loans were pooled together according to common risk characteristics. A pool is then accounted for as a single asset with a single component interest rate and as aggregate expectation of cash flows. The excess of the cash flows expected to be collected over the cost of the loans acquired is referred to as the accretable yield and is recognized in interest income over the remaining life of the loans using the effective yield method. The difference between the contractually required payments and the cash flows expected to be collected at acquisition is referred to as the nonaccretable difference. This difference is neither accreted into income nor recorded on our consolidated balance sheets. Changes in the expected cash flows of loans receivable from the date of acquisition will either impact the accretable yield or result in a charge to the provision for loan losses in the period in which the changes become probable. Prepayments are treated as a reduction of cash flows expected to be collected and a reduction of contractually required payments such that the nonaccretable difference is not affected. Subsequent significant decreases to the expected cash flows will generally result in a charge to the provision for loan losses,
87
LENNAR CORPORATION AND SUBSIDIARIES
NOTES TO CONSOLIDATED FINANCIAL STATEMENTS—(Continued)
resulting in an increase to the allowance for loan losses, and a reclassification from accretable yield to nonaccretable difference. Subsequent probable and significant increases in the cash flows will result in a recovery of any previously recorded allowance for loan losses, to the extent applicable, and a reclassification from nonaccretable difference to accretable yield. Amounts related to the ASC 310-30 loans are estimates and may change as we obtain additional information related to the respective loans and the inherent uncertainty associated with estimating the amount and timing of the expected cash flows associated with distressed residential and commercial real estate loans. The timing and amount of expected cash flows and related accretable yield can also be impacted by disposal of loans, loan payoffs or expected foreclosures, which result in removal of the loans from the pools. Since the cash flows are based on projections, they are subjective and can change due to unexpected changes in economic conditions and loan performance. During the fourth quarter of 2014, in an effort to better reflect the performance of the loan portfolios, the Company changed from recording accretable yield income on a loan pool basis to recording income on a cost recovery basis per loan as expected cash flows on the remaining loan portfolios could no longer be reasonably estimated. At
November 30, 2014
, these loans were classified as nonaccrual loans.
Nonaccrual Loans- Revenue Recognition & Impairment
At
November 30, 2014
and
2013
, there were loans receivable with a carrying value of
$130.1 million
and
$8.3 million
, respectively, for which interest income was not being recognized as they were classified as nonaccrual. When forecasted principal and interest cannot be reasonably estimated at the loan acquisition date, management classifies the loan as nonaccrual and accounts for these assets in accordance with ASC 310-10,
Receivable
, (“ASC 310-10”). When a loan is classified as nonaccrual, any subsequent cash receipt is accounted for using the cost recovery method. In accordance with ASC 310-10, a loan is considered impaired when based on current information and events, it is probable that all amounts due according to the contractual terms of the loan agreement will not be collected.
A provision for loan losses is recognized when the recorded investment in the loan is in excess of its fair value. The fair value of the loan is determined by using either the present value of expected future cash flows discounted at the loan’s effective interest rate or the fair value of the collateral less estimated costs to sell.
Real Estate Owned
Real estate owned (“REO”) represents real estate that the Rialto segment has taken control or has effective control of in partial or full satisfaction of loans receivable. At the time of acquisition of a property through foreclosure of a loan, REO is recorded at fair value less estimated costs to sell if classified as held-for-sale or at fair value if classified as held-and-used, which becomes the property’s new basis. The fair values of these assets are determined in part by placing reliance on third-party appraisals of the properties and/or internally prepared analyses of recent offers or prices on comparable properties in the proximate vicinity. The third-party appraisals and internally developed analyses are significantly impacted by the local market economy, market supply and demand, competitive conditions and prices on comparable properties, adjusted for date of sale, location, property size, and other factors. Each REO is unique and is analyzed in the context of the particular market where the property is located. In order to establish the significant assumptions for a particular REO, the Company analyzes historical trends, including trends achieved by the Company's local homebuilding operations, if applicable, and current trends in the market and economy impacting the REO. Using available trend information, the Company then calculates its best estimate of fair value, which can include projected cash flows discounted at a rate the Company believes a market participant would determine to be commensurate with the inherent risks associated with the assets and related estimated cash flow streams. These methods use unobservable inputs to develop fair value for the Company’s REO. Due to the volume and variance of unobservable inputs, resulting from the uniqueness of each of the Company's REO, the Company does not use a standard range of unobservable inputs with respect to its evaluation of REO. However, for operating properties within REO, the Company may also use estimated cash flows multiplied by a capitalization rate to determine the fair value of the property. For the year ended
November 30, 2014
, the capitalization rates used to estimate fair value ranged from
8%
to
12%
and varied based on the location of the asset, asset type and occupancy rates for the operating properties.
Changes in economic factors, consumer demand and market conditions, among other things, could materially impact estimates used in the third-party appraisals and/or internally prepared analyses of recent offers or prices on comparable properties. Thus, estimates can differ significantly from the amounts ultimately realized by the Rialto segment from disposition of these assets. The amount by which the recorded investment in the loan is less than the REO’s fair value (net of estimated cost to sell if held-for-sale), is recorded as an unrealized gain upon foreclosure in the Company’s consolidated statement of operations. The amount by which the recorded investment in the loan is greater than the REO’s fair value (net of estimated cost to sell if held-for-sale) is generally recorded as a provision for loan losses in the Company’s consolidated statement of operations.
At times, the Company may foreclose on a loan from an accrual loan pool in which the removal of the loan does not cause an overall decrease in the expected cash flows of the loan pool, and as such, no provision for loan losses is required to be
88
LENNAR CORPORATION AND SUBSIDIARIES
NOTES TO CONSOLIDATED FINANCIAL STATEMENTS—(Continued)
recorded. However, the amount by which the recorded investment in the loan is greater than the REO’s fair value (net of estimated cost to sell if held-for-sale) is recorded as an unrealized loss upon foreclosure.
Additionally, REO includes real estate which Rialto has purchased directly from financial institutions. These REOs are recorded at cost or allocated cost if purchased in a bulk transaction.
Subsequent to obtaining REO via foreclosure or directly from a financial institution, management periodically performs valuations using the methodologies described above such that the real estate is carried at the lower of its carrying value or current fair value, less estimated costs to sell if classified as held-for-sale. Held-and-used assets are tested for recoverability whenever changes in circumstances indicate that the carrying value may not be recoverable, and impairment losses are recorded for any amount by which the carrying value exceeds its fair value. Any subsequent valuation adjustments, operating expenses or income, and gains and losses on disposition of such properties are also recognized in Rialto other income (expense), net. REO assets classified as held-and-used are depreciated using a useful life of forty years for commercial properties and twenty seven and a half years for residential properties. REO assets classified as held-for-sale are not depreciated. Occasionally an asset will require certain improvements to yield a higher return. In accordance with ASC 970-340-25,
Real Estate
, construction costs incurred prior to acquisition or during development of the asset may be capitalized.
Rialto Mortgage Finance - Loans Held-for-Sale
The originated mortgage loans are classified as loans held-for-sale on the consolidated balance sheets and are recorded at fair value. The Company elected the fair value option for Rialto Mortgage Finance's ("RMF's") loans held-for-sale in accordance with ASC 825,
Financial Instruments
, which permits entities to measure various financial instruments and certain other items at fair value on a contract-by-contract basis. Management believes that carrying loans held-for-sale at fair value improves financial reporting by mitigating volatility in reported earnings caused by measuring the fair value of the loans and the derivative instruments, which are also carried at fair value, used to economically hedge them without having to apply complex hedge accounting provisions. Changes in fair values of the loans are reflected in Rialto revenues in the accompanying consolidated statements of operations. Interest income on these loans is calculated based on the interest rate of the loan and is recorded within Rialto revenues in the accompanying consolidated statements of operations. Substantially all of the mortgage loans originated are sold within a short period of time in a securitization on a servicing released, non-recourse basis; although, the Company remains liable for certain limited industry-standard representations and warranties related to loan sales.
Consolidations of Variable Interest Entities
In 2010, the Rialto segment acquired indirectly
40%
managing member equity interests in two limited liability companies (“LLCs”), in partnership with the FDIC. The Company determined that each of the LLCs met the definition of a VIE and that the Company was the primary beneficiary. In accordance with ASC 810-10-65-2,
Consolidations
, (“ASC 810-10-65-2”), the Company identified the activities that most significantly impact the LLCs’ economic performance and determined that it has the power to direct those activities. The economic performance of the LLCs is most significantly impacted by the performance of the LLCs’ portfolios of assets, which consisted primarily of distressed residential and commercial mortgage loans. Thus, the activities that most significantly impact the LLCs’ economic performance are the servicing and disposition of mortgage loans and real estate obtained through foreclosure of loans, restructuring of loans, or other planned activities associated with the monetizing of loans.
The FDIC does not have the unilateral power to terminate the Company’s role in managing the LLCs and servicing the loan portfolios. While the FDIC has the right to prevent certain types of transactions (i.e., bulk sales, selling assets with recourse back to the selling entity, selling assets with representations and warranties and financing the sales of assets without the FDIC’s approval), the FDIC does not have full voting or blocking rights over the LLCs’ activities, making their voting rights protective in nature, not substantive participating voting rights. Other than as described in the preceding sentence, which are not the primary activities of the LLCs, the Company can cause the LLCs to enter into both the disposition and restructuring of loans without any involvement of the FDIC. Additionally, the FDIC has no voting rights with regard to the operation/management of the operating properties that are acquired upon foreclosure of loans (e.g. REO) and no voting rights over the business plans of the LLCs. The FDIC can make suggestions regarding the business plans, but the Company can decide not to follow the FDIC’s suggestions and not to incorporate them in the business plans. Since the FDIC’s voting rights are protective in nature and not substantive participating voting rights, the Company has the power to direct the activities that most significantly impact the LLCs’ economic performance.
In accordance with ASC 810-10-65-2, the Company determined that it had an obligation to absorb losses of the LLCs that could potentially be significant to the LLCs or the right to receive benefits from the LLCs that could potentially be significant to the LLCs based on the following factors:
|
•
|
Rialto/Lennar owns
40%
of the equity of the LLCs and has the power to direct the activities of the LLCs that most significantly impact their economic performance through loan resolutions and the sale of REO.
|
89
LENNAR CORPORATION AND SUBSIDIARIES
NOTES TO CONSOLIDATED FINANCIAL STATEMENTS—(Continued)
|
•
|
Rialto/Lennar has a management/servicer contract under which the Company earns a
0.5%
servicing fee.
|
|
•
|
Rialto/Lennar has guaranteed, as the servicer, its obligations under the servicing agreement up to
$10 million
.
|
The Company is aware that the FDIC, as the owner of
60%
of the equity of each of the LLCs, may also have an obligation to absorb losses of the LLCs that could potentially be significant to the LLCs. However, in accordance with ASC 810-10-25-38A, only one enterprise, if any, is expected to be identified as the primary beneficiary of a VIE.
Since both criteria for consolidation in ASC 810-10-65-2 are met, the Company consolidated the LLCs.
Voting Interest Entities
Rialto Real Estate Fund, LP ("Fund I"), Rialto Real Estate Fund II, LP ("Fund II") and the Rialto Mezzanine Partners Fund ("Mezzanine Fund") are unconsolidated entities and are accounted for under the equity method of accounting. They were determined to have the attributes of an investment company in accordance with ASC Topic 946,
Financial Services – Investment Companies
, the attributes of which are different from the attributes that would cause a company to be an investment company for purposes of the Investment Company Act of 1940. As a result, Fund I, Fund II and the Mezzanine Fund’s assets and liabilities are recorded at fair value with increases/decreases in fair value recorded in their respective statements of operations, the Company’s share of which will be recorded in the Rialto equity in earnings (loss) from unconsolidated entities financial statement line item. The Company determined that Fund I, Fund II and the Mezzanine Fund are not variable interest entities but rather voting interest entities due to the following factors:
|
•
|
The Company determined that Rialto’s general partner interest and all the limited partners’ interests qualify as equity investment at risk.
|
|
•
|
Based on the capital structure of Fund I, Fund II and the Mezzanine Fund (100% capitalized via equity contributions), the Company was able to conclude that the equity investment at risk was sufficient to allow Fund I, Fund II and the Mezzanine Fund to finance its activities without additional subordinated financial support.
|
|
•
|
The general partner and the limited partners in Fund I, Fund II and the Mezzanine Fund, collectively, have full decision-making ability as they collectively have the power to direct the activities of Fund I, Fund II and the Mezzanine Fund, since Rialto, in addition to being a general partner with a substantive equity investment in Fund I, Fund II and the Mezzanine Fund, also provides services to Fund I, Fund II and the Mezzanine Fund under a management agreement and an investment agreement, which are not separable from Rialto’s general partnership interest.
|
|
•
|
As a result of all these factors, the Company has concluded that the power to direct the activities of Fund I, Fund II and the Mezzanine Fund reside in its general partnership interest and thus with the holders of the equity investment at risk.
|
|
•
|
In addition, there are no guaranteed returns provided to the equity investors and the equity contributions are fully subjected to Fund I, Fund II and the Mezzanine Fund's operational results, thus the equity investors absorb the expected negative and positive variability relative to Fund I, Fund II and the Mezzanine Fund.
|
|
•
|
Finally, substantially all of the activities of Fund I, Fund II and the Mezzanine Fund are not conducted on behalf of any individual investor or related group that has disproportionately few voting rights (i.e., on behalf of any individual limited partner).
|
Having concluded that Fund I, Fund II and the Mezzanine Fund are voting interest entities, the Company has evaluated the funds under the voting interest entity model to determine whether, as general partner, it has control over Fund I, Fund II or the Mezzanine Fund. The Company determined that it does not control Fund I, Fund II or the Mezzanine Fund as its general partner, because the unaffiliated limited partners have substantial kick-out rights and can remove Rialto as general partner at any time for cause or without cause through a simple majority vote of the limited partners. In addition, there are no significant barriers to the exercise of these rights. As a result of determining that the Company does not control Fund I, Fund II or the Mezzanine Fund under the voting interest entity model, Fund I, Fund II and the Mezzanine Fund are not consolidated in the Company’s financial statements.
90
LENNAR CORPORATION AND SUBSIDIARIES
NOTES TO CONSOLIDATED FINANCIAL STATEMENTS—(Continued)
Lennar Multifamily
Management Fees and General Contractor Revenue
The Lennar Multifamily segment provides management services with respect to the development, construction and management of rental projects in joint ventures in which the Company has investments. As a result, the Lennar Multifamily segment earns and receives fees, which are based upon a stated percentage of development and construction costs. These fees are included in Lennar Multifamily revenue and are recorded over the period in which the services are performed, fees are determinable and collectability is reasonably assured. In addition, the Lennar Multifamily provides general contractor services for the construction of some of its rental projects and recognizes the revenue over the period in which the services are performed under the percentage of completion method.
New Accounting Pronouncements
In December 2011, the FASB issued ASU 2011-11,
Disclosures about Offsetting Assets and Liabilities,
(“ASU 2011-11”), which requires entities to disclose information about offsetting and related arrangements of financial instruments and derivative instruments. In January 2013, this guidance was amended by ASU 2013-01,
Clarifying the Scope of Disclosures about Offsetting assets and Liabilities
("ASU 2013-01"). ASU 2013-01 limits the scope of ASU 2011-11 to certain derivatives, repurchase and reverse repurchase agreements, and securities borrowing and lending transactions. The guidance was effective for the Company's fiscal year beginning December 1, 2013 and subsequent interim periods. The adoption of this guidance, which is related to disclosure only, did not have a material effect on the Company’s consolidated financial statements.
In April 2013, the FASB issued ASU 2013-04,
Liabilities,
(“ASU 2013-04”). ASU 2013-04 provides guidance for the recognition, measurement, and disclosure of obligations resulting from joint and several liability arrangements for which the total amount of the obligation is fixed at the reporting date. ASU 2013-04 is effective for the Company’s fiscal year beginning December 1, 2014 and subsequent interim periods. The adoption of ASU 2013-04 is not expected to have a material effect on the Company’s consolidated financial statements.
In June 2013, the FASB issued ASU 2013-08,
Investment Companies
, (“ASU 2013-08”), which amends the criteria for an entity to qualify as an investment company under ASC 946,
Financial Services - Investment Companies,
(“ASC 946”). While ASU 2013-08 is not expected to significantly change which entities qualify for the specialized investment company accounting in ASC 946, it (1) introduces new disclosure requirements that apply to all investment companies and (2) amends the measurement criteria for certain interests in other investment companies. ASU 2013-08 also amends the requirements in ASC 810 related to qualifying for the “investment company deferral” as well as the requirements in ASC 820,
Fair Value Measurement
, related to qualifying for the “net asset value practical expedient.” ASU 2013-08 was effective for the Company’s second fiscal quarter beginning March 1, 2014. The adoption of ASU 2013-08 did not have a material effect on the Company’s consolidated financial statements.
In July 2013, the FASB issued ASU 2013-11,
Presentation of an Unrecognized Tax Benefit When a Net Operating Loss Carryforward, a similar Tax Loss, or a Tax Credit Carryforward Exists,
(“ASU 2013-11”). ASU 2013-13 is intended to end inconsistent practices regarding the presentation of a unrecognized tax benefits when a net operating loss ("NOL"), a similar tax loss or a tax credit carryforward is available to reduce the taxable income or tax payable that would result from the disallowance of a tax position. ASU 2013-11 is effective for the Company’s fiscal year beginning December 1, 2014 and subsequent interim periods. The adoption of ASU 2013-11 is not expected to have a material effect on the Company’s consolidated financial statements.
In April 2014, the FASB issued ASU 2014-08,
Presentation of Financial Statements and Property, Plant, and Equipment:
Reporting Discontinued Operations and Disclosures of Disposals of Components of an Entity,
(“ASU 2014-08”). ASU 2014-08 is intended to change the criteria for reporting discontinued operations and enhance disclosures in this area. Under the new guidance, only disposals representing a strategic shift in operations that has a major effect on the entity's operations and financial results should be presented as discontinued operations. If the disposal does qualify as a discontinued operation, the entity will be required to provide expanded disclosures as well as disclosure of the pretax income attributable to the disposal of a significant part of an entity that does not qualify as a discontinued operation. ASU 2014-08 is effective for the Company’s fiscal year beginning December 1, 2014 and subsequent interim periods. The adoption of ASU 2014-08 is not expected to have a material effect on the Company’s consolidated financial statements.
In May 2014, the FASB issued ASU 2014-09,
Revenue from Contracts with Customers,
(“ASU 2014-09”). ASU 2014-09 provides a single comprehensive model for entities to use in accounting for revenue arising from contracts with customers and supersedes most current revenue recognition guidance, including industry-specific guidance. ASU 2014-09 will require an entity to recognize revenue when it transfers promised goods or services to customers in an amount that reflects the consideration to which the entity expects to be entitled in exchange for those goods or services. This update creates a five-step
91
LENNAR CORPORATION AND SUBSIDIARIES
NOTES TO CONSOLIDATED FINANCIAL STATEMENTS—(Continued)
model that requires entities to exercise judgment when considering the terms of the contract(s) which include (i) identifying the contract(s) with the customer, (ii) identifying the separate performance obligations in the contract, (iii) determining the transaction price, (iv) allocating the transaction price to the separate performance obligations, and (v) recognizing revenue when each performance obligation is satisfied. ASU 2014-09 will be effective for the Company’s fiscal year beginning December 1, 2017 and subsequent interim periods The Company has the option to apply the provisions of ASU 2014-09 either retrospectively to each prior reporting period presented or retrospectively with the cumulative effect of applying this ASU recognized at the date of initial application. Early adoption is not permitted. The Company is currently evaluating the method by which it will implement ASU 2014-09 and the impact the adoption of this ASU will have on the Company's consolidated financial statements.
In August 2014, the FASB issued ASU 2014-15,
Presentation of Financial Statements - Going Concern (Subtopic 205-40): Disclosure of Uncertainties About an Entity's Ability to Continue as a Going Concern,
(“ASU 2014-15”). ASU 2014-15 requires management to perform interim and annual assessments on whether there are conditions or events that raise substantial doubt about the entity's ability to continue as a going concern within one year of the date the financial statements are issued and to provide related disclosures, if required. ASU 2014-15 will be effective for the Company’s fiscal year beginning December 1, 2016 and subsequent interim periods. The adoption of ASU 2014-15 is not expected to have a material effect on the Company’s consolidated financial statements.
In January 2015, the FASB issued ASU 2015-01,
Income Statement - Extraordinary and Unusual Items (Subtopic 225-20): Simplifying Income Statement Presentation by Eliminating the Concept of Extraordinary Items,
(“ASU 2015-01”). ASU 2015-01 eliminates the concept of an extraordinary item from GAAP. As a result, an entity will no longer be required to segregate extraordinary items from the results of ordinary operations, to separately present an extraordinary item on its income statement, net of tax, after income from continuing operations or to disclose income taxes and earnings-per-share data applicable to an extraordinary item. However, ASU 2015-01 will still retain the presentation and disclosure guidance for items that are unusual in nature and occur infrequently. ASU 2015-01 will be effective for the Company’s fiscal year beginning December 1, 2016 and subsequent interim periods. The adoption of ASU 2015-015 is not expected to have a material effect on the Company’s consolidated financial statements.
2. Operating and Reporting Segments
The Company’s operating segments are aggregated into reportable segments, based primarily upon similar economic characteristics, geography and product type. The Company’s reportable segments consist of:
|
(1)
|
Homebuilding East
|
|
(2)
|
Homebuilding Central
|
|
(3)
|
Homebuilding West
|
|
(4)
|
Homebuilding Southeast Florida
|
|
(5)
|
Homebuilding Houston
|
|
(6)
|
Financial Services
|
|
(7)
|
Rialto
|
|
(8)
|
Lennar Multifamily
|
Information about homebuilding activities in which the Company’s homebuilding activities are not economically similar to other states in the same geographic area is grouped under “Homebuilding Other,” which is not considered a reportable segment.
Evaluation of segment performance is based primarily on operating earnings (loss) before income taxes. Operations of the Company’s homebuilding segments primarily include the construction and sale of single-family attached and detached homes, as well as the purchase, development and sale of residential land directly and through the Company’s unconsolidated entities. Operating earnings (loss) for the homebuilding segments consist of revenues generated from the sales of homes and land, equity in earnings (loss) from unconsolidated entities and other income (expense), net, less the cost of homes sold and land sold, selling, general and administrative expenses and other interest expense of the segment.
92
LENNAR CORPORATION AND SUBSIDIARIES
NOTES TO CONSOLIDATED FINANCIAL STATEMENTS—(Continued)
The Company’s reportable homebuilding segments and all other homebuilding operations not required to be reported separately, have operations located in:
East:
Florida
(1)
, Georgia, Maryland, New Jersey, North Carolina, South Carolina and Virginia
Central:
Arizona, Colorado and Texas
(2)
West:
California and Nevada
Southeast Florida:
Southeast Florida
Houston:
Houston, Texas
Other:
Illinois, Minnesota, Oregon, Tennessee and Washington
|
(1)
|
Florida in the East reportable segment excludes Southeast Florida, which is its own reportable segment.
|
|
(2)
|
Texas in the Central reportable segment excludes Houston, Texas, which is its own reportable segment.
|
Operations of the Lennar Financial Services segment include primarily mortgage financing, title insurance and closing services for both buyers of the Company’s homes and others. The Lennar Financial Services sells substantially all of the loans it originates within a short period in the secondary mortgage market, the majority of which are sold on a servicing released, non-recourse basis. After the loans are sold, the Company retains potential liability for possible claims by purchasers that it breached certain limited industry-standard representations and warranties in the loan sale agreements. Lennar Financial Services’ operating earnings consist of revenues generated primarily from mortgage financing, title insurance and closing services, less the cost of such services and certain selling, general and administrative expenses incurred by the segment. The Lennar Financial Services segment operates generally in the same states as the Company’s homebuilding operations as well as in other states.
Operations of the Rialto segment include raising, investing and managing third-party capital, originating and securitizing commercial mortgage loans as well as investing its own capital in real estate related mortgage loans, properties and related securities. Rialto utilizes its vertically-integrated investment and operating platform to underwrite, diligence, acquire, manage, workout and add value to diverse portfolios of real estate loans, properties and securities as well as providing strategic real estate capital. Rialto’s operating earnings consists of revenues generated primarily from gains from securitization transactions and interest income from the RMF business, interest income associated with portfolios of real estate loans acquired in partnership with the FDIC and other portfolios of real estate loans and assets acquired, asset management, due diligence and underwriting fees derived from the segment's investments in the real estate investment funds managed by the Rialto segment, fees for sub-advisory services, other income (expense), net, consisting primarily of gains upon foreclosure of real estate owned (“REO”) and gains on sale of REO, and equity in earnings (loss) from unconsolidated entities, less the costs incurred by the segment for managing portfolios, costs related to RMF, REO expenses and other general and administrative expenses.
Operations of the Lennar Multifamily segment include revenues generated from the sales of land, revenue from construction activities and management fees generated from joint ventures and equity in earnings (loss) from unconsolidated entities, less the cost of sales of land, expenses related to construction activities and general and administrative expenses.
Each reportable segment follows the same accounting policies described in Note 1—“Summary of Significant Accounting Policies” to the consolidated financial statements. Operational results of each segment are not necessarily indicative of the results that would have occurred had the segment been an independent, stand-alone entity during the periods presented.
93
LENNAR CORPORATION AND SUBSIDIARIES
NOTES TO CONSOLIDATED FINANCIAL STATEMENTS—(Continued)
Financial information relating to the Company’s operations was as follows:
|
November 30,
|
||||||
|
(In thousands)
|
2014
|
2013
|
||||
|
Assets:
|
||||||
|
Homebuilding East
|
$
|
2,323,978
|
|
1,890,138
|
|
|
|
Homebuilding Central
|
1,233,991
|
|
963,815
|
|
||
|
Homebuilding West
|
3,454,611
|
|
3,108,395
|
|
||
|
Homebuilding Southeast Florida
|
722,706
|
|
757,125
|
|
||
|
Homebuilding Houston
|
398,538
|
|
307,864
|
|
||
|
Homebuilding Other
|
880,912
|
|
808,496
|
|
||
|
Rialto
|
1,458,152
|
|
1,479,313
|
|
||
|
Lennar Financial Services
|
1,177,053
|
|
796,710
|
|
||
|
Lennar Multifamily
|
268,014
|
|
147,089
|
|
||
|
Corporate and unallocated
|
1,040,312
|
|
1,014,302
|
|
||
|
Total assets
|
$
|
12,958,267
|
|
11,273,247
|
|
|
|
Lennar Homebuilding investments in unconsolidated entities:
|
||||||
|
Homebuilding East
|
$
|
10,620
|
|
19,569
|
|
|
|
Homebuilding Central
|
35,772
|
|
56,136
|
|
||
|
Homebuilding West
|
564,643
|
|
600,622
|
|
||
|
Homebuilding Southeast Florida
|
32,670
|
|
36,595
|
|
||
|
Homebuilding Houston
|
162
|
|
2,074
|
|
||
|
Homebuilding Other
|
12,970
|
|
1,953
|
|
||
|
Total Lennar Homebuilding investments in unconsolidated entities
|
$
|
656,837
|
|
716,949
|
|
|
|
Rialto investments in unconsolidated entities
|
$
|
175,700
|
|
154,573
|
|
|
|
Lennar Multifamily investments in unconsolidated entities
|
$
|
105,674
|
|
46,301
|
|
|
|
Rialto goodwill
|
$
|
5,396
|
|
—
|
|
|
|
Lennar Financial Services goodwill
|
$
|
38,854
|
|
34,046
|
|
|
94
LENNAR CORPORATION AND SUBSIDIARIES
NOTES TO CONSOLIDATED FINANCIAL STATEMENTS—(Continued)
|
Years Ended November 30,
|
|||||||||
|
(In thousands)
|
2014
|
2013
|
2012
|
||||||
|
Revenues:
|
|||||||||
|
Homebuilding East
|
$
|
2,247,681
|
|
1,842,162
|
|
1,299,980
|
|
||
|
Homebuilding Central
|
936,940
|
|
743,475
|
|
506,388
|
|
|||
|
Homebuilding West
|
1,796,375
|
|
1,161,332
|
|
697,289
|
|
|||
|
Homebuilding Southeast Florida
|
692,898
|
|
502,175
|
|
367,641
|
|
|||
|
Homebuilding Houston
|
713,113
|
|
641,161
|
|
471,623
|
|
|||
|
Homebuilding Other
|
638,123
|
|
464,642
|
|
238,311
|
|
|||
|
Lennar Financial Services
|
454,381
|
|
427,342
|
|
384,618
|
|
|||
|
Rialto
|
230,521
|
|
138,060
|
|
138,856
|
|
|||
|
Lennar Multifamily
|
69,780
|
|
14,746
|
|
426
|
|
|||
|
Total revenues (1)
|
$
|
7,779,812
|
|
5,935,095
|
|
4,105,132
|
|
||
|
Operating earnings (loss):
|
|||||||||
|
Homebuilding East (2)
|
$
|
340,108
|
|
251,117
|
|
113,997
|
|
||
|
Homebuilding Central (3)
|
75,585
|
|
55,203
|
|
24,827
|
|
|||
|
Homebuilding West (4)
|
292,719
|
|
211,155
|
|
(14,027
|
)
|
|||
|
Homebuilding Southeast Florida (5)
|
161,963
|
|
106,889
|
|
71,057
|
|
|||
|
Homebuilding Houston
|
107,622
|
|
80,819
|
|
46,275
|
|
|||
|
Homebuilding Other (6)
|
55,724
|
|
27,892
|
|
16,856
|
|
|||
|
Lennar Financial Services
|
80,138
|
|
85,786
|
|
84,782
|
|
|||
|
Rialto
|
44,079
|
|
26,128
|
|
11,569
|
|
|||
|
Lennar Multifamily
|
(10,993
|
)
|
(16,988
|
)
|
(5,884
|
)
|
|||
|
Total operating earnings
|
1,146,945
|
|
828,001
|
|
349,452
|
|
|||
|
Corporate general and administrative expenses
|
177,161
|
|
146,060
|
|
127,338
|
|
|||
|
Earnings before income taxes
|
$
|
969,784
|
|
681,941
|
|
222,114
|
|
||
|
(1)
|
Total revenues were net of sales incentives of
$449.2 million
(
$21,400
per home delivered) for the year ended
November 30, 2014
,
$373.1 million
(
$20,500
per home delivered) for the year ended
November 30, 2013
and
$388.2 million
(
$28,300
per home delivered) for the year ended
November 30, 2012
.
|
|
(2)
|
For the year ended November 30, 2012, operating earnings included
$2.4 million
of valuation adjustments to finished homes, CIP and land on which the Company intends to build homes,
$1.8 million
in write-offs of option deposits and pre-acquisition costs and
$1.0 million
in write-offs of other receivables.
|
|
(3)
|
For the year ended November 30, 2014, operating earnings included
$1.1 million
in write-offs of option deposits and pre-acquisition costs and
$2.0 million
in write-offs of other receivables.
|
|
(4)
|
For the year ended November 30, 2014, operating earnings included
$2.0 million
in write-offs of option deposits and pre-acquisition costs and
$4.3 million
of the Company's share of valuation adjustments primarily related to assets of a Lennar Homebuilding unconsolidated entity. For the year ended November 30, 2013, operating earnings included a
$14.4 million
gain on the sale of an operating property,
$19.8 million
of our share of equity in earnings as a result of sales of homesites to third parties by one unconsolidated entity. For the year ended November 30, 2012, operating loss included
$5.2 million
of valuation adjustments to finished homes, CIP and land on which the Company intends to build homes and
$12.1 million
of the Company's share of valuation adjustments primarily related to strategic asset sales at Lennar Homebuilding unconsolidated entities.
|
|
(5)
|
For the year ended November 30, 2014, operating earnings included
$3.0 million
of valuation adjustments to finished homes, CIP and land on which the Company intends to build homes and
$1.0 million
of valuation adjustments to other assets. For the year ended November 30, 2013, operating earnings included
$4.0 million
of valuation adjustments to finished homes, CIP and land on which the Company intends to build homes. For the year ended November 30, 2012, operating earnings included a
$15.0 million
gain on the sale of an operating property, partially offset by
$3.6 million
of valuation adjustments to finished homes, CIP and land on which the Company intends to build homes.
|
|
(6)
|
For the year ended November 30, 2014, operating earnings included
$1.5 million
in write-offs of option deposits and pre-acquisition costs.
|
Changes in market conditions and other specific developments may cause the Company to re-evaluate its strategy regarding certain assets that could result in further valuation adjustments and/or additional write-offs of option deposits and pre-acquisition costs due to abandonment of those options contracts.
95
LENNAR CORPORATION AND SUBSIDIARIES
NOTES TO CONSOLIDATED FINANCIAL STATEMENTS—(Continued)
|
Years Ended November 30,
|
|||||||||
|
(In thousands)
|
2014
|
2013
|
2012
|
||||||
|
Lennar Homebuilding interest expense:
|
|||||||||
|
Homebuilding East
|
$
|
65,437
|
|
65,123
|
|
60,026
|
|
||
|
Homebuilding Central
|
24,593
|
|
28,534
|
|
24,765
|
|
|||
|
Homebuilding West
|
58,999
|
|
63,106
|
|
49,096
|
|
|||
|
Homebuilding Southeast Florida
|
21,307
|
|
19,237
|
|
17,282
|
|
|||
|
Homebuilding Houston
|
14,914
|
|
16,412
|
|
13,800
|
|
|||
|
Homebuilding Other
|
16,289
|
|
21,844
|
|
16,416
|
|
|||
|
Total Lennar Homebuilding interest expense
|
$
|
201,539
|
|
214,256
|
|
181,385
|
|
||
|
Lennar Financial Services interest income, net
|
$
|
6,585
|
|
5,154
|
|
3,697
|
|
||
|
Depreciation and amortization:
|
|||||||||
|
Homebuilding East
|
$
|
10,860
|
|
8,955
|
|
6,039
|
|
||
|
Homebuilding Central
|
5,568
|
|
3,569
|
|
2,165
|
|
|||
|
Homebuilding West
|
14,533
|
|
10,594
|
|
9,225
|
|
|||
|
Homebuilding Southeast Florida
|
3,039
|
|
2,047
|
|
1,889
|
|
|||
|
Homebuilding Houston
|
3,252
|
|
2,647
|
|
1,692
|
|
|||
|
Homebuilding Other
|
5,729
|
|
4,213
|
|
3,228
|
|
|||
|
Lennar Financial Services
|
4,539
|
|
2,755
|
|
2,863
|
|
|||
|
Rialto
|
7,367
|
|
5,588
|
|
6,998
|
|
|||
|
Lennar Multifamily
|
595
|
|
484
|
|
—
|
|
|||
|
Corporate and unallocated
|
23,641
|
|
23,056
|
|
23,294
|
|
|||
|
Total depreciation and amortization
|
$
|
79,123
|
|
63,908
|
|
57,393
|
|
||
|
Net additions (disposals) to operating properties and equipment:
|
|||||||||
|
Homebuilding East
|
$
|
350
|
|
97
|
|
597
|
|
||
|
Homebuilding Central
|
578
|
|
201
|
|
114
|
|
|||
|
Homebuilding West (1)
|
6,719
|
|
(128,058
|
)
|
724
|
|
|||
|
Homebuilding Southeast Florida (2)
|
(42,780
|
)
|
78
|
|
4
|
|
|||
|
Homebuilding Houston
|
6
|
|
—
|
|
—
|
|
|||
|
Homebuilding Other
|
1,042
|
|
561
|
|
193
|
|
|||
|
Lennar Financial Services
|
4,502
|
|
3,648
|
|
960
|
|
|||
|
Rialto
|
4,361
|
|
4,052
|
|
—
|
|
|||
|
Lennar Multifamily
|
1,907
|
|
92
|
|
12
|
|
|||
|
Corporate and unallocated
|
1,977
|
|
401
|
|
218
|
|
|||
|
Total net additions (disposals) to operating properties and equipment
|
$
|
(21,338
|
)
|
(118,928
|
)
|
2,822
|
|
||
|
Lennar Homebuilding equity in earnings (loss) from unconsolidated entities
|
|||||||||
|
Homebuilding East
|
$
|
2,254
|
|
678
|
|
542
|
|
||
|
Homebuilding Central
|
(131
|
)
|
(87
|
)
|
(514
|
)
|
|||
|
Homebuilding West (3)
|
(1,647
|
)
|
22,039
|
|
(25,415
|
)
|
|||
|
Homebuilding Southeast Florida
|
(576
|
)
|
(152
|
)
|
(961
|
)
|
|||
|
Homebuilding Houston
|
121
|
|
2,079
|
|
(35
|
)
|
|||
|
Homebuilding Other
|
(376
|
)
|
(754
|
)
|
(289
|
)
|
|||
|
Total Lennar Homebuilding equity in earnings (loss) from unconsolidated entities
|
$
|
(355
|
)
|
23,803
|
|
(26,672
|
)
|
||
|
Rialto equity in earnings from unconsolidated entities
|
$
|
59,277
|
|
22,353
|
|
41,483
|
|
||
|
Lennar Multifamily equity in earnings (loss) from unconsolidated entities
|
$
|
14,454
|
|
(271
|
)
|
(4
|
)
|
||
|
(1)
|
For the year ended November 30, 2013, net disposals of operating properties and equipment included the sale of an operating property with a basis of
$127.1 million
.
|
|
(2)
|
For the year ended November 30, 2014, net disposals to operating properties and equipment included the sale of an operating property with a basis of
$44.1 million
.
|
96
LENNAR CORPORATION AND SUBSIDIARIES
NOTES TO CONSOLIDATED FINANCIAL STATEMENTS—(Continued)
|
(3)
|
For the year ended November 30, 2014, Lennar Homebuilding equity in loss from unconsolidated entities related primarily to the Company's share of operating losses of the Company's Lennar Homebuilding unconsolidated entities, which included
$4.3 million
of the Company's share of valuation adjustments related to assets of Lennar Homebuilding's unconsolidated entities, partially offset by the Company's share of operating earnings of
$4.7 million
related to third-party land sales by one unconsolidated entity. For the year ended November 30, 2013, Lennar Homebuilding equity in earnings from unconsolidated entities included
$19.8 million
of equity in earnings primarily as a result of sales of homesites to third parties by one unconsolidated entity. For the year ended November 30, 2012, equity in loss from unconsolidated entities related primarily to the Company's share of operating losses of the Company's Lennar Homebuilding unconsolidated entities, which included
$12.1 million
of the Company's share of valuation adjustments primarily related to assets of Lennar Homebuilding unconsolidated entities.
|
3. Lennar Homebuilding Receivables
|
November 30,
|
||||||
|
(In thousands)
|
2014
|
2013
|
||||
|
Accounts receivable
|
$
|
44,368
|
|
32,677
|
|
|
|
Mortgage and notes receivable
|
41,326
|
|
14,550
|
|
||
|
Income tax receivables
|
10,620
|
|
7,432
|
|
||
|
96,314
|
|
54,659
|
|
|||
|
Allowance for doubtful accounts
|
(2,870
|
)
|
(2,724
|
)
|
||
|
$
|
93,444
|
|
51,935
|
|
||
At
November 30, 2014
and
2013
, Lennar Homebuilding accounts receivable related primarily to other receivables and rebates. The Company performs ongoing credit evaluations of its customers and generally does not require collateral for accounts receivable. Mortgages and notes receivable arising from the sale of land are generally collateralized by the property sold to the buyer. Allowances are maintained for potential credit losses based on historical experience, present economic conditions and other factors considered relevant by the Company.
4. Lennar Homebuilding Investments in Unconsolidated Entities
Summarized condensed financial information on a combined 100% basis related to Lennar Homebuilding’s unconsolidated entities that are accounted for by the equity method was as follows:
|
Statements of Operations
|
|||||||||
|
Years Ended November 30,
|
|||||||||
|
(In thousands)
|
2014
|
2013
|
2012
|
||||||
|
Revenues
|
$
|
263,395
|
|
570,910
|
|
353,902
|
|
||
|
Costs and expenses
|
291,993
|
|
425,282
|
|
418,905
|
|
|||
|
Other income
|
—
|
|
14,602
|
|
10,515
|
|
|||
|
Net earnings (loss) of unconsolidated entities
|
$
|
(28,598
|
)
|
160,230
|
|
(54,488
|
)
|
||
|
Lennar Homebuilding equity in earnings (loss) from unconsolidated entities (1)
|
$
|
(355
|
)
|
23,803
|
|
(26,672
|
)
|
||
|
(1)
|
For the year ended November 30, 2014, Lennar Homebuilding equity in loss from unconsolidated entities related primarily to the Company's share of operating losses of Lennar Homebuilding unconsolidated entities, which included
$4.6 million
of valuation adjustments related to assets of Lennar Homebuilding's unconsolidated entities, partially offset by
$4.7 million
of equity in earnings as a result of third-party land sales by one unconsolidated entity. For the year ended November 30, 2013, Lennar Homebuilding equity in earnings from unconsolidated entities included
$19.8 million
of equity in earnings primarily as a result of sales of homesites to third parties by one unconsolidated entity. For the year ended November 30, 2012, Lennar Homebuilding equity in loss from unconsolidated entities included
$12.1 million
of valuation adjustments primarily related to strategic asset sales at Lennar Homebuilding's unconsolidated entities.
|
97
LENNAR CORPORATION AND SUBSIDIARIES
NOTES TO CONSOLIDATED FINANCIAL STATEMENTS—(Continued)
|
Balance Sheets
|
||||||
|
November 30,
|
||||||
|
(In thousands)
|
2014
|
2013
|
||||
|
Assets:
|
||||||
|
Cash and cash equivalents
|
$
|
243,597
|
|
184,521
|
|
|
|
Inventories
|
2,889,267
|
|
2,904,795
|
|
||
|
Other assets
|
155,470
|
|
147,410
|
|
||
|
$
|
3,288,334
|
|
3,236,726
|
|
||
|
Liabilities and equity:
|
||||||
|
Accounts payable and other liabilities
|
$
|
271,638
|
|
272,940
|
|
|
|
Debt
|
737,755
|
|
450,457
|
|
||
|
Equity
|
2,278,941
|
|
2,513,329
|
|
||
|
$
|
3,288,334
|
|
3,236,726
|
|
||
As of
November 30, 2014
and
2013
, the Company’s recorded investments in Lennar Homebuilding unconsolidated entities were
$656.8 million
and
$716.9 million
, respectively, while the underlying equity in Lennar Homebuilding unconsolidated entities partners’ net assets as of
November 30, 2014
and
2013
was
$722.6 million
and
$829.5 million
, respectively. The basis difference is primarily as a result of the Company buying an interest in a partner's equity in a Lennar Homebuilding unconsolidated entity at a discount to book value and contributing non-monetary assets to an unconsolidated entity with a higher fair value than book value.
The Company’s partners generally are unrelated homebuilders, land owners/developers and financial or other strategic partners. The unconsolidated entities follow accounting principles that are in all material respects the same as those used by the Company. The Company shares in the profits and losses of these unconsolidated entities generally in accordance with its ownership interests. In many instances, the Company is appointed as the day-to-day manager under the direction of a management committee that has shared powers amongst the partners of the unconsolidated entities and receives management fees and/or reimbursement of expenses for performing this function. During the years ended
November 30, 2014
,
2013
and
2012
, the Company received management fees and reimbursement of expenses from the Homebuilding unconsolidated entities totaling
$30.7 million
,
$18.8 million
and
$20.6 million
, respectively.
The Company and/or its partners sometimes obtain options or enter into other arrangements under which the Company can purchase portions of the land held by the unconsolidated entities. Option prices are generally negotiated prices that approximate fair value when the Company receives the options. During the years ended
November 30, 2014
,
2013
and
2012
,
$59.0 million
,
$192.5 million
and
$130.3 million
, respectively, of the unconsolidated entities’ revenues were from land sales to the Company. The Company does not include in its Lennar Homebuilding equity in earnings (loss) from unconsolidated entities its pro rata share of unconsolidated entities’ earnings resulting from land sales to its homebuilding divisions. Instead, the Company accounts for those earnings as a reduction of the cost of purchasing the land from the unconsolidated entities. This in effect defers recognition of the Company’s share of the unconsolidated entities’ earnings related to these sales until the Company delivers a home and title passes to a third-party homebuyer.
In fiscal 2007, the Company sold a portfolio of land to a strategic land investment venture with Morgan Stanley Real Estate Fund II, L.P., an affiliate of Morgan Stanley & Co., Inc. ("MSR"), in which the Company has a
20%
ownership interest and
50%
voting rights. Due to the nature of the Company’s continuing involvement, the transaction did not qualify as a sale by the Company under GAAP; thus, the inventory remained on the Company’s consolidated balance sheet in consolidated inventory not owned. As of
November 30, 2013
, the portfolio of land (including land development costs) of
$241.8 million
was also reflected as inventory in the summarized condensed financial information related to Lennar Homebuilding’s unconsolidated entities. In 2014, the Company entered into a new agreement with the joint venture, which required
$155.0 million
of inventory assets to remain consolidated due to the existence of option contracts on substantially all of the homesites and were reclassified into land and land under development. The remaining
$70.3 million
of inventory assets no longer under option by the Company were deconsolidated.
The Lennar Homebuilding entities in which the Company has investments usually finance their activities with a combination of partner equity and debt financing. In some instances, the Company and its partners have guaranteed debt of certain unconsolidated entities.
98
LENNAR CORPORATION AND SUBSIDIARIES
NOTES TO CONSOLIDATED FINANCIAL STATEMENTS—(Continued)
The total debt of the Lennar Homebuilding unconsolidated entities in which the Company has investments was as follows:
|
November 30,
|
||||||
|
(Dollars in thousands)
|
2014
|
2013
|
||||
|
The Company’s net recourse exposure
|
$
|
24,481
|
|
27,496
|
|
|
|
Reimbursement agreements from partners
|
—
|
|
13,500
|
|
||
|
The Company’s maximum recourse exposure
|
$
|
24,481
|
|
40,996
|
|
|
|
Non-recourse bank debt and other debt (partner’s share of several recourse)
|
$
|
56,573
|
|
61,008
|
|
|
|
Non-recourse land seller debt or other debt
|
4,022
|
|
20,454
|
|
||
|
Non-recourse debt with completion guarantees
|
442,854
|
|
245,821
|
|
||
|
Non-recourse debt without completion guarantees
|
209,825
|
|
82,178
|
|
||
|
Non-recourse debt to the Company
|
713,274
|
|
409,461
|
|
||
|
Total debt
|
$
|
737,755
|
|
450,457
|
|
|
|
The Company’s maximum recourse exposure as a % of total JV debt
|
3
|
%
|
9
|
%
|
||
In most instances in which the Company has guaranteed debt of a Lennar Homebuilding unconsolidated entity, the Company’s partners have also guaranteed that debt and are required to contribute their share of the guarantee payments. Historically, the Company has had repayment guarantees and/or maintenance guarantees. In a repayment guarantee, the Company and its venture partners guarantee repayment of a portion or all of the debt in the event of default before the lender would have to exercise its rights against the collateral. In the event of default, if the Company’s venture partner does not have adequate financial resources to meet its obligations under the reimbursement agreement, the Company may be liable for more than its proportionate share, up to its maximum recourse exposure, which is the full amount covered by the joint and several guarantee. The maintenance guarantees only apply if the value or the collateral (generally land and improvements) is less than a specified percentage of the loan balance. As of both
November 30, 2014
and
2013
, the Company does not have any maintenance guarantees related to its Lennar Homebuilding unconsolidated entities.
In connection with many of the loans to Lennar Homebuilding unconsolidated entities, the Company and its joint venture partners (or entities related to them) have been required to give guarantees of completion to the lenders. Those completion guarantees may require that the guarantors complete the construction of the improvements for which the financing was obtained. If the construction is to be done in phases, the guarantee generally is limited to completing only the phases as to which construction has already commenced and for which loan proceeds were used.
If the Company is required to make a payment under any guarantee, the payment would constitute a capital contribution or loan to the Lennar Homebuilding unconsolidated entity and increase the Company's investment in the unconsolidated entity and its share of any funds the entity distributes.
As of both
November 30, 2014
and
2013
, the fair values of the repayment guarantees and completion guarantees were not material. The Company believes that as of
November 30, 2014
, in the event it becomes legally obligated to perform under a guarantee of the obligation of a Lennar Homebuilding unconsolidated entity due to a triggering event under a guarantee, most of the time the collateral should be sufficient to repay at least a significant portion of the obligation or the Company and its partners would contribute additional capital into the venture. In certain instances, the Company has placed performance letters of credit and surety bonds with municipalities for its joint ventures (see Note 6).
99
LENNAR CORPORATION AND SUBSIDIARIES
NOTES TO CONSOLIDATED FINANCIAL STATEMENTS—(Continued)
5. Lennar Homebuilding Operating Properties and Equipment
|
November 30,
|
||||||
|
(In thousands)
|
2014
|
2013
|
||||
|
Operating properties (1)
|
$
|
161,741
|
|
205,707
|
|
|
|
Leasehold improvements
|
32,890
|
|
29,681
|
|
||
|
Furniture, fixtures and equipment
|
36,464
|
|
29,827
|
|
||
|
231,095
|
|
265,215
|
|
|||
|
Accumulated depreciation and amortization
|
(87,931
|
)
|
(83,792
|
)
|
||
|
$
|
143,164
|
|
181,423
|
|
||
|
(1)
|
Operating properties primarily include multi-level residential buildings that have been converted to rental operations. During the year ended November 30, 2014, the Company sold one of its operating properties with a basis of
$44.1 million
.
|
Operating properties and equipment are included in Lennar Homebuilding other assets in the consolidated balance sheets.
6. Lennar Homebuilding Senior Notes and Other Debts Payable
|
November 30,
|
||||||
|
(Dollars in thousands)
|
2014
|
2013
|
||||
|
5.60% senior notes due 2015
|
$
|
500,272
|
|
500,527
|
|
|
|
6.50% senior notes due 2016
|
249,923
|
|
249,886
|
|
||
|
12.25% senior notes due 2017
|
396,278
|
|
395,312
|
|
||
|
4.75% senior notes due 2017
|
399,250
|
|
399,250
|
|
||
|
6.95% senior notes due 2018
|
248,485
|
|
248,167
|
|
||
|
4.125% senior notes due 2018
|
274,995
|
|
274,995
|
|
||
|
4.500% senior notes due 2019
|
500,477
|
|
—
|
|
||
|
4.50% senior notes due 2019
|
350,000
|
|
—
|
|
||
|
2.75% convertible senior notes due 2020
|
431,042
|
|
416,041
|
|
||
|
3.25% convertible senior notes due 2021
|
400,000
|
|
400,000
|
|
||
|
4.750% senior notes due 2022
|
571,439
|
|
571,012
|
|
||
|
5.50% senior notes due 2014
|
—
|
|
249,640
|
|
||
|
Mortgages notes on land and other debt
|
368,052
|
|
489,602
|
|
||
|
$
|
4,690,213
|
|
4,194,432
|
|
||
At
November 30, 2014
, the Company had a
$1.5 billion
unsecured revolving credit facility (the "Credit Facility"), which includes a
$248 million
accordion feature, subject to additional commitments, with certain financial institutions that matures in June 2018. The proceeds available under the Credit Facility, which are subject to specified conditions for borrowing, may be used for working capital and general corporate purposes. The credit agreement also provides that up to
$500 million
in commitments may be used for letters of credit. As of both
November 30, 2014
and
2013
, the Company had
no
outstanding borrowings under the Credit Facility. Under the Credit Facility agreement, the Company is required to maintain a minimum consolidated tangible net worth, a maximum leverage ratio and either a liquidity or an interest coverage ratio. These ratios are calculated per the Credit Facility agreement, which involves adjustments to GAAP financial measures. For more details refer to Management's Discussion and Analysis of Financial Conditions and Results of Operations in Item 7. The Company believes it was in compliance with its debt covenants at
November 30, 2014
. In addition, the Company had
$125 million
letter of credit facilities with a financial institution and a
$140 million
letter of credit facility with a different financial institution.
The Company’s performance letters of credit outstanding were
$234.1 million
and
$160.6 million
at
November 30, 2014
and
2013
, respectively. The Company’s financial letters of credit outstanding were
$190.4 million
and
$212.8 million
at
November 30, 2014
and
2013
, respectively. Performance letters of credit are generally posted with regulatory bodies to guarantee the Company’s performance of certain development and construction activities. Financial letters of credit are generally posted in lieu of cash deposits on option contracts, for insurance risks, credit enhancements and as other collateral. Additionally, at
November 30, 2014
, the Company had outstanding performance and surety bonds related to site improvements at various projects (including certain projects of the Company’s joint ventures) of
$923.3 million
. Although significant
100
LENNAR CORPORATION AND SUBSIDIARIES
NOTES TO CONSOLIDATED FINANCIAL STATEMENTS—(Continued)
development and construction activities have been completed related to these site improvements, these bonds are generally not released until all development and construction activities are completed. As of
November 30, 2014
, there were approximately
$363.7 million
, or
39%
, of anticipated future costs to complete related to these site improvements. The Company does not presently anticipate any draws upon these bonds or letters of credit, but if any such draws occur, the Company does not believe they would have a material effect on its financial position, results of operations or cash flows.
The terms of each of the Company's senior and convertible senior notes outstanding at
November 30, 2014
were as follows:
|
Senior and Convertible Senior Notes Outstanding (1)
|
Principal Amount
|
Net Proceeds (2)
|
Price
|
Dates Issued
|
|||||||||
|
(Dollars in thousands)
|
|||||||||||||
|
5.60% senior notes due 2015
|
$
|
500,000
|
|
$
|
501,400
|
|
(3)
|
|
April 2005, July 2005
|
||||
|
6.50% senior notes due 2016
|
250,000
|
|
248,900
|
|
99.873
|
%
|
April 2006
|
||||||
|
12.25% senior notes due 2017
|
400,000
|
|
386,700
|
|
98.098
|
%
|
April 2009
|
||||||
|
4.75% senior notes due 2017
|
400,000
|
|
395,900
|
|
100
|
%
|
July 2012, August 2012
|
||||||
|
6.95% senior notes due 2018
|
250,000
|
|
243,900
|
|
98.929
|
%
|
May 2010
|
||||||
|
4.125% senior notes due 2018 (4)
|
275,000
|
|
271,718
|
|
99.998
|
%
|
February 2013
|
||||||
|
4.500% senior notes due 2019
|
500,000
|
|
495,725
|
|
(5)
|
|
February 2014
|
||||||
|
4.50% senior notes due 2019
|
350,000
|
|
347,016
|
|
100
|
%
|
November 2014
|
||||||
|
2.75% convertible senior notes due 2020
|
446,000
|
|
436,400
|
|
100
|
%
|
November 2010
|
||||||
|
3.25% convertible senior notes due 2021
|
400,000
|
|
391,600
|
|
100
|
%
|
November 2011, December 2011
|
||||||
|
4.750% senior notes due 2022 (4)
|
575,000
|
|
567,585
|
|
(6)
|
|
October 2012, February 2013, April 2013
|
||||||
|
(1)
|
Interest is payable semi-annually for each of the series of senior and convertible senior notes. The senior and convertible senior notes are unsecured and unsubordinated, but are guaranteed by substantially all of the Company's 100% owned homebuilding subsidiaries.
|
|
(2)
|
The Company generally uses the net proceeds for working capital and general corporate purposes, which can include the repayment or repurchase of other outstanding senior notes.
|
|
(3)
|
The Company issued
$300 million
aggregate principal amount at a price of
99.771%
and
$200 million
aggregate principal amount at a price of
101.407%
.
|
|
(4)
|
During 2013, the Company incurred additional interest with respect to the
4.125%
senior notes due 2018 and to the
4.750%
senior notes due 2022 because the registration statements relating to the notes did not become effective by, and the exchange offers were not consummated by, the dates specified in the Registration Rights Agreement related to such notes.
|
|
(5)
|
The Company issued
$400 million
aggregate principal amount at a price of
100%
and
$100 million
aggregate principal amount at a price of
100.5%
.
|
|
(6)
|
The Company issued
$350 million
aggregate principal amount at a price of
100%
,
$175 million
aggregate principal amount at a price of
98.073%
and
$50 million
aggregate principal amount at a price of
98.250%
.
|
In September 2014, the Company retired its
$250 million
5.50%
senior notes for 100% of the outstanding principal amount, plus accrued and unpaid interest as of the maturity date. At November 30, 2013, the carrying value of the
5.50%
Senior Notes was
$249.6 million
.
The
3.25%
convertible senior notes due 2021 (the "
3.25%
Convertible Senior Notes") are convertible into shares of Class A common stock at any time prior to maturity or redemption at the initial conversion rate of
42.5555
shares of Class A common stock per
$1,000
principal amount of the
3.25%
Convertible Senior Notes or
17,022,200
shares of Class A common stock if all the
3.25%
Convertible Senior Notes are converted, which is equivalent to an initial conversion price of approximately
$23.50
per share of Class A common stock, subject to anti-dilution adjustments. The shares are included in the calculation of diluted earnings per share.
Holders of the 3.25% Convertible Senior Notes have the right to require the Company to repurchase them for cash equal to 100% of their principal amount, plus accrued but unpaid interest on November 15, 2016.
The Company has the right to redeem the 3.25% Convertible Senior Notes at any time on or after November 20, 2016 for 100% of their principal amount, plus accrued but unpaid interest.
The
2.75%
convertible senior notes due 2020 (the “
2.75%
Convertible Senior Notes”) are convertible into cash, shares of Class A common stock or a combination of both, at the Company’s election. However, it is the Company’s intent to settle the face value of the
2.75%
Convertible Senior Notes in cash. Holders may convert the
2.75%
Convertible Senior Notes at the initial conversion rate of
45.1794
shares of Class A common stock per
$1,000
principal amount or
20,150,012
shares of Class A common stock if all the
2.75%
Convertible Senior Notes are converted, which is equivalent to an initial conversion price of approximately
$22.13
per share of Class A common stock, subject to anti-dilution adjustments. For the years ended
101
LENNAR CORPORATION AND SUBSIDIARIES
NOTES TO CONSOLIDATED FINANCIAL STATEMENTS—(Continued)
November 30, 2014
and
2013
, the Company's volume weighted average stock price was
$39.96
and
$37.06
, respectively, which exceeded the conversion price, thus
9.0 million
shares and
8.2 million
shares, respectively, were included in the calculation of diluted earnings per share.
Holders of the
2.75%
Convertible Senior Notes have the right to convert them, during any fiscal quarter (and only during such fiscal quarter), if the last reported sale price of the Company’s Class A common stock for at least
20
trading days (whether or not consecutive) during a period of
30
consecutive trading days ending on the last trading day of the immediately preceding fiscal quarter is greater than or equal to
130%
of the conversion price on each applicable trading day.
Holders of the 2.75% Convertible Senior Notes have the right to require the Company to repurchase them for cash equal to 100% of their principal amount, plus accrued but unpaid interest, on December 15, 2015.
The Company has the right to redeem the 2.75% Convertible Senior Notes at any time on or after December 20, 2015 for 100% of their principal amount, plus accrued but unpaid interest.
For its
2.75%
Convertible Senior Notes, the Company will be required to pay contingent interest with regard to any interest period beginning with the interest period commencing December 20, 2015 and ending June 14, 2016, and for each subsequent
six
-month period commencing on an interest payment date to, but excluding, the next interest payment date, if the average trading price of the
2.75%
Convertible Senior Notes during the
five
consecutive trading days ending on the second trading day immediately preceding the first day of the applicable interest period exceeds
120%
of the principal amount of the
2.75%
Convertible Senior Notes. The amount of contingent interest payable per
$1,000
principal amount of notes during the applicable interest period will equal
0.75%
per year of the average trading price of such
$1,000
principal amount of
2.75%
Convertible Senior Notes during the five trading day reference period.
Certain provisions under ASC 470,
Debt
, require the issuer of certain convertible debt instruments that may be settled in cash on conversion to separately account for the liability and equity components of the instrument in a manner that reflects the issuer’s non-convertible debt borrowing rate. The Company has applied these provisions to its
2.75%
Convertible Senior Notes. At issuance, the Company estimated the fair value of the
2.75%
Convertible Senior Notes using similar debt instruments that did not have a conversion feature and allocated the residual value to an equity component that represented the estimated fair value of the conversion feature at issuance. The debt discount of the
2.75%
Convertible Senior Notes is being amortized over five years and the annual effective interest rate is
7.1%
after giving effect to the amortization of the discount and deferred financing costs. At both
November 30, 2014
and
2013
, the principal amount of the
2.75%
Convertible Senior Notes was
$446.0 million
. At
November 30, 2014
and
2013
, the carrying amount of the equity component included in stockholders’ equity was
$15.0 million
and
$30.0 million
, respectively, and the net carrying amount of the
2.75%
Convertible Senior Notes included in Lennar Homebuilding senior notes and other debts payable was
$431.0 million
and
$416.0 million
, respectively. During the years ended
November 30, 2014
and
2013
, the amount of interest recognized relating to both the contractual interest and amortization of the discount was
$27.3 million
and
$26.5 million
, respectively.
Although the guarantees by substantially all of the Company's 100% owned homebuilding subsidiaries are full, unconditional and joint and several while they are in effect, (i) a subsidiary will cease to be a guarantor at any time when it is not directly or indirectly guaranteeing at least
$75 million
of debt of Lennar Corporation (the parent company), and (ii) a subsidiary will be released from its guarantee and any other obligations it may have regarding the senior notes if all or substantially all its assets, or all of its capital stock, are sold or otherwise disposed of.
At
November 30, 2014
, the Company had mortgage notes on land and other debt due at various dates through 2028 bearing interest at rates up to
9.0%
with an average interest rate of
3.2%
. At
November 30, 2014
and
2013
, the carrying amount of the mortgage notes on land and other debt was
$368.1 million
and
$489.6 million
, respectively. During the years ended
November 30, 2014
and
2013
, the Company retired
$285.9 million
and
$285.4 million
, respectively, of mortgage notes on land and other debt.
102
LENNAR CORPORATION AND SUBSIDIARIES
NOTES TO CONSOLIDATED FINANCIAL STATEMENTS—(Continued)
The minimum aggregate principal maturities of senior notes and other debts payable during the five years subsequent to
November 30, 2014
and thereafter are as follows:
|
(In thousands)
|
Debt
Maturities (1)
|
||
|
2015
|
$
|
659,378
|
|
|
2016
|
417,880
|
|
|
|
2017
|
412,026
|
|
|
|
2018
|
650,998
|
|
|
|
2019
|
1,125,472
|
|
|
|
Thereafter
|
1,424,459
|
|
|
|
(1)
|
Some of the debt maturities included in these amounts relate to convertible senior notes that are putable to the Company at earlier dates than in this table, as described in the detail description of each of the convertible senior notes.
|
7. Lennar Financial Services Segment
The assets and liabilities related to the Lennar Financial Services segment were as follows:
|
November 30,
|
||||||
|
(In thousands)
|
2014
|
2013
|
||||
|
Assets:
|
||||||
|
Cash and cash equivalents
|
$
|
90,010
|
|
73,066
|
|
|
|
Restricted cash
|
8,609
|
|
10,283
|
|
||
|
Receivables, net (1)
|
150,858
|
|
127,223
|
|
||
|
Loans held-for-sale (2)
|
738,396
|
|
414,231
|
|
||
|
Loans held-for-investment, net
|
26,894
|
|
26,356
|
|
||
|
Investments held-to-maturity
|
45,038
|
|
62,344
|
|
||
|
Goodwill
|
38,854
|
|
34,046
|
|
||
|
Other (3)
|
78,394
|
|
49,161
|
|
||
|
$
|
1,177,053
|
|
796,710
|
|
||
|
Liabilities:
|
||||||
|
Notes and other debts payable
|
$
|
704,143
|
|
374,166
|
|
|
|
Other (4)
|
192,500
|
|
169,473
|
|
||
|
$
|
896,643
|
|
543,639
|
|
||
|
(1)
|
Receivables, net, primarily related to loans sold to investors for which the Company had not yet been paid as of
November 30, 2014
and
2013
, respectively.
|
|
(2)
|
Loans held-for-sale related to unsold loans carried at fair value.
|
|
(3)
|
Other assets included mortgage loan commitments carried at fair value of
$12.7 million
and
$7.3 million
as of
November 30, 2014
and
2013
, respectively. Other assets also included forward contracts carried at fair value of
$1.4 million
as of November 30, 2013. In addition, other assets included mortgage servicing rights carried at fair value of
$17.4 million
and
$11.5 million
as of
November 30, 2014
and
2013
, respectively, and other investment securities of
$16.8 million
as of
November 30, 2014
.
|
|
(4)
|
Other liabilities included
$69.3 million
and
$74.5 million
as of
November 30, 2014
and
2013
, respectively, of certain of the Company’s self-insurance reserves related to construction defects, general liability and workers’ compensation. Other liabilities also included forward contracts carried at fair value of
$7.6 million
as of November 30, 2014.
|
103
LENNAR CORPORATION AND SUBSIDIARIES
NOTES TO CONSOLIDATED FINANCIAL STATEMENTS—(Continued)
At
November 30, 2014
, the financial services warehouse facilities were as follows:
|
Warehouse Repurchase Facilities (In thousands)
|
Maximum Aggregate Commitment
|
||
|
364-day warehouse repurchase facility that matures December 2014 (1)
|
$
|
325,000
|
|
|
364-day warehouse repurchase facility that matures January 2015 (2)
|
300,000
|
|
|
|
364-day warehouse repurchase facility that matures February 2015
|
150,000
|
|
|
|
364-day warehouse repurchase facility that matures June 2015 (3)
|
150,000
|
|
|
|
Total
|
$
|
925,000
|
|
|
(1)
|
In December 2014, the Lennar Financial Services segment amended its 364-day warehouse repurchase facility that matured in December 2014 increasing the maximum aggregate commitment from
$325 million
to
$350 million
through the second quarter of fiscal 2015 and to
$450 million
for the third and fourth quarter of fiscal 2015. The maturity date was extended to December 2015.
|
|
(2)
|
Maximum aggregate commitment includes a
$100 million
accordion feature that is usable 10 days prior to fiscal quarter-end through 20 days after fiscal quarter-end.
|
|
(3)
|
Maximum aggregate commitment includes a
$50 million
accordion feature that is available beginning on the tenth (10th) calendar day immediately preceding the first day of a fiscal quarter through 20 days after fiscal quarter-end.
|
The Lennar Financial Services segment uses these facilities to finance its lending activities until the mortgage loans are sold to investors and the proceeds are collected. The facilities are expected to be renewed or replaced with other facilities when they mature. Borrowings under the facilities and their prior year predecessors were
$698.4 million
and
$374.2 million
at
November 30, 2014
and
2013
, respectively, and were collateralized by mortgage loans and receivables on loans sold to investors but not yet paid for with outstanding principal balances of
$732.1 million
and
$452.5 million
at
November 30, 2014
and
2013
, respectively. The combined effective interest rate on the facilities at
November 30, 2014
was
2.5%
. If the facilities are not renewed or replaced, the borrowings under the lines of credit will be paid off by selling the mortgage loans held-for-sale to investors and by collecting on receivables on loans sold but not yet paid. Without the facilities, the Lennar Financial Services segment would have to use cash from operations and other funding sources to finance its lending activities.
In April 2014, the Lennar Financial Services segment acquired a Colorado-based mortgage company. At acquisition date the fair value of the assets acquired was
$1.4 million
and the goodwill recorded was
$4.8 million
.
8. Rialto Segment
The assets and liabilities related to the Rialto segment were as follows:
|
November 30,
|
||||||
|
(In thousands)
|
2014
|
2013
|
||||
|
Assets:
|
||||||
|
Cash and cash equivalents
|
$
|
303,889
|
|
201,496
|
|
|
|
Restricted cash
|
46,975
|
|
2,593
|
|
||
|
Receivables, net (1)
|
153,773
|
|
111,833
|
|
||
|
Loans receivable, net
|
130,105
|
|
278,392
|
|
||
|
Loans held-for-sale (2)
|
113,596
|
|
44,228
|
|
||
|
Real estate owned - held-for-sale
|
190,535
|
|
197,851
|
|
||
|
Real estate owned - held-and-used, net
|
255,795
|
|
428,989
|
|
||
|
Investments in unconsolidated entities
|
175,700
|
|
154,573
|
|
||
|
Investments held-to-maturity
|
17,290
|
|
16,070
|
|
||
|
Other
|
70,494
|
|
43,288
|
|
||
|
$
|
1,458,152
|
|
1,479,313
|
|
||
|
Liabilities:
|
||||||
|
Notes payable and other debts payable (3)
|
$
|
623,246
|
|
441,883
|
|
|
|
Other
|
123,798
|
|
55,125
|
|
||
|
$
|
747,044
|
|
497,008
|
|
||
|
(1)
|
Receivables, net primarily related to loans sold but not settled as of November 30, 2014 and 2013.
|
|
(2)
|
Loans held-for-sale related to unsold loans originated by RMF carried at fair value.
|
|
(3)
|
Notes and other debts payable included
$351.9 million
and
$250.0 million
related to the
7.00%
Senior Notes due 2018 ("
7.00%
Senior Notes") as of
November 30, 2014
and
2013
, respectively,
$141.3 million
and
$76.0 million
related to the RMF warehouse repurchase financing agreements as of
November 30, 2014
and
2013
, respectively, and
$58.0 million
related to notes issued through a structured note offering as of
November 30, 2014
.
|
Rialto’s operating earnings were as follows:
|
Years Ended November 30,
|
|||||||||
|
(In thousands)
|
2014
|
2013
|
2012
|
||||||
|
Revenues
|
$
|
230,521
|
|
138,060
|
|
138,856
|
|
||
|
Costs and expenses (1)
|
249,114
|
|
151,072
|
|
138,990
|
|
|||
|
Rialto equity in earnings from unconsolidated entities
|
59,277
|
|
22,353
|
|
41,483
|
|
|||
|
Rialto other income (expense), net
|
3,395
|
|
16,787
|
|
(29,780
|
)
|
|||
|
Operating earnings (2)
|
$
|
44,079
|
|
26,128
|
|
11,569
|
|
||
|
(1)
|
Costs and expenses for the years ended
November 30, 2014
,
2013
and
2012
included loan impairments of
$57.1 million
,
$16.1 million
and
$28.0 million
, respectively, primarily associated with the segment's FDIC loans portfolio (before noncontrolling interests).
|
|
(2)
|
Operating earnings for the years ended
November 30, 2014
,
2013
and
2012
included net earnings (loss) attributable to noncontrolling interests of
($22.5) million
,
$6.2 million
and
($14.4) million
, respectively.
|
104
LENNAR CORPORATION AND SUBSIDIARIES
NOTES TO CONSOLIDATED FINANCIAL STATEMENTS—(Continued)
The following is a detail of Rialto other income (expense), net for the periods indicated:
|
Years Ended November 30,
|
|||||||||
|
(In thousands)
|
2014
|
2013
|
2012
|
||||||
|
Realized gains on REO sales, net
|
$
|
43,671
|
|
48,785
|
|
21,649
|
|
||
|
Unrealized losses on transfer of loans receivable to REO and impairments, net
|
(26,107
|
)
|
(16,517
|
)
|
(11,160
|
)
|
|||
|
REO and other expenses
|
(58,067
|
)
|
(44,282
|
)
|
(56,745
|
)
|
|||
|
Rental and other income
|
43,898
|
|
20,269
|
|
16,476
|
|
|||
|
Gain on bargain purchase acquisition
|
—
|
|
8,532
|
|
—
|
|
|||
|
Rialto other income (expense), net
|
$
|
3,395
|
|
16,787
|
|
(29,780
|
)
|
||
Loans Receivable
In February 2010, the Rialto segment acquired indirectly
40%
managing member equity interests in two limited liability companies (“LLCs”), in partnership with the FDIC, which retained
60%
equity interest in the LLCs, for approximately
$243 million
(net of transaction costs and a
$22 million
working capital reserve). If the LLCs exceed expectations and meet certain internal rate of return and distribution thresholds, the Company’s equity interest in the LLCs could be reduced from
40%
down to
30%
, with a corresponding increase to the FDIC’s equity interest from
60%
up to
70%
. As these thresholds have not been met, distributions continue being shared
60%
/
40%
with the FDIC. During the years ended
November 30, 2014
and
2013
, the LLCs distributed
$184.9 million
and
$46.7 million
, respectively, of which
$110.9 million
and
$28.4 million
, respectively, was distributed to the FDIC and
$74.0 million
and
$18.3 million
, respectively, was distributed to Rialto, the parent company.
The LLCs meet the accounting definition of VIEs and since the Company was determined to be the primary beneficiary, the Company consolidated the LLCs. The Company was determined to be the primary beneficiary because it has the power to direct the activities of the LLCs that most significantly impact the LLCs’ performance through Rialto's management and servicer contracts. At
November 30, 2014
, these consolidated LLCs had total combined assets and liabilities of
$508.4 million
and
$21.5 million
, respectively. At
November 30, 2013
, these consolidated LLCs had total combined assets and liabilities of
$727.1 million
and
$20.2 million
, respectively.
In September 2010, the Rialto segment acquired approximately
400
distressed residential and commercial real estate loans (“Bank Portfolios”) and over
300
REO properties from three financial institutions. The Company paid
$310.0 million
for the distressed real estate and real estate related assets of which
$124 million
was financed through a
5
-year senior unsecured note provided by one of the selling institutions. As of
November 30, 2014
and
2013
, there was
$60.6 million
and
$90.9 million
outstanding, respectively.
In May 2014, Rialto issued
$73.8 million
principal amount of notes through a structured note offering (the "Structured Notes") collateralized by certain assets originally acquired in the Bank Portfolios transaction at a price of
100%
, with an annual coupon rate of
2.85%
. Proceeds from the offering, after payment of expenses and hold backs for a cash reserve, were
$69.1 million
. In November 2014, Rialto issued an additional
$20.8 million
of the Structured Notes at a price of
99.5%
, with an annual coupon rate of
5.0%
. Proceeds from the offering, after payment of expenses, were
$20.7 million
. The estimated final payment date of the Structured Notes is December 15, 2015. As of
November 30, 2014
, there was
$58.0 million
outstanding related to the Structured Notes.
The following table displays the loans receivable, net by aggregate collateral type:
|
November 30,
|
||||||
|
(In thousands)
|
2014
|
2013
|
||||
|
Land
|
$
|
89,603
|
|
166,950
|
|
|
|
Single family homes
|
20,402
|
|
59,647
|
|
||
|
Commercial properties
|
7,286
|
|
38,060
|
|
||
|
Other
|
12,814
|
|
13,735
|
|
||
|
Loans receivable, net
|
$
|
130,105
|
|
278,392
|
|
|
With regards to loans accounted for under ASC 310-30, the Rialto segment estimated the cash flows, at acquisition, it expected to collect on the FDIC Portfolios and Bank Portfolios. In accordance with ASC 310-30, the difference between the contractually required payments and the cash flows expected to be collected at acquisition is referred to as the nonaccretable difference. This difference is neither accreted into income nor recorded on the Company’s consolidated balance sheets. The
105
LENNAR CORPORATION AND SUBSIDIARIES
NOTES TO CONSOLIDATED FINANCIAL STATEMENTS—(Continued)
excess of cash flows expected to be collected over the cost of the loans acquired is referred to as the accretable yield and is recognized in interest income over the remaining life of the loans using the effective yield method.
The Rialto segment periodically evaluates its estimate of cash flows expected to be collected on its FDIC Portfolios and Bank Portfolios. These evaluations require the continued use of key assumptions and estimates, similar to those used in the initial estimate of fair value of the loans to allocate purchase price. Subsequent changes in the estimated cash flows expected to be collected may result in changes in the accretable yield and nonaccretable difference or reclassifications from nonaccretable yield to accretable yield. Increases in the cash flows expected to be collected will generally result in an increase in interest income over the remaining life of the loan or pool of loans. Decreases in expected cash flows will generally result in an impairment charge recognized as a provision for loan losses, resulting in an increase to the allowance for loan losses but can reversed if conditions improve.
During the fourth quarter of 2014, in an effort to better reflect the performance of the FDIC Portfolios and Bank Portfolios, the Company changed from recording accretable yield income on a loan pool basis to recording income on a cost recovery basis per loan as expected cash flows on the remaining loan portfolios could no longer be reasonably estimated. At
November 30, 2014
, these loans were classified as nonaccrual loans. The change from accrual to nonaccrual in accordance with ASC 310-30, resulted in an additional impairment charge of
$10.1 million
within the FDIC Portfolios and a recovery of
$0.1 million
in the Bank Portfolios.
The outstanding balance and carrying value of loans accounted for under ASC 310-30 were as follows:
|
November 30,
|
||||||
|
(In thousands)
|
2014
|
2013
|
||||
|
Outstanding principal balance
|
$
|
—
|
|
586,901
|
|
|
|
Carrying value
|
$
|
—
|
|
270,075
|
|
|
The activity in the accretable yield for the FDIC Portfolios and Bank Portfolios for the years ended
November 30, 2014
and
2013
was as follows:
|
November 30,
|
||||||
|
(In thousands)
|
2014
|
2013
|
||||
|
Accretable yield, beginning of year
|
$
|
73,144
|
|
112,899
|
|
|
|
Additions
|
8,988
|
|
70,077
|
|
||
|
Deletions
|
(54,482
|
)
|
(60,582
|
)
|
||
|
Accretions
|
(27,650
|
)
|
(49,250
|
)
|
||
|
Accretable yield, end of year
|
$
|
—
|
|
73,144
|
|
|
Additions primarily represent reclasses from nonaccretable yield to accretable yield on the portfolios. Deletions represent loan impairments, net of recoveries, and disposal of loans, which includes foreclosure of underlying collateral and result in the removal of the loans from the accretable yield portfolios. During the year ended
November 30, 2014
, deletions also included a reclassification to nonaccretable difference due to the change from accrual to nonaccrual described above.
When forecasted principal and interest cannot be reasonably estimated at the loan acquisition date, management classifies the loan as nonaccrual and accounts for these assets in accordance with ASC 310-10. When a loan is classified as nonaccrual, any subsequent cash receipt is accounted for using the cost recovery method. In accordance with ASC 310-10, a loan is considered impaired when based on current information and events it is probable that all amounts due according to the contractual terms of the loan agreement will not be collected. Although these loans met the definition of ASC 310-10, these loans were not considered impaired relative to the Company’s recorded investment at the time of the acquisition since they were acquired at a substantial discount to their unpaid principal balance. A provision for loan losses is recognized when the recorded investment in the loan is in excess of its fair value. The fair value of the loan is determined by using either the present value of expected future cash flows discounted at the loan’s effective interest rate or the fair value of the collateral less estimated costs to sell.
106
LENNAR CORPORATION AND SUBSIDIARIES
NOTES TO CONSOLIDATED FINANCIAL STATEMENTS—(Continued)
The following tables represents nonaccrual loans in the FDIC Portfolios and Bank Portfolios accounted for under ASC 310-10 aggregated by collateral type:
November 30, 2014
|
Recorded Investment
|
||||||||||||
|
(In thousands)
|
Unpaid
Principal
Balance
|
With
Allowance
|
Without
Allowance
|
Total
Recorded
Investment
|
||||||||
|
Land
|
$
|
228,245
|
|
85,912
|
|
3,691
|
|
89,603
|
|
|||
|
Single family homes
|
66,183
|
|
18,096
|
|
2,306
|
|
20,402
|
|
||||
|
Commercial properties
|
34,048
|
|
3,368
|
|
3,918
|
|
7,286
|
|
||||
|
Other
|
64,284
|
|
5
|
|
12,809
|
|
12,814
|
|
||||
|
Loans receivable
|
$
|
392,760
|
|
107,381
|
|
22,724
|
|
130,105
|
|
|||
November 30, 2013
|
Recorded Investment
|
||||||||||||
|
(In thousands)
|
Unpaid
Principal
Balance
|
With
Allowance
|
Without
Allowance
|
Total
Recorded
Investment
|
||||||||
|
Land
|
$
|
6,791
|
|
249
|
|
2,304
|
|
2,553
|
|
|||
|
Single family homes
|
15,125
|
|
519
|
|
4,119
|
|
4,638
|
|
||||
|
Commercial properties
|
3,400
|
|
498
|
|
628
|
|
1,126
|
|
||||
|
Loans receivable
|
$
|
25,316
|
|
1,266
|
|
7,051
|
|
8,317
|
|
|||
The average recorded investment in impaired loans totaled approximately
$69 million
and
$24 million
for the years ended
November 30, 2014
and
2013
, respectively.
The loans receivable portfolios consist of loans acquired at a discount. Based on the nature of these loans, the portfolios are managed by assessing the risks related to the likelihood of collection of payments from borrowers and guarantors, as well as monitoring the value of the underlying collateral.
Accrual
— Loans in which forecasted cash flows under the loan agreement, as it might be modified from time to time, can be reasonably estimated at the date of acquisition. The risk associated with loans in this category relates to the possible default by the borrower with respect to principal and interest payments and/or the possible decline in value of the underlying collateral and thus, both could cause a decline in the forecasted cash flows used to determine accretable yield income and the recognition of an impairment through an allowance for loan losses but can be reversed if conditions improve. The activity in the Company's allowance rollforward related to accrual loans was as follows:
|
November 30,
|
||||||
|
(In thousands)
|
2014
|
2013
|
||||
|
Allowance on accrual loans, beginning of year
|
$
|
18,952
|
|
12,178
|
|
|
|
Provision for loan losses
|
44,577
|
|
14,241
|
|
||
|
Reclassification to nonaccrual (1)
|
(53,265
|
)
|
—
|
|
||
|
Charge-offs
|
(10,264
|
)
|
(7,467
|
)
|
||
|
Allowance on accrual loans, end of year
|
$
|
—
|
|
18,952
|
|
|
|
(1)
|
During the fourth quarter of 2014, the Company changed from recording accretable yield income on a loan pool basis to recording income on a cost recovery basis per loan as expected cash flows on the remaining loan portfolios could no longer be reasonably estimated. At
November 30, 2014
, these loans were classified as nonaccrual loans.
|
Nonaccrual
— Loans in which forecasted principal and interest could not be reasonably estimated at the date of acquisition or subsequently. Although the Company believes the recorded investment balance will ultimately be realized, the risk of nonaccrual loans relates to a decline in the value of the collateral securing the outstanding obligation and the recognition of an impairment through an allowance for loan losses if the recorded investment in the loan exceeds the fair value of the collateral less estimated cost to sell. The activity in the Company's allowance rollforward related to nonaccrual loans was as follows:
107
LENNAR CORPORATION AND SUBSIDIARIES
NOTES TO CONSOLIDATED FINANCIAL STATEMENTS—(Continued)
|
November 30,
|
||||||
|
(In thousands)
|
2014
|
2013
|
||||
|
Allowance on nonaccrual loans, beginning of year
|
$
|
1,213
|
|
3,722
|
|
|
|
Provision for loan losses
|
12,536
|
|
1,898
|
|
||
|
Reclassification from accrual (1)
|
53,265
|
|
—
|
|
||
|
Charge-offs
|
(8,688
|
)
|
(4,407
|
)
|
||
|
Allowance on nonaccrual loans, end of year
|
$
|
58,326
|
|
1,213
|
|
|
|
(1)
|
During the fourth quarter of 2014, the Company changed from recording accretable yield income on a loan pool basis to recording income on a cost recovery basis per loan as expected cash flows on the remaining loan portfolios could no longer be reasonably estimated. At
November 30, 2014
, these loans were classified as nonaccrual loans.
|
Accrual and nonaccrual loans receivable, net by risk categories were as follows:
November 30, 2014
|
(In thousands)
|
Accrual
|
Nonaccrual
|
Total
|
||||||
|
Land
|
$
|
—
|
|
89,603
|
|
89,603
|
|
||
|
Single family homes
|
—
|
|
20,402
|
|
20,402
|
|
|||
|
Commercial properties
|
—
|
|
7,286
|
|
7,286
|
|
|||
|
Other
|
—
|
|
12,814
|
|
12,814
|
|
|||
|
Loans receivable, net
|
$
|
—
|
|
130,105
|
|
130,105
|
|
||
November 30, 2013
|
(In thousands)
|
Accrual
|
Nonaccrual
|
Total
|
||||||
|
Land
|
$
|
164,397
|
|
2,553
|
|
166,950
|
|
||
|
Single family homes
|
55,009
|
|
4,638
|
|
59,647
|
|
|||
|
Commercial properties
|
36,934
|
|
1,126
|
|
38,060
|
|
|||
|
Other
|
13,735
|
|
—
|
|
13,735
|
|
|||
|
Loans receivable
|
$
|
270,075
|
|
8,317
|
|
278,392
|
|
||
In order to assess the risk associated with each risk category, Rialto management evaluates the forecasted cash flows and the value of the underlying collateral securing loans receivable on a quarterly basis or when an event occurs that suggests a decline in the collaterals’ fair value.
Real Estate Owned
The acquisition of properties acquired through, or in lieu of, loan foreclosure are reported within the consolidated balance sheets as REO held-and-used, net and REO held-for-sale. When a property is determined to be held-and-used, net the asset is recorded at fair value and depreciated over its useful life using the straight line method. When certain criteria set forth in ASC 360,
Property, Plant and Equipment
, are met, the property is classified as held-for-sale. When a real estate asset is classified as held-for-sale, the property is recorded at the lower of its cost basis or fair value less estimated costs to sell. The fair value of REO held-for-sale is determined in part by placing reliance on third-party appraisals of the properties and/or internally prepared analyses of recent offers or prices on comparable properties in the proximate vicinity.
108
LENNAR CORPORATION AND SUBSIDIARIES
NOTES TO CONSOLIDATED FINANCIAL STATEMENTS—(Continued)
The following tables present the activity in REO:
|
November 30,
|
||||||
|
(In thousands)
|
2014
|
2013
|
||||
|
REO - held-for-sale, beginning of year
|
$
|
197,851
|
|
134,161
|
|
|
|
Additions
|
—
|
|
15,985
|
|
||
|
Improvements
|
8,176
|
|
5,791
|
|
||
|
Sales
|
(226,027
|
)
|
(190,430
|
)
|
||
|
Impairments and unrealized losses
|
(9,441
|
)
|
(5,573
|
)
|
||
|
Transfers to/from held-and-used, net (1)
|
219,976
|
|
247,397
|
|
||
|
Transfers to Lennar Homebuilding
|
—
|
|
(9,480
|
)
|
||
|
REO - held-for-sale, end of year
|
$
|
190,535
|
|
197,851
|
|
|
|
November 30,
|
||||||
|
(In thousands)
|
2014
|
2013
|
||||
|
REO - held-and-used, net, beginning of year
|
$
|
428,989
|
|
601,022
|
|
|
|
Additions
|
55,407
|
|
86,262
|
|
||
|
Improvements
|
6,102
|
|
3,616
|
|
||
|
Impairments
|
(11,501
|
)
|
(10,517
|
)
|
||
|
Depreciation
|
(3,226
|
)
|
(3,997
|
)
|
||
|
Transfers to held-for-sale (1)
|
(219,976
|
)
|
(247,397
|
)
|
||
|
REO - held-and-used, net, end of year
|
$
|
255,795
|
|
428,989
|
|
|
|
(1)
|
During the years ended
November 30, 2014
and
2013
, the Rialto segment transferred certain properties to/from REO held-and-used, net to REO held-for-sale as a result of changes made in the disposition strategy of the real estate assets.
|
For the years ended
November 30, 2014
,
2013
and
2012
, the Company recorded net losses of
$6.8 million
,
$0.4 million
and
$1.9 million
, respectively, from acquisitions of REO through foreclosure. These net losses are recorded in Rialto other income (expense), net.
Rialto Mortgage Finance
In July 2013, RMF was formed to originate and sell into securitizations
five
,
seven
and
ten
year commercial first mortgage loans, generally with principal amounts between
$2 million
and
$75 million
, which are secured by income producing properties. During the year ended
November 30, 2014
, RMF had originated loans with a total principal balance of
$1.6 billion
and sold
$1.3 billion
of these originated loans into
eight
separate securitizations. During the year ended
November 30, 2013
, RMF had originated loans with a principal balance of
$690.3 million
and sold
$537.0 million
of loans into three separate securitizations. As of
November 30, 2014
and
2013
,
$147.2 million
and
$109.3 million
, respectively, of these originated loans were sold into a securitization trust but not settled and thus were included as receivables, net. As of
November 30, 2014
and
2013
, RMF had
two
warehouse repurchase financing agreements that mature in fiscal year 2015 with commitments totaling
$650 million
and
$500 million
, respectively, to help finance the loans it makes. Borrowings under these facilities were
$141.3 million
and
$76.0 million
as of
November 30, 2014
and
2013
, respectively.
In November 2013, the Rialto segment issued
$250 million
aggregate principal amount of the
7.00%
Senior Notes, at a price of
100%
in a private placement. Proceeds from the offering, after payment of expenses, were approximately
$245 million
. Rialto used a majority of the net proceeds of the sale of the
7.00%
Senior Notes as working capital for RMF and used
$100 million
to repay sums that had been advanced to RMF from Lennar to enable it to begin originating and securitizing commercial mortgage loans. In March 2014, the Rialto segment issued an additional
$100 million
of the
7.00%
Senior Notes at a price of
102.25%
of their face value in a private placement. Proceeds from the offering, after payment of expenses, were approximately
$102 million
. Rialto used the net proceeds of the offering to provide additional working capital for RMF, and to make investments in the funds that Rialto manages, as well as for general corporate purposes. Interest on the
7.00%
Senior Notes is due semi-annually. At
November 30, 2014
and
2013
, the carrying amount of the
7.00%
Senior Notes was
$351.9 million
and
$250.0 million
, respectively. Under the indenture, Rialto is subject to certain covenants limiting, among other things, Rialto’s ability to incur indebtedness, to make investments, to make distributions to, or enter into transactions with, Lennar or to create liens, subject to certain exceptions and qualifications. Rialto also has quarterly and annual reporting
109
LENNAR CORPORATION AND SUBSIDIARIES
NOTES TO CONSOLIDATED FINANCIAL STATEMENTS—(Continued)
requirements, similar to an SEC registrant, to holders of the
7.00%
Senior Notes. The Company believes Rialto was in compliance with its debt covenants at
November 30, 2014
.
Investments
All of Rialto's investments in funds have the attributes of an investment company in accordance with ASC 946,
Financial Services – Investment Companies
, as amended by ASU 2013-08,
Financial Services - Investment Companies (Topic 946): Amendments to the Scope, Measurement, and Disclosure Requirements
, the attributes of which are different from the attributes that would cause a company to be an investment company for purposes of the Investment Company Act of 1940. As a result, the assets and liabilities of Rialto's funds investment are recorded at fair value with increases/decreases in fair value recorded in their respective statements of operations and the Company’s share is recorded in Rialto equity in earnings from unconsolidated entities in the Company's statement of operations.
The following table reflects Rialto's investments in funds that invest in and manage real estate related assets and other investments:
|
November 30,
2014 |
November 30,
2014 |
November 30,
2013 |
||||||||||||||||||||||
|
(Dollars in thousands)
|
Inception Year
|
Equity Commitments
|
Equity Commitments Called
|
Commitment to fund by the Company
|
Funds contributed by the Company
|
Investment
|
||||||||||||||||||
|
Rialto Real Estate Fund, LP
|
2010
|
$
|
700,006
|
|
$
|
700,006
|
|
$
|
75,000
|
|
$
|
75,000
|
|
$
|
71,831
|
|
75,729
|
|
||||||
|
Rialto Real Estate Fund II, LP
|
2012
|
1,305,000
|
|
760,058
|
|
100,000
|
|
58,242
|
|
67,652
|
|
53,103
|
|
|||||||||||
|
Rialto Mezzanine Partners Fund
|
2013
|
251,100
|
|
188,600
|
|
27,299
|
|
20,504
|
|
20,226
|
|
16,724
|
|
|||||||||||
|
Other investments
|
15,991
|
|
9,017
|
|
||||||||||||||||||||
|
$
|
175,700
|
|
154,573
|
|
||||||||||||||||||||
Rialto's share of earnings from unconsolidated entities was as follows:
|
Years Ended November 30,
|
|||||||||
|
(In thousands)
|
2014
|
2013
|
2012
|
||||||
|
Rialto Real Estate Fund, LP
|
$
|
30,612
|
|
19,391
|
|
21,026
|
|
||
|
Rialto Real Estate Fund II, LP
|
15,929
|
|
2,523
|
|
—
|
|
|||
|
Rialto Mezzanine Partners Fund
|
1,913
|
|
354
|
|
—
|
|
|||
|
Other investments
|
10,823
|
|
85
|
|
20,457
|
|
|||
|
Rialto equity in earnings from unconsolidated entities
|
$
|
59,277
|
|
22,353
|
|
41,483
|
|
||
During the year ended
November 30, 2014
, the Company received a
$34.7 million
advanced distribution with regard to Rialto's carried interest in Fund I in order to cover the income tax obligation, which resulted from allocations of taxable income to Rialto's general partner interest. This was included in the Rialto segment revenues.
In addition to the acquisition and management of the FDIC and Bank portfolios, an affiliate in the Rialto segment was a sub-advisor to the AllianceBernstein L.P. (“AB”) fund formed under the Federal government’s Public-Private Investment Program (“PPIP”) to purchase real estate related securities from banks and other financial institutions. The sub-advisor received management fees for sub-advisory services. At the end of 2012, the AB PPIP fund finalized the last sales of the underlying securities in the fund and made substantially all of the final liquidating distributions to the partners, including the Company. As the Company’s role as sub-advisor to the AB PPIP fund has been completed, no further management fees will be received for these services. During the year ended November 30, 2012, the Company contributed
$1.9 million
and received distributions of
$87.6 million
. Of the distributions received during the year ended November 30, 2012,
$83.5 million
related to the unwinding of the AB PPIP fund's operations. During the year ended November 30, 2013, the Company also earned
$9.1 million
in fees from the segment's role as a sub-advisor to the AB PPIP fund, which were included in the Rialto segment revenues.
110
LENNAR CORPORATION AND SUBSIDIARIES
NOTES TO CONSOLIDATED FINANCIAL STATEMENTS—(Continued)
Summarized condensed financial information on a combined
100%
basis related to Rialto’s investments in unconsolidated entities that are accounted for by the equity method was as follows:
|
Balance Sheets
|
||||||
|
|
November 30,
|
|||||
|
(In thousands)
|
2014
|
2013
|
||||
|
Assets:
|
||||||
|
Cash and cash equivalents
|
$
|
141,609
|
|
332,968
|
|
|
|
Loans receivable
|
512,034
|
|
523,249
|
|
||
|
Real estate owned
|
378,702
|
|
285,565
|
|
||
|
Investment securities
|
795,306
|
|
381,555
|
|
||
|
Investments in partnerships
|
311,037
|
|
149,350
|
|
||
|
Other assets
|
45,451
|
|
191,624
|
|
||
|
$
|
2,184,139
|
|
1,864,311
|
|
||
|
Liabilities and equity:
|
||||||
|
Accounts payable and other liabilities
|
$
|
20,573
|
|
108,514
|
|
|
|
Notes payable
|
395,654
|
|
398,445
|
|
||
|
Partner loans
|
—
|
|
163,940
|
|
||
|
Equity
|
1,767,912
|
|
1,193,412
|
|
||
|
$
|
2,184,139
|
|
1,864,311
|
|
||
|
Statements of Operations
|
|||||||||
|
|
Years Ended November 30,
|
||||||||
|
(In thousands)
|
2014
|
2013
|
2012
|
||||||
|
Revenues
|
$
|
150,452
|
|
251,533
|
|
414,027
|
|
||
|
Costs and expenses
|
95,629
|
|
252,563
|
|
243,483
|
|
|||
|
Other income, net (1)
|
479,929
|
|
187,446
|
|
713,710
|
|
|||
|
Net earnings of unconsolidated entities
|
$
|
534,752
|
|
186,416
|
|
884,254
|
|
||
|
Rialto equity in earnings from unconsolidated entities
|
$
|
59,277
|
|
22,353
|
|
41,483
|
|
||
|
(1)
|
Other income, net for the year ended November 30, 2014 included Fund I, Fund II, Mezzanine Fund and other investments realized and unrealized gains on investments as well as other income from REO. Other income, net for the year ended November 30, 2013 included Fund I, Fund II and other investments realized and unrealized gains on investments as well as other income from REO. Other income, net for the year ended November 30, 2012 included the AB PPIP Fund’s mark-to-market unrealized gains and losses, and realized gains from the sale of investments in the portfolio underlying the AB PPIP fund, all of which the Company's portion was a small percentage.
|
In 2010, the Rialto segment invested in non-investment grade CMBS at a
55%
discount to par value. The carrying value of the investment securities at
November 30, 2014
and
2013
was
$17.3 million
and
$16.1 million
, respectively. These securities bear interest at a coupon rate of
4%
and have a stated and assumed final distribution date of November 2020 and a stated maturity date of October 2057. The Rialto segment reviews changes in estimated cash flows periodically to determine if other-than-temporary impairment has occurred on its investment securities. Based on the Rialto segment’s assessment,
no
impairment charges were recorded during the years ended
November 30, 2014
,
2013
and
2012
. The Rialto segment classified these securities as held-to-maturity based on its intent and ability to hold the securities until maturity.
In a CMBS transaction, monthly interest received from all of the pooled loans is paid to the investors, starting with those investors holding the highest rated bonds and progressing in an order of seniority based on the class of security. Based on the aforementioned, the principal and interest repayments of a particular class are dependent upon collections on the underlying mortgages, which are affected by prepayments, extensions and defaults.
In January 2014, Rialto acquired 100% of the Servicer Provider in which a subsidiary of Rialto had an approximately
5%
investment, in exchange for its investment interest. The Servicer Provider has a business segment that provides service and infrastructure to the residential home loan market, which provides loan servicing support for all of Rialto's owned and managed portfolios and asset management services for Rialto's small balance loan program. At acquisition date, the fair value of the assets acquired was
$20.8 million
, the goodwill recorded was
$5.1 million
and the fair value of the liabilities assumed was
111
LENNAR CORPORATION AND SUBSIDIARIES
NOTES TO CONSOLIDATED FINANCIAL STATEMENTS—(Continued)
$17.6 million
. As of November 30, 2013, the carrying value of the Company’s investment in the Servicer Provider was
$8.3 million
.
9. Lennar Multifamily Segment
The Company is actively involved, primarily through unconsolidated entities, in the development of multifamily rental properties. The Lennar Multifamily segment focuses on developing a geographically diversified portfolio of institutional quality multifamily rental properties in select U.S. markets.
The assets and liabilities related to the Lennar Multifamily segment were as follows:
|
November 30,
|
||||||
|
(In thousands)
|
2014
|
2013
|
||||
|
Assets:
|
||||||
|
Cash and cash equivalents
|
$
|
2,186
|
|
519
|
|
|
|
Land under development
|
120,666
|
|
88,260
|
|
||
|
Consolidated inventory not owned
|
5,508
|
|
10,500
|
|
||
|
Investments in unconsolidated entities
|
105,674
|
|
46,301
|
|
||
|
Operating properties and equipment
|
15,740
|
|
—
|
|
||
|
Other assets
|
18,240
|
|
1,509
|
|
||
|
$
|
268,014
|
|
147,089
|
|
||
|
Liabilities:
|
||||||
|
Accounts payable and other liabilities
|
$
|
48,235
|
|
17,518
|
|
|
|
Notes payable
|
—
|
|
13,858
|
|
||
|
Liabilities related to consolidated inventory not owned
|
4,008
|
|
10,150
|
|
||
|
$
|
52,243
|
|
41,526
|
|
||
The unconsolidated entities in which the Lennar Multifamily segment has investments usually finance their activities with a combination of partner equity and debt financing. In connection with many of the loans to Lennar Multifamily unconsolidated entities, the Company (or entities related to them) have been required to give guarantees of completion and cost over-runs to the lenders and partners. Those completion guarantees may require that the guarantors complete the construction of the improvements for which the financing was obtained. If the construction is to be done in phases, the guarantee generally is limited to completing only the phases as to which construction has already commenced and for which loan proceeds were used. Additionally, the Company guarantees the construction costs of the project. Generally construction cost over-runs would be paid by the Company. Generally, these payments are increases to our investments in the entities and would increase our share of funds the entities distribute after the achievement of certain thresholds. As of both
November 30, 2014
and
2013
, the fair value of the completion guarantees was immaterial. Additionally, as of
November 30, 2014
and
2013
, the Lennar Multifamily segment had
$23.5 million
and
$28.2 million
, respectively, of letters of credit outstanding primarily for credit enhancements for the bank debt of certain of its unconsolidated entities. These letters of credit outstanding were included in the disclosure in Note 6 related to the Company's performance and financial letters of credit. As of
November 30, 2014
and
2013
, the Lennar Multifamily segment's unconsolidated entities had non-recourse debt with completion guarantees of
$163.4 million
and
$51.6 million
, respectively.
In many instances, the Lennar Multifamily segment is appointed as the day-to-day manager of certain of its Lennar Multifamily unconsolidated entities and receives fees for performing this function. During the years ended
November 30, 2014
and
2013
, the Lennar Multifamily segment received fees from its unconsolidated entities totaling
$13.5 million
and
$4.0 million
, respectively.
During the year ended
November 30, 2014
, the Lennar Multifamily segment provided general contractors services for the construction of some of its rental properties and received fees totaling
$50.9 million
, which are offset by costs related to those services of
$49.0 million
.
112
LENNAR CORPORATION AND SUBSIDIARIES
NOTES TO CONSOLIDATED FINANCIAL STATEMENTS—(Continued)
Summarized condensed financial information on a combined
100%
basis related to Lennar Multifamily's investments in unconsolidated entities that are accounted for by the equity method was as follows:
|
Balance Sheets
|
||||||
|
|
November 30,
|
|||||
|
(In thousands)
|
2014
|
2013
|
||||
|
Assets:
|
||||||
|
Cash and cash equivalents
|
$
|
25,319
|
|
5,800
|
|
|
|
Operating properties and equipment
|
637,259
|
|
236,528
|
|
||
|
Other assets
|
14,742
|
|
3,460
|
|
||
|
$
|
677,320
|
|
245,788
|
|
||
|
Liabilities and equity:
|
||||||
|
Accounts payable and other liabilities
|
$
|
87,151
|
|
11,147
|
|
|
|
Notes payable
|
163,376
|
|
51,604
|
|
||
|
Equity
|
426,793
|
|
183,037
|
|
||
|
$
|
677,320
|
|
245,788
|
|
||
|
Statements of Operations
|
|||||||||
|
|
Years Ended November 30,
|
||||||||
|
(In thousands)
|
2014
|
2013
|
2012
|
||||||
|
Revenues
|
$
|
4,855
|
|
—
|
|
—
|
|
||
|
Costs and expenses
|
7,435
|
|
1,493
|
|
29
|
|
|||
|
Other income, net (1)
|
35,068
|
|
—
|
|
—
|
|
|||
|
Net earnings (loss) of unconsolidated entities
|
$
|
32,488
|
|
(1,493
|
)
|
(29
|
)
|
||
|
Lennar Multifamily equity in earnings (loss) from unconsolidated entities (2)
|
$
|
14,454
|
|
(271
|
)
|
(4
|
)
|
||
|
(1)
|
Other income, net, included the gains related to the sale of two operating properties during the year ended
November 30, 2014
.
|
|
(2)
|
For the year ended
November 30, 2014
, Lennar Multifamily equity in earnings from unconsolidated entities included Lennar Multifamily's share of gains totaling
$14.7 million
related to the sale of two operating properties by unconsolidated entities. The Company’s share of profits and cash distributions from the sales of the two operating properties was higher compared to the Company’s ownership interests in the two unconsolidated entities due to the achievement of specified internal rate of return milestones.
|
10. Income Taxes
The benefit (provision) for income taxes consisted of the following:
|
Years Ended November 30,
|
|||||||||
|
(In thousands)
|
2014
|
2013
|
2012
|
||||||
|
Current:
|
|||||||||
|
Federal
|
$
|
(261,306
|
)
|
(2,495
|
)
|
(3,790
|
)
|
||
|
State
|
3,340
|
|
(5,740
|
)
|
(5,860
|
)
|
|||
|
$
|
(257,966
|
)
|
(8,235
|
)
|
(9,650
|
)
|
|||
|
Deferred:
|
|||||||||
|
Federal
|
$
|
(42,847
|
)
|
(207,588
|
)
|
350,165
|
|
||
|
State
|
(40,278
|
)
|
38,808
|
|
94,703
|
|
|||
|
(83,125
|
)
|
(168,780
|
)
|
444,868
|
|
||||
|
$
|
(341,091
|
)
|
(177,015
|
)
|
435,218
|
|
|||
113
LENNAR CORPORATION AND SUBSIDIARIES
NOTES TO CONSOLIDATED FINANCIAL STATEMENTS—(Continued)
A reconciliation of the statutory rate and the effective tax rate was as follows:
|
Percentage of Pretax Income
|
||||||||
|
2014
|
2013
|
2012
|
||||||
|
Statutory rate
|
35.00
|
%
|
35.00
|
%
|
35.00
|
%
|
||
|
State income taxes, net of federal income tax benefit
|
3.17
|
|
3.16
|
|
3.79
|
|
||
|
Domestic production activities deduction
|
(2.81
|
)
|
—
|
|
—
|
|
||
|
Tax reserves and interest expense
|
0.59
|
|
0.56
|
|
5.00
|
|
||
|
Deferred tax asset valuation reversal
|
(0.28
|
)
|
(10.22
|
)
|
(212.55
|
)
|
||
|
Tax credits
|
(0.41
|
)
|
(0.45
|
)
|
(0.10
|
)
|
||
|
Net operating loss adjustment (1)
|
—
|
|
—
|
|
(8.32
|
)
|
||
|
Nondeductible compensation
|
—
|
|
—
|
|
0.40
|
|
||
|
Other
|
(0.46
|
)
|
(1.09
|
)
|
(1.65
|
)
|
||
|
Effective rate
|
34.80
|
%
|
26.96
|
%
|
(178.43
|
%)
|
||
|
(1)
|
During the year ended November 30, 2012, the Company recorded adjustments to its NOL carryforwards as a result of the conclusion of an IRS examination and additional state net operating loss adjustments.
|
Deferred income taxes reflect the net tax effects of temporary differences between the carrying amounts of the assets and liabilities for financial reporting purposes and the amounts used for income tax purposes. The tax effects of significant temporary differences that give rise to the net deferred tax assets were as follows:
|
November 30,
|
||||||
|
(In thousands)
|
2014
|
2013
|
||||
|
Deferred tax assets:
|
||||||
|
Inventory valuation adjustments
|
$
|
59,208
|
|
68,170
|
|
|
|
Reserves and accruals
|
158,858
|
|
125,756
|
|
||
|
Net operating loss carryforwards
|
115,850
|
|
231,735
|
|
||
|
Capitalized expenses
|
66,768
|
|
71,739
|
|
||
|
Investments in unconsolidated entities
|
24,843
|
|
1,012
|
|
||
|
Other assets
|
32,904
|
|
29,017
|
|
||
|
Total deferred tax assets
|
458,431
|
|
527,429
|
|
||
|
Valuation allowance
|
(8,029
|
)
|
(12,705
|
)
|
||
|
Total deferred tax assets after valuation allowance
|
450,402
|
|
514,724
|
|
||
|
Deferred tax liabilities:
|
||||||
|
Capitalized expenses
|
64,448
|
|
75,921
|
|
||
|
Convertible debt basis difference
|
5,833
|
|
11,684
|
|
||
|
Rialto investments
|
22,262
|
|
16,268
|
|
||
|
Deferred income
|
7,707
|
|
4,467
|
|
||
|
Other
|
36,323
|
|
29,585
|
|
||
|
Total deferred tax liabilities
|
136,573
|
|
137,925
|
|
||
|
Net deferred tax assets
|
$
|
313,829
|
|
376,799
|
|
|
114
LENNAR CORPORATION AND SUBSIDIARIES
NOTES TO CONSOLIDATED FINANCIAL STATEMENTS—(Continued)
The detail of the Company's net deferred tax assets were as follows:
|
November 30,
|
|||||||
|
(In thousands)
|
2014
|
2013
|
|||||
|
Deferred tax assets (liabilities)
|
Balance Sheet Presentation
|
||||||
|
Lennar Homebuilding
|
Other assets
|
$
|
325,779
|
|
388,647
|
|
|
|
Rialto
|
Other liabilities
|
(3,335
|
)
|
(7,815
|
)
|
||
|
Lennar Financial Services
|
Other liabilities
|
(8,615
|
)
|
(4,033
|
)
|
||
|
Net deferred tax assets
|
$
|
313,829
|
|
376,799
|
|
||
As of
November 30, 2014
and 2013, the net deferred tax assets included a valuation allowance of
$8.0 million
and
$12.7 million
, respectively, primarily related to state net operating loss ("NOL") carryforwards that are not more likely than not to be utilized due to an inability to carry back these losses in most states and short carryforward periods that exist in certain states. During the year ended
November 30, 2014
, the Company reversed
$4.7 million
of valuation allowance, primarily due to the utilization of federal and state net operating losses. The Company continues to evaluate both positive and negative evidence in determining the need for a valuation allowance with respect to its tax benefits for state NOL carryforwards. In future periods, the remaining allowance could be reversed if additional sufficient positive evidence is present indicating that it is more likely than not that a portion or all of the Company's remaining deferred tax assets will be realized.
During the year ended November 30, 2013, the Company concluded that it was more likely than not that the majority of its deferred tax assets would be utilized. This conclusion was based on a detailed evaluation of all relevant evidence, both positive and negative. The positive evidence included factors such as consecutive quarters of earnings, actual and forecasted profitability, generating cumulative pre-tax earnings over a rolling
four
year period including the pre-tax earnings achieved during 2013, the expectation of continued earnings and evidence of a sustained recovery in the housing markets that the Company operates.
For the year ended November 30, 2013, the Company reversed
$67.1 million
of its valuation allowance primarily against its state deferred tax assets. This reversal was offset by a tax provision of
$244.1 million
, primarily related to pre-tax earnings during the year ended November 30, 2013, resulting in a
$177.0 million
provision for income taxes for the year ended November 30, 2013.
At
November 30, 2014
and
2013
, the Company had federal tax effected NOL carryforwards totaling
$2.0 million
and
$88.1 million
, respectively, that may be carried forward up to
20
years to offset future taxable income and begin to expire in 2025. At
November 30, 2014
and
2013
, the Company had state tax effected NOL carryforwards totaling
$113.8 million
and
$143.6 million
, respectively, that may be carried forward from
5
to
20
years, depending on the tax jurisdiction, with losses expiring between
2015 and 2034
. As of
November 30, 2014
, state tax effected NOL carryforwards totaling
$2.0 million
may expire over the next twelve months, if sufficient taxable income is not generated to utilize the NOLs.
The following table summarizes the changes in gross unrecognized tax benefits:
|
Years Ended November 30,
|
|||||||||
|
(In thousands)
|
2014
|
2013
|
2012
|
||||||
|
Gross unrecognized tax benefits, beginning of year
|
$
|
10,459
|
|
12,297
|
|
36,739
|
|
||
|
Increases due to tax positions taken during the period (1)
|
—
|
|
1,982
|
|
—
|
|
|||
|
Decreases due to settlements with taxing authorities (2)
|
(3,202
|
)
|
(3,820
|
)
|
(24,442
|
)
|
|||
|
Gross unrecognized tax benefits, end of year
|
$
|
7,257
|
|
10,459
|
|
12,297
|
|
||
|
(1)
|
Increased the Company's effective tax rate for the year ended November 30, 2013 from
26.71%
to
26.96%
.
|
|
(2)
|
Decreased the Company's effective tax rate for the year ended November 30, 2014 from
35.13%
to
34.80%
and for the year ended November 30, 2012 from
(178.03)%
to
(178.43)%
. The decrease for the year ended November 30, 2013 had no effect on the Company's effective tax rate.
|
If the Company were to recognize its gross unrecognized tax benefits as of
November 30, 2014
,
$4.7 million
would affect the Company’s effective tax rate. The Company does not expect the total amount of unrecognized tax benefits to increase or decrease by a material amount within the following twelve months.
At
November 30, 2014
and
2013
, the Company had
$31.5 million
and
$19.1 million
, respectively, accrued for interest and penalties, of which
$14.0 million
and
$3.8 million
, were recorded during the years ended
November 30, 2014
and
2013
, respectively. During the years ended
November 30, 2014
and
2013
, the accrual for interest and penalties was reduced by
$1.6
115
LENNAR CORPORATION AND SUBSIDIARIES
NOTES TO CONSOLIDATED FINANCIAL STATEMENTS—(Continued)
million
and
$5.2 million
, respectively, as a result of the payment of interest related to state tax payments resulting from settled IRS examinations and various state issues.
The IRS is currently examining the Company’s federal income tax return for fiscal year 2013, and certain state taxing authorities are examining various fiscal years. The final outcome of these examinations is not yet determinable. The statute of limitations for the Company’s major tax jurisdictions remains open for examination for fiscal year 2005 and subsequent years. The Company participates in an IRS examination program, Compliance Assurance Process, "CAP." This program operates as a contemporaneous exam throughout the year in order to keep exam cycles current and achieve a higher level of compliance.
11. Earnings Per Share
Basic and diluted earnings per share were calculated as follows:
|
Years Ended November 30,
|
|||||||||
|
(In thousands, except per share amounts)
|
2014
|
2013
|
2012
|
||||||
|
Numerator:
|
|||||||||
|
Net earnings attributable to Lennar
|
$
|
638,916
|
|
479,674
|
|
679,124
|
|
||
|
Less: distributed earnings allocated to nonvested shares
|
414
|
|
458
|
|
531
|
|
|||
|
Less: undistributed earnings allocated to nonvested shares
|
7,379
|
|
6,356
|
|
10,397
|
|
|||
|
Numerator for basic earnings per share
|
631,123
|
|
472,860
|
|
668,196
|
|
|||
|
Plus: interest on 3.25% convertible senior notes due 2021 and 2.00% convertible senior notes due 2020 (1)
|
7,928
|
|
11,302
|
|
11,330
|
|
|||
|
Plus: undistributed earnings allocated to convertible shares
|
7,379
|
|
6,356
|
|
10,397
|
|
|||
|
Less: undistributed earnings reallocated to convertible shares
|
6,632
|
|
5,506
|
|
9,050
|
|
|||
|
Numerator for diluted earnings per share
|
$
|
639,798
|
|
485,012
|
|
680,873
|
|
||
|
Denominator:
|
|||||||||
|
Denominator for basic earnings per share - weighted average common shares outstanding
|
202,209
|
|
190,473
|
|
186,662
|
|
|||
|
Effect of dilutive securities:
|
|||||||||
|
Shared based payments
|
8
|
|
254
|
|
984
|
|
|||
|
Convertible senior notes
|
26,023
|
|
35,193
|
|
31,049
|
|
|||
|
Denominator for diluted earnings per share - weighted average common shares outstanding
|
228,240
|
|
225,920
|
|
218,695
|
|
|||
|
Basic earnings per share
|
$
|
3.12
|
|
2.48
|
|
3.58
|
|
||
|
Diluted earnings per share
|
$
|
2.80
|
|
2.15
|
|
3.11
|
|
||
|
(1)
|
Interest on the 2.00% convertible senior notes due 2020 was included for the years ended November 30, 2013 and
2012
because the holders of the 2.00% convertible senior notes due 2020 converted the notes into shares of Class A common stock on November 30, 2013.
|
For the years ended
November 30, 2014
,
2013
and
2012
, there were
no
options to purchase shares of common stock that were outstanding and anti-dilutive.
12. Comprehensive Income (Loss)
Comprehensive income attributable to Lennar represents changes in stockholders’ equity from non-owner sources. For the years ended
November 30, 2014
,
2013
and
2012
, comprehensive income attributable to Lennar was the same as net earnings attributable to Lennar. Comprehensive income (loss) attributable to noncontrolling interests for the years ended
November 30, 2014
,
2013
and
2012
was the same as the net earnings (loss) attributable to noncontrolling interests. There was
no
accumulated other comprehensive income at
November 30, 2014
and
2013
.
13. Capital Stock
Preferred Stock
The Company is authorized to issue
500,000
shares of preferred stock with a par value of
$10
per share and
100 million
shares of participating preferred stock with a par value of
$0.10
per share.
No
shares of preferred stock or participating preferred stock have been issued as of
November 30, 2014
and
2013
.
116
LENNAR CORPORATION AND SUBSIDIARIES
NOTES TO CONSOLIDATED FINANCIAL STATEMENTS—(Continued)
Common Stock
During the years ended
November 30, 2014
,
2013
and
2012
, the Company’s Class A and Class B common stockholders received a per share annual dividend of
$0.16
. The only significant difference between the Class A common stock and Class B common stock is that Class A common stock entitles holders to
one
vote per share and the Class B common stock entitles holders to
ten
votes per share.
As of
November 30, 2014
, Stuart A. Miller, the Company’s Chief Executive Officer and a Director, directly owned, or controlled through family-owned entities, shares of Class A and Class B common stock, which represented approximately
44%
voting power of the Company’s stock.
The Company has a stock repurchase program, which originally authorized the purchase up to
20 million
shares of its outstanding common stock. During the years ended
November 30, 2014
,
2013
and
2012
, there were
no
share repurchases of common stock under the stock repurchase program. As of
November 30, 2014
, the remaining authorized shares that can be purchased under the stock repurchase program were
6.2 million
shares of common stock.
During the year ended
November 30, 2014
, treasury stock decreased by
11.6 million
shares of Class A common stock primarily due to the retirement of
11.7 million
shares of Class A common stock authorized by the Company's Board of Directors, partially offset by activity related to the Company's equity compensation plan. The retirement of Class A common stock resulted in a reclass between treasury stock and additional paid-in capital within stockholders' equity. During the year ended
November 30, 2013
, treasury stock decreased by
0.4 million
shares of Class A common stock due to activity related to the Company’s equity compensation plan.
Restrictions on Payment of Dividends
There are no restrictions on the payment of dividends on common stock by the Company.
There are no agreements which restrict the payment of dividends by subsidiaries of the Company other than to maintain the financial ratios and net worth requirements under the Lennar Financial Services segment’s warehouse lines of credit, which restrict the payment of dividends from the Company’s mortgage subsidiaries following the occurrence and during the continuance of an event of default thereunder and limit dividends to 50% of net income in the absence of an event of default and the restriction under Rialto's 7.00% Senior Notes indenture that limits Rialto's ability to make distributions to Lennar.
401(k) Plan
Under the Company’s 401(k) Plan (the “Plan”), contributions made by associates can be invested in a variety of mutual funds or proprietary funds provided by the Plan trustee. The Company may also make contributions for the benefit of associates. The Company records as compensation expense its contribution to the Plan. For the years ended
November 30, 2014
,
2013
and
2012
, this amount was
$10.2 million
,
$8.0 million
and
$6.2 million
, respectively.
14. Share-Based Payments
Compensation expense related to the Company’s share-based awards was as follows:
|
Years ended November 30,
|
|||||||||
|
(In thousands)
|
2014
|
2013
|
2012
|
||||||
|
Stock options
|
$
|
137
|
|
130
|
|
2,433
|
|
||
|
Nonvested shares
|
40,581
|
|
33,559
|
|
29,312
|
|
|||
|
Total compensation expense for share-based awards
|
$
|
40,718
|
|
33,689
|
|
31,745
|
|
||
Cash flows resulting from tax benefits related to tax deductions in excess of the compensation expense recognized are classified as financing cash flows. For the years ended
November 30, 2014
,
2013
and
2012
there was
$7.5 million
,
$10.1 million
and
$10.8 million
, respectively, of excess tax benefits from share based awards.
Cash received from stock options exercised during the years ended
November 30, 2014
,
2013
and
2012
was
$0.3 million
,
$16.7 million
and
$26.5 million
, respectively. The tax benefit related to stock options exercised during the years ended
November 30, 2014
,
2013
, and
2012
was
$0.1 million
,
$12.0 million
and
$14.8 million
, respectively.
The fair value of each of the Company’s stock option awards is estimated on the date of grant using a Black-Scholes option-pricing model that uses the assumptions noted in the table below. The fair value of the Company’s stock option awards, which are subject to graded vesting, is expensed on a straight-line basis over the vesting life of the stock options. Expected volatility is based on historical volatility of the Company’s stock over the most recent period equal to the expected life of the award. The risk-free rate for periods within the contractual life of the stock option award is based on the yield curve of a zero-
117
LENNAR CORPORATION AND SUBSIDIARIES
NOTES TO CONSOLIDATED FINANCIAL STATEMENTS—(Continued)
coupon U.S. Treasury bond on the date the stock option award is granted with a maturity equal to the expected term of the stock option award granted. The Company uses historical data to estimate stock option exercises and forfeitures within its valuation model. The expected life of stock option awards granted is derived from historical exercise experience under the Company’s share-based payment plans and represents the period of time that stock option awards granted are expected to be outstanding.
The fair value of these options was determined at the date of the grant using the Black-Scholes option-pricing model. The significant weighted average assumptions were as follows:
|
2014
|
2013
|
2012
|
|||
|
Dividends yield
|
0.4%
|
0.4%
|
0.6%
|
||
|
Volatility rate
|
35.6%
|
35.3%
|
47%
|
||
|
Risk-free interest rate
|
0.2%
|
0.2%
|
0.2%
|
||
|
Expected option life (years)
|
1.5
|
1.5
|
1.5
|
||
A summary of the Company’s stock option activity for the year ended
November 30, 2014
was as follows:
|
Stock Options
|
Weighted Average Exercise Price
|
Weighted Average Remaining Contractual Life
|
Aggregate Intrinsic Value
(In thousands)
|
|||||||||
|
Outstanding at November 30, 2013
|
52,500
|
|
$
|
28.62
|
|
|||||||
|
Grants
|
20,000
|
|
$
|
39.62
|
|
|||||||
|
Exercises
|
(15,000
|
)
|
$
|
18.19
|
|
|||||||
|
Outstanding at November 30, 2014
|
57,500
|
|
$
|
35.16
|
|
1.4 years
|
$
|
694
|
|
|||
|
Vested and expected to vest in the future at November 30, 2014
|
57,500
|
|
$
|
35.16
|
|
1.4 years
|
$
|
694
|
|
|||
|
Exercisable at November 30, 2014
|
57,500
|
|
$
|
35.16
|
|
1.4 years
|
$
|
694
|
|
|||
|
Available for grant at November 30, 2014
|
9,551,316
|
|
||||||||||
The weighted average fair value of options granted during the years ended
November 30, 2014
,
2013
and
2012
was
$6.76
,
$6.59
and
$5.72
, respectively. The total intrinsic value of options exercised during the years ended
November 30, 2014
,
2013
and
2012
was
$0.3 million
,
$30.8 million
and
$38.1 million
, respectively.
The fair value of nonvested shares is determined based on the trading price of the Company’s common stock on the grant date. The weighted average fair value of nonvested shares granted during the years ended
November 30, 2014
,
2013
and
2012
was
$41.89
,
$35.04
and
$30.62
, respectively. A summary of the Company’s nonvested shares activity for the year ended
November 30, 2014
was as follows:
|
Shares
|
Weighted Average Grant Date Fair Value
|
|||||
|
Nonvested restricted shares at November 30, 2013
|
2,472,068
|
|
$
|
30.66
|
|
|
|
Grants
|
1,119,356
|
|
$
|
41.89
|
|
|
|
Vested
|
(1,244,045
|
)
|
$
|
28.23
|
|
|
|
Forfeited
|
(58,253
|
)
|
$
|
34.12
|
|
|
|
Nonvested restricted shares at November 30, 2014
|
2,289,126
|
|
$
|
37.38
|
|
|
At
November 30, 2014
, there was
$67.9 million
of unrecognized compensation expense related to unvested share-based awards granted under the Company’s share-based payment plan, all of which relates to nonvested shares with a weighted average remaining contractual life of
2.0
years. During the years ended
November 30, 2014
,
2013
and
2012
,
1.2 million
nonvested shares,
1.3 million
nonvested shares and
1.7 million
nonvested shares, respectively, vested. For the years ended
November 30, 2014
,
2013
, and
2012
, the Company recorded an excess tax benefit related to nonvested share activity of
$7.4 million
,
$6.9 million
and
$11.7 million
, respectively.
118
LENNAR CORPORATION AND SUBSIDIARIES
NOTES TO CONSOLIDATED FINANCIAL STATEMENTS—(Continued)
15. Financial Instruments and Fair Value Disclosures
The following table presents the carrying amounts and estimated fair values of financial instruments held by the Company at
November 30, 2014
and
2013
, using available market information and what the Company believes to be appropriate valuation methodologies. Considerable judgment is required in interpreting market data to develop the estimates of fair value. The use of different market assumptions and/or estimation methodologies might have a material effect on the estimated fair value amounts. The table excludes cash and cash equivalents, restricted cash, receivables, net, and accounts payable, all of which had fair values approximating their carrying amounts due to the short maturities and liquidity of these instruments.
|
November 30,
|
||||||||||||||
|
2014
|
2013
|
|||||||||||||
|
Fair Value
|
Carrying
|
Fair
|
Carrying
|
Fair
|
||||||||||
|
(In thousands)
|
Hierarchy
|
Amount
|
Value
|
Amount
|
Value
|
|||||||||
|
ASSETS
|
||||||||||||||
|
Rialto:
|
||||||||||||||
|
Loans receivable, net
|
Level 3
|
$
|
130,105
|
|
135,881
|
|
278,392
|
|
305,810
|
|
||||
|
Investments held-to-maturity
|
Level 3
|
$
|
17,290
|
|
17,155
|
|
16,070
|
|
15,952
|
|
||||
|
Lennar Financial Services:
|
||||||||||||||
|
Loans held-for-investment, net
|
Level 3
|
$
|
26,894
|
|
26,723
|
|
26,356
|
|
26,095
|
|
||||
|
Investments held-to-maturity
|
Level 2
|
$
|
45,038
|
|
45,051
|
|
62,344
|
|
62,580
|
|
||||
|
LIABILITIES
|
||||||||||||||
|
Lennar Homebuilding senior notes and other debts payable
|
Level 2
|
$
|
4,690,213
|
|
5,760,075
|
|
4,194,432
|
|
4,971,500
|
|
||||
|
Rialto notes payable and other debts payable
|
Level 2
|
$
|
623,246
|
|
640,335
|
|
441,883
|
|
438,373
|
|
||||
|
Lennar Financial Services notes and other debts payable
|
Level 2
|
$
|
704,143
|
|
704,143
|
|
374,166
|
|
374,166
|
|
||||
|
Lennar Multifamily notes payable
|
Level 2
|
$
|
—
|
|
—
|
|
13,858
|
|
13,858
|
|
||||
The following methods and assumptions are used by the Company in estimating fair values:
Lennar Homebuilding and Lennar Multifamily
—For senior notes and other debts payable, the fair value of fixed-rate borrowings is based on quoted market prices and the fair value of variable-rate borrowings is based on expected future cash flows calculated using current market forward rates.
Rialto
—The fair values for loans receivable, net are based on the fair value of the collateral less estimated cost to sell or discounted cash flows, if estimable. The fair value for investments held-to-maturity is based on discounted cash flows. For notes and other debts payable, the fair value is calculated based on discounted cash flows using the Company’s weighted average borrowing rate and for the warehouse repurchase financing agreements fair values approximate their carrying value due to their short maturities.
Lennar Financial Services
—The fair values above are based on quoted market prices, if available. The fair values for instruments that do not have quoted market prices are estimated by the Company on the basis of discounted cash flows or other financial information.
Fair Value Measurements
GAAP provides a framework for measuring fair value, expands disclosures about fair value measurements and establishes a fair value hierarchy which prioritizes the inputs used in measuring fair value summarized as follows:
Level 1: Fair value determined based on quoted prices in active markets for identical assets.
Level 2: Fair value determined using significant other observable inputs.
Level 3: Fair value determined using significant unobservable inputs.
119
LENNAR CORPORATION AND SUBSIDIARIES
NOTES TO CONSOLIDATED FINANCIAL STATEMENTS—(Continued)
The Company’s financial instruments measured at fair value on a recurring basis are summarized below:
|
Financial Instruments
|
||||||||
|
(In thousands)
|
Fair
Value
Hierarchy
|
Fair Value at November 30, 2014
|
Fair Value at November 30, 2013
|
|||||
|
Lennar Financial Services:
|
||||||||
|
Loans held-for-sale (1)
|
Level 2
|
$
|
738,396
|
|
414,231
|
|
||
|
Mortgage loan commitments
|
Level 2
|
$
|
12,687
|
|
7,335
|
|
||
|
Forward contracts
|
Level 2
|
$
|
(7,576
|
)
|
1,444
|
|
||
|
Mortgage servicing rights
|
Level 3
|
$
|
17,353
|
|
11,455
|
|
||
|
Lennar Homebuilding:
|
||||||||
|
Investments available-for-sale
|
Level 3
|
$
|
480
|
|
40,032
|
|
||
|
Rialto:
|
||||||||
|
Loans held-for-sale (2)
|
Level 3
|
$
|
113,596
|
|
44,228
|
|
||
|
(1)
|
The aggregate fair value of Lennar Financial Services loans held-for-sale of
$738.4 million
at
November 30, 2014
exceeds their aggregate principal balance of
$706.0 million
by
$32.4 million
. The aggregate fair value of loans held-for-sale of
$414.2 million
at
November 30, 2013
exceeds their aggregate principal balance of
$399.0 million
by
$15.3 million
.
|
|
(2)
|
The aggregate fair value of Rialto loans held-for-sale of
$113.6 million
at
November 30, 2014
exceeds their aggregate principal balance of
$111.8 million
by
$1.8 million
. The aggregate fair value of Rialto loans held-for-sale of
$44.2 million
at
November 30, 2013
exceeds their aggregate principal balance of
$44.0 million
by
$0.2 million
.
|
The estimated fair values of the Company’s financial instruments have been determined by using available market information and what the Company believes to be appropriate valuation methodologies. Considerable judgment is required in interpreting market data to develop the estimates of fair value. The use of different market assumptions and/or estimation methodologies might have a material effect on the estimated fair value amounts. The following methods and assumptions are used by the Company in estimating fair values:
Lennar Financial Services loans held-for-sale
— Fair value is based on independent quoted market prices, where available, or the prices for other mortgage whole loans with similar characteristics. Management believes carrying loans held-for-sale at fair value improves financial reporting by mitigating volatility in reported earnings caused by measuring the fair value of the loans and the derivative instruments used to economically hedge them without having to apply complex hedge accounting provisions. In addition, the Company recognizes the fair value of its rights to service a mortgage loan as revenue upon entering into an interest rate lock loan commitment with a borrower. The fair value of these servicing rights is included in Lennar Financial Services’ loans held-for-sale as of
November 30, 2014
and
2013
. Fair value of servicing rights is determined based on actual sales of servicing rights on loans with similar characteristics.
Lennar Financial Services mortgage loan commitments
— Fair value of commitments to originate loans is based upon the difference between the current value of similar loans and the price at which the Lennar Financial Services segment has committed to originate the loans. The fair value of commitments to sell loan contracts is the estimated amount that the Lennar Financial Services segment would receive or pay to terminate the commitments at the reporting date based on market prices for similar financial instruments. In addition, the Company recognizes the fair value of its rights to service a mortgage loan as revenue upon entering into an interest rate lock loan commitment with a borrower. The fair value of servicing rights is determined based on actual sales of servicing rights on loans with similar characteristics. The fair value of the mortgage loan commitments and related servicing rights is included in Lennar Financial Services’ other assets.
Lennar Financial Services forward contracts
— Fair value is based on quoted market prices for similar financial instruments. As of
November 30, 2014
, the fair value of forward contracts is included in the Lennar Financial Services segment's other liabilities. As of
November 30, 2013
, the fair value of forward contracts is included in the Lennar Financial Services segment's other assets.
Lennar Financial Services mortgage servicing rights
—
Lennar Financial Services records mortgage servicing rights when it sells loans on a servicing-retained basis, at the time of securitization or through the acquisition or assumption of the right to service a financial asset. The fair value of the mortgage servicing rights is calculated using third-party valuations. The key assumptions, which are generally unobservable inputs, used in the valuation of the mortgage servicing rights include mortgage prepayment rates, discount rates and delinquency rates. As of
November 30, 2014
, the key assumptions used in determining the fair value include a
13.2%
mortgage prepayment rate, a
6.5%
delinquency rate and a
12.0%
discount rate. The fair value of mortgage servicing rights is included in the Lennar Financial Services segment's other assets.
120
LENNAR CORPORATION AND SUBSIDIARIES
NOTES TO CONSOLIDATED FINANCIAL STATEMENTS—(Continued)
Lennar Homebuilding investments available-for-sale
— The fair value of these investments is based on third-party valuations and/or estimated by the Company on the basis of discounted cash flows and it is included in the Lennar Homebuilding segment's other assets.
Rialto loans held-for-sale
— The fair value of loans held-for-sale is calculated from model-based techniques that use discounted cash flow assumptions and the Company’s own estimates of CMBS spreads, market interest rate movements and the underlying loan credit quality. Loan values are calculated by allocating the change in value of an assumed CMBS capital structure to each loan. The value of an assumed CMBS capital structure is calculated, generally, by discounting the cash flows associated with each CMBS class at market interest rates and at the Company’s own estimate of CMBS spreads. The Company estimates CMBS spreads by observing the pricing of recent CMBS offerings, secondary CMBS markets, changes in the CMBX index, and general capital and commercial real estate market conditions. Considerations in estimating CMBS spreads include comparing the Company’s current loan portfolio with comparable CMBS offerings containing loans with similar duration, credit quality and collateral composition. These methods use unobservable inputs in estimating a discount rate that is used to assign a value to each loan. While the cash payments on the loans are contractual, the discount rate used and assumptions regarding the relative size of each class in the CMBS capital structure can significantly impact the valuation. Therefore, the estimates used could differ materially from the fair value determined when the loans are sold to a securitization trust.
The changes in fair value for Level 1 and Level 2 financial instruments measured on a recurring basis are shown below by financial instrument and financial statement line item:
|
Years Ended November 30,
|
|||||||||
|
(In thousands)
|
2014
|
2013
|
2012
|
||||||
|
Changes in fair value included in Lennar Financial Services revenues:
|
|||||||||
|
Loans held-for-sale
|
$
|
17,124
|
|
(7,927
|
)
|
11,654
|
|
||
|
Mortgage loan commitments
|
$
|
5,352
|
|
(5,378
|
)
|
8,521
|
|
||
|
Forward contracts
|
$
|
(9,020
|
)
|
4,014
|
|
(1,166
|
)
|
||
Interest income on Lennar Financial Services loans held-for-sale measured at fair value is calculated based on the interest rate of the loan and recorded as revenues in the Lennar Financial Services’ statement of operations.
The Lennar Financial Services segment uses mandatory mortgage-backed securities (“MBS”) forward commitments, option contracts and investor commitments to hedge its mortgage-related interest rate exposure. These instruments involve, to varying degrees, elements of credit and interest rate risk. Credit risk associated with MBS forward commitments, option contracts and loan sales transactions is managed by limiting the Company’s counterparties to investment banks, federally regulated bank affiliates and other investors meeting the Company’s credit standards. The segment’s risk, in the event of default by the purchaser, is the difference between the contract price and fair value of the MBS forward commitments and option contracts. At
November 30, 2014
, the segment had open commitments amounting to
$771.0 million
to sell MBS with varying settlement dates through February 2015.
The following tables represents the reconciliations of the beginning and ending balance for the Level 3 recurring fair value measurements:
|
November 30,
|
||||||
|
(In thousands)
|
2014
|
2013
|
||||
|
Mortgage servicing rights, beginning of period
|
$
|
11,455
|
|
4,749
|
|
|
|
Purchases and retention of mortgage servicing rights (1)
|
9,314
|
|
5,675
|
|
||
|
Disposals
|
(2,308
|
)
|
(790
|
)
|
||
|
Changes in fair value (2)
|
(1,108
|
)
|
1,821
|
|
||
|
Mortgage servicing rights, end of period
|
17,353
|
|
11,455
|
|
||
|
(1)
|
For the year ended
November 30, 2014
, purchases and retention of mortgage servicing rights included the
$5.7 million
acquisition of a portfolio of mortgage servicing rights.
|
|
(2)
|
Amount represents changes in fair value included in Lennar Financial Services revenues.
|
121
LENNAR CORPORATION AND SUBSIDIARIES
NOTES TO CONSOLIDATED FINANCIAL STATEMENTS—(Continued)
|
November 30,
|
||||||
|
(In thousands)
|
2014
|
2013
|
||||
|
Investments available-for-sale, beginning of period
|
$
|
40,032
|
|
19,591
|
|
|
|
Purchases and other (1)
|
21,274
|
|
25,518
|
|
||
|
Sales
|
(51,934
|
)
|
(5,618
|
)
|
||
|
Changes in fair value (2)
|
7,379
|
|
748
|
|
||
|
Settlements (3)
|
(16,271
|
)
|
(207
|
)
|
||
|
Investments available-for-sale, end of period
|
$
|
480
|
|
40,032
|
|
|
|
(1)
|
Represents investments in community development district bond that mature at
2039
.
|
|
(2)
|
The changes in fair value were not included in other comprehensive income because the changes in fair value were deferred as a result of the Company's continuing involvement in the underlying real estate collateral.
|
|
(3)
|
The investments available-for-sale that were settled during the year ended
November 30, 2014
related to investments in community development district bonds, which were in default by the borrower and regarding which the Company redeemed the bonds.
|
|
November 30,
|
||||||
|
(In thousands)
|
2014
|
2013
|
||||
|
Rialto loans held-for-sale, beginning of period
|
$
|
44,228
|
|
—
|
|
|
|
Loan originations
|
1,562,748
|
|
690,266
|
|
||
|
Originated loans sold, including those not settled
|
(1,494,075
|
)
|
(646,266
|
)
|
||
|
Interest and principal paydowns
|
(800
|
)
|
195
|
|
||
|
Changes in fair value (1)
|
1,495
|
|
33
|
|
||
|
Rialto loans held-for-sale, end of period
|
$
|
113,596
|
|
44,228
|
|
|
|
(1)
|
Amount represents changes in fair value included in Rialto revenues.
|
122
LENNAR CORPORATION AND SUBSIDIARIES
NOTES TO CONSOLIDATED FINANCIAL STATEMENTS—(Continued)
The Company’s assets measured at fair value on a nonrecurring basis are those assets for which the Company has recorded valuation adjustments and write-offs. The fair values included in the tables below represent only those assets whose carrying values were adjusted to fair value during the respective periods disclosed. The assets measured at fair value on a nonrecurring basis are summarized below:
|
Years Ended November 30,
|
|||||||||||||||||||||||||||||
|
2014
|
2013
|
2012
|
|||||||||||||||||||||||||||
|
(In thousands)
|
Fair
Value
Hierarchy
|
Carrying Value
|
Fair Value
|
Total Gains
(Losses) (1)
|
Carrying Value
|
Fair Value
|
Total Gains
(Losses) (1)
|
Carrying Value
|
Fair Value
|
Total Gains
(Losses) (1)
|
|||||||||||||||||||
|
Financial Assets
|
|||||||||||||||||||||||||||||
|
Rialto:
|
|||||||||||||||||||||||||||||
|
Impaired loans receivable
|
Level 3
|
$
|
187,218
|
|
130,105
|
|
(57,113
|
)
|
237,829
|
|
221,690
|
|
(16,139
|
)
|
354,687
|
|
326,721
|
|
(27,966
|
)
|
|||||||||
|
Non-financial assets
|
|||||||||||||||||||||||||||||
|
Lennar Homebuilding:
|
|||||||||||||||||||||||||||||
|
Finished homes and construction in progress (2)
|
Level 3
|
$
|
8,071
|
|
4,498
|
|
(3,573
|
)
|
16,453
|
|
11,995
|
|
(4,458
|
)
|
25,784
|
|
14,755
|
|
(11,029
|
)
|
|||||||||
|
Land and land under development (2)
|
Level 3
|
$
|
7,013
|
|
6,143
|
|
(870
|
)
|
—
|
|
—
|
|
—
|
|
18,044
|
|
16,166
|
|
(1,878
|
)
|
|||||||||
|
Investments in unconsolidated entities (3)
|
Level 3
|
$
|
—
|
|
—
|
|
—
|
|
20,921
|
|
20,024
|
|
(897
|
)
|
—
|
|
—
|
|
—
|
|
|||||||||
|
Rialto:
|
|||||||||||||||||||||||||||||
|
REO - held-for-sale (4)
|
|||||||||||||||||||||||||||||
|
Upon acquisition/transfer
|
Level 3
|
$
|
26,750
|
|
25,145
|
|
(1,605
|
)
|
14,367
|
|
15,985
|
|
1,618
|
|
14,325
|
|
9,987
|
|
(4,338
|
)
|
|||||||||
|
Upon management periodic valuations
|
Level 3
|
$
|
50,115
|
|
42,279
|
|
(7,836
|
)
|
26,772
|
|
21,199
|
|
(5,573
|
)
|
19,718
|
|
17,139
|
|
(2,579
|
)
|
|||||||||
|
REO - held-and-used, net (5)
|
|||||||||||||||||||||||||||||
|
Upon acquisition/transfer
|
Level 3
|
$
|
60,572
|
|
55,407
|
|
(5,165
|
)
|
79,775
|
|
86,262
|
|
6,487
|
|
172,654
|
|
175,114
|
|
2,460
|
|
|||||||||
|
Upon management periodic valuations
|
Level 3
|
$
|
39,728
|
|
28,227
|
|
(11,501
|
)
|
22,743
|
|
12,226
|
|
(10,517
|
)
|
33,003
|
|
26,300
|
|
(6,703
|
)
|
|||||||||
|
(1)
|
Represents losses due to valuation adjustments, write-offs, gains (losses) from transfers or acquisitions of real estate through foreclosure and REO impairments recorded during the years ended
November 30, 2014
,
2013
and
2012
.
|
|
(2)
|
Valuation adjustments were included in Lennar Homebuilding costs and expenses in the Company's consolidated statement of operations for the years ended
November 30, 2014
,
2013
and
2012
.
|
|
(3)
|
Valuation adjustments were included in Lennar Homebuilding other income, net in the Company's consolidated statement of operations for the year ended
November 30, 2013
.
|
|
(4)
|
REO held-for-sale assets are initially recorded at fair value less estimated costs to sell at the time of the transfer or acquisition through, or in lieu of, loan foreclosure. The fair value of REO held-for-sale is based upon appraised value at the time of foreclosure or management's best estimate. In addition, management periodically performs valuations of its REO held-for-sale. The gains (losses) upon the transfer or acquisition of REO and impairments were included in Rialto other income (expense), net, in the Company’s consolidated statement of operations for the years ended
November 30, 2014
,
2013
and
2012
.
|
|
(5)
|
REO held-and-used, net, assets are initially recorded at fair value at the time of acquisition through, or in lieu of, loan foreclosure. The fair value of REO held-and-used, net, is based upon the appraised value at the time of foreclosure or management’s best estimate. In addition, management periodically performs valuations of its REO held-and-used, net. The gains (losses) upon acquisition of REO held-and-used, net and impairments were included in Rialto other income (expense), net, in the Company’s consolidated statement of operations for the years ended
November 30, 2014
,
2013
and
2012
.
|
See Note 1 for a detailed description of the Company’s process for identifying and recording valuation adjustments related to Lennar Homebuilding inventory, Lennar Homebuilding investments in unconsolidated entities and Rialto REO assets.
16. Consolidation of Variable Interest Entities
GAAP requires the consolidation of VIEs in which an enterprise has a controlling financial interest. A controlling financial interest will have both of the following characteristics: (a) the power to direct the activities of a VIE that most significantly impact the VIEs economic performance and (b) the obligation to absorb losses of the VIE that could potentially be significant to the VIE or the right to receive benefits from the VIE that could potentially be significant to the VIE.
123
LENNAR CORPORATION AND SUBSIDIARIES
NOTES TO CONSOLIDATED FINANCIAL STATEMENTS—(Continued)
The Company evaluated the joint venture agreements of its joint ventures that were formed or that had reconsideration events during the year ended
November 30, 2014
. Based on the Company’s evaluation, in the third quarter of 2014, the Company consolidated entities within its Lennar Multifamily segment that had combined total assets of
$17.9 million
. In the second quarter of
2014
, the Company entered into a new option agreement with MSR, which resulted in the consolidation of certain VIEs because of the Company having options on substantially all of the homesites. The VIEs that consolidated had total combined assets of
$158.5 million
and non-recourse liabilities of
$1.6 million
.
At
November 30, 2014
and
2013
, the Company’s recorded investments in Lennar Homebuilding unconsolidated entities were
$656.8 million
and
$716.9 million
, respectively, the Rialto segment’s investments in unconsolidated entities were
$175.7 million
and
$154.6 million
, respectively, and the Lennar Multifamily segment's investments in unconsolidated entities were
$105.7 million
and
$46.3 million
, respectively.
Consolidated VIEs
As of
November 30, 2014
, the carrying amount of the VIEs’ assets and non-recourse liabilities that consolidated were
$929.1 million
and
$149.8 million
, respectively. As of
November 30, 2013
, the carrying amount of the VIEs’ assets and non-recourse liabilities that consolidated were
$1,195.3 million
and
$294.8 million
, respectively. Those assets are owned by, and those liabilities are obligations of, the VIEs, not the Company.
A VIE’s assets can only be used to settle obligations of that VIE. The VIEs are not guarantors of the Company’s senior notes and other debts payable. In addition, the assets held by a VIE usually are collateral for that VIE’s debt. The Company and other partners do not generally have an obligation to make capital contributions to a VIE unless the Company and/or the other partner(s) have entered into debt guarantees with the VIE’s banks. Other than debt guarantee agreements with a VIE’s banks, there are no liquidity arrangements or agreements to fund capital or purchase assets that could require the Company to provide financial support to a VIE. While the Company has option contracts to purchase land from certain of its VIEs, the Company is not required to purchase the assets and could walk away from the contracts.
Consolidated Joint Ventures
During the year ended
November 30, 2013
, in a joint venture transaction, the Company bought out its
50%
partners for
$82.3 million
, paying
$18.8 million
in cash and financing the remainder with a short-term note. The Company's consolidated joint venture then contributed certain assets to a new unconsolidated joint venture and brought in a new, long-term partner for
$125 million
, or a
31.25%
interest. During the year ended
November 30, 2013
, the new unconsolidated joint venture subsequently distributed
$125 million
of cash to the Company as a return of capital.
Unconsolidated VIEs
At
November 30, 2014
and
2013
, the Company’s recorded investments in VIEs that are unconsolidated and its estimated maximum exposure to loss were as follows:
|
November 30, 2014
|
||||||
|
(In thousands)
|
Investments in
Unconsolidated VIEs |
Lennar’s
Maximum
Exposure to Loss
|
||||
|
Lennar Homebuilding (1)
|
$
|
124,311
|
|
194,321
|
|
|
|
Rialto (2)
|
17,290
|
|
17,290
|
|
||
|
Lennar Multifamily (3)
|
41,600
|
|
65,810
|
|
||
|
$
|
183,201
|
|
277,421
|
|
||
|
November 30, 2013
|
||||||
|
(In thousands)
|
Investments in
Unconsolidated
VIEs
|
Lennar’s
Maximum
Exposure to Loss
|
||||
|
Lennar Homebuilding (1)
|
$
|
195,720
|
|
301,315
|
|
|
|
Rialto (2)
|
24,393
|
|
24,393
|
|
||
|
Lennar Multifamily (3)
|
25,874
|
|
55,002
|
|
||
|
$
|
245,987
|
|
380,710
|
|
||
|
(1)
|
At
November 30, 2014
, the maximum exposure to loss of Lennar Homebuilding’s investments in unconsolidated VIEs was limited to its investment in the unconsolidated VIEs, except with regard to
$70.0 million
remaining commitment to fund an unconsolidated entity for further expenses up until the unconsolidated entity obtains permanent financing. At
November 30, 2013
, the maximum exposure to loss
|
124
LENNAR CORPORATION AND SUBSIDIARIES
NOTES TO CONSOLIDATED FINANCIAL STATEMENTS—(Continued)
of Lennar Homebuilding’s investments in unconsolidated entities was limited to its investment in the unconsolidated VIEs, except with regard to
$90.5 million
remaining commitment to fund an unconsolidated entity that was formed in
2013
for further expenses up until the unconsolidated entity obtains permanent financing and
$15.0 million
of recourse debt of an unconsolidated VIEs, which was included in the Company’s maximum recourse related to Lennar Homebuilding unconsolidated entities.
|
(2)
|
At both
November 30, 2014
and
2013
, the maximum recourse exposure to loss of Rialto’s investments in unconsolidated VIEs was limited to its investments in the unconsolidated entities. At
November 30, 2014
and
2013
, investments in unconsolidated VIEs and Lennar’s maximum exposure to loss included
$17.3 million
and
$16.1 million
, respectively, related to Rialto’s investments held-to-maturity.
|
|
(3)
|
At
November 30, 2014
and
2013
, the maximum exposure to loss of Lennar Multifamily's investments in unconsolidated VIEs was limited to its investments in the unconsolidated VIEs, except with regard to
$23.4 million
and
$28.0 million
, respectively, of letters of credit outstanding for certain of the unconsolidated VIEs that could be drawn upon in the event of default under their debt agreements.
|
While these entities are VIEs, the Company has determined that the power to direct the activities of the VIEs that most significantly impact the VIEs’ economic performance is generally shared. While the Company generally manages the day-to-day operations of the VIEs, each of these VIEs has an executive committee made up of representatives from each partner. The members of the executive committee have equal votes and major decisions require unanimous consent and approval from all members. The Company does not have the unilateral ability to exercise participating voting rights without partner consent.
The Company and other partners do not generally have an obligation to make capital contributions to the VIEs, except for
$23.4 million
of letters of credit outstanding for certain Lennar Multifamily unconsolidated VIEs that could be drawn upon in the event of default under their debt agreements. In addition, there are no liquidity arrangements or agreements to fund capital or purchase assets that could require the Company to provide financial support to the VIEs, except with regard to a
$70.0 million
remaining commitment to fund an unconsolidated entity for further expenses up until the unconsolidated entity obtains permanent financing. Except for the unconsolidated VIEs discussed above, the Company and the other partners did not guarantee any debt of the other unconsolidated VIEs. While the Company has option contracts to purchase land from certain of its unconsolidated VIEs, the Company is not required to purchase the assets and could walk away from the contracts.
Option Contracts
The Company has access to land through option contracts, which generally enables it to control portions of properties owned by third parties (including land funds) and unconsolidated entities until the Company has determined whether to exercise the option.
A majority of the Company’s option contracts require a non-refundable cash deposit or irrevocable letter of credit based on a percentage of the purchase price of the land. The Company’s option contracts sometimes include price adjustment provisions, which adjust the purchase price of the land to its approximate fair value at the time of acquisition or are based on the fair value at the time of takedown.
The Company’s investments in option contracts are recorded at cost unless those investments are determined to be impaired, in which case the Company’s investments are written down to fair value. The Company reviews option contracts for indicators of impairment during each reporting period. The most significant indicator of impairment is a decline in the fair value of the optioned property such that the purchase and development of the optioned property would no longer meet the Company’s targeted return on investment with appropriate consideration given to the length of time available to exercise the option. Such declines could be caused by a variety of factors including increased competition, decreases in demand or changes in local regulations that adversely impact the cost of development. Changes in any of these factors would cause the Company to re-evaluate the likelihood of exercising its land options.
Some option contracts contain a predetermined take-down schedule for the optioned land parcels. However, in almost all instances, the Company is not required to purchase land in accordance with those take-down schedules. In substantially all instances, the Company has the right and ability to not exercise its option and forfeit its deposit without further penalty, other than termination of the option and loss of any unapplied portion of its deposit and pre-acquisition costs. Therefore, in substantially all instances, the Company does not consider the take-down price to be a firm contractual obligation.
When the Company does not intend to exercise an option, it writes off any unapplied deposit and pre-acquisition costs associated with the option contract. For the years ended
November 30, 2014
,
2013
and
2012
, the Company wrote-off
$4.6 million
,
$1.9 million
and
$2.4 million
, respectively, of option deposits and pre-acquisition costs related to land under option that it does not intend to purchase.
The Company evaluates all option contracts for land to determine whether they are VIEs and, if so, whether the Company is the primary beneficiary of certain of these option contracts. Although the Company does not have legal title to the optioned land, if the Company is deemed to be the primary beneficiary or makes a significant deposit for optioned land, it may need to consolidate the land under option at the purchase price of the optioned land. Due to the new agreement with MSR
125
LENNAR CORPORATION AND SUBSIDIARIES
NOTES TO CONSOLIDATED FINANCIAL STATEMENTS—(Continued)
discussed in Note 4,
$155.0 million
of consolidated inventory not owned was reclassified to land and land under development and
$70.3 million
of consolidated inventory not owned was deconsolidated during the year ended
November 30, 2014
.
In addition to this transaction, during the year ended
November 30, 2014
, consolidated inventory not owned decreased by
$182.4 million
with a corresponding decrease to liabilities related to consolidated inventory not owned in the accompanying consolidated balance sheet as of
November 30, 2014
. The decrease was primarily due to the purchase of land that was the subject of a previously consolidated option contract. To reflect the purchase price of the inventory consolidated, the Company had a net reclass related to option deposits from consolidated inventory not owned to land under development in the accompanying consolidated balance sheet as of
November 30, 2014
. The liabilities related to consolidated inventory not owned primarily represent the difference between the option exercise prices for the optioned land and the Company’s cash deposits.
The Company’s exposure to loss related to its option contracts with third parties and unconsolidated entities consisted of its non-refundable option deposits and pre-acquisition costs totaling
$85.6 million
and
$129.2 million
at
November 30, 2014
and
2013
, respectively. Additionally, the Company had posted
$34.5 million
and
$29.9 million
of letters of credit in lieu of cash deposits under certain option contracts as of
November 30, 2014
and
2013
, respectively.
17. Commitments and Contingent Liabilities
The Company is party to various claims, legal actions and complaints arising in the ordinary course of business. In the opinion of management, the disposition of these matters will not have a material adverse effect on the Company’s consolidated financial statements. The Company is also a party to various lawsuits involving purchases and sales of real property. These lawsuits include claims regarding representations and warranties made in connection with the transfer of the property and disputes regarding the obligation to purchase or sell the property.
The Company has been engaged in litigation since 2008 in the United States District Court for the District of Maryland regarding whether the Company is required by a contract it entered into in 2005 to purchase a property in Maryland. After entering into the contract, the Company later renegotiated the purchase price, reducing it from
$200 million
to
$134 million
,
$20 million
of which has been paid and subsequently written off, leaving a balance of
$114 million
. In July 2014, the Court ruled that the Company may be obligated to purchase the property. As a result of changes in zoning for the property during the litigation, the Court ordered further proceedings to determine whether the sellers are entitled to specific performance and, if so, whether a further reduction in the purchase price is required.
In January 2015, the Court rendered a decision ordering the Company to purchase the property for the
$114 million
balance of the contract price, to pay interest at the rate of
12%
per annum from May 27, 2008, and to reimburse the seller for real estate taxes and attorneys’ fees. The Company believes the decision is contrary to applicable law and will appeal the decision.
The Company does not believe it is probable that a loss has occurred and, therefore, no liability has been recorded with respect to this case.
The Company does not believe that the ultimate resolution of these claims or lawsuits will have a material adverse effect on its business or financial position. However, the financial effect of litigation concerning purchases and sales of property may depend upon the value of the subject property, which may have changed from the time the agreement for purchase or sale was entered into.
In December 2013, the Company was awarded by a civil jury compensatory damages and punitive damages against a former unconsolidated joint venture partner on court findings of defamation and conspiracy to extort money from the Company in 2008 and 2009. The Company does not expect to be able to collect the amount awarded to it and thus has not recorded any amounts receivable in its financial statements related to the award.
The Company is subject to the usual obligations associated with entering into contracts (including option contracts) for the purchase, development and sale of real estate, which it does in the routine conduct of its business. Option contracts generally enable the Company to control portions of properties owned by third parties (including land funds) and unconsolidated entities until the Company determines whether to exercise the option. The use of option contracts allows the Company to reduce the financial risks associated with long-term land holdings. At
November 30, 2014
, the Company had
$85.6 million
of non-refundable option deposits and pre-acquisition costs related to certain of these homesites, which were included in inventories in the consolidated balance sheet.
126
LENNAR CORPORATION AND SUBSIDIARIES
NOTES TO CONSOLIDATED FINANCIAL STATEMENTS—(Continued)
The Company has entered into agreements to lease certain office facilities and equipment under operating leases. Future minimum payments under the non-cancellable leases in effect at
November 30, 2014
were as follows:
|
(In thousands)
|
Lease
Payments
|
||
|
2015
|
$
|
34,358
|
|
|
2016
|
28,524
|
|
|
|
2017
|
23,695
|
|
|
|
2018
|
19,885
|
|
|
|
2019
|
13,994
|
|
|
|
Thereafter
|
16,658
|
|
|
Rental expense for the years ended
November 30, 2014
,
2013
and
2012
was
$48.9 million
,
$41.9 million
and
$38.7 million
, respectively.
The Company is committed, under various letters of credit, to perform certain development and construction activities and provide certain guarantees in the normal course of business. Outstanding letters of credit under these arrangements totaled
$424.6 million
at
November 30, 2014
. The Company also had outstanding performance and surety bonds related to site improvements at various projects (including certain projects in the Company’s joint ventures) of
$923.3 million
. Although significant development and construction activities have been completed related to these site improvements, these bonds are generally not released until all development and construction activities are completed. As of
November 30, 2014
, there were approximately
$363.7 million
, or
39%
, of costs to complete related to these site improvements. The Company does not presently anticipate any draws upon these bonds that would have a material effect on its consolidated financial statements.
18. Supplemental Financial Information
The indentures governing the Company’s
5.60%
senior notes due 2015,
6.50%
senior notes due 2016,
12.25%
senior notes due 2017,
4.75%
senior notes due 2017,
6.95%
senior notes due 2018,
4.125%
senior notes due 2018,
4.500%
senior notes due 2019,
4.50%
senior notes due 2019,
2.75%
convertible senior notes due 2020,
3.25%
convertible senior notes due 2021 and
4.750%
senior notes due 2022 require that, if any of the Company’s 100% owned subsidiaries, other than its finance company subsidiaries and foreign subsidiaries, directly or indirectly guarantee at least
$75 million
principal amount of debt of Lennar Corporation, those subsidiaries must also guarantee Lennar Corporation’s obligations with regard to its senior notes. The entities referred to as “guarantors” in the following tables are subsidiaries that are not finance company subsidiaries or foreign subsidiaries and were guaranteeing the senior notes because at
November 30, 2014
they were guaranteeing Lennar Corporation's
$125 million
letter of credit facilities, it's
$140 million
letter of credit facility and its Credit Facility. The guarantees are full, unconditional and joint and several and the guarantor subsidiaries are 100% directly or indirectly owned by Lennar Corporation. A subsidiary's guarantee will be suspended at any time when it is not directly or indirectly guaranteeing at least
$75 million
principal amount of debt of Lennar Corporation, and a subsidiary will be released from its guarantee and any other obligations it may have regarding the senior notes if all or substantially all its assets, or all of its capital stock, are sold or otherwise disposed of.
For purposes of the condensed consolidating statement of cash flows included in the following supplemental financial information, the Company's accounting policy is to treat cash received by Lennar Corporation ("the Parent") from its subsidiaries, to the extent of net earnings from such subsidiaries as a dividend and accordingly a return on investment within cash flows from operating activities. Distributions of capital received by the Parent from its subsidiaries are reflected as cash flows from investing activities. The cash outflows associated with the return on investment dividends and distributions of capital received by the Parent are reflected by the Guarantor and Non-Guarantor subsidiaries in the Dividends line item within cash flows from financing activities. All other cash flows between the Parent and its subsidiaries represent the settlement of receivables and payables between such entities in conjunction with the Parent's centralized cash management arrangement with its subsidiaries, which operates with the characteristics of a revolving credit facility, and are accordingly reflected net in the Intercompany line item within cash flows from investing activities for the Parent and net in the Intercompany line item within cash flows from financing activities for the Guarantor and Non-Guarantor subsidiaries.
127
LENNAR CORPORATION AND SUBSIDIARIES
NOTES TO CONSOLIDATED FINANCIAL STATEMENTS—(Continued)
Supplemental information for the subsidiaries that were guarantor subsidiaries at
November 30, 2014
was as follows:
|
Consolidating Balance Sheet
November 30, 2014
|
|||||||||||||||
|
(In thousands)
|
Lennar
Corporation
|
Guarantor
Subsidiaries
|
Non-Guarantor
Subsidiaries
|
Eliminations
|
Total
|
||||||||||
|
ASSETS
|
|||||||||||||||
|
Lennar Homebuilding:
|
|||||||||||||||
|
Cash and cash equivalents, restricted cash and receivables, net
|
$
|
653,491
|
|
323,325
|
|
12,206
|
|
—
|
|
989,022
|
|
||||
|
Inventories
|
—
|
|
7,528,633
|
|
207,967
|
|
—
|
|
7,736,600
|
|
|||||
|
Investments in unconsolidated entities
|
—
|
|
632,973
|
|
23,864
|
|
—
|
|
656,837
|
|
|||||
|
Other assets
|
159,564
|
|
402,076
|
|
104,619
|
|
6,330
|
|
672,589
|
|
|||||
|
Investments in subsidiaries
|
4,073,687
|
|
299,432
|
|
—
|
|
(4,373,119
|
)
|
—
|
|
|||||
|
Intercompany
|
4,709,544
|
|
—
|
|
—
|
|
(4,709,544
|
)
|
—
|
|
|||||
|
9,596,286
|
|
9,186,439
|
|
348,656
|
|
(9,076,333
|
)
|
10,055,048
|
|
||||||
|
Rialto real estate owned - held-and-used, net
|
—
|
|
—
|
|
255,795
|
|
—
|
|
255,795
|
|
|||||
|
Rialto all other assets
|
—
|
|
—
|
|
1,202,357
|
|
—
|
|
1,202,357
|
|
|||||
|
Lennar Financial Services
|
—
|
|
76,428
|
|
1,100,625
|
|
—
|
|
1,177,053
|
|
|||||
|
Lennar Multifamily
|
—
|
|
248,784
|
|
19,230
|
|
—
|
|
268,014
|
|
|||||
|
Total assets
|
$
|
9,596,286
|
|
9,511,651
|
|
2,926,663
|
|
(9,076,333
|
)
|
12,958,267
|
|
||||
|
LIABILITIES AND EQUITY
|
|||||||||||||||
|
Lennar Homebuilding:
|
|||||||||||||||
|
Accounts payable and other liabilities
|
$
|
447,104
|
|
756,991
|
|
71,699
|
|
—
|
|
1,275,794
|
|
||||
|
Liabilities related to consolidated inventory not owned
|
—
|
|
45,028
|
|
—
|
|
—
|
|
45,028
|
|
|||||
|
Senior notes and other debts payable
|
4,322,162
|
|
287,700
|
|
80,351
|
|
—
|
|
4,690,213
|
|
|||||
|
Intercompany
|
—
|
|
4,579,314
|
|
130,230
|
|
(4,709,544
|
)
|
—
|
|
|||||
|
4,769,266
|
|
5,669,033
|
|
282,280
|
|
(4,709,544
|
)
|
6,011,035
|
|
||||||
|
Rialto
|
—
|
|
—
|
|
747,044
|
|
—
|
|
747,044
|
|
|||||
|
Lennar Financial Services
|
—
|
|
28,705
|
|
861,608
|
|
6,330
|
|
896,643
|
|
|||||
|
Lennar Multifamily
|
—
|
|
52,150
|
|
93
|
|
—
|
|
52,243
|
|
|||||
|
Total liabilities
|
$
|
4,769,266
|
|
5,749,888
|
|
1,891,025
|
|
(4,703,214
|
)
|
7,706,965
|
|
||||
|
Stockholders’ equity
|
4,827,020
|
|
3,761,763
|
|
611,356
|
|
(4,373,119
|
)
|
4,827,020
|
|
|||||
|
Noncontrolling interests
|
—
|
|
—
|
|
424,282
|
|
—
|
|
424,282
|
|
|||||
|
Total equity
|
4,827,020
|
|
3,761,763
|
|
1,035,638
|
|
(4,373,119
|
)
|
5,251,302
|
|
|||||
|
Total liabilities and equity
|
$
|
9,596,286
|
|
9,511,651
|
|
2,926,663
|
|
(9,076,333
|
)
|
12,958,267
|
|
||||
128
LENNAR CORPORATION AND SUBSIDIARIES
NOTES TO CONSOLIDATED FINANCIAL STATEMENTS—(Continued)
|
Consolidating Balance Sheet
November 30, 2013
|
|||||||||||||||
|
(In thousands)
|
Lennar
Corporation
|
Guarantor
Subsidiaries
|
Non-Guarantor
Subsidiaries
|
Eliminations
|
Total
|
||||||||||
|
ASSETS
|
|||||||||||||||
|
Lennar Homebuilding:
|
|||||||||||||||
|
Cash and cash equivalents, restricted cash and receivables, net
|
$
|
562,134
|
|
192,945
|
|
28,430
|
|
—
|
|
783,509
|
|
||||
|
Inventories
|
—
|
|
6,507,172
|
|
93,876
|
|
—
|
|
6,601,048
|
|
|||||
|
Investments in unconsolidated entities
|
—
|
|
702,291
|
|
14,658
|
|
—
|
|
716,949
|
|
|||||
|
Other assets
|
116,657
|
|
539,264
|
|
86,773
|
|
5,935
|
|
748,629
|
|
|||||
|
Investments in subsidiaries
|
4,305,887
|
|
325,906
|
|
—
|
|
(4,631,793
|
)
|
—
|
|
|||||
|
Intercompany
|
3,191,611
|
|
—
|
|
—
|
|
(3,191,611
|
)
|
—
|
|
|||||
|
8,176,289
|
|
8,267,578
|
|
223,737
|
|
(7,817,469
|
)
|
8,850,135
|
|
||||||
|
Rialto real estate owned - held-and-used, net
|
—
|
|
—
|
|
428,989
|
|
—
|
|
428,989
|
|
|||||
|
Rialto all other assets
|
—
|
|
—
|
|
1,050,324
|
|
—
|
|
1,050,324
|
|
|||||
|
Lennar Financial Services
|
—
|
|
76,160
|
|
720,550
|
|
—
|
|
796,710
|
|
|||||
|
Lennar Multifamily
|
—
|
|
147,089
|
|
—
|
|
—
|
|
147,089
|
|
|||||
|
Total assets
|
$
|
8,176,289
|
|
8,490,827
|
|
2,423,600
|
|
(7,817,469
|
)
|
11,273,247
|
|
||||
|
LIABILITIES AND EQUITY
|
|||||||||||||||
|
Lennar Homebuilding:
|
|||||||||||||||
|
Accounts payable and other liabilities
|
$
|
302,558
|
|
623,709
|
|
58,029
|
|
—
|
|
984,296
|
|
||||
|
Liabilities related to consolidated inventory not owned
|
—
|
|
384,876
|
|
—
|
|
—
|
|
384,876
|
|
|||||
|
Senior notes and other debts payable
|
3,704,830
|
|
400,044
|
|
89,558
|
|
—
|
|
4,194,432
|
|
|||||
|
Intercompany
|
—
|
|
3,183,664
|
|
7,947
|
|
(3,191,611
|
)
|
—
|
|
|||||
|
4,007,388
|
|
4,592,293
|
|
155,534
|
|
(3,191,611
|
)
|
5,563,604
|
|
||||||
|
Rialto
|
—
|
|
—
|
|
497,008
|
|
—
|
|
497,008
|
|
|||||
|
Lennar Financial Services
|
—
|
|
30,045
|
|
507,659
|
|
5,935
|
|
543,639
|
|
|||||
|
Lennar Multifamily
|
—
|
|
41,526
|
|
—
|
|
—
|
|
41,526
|
|
|||||
|
Total liabilities
|
$
|
4,007,388
|
|
4,663,864
|
|
1,160,201
|
|
(3,185,676
|
)
|
6,645,777
|
|
||||
|
Stockholders’ equity
|
4,168,901
|
|
3,826,963
|
|
804,830
|
|
(4,631,793
|
)
|
4,168,901
|
|
|||||
|
Noncontrolling interests
|
—
|
|
—
|
|
458,569
|
|
—
|
|
458,569
|
|
|||||
|
Total equity
|
4,168,901
|
|
3,826,963
|
|
1,263,399
|
|
(4,631,793
|
)
|
4,627,470
|
|
|||||
|
Total liabilities and equity
|
$
|
8,176,289
|
|
8,490,827
|
|
2,423,600
|
|
(7,817,469
|
)
|
11,273,247
|
|
||||
129
LENNAR CORPORATION AND SUBSIDIARIES
NOTES TO CONSOLIDATED FINANCIAL STATEMENTS—(Continued)
|
Consolidating Statement of Operations
Year Ended November 30, 2014
|
|||||||||||||||
|
(In thousands)
|
Lennar
Corporation
|
Guarantor
Subsidiaries
|
Non-Guarantor
Subsidiaries
|
Eliminations
|
Total
|
||||||||||
|
Revenues:
|
|||||||||||||||
|
Lennar Homebuilding
|
$
|
—
|
|
7,023,678
|
|
1,452
|
|
—
|
|
7,025,130
|
|
||||
|
Lennar Financial Services
|
—
|
|
161,145
|
|
315,123
|
|
(21,887
|
)
|
454,381
|
|
|||||
|
Rialto
|
—
|
|
—
|
|
230,521
|
|
—
|
|
230,521
|
|
|||||
|
Lennar Multifamily
|
—
|
|
69,780
|
|
—
|
|
—
|
|
69,780
|
|
|||||
|
Total revenues
|
—
|
|
7,254,603
|
|
547,096
|
|
(21,887
|
)
|
7,779,812
|
|
|||||
|
Cost and expenses:
|
|||||||||||||||
|
Lennar Homebuilding
|
—
|
|
5,968,866
|
|
1,640
|
|
(8,477
|
)
|
5,962,029
|
|
|||||
|
Lennar Financial Services
|
—
|
|
153,975
|
|
233,162
|
|
(12,894
|
)
|
374,243
|
|
|||||
|
Rialto
|
—
|
|
—
|
|
249,114
|
|
—
|
|
249,114
|
|
|||||
|
Lennar Multifamily
|
—
|
|
95,226
|
|
1
|
|
—
|
|
95,227
|
|
|||||
|
Corporate general and administrative
|
172,099
|
|
—
|
|
—
|
|
5,062
|
|
177,161
|
|
|||||
|
Total costs and expenses
|
172,099
|
|
6,218,067
|
|
483,917
|
|
(16,309
|
)
|
6,857,774
|
|
|||||
|
Lennar Homebuilding equity in earnings (loss) from unconsolidated entities
|
—
|
|
(3,882
|
)
|
3,527
|
|
—
|
|
(355
|
)
|
|||||
|
Lennar Homebuilding other income, net
|
254
|
|
7,488
|
|
—
|
|
(216
|
)
|
7,526
|
|
|||||
|
Other interest expense
|
(5,794
|
)
|
(36,551
|
)
|
—
|
|
5,794
|
|
(36,551
|
)
|
|||||
|
Rialto equity in earnings from unconsolidated entities
|
—
|
|
—
|
|
59,277
|
|
—
|
|
59,277
|
|
|||||
|
Rialto other income, net
|
—
|
|
—
|
|
3,395
|
|
—
|
|
3,395
|
|
|||||
|
Lennar Multifamily equity in earnings from unconsolidated entities
|
—
|
|
14,454
|
|
—
|
|
—
|
|
14,454
|
|
|||||
|
Earnings (loss) before income taxes
|
(177,639
|
)
|
1,018,045
|
|
129,378
|
|
—
|
|
969,784
|
|
|||||
|
Benefit (provision) for income taxes
|
61,818
|
|
(351,787
|
)
|
(51,122
|
)
|
—
|
|
(341,091
|
)
|
|||||
|
Equity in earnings from subsidiaries
|
754,737
|
|
39,623
|
|
—
|
|
(794,360
|
)
|
—
|
|
|||||
|
Net earnings (including net loss attributable to noncontrolling interests)
|
638,916
|
|
705,881
|
|
78,256
|
|
(794,360
|
)
|
628,693
|
|
|||||
|
Less: Net loss attributable to noncontrolling interests
|
—
|
|
—
|
|
(10,223
|
)
|
—
|
|
(10,223
|
)
|
|||||
|
Net earnings attributable to Lennar
|
$
|
638,916
|
|
705,881
|
|
88,479
|
|
(794,360
|
)
|
638,916
|
|
||||
|
Comprehensive earnings attributable to Lennar
|
$
|
638,916
|
|
705,881
|
|
88,479
|
|
(794,360
|
)
|
638,916
|
|
||||
|
Comprehensive loss attributable to noncontrolling interests
|
$
|
—
|
|
—
|
|
(10,223
|
)
|
—
|
|
(10,223
|
)
|
||||
130
LENNAR CORPORATION AND SUBSIDIARIES
NOTES TO CONSOLIDATED FINANCIAL STATEMENTS—(Continued)
|
Consolidating Statement of Operations
Year Ended November 30, 2013
|
|||||||||||||||
|
(In thousands)
|
Lennar
Corporation
|
Guarantor
Subsidiaries
|
Non-Guarantor
Subsidiaries
|
Eliminations
|
Total
|
||||||||||
|
Revenues:
|
|||||||||||||||
|
Lennar Homebuilding
|
$
|
—
|
|
5,317,890
|
|
37,057
|
|
—
|
|
5,354,947
|
|
||||
|
Lennar Financial Services
|
—
|
|
162,939
|
|
285,474
|
|
(21,071
|
)
|
427,342
|
|
|||||
|
Rialto
|
—
|
|
—
|
|
138,060
|
|
—
|
|
138,060
|
|
|||||
|
Lennar Multifamily
|
—
|
|
14,746
|
|
—
|
|
—
|
|
14,746
|
|
|||||
|
Total revenues
|
—
|
|
5,495,575
|
|
460,591
|
|
(21,071
|
)
|
5,935,095
|
|
|||||
|
Cost and expenses:
|
|||||||||||||||
|
Lennar Homebuilding
|
—
|
|
4,547,431
|
|
24,368
|
|
7,309
|
|
4,579,108
|
|
|||||
|
Lennar Financial Services
|
—
|
|
157,351
|
|
212,380
|
|
(28,175
|
)
|
341,556
|
|
|||||
|
Rialto
|
—
|
|
—
|
|
151,072
|
|
—
|
|
151,072
|
|
|||||
|
Lennar Multifamily
|
—
|
|
31,463
|
|
—
|
|
—
|
|
31,463
|
|
|||||
|
Corporate general and administrative
|
140,999
|
|
—
|
|
—
|
|
5,061
|
|
146,060
|
|
|||||
|
Total costs and expenses
|
140,999
|
|
4,736,245
|
|
387,820
|
|
(15,805
|
)
|
5,249,259
|
|
|||||
|
Lennar Homebuilding equity in earnings from unconsolidated entities
|
—
|
|
22,966
|
|
837
|
|
—
|
|
23,803
|
|
|||||
|
Lennar Homebuilding other income, net
|
542
|
|
27,308
|
|
—
|
|
(504
|
)
|
27,346
|
|
|||||
|
Other interest expense
|
(5,770
|
)
|
(93,913
|
)
|
—
|
|
5,770
|
|
(93,913
|
)
|
|||||
|
Rialto equity in earnings from unconsolidated entities
|
—
|
|
—
|
|
22,353
|
|
—
|
|
22,353
|
|
|||||
|
Rialto other income, net
|
—
|
|
—
|
|
16,787
|
|
—
|
|
16,787
|
|
|||||
|
Lennar Multifamily equity in loss from unconsolidated entities
|
—
|
|
(271
|
)
|
—
|
|
—
|
|
(271
|
)
|
|||||
|
Earnings (loss) before income taxes
|
(146,227
|
)
|
715,420
|
|
112,748
|
|
—
|
|
681,941
|
|
|||||
|
Benefit (provision) for income taxes
|
54,353
|
|
(198,292
|
)
|
(33,076
|
)
|
—
|
|
(177,015
|
)
|
|||||
|
Equity in earnings from subsidiaries
|
571,548
|
|
45,015
|
|
—
|
|
(616,563
|
)
|
—
|
|
|||||
|
Net earnings (including net earnings attributable to noncontrolling interests)
|
479,674
|
|
562,143
|
|
79,672
|
|
(616,563
|
)
|
504,926
|
|
|||||
|
Less: Net earnings attributable to noncontrolling interests
|
—
|
|
—
|
|
25,252
|
|
—
|
|
25,252
|
|
|||||
|
Net earnings attributable to Lennar
|
$
|
479,674
|
|
562,143
|
|
54,420
|
|
(616,563
|
)
|
479,674
|
|
||||
|
Comprehensive earnings attributable to Lennar
|
$
|
479,674
|
|
562,143
|
|
54,420
|
|
(616,563
|
)
|
479,674
|
|
||||
|
Comprehensive earnings attributable to noncontrolling interests
|
$
|
—
|
|
—
|
|
25,252
|
|
—
|
|
25,252
|
|
||||
131
LENNAR CORPORATION AND SUBSIDIARIES
NOTES TO CONSOLIDATED FINANCIAL STATEMENTS—(Continued)
|
Consolidating Statement of Operations
Year Ended November 30, 2012
|
|||||||||||||||
|
(In thousands)
|
Lennar
Corporation
|
Guarantor
Subsidiaries
|
Non-Guarantor
Subsidiaries
|
Eliminations
|
Total
|
||||||||||
|
Revenues:
|
|||||||||||||||
|
Lennar Homebuilding
|
$
|
—
|
|
3,580,827
|
|
405
|
|
—
|
|
3,581,232
|
|
||||
|
Lennar Financial Services
|
—
|
|
156,478
|
|
246,566
|
|
(18,426
|
)
|
384,618
|
|
|||||
|
Rialto
|
—
|
|
—
|
|
138,856
|
|
—
|
|
138,856
|
|
|||||
|
Lennar Multifamily
|
—
|
|
426
|
|
—
|
|
—
|
|
426
|
|
|||||
|
Total revenues
|
—
|
|
3,737,731
|
|
385,827
|
|
(18,426
|
)
|
4,105,132
|
|
|||||
|
Cost and expenses:
|
|||||||||||||||
|
Lennar Homebuilding
|
—
|
|
3,201,036
|
|
15,872
|
|
(542
|
)
|
3,216,366
|
|
|||||
|
Lennar Financial Services
|
—
|
|
151,455
|
|
165,419
|
|
(17,038
|
)
|
299,836
|
|
|||||
|
Rialto
|
—
|
|
—
|
|
138,990
|
|
—
|
|
138,990
|
|
|||||
|
Lennar Multifamily
|
—
|
|
6,306
|
|
—
|
|
—
|
|
6,306
|
|
|||||
|
Corporate general and administrative
|
122,277
|
|
—
|
|
—
|
|
5,061
|
|
127,338
|
|
|||||
|
Total costs and expenses
|
122,277
|
|
3,358,797
|
|
320,281
|
|
(12,519
|
)
|
3,788,836
|
|
|||||
|
Lennar Homebuilding equity in loss from unconsolidated entities
|
—
|
|
(26,153
|
)
|
(519
|
)
|
—
|
|
(26,672
|
)
|
|||||
|
Lennar Homebuilding other income (expense), net
|
(90
|
)
|
15,106
|
|
—
|
|
128
|
|
15,144
|
|
|||||
|
Other interest expense
|
(5,779
|
)
|
(94,353
|
)
|
—
|
|
5,779
|
|
(94,353
|
)
|
|||||
|
Rialto equity in earnings from unconsolidated entities
|
—
|
|
—
|
|
41,483
|
|
—
|
|
41,483
|
|
|||||
|
Rialto other expense, net
|
—
|
|
—
|
|
(29,780
|
)
|
—
|
|
(29,780
|
)
|
|||||
|
Lennar Multifamily equity in loss from unconsolidated entities
|
—
|
|
(4
|
)
|
—
|
|
—
|
|
(4
|
)
|
|||||
|
Earnings (loss) before income taxes
|
(128,146
|
)
|
273,530
|
|
76,730
|
|
—
|
|
222,114
|
|
|||||
|
Benefit (provision) for income taxes
|
20,711
|
|
457,850
|
|
(43,343
|
)
|
—
|
|
435,218
|
|
|||||
|
Equity in earnings from subsidiaries
|
786,559
|
|
44,815
|
|
—
|
|
(831,374
|
)
|
—
|
|
|||||
|
Net earnings (including net loss attributable to noncontrolling interests)
|
679,124
|
|
776,195
|
|
33,387
|
|
(831,374
|
)
|
657,332
|
|
|||||
|
Less: Net loss attributable to noncontrolling interests
|
—
|
|
—
|
|
(21,792
|
)
|
—
|
|
(21,792
|
)
|
|||||
|
Net earnings attributable to Lennar
|
$
|
679,124
|
|
776,195
|
|
55,179
|
|
(831,374
|
)
|
679,124
|
|
||||
|
Comprehensive earnings attributable to Lennar
|
$
|
679,124
|
|
776,195
|
|
55,179
|
|
(831,374
|
)
|
679,124
|
|
||||
|
Comprehensive loss attributable to noncontrolling interests
|
$
|
—
|
|
—
|
|
(21,792
|
)
|
—
|
|
(21,792
|
)
|
||||
132
LENNAR CORPORATION AND SUBSIDIARIES
NOTES TO CONSOLIDATED FINANCIAL STATEMENTS—(Continued)
|
Consolidating Statement of Cash Flows
Year Ended November 30, 2014
|
|||||||||||||||
|
(In thousands)
|
Lennar
Corporation
|
Guarantor
Subsidiaries
|
Non-Guarantor
Subsidiaries
|
Eliminations
|
Total
|
||||||||||
|
Cash flows from operating activities:
|
|||||||||||||||
|
Net earnings (including net loss attributable to noncontrolling interests)
|
$
|
638,916
|
|
705,881
|
|
78,256
|
|
(794,360
|
)
|
628,693
|
|
||||
|
Distributions of earnings from guarantor and non-guarantor subsidiaries
|
754,737
|
|
39,623
|
|
—
|
|
(794,360
|
)
|
—
|
|
|||||
|
Other adjustments to reconcile net earnings (including net loss attributable to noncontrolling interests) to net cash provided by (used in) operating activities
|
(583,119
|
)
|
(1,227,547
|
)
|
(400,875
|
)
|
794,360
|
|
(1,417,181
|
)
|
|||||
|
Net cash provided by (used in) operating activities
|
810,534
|
|
(482,043
|
)
|
(322,619
|
)
|
(794,360
|
)
|
(788,488
|
)
|
|||||
|
Cash flows from investing activities:
|
|||||||||||||||
|
Distributions of capital from Lennar Homebuilding unconsolidated entities, net of investments in and contributions to
|
—
|
|
54,065
|
|
1,885
|
|
—
|
|
55,950
|
|
|||||
|
Distributions of capital from Rialto unconsolidated entities, net of investments in and contributions to
|
—
|
|
—
|
|
27,391
|
|
—
|
|
27,391
|
|
|||||
|
Distributions of capital from Lennar Multifamily unconsolidated entities, net of investments in and contributions to
|
—
|
|
36,182
|
|
—
|
|
—
|
|
36,182
|
|
|||||
|
Receipts of principal payments on Rialto loans receivable, net
|
—
|
|
—
|
|
24,019
|
|
—
|
|
24,019
|
|
|||||
|
Proceeds from sales of Rialto real estate owned
|
—
|
|
—
|
|
269,698
|
|
—
|
|
269,698
|
|
|||||
|
Proceeds from sale of operating properties
|
—
|
|
43,937
|
|
—
|
|
—
|
|
43,937
|
|
|||||
|
Other
|
(2,347
|
)
|
17,491
|
|
(33,962
|
)
|
—
|
|
(18,818
|
)
|
|||||
|
Distributions of capital from guarantor and non-guarantor subsidiaries
|
232,200
|
|
65,200
|
|
—
|
|
(297,400
|
)
|
—
|
|
|||||
|
Intercompany
|
(1,515,367
|
)
|
—
|
|
—
|
|
1,515,367
|
|
—
|
|
|||||
|
Net cash provided by (used in) investing activities
|
(1,285,514
|
)
|
216,875
|
|
289,031
|
|
1,217,967
|
|
438,359
|
|
|||||
|
Cash flows from financing activities:
|
|||||||||||||||
|
Net borrowings under Lennar Financial Services debt
|
—
|
|
—
|
|
324,281
|
|
—
|
|
324,281
|
|
|||||
|
Net borrowings under Rialto warehouse repurchase facilities
|
—
|
|
—
|
|
65,254
|
|
—
|
|
65,254
|
|
|||||
|
Net proceeds from senior notes and structured notes
|
843,300
|
|
—
|
|
196,180
|
|
—
|
|
1,039,480
|
|
|||||
|
Redemption of senior notes
|
(250,000
|
)
|
—
|
|
—
|
|
—
|
|
(250,000
|
)
|
|||||
|
Principal repayments on Rialto notes payable
|
—
|
|
—
|
|
(75,879
|
)
|
—
|
|
(75,879
|
)
|
|||||
|
Net repayments on other borrowings
|
—
|
|
(255,397
|
)
|
(9,892
|
)
|
—
|
|
(265,289
|
)
|
|||||
|
Exercise of land option contracts from an unconsolidated land investment venture
|
—
|
|
(1,540
|
)
|
—
|
|
—
|
|
(1,540
|
)
|
|||||
|
Net payments related to noncontrolling interests
|
—
|
|
—
|
|
(142,766
|
)
|
—
|
|
(142,766
|
)
|
|||||
|
Excess tax benefits from share-based awards
|
7,497
|
|
—
|
|
—
|
|
—
|
|
7,497
|
|
|||||
|
Common stock:
|
|||||||||||||||
|
Issuances
|
13,599
|
|
—
|
|
—
|
|
—
|
|
13,599
|
|
|||||
|
Repurchases
|
(20,424
|
)
|
—
|
|
—
|
|
—
|
|
(20,424
|
)
|
|||||
|
Dividends
|
(32,775
|
)
|
(771,081
|
)
|
(320,679
|
)
|
1,091,760
|
|
(32,775
|
)
|
|||||
|
Intercompany
|
—
|
|
1,395,934
|
|
119,433
|
|
(1,515,367
|
)
|
—
|
|
|||||
|
Net cash provided by financing activities
|
561,197
|
|
367,916
|
|
155,932
|
|
(423,607
|
)
|
661,438
|
|
|||||
|
Net increase in cash and cash equivalents
|
86,217
|
|
102,748
|
|
122,344
|
|
—
|
|
311,309
|
|
|||||
|
Cash and cash equivalents at beginning of period
|
547,101
|
|
152,753
|
|
270,651
|
|
—
|
|
970,505
|
|
|||||
|
Cash and cash equivalents at end of period
|
$
|
633,318
|
|
255,501
|
|
392,995
|
|
—
|
|
1,281,814
|
|
||||
133
LENNAR CORPORATION AND SUBSIDIARIES
NOTES TO CONSOLIDATED FINANCIAL STATEMENTS—(Continued)
|
Consolidating Statement of Cash Flows
Year Ended November 30, 2013
|
|||||||||||||||
|
(In thousands)
|
Lennar
Corporation
|
Guarantor
Subsidiaries
|
Non-Guarantor
Subsidiaries
|
Eliminations
|
Total
|
||||||||||
|
Cash flows from operating activities:
|
|||||||||||||||
|
Net earnings (including net earnings attributable to noncontrolling interests)
|
$
|
479,674
|
|
562,143
|
|
79,672
|
|
(616,563
|
)
|
504,926
|
|
||||
|
Distributions of earnings from guarantor and non-guarantor subsidiaries
|
571,548
|
|
45,015
|
|
—
|
|
(616,563
|
)
|
—
|
|
|||||
|
Other adjustments to reconcile net earnings (including net earnings attributable to noncontrolling interests) to net cash provided by (used in) operating activities
|
(555,792
|
)
|
(1,421,646
|
)
|
48,235
|
|
616,563
|
|
(1,312,640
|
)
|
|||||
|
Net cash provided by (used in) operating activities
|
495,430
|
|
(814,488
|
)
|
127,907
|
|
(616,563
|
)
|
(807,714
|
)
|
|||||
|
Cash flows from investing activities:
|
|||||||||||||||
|
Distributions of capital from Lennar Homebuilding unconsolidated entities, net of investments in and contributions to
|
—
|
|
98,819
|
|
2,190
|
|
—
|
|
101,009
|
|
|||||
|
Investments in and contributions to Rialto unconsolidated entities, net of distributions of capital
|
—
|
|
—
|
|
(24,397
|
)
|
—
|
|
(24,397
|
)
|
|||||
|
Decrease in Rialto defeasance cash to retire notes payable
|
—
|
|
—
|
|
223,813
|
|
—
|
|
223,813
|
|
|||||
|
Receipts of principal payments on Rialto loans receivable, net
|
—
|
|
—
|
|
66,788
|
|
—
|
|
66,788
|
|
|||||
|
Proceeds from sales of Rialto real estate owned
|
—
|
|
—
|
|
239,215
|
|
—
|
|
239,215
|
|
|||||
|
Proceeds from sale of operating properties
|
—
|
|
—
|
|
140,564
|
|
—
|
|
140,564
|
|
|||||
|
Other
|
(233
|
)
|
(30,213
|
)
|
(27,297
|
)
|
—
|
|
(57,743
|
)
|
|||||
|
Intercompany
|
(1,333,932
|
)
|
—
|
|
—
|
|
1,333,932
|
|
—
|
|
|||||
|
Net cash provided by (used in) investing activities
|
(1,334,165
|
)
|
68,606
|
|
620,876
|
|
1,333,932
|
|
689,249
|
|
|||||
|
Cash flows from financing activities:
|
|||||||||||||||
|
Net repayments under Lennar Financial Services debt
|
—
|
|
—
|
|
(83,828
|
)
|
—
|
|
(83,828
|
)
|
|||||
|
Net borrowings under Rialto warehouse repurchase facilities
|
—
|
|
—
|
|
76,017
|
|
—
|
|
76,017
|
|
|||||
|
Net proceeds from convertible and senior notes
|
494,329
|
|
—
|
|
—
|
|
—
|
|
494,329
|
|
|||||
|
Redemption of senior notes
|
(63,001
|
)
|
(750
|
)
|
—
|
|
—
|
|
(63,751
|
)
|
|||||
|
Net proceeds from Rialto senior notes
|
—
|
|
—
|
|
242,736
|
|
—
|
|
242,736
|
|
|||||
|
Principal repayments on Rialto notes payable
|
—
|
|
—
|
|
(471,255
|
)
|
—
|
|
(471,255
|
)
|
|||||
|
Net repayments on other borrowings
|
—
|
|
(67,984
|
)
|
(126,779
|
)
|
—
|
|
(194,763
|
)
|
|||||
|
Exercise of land option contracts from an unconsolidated land investment venture
|
—
|
|
(28,869
|
)
|
—
|
|
—
|
|
(28,869
|
)
|
|||||
|
Net payments related to noncontrolling interests
|
—
|
|
—
|
|
(193,419
|
)
|
—
|
|
(193,419
|
)
|
|||||
|
Excess tax benefits from share-based awards
|
10,148
|
|
—
|
|
—
|
|
—
|
|
10,148
|
|
|||||
|
Common stock:
|
|||||||||||||||
|
Issuances
|
34,114
|
|
—
|
|
—
|
|
—
|
|
34,114
|
|
|||||
|
Repurchases
|
(12,320
|
)
|
—
|
|
—
|
|
—
|
|
(12,320
|
)
|
|||||
|
Dividends
|
(30,912
|
)
|
(562,143
|
)
|
(54,420
|
)
|
616,563
|
|
(30,912
|
)
|
|||||
|
Intercompany
|
—
|
|
1,366,008
|
|
(32,076
|
)
|
(1,333,932
|
)
|
—
|
|
|||||
|
Net cash provided by (used in) financing activities
|
432,358
|
|
706,262
|
|
(643,024
|
)
|
(717,369
|
)
|
(221,773
|
)
|
|||||
|
Net increase (decrease) in cash and cash equivalents
|
(406,377
|
)
|
(39,620
|
)
|
105,759
|
|
—
|
|
(340,238
|
)
|
|||||
|
Cash and cash equivalents at beginning of period
|
953,478
|
|
192,373
|
|
164,892
|
|
—
|
|
1,310,743
|
|
|||||
|
Cash and cash equivalents at end of period
|
$
|
547,101
|
|
152,753
|
|
270,651
|
|
—
|
|
970,505
|
|
||||
134
LENNAR CORPORATION AND SUBSIDIARIES
NOTES TO CONSOLIDATED FINANCIAL STATEMENTS—(Continued)
|
Consolidating Statement of Cash Flows
Year Ended November 30, 2012
|
|||||||||||||||
|
(In thousands)
|
Lennar
Corporation
|
Guarantor
Subsidiaries
|
Non-Guarantor
Subsidiaries
|
Eliminations
|
Total
|
||||||||||
|
Cash flows from operating activities:
|
|||||||||||||||
|
Net earnings (including net loss attributable to noncontrolling interests)
|
$
|
679,124
|
|
776,195
|
|
33,387
|
|
(831,374
|
)
|
657,332
|
|
||||
|
Distributions of earnings from guarantor and non-guarantor subsidiaries
|
318,998
|
|
44,815
|
|
—
|
|
(363,813
|
)
|
—
|
|
|||||
|
Other adjustments to reconcile net earnings (including net loss attributable to noncontrolling interests) to net cash provided by (used in) operating activities
|
(783,282
|
)
|
(962,447
|
)
|
(167,625
|
)
|
831,374
|
|
(1,081,980
|
)
|
|||||
|
Net cash provided by (used in) operating activities
|
214,840
|
|
(141,437
|
)
|
(134,238
|
)
|
(363,813
|
)
|
(424,648
|
)
|
|||||
|
Cash flows from investing activities:
|
|||||||||||||||
|
Investments in and contributions to Lennar Homebuilding unconsolidated entities, net of distributions of capital
|
—
|
|
(27,113
|
)
|
(842
|
)
|
—
|
|
(27,955
|
)
|
|||||
|
Distributions of capital from Rialto unconsolidated entities, net of investments and contributions to
|
—
|
|
—
|
|
39,813
|
|
—
|
|
39,813
|
|
|||||
|
Increase in Rialto defeasance cash to retire notes payable
|
—
|
|
—
|
|
(4,427
|
)
|
—
|
|
(4,427
|
)
|
|||||
|
Receipts of principal payments on Rialto loans receivable, net
|
—
|
|
—
|
|
81,648
|
|
—
|
|
81,648
|
|
|||||
|
Proceeds from sales of Rialto real estate owned
|
—
|
|
—
|
|
183,883
|
|
—
|
|
183,883
|
|
|||||
|
Other
|
(218
|
)
|
3,720
|
|
(31,173
|
)
|
—
|
|
(27,671
|
)
|
|||||
|
Intercompany
|
(700,846
|
)
|
—
|
|
—
|
|
700,846
|
|
—
|
|
|||||
|
Net cash provided by (used in) investing activities
|
(701,064
|
)
|
(23,393
|
)
|
268,902
|
|
700,846
|
|
245,291
|
|
|||||
|
Cash flows from financing activities:
|
|||||||||||||||
|
Net borrowings (repayments) under Lennar Financial Services debt
|
—
|
|
(76
|
)
|
47,936
|
|
—
|
|
47,860
|
|
|||||
|
Net proceeds from convertible and senior notes
|
790,882
|
|
—
|
|
—
|
|
—
|
|
790,882
|
|
|||||
|
Partial redemption of senior notes
|
(210,862
|
)
|
—
|
|
—
|
|
—
|
|
(210,862
|
)
|
|||||
|
Net repayments on other borrowings
|
—
|
|
(51,918
|
)
|
(195,694
|
)
|
—
|
|
(247,612
|
)
|
|||||
|
Exercise of land option contracts from an unconsolidated land investment venture
|
—
|
|
(50,396
|
)
|
—
|
|
—
|
|
(50,396
|
)
|
|||||
|
Net receipts related to noncontrolling interests
|
—
|
|
—
|
|
1,179
|
|
|
|
1,179
|
|
|||||
|
Excess tax benefits from share-based awards
|
10,814
|
|
—
|
|
—
|
|
—
|
|
10,814
|
|
|||||
|
Common stock:
|
|||||||||||||||
|
Issuances
|
32,174
|
|
—
|
|
—
|
|
—
|
|
32,174
|
|
|||||
|
Repurchases
|
(17,149
|
)
|
—
|
|
—
|
|
—
|
|
(17,149
|
)
|
|||||
|
Dividends
|
(30,394
|
)
|
(308,634
|
)
|
(55,179
|
)
|
363,813
|
|
(30,394
|
)
|
|||||
|
Intercompany
|
—
|
|
596,209
|
|
104,637
|
|
(700,846
|
)
|
—
|
|
|||||
|
Net cash provided by (used in) financing activities
|
575,465
|
|
185,185
|
|
(97,121
|
)
|
(337,033
|
)
|
326,496
|
|
|||||
|
Net increase in cash and cash equivalents
|
89,241
|
|
20,355
|
|
37,543
|
|
—
|
|
147,139
|
|
|||||
|
Cash and cash equivalents at beginning of period
|
864,237
|
|
172,018
|
|
127,349
|
|
—
|
|
1,163,604
|
|
|||||
|
Cash and cash equivalents at end of period
|
$
|
953,478
|
|
192,373
|
|
164,892
|
|
—
|
|
1,310,743
|
|
||||
135
LENNAR CORPORATION AND SUBSIDIARIES
NOTES TO CONSOLIDATED FINANCIAL STATEMENTS—(Continued)
19. Quarterly Data (unaudited)
|
First
|
Second
|
Third
|
Fourth
|
|||||||||
|
(In thousands, except per share amounts)
|
||||||||||||
|
2014
|
||||||||||||
|
Revenues
|
$
|
1,363,095
|
|
1,818,745
|
|
2,014,034
|
|
2,583,938
|
|
|||
|
Gross profit from sales of homes
|
$
|
286,053
|
|
409,615
|
|
456,162
|
|
584,403
|
|
|||
|
Earnings before income taxes
|
$
|
125,876
|
|
203,630
|
|
262,335
|
|
377,943
|
|
|||
|
Net earnings attributable to Lennar
|
$
|
78,117
|
|
137,719
|
|
177,757
|
|
245,323
|
|
|||
|
Earnings per share:
|
||||||||||||
|
Basic
|
$
|
0.38
|
|
0.67
|
|
0.87
|
|
1.20
|
|
|||
|
Diluted
|
$
|
0.35
|
|
0.61
|
|
0.78
|
|
1.07
|
|
|||
|
2013
|
||||||||||||
|
Revenues
|
$
|
990,243
|
|
1,426,881
|
|
1,602,768
|
|
1,915,203
|
|
|||
|
Gross profit from sales of homes
|
$
|
188,997
|
|
303,284
|
|
360,946
|
|
465,033
|
|
|||
|
Earnings before income taxes
|
$
|
53,321
|
|
162,289
|
|
189,359
|
|
276,972
|
|
|||
|
Net earnings attributable to Lennar
|
$
|
57,492
|
|
137,436
|
|
120,662
|
|
164,084
|
|
|||
|
Earnings per share:
|
||||||||||||
|
Basic
|
$
|
0.30
|
|
0.71
|
|
0.62
|
|
0.84
|
|
|||
|
Diluted
|
$
|
0.26
|
|
0.61
|
|
0.54
|
|
0.73
|
|
|||
Quarterly and year-to-date computations of per share amounts are made independently. Therefore, the sum of per share amounts for the quarters may not agree with per share amounts for the year.
136
Not applicable.
Evaluation of Disclosure Controls and Procedures
Our Chief Executive Officer and Chief Financial Officer participated in an evaluation by our management of the effectiveness of our disclosure controls and procedures as of the end of the period cover by this report. Based on their participation in that evaluation, our CEO and CFO concluded that our disclosure controls and procedures were effective as of
November 30, 2014
to ensure that information required to be disclosed in our reports filed or submitted under the Securities Exchange Act of 1934 is recorded, processed, summarized and reported within the time periods specified in the Securities and Exchange Commission’s rules and forms, and to ensure that information required to be disclosed in our reports filed or furnished under the Securities Exchange Act of 1934, as amended, is accumulated and communicated to our management, including our CEO and CFO, as appropriate to allow timely decisions regarding required disclosures.
Our CEO and CFO also participated in an evaluation by our management of any changes in our internal control over financial reporting that occurred during the quarter ended
November 30, 2014
. That evaluation did not identify any changes that have materially affected, or are reasonably likely to materially affect, our internal control over financial reporting.
Management’s Annual Report on Internal Control Over Financial Reporting and the Report of Independent Registered Public Accounting Firm obtained from Deloitte & Touche LLP relating to the effectiveness of Lennar Corporation’s internal control over financial reporting are included elsewhere in this document.
Management’s Annual Report on Internal Control Over Financial Reporting
Our management is responsible for establishing and maintaining adequate internal control over financial reporting, as such term is defined in Exchange Act Rule 13a-15(f). Under the supervision and with the participation of our management, including our CEO and CFO, we conducted an evaluation of the effectiveness of our internal control over financial reporting based on the framework in
Internal Control—Integrated Framework
(1992) issued by the Committee of Sponsoring Organizations of the Treadway Commission. Based on our evaluation under the framework in
Internal Control—Integrated Framework
(1992)
,
our management concluded that our internal control over financial reporting was effective as of
November 30, 2014
. The effectiveness of our internal control over financial reporting as of
November 30, 2014
has been audited by Deloitte & Touche LLP, an independent registered public accounting firm, as stated in their attestation report which is included herein.
137
REPORT OF INDEPENDENT REGISTERED PUBLIC ACCOUNTING FIRM
To the Board of Directors and Stockholders of Lennar Corporation
We have audited the internal control over financial reporting of Lennar Corporation and subsidiaries (the “Company”) as of
November 30, 2014
, based on the criteria established in
Internal Control — Integrated Framework
(1992) issued by the Committee of Sponsoring Organizations of the Treadway Commission. The Company’s management is responsible for maintaining effective internal control over financial reporting and for its assessment of the effectiveness of internal control over financial reporting, included in the accompanying Management’s Annual Report on Internal Control Over Financial Reporting. Our responsibility is to express an opinion on the Company’s internal control over financial reporting based on our audit.
We conducted our audit in accordance with the standards of the Public Company Accounting Oversight Board (United States). Those standards require that we plan and perform the audit to obtain reasonable assurance about whether effective internal control over financial reporting was maintained in all material respects. Our audit included obtaining an understanding of internal control over financial reporting, assessing the risk that a material weakness exists, testing and evaluating the design and operating effectiveness of internal control based on the assessed risk, and performing such other procedures as we considered necessary in the circumstances. We believe that our audit provides a reasonable basis for our opinion.
A company’s internal control over financial reporting is a process designed by, or under the supervision of, the company’s principal executive and principal financial officers, or persons performing similar functions, and effected by the company’s board of directors, management, and other personnel to provide reasonable assurance regarding the reliability of financial reporting and the preparation of financial statements for external purposes in accordance with generally accepted accounting principles. A company’s internal control over financial reporting includes those policies and procedures that (1) pertain to the maintenance of records that, in reasonable detail, accurately and fairly reflect the transactions and dispositions of the assets of the company; (2) provide reasonable assurance that transactions are recorded as necessary to permit preparation of financial statements in accordance with generally accepted accounting principles, and that receipts and expenditures of the company are being made only in accordance with authorizations of management and directors of the company; and (3) provide reasonable assurance regarding prevention or timely detection of unauthorized acquisition, use, or disposition of the company’s assets that could have a material effect on the financial statements.
Because of the inherent limitations of internal control over financial reporting, including the possibility of collusion or improper management override of controls, material misstatements due to error or fraud may not be prevented or detected on a timely basis. Also, projections of any evaluation of the effectiveness of the internal control over financial reporting to future periods are subject to the risk that the controls may become inadequate because of changes in conditions, or that the degree of compliance with the policies or procedures may deteriorate.
In our opinion, the Company maintained, in all material respects, effective internal control over financial reporting as of
November 30, 2014
, based on the criteria established in
Internal Control — Integrated Framework
(1992) issued by the Committee of Sponsoring Organizations of the Treadway Commission.
We have also audited, in accordance with the standards of the Public Company Accounting Oversight Board (United States), the consolidated financial statements as of and for the year ended
November 30, 2014
of the Company and our report dated
January 23, 2015
expressed an unqualified opinion on those financial statements.
|
/s/ DELOITTE & TOUCHE LLP
|
|
Certified Public Accountants
|
|
Miami, Florida
|
|
January 23, 2015
|
138
Not applicable.
The information required by this item for executive officers is set forth under the heading “Executive Officers of Lennar Corporation” in Part I. We have adopted a Code of Business Conduct and Ethics that applies to our Chief Executive Officer, Chief Financial Officer and Chief Accounting Officer. The Code of Business Conduct and Ethics is located on our internet web site at www.lennar.com under “Investor Relations – Corporate Governance.” We intend to provide disclosure of any amendments or waivers of our Code of Business Conduct and Ethics on our website within four business days following the date of the amendment or waiver. The other information called for by this item is incorporated by reference to our definitive proxy statement, which will be filed with the Securities and Exchange Commission not later than March 30, 2015 (120 days after the end of our fiscal year).
The information required by this item is incorporated by reference to our definitive proxy statement, which will be filed with the Securities and Exchange Commission not later than March 30, 2015 (120 days after the end of our fiscal year).
The information required by this item is incorporated by reference to our definitive proxy statement, which will be filed with the Securities and Exchange Commission not later than March 30, 2015 (120 days after the end of our fiscal year), except for the information required by Item 201(d) of Regulation S-K, which is provided below.
The following table summarizes our equity compensation plans as of
November 30, 2014
:
|
Plan category
|
Number of shares to be issued upon exercise of outstanding options, warrants and rights
(a)
|
Weighted-average exercise price of outstanding options, warrants and rights (b)
|
Number of shares remaining available for future issuance under equity compensation plans (excluding shares reflected in column (a)) c(1)
|
||||||
|
Equity compensation plans approved by stockholders
|
57,500
|
|
$
|
35.16
|
|
9,551,316
|
|
||
|
Equity compensation plans not approved by stockholders
|
—
|
|
—
|
|
—
|
|
|||
|
Total
|
57,500
|
|
$
|
35.16
|
|
9,551,316
|
|
||
|
(1)
|
Both Class A and Class B common stock may be issued.
|
The information required by this item is incorporated by reference to our definitive proxy statement, which will be filed with the Securities and Exchange Commission not later than March 30, 2015 (120 days after the end of our fiscal year).
The information required by this item is incorporated by reference to our definitive proxy statement, which will be filed with the Securities and Exchange Commission not later than March 30, 2015 (120 days after the end of our fiscal year).
139
|
(a)
|
Documents filed as part of this Report.
|
|
1.
|
The following financial statements are contained in Item 8:
|
|
Financial Statements
|
Page in
this Report
|
|
2.
|
The following financial statement schedule is included in this Report:
|
|
Financial Statement Schedule
|
Page in
this Report
|
Information required by other schedules has either been incorporated in the consolidated financial statements and accompanying notes or is not applicable to us.
|
3.
|
The following exhibits are filed with this Report or incorporated by reference:
|
|
3.1
|
Restated Certificate of Incorporation of the Company, dated January 14, 2015-filed herewith.
|
|
3.2
|
Bylaws of the Company, as amended effective October 3, 2013-Incorporated by reference to Exhibit 3.6 of the Company’s Current Report on Form 8-K, dated October 4, 2013.
|
|
4.1
|
Indenture, dated as of December 31, 1997, between Lennar Corporation and Bank One Trust Company, N.A., as trustee-Incorporated by reference to Exhibit 4 of the Company’s Registration Statement on Form S-3, Registration No. 333-45527, filed with the Commission on February 3, 1998.
|
|
4.2
|
Indenture, dated April 28, 2005, between Lennar and J.P. Morgan Trust Company, N.A., as trustee (relating to Lennar’s 5.60% Senior Notes due 2015)-Incorporated by reference to Exhibit 4.1 of the Company’s Registration Statement on Form S-4, Registration No. 333-127839, filed with the Commission on August 25, 2005.
|
|
4.3
|
Indenture, dated April 26, 2006, between Lennar and J.P. Morgan Trust Company, N.A., as trustee (relating to Lennar’s 6.50% Senior Notes due 2016)-Incorporated by reference to Exhibit 10.2 of the Company’s Current Report on Form 8-K, dated April 26, 2006.
|
|
4.4
|
Indenture, dated April 30, 2009, between Lennar and The Bank of New York Mellon, as trustee (relating to Lennar’s 12.25% Senior Notes due 2017)-Incorporated by reference to Exhibit 99.1 of the Company’s Current Report on Form 8-K, dated April 30, 2009.
|
|
4.5
|
Indenture, dated May 4, 2010, between Lennar and The Bank of New York Mellon, as trustee (relating to Lennar’s 6.95% Senior Notes due 2018)- Incorporated by reference to Exhibit 4.1 of the Company’s Registration Statement on Form S-4, Registration No. 333-167622, filed with the Commission on June 18, 2010.
|
|
4.6
|
Indenture, dated November 10, 2010, between Lennar and The Bank of New York Mellon, as trustee (relating to Lennar’s 2.75% Convertible Senior Notes due 2020)-Incorporated by reference to Exhibit 4.10 of the Company’s Annual Report on Form 10-K for the fiscal year ended November 30, 2010.
|
|
4.7
|
Indenture, dated November 23, 2011, between Lennar and The Bank of New York Mellon, as trustee (relating to Lennar’s 3.25% Convertible Senior Notes due 2021)-Incorporated by reference to Exhibit 4.1 of the Company's Current Report on Form 8-K, dated February 1, 2012.
|
|
4.8
|
Indenture, dated July 20, 2012, between Lennar and The Bank of New York Mellon Trust Company, N.A., as trustee (relating to Lennar’s 4.75% Senior Notes due 2017)-Incorporated by reference to Exhibit 4.1 of the Company's Registration Statement on Form S-4, Registration No. 333-183755, filed with the Commission on September 6, 2012.
|
140
|
4.9
|
Indenture, dated October 23, 2012, between Lennar and The Bank of New York Mellon Trust Company, N.A., as trustee (relating to Lennar’s 4.750% Senior Notes due 2022).
|
|
4.10
|
Indenture, dated February 4, 2013, between Lennar and The Bank of New York Mellon Trust Company, N.A., as trustee (relating to Lennar’s 4.125% Senior Notes due 2018)-Incorporated by reference to Exhibit 10.1 of the Company's Current Report on Form 10-Q for the quarter ended February 28, 2013.
|
|
4.11
|
Eighth Supplemental Indenture, dated as of February 12, 2014, among Lennar Corporation, each of the guarantors identified therein and The Bank of New York Mellon, as trustee, including the form of 4.50% Senior Notes due 2019-Incorporated by reference to Exhibit 4.12 of the Company’s Current Report on Form 8-K, dated February 13, 2014.
|
|
4.12
|
Ninth Supplemental Indenture, dated as of November 25, 2014, among Lennar Corporation, each of the guarantors identified therein and The Bank of New York Mellon, as trustee, including the form of 4.50% Senior Notes due 2019-Incorporated by reference to Exhibit 4.13 of the Company’s Current Report on Form 8-K, dated November 25, 2014.
|
|
10.1*
|
Lennar Corporation 2007 Equity Incentive Plan, as amended effective January 12, 2012-Incorporated by reference to Exhibit 1 of the Company’s Proxy Statement on Schedule 14A dated March 2, 2012.
|
|
10.2*
|
Lennar Corporation 2012 Incentive Compensation Plan-Incorporated by reference to Exhibit 2 of the Company’s Proxy Statement on Schedule 14A dated March 2, 2012.
|
|
10.3*
|
Lennar Corporation Nonqualified Deferred Compensation Plan-Incorporated by reference to Exhibit 10 of the Company’s Quarterly Report on Form 10-Q for the quarter ended August 31, 2002.
|
|
10.4*
|
Aircraft Time-Sharing Agreement, dated August 17, 2005, between U.S. Home Corporation and Stuart Miller-Incorporated by reference to Exhibit 10.1 of the Company’s Current Report on Form 8-K, dated August 17, 2005.
|
|
10.5*
|
Amendment No. 1 to Aircraft Time-Sharing Agreement, dated September 1, 2005, between U.S. Home Corporation and Stuart Miller-Incorporated by reference to Exhibit 10.16 of the Company’s Annual Report on Form 10-K for the fiscal year ended November 30, 2005.
|
|
10.6*
|
Amended and Restated Aircraft Dry Lease Agreement, dated December 1, 2008, between U.S. Home Corporation and Stuart Miller-Incorporated by reference to Exhibit 10.1 of the Company’s Current Report on Form 8-K, dated February 18, 2009.
|
|
10.7
|
Membership Interest Purchase Agreement, dated as of November 30, 2007, by and among Lennar, Lennar Homes of California, Inc., the Sellers named in the agreement and MS Rialto Residential Holdings, LLC.-Incorporated by reference to Exhibit 10.23 of the Company’s Annual Report on Form 10-K for the fiscal year ended November 30, 2007.
|
|
10.8*
|
Aircraft Time-Sharing Agreement, dated January 26, 2011, between U.S. Home Corporation and Richard Beckwitt -Incorporated by reference to Exhibit 10.22 of the Company’s Annual Report on Form 10-K for the fiscal year ended November 30, 2010.
|
|
10.9
|
Amended and Restated Credit Agreement, dated as of June 11, 2013, among Lennar Corporation, as borrower, JPMorgan Chase Bank, N.A., as swingline lender, issuing lender, and administrative agent, the several lenders from time to time parties thereto, and the other parties and agents thereto-Incorporated by reference to Exhibit 10.18 of the Company’s Current Report on Form 8-K, dated June 14, 2013.
|
|
10.10
|
Amended and Restated Guarantee Agreement, dated as of June 11, 2013, among certain of Lennar Corporation’s subsidiaries in favor of guaranteed parties referred to therein-Incorporated by reference to Exhibit 10.19 of the Company’s Current Report on Form 8-K, dated June 14, 2013.
|
|
10.11
|
Second Amended and Restated Credit Agreement, dated as of June 25, 2014, among Lennar Corporation, as borrower, JPMorgan Chase Bank, N.A., as swingline lender, issuing lender, and administrative agent, the several lenders from time to time parties thereto, and the other parties and agents thereto-Incorporated by reference to Exhibit 10.21 of the Company’s Current Report on Form 8-K, dated June, 30, 2014.
|
|
10.12
|
Second Amended and Restated Guarantee Agreement, dated as of June 25, 2014, among certain of Lennar Corporation’s subsidiaries in favor of guaranteed parties referred to therein -Incorporated by reference to Exhibit 10.22 of the Company’s Current Report on Form 8-K, dated June, 30, 2014.
|
|
10.13
|
Indenture, dated November 14, 2013, among Rialto Holdings, LLC, Rialto Corporation, the Guarantors named therein and Wells Fargo Bank, National Association, as trustee, including the form of 7.000% Senior Notes due 2018-Incorporated by reference to Exhibit 10.20 of the Company’s Current Report on Form 8-K, dated November 14, 2013.
|
141
|
10.14
|
Master Repurchase Agreement, dated November 21, 2013, among JPMorgan Chase Bank, N.A., as a Buyer and as Administrative Agent for the Buyers named from time to time thereunder, the Buyers party thereto, and Universal American Mortgage Company of California and Universal American Mortgage Company, LLC, as Sellers, as amended-filed herewith.
|
|
10.15
|
Amended and Restated Administration Agreement, dated as of December 20, 2014, by and among JPMorgan Chase Bank, N.A., as a Buyer and as Administrative Agent for the Buyers named from time to time thereunder, and Universal American Mortgage Company of California and Universal American Mortgage Company, LLC, as Sellers-filed herewith.
|
|
10.16*
|
2013 Award Agreements for Stuart Miller, Rick Beckwitt, Jonathan Jaffe, Bruce Gross and Mark Sustana -Incorporated by reference to Exhibit 10.19 of the Company’s Annual Report on Form 10-K for the fiscal year ended November 30, 2013.
|
|
10.17*
|
2014 Award Agreements for Stuart Miller, Rick Beckwitt, Jonathan Jaffe, Bruce Gross and Mark Sustana -Incorporated by reference to Exhibit 10.20 of the Company’s Annual Report on Form 10-K for the fiscal year ended November 30, 2013.
|
|
10.18*
|
2015 Award Agreements for Stuart Miller, Rick Beckwitt, Jonathan Jaffe, Bruce Gross and Mark Sustana -filed herewith.
|
|
21
|
List of subsidiaries.
|
|
23
|
Consent of Independent Registered Public Accounting Firm.
|
|
31.1
|
Rule 13a-14a/15d-14(a) Certification of Stuart A. Miller.
|
|
31.2
|
Rule 13a-14a/15d-14(a) Certification of Bruce E. Gross.
|
|
32
|
Section 1350 Certifications of Stuart A. Miller and Bruce E. Gross.
|
|
101
|
The following financial statements from Lennar Corporation Annual Report on Form 10-K for the year ended November 30, 2014, filed on January 23, 2015, formatted in XBRL (Extensible Business Reporting Language); (i) Consolidated Balance Sheets, (ii) Consolidated Statements of Operations, (iii) Consolidated Statements of Cash Flows and (iv) the Notes to Consolidated Financial Statements (1).
|
* Management contract or compensatory plan or arrangement.
|
(1)
|
In accordance with Rule 406T of Regulation S-T, the XBRL related to information in Exhibit 101 to this Annual Report on Form 10-K shall not be deemed to be “filed” for purposes of Section 18 of Exchange Act, or otherwise subject to the liability of that section, and shall not be part of any registration or other document filed under the Securities Act or the Exchange Act, except as shall be expressly set forth by specific reference in such filing.
|
142
SIGNATURES
Pursuant to the requirements of Section 13 or 15(d) of the Securities Exchange Act of 1934, the registrant has duly caused this Report to be signed on its behalf by the undersigned, thereunto duly authorized.
|
LENNAR CORPORATION
|
||
|
/
S
/ S
TUART
A. M
ILLER
|
||
|
Stuart A. Miller
|
||
|
Chief Executive Officer and Director
|
||
|
Date:
|
January 23, 2015
|
|
Pursuant to the requirements of the Securities Exchange Act of 1934, this Report has been signed below by the following persons on behalf of the registrant and in the capacities and on the dates indicated:
|
Principal Executive Officer:
|
||
|
Stuart A. Miller
|
/
S
/ S
TUART
A. M
ILLER
|
|
|
Chief Executive Officer and Director
|
Date:
|
January 23, 2015
|
|
Principal Financial Officer:
|
||
|
Bruce E. Gross
|
/
S
/ B
RUCE
E. G
ROSS
|
|
|
Vice President and Chief Financial Officer
|
Date:
|
January 23, 2015
|
|
Principal Accounting Officer:
|
||
|
David M. Collins
|
/
S
/ D
AVID
M. C
OLLINS
|
|
|
Controller
|
Date:
|
January 23, 2015
|
|
Directors:
|
||
|
Irving Bolotin
|
/
S
/ I
RVING
B
OLOTIN
|
|
|
Date:
|
January 23, 2015
|
|
|
Steven L. Gerard
|
/
S
/ S
TEVEN
L. G
ERARD
|
|
|
Date:
|
January 23, 2015
|
|
|
Theron I. (“Tig”) Gilliam, Jr.
|
/s/ T
HERON
I. (“T
IG
”) G
ILLIAM
, J
R
.
|
|
|
Date:
|
January 23, 2015
|
|
|
Sherrill W. Hudson
|
/
S
/ S
HERRILL
W. H
UDSON
|
|
|
Date:
|
January 23, 2015
|
|
|
R. Kirk Landon
|
/
S
/ R. K
IRK
L
ANDON
|
|
|
Date:
|
January 23, 2015
|
|
|
Sidney Lapidus
|
/
S
/ S
IDNEY
L
APIDUS
|
|
|
Date:
|
January 23, 2015
|
|
|
Teri McClure
|
/
S
/ T
ERI
M
C
C
LURE
|
|
|
Date:
|
January 23, 2015
|
|
|
Armando Olivera
|
||
|
Date:
|
January 23, 2015
|
|
|
Jeffrey Sonnenfeld
|
/
S
/ J
EFFREY
S
ONNENFELD
|
|
|
Date:
|
January 23, 2015
|
|
143
REPORT OF INDEPENDENT REGISTERED PUBLIC ACCOUNTING FIRM
To the Board of Directors and Stockholders of Lennar Corporation
We have audited the consolidated financial statements of Lennar Corporation and subsidiaries (the “Company”) as of
November 30, 2014
and
2013
, and for each of the three years in the period ended
November 30, 2014
, and the Company’s internal control over financial reporting as of
November 30, 2014
, and have issued our reports thereon dated
January 23, 2015
; such consolidated financial statements and reports are included elsewhere in this Form 10-K. Our audits also included the consolidated financial statement schedule of the Company listed in Item 15. This consolidated financial statement schedule is the responsibility of the Company’s management. Our responsibility is to express an opinion based on our audits. In our opinion, such consolidated financial statement schedule, when considered in relation to the basic consolidated financial statements taken as a whole, presents fairly, in all material respects, the information set forth therein.
|
/s/ DELOITTE & TOUCHE LLP
|
|
Certified Public Accountants
|
|
Miami, Florida
|
|
January 23, 2015
|
144
LENNAR CORPORATION AND SUBSIDIARIES
Schedule II—Valuation and Qualifying Accounts
Years Ended
November 30, 2014
,
2013
and
2012
|
Additions
|
|||||||||||||||
|
(In thousands)
|
Beginning
balance
|
Charged to costs and expenses
|
Charged (credited) to other accounts
|
Deductions
|
Ending
balance
|
||||||||||
|
Year ended November 30, 2014
|
|||||||||||||||
|
Allowances deducted from assets to which they apply:
|
|||||||||||||||
|
Allowances for doubtful accounts and notes and other receivables
|
$
|
3,067
|
|
207
|
|
323
|
|
(340
|
)
|
3,257
|
|
||||
|
Allowance for loan losses and loans receivable
|
$
|
24,687
|
|
57,207
|
|
—
|
|
(19,790
|
)
|
62,104
|
|
||||
|
Allowance against net deferred tax assets
|
$
|
12,706
|
|
—
|
|
—
|
|
(4,677
|
)
|
8,029
|
|
||||
|
Year ended November 30, 2013
|
|||||||||||||||
|
Allowances deducted from assets to which they apply:
|
|||||||||||||||
|
Allowances for doubtful accounts and notes and other receivables
|
$
|
3,183
|
|
605
|
|
407
|
|
(1,128
|
)
|
3,067
|
|
||||
|
Allowance for loan losses and loans receivable
|
$
|
21,353
|
|
16,744
|
|
(167
|
)
|
(13,243
|
)
|
24,687
|
|
||||
|
Allowance against net deferred tax assets
|
$
|
88,794
|
|
—
|
|
—
|
|
(76,088
|
)
|
12,706
|
|
||||
|
Year ended November 30, 2012
|
|||||||||||||||
|
Allowances deducted from assets to which they apply:
|
|||||||||||||||
|
Allowances for doubtful accounts and notes and other receivables
|
$
|
3,376
|
|
558
|
|
(101
|
)
|
(650
|
)
|
3,183
|
|
||||
|
Allowance for loan losses and loans receivable
|
$
|
6,868
|
|
28,828
|
|
52
|
|
(14,395
|
)
|
21,353
|
|
||||
|
Allowance against net deferred tax assets
|
$
|
576,890
|
|
—
|
|
51,259
|
|
(539,355
|
)
|
88,794
|
|
||||
145
TABLE OF CONTENTS
Part IItem 1. BusinessItem 1A. Risk FactorsItem 1B. Unresolved Staff CommentsItem 2. PropertiesItem 3. Legal ProceedingsItem 4. Mine Safety DisclosuresPart IIItem 5. Market For Registrant S Common Equity, Related Stockholder Matters and Issuer Purchases Of Equity SecuritiesItem 6. Selected Financial DataItem 7. Management S Discussion and Analysis Of Financial Condition and Results Of OperationsItem 7A. Quantitative and Qualitative Disclosures About Market RiskItem 8. Financial Statements and Supplementary DataItem 9. Changes in and Disagreements with Accountants on Accounting and Financial DisclosureItem 9A. Controls and ProceduresItem 9B. Other InformationPart IIIItem 10. Directors, Executive Officers and Corporate GovernanceItem 11. Executive CompensationItem 12. Security Ownership Of Certain Beneficial Owners and Management and Related Stockholder MattersItem 13. Certain Relationships and Related Transactions, and Director IndependenceItem 14. Principal Accounting Fees and ServicesPart IVItem 15. Exhibits, Financial Statement Schedules