CENTRUS ENERGY CORP
10-Ks and 10-Qs
|
|
|
|
|
|
|
|
|
|
|
|
|
|
|
|
|
|
|
|
|
|
|
|
|
|
|
|
|
|
|
|
|
|
|
|
|
|
|
|
|
|
|
|
|
|
|
|
|
|
|
|
|
UNITED STATES
SECURITIES AND EXCHANGE COMMISSION
Washington, D.C. 20549
FORM 10-K
ANNUAL REPORT PURSUANT TO SECTION 13 OR 15(d) OF
THE SECURITIES EXCHANGE ACT OF 1934
For the fiscal year ended December 31, 2018
Commission file number 1-14287
Centrus Energy Corp.
|
Delaware
|
52-2107911
|
|
(State of incorporation)
|
(IRS Employer Identification No.)
|
6901 Rockledge Drive, Suite 800, Bethesda, Maryland 20817
(301) 564-3200
Securities registered pursuant to Section 12(b) of the Act:
|
Title of each class
|
Name of each exchange on which registered
|
|
Class A Common Stock, par value $0.10 per share
|
NYSE American
|
|
Rights to purchase Series A Participating Cumulative Preferred Stock, par value $1.00 per share
|
NYSE American
|
Securities registered pursuant to Section 12(g) of the Act: None
Indicate by check mark if the registrant is a well-known seasoned issuer, as defined in Rule 405 of the Securities Act. Yes
o
.
No
ý
Indicate by check mark if the registrant is not required to file reports pursuant to Section 13 or Section 15(d) of the Act. Yes
o
.
No
ý
Indicate by check mark whether the registrant (1) has filed all reports required to be filed by Section 13 or 15(d) of the Securities Exchange Act of 1934 during the preceding 12 months (or for such shorter period that the registrant was required to file such reports), and (2) has been subject to such filing requirements for the past 90 days. Yes
ý
No
o
Indicate by check mark whether the registrant has submitted electronically every Interactive Data File required to be submitted pursuant to Rule 405 of Regulation S-T (§232.405 of this chapter) during the preceding 12 months (or for such shorter period that the registrant was required to submit such files). Yes
ý
No
o
Indicate by check mark if disclosure of delinquent filers pursuant to Item 405 of Regulation S-K (§229.405 of this chapter) is not contained herein, and will not be contained, to the best of registrant’s knowledge, in definitive proxy or information statements incorporated by reference in Part III of this Form 10-K or any amendment to this Form 10-K.
ý
Indicate by check mark whether the registrant is a large accelerated filer, an accelerated filer, a non-accelerated filer, a smaller reporting company or an emerging growth company. See the definitions of “large accelerated filer,” “accelerated filer,” “smaller reporting company,” and “emerging growth company” in Rule 12b-2 of the Exchange Act.
|
Large accelerated filer
|
o
|
|
Smaller reporting company
|
ý
|
|
Accelerated filer
|
o
|
|
Emerging growth company
|
o
|
|
Non-accelerated filer
|
ý
|
|||
If an emerging growth company, indicate by check mark if the registrant has elected not to use the extended transition period for complying with any new or revised financial accounting standards provided pursuant to Section 13(a) of the Exchange Act.
o
Indicate by check mark whether the registrant is a shell company (as defined in Rule 12b-2 of the Exchange Act). Yes
o
No
ý
Indicate by check mark whether the registrant has filed all documents and reports required to be filed by Section 12, 13 or 15(d) of the Securities Exchange Act of 1934 subsequent to the distribution of securities under a plan confirmed by a court. Yes
ý
No
o
The aggregate market value of Common Stock held by non-affiliates computed by reference to the price at which the Common Stock was last sold as reported on the New York Stock Exchange as of June 30, 2018, was $17.8 million. As of March 1, 2019, there were 8,031,307 shares of the registrant’s Class A Common Stock and 1,406,082 shares of the registrant’s Class B Common Stock, par value $0.10 per share, outstanding.
DOCUMENTS INCORPORATED BY REFERENCE
Portions of the definitive proxy statement for the 2019 annual meeting of shareholders to be filed subsequent to the date hereof are incorporated by reference into Part III of this Annual Report on Form 10-K.
TABLE OF CONTENTS
|
|
|
Page
|
|
|
PART I
|
|
|
|
||
|
|
PART II
|
|
|
|
PART III
|
|
|
PART IV
|
||
FORWARD-LOOKING STATEMENTS
This Annual Report on Form 10-K, including
Management’s Discussion and Analysis of Financial Condition and Results of Operations
in Part II, Item 7, contains “forward-looking statements” within the meaning of Section 21E of the Securities Exchange Act of 1934 - that is, statements related to future events. In this context, forward-looking statements may address our expected future business and financial performance, and often contain words such as “expects”, “anticipates”, “intends”, “plans”, “believes”, “will”, “should”, “could”, “would” or “may” and other words of similar meaning. Forward-looking statements by their nature address matters that are, to different degrees, uncertain. For Centrus Energy Corp., particular risks and uncertainties that could cause our actual future results to differ materially from those expressed in our forward-looking statements include: risks related to our significant long-term liabilities, including material unfunded defined benefit pension plan obligations and postretirement health and life benefit obligations; risks relating to our outstanding 8.0% paid-in-kind (“PIK”) toggle notes (the “8% PIK Toggle Notes”) maturing in September 2019, our 8.25% notes (the “8.25% Notes”) maturing in February 2027 and our Series B Senior Preferred Stock, including the potential termination of the guarantee by our principal subsidiary United States Enrichment Corporation (“Enrichment Corp.”) of the 8% PIK Toggle Notes; risks related to the use of our net operating loss (“NOLs”) carryforwards and net unrealized built-in losses (“NUBILs”) to offset future taxable income and the use of the Rights
2
Agreement (as defined herein) to prevent an “ownership change” as defined in Section 382 of the Internal Revenue Code of 1986, as amended (the “Code”) and our ability to generate taxable income to utilize all or a portion of the NOLs and NUBILs prior to the expiration thereof; risks related to the limited trading markets in our securities; risks related to our ability to maintain the listing of our Class A Common Stock on the NYSE American LLC (the “NYSE American”); risks related to decisions made by our Class B stockholders regarding their investment in the Company based upon factors that are unrelated to the Company’s performance; risks related to the Company’s capital concentration; the continued impact of the March 2011 earthquake and tsunami in Japan on the nuclear industry and on our business, results of operations and prospects; the impact and potential extended duration of the current supply/demand imbalance in the market for low-enriched uranium (“LEU”); our dependence on others for deliveries of LEU including deliveries from the Russian government entity Joint Stock Company “TENEX” (“TENEX”) under a commercial supply agreement with TENEX and deliveries under a long-term supply agreement with Orano Cycle (“Orano”); risks related to our ability to sell the LEU we procure pursuant to our purchase obligations under our supply agreements; risks relating to our sales order book, including uncertainty concerning customer actions under current contracts and in future contracting due to market conditions and lack of current production capability; risks related to financial difficulties experienced by customers, including possible bankruptcies, insolvencies or any other inability to pay for our products or services; pricing trends and demand in the uranium and enrichment markets and their impact on our profitability; movement and timing of customer orders; risks related to the value of our intangible assets related to the sales order book and customer relationships; risks associated with our reliance on third-party suppliers to provide essential services to us; risks related to existing or new trade barriers and contract terms that limit our ability to deliver LEU to customers; risks related to actions, including government reviews, that may be taken by the U.S. government, the Russian government or other governments that could affect our ability to perform or the ability of our sources of supply to perform under their contract obligations to us, including the imposition of sanctions, restrictions or other requirements; the impact of government regulation including by the U.S. Department of Energy (“DOE”) and the U.S. Nuclear Regulatory Commission; uncertainty regarding our ability to commercially deploy competitive enrichment technology; risks and uncertainties regarding funding for the American Centrifuge project and our ability to obtain and/or perform under our future agreements with UT-Battelle, LLC (“UT-Battelle”), the management and operating contractor for Oak Ridge National Laboratory (“ORNL”), for continued research and development of the American Centrifuge technology; uncertainties regarding uses for the Piketon, Ohio facility that we lease from the DOE; the potential for further demobilization or termination of the American Centrifuge project; risks related to the current demobilization of portions of the American Centrifuge project, including risks that the schedule could be delayed and costs could be higher than expected; risks related to our ability to perform and receive timely payment under agreements with the DOE, including risk and uncertainties related to the ongoing funding of the government and potential audits; the competitive bidding process associated with obtaining a federal contract; risks related to our ability to perform fixed-price contracts, including the risk that costs could be higher than expected; risks that we will be unable to obtain new business opportunities, achieve market acceptance of our services or that services provided by others will render our services obsolete or noncompetitive; risks that we will not be able to timely complete the work that we are obligated to perform; failures or security breaches of our information technology systems; potential strategic transactions, which could be difficult to implement, disrupt our business or change our business profile significantly; the outcome of legal proceedings and other contingencies (including lawsuits and government investigations or audits); the competitive environment for our products and services; changes in the nuclear energy industry; the impact of financial market conditions on our business, liquidity, prospects, pension assets and insurance facilities; risks related to the identification of a material weakness in our internal controls over financial reporting; the risks of revenue and operating results fluctuating significantly from quarter to quarter, and in some cases, year to year; and other risks and uncertainties discussed in this and our other filings with the Securities and Exchange Commission.
For a discussion of these risks and uncertainties and other factors that may affect our future results, please see Part I, Item 1A,
Risk Factors
, and the other sections of this Annual Report on Form 10-K. These factors may not constitute all factors that could cause actual results to differ from those discussed in any forward-looking statement. Accordingly, forward-looking statements should not be relied upon as a predictor of actual results. Readers are urged to carefully review and consider the various disclosures made in this report and in our other filings with the Securities and Exchange Commission that attempt to advise interested parties of the risks and factors that may affect our business. We do not undertake to update our forward-looking statements to reflect events or circumstances that may arise after the date of this Annual Report on Form 10-K, except as required by law.
3
PART I
Item 1.
Business
Overview
Centrus Energy Corp., a Delaware corporation (“Centrus” or the “Company”), is a trusted supplier of nuclear fuel and services for the nuclear power industry. References to “Centrus”, the “Company”, or “we” include Centrus Energy Corp. and its wholly owned subsidiaries as well as the predecessor to Centrus, unless the context otherwise indicates. We were incorporated in 1998 as part of the privatization of the United States Enrichment Corporation.
Centrus operates two business segments: low-enriched uranium (“LEU”), which supplies various components of nuclear fuel to utilities, and contract services, which provides advanced engineering, design, and manufacturing services to government and private sector customers.
Our LEU business involves the sale of low-enriched uranium, its components, and natural uranium to utilities operating commercial nuclear power plants. LEU is a critical component in the production of nuclear fuel for reactors that produce electricity. We supply LEU to both domestic and international utilities for use in nuclear reactors worldwide. We provide LEU from multiple sources including our inventory, medium- and long- term supply contracts and spot purchases. As a long-term supplier of LEU to our customers, our objective is to provide value through the reliability and diversity of our supply sources. Our long-term goal is to resume commercial enrichment production, and we are exploring approaches to that end.
Our contract services segment utilizes the unique technical expertise, operational experience and specialized facilities that we developed over nearly two decades as part of our uranium enrichment technology program. We are leveraging these capabilities to expand and diversify our business, offering new services to existing and new customers in complementary markets.
With the specialized capabilities and workforce at our Technology and Manufacturing Center in Oak Ridge, Tennessee, we are performing technical, engineering and manufacturing services for a range of commercial and government customers and actively working to secure new customers. Our experience developing, licensing and manufacturing advanced nuclear fuels and technologies positions us to provide critical design, engineering, manufacturing and other services to a broad range of potential clients, including those involving sensitive or classified technologies. This work includes design, engineering, manufacturing and licensing services support for advanced reactor and fuel fabrication projects. Based on our experience at our uranium enrichment facilities, we are also performing decontamination and decommissioning (“D&D”) work for the U.S. government in Oak Ridge, Tennessee.
With our several decades of experience in enrichment, we also continue to be a leader in the development of an advanced U.S. uranium enrichment technology, which we believe could play a critical role in supplying fuel for advanced reactors, meeting U.S. national and energy security needs, and achieving our nation’s nonproliferation objectives. To support U.S. energy and national security, we have been performing research and demonstration work on our advanced gas centrifuge uranium enrichment technology through contracts with UT-Battelle, LLC (“UT-Battelle”), the management and operating contractor of Oak Ridge National Laboratory (“ORNL”) for the United States Department of Energy (“DOE”).
The nuclear industry in general, and the nuclear fuel industry in particular, is in a period of significant change, which continues to affect the competitive landscape. In the seven years following the 2011 Fukushima accident, the published market prices for uranium enrichment declined more than 75 percent. While the monthly price indicators have gradually increased starting in September 2018, the uranium enrichment segment of the nuclear fuel market remains oversupplied and faces uncertainty about future demand for nuclear power generation. Changes in the competitive landscape affect pricing trends, change customer spending patterns, and create uncertainty. To address these changes, we have taken steps to adjust our cost structure and may seek further adjustments to our cost
4
structure and operations and to evaluate opportunities to grow our business organically or through acquisitions and other strategic transactions.
We are also actively considering, and expect to consider from time to time in the future, potential strategic transactions, which could involve, without limitation, acquisitions and/or dispositions of businesses or assets, joint ventures or investments in businesses, products or technologies. In connection with any such transaction, we may seek additional debt or equity financing, contribute or dispose of assets, assume additional indebtedness, or partner with other parties to consummate a transaction.
Our Business Today
In 2018, our management team led the Company’s successful efforts to add new sales and customers to the LEU order book, to diversify our supply at reduced cost, to expand into new areas of the nuclear power and complementary industries, and to reduce our future selling, general and administrative (“SG&A”) costs. We have worked to diversify our supply and revenue streams and position ourselves for long-term financial strength as we seek to remain a trusted partner to the global nuclear industry and return value to our shareholders. Our competitive strengths include:
|
•
|
Positioned for the long term:
We have long-term nuclear fuel sales and supply contracts in place that extend to 2030; these contracts will provide a stream of revenue for many years and provide a foundation for growth. Because we do not have the large capital and overhead costs of a commercial production facility, we are positioned to continue to obtain supply of LEU from an oversupplied market experiencing prices near their historic lows, which we believe will strengthen our position for the future.
|
|
•
|
Diverse supply portfolio:
In 2018, we entered into new agreements with suppliers of enriched uranium, diversifying and expanding our sources of supply and improving our logistics for delivery of enriched uranium. In addition, we have acquired access to additional enriched uranium supply from the excess inventories of utility operators of nuclear power plants and from other primary and secondary sources of enriched uranium supply. Our strategy is to remain a highly diversified and reliable supplier of LEU with the flexibility to meet the evolving needs of our customers and effectively compete in the marketplace.
|
|
•
|
Engineering, design, and manufacturing capabilities:
Our expertise and world-leading technical, engineering and manufacturing capabilities in Oak Ridge, Tennessee are creating new opportunities. First, we are leveraging our domestic enrichment experience and engineering know-how to assist private sector customers in production of fuel for next-generation nuclear reactors and the development of related facilities. Second, we are leveraging our significant experience in advanced manufacturing to support contract design, prototyping, and precision manufacturing work for commercial and government clients.
|
|
•
|
Enrichment technology development:
We have continued to advance our U.S. centrifuge technology in specialized facilities in Oak Ridge so that it could be deployed if and when needed for national security, advanced reactor fuel, or other government purposes, and/or deployed at a commercial scale enrichment facility over the long term once market conditions will support new capacity.
|
We believe that our position as a leading provider of enriched uranium and our long-standing global relationships will enable us to increase our future market share in the nuclear fuel market and support our growth into complementary areas of the nuclear and other industries. We are well-positioned to capitalize on our heritage, industry-wide relationships, and diversity of supply to provide reliable and competitive sources of nuclear fuel and services. Centrus continues to be valued by our customers as a source of diversity, stability, and competition in the enrichment market.
For a discussion of the potential risks and uncertainties facing our business, see Part I, Item 1A,
Risk Factors
.
5
Uranium and Enrichment
LEU consists of two components: separative work units (“SWU”) and uranium. Uranium is a naturally occurring element and is mined from deposits located in Kazakhstan, Canada, Australia, and several other countries including the United States. According to the World Nuclear Association (“WNA”), there are adequate measured resources of uranium to fuel nuclear power at current usage rates for about 90 years. In its natural state, uranium is principally comprised of two isotopes: uranium-235 (“U
235
”) and uranium-238 (“U
238
”). The concentration of U
235
in natural uranium is only 0.711% by weight. Most commercial nuclear power reactors require LEU fuel with a U
235
concentration greater than natural uranium and up to 5% by weight. Future reactor designs currently under development will likely require higher U
235
concentration levels of up to 20%. Uranium enrichment is the process by which the concentration of U
235
is increased to that level.
SWU is a standard unit of measurement that represents the effort required to transform a given amount of natural uranium into two components: enriched uranium having a higher percentage of U
235
and depleted uranium having a lower percentage of U
235
. The SWU contained in LEU is calculated using an industry standard formula based on the physics of enrichment. The amount of enrichment deemed to be contained in LEU under this formula is commonly referred to as its SWU component and the quantity of natural uranium deemed to be contained in LEU under this formula is referred to as its uranium or “feed” component.
While in some cases customers purchase both the SWU and uranium components of LEU from us, utility customers typically provide uranium to us as part of their enrichment contracts, and in exchange we deliver LEU to these customers and charge for the SWU component. Title to uranium provided by customers generally remains with the customer until delivery of LEU, at which time title to LEU is transferred to the customer, and we take title to the uranium.
The following outlines the steps for converting natural uranium into LEU fuel, commonly known as the nuclear fuel cycle:
Mining and Milling.
Natural, or unenriched, uranium is removed from the earth in the form of ore and then crushed and concentrated.
Conversion.
Uranium concentrates (“U
3
O
8
”) are combined with fluorine gas to produce uranium hexafluoride (“UF
6
”), a solid at room temperature and a gas when heated. UF
6
is shipped to an enrichment plant.
Enrichment.
UF
6
is enriched in a process that increases the concentration of the U
235
isotope in the UF
6
from its natural state of 0.711% up to 5%, or LEU, which is usable as a fuel for current light water commercial nuclear power reactors. Future commercial reactor designs may use uranium enriched up to 20% U
235
, or HALEU.
Fuel Fabrication.
LEU is then converted to uranium oxide and formed into small ceramic pellets by fabricators. The pellets are loaded into metal tubes that form fuel assemblies, which are shipped to nuclear power plants.
Nuclear Power Plant.
The fuel assemblies are loaded into nuclear reactors to create energy from a controlled chain reaction. Nuclear power plants generate approximately 20% of U.S. electricity and 11% of the world’s electricity.
Used Fuel Storage.
After the nuclear fuel has been in a reactor for several years, its efficiency is reduced and the assembly is removed from the reactor’s core. The used fuel is warm and radioactive and is kept in a deep pool of water for several years. Many utilities have elected to then move the used fuel into steel or concrete and steel casks for interim storage.
6
Products and Services
We operate the following two business segments: (1) Low-Enriched Uranium and (2) Contract Services.
Low-Enriched Uranium
Revenue from our LEU segment is derived primarily from:
|
•
|
sales of the SWU component of LEU,
|
|
•
|
sales of both the SWU and uranium components of LEU, and
|
|
•
|
sales of natural uranium.
|
Revenue for our LEU segment accounted for approximately 85% of our total revenue in 2018. Our customers are primarily domestic and international utilities that operate nuclear power plants. Our agreements with electric utilities are primarily long-term, fixed-commitment contracts under which our customers are obligated to purchase a specified quantity of the SWU component of LEU (or the SWU and uranium components of LEU) from us. Our agreements for natural uranium sales are generally shorter-term, fixed-commitment contracts.
Contract Services
Our Contract Services segment reflects our technical, manufacturing and engineering services offered to our public and private sector customers. Our public-sector work has primarily focused on the American Centrifuge engineering and testing activities we have performed as a contractor for UT-Battelle. In addition, we are now performing D&D work for DOE at its facilities in Oak Ridge, Tennessee.
With our private-sector customers, we seek to leverage our domestic enrichment experience, engineering know-how, and advanced manufacturing capabilities, to assist customers with a range of engineering, design, and precision manufacturing projects, including the production of fuel for next-generation nuclear reactors and the development of related facilities. Our contracts with private sector and government customers are usually time-and-material or fixed-priced based and require delivery of contracted services or manufactured materials specified by the customer.
SWU and Uranium Sales Order Book
The SWU component of LEU is typically bought and sold under long-term contracts with deliveries over several years.
The Company’s agreements for natural uranium sales are generally shorter-term, fixed-commitment contracts.
Our order book of sales under contract
in the LEU segment
(“order book”) extends to 2030. As of December 31, 2018, our order book was $1.0 billion compared to $1.3 billion at December 31, 2017
, reflecting completed deliveries and new contracts signed in 2018 and rejection of a contract by a customer in bankruptcy proceedings. As of December 31, 2017, we had estimated that approximately 14% of our order book was at risk due to factors including customer financial conditions.
We estimate that as of December 31, 2018, approximately 4% of our order book is at risk related to customer financial conditions or operations.
We anticipate our SWU and uranium revenue from the sales currently under contract in our order book will be in a range of $85 million to $120 million during 2019. Most of our contracts provide for fixed purchases of SWU during a given year. Our estimate of the aggregate dollar amount of future SWU and uranium sales is partially based on customers’ estimates of the timing and size of their fuel requirements and other assumptions that are subject to change. For example, depending on the terms of specific contracts, the customer may be able to increase or decrease the quantity delivered within an agreed range. Our order book estimate is also based on our estimates of selling prices, which are subject to change. For example, depending on the terms of specific contracts, prices may be adjusted based on escalation using a general inflation index, published SWU price indicators prevailing at the time of delivery, and other factors, all of which are variable. We use external composite forecasts of future market prices
7
and inflation rates in our pricing estimates.
Refer to Part I, Item 1A,
Risk Factors
, for a discussion of risks related to our order book.
Suppliers
We have a diverse base of supply that includes:
|
•
|
existing inventory of LEU,
|
|
•
|
mid- and long-term contracts with enrichment producers,
|
|
•
|
secondary suppliers including utility operators of nuclear power plants that have excess inventory, and
|
|
•
|
spot purchases of SWU and uranium.
|
We have and will seek to continue to further diversify this base of supply and take advantage of the opportunities to obtain additional short and long-term supplies of LEU at prices consistent with the current market.
Currently, our largest suppliers of SWU are the Russian government entity Joint Stock Company “TENEX” (“TENEX”) and the French government owned company Orano Cycle (formerly, AREVA NC) (“Orano”).
Under an agreement with TENEX (the “Russian Supply Agreement”), we purchase SWU contained in LEU received from TENEX, and we deliver natural uranium to TENEX for the LEU’s uranium component. The Russian Supply Agreement was originally signed with commitments through 2022 but was modified in 2015 to give us the right to reschedule certain quantities of SWU of the original commitments into the period 2023 and beyond, in return for the purchase of additional SWU in those years. If we exercise this right to reschedule in full during the remaining years of the contract’s original term, we will have a rescheduled post-2022 purchase commitment through 2028.
Under the Russian Supply Agreement, we pay for the SWU contained in the LEU delivered to us, and either supply natural uranium to TENEX for the uranium content of the LEU or, in limited cases, pay for such content. SWU pricing is determined by a formula that uses a combination of market-related price points and other factors. The LEU that we obtain from TENEX under the Russian Supply Agreement is currently subject to quotas and other restrictions that could adversely affect our ability to sell the purchased enrichment in the United States and other markets. The Russian Supply Agreement only gives us the right to use a portion of this quota, which is less than the amount of Russian LEU that we need to order to meet our SWU purchase obligations to TENEX. We can ask TENEX to make additional quota available to us, sell the SWU in foreign markets or secure a deferral to a future year of the portion of the purchase obligation under the Russian Supply Agreement for which we have insufficient quota. In the past we have been able to reach agreement with TENEX to either secure additional quota or defer our obligation, but TENEX’s willingness to enter into such agreements in the future is not known. Refer below to —
Competition and Foreign Trade - Limitations on Imports of LEU from Russia
.
We expect that a portion of the Russian LEU that we order during the term of the Russian Supply Agreement will need to be delivered to customers who will use it in foreign reactors. The Russian LEU that we deliver to foreign customers can be delivered either at fabrication facilities in the U.S. or in foreign countries. The amount of SWU we must purchase from TENEX under the Russian Supply Agreement exceeds our current sales order book and, therefore, we will need to make new sales for deliveries in 2023 and beyond to place all the Russian LEU we must order to meet our SWU purchase obligations to TENEX. In addition, due to quotas and other limitations, not all of our delivery obligations under our existing contracts can be met with Russian LEU.
In April 2018, we entered into an agreement (the “Orano Supply Agreement”) with Orano for the long-term supply of SWU contained in LEU, nominally commencing in 2023. Under the Orano Supply Agreement, we will purchase SWU contained in LEU received from Orano, and then deliver natural uranium to Orano for the natural uranium feed material component of LEU. We may elect to begin to accept deliveries as early as 2021 or to defer
8
the commencement of purchases until 2024 and have the option to extend the six-year purchase period for an additional two years. The Orano Supply Agreement provides significant flexibility to adjust purchase volumes, subject to annual minimums and maximums in fixed amounts that vary year by year. The pricing for the SWU purchased by us is determined by a formula that uses a combination of market-related price points and other factors, and is subject to certain floors and ceilings. Prices are payable in a combination of U.S. dollars and euros.
We procure LEU from other sources under short-term and long-term contracts and have inventories available that diversify our supply portfolio and provide flexibility to meet the needs of our customers.
Market prices for SWU fell substantially in the aftermath of the nuclear incident at Fukushima, Japan in 2011. Recent purchases of SWU and our long-term contract with Orano reflect this decline in market prices. We signed our large, long-term supply agreement with TENEX in 2011. Prices under the Russian Supply Agreement also have been adjusted to reflect lower market prices based on a one-time market related price reset that was agreed when we signed the contract in 2011. The reset occurred in 2018 for purchases we make in 2019 and beyond, decreasing the unit costs per SWU for the duration of the contract.
The cost of sales per SWU reported in our financial statements are calculated by applying the average cost method to our entire inventory, including higher priced purchases we made in earlier years. Consequently, we expect our future costs of goods sold per SWU to significantly decrease over time beginning in 2019, as product is sold and revenue and costs are recognized. Given the unpredictability of the market and other factors, including pending U.S. government trade proceedings, there can be no assurance that the expected improvement will be realized near term.
Advanced Technology, Manufacturing, and Engineering Capability
We have a long record as a global leader in advanced technology, manufacturing and engineering. Our manufacturing, engineering and testing facilities and our highly-trained workforce are deeply engaged in developing advanced nuclear fuel solutions, providing engineering and precision manufacturing services, and advancing the next generation of uranium enrichment technology.
We are exploring a number of options for returning to domestic production in the future.
The economics for commercial deployment of new enrichment capacity are severely challenged by the current supply/demand imbalance in the market for LEU and related downward pressure on market prices for SWU, which reached a historic low in August 2018. Market conditions, however, improved at the end of 2018 and are expected to improve further in the long term.
In February 2016, we completed a successful three-year demonstration of our American Centrifuge technology, with 120 advanced uranium enrichment gas centrifuge machines linked together in a cascade to simulate industrial operating conditions. Since September 2015, our government contracts with UT-Battelle have provided for continued engineering and testing work on the American Centrifuge technology at our facilities in Oak Ridge, Tennessee. On October 26, 2017, we entered into a contract with UT-Battelle for the period from October 1, 2017, through September 30, 2018. The contract provided for fixed payments upon completion of defined milestones and generated total revenue of $16.0 million. Funding for the program was provided to UT-Battelle by the federal government. Although the most recent contract expired September 30, 2018, we continue to perform work towards the expected milestones as the parties work toward a successor agreement; however, we have no assurance that a successor agreement will be executed.
On January 7, 2019, DOE issued a Notice of Intent to contract with Centrus to deploy a cascade of centrifuges to demonstrate the ability to produce HALEU, suitable for a range of military and civilian applications. While existing reactors currently in operation typically operate on LEU enriched so that the uranium-235 isotope concentration is just below 5%, HALEU has a uranium-235 concentration of up to 20%. HALEU is not commercially available today, but may be required in the future for a number of advanced reactor designs currently under development, for DOE nonproliferation efforts, or for some advanced fuel designs that may be suitable in the future for existing
9
reactors. There are no guarantees about whether or when government or commercial demand for HALEU will materialize, and there are a number of technical, regulatory and economic hurdles that must be overcome for these fuels and reactors to come to the market. Additionally, while Centrus has begun contract discussions with DOE about the proposed demonstration project, there is no assurance that a contract will be executed or that the project will go forward.
On March 26, 2018, we entered into a services agreement with X Energy, LLC (“X-energy”) to provide X-energy with (i) technical and resource support for criticality safety evaluation of processing equipment, design of fresh fuel transport packages, and conceptual mock-up of a nuclear fuel production facility and (ii) non-cash in-kind contributions subject to a cooperative agreement between X-energy and the United States government. The services were performed pursuant to separate task orders issued under the agreement. The initial task orders ran through December 31, 2018, and provided for time-and-materials based pricing with payments to be made to us totaling approximately $4.4 million. In addition, we contributed non-cash in-kind contributions with a value of approximately $2.5 million.
On November 29, 2018, we entered into a second services agreement with X-energy to provide X-energy with (i) technical and resource support to the design and license application development of its nuclear fuel production facility and (ii) non-cash in-kind contributions subject to a cooperative agreement between X-energy and the United States government. The services will be performed pursuant to separate task orders issued under the agreement. The initial task orders run through September 30, 2019 with deliverables to be completed through November 30, 2019, and provide for time-and-materials based pricing with payments to be made to us totaling approximately $4.2 million. In addition, we agreed to provide non-cash in-kind contributions with a value of approximately $2.4 million.
Competition and Foreign Trade
It is estimated that the enrichment industry market is currently about 50 million SWU per year. Our global market share is approximately 3%. Global LEU suppliers in our highly competitive industry compete primarily on the basis of price and secondarily on reliability of supply and customer service. The four largest LEU suppliers comprise an estimated 96% of market share combined:
|
•
|
Rosatom, a Russian government entity, which sells LEU through its wholly owned subsidiary TENEX;
|
|
•
|
Urenco, a consortium of companies owned or controlled by the British and Dutch governments and two German utilities;
|
|
•
|
Orano, a company largely owned by the French government that was formerly part of the French government owned company, AREVA; and
|
|
•
|
China Nuclear Energy Industry Corporation (“CNEIC”), a company owned by the Chinese government.
|
The production capacity for Rosatom/TENEX is estimated by the World Nuclear Association (“WNA”) to be approximately 27 million SWU per year. Imports of LEU and other uranium products produced in the Russian Federation are subject to restrictions as described below under —
Limitations on Imports of LEU from Russia
.
Urenco reported installed capacity at its European and U.S. enrichment facilities of 18.6 million SWU per year at the end of 2018.
Orano’s gas centrifuge enrichment plant in France began commercial operations in 2011 and the plant’s nominal capacity of 7.5 million SWU was reportedly in service at the end of 2016. Orano has reported that it has suspended planned capacity expansions beyond 7.5 million SWU.
CNEIC has emerged as a significant producer primarily focused on supplying domestic requirements in China, but it has begun to supply LEU to international markets in recent years. CNEIC’s commercial SWU production capacity is estimated to be approximately 8 million SWU per year in 2019.
10
All of our current competitors are owned or controlled, in whole or in part, by foreign governments. These competitors may make business decisions in both domestic and international markets that are influenced by political or economic policy considerations rather than exclusively by commercial considerations.
There are also producers of LEU in Japan and Brazil that primarily serve a portion of their respective domestic markets.
LEU may also be produced by down-blending government stockpiles of highly-enriched uranium. Governments control the timing and availability of highly-enriched uranium released for this purpose, and the release of this material to the market could impact market conditions. Given the current oversupplied nuclear fuel market, any additional LEU from down-blended highly-enriched uranium released into the market would have a negative effect on prices for LEU.
LEU we supply to foreign customers is exported under the terms of international agreements governing nuclear cooperation between the United States and the country of destination or other entities, such as the European Union or the International Atomic Energy Agency. The LEU supplied to us is subject to the terms of cooperation agreements between the country in which the material is produced and the country of destination or other entities.
Limitations on Imports of LEU from Russia
Imports into the United States of LEU and other uranium products produced in the Russian Federation, including LEU imported under the Russian Supply Agreement, are subject to quotas imposed under legislation enacted into law in September 2008 and under the 1992 Russian Suspension Agreement, as amended in 2008. These quotas limit the amount of Russian LEU that can be imported into the United States for U.S. consumption. At present, the quotas apply through 2020 and, for 2016-2020, are set at an amount equal to approximately 20% of projected annual U.S. consumption of LEU, based on a market report published in 2015 by the WNA.
As an exception to the quotas on imports of LEU for U.S. consumption, both the Russian Suspension Agreement and the September 2008 legislation permit unlimited imports of Russian LEU for use in initial cores for any new U.S. nuclear reactor.
It is possible that the quotas on imports of Russian LEU could change. Both the Russian Suspension Agreement and the September 2008 legislation require the U.S. Department of Commerce (“DOC”) to adjust the quotas in 2016 and 2019 based on changes in projected reactor demand as forecast by the WNA. In 2016, the DOC preliminarily determined that the adjustment would increase the quotas, but this increase was challenged by U.S. uranium mining companies, and, in May 2017, the DOC finally determined to increase the quota in 2018 and to reduce it in 2019 and 2020. However, because contracts approved by the DOC prior to the change in the quotas are not affected by the quota adjustment, this change in the quotas in 2019 and 2020 are not expected to materially affect imports of Russian LEU in those years pursuant to such contracts.
Additionally, as more fully explained below, the quotas on imports of Russian LEU could be extended beyond December 31, 2020, which is the current expiration date of quotas under both the Russian Suspension Agreement and the September 2008 legislation, if, for example, the Russian and U.S. governments were to agree on such an extension. On February 22, 2019, the DOC sent a letter to Rosatom formally opening consultations with Rosatom and TENEX with respect to a possible extension of the Russian Suspension Agreement. We cannot predict the outcome of these negotiations but they could result in an agreement on new quotas for the period after 2020.
11
Aside from the quotas on imports of Russian LEU that will be consumed in the United States, there is a separate quota that applies to deliveries of Russian LEU to foreign customers at U.S. fabrication facilities. This quota generally requires that the LEU be processed and re-exported within a certain period of time although, in 2014, the DOC approved our proposal that Japanese customers with which we have existing contracts be allowed to physically store certain amounts of Russian LEU in the United States pending the restart of nuclear reactors in Japan.
In October 2017, Louisiana Energy Services (“LES”), a U.S. subsidiary of Urenco, a foreign competitor, requested that the DOC conduct an administrative review of the Russian Suspension Agreement for the period October 2016 through September 2017. By statute, the purpose of an administrative review is to review the current status of, and compliance with the Russian Suspension Agreement during the period of the review. We are not aware of any violation of the Russian Suspension Agreement and in November 2018, the DOC preliminarily determined that there was no evidence of such a violation. However, in filings with the DOC, LES has requested the agency undertake a much broader review of whether the Russian Suspension Agreement continues to prevent the suppression or undercutting of price levels of domestic uranium products. In its November 2018 determination, the DOC stated that it would need additional time to collect all the evidence required to determine whether the Russian Suspension Agreement continues to prevent price suppression or undercutting. The date for the final determination is June 24, 2019.
At the conclusion of its review, the DOC could leave the Russian Suspension Agreement in place, reach an agreement with the Russian Federation that would modify the Russian Suspension Agreement, impose additional or different restrictions on imports of Russian uranium products, including LEU, beyond 2020 or terminate the Russian Suspension Agreement and restart the suspended antidumping investigation.
Imposition of additional restrictions or the restart of the investigation accompanied by an imposition of duties could adversely affect our financial condition and operations and could make it economically difficult or impossible for us to continue to import Russia LEU or sell the amounts required to be purchased under the Russian Supply Agreement. In that case, we would need to find alternative supplies of LEU to meet our obligations to U.S. customers, and also find alternative markets outside the United States in which to sell the Russian SWU that we are obligated to purchase from TENEX but which we could not import or sell in the United States. Alternatively, if, instead of restarting the investigation, the DOC agrees with the Russian government to modify the Russian Suspension Agreement and extend or impose new restrictions on imports of Russian LEU, our ability to continue to deliver Russian LEU to customers would depend upon whether we could secure an exception under those new restrictions or a share of any quota granted to TENEX.
We are actively participating in the administrative review and seeking to ensure that the Russian Suspension Agreement is implemented in a manner that does not adversely impact our existing contracts, including the Russian Supply Agreement, or our ability to continue to offer a diverse supply to our customers in the United States. The administrative review is expected to conclude in mid-2019.
In October 2018, LES requested DOC to also conduct an administrative review of the Russian Suspension Agreement for the period October 2017 through September 2018. This review will be in addition to the current review. In October 2019 and 2020, LES and other domestic parties will have additional opportunities to request that the DOC conduct administrative reviews.
Absent an agreement between the DOC and the Russian government to extend the Russian Suspension Agreement, the Russian Suspension Agreement (and the antidumping order that it suspended) will expire at the end of 2020. The quotas under the September 2008 legislation also are scheduled to expire at the end of 2020. As noted above, on February 22, 2019, the DOC sent a letter to Rosatom formally opening consultations with Rosatom and TENEX with respect to a possible extension of the Russian Suspension Agreement. We cannot predict the outcome of these negotiations but they could result in an agreement on new quotas for the period after 2020.
12
Limitations on Imports of LEU from France
The DOC imposed an antidumping order on imports of French LEU in 2002, that was subject to periodic review to determine if the order should be maintained in effect. In connection with its most recent view of the order, the DOC did not receive any notices that domestic parties intended to participate in the review. Consequently, the order was revoked in the March 2019.
Other Trade Actions
On January 16, 2018, two U.S. mining companies submitted a request to the DOC to investigate the impact of uranium imports on national security under Section 232 of the Trade Expansion Act of 1962. In the petition, these companies proposed, as a remedy, that the President (1) impose quotas on imports that will ensure that 25% of the U.S. market is reserved to newly-produced U.S. uranium and (2) adopt a “Buy American” preference for purchases of all forms of uranium by U.S. agencies, including U.S. government corporations, such as the Tennessee Valley Authority. By statute, the investigation should have been completed within 270 days after the investigation is initiated, with up to an additional 90 days granted for Presidential action after the investigation results are reported to the President.
Along with a number of other U.S. and foreign companies that potentially could be affected by the proposed remedy, we have participated vigorously in this Section 232 proceeding. In January 2019, the DOC issued a detailed questionnaire to a number of companies, including Centrus, to obtain information about their sales, imports, production and other matters, for the purposes of preparing a report to the President, including recommendations regarding possible actions to take. The DOC is expected to conclude its investigation in April 2019.
The outcome of a national security investigation of uranium imports is unknown. Even if the DOC found that imports threatened national security, the President would not be obligated to grant the remedies requested by the mining companies but could choose to grant other remedies or to impose no remedies at all. Nonetheless, if the remedies requested by the mining companies were granted, the remedies could create additional barriers to imports or sales of non-U.S. uranium, including our imports and sales of enriched uranium and its components.
DOE Facilities
We produced LEU through May 2013 at the Paducah Gaseous Diffusion Plant (“Paducah GDP”) in Paducah, Kentucky which we had leased from DOE. We then repackaged and transferred our existing inventory to offsite licensed locations under agreements with the operators of those facilities. Our prior enrichment operations generated hazardous, low-level radioactive and mixed wastes. The storage, treatment, and disposal of wastes are regulated by federal and state laws. The treatment and disposal of wastes from our prior operations at the Paducah GDP were completed in 2016. Regarding our past operations at the former Portsmouth Gaseous Diffusion Plant (“Portsmouth GDP”) in Piketon, Ohio, DOE agreed in 2011 to accept ownership of all nuclear material at the site, some of which required processing for waste disposal. We agreed to pay DOE for costs for disposing of our share of such wastes. The treatment and disposal of wastes from our prior operations at the Portsmouth GDP were completed in 2017.
The Portsmouth and Paducah gaseous diffusion plants were operated by agencies of the U.S. government for approximately 40 years prior to our privatization in 1998. As a result of such operation, there are contamination and other potential environmental liabilities associated with the plants. The USEC Privatization Act and our former leases for the plants provide that DOE remains responsible for the D&D of the gaseous diffusion plants.
We continue to lease the portion of the DOE facility in Piketon, Ohio, that was formerly used to demonstrate the American Centrifuge technology. We commenced with D&D of the demonstration cascade in the Piketon facility in accordance with U.S. Nuclear Regulatory Commission (“NRC”) requirements in 2016. We believe the D&D work required under NRC license requirements has been completed. At the conclusion of the Piketon facility lease on June 30, 2019, absent mutual agreement between the Company and DOE regarding other possible uses for the facility, we are obligated to return the facility to DOE in a condition that meets NRC requirements and in the same
13
condition as the facility was in when it was leased to us (other than due to normal wear and tear). By the conclusion of the lease term, we must remove all Company-owned capital improvements, unless otherwise consented to by DOE, by the conclusion of the lease term.
As discussed above, on January 7, 2019, DOE issued a Notice of Intent to contract with Centrus to deploy a cascade of centrifuges to demonstrate the ability to produce HALEU suitable for a range of military and civilian applications including fueling advanced reactors currently under development. The cascade of centrifuge machines would be deployed at the Piketon facility whereby we would maintain our lease and NRC license for at least the term of the associated contract.
On September 27, 2018, we entered into an agreement with DOE to D&D the K-1600 facility of DOE located at the East Tennessee Technology Park. Under the terms of the agreement, pursuant to a work authorization under our lease with DOE, we will remove and dispose of government owned materials and equipment in order to render the facility non-contaminated and unclassified. The work to be performed is expected to be completed by September 30, 2019. The contract is a cost-plus fixed fee contract totaling approximately $15 million. The contract is incrementally funded and subject to appropriations by the federal government.
Employees
A summary of our employees by location follows:
|
No. of Employees
at December 31,
|
||||||
|
Location
|
2018
|
2017
|
||||
|
Oak Ridge, TN
|
105
|
|
106
|
|
||
|
Piketon, OH
|
65
|
|
123
|
|
||
|
Bethesda, MD
|
51
|
|
53
|
|
||
|
Other
|
5
|
|
8
|
|
||
|
Total Employees
|
226
|
|
290
|
|
||
On March 16, 2017, members of the United Steelworkers (“USW”) Local 689 ratified a new collective bargaining agreement for the 20 employees represented by the USW at the advanced technology facility in Piketon. The contract term is through January 19, 2020.
For details concerning ongoing workforce reductions in connection with the conclusion of the federally funded advanced technology demonstration effort in Piketon, Ohio, refer to Part II, Item 7,
Management’s Discussion and Analysis of Financial Condition and Results of Operations
.
14
Available Information
Our website is www.centrusenergy.com. We make available on our website, or upon request, without charge, access to our Annual Report on Form 10-K, quarterly reports on Form 10-Q, current reports on Form 8-K, and amendments to those reports filed with, or furnished to, the Securities and Exchange Commission, pursuant to Section 13(a) or 15(d) of the Securities Exchange Act of 1934, as amended (the “Exchange Act”), as soon as reasonably practicable after such reports are electronically filed with, or furnished to, the Securities and Exchange Commission.
Our code of business conduct provides a brief summary of the standards of conduct that are at the foundation of our business operations. The code of business conduct states that we conduct our business in strict compliance with all applicable laws. Each employee must read the code of business conduct and sign a form stating that he or she has read, understands and agrees to comply with the code of business conduct. A copy of the code of business conduct is available on our website or upon request without charge. We will disclose on the website any amendments to, or waivers from, the code of business conduct that are required to be publicly disclosed.
We also make available on our website or upon request, free of charge, our Board of Directors Governance Guidelines and our Board committee charters.
15
Item 1A. Risk Factors
The following discussion sets forth the material risk factors that could affect our financial condition and operations. Readers should not consider any descriptions of such factors to be a complete set of all potential risks that could affect us. Below, we describe certain important operational, financial, strategic and legal and compliance risks.
Operational Risks
Operational risks relate to risks arising from systems, processes, people and external events that affect the operation of our business, including supply chain and business disruption and data protection and security, including cyber security.
We are dependent on existing inventory and other sources to meet our obligations to customers.
We are currently dependent on existing inventory, purchases from TENEX and Orano and other sources to meet our obligations to customers. We are acquiring alternative sources of supply in the market, given the current oversupply. The availability, cost and terms of additional alternative sources of supply are subject to variables that are difficult to predict. A significant delay in, or stoppage or termination of, deliveries of material under those supply agreements could adversely affect our ability to make deliveries to customers and would adversely affect revenues and results of operations. A delay, stoppage or termination could occur due to a number of factors, including logistical problems with shipments, commercial or political disputes between the parties or their governments, imposition of sanctions, quotas, duties or other restrictions or a failure or inability by either party to meet the terms of such agreements. An interruption of deliveries could adversely impact our business, results of operations, and prospects.
We may be unable to sell all of the LEU purchased under supply agreements for prices that cover our purchase costs, which could adversely affect profitability and the viability of our business.
We may not achieve the anticipated benefits from supply agreements we enter into. For example, the price we are charged for the SWU component of Russian LEU under the Russian Supply Agreement is determined by a formula that uses a combination of market-related price points and other factors, which may result in prices that are not aligned with the prevailing market prices when those market prices are depressed, or declining, as is currently the case. Pursuant to an existing provision of the Russian Supply Agreement, the pricing formula in the contract was adjusted in 2018 to account for the significant decreases in market prices since 2011. The adjusted pricing formula will apply to SWU purchased by Centrus for delivery in 2019 and beyond. We expect the adjusted pricing formula will lead to a reduction in the price we would pay in future years, but there can be no assurance that an unexpected change in market prices will not occur that could lead to a different result. Other existing or new supply agreements may have pricing mechanisms that may not be aligned with market prices. The pricing mechanisms of our supply agreements may not align with pricing provided in our new or existing sales contracts and could result in sales prices that do not cover our purchase costs and may limit our ability to make new sales at prices that exceed the purchase price we pay for the LEU.
Restrictions on imports or sales of LEU or SWU that we buy could adversely affect profitability and the viability of our business.
Our ability to place LEU we purchase into existing and future contracts with customers is subject to U.S. import limitations and, in some cases, the contracts’ terms. Further, in the case of Russian LEU, sales of Russian LEU or SWU are more challenging than sales of non-Russian material. Some of our customers are unable or unwilling to accept Russian LEU. In addition, we may not achieve the anticipated benefits from the Russian Supply Agreement or other agreements to purchase LEU or SWU because of restrictions on U.S. imports of LEU and other uranium products from the country from which the LEU or SWU is sourced. For example, imports of LEU under the Russian Supply Agreement are subject to quotas imposed under legislation enacted into law in September 2008 and under the 1992 Russian Suspension Agreement, as amended in 2008. We are also dependent upon TENEX to grant us the
16
right to use a portion of these quotas under the terms of the Russian Supply Agreement in order to import Russian LEU for sale in the United States. Further, the U.S. quotas on imports of Russian LEU are subject to periodic review by the DOC, which may result in a decrease in availability of quotas to us, and even an extension of quotas to years in which they do not currently apply.
It also is possible that, in lieu of quotas, duties or other restrictions could be applied to imports of LEU or other uranium products. In addition to, or in lieu of, the quotas imposed in 2008 on Russian LEU, quotas, duties and other restrictions could be applied to foreign LEU and other forms of foreign uranium through legislation or at the discretion of the President (for example, as a result of an investigation of uranium now being concluded under Section 232 of the Trade Expansion Act of 1962 that could result in new trade restrictions as early as June 2019). All such quotas, duties and restrictions could affect Centrus’ sales of non-U.S. natural uranium or LEU containing non-U.S. uranium, which could adversely affect Centrus’ revenues and financial results. For example, it is possible that pursuant to pending negotiations between agencies of the Russian and U.S. governments, the agreement under which quotas are now imposed could be extended beyond their anticipated expiration at the end of 2020.
The LEU that we are committed to purchase and cannot sell for consumption in the United States will have to be sold for consumption by utilities outside the United States. Our ability to sell to those utilities may be limited by policies of foreign governments or regional institutions that seek to restrict the origin of LEU purchased by utilities under their jurisdiction. In addition, foreign utilities who take delivery of imported LEU from us in the United States may be unwilling to cooperate with us in meeting requirements under U.S. law that provide that the imported material be re-exported within a fixed period of time. Further, geopolitical events, including domestic or international reactions or responses to such events, as well as concerns about U.S. national security or other issues, could lead to U.S. or foreign government or international actions, including the imposition of sanctions, that could disrupt our ability to purchase, sell or make deliveries to customers of LEU or other uranium products from Russia or other countries. Such an interruption could threaten our ability to fulfill our purchase commitments to our suppliers and our delivery commitments to customers, with adverse effects on our reputation, costs, results of operations, cash flows and long-term viability. Even in the absence of sanctions or other legal restrictions, customers may be unwilling to agree to purchase or amend contracts to permit delivery of foreign LEU. Accordingly, there is no assurance that we will be successful in our efforts to sell or deliver, in or outside of the United States, the LEU we are obligated to purchase under the Russian Supply Agreement, the Orano Supply Agreement and other supply agreements. These restrictions could adversely impact our business and our profitability.
We face risks associated with reliance on third-party suppliers to meet customer commitments.
We rely on third-party suppliers to provide essential services to the Company, such as the storage and management of inventory, transportation and radiation protection. We face the risk that those service providers may not perform on time, with the desired quality or at all for a variety of reasons, many of which are outside our control. Alternative third-party suppliers may not be readily available or may be more costly. As a result of such risks, we may be unable to meet our customer commitments, our costs could be higher than planned, and/or our relationship with customers could be negatively affected, all of which could adversely affect our business, results of operations, and prospects. Customers place great value in the reliability of their supply of fuel for their reactors. Failure to make a delivery could have an adverse effect on our ability to make new sales and could have an adverse effect on our business, results of operations, and prospects.
Periodically, events or issues arise that may affect the performance of our suppliers. There can be no assurance that the steps we may take to address these events or issues will be successful in minimizing potential impacts to the Company and our customers. Unless adequately addressed, such events or issues could adversely affect our business, results of operations, and prospects.
17
Dependence on our largest customers could adversely affect us.
In 2018, our ten largest nuclear fuel customers represented approximately 85% of total revenue and our three largest customers represented approximately 52% of total revenue. Further, individual orders average roughly $10 million. A reduction in purchases from our customers, whether due to their decision not to purchase optional quantities or for other reasons, including a disruption or change in their operations or financial condition that reduces purchases of LEU from us, could adversely affect our business, results of operations, and prospects.
We have seen increased price competition when competitors and secondary suppliers lowered their prices to sell excess supply created by prevailing market conditions. This has adversely affected our sales efforts. Because price is a significant factor in a customer’s choice of a LEU supplier, when contracts come up for renewal, customers may reduce their purchases from us if we are not able to compete on price, resulting in the loss of new sales contracts. Once lost, customers may be difficult to regain because they typically purchase LEU under long-term contracts. Therefore, given the need to maintain existing customer relationships, our ability to raise prices to respond to increases in costs or other developments may be limited. In addition, because we have a commitment to acquire LEU from third parties, any reduction in purchases by the customers below the level required for us to resell the material we are obligated to buy could adversely affect our business, results of operations, and prospects.
The dollar amount of the sales order book, as stated at any given time, is not necessarily indicative of future sales revenues and is subject to uncertainty.
Our order book of sales is the estimated aggregate dollar amount of SWU and uranium sales that we expect to recognize as revenue in future periods under existing contracts with customers. There is no assurance that the revenues projected will be realized, or, if realized, will result in profits. Most of our contracts provide for fixed purchases of SWU during a given year. Our estimate of the order book is partially based on customers’ estimates of the timing and size of their fuel requirements and other assumptions that may prove to be inaccurate. The order book is also based on estimates of selling prices, which are subject to change. For example, depending on the terms of specific contracts, prices may be adjusted based on escalation using a general inflation index, published SWU or uranium market price indicators prevailing at the time of delivery, and other factors, all of which are unpredictable, particularly in light of general uncertainty in the nuclear market. We use external composite forecasts of future market prices and inflation rates in our pricing estimates. These forecasts may not be accurate, and therefore estimates of future prices could be overstated. Any inaccuracy in estimates of future prices would add to the imprecision of the order book estimate.
For a variety of reasons, the amounts of SWU and uranium that we will sell in the future under existing contracts, and the timing of customer purchases under those contracts, may differ from estimates. Customers may not purchase as much as we predict, nor at the times we anticipate, as a result of operational or financial difficulties, changes in fuel requirements, reactor shutdowns, or other reasons. Reduced purchases would reduce the revenues we actually receive from contracts included in the order book. Customers could also seek to modify or cancel orders in response to concerns regarding our financial strength or future business prospects. Further, financial and operational issues, including possibility for bankruptcies, facing our customers could affect the order book.
The order book includes sales prices that are significantly above current market prices. Customers may seek to limit their obligations under these existing contracts or may be unwilling to continue contracts. Further, some of our customers are facing financial difficulties and may seek modifications to their contracts or seek bankruptcy protection. In addition, we estimate that approximately 4% of our order book as of December 31, 2018, is at risk related to customer financial conditions or operations. From time to time, we have worked with customers to modify contracts that have delivery, scheduling, origin or other terms that may require modifications to address our anticipated supply sources. If we were to initiate such discussions in the future, we have no assurance that our customers would agree to revise existing contracts or would not seek to exercise contract termination rights or require concessions, which could adversely affect the value of our order book and our prospects.
18
Our contract services segment conducts business under various types of contracts, including fixed-price contracts, which subjects us to risks associated with cost over-runs.
The contract services segment conducts business under various types of contracts, including fixed-price contracts, where costs must be estimated in advance of our performance. These types of contracts are priced, in part, on cost and scheduling estimates that are based on assumptions including prices and availability of experienced labor, equipment and materials. If these estimates prove inaccurate, if there are errors or ambiguities as to contract specifications or if circumstances change due to, among other things, unanticipated technical problems, poor project execution, changes in the costs of equipment and materials or our suppliers’ or subcontractors’ inability to perform, then cost overruns may occur. We may not be able to obtain compensation for additional work performed or expenses incurred. Our failure to accurately estimate the resources and time required for fixed-price contracts or our failure to complete our contractual obligations within the time frame and costs committed could result in reduced profits or, in certain cases, a loss for that contract. If the contract is significant, or we encounter issues that affect multiple contracts, cost overruns could have a material adverse effect on our business, financial condition and results of operations.
Our ability to expand our contract services segment is dependent on developing new business opportunities, meeting the requirements of new customers and timely performance of work in different market sectors.
Our contract service segment is focusing on new customers and new industries with which we do not currently do business with as part of our business development efforts. As we develop these opportunities, we may face greater costs and we may need to devote more resources to develop contract work. Performing and/or bidding on such work could result in our failing to successfully compete for work or underestimating the time, cost and complexity of such work. There can be no assurance that we will successfully identify new business opportunities, achieve market acceptance of our services or that services provided by others will not render our services obsolete or noncompetitive or we will be able to timely complete the work or avoid cost overruns.
The federal government awards contracts through a rigorous competitive process and our efforts to obtain future federal contracts may not be successful.
The federal government conducts a rigorous competitive bidding and award process for most federal contracts. We face strong competition and pricing pressures for any additional contract awards from the federal government, and we may be required to qualify or continue to qualify under the various multiple award task order contract criteria. It may be difficult for us to win future awards from the federal government and we may have other contractors sharing in any federal government awards that we win. In addition, negative publicity regarding findings stemming from audits, congressional opposition, and litigation may adversely affect our ability to obtain future awards.
Our federal government contract work is regularly reviewed and audited by the U.S. government and these reviews can lead to withholding or delay of payments to us, non-receipt of award fees, legal actions, fines, penalties and liabilities and other remedies against us.
U.S. government contracts are subject to specific regulations such as the Federal Acquisition Regulation (“FAR”), the Truth in Negotiations Act, Cost Accounting Standards rules and regulations (“CAS”), the Service Contract Act and DOE regulations. Failure to comply with any of these regulations, requirements or statutes may result in contract price adjustments, financial penalties or contract termination. Our U.S. government contracts are subject to audits, cost reviews and investigations by U.S. government contracting oversight agencies such as the Defense Contract Audit Agency ("DCAA"). The DCAA reviews the adequacy of, and our compliance with, our internal control systems and policies, including our labor, billing, accounting, purchasing, property, estimating, compensation and management information systems. The DCAA has the authority to conduct audits and reviews to determine if we are complying with the requirements under the FAR and CAS, pertaining to the allocation, period assignment and allowability of costs assigned to U.S. government contracts. The DCAA presents its report findings to the contracting agency. Should the contracting agency determine that we have not complied with the terms of our
19
contract and applicable statutes and regulations, payments to us may be disallowed, which could result in adjustments to previously reported revenues and refunding of previously collected cash proceeds. Additionally, we may be subject to litigation brought by private individuals on behalf of the U.S. government under the Federal False Claims Act, which could include claims for treble damages. If we experience performance issues under any of our U.S. government contracts, the U.S. government retains the right to pursue remedies, which could include termination under any affected contract. If any contract were so terminated, our ability to secure future contracts could be adversely affected and may also have a material adverse effect on our business, financial condition, results of operations and cash flows.
Our federal government contracts are dependent on continued U.S. government funding and government appropriations, which may not be made on a timely basis or at all, and could have an adverse effect on our business.
Current and future federal contracts are dependent on government funding, which is generally subject to Congressional appropriations. Our ability to perform under these federal contracts is dependent upon our receiving sufficient funding of and timely payment by contracting governmental entities. There could be reductions or terminations of, or delays in, the government funding. If the contracting governmental agency does not receive sufficient appropriations to cover its contractual obligations, it may terminate our contract or delay or reduce payment to us. Any inability to award a contract, delay in payment, or the termination of a contract due to a lapse in funding, could adversely affect our business, financial condition or results of operations or cash flow.
Failures to protect classified or other sensitive information or security breaches of information technology (“IT”) systems could result in significant liability or otherwise have an adverse effect on our business.
Our business requires us to use and protect classified, sensitive and other protected information as well as business proprietary information and intellectual property. Our computer networks and other IT systems are designed to protect this information through the use of classified networks and other procedures. A material network breach in the security of the IT systems could include the theft of our business proprietary and intellectual property. To the extent any security breach or human error results in a loss or damage to data, or in inappropriate disclosure of classified or other protected information, it could cause grave damage to the country’s national security and to our business. One of the biggest threats to classified information we protect comes from the insider threat - an employee with legitimate access who engages in misconduct and/or negligence. Transitions in the business, in particular the potential for employee layoffs and other transitions, can increase the risk that an insider with access could steal our intellectual property. Any event leading to a security breach or loss or damage to data, whether by our employees or third parties, could result in negative publicity, significant remediation costs, legal liability, and damage to our reputation and could have a material adverse effect on our results of operations.
Financial Risks
Financial risks relate to our financial condition, capital structure and ability to meet financial obligations and the price, volatility and ownership concentration of our Class A Common Stock.
We have significant long-term liabilities.
We continue to have significant long-term liabilities, including the indebtedness under the 8% PIK Toggle Notes due in September 2019, which is currently classified as current debt, as well as our 8.25% Notes, which mature in February 2027. We also still have substantial pension and postretirement health and life benefit obligations and other long-term liabilities. In addition, the terms of the indenture governing our 8% PIK Toggle Notes and the indenture governing our 8.25% Notes will not restrict Centrus or any of its subsidiaries from incurring substantial additional indebtedness in the future.
20
Our significant long-term liabilities (and other third-party financial obligations) could have important consequences, including:
|
•
|
the terms and conditions imposed by the documents governing our indebtedness could make it more difficult for us to satisfy our obligations to lenders and other creditors, resulting in possible defaults on and acceleration of such indebtedness or breaches of such other commitments;
|
|
•
|
we may be more vulnerable to adverse economic conditions and have less flexibility to plan for, or react to, changes in the nuclear enrichment industry, which could place us at a competitive disadvantage compared to industry competitors that have less debt or comparable debt at more favorable interest rates and that, as a result, may be better positioned to withstand economic downturns;
|
|
•
|
we may find it more difficult to obtain additional financing for future working capital, and other general corporate requirements; and
|
|
•
|
we will be required to dedicate a substantial portion of our cash resources to payments on the 8% PIK Toggle Notes, due in September 2019, and 8.25% Notes, due in February 2027, thereby reducing the availability of our cash to fund our operations, capital expenditures and future business opportunities.
|
If we incur substantial additional indebtedness, the foregoing risks would intensify. Additional information concerning the 8% PIK Toggle Notes and 8.25% Notes including the terms and conditions of the 8% PIK Toggle Notes and 8.25% Notes are described in
Note 9,
Debt
of the consolidated financial statements.
The Company has material unfunded defined benefit pension plans obligations and postretirement health and life benefit obligations. These liabilities are anticipated to require material contributions in future periods, which may divert funds from other uses and could adversely impact the Company’s liquidity and prospects.
Centrus and its subsidiary, United States Enrichment Corporation (“Enrichment Corp.”), maintain qualified defined benefit pension plans that are guaranteed by the Pension Benefit Guaranty Corporation (“PBGC”), a wholly owned U.S. government corporation that was created by the Employee Retirement Income Security Act of 1974, as amended (“ERISA”). Centrus also maintains non-qualified defined benefit pension plans for certain executive officers. Effective August 2013, accrued benefits under the defined benefit pension plans are fixed and no longer increase to reflect changes in compensation or company service. In addition, Enrichment Corp. maintains postretirement health and life benefit plans. The aforementioned pension and health and life benefit plans are closed to new participants. These plans are anticipated to require material cash contributions in the future, which may divert funds from other uses and could adversely impact our liquidity depending on the timing of any required contributions or payments in relation to our sources of cash and other payment obligations. See also the Risk Factor,
Levels of returns on pension and postretirement benefit plan assets, changes in interest rates and other factors affecting the amounts to be contributed to fund future pension and postretirement benefit liabilities could adversely affect earnings and cash flows in future periods
, below
.
Levels of returns on pension and postretirement benefit plan assets, changes in interest rates and other factors affecting the amounts to be contributed to fund future pension and postretirement benefit liabilities could adversely affect earnings and cash flows in future periods.
Earnings may be positively or negatively impacted by the amount of expense we record for employee benefit plans. This is particularly true with expense for the pension and postretirement benefit plans. Generally accepted accounting principles in the United States (“U.S. GAAP”) require a company to calculate expense for these plans using actuarial valuations. These valuations are based on assumptions relating to financial markets and other economic conditions. Changes in key economic indicators can result in changes in the assumptions used. The key year-end assumptions used to estimate pension and postretirement benefit expenses for the following year are the discount rate, the expected rate of return on plan assets and healthcare cost trend rates. The rate of return on pension
21
assets and changes in interest rates affect funding requirements for defined benefit pension plans. The IRS and the Pension Protection Act of 2006 regulate the minimum amount we contribute to our pension plans. The amount required to contribute to pension plans can have an adverse effect on our cash flows.
Our revenues and operating results may fluctuate significantly from quarter to quarter and year to year, which could have an adverse effect on our cash flows.
Revenue is recognized when or as we transfer control of the promised LEU or uranium to the customer. Customer demand is affected by, among other things, electricity markets, reactor operations, maintenance and the timing of refueling outages. Customer payments for the SWU component of LEU typically average roughly $10 million per order. Further, some customers are facing challenging market and financial conditions, including seeking protection under bankruptcy laws. Accordingly, they may seek modification of or relief from their obligations either informally or under bankruptcy laws. As a result, a relatively small change in the timing, amount or other terms of customer orders for LEU due to a change in a customer’s refueling schedule or other reasons may cause operating results to be substantially above or below expectations, which could have an adverse effect on our cash flows.
Results of operations could be negatively impacted if
adverse conditions or changes in circumstances indicate a possible impairment loss related to our intangible assets
.
Intangible assets originated from our reorganization and application of fresh start accounting as of September 30, 2014. The intangible assets represented the fair value adjustment to the assets and liabilities for our LEU segment. The intangible assets remaining on our balance sheet relate to our sales order book and customer relationships. The order book intangible asset is amortized to expense as the order book valued at emergence is reduced, principally as a result of deliveries to customers. The customer relationships intangible asset is amortized to expense using the straight-line method over the estimated average useful life of 15 years.
The carrying values of the intangible assets are subject to impairment tests whenever adverse conditions or changes in circumstances indicate a possible impairment loss. If impairment is indicated, the asset carrying value will be reduced to its fair value. Inherent in our fair value determinations are certain judgments and estimates, including projections of future cash flows, the discount rate reflecting the risk inherent in future cash flows, the interpretation of current economic indicators and market valuations, and strategic plans with regard to operations. A change in these underlying assumptions would cause a change in the results of the tests, which could cause the fair value of the intangible asset to be less than its respective carrying amount.
Centrus is dependent on intercompany support from Enrichment Corp.
Substantially all of our revenue-generating operations are conducted at our subsidiary, Enrichment Corp. The financing obtained from Enrichment Corp. funds our general corporate expenses, including cash interest payments on the 8% PIK Toggle Notes and the 8.25% Notes, which are guaranteed on a limited and subordinated basis by Enrichment Corp. As a wholly owned subsidiary of Centrus, Enrichment Corp. has its own set of creditors and a separate board of directors, including independent directors (the “Enrichment Board”), who are elected by Centrus. Current and future funding and support are conditional and dependent on Enrichment Corp.’s own financial condition and a determination by the Enrichment Board that such funding is in the interest of Enrichment Corp.
There is a limited trading market for our securities and the market price of our securities is subject to volatility.
The price of our Class A Common Stock remains subject to volatility. The market price and level of trading of our Class A Common Stock could be subject to wide fluctuations in response to numerous factors, many of which are beyond our control. These factors include, among other things, our limited trading history, our limited trading volume, the concentration of holdings of our Class A Common Stock, actual or anticipated variations in our operating results and cash flow, the nature and content of our earnings releases, announcements or events that impact our products, customers, competitors or markets, business conditions in our markets and the general state of
22
the securities markets and the market for energy-related stocks, as well as general economic and market conditions and other factors that may affect our future results.
Previously, one of our Class B stockholders sold a limited number of shares of Class B Common Stock to a third-party, which resulted in the automatic conversion of the sold shares into Class A Common Stock. Our Class B stockholders may make decisions regarding their investment in the Company based upon factors that are unrelated to the Company’s performance. Any further sales by such stockholder or a decision by the other Class B stockholder to sell shares would also result in automatic conversion (with limited exceptions) of Class B Common Stock into Class A Common Stock upon the sale of Class B Common Stock, which in turn could significantly adversely impact the trading price of the Class A Common Stock.
Our 8% PIK Toggle Notes, the 8.25% Notes, and the Series B Preferred Stock are not listed on any securities exchange. No assurance can be given as to the liquidity of the trading market for the 8% PIK Toggle Notes, the 8.25% Notes or the Series B Preferred Stock. The 8% PIK Toggle Notes, the 8.25% Notes, and the Series B Preferred Stock may be traded only infrequently in transactions arranged through brokers or otherwise, and reliable market quotations for the 8% PIK Toggle Notes, the 8.25% Notes and the Series B Preferred Stock may not be available. In addition, the trading prices of the 8% PIK Toggle Notes, the 8.25% Notes, and the Series B Preferred Stock will depend on many factors, including prevailing interest rates, the limited trading volume of the 8% PIK Toggle Notes, the 8.25% Notes and the Series B Preferred Stock, and the other factors discussed above with respect to the Class A Common Stock.
A small number of Class A stockholders may exert significant influence over the direction of the Company.
As of December 31, 2018, based solely on amounts reported in Schedule 13D and 13G filings with the SEC, two principal stockholders (those stockholders with beneficial ownership of more than 10% of our Class A Common Stock) collectively beneficially own approximately 30.5% of our Class A Common Stock. As a result, these stockholders may be able to exert significant influence over all matters requiring stockholder approval, including the election of directors and approval of significant corporate transactions, such as a merger of the Company or sale of substantially all of the Company’s assets. These stockholders may have interests that differ from, and may vote in a way adverse to, other holders of Class A Common Stock or adverse to the recommendations of the Company’s management. This concentration of ownership may make it more difficult for other stockholders to effect substantial changes in the Company, may limit the ability of the Company to pass certain initiatives or other items that require stockholder approval, and may also have the effect of delaying, preventing or expediting, as the case may be, a change in control of the Company.
A small number of Class A stockholders who also have significant holdings of the Company’s Series B Preferred Stock and 8.25% Notes may be motivated by interests that are not aligned with the Company’s other Class A stockholders.
Currently, three Class A stockholders collectively own greater than 50% of our Series B Preferred Stock and 25% of our 8.25% Notes. As a result, these stockholders may have interests that differ from the remainder of the Class A stockholders, and, as a result, may vote or take other actions in a way adverse to other holders of Class A Common Stock.
Our ability to utilize our net operating loss carryforwards to offset future taxable income may be limited.
Our ability to fully utilize our existing net operating losses (“NOLs”) or net unrealized built-in losses could be limited or eliminated in the event (i) we undergo an “ownership change” as described under Section 382 of the Code, (ii) we do not reach profitability or are only marginally profitable, or (iii) there are changes in federal laws and regulations. An “ownership change” is generally defined as a greater than 50% change in equity ownership by value over a rolling three-year period. Past or future ownership changes, some of which may be beyond our control, as well as differences and fluctuations in the value of our equity securities may adversely affect our ability to utilize our NOLs and could reduce our flexibility to raise capital in future equity financings or other transactions, or we
23
may determine to pursue transactions even if they would result in an ownership change and impair our ability to use our NOLs. In addition, the Section 382 Rights Agreement we have adopted with respect to our common stock and the transfer restrictions in the Series B Preferred Stock contain limitations on transferability intended to prevent the possibility of experiencing an “ownership change,” but we cannot assure you that these measures will be effective or we may determine to pursue transactions even if they would result in an ownership change and impair our ability to use our NOLs. In addition, any changes to tax rules and regulations or the interpretation of tax rules and regulations (including the recent tax legislation) could negatively impact our ability to recognize any potential benefits from our NOLs or net unrealized built-in losses.
We have identified a material weakness in our internal control over financial reporting, which could, if not remediated, result in a material misstatement of our financial statements.
In connection with management's evaluation of the effectiveness of our internal control over financial reporting as of December 31, 2018, we determined that we did not design and maintain effective controls over the evaluation of arrangements with customers that could result in modification accounting or other impacts for a sales contract. Specifically, we did not maintain effective controls over the determination and assessment of accounting impacts for these arrangements when executed. The material weakness did not result in a material misstatement of our annual or interim financial statements. However, the material weakness could result in a misstatement of the revenue or inventory-related account balances or disclosures that would result in a material misstatement to the annual or interim financial statements which would not be prevented or detected in a timely manner. For additional discussion see Part II, Item 9A,
Controls and Procedures
.
We are evaluating the material weakness and developing a plan of remediation to strengthen our overall internal control over determination and assessment of accounting impacts for these arrangements when executed. If our remediation efforts are insufficient to address the identified material weakness or if additional material weaknesses in internal controls are discovered in the future, we may be unable to timely and accurately record, process, summarize and report our financial results. The occurrence of or failure to remediate a material weakness may adversely affect our reputation and business and the market price of shares of our Class A Common Stock.
Strategic Risks
Strategic risks relate to the Company’s future business plans and strategies, including the risks associated with: the global macro environment in which we operate, the demand for our products and services, competitive threats and technology innovation.
Our future prospects are tied directly to the nuclear energy industry worldwide, and the financial difficulties experienced by and operating conditions of our customers could adversely affect our results of operations and financial condition.
Potential events that could affect either nuclear reactors under current or future contracts with us or the nuclear industry as a whole, include:
|
•
|
accidents, terrorism or other incidents at nuclear facilities or involving shipments of nuclear materials;
|
|
•
|
regulatory actions or changes in regulations by nuclear regulatory bodies;
|
|
•
|
decisions by agencies, courts or other bodies under applicable trade laws;
|
|
•
|
disruptions in other areas of the nuclear fuel cycle, such as uranium supplies or conversion;
|
|
•
|
civic opposition to, or changes in government policies regarding, nuclear operations;
|
|
•
|
business decisions concerning reactors or reactor operations;
|
|
•
|
the financial condition of reactor owners and operations;
|
|
•
|
the need for generating capacity; or
|
|
•
|
consolidation within the electric power industry.
|
24
These events could adversely affect us to the extent they result in a reduction or elimination of customers’ contractual requirements to purchase from us, the suspension or reduction of nuclear reactor operations, the reduction of supplies of raw materials, lower demand, burdensome regulation, disruptions of shipments or production, increased competition from third parties, increased costs or difficulties or increased liability for actual or threatened property damage or personal injury.
Additionally, customers may face financial difficulties, including from factors unrelated to the nuclear industry, that could affect their willingness or ability to make purchases. We are exposed to the risk of loss in the event of nonperformance or a default by customers on their contracts. We cannot provide any assurance that our customers will not default on their obligations to us or file for bankruptcy protection. If a customer files for bankruptcy protection, we likely would be unable to collect all, or even a significant portion, of amounts that are owed to us. A customer default and bankruptcy filing could have a material adverse effect on our business, financial position, results of operations or cash flows.
The continued excess supply of LEU in the market could adversely affect our business, results of operations and prospects.
Approximately 60 reactors in Japan and Germany were taken offline following the March 2011 earthquake and tsunami that caused irreparable damage to four reactors in Fukushima, Japan. The events at Fukushima and its aftermath have negatively affected the balance of supply and demand. In addition, reactor operators face competition from low priced natural gas and other alternatives. As a result, since 2013, United States utilities have closed or have announced plans to close 19 reactors and additional reactors have been reported to be at risk of closure. These impacts could continue to grow depending on the length and severity of delays in the restart of reactors, the number of reactors closed or cancellations of deliveries. The longer that this demand is reduced or absent from the market, the greater the cumulative impact on the market. Market prices for our products are near their lowest levels in more than two decades and this trend could continue or worsen. Suppliers whose deliveries are cancelled or delayed due to shutdown reactors or delays in reactor refueling have excess supply available to sell in the market. This has adversely affected our success in selling LEU. These events have created significant uncertainty, and our business, results of operations, and prospects have been and could continue to be adversely affected.
We have long been a leading supplier of LEU to Japanese and U.S. utilities. To maintain our order book with Japanese and U.S. utilities, and other utilities customers that do not currently need more fuel, we may need to restructure our contracts to give the customers greater flexibility to meet their obligations to us without a material loss in value to us. If deliveries under contracts included in our order book are significantly delayed, modified or canceled because purchases are tied to requirements or because customers seek to limit their obligations under existing contracts, our revenues and earnings may be adversely impacted, with a corresponding impact on our financial condition and prospects.
In addition, China has emerged as a significant enriched uranium producer. Although primarily focused on supplying domestic requirements in China, it has begun to supply LEU to international markets in recent years which may further contribute to the excess supply of LEU in the market.
The ability to attract and retain key personnel is critical to the success of our business.
The success of our business depends on key executives, managers, scientists, engineers and other skilled personnel. The ability to attract and retain these key personnel may be difficult in light of the uncertainties currently facing the business and changes we may make to the organizational structure to adjust to changing circumstances. Changes in senior management could create uncertainty among our employees, customers and other third parties with which we do business. The inability to retain appropriately qualified and experienced senior executives could negatively affect our operations, strategic planning and performance.
25
We could further demobilize or terminate the American Centrifuge project in the future, which could have an adverse effect on our results of operations and liquidity and could trigger termination of the limited, conditional guaranty by Enrichment Corp. of the 8% PIK Toggle Notes.
We lease the Piketon facility from DOE. At the conclusion of the lease on June 30, 2019, absent mutual agreement between the Company and DOE regarding other possible uses for the facility, we are obligated to return the facility to DOE in a condition that meets NRC requirements and in the same condition as the facility was in when it was leased to us (other than due to normal wear and tear). We believe we have completed the D&D work required under NRC license requirements. As of December 31, 2018, we continue to incur costs in connection with maintaining the lease facilities in accordance with the lease. If remaining costs related to maintaining the facility are greater than our estimates, then such increased costs could have an adverse impact on our results of operations and liquidity.
On January 7, 2019, DOE issued a Notice of Intent to contract with Centrus to deploy a cascade of centrifuges at the Piketon facility to demonstrate the ability to produce HALEU. The associated contract is being definitized with DOE, and the Company anticipates it will extend its lease beyond June 30, 2019, for at least the term of the associated contract. In the event the Company does not terminate the NRC license for the test facility and/or the lease because it expects to receive a contract with DOE, but the Company does not receive the contract, the Company could incur substantial additional costs that could have an adverse impact on our results of operations and liquidity.
While we are working to obtain additional revenue sources to support and expand our technology capabilities at our facilities in Oak Ridge and Piketon, there can be no assurance that such efforts will succeed. If funding by DOE is not obtained or we are unsuccessful in obtaining other revenue to support our technology, our results of operations and liquidity could be adversely affected by potential impacts, including, but not limited to:
|
•
|
implementing worker layoffs and potentially losing additional key skilled personnel, all of whom have security clearances, which could be difficult to rehire or replace, and incurring severance and other termination costs; and
|
|
•
|
terminating the remaining portions of the American Centrifuge project and losing technical capabilities and key resources that could be useful in deploying a future commercial enrichment plant using the American Centrifuge technology or other technologies or expanding into other areas of the nuclear industry.
|
Termination of the American Centrifuge project or termination of DOE funding of the project through the contract with UT-Battelle, as operator of ORNL for DOE, could trigger termination of the limited, conditional guaranty by Enrichment Corp. of the 8% PIK Toggle Notes (other than with respect to the unconditional interest claim) as provided in the indenture governing the 8% PIK Toggle Notes. DOE funding of the project through the contract with UT-Battelle expired September 30, 2018, and we continue to perform work towards the expected milestones as the parties work toward a successor agreement; however, we have no assurance that a successor agreement will be executed. In the event government funding is not received or is reduced from prior levels, the American Centrifuge project may be subject to demobilization, costs, delays or termination.
The potential for DOE to seek to terminate or exercise its remedies under the 2002 DOE-USEC Agreement and our other agreements with DOE, or to require modifications to such agreements that are adverse to our interests, may have adverse consequences on the Company.
The Company and DOE signed an agreement dated June 17, 2002, as amended (the “2002 DOE-USEC Agreement”), pursuant to which the parties made long-term commitments directed at resolving issues related to the stability and security of the domestic uranium enrichment industry. DOE consented to the assumption by the Company of the 2002 DOE-USEC Agreement and other agreements between the Company and DOE subject to an express reservation of all rights, remedies and defenses by DOE and the Company under those agreements as part of the Company’s Chapter 11 bankruptcy process. The 2002 DOE-USEC Agreement requires the Company to develop,
26
demonstrate and deploy advanced enrichment technology in accordance with milestones and provides for remedies in the event of a failure to meet a milestone under certain circumstances.
DOE has specific remedies under the 2002 DOE-USEC Agreement if we fail to meet a milestone that would adversely impact our ability to begin commercial operations of the American Centrifuge Plant on schedule, and such delay was within our control or was due to our fault or negligence or if we abandon or constructively abandon the commercial deployment of an advanced enrichment technology. These remedies include terminating the 2002 DOE-USEC Agreement, revoking our access to DOE’s centrifuge technology that is required for the success of the American Centrifuge project, requiring us to transfer certain rights in the American Centrifuge technology and facilities to DOE, and requiring us to reimburse DOE for certain costs associated with the American Centrifuge project.
DOE may seek to exercise remedies under such agreements and there is no assurance that the parties will be able to reach agreement on appropriate modifications to the agreements in the future. Moreover, even if the parties reach agreement on modifications to such agreements, there is no assurance that such modifications will not impose material additional requirements, provide DOE with material additional rights or remedies or otherwise affect the overall economics of the American Centrifuge Plant and the ability to finance and successfully deploy the project. Any of these actions could have an adverse impact on our business and prospects.
We also granted to DOE an irrevocable, non-exclusive right to use or permit third parties on behalf of DOE to use all centrifuge technology intellectual property (“Centrifuge IP”) royalty free for U.S. government purposes (which includes national defense purposes, including providing nuclear material to operate commercial nuclear power reactors for tritium production). We also granted an irrevocable, non-exclusive license to DOE to use such Centrifuge IP developed at our expense for commercial purposes (including a right to sublicense), which may be exercised only if we miss any of the milestones under the 2002 DOE-USEC Agreement or if we (or our affiliate or entity acting through us) are no longer willing or able to proceed with, or have determined to abandon or have constructively abandoned, the commercial deployment of the centrifuge technology. Such a commercial purposes license is subject to payment of an agreed upon royalty to us, which will not exceed $665 million in the aggregate. Any of these actions could have an adverse impact on our business and prospects.
We face significant competition from four major producers who may be less cost sensitive or may be favored due to national loyalties.
We compete with four major producers of LEU, all of which are wholly or substantially owned by governments: Orano (France), Rosatom/TENEX (Russia), Urenco (the Netherlands, the United Kingdom and two German utilities), and CNEIC (China). Our competitors have greater financial resources than we do. Foreign competitors enjoy support from their government owners, which may enable them to be less cost- or profit-sensitive than we are. In addition, decisions by foreign competitors may be influenced by political and economic policy considerations rather than commercial considerations. For example, foreign competitors may elect to increase their production or exports of LEU, even when not justified by market conditions, thereby depressing prices and reducing demand for LEU, which could adversely affect our business, results of operations, and prospects. Similarly, the elimination or weakening of existing restrictions on imports from foreign competitors could adversely affect our business, results of operations, and prospects. Moreover, our competitors may be better positioned to take advantage of improved market conditions and increase capacity to meet any future market expansion.
The ability to compete in certain foreign markets may be limited for political, legal and economic reasons.
Agreements for cooperation between the United States government and various foreign governments or governmental agencies control the export of nuclear materials from the United States. If any of the agreements governing exports to countries in which customers are located were to lapse, terminate or be amended, it is possible our sales could be curtailed or terminated or LEU could no longer be delivered to customers in those countries. This could adversely affect our business, results of operations, and prospects.
27
Purchases of LEU by customers in the European Union are subject to a policy of the Euratom Supply Agency that seeks to limit foreign enriched uranium to no more than 20% of European Union consumption per year. Application of this policy to consumption in the European Union of the LEU that we supply or purchase can significantly limit our ability to make sales to European customers. Additionally, any decision by the United Kingdom to withdraw from the Euratom Supply Agency as a result of its decision to exit the European Union may have an impact on the nuclear industry.
Further, geopolitical events, including domestic or international reactions or responses to such events and subsequent government or international actions including the imposition of sanctions, could also impact our ability to purchase, sell or make deliveries of LEU to customers.
Certain emerging markets lack a comprehensive nuclear liability law that protects suppliers by channeling liability for injury and property damage suffered by third persons from nuclear incidents at a nuclear facility to the facility’s operator. To the extent a country does not have such a law and has not otherwise provided nuclear liability protection for suppliers to the projects to which we supply SWU, we intend to negotiate terms in customer contracts that we believe will adequately protect us in a manner consistent with this channeling principle. However, if a customer is unwilling to agree to such contract terms, the lack of clear protection for suppliers in the national laws of these countries could adversely affect our ability to compete for sales to meet the growing demand for LEU in these markets and our prospects for future revenue from such sales.
Changes to, or termination of, any agreements with the U.S. government, or deterioration in our relationship with the U.S. government, could adversely affect results of operations.
We are a party to a number of agreements and arrangements with the U.S. government that are important to the business, including:
|
•
|
leases for the centrifuge facilities;
|
|
•
|
the 2002 DOE-USEC Agreement and other agreements that address issues relating to the domestic uranium enrichment industry and centrifuge technology; and
|
|
•
|
the agreement with DOE to provide D&D services for DOE’s K-1600 facility located at the East Tennessee Technology Park.
|
Termination, expiration or failure to obtain one or more of these agreements, without replacement with an equivalent agreement or arrangement that accomplishes the same objectives as such agreements, could adversely affect our business and prospects. In addition, deterioration in our relationship with the U.S. agencies that are parties to these agreements could impair or impede our ability to successfully implement these agreements, which could adversely affect our results of operations.
Our success depends on our ability to adapt to a rapidly changing competitive environment in the nuclear industry.
The nuclear industry in general, and the nuclear fuel industry in particular, is in a period of significant change, which could significantly transform the competitive landscape we face. The uranium enrichment sector of the nuclear fuel cycle industry remains oversupplied, creating downward pressures on commodity pricing, with uncertainty regarding nuclear power generation. Changes in the competitive landscape may adversely affect pricing trends, change customer spending patterns, or create uncertainty. To address these changes, we may seek to adjust our cost structure and operations and evaluate opportunities to grow our business organically or through acquisitions and other strategic transactions. We are actively considering, and expect to consider from time to time in the future, potential strategic transactions, which could involve, without limitation, acquisitions and/or dispositions of businesses or assets, joint ventures or investments in businesses, products or technologies. In connection with any such transaction, we may seek additional debt or equity financing, contribute or dispose of assets, assume additional indebtedness, or partner with other parties to consummate a transaction. Any such transaction may not result in the intended benefits and could involve significant commitments of our financial and other resources. If the actions we
28
take in response to industry changes are not successful, our business, results of operations and financial condition may be adversely affected.
Legal and Compliance Risks
Legal and compliance risks relate to risks arising from the government and regulatory environment and action, legal proceedings and compliance with integrity policies and procedures, including those relating to financial reporting and environmental health and safety. Government and regulatory risk includes the risk that the government or regulatory actions will impose additional cost on us or cause us to have to change our business models or practices.
Our operations are highly regulated by the NRC, DOE and the State of Tennessee.
Our operations are subject to regulation by the NRC. The NRC has granted two licenses for the Piketon facility, i.e. a license for the test facility was granted in February 2004 and a separate license to construct and operate a commercial plant was granted in April 2007. Unless we receive a new contract from DOE for the development of HALEU, it is our intention to terminate the NRC license for the test facility in 2019. The NRC could refuse to terminate the license if we have failed to meet the conditions for termination.
The NRC also could refuse to renew our license to construct and operate a commercial plant if it determines that: (1) we are foreign owned, controlled or dominated; (2) the issuance of a renewed license would be inimical to the maintenance of a reliable and economic domestic source of enrichment; (3) the issuance of a renewed license would be adverse to U.S. defense or security objectives; or (4) the issuance of a renewed license is otherwise not consistent with applicable laws or regulations in effect at the time of renewal.
The NRC has the authority to issue notices of violation for violations of the Atomic Energy Act of 1954, as amended (the “Atomic Energy Act”), the NRC regulations and conditions of licenses, certificates of compliance, or orders. The NRC has the authority to impose civil penalties or additional requirements and to order cessation of operations for violations of its regulations. Penalties under the NRC regulations could include substantial fines, imposition of additional requirements or withdrawal or suspension of licenses or certificates. Any penalties imposed on us could adversely affect our results of operations and liquidity. The NRC also has the authority to issue new regulatory requirements or to change existing requirements. Changes to the regulatory requirements could also adversely affect our results of operations.
In addition, the centrifuge technology development and manufacturing facilities in Oak Ridge, and certain operations at our other facilities, are subject to regulation by DOE. Our facility in Oak Ridge is also regulated by the State of Tennessee under NRC’s agreement state program. DOE and the State of Tennessee have the authority to impose civil penalties and additional requirements, which could adversely affect our results of operations.
Our operations involve the use, transportation and disposal of toxic, hazardous and/or radioactive materials and could result in liability without regard to fault or negligence.
Our operations involve the use, transportation and disposal of toxic, hazardous and radioactive materials. A release of these materials could pose a health risk to humans or animals. If an accident were to occur, its severity would depend on the volume of the release and the speed of corrective action taken by plant emergency response personnel, as well as other factors beyond our control, such as weather and wind conditions. Actions taken in response to an actual or suspected release of these materials, including a precautionary evacuation, could result in significant costs for which we could be legally responsible. In addition to health risks, a release of these materials may cause damage to, or the loss of, property and may adversely affect property values.
29
We lease facilities from DOE at the centrifuge facilities in Piketon, Ohio and Oak Ridge, Tennessee. Pursuant to the Price-Anderson Act, DOE has indemnified the Company against claims for public liability (as defined in the Atomic Energy Act) arising out of or in connection with activities under those leases resulting from a nuclear incident or precautionary evacuation. If an incident or evacuation is not covered under DOE indemnification, we could be financially liable for damages arising from such incident or evacuation, which could have an adverse effect on our results of operations and financial condition. The DOE indemnification does not apply to incidents outside the United States, including in connection with international transportation of LEU.
While DOE has provided indemnification pursuant to the Price-Anderson Act, there could be delays in obtaining reimbursement for costs from DOE and DOE may determine that some or all costs are not reimbursable under the indemnification. In addition, the Price-Anderson Act indemnification does not cover loss or damage to property located on the leased facilities due to a nuclear incident.
In our contracts, we seek to protect ourselves from liability, but there is no assurance that such contractual limitations on liability will be effective in all cases. The costs of defending against a claim arising out of a nuclear incident or precautionary evacuation, and any damages awarded as a result of such a claim, could adversely affect our results of operations and financial condition.
Our failure to maintain compliance with the listing requirements of the NYSE American could result in a delisting of our Class A Common Stock and would impair stockholders’ ability to sell or purchase our Class A Common Stock.
On November 17, 2015, we received notice from the NYSE American indicating that the Company was not in compliance with Sections 1003(a)(i) and (ii) of the NYSE American’s Company Guide since it reported a stockholders’ deficit as of September 30, 2015, and net losses in its fiscal years ended December 31, 2011, 2012 and 2013. On April 28, 2017, the NYSE American informed Centrus that it had regained compliance with the NYSE American’s continued listing standards because it had resolved the continued listing deficiency. If the Company falls below any of the NYSE American’s continued listing standards in the future, the NYSE American may initiate delisting procedures as appropriate. A delisting of our Class A Common Stock by the NYSE American and the failure of our Class A Common Stock to be listed on another national exchange could have significant adverse consequences. A delisting would likely have a negative effect on the price of our Class A Common Stock and would impair stockholders’ ability to sell or purchase our Class A Common Stock. A delisting could also affect our access to capital resources.
Our certificate of incorporation gives us certain rights with respect to equity securities held (beneficially or of record) by foreign persons. If levels of foreign ownership set forth in our certificate of incorporation are exceeded, we have the right, among other things, to redeem or exchange common stock held by foreign persons, and in certain cases, the applicable redemption price or exchange value may be equal to the lower of fair market value or a foreign person’s purchase price.
Our certificate of incorporation gives us certain rights with respect to shares of our common stock held (beneficially or of record) by foreign persons. Foreign persons are defined in our certificate of incorporation to include, among others, an individual who is not a U.S. citizen, an entity that is organized under the laws of a non-U.S. jurisdiction and an entity that is controlled by individuals who are not U.S. citizens or by entities that are organized under the laws of non-U.S. jurisdictions.
The occurrence of any one or more of the following events is a “foreign ownership review event” and triggers the board of directors’ right to take various actions under our certificate of incorporation: (1) the beneficial ownership by a foreign person of (a) 5% or more of the issued and outstanding shares of any class of our equity securities, (b) 5% or more in voting power of the issued and outstanding shares of all classes of our equity securities, or (c) less than 5% of the issued and outstanding shares of any class of our equity securities or less than 5% of the voting power of the issued and outstanding shares of all classes of our equity securities, if such foreign
30
person is entitled to control the appointment and tenure of any of our management positions or any director; (2) the beneficial ownership of any shares of any class of our equity securities by or for the account of a foreign uranium enrichment provider or a foreign competitor (defined in our certificate of incorporation as a “Contravening Person”); or (3) any ownership of, or exercise of rights with respect to, shares of any class of our equity securities or other exercise or attempt to exercise control of us that is inconsistent with, or in violation of, any regulatory restrictions, or that could jeopardize the continued operations of our facilities (defined in our certificate of incorporation as an “Adverse Regulatory Occurrence”). These rights include requesting information from holders (or proposed holders) of our securities, refusing to permit the transfer of securities by such holders, suspending or limiting voting rights of such holders, redeeming or exchanging shares of our stock owned by such holders on terms set forth in our certificate of incorporation, and taking other actions that we deem necessary or appropriate to ensure compliance with the foreign ownership restrictions.
The terms and conditions of our rights with respect to our redemption or exchange right in respect of shares held by foreign persons or Contravening Persons are as follows:
|
•
|
Redemption price or exchange value:
Generally, the redemption price or exchange value for any shares of our common stock redeemed or exchanged would be their fair market value. However, if we redeem or exchange shares held by foreign persons or Contravening Persons and our Board in good faith determines that such person knew or should have known that its ownership would constitute a foreign ownership review event (other than shares for which our Board determined at the time of the person’s purchase that the ownership of, or exercise of rights with respect to, such shares did not at such time constitute an Adverse Regulatory Occurrence), the redemption price or exchange value is required to be the lesser of fair market value and the person’s purchase price for the shares redeemed or exchanged.
|
|
•
|
Form of payment:
Cash, securities or a combination, valued by our board of directors in good faith.
|
|
•
|
Notice:
At least 30 days written notice of redemption is required; however, if we have deposited the cash or securities for the redemption or exchange in trust for the benefit of the relevant holders, we may redeem shares held by such holders on the same day that we provide notice.
|
Accordingly, there are situations in which a foreign stockholder or Contravening Person could lose the right to vote its shares or in which we may redeem or exchange shares held by a foreign person or Contravening Person and in which such redemption or exchange could be at the lesser of fair market value and the person’s purchase price for the shares redeemed or exchanged, which could result in a significant loss for that person.
The terms of our outstanding 8% PIK Toggle Notes, 8.25% Notes and Series B Preferred Stock contain
restrictions on our ability to pay dividends on our Class A Common Stock.
Our Series B Preferred Stock provides that we may not pay dividends on our Class A Common Stock (other than dividends payable in shares of Class A Common Stock) so long as any share of our Series B Preferred Stock are outstanding. Although we may redeem or repurchase our Series B Preferred Stock, we currently have no plans to do so, and we cannot assure you that we would redeem or repurchase our Series B Preferred Stock in the future. In addition, the indentures governing our 8% PIK Toggle Notes and 8.25% Notes, subject to certain exceptions, place certain restrictions on the ability of our subsidiary, Enrichment Corp. to transfer cash and other assets to us. This could act as an additional constraint on our ability to pay dividends on our Class A Common Stock.
31
Anti-takeover provisions could delay or prevent an acquisition of us.
We are a Delaware corporation, and the anti-takeover provisions of Delaware law impose various impediments to the ability of a third-party to acquire control of our company, even if a change of control would be beneficial to our existing stockholders. In particular, we are governed by the provisions of Section 203 of the Delaware General Corporation Law, or DGCL, which generally prohibits a Delaware corporation from engaging in a broad range of business combinations with any “interested” stockholder for a period of three years following the date on which the stockholder becomes an “interested” stockholder. Our certificate of incorporation, or charter, establishes restrictions on foreign ownership of our securities. Other provisions of our charter and bylaws may make it more difficult for a third-party to acquire control of us without the consent of our board of directors. These provisions include:
|
•
|
authorizing “blank check” preferred stock that our board of directors could issue to increase the number of outstanding shares to discourage a takeover attempt;
|
|
•
|
not providing for cumulative voting in the election of directors, which limits the ability of minority stockholders to elect director candidates;
|
|
•
|
limiting the ability of stockholders to call a special stockholder meeting;
|
|
•
|
establishing advance notice requirements for nominations for election to our board of directors or for proposing matters that can be acted upon by stockholders at stockholder meetings; and
|
|
•
|
providing that our board of directors is expressly authorized to amend, alter, rescind or repeal our by-laws.
|
These various restrictions could deprive shareholders of the opportunity to realize takeover premiums for their shares.
Also, in April 2016, we adopted a Section 382 Shareholder Rights Agreement (the “Rights Agreement”) in an effort to protect shareholder value by, among other things, attempting to protect against a possible limitation on our ability to use our net operating loss carryforwards and other tax benefits, which may be used to reduce potential future income tax obligations. Pursuant to the terms of the Rights Agreement, if certain persons or groups acquire more than a certain amount of the outstanding shares of our Class A Common Stock, then, subject to certain exceptions, the Rights Agreement would be triggered.
In addition, the indenture governing our 8% PIK Toggle Notes and the indenture governing our 8.25% Notes include restrictions on our ability to engage in certain mergers or acquisitions. The indentures governing our 8% PIK Toggle Notes and our 8.25% Notes also require us to offer to repurchase all such outstanding notes at 101% of their outstanding principal amount in the event of certain change of control events.
These and other provisions could prevent, deter, or make it more difficult for a third party from acquiring us even where the acquisition could be beneficial to stockholders.
Item 1B.
Unresolved Staff Comments
None.
32
Item 2.
Properties
Our corporate headquarters is located at 6901 Rockledge Drive, Suite 800, Bethesda, Maryland 20817, where we lease 24,000 square feet of office space through October 2027. We own a 440,000 square foot manufacturing facility, including supporting office space, on 72 acres at 400 Centrifuge Way, Oak Ridge, Tennessee 37830. We lease 50,400 square feet of centrifuge testing facilities from DOE at the East Tennessee Technology Park, 2010 Hwy 58, Oak Ridge, Tennessee 37830. The current lease term is through December 2019. We also lease industrial buildings and 110,000 square feet of supporting office space from DOE at 3930 U.S. Route 23, Piketon, Ohio 45661. The industrial buildings encompass more than 14 acres under roof and were built to contain uranium enrichment operations using centrifuge technology. In May 2017, we entered into a lease through July 2021 for 6,000 square feet of office space at 14074 U.S. Highway 23, Waverly, Ohio. We also have short-term leases for small areas of office space in Washington, DC and Tokyo, Japan.
Item 3.
Legal Proceedings
On August 30, 2013, the Company submitted a claim to DOE under the Contract Disputes Act for payment of $42.8 million, representing DOE’s share of pension and postretirement benefits costs related to the transition of Portsmouth site employees to DOE’s D&D contractor. On August 27, 2014, the DOE contracting officer denied the Company’s claim. As a result, the Company filed an appeal of the decision in the U.S. Court of Federal Claims in January 2015. As noted in Part I, Item 1A,
Risk Factors,
Centrus has potential pension plan funding obligations under Section 4062(e) of ERISA related to the Company’s de-lease of the former Portsmouth GDP and transition of employees to DOE’s D&D contractor and related to the transition of employees in connection with the Paducah GDP transition. Centrus believes that DOE is responsible for a significant portion of any pension and postretirement benefit costs associated with the transition of employees at Portsmouth. The receivable for DOE’s share of pension and postretirement benefits costs has a full valuation allowance due to the lack of a resolution with DOE and uncertainty regarding the amounts owed and the timing of collection. The parties filed cross motions for partial summary judgment to seek a judicial determination of two issues related to the calculation of the pension liability and the entitlement of Centrus to reimbursement for postretirement benefit costs. The Court ruled on the pension calculation methodology and ruled Centrus was entitled to recover costs associated with postretirement benefits for employees afforded protection under the USEC Privatization Act. The parties are engaged in settlement discussions and further action on the case is stayed pending the outcome of such discussions.
On October 11, 2018, the Company’s subsidiaries, Enrichment Corp. and American Centrifuge Enrichment, LLC (“ACE”, together with Enrichment Corp., the “Company Subsidiaries”) filed proofs of claim in the U.S. Bankruptcy Court for the Northern District of Ohio (the “Bankruptcy Court”) against each of FirstEnergy Nuclear Operating Company (“FENOC”), FirstEnergy Nuclear Generation, LLC (“FENG,” and together with FENOC, the “FirstEnergy Contract Parties”), FirstEnergy Solutions Corp. (“FES”) and FirstEnergy Generation, LLC (“FG”) in the amount of approximately $314.0 million. The claims relate to damages arising from the rejection and breach of a long-term contract between the Company Subsidiaries and the FirstEnergy Contract Parties that was approved by the Bankruptcy Court and made effective as of July 26, 2018. The proofs of claim filed by the Company Subsidiaries include claims against FENOC and FENG based on their liability as parties to the contract that was rejected and breached. The proofs of claim filed by the Company Subsidiaries also include claims against FES and FG based on their liability under guaranties they issued that may obligate FES and FG to satisfy the rejection and breach of contract damages claims.
We are subject to various legal proceedings and claims, either asserted or unasserted, which arise in the ordinary course of business. While the outcome of these claims cannot be predicted with certainty, other than the above, we do not believe that the outcome of any of these legal matters, individually or in the aggregate, will have a material adverse effect on our cash flows, results of operations or consolidated financial condition.
Item 4.
Mine Safety Disclosures
None.
33
Executive Officers of the Registrant
Executive officers are elected by and serve at the discretion of the Board of Directors. Executive officers at April 1, 2019, follow:
|
Name
|
Age
|
Position
|
|
Daniel B. Poneman
|
63
|
President and Chief Executive Officer
|
|
Larry B. Cutlip
|
59
|
Senior Vice President, Field Operations
|
|
Elmer W. Dyke
|
55
|
Senior Vice President, Business Operations and Chief Commercial Officer
|
|
Marian K. Davis
|
60
|
Senior Vice President, Chief Financial Officer and Treasurer
|
|
Stephen S. Greene
|
61
|
Senior Vice President, Corporate Development and Strategy
|
|
Dennis J. Scott
|
59
|
Senior Vice President, General Counsel, Chief Compliance Officer and Corporate Secretary
|
|
John M.A. Donelson
|
54
|
Vice President, Sales and Chief Marketing Officer
|
Daniel B. Poneman has been President and Chief Executive Officer since April 2015 and was Chief Strategic Officer in March 2015. Prior to joining the Company, Mr. Poneman was Deputy Secretary of Energy from May 2009 to October 2014, in which capacity he also served as Chief Operating Officer of the U.S. Department of Energy.
Larry B. Cutlip has been Senior Vice President, Field Operations since January 2018, was Vice President, Field Operations from May 2016 through December 2017, was Deputy Director of the American Centrifuge Project from January 2015 to May 2016, was Director, Centrifuge Manufacturing from April 2008 to December 2014, was Director, Program Management and Strategic Planning from December 2005 to April 2008, was Manager, Engineering from May 1999 to December 2005, and held positions in operations management and engineering at the Company and its predecessors since 1981.
Elmer W. Dyke has been Senior Vice President, Business Operations and Chief Commercial Officer since January 2018 and was Senior Vice President, Business Operations from September 2015 through December 2017. Prior to joining the Company, Mr. Dyke was a Senior Vice President of NAC International’s global consulting business and Vice President of International Sales from August 2010 to September 2015.
Marian K. Davis has been Senior Vice President, Chief Financial Officer and Treasurer since April 3, 2018, was Vice President, Finance and Accounting from January 2018 to April 2018 and was Vice President and Chief Audit Executive from July 2011 through December 31, 2017.
Stephen S. Greene has been Senior Vice President, Corporate Development and Strategy since April 3, 2018, was Senior Vice President, Chief Financial Officer and Treasurer from July 2015 to April 2018, and was Vice President, Finance and Treasurer from February 2007 to July 2015.
Dennis J. Scott has been Senior Vice President, General Counsel, Chief Compliance Officer and Corporate Secretary since January 2018 and Vice President, General Counsel, Chief Compliance Officer and Corporate Secretary from May 2016 through December 2017. Mr. Scott was Deputy General Counsel and Director, Corporate Compliance from April 2011 to May 2016, Acting Deputy General Counsel from August 2010 to April 2011, Assistant General Counsel and Director, Corporate Compliance from April 2005 to August 2010 and Assistant General Counsel from January 1994 to April 2005.
John M.A. Donelson has been Vice President, Sales and Chief Marketing Officer since January 2018 and Vice President, Marketing, Sales and Power from April 2011 through December 2017. Mr. Donelson was Vice President, Marketing and Sales from December 2005 to April 2011, Director, North American and European Sales from June 2004 to December 2005, Director, North American Sales from August 2000 to June 2004 and Senior Sales Executive from July 1999 to August 2000.
34
PART II
Item 5.
Market for Registrant’s Common Equity, Related Stockholder Matters and Issuer Purchases of Equity Securities
The Company’s certificate of incorporation authorizes 100,000,000 shares of common stock, consisting of 70,000,000 shares of Class A common stock, $0.10 par value per share (the “Class A Common Stock”) and 30,000,000 shares of Class B common stock, $0.10 par value per share (the “Class B Common Stock,” and together with the Class A Common Stock, the “Common Stock”). The Company has issued 9,437,389 shares of Common Stock, consisting of 8,031,307 shares of Class A Common Stock and 1,406,082 shares of Class B Common Stock. The Class B Common Stock was issued to Toshiba America Nuclear Energy Corporation (“Toshiba”) and Babcock & Wilcox Investment Company (“B&W”) and has the same rights, powers, preferences and restrictions and ranks equally in all matters with the Class A Common Stock, except voting. Holders of Class B Common Stock are entitled to elect, in the aggregate, two members of the Board of Directors of the Company, subject to certain holding requirements. Additionally, the Company has reserved 1,200,000 shares of Class A Common Stock under its management incentive plan, of which approximately 596,000 shares were available for future awards as of December 31, 2018, including approximately 120,000 shares associated with awards which terminated or were cancelled without being exercised.
The Class A Common Stock trades on the NYSE American under the symbol “LEU”.
As of March 1, 2019, there were 8,031,307 shares of Class A Common Stock outstanding. As of March 1, 2019, there were approximately 930 holders of record and approximately 7,550 beneficial owners of the Company’s Class A Common Stock.
No cash dividends were paid in 2017 or 2018, and we have no intention to pay cash dividends in the foreseeable future. Our Series B Preferred Stock provides that so long as any shares of our Series B Preferred Stock are outstanding, we may not pay dividends on our Class A Common Stock (other than dividends payable in shares of Class A Common Stock). In addition, the indentures governing our 8% PIK Toggle Notes and 8.25% Notes, subject to certain exceptions, place certain restrictions on the ability of our subsidiary, Enrichment Corp. to transfer cash and other assets to us. This could act as an additional constraint on our ability to pay dividends on our Class A Common Stock.
In addition, we are obligated to pay cash dividends on our Series B Preferred Stock to the extent that (1) our pension plans and Enrichment Corp.’s pension plans are at least 90% funded on a variable rate premium calculation in the current plan year, (2) our net income calculated in accordance with U.S. GAAP (excluding the effect of pension remeasurement) for the immediately preceding fiscal quarter exceeds $7.5 million, (3) our free cash flow (defined as the sum of cash provided by (used in) operating activities and cash provided by (used in) investing activities) for the immediately preceding four fiscal quarters exceeds $35.0 million, (4) the balance of cash and cash equivalents calculated in accordance with U.S. GAAP on the last day of the immediately preceding quarter would exceed $150.0 million after pro forma application of the dividend payment, and (5) dividends may be legally payable under Delaware law. We did not meet the criteria for a dividend payment obligation for the year ended December 31, 2018, and we have not declared, accrued or paid dividends on the Series B Preferred Stock since issuance on February 14, 2017.
There were no unregistered sales of equity securities by the Company during the years ended December 31, 2018 or 2017.
Fourth Quarter 2018 Issuer Repurchases of Equity Securities
None.
35
Matters Affecting our Foreign Stockholders
In order to aid in our compliance with our NRC license, our certificate of incorporation gives us certain rights with respect to shares of our Common Stock held (beneficially or of record) by foreign persons. Foreign persons are defined in our certificate of incorporation to include, among others, an individual who is not a U.S. citizen, an entity that is organized under the laws of a non-U.S. jurisdiction and an entity that is controlled by individuals who are not U.S. citizens or by entities that are organized under the laws of non-U.S. jurisdictions.
The occurrence of any one or more of the following events is a “foreign ownership review event” and triggers the board of directors’ right to take various actions under our certificate of incorporation: (1) the beneficial ownership by a foreign person of (a) 5% or more of the issued and outstanding shares of any class of our equity securities, (b) 5% or more in voting power of the issued and outstanding shares of all classes of our equity securities, or (c) less than 5% of the issued and outstanding shares of any class of our equity securities or less than 5% of the voting power of the issued and outstanding shares of all classes of our equity securities, if such foreign person is entitled to control the appointment and tenure of any of our management positions or any director; (2) the beneficial ownership of any shares of any class of our equity securities by or for the account of a foreign uranium enrichment provider or a foreign competitor (referred to as “contravening persons”); or (3) any ownership of, or exercise of rights with respect to, shares of any class of our equity securities or other exercise or attempt to exercise control of us that is inconsistent with, or in violation of, any regulatory restrictions, or that could jeopardize the continued operations of our facilities (an “adverse regulatory occurrence”). These rights include requesting information from holders (or proposed holders) of our securities, refusing to permit the transfer of securities by such holders, suspending or limiting voting rights of such holders, redeeming or exchanging shares of our stock owned by such holders on terms set forth in our certificate of incorporation, and taking other actions that we deem necessary or appropriate to ensure compliance with the foreign ownership restrictions.
For information regarding the foreign ownership restrictions set forth in our certificate of incorporation, please refer to — Part I, Item 1A,
Risk Factors
-
Our certificate of incorporation gives us certain rights with respect to equity securities held (beneficially or of record) by foreign persons. If levels of foreign ownership set forth in our certificate of incorporation are exceeded, we have the right, among other things, to redeem or exchange common stock held by foreign persons, and in certain cases, the applicable redemption price or exchange value may be equal to the lower of fair market value or a foreign person’s purchase price.
Item 6.
Selected Financial Data
Not provided as a smaller reporting company as defined in Rule 12b-2 of the Exchange Act.
36
Item 7.
Management’s Discussion and Analysis of Financial Condition and Results of Operations
The following discussion should be read in conjunction with, and is qualified in its entirety by reference to, the consolidated financial statements and related notes appearing elsewhere in this report.
Overview
Centrus Energy Corp., a Delaware corporation (“Centrus” or the “Company”), is a trusted supplier of nuclear fuel and services for the nuclear power industry. References to “Centrus”, the “Company”, or “we” include Centrus Energy Corp. and its wholly owned subsidiaries as well as the predecessor to Centrus, unless the context otherwise indicates.
Centrus operates two business segments: low-enriched uranium (“LEU”), which supplies various components of nuclear fuel to utilities, and contract services, which provides advanced engineering, design, and manufacturing services to government and private sector customers.
Our LEU segment involves the sale of low-enriched uranium, its components, and natural uranium to utilities operating commercial nuclear power plants. LEU is a critical component in the production of nuclear fuel for reactors that produce electricity. We supply LEU to both domestic and international utilities for use in nuclear reactors worldwide. We provide LEU from multiple sources including our inventory, medium- and long- term supply contracts and spot purchases. As a long-term supplier of LEU to our customers, our objective is to provide value through the reliability and diversity of our supply sources. Our long-term goal is to resume commercial enrichment production, and we are exploring approaches to that end.
Our contract services segment utilizes the unique technical expertise, operational experience and specialized facilities that we developed over nearly two decades as part of our uranium enrichment technology program. We are leveraging these capabilities to expand and diversify our business, offering new services to existing and new customers in complementary markets.
With the specialized capabilities and workforce at our Technology and Manufacturing Center in Oak Ridge, Tennessee, we are performing technical, engineering and manufacturing services for a range of commercial and government customers and actively working to secure new customers. Our experience developing, licensing and manufacturing advanced nuclear fuels and technologies positions us to provide critical design, engineering, manufacturing and other services to a broad range of potential clients, including those involving sensitive or classified technologies. This work includes design, engineering, manufacturing and licensing services support for advanced reactor and fuel fabrication projects. Based on our experience at our uranium enrichment facilities, we are also performing decontamination and decommissioning (“D&D”) work for the U.S. government in Oak Ridge, Tennessee.
With several decades of experience in enrichment, we also continue to be a leader in the development of an advanced U.S. uranium enrichment technology, which we believe could play a critical role in supplying fuel for advanced reactors, meeting U.S. national and energy security needs, and achieving our nation’s nonproliferation objectives. To support U.S. energy and national security, we have been performing research and demonstration work on our advanced gas centrifuge uranium enrichment technology through contracts with UT-Battelle, LLC (“UT-Battelle”), the management and operating contractor of Oak Ridge National Laboratory (“ORNL”) for the United States Department of Energy (“DOE”).
37
On January 7, 2019, DOE issued a Notice of Intent to contract with Centrus to deploy a cascade of centrifuges to demonstrate the ability to produce high assay, low-enriched uranium (“HALEU”), suitable for a range of military and civilian applications. While existing reactors currently in operation typically operate on LEU enriched so that the uranium-235 isotope concentration is just below 5%, HALEU has a uranium-235 concentration of up to 20%. HALEU is not commercially available today, but may be required in the future for a number of advanced reactor designs currently under development, for DOE nonproliferation efforts, or for some advanced fuel designs that may be suitable in the future for existing reactors. There are no guarantees about whether or when government or commercial demand for HALEU will materialize, and there are a number of technical, regulatory and economic hurdles that must be overcome for these fuels and reactors to come to the market. Additionally, while Centrus has begun contract discussions with DOE about the proposed demonstration project, there is no assurance that a contract will be executed or that the project will go forward.
The nuclear industry in general, and the nuclear fuel industry in particular, is in a period of significant change, which continues to affect the competitive landscape. In the seven years following the 2011 Fukushima accident, the published market prices for uranium enrichment declined more than 75 percent. While the monthly price indicators have gradually increased starting in September 2018, the uranium enrichment segment of the nuclear fuel market remains oversupplied and faces uncertainty about future demand for nuclear power generation. Changes in the competitive landscape affect pricing trends, change customer spending patterns, and create uncertainty. To address these changes, we have taken steps to adjust our cost structure and may seek further adjustments to our cost structure and operations and to evaluate opportunities to grow our business organically or through acquisitions and other strategic transactions.
We are also actively considering, and expect to consider from time to time in the future, potential strategic transactions, which could involve, without limitation, acquisitions and/or dispositions of businesses or assets, joint ventures or investments in businesses, products or technologies. In connection with any such transaction, we may seek additional debt or equity financing, contribute or dispose of assets, assume additional indebtedness, or partner with other parties to consummate a transaction.
Refer to Part I, Item 1,
Business
, for additional information.
Market Conditions and Outlook
In March 2011, an earthquake and tsunami caused irreparable damage to four reactors in Fukushima, Japan. As a consequence, approximately 60 reactors in Japan and Germany were taken offline, and other countries curtailed or slowed their construction of new reactors or accelerated their retirement of existing plants. While some reactors in Japan have restarted and many are expected to restart within the next few years, supply and demand dynamics for nuclear fuel continue to be depressed. In addition, low natural gas prices and an increase in outputs from renewable sources have put financial pressure on some reactor operators in the United States; six reactors have been shut down in recent years and several more face the prospect of premature shut down in the next few years. The United States remains the largest market in the world for nuclear fuel, with 98 commercial reactors in operation today.
Although the market for the uranium enrichment sector for nuclear fuel is expected to remain oversupplied for the remainder of this decade and into the 2020s, the market is expected to grow as the nuclear power industry expands around the world. According to the World Nuclear Association (“WNA”), there are 55 reactors under construction and 126 firmly planned around the world, compared to 450 currently in operation. This includes growth in China, Russia, and India. The new reactor builds will have the potential to improve market conditions in the long-term.
38
The enrichment component of LEU is
typically bought and sold under long-term contracts with deliveries over several years.
The Company’s agreements for natural uranium sales are generally shorter-term, fixed-commitment contracts. As of December 31, 2018,
our order book of sales under contract
in the LEU segment was $1.0 billion. While new sales booked in recent years reflect the historically low prices prevalent in today’s market, certain contracts included in the order book have sales prices that are significantly above current market prices. We estimate that approximately 4% of our order book as of December 31, 2018, is at risk related to customer financial conditions or operations.
Revenue
We have two reportable segments: the LEU segment and the contract services segment.
Revenue from our LEU segment is derived primarily from:
|
•
|
sales of the SWU component of LEU;
|
|
•
|
sales of both the SWU and uranium components of LEU; and
|
|
•
|
sales of natural uranium.
|
Our contract services segment reflects our technical, manufacturing and engineering services offered to public and private sector customers, including engineering and testing activities as well as technical and resource support currently being performed by the Company.
SWU and Uranium Sales
Revenue from our LEU segment accounted for approximately 85% of our total revenue in 2018. The majority of our customers are domestic and international utilities that operate nuclear power plants, with international sales constituting approximately 31% of revenue from our LEU segment in recent years. Our agreements with electric utilities are primarily long-term, fixed-commitment contracts under which our customers are obligated to purchase a specified quantity of the SWU component of LEU (or the SWU and uranium components of LEU) from us. Our agreements for natural uranium sales are generally shorter-term, fixed-commitment contracts.
Our revenues, operating results and cash flows can fluctuate significantly from quarter to quarter and year to year. Revenue is recognized at the time LEU or uranium is delivered under the terms of our contracts. The timing of customer demand is affected by, among other things, electricity markets, reactor operations, maintenance and refueling outages, and customer inventories. In the current market environment, some customers are building inventories and may choose to take deliveries under annual purchase obligations later in the year. Customer payments for the SWU component of LEU average roughly $10 million per order. As a result, a relatively small change in the timing of customer orders for LEU may cause significant variability in operating results.
Utility customers in general have the option to defer receipt of LEU or uranium purchased from Centrus beyond the contractual sale period, resulting in the deferral of costs and revenue recognition. Refer to
Note 2, Revenue and Contracts with Customers,
in the consolidated financial statements for further details.
Our financial performance over time can be significantly affected by changes in prices for SWU and uranium. Since 2011, market prices for SWU and uranium have significantly declined. Since our sales order book includes contracts awarded to us in previous years, the average SWU price billed to customers typically lags behind published price indicators by several years, which means that average prices under contract today exceed current market prices. The long-term SWU price indicator, as published by TradeTech, LLC in
Nuclear Market Review
, is an indication of base-year prices under new long-term enrichment contracts in our primary markets. The following chart summarizes TradeTech’s long-term and spot SWU price indicators, the long-term price for natural uranium hexafluoride (“UF6”), as calculated by Centrus using indicators published in
Nuclear Market Review
, and TradeTech’s spot price indicator for UF6:
39
SWU and Uranium Market Price Indicators*
SEVEN-YEAR VIEW
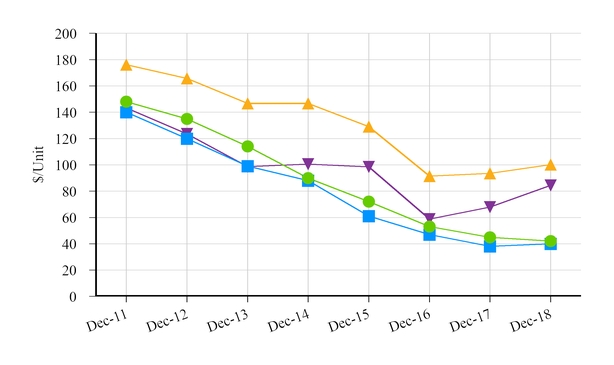
TWO-YEAR MONTHLY VIEW
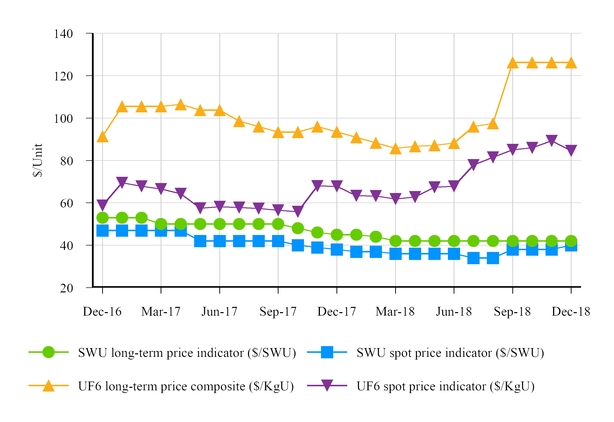
* Source:
Nuclear Market Review
, a TradeTech publication, www.uranium.com
40
Our contracts with customers are primarily denominated in U.S. dollars, and although revenue has not been directly affected by changes in the foreign exchange rate of the U.S. dollar, we may have a competitive price advantage or disadvantage obtaining new contracts in a competitive bidding process depending upon the weakness or strength of the U.S. dollar. Costs of our primary competitors are denominated in other currencies. Our contracts with suppliers have historically been denominated in U.S. dollars. In April 2018, we entered into an agreement with Orano Cycle (formerly, AREVA NC) (“Orano”) for the long-term supply of SWU. We may elect to begin deliveries as early as 2021. Purchases will be payable in a combination of U.S dollars and euros and we may be subject to exchange rate risk for the portion of purchases payable in euros.
On occasion, we will accept payment in the form of uranium. Revenue from the sale of SWU under such contracts is recognized at the time LEU is delivered and is based on the fair value of the uranium at contract inception, or as the quantity of uranium is finalized, if variable.
Cost of sales for SWU and uranium is based on the amount of SWU and uranium sold and delivered during the period and unit inventory costs. Unit inventory costs are determined using the average cost method. Changes in purchase costs have an effect on inventory costs and cost of sales over current and future periods. Cost of sales includes costs for inventory management at off-site licensed locations. Cost of sales also includes certain legacy costs related to former employees of the Portsmouth and Paducah Gaseous Diffusion Plants.
Contract Services
Our contract services segment reflects our technical, manufacturing, and engineering services offered to public and private sector customers, including the American Centrifuge engineering and testing activities we have performed as a contractor for UT-Battelle. With our private sector customers, we seek to leverage our domestic enrichment experience, engineering know-how, and precision manufacturing facility to assist customers with a range of engineering, design, and advanced manufacturing projects including the production of fuel for next-generation nuclear reactors and the development of related facilities.
Government Contracting
We have a long record as a global leader in advanced technology, manufacturing and engineering. Our manufacturing, engineering and testing facilities and our highly-trained workforce are deeply engaged in advancing the next generation of uranium enrichment technology. We are exploring a number of options for returning to domestic production in the future.
Our government contracts with UT-Battelle have provided for engineering and testing work on the American Centrifuge technology at our facilities in Oak Ridge, Tennessee. Our recently completed contract with UT-Battelle was for the period from October 1, 2017, through September 30, 2018, and generated total revenue of approximately $16.0 million upon completion of defined milestones. These contracts have been funded incrementally. Funding for the American Centrifuge program was provided to UT-Battelle by the federal government. Our previous contract with UT-Battelle was for the period from October 1, 2016, through September 30, 2017, and generated revenue of approximately $25.0 million. Although the most recent contract expired September 30, 2018, we continue to perform work towards the expected milestones as the parties work toward a successor agreement. However, we have no assurance that a successor agreement will be executed.
On September 27, 2018, we leveraged our D&D experience and entered into an agreement with DOE to D&D the K-1600 facility of DOE located at the East Tennessee Technology Park. Under the terms of the agreement, pursuant to a work authorization under our lease with DOE, we will remove and dispose of government owned materials and equipment in order to render the facility non-contaminated and unclassified. The work to be performed is expected to be completed by September 30, 2019. The contract is a cost-plus fixed fee contract totaling approximately $15 million. The contract is incrementally funded and subject to appropriations by the federal government.
41
In addition, we have entered into other contracts with DOE, other agencies and their contractors to provide engineering, design and manufacturing services.
American Centrifuge expenses that are outside of our work for UT-Battelle are included in
Advanced Technology License and Decommissioning Costs
on the consolidated statement of operations, including ongoing costs for work related to the U.S. Nuclear Regulatory Commission (“NRC”) license and the DOE lease for the Piketon facility. The lease expires on June 30, 2019, absent any mutual agreement between us and DOE regarding other possible uses for the Piketon facility such as deploying a demonstration cascade for HALEU production. Centrus commenced the D&D of the Piketon demonstration facility in 2016, and we believe the D&D work required under NRC license requirements has been completed. As of December 31, 2018, we have remaining accrued liabilities of $1.6 million for lease turnover obligations and $3.2 million for termination benefits related to the Piketon facility. In addition, we anticipate incurring expenses of approximately $6 million in the first half of 2019 to continue to maintain the lease facilities in accordance with the lease.
Commercial Contracting
On March 26, 2018, we entered into a services agreement with X Energy, LLC (“X-energy”). Under the terms of the services agreement, we provided (i) technical and resource support to X-energy for criticality safety evaluation of processing equipment, design of fresh fuel transport packages, and conceptual mock-up of a nuclear fuel production facility and (ii) non-cash in-kind contributions to X-energy subject to a cooperative agreement between X-energy and the U.S. government. The technical and resource support provided by us to X-energy was performed pursuant to separate task orders issued under and pursuant to the services agreement. The initial task orders ran through December 31, 2018. Depending upon the pricing outlined in the task orders, payment for work performed by us pursuant to the services agreement was either fixed price based or time-and-materials based. The initial task orders in 2018 provided for time-and-materials based pricing with payments to us totaling approximately $4.4 million. In addition, we contributed non-cash in-kind contributions with a value of approximately $2.5 million.
On November 29, 2018, we entered into a second services agreement with X-energy. Under the terms of the second services agreement, we will provide (i) technical and resource support to the design and license application development of X-energy’s nuclear fuel production facility and (ii) non-cash in-kind contributions to X-energy subject to a cooperative agreement between X-energy and the United States government. The technical and resource support provided by us to X-energy will be performed pursuant to separate task orders issued under and pursuant to the second services agreement. The initial task orders run through September 30, 2019 with deliverables to be completed through November 30, 2019. The awarding of any additional task orders to us will be dependent upon the receipt of additional funding. Depending upon the pricing outlined in the task orders, payment for work performed by us pursuant to the services agreement will either be fixed-price based or time-and-materials based. The initial task orders provide for time-and-materials based pricing with payments to be made to us totaling approximately $4.2 million. In addition, we have agreed to provide non-cash in-kind contributions with a value of approximately $2.4 million.
In addition, we have entered into other contracts for the engineering, design, and advanced manufacturing services with other commercial entities.
Prior Site Services Work
We formerly performed sites services work under contracts with DOE and its contractors at the former Portsmouth and Paducah Gaseous Diffusion Plants. On January 11, 2018, we entered into a settlement agreement with DOE and the U.S. government regarding breach of contract claims relating to this work. Refer to
Note 2, Revenue and Contracts with Customers.
42
The Company and DOE have yet to fully settle the Company’s claims for reimbursements for certain pension and postretirement benefits costs related to past contract work performed at the Portsmouth and Paducah plant sites. There is the potential for additional revenue to be recognized for this work pending the outcome of legal proceedings related to the Company’s claims for payment and the potential release of previously established valuation allowances on receivables. Refer to Part I, Item 3,
Legal Proceedings,
for additional information.
2019 Outlook
We anticipate 2019 SWU and uranium revenue to be in the range of $85 million to $120 million and total revenue to be in a range of $125 million to $160 million. Consistent with prior years, revenue continues to be most heavily weighted to the second half of the year. We expect to end 2019 with a cash and cash equivalents balance in a range of $120 million to $140 million.
Our financial guidance is subject to a number of assumptions and uncertainties that could affect results either positively or negatively. Variations from our expectations could cause differences between our guidance and our ultimate results. Among the factors that could affect our results are:
|
•
|
Additional purchases or sales of SWU and uranium;
|
|
•
|
Conditions in the LEU and energy markets, including pricing, demand, operations, and regulations
|
|
•
|
Timing of customer orders, related deliveries, and purchases of LEU or components;
|
|
•
|
Timing of execution of letter agreement for HALEU and terms established in a definitized contract;
|
|
•
|
Financial market conditions and other factors that may affect pension and benefit liabilities and the value of related assets
|
|
•
|
The outcome of legal proceedings and other contingencies;
|
|
•
|
Potential use of cash for strategic initiatives;
|
|
•
|
Actions taken by customers, including actions that might affect existing contracts, as a result of market and other conditions impacting Centrus’ customers and the industry; and
|
|
•
|
Timing of return of cash collateral supporting financial assurance for the Piketon facility.
|
See also
“Forward Looking Statements
” earlier in this report for additional information.
Critical Accounting Policies and Estimates
Our significant accounting policies are summarized in
Note 1, Summary of Significant Accounting Policies
, of our consolidated financial statements, which were prepared in accordance with generally accepted accounting principles.
Generally accepted accounting principles and related accounting pronouncements, implementation guidelines and interpretations with regard to a wide range of matters that are relevant to our business are complex and involve many subjective assumptions, estimates and judgments that are, by their nature, subject to substantial risks and uncertainties.
Critical accounting estimates are those that require management to make assumptions about matters that are uncertain at the time the estimate is made and for which different estimates, often based on complex judgments, probabilities and assumptions that we believe to be reasonable, but are inherently uncertain and unpredictable, could have a material impact on our operating results and financial condition. It is also possible that other professionals, applying their own judgment to the same facts and circumstances, could develop and support a range of alternative estimated amounts. We are also subject to risks and uncertainties that may cause actual results to differ from estimated amounts, such as the healthcare environment, legislation and regulation. Additionally, c
hanges in accounting rules or their interpretation could significantly affect our results of operations and financial condition.
43
The sensitivity analyses used below are not intended to provide a reader with our predictions of the variability of the estimates used. Rather, the sensitivities used are included to allow the reader to understand a general cause and effect of changes in estimates.
We have identified the following to be our critical accounting estimates:
Asset Valuations
The accounting for SWU and uranium inventories includes estimates and judgments. SWU and uranium inventory costs are determined using the average cost method.
Inventories of SWU and uranium are valued at the lower of cost or net realizable value (“NRV”). NRV is the estimated selling price in the ordinary course of business less reasonably predictable costs of completion, disposal, and transportation. The estimated selling price for SWU and uranium is based on the pricing terms of contracts in our sales order book, and, for uranium not under contract, the estimated selling price is based primarily on published price indicators at the balance sheet date.
Intangible assets originated from our reorganization and application of fresh start accounting as of September 30, 2014. The intangible assets represented the fair value adjustment to the assets and liabilities for our LEU segment. The identifiable intangible assets relate to our order book and customer relationships. The order book intangible asset is amortized as the order book valued at emergence is reduced, principally as a result of deliveries to customers. The customer relationships intangible asset is amortized using the straight-line method over the estimated average useful life of 15 years. The aggregate net balance of identifiable intangible assets was $76.0 million as of December 31, 2018.
The carrying values of the intangible assets are subject to impairment tests whenever events or changes in business circumstances indicate that the carrying amount of the intangible assets may not be fully recoverable. The carrying amount of a long-lived asset is not recoverable if it exceeds the sum of the undiscounted cash flows expected to result from the use and eventual disposition of the asset. An impairment loss is measured as the amount by which the carrying amount of a long-lived asset, or asset group exceeds its fair value.
Inherent in our fair value determinations are certain judgments and estimates, including projections of future cash flows, the discount rate reflecting the risk inherent in future cash flows, the interpretation of current economic indicators and market valuations, and strategic plans with regard to operations. A change in these underlying assumptions would cause a change in the results of the tests, which could cause the fair value of the intangible asset to be less than its respective carrying amount.
Pension and Postretirement Health and Life Benefit Costs and Obligations
We provide retirement benefits to certain employees and retirees under defined benefit pension plans and postretirement health and life benefit plans. The valuation of benefit obligations and costs is based on provisions of the plans and actuarial assumptions that involve judgments and estimates.
Assets and obligations related to our retiree benefit plans are remeasured each year as of the balance sheet date resulting in differences between actual and projected results for the year. The Company has elected the accounting option to recognize these actuarial gains and losses in the statement of operations in the fourth quarter. The alternative would be to amortize gains and losses into operating results over time. The Company’s treatment of recognizing
actuarial
gains and losses immediately is intended to increase transparency into how movements in plan assets and benefit obligations impact financial results.
Immediate recognition of such gains and losses in the statement of operations may cause significant fluctuations in our results of operations.
In addition, an interim remeasurement and recognition of gains or losses may be required for a plan during the year if lump sum payments exceed certain levels.
44
Effective January 1, 2018, a new accounting standard requires components of retirement benefit expense/income other than service cost to be presented below the subtotal for operating income (loss), and are presented in our consolidated statement of operations as
Nonoperating Components of Net Periodic Benefit Expense (Income)
. Service cost continues to be recognized in
Cost of Sales
for the LEU segment and to
Selling, General and Administrative
expense. For the year ended December 31, 2017, components of retirement benefit expense/income other than service cost were reclassified from
Cost of Sales
in the LEU segment and
Selling, General and Administrative
expense to conform with the current presentation.
We recognized $17.3 million of net actuarial losses in 2018 compared to net actuarial gains of $25.8 million in 2017 related to our retiree benefit plans. In 2018, major U.S. stock indices posted their largest annual losses since 2008. The net loss in 2018 reflects unfavorable investment returns relative to the expected return assumption, partially offset by increases in market interest rates, changes in mortality and healthcare claim assumptions, and favorable claims experience. In 2017, the net gain reflects favorable investment returns relative to the expected return assumption, changes in mortality and healthcare claim assumptions, and favorable claims experience, partially offset by declines in market interest rates and changes in retiree benefits. The changes in retiree benefits as of December 31, 2017, are not treated as prior service cost as they are attributed to a settlement with a collective bargaining unit and are recognized in
Nonoperating Components of Net Periodic Benefit Expense (Income)
in 2017. Refer to
Note 11, Pension and Postretirement Health and Life Benefits
, of the consolidated financial statements.
Changes in actuarial assumptions could impact the measurement of benefit obligations and benefit costs, as follows:
|
•
|
The expected return on benefit plan assets is approximately 6.8% for 2019. The expected return is based on historical returns and expectations of future returns for the composition of the plans’ equity and debt securities. A one-half percentage point decrease in the expected return on plan assets would increase annual pension costs by $2.6 million in 2019. However, the net impact of any changes in the expected return on benefit plan assets on the final benefit cost recognized for fiscal year 2019 would be $0 since the actual return on assets would effectively be reflected at December 31, 2019, under our mark-to-market accounting methodology.
|
|
•
|
The present value of pension obligations is calculated by discounting long-term obligations using a market interest rate. This discount rate is the estimated rate at which the benefit obligations could be effectively settled on the measurement date and is based on yields of high quality fixed income investments whose cash flows match the timing and amount of expected benefit payments of the plan.
Discount rates of approximately 4.3% were used as of December 31, 2018. A one-half percentage point reduction in the discount rate would increase the valuation of pension benefit obligations by $41.2 million and postretirement health and life benefit obligations by $2.6 million, and the resulting changes in the valuations would decrease the service cost and interest cost components of annual pension costs and postretirement health and life benefit costs by $2.5 million and $0.1 million, respectively.
|
|
•
|
The healthcare costs trend rates are 6.0% projected in 2019 reducing to a final trend rate of 5% by 2021. The healthcare costs trend rate represents our estimate of the annual rate of increase in the gross cost of providing benefits. The trend rate is a reflection of health care inflation assumptions, changes in healthcare utilization and delivery patterns, technological advances, and changes in the health status of our plan participants. A one-percentage point increase in the healthcare cost trend rates would increase postretirement health benefit obligations by about $2.9 million and would increase the service cost and interest cost components of annual benefit costs by about $0.1 million.
|
In December 2012, we invoiced DOE for $42.8 million, representing its share of pension and postretirement benefits costs related to the transition of Portsmouth site employees to DOE’s D&D contractor, as permitted by CAS and based on CAS calculation methodology.
DOE has denied our claim, and Centrus filed a complaint with the U.S. Court of Federal Claims in January 2015. There is no assurance we will be successful in our appeal, and w
e have not recognized revenue or a receivable due to
uncertainty regarding the amounts owed and the timing of collection. The parties are engaged in settlement discussions, and further action on the case is stayed pending the outcome of
45
such discussions. Refer to Part I, Item 3,
Legal Proceedings,
for additional information.
Income Taxes
During the ordinary course of business, there are transactions and calculations for which the ultimate tax determination is uncertain. As a result, we recognize tax liabilities based on estimates of whether additional taxes and interest will be due. To the extent that the final tax outcome of these matters is different than the amounts that were initially recorded, such differences will impact the income tax provision in the period in which such determination is made.
Accounting standards prescribe a minimum recognition threshold that a tax position is required to meet before the related tax benefit may be recognized in the financial statements. As of December 31, 2018, the liability for unrecognized tax benefits, included in
Other Long-Term Liabilities
, was $0.2 million and accrued interest and penalties totaled less than $0.1 million.
Accounting for income taxes involves estimates and judgments relating to the tax bases of assets and liabilities and the future recoverability of deferred tax assets. In assessing the realization of deferred tax assets, we determine whether it is more likely than not that the deferred tax assets will be realized. The ultimate realization of deferred tax assets is dependent upon generating sufficient taxable income in future years when deferred tax assets are recoverable or are expected to reverse. Factors that may affect estimates of future taxable income include, but are not limited to, competition, changes in revenue, costs or profit margins, market share and developments related to the American Centrifuge technology. In practice, positive and negative evidence is reviewed with objective evidence receiving greater weight. If, based on the weight of available evidence, it is more likely than not that all, or some portion, of the deferred tax assets will not be realized, we record a valuation allowance. The more negative evidence that exists, the more positive evidence is necessary and the more difficult it is to support a conclusion that a valuation allowance is not needed for all, or some portion, of the deferred tax assets. A cumulative loss in recent years is a significant piece of negative evidence and one of the most difficult forms of negative evidence to overcome.
We have incurred cumulative operating losses since 2011.
Our inability to overcome the strong negative objective evidence of a cumulative loss in recent years with sufficient objective positive evidence of future taxable income to realize our deferred tax assets required us to record a valuation allowance. To determine the amount of the valuation allowance, all sources of taxable income, including tax planning strategies, were analyzed. We determined that it is more likely than not that our net deferred tax assets will not be realized in the immediate future. A full valuation allowance was first recorded in the fourth quarter of 2011 for the net deferred tax asset created by the expensing of previously capitalized costs related to a number of earlier centrifuge machines used in the demonstration cascade test program, as well as all other previously recorded net deferred tax assets, including state deferred taxes. As of December 31, 2018, the valuation allowance against net deferred taxes was $456.6 million.
The valuation allowance results in our inability to record tax benefits on future losses until we generate sufficient taxable income to support the elimination of the valuation allowance. However, the valuation allowance will not affect the Company’s ability to use its deferred tax assets if it generates taxable income in the future.
In connection with the 2014 bankruptcy plan, tax attributes, such as net operating losses (“NOLs”), tax credits, and tax basis in property have been reduced. When tax attributes are reduced, deferred taxes related to the tax attributes and the corresponding valuation allowance are adjusted.
Management will reassess the realization of the deferred tax assets each reporting period. To the extent that the financial results improve and the deferred tax assets become realizable, we will reduce the valuation allowance accordingly.
The
Tax Cut and Jobs Act of 2017 (the “Tax Act”) contains several significant changes to the Internal Revenue Code of 1986, as amended (the “Code”). The change in tax law required us to remeasure existing net deferred tax assets resulting in a 2017 deferred income tax expense of $288.9 million, fully offset by a valuation allowance and no net impact to the income tax provision for the year.
46
The following provisions in the Tax Act impact our federal income taxes starting in 2018:
|
•
|
The federal corporate income tax rate is 21%;
|
|
•
|
Federal NOLs originating after 2017 are limited to 80% of taxable income computed without regard to the NOL deduction and will have an indefinite carryforward period;
|
|
•
|
The deduction for business interest expense is limited to 1) business interest income, plus 2) 30% of the taxpayer’s taxable income without regard to net interest expense, depreciation and amortization, and the NOL deduction. Any business interest expense that is not deductible can be carried forward indefinitely and is treated as an item of pre-change loss subject to the annual limitation under Section 382 of the Code if there is an ownership change; and
|
|
•
|
Revenue associated with advanced payments is accelerated.
|
Based on our available NOLs, the impact to our federal income taxes is currently not material. However, if we have a tax ownership change under Section 382 of the Code, our ability to utilize existing NOLs will be significantly limited.
47
Results of Operations
Overview
Declining prices in the enrichment market - which reached a historic low in August - were the biggest driver in our losses for the year. A greater proportion of our sales in 2018 were made under contracts signed since market prices began to fall, both because of the natural evolution of our order book and because of the specific deliveries made during the year, but our cost of sales in 2018 - which is calculated on a rolling average - was still based on legacy prices that predated the fall. While spot market prices have risen more than 25 percent since August, our supply costs are lower starting in 2019 due to the price adjustment in our Russian supply agreement as well as other low-cost supply we have secured. Centrus anticipates a return to profitability in 2020 as the impact of lower supply costs become more fully reflected in our results.
Basis of Presentation
On January 1, 2018, we adopted several new accounting standards and certain prior period amounts have been recast to conform with the current presentation. For the adoption of the new revenue standard using the modified retrospective method, results for reporting periods beginning after January 1, 2018, are presented under the new guidance, while prior period amounts are not adjusted and continue to be reported in accordance with the previous guidance. Refer to
Note 1, Summary of Significant Accounting Policies,
to the consolidated financial statements for further details.
Segment Information
The following table presents elements of the accompanying consolidated statements of operations that are categorized by segment (dollar amounts in millions):
|
Year Ended December 31,
|
||||||||||||||
|
|
2018
|
2017
|
$ Change
|
% Change
|
||||||||||
|
LEU segment
|
|
|
||||||||||||
|
Revenue:
|
|
|
||||||||||||
|
SWU revenue
|
$
|
130.6
|
|
$
|
195.4
|
|
$
|
(64.8
|
)
|
(33
|
)%
|
|||
|
Uranium revenue
|
33.8
|
|
—
|
|
33.8
|
|
–
|
|
||||||
|
Total
|
164.4
|
|
195.4
|
|
(31.0
|
)
|
(16
|
)%
|
||||||
|
Cost of sales
|
187.7
|
|
162.7
|
|
(25.0
|
)
|
(15
|
)%
|
||||||
|
Gross profit (loss)
|
$
|
(23.3
|
)
|
$
|
32.7
|
|
$
|
(56.0
|
)
|
|||||
|
Contract services segment
|
|
|
|
|
||||||||||
|
Revenue
|
$
|
28.6
|
|
$
|
23.0
|
|
$
|
5.6
|
|
24
|
%
|
|||
|
Cost of sales
|
23.2
|
|
25.5
|
|
2.3
|
|
9
|
%
|
||||||
|
Gross profit (loss)
|
$
|
5.4
|
|
$
|
(2.5
|
)
|
$
|
7.9
|
|
|||||
|
Total
|
|
|
|
|
||||||||||
|
Revenue
|
$
|
193.0
|
|
$
|
218.4
|
|
$
|
(25.4
|
)
|
(12
|
)%
|
|||
|
Cost of sales
|
210.9
|
|
188.2
|
|
(22.7
|
)
|
(12
|
)%
|
||||||
|
Gross profit (loss)
|
$
|
(17.9
|
)
|
$
|
30.2
|
|
$
|
(48.1
|
)
|
|||||
48
Revenue
Revenue from the LEU segment declined $31.0 million (or 16%) in 2018 compared to 2017. Revenue for 2018 included uranium revenue of $33.8 million, with no uranium revenue in the corresponding prior period. The volume of SWU sales increased 24% primarily due to increased short-term sales and the variability in timing of utility customer orders. The average price billed to customers for sales of SWU declined 46% primarily reflecting the trend of lower SWU market prices in recent years and the particular contracts under which SWU were sold during the periods.
Revenue from the Contract Service segment increased $5.6 million (or 24%) in 2018 compared to 2017 primarily reflecting services provided under the X-energy contract beginning in the second quarter of 2018, partially offset by the reduced scope of work under the contract with UT-Battelle in 2018. The increase in 2018 also reflects $9.5 million of revenue related to the January 2018 settlement with DOE related to past work performed.
Cost of Sales
Cost of sales for the LEU segment increased $25.0 million (or 15%) in 2018 compared to 2017, primarily reflecting changes in SWU and uranium sales volumes, partially offset by a decline in the average cost of sales per SWU. In 2018, the average cost of sales per SWU declined approximately 22%. We anticipate our average cost of sales per SWU to decline again in 2019, with further declines in subsequent years, primarily due to lower pricing in new supply contracts and the pricing provisions of existing contracts. Cost of sales includes legacy costs of $3.4 million in each of 2018 and 2017 related to former employees of the Portsmouth and Paducah Gaseous Diffusion Plants.
Cost of sales for the contract services segment declined $2.3 million (or 9%) in 2018 compared to 2017, reflecting the reduced scope of work under the contract with UT-Battelle in 2018, partially offset by costs for services provided under the X-energy contract beginning in the second quarter of 2018.
Gross Profit (Loss)
We realized a gross loss of $17.9 million in 2018, a decline of $48.1 million compared to the gross profit of $30.2 million in 2017. Excluding the $9.5 million of revenue in the current period from the January 2018 settlement with DOE related to past work performed, we realized a gross loss in 2018, of $27.4 million.
The gross loss for the LEU segment was $23.3 million in 2018 compared to a gross profit of $32.7 million in 2017. The decline of $56.0 million was primarily due to the decline in the average price billed to customers for sales of SWU. SWU sales in 2018 reflect a greater concentration of sales made under contracts that reflect lower prices under more recent market conditions.
For the contract services segment, we realized a gross profit of $5.4 million in 2018, including $9.5 million of revenue from the January 2018 settlement with DOE, compared to a gross loss of $2.5 million in 2017. Gross losses are primarily due to costs incurred which are greater than the revenue under the contracts with UT-Battelle and X-energy. We continue to invest in the contract services segment because of the potential for future growth into new areas of business for the company, while also preserving our unique workforce at the Technology and Manufacturing Center in Oak Ridge, Tennessee. Our near-term goal is to make the segment profitable.
49
Non-Segment Information
The following table presents elements of the accompanying consolidated statements of operations that are not categorized by segment (dollar amounts in millions):
|
Year Ended December 31,
|
||||||||||||||
|
|
2018
|
2017
|
$ Change
|
% Change
|
||||||||||
|
Gross profit (loss)
|
$
|
(17.9
|
)
|
30.2
|
|
$
|
(48.1
|
)
|
|
|
||||
|
Advanced technology license and decommissioning costs
|
26.1
|
|
15.7
|
|
(10.4
|
)
|
(66
|
)%
|
||||||
|
Selling, general and administrative
|
39.9
|
|
43.7
|
|
3.8
|
|
9
|
%
|
||||||
|
Amortization of intangible assets
|
6.6
|
|
10.6
|
|
4.0
|
|
38
|
%
|
||||||
|
Special charges for workforce reductions and advisory costs
|
2.2
|
|
9.5
|
|
7.3
|
|
77
|
%
|
||||||
|
Gains on sales of assets
|
(0.3
|
)
|
(4.6
|
)
|
(4.3
|
)
|
(93
|
)%
|
||||||
|
Operating loss
|
(92.4
|
)
|
(44.7
|
)
|
(47.7
|
)
|
107
|
%
|
||||||
|
Gain on early extinguishment of debt
|
(0.5
|
)
|
(33.6
|
)
|
(33.1
|
)
|
(99
|
)%
|
||||||
|
Nonoperating components of net periodic benefit expense (income)
|
10.6
|
|
(27.2
|
)
|
(37.8
|
)
|
139
|
%
|
||||||
|
Interest expense
|
4.1
|
|
5.3
|
|
1.2
|
|
23
|
%
|
||||||
|
Investment income
|
(2.5
|
)
|
(1.3
|
)
|
1.2
|
|
92
|
%
|
||||||
|
Income (loss) before income taxes
|
(104.1
|
)
|
12.1
|
|
(116.2
|
)
|
|
|
||||||
|
Income tax benefit
|
—
|
|
(0.1
|
)
|
(0.1
|
)
|
(100
|
)%
|
||||||
|
Net income (loss)
|
(104.1
|
)
|
12.2
|
|
(116.3
|
)
|
|
|
||||||
|
Preferred stock dividends - undeclared and cumulative
|
7.8
|
|
6.9
|
|
(0.9
|
)
|
(13
|
)%
|
||||||
|
Net income (loss) allocable to common stockholders
|
$
|
(111.9
|
)
|
$
|
5.3
|
|
$
|
(117.2
|
)
|
|
|
|||
Advanced Technology License and Decommissioning Costs
Advanced technology license and decommissioning costs consist of American Centrifuge expenses that are outside of our customer contracts in the contract services segment, including ongoing costs for work at the Piketon facility. Costs increased $10.4 million (or 66%) in 2018 compared to 2017. In the current period, efforts at the Piketon facility were focused on supporting NRC requirements, including working towards elimination of the required financial assurance, and DOE lease turnover activities and the related costs were charged to expense. In addition, a greater allocation of Piketon facility costs was charged to advanced technology license and decommissioning costs in the current period following the relocation of certain corporate functions from the Piketon facility. In the prior period, efforts were primarily focused on D&D of the Piketon facility, and the related costs were recorded as a reduction of the D&D liability. A credit of $5.9 million to advanced technology license and decommissioning costs was recognized in the fourth quarter of 2017 as a result of completing the D&D work using primarily internal resources and less contractor support as well as efficiencies achieved.
Selling, General and Administrative
Selling, general and administrative (“SG&A”) expenses declined $3.8 million (or 9%) in 2018 compared to 2017. Overhead allocated to SG&A expenses declined $2.4 million in 2018, following the relocation of certain corporate functions from the Piketon facility and compensation and benefits declined $0.8 million in 2018. These decreases were partially offset by an increase in consulting costs of $0.6 million in 2018, primarily for work related to business development.
50
Amortization of Intangible Assets
Amortization expense for the intangible asset related to the September 2014 sales order book is a function of SWU sales volume under that order book, which declined to $6.6 million in 2018 from $10.6 million in 2017. Amortization expense for the intangible asset related to customer relationships is amortized on a straight-line basis.
Special Charges for Workforce Reductions and Advisory Costs
Special charges were $2.2 million in 2018, compared to $9.5 million in 2017, a decline of $7.3 million (or 77%). Special charges in 2018 consisted of estimated employee termination benefits of $2.1 million and advisory costs related to updating the Company’s information technology systems of $0.1 million. Special charges for 2017 included estimated employee termination benefits of $3.5 million, less $0.3 million for unvested employee departures and advisory costs of $6.3 million.
Gain on Early Extinguishment of Debt
In the fourth quarter of 2018, we recognized a gain of $0.5 million related to the exchange of securities and cash on December 6, 2018 related to the early extinguishment of $6.3 million of the 8% PIK Toggle Notes.
In the first quarter of 2017, we recognized a gain of $33.6 million related to the exchange of securities and cash on February 14, 2017, which is net of transaction costs of $9.0 million and previously deferred issuance costs related to the 8% PIK Toggle Notes of $0.4 million. Refer to
Note 9, Debt,
of the consolidated financial statements.
Nonoperating Components of Net Periodic Benefit Expense (Income)
Effective January 1, 2018, a new accounting standard requires components of retirement benefit expense/income other than service cost to be presented below the subtotal for operating income (loss). For the year ended December 31, 2017, $26.6 million of income was reclassified from Cost of Sales in the LEU segment and $0.6 million of income was reclassified from SG&A to conform with the current presentation.
In 2018, major U.S. stock indices posted their largest annual losses since 2008. The net expense in 2018 reflects unfavorable investment returns relative to the expected return assumption, partially offset by increases in market interest rates, changes in mortality and healthcare claim assumptions, and favorable claims experience. In 2017, the net gain reflects favorable investment returns relative to the expected return assumption, changes in mortality and healthcare claim assumptions, and favorable claims experience, partially offset by declines in market interest rates and changes in retiree benefits.
Interest Expense
Interest expense declined $1.2 million (or 23%) in 2018, compared to 2017, primarily as a result of the decrease in the outstanding debt balance and the early extinguishment of $6.3 million of the outstanding principal amount of the 8% PIK Toggle Notes on December 6, 2018. No interest expense is recognized on the 8.25% Notes as described in
Note 9, Debt
, of the consolidated financial statements.
Income Tax Benefit
The income tax benefit was less than $0.1 million in 2018 and $0.1 million in 2017, respectively. The income tax benefit in both 2018 and 2017 consists mainly of discrete items for reversals of previously accrued amounts associated with liabilities for unrecognized benefits.
51
Net Income (Loss)
Our net loss was $104.1 million in 2018, compared to net income of $12.2 million in 2017. The unfavorable variance of $116.3 million was a result of a $37.8 million unfavorable variance in the nonoperating components of net periodic benefit expense (income), a $48.1 million unfavorable variance in the gross loss ($57.6 million excluding the settlement with DOE), a $33.1 million decrease in the gain from the early extinguishment of debt and a $10.4 million increase in advanced technology license and decommissioning costs. These unfavorable variances were partially offset by a $7.3 million decline in special charges and a $3.8 million decline in SG&A expenses.
Preferred Stock Dividends - Undeclared and Cumulative
Holders of the Series B Preferred Stock are entitled to cumulative dividends of 7.5% per annum of the aggregate liquidation preference at origination of $104.6 million. We did not meet the criteria for a dividend payment obligation for the years ended December 31, 2018 and 2017, and we have not declared, accrued or paid dividends on the Series B Preferred Stock since issuance on February 14, 2017. Dividends on the Series B Preferred Stock are cumulative to the extent not paid at any quarter-end, whether or not declared and whether or not there are assets of the Company legally available for the payment of such dividends in whole or in part. Refer to
Note 15, Stockholders’ Equity,
of the consolidated financial statements
.
Liquidity and Capital Resources
We ended 2018 with a consolidated cash balance of
$123.1 million
. We anticipate having adequate liquidity to support our business operations for at least the next 12 months from the date of this report. Our view of liquidity is dependent on, among other things, our operations and the level of expenditures and government funding for our services contracts and the timing of customer payments. Liquidity requirements for our existing operations are affected primarily by the timing and amount of customer sales and our inventory purchases.
We believe our sales order book in our LEU segment is a source of stability for our liquidity position. Our
sales order book extends to 2030.
Although, based on current market conditions, we see limited uncommitted demand for LEU for the remainder of this decade before an anticipated rise in uncommitted demand in the 2020s, we continue to seek and make additional sales, including sales for delivery during that time period.
Substantially all revenue-generating operations of the Company are conducted at the subsidiary level. Centrus’ principal source of funding for American Centrifuge activities has been provided: (i) under the contract with UT-Battelle for the period October 1, 2017 through September 30, 2018, the operator of ORNL; and (ii) from Centrus’ wholly-owned subsidiary, Enrichment Corp. to Centrus and its 100% indirectly owned subsidiary American Centrifuge Operating, LLC pursuant to two secured intercompany financing notes. The financing obtained from Enrichment Corp. funds American Centrifuge activities pending receipt of payments related to work performed under the contract with UT-Battelle, American Centrifuge costs that are outside the scope of work under the contract with UT-Battelle, including D&D and other costs of the Piketon facility, and general corporate expenses, including cash interest payments on our debt. Although the most recent contract with UT-Battelle expired September 30, 2018, we continue to perform work towards the expected milestones as the parties work toward a successor agreement. However, we have no assurance that a successor agreement will be executed.
Capital expenditures are expected to be insignificant for at least the next 12 months.
In February 2016, Centrus completed a successful three-year demonstration of the American Centrifuge technology at its facility in Piketon, Ohio. U.S. government funding for American Centrifuge since October 2015 is now limited to research and development work at our facilities in Oak Ridge, Tennessee. In the event that funding by the U.S. government is further reduced or discontinued, the American Centrifuge project may be subject to further demobilization, costs, delays and termination. Any such actions may have a material adverse impact on our ability to deploy the American Centrifuge technology and on our liquidity.
52
We have previously provided financial assurance to the NRC for the D&D of the Piketon demonstration facility in the form of surety bonds that are fully cash collateralized by us for $16.3 million. We believe the D&D work required for elimination of financial assurance under NRC license requirements has been completed, and we are working with the NRC to have the surety bonds cancelled, which would permit the Company to receive the cash collateral.
We lease the Piketon facility from DOE. At the conclusion of the lease on June 30, 2019, absent mutual agreement between us and DOE regarding other possible uses for the facility, we are obligated to return the facility to DOE in a condition that meets NRC requirements and in the same condition as the facility was in when it was leased to us (other than due to normal wear and tear). As of December 31, 2018, we have remaining accrued lease turnover obligations of $1.6 million. We have previously provided financial assurance to DOE for the lease turnover obligations in the form of surety bonds that are fully cash collateralized by us for $13.8 million. We expect to receive cash when these surety bonds are reduced and/or cancelled as the Company fulfills its lease turnover obligations.
In addition to remaining lease turnover obligations of $1.6 million and accrued employee termination benefits of $3.2 million related to the Piketon facility, we anticipate incurring expenses of approximately $6 million in the first half of 2019 to continue to maintain the lease facilities in accordance with the lease. If remaining costs related to the Piketon facility are greater than our estimates, then such increased costs could have an adverse impact on our results of operations and liquidity.
The change in cash, cash equivalents and restricted cash from our consolidated statements of cash flows are as follows on a summarized basis (in millions):
|
Year Ended December 31,
|
|||||||
|
|
2018
|
2017
|
|||||
|
Cash used in operating activities
|
$
|
(74.4
|
)
|
$
|
(16.1
|
)
|
|
|
Cash provided by investing activities
|
0.4
|
|
4.2
|
|
|||
|
Cash used in financing activities
|
(11.1
|
)
|
(40.0
|
)
|
|||
|
Decrease in cash, cash equivalents and restricted cash
|
$
|
(85.1
|
)
|
$
|
(51.9
|
)
|
|
Operating Activities
During 2018, net cash used in operating activities was $74.4 million. Sources of cash included the monetization of inventory purchased in prior periods, with inventories declining $61.0 million in 2018. The net reduction of $33.4 million in the SWU purchase payables balance, due to the timing of purchase deliveries, was a significant use of cash in 2018. Uses of cash also included the net loss of $104.1 million in 2018, net of non-cash expenses, and the increase in receivables from utility customers of $15.8 million.
During 2017, net cash used in operating activities was $16.1 million. American Centrifuge expenditures have been a use of cash, including the significant reduction in the D&D obligation. Sources of cash included the monetization of inventory purchased in prior periods, with inventories declining $44.7 million in 2017. The impact is partially offset by the timing of utility customer payments, with utility customer receivables increasing $27.0 million. The net increase of $19.8 million in the SWU purchase payables balance, due to the timing and quantity of purchase deliveries, was a source of cash in 2017. Net income of $12.2 million in 2017, net of non-cash expenses, was a source of cash.
Investing Activities
There were no significant capital expenditures in 2018 and 2017. Sales of unneeded assets and property yielded net proceeds of $0.5 million and $4.7 million in 2018 and 2017, respectively.
53
Financing Activities
On December 6, 2018, Centrus entered into Exchange Agreements (the “Exchange Agreements”) with certain holders of the Company’s outstanding 8% paid-in-kind (“PIK”) toggle notes (the “8% PIK Toggle Notes). Under the terms of the Exchange Agreements, the Company exchanged $6.3 million aggregate principal amount of 8% PIK Toggle Notes for 398,638 shares of Class A Common Stock and approximately $5.1 million in cash, which includes accrued and unpaid interest on the 8% PIK Toggle Notes. The Company recognized a gain on extinguishment of $0.5 million, which is net of transaction costs of less than $0.1 million. Refer to
Note 15, Stockholders’ Equity
for details related to the Common Stock.
In 2018, the $6.1 million payment of interest classified as debt is classified as a financing activity. Refer to
Note 9, Debt,
of the consolidated financial statements regarding the accounting for the 8.25% Notes.
In February 2017, Centrus exchanged $204.9 million principal amount of the Company’s 8% PIK Toggle Notes for $74.3 million principal amount of 8.25% Notes, 104,574 shares of Series B Preferred Stock and $27.6 million of cash. Refer to
Note 9, Debt
of the consolidated financial statements.
Working Capital
The following table summarizes the Company’s working capital (in millions):
|
December 31,
|
|||||||
|
2018
|
2017
|
||||||
|
Cash and cash equivalents
|
$
|
123.1
|
|
$
|
208.8
|
|
|
|
Accounts receivable
|
60.2
|
|
60.2
|
|
|||
|
Inventories, net
|
26.7
|
|
75.2
|
|
|||
|
Deposits for financial assurance
|
30.3
|
|
16.3
|
|
|||
|
Current debt
|
(32.8
|
)
|
(6.1
|
)
|
|||
|
Other current assets and liabilities, net
|
(161.7
|
)
|
(190.9
|
)
|
|||
|
Working capital
|
$
|
45.8
|
|
$
|
163.5
|
|
|
Capital Structure and Financial Resources
Interest on the 8.25% Notes is payable semi-annually in arrears as of February 28 and August 31 based on a 360-day year consisting of twelve 30-day months. The 8.25% Notes are guaranteed on a subordinated and limited basis by, and secured by substantially all assets of, Enrichment Corp. The 8.25% Notes mature on February 28, 2027.
The principal amount of the 8% PIK Toggle Notes is increased by any payment of interest in the form of PIK payments. We have the option to pay up to 5.5% per annum of interest due on the 8% PIK Toggle Notes in the form of PIK payments. The 8% PIK Toggle Notes are guaranteed and secured on a subordinated, conditional, and limited basis by Enrichment Corp. The 8% PIK Toggle Notes mature on September 30, 2019. However, the maturity date can be extended to September 30, 2024, upon the satisfaction of certain funding conditions described in the applicable indenture relating to the funding, under binding agreements, of (i) the American Centrifuge project or (ii) the implementation and deployment of a National Security Train Program utilizing American Centrifuge technology.
Additional terms and conditions of the 8.25% Notes and the 8% PIK Toggle Notes are described in
Note 9, Debt,
of the consolidated financial statements.
54
Holders of the Series B Preferred Stock are entitled to cumulative dividends of 7.5% per annum of the Liquidation Preference. We are obligated to pay cash dividends on our Series B Preferred Stock to the extent dividends are declared by the Board of Directors and certain criteria are met. We have not met these criteria for the periods from issuance through December 31, 2018, and have not declared, accrued or paid dividends on the Series B Preferred Stock as of December 31, 2018. Additional terms and conditions of the Series B Preferred Stock, including the criteria that must be met for the payment of dividends, are described in
Note 15, Stockholders’ Equity
of the consolidated financial statements.
The nuclear industry in general, and the nuclear fuel industry in particular, are in a period of significant change. We are actively considering, and expect to consider from time to time in the future, potential strategic transactions, which at any given time may be in various stages of discussions, diligence or negotiation. If we pursue opportunities that require capital, we believe we would seek to satisfy these needs through a combination of working capital, cash generated from operations or additional debt or equity financing.
We are managing our working capital to seek to improve the long-term value of our LEU business and are planning to continue funding the Company’s qualified pension plans in the ordinary course because we believe that is in the best interest of all stakeholders. We expect that any other uses of working capital will be undertaken in light of these strategic priorities and will be based on the Company’s determination as to the relative strength of its operating performance and prospects, financial position and expected liquidity requirements. In addition, we expect that any such other uses of working capital will be subject to compliance with contractual restrictions to which the Company and its subsidiaries are subject, including the terms and conditions of their debt securities and credit facilities. We continually evaluate alternatives to manage our capital structure, and may opportunistically repurchase, exchange or redeem Company securities from time to time.
Commitments under SWU Purchase Agreements
The Company purchases SWU contained in LEU from Russia supplied to us under a 2011 agreement, as amended, with the Russian government entity Joint Stock Company “TENEX”. Under a 2018 agreement, the Company will purchase SWU contained in LEU from Orano with deliveries starting as early as 2021. Refer to
Note 16,
Commitments and Contingencies,
of the consolidated financial statements for additional information.
DOE Technology License
We have a non-exclusive license in DOE inventions that pertain to enriching uranium using gas centrifuge technology. The license agreement with DOE provides for annual royalty payments based on a varying percentage (1% up to 2%) of our annual revenues from sales of the SWU component of LEU produced by us at the ACP and any other facility using DOE centrifuge technology. There is a minimum annual royalty payment of $100,000 and the maximum cumulative royalty over the life of the license is $100 million. There is currently no commercial enrichment facility producing LEU using DOE centrifuge technology. We are continuing to advance our U.S. centrifuge technology that has evolved from DOE inventions at specialized facilities in Oak Ridge, Tennessee, with a view to deploying a commercial enrichment facility over the long term once market conditions recover.
Off-Balance Sheet Arrangements
Other than outstanding letters of credit and surety bonds, our SWU purchase commitments and the license agreement with DOE relating to the American Centrifuge technology, there were no material off-balance sheet arrangements at December 31, 2018, or December 31, 2017.
New Accounting Standards
Reference is made to
New Accounting Standards
in
Note 1, Summary of Significant Accounting Policies,
of the consolidated financial statements for information on new accounting standards.
55
Item 7A.
Quantitative and Qualitative Disclosures About Market Risk
Not provided as a smaller reporting company as defined in Rule 12b-2 of the Exchange Act.
Item 8.
Financial Statements and Supplementary Data
Our consolidated financial statements, together with related notes and the report of PricewaterhouseCoopers LLP, our independent registered public accounting firm, are set forth in Part IV, Item 15.
Item 9.
Changes in and Disagreements with Accountants on Accounting and Financial Disclosure
None.
Item 9A.
Controls and Procedures
Evaluation of Disclosure Controls and Procedures
As of December 31, 2018, the end of the period covered by this report, our management performed an evaluation, under the supervision and with the participation of the Chief Executive Officer and the Chief Financial Officer, of the effectiveness of our disclosure controls and procedures (as defined in Rule 13a-15(e) under the Securities Exchange Act of 1934, as amended (the “Exchange Act”)). Based on this evaluation, the Chief Executive Officer and the Chief Financial Officer concluded that the Company’s disclosure controls and procedures were not effective due to a material weakness in internal control over financial reporting described below in Management’s Annual Report on Internal Control Over Financial Reporting.
Notwithstanding the material weakness described below, management believes that the consolidated financial statements included in this Annual Report on Form 10-K present fairly, in all material respects, our financial position, results of operations and cash flows as of and for the periods presented in accordance with U.S. GAAP.
Management’s Annual Report on Internal Control Over Financial Reporting
Our management is responsible for establishing and maintaining adequate internal control over financial reporting, as defined in Rule 13a-15(f) of the Exchange Act. Our internal control over financial reporting is a process designed to provide reasonable assurance regarding the reliability of financial reporting and the preparation of financial statements for external purposes in accordance with generally accepted accounting principles. Because of its inherent limitations, internal control over financial reporting may not prevent or detect misstatements.
Our management conducted an evaluation of the effectiveness of our internal control over financial reporting as of December 31, 2018. This evaluation was based on the framework set forth by the Committee of Sponsoring Organizations of the Treadway Commission (COSO) in
Internal Control - Integrated Framework
(2013). Based on this assessment, our management concluded that a material weakness exists in our internal control over financial reporting as described below. A material weakness is a deficiency, or combination of deficiencies, in internal control over financial reporting, such that there is a reasonable possibility that a material misstatement of our annual or interim financial statements will not be prevented or detected on a timely basis.
We did not design and maintain effective controls over the evaluation of arrangements with customers that could result in modification accounting or other impacts for a sales contract. Specifically, we did not maintain effective controls over the determination and assessment of accounting impacts for these arrangements when executed. The material weakness did not result in a material misstatement of our annual or interim financial statements. However, the material weakness could result in a misstatement of the revenue or inventory-related account balances or disclosures that would result in a material misstatement to the annual or interim financial statements which would not be prevented or detected in a timely manner.
56
Because of this material weakness, management concluded that we did not maintain effective internal control over financial reporting as of December 31, 2018, based on criteria described in
Internal Control - Integrated Framework
(2013) issued by COSO.
This annual report does not include an audit report of the Company’s independent registered public accounting firm regarding internal control over financial reporting. Management’s report was not subject to audit by the Company’s registered public accounting firm pursuant to rules of the Securities and Exchange Commission that permit the Company to provide only management’s report in this annual report.
Remediation Efforts to Address Material Weakness
Management is evaluating the material weakness and developing a plan of remediation to strengthen our overall internal control over determination and assessment of accounting impacts for these arrangements when executed. The remediation plan is expected to include, at a minimum, implementing additional review controls as well as enhancing and formalizing existing processes over these arrangements with customers.
The material weakness will not be considered remediated until the applicable remedial controls operate for a sufficient period of time and management has concluded, through testing, that these controls are operating effectively.
Changes in Internal Control Over Financial Reporting
There were no changes in internal control over financial reporting during our most recently completed fiscal quarter ended December 31, 2018 that materially affected, or are reasonably likely to materially affect, our internal control over financial reporting.
Item 9B.
Other Information
None.
57
PART III
Item 10. Directors, Executive Officers and Corporate Governance
Information regarding executive officers is included in Part I of this Annual Report. Additional information concerning directors, executive officers and corporate governance appearing under the captions
Proposal 1. Election of Directors, Governance Information, Section 16(a) Beneficial Ownership Reporting Compliance,
and
Board and Committee Membership
in the Company’s Proxy Statement for the 2019 annual meeting of stockholders, which will be filed no later than 120 days after December 31, 2018 (the “2019 Proxy Statement”), is incorporated herein by reference.
Item 11. Executive Compensation
Information concerning executive and director compensation appearing under the captions
Executive Compensation,
and
Compensation of Directors
in the 2019 Proxy Statement is incorporated herein by reference.
Item 12. Security Ownership of Certain Beneficial Owners and Management and Related Stockholder Matters
Information concerning security ownership of certain beneficial owners and management appearing under the caption
Security Ownership of Certain Beneficial Owners and Management
in the 2019 Proxy Statement is incorporated herein by reference.
Information concerning the common stock that may be issued under the 2014 Equity Incentive Plan appearing under the caption
Equity Compensation Plan Information
in the 2019 Proxy Statement is incorporated herein by reference.
Item 13. Certain Relationships and Related Transactions, and Director Independence
Information concerning certain relationships and related transactions and director independence appearing under the captions
Transactions with Related Persons,
and
Director Independence
in the 2019 Proxy Statement is incorporated herein by reference.
Item 14. Principal Accounting Fees and Services
Information concerning principal accounting fees and services appearing under the caption
Audit and Non-Audit Fees
in the 2019 Proxy Statement is incorporated herein by reference.
58
PART IV
Item 15.
Exhibits and Financial Statement Schedules
|
(a)
|
(1)
Consolidated Financial Statements
|
Reference is made to the consolidated financial statements appearing elsewhere in this Annual Report.
(2)
Financial Statement Schedules
No financial statement schedules are required to be filed as part of this Annual Report.
(3)
Exhibits
The exhibits listed on the accompanying Exhibit Index are filed or incorporated by reference as part of this report and such Exhibit Index is incorporated herein by reference. The accompanying Exhibit Index identifies each management contract or compensatory plan or arrangement required to be filed as an exhibit to this report.
Item 16.
Form 10-K Summary
None.
59
EXHIBIT INDEX
|
Exhibit No.
|
Description
|
|
2.1
|
|
|
3.1
|
|
|
3.2
|
|
|
3.3
|
|
|
3.4
|
|
|
4.1
|
|
|
4.2
|
|
|
4.3
|
|
|
4.4
|
|
|
4.5
|
|
|
4.6
|
|
|
4.7
|
|
|
4.8
|
|
|
4.9
|
|
60
|
4.10
|
|
|
4.11
|
|
|
4.12
|
|
|
10.1
|
|
|
10.2
|
|
|
10.3
|
|
|
10.4
|
|
|
10.5
|
|
|
10.6
|
|
|
10.7
|
|
|
10.8
|
|
|
10.9
|
|
|
10.10
|
|
|
10.11
|
|
|
10.12
|
|
61
|
10.13
|
|
|
10.14
|
|
|
10.15
|
|
|
10.16
|
|
|
10.17
|
|
|
10.18
|
|
|
10.19
|
|
|
10.20
|
|
|
10.21
|
|
|
10.22
|
|
|
10.23
|
|
|
10.24
|
|
62
|
10.25
|
|
|
10.26
|
|
|
10.27
|
|
|
10.28
|
|
|
10.29
|
|
|
10.30
|
|
|
10.31
|
|
|
1032
|
|
|
10.33
|
|
|
10.34
|
|
|
10.35
|
|
|
10.36
|
|
|
10.37
|
|
|
10.38
|
|
|
10.39
|
|
|
10.40
|
|
|
10.41
|
|
|
10.42
|
|
|
10.43
|
|
63
|
10.44
|
|
|
10.45
|
|
|
10.46
|
|
|
10.47
|
|
|
10.48
|
|
|
10.49
|
|
|
10.50
|
|
|
10.51
|
|
|
10.52
|
|
|
21
|
|
|
23.1
|
|
|
31.1
|
|
|
31.2
|
|
|
32.1
|
|
|
101
|
Consolidated financial statements from the Annual Report on Form 10-K for the fiscal year ended December 31, 2018, filed in interactive data file (XBRL) format. (a)
|
|
(a)
|
Filed herewith.
|
|
(b)
|
Management contracts and compensatory plans and arrangements required to be filed as exhibits pursuant to Item 15(b) of this report.
|
64
SIGNATURES
Pursuant to the requirements of Section 13 or 15(d) of the Securities Exchange Act of 1934, the registrant has duly caused this report to be signed on its behalf by the undersigned, thereunto duly authorized.
|
Centrus Energy Corp.
|
|
|
April 1, 2019
|
/s/ Daniel B. Poneman
|
|
Daniel B. Poneman
|
|
|
President and Chief Executive Officer
|
|
Pursuant to the requirements of the Securities Exchange Act of 1934, this report has been signed below by the following persons on behalf of the registrant and in the capacities indicated on April 1, 2019:
|
Signature
|
Title
|
|
|
/s/ Daniel B. Poneman
|
President and Chief Executive Officer
(Principal Executive Officer) and Director
|
|
|
Daniel B. Poneman
|
||
|
/s/ Marian K. Davis
|
Senior Vice President, Chief Financial Officer
and Treasurer (Principal Financial Officer)
|
|
|
Marian K. Davis
|
||
|
/s/ John C. Dorrian
|
Controller and Chief Accounting Officer
(Principal Accounting Officer)
|
|
|
John C. Dorrian
|
||
|
/s/ Mikel H. Williams
|
Chairman of the Board and Director
|
|
|
Mikel H. Williams
|
||
|
/s/ Michael Diament
|
Director
|
|
|
Michael Diament
|
||
|
/s/ Tetsuo Iguchi
|
Director
|
|
|
Tetsuo Iguchi
|
||
|
/s/ W. Thomas Jagodinski
|
Director
|
|
|
W. Thomas Jagodinski
|
||
|
/s/ Patricia J. Jamieson
|
Director
|
|
|
Patricia J. Jamieson
|
||
|
/s/ William J. Madia
|
Director
|
|
|
William J. Madia
|
||
|
/s/ Neil S. Subin
|
Director
|
|
|
Neil S. Subin
|
||
65
CENTRUS ENERGY CORP.
INDEX TO CONSOLIDATED FINANCIAL STATEMENTS
|
Page
|
|
66
Report of Independent Registered Public Accounting Firm
To
the Board of Directors and Stockholders of Centrus Energy Corp.
Opinion on the Financial Statements
We have audited the accompanying consolidated balance sheets of Centrus Energy Corp. and its subsidiaries (the “Company”) as of December 31, 2018 and 2017, and the related consolidated statements of operations, of comprehensive income (loss), of stockholders’ deficit and of cash flows for each of the two years in the period ended December 31, 2018, including the related notes (collectively referred to as the “consolidated
financial statements”). In our opinion, the consolidated financial statements present fairly, in all material respects, the financial position of the Company
as of December 31, 2018 and 2017, and the results of its operations and its cash flows for each of the two years in the period ended December 31, 2018
in conformity with accounting principles generally accepted in the United States of America.
Basis for Opinion
These consolidated financial statements are the responsibility of the Company’s management. Our responsibility is to express an opinion on the Company’s consolidated financial statements based on our audits. We are a public accounting firm registered with the Public Company Accounting Oversight Board (United States) (PCAOB) and are required to be independent with respect to the Company in accordance with the U.S. federal securities laws and the applicable rules and regulations of the Securities and Exchange Commission and the PCAOB.
We conducted our audits of these consolidated financial statements in accordance with the standards of the PCAOB. Those standards require that we plan and perform the audit to obtain reasonable assurance about whether the consolidated financial statements are free of material misstatement, whether due to error or fraud. The Company is not required to have, nor were we engaged to perform, an audit of its internal control over financial reporting. As part of our audits we are required to obtain an understanding of internal control over financial reporting but not for the purpose of expressing an opinion on the effectiveness of the Company's internal control over financial reporting. Accordingly, we express no such opinion.
Our audits included performing procedures to assess the risks of material misstatement of the consolidated financial statements, whether due to error or fraud, and performing procedures that respond to those risks. Such procedures included examining, on a test basis, evidence regarding the amounts and disclosures in the consolidated financial statements. Our audits also included evaluating the accounting principles used and significant estimates made by management, as well as evaluating the overall presentation of the consolidated financial statements. We believe that our audits provide a reasonable basis for our opinion.
/s/
PricewaterhouseCoopers LLP
Baltimore, Maryland
April 1, 2019
We have served as the Company's auditor since 2002.
67
CENTRUS ENERGY CORP.
CONSOLIDATED BALANCE SHEETS
(in millions, except share and per share data)
|
|
December 31,
2018 |
December 31,
2017 |
|||||
|
ASSETS
|
|
|
|||||
|
Current assets:
|
|
|
|||||
|
Cash and cash equivalents
|
$
|
123.1
|
|
$
|
208.8
|
|
|
|
Accounts receivable
|
60.2
|
|
60.2
|
|
|||
|
Inventories
|
129.7
|
|
153.1
|
|
|||
|
Deferred costs associated with deferred revenue
|
134.9
|
|
122.3
|
|
|||
|
Deposits for financial assurance
|
30.3
|
|
16.3
|
|
|||
|
Other current assets
|
6.3
|
|
6.2
|
|
|||
|
Total current assets
|
484.5
|
|
566.9
|
|
|||
|
Property, plant and equipment, net
|
4.2
|
|
4.9
|
|
|||
|
Deposits for financial assurance
|
6.3
|
|
19.7
|
|
|||
|
Intangible assets, net
|
76.0
|
|
82.7
|
|
|||
|
Other long-term assets
|
0.7
|
|
1.1
|
|
|||
|
Total assets
|
$
|
571.7
|
|
$
|
675.3
|
|
|
|
LIABILITIES AND STOCKHOLDERS’ DEFICIT
|
|
|
|
|
|||
|
Current liabilities:
|
|
|
|
|
|||
|
Accounts payable and accrued liabilities
|
$
|
52.4
|
|
$
|
48.2
|
|
|
|
Payables under SWU purchase agreements
|
46.0
|
|
79.4
|
|
|||
|
Inventories owed to customers and suppliers
|
103.0
|
|
77.9
|
|
|||
|
Deferred revenue and advances from customers
|
204.5
|
|
191.8
|
|
|||
|
Current debt
|
32.8
|
|
6.1
|
|
|||
|
Total current liabilities
|
438.7
|
|
403.4
|
|
|||
|
Long-term debt
|
120.2
|
|
157.5
|
|
|||
|
Postretirement health and life benefit obligations
|
136.2
|
|
154.2
|
|
|||
|
Pension benefit liabilities
|
168.9
|
|
161.6
|
|
|||
|
Advances from customers
|
15.0
|
|
—
|
|
|||
|
Other long-term liabilities
|
14.6
|
|
17.5
|
|
|||
|
Total liabilities
|
893.6
|
|
894.2
|
|
|||
|
Commitments and contingencies (Note 16)
|
|
|
|
|
|||
|
Stockholders’ deficit:
|
|||||||
|
Preferred stock, par value $1.00 per share, 20,000,000 shares authorized
|
|||||||
|
Series A Participating Cumulative Preferred Stock, none issued
|
—
|
|
—
|
|
|||
|
Series B Senior Preferred Stock, 7.5% cumulative, 104,574 shares issued and outstanding and an aggregate liquidation preference of $119.3 and $111.5 as of December 31, 2018 and 2017, respectively
|
4.6
|
|
4.6
|
|
|||
|
Class A Common Stock, par value $0.10 per share, 70,000,000 shares authorized, 8,031,307 shares and 7,632,669 shares issued and outstanding as of December 31, 2018 and 2017, respectively
|
0.8
|
|
0.8
|
|
|||
|
Class B Common Stock, par value $0.10 per share, 30,000,000 shares authorized, 1,406,082 shares issued and outstanding as of December 31, 2018 and December 31, 2017
|
0.1
|
|
0.1
|
|
|||
|
Excess of capital over par value
|
61.2
|
|
60.0
|
|
|||
|
Accumulated deficit
|
(388.5
|
)
|
(284.5
|
)
|
|||
|
Accumulated other comprehensive income, net of tax
|
(0.1
|
)
|
0.1
|
|
|||
|
Total stockholders’ deficit
|
(321.9
|
)
|
(218.9
|
)
|
|||
|
Total liabilities and stockholders’ deficit
|
$
|
571.7
|
|
$
|
675.3
|
|
|
The accompanying notes are an integral part of these consolidated financial statements.
68
CENTRUS ENERGY CORP.
CONSOLIDATED STATEMENTS OF OPERATIONS
(in millions, except share and per share data)
|
Year Ended December 31,
|
|||||||
|
2018
|
2017
|
||||||
|
Revenue:
|
|||||||
|
Separative work units
|
$
|
130.6
|
|
$
|
195.4
|
|
|
|
Uranium
|
33.8
|
|
—
|
|
|||
|
Contract services
|
28.6
|
|
23.0
|
|
|||
|
Total revenue
|
193.0
|
|
218.4
|
|
|||
|
Cost of Sales:
|
|||||||
|
Separative work units and uranium
|
187.7
|
|
162.7
|
|
|||
|
Contract services
|
23.2
|
|
25.5
|
|
|||
|
Total cost of sales
|
210.9
|
|
188.2
|
|
|||
|
Gross profit (loss)
|
(17.9
|
)
|
30.2
|
|
|||
|
Advanced technology license and decommissioning costs
|
26.1
|
|
15.7
|
|
|||
|
Selling, general and administrative
|
39.9
|
|
43.7
|
|
|||
|
Amortization of intangible assets
|
6.6
|
|
10.6
|
|
|||
|
Special charges for workforce reductions and advisory costs
|
2.2
|
|
9.5
|
|
|||
|
Gains on sales of assets
|
(0.3
|
)
|
(4.6
|
)
|
|||
|
Operating loss
|
(92.4
|
)
|
(44.7
|
)
|
|||
|
Gain on early extinguishment of debt
|
(0.5
|
)
|
(33.6
|
)
|
|||
|
Nonoperating components of net periodic benefit expense (income)
|
10.6
|
|
(27.2
|
)
|
|||
|
Interest expense
|
4.1
|
|
5.3
|
|
|||
|
Investment income
|
(2.5
|
)
|
(1.3
|
)
|
|||
|
Income (loss) before income taxes
|
(104.1
|
)
|
12.1
|
|
|||
|
Income tax benefit
|
—
|
|
(0.1
|
)
|
|||
|
Net income (loss)
|
(104.1
|
)
|
12.2
|
|
|||
|
Preferred stock dividends - undeclared and cumulative
|
7.8
|
|
6.9
|
|
|||
|
Net income (loss) allocable to common stockholders
|
$
|
(111.9
|
)
|
$
|
5.3
|
|
|
|
Net income (loss) per common share - basic and diluted
|
$
|
(12.23
|
)
|
$
|
0.58
|
|
|
|
Average number of common shares outstanding - basic and diluted (in thousands)
|
9,151
|
|
9,081
|
|
|||
The accompanying notes are an integral part of these consolidated financial statements.
69
CENTRUS ENERGY CORP.
CONSOLIDATED STATEMENTS OF COMPREHENSIVE INCOME (LOSS)
(in millions)
|
|
Year Ended December 31,
|
||||||
|
|
2018
|
2017
|
|||||
|
Net income (loss)
|
$
|
(104.1
|
)
|
$
|
12.2
|
|
|
|
Other comprehensive loss, before tax (Note 17):
|
|||||||
|
Amortization of prior service credits, net
|
(0.2
|
)
|
(0.1
|
)
|
|||
|
Other comprehensive loss, before tax
|
(0.2
|
)
|
(0.1
|
)
|
|||
|
Income tax benefit related to items of other comprehensive income
|
—
|
|
—
|
|
|||
|
Other comprehensive loss, net of tax benefit
|
(0.2
|
)
|
(0.1
|
)
|
|||
|
Comprehensive income (loss)
|
$
|
(104.3
|
)
|
$
|
12.1
|
|
|
The accompanying notes are an integral part of these consolidated financial statements.
70
CENTRUS ENERGY CORP.
CONSOLIDATED STATEMENTS OF CASH FLOWS
(in millions)
|
|
Year Ended December 31,
|
||||||
|
|
2018
|
2017
|
|||||
|
Operating Activities:
|
|
||||||
|
Net income (loss)
|
$
|
(104.1
|
)
|
$
|
12.2
|
|
|
|
Adjustments to reconcile net loss to cash used in operating activities:
|
|||||||
|
Depreciation and amortization
|
7.4
|
|
12.0
|
|
|||
|
Immediate recognition of retirement benefit plans (gains) losses, net
|
17.3
|
|
(25.8
|
)
|
|||
|
PIK interest on paid-in-kind toggle notes
|
1.7
|
|
2.9
|
|
|||
|
Gain on early extinguishment of debt
|
(0.5
|
)
|
(33.6
|
)
|
|||
|
Gain on sales of assets
|
(0.4
|
)
|
(4.6
|
)
|
|||
|
Changes in operating assets and liabilities:
|
|||||||
|
Accounts receivable
|
9.7
|
|
(17.6
|
)
|
|||
|
Inventories, net
|
61.0
|
|
44.7
|
|
|||
|
Payables under SWU purchase agreements
|
(33.4
|
)
|
19.8
|
|
|||
|
Deferred revenue, net of deferred costs
|
0.1
|
|
15.9
|
|
|||
|
Accounts payable and other liabilities
|
3.7
|
|
(25.2
|
)
|
|||
|
Pension and postretirement liabilities
|
(28.0
|
)
|
(9.6
|
)
|
|||
|
Other, net
|
(8.9
|
)
|
(7.2
|
)
|
|||
|
Cash used in operating activities
|
(74.4
|
)
|
(16.1
|
)
|
|||
|
Investing Activities:
|
|||||||
|
Capital expenditures
|
(0.1
|
)
|
(0.5
|
)
|
|||
|
Proceeds from sales of assets
|
0.5
|
|
4.7
|
|
|||
|
Cash provided by investing activities
|
0.4
|
|
4.2
|
|
|||
|
Financing Activities:
|
|||||||
|
Payment of interest classified as debt
|
(6.1
|
)
|
(3.4
|
)
|
|||
|
Extinguishment of debt
|
(5.0
|
)
|
(27.6
|
)
|
|||
|
Payment of securities transaction costs
|
—
|
|
(9.0
|
)
|
|||
|
Cash used in financing activities
|
(11.1
|
)
|
(40.0
|
)
|
|||
|
Decrease in cash, cash equivalents and restricted cash
|
(85.1
|
)
|
(51.9
|
)
|
|||
|
Cash, cash equivalents and restricted cash, beginning of period
(1)
|
244.8
|
|
296.7
|
|
|||
|
Cash, cash equivalents and restricted cash, end of period
(1)
|
$
|
159.7
|
|
$
|
244.8
|
|
|
|
Supplemental cash flow information:
|
|||||||
|
Interest paid in cash
|
$
|
7.1
|
|
$
|
4.2
|
|
|
|
Non-cash activities:
|
|||||||
|
Conversion of interest payable-in-kind to debt
|
$
|
1.7
|
|
$
|
0.4
|
|
|
|
Exchange of debt for Series B preferred stock
|
$
|
—
|
|
$
|
4.6
|
|
|
|
Exchange of debt for Class A common stock
|
$
|
0.9
|
|
$
|
—
|
|
|
_______________
(1)
Refer to
Note 4, Cash, Cash Equivalents and Restricted Cash.
The accompanying notes are an integral part of these consolidated financial statements.
71
CENTRUS ENERGY CORP.
CONSOLIDATED STATEMENTS OF STOCKHOLDERS’ DEFICIT
(in millions, except per share data)
|
|
Preferred Stock,
Series B
|
Common Stock,
Class A,
Par Value
$.10 per Share
|
Common Stock,
Class B,
Par Value
$.10 per Share
|
Excess of
Capital Over
Par Value
|
Accumulated Deficit
|
Accumulated
Other Comprehensive Income
|
Total
|
||||||||||||||||||||
|
Balance at December 31, 2016
|
$
|
—
|
|
$
|
0.8
|
|
$
|
0.1
|
|
$
|
59.5
|
|
$
|
(296.7
|
)
|
$
|
0.2
|
|
$
|
(236.1
|
)
|
||||||
|
Net income
|
—
|
|
—
|
|
—
|
|
—
|
|
12.2
|
|
—
|
|
12.2
|
|
|||||||||||||
|
Issuance of preferred stock
|
4.6
|
|
—
|
|
—
|
|
—
|
|
—
|
|
—
|
|
4.6
|
|
|||||||||||||
|
Other comprehensive loss, net of tax benefit (Note 17)
|
—
|
|
—
|
|
—
|
|
—
|
|
—
|
|
(0.1
|
)
|
(0.1
|
)
|
|||||||||||||
|
Restricted stock units and stock options issued, net of amortization
|
—
|
|
—
|
|
—
|
|
0.5
|
|
—
|
|
—
|
|
0.5
|
|
|||||||||||||
|
Balance at December 31, 2017
|
$
|
4.6
|
|
$
|
0.8
|
|
$
|
0.1
|
|
$
|
60.0
|
|
$
|
(284.5
|
)
|
$
|
0.1
|
|
$
|
(218.9
|
)
|
||||||
|
Balance at December 31, 2017
|
$
|
4.6
|
|
$
|
0.8
|
|
$
|
0.1
|
|
$
|
60.0
|
|
$
|
(284.5
|
)
|
$
|
0.1
|
|
$
|
(218.9
|
)
|
||||||
|
Adoption of ASC 606 as of January 1, 2018 (Note 1)
|
—
|
|
—
|
|
—
|
|
—
|
|
0.1
|
|
—
|
|
0.1
|
|
|||||||||||||
|
Net loss
|
—
|
|
—
|
|
—
|
|
—
|
|
(104.1
|
)
|
—
|
|
(104.1
|
)
|
|||||||||||||
|
Issuance of common stock
|
—
|
|
—
|
|
—
|
|
0.8
|
|
—
|
|
—
|
|
0.8
|
|
|||||||||||||
|
Other comprehensive loss, net of tax benefit (Note 17)
|
—
|
|
—
|
|
—
|
|
—
|
|
—
|
|
(0.2
|
)
|
(0.2
|
)
|
|||||||||||||
|
Restricted stock units and stock options issued, net of amortization
|
—
|
|
—
|
|
—
|
|
0.4
|
|
—
|
|
—
|
|
0.4
|
|
|||||||||||||
|
Balance at December 31, 2018
|
$
|
4.6
|
|
$
|
0.8
|
|
$
|
0.1
|
|
$
|
61.2
|
|
$
|
(388.5
|
)
|
$
|
(0.1
|
)
|
$
|
(321.9
|
)
|
||||||
The accompanying notes are an integral part of these consolidated financial statements.
72
CENTRUS ENERGY CORP.
NOTES TO CONSOLIDATED FINANCIAL STATEMENTS
1. SUMMARY OF SIGNIFICANT ACCOUNTING POLICIES
Basis of Presentation and Principles of Consolidation
The consolidated financial statements of Centrus Energy Corp. (“Centrus” or the “Company”), which include the accounts of the Company, its principal subsidiary United States Enrichment Corporation (“Enrichment Corp.”) and its other subsidiaries, were prepared in conformity with generally accepted accounting principles in the U.S. (“U.S. GAAP”). Certain prior year amounts have been reclassified for consistency with the current year presentation. All material intercompany transactions have been eliminated.
Correction of Error
In the second quarter of 2018, Management identified a classification error for
$0.3 million
of costs that had been previously included in
Cost of Sales
for the contract services segment in the consolidated statement of operations for the three months ended March 31, 2018. These costs are now included in
Advanced Technology License and Decommissioning Costs
in the consolidated statement of operations for the year ended December 31, 2018. The Company considered quantitative and qualitative factors in assessing the materiality of the classification error and determined that the classification error was not material. This revision had no impact to the Company’s net loss for the three months ended March 31, 2018, or the year ended December 31, 2018.
Use of Estimates
The preparation of consolidated financial statements in conformity with U.S. GAAP requires management to make estimates and assumptions that affect reported amounts presented and disclosed in the consolidated financial statements. Significant estimates and judgments include, but are not limited to, asset valuations, pension and postretirement health and life benefit costs and obligations, the tax bases of assets and liabilities, the future recoverability of deferred tax assets, and determination of the valuation allowance for deferred tax assets. Actual results may differ from such estimates, and estimates may change if the underlying conditions or assumptions change.
Cash and Cash Equivalents
Cash and cash equivalents include short-term or highly liquid assets with original maturities of three months or less.
Inventories and Inventories Owed to Customers and Suppliers
Low-enriched uranium (“LEU”) consists of two components: separative work units (“SWU”) and uranium. SWU is a standard unit of measurement that represents the effort required to transform a given amount of natural uranium into two components: enriched uranium having a higher percentage of U
235
and depleted uranium having a lower percentage of U
235
. The SWU contained in LEU is calculated using an industry standard formula based on the physics of enrichment. The amount of enrichment deemed to be contained in LEU under this formula is commonly referred to as its SWU component and the quantity of natural uranium deemed to be used in the production of LEU under this formula is referred to as its uranium or “feed” component.
SWU and uranium inventory costs are determined using the average cost method. SWU and uranium purchase costs include shipping costs when applicable. Inventories of SWU and uranium are valued at the lower of cost or net realizable value (“NRV”). NRV is the estimated selling price in the ordinary course of business less reasonably predictable costs of completion, disposal, and transportation. The estimated selling price for SWU and uranium is based on the pricing terms of contracts in the Company’s sales order book, and, for uranium not under contract, the estimated selling price is based primarily on published price indicators at the balance sheet date.
73
Inventories owed to customers and suppliers, included in current liabilities, consist primarily of SWU and uranium inventories owed to fabricators. Fabricators process LEU into fuel for use in nuclear reactors. Under inventory optimization arrangements between Centrus and domestic fabricators, fabricators order quantities of LEU from Centrus based on scheduled or anticipated orders from utility customers for deliveries in future periods. As delivery obligations under actual customer orders arise, Centrus satisfies these obligations by arranging for the transfer to the customer of title to the specified quantity of LEU at the fabricator. Centrus’ balances of SWU and uranium vary over time based on the timing and size of the fabricator’s LEU orders from Centrus and the fabricator’s needs for working stock of LEU. Balances can be positive or negative at the discretion of the fabricator. Fabricators have other inventory supplies and, where a fabricator has elected to order less material from Centrus than Centrus is required to deliver to its customers at the fabricator, the fabricator will use these other inventories to satisfy Centrus’ customer order obligations on Centrus’ behalf. In such cases, the transfer of title of LEU from Centrus to the customer results in quantities of SWU and uranium being owed by Centrus to the fabricator. The amounts of SWU and uranium owed to fabricators are satisfied as future deliveries of LEU to fabricators are made.
Deferred Taxes
Centrus follows the asset and liability approach to account for deferred taxes. Deferred tax assets and liabilities are recognized for the anticipated future tax consequences of temporary differences between the balance sheet carrying amounts of assets and liabilities and their respective tax bases. Deferred taxes are based on income tax rates in effect for the years in which temporary differences are expected to reverse. The effect on deferred taxes of a change in income tax rates is recognized in income when the change in rates is enacted in the law. A valuation allowance is provided if it is more likely than not that all, or some portion, of the deferred tax assets may not be realized.
Property, Plant and Equipment
Property, plant and equipment are recorded at acquisition cost. Leasehold improvements and machinery and equipment are depreciated on a straight-line basis over the shorter of the useful life of the assets or the lease term, if applicable. Refer also to
Carrying Value of Long-Lived Assets
below.
Intangible Assets
Centrus has intangible assets resulting from fresh start accounting as a result of emergence from Chapter 11 bankruptcy on September 30, 2014. The identifiable intangible assets relate to the sales order book and customer relationships. The order book intangible asset is amortized as the order book valued at emergence is reduced, principally as a result of deliveries to customers. The customer relationships intangible asset is amortized using the straight-line method over the estimated average useful life of
15
years. Refer also to
Carrying Value of Long-Lived Assets
below.
Carrying Value of Long-Lived Assets
The Company evaluates the carrying values of property, plant and equipment and identifiable intangible assets when events or changes in business circumstances indicate that the carrying amount of asset, or asset group, may not be fully recoverable. The carrying amount of a long-lived asset is not recoverable if it exceeds the sum of the undiscounted cash flows expected to result from the use and eventual disposition of the asset. An impairment loss is measured as the amount by which the carrying amount of a long-lived asset, or asset group exceeds its fair value.
74
Financial Instruments and Fair Value Measurement
Accounting standards define fair value as the price that would be received from selling an asset or paid to transfer a liability in an orderly transaction between market participants at the measurement date. When determining the fair value measurements for assets and liabilities required or permitted to be recorded at fair value, consideration is given to the principal or most advantageous market and assumptions that market participants would use when pricing the asset or liability.
Pursuant to accounting standards, Centrus’ 8.0% paid-in-kind (“PIK”) toggle notes (the “8% PIK Toggle Notes”) and its 8.25% notes (the “8.25% Notes”) are recorded at face value and the fair value is disclosed. The estimated fair value of each of the 8% PIK Toggle Notes and the 8.25% Notes is based on the trading price nearest the balance sheet date observed on secondary markets. Debt issuance costs are deferred and amortized over the life of the instrument.
The balance sheet carrying amounts for accounts receivable, accounts payable and accrued liabilities, and payables under SWU purchase agreements approximate fair value because of the short-term nature of the instruments.
Concentrations of Credit Risk
Credit risk could result from the possibility of a customer failing to perform or pay according to the terms of a contract. Extension of credit is based on an evaluation of each customer’s financial condition. Centrus regularly monitors credit risk exposure and takes steps to mitigate the likelihood of such exposure resulting in a loss.
Revenue
On January 1, 2018, the Company adopted ASC 606 using the modified retrospective method as applied to customer contracts that were not completed as of the adoption date. As a result, financial information for reporting periods beginning on or after January 1, 2018, are presented under ASC 606, while comparative financial information has not been adjusted and continues to be reported in accordance with the Company’s historical accounting policy for revenue recognition prior to the adoption of ASC 606. There was no material impact of adopting ASC 606 for sales under the LEU segment. For sales under the contract services segment, revenue is now primarily recognized over time as control is transferred to the customer.
Revenue for product and service sales is recognized when or as the Company transfers control of the promised products or services to the customer. Revenue is measured at the transaction price, which is based on the amount of consideration that the Company expects to receive in exchange for transferring the promised goods or services to the customer. The transaction price will include estimates of variable consideration to the extent it is probable that a significant reversal of revenue recognized will not occur.
SWU and Uranium Revenue
Revenue for the Company’s LEU segment is derived from sales of the SWU component of LEU, from sales of both the SWU and uranium components of LEU, and from sales of uranium. Contracts with customers are primarily long-term, fixed-commitment contracts under which its customers are obligated to purchase a specified quantity of the SWU component of LEU or the SWU and uranium components of LEU. The Company’s contracts for natural uranium are generally shorter-term, fixed-commitment contracts.
75
Revenue is recognized at the time the customer obtains control of the LEU or uranium. Customers generally obtain control of LEU at nuclear fuel fabricators. Centrus ships LEU to nuclear fuel fabricators for scheduled or anticipated orders from utility customers. Based on customer orders, Centrus arranges for the transfer of title of LEU from Centrus to the customer for the specified quantity of LEU at the fuel fabricator. Each such delivery to a customer is accounted for as a distinct performance obligation under a contract, and a contract may call for multiple deliveries over a number of periods. The contract’s transaction price is allocated to each performance obligation based on the observable standalone selling price of each distinct delivery of SWU or uranium.
Utility customers in general have the option to defer receipt of LEU or uranium purchased from the Company beyond the contractual sale period. In such cases, title to LEU or uranium is transferred to the customer and a performance obligation for Centrus is created and a receivable is recorded. Cash is collected for the receivable under normal credit terms. The performance obligation is represented as
Deferred Revenue
on the consolidated balance sheet and the customer-titled product is classified as
Deferred Costs Associated with Deferred Revenue
on the consolidated balance sheet. Risk of loss remains with Centrus until the customer obtains control of LEU or uranium. The recognition of revenue and related cost of sales occurs at the point in time at which the customer obtains control of LEU or uranium and risk of loss of the product transfers to the customer, which may occur beyond one year. The timing of the transfer of control, subject to notice period requirements, is at the option of the customer. As such, deferred costs and deferred revenue are classified within current assets and current liabilities, respectively.
On occasion, the Company will accept payment in the form of uranium. Revenue from the sale of SWU under such contracts is recognized at the time transfer of control of LEU occurs and is based on the fair value of the uranium at contract inception or as the quantity of uranium is finalized, if variable. The Company may also borrow SWU from customers, in which case the Company will record the SWU and the related liability for the borrowing using a projected average purchase price over the borrowing period.
Amounts billed to customers for handling costs are included in sales. Handling costs are accounted for as a fulfillment cost and are included in cost of sales. The Company does not have shipping costs associated with outbound freight after control over a product has transferred to a customer. The Company’s contracts with customers do not provide for significant payment terms or financing components.
Contract Services Revenue
Revenue for the contract services segment, principally representing engineering and testing activities performed by the Company, as well as technical and resource support, is recognized over the contractual period as services are rendered. The Company recognizes revenue over time as it performs on these contracts because of the continuous transfer of control to the customer. With control transferring over time, revenue is recognized based on the extent of progress towards completion of the performance obligation. A contract may contain one or more performance obligations. Two or more promises to transfer goods or services to a customer may be considered a single performance obligation if the goods or services are highly interdependent or highly interrelated such that utility of the promised goods or services to the customer includes integration services provided by the Company.
The Company generally uses the cost-to-cost input method of progress for fixed-price contracts because it best depicts the transfer of control to the customer that occurs as the Company incurs costs. Under the cost-to-cost method, the extent of progress towards completion is measured based on the proportion of direct costs incurred to date to the total estimated direct costs at completion of the performance obligation. Revenues are recorded proportionally as costs are incurred. If transaction prices are not stated in the contract for each performance obligation, contractual prices are allocated to performance obligations based on estimated relative standalone selling prices of the promised services. For contracts that are not accounted for under the percentage of completion method, the Company records revenue as services are provided. The Company recognizes time-and-material contract revenue at negotiated, fixed, contractually billable rates as it delivers labor hours and incurs other direct expenses.
76
The Company has applied the practical expedient in paragraph ASC 606-10-50-14 and does not provide t
he value of r
emaining performance obligations under service contracts having original expected terms of one year or less.
The timing of revenue recognition may differ from the timing of invoicing to customers. Progress on satisfying performance obligations under contracts with customers and the related billings and cash collections are recorded on the consolidated balance sheet as contract assets or contract liabilities. Contract balances are classified as assets or liabilities on a contract-by-contract basis at the end of each reporting period.
Unbilled receivables (contract assets) are included in
Accounts Receivable
on the consolidated balance sheet and arise when the timing of cash collected from customers differs from the timing of revenue recognition, such as when contract provisions require specific milestones to be met before a customer can be billed. Those assets are recognized when the revenue associated with the contract is recognized prior to billing and derecognized when billed in accordance with the terms of the contract. To the extent billings to the customer precede the recognition of contract services revenue, the Company recognizes a liability included in
Deferred Revenue and Advances from Customers
on the consolidated balance sheet.
Results for prior periods were reported in accordance with ASC 605. Revenue derived from sales of the SWU component of LEU, from sales of both the SWU and uranium components of LEU, and from sales of uranium was recognized at the time LEU or uranium was delivered under the terms of contracts with domestic and international electric utility customers. Most customers took title and delivery of LEU at fuel fabricators and revenue was recognized when delivery of LEU to the customer occurred at the fuel fabricator. In cases when utility customers deferred receipt of LEU or uranium purchased from the Company beyond the contractual sale period, title to LEU or uranium was transferred to the customer and risk of loss remained with Centrus until delivery occurred. The recognition of revenue and related cost of sales occurred at the time delivery occurred and risk of loss transferred to the customer. In cases where Centrus accepted payment in the form of uranium, revenue was recognized at the time LEU was delivered and was based on the fair value of the uranium received in exchange for the SWU.
Contract services revenue in prior periods included billings for fees and payments for allowable costs that were determined in accordance with the terms of the underlying contracts. For contracts that provided fixed payments for monthly reports, revenue was recognized as deliverables are completed and as fees are earned. For contracts that provided fixed payments for completion of milestones, revenue was recognized as each milestone is completed.
Advanced Technology License and Decommissioning Costs
American Centrifuge expenses that are outside of our contracts with UT-Battelle are included in
Advanced Technology License and Decommissioning Costs
, including ongoing costs to maintain the demobilized Piketon facility and our licenses from the U.S. Nuclear Regulatory Commission (“NRC”) at that location. Refer to
Note 16, Commitments and Contingencies,
for further details regarding the American Centrifuge project.
Pension and Postretirement Health and Life Benefit Plans
The Company provides retirement benefits to certain employees and retirees under defined benefit pension plans and postretirement health and life benefit plans. The valuation of benefit obligations and costs is based on provisions of the plans and actuarial assumptions that involve judgments and estimates.
Plan assets and benefit obligations are remeasured each year as of the balance sheet date, or when lump sum payments exceed certain levels, resulting in differences between actual and projected results. The Company has elected to recognize these actuarial gains and losses immediately in the statement of operations to provide transparency regarding the impacts of changes in plan assets and benefit obligations.
77
Stock-Based Compensation
Centrus has a stock-based compensation plan which authorizes the issuance of common stock to the Company’s employees, officers, directors and other individuals providing services to the Company or its affiliates pursuant to options, stock appreciation rights, restricted stock units, restricted stock, performance awards, dividend equivalent rights and other stock based awards. Stock-based compensation cost is measured at the grant date based on the fair value of the award. The cost is recognized over the requisite service period on a straight-line basis over the vesting period.
New Accounting Standards
Recently Adopted Accounting Standards
In 2014, the Financial Accounting Standards Board (the “FASB”) issued Accounting Standards Update (“ASU”) 2014-09,
Revenue from Contracts with Customers,
which requires revenue to be recognized when a customer obtains control of promised goods and services at an amount that reflects the consideration the Company expects to receive in exchange for those goods and services. In addition, ASU 2014-09 and subsequent amendments, collectively known as Accounting Standards Codification (“ASC”) 606 (“ASC 606”) require certain additional disclosures regarding the nature, amount, timing, and uncertainty of revenues and cash flows arising from contracts with customers.
The Company adopted ASC 606 on January 1, 2018, using the modified retrospective method. The new standard was applied to contracts that were not completed as of the adoption date. The Company recognized the cumulative effect of initially applying ASC 606 of
$0.1 million
as an adjustment to the opening balance of accumulated deficit. The comparative information has not been restated and continues to be presented according to accounting standards in effect for those periods. Refer to
Note 2, Revenue and Contracts with Customers,
for additional information.
The following table summarizes the cumulative effect of the changes to the Company’s consolidated balance sheet as of January 1, 2018, from the adoption of ASC 606 (in millions):
|
|
Balance at December 31, 2017
|
Adjustment for ASC 606
|
Balance at
January 1, 2018
|
||||||||
|
Assets:
|
|||||||||||
|
Unbilled contract revenue
|
$
|
—
|
|
$
|
0.1
|
|
$
|
0.1
|
|
||
|
Stockholders’ Deficit:
|
|||||||||||
|
Accumulated Deficit
|
(284.5
|
)
|
0.1
|
|
(284.4
|
)
|
|||||
The following table summarizes the impact of adopting ASC 606 on revenue and net loss for the year ended December 31, 2018 (in millions):
|
Year Ended
December 31, 2018
|
||||||||||||
|
|
As Reported
|
Under Previous Accounting
|
Effect of Adoption
|
|||||||||
|
Revenue
|
$
|
193.0
|
|
$
|
193.1
|
|
$
|
(0.1
|
)
|
|||
|
Net loss
|
(104.1
|
)
|
(104.0
|
)
|
(0.1
|
)
|
||||||
The effect of adoption for the year ended December 31, 2018, includes the opening balance adjustment of $0.1 million.
78
In March 2017, the FASB issued ASU 2017-07,
Compensation-Retirement Benefits (Topic 715): Improving the Presentation of Net Periodic Pension Cost and Net Periodic Postretirement Benefit Cost
. ASU 2017-07 requires changes to the presentation of the components of net periodic benefit cost on the statement of operations by requiring service cost to be presented with other employee compensation costs and other components of net periodic benefit cost to be presented outside of any subtotal of operating income. The Company adopted this standard on January 1, 2018, on a retrospective basis for all periods presented, and certain prior period amounts have been recast to conform with the current presentation as follows (in millions):
|
|
Year Ended
December 31, 2017
|
|||||||||||
|
|
As Previously Reported
|
Adjustments
|
Current Presentation
|
|||||||||
|
Cost of sales - separative work units and uranium
|
$
|
136.1
|
|
$
|
26.6
|
|
$
|
162.7
|
|
|||
|
Selling, general and administrative
|
43.1
|
|
0.6
|
|
43.7
|
|
||||||
|
Nonoperating components of net periodic benefit expense (income)
|
—
|
|
(27.2
|
)
|
(27.2
|
)
|
||||||
Refer to
Note 11, Pension and Postretirement Health and Life Benefits,
for additional information.
In August 2016, the FASB issued ASU 2016-15,
Statement of Cash Flows (Topic 230): Classification of Certain Cash Receipts and Cash Payments
. ASU 2016-15 addresses the presentation and classification of certain cash receipts and cash payments in the statement of cash flows. It is intended to reduce diversity in practice by providing guidance on eight specific cash flow issues. ASU 2016-15 became effective for the Company on January 1, 2018. Upon adoption, the Company reclassified $9.0 million of transaction costs incurred in the first quarter of 2017 related to the note exchange (see
Note 9, Debt
) in the statement of cash flows as follows (in millions):
|
|
Year Ended
December 31, 2017
|
||||||||||
|
|
As Previously Reported
|
Adjustments
|
Current Presentation
|
||||||||
|
Cash used in operating activities
|
$
|
(25.1
|
)
|
$
|
9.0
|
|
$
|
(16.1
|
)
|
||
|
Cash used in financing activities
|
(31.0
|
)
|
(9.0
|
)
|
(40.0
|
)
|
|||||
In November 2016, the FASB issued ASU 2016-18,
Statement of Cash Flows (Topic 230): Restricted Cash
. ASU 2016-18 requires that the statement of cash flows explain the change during the period in the total of cash, cash equivalents, and amounts generally described as restricted cash or restricted cash equivalents. ASU 2016-18 is to be applied retrospectively for each period presented. The Company adopted the new standard on January 1, 2018. Upon adoption, the Company added its restricted cash balances to the consolidated statement of cash flows, and the prior period amounts have been recast to conform with the current presentation.
In October 2016, the FASB issued ASU 2016-16,
Income Taxes (Topic 740): Intra-Entity Transfers of Assets Other Than Inventory,
requiring the recognition of the current and deferred income taxes resulting from an intra-entity transfer of assets other than inventory when the transfer occurs. The Company adopted the new standard on January 1, 2018, on a modified retrospective basis. The adoption of ASU 2016-16 did not have a material impact on the Company’s consolidated financial statements, including the cumulative effect adjustment required upon adoption.
79
Accounting Standards Effective in Future Periods
In February 2016, the FASB issued ASU 2016-02,
Leases (Topic 842),
which requires lessees to recognize a right-of-use asset and lease liability on the balance sheet for all leases with terms longer than 12 months. Leases will be classified as either financing or operating, with classification affecting expense recognition in the statement of operations. The standard is effective for public companies for fiscal years, and interim periods within those fiscal years, beginning after December 15, 2018. The new guidance, as amended in July 2018 by ASU 2018-11,
Leases (Topic 842): Targeted Improvements,
requires a transition adoption election using either 1) a modified retrospective approach with periods prior to the adoption date being recast or 2) a prospective adoption approach with a cumulative-effect adjustment recognized to the opening balance of retained earnings on the adoption date with prior periods not recast. The Company is finalizing its evaluation of the impact of adoption and anticipates adopting this standard as of January 1, 2019, using the prospective adoption approach.
In February 2018, the FASB issued ASU 2018-02,
Income Statement-Reporting Comprehensive Income (Topic 220): Reclassification of Certain Tax Effects from Accumulated Other Comprehensive Income
. The amendments in ASU 2018-02 allow a reclassification from accumulated other comprehensive income to retained earnings for stranded tax effects resulting from the Tax Cut and Jobs Act of 2017 (the “Tax Act”). However, because the amendments only relate to the reclassification of the income tax effects of the Tax Act, the underlying guidance that requires that the effect of a change in tax laws or rates be included in income from continuing operations is not affected. The amendments in ASU 2018-02 are effective for all entities for fiscal years beginning after December 15, 2018, and interim periods within those fiscal years. Early adoption of the amendments is permitted. The Company is currently evaluating the effect of the standard on its Consolidated Financial Statements.
In August 2018, the FASB issued ASU 2018-14,
Compensation - Retirement Benefits - Defined Benefit Plans - General (Subtopic 715-20),
which modifies the disclosure requirements for employers that sponsor defined benefit pension plans and other postretirement plans. ASU 2018-14 is effective for public companies for fiscal years, and interim periods within those fiscal years, beginning after December 15, 2020. The standard is to be applied on a retrospective basis to all periods presented and early adoption is permitted. The Company is evaluating the effect that the provisions of ASU 2018-14 will have on its consolidated financial statements.
2. REVENUE AND CONTRACTS WITH CUSTOMERS
Disaggregation of Revenue
The following table presents revenue from SWU and uranium sales disaggregated by geographical region based on the billing addresses of customers (in millions):
|
Year Ended December 31,
|
|||||||
|
2018
|
2017
|
||||||
|
United States
|
$
|
112.7
|
|
$
|
111.5
|
|
|
|
Foreign:
|
|||||||
|
Belgium
|
35.2
|
|
34.9
|
|
|||
|
Japan
|
3.1
|
|
49.0
|
|
|||
|
Other
|
13.4
|
|
—
|
|
|||
|
Revenue - SWU and uranium
|
$
|
164.4
|
|
$
|
195.4
|
|
|
Refer to
Note 18, Revenue by Geographic Area, Major Customers and Segment Information
for disaggregation of revenue by segment. Disaggregation by end-market is provided in Note 18 and the consolidated statements of operations. SWU and uranium sales are made primarily to electric utility customers. Contract services revenue resulted primarily from services provided to government contractors and, in the first quarter of 2018, the settlement with DOE and the U.S. government. SWU and uranium revenue is recognized at point of sale and contract services revenue is generally recognized over time.
80
Contract Balances
The following table represents changes in the Company’s contract assets and contract liabilities balances (in millions):
|
December 31,
2018
|
January 1, 2018
|
Year-To-Date Change
|
||||||||||
|
Contract assets
|
||||||||||||
|
Accounts receivable:
|
||||||||||||
|
Billed
|
$
|
50.4
|
|
$
|
60.2
|
|
$
|
(9.8
|
)
|
|||
|
Uranium feed receivable
|
9.8
|
|
—
|
|
9.8
|
|
||||||
|
Unbilled contract revenue
|
—
|
|
0.1
|
|
(0.1
|
)
|
||||||
|
Accounts receivable
|
$
|
60.2
|
|
$
|
60.3
|
|
$
|
(0.1
|
)
|
|||
|
Deferred costs associated with deferred revenue
|
$
|
134.9
|
|
$
|
122.3
|
|
$
|
12.6
|
|
|||
|
Contract liabilities
|
||||||||||||
|
Deferred revenue and advances from customers - current:
|
||||||||||||
|
Deferred revenue
|
$
|
204.5
|
|
$
|
172.5
|
|
$
|
32.0
|
|
|||
|
Advances from customers
|
—
|
|
19.3
|
|
(19.3
|
)
|
||||||
|
Deferred revenue and advances from customers - current
|
$
|
204.5
|
|
$
|
191.8
|
|
$
|
12.7
|
|
|||
|
Advances from customers - noncurrent
|
$
|
15.0
|
|
$
|
—
|
|
$
|
15.0
|
|
|||
Deferred cost and deferred revenue activity for the year ended December 31, 2018, follows (in millions):
|
|
Deferred Sales in the Period
|
Previously Deferred Sales Recognized in the Period
|
Year-To-Date Change
|
||||||||
|
Deferred costs associated with deferred revenue
|
$
|
25.4
|
|
$
|
(12.8
|
)
|
$
|
12.6
|
|
||
|
Deferred revenue
|
55.3
|
|
(23.3
|
)
|
32.0
|
|
|||||
In the second quarter of 2018, the Company received uranium valued at
$14.5 million
from a customer that elected to defer a SWU purchase obligation for a period greater than one year. Under the contract, the customer has not received title to SWU or LEU product from the Company. The liability to the customer is included in
Advances from Customers
, a noncurrent liability. In December 2018, the Company borrowed
$7.3 million
of SWU from a customer under terms which require repayment within 48 months. The Company recorded the SWU and the related liability for the borrowing using an average purchase price over the borrowing period. The liability to the customer is included in
Other Liabilities,
which is included in noncurrent liabilities.
On January 11, 2018, the Company entered into a settlement agreement with DOE and the U.S. government regarding breach of contract claims relating to work performed by the Company under contracts with DOE and subcontracts with DOE contractors. DOE agreed to settle all claims raised as part of and subsequent to the litigation, except with respect to certain claims for pension and postretirement benefits, for a total of
$24.0 million
and provide a complete close out of all such contracts and subcontracts settled under the settlement agreement without any further audit or review of the Company’s costs or incurred cost submissions. Prior to the settlement, the Company had a receivables balance related to the claims being settled of
$14.5 million
. In 2018, the Company (a) received
$4.7 million
from the U.S. government, (b) applied approximately
$19.3 million
of advances from the U.S.
81
government received in prior years against the receivables balance, and (c) recorded additional revenue of
$9.5 million
.
Revenue for the contract services segment, principally representing engineering and testing activities performed by the Company, as well as technical and resource support, is recognized over the contractual period as services are rendered. The contract services segment also includes limited services provided by Centrus to the DOE and its contractors at the Piketon site related to facilities the Company leases from DOE. In 2018, revenue for the contract services segment included
$9.5 million
under a January 2018 settlement agreement with DOE and the U.S. government.
Centrus and DOE have yet to fully settle the Company’s claims for reimbursements for certain pension and postretirement benefits costs related to past contract work performed for DOE. There is the potential for additional revenue to be recognized for this work pending the outcome of legal proceedings related to the Company’s claims for payment and the potential release of previously established valuation allowances on receivables. As a result of the application of fresh start accounting following the Company’s emergence from Chapter 11 bankruptcy on September 30, 2014, the receivables related to the Company’s claims for payment are carried at fair value as of September 30, 2014, which is net of the valuation allowances.
LEU Segment Order Book
The SWU component of LEU is typically bought and sold under long-term contracts with deliveries over several years. The Company’s agreements for natural uranium sales are generally shorter-term, fixed-commitment contracts. The Company’s order book sales under contract in the LEU segment (“order book”) extends to 2030. The order book represents the Company’s remaining performance obligations under these contracts and includes the
Deferred Revenue
amounts in the Contract Balances table above. The order book was
$1.0 billion
as of December 31, 2018, compared to
$1.3 billion
at December 31, 2017, reflecting completed deliveries and new contracts signed in 2018 and a rejection of a contract by a customer in bankruptcy proceedings. No other adjustments were required to the Company’s consolidated financial statements as a result of the contract rejection. Refer to
Note 16, Commitments and Contingencies
, for additional information regarding the customer and claims filed by the Company.
Most of
the Company’s
contracts provide for fixed purchases of SWU during a given year. T
he Company’s
estimate of the aggregate dollar amount of future SWU and uranium sales is partially based on customers’ estimates of the timing and size of their fuel requirements and other assumptions that are subject to change. For example, depending on the terms of specific contracts, the customer may be able to increase or decrease the quantity delivered within an agreed range. T
he Company’s
order book estimate is also based on
the Company’s
estimates of selling prices, which are subject to change. For example, depending on the terms of specific contracts, prices may be adjusted based on escalation using a general inflation index, published SWU price indicators prevailing at the time of delivery, and other factors, all of which are variable. T
he Company
uses external composite forecasts of future market prices and inflation rates in its pricing estimates.
Contract Modification
In 2018 the Company entered into an arrangement with a fabricator to facilitate a prior arrangement with a customer that resulted in a modification of its previous SWU sales arrangement with the customer. The product to be delivered under the modified arrangement is distinct and, therefore, the modification is being accounted for on a prospective basis. No revenue was recognized in 2018 from the customer as the distinct product was not delivered. Under the new arrangement, the Company made a payment to the customer of
$20.7 million
that is a contract asset, which will be recovered as payments are received from the customer for the remaining product delivery. The Company received
$21.1 million
in December 2018 that is a contract liability and the net of these amounts of
$0.4 million
is classified as a contract liability as of December 31, 2018, which is included in
Advances from Customers
, a noncurrent liability.
82
3. SPECIAL CHARGES
For the years ended December 31, 2018 and 2017, special charges totaled
$2.2 million
and
$9.5 million
, respectively, including advisory costs of
$0.1 million
and
$6.3 million
, respectively. In 2018 and 2017, advisory costs related to updating the Company’s information technology systems.
Workforce reductions have resulted from evolving business needs and the completion of the demonstration of American Centrifuge technology at the Company’s facility in Piketon, Ohio.
W
ithout mutual agreement between Centrus and DOE regarding other possible uses for the Piketon facility
, the remaining balance of termination benefits of
$3.2 million
related to the Pi
keton facility is expected to be paid in the third quarter of 2019 and is classified in
Accounts Payable and Accrued Liabilities
in the consolidated balance sheet. A summary of termination benefit activity an
d related liabilities follows (in millions):
|
Liability
Dec. 31,
2016
|
2017
|
Liability
Dec. 31,
2017
|
2018
|
Liability
Dec. 31,
2018
|
|||||||||||||||||||||||
|
Charges for Termination Benefits
|
Paid/
Settled
|
Charges for Termination Benefits
|
Paid/
Settled
|
||||||||||||||||||||||||
|
Workforce reductions:
|
|||||||||||||||||||||||||||
|
Evolving business needs
|
$
|
0.1
|
|
$
|
2.4
|
|
$
|
(1.7
|
)
|
$
|
0.8
|
|
$
|
2.1
|
|
$
|
(2.0
|
)
|
$
|
0.9
|
|
||||||
|
Piketon demonstration facility
|
5.4
|
|
1.1
|
|
(0.8
|
)
|
5.7
|
|
0.1
|
|
(2.6
|
)
|
3.2
|
|
|||||||||||||
|
Total
|
$
|
5.5
|
|
$
|
3.5
|
|
$
|
(2.5
|
)
|
$
|
6.5
|
|
$
|
2.2
|
|
$
|
(4.6
|
)
|
$
|
4.1
|
|
||||||
4. CASH, CASH EQUIVALENTS AND RESTRICTED CASH
The following table summarizes the Company’s cash, cash equivalents and restricted cash as presented on the consolidated balance sheet to amounts on the consolidated statement of cash flows (in millions):
|
December 31, 2018
|
December 31, 2017
|
||||||
|
Cash and cash equivalents
|
$
|
123.1
|
|
$
|
208.8
|
|
|
|
Deposits for financial assurance - current
|
30.3
|
|
16.3
|
|
|||
|
Deposits for financial assurance - noncurrent
|
6.3
|
|
19.7
|
|
|||
|
Total cash, cash equivalents and restricted cash
|
$
|
159.7
|
|
$
|
244.8
|
|
|
The following table provides additional detail regarding the Company’s deposits for financial assurance (in millions):
|
December 31, 2018
|
December 31, 2017
|
||||||||||||||
|
Current
|
Long-Term
|
Current
|
Long-Term
|
||||||||||||
|
NRC license
|
$
|
16.3
|
|
$
|
—
|
|
$
|
16.1
|
|
$
|
—
|
|
|||
|
DOE lease
|
13.8
|
|
—
|
|
—
|
|
13.5
|
|
|||||||
|
Workers compensation
|
—
|
|
6.0
|
|
—
|
|
5.9
|
|
|||||||
|
Other
|
0.2
|
|
0.3
|
|
0.2
|
|
0.3
|
|
|||||||
|
Total deposits for financial assurance
|
$
|
30.3
|
|
$
|
6.3
|
|
$
|
16.3
|
|
$
|
19.7
|
|
|||
83
Piketon Facility Obligations and Surety Bonds
Centrus commenced with the decontamination and decommissioning (“D&D”) of the Piketon demonstration facility in accordance with the NRC license requirements in 2016. Centrus has previously provided financial assurance to the NRC for the D&D work in the form of surety bonds that are fully cash collateralized by Centrus for
$16.3 million
. Centrus believes the D&D work required for elimination of financial assurance under NRC license requirements has been completed and is working with the NRC to have the surety bonds cancelled, which would permit the Company to receive the cash collateral.
Centrus leases the Piketon facility from DOE. At the conclusion of the lease on June 30, 2019, absent mutual agreement between Centrus and DOE regarding other possible uses for the facility, Centrus is obligated to return the facility to DOE in a condition that meets NRC license requirements and in the same condition as the facility was in when it was leased to Centrus (other than due to normal wear and tear). Centrus must remove all Company-owned capital improvements at the Piketon facility, unless otherwise consented to by DOE, by the conclusion of the lease term. The estimated cost for these lease termination obligations, included in
Accounts Payable and Accrued Liabilities
on the consolidated balance sheet, is
$1.6 million
and
$0.8 million
as of December 31, 2018, and December 31, 2017, respectively. Centrus has previously provided financial assurance to DOE for the lease turnover obligations in the form of surety bonds that are fully cash collateralized by Centrus for
$13.8 million
. Centrus expects to receive cash when these surety bonds are reduced and/or cancelled as the Company fulfills its lease turnover obligations.
Financial Assurance for Workers’ Compensation
The Company has provided financial assurance to states in which it was previously self-insured for workers’ compensation in accordance with the state requirements in the form of a surety bond and a letter of credit that are fully cash collateralized by Centrus for
$6.0 million
. The surety bond and letter of credit will be cancelled, and the Company expects to receive cash when each state determines the Company has no further workers’ compensation obligations.
84
5. INVENTORIES
Centrus holds uranium at licensed locations in the form of natural uranium and as the uranium component of LEU. Centrus also holds SWU as the SWU component of LEU at licensed locations (e.g., fabricators) to meet book transfer requests by customers. Fabricators process LEU into fuel for use in nuclear reactors. Components of inventories follow (in millions):
|
|
December 31, 2018
|
December 31, 2017
|
|||||||||||||||||||||
|
|
Current
Assets
|
Current
Liabilities
(a)
|
Inventories, Net
|
Current
Assets
|
Current
Liabilities
(a)
|
Inventories, Net
|
|||||||||||||||||
|
Separative work units
|
$
|
20.1
|
|
$
|
3.6
|
|
$
|
16.5
|
|
$
|
47.2
|
|
$
|
15.0
|
|
$
|
32.2
|
|
|||||
|
Uranium
|
109.6
|
|
99.4
|
|
10.2
|
|
105.9
|
|
62.9
|
|
43.0
|
|
|||||||||||
|
Total
|
$
|
129.7
|
|
$
|
103.0
|
|
$
|
26.7
|
|
$
|
153.1
|
|
$
|
77.9
|
|
$
|
75.2
|
|
|||||
|
(a)
|
Inventories owed to customers and suppliers, included in current liabilities, include SWU and uranium inventories owed to fabricators.
|
6. PROPERTY, PLANT AND EQUIPMENT
A summary of changes in property, plant and equipment follows (in millions):
|
December 31,
2017 |
Additions / (Depreciation)
|
Retirements
|
December 31,
2018 |
||||||||||||
|
Land
|
$
|
1.2
|
|
$
|
—
|
|
$
|
—
|
|
$
|
1.2
|
|
|||
|
Leasehold improvements
|
3.2
|
|
—
|
|
(0.7
|
)
|
2.5
|
|
|||||||
|
Machinery and equipment
|
1.3
|
|
0.1
|
|
(0.4
|
)
|
1.0
|
|
|||||||
|
Other
|
1.1
|
|
—
|
|
—
|
|
1.1
|
|
|||||||
|
Property, plant and equipment, gross
|
6.8
|
|
0.1
|
|
(1.1
|
)
|
5.8
|
|
|||||||
|
Accumulated depreciation
|
(1.9
|
)
|
(0.8
|
)
|
1.1
|
|
(1.6
|
)
|
|||||||
|
Property, plant and equipment, net
|
$
|
4.9
|
|
$
|
(0.7
|
)
|
$
|
—
|
|
$
|
4.2
|
|
|||
Depreciation expense was
$0.8 million
and
$1.4 million
for the years ended December 31, 2018 and 2017, respectively.
The Company sold assets and property in 2018 and 2017 related to its operations and the American Centrifuge project that were no longer needed (in millions):
|
Year Ended December 31,
|
|||||||
|
2018
|
2017
|
||||||
|
Sales of assets and property, net of auction fees and other costs
|
$
|
0.4
|
|
$
|
4.8
|
|
|
|
Less: net carrying value
|
—
|
|
(0.2
|
)
|
|||
|
Gain on sales of assets
|
$
|
0.4
|
|
$
|
4.6
|
|
|
|
Cash proceeds received
|
$
|
0.5
|
|
$
|
4.7
|
|
|
Cash proceeds for the years ended December 31, 2018 and 2017 include
$0.1 million
and
$0.2 million
, respectively, which were included in
Accounts Receivable
as of December 31 of the prior year.
85
7. INTANGIBLE ASSETS
Intangible assets originated from the Company’s reorganization and application of fresh start accounting as of the date the Company emerged from bankruptcy, September 30, 2014, and reflect the conditions at that time. The intangible asset related to the sales order book is amortized as the order book existing at emergence is reduced, principally as a result of deliveries to customers. The intangible asset related to customer relationships is amortized using the straight-line method over the estimated average useful life of
15
years. Amortization expense is presented below gross profit on the consolidated statements of operations. Intangible asset balances are as follows (in millions):
|
December 31, 2018
|
December 31, 2017
|
||||||||||||||||||||||
|
Gross Carrying Amount
|
Accumulated Amortization
|
Net Amount
|
Gross Carrying Amount
|
Accumulated Amortization
|
Net Amount
|
||||||||||||||||||
|
Sales order book
|
$
|
54.6
|
|
$
|
28.0
|
|
$
|
26.6
|
|
$
|
54.6
|
|
$
|
25.9
|
|
$
|
28.7
|
|
|||||
|
Customer relationships
|
68.9
|
|
19.5
|
|
49.4
|
|
68.9
|
|
14.9
|
|
54.0
|
|
|||||||||||
|
Total
|
$
|
123.5
|
|
$
|
47.5
|
|
$
|
76.0
|
|
$
|
123.5
|
|
$
|
40.8
|
|
$
|
82.7
|
|
|||||
The amount of amortization expense for intangible assets in each of the succeeding years is estimated to be as follows (in millions):
|
2019
|
$
|
5.4
|
|
|
2020
|
8.0
|
|
|
|
2021
|
8.8
|
|
|
|
2022
|
9.7
|
|
|
|
2023
|
8.3
|
|
|
|
Thereafter
|
35.8
|
|
|
|
Total
|
$
|
76.0
|
|
8. ACCOUNTS PAYABLE AND ACCRUED LIABILITIES
Components of accounts payable and accrued liabilities follow (in millions):
|
December 31,
|
|||||||
|
2018
|
2017
|
||||||
|
Trade payables
|
$
|
3.9
|
|
$
|
6.3
|
|
|
|
Compensation and employee benefits
|
21.0
|
|
17.4
|
|
|||
|
Postretirement health and life benefit obligations - current
|
15.4
|
|
14.7
|
|
|||
|
Severance
|
4.1
|
|
3.9
|
|
|||
|
Lease turnover obligations
|
1.6
|
|
1.8
|
|
|||
|
Accrued interest on 8% PIK Toggle Notes
|
0.6
|
|
0.2
|
|
|||
|
Other accrued liabilities
|
5.8
|
|
3.9
|
|
|||
|
Total accounts payable and accrued liabilities
|
$
|
52.4
|
|
$
|
48.2
|
|
|
86
9. DEBT
A summary of debt follows (in millions):
|
December 31, 2018
|
December 31, 2017
|
||||||||||||||||
|
Maturity
|
Current
|
Long-Term
|
Current
|
Long-Term
|
|||||||||||||
|
8.25% Notes:
|
Feb. 2027
|
||||||||||||||||
|
Principal
|
$
|
—
|
|
$
|
74.3
|
|
$
|
—
|
|
$
|
74.3
|
|
|||||
|
Interest
|
6.1
|
|
45.9
|
|
6.1
|
|
52.0
|
|
|||||||||
|
8.25% Notes
|
$
|
6.1
|
|
$
|
120.2
|
|
$
|
6.1
|
|
$
|
126.3
|
|
|||||
|
8% PIK Toggle Notes
|
Sep. 2019
(a)
|
$
|
26.7
|
|
$
|
—
|
|
$
|
—
|
|
$
|
31.3
|
|
||||
|
Less deferred issuance costs
|
—
|
|
—
|
|
—
|
|
0.1
|
|
|||||||||
|
8% PIK Toggle Notes
|
$
|
26.7
|
|
$
|
—
|
|
$
|
—
|
|
$
|
31.2
|
|
|||||
|
Total
|
$
|
32.8
|
|
$
|
120.2
|
|
$
|
6.1
|
|
$
|
157.5
|
|
|||||
(a) Maturity can be extended to September 2024 upon the satisfaction of certain funding conditions described in the applicable indenture.
December 6, 2018 Note Exchange
On December 6, 2018, Centrus entered into Exchange Agreements (the “Exchange Agreements”) with certain holders of the Company’s outstanding 8% PIK Toggle Notes. Under the terms of the Exchange Agreements, the Company exchanged
$6.3 million
aggregate principal amount of 8% PIK Toggle Notes for 398,638 shares of Class A Common Stock and approximately
$5.1 million
in cash, which included accrued and unpaid interest on the Notes. The Company recognized a gain on extinguishment of
$0.5 million
, which is net of transaction costs and previously deferred costs related to the 8% PIK Toggle Notes of less than
$0.1 million
. Refer to
Note 15, Stockholders’ Equity
for details related to the common stock.
February 14, 2017 Note Exchange
On February 14, 2017, pursuant to an exchange offer and consent solicitation, Centrus exchanged
$204.9 million
principal amount of the Company’s
8%
PIK Toggle Notes for
$74.3 million
principal amount of
8.25%
notes due February 2027 (the “8.25% Notes”),
104,574
shares of Series B Preferred Stock with a liquidation preference of
$1,000
per share, and
$27.6 million
of cash. The exchange is accounted for as a troubled debt restructuring under ASC Subtopic 470-60,
Debt-Troubled Debt Restructurings by Debtors
. The Company recognized the 8.25% Notes on the consolidated balance sheet as the sum of the principal balance and all future interest payments and recognized a gain of
$33.6 million
related to the note exchange for the quarter ended March 31, 2017, which is net of transaction costs of
$9.0 million
and previously deferred issuance costs related to the 8% PIK Toggle Notes of
$0.4 million
. Refer to
Note 15, Stockholders’ Equity
for details related to the preferred stock.
8.25% Notes
Interest on the 8.25% Notes is payable semi-annually in arrears as of February 28 and August 31 based on a 360-day year consisting of twelve 30-day months. The 8.25% Notes mature on February 28, 2027. As described above, all future interest payment obligations on the 8.25% Notes are included in the carrying value of the 8.25% Notes. As a result, the Company’s reported interest expense will be less than its contractual interest payments throughout the term of the 8.25% Notes. As of December 31, 2018, and December 31, 2017,
$6.1 million
of interest is recorded as current and classified as
Current Debt
in the consolidated balance sheet.
87
The 8.25% Notes rank equally in right of payment with all of the Company’s existing and future unsubordinated indebtedness other than its Issuer Senior Debt and our Limited Secured Acquisition Debt (each as defined below). The 8.25% Notes rank senior in right of payment to all of the Company’s existing and future subordinated indebtedness and to certain limited secured acquisition indebtedness of the Company (the “Limited Secured Acquisition Debt”). The Limited Secured Acquisition Debt includes (i) any indebtedness, the proceeds of which are used to finance all or a portion of an acquisition or similar transaction if any lender’s lien is solely limited to the assets acquired in such a transaction and (ii) any indebtedness, the proceeds of which are used to finance all or a portion of the American Centrifuge project or another next generation enrichment technology if any lender’s lien is solely limited to such assets,
provided that
a lien securing the 8.25% Notes that is junior with respect to the lien securing such indebtedness will be limited to the assets acquired with such Limited Secured Acquisition Debt.
The 8.25% Notes are subordinated in right of payment to certain indebtedness and obligations of the Company, as described in the 8.25% Notes Indenture (the “Issuer Senior Debt”), including (i) any indebtedness of the Company (inclusive of any indebtedness of Enrichment Corp.) under a future credit facility up to
$50 million
with a maximum net borrowing of
$40 million
after taking into account any minimum cash balance (unless a higher amount is approved with the consent of the holders of a majority of the aggregate principal amount of the 8.25% Notes then outstanding), (ii) any revolving credit facility to finance inventory purchases and related working capital needs, and (iii) any indebtedness of the Company to Enrichment Corp. under the secured intercompany notes.
The 8.25% Notes are guaranteed on a subordinated and limited basis by, and secured by substantially all of the assets of, Enrichment Corp. The Enrichment Corp. guarantee is a secured obligation and ranks equally in right of payment with all existing and future unsubordinated indebtedness of Enrichment Corp. (other than Designated Senior Claims (as defined below) and Limited Secured Acquisition Debt) and senior in right of payment to all existing and future subordinated indebtedness of Enrichment Corp. and Limited Secured Acquisition Debt. The Enrichment Corp. guarantee is subordinated in right of payment to certain obligations of, and claims against, Enrichment Corp. described in the 8.25% Notes Indenture (collectively, the “Designated Senior Claims”), including obligations and claims:
|
•
|
under a future credit facility up to $50 million with a maximum net borrowing of $40 million after taking into account any minimum cash balance;
|
|
•
|
under any revolving credit facility to finance inventory purchases and related working capital needs;
|
|
•
|
held by or for the benefit of the Pension Benefit Guaranty Corporation (“PBGC”) pursuant to any settlement (including any required funding of pension plans); and
|
|
•
|
under surety bonds or similar obligations held by or on behalf of the U.S. government pursuant to regulatory requirements.
|
The liens securing the Enrichment Corp. guarantee of the PIK Toggle Notes and the 8.25% Notes are pari passu with each other, and are junior in priority with respect to the lien securing Limited Secured Acquisition Debt, which is limited to the assets acquired with such Limited Secured Acquisition Debt.
8% PIK Toggle Notes
Interest on the 8% PIK Toggle Notes is payable semi-annually in arrears on March 31 and September 30 based on a 360-day year consisting of twelve 30-day months. The principal amount is increased by any payment of interest in the form of PIK payments. The Company has the option to pay up to 5.5% per annum of interest due on the 8% PIK Toggle Notes in the form of PIK payments. For the semi-annual interest periods in 2017 and 2018, the Company elected to pay interest in the form of PIK payments at 5.5% per annum. Financing costs for the issuance of the 8% PIK Toggle Notes were deferred and are being amortized on a straight-line basis, which approximates the effective interest method, over the life of the 8% PIK Toggle Notes. The 8% PIK Toggle Notes mature on September 20, 2019. However, the maturity date may be extended to September 30, 2024, upon the satisfaction of certain funding conditions described in the applicable indenture.
88
The 8% PIK Toggle Notes mature on September 30, 2019. However, the maturity date can be extended to September 30, 2024, upon the satisfaction of certain funding conditions described in the Indenture relating to the funding, under binding agreements, of (i) the American Centrifuge project or (ii) the implementation and deployment of a National Security Train Program utilizing American Centrifuge technology.
The 8% PIK Toggle Notes rank equally in right of payment with all existing and future unsubordinated indebtedness of the Company (other than the Issuer Senior Debt) and are senior in right of payment to all existing and future subordinated indebtedness of the Company. The 8% PIK Toggle Notes are subordinated in right of payment to the Issuer Senior Debt.
The 8% PIK Toggle Notes are guaranteed and secured on a subordinated, conditional, and limited basis by Enrichment Corp. Enrichment Corp. will be released from its guarantee without the consent of the holders of the 8% PIK Toggle Notes upon the occurrence of certain termination events (other than with respect to an unconditional interest claim), including (i) the involuntary termination by the Pension Benefit Guaranty Corporation (“PBGC”) of any of the qualified pension plans of the Company or Enrichment Corp, (ii) the cessation of funding prior to completion of our ongoing American Centrifuge test programs or (iii) both a decision by the Company to abandon American Centrifuge technology and either (1) the efforts by the Company to commercialize another next generation enrichment technology funded at least in part by new capital provided or to be provided by Enrichment Corp. have been terminated or are no longer being pursued or (2) the attainment of capital necessary to commercialize another next generation enrichment technology with respect to which the issuer is involved which does not include new capital provided or to be provided by Enrichment Corp.
The Enrichment Corp. guarantee ranks equally in right of payment with all existing and future unsubordinated indebtedness of Enrichment Corp. (other than the Designated Senior Claims and Limited Secured Acquisition Debt) and senior in right of payment to all existing and future subordinated indebtedness of Enrichment Corp. and Limited Secured Acquisition Debt. The Enrichment Corp. guarantee is subordinated in right of payment to the Designated Senior Claims.
89
10. FAIR VALUE
Fair value is the price that would be received from selling an asset or paid to transfer a liability in an orderly transaction between market participants at the measurement date. When determining the fair value of assets and liabilities, the following hierarchy is used in selecting inputs, with the highest priority given to Level 1, as these are the most transparent or reliable:
|
•
|
Level 1 – quoted prices for identical instruments in active markets.
|
|
•
|
Level 2 – quoted prices for similar instruments in active markets; quoted prices for identical or similar instruments in markets that are not active; and model-derived valuations in which all significant inputs are observable in active markets.
|
|
•
|
Level 3 – valuations derived using one or more significant inputs that are not observable.
|
Financial Instruments Recorded at Fair Value (in millions):
|
December 31, 2018
|
December 31, 2017
|
||||||||||||||||||||||||||||||
|
|
Level 1
|
Level 2
|
Level 3
|
Total
|
Level 1
|
Level 2
|
Level 3
|
Total
|
|||||||||||||||||||||||
|
Assets:
|
|
|
|
|
|
|
|
|
|||||||||||||||||||||||
|
Cash and cash equivalents
|
$
|
123.1
|
|
$
|
—
|
|
$
|
—
|
|
$
|
123.1
|
|
$
|
208.8
|
|
$
|
—
|
|
$
|
—
|
|
$
|
208.8
|
|
|||||||
|
Deferred compensation asset (a)
|
1.4
|
|
—
|
|
—
|
|
1.4
|
|
1.4
|
|
—
|
|
—
|
|
1.4
|
|
|||||||||||||||
|
Liabilities:
|
|
|
|
|
|
|
|
|
|
|
|
|
|||||||||||||||||||
|
Deferred compensation obligation (a)
|
$
|
1.4
|
|
$
|
—
|
|
$
|
—
|
|
$
|
1.4
|
|
$
|
1.4
|
|
$
|
—
|
|
$
|
—
|
|
$
|
1.4
|
|
|||||||
|
(a)
|
The deferred compensation obligation represents the balance of deferred compensation plus net investment earnings. The deferred compensation plan is funded through a rabbi trust. Trust funds are invested in mutual funds for which unit prices are quoted in active markets and are classified within Level 1 of the valuation hierarchy.
|
There were no transfers between Level 1, 2 or 3 during the periods presented.
Other Financial Instruments
As of
December 31, 2018
, and December 31, 2017, the balance sheet carrying amounts for
Accounts Receivable
,
Accounts Payable and Accrued Liabilities
(excluding the deferred compensation obligation described above), and
Payables under SWU Purchase Agreements
approximate fair value because of their short-term nature.
The carrying value and estimated fair value of long-term debt are as follows (in millions):
|
December 31, 2018
|
December 31, 2017
|
||||||||||||||
|
Carrying Value
|
Estimated Fair Value
(a)
|
Carrying Value
|
Estimated Fair Value
(a)
|
||||||||||||
|
8.25% Notes
|
$
|
126.3
|
|
(b)
|
$
|
57.9
|
|
$
|
132.4
|
|
(b)
|
$
|
61.7
|
|
|
|
8% PIK Toggle Notes
|
26.7
|
|
21.8
|
|
31.3
|
|
25.1
|
|
|||||||
(a)
Based on recent trading prices and bid/ask quotes as of or near the balance sheet date, which are considered Level 2 inputs based on the frequency of trading.
|
(b)
|
The carrying value of the 8.25% Notes consists of the principal balance of
$74.3 million
and the sum of current and noncurrent interest payment obligations until maturity. Refer to
Note 9, Debt
.
|
90
11. PENSION AND POSTRETIREMENT HEALTH AND LIFE BENEFITS
There are approximately
5,000
employees and retirees covered by qualified defined benefit pension plans providing retirement benefits based on compensation and years of service, and approximately
3,100
employees and retirees covered by postretirement health and life benefit plans. DOE retained the obligation for postretirement health and life benefits for workers who retired prior to July 28, 1998. Pursuant to non-qualified supplemental pension plans, Centrus provides certain executive officers additional retirement benefits in excess of qualified plan limits imposed by tax law based on a targeted benefit objective. Employees hired on or after September 1, 2008, who are not covered by a collective bargaining agreement that provides for participation do not participate in a qualified defined benefit pension plan or postretirement health and life benefit plans.
Changes in the projected benefit obligations and plan assets and the funded status of the plans follow:
|
Defined Benefit Pension Plans
|
Postretirement Health
and Life Benefit Plans
|
||||||||||||||
|
($ millions)
|
Year Ended December 31,
|
Year Ended December 31,
|
|||||||||||||
|
2018
|
2017
|
2018
|
2017
|
||||||||||||
|
Changes in Benefit Obligations:
|
|||||||||||||||
|
Obligations at beginning of period
|
$
|
817.9
|
|
$
|
814.6
|
|
$
|
170.7
|
|
$
|
192.8
|
|
|||
|
Actuarial (gains) losses, net
|
(50.8
|
)
|
32.8
|
|
(13.1
|
)
|
(24.8
|
)
|
|||||||
|
Service costs
|
3.4
|
|
3.7
|
|
—
|
|
—
|
|
|||||||
|
Interest costs
|
28.7
|
|
32.2
|
|
5.8
|
|
7.2
|
|
|||||||
|
Benefits paid
|
(57.5
|
)
|
(59.3
|
)
|
(11.8
|
)
|
(14.5
|
)
|
|||||||
|
Lump sum benefits paid
|
(4.8
|
)
|
(2.9
|
)
|
—
|
|
—
|
|
|||||||
|
Plan change
|
—
|
|
—
|
|
—
|
|
10.0
|
|
|||||||
|
Administrative expenses paid
|
(3.1
|
)
|
(3.2
|
)
|
—
|
|
—
|
|
|||||||
|
Obligations at end of period
|
733.8
|
|
817.9
|
|
151.6
|
|
170.7
|
|
|||||||
|
Changes in Plan Assets:
|
|||||||||||||||
|
Fair value of plan assets at beginning of period
|
654.6
|
|
634.1
|
|
1.8
|
|
7.7
|
|
|||||||
|
Actual return on plan assets
|
(40.2
|
)
|
84.4
|
|
—
|
|
0.1
|
|
|||||||
|
Company contributions
|
14.5
|
|
1.5
|
|
10.0
|
|
8.5
|
|
|||||||
|
Benefits paid
|
(57.5
|
)
|
(59.3
|
)
|
(11.8
|
)
|
(14.5
|
)
|
|||||||
|
Lump sum benefits paid
|
(4.8
|
)
|
(2.9
|
)
|
—
|
|
—
|
|
|||||||
|
Administrative expenses paid
|
(3.1
|
)
|
(3.2
|
)
|
—
|
|
—
|
|
|||||||
|
Fair value of plan assets at end of period
|
563.5
|
|
654.6
|
|
—
|
|
1.8
|
|
|||||||
|
Unfunded status at end of period
|
$
|
(170.3
|
)
|
$
|
(163.3
|
)
|
$
|
(151.6
|
)
|
$
|
(168.9
|
)
|
|||
|
Amounts recognized in assets and liabilities:
|
|||||||||||||||
|
Current liabilities
|
$
|
(1.4
|
)
|
$
|
(1.7
|
)
|
(15.4
|
)
|
(14.7
|
)
|
|||||
|
Noncurrent liabilities
|
(168.9
|
)
|
(161.6
|
)
|
(136.2
|
)
|
(154.2
|
)
|
|||||||
|
$
|
(170.3
|
)
|
$
|
(163.3
|
)
|
$
|
(151.6
|
)
|
$
|
(168.9
|
)
|
||||
|
Amounts in accumulated other comprehensive income (loss), pre-tax:
|
|||||||||||||||
|
Prior service cost (credit)
|
$
|
—
|
|
$
|
—
|
|
$
|
(2.4
|
)
|
$
|
(2.5
|
)
|
|||
|
Discount rate used to determine benefit obligations at end of period:
|
4.3
|
%
|
3.7
|
%
|
4.3
|
%
|
3.6
|
%
|
|||||||
91
The current liabilities reflect expected contributions for benefit payments for the non-qualified plans and the postretirement health and life benefit plans in the following year.
The discount rates above, rounded to the nearest 0.1%, are the estimated rates at which the benefit obligations could be effectively settled on the measurement date and are based on yields of high quality fixed income investments whose cash flows match the timing and amount of expected benefit payments of the plans.
Plan assets and benefit obligations are remeasured each year as of the balance sheet date resulting in differences between actual and projected results for the year. These actuarial gains and losses are recognized in the statement of operations in the fourth quarter. In addition, an interim remeasurement and recognition of gains or losses may be required for a plan during the year when lump sum payments exceed, or are expected to exceed, the sum of the service cost and interest cost components of the annual net periodic benefit cost for that plan for the current year. There were no interim remeasurements in 2018 and 2017.
The defined benefit pension plans currently allow for a lump sum payment option to (a) active employees who are terminated as a result of Company reductions
in
force and (b) periodically to terminated vested participants. The lump sum payment option was most recently extended through September 2019 to those terminated vested participants who have not yet begun receiving their benefits and have been terminated as a result of a reduction in force by the Company, or due to voluntary termination or involuntary termination, other than involuntary termination as a termination for cause.
Projected benefit obligations
are based on actuarial assumptions including possible future increases in compensation.
Accumulated benefit obligations
are based on actuarial assumptions but do not include possible future increases in compensation. Effective August 2013, accrued benefits under the defined benefit pension plans are fixed and no longer increase to reflect changes in compensation or company service. Therefore, the accumulated benefit obligation equaled the projected benefit obligation of
$733.8 million
and
$817.9 million
as of December 31, 2018 and 2017, respectively. As of December 31, 2018 and 2017, none of Centrus’ plans had fair value of plan assets in excess of accumulated benefit obligations.
92
Components of Net Periodic Benefit Costs and Other Amounts Recognized in Other Comprehensive Income (Loss)
The Company reports service costs for its defined benefit pension plans and its postretirement health and life benefit plans in
Cost of Sales
and
Selling, General and Administrative Expenses
. The remaining components of net periodic benefit credits (costs) are reported as
Nonoperating Components of Net Periodic Benefit Expense (Income).
|
Defined Benefit Pension Plans
|
Postretirement Health
and Life Benefit Plans
|
||||||||||||||
|
(in millions)
|
Year Ended December 31,
|
Year Ended December 31,
|
|||||||||||||
|
2018
|
2017
|
2018
|
2017
|
||||||||||||
|
Net Periodic Benefit (Credits) Costs
|
|||||||||||||||
|
Service costs
|
$
|
3.4
|
|
$
|
3.7
|
|
$
|
—
|
|
$
|
—
|
|
|||
|
Interest costs
|
28.7
|
|
32.2
|
|
5.8
|
|
7.2
|
|
|||||||
|
Expected return on plan assets (gains)
|
(41.0
|
)
|
(40.7
|
)
|
—
|
|
—
|
|
|||||||
|
Amortization of prior service costs (credits), net
|
—
|
|
—
|
|
(0.2
|
)
|
(0.1
|
)
|
|||||||
|
Actuarial (gains) losses, net
|
30.4
|
|
(10.9
|
)
|
(13.1
|
)
|
(24.9
|
)
|
|||||||
|
Loss on plan changes resulting from legal settlement
|
—
|
|
—
|
|
—
|
|
10.0
|
|
|||||||
|
Net periodic benefit (credits) costs
|
$
|
21.5
|
|
$
|
(15.7
|
)
|
$
|
(7.5
|
)
|
$
|
(7.8
|
)
|
|||
|
Other Changes in Plan Assets and Benefit Obligations Recognized in Other Comprehensive Income (Loss)
|
|||||||||||||||
|
Amortization of prior service (costs) credits, net
|
$
|
—
|
|
$
|
—
|
|
$
|
0.2
|
|
$
|
0.1
|
|
|||
|
Total loss recognized in other comprehensive income (loss), pre-tax
|
$
|
—
|
|
$
|
—
|
|
$
|
0.2
|
|
$
|
0.1
|
|
|||
|
Total recognized in net periodic benefit costs (income) and other comprehensive income (loss), pre-tax
|
$
|
21.5
|
|
$
|
(15.7
|
)
|
$
|
(7.3
|
)
|
$
|
(7.7
|
)
|
|||
Net periodic benefit costs include service and interest costs of providing pension benefits that are accrued over the years employees render service. Prior service costs or credits are amortized over the employees’ average remaining years of service from age 40 until the date of full benefit eligibility or the average expected future lifetime of all plan participants, as applicable. Participants in the postretirement health and life benefit plans are generally eligible for benefits at retirement after age 50 with 10 years of continuous credited service at the time of retirement.
Effective January 1, 2014, or for certain plan participants formerly represented by a collective bargaining unit, January 1, 2015, plan participants age 65 or older (“post-65”) have access to a range of medical plan choices with varying costs and benefits through a Medicare Exchange implemented by the Company. The Company provides an annual stipend for each of the post-65 retirees and post-65 spouses who enroll in the coverage through the exchange. Depending on the level of benefits elected by the participant, the participant may be required to make contributions in excess of the stipend amount.
The transition to the post-65 Medicare Exchange was reflected as a plan amendment that reduced plan obligations by $6.8 million as of December 31, 2014. This reduction in obligation was recognized in other comprehensive income in 2014 as a prior service credit. The prior service credit is being amortized into net periodic benefit cost as a credit over time. The post-65 Medicare Exchange stipend amount was increased for 2017. This increase in obligation of $3.6 million as of December 31, 2016, was recognized in other comprehensive income in 2016 as a prior service cost and is being amortized into net periodic benefit cost over time. The post-65 Medicare Exchange stipend amount was increased in 2018, as specified in a settlement agreement with the former collective bargaining unit. The settlement agreement also specifies the addition of catastrophic drug coverage effective January 1, 2019. The benefit enhancement for 2019 has been applied to all post-65 participants regardless of past representation by the collective bargaining agreement. The increase in obligation of $10.0 million as a result of the
93
settlement agreement was recognized in net periodic benefit costs in 2017 as a plan change resulting from a legal settlement and is reported in
Nonoperating Components of Net Periodic Benefit Expense (Income)
.
Assumptions Used to Determine Net Periodic Benefit Costs
|
Defined Benefit Pension Plans
|
Postretirement Health
and Life Benefit Plans
|
||||||
|
Year Ended December 31,
|
Year Ended December 31,
|
||||||
|
2018
|
2017
|
2018
|
2017
|
||||
|
Discount rate
|
4.3%
|
3.7%
|
4.3%
|
3.6%
|
|||
|
Expected return on plan assets
|
6.8%
|
6.8%
|
—
|
—
|
|||
The expected return on plan assets is based on the weighted average of long-term return expectations for the composition of the plans’ equity and debt securities. Expected returns on equity securities are based on historical long-term returns of equity markets. Expected returns on debt securities are based on the current interest rate environment.
Healthcare cost trend rates used to measure postretirement health benefit obligations follow:
|
December 31,
|
|||
|
2018
|
2017
|
||
|
Healthcare cost trend rate for the following year
|
6.0%
|
6.5%
|
|
|
Long-term rate that the healthcare cost trend rate gradually declines to
|
5%
|
5%
|
|
|
Year that the healthcare cost trend rate is expected to reach the long-term rate
|
2021
|
2021
|
|
A one-percentage-point change in the assumed healthcare cost trend rates would have an effect on the postretirement health benefit obligation and costs as follows:
|
(in millions)
|
One-Percentage Point
|
||||||
|
Increase
|
Decrease
|
||||||
|
Postretirement health benefit obligation
|
$
|
2.9
|
|
$
|
(2.7
|
)
|
|
|
Net periodic benefit costs (service and interest cost components only)
|
$
|
0.1
|
|
$
|
(0.1
|
)
|
|
Benefit Plan Assets
Independent advisors manage investment assets of Centrus’ defined benefit pension plans and postretirement health and life benefit plans. Centrus has the fiduciary responsibility for reviewing performance of the various investment advisors. The investment policy of the plans is to maximize portfolio returns within reasonable and prudent levels of risk in order to meet projected liabilities and maintain sufficient cash to make timely payments of all participant benefits. Risk is reduced by diversifying plan assets and following a strategic asset allocation approach. Asset classes and target weights are adjusted periodically to optimize the long-term portfolio risk/return tradeoff, to provide liquidity for benefit payments, and to align portfolio risk with the underlying obligations. The investment policy of the plans prohibits the use of leverage, direct investments in tangible assets, or any investment prohibited by applicable laws or regulations.
94
The allocation of plan assets between equity and debt securities and the target allocation range by asset category for the defined benefit pension plans follows:
|
December 31,
|
|||||||||
|
2018
|
2017
|
2019 Target
|
|||||||
|
Equity securities
|
48
|
%
|
49
|
%
|
40
|
-
|
60%
|
||
|
Debt securities
|
49
|
%
|
49
|
%
|
40
|
-
|
60%
|
||
|
Cash
|
3
|
%
|
2
|
%
|
0
|
-
|
5%
|
||
|
100
|
%
|
100
|
%
|
||||||
Prefunding for the postretirement health and life benefit plans was discontinued in 2012 and the remaining assets were invested in short-term bond funds as of December 31, 2017, and were expended in early 2018. Benefit costs of the postretirement health and life benefit plans are primarily funded as costs are incurred.
Plan assets are measured at fair value. Following are the plan investments as of December 31, 2018 and 2017, categorized by the fair value hierarchy levels described in
Note 10, Fair Value Measurements
:
|
Defined Benefit Pension Plans
|
|||||||||||||||||||||||||||||||
|
(in millions)
|
Level 1
|
Level 2
|
Level 3
|
Total
|
|||||||||||||||||||||||||||
|
2018
|
2017
|
2018
|
2017
|
2018
|
2017
|
2018
|
2017
|
||||||||||||||||||||||||
|
U.S. government securities
|
$
|
—
|
|
$
|
—
|
|
$
|
34.6
|
|
$
|
34.6
|
|
$
|
—
|
|
$
|
—
|
|
$
|
34.6
|
|
$
|
34.6
|
|
|||||||
|
Corporate debt
|
—
|
|
—
|
|
104.7
|
|
119.7
|
|
—
|
|
—
|
|
104.7
|
|
119.7
|
|
|||||||||||||||
|
Municipal bonds and non-U.S. government securities
|
—
|
|
—
|
|
2.0
|
|
3.5
|
|
—
|
|
—
|
|
2.0
|
|
3.5
|
|
|||||||||||||||
|
Mortgage and asset backed securities
|
—
|
|
—
|
|
4.2
|
|
0.3
|
|
—
|
|
—
|
|
4.2
|
|
0.3
|
|
|||||||||||||||
|
Fair value of investments by hierarchy level
|
$
|
—
|
|
$
|
—
|
|
$
|
145.5
|
|
$
|
158.1
|
|
$
|
—
|
|
$
|
—
|
|
$
|
145.5
|
|
$
|
158.1
|
|
|||||||
|
Investments measured at NAV (a)
|
416.1
|
|
494.7
|
|
|||||||||||||||||||||||||||
|
Accrued interest receivable
|
1.8
|
|
1.9
|
|
|||||||||||||||||||||||||||
|
Unsettled transactions
|
0.1
|
|
(0.1
|
)
|
|||||||||||||||||||||||||||
|
Plan assets
|
$
|
563.5
|
|
$
|
654.6
|
|
|||||||||||||||||||||||||
|
Postretirement Health and Life Benefit Plans
|
|||||||||||||||||||||||||||||||
|
(in millions)
|
Level 1
|
Level 2
|
Level 3
|
Total
|
|||||||||||||||||||||||||||
|
2018
|
2017
|
2018
|
2017
|
2018
|
2017
|
2018
|
2017
|
||||||||||||||||||||||||
|
Money market funds
|
$
|
—
|
|
$
|
—
|
|
$
|
—
|
|
$
|
—
|
|
$
|
—
|
|
$
|
—
|
|
$
|
—
|
|
$
|
—
|
|
|||||||
|
Bond mutual funds
|
—
|
|
1.8
|
|
—
|
|
—
|
|
—
|
|
—
|
|
—
|
|
1.8
|
|
|||||||||||||||
|
Fair value of investments by hierarchy level
|
$
|
—
|
|
$
|
1.8
|
|
$
|
—
|
|
$
|
—
|
|
$
|
—
|
|
$
|
—
|
|
$
|
—
|
|
$
|
1.8
|
|
|||||||
(a) Equity, bond and money market investments held in collective trusts are valued based on the net asset value (“NAV”) provided by the administrator of the funds. The NAV for each fund is based on the underlying assets owned by the fund, less any expenses accrued against the fund, divided by the number of fund shares outstanding. While the underlying investments are traded on an exchange, the funds are not. Fair values for the collective trust investments are measured using the NAVs as a practical expedient and are not categorized in the fair value hierarchy.
Level 1 assets consist of mutual funds and money market funds having a publicly available NAV.
Level 2 assets include investments in U.S. government agency securities, corporate and municipal debt that are valued based on estimated prices using observable, market-based inputs.
95
Benefit Plan Cash Flows
Centrus expects to contribute
$9.4 million
to the qualified defined benefit pension plans,
$1.4 million
to the non-qualified defined benefit pension plans and
$15.3 million
to the postretirement health and life benefit plans in 2019. There is no required contribution for the postretirement health and life benefit plans under Employee Retirement Income Security Act (“ERISA”).
Estimated future benefit plan payments follow (in millions):
|
Defined Benefit Pension Plans
|
Postretirement Health and Life Benefit Plans
|
||||||
|
2019
|
$
|
57.9
|
|
$
|
15.3
|
|
|
|
2020
|
56.0
|
|
13.9
|
|
|||
|
2021
|
54.8
|
|
13.2
|
|
|||
|
2022
|
53.6
|
|
12.6
|
|
|||
|
2023
|
52.4
|
|
12.1
|
|
|||
|
2024 to 2028
|
245.1
|
|
49.3
|
|
|||
Other Plans
Centrus sponsors a 401(k) defined contribution plan for employees. Employee contributions are matched at established rates. Amounts contributed are invested in a range of investment options available to participants and the funds are administered by an independent trustee. Matching cash contributions by the Company amounted to
$1.8 million
in 2018 and
$2.3 million
in 2017.
Under the Executive Deferred Compensation Plan, qualified employees may defer compensation on a tax-deferred basis subject to plan limitations. Any matching contributions under the Company’s 401(k) plan that are foregone due to annual compensation limitations of the Internal Revenue Code are eligible to be received from the Company under the Executive Deferred Compensation Plan, provided that the employee deferred
the maximum allowable pre-tax contribution in the 401(k) plan
. Centrus matching contributions amounted to less than $0.1 million in 2018 and 2017.
96
12. STOCK-BASED COMPENSATION
The Company’s 2014 Equity Incentive Plan authorizes the issuance of stock options, stock appreciation rights, restricted stock units, restricted stock, performance awards, dividend equivalent rights and other stock-based awards, as well as cash-based awards to employees, officers, directors and other individuals providing services to the Company or its affiliates. The plan authorizes the issuance of up to
1,200,000
shares of Class A Common Stock. As of December 31, 2018, there were approximately
596,000
shares available for future awards, including approximately
120,000
shares associated with awards that were cancelled or forfeited without being exercised.
A summary of stock-based compensation costs follows (in millions):
|
|
Year Ended December 31,
|
||||||
|
|
2018
|
2017
|
|||||
|
|
|||||||
|
Total stock-based compensation costs:
|
|||||||
|
Restricted stock units
|
$
|
0.1
|
|
$
|
0.1
|
|
|
|
Stock options
|
0.3
|
|
0.4
|
|
|||
|
Expense included in selling, general and administrative expense
|
$
|
0.4
|
|
$
|
0.5
|
|
|
|
Total recognized tax benefit
|
$
|
—
|
|
$
|
—
|
|
|
The total recognized tax benefit is reported at the federal statutory rate net of the tax valuation allowance.
Stock-based compensation cost is measured at the grant date, based on the fair value of the award, and is recognized on a straight-line basis over the requisite service period. As of December 31, 2018, there was
$0.1 million
of unrecognized compensation cost, adjusted for actual forfeitures, related to non-vested stock-based payments granted, of which
$0.1 million
relates to stock options and less than $0.1 million relates to restricted stock units. That cost is expected to be recognized over a weighted-average period of
3 months
. There were no stock options granted, exercised or forfeited during the years ended December 31, 2018 and 2017.
Restricted Stock Units
Non-employee, independent directors are granted restricted stock units as part of their compensation for serving on the Board of Directors. Settlement of these restricted stock units is made in shares of Class A Common Stock only upon the director’s retirement or other end of service. The restricted stock units generally vest over one year; however, vesting is accelerated upon (1) the director attaining eligibility for retirement, (2) termination of the director’s service by reason of death or disability, or (3) a change in control. As of December 31, 2018, approximately
141,000
shares of restricted stock units could potentially be converted to Class A Common Stock once vested and settled.
The fair value of restricted stock units is determined based on the closing price of Class A Common Stock on the grant date. Compensation cost for restricted stock units is amortized to expense on a straight-line basis over the vesting period.
Stock Options
The intrinsic value of an option, if any, represents the excess of the fair value of the common stock over the exercise price. The fair value of stock option awards is estimated using the Black-Scholes option pricing model, which includes a number of assumptions including Centrus’ estimates of stock price volatility, employee stock option exercise behaviors, future dividend payments, and risk-free interest rates.
97
The expected term of options granted is the estimated period of time from the beginning of the vesting period to the date of expected exercise or other settlement, based on historical exercises and post-vesting terminations. Centrus has estimated the expected term using the simplified method described in SEC Staff Accounting Bulletin No. 107/110,
Share-Based Payment
, due to the lack of historical exercise and post-vesting termination information available for the Company since its reorganization. Future stock price volatility is estimated based on the Company’s historical volatility. The risk-free interest rate for the expected option term is based on the U.S. Treasury yield curve in effect at the time of grant. No cash dividends are expected in the foreseeable future and, therefore, an expected dividend yield of zero is used in the option valuation model. For reporting periods prior to January 1, 2017, the Company used historical data to estimate pre-vesting option forfeitures at the time of grant and revised those estimates in subsequent periods if actual forfeitures differed from the estimates. Effective January 1, 2017, the Company recognizes forfeitures as they occur. Compensation expense is recognized for stock option awards that are expected to vest. There were no option grants in the years ended December 31, 2018 and 2017.
Stock options vest and become exercisable in equal annual installments over a three or four year period and expire ten years from the date of grant. A summary of stock option activity follows:
|
Stock Options (thousands)
|
Weighted Average Exercise Price
|
Weighted Average Remaining Contractual Life in Years
|
Aggregate Intrinsic Value (millions)
|
|||||
|
Outstanding at December 31, 2017
|
425
|
$4.14
|
7.3
|
$0.1
|
||||
|
Outstanding at December 31, 2018
|
425
|
$4.14
|
6.3
|
$—
|
||||
|
Exercisable at December 31, 2018
|
345
|
$4.11
|
6.3
|
$—
|
||||
Stock options outstanding and options exercisable at December 31, 2018, follow:
|
Stock Exercise Price
|
Options Outstanding (thousands)
|
Remaining Contractual Life in Years
|
Options Exercisable (thousands)
|
|||
|
$5.62
|
22
|
5.9
|
22
|
|||
|
$4.37
|
300
|
6.2
|
225
|
|||
|
$3.90
|
23
|
6.6
|
23
|
|||
|
$3.93
|
15
|
6.6
|
15
|
|||
|
$2.71
|
50
|
6.8
|
50
|
|||
|
$2.68
|
15
|
7.4
|
10
|
|||
98
13. INCOME TAXES
Benefit
The benefit from income taxes from continuing operations is as follows (in millions):
|
Year Ended December 31,
|
|||||||
|
2018
|
2017
|
||||||
|
Current:
|
|||||||
|
Federal
|
$
|
—
|
|
$
|
—
|
|
|
|
State and local
|
—
|
|
(0.1
|
)
|
|||
|
Foreign
|
—
|
|
—
|
|
|||
|
—
|
|
(0.1
|
)
|
||||
|
Deferred:
|
|||||||
|
Federal
|
—
|
|
—
|
|
|||
|
State and local
|
—
|
|
—
|
|
|||
|
Foreign
|
—
|
|
—
|
|
|||
|
—
|
|
—
|
|
||||
|
$
|
—
|
|
$
|
(0.1
|
)
|
||
Deferred Taxes
Future tax consequences of temporary differences between the carrying amounts for financial reporting purposes and the Company’s estimate of the tax bases of its assets and liabilities result in deferred tax assets and liabilities, as follows (in millions):
|
December 31,
|
|||||||
|
2018
|
2017
|
||||||
|
Deferred tax assets:
|
|||||||
|
Employee benefits costs
|
$
|
73.6
|
|
$
|
79.9
|
|
|
|
Inventory
|
11.1
|
|
2.4
|
|
|||
|
Property, plant and equipment
|
185.9
|
|
187.0
|
|
|||
|
Net operating loss and credit carryforwards
|
187.1
|
|
166.9
|
|
|||
|
Accrued expenses
|
0.9
|
|
0.9
|
|
|||
|
Long-term debt and financing costs
|
15.3
|
|
17.3
|
|
|||
|
Other
|
0.2
|
|
5.5
|
|
|||
|
474.1
|
|
459.9
|
|
||||
|
Valuation allowance
|
(456.6
|
)
|
(440.7
|
)
|
|||
|
Deferred tax assets, net of valuation allowance
|
$
|
17.5
|
|
$
|
19.2
|
|
|
|
Deferred tax liabilities:
|
|||||||
|
Intangible assets
|
$
|
16.0
|
|
$
|
17.7
|
|
|
|
Prepaid expenses
|
1.5
|
|
1.5
|
|
|||
|
Deferred tax liabilities
|
$
|
17.5
|
|
$
|
19.2
|
|
|
|
$
|
—
|
|
$
|
—
|
|
||
The valuation allowance reduces the net deferred tax assets to their net realizable value. There is a full valuation allowance against net deferred taxes due to annual operating losses since 2011 and substantial uncertainty to generate future taxable income that would lead to realization of the net deferred tax assets. When a change in the tax rate or tax law has an impact on deferred taxes, we apply the change based on the years in which the deferred taxes are expected to reverse. The Company records the impact of the change in its consolidated financial statements in the period of enactment. For the year ended December 31, 2017, the Company recorded a decrease in net deferred
99
tax assets before valuation allowance which resulted primarily from the remeasurement at
21%
in accordance with t
he
Tax Act. The ultimate realization of the net deferred tax assets is dependent upon generating sufficient taxable income in future years when deferred tax assets are recoverable or are expected to reverse.
The Company has federal net operating losses of
$791.3 million
generated through December 31, 2017 that currently expire through 2037. In addition, the Company has federal net operating losses and business interest expense carry forwards of
$89.2 million
and
$10.1 million
, respectively, generated after December 31, 2017, that do not expire. The Company has concluded that a full valuation allowance is needed for all federal net operating losses. In 2014, the federal net operating losses as well as other tax attributes consisting primarily of tax basis in property of approximately
$15.3 million
were reduced as a result of Centrus’ cancellation of debt income of approximately
$340 million
as prescribed by Internal Revenue Code Section 108. Centrus also has state net operating losses of
$0.3 million
that currently expire through 2038. The deferred tax assets for state net operating losses and state unrealized built-in loss deductions have been reduced as a result of Centrus’ tax ownership change and cancellation of debt income in 2014.
Centrus experienced an ownership change as defined under Internal Revenue Code Section 382 on September 30, 2014 when it emerged from bankruptcy. Generally, after an ownership change, the use of federal and state net operating loss carryforwards and tax credits generated prior to the ownership change are subject to an annual limitation. However, there is an exception available to qualifying corporations that eliminates the annual limitation. Centrus can utilize this exception for federal purposes, but not for state purposes. The pre-apportioned annual state limitation is
$2.9 million
. Centrus also had an unrealized built-in loss as of the ownership change date. To the extent this built-in loss is recognized during the five-year post-ownership change period through certain depreciation and loss deductions, the same annual limitation for loss and tax credit carryforwards also applies generally to a built-in loss when it is recognized, unless the exception applies. Centrus can utilize the same exception for federal purposes when the built-in loss is recognized, but not for state purposes. To the extent the built-in loss is recognized during the five-year post-ownership change period, the same pre-apportioned state limitation will apply so that the combination of loss carryforwards and recognized built-in losses cannot exceed $2.9 million annually.
Effective Tax Rate
A reconciliation of income taxes calculated based on the federal statutory income tax rate and the effective tax rate follows:
|
Year Ended December 31,
|
|||||
|
2018
|
2017
|
||||
|
Federal statutory tax rate
|
21
|
%
|
35
|
%
|
|
|
Valuation allowance against net deferred tax assets
|
(15
|
)
|
(2,156
|
)
|
|
|
State rate changes
|
(6
|
)
|
—
|
|
|
|
Executive compensation
|
(1
|
)
|
—
|
|
|
|
State income tax expense, net of federal benefit
|
1
|
|
1
|
|
|
|
Tax Cuts and Jobs Act of 2017
|
—
|
|
2,382
|
|
|
|
Gain on early extinguishment of debt
|
—
|
|
(268
|
)
|
|
|
Interest expense
|
—
|
|
4
|
|
|
|
Other non-deductible expenses
|
—
|
|
1
|
|
|
|
Effective tax rate
|
—
|
%
|
(1
|
)%
|
|
The Tax Act enacted on December 22, 2017 reduced the U.S. federal corporate income tax rate from
35%
to
21%
, effective January 1, 2018. The SEC staff issued Staff Accounting Bulletin 118 (“SAB 118”), which provides guidance on accounting for the tax effects of the Tax Act. SAB 118 provides a measurement period that should not extend beyond one year from the Tax Act enactment date for companies to complete the accounting under Accounting Standards Codification 740,
Income Taxes
(“ASC 740”). In accordance with SAB 118, a company must reflect the income tax effects of those aspects of the Tax Act for which the accounting under ASC 740 is complete. To the extent that a company’s accounting for certain income tax effects of the Tax Act is incomplete, but it can
100
determine a reasonable estimate, it must record a provisional estimate in the financial statements. The Company has completed its accounting for the tax effects of the Tax Act, and based on the Company’s net operating loss carryovers and full valuation allowance, there is no impact to its consolidated financial statements.
As a result of the reduction of the federal corporate income tax rate, the net deferred tax assets have been remeasured as of December 31, 2017. Primarily as a result of the remeasurement, the effective tax rate for the year ended December 31, 2017 includes a decrease to the net deferred tax assets of
$288.9 million
, or an increase to the effective tax rate of
2,382%
. The effective tax rate also includes a decrease to the valuation allowance against net deferred tax assets of
$261.5 million
, or a change to the effective tax rate of
(2,156)%
, and an adjustment to the gain on early extinguishment of debt of
$32.5 million
or a change to the effective tax rate of
(268)%
. The Tax Act did not affect the income tax provision for the year ended December 31, 2017.
The effective tax rate for the year ended December 31, 2018 includes an increase to the valuation allowance against net deferred tax assets of
$15.9 million
, or a change to the effective tax rate of
(15)%
, and a
$6 million
decrease to the state deferred tax assets resulting from state rate changes, or a change to the effective tax rate of
(6)%
.
Uncertain Tax Positions
Accounting standards require that a tax position meet a minimum recognition threshold in order for the related tax benefit to be recognized in the financial statements. The liability for unrecognized tax benefits, included in
Other Long-Term Liabilities
, was
$0.2 million
as of December 31, 2018 and
$0.3 million
as of December 31, 2017. If recognized, these tax benefits would impact the effective tax rate. As a result of changes to unrecognized tax benefits, the income tax provision (state tax, net of federal benefit) decreased
$0.1 million
during the years ended December 31, 2018 and December 31, 2017. The liability for unrecognized tax benefits in the table below relates to unrecognized state income tax benefits. Centrus believes that the liability for unrecognized tax benefits will not change significantly in the next 12 months.
A reconciliation of the beginning and ending amount of unrecognized tax benefits follows (in millions):
|
Year Ended December 31,
|
|||||||
|
2018
|
2017
|
||||||
|
Balance at beginning of the period
|
$
|
0.3
|
|
$
|
0.4
|
|
|
|
Additions to tax positions of current period
|
—
|
|
0.1
|
|
|||
|
Reductions to tax positions of prior years
|
(0.1
|
)
|
(0.2
|
)
|
|||
|
Balance at end of the period
|
$
|
0.2
|
|
$
|
0.3
|
|
|
Centrus and its subsidiaries file income tax returns with the U.S. government and various states and foreign jurisdictions. As of December 31, 2018, the federal and Maryland statutes of limitation are closed with respect to all tax years through 2014, and the Kentucky statute of limitations is closed with respect to all tax years through 2013.
Centrus recognizes accrued interest related to uncertain tax positions as a component of interest expense. Reversals of previously accrued interest for income taxes is typically offset against interest expense, but if the amount is significant, it is reclassified to interest income in the consolidated statement of operations. Centrus recognizes the increase or decrease of accrued penalties for income taxes as a component of selling, general and administrative expense in the consolidated statement of operations.
The impact of accrued interest and penalties for income taxes in the consolidated statement of operations was a reduction to expenses of less than
$0.1 million
for the years ended December 31, 2018 and 2017. Accrued interest and penalties for income taxes, included as a component of
Other Long-Term Liabilities
, totaled less than
$0.1 million
as of December 31, 2018 and 2017.
101
14. NET INCOME (LOSS) PER COMMON SHARE
Basic net income (loss) per common share is calculated by dividing income (loss) allocable to common stockholders by the weighted average number of shares of common stock outstanding during the period. In calculating diluted net income (loss) per common share, the number of shares is increased by the weighted average number of potential shares related to stock compensation awards. No dilutive effect is recognized in a period in which a net loss has occurred. The weighted average number of common and common equivalent shares used in the calculation of basic and diluted income (loss) per common share are as follows:
|
|
Year ended December 31,
|
||||||
|
2018
|
2017
|
||||||
|
Numerator (in millions):
|
|||||||
|
Net income (loss)
|
$
|
(104.1
|
)
|
$
|
12.2
|
|
|
|
Preferred stock dividends - undeclared and cumulative
|
7.8
|
|
6.9
|
|
|||
|
Net income (loss) allocable to common stockholders
|
$
|
(111.9
|
)
|
$
|
5.3
|
|
|
|
Denominator (in thousands):
|
|||||||
|
Average common shares outstanding - basic
|
9,151
|
|
9,081
|
|
|||
|
Potentially dilutive shares related to stock options and restricted stock units
(a)
|
—
|
|
—
|
|
|||
|
Average common shares outstanding - diluted
|
9,151
|
|
9,081
|
|
|||
|
Net income (loss) per common share (in dollars) - basic and diluted:
|
$
|
(12.23
|
)
|
$
|
0.58
|
|
|
|
(a) Common stock equivalents excluded from the diluted calculation as a result of a net loss in the period (in thousands)
|
23
|
|
—
|
|
|||
|
Options outstanding and considered anti-dilutive as their exercise price exceeded the average share market price (in thousands)
|
360
|
|
200
|
|
|||
15. STOCKHOLDERS’ EQUITY
Common Stock
The Company’s certificate of incorporation authorizes
20,000,000
shares of preferred stock, par value
$1.00
per share,
70,000,000
shares of Class A common stock,
$0.10
par value per share (the “Class A Common Stock”) and
30,000,000
shares of Class B common stock, $0.10 par value per share (the “Class B Common Stock,” and together with the Class A Common Stock, the “Common Stock”). The Company has issued
9,437,389
shares of Common Stock, consisting of
8,031,307
shares of Class A Common Stock and
1,406,082
shares of Class B Common Stock.
On December 6, 2018, Centrus issued
398,638
shares of Class A Common Stock with a $0.10 par value, as part of the securities exchange described in
Note 9, Debt
. The Class A Common Stock is recorded on the consolidated balance sheet at fair value less transaction costs, or
$0.8 million
, as of December 31, 2018.
A total of
38,751
shares of Class A Common Stock were issued in settlement of vested restricted stock units to three former members of the Board of Directors following the end of their service on May 31, 2017. Shares of Class B Common Stock that are sold in the market are automatically converted to shares of Class A Common Stock. In the twelve months ended December 31, 2017, a total of
30,318
shares of Class B Common Stock were sold in the market and converted to shares of Class A Common Stock as of December 31, 2017.
102
The Company has reserved
1,200,000
shares of Class A Common Stock under its management incentive plan, of which approximately
596,000
shares are available for future awards as of December 31, 2018. Refer to
Note 12,
Stock-Based Compensation
, for additional information.
The Class A Common Stock trades under the symbol “LEU” on the NYSE American trading platform.
The Class B Common Stock was issued to Toshiba America Nuclear Energy Corporation (“Toshiba”
)
and Babcock & Wilcox Investment Company (“B&W”) and has the same rights, powers, preferences and restrictions and ranks equally in all matters with the Class A Common Stock, except voting. Holders of Class B Common Stock are entitled to elect, in the aggregate, two members of the Board of Directors of the Company, subject to certain holding requirements.
Series B Preferred Stock
On February 14, 2017, Centrus issued
104,574
shares of Series B Preferred Stock as part of the securities exchange described in
Note 9, Debt
. The issuance of the Series B Preferred Stock was a non-cash financing transaction. The Series B Preferred Stock has a par value of
$1.00
per share and a liquidation preference of
$1,000
per share (the “Liquidation Preference”). The Series B Preferred Stock is recorded on the consolidated balance sheet at fair value less transaction costs, or
$4.6 million
, as of December 31, 2018, and December 31, 2017.
Holders of the Series B Preferred Stock are entitled to cumulative dividends of
7.5%
per annum of the Liquidation Preference. Centrus is obligated to pay cash dividends on the Series B Preferred Stock in an amount equal to the Liquidation Preference to the extent that dividends are declared by the Board and:
|
(a)
|
its pension plans and Enrichment Corp.’s pension plans are at least
90%
funded on a variable rate premium calculation in the current plan year;
|
|
(b)
|
its net income calculated in accordance with GAAP (excluding the effect of pension remeasurement) for the immediately preceding fiscal quarter exceeds
$7.5 million
;
|
|
(c)
|
its free cash flow (defined as the sum of cash provided by (used in) operating activities and cash provided by (used in) investing activities) for the immediately preceding four fiscal quarters exceeds
$35 million
;
|
|
(d)
|
the balance of cash and cash equivalents calculated in accordance with GAAP on the last day of the immediately preceding quarter would exceed
$150 million
after pro forma application of the dividend payment; and
|
|
(e)
|
dividends may be legally paid under Delaware law.
|
Centrus has not met these criteria for the periods from issuance through December 31, 2018, and has not declared, accrued or paid dividends on the Series B Preferred Stock as of December 31, 2018. Dividends on the Series B Preferred Stock are cumulative to the extent not paid at any quarter-end, whether or not declared and whether or not there are assets of the Company legally available for the payment of such dividends in whole or in part. As of December 31, 2018, the Series B Preferred Stock has an aggregate liquidation preference of
$119.3 million
including accumulated dividends of
$14.7 million
. As of December 31, 2017, the Series B Preferred Stock had an aggregate liquidation preference of
$111.5 million
, including accumulated dividends of
$6.9 million
.
Outstanding shares of the Series B Senior Preferred Stock are redeemable at the Company’s option, in whole or in part, for an amount of cash equal to the Liquidation Preference, plus an amount equal to the accrued and unpaid dividends, if any, whether or not declared, through date of redemption.
103
Rights Agreement
On April 6, 2016 (the “Effective Date”), the Company’s Board of Directors (the “Board”) adopted a Section 382 Rights Agreement (the “Rights Agreement”). The Board adopted the Rights Agreement in an effort to protect shareholder value by, among other things, attempting to protect against a possible limitation on the Company’s ability to use its net operating loss carryforwards and other tax benefits, which may be used to reduce potential future income tax obligations.
In connection with the adoption of the Rights Agreement, the Board declared a dividend of one preferred-share-purchase-right for each share of the Company’s Class A Common Stock and Class B Common Stock outstanding as of the Effective Date. The rights initially trade together with the common stock and are not exercisable. In the absence of further action by the Board, the rights would generally become exercisable and allow a holder to acquire shares of a new series of the Company’s preferred stock if any person or group acquires
4.99%
or more of the outstanding shares of the Company’s common stock, or if a person or group that already owns 4.99% or more of the Company’s Class A Common Stock acquires additional shares representing
0.5%
or more of the outstanding shares of the Company’s Class A Common Stock. The rights beneficially owned by the acquirer would become null and void, resulting in significant dilution in the ownership interest of such acquirer.
The Board may exempt any acquisition of the Company’s common stock from the provisions of the Rights Agreement if it determines that doing so would not jeopardize or endanger the Company’s use of its tax assets or is otherwise in the best interests of the Company. The Board also has the ability to amend or terminate the Rights Agreement prior to a triggering event.
Effective on February 14, 2017, in connection with the settlement and completion of the exchange offer and consent solicitation, the Company amended the Rights Agreement solely to exclude acquisitions of the Series B Preferred Stock issued as part of the exchange offer and consent solicitation from the definition of “Common Shares.”
The Company’s stockholders approved the Rights Agreement at the 2017 annual meeting of stockholders on May 31, 2017. Unless earlier terminated or extended in accordance with the Rights Agreement, the rights issued under the Rights Agreement expire on April 5, 2019.
Shares Outstanding
Changes in the number of shares outstanding are as follows:
|
|
Preferred Stock,
Series B
|
Common Stock,
Class A
|
Common Stock,
Class B
|
|||||
|
Balance at December 31, 2016
|
—
|
|
7,563,600
|
|
1,436,400
|
|
||
|
Issuance of Preferred Stock
|
104,574
|
|
—
|
|
—
|
|
||
|
Issuance of Class A Common Stock
|
—
|
|
38,751
|
|
—
|
|
||
|
Conversion of Common Stock from Class B to Class A
|
—
|
|
30,318
|
|
(30,318
|
)
|
||
|
Balance at December 31, 2017
|
104,574
|
|
7,632,669
|
|
1,406,082
|
|
||
|
Issuance of Class A Common Stock
|
—
|
|
398,638
|
|
—
|
|
||
|
Balance at December 31, 2018
|
104,574
|
|
8,031,307
|
|
1,406,082
|
|
||
104
16. COMMITMENTS AND CONTINGENCIES
Commitments under SWU Purchase Agreements
TENEX
A major supplier of SWU to the Company is the Russian government entity Joint Stock Company “TENEX” (“TENEX”). Under a 2011 agreement with TENEX, as amended, (the “Russian Supply Agreement”), the Company purchases SWU contained in LEU received from TENEX, and the Company delivers natural uranium to TENEX for the LEU’s uranium component. The LEU that the Company obtains from TENEX under the agreement is subject to quotas and other restrictions applicable to commercial Russian LEU.
The Russian Supply Agreement was originally signed with commitments through 2022 but was modified in 2015 to give the Company the right to reschedule certain quantities of SWU of the original commitments into the period 2023 and beyond, in return for the purchase of additional SWU in those years. If the Company exercises this right to reschedule in full during the remaining years of the contract’s original term, the Company will have a rescheduled post-2022 purchase commitment through 2028.
The Russian Supply Agreement provides that the Company must pay for all SWU in its minimum purchase obligation each year, even if it fails to submit orders for such SWU. The Company would then have the right to take the unordered SWU in the following year. Pricing terms for SWU under the Russian Supply Agreement are based on a combination of market-related price points and other factors. This formula is subject to an adjustment that the Company anticipates will reduce the unit costs of SWU under this contract for the duration of the contract.
Orano
On April 27, 2018, the Company entered into an agreement (the “Orano Supply Agreement”) with Orano Cycle (formerly, AREVA NC) (“Orano”) for the long-term supply to the Company of SWU contained in LEU, nominally commencing in 2023. Under the Agreement, the Company purchases SWU contained in LEU received from Orano, and the Company delivers natural uranium to Orano for the natural uranium feed material component of LEU. The Company may elect to begin to accept deliveries as early as 2021 or to defer the commencement of purchases until 2024 and has the option to extend the six-year purchase period for an additional two years. The Orano Supply Agreement provides significant flexibility to adjust purchase volumes, subject to annual minimums and maximums in fixed amounts that vary year by year. The pricing for the SWU purchased by the Company is determined by a formula that uses a combination of market-related price points and other factors, and is subject to certain floors and ceilings. Prices are payable in a combination of U.S. dollars and euros.
Nuclear Fuel Industries, Ltd
.
On August 28, 2018, Enrichment Corp. entered into an agreement with Nuclear Fuel Industries, Ltd. (“NFI”) pursuant to which Enrichment Corp. would make a one-time purchase of SWU and uranium from NFI for
$7.1 million
. In March 2019, Enrichment Corp. completed the purchase from NFI. Toshiba America Nuclear Energy Corporation (“TANE”) holds 718,200 shares (51%) of the Company’s Class B common stock and certain of the Company’s 8.25% senior notes due 2027. Each of NFI and TANE are wholly-owned, indirect subsidiaries of Toshiba Corporation.
105
Milestones Under the 2002 DOE-USEC Agreement
The Company and DOE signed an agreement dated June 17, 2002, as amended (the “2002 DOE-USEC Agreement”), pursuant to which the parties made long-term commitments directed at resolving issues related to the stability and security of the domestic uranium enrichment industry. DOE consented to the assumption by Centrus of the 2002 DOE-USEC Agreement and other agreements between the Company and DOE subject to an express reservation of all rights, remedies and defenses by DOE and Centrus under those agreements as part of the Company’s Chapter 11 bankruptcy process. The 2002 DOE-USEC Agreement requires Centrus to develop, demonstrate and deploy advanced enrichment technology in accordance with milestones and provides for remedies in the event of a failure to meet a milestone under certain circumstances.
DOE has specific remedies under the 2002 DOE-USEC Agreement if Centrus fails to meet a milestone that would adversely impact its ability to begin commercial operations of the American Centrifuge Plant on schedule, and such delay was within Centrus’ control or was due to its fault or negligence or if Centrus abandons or constructively abandons the commercial deployment of an advanced enrichment technology. These remedies include terminating the 2002 DOE-USEC Agreement, revoking Centrus’ access to DOE’s centrifuge technology that is required for the success of the American Centrifuge project, requiring Centrus to transfer certain rights in the American Centrifuge technology and facilities to DOE, and requiring Centrus to reimburse DOE for certain costs associated with the American Centrifuge project.
The 2002 DOE-USEC Agreement provides that if a delaying event beyond the control and without the fault or negligence of Centrus occurs that could affect Centrus’ ability to meet an American Centrifuge Plant milestone, DOE and Centrus will jointly meet to discuss in good faith possible adjustments to the milestones as appropriate to accommodate the delaying event. The Company notified DOE that it had not met the June 2014 milestone within the time period provided due to events beyond its control and without the fault or negligence of the Company. The assumption of the 2002 DOE-USEC Agreement provided for under the Plan of Reorganization did not affect the ability of either party to assert all rights, remedies and defenses under the agreement and all such rights, remedies and defenses are specifically preserved and all-time limits tolled expressly including all rights, remedies and defenses and time limits relating to any missed milestones. DOE and Centrus have agreed that all rights, remedies and defenses of the parties with respect to any missed milestones since March 5, 2014, including the June 2014 and November 2014 milestones, and all other matters under the 2002 DOE-USEC Agreement continue to be preserved, and that the time limits for each party to respond to any missed milestones continue to be tolled.
Legal Matters
On October 11, 2018, the Company’s subsidiaries, Enrichment Corp. and American Centrifuge Enrichment, LLC (“ACE”, together with Enrichment Corp., the “Company Subsidiaries”) filed proofs of claim in the U.S. Bankruptcy Court for the Northern District of Ohio (the “Bankruptcy Court”) against each of FirstEnergy Nuclear Operating Company (“FENOC”), FirstEnergy Nuclear Generation, LLC (“FENG,” and together with FENOC, the “FirstEnergy Contract Parties”), FirstEnergy Solutions Corp. (“FES”) and FirstEnergy Generation, LLC (“FG”) in the amount of approximately
$314 million
. The claims relate to damages arising from the rejection and breach of a long-term contract between the Company Subsidiaries and the FirstEnergy Contract Parties that was approved by the Bankruptcy Court and made effective as of July 26, 2018. The proofs of claim filed by the Company Subsidiaries include claims against FENOC and FENG based on their liability as parties to the contract that was rejected and breached. The proofs of claim filed by the Company Subsidiaries also include claims against FES and FG based on their liability under guaranties they issued that may obligate FES and FG to satisfy the rejection and breach of contract damages claims. No amounts have been recorded in the Company’s consolidated financial statements related to the claims.
Centrus is subject to various legal proceedings and claims, either asserted or unasserted, which arise in the ordinary course of business. While the outcome of these claims cannot be predicted with certainty, other than the above, Centrus does not believe that the outcome of any of these legal matters, individually and in the aggregate, will have a material adverse effect on its cash flows, results of operations or consolidated financial condition.
106
Lease Commitments
Expenses under operating leases for office space, equipment and the Piketon and Oak Ridge facilities amounted to
$3.3 million
and
$3.1 million
in 2018 and 2017, respectively. Future estimated minimum lease payments and expected lease administration payments for leases with remaining terms in excess of one year follow (in millions):
|
2019
|
$
|
0.9
|
|
|
2020
|
0.9
|
|
|
|
2021
|
0.9
|
|
|
|
2022
|
1.0
|
|
|
|
2023
|
1.0
|
|
|
|
Thereafter
|
3.8
|
|
|
|
$
|
8.5
|
|
|
Centrus has a lease with DOE for centrifuge testing facilities in Oak Ridge through December 2019. Centrus leases facilities in Piketon for the American Centrifuge Plant from DOE. The current five-year lease term is through June 2019. Centrus has the option to extend the lease term for additional five-year terms. DOE may terminate the lease for default, including if DOE is able to exercise its remedies with respect to the ACP under the 2002 DOE-USEC Agreement.
Centrus leases the office space for its corporate headquarters in Bethesda, Maryland through October 2027 with an option to extend for five years. In May 2017, Centrus entered into a lease through July 2021 for 6,000 square feet of additional office space in Waverly, Ohio. Centrus also has short-term leases for small areas of office space in Washington, DC and Tokyo, Japan.
17. ACCUMULATED OTHER COMPREHENSIVE INCOME (LOSS)
The sole component of accumulated other comprehensive income (loss) (“AOCI”) relates to activity in the accounting for pension and postretirement health and life benefit plans. The amortization of prior service costs (credits) are reclassified from AOCI and included in the computation of net periodic benefit cost as detailed in
Note 11, Pension and Postretirement Health and Life Benefits
.
18. REVENUE BY GEOGRAPHIC AREA, MAJOR CUSTOMERS AND SEGMENT INFORMATION
Revenue by customer location, including customers in a foreign country representing 10% or more of total revenue, follows (in millions):
|
Year Ended December 31,
|
|||||||
|
2018
|
2017
|
||||||
|
United States
|
$
|
141.3
|
|
$
|
134.5
|
|
|
|
Foreign:
|
|||||||
|
Belgium
|
35.2
|
|
34.9
|
|
|||
|
Japan
|
3.1
|
|
49.0
|
|
|||
|
Other
|
13.4
|
|
—
|
|
|||
|
Total foreign
|
51.7
|
|
83.9
|
|
|||
|
Total revenue
|
$
|
193.0
|
|
$
|
218.4
|
|
|
107
In 2018, the Company’s 10 largest customers represented approximately
85%
of total revenue and its three largest customers represented approximately
52%
of total revenue. In the Company’s LEU segment, revenue from Florida Power and Light, Synatom, and South Carolina Electric & Gas represented approximately
21%
,
18%
,
13%
, respectively, of total revenue in 2018. In 2017, the Company’s 10 largest customers represented approximately
97%
of total revenue and its four largest customers represented approximately
53%
of total revenue. In our LEU segment, revenue from Synatom, Entergy, American Electric Power and South Carolina Electric & Gas represented approximately
16%
,
14%
,
12%
and
11%
, respectively, of total revenue in 2017. In the Company’s contract services segment, the U.S. government and its contractors represented approximately 12% of total revenue in 2018 and 11% in 2017, respectively. No other customer represented more than 10% of total revenue in 2018 or 2017.
Centrus has two reportable segments: the LEU segment with two components, SWU and uranium, and the contract services segment. The LEU segment includes sales of the SWU component of LEU, sales of both the SWU and uranium components of LEU, and sales of uranium. The contract services segment includes revenue and cost of sales for work that Centrus performs under a fixed price agreement as a contractor to UT-Battelle. The contract services segment also includes limited services provided by Centrus to DOE and its contractors at the Piketon facility. Gross profit is Centrus’ measure for segment reporting. There were no intersegment sales in the periods presented.
The Company’s revenue and gross profit by segment are as follows (in millions):
|
|
Year Ended December 31,
|
||||||
|
2018
|
2017
|
||||||
|
Revenue
|
|||||||
|
LEU segment:
|
|||||||
|
Separative work units
|
$
|
130.6
|
|
$
|
195.4
|
|
|
|
Uranium
|
33.8
|
|
—
|
|
|||
|
Total
|
164.4
|
|
195.4
|
|
|||
|
Contract services segment
|
28.6
|
|
23.0
|
|
|||
|
Total revenue
|
$
|
193.0
|
|
$
|
218.4
|
|
|
|
Segment Gross Profit (Loss)
|
|||||||
|
LEU segment
|
$
|
(23.3
|
)
|
$
|
32.7
|
|
|
|
Contract services segment
|
5.4
|
|
(2.5
|
)
|
|||
|
Gross profit (loss)
|
$
|
(17.9
|
)
|
$
|
30.2
|
|
|
The Company’s total assets are not presented for each reportable segment as they are not reviewed by, nor otherwise regularly provided to, the chief operating decision maker. Centrus’ long-term or long-lived assets, which include property, plant and equipment and other assets reported on the consolidated balance sheet, were located in the United States as of December 31, 2018, and December 31, 2017.
108
19. QUARTERLY RESULTS OF OPERATIONS (Unaudited)
(in millions, except per share data)
|
2018
|
|||||||||||||||||||
|
1st Qtr.
|
2nd Qtr.
|
3rd Qtr.
|
4th Qtr.
|
Year
|
|||||||||||||||
|
Revenue
|
$
|
35.7
|
|
$
|
39.4
|
|
$
|
34.1
|
|
$
|
83.8
|
|
$
|
193.0
|
|
||||
|
Cost of sales
|
41.3
|
|
49.8
|
|
26.3
|
|
93.5
|
|
210.9
|
|
|||||||||
|
Gross profit (loss)
|
(5.6
|
)
|
(10.4
|
)
|
7.8
|
|
(9.7
|
)
|
(17.9
|
)
|
|||||||||
|
Advanced technology license and decommissioning costs
|
7.7
|
|
5.7
|
|
5.8
|
|
6.9
|
|
26.1
|
|
|||||||||
|
Selling, general and administrative
|
11.2
|
|
9.7
|
|
8.8
|
|
10.2
|
|
39.9
|
|
|||||||||
|
Amortization of intangible assets
|
1.3
|
|
1.5
|
|
1.7
|
|
2.1
|
|
6.6
|
|
|||||||||
|
Special charges for workforce reductions and advisory costs
|
0.6
|
|
0.3
|
|
0.6
|
|
0.7
|
|
2.2
|
|
|||||||||
|
Gains on sales of assets
|
(0.1
|
)
|
(0.2
|
)
|
—
|
|
—
|
|
(0.3
|
)
|
|||||||||
|
Operating loss
|
(26.3
|
)
|
(27.4
|
)
|
(9.1
|
)
|
(29.6
|
)
|
(92.4
|
)
|
|||||||||
|
Gain on early extinguishment of debt
|
—
|
|
—
|
|
—
|
|
(0.5
|
)
|
(0.5
|
)
|
|||||||||
|
Nonoperating components of net periodic benefit expense (income)
|
(1.6
|
)
|
(1.7
|
)
|
(1.6
|
)
|
15.5
|
|
10.6
|
|
|||||||||
|
Interest expense
|
1.0
|
|
1.0
|
|
1.0
|
|
1.1
|
|
4.1
|
|
|||||||||
|
Investment income
|
(0.6
|
)
|
(0.6
|
)
|
(0.7
|
)
|
(0.6
|
)
|
(2.5
|
)
|
|||||||||
|
Income tax benefit
|
(0.1
|
)
|
—
|
|
—
|
|
0.1
|
|
—
|
|
|||||||||
|
Net loss
|
$
|
(25.0
|
)
|
$
|
(26.1
|
)
|
$
|
(7.8
|
)
|
$
|
(45.2
|
)
|
$
|
(104.1
|
)
|
||||
|
Preferred stock dividends - undeclared and cumulative
|
1.9
|
|
2.0
|
|
1.9
|
|
2.0
|
|
7.8
|
|
|||||||||
|
Net loss allocable to common stockholders
|
$
|
(26.9
|
)
|
$
|
(28.1
|
)
|
$
|
(9.7
|
)
|
$
|
(47.2
|
)
|
$
|
(111.9
|
)
|
||||
|
Net loss per share - basic and diluted
|
$
|
(2.97
|
)
|
$
|
(3.08
|
)
|
$
|
(1.06
|
)
|
$
|
(5.10
|
)
|
$
|
(12.23
|
)
|
||||
|
2017
|
|||||||||||||||||||
|
1st Qtr.
|
2nd Qtr.
|
3rd Qtr.
|
4th Qtr.
|
Year
|
|||||||||||||||
|
Revenue
|
$
|
7.2
|
|
$
|
44.0
|
|
$
|
50.3
|
|
$
|
116.9
|
|
$
|
218.4
|
|
||||
|
Cost of sales
|
10.1
|
|
48.7
|
|
39.0
|
|
90.4
|
|
188.2
|
|
|||||||||
|
Gross profit (loss)
|
(2.9
|
)
|
(4.7
|
)
|
11.3
|
|
26.5
|
|
30.2
|
|
|||||||||
|
Advanced technology license and decommissioning costs
|
6.1
|
|
4.4
|
|
4.5
|
|
0.7
|
|
15.7
|
|
|||||||||
|
Selling, general and administrative
|
12.4
|
|
9.7
|
|
11.0
|
|
10.6
|
|
43.7
|
|
|||||||||
|
Amortization of intangible assets
|
1.2
|
|
2.0
|
|
2.5
|
|
4.9
|
|
10.6
|
|
|||||||||
|
Special charges for workforce reductions and advisory costs
|
2.4
|
|
2.3
|
|
2.4
|
|
2.4
|
|
9.5
|
|
|||||||||
|
Gains on sales of assets
|
(1.0
|
)
|
(0.7
|
)
|
(0.6
|
)
|
(2.3
|
)
|
(4.6
|
)
|
|||||||||
|
Operating income (loss)
|
(24.0
|
)
|
(22.4
|
)
|
(8.5
|
)
|
10.2
|
|
(44.7
|
)
|
|||||||||
|
Gain on early extinguishment of debt
|
(33.6
|
)
|
—
|
|
—
|
|
—
|
|
(33.6
|
)
|
|||||||||
|
Nonoperating components of net periodic benefit expense (income)
|
(0.4
|
)
|
(0.4
|
)
|
(0.3
|
)
|
(26.1
|
)
|
(27.2
|
)
|
|||||||||
|
Interest expense
|
2.9
|
|
0.7
|
|
0.7
|
|
1.0
|
|
5.3
|
|
|||||||||
|
Investment income
|
(0.3
|
)
|
(0.3
|
)
|
(0.4
|
)
|
(0.3
|
)
|
(1.3
|
)
|
|||||||||
|
Income tax (benefit) expense
|
(0.2
|
)
|
—
|
|
—
|
|
0.1
|
|
(0.1
|
)
|
|||||||||
|
Net income (loss)
|
$
|
7.6
|
|
$
|
(22.4
|
)
|
$
|
(8.5
|
)
|
$
|
35.5
|
|
$
|
12.2
|
|
||||
|
Preferred stock dividends - undeclared and cumulative
|
1.0
|
|
2.0
|
|
2.0
|
|
1.9
|
|
6.9
|
|
|||||||||
|
Net income (loss) allocable to common stockholders
|
$
|
6.6
|
|
$
|
(24.4
|
)
|
$
|
(10.5
|
)
|
$
|
33.6
|
|
$
|
5.3
|
|
||||
|
Net income (loss) per share:
|
|||||||||||||||||||
|
Basic
|
$
|
0.73
|
|
$
|
(2.69
|
)
|
$
|
(1.15
|
)
|
$
|
3.69
|
|
$
|
0.58
|
|
||||
|
Diluted
|
$
|
0.72
|
|
$
|
(2.69
|
)
|
$
|
(1.15
|
)
|
$
|
3.69
|
|
$
|
0.58
|
|
||||
The calculation of net income (loss) per share on a dilutive basis is provided in
Note 14, Net Income (Loss) Per Share
. No dilutive effect is recognized in periods in which a net loss has occurred or in which the assumed conversion effect of options or convertible securities is anti-dilutive.
109
TABLE OF CONTENTS
Part IItem 1. BusinessItem 1A. Risk FactorsItem 1B. Unresolved Staff CommentsItem 2. PropertiesItem 3. Legal ProceedingsItem 4. Mine Safety DisclosuresPart IIItem 5. Market For Registrant S Common Equity, Related Stockholder Matters and Issuer Purchases Of Equity SecuritiesItem 6. Selected Financial DataItem 7. Management S Discussion and Analysis Of Financial Condition and Results Of OperationsNote 2, Revenue and Contracts with Customers,Note 2, Revenue and Contracts with CustomersNote 1, Summary Of Significant Accounting PoliciesNote 11, Pension and Postretirement Health and Life BenefitsNote 1, Summary Of Significant Accounting Policies,Note 9, Debt,Note 9, DebtNote 15, Stockholders Equity,Note 15, Stockholders EquityItem 7A. Quantitative and Qualitative Disclosures About Market RiskItem 8. Financial Statements and Supplementary DataItem 9. Changes in and Disagreements with Accountants on Accounting and Financial DisclosureItem 9A. Controls and ProceduresItem 9B. Other InformationPart IIIItem 10. Directors, Executive Officers and Corporate GovernanceItem 11. Executive CompensationItem 12. Security Ownership Of Certain Beneficial Owners and Management and Related Stockholder MattersItem 13. Certain Relationships and Related Transactions, and Director IndependenceItem 14. Principal Accounting Fees and ServicesPart IVItem 15. Exhibits and Financial Statement SchedulesItem 16. Form 10-k SummaryNote 4, Cash, Cash Equivalents and Restricted CashNote 16, Commitments and Contingencies,Note 11, Pension and Postretirement Health and Life Benefits,Note 18, Revenue By Geographic Area, Major Customers and Segment InformationNote 16, Commitments and ContingenciesNote 10, Fair Value MeasurementsNote 14, Net Income (loss) Per Share