CENTRUS ENERGY CORP
10-Ks and 10-Qs
|
|
|
|
|
|
|
|
|
|
|
|
|
|
|
|
|
|
|
|
|
|
|
|
|
|
|
|
|
|
|
|
|
|
|
|
|
|
|
|
|
|
|
|
|
|
|
|
|
|
|
|
|
UNITED STATES
SECURITIES AND EXCHANGE COMMISSION
Washington, D.C. 20549
FORM 10-Q
|
ý
|
QUARTERLY REPORT PURSUANT TO SECTION 13 OR 15(d) OF THE SECURITIES EXCHANGE ACT OF 1934
|
For the quarterly period ended
March 31, 2017
OR
|
o
|
TRANSITION REPORT PURSUANT TO SECTION 13 OR 15(d) OF THE SECURITIES EXCHANGE ACT OF 1934
|
Commission file number 1-14287
Centrus Energy Corp.
|
Delaware
|
52-2107911
|
|
(State of incorporation)
|
(I.R.S. Employer Identification No.)
|
6901 Rockledge Drive, Suite 800, Bethesda, Maryland 20817
(301) 564-3200
Indicate by check mark whether the registrant (1) has filed all reports required to be filed by Section 13 or 15(d) of the Securities Exchange Act of 1934 during the preceding 12 months (or for such shorter period that the registrant was required to file such reports), and (2) has been subject to such filing requirements for the past 90 days. Yes
ý
No
o
Indicate by check mark whether the registrant has submitted electronically and posted on its corporate Web site, if any, every Interactive Data File required to be submitted and posted pursuant to Rule 405 of Regulation S-T (§232.405 of this chapter) during the preceding 12 months (or for such shorter period that the registrant was required to submit and post such files). Yes
ý
No
o
Indicate by check mark whether the registrant is a large accelerated filer, an accelerated filer, a non-accelerated filer, a smaller reporting company or an emerging growth company. See the definitions of “large accelerated filer,” “accelerated filer,” and “smaller reporting company,” and “emerging growth company” in Rule 12b-2 of the Exchange Act.
|
Large accelerated filer
|
o
|
|
Smaller reporting company
|
ý
|
|
Accelerated filer
|
o
|
|
Emerging growth company
|
o
|
|
Non-accelerated filer
|
o
|
|||
If an emerging growth company, indicate by check mark if the registrant has elected not to use the extended transition period for complying with any new or revised financial accounting standards provided pursuant to Section 13(a) of the Exchange Act.
o
Indicate by check mark whether the registrant is a shell company (as defined in Rule 12b-2 of the Exchange Act).
Yes
o
No
ý
Indicate by check mark whether the registrant has filed all documents and reports required to be filed by Sections 12, 13 or 15(d) of the Securities Exchange Act of 1934 subsequent to the distribution of securities under a plan confirmed by a court.
Yes
ý
No
o
As of May 9, 2017, there were 7,563,600 shares of the registrant’s Class A Common Stock and 1,436,400 shares of the registrant’s Class B Common Stock outstanding.
TABLE OF CONTENTS
|
|
|
Page
|
|
|
PART I – FINANCIAL INFORMATION
|
|
|
|
|
|
|
|
||
|
|
||
|
|
||
|
|
||
|
|
||
|
|
||
|
|
||
|
|
|
|
|
|
PART II – OTHER INFORMATION
|
|
FORWARD-LOOKING STATEMENTS
This Quarterly Report on Form 10-Q, including
Management’s Discussion and Analysis of Financial Condition and Results of Operations
in Part I, Item 2, contains “forward-looking statements” within the meaning of Section 21E of the Securities Exchange Act of 1934 - that is, statements related to future events. In this context, forward-looking statements may address our expected future business and financial performance, and often contain words such as “expects”, “anticipates”, “intends”, “plans”, “believes”, “will”, “should”, “could”, “would” or “may” and other words of similar meaning. Forward-looking statements by their nature address matters that are, to different degrees, uncertain. For Centrus Energy Corp., particular risks and uncertainties that could cause our actual future results to differ materially from those expressed in our forward-looking statements include risks related to our significant long-term liabilities, including material unfunded defined benefit pension plan obligations and postretirement health and life benefit obligations; risks relating to our outstanding 8.0% paid-in-kind (“PIK”) toggle notes (the “8% PIK Toggle Notes”) maturing in September 2019, our 8.25% notes maturing in February 2027 (the “8.25% Notes”) and our Series B Senior Preferred Stock (the “Series B Preferred Stock”), including the potential termination of the guarantee by United States Enrichment Corporation (“Enrichment Corp.”) of the 8% PIK Toggle Notes; risks related to the limited trading markets in our securities; risks related to our ability to maintain the listing of our Class A Common Stock on the NYSE MKT LLC; risks related to the use of our net operating losses (“NOLs”) and net unrealized built-in losses (“NUBILs”) to offset future taxable income and the use of the Rights Agreement (as defined herein) to prevent an “ownership change” as defined in Section 382 of the Internal Revenue Code and our ability to generate taxable income to utilize all or a portion of the NOLs and NUBILs prior to the expiration thereof; the continued impact of the March 2011 earthquake and tsunami in Japan on the nuclear industry and on our business, results of operations and prospects; the impact and potential extended duration of the current supply/demand imbalance in the market for low-enriched uranium (“LEU”);
our dependence on others for
deliveries of LEU including deliveries from the Russian government entity Joint Stock Company “TENEX” (“TENEX”) under a commercial supply agreement with TENEX (the “Russian Supply Agreement”); risks related to our ability to sell
2
the LEU we procure pursuant to our purchase obligations under our supply agreements, including the Russian Supply Agreement; risks relating to our sales order book, including uncertainty concerning customer actions under current contracts and in future contracting due to market conditions and lack of current production capability; risks related to the value of our intangible assets related to the sales order book and customer relationships; risks associated with our reliance on third-party suppliers to provide essential services to us; pricing trends and demand in the uranium and enrichment markets and their impact on our profitability; movement and timing of customer orders; risks related to trade barriers and contract terms that limit our ability to deliver LEU to customers; risks related to actions that may be taken by the U.S. government, the Russian government or other governments that could affect our ability or the ability of our sources of supply to perform under their contract obligations to us, including the imposition of sanctions, restrictions or other requirements; the impact of government regulation including by the U.S. Department of Energy and the U.S. Nuclear Regulatory Commission; uncertainty regarding our ability to commercially deploy competitive enrichment technology; risks and uncertainties regarding funding for the American Centrifuge project and our ability to perform under our agreement with UT-Battelle, LLC, the management and operating contractor for Oak Ridge National Laboratory, for continued research and development of the American Centrifuge technology; the potential for further demobilization or termination of the American Centrifuge project; risks related to the current demobilization of portions of the American Centrifuge project, including risks that the schedule could be delayed and costs could be higher than expected; potential strategic transactions, which could be difficult to implement, disrupt our business or change our business profile significantly; the outcome of legal proceedings and other contingencies (including lawsuits and government investigations or audits); the
competitive environment for our products and services; changes in the nuclear energy industry; the impact of financial market conditions on our business, liquidity, prospects, pension assets and insurance facilities; revenue and operating results can fluctuate significantly from quarter to quarter, and in some cases, year to year; and other risks and uncertainties discussed in this and our other filings with the Securities and Exchange Commission, including our Annual Report on Form 10-K for the fiscal year ended December 31, 2016.
Readers are urged to carefully review and consider the various disclosures made in this report and in our other filings with the Securities and Exchange Commission that attempt to advise interested parties of the risks and factors that may affect our business. We do not undertake to update our forward-looking statements to reflect events or circumstances that may arise after the date of this Quarterly Report on Form 10-Q, except as required by law.
3
CENTRUS ENERGY CORP.
(in millions, except share and per share data)
|
|
March 31,
2017 |
December 31,
2016 |
|||||
|
ASSETS
|
|
|
|||||
|
Current assets
|
|
|
|||||
|
Cash and cash equivalents
|
$
|
151.7
|
|
$
|
260.7
|
|
|
|
Accounts receivable
|
5.8
|
|
19.9
|
|
|||
|
Inventories
|
143.6
|
|
177.4
|
|
|||
|
Deferred costs associated with deferred revenue
|
89.0
|
|
89.3
|
|
|||
|
Other current assets
|
14.7
|
|
13.3
|
|
|||
|
Total current assets
|
404.8
|
|
560.6
|
|
|||
|
Property, plant and equipment, net
|
5.6
|
|
6.0
|
|
|||
|
Deposits for surety bonds
|
29.6
|
|
29.5
|
|
|||
|
Intangible assets, net
|
92.1
|
|
93.3
|
|
|||
|
Other long-term assets
|
15.5
|
|
24.1
|
|
|||
|
Total assets
|
$
|
547.6
|
|
$
|
713.5
|
|
|
|
LIABILITIES AND STOCKHOLDERS’ DEFICIT
|
|
|
|
|
|||
|
Current liabilities
|
|
|
|
|
|||
|
Accounts payable and accrued liabilities
|
$
|
46.8
|
|
$
|
46.4
|
|
|
|
Payables under SWU purchase agreements
|
0.1
|
|
59.6
|
|
|||
|
Inventories owed to customers and suppliers
|
22.8
|
|
57.5
|
|
|||
|
Deferred revenue
|
123.3
|
|
123.6
|
|
|||
|
Decontamination and decommissioning obligations
|
34.9
|
|
38.6
|
|
|||
|
Total current liabilities
|
227.9
|
|
325.7
|
|
|||
|
Long-term debt
|
159.8
|
|
234.1
|
|
|||
|
Postretirement health and life benefit obligations
|
169.4
|
|
171.3
|
|
|||
|
Pension benefit liabilities
|
178.6
|
|
179.9
|
|
|||
|
Other long-term liabilities
|
35.8
|
|
38.6
|
|
|||
|
Total liabilities
|
771.5
|
|
949.6
|
|
|||
|
Commitments and contingencies (note 12)
|
|
|
|
|
|||
|
Stockholders’ deficit
|
|||||||
|
Preferred stock, par value $1.00 per share, 20,000,000 shares authorized
|
|||||||
|
Series A Participating Cumulative Preferred Stock, none issued
|
—
|
|
—
|
|
|||
|
Series B Senior Preferred Stock, 7.5% cumulative, 104,574 shares issued and outstanding and an aggregate liquidation preference of $105.6 million at March 31, 2017
|
4.6
|
|
—
|
|
|||
|
Class A Common Stock, par value $0.10 per share, 70,000,000 shares authorized, 7,563,600 shares issued and outstanding at March 31, 2017 and December 31, 2016
|
0.8
|
|
0.8
|
|
|||
|
Class B Common Stock, par value $0.10 per share, 30,000,000 shares authorized, 1,436,400 shares issued and outstanding at March 31, 2017 and December 31, 2016
|
0.1
|
|
0.1
|
|
|||
|
Excess of capital over par value
|
59.6
|
|
59.5
|
|
|||
|
Accumulated deficit
|
(289.1
|
)
|
(296.7
|
)
|
|||
|
Accumulated other comprehensive income, net of tax
|
0.1
|
|
0.2
|
|
|||
|
Total stockholders’ deficit
|
(223.9
|
)
|
(236.1
|
)
|
|||
|
Total liabilities and stockholders’ deficit
|
$
|
547.6
|
|
$
|
713.5
|
|
|
The accompanying notes are an integral part of these condensed consolidated financial statements.
4
CENTRUS ENERGY CORP.
(in millions, except share and per share data)
|
Three Months Ended
March 31, |
|||||||
|
2017
|
2016
|
||||||
|
Revenue:
|
|||||||
|
Separative work units
|
$
|
0.8
|
|
$
|
59.3
|
|
|
|
Uranium
|
—
|
|
14.3
|
|
|||
|
Contract services
|
6.4
|
|
16.4
|
|
|||
|
Total revenue
|
7.2
|
|
90.0
|
|
|||
|
Cost of Sales:
|
|||||||
|
Separative work units and uranium
|
2.3
|
|
65.5
|
|
|||
|
Contract services
|
7.4
|
|
8.7
|
|
|||
|
Total cost of sales
|
9.7
|
|
74.2
|
|
|||
|
Gross profit (loss)
|
(2.5
|
)
|
15.8
|
|
|||
|
Advanced technology license and decommissioning costs
|
6.1
|
|
12.0
|
|
|||
|
Selling, general and administrative
|
12.4
|
|
11.4
|
|
|||
|
Amortization of intangible assets
|
1.2
|
|
3.2
|
|
|||
|
Special charges for workforce reductions and advisory costs
|
2.4
|
|
—
|
|
|||
|
Gains on sales of assets
|
(1.0
|
)
|
(0.3
|
)
|
|||
|
Operating loss
|
(23.6
|
)
|
(10.5
|
)
|
|||
|
Gain on early extinguishment of debt
|
(33.6
|
)
|
—
|
|
|||
|
Interest expense
|
2.9
|
|
5.0
|
|
|||
|
Investment income
|
(0.3
|
)
|
(0.3
|
)
|
|||
|
Income (loss) before income taxes
|
7.4
|
|
(15.2
|
)
|
|||
|
Income tax benefit
|
(0.2
|
)
|
(0.6
|
)
|
|||
|
Net income (loss)
|
7.6
|
|
(14.6
|
)
|
|||
|
Preferred stock dividends - undeclared and cumulative
|
1.0
|
|
—
|
|
|||
|
Net income (loss) allocable to common stockholders
|
$
|
6.6
|
|
$
|
(14.6
|
)
|
|
|
Net income (loss) per common share:
|
|||||||
|
– Basic
|
$
|
0.73
|
|
$
|
(1.60
|
)
|
|
|
– Diluted
|
$
|
0.72
|
|
$
|
(1.60
|
)
|
|
|
Average number of common shares outstanding (in thousands):
|
|||||||
|
– Basic
|
9,063
|
|
9,063
|
|
|||
|
– Diluted
|
9,174
|
|
9,063
|
|
|||
The accompanying notes are an integral part of these condensed consolidated financial statements.
5
CENTRUS ENERGY CORP.
CONDENSED CONSOLIDATED STATEMENTS OF COMPREHENSIVE INCOME (LOSS)
(Unaudited)
(in millions)
|
|
Three Months Ended
March 31, |
||||||
|
|
2017
|
2016
|
|||||
|
Net income (loss)
|
$
|
7.6
|
|
$
|
(14.6
|
)
|
|
|
Other comprehensive loss, before tax (Note 13):
|
|||||||
|
Amortization of prior service credits, net
|
(0.1
|
)
|
(0.1
|
)
|
|||
|
Other comprehensive loss, before tax
|
(0.1
|
)
|
(0.1
|
)
|
|||
|
Income tax benefit related to items of other comprehensive income
|
—
|
|
—
|
|
|||
|
Other comprehensive loss, net of tax benefit
|
(0.1
|
)
|
(0.1
|
)
|
|||
|
Comprehensive income (loss)
|
$
|
7.5
|
|
$
|
(14.7
|
)
|
|
The accompanying notes are an integral part of these condensed consolidated financial statements.
6
CENTRUS ENERGY CORP.
(in millions)
|
|
Three Months Ended
March 31, |
||||||
|
|
2017
|
2016
|
|||||
|
Operating Activities
|
|
||||||
|
Net income (loss)
|
$
|
7.6
|
|
$
|
(14.6
|
)
|
|
|
Adjustments to reconcile net income (loss) to cash used in operating activities:
|
|||||||
|
Depreciation and amortization
|
1.4
|
|
3.6
|
|
|||
|
PIK interest on paid-in-kind toggle notes
|
0.8
|
|
3.4
|
|
|||
|
Gain on early extinguishment of debt
|
(33.6
|
)
|
—
|
|
|||
|
Gain on sales of assets
|
(1.0
|
)
|
(0.3
|
)
|
|||
|
Inventory valuation adjustments
|
—
|
|
0.5
|
|
|||
|
Changes in operating assets and liabilities:
|
|||||||
|
Accounts receivable
|
23.0
|
|
(29.4
|
)
|
|||
|
Inventories, net
|
(0.9
|
)
|
48.5
|
|
|||
|
Payables under SWU purchase agreements
|
(59.5
|
)
|
(61.0
|
)
|
|||
|
Deferred revenue, net of deferred costs
|
—
|
|
4.2
|
|
|||
|
Accounts payable and other liabilities
|
(18.4
|
)
|
(9.8
|
)
|
|||
|
Other, net
|
(1.4
|
)
|
—
|
|
|||
|
Cash used in operating activities
|
(82.0
|
)
|
(54.9
|
)
|
|||
|
Investing Activities
|
|||||||
|
Proceeds from sales of assets
|
0.6
|
|
0.6
|
|
|||
|
Cash provided by investing activities
|
0.6
|
|
0.6
|
|
|||
|
Financing Activities
|
|||||||
|
Repurchase of debt
|
(27.6
|
)
|
—
|
|
|||
|
Cash used in financing activities
|
(27.6
|
)
|
—
|
|
|||
|
Decrease in cash and cash equivalents
|
(109.0
|
)
|
(54.3
|
)
|
|||
|
Cash and cash equivalents at beginning of period
|
260.7
|
|
234.0
|
|
|||
|
Cash and cash equivalents at end of period
|
$
|
151.7
|
|
$
|
179.7
|
|
|
|
Supplemental cash flow information:
|
|||||||
|
Interest paid in cash
|
$
|
0.4
|
|
$
|
3.1
|
|
|
|
Non-cash activities:
|
|||||||
|
Conversion of interest payable-in-kind to long-term debt
|
$
|
0.8
|
|
$
|
3.4
|
|
|
The accompanying notes are an integral part of these condensed consolidated financial statements.
7
CENTRUS ENERGY CORP.
CONDENSED CONSOLIDATED STATEMENTS OF STOCKHOLDERS’ DEFICIT
(Unaudited)
(in millions, except per share data)
|
|
Preferred Stock,
Series B,
Par Value
$.10 per Share
|
Common Stock,
Class A,
Par Value
$.10 per Share
|
Common Stock,
Class B,
Par Value
$.10 per Share
|
Excess of
Capital Over
Par Value
|
Accumulated Deficit
|
Accumulated
Other Comprehensive Income
|
Total
|
||||||||||||||||||||
|
Balance at December 31, 2015
|
$
|
—
|
|
$
|
0.8
|
|
$
|
0.1
|
|
$
|
59.0
|
|
$
|
(229.7
|
)
|
$
|
4.1
|
|
$
|
(165.7
|
)
|
||||||
|
Net loss
|
—
|
|
—
|
|
—
|
|
—
|
|
(14.6
|
)
|
—
|
|
(14.6
|
)
|
|||||||||||||
|
Other comprehensive loss, net of tax benefit (Note 13)
|
—
|
|
—
|
|
—
|
|
—
|
|
—
|
|
(0.1
|
)
|
(0.1
|
)
|
|||||||||||||
|
Restricted stock units and stock options issued, net of amortization
|
—
|
|
—
|
|
—
|
|
0.2
|
|
—
|
|
—
|
|
0.2
|
|
|||||||||||||
|
Balance at March 31, 2016
|
$
|
—
|
|
$
|
0.8
|
|
$
|
0.1
|
|
$
|
59.2
|
|
$
|
(244.3
|
)
|
$
|
4.0
|
|
$
|
(180.2
|
)
|
||||||
|
Balance at December 31, 2016
|
$
|
—
|
|
$
|
0.8
|
|
$
|
0.1
|
|
$
|
59.5
|
|
$
|
(296.7
|
)
|
$
|
0.2
|
|
$
|
(236.1
|
)
|
||||||
|
Net income
|
—
|
|
—
|
|
—
|
|
—
|
|
7.6
|
|
—
|
|
7.6
|
|
|||||||||||||
|
Issuance of preferred stock
|
4.6
|
|
—
|
|
—
|
|
—
|
|
—
|
|
—
|
|
4.6
|
|
|||||||||||||
|
Other comprehensive loss, net of tax benefit (Note 13)
|
—
|
|
—
|
|
—
|
|
—
|
|
—
|
|
(0.1
|
)
|
(0.1
|
)
|
|||||||||||||
|
Restricted stock units and stock options issued, net of amortization
|
—
|
|
—
|
|
—
|
|
0.1
|
|
—
|
|
—
|
|
0.1
|
|
|||||||||||||
|
Balance at March 31, 2017
|
$
|
4.6
|
|
$
|
0.8
|
|
$
|
0.1
|
|
$
|
59.6
|
|
$
|
(289.1
|
)
|
$
|
0.1
|
|
$
|
(223.9
|
)
|
||||||
The accompanying notes are an integral part of these condensed consolidated financial statements.
8
CENTRUS ENERGY CORP.
NOTES TO CONDENSED CONSOLIDATED FINANCIAL STATEMENTS (Unaudited)
1. BASIS OF PRESENTATION
The unaudited condensed consolidated financial statements of Centrus Energy Corp. (“Centrus” or the “Company”), which include the accounts of the Company, its principal subsidiary United States Enrichment Corporation (“Enrichment Corp.”) and its other subsidiaries, as of and for the three months ended March 31, 2017 and 2016, have been prepared pursuant to the rules and regulations of the Securities and Exchange Commission (“SEC”). The condensed consolidated balance sheet as of December 31, 2016, was derived from audited consolidated financial statements, but does not include all disclosures required by generally accepted accounting principles in the United States (“GAAP”). The unaudited condensed consolidated financial statements reflect all adjustments that are, in the opinion of management, necessary for a fair statement of the financial results for the interim period. Certain information and notes normally included in financial statements prepared in accordance with GAAP have been omitted pursuant to such rules and regulations. All material intercompany transactions have been eliminated.
Operating results for the three months ended March 31, 2017, are not necessarily indicative of the results that may be expected for the year ending December 31, 2017. The unaudited condensed consolidated financial statements should be read in conjunction with the consolidated financial statements and related notes and
Management's Discussion and Analysis of Financial Condition and Results of Operations
included in the Annual Report on Form 10-K for the fiscal year ended December 31, 2016.
New Accounting Standards
In May 2014, the Financial Accounting Standards Board (the “FASB”) issued Accounting Standards Update (“ASU”) 2014-09,
Revenue from Contracts with Customers (Topic 606)
. ASU 2014-09 introduces a new five-step revenue recognition model in which an entity should recognize revenue to depict the transfer of promised goods or services to customers in an amount that reflects the consideration to which the entity expects to be entitled in exchange for those goods or services. ASU 2014-09 also requires disclosures sufficient to enable users to understand the nature, amount, timing, and uncertainty of revenue and cash flows arising from contracts with customers, including qualitative and quantitative disclosures about contracts with customers, significant judgments and changes in judgments, and assets recognized from the costs to obtain or fulfill a contract. The FASB issued amendments in 2015 and 2016 that clarify a number of specific issues as well as require additional disclosures. The revenue recognition standard will become effective for the Company beginning with the first quarter of 2018. The Company is evaluating the effect that the provisions of ASU 2014-09 will have on its consolidated financial statements.
In February 2016, the FASB issued ASU 2016-02,
Leases (Topic 842),
which requires lessees to recognize a right-of-use asset and lease liability on the balance sheet for all leases with terms longer than 12 months. Leases will be classified as either finance or operating, with classification affecting expense recognition in the statement of operations. ASU 2016-02 will become effective for the Company beginning in the first quarter of 2019, with early adoption permitted, and is to be applied using a modified retrospective approach. The Company is evaluating the effect that the provisions of ASU 2016-02 will have on its consolidated financial statements.
In March 2016, the FASB issued ASU 2016-09,
Stock Compensation - Improvements to Employee Share-Based Payment Accounting (Topic 718)
. ASU 2016-09 simplifies several aspects of the accounting for share-based payment transactions, including income tax consequences, classification of awards as either equity or liabilities, and classification on the statement of cash flows. ASU 2016-09 became effective for the Company in the first quarter of 2017. Under ASU 2016-09, entities are permitted to make an accounting policy election to either estimate forfeitures on share-based payment awards, as previously required, or to recognize forfeitures as they occur. The Company has elected to recognize forfeitures as they occur. The adoption of ASU 2016-09 did not have a material impact on the Company’s consolidated financial statements.
9
In August 2016, the FASB issued ASU 2016-15,
Statement of Cash Flows (Topic 230): Classification of Certain Cash Receipts and Cash Payments
. ASU 2016-15 addresses the presentation and classification of certain cash receipts and cash payments in the statement of cash flows. It is intended to reduce diversity in practice by providing guidance on eight specific cash flow issues. ASU 2016-15 will become effective for the Company beginning in the first quarter of 2018, with early adoption permitted, and is to be applied using a retrospective approach. The Company is evaluating the effect that the provisions of ASU 2016-15 will have on its consolidated financial statements.
In October 2016, the FASB issued ASU 2016-16,
Income Taxes (Topic 740): Intra-Entity Transfers of Assets Other Than Inventory,
requiring an entity to recognize the income tax consequences of an intra-entity transfer of an asset other than inventory when the transfer occurs. ASU 2016-16 will become effective for the Company beginning in the first quarter of 2018, with early adoption permitted. The Company is evaluating the effect that the provisions of ASU 2016-16 will have on its consolidated financial statements.
In November 2016, the FASB issued ASU 2016-18,
Statement of Cash Flows (Topic 230): Restricted Cash
. ASU 2016-18 requires that the statement of cash flows explain the change during the period in the total of cash, cash equivalents, and amounts generally described as restricted cash or restricted cash equivalents. ASU 2016-18 is to be applied retrospectively for each period presented, and will become effective for the Company beginning in the first quarter of 2018, with early adoption permitted. The Company is evaluating the effect that the provisions of ASU 2016-18 will have on its consolidated financial statements.
In March 2017, the FASB issued ASU 2017-07,
Compensation-Retirement Benefits (Topic 715): Improving the Presentation of Net Periodic Pension Cost and Net Periodic Postretirement Benefit Cost
. ASU 2017-07 requires changes to the presentation of the components of net periodic benefit cost on the statement of operations by requiring service cost to be presented with other employee compensation costs and other components of net periodic benefit cost to be presented outside of any subtotal of operating income. ASU 2017-07 also stipulates that only the service cost component of net benefit cost is eligible for capitalization in assets. The guidance will become effective for the Company beginning in the first quarter of 2018, with early adoption permitted. The Company is evaluating the effect that the provisions of ASU 2017-07 will have on its consolidated financial statements.
2. SPECIAL CHARGES
Evolving Business Needs
Evolving business needs have resulted in workforce reductions since 2013. In the three months ended March 31, 2017, special charges included estimated employee termination benefits of
$0.8 million
. Centrus expects to make related payments in the second and third quarters of 2017.
In the second quarter of 2016, the Company commenced a project to align its corporate structure to the scale of its ongoing business operations and to update related information technology systems. The Company incurred advisory costs of
$1.6 million
related to the reengineering project in the three months ended March 31, 2017.
Piketon Demonstration Facility
In September 2015, Centrus completed a successful three-year demonstration of its American Centrifuge technology at its facility in Piketon, Ohio. The demonstration effort was primarily funded by the U.S. government. As a result of reduced program funding, Centrus incurred a special charge in the third quarter of 2015 for estimated employee termination benefits. Of the remaining
$5.4 million
liability as of March 31, 2017,
$3.3 million
is classified as current and included in
Accounts Payable and Accrued Liabilities
in the condensed consolidated balance sheet. The remaining
$2.1 million
is included in
Other Long-Term Liabilities
and is expected to be paid through 2019.
10
A summary of termination benefit activity and related liabilities follows (in millions):
|
Liability
December 31,
2016
|
Three Months Ended
March 31, 2017
|
Liability
March 31,
2017
|
|||||||||||||||
|
Charges for Termination Benefits
|
Paid
|
||||||||||||||||
|
Workforce reductions:
|
|||||||||||||||||
|
Evolving business needs
|
$
|
0.1
|
|
$
|
0.8
|
|
$
|
(0.1
|
)
|
$
|
0.8
|
|
|||||
|
Piketon demonstration facility
|
5.4
|
|
—
|
|
—
|
|
5.4
|
|
|||||||||
|
$
|
5.5
|
|
$
|
0.8
|
|
$
|
(0.1
|
)
|
$
|
6.2
|
|
||||||
3. CONTRACT SERVICES AND ADVANCED TECHNOLOGY LICENSE AND DECOMMISSIONING COSTS
The contract services segment includes
Revenue
and
Cost of Sales
for engineering and testing work Centrus performs on the American Centrifuge technology under a government contract with UT-Battelle, LLC (“UT-Battelle”), the operator of Oak Ridge National Laboratory. The current contract between Centrus and UT-Battelle (the “2017 ORNL Contract”) is for the period from October 1, 2016, through September 30, 2017 and is valued at approximately
$25 million
. The 2017 ORNL Contract provides for payments for monthly reports of deliverables of approximately
$2.0 million
per month and additional aggregate payments of
$1.0 million
based on completion of certain milestones. The 2017 ORNL Contract is currently being funded incrementally. Funding for the program is provided to UT-Battelle by the U.S. government.
The Company’s contract with UT-Battelle that ended September 30, 2016 (the “2016 ORNL Contract”), provided for payments for monthly reports of deliverables of approximately
$2.7 million
per month. The 2016 ORNL Contract, which was signed in March 2016, provided for payments for reports related to work performed since October 1, 2015.
Revenue
in the three months ended March 31, 2016, includes
$8.1 million
for March 2016 reports on work performed in the three months ended December 31, 2015, and
$8.1 million
for reports on work performed in the three months ended March 31, 2016. Expenses for contract work performed in the three months ended March 31, 2016, are included in
Cost of Sales
. Expenses for work performed in the three months ended December 31, 2015, before entering into the 2016 ORNL Contract, were included in
Advanced Technology License and Decommissioning Costs
in 2015.
American Centrifuge expenses that are outside of the Company’s contracts with UT-Battelle are included in
Advanced Technology License and Decommissioning Costs,
including ongoing costs to maintain the demobilized Piketon facility and our licenses from the U.S. Nuclear Regulatory Commission (“NRC”) at that location. In the second quarter of 2016, the Company commenced the decontamination and decommissioning (“D&D”) of the Piketon facility in accordance with the requirements of NRC and the U.S. Department of Energy (“DOE”). Refer to
Note 12, Commitments and Contingencies
, for additional details.
11
4. RECEIVABLES
|
March 31,
2017 |
December 31,
2016 |
||||||
|
|
(in millions)
|
||||||
|
Utility customers and other
|
$
|
1.1
|
|
$
|
15.3
|
|
|
|
Contract services, primarily DOE
|
4.7
|
|
4.6
|
|
|||
|
Accounts receivable
|
$
|
5.8
|
|
$
|
19.9
|
|
|
Centrus formerly performed site services work under contracts with DOE at the former Portsmouth and Paducah gaseous diffusion plants. Overdue receivables from DOE of
$14.3 million
as of March 31, 2017, and
$22.8 million
as of December 31, 2016, are included in other long-term assets based on the extended timeframe expected to resolve the Company’s claims for payment.
Centrus has unapplied payments from DOE that may be used, at DOE’s direction, (a) to pay for future services provided by the Company, or (b) to reduce outstanding receivables balances due from DOE. The balance of unapplied payments of
$19.3 million
as of March 31, 2017, and December 31, 2016, is included in other long-term liabilities pending resolution of the long-term receivables from DOE described above.
5. INVENTORIES
Centrus holds uranium at licensed locations in the form of natural uranium and as the uranium component of low enriched uranium (“LEU”). Centrus also holds separative work units (“SWU”) as the SWU component of LEU at licensed locations (e.g., fabricators) to meet book transfer requests by customers. Fabricators process LEU into fuel for use in nuclear reactors. Components of inventories follow (in millions):
|
|
March 31, 2017
|
December 31, 2016
|
|||||||||||||||||||||
|
|
Current
Assets
|
Current
Liabilities
(a)
|
Inventories, Net
|
Current
Assets
|
Current
Liabilities
(a)
|
Inventories, Net
|
|||||||||||||||||
|
Separative work units
|
$
|
103.8
|
|
$
|
2.3
|
|
$
|
101.5
|
|
$
|
115.8
|
|
$
|
15.2
|
|
$
|
100.6
|
|
|||||
|
Uranium
|
39.6
|
|
20.5
|
|
19.1
|
|
61.4
|
|
42.3
|
|
19.1
|
|
|||||||||||
|
Materials and supplies
|
0.2
|
|
—
|
|
0.2
|
|
0.2
|
|
—
|
|
0.2
|
|
|||||||||||
|
|
$
|
143.6
|
|
$
|
22.8
|
|
$
|
120.8
|
|
$
|
177.4
|
|
$
|
57.5
|
|
$
|
119.9
|
|
|||||
|
(a)
|
Inventories owed to customers and suppliers, included in current liabilities, include SWU and uranium inventories owed to fabricators.
|
6. PROPERTY, PLANT AND EQUIPMENT
|
March 31,
2017 |
December 31,
2016 |
||||||
|
(in millions)
|
|||||||
|
Property, plant and equipment, gross
|
6.6
|
|
6.8
|
|
|||
|
Accumulated depreciation
|
(1.0
|
)
|
(0.8
|
)
|
|||
|
Property, plant and equipment, net
|
$
|
5.6
|
|
$
|
6.0
|
|
|
12
7. INTANGIBLE ASSETS
Intangible assets originated from the Company’s reorganization and application of fresh start accounting as of September 30, 2014. The intangible asset related to the sales order book is amortized as the order book valued at emergence is reduced, principally as a result of deliveries to customers. The intangible asset related to customer relationships is amortized using the straight-line method over the estimated average useful life of
15
years. Amortization expense is presented below gross profit on the condensed consolidated statements of operations.
|
March 31, 2017
|
December 31, 2016
|
||||||||||||||||||||||
|
(in millions)
|
|||||||||||||||||||||||
|
Gross Carrying Amount
|
Accumulated Amortization
|
Net Amount
|
Gross Carrying Amount
|
Accumulated Amortization
|
Net Amount
|
||||||||||||||||||
|
Sales order book
|
$
|
54.6
|
|
$
|
19.9
|
|
$
|
34.7
|
|
$
|
54.6
|
|
$
|
19.9
|
|
$
|
34.7
|
|
|||||
|
Customer relationships
|
68.9
|
|
11.5
|
|
57.4
|
|
68.9
|
|
10.3
|
|
58.6
|
|
|||||||||||
|
Total
|
$
|
123.5
|
|
$
|
31.4
|
|
$
|
92.1
|
|
$
|
123.5
|
|
$
|
30.2
|
|
$
|
93.3
|
|
|||||
A summary of long-term debt follows (in millions):
|
Maturity
|
March 31,
2017
|
December 31, 2016
|
|||||||
|
8.25% Notes:
|
Feb. 2027
|
||||||||
|
Principal
|
$
|
74.3
|
|
$
|
—
|
|
|||
|
Interest
|
61.5
|
|
—
|
|
|||||
|
8.25% Notes
|
135.8
|
|
—
|
|
|||||
|
8% PIK Toggle Notes
|
Sep. 2019
(a)
|
30.5
|
|
234.6
|
|
||||
|
Subtotal
|
166.3
|
|
234.6
|
|
|||||
|
Less deferred issuance costs
|
0.1
|
|
0.5
|
|
|||||
|
Total debt
|
166.2
|
|
234.1
|
|
|||||
|
Less current portion
|
6.4
|
|
—
|
|
|||||
|
Long-term debt
|
$
|
159.8
|
|
$
|
234.1
|
|
|||
(a) Maturity can be extended to September 2024 upon the satisfaction of certain funding conditions described below.
Note Exchange
On February 14, 2017, pursuant to an exchange offer and consent solicitation, Centrus exchanged
$204.9 million
principal amount of the Company’s
8%
paid-in-kind (“PIK”) toggle notes (the “8% PIK Toggle Notes”) for
$74.3 million
principal amount of
8.25%
notes due February 2027 (the “8.25% Notes”),
104,574
shares of Series B Preferred Stock with a liquidation preference of
$1,000
per share, and
$27.6 million
of cash. The exchange is accounted for as a troubled debt restructuring (a “TDR”) under Accounting Standards Codification Subtopic 470-60,
Debt-Troubled Debt Restructurings by Debtors
. For an exchange classified as a TDR, if the future undiscounted cash flows of the newly issued debt and other consideration are less than the net carrying value of the original debt, a gain is recorded for the difference and the carrying value of the newly issued debt is adjusted to the future undiscounted cash flow amount and no future interest expense is recorded. All future interest payments on the newly issued debt reduce the carrying value. Accordingly, the Company recognized the 8.25% Notes on the condensed consolidated balance sheet at
$135.8 million
as of March 31, 2017. The Company recognized a gain of
$33.6 million
related to the note exchange for the quarter ended March 31, 2017, which is net of transaction costs of
$9.0 million
and previously deferred issuance costs related to the 8% PIK Toggle Notes of
$0.4 million
. Refer to
Note 13, Stockholders’ Equity
for details related to the newly issued preferred stock.
13
8.25% Notes
Interest on the 8.25% Notes is payable semi-annually in arrears as of February 28 and August 31 based on a 360-day year consisting of twelve 30-day months. The 8.25% Notes mature on February 28, 2027. As described above, all future interest payment obligations on the 8.25% Notes are included in the carrying value of the 8.25% Notes. As a result, the Company’s reported interest expense will be less than its contractual interest payments throughout the term of the 8.25% Notes. As of March 31, 2017,
$6.4 million
of interest is recorded as current and classified as
Accounts Payable and Accrued Liabilities
in the condensed consolidated balance sheet.
The 8.25% Notes rank equally in right of payment with all of our existing and future unsubordinated indebtedness other than our Issuer Senior Debt and our Limited Secured Acquisition Debt (each as defined below). The 8.25% Notes rank senior in right of payment to all of our existing and future subordinated indebtedness and to certain limited secured acquisition indebtedness of the Company (the “Limited Secured Acquisition Debt”). The Limited Secured Acquisition Debt includes (i) any indebtedness, the proceeds of which are used to finance all or a portion of an acquisition or similar transaction if any lender’s lien is solely limited to the assets acquired in such a transaction and (ii) any indebtedness, the proceeds of which are used to finance all or a portion of the American Centrifuge project or another next generation enrichment technology if any lender’s lien is solely limited to such assets,
provided that
a lien securing the 8.25% Notes that is junior with respect to the lien securing such indebtedness, will be effected for the 8.25% Notes, which will be limited to the assets acquired with such Limited Secured Acquisition Debt.
The 8.25% Notes are subordinated in right of payment to certain indebtedness and obligations of the Company, as described in the 8.25% Notes Indenture (the “Issuer Senior Debt”), including (i) any indebtedness of the Company (inclusive of any indebtedness of Enrichment Corp.) under a future credit facility up to
$50 million
with a maximum net borrowing of
$40 million
after taking into account any minimum cash balance (unless a higher amount is approved with the consent of the holders of a majority of the aggregate principal amount of the 8.25% Notes then outstanding), (ii) any revolving credit facility to finance inventory purchases and related working capital needs, and (iii) any indebtedness of the Company to Enrichment Corp. under the secured intercompany notes.
The 8.25% Notes are guaranteed on a subordinated and limited basis by, and secured by substantially all of the assets of, Enrichment Corp. The Enrichment Corp. guarantee is a secured obligation and ranks equally in right of payment with all existing and future unsubordinated indebtedness of Enrichment Corp. (other than Designated Senior Claims (as defined below) and Limited Secured Acquisition Debt) and senior in right of payment to all existing and future subordinated indebtedness of Enrichment Corp. and Limited Secured Acquisition Debt. The Enrichment Corp. guarantee is subordinated in right of payment to certain obligations of, and claims against, Enrichment Corp. described in the 8.25% Notes Indenture (collectively, the “Designated Senior Claims”), including obligations and claims:
|
•
|
under a future credit facility up to $50 million with a maximum net borrowing of $40 million after taking into account any minimum cash balance;
|
|
•
|
under any revolving credit facility to finance inventory purchases and related working capital needs;
|
|
•
|
held by or for the benefit of the Pension Benefit Guaranty Corporation (“PBGC”) pursuant to any settlement (including any required funding of pension plans); and
|
|
•
|
under surety bonds or similar obligations held by or on behalf of the U.S. government pursuant to regulatory requirements.
|
The liens securing the Enrichment Corp. guarantee of the 8% PIK Toggle Notes and the 8.25% Notes are pari passu with each other, and are junior in priority with respect to the lien securing Limited Secured Acquisition Debt, which is limited to the assets acquired with such Limited Secured Acquisition Debt.
14
8% PIK Toggle Notes
Interest on the 8% PIK Toggle Notes is payable semi-annually in arrears on March 31 and September 30 based on a 360-day year consisting of twelve 30-day months. The principal amount is increased by any payment of interest in the form of PIK payments. The Company has the option to pay up to 5.5% per annum of interest due on the 8% PIK Toggle Notes in the form of PIK payments. For the semi-annual interest periods ended March 31, 2017, and September 30, 2017, the Company has elected to pay interest in the form of PIK payments at 5.5% per annum.
Financing costs for the issuance of the 8% PIK Toggle Notes were deferred and are being amortized on a straight-line basis, which approximates the effective interest method, over the life of the 8% PIK Toggle Notes.
The 8% PIK Toggle Notes mature on September 30, 2019. However, the maturity date can be extended to September 30, 2024, upon the satisfaction of certain funding conditions described in the Indenture relating to the funding, under binding agreements, of (i) the American Centrifuge project or (ii) the implementation and deployment of a National Security Train Program utilizing American Centrifuge technology.
The 8% PIK Toggle Notes rank equally in right of payment with all existing and future unsubordinated indebtedness of the Company (other than the Issuer Senior Debt) and are senior in right of payment to all existing and future subordinated indebtedness of the Company. The 8% PIK Toggle Notes are subordinated in right of payment to the Issuer Senior Debt.
The 8% PIK Toggle Notes are guaranteed and secured on a subordinated, conditional, and limited basis by Enrichment Corp. Enrichment Corp will be released from its guarantee without the consent of the holders of the 8% PIK Toggle Notes upon the occurrence of certain termination events (other than with respect to an unconditional interest claim), including (i) the involuntary termination by the PBGC of any of the qualified pension plans of the Company or Enrichment Corp, (ii) the cessation of funding prior to completion of our ongoing American Centrifuge test programs or (iii) both a decision by the Company to abandon American Centrifuge technology and either (1) the efforts by the Company to commercialize another next generation enrichment technology funded at least in part by new capital provided or to be provided by Enrichment Corp have been terminated or are no longer being pursued or (2) the attainment of capital necessary to commercialize another next generation enrichment technology with respect to which the Company is involved which does not include new capital provided or to be provided by Enrichment Corp.
The Enrichment Corp. guarantee ranks equally in right of payment with all existing and future unsubordinated indebtedness of Enrichment Corp. (other than Designated Senior Claims and Limited Secured Acquisition Debt) and senior in right of payment to all existing and future subordinated indebtedness of Enrichment Corp. and Limited Secured Acquisition Debt. The Enrichment Corp. guarantee is subordinated in right of payment to Designated Senior Claims.
As explained above, the liens securing the Enrichment Corp. guarantee of the 8% PIK Toggle Notes and the 8.25% Notes are pari passu with each other, and are junior in priority with respect to the lien securing Limited Secured Acquisition Debt, which is limited to the assets acquired with such Limited Secured Acquisition Debt.
15
9. FAIR VALUE
Fair value is the price that would be received from selling an asset or paid to transfer a liability in an orderly transaction between market participants at the measurement date. When determining the fair value of assets and liabilities, the following hierarchy is used in selecting inputs, with the highest priority given to Level 1, as these are the most transparent or reliable:
|
•
|
Level 1 – quoted prices for identical instruments in active markets.
|
|
•
|
Level 2 – quoted prices for similar instruments in active markets; quoted prices for identical or similar instruments in markets that are not active; and model-derived valuations in which all significant inputs are observable in active markets.
|
|
•
|
Level 3 – valuations derived using one or more significant inputs that are not observable.
|
Financial Instruments Recorded at Fair Value (in Millions)
|
March 31, 2017
|
December 31, 2016
|
||||||||||||||||||||||||||||||
|
|
Level 1
|
Level 2
|
Level 3
|
Total
|
Level 1
|
Level 2
|
Level 3
|
Total
|
|||||||||||||||||||||||
|
Assets:
|
|
|
|
|
|
|
|
|
|||||||||||||||||||||||
|
Cash and cash equivalents
|
$
|
151.7
|
|
$
|
—
|
|
$
|
—
|
|
$
|
151.7
|
|
$
|
260.7
|
|
$
|
—
|
|
$
|
—
|
|
$
|
260.7
|
|
|||||||
|
Deferred compensation asset (a)
|
1.2
|
|
—
|
|
—
|
|
1.2
|
|
1.1
|
|
—
|
|
—
|
|
1.1
|
|
|||||||||||||||
|
Liabilities:
|
|
|
|
|
|
|
|
|
|
|
|
|
|||||||||||||||||||
|
Deferred compensation obligation (a)
|
1.2
|
|
—
|
|
—
|
|
1.2
|
|
1.1
|
|
—
|
|
—
|
|
1.1
|
|
|||||||||||||||
|
(a)
|
The deferred compensation obligation represents the balance of deferred compensation plus net investment earnings. The deferred compensation plan is funded through a rabbi trust. Trust funds are invested in mutual funds for which unit prices are quoted in active markets and are classified within Level 1 of the valuation hierarchy.
|
There were no transfers between Level 1, 2 or 3 during the periods presented.
Other Financial Instruments
As of
March 31, 2017
, and December 31, 2016, the balance sheet carrying amounts for accounts receivable, accounts payable and accrued liabilities (excluding the deferred compensation obligation described above), and payables under SWU purchase agreements approximate fair value because of the short-term nature of the instruments.
The carrying value and estimated fair value of long-term debt follow (in millions):
|
March 31, 2017
|
December 31, 2016
|
||||||||||||
|
Carrying Value
|
Estimated Fair Value
(a)
|
Carrying Value
|
Estimated Fair Value
(a)
|
||||||||||
|
8.25% Notes
|
$
|
135.8
|
|
(b)
|
$
|
59.7
|
|
-
|
|
-
|
|
||
|
8% PIK Toggle Notes
|
30.5
|
|
18.7
|
|
234.6
|
|
107.4
|
|
|||||
(a)
Based on the most recent trading price as of the balance sheet date, which is considered a Level 2 input as of March 31, 2017, and a Level 1 input as of December 31, 2016, based on the frequency of trading.
|
(b)
|
The carrying value of the 8.25% Notes as of March 31, 2017, consists of the principal balance of
$74.3 million
and the sum of interest payment obligations until maturity. Refer to
Note 8, Debt
.
|
16
10. PENSION AND POSTRETIREMENT HEALTH AND LIFE BENEFITS
The components of net periodic benefit credit for the pension plans were as follows (in millions):
|
Three Months Ended
March 31, |
|||||||
|
2017
|
2016
|
||||||
|
Service costs
|
$
|
0.9
|
|
$
|
0.9
|
|
|
|
Interest costs
|
8.1
|
|
8.9
|
|
|||
|
Expected gains on plan assets
|
(10.2
|
)
|
(10.5
|
)
|
|||
|
Net periodic benefit credit
|
$
|
(1.2
|
)
|
$
|
(0.7
|
)
|
|
The components of net periodic benefit cost for the postretirement health and life benefit plans were as follows (in millions):
|
Three Months Ended
March 31, |
|||||||
|
2017
|
2016
|
||||||
|
Interest costs
|
$
|
1.8
|
|
$
|
2.1
|
|
|
|
Expected gains on plan assets
|
—
|
|
(0.1
|
)
|
|||
|
Amortization of prior service credits, net
|
(0.1
|
)
|
(0.1
|
)
|
|||
|
Net periodic benefit cost
|
$
|
1.7
|
|
$
|
1.9
|
|
|
11. NET INCOME (LOSS) PER COMMON SHARE
Basic net income (loss) per common share is calculated by dividing income (loss) allocable to common stockholders by the weighted average number of shares of common stock outstanding during the period. In calculating diluted net income (loss) per common share, the number of shares is increased by the weighted average number of potential shares related to stock compensation awards. No dilutive effect is recognized in a period in which a net loss has occurred.
|
|
Three Months Ended
March 31, |
||||||
|
2017
|
2016
|
||||||
|
|
|||||||
|
Net income (loss) allocable to common stockholders (in millions)
|
$
|
6.6
|
|
$
|
(14.6
|
)
|
|
|
Shares in thousands:
|
|||||||
|
Average common shares outstanding - basic
|
9,063
|
|
9,063
|
|
|||
|
Potentially dilutive shares related to stock options
|
111
|
|
—
|
|
|||
|
Average common shares outstanding - diluted
|
9,174
|
|
9,063
|
|
|||
|
Net income (loss) per common share:
|
|||||||
|
– Basic
|
$
|
0.73
|
|
$
|
(1.60
|
)
|
|
|
– Diluted
|
$
|
0.72
|
|
$
|
(1.60
|
)
|
|
|
Options outstanding and considered anti-dilutive as their exercise price exceeded the average share market price (in thousands)
|
—
|
|
475
|
|
|||
17
12. COMMITMENTS AND CONTINGENCIES
NYSE MKT Listing Standards Notice
On April 28, 2017, the NYSE MKT LLC (“NYSE MKT”) informed Centrus that it was back in compliance with the NYSE MKT continued listing standards because it had resolved the continued listing deficiency with respect to Sections 1003(a)(i) and (ii) of the NYSE MKT’s Company Guide. On November 17, 2015, Centrus received a notice from the NYSE MKT indicating that the Company was not in compliance with the continued listing standards since the Company reported a stockholders’ deficit as of September 30, 2015, and net losses in its fiscal years ended December 31, 2011, 2012 and 2013. In December 2015, the Company submitted a plan to regain compliance and the NYSE MKT accepted the plan in January 2016. Effective May 1, 2017, Centrus was removed from the list of NYSE MKT noncompliant issuers on the exchange’s website. In accordance with NYSE MKT regulations, Centrus will be subject to a 12-month follow-up review period to ensure that the Company does not fall below any of the NYSE MKT’s continued listing standards.
American Centrifuge
Milestones Under the 2002 DOE-USEC Agreement
The Company and DOE signed an agreement dated June 17, 2002, as amended (the “2002 DOE-USEC Agreement”), pursuant to which the parties made long-term commitments directed at resolving issues related to the stability and security of the domestic uranium enrichment industry. DOE consented to the assumption by Centrus of the 2002 DOE-USEC Agreement and other agreements between the Company and DOE subject to an express reservation of all rights, remedies and defenses by DOE and Centrus under those agreements as part of Centrus’ Chapter 11 bankruptcy process. The 2002 DOE-USEC Agreement requires Centrus to develop, demonstrate and deploy advanced enrichment technology in accordance with milestones and provides for remedies in the event of a failure to meet a milestone under certain circumstances.
DOE has specific remedies under the 2002 DOE-USEC Agreement if Centrus fails to meet a milestone that would adversely impact its ability to begin commercial operations of the American Centrifuge Plant on schedule, and such delay was within Centrus’ control or was due to its fault or negligence or if Centrus abandons or constructively abandons the commercial deployment of an advanced enrichment technology. These remedies include terminating the 2002 DOE-USEC Agreement, revoking Centrus’ access to DOE’s centrifuge technology that is required for the success of the American Centrifuge project, requiring Centrus to transfer certain rights in the American Centrifuge technology and facilities to DOE, and requiring Centrus to reimburse DOE for certain costs associated with the American Centrifuge project.
The 2002 DOE-USEC Agreement provides that if a delaying event beyond the control and without the fault or negligence of Centrus occurs that could affect Centrus’ ability to meet an American Centrifuge Plant milestone, DOE and Centrus will jointly meet to discuss in good faith possible adjustments to the milestones as appropriate to accommodate the delaying event. The Company notified DOE that it had not met the June 2014 milestone within the time period provided due to events beyond its control and without the fault or negligence of the Company. The assumption of the 2002 DOE-USEC Agreement provided for under the Plan of Reorganization did not affect the ability of either party to assert all rights, remedies and defenses under the agreement and all such rights, remedies and defenses are specifically preserved and all time limits tolled expressly including all rights, remedies and defenses and time limits relating to any missed milestones. DOE and Centrus have agreed that all rights, remedies and defenses of the parties with respect to any missed milestones since March 5, 2014, including the June 2014 and November 2014 milestones, and all other matters under the 2002 DOE-USEC Agreement continued to be preserved, and that the time limits for each party to respond to any missed milestones continue to be tolled.
18
Piketon Facility Costs and D&D Obligations
Effective October 1, 2015, the U.S. government discontinued funding of the American Centrifuge demonstration cascade at Piketon. Funding for American Centrifuge is now limited to research and development work at the Company’s facilities in Oak Ridge, Tennessee. As a result of reduced program funding, Centrus incurred a special charge in the third quarter of 2015 for estimated employee termination benefits, and began reductions in force. Refer to
Note 2, Special Charges
, for details. Centrus began to incur expenditures in the second quarter of 2016 associated with the D&D of the Piketon facility in accordance with the requirements of the NRC and DOE. Centrus leases the Piketon facility from DOE. At the conclusion of the lease, Centrus is obligated to return the facility to DOE in a condition that meets NRC requirements and in the same condition as the facility was in when it was leased to Centrus (other than due to normal wear and tear). Centrus must remove all Company-owned capital improvements at the Piketon facility, unless otherwise consented to by DOE, by the conclusion of the lease term. The lease will expire on June 30, 2019, unless it is extended. The D&D work is expected to extend through 2017 and be substantially completed by year-end. As of March 31, 2017, Centrus has accrued
$34.9 million
on the balance sheet as
Decontamination and Decommissioning Obligations
for the estimated fair value of the remaining costs to complete the D&D work.
Centrus is required to provide financial assurance to the NRC and DOE for D&D costs under a regulatorily-prescribed methodology that includes potential contingent costs and reserves. As of March 31, 2017, Centrus has provided financial assurance to the NRC and DOE in the form of surety bonds totaling
$29.6 million
, which are fully cash collateralized by Centrus. Centrus expects to receive cash when surety bonds are reduced and/or cancelled as the Company fulfills its D&D and lease obligations.
13. STOCKHOLDERS’ EQUITY
Series B Preferred Stock
On February 14, 2017, Centrus issued
104,574
shares of Series B Preferred Stock as part of the securities exchange described in
Note 8, Debt
. The Series B Preferred Stock has a par value of
$1.00
per share and a liquidation preference of
$1,000
per share (the “Liquidation Preference”). The Series B Preferred Stock is recorded on the condensed consolidated balance sheet at fair value less transaction costs, or
$4.6 million
as of March 31, 2017.
Holders of the Series B Preferred Stock are entitled to cumulative dividends of
7.5%
per annum of the Liquidation Preference. Centrus is obligated to pay cash dividends on the Series B Preferred Stock in an amount equal to the Liquidation Preference to the extent that dividends are declared by the Board and:
|
(a)
|
its pension plans and Enrichment Corp.’s pension plans are at least
90%
funded on a variable rate premium calculation in the current plan year;
|
|
(b)
|
its net income calculated in accordance with GAAP (excluding the effect of pension remeasurement) for the immediately preceding fiscal quarter exceeds
$7.5 million
;
|
|
(c)
|
its free cash flow (defined as the sum of cash provided by (used in) operating activities and cash provided by (used in) investing activities) for the immediately preceding four fiscal quarters exceeds
$35 million
;
|
|
(d)
|
the balance of cash and cash equivalents calculated in accordance with GAAP on the last day of the immediately preceding quarter would exceed
$150 million
after pro forma application of the dividend payment; and
|
|
(e)
|
dividends may be legally paid under Delaware law.
|
19
Centrus has not met these criteria as of March 31, 2017, and has not declared or paid dividends on the Series B Preferred Stock as of March 31, 2017. Dividends on the Series B Preferred Stock are cumulative to the extent not paid at any quarter-end, whether or not declared and whether or not there are assets of the Company legally available for the payment of such dividends in whole or in part. As of March 31, 2017, the Series B Preferred Stock has an aggregate liquidation preference of
$105.6 million
, including accumulated dividends
$1.0 million
.
Outstanding shares of the Series B Senior Preferred Stock are redeemable at the Company’s option, in whole or in part, for an amount of cash equal to the Liquidation Preference, plus an amount equal to the accrued and unpaid dividends, if any, whether or not declared, through date of redemption.
Rights Agreement
On April 6, 2016 (the “Effective Date”), the Company’s Board of Directors (the “Board”) adopted a Section 382 Rights Agreement (the “Rights Agreement”). The Board adopted the Rights Agreement in an effort to protect shareholder value by, among other things, attempting to protect against a possible limitation on the Company’s ability to use its net operating loss carryforwards and other tax benefits, which may be used to reduce potential future income tax obligations. As reported on the Company’s Annual Report on Form 10-K for the year ended December 31, 2016, as of December 31, 2016, the Company had federal net operating losses of
$725.8 million
that currently expire through 2036.
In connection with the adoption of the Rights Agreement, the Board declared a dividend of one preferred-share-purchase-right for each share of the Company’s Class A Common Stock and Class B Common Stock outstanding as of the Effective Date. The rights initially trade together with the common stock and are not exercisable. In the absence of further action by the Board, the rights would generally become exercisable and allow a holder to acquire shares of a new series of the Company’s preferred stock if any person or group acquires
4.99%
or more of the outstanding shares of the Company’s common stock, or if a person or group that already owns 4.99% or more of the Company’s Class A Common Stock acquires additional shares representing
0.5%
or more of the outstanding shares of the Company’s Class A Common Stock. The rights beneficially owned by the acquirer would become null and void, resulting in significant dilution in the ownership interest of such acquirer.
The Board may exempt any acquisition of the Company’s common stock from the provisions of the Rights Agreement if it determines that doing so would not jeopardize or endanger the Company's use of its tax assets or is otherwise in the best interests of the Company. The Board also has the ability to amend or terminate the Rights Agreement prior to a triggering event.
The Company is seeking stockholder approval of the Rights Agreement at the 2017 annual meeting of stockholders. The rights issued under the Rights Agreement will expire if, among other things, the Rights Agreement is not approved by the Company's stockholders at the 2017 annual meeting or on April 6, 2019, if the Rights Agreement is so approved.
Effective on February 14, 2017, in connection with the settlement and completion of the exchange offer and consent solicitation, the Company amended the Rights Agreement solely to exclude acquisitions of the Series B Preferred Stock issued as part of the exchange offer and consent solicitation from the definition of “Common Shares.”
20
Stock-Based Compensation
A summary of stock-based compensation costs follows (in millions):
|
|
Three Months Ended
March 31, |
||||||
|
2017
|
2016
|
||||||
|
|
|||||||
|
Total stock-based compensation costs:
|
|
||||||
|
Restricted stock units
|
$
|
—
|
|
$
|
0.1
|
|
|
|
Stock options
|
0.1
|
|
0.1
|
|
|||
|
Expense included in selling, general and administrative expense
|
$
|
0.1
|
|
$
|
0.2
|
|
|
|
Total recognized tax benefit
|
$
|
—
|
|
$
|
—
|
|
|
As of March 31, 2017, there was
$0.6 million
of unrecognized compensation cost related to unvested stock-based payments granted, of which
$0.6 million
relates to stock options and less than
$0.1 million
relates to unvested restricted stock units. That cost is expected to be recognized over a weighted-average period of
1.7
years.
Stock-based compensation cost is measured at the grant date, based on the fair value of the award, and is recognized on a straight-line basis over the requisite service period. Stock options vest and become exercisable in equal annual installments over a three- or four-year period and expire
10
years from the date of grant. There were no grants of stock-based compensation in the three months ended March 31, 2017 or 2016.
Accumulated Other Comprehensive Income
The sole component of accumulated other comprehensive income (“AOCI”) relates to activity in the accounting for pension and postretirement health and life benefit plans. Amortization of prior service credits is reclassified from AOCI and included in the computation of net periodic benefit cost as detailed in
Note 10, Pension and Post-Retirement Health and Life Benefits
.
21
14. SEGMENT INFORMATION
Centrus has two reportable segments: the LEU segment with two components, SWU and uranium, and the contract services segment. The LEU segment includes sales of the SWU component of LEU, sales of both the SWU and uranium components of LEU, and sales of uranium. The contract services segment includes revenue and cost of sales for work that Centrus performs under a fixed-price agreement as a contractor to UT-Battelle. The contract services segment also includes limited services provided by Centrus to DOE and its contractors at the Piketon facility. Gross profit is Centrus’ measure for segment reporting. There were no intersegment sales in the periods presented. For additional details on each segment, refer to Item 2,
Management’s Discussion and Analysis of Financial Condition and Results of Operations
.
|
|
Three Months Ended
March 31, |
||||||
|
2017
|
2016
|
||||||
|
(in millions)
|
|||||||
|
Revenue
|
|||||||
|
LEU segment:
|
|||||||
|
Separative work units
|
$
|
0.8
|
|
$
|
59.3
|
|
|
|
Uranium
|
—
|
|
14.3
|
|
|||
|
|
0.8
|
|
73.6
|
|
|||
|
Contract services segment
|
6.4
|
|
16.4
|
|
|||
|
Revenue
|
$
|
7.2
|
|
$
|
90.0
|
|
|
|
Segment Gross Profit (Loss)
|
|
|
|
|
|||
|
LEU segment
|
$
|
(1.5
|
)
|
$
|
8.1
|
|
|
|
Contract services segment
|
(1.0
|
)
|
7.7
|
|
|||
|
Gross profit (loss)
|
$
|
(2.5
|
)
|
|
$
|
15.8
|
|
22
Item 2.
Management’s Discussion and Analysis of Financial Condition and Results of Operations
The following discussion should be read in conjunction with, and is qualified in its entirety by reference to, the condensed consolidated financial statements and related notes appearing elsewhere in this report.
Overview
Centrus Energy Corp. (“Centrus” or the “Company”) is a trusted supplier of low-enriched uranium (“LEU”) for commercial nuclear power plants. References to “Centrus”, the “Company”, or “we” include Centrus Energy Corp. and its wholly owned subsidiaries as well as the predecessor to Centrus, unless the context otherwise indicates. LEU is a critical component in the production of nuclear fuel for reactors that produce electricity. We supply LEU to both domestic and international utilities for use in nuclear reactors worldwide. We are a leader in the development of advanced uranium enrichment technology and are performing research and demonstration work to support U.S. energy and national security through our contract with UT-Battelle, LLC (“UT-Battelle”), the operator of Oak Ridge National Laboratory (“ORNL”).
As a long-term supplier of LEU to our customers, our goal is to provide value through the reliability and diversity of our supply sources. We provide LEU from multiple sources including our inventory, long- and mid-term supply contracts and spot purchases. Our long-term objective is to resume commercial enrichment production and we are exploring alternative approaches to that end.
We have a contract with UT-Battelle to conduct research and development of our advanced centrifuge technology for the U.S. government. We believe that this technology could play a critical role in meeting our national and energy security needs and achieving our nation’s non-proliferation objectives.
The nuclear industry in general, and the nuclear fuel industry in particular, is in a period of significant change, which could significantly transform the competitive landscape Centrus faces. The nuclear fuel cycle industry remains oversupplied, creating downward pressures on commodity pricing, with uncertainty regarding the timing of industry expansion globally. Changes in the competitive landscape may adversely affect pricing trends, change customer spending patterns, or create uncertainty. To address these changes, we may seek to adjust our cost structure and operations and evaluate opportunities to grow our business organically or through acquisitions and other strategic transactions. We are actively considering, and expect to consider from time to time in the future, potential strategic transactions, which could involve, without limitation, acquisitions and/or dispositions of businesses or assets, joint ventures or investments in businesses, products or technologies. In connection with any such transaction, we may seek additional debt or equity financing, contribute or dispose of assets, assume additional indebtedness, or partner with other parties to consummate a transaction.
23
Business Segments
Centrus has two reportable segments: the LEU segment with two components, separative work units (“SWU”) and uranium, and the contract services segment.
LEU Segment
Revenue from Sales of SWU and Uranium
The LEU segment is currently our primary business focus. Revenue from our LEU segment is derived primarily from:
|
•
|
sales of the SWU component of LEU,
|
|
•
|
sales of both the SWU and uranium components of LEU, and
|
|
•
|
sales of natural uranium.
|
Revenue for our LEU segment accounted for approximately 88% of our total revenue in 2016. The majority of our customers are domestic and international utilities that operate nuclear power plants, with international sales constituting 25% of revenue from our LEU segment in 2016. Our agreements with electric utilities are primarily long-term, fixed-commitment contracts under which our customers are obligated to purchase a specified quantity of the SWU component of LEU (or the SWU and uranium components of LEU) from us. Our agreements for natural uranium sales are generally shorter-term, fixed-commitment contracts.
Our revenues, operating results and cash flows can fluctuate significantly from quarter to quarter and year to year. Revenue is recognized at the time LEU or uranium is delivered under the terms of our contracts. The timing of customer demand is affected by, among other things, electricity markets, reactor operations, maintenance and refueling outages, and customer inventories. In the current market environment, some customers are building inventories and may choose to take deliveries under annual purchase obligations later in the year. Customer payments for the SWU component of LEU average roughly $10-15 million per order. As a result, a relatively small change in the timing of customer orders for LEU may cause variability in operating results.
Our financial performance over time can be significantly affected by changes in prices for SWU and uranium. Since 2011, market prices for SWU and uranium have significantly declined. Since our sales order book includes contracts awarded to us in previous years, the average SWU price billed to customers typically lags behind published price indicators by several years, which means that average prices under contract today exceed current market prices. The long-term SWU price indicator, as published by TradeTech, LLC in
Nuclear Market Review
, is an indication of base-year prices under new long-term enrichment contracts in our primary markets. The following chart summarizes TradeTech’s long-term and spot SWU price indicators, the long-term price for uranium hexafluoride (“UF6”), as calculated by Centrus using indicators published in
Nuclear Market Review
, and TradeTech’s spot price indicator for UF6:
24
SWU and Uranium Market Price Indicators
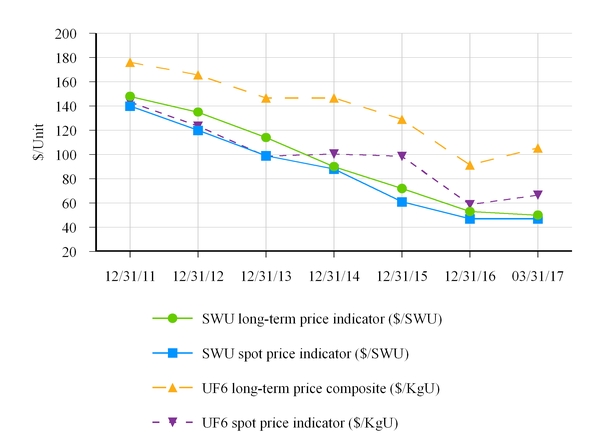
In a limited number of sales transactions, title to uranium or LEU is transferred to the customer without Centrus physically delivering the uranium or LEU to the customer. In such cases, risk of loss remains with Centrus until physical delivery occurs. At the time transfer of title occurs, a performance obligation for Centrus is created and a receivable is recorded. Cash is collected for the receivable under normal credit terms. The recognition of revenue and related cost of sales occurs at the time physical delivery occurs and risk of loss transfers to the customer.
Our contracts with customers and suppliers are denominated in U.S. dollars, and although revenue has not been directly affected by changes in the foreign exchange rate of the U.S. dollar, we may have a competitive price advantage or disadvantage obtaining new contracts in a competitive bidding process depending upon the weakness or strength of the U.S. dollar. Costs of our primary competitors are denominated in other currencies.
On occasion, Centrus will accept payment in the form of uranium. Revenue from the sale of SWU under such contracts is recognized at the time LEU is delivered and is based on the fair value of the uranium received in exchange for the SWU.
Cost of Sales for SWU and Uranium
Cost of sales for SWU and uranium is based on the amount of SWU and uranium sold and delivered during the period and unit inventory costs. Unit inventory costs are determined using the monthly moving average cost method. Changes in purchase costs have an effect on inventory costs and cost of sales over current and future periods. Cost of sales includes costs for inventory management at off-site licensed locations. Cost of sales also includes legacy costs related to former employees of the Portsmouth and Paducah gaseous diffusion plants. Actuarial gains and losses related to the retiree benefit plans are recognized immediately in the statements of operations when plan obligations are remeasured at year-end or when lump-sum payments reach certain levels.
25
Contract Services Segment
The contract services segment includes revenue and cost of sales for American Centrifuge work we perform as a contractor to UT-Battelle. Direct costs incurred in performing the contract work are consistent with the funding levels. Centrus records an unbilled receivable and revenue based on the progress towards the achievement of monthly deliverables. Monthly reports and invoices affirming the achievement of monthly deliverables are submitted shortly following each month. The achievement of monthly deliverables has resulted in revenue consistent with the funding levels. The contract services segment also includes limited services provided by Centrus to the U.S. Department of Energy (“DOE”) and its contractors at the Piketon facility.
American Centrifuge
The Company has a long record as a global leader in advanced technology, manufacturing and engineering. Our manufacturing, engineering and testing facilities and our highly-trained workforce are deeply engaged in advancing the next generation of uranium enrichment technology. We are exploring a number of options for returning to domestic production in the future.
In September 2015, Centrus completed a successful three-year demonstration of the existing American Centrifuge technology at its facility in Piketon, Ohio, with 120 machines linked together in a cascade to simulate industrial operating conditions. Since then our government contracts with UT-Battelle have provided for continued engineering and testing work on the American Centrifuge technology at the Company’s facilities in Oak Ridge, Tennessee. Our current contract with UT-Battelle (the “2017 ORNL Contract”) is for the period from October 1, 2016, through September 30, 2017, and is valued at approximately $25 million. The 2017 ORNL Contract provides for payments for monthly reports of approximately $2.0 million per month and additional aggregate payments of $1.0 million based on completion of certain milestones. The 2017 ORNL Contract is currently being funded incrementally. Funding for the program is provided to UT-Battelle by the U.S. government which is currently operating under a continuing resolution.
The Company’s contract with UT-Battelle that ended September 30, 2016 (the “2016 ORNL Contract”), provided for payments for monthly reports of approximately $2.7 million per month. The 2016 ORNL Contract, which was signed in March 2016, provided for payment for reports related to work performed since October 1, 2015.
Revenue
in the three months ended March 31, 2016, includes $8.1 million for March 2016 reports on work performed in the three months ended December 31, 2015, and $8.1 million for reports on work performed in the three months ended March 31, 2016. Expenses for contract work performed in the three months ended March 31, 2016, are included in
Cost of Sales
. Expenses for work performed in the three months ended December 31, 2015, before entering into the 2016 ORNL Contract, were included in
Advanced Technology License and Decommissioning Costs
in 2015.
American Centrifuge expenses that are outside of our contracts with UT-Battelle are included in
Advanced Technology License and Decommissioning Costs
, including ongoing costs to maintain the demobilized Piketon facility and our NRC licenses at that location. In the second quarter of 2016, the Company commenced with the decontamination and decommissioning (“D&D”) of the Piketon facility in accordance with the requirements of the NRC and DOE. For additional details on costs, schedule and accrued liabilities related to the D&D of the Piketon facility, refer to
Results of Operations
below and
American Centrifuge - Piketon Facility Costs and D&D Obligations
in
Note 12, Commitments and Contingencies,
of the condensed consolidated financial statements.
26
Site Services Work and Related Receivables
We formerly performed work under contracts with DOE and its contractors to maintain and prepare the former Portsmouth Gaseous Diffusion Plant (the “Portsmouth GDP”) for D&D. In September 2011, our contracts for maintaining the Portsmouth facilities and performing services for DOE at Portsmouth expired and we completed the transition of facilities to DOE’s D&D contractor for the Portsmouth site. Additionally, we provided limited services to DOE and its contractors at the Paducah Gaseous Diffusion Plant (the “Paducah GDP”) until the leased portions of the Paducah GDP were returned to DOE on October 21, 2014.
There is the potential for additional revenue to be recognized, based on the outcome of DOE reviews and audits, as the result of the release of previously established receivable related reserves. However, uncertainty exists because contract billing periods since June 2002 have not been finalized with DOE, and we have not yet recognized this additional revenue. Certain receivables from DOE are included in other long-term assets based on the extended timeframe expected to resolve claims for payment. Additional details are provided in
Note 4, Receivables
to the condensed consolidated financial statements.
2017 Outlook
We anticipate SWU and uranium revenue in 2017 in a range of $175 million to $200 million, reflecting an expected decline in SWU and uranium volumes delivered compared to 2016. We anticipate total revenue in a range of $200 million to $225 million. Our revenues continue to be most heavily weighted to the fourth quarter, and we expect more than two-thirds of our annual revenue in the fourth quarter of 2017. We expect to end 2017 with a cash and cash equivalents balance in a range of $150 million to $175 million.
Our financial guidance is subject to a number of assumptions and uncertainties that could affect results either positively or negatively. Variations from our expectations could cause differences between our guidance and our ultimate results. Among the factors that could affect our results are:
|
•
|
Additional short-term purchases or sales of SWU and uranium;
|
|
•
|
Timing of customer orders, related deliveries, and purchases of LEU or components;
|
|
•
|
The outcome of legal proceedings and other contingencies;
|
|
•
|
Execution and funding of a new agreement with UT-Battelle, the operator of ORNL, for the continuation of American Centrifuge development and testing activities in Oak Ridge following the expiration of the agreement on September 30, 2017;
|
|
•
|
Potential use of cash for strategic initiatives; and
|
|
•
|
Additional costs for decontamination and decommissioning of the Company’s facility in Ohio.
|
27
Results of Operations
Segment Information
The following table presents elements of the accompanying condensed consolidated statements of operations that are categorized by segment (dollar amounts in millions):
|
Three Months Ended
March 31, |
||||||||||||||
|
|
2017
|
2016
|
$ Change
|
% Change
|
||||||||||
|
LEU segment
|
|
|
||||||||||||
|
Revenue:
|
|
|
||||||||||||
|
SWU revenue
|
$
|
0.8
|
|
$
|
59.3
|
|
$
|
(58.5
|
)
|
(99
|
)%
|
|||
|
Uranium revenue
|
—
|
|
14.3
|
|
(14.3
|
)
|
–
|
|
||||||
|
Total
|
0.8
|
|
73.6
|
|
(72.8
|
)
|
(99
|
)%
|
||||||
|
Cost of sales
|
2.3
|
|
65.5
|
|
63.2
|
|
96
|
%
|
||||||
|
Gross profit (loss)
|
$
|
(1.5
|
)
|
$
|
8.1
|
|
$
|
(9.6
|
)
|
(119
|
)%
|
|||
|
Contract services segment
|
|
|
|
|
||||||||||
|
Revenue
|
$
|
6.4
|
|
$
|
16.4
|
|
$
|
(10.0
|
)
|
(61
|
)%
|
|||
|
Cost of sales
|
7.4
|
|
8.7
|
|
1.3
|
|
15
|
%
|
||||||
|
Gross profit (loss)
|
$
|
(1.0
|
)
|
$
|
7.7
|
|
$
|
(8.7
|
)
|
(113
|
)%
|
|||
|
Total
|
|
|
|
|
||||||||||
|
Revenue
|
$
|
7.2
|
|
$
|
90.0
|
|
$
|
(82.8
|
)
|
(92
|
)%
|
|||
|
Cost of sales
|
9.7
|
|
74.2
|
|
64.5
|
|
87
|
%
|
||||||
|
Gross profit (loss)
|
$
|
(2.5
|
)
|
$
|
15.8
|
|
$
|
(18.3
|
)
|
(116
|
)%
|
|||
Revenue
Revenue from the LEU segment was $0.8 million in the three months ended March 31, 2017, reflecting a substantial decrease from $59.3 million in the corresponding period in 2016, reflecting the variability in timing of utility customer orders. More than two-thirds of our annual revenue is expected in the fourth quarter of 2017. SWU and uranium volumes delivered are expected to decline in 2017 compared to 2016. Refer to
2017 Outlook
above.
Revenue from the contract services segment declined $10.0 million in the three months ended March 31, 2017, compared to the corresponding period in 2016, primarily due to the timing of revenue recognition in the prior period. As a result of the contract signed with UT-Battelle in March 2016, revenue in the three months ended March 31, 2016, included $8.1 million for March 2016 reports on work performed in the three months ended March 31, 2016, as well as $8.1 million for work in the fourth quarter of 2015. In addition, the reduced scope of contract work for American Centrifuge technology services resulted in a decline of $1.8 million in the three months ended March 31, 2017, compared to the corresponding period in 2016.
Cost of Sales
The decrease in cost of sales for the LEU segment was consistent with the decline in sales volumes. Cost of sales for the LEU segment included costs related to benefits for former GDP employees and inventory storage costs totaling $2.0 million in the three months ended March 31, 2017, and $4.0 million in the corresponding period in 2016.
28
Cost of sales for the contract services segment declined $1.3 million in the three months ended March 31, 2017, compared to the corresponding period in 2016, due to the reduced scope of contract work.
Gross Profit (Loss)
We realized a gross loss of $2.5 million in the three months ended March 31, 2017, a decline of $18.3 million compared to the gross profit of $15.8 million in the corresponding period in 2016. We realized a decline in gross profit of $9.6 million for the LEU segment due to the decline in sales volume. We realized a decline in gross profit of $8.7 million for the contract services segment. Revenue for the contract services segment in the three months ended March 31, 2016, included a billing for March 2016 reports on work performed in the fourth quarter of 2015. Related expenses were included in
Advanced Technology License and Decommissioning Costs
in 2015 as they were incurred before a contract was in place. We realized a gross loss of $1.0 million for the contract services segment in the three months ended March 31, 2017, due to the timing of costs incurred and the allocation of indirect corporate costs, which are not fully recoverable from the revenue under the contract with UT-Battelle.
Non-Segment Information
The following table presents elements of the accompanying condensed consolidated statements of operations that are not categorized by segment (dollar amounts in millions):
|
Three Months Ended
March 31, |
||||||||||||||
|
|
2017
|
2016
|
$ Change
|
% Change
|
||||||||||
|
Gross profit (loss)
|
$
|
(2.5
|
)
|
$
|
15.8
|
|
$
|
(18.3
|
)
|
(116
|
)%
|
|||
|
Advanced technology license and decommissioning costs
|
6.1
|
|
12.0
|
|
5.9
|
|
49
|
%
|
||||||
|
Selling, general and administrative
|
12.4
|
|
11.4
|
|
(1.0
|
)
|
(9
|
)%
|
||||||
|
Amortization of intangible assets
|
1.2
|
|
3.2
|
|
2.0
|
|
63
|
%
|
||||||
|
Special charges for workforce reductions and advisory costs
|
2.4
|
|
—
|
|
(2.4
|
)
|
–
|
|
||||||
|
Gains on sales of assets
|
(1.0
|
)
|
(0.3
|
)
|
0.7
|
|
233
|
%
|
||||||
|
Operating loss
|
(23.6
|
)
|
(10.5
|
)
|
(13.1
|
)
|
(125
|
)%
|
||||||
|
Gain on early extinguishment of debt
|
(33.6
|
)
|
—
|
|
33.6
|
|
–
|
|
||||||
|
Interest expense
|
2.9
|
|
5.0
|
|
2.1
|
|
42
|
%
|
||||||
|
Investment income
|
(0.3
|
)
|
(0.3
|
)
|
—
|
|
–
|
|
||||||
|
Income (loss) before income taxes
|
7.4
|
|
(15.2
|
)
|
22.6
|
|
149
|
%
|
||||||
|
Income tax benefit
|
(0.2
|
)
|
(0.6
|
)
|
(0.4
|
)
|
–
|
|
||||||
|
Net income (loss)
|
7.6
|
|
(14.6
|
)
|
22.2
|
|
152
|
%
|
||||||
|
Preferred stock dividends - undeclared and cumulative
|
1.0
|
|
—
|
|
1.0
|
|
–
|
|
||||||
|
Net income (loss) allocable to common stockholders
|
$
|
6.6
|
|
$
|
(14.6
|
)
|
$
|
21.2
|
|
145
|
%
|
|||
Advanced Technology License and Decommissioning Costs
Advanced technology license and decommissioning costs consist of American Centrifuge expenses that are outside of our contracts with UT-Battelle, including ongoing costs to maintain the demobilized Piketon facility and our NRC licenses at that location. Costs declined $5.9 million (or 49%) in the three months ended March 31, 2017, compared to the corresponding period in 2016. Costs in the prior period included demobilization costs in preparation for the D&D of the Piketon demonstration facility, which commenced in the second quarter of 2016. In the three months ended March 31, 2017, D&D costs of $3.7 million were charged against the accrued D&D liability. For additional details on the D&D of the Piketon facility, refer to
American Centrifuge - Piketon Facility Costs and D&D Obligations
in
Note 12, Commitments and Contingencies,
of the condensed consolidated financial statements.
29
Selling, General and Administrative
Selling, general and administrative (“SG&A”) expenses increased $1.0 million (or 9%) in the three months ended March 31, 2017, compared to the corresponding period in 2016. Consulting costs increased $0.4 million in the three months ended March 31, 2017, compared to the corresponding period in 2016, for work related to business development. Salaries and other compensation increased $0.4 million and office technology costs increased $0.3 million, compared to the corresponding period in 2016.
Amortization of Intangible Assets
Amortization expense for the intangible asset related to the September 2014 sales order book is a function of SWU sales volume under that order book, which declined in the three months ended March 31, 2017, compared to the corresponding period in 2016. Amortization expense for the intangible asset related to customer relationships is amortized on a straight-line basis.
Special Charges for Workforce Reductions and Advisory Costs
Special charges in the three months ended March 31, 2017, included estimated employee termination benefits of $0.8 million and advisory costs of $1.6 million related to the Company’s project to align its corporate structure to the scale of its ongoing business operations and to update related information technology.
Gain on Early Extinguishment of Debt
In the three months ended March 31, 2017, the Company recognized a gain of $33.6 million related to the exchange of securities and cash on February 14, 2017, which is net of transaction costs of $9.0 million and previously deferred issuance costs related to the 8% PIK Toggle Notes of $0.4 million. Refer to
Note 8, Debt
of the condensed consolidated financial statements.
Interest Expense
Interest expense declined $2.1 million (or 42%) in the three months ended March 31, 2017, compared to the corresponding period in 2016, due to the early extinguishment of 87% of the 8% PIK Toggle Notes on February 14, 2017. No interest expense is recognized on the new 8.25% Notes as described in
Note 8, Debt
, of the condensed consolidated financial statements.
Income Tax Benefit
There was a benefit for income taxes of $0.2 million in the three months ended March 31, 2017, and $0.6 million in the corresponding period in 2016, resulting from reversals of previously accrued amounts associated with liabilities for unrecognized benefits.
Net Income (Loss)
Net income was $7.6 million in the three months ended March 31, 2017, compared to a net loss of $14.6 million in the three months ended March 31, 2016. The favorable variance of $22.2 million is primarily the result of the $33.6 million gain on the early extinguishment of debt, partially offset by the $18.3 million decline in gross profit and the $5.9 million decline in advanced technology license and decommissioning costs, as D&D costs of $3.7 million in the three months ended March 31, 2017, were charged against the accrued D&D liability.
30
Preferred Stock Dividends - Undeclared and Cumulative
Holders of the Series B Preferred Stock are entitled to cumulative dividends of 7.5% per annum of the liquidation preference of $104.6 million. We did not meet the criteria for a dividend payment obligation as of March 31, 2017, and we did not declare or pay dividends on the Series B Preferred Stock for the period from issuance on February 14, 2017, to March 31, 2017. Dividends on the Series B Preferred Stock are cumulative to the extent not paid at any quarter-end, whether or not declared and whether or not there are assets of the Company legally available for the payment of such dividends in whole or in part.
Liquidity and Capital Resources
We ended the first quarter of 2017 with a consolidated cash balance of $151.7 million. We anticipate having adequate liquidity to support our business operations for at least the next 12 months from the date of this report. Our view of liquidity is dependent on our operations and the level of expenditures and government funding for the American Centrifuge program. Liquidity requirements for our existing operations are affected by the timing and amount of customer sales and our inventory purchases.
We believe our sales order book in our LEU segment is a source of stability for our liquidity position.
Centrus’ sales order book extends for more than a decade.
Although we see limited uncommitted demand for LEU for the remainder of this decade and into the 2020s based on current market conditions, we continue to seek and make additional sales, including sales for delivery during that time period.
Substantially all revenue-generating operations of the Company are conducted at the subsidiary level. Centrus’ principal source of funding for American Centrifuge activities is provided (i) under the contract with UT-Battelle, the operator of ORNL; and (ii) from Centrus’ wholly owned subsidiary United States Enrichment Corporation (“Enrichment Corp.”) to Centrus and its 100% indirectly owned subsidiary American Centrifuge Operating, LLC pursuant to two secured intercompany financing notes. The financing obtained from Enrichment Corp. funds American Centrifuge activities pending receipt of payments related to work performed under the contract with UT-Battelle, American Centrifuge costs that are outside the scope of work under the contract with UT-Battelle, including D&D costs and ongoing costs to maintain the Piketon facility and our NRC licenses at that location, and general corporate expenses, including cash interest payments on our debt.
Capital expenditures are expected to be insignificant for at least the next 12 months.
In September 2015, Centrus completed a successful three-year demonstration of the American Centrifuge technology at its facility in Piketon, Ohio. U.S. government funding for American Centrifuge is now limited to research and development work at our facilities in Oak Ridge, Tennessee. As a result of reduced program funding, workforce reductions commenced in the fourth quarter of 2015 and we expect to make payments of $5.4 million for remaining workforce reductions through 2019.
Centrus began to incur expenditures in the second quarter of 2016 associated with the D&D of the Piketon facility in accordance with the requirements of the NRC and DOE. In the three months ended March 31, 2017, D&D costs of $3.7 million were charged against the accrued D&D liability. The D&D work is expected to extend through 2017 and be substantially completed by year-end. As of March 31, 2017, we have accrued $34.9 million for the estimated fair value of the remaining costs to complete the D&D work.
Centrus has previously provided financial assurance to the NRC and DOE for D&D and lease turnover costs in the form of surety bonds of approximately $16 million and $13 million, respectively, which are fully cash collateralized by Centrus. Centrus expects to receive cash when surety bonds are reduced and/or cancelled as the Company fulfills its D&D and lease obligations.
31
In the event that funding by the U.S. government is further reduced or discontinued, the American Centrifuge project may be subject to further demobilization, costs, delays and termination. Any such actions may have a material adverse impact on our ability to deploy the American Centrifuge technology and on our liquidity.
The change in cash and cash equivalents from our condensed consolidated statements of cash flows are as follows on a summarized basis (in millions):
|
Three Months Ended
March 31, |
|||||||
|
|
2017
|
2016
|
|||||
|
Cash used in operating activities
|
$
|
(82.0
|
)
|
$
|
(54.9
|
)
|
|
|
Cash provided by investing activities
|
0.6
|
|
0.6
|
|
|||
|
Cash used in financing activities
|
(27.6
|
)
|
—
|
|
|||
|
Decrease in cash and cash equivalents
|
$
|
(109.0
|
)
|
$
|
(54.3
|
)
|
|
Operating Activities
The net reduction of $59.5 million in the SWU purchase payables balance, due to the timing of purchase deliveries, was a significant use of cash in the three months ended March 31, 2017. Other uses of cash are reflected in the reduction of accounts payable and other liabilities of $18.4 million. Sources of cash included the decline of accounts receivable of $23.0 million due to collections from customers in the three-month period without increased sales and billings. The operating loss of
$23.6 million
in the three months ended March 31, 2017, net of non-cash expenses, was a use of cash.
In the corresponding period in 2016, the net reduction of $61.0 million in the SWU purchase payables balance was a significant use of cash. American Centrifuge expenses were also a significant use of cash, including demobilization expenses and contract work expenses not paid until April 2016 under the terms of the 2016 ORNL Contract. Other uses of cash are reflected in the reduction in accounts payable and accrued liabilities of $9.8 million. Sources of cash included the monetization of inventory purchased in prior periods. Inventories declined $48.5 million in the quarter, less an increase in receivables from utility customers of $13.4 million.
Investing Activities
There were no significant capital expenditures in the three months ended March 31, 2017, or the corresponding period in 2016.
Financing Activities
On February 14, 2017, pursuant to an exchange offer and consent solicitation, Centrus exchanged $204.9 million principal amount of the Company’s 8% PIK Toggle Notes for $74.3 million principal amount of 8.25% Notes, 104,574 shares of Series B Preferred Stock and $27.6 million of cash. Refer to
Note 8, Debt
of the condensed consolidated financial statements.
Working Capital
|
March 31,
2017 |
December 31,
2016
|
||||||
|
(in millions)
|
|||||||
|
Cash and cash equivalents
|
$
|
151.7
|
|
$
|
260.7
|
|
|
|
Accounts receivable
|
5.8
|
|
19.9
|
|
|||
|
Inventories, net
|
120.8
|
|
119.9
|
|
|||
|
Other current assets and liabilities, net
|
(101.4
|
)
|
(165.6
|
)
|
|||
|
Working capital
|
$
|
176.9
|
|
$
|
234.9
|
|
|
32
Capital Structure and Financial Resources
On February 14, 2017, pursuant to an exchange offer and consent solicitation, we exchanged $204.9 million principal amount of our 8% paid-in-kind (“PIK”) toggle notes (“8% PIK Toggle Notes”) for $74.3 million principal amount of 8.25% notes maturing in February 2027 (the “8.25% Notes”), 104,574 shares of Series B Preferred Stock with liquidation preference of $1,000 per share, and $27.6 million of cash. Following the exchange offer, $29.6 million principal amount of 8% PIK Toggle Notes remained outstanding. The Company recognized a gain related to the note exchange of $33.6 million in the three months ended March 31, 2017, which is net of transaction costs of $9.0 million and previously deferred issuance costs related to the 8% PIK Toggle Notes of $0.4 million.
Interest on the 8.25% Notes is payable semi-annually in arrears as of February 28 and August 31 based on a 360-day year consisting of twelve 30-day months. The 8.25% Notes are guaranteed on a subordinated and limited basis by, and secured by substantially all assets of, Enrichment Corp. Additional terms and conditions of the 8.25% Notes and the Enrichment Corp. guarantee are described in
Note 8, Debt
of the condensed consolidated financial statements.
The principal amount of the 8% PIK Toggle Notes is increased by any payment of interest in the form of PIK payments. The Company has the option to pay up to 5.5% per annum of interest due on the 8% PIK Toggle Notes in the form of PIK payments. For the semi-annual interest periods ended March 31, 2017, and September 30, 2017, the Company has elected to pay interest in the form of cash payments at 2.5% per annum and PIK payments at 5.5% per annum. The principal amount of the 8% PIK Toggle Notes is $30.5 million as of March 31, 2017. The 8% PIK Toggle Notes are guaranteed and secured on a subordinated, conditional, and limited basis by Enrichment Corp. Enrichment Corp. will be released from its guarantee without the consent of the holders of the 8% PIK Toggle Notes upon the occurrence of certain termination events (other than with respect to an unconditional interest claim). Additional terms and conditions of the 8% PIK Toggle Notes and the Enrichment Corp. guarantee are described in
Note 8, Debt
of the condensed consolidated financial statements.
Holders of the Series B Preferred Stock are entitled to cumulative dividends of 7.5% per annum of the Liquidation Preference. We are obligated to pay cash dividends on our Series B Preferred Stock to the extent that: our pension plans and Enrichment Corp.’s pension plans are at least 90% funded on a variable rate premium calculation in the current plan year; our net income calculated in accordance with generally accepted accounting principles in the United States (“GAAP”) (excluding the effect of pension remeasurement) for the immediately preceding fiscal quarter exceeds $7.5 million; our free cash flow (defined as the sum of cash provided by (used in) operating activities and cash provided by (used in) investing activities) for the immediately preceding four fiscal quarters exceeds $35 million; the balance of cash and cash equivalents calculated in accordance with GAAP on the last day of the immediately preceding quarter would exceed $150 million after pro forma application of the dividend payment; and dividends may be legally paid under Delaware law.
The nuclear industry in general, and the nuclear fuel industry in particular, are in a period of significant change. We are actively considering, and expect to consider from time to time in the future, potential strategic transactions, which at any given time may be in various stages of discussions, diligence or negotiation with respect to a number of potential acquisitions. If we pursue opportunities that require capital, we believe we would seek to satisfy these needs through a combination of working capital, cash generated from operations or additional debt or equity financing.
We are managing our working capital to seek to improve the long-term value of our LEU business and are planning to continue funding the Company’s qualified pension plans in the ordinary course because we believe that is in the best interest of all stakeholders. We expect that any other uses of working capital will be undertaken in light of these strategic priorities and will be based on the Company’s determination as to the relative strength of its operating performance and prospects, financial position and expected liquidity requirements. In addition, we expect that any such other uses of working capital will be subject to compliance with contractual restrictions to which the Company and its subsidiaries are subject, including the terms and conditions of their debt securities and credit
33
facilities. The Company continually evaluates alternatives to manage our capital structure, and may opportunistically repurchase, exchange or redeem Company securities from time to time.
NYSE MKT Listing Standards Notice
On April 28, 2017, the NYSE MKT LLC (“NYSE MKT”) informed Centrus that it was back in compliance with the NYSE MKT continued listing standards because it had resolved the continued listing deficiency with respect to Sections 1003(a)(i) and (ii) of the NYSE MKT’s Company Guide. On November 17, 2015, Centrus received a notice from the NYSE MKT indicating that the Company was not in compliance with the continued listing standards since the Company reported a stockholders’ deficit as of September 30, 2015, and net losses in its fiscal years ended December 31, 2011, 2012 and 2013. In December 2015, the Company submitted a plan to regain compliance and the NYSE MKT accepted the plan in January 2016. Effective May 1, 2017, Centrus was removed from the list of NYSE MKT noncompliant issuers on the exchange’s website. In accordance with NYSE MKT regulations, Centrus will be subject to a 12-month follow-up review period to ensure that the Company does not fall below any of the NYSE MKT’s continued listing standards.
Off-Balance Sheet Arrangements
Other than outstanding letters of credit and surety bonds, our SWU purchase commitments and the license agreement with DOE relating to the American Centrifuge technology disclosed in our Annual Report on Form 10-K for the fiscal year ended December 31, 2016, there were no material off-balance sheet arrangements at March 31, 2017, or December 31, 2016.
New Accounting Standards Not Yet Implemented
Reference is made to
New Accounting Standards
in
Note 1, Basis of Presentation,
of the condensed consolidated financial statements for information on new accounting standards.
34
Item 4.
Controls and Procedures
Evaluation of Disclosure Controls and Procedures
Centrus maintains disclosure controls and procedures that are designed to ensure that information required to be disclosed by Centrus in reports it files or submits under the Securities Exchange Act of 1934, as amended, (the “Exchange Act”) is recorded, processed, summarized and reported on a timely basis and that such information is accumulated and communicated to management, including the Chief Executive Officer and the Chief Financial Officer, as appropriate to allow for timely decisions regarding required disclosures.
As previously disclosed in
Part II, Item 9A, Controls and Procedures
of our Annual Report on Form 10-K for the fiscal year ended December 31, 2016, management identified a material weakness in the Company’s internal control over financial reporting. Because of this material weakness, our Chief Executive Officer and Chief Financial Officer concluded that the Company’s disclosure controls and procedures were not effective as of December 31, 2016.
As of
March 31, 2017
, the end of the period covered by this report, our management performed an evaluation, under the supervision and with the participation of the Chief Executive Officer and the Chief Financial Officer, of the effectiveness of our disclosure controls and procedures (as defined in Rule 13a-15(e) under the Securities Exchange Act). Based on this evaluation, the Chief Executive Officer and the Chief Financial Officer concluded that the Company’s disclosure controls and procedures were not effective due to the previously identified material weakness in internal control over financial reporting, which continued to exist as of
March 31, 2017
.
Notwithstanding the material weakness described below, our management concluded that the condensed consolidated financial statements included in this report fairly present, in all material respects, our financial position, results of operations and cash flows as of the dates, and for the periods presented, in accordance with GAAP.
Efforts to Address Material Weakness
The Company has and expects to continue to make progress in improving internal control over accounting for our D&D obligation. Management has enhanced its review process of D&D costs incurred and projected costs remaining to complete the D&D work and we expect to formalize applicable procedures as remedial controls and begin related controls testing in the second quarter of 2017. The material weakness will not be considered remediated until the remedial controls operate for a sufficient period of time and management has concluded, through testing, that these controls are operating effectively. We expect that the remediation of this material weakness will be completed by the end of 2017.
Changes in Internal Control Over Financial Reporting
Other than the steps taken to work towards the remediation of the material weakness identified above, there were no changes in our internal control over financial reporting during the quarter ended March 31, 2017, that have materially affected, or are reasonably likely to materially affect, our internal control over financial reporting.
35
Item 1.
Legal Proceedings
There have been no material changes to the Legal Proceedings set forth under Part I, Item 3,
Legal Proceedings,
in our Annual Report on Form 10-K for the fiscal year ended December 31, 2016.
Centrus is subject to various legal proceedings and claims, either asserted or unasserted, which arise in the ordinary course of business. While the outcome of these claims cannot be predicted with certainty, we do not believe that the outcome of any of these legal matters, individually and in the aggregate, will have a material adverse effect on our cash flows, results of operations or consolidated financial condition.
Item 1A.
Risk Factors
There have been no material changes to the Risk Factors described in Part I, Item 1A,
Risk Factors
, in our Annual Report on Form 10-K for the fiscal year ended December 31, 2016.
Item 6.
Exhibits
The exhibits listed on the accompanying Exhibit Index are filed or incorporated by reference as part of this report and such Exhibit Index is incorporated herein by reference. The accompanying Exhibit Index identifies each management contract or compensatory plan or arrangement required to be filed as an exhibit to this report.
36
SIGNATURES
Pursuant to the requirements of the Securities Exchange Act of 1934, the registrant has duly caused this report to be signed on its behalf by the undersigned thereunto duly authorized.
|
|
Centrus Energy Corp.
|
|||
|
|
|
|
|
|
|
|
|
|
|
|
|
Date:
|
May 10, 2017
|
By:
|
/s/ Stephen S. Greene
|
|
|
|
|
Stephen S. Greene
|
|
|
|
|
Senior Vice President, Chief Financial Officer and Treasurer
|
|||
|
|
(Duly Authorized Officer and Principal Financial Officer)
|
|||
37
EXHIBIT INDEX
|
Exhibit No.
|
Description
|
|
31.1
|
Certification of the Chief Executive Officer pursuant to Rule 13a-14(a)/15d-14(a) under the Securities Exchange Act of 1934, as amended. (a)
|
|
31.2
|
Certification of the Chief Financial Officer pursuant to Rule 13a-14(a)/15d-14(a) under the Securities Exchange Act of 1934, as amended. (a)
|
|
32.1
|
Certification of Chief Executive Officer and Chief Financial Officer pursuant to 18 U.S.C. Section 1350. (a)
|
|
101
|
Condensed consolidated financial statements from the Quarterly Report on Form 10-Q for the quarter ended March 31, 2017, filed in interactive data file (XBRL) format.
|
|
(a)
|
Filed herewith.
|
38
TABLE OF CONTENTS
Note 12, Commitments and ContingenciesNote 13, Stockholders EquityNote 8, DebtNote 2, Special ChargesNote 10, Pension and Post-retirement Health and Life BenefitsItem 2. Management S Discussion and Analysis Of Financial Condition and Results Of OperationsNote 12, Commitments and Contingencies,Note 4, ReceivablesNote 1, Basis Of Presentation,Item 4. Controls and ProceduresPart Ii, Item 9a, Controls and ProceduresPart IIItem 1. Legal ProceedingsItem 1A. Risk FactorsItem 6. Exhibits