CENTRUS ENERGY CORP
10-Ks and 10-Qs
|
|
|
|
|
|
|
|
|
|
|
|
|
|
|
|
|
|
|
|
|
|
|
|
|
|
|
|
|
|
|
|
|
|
|
|
|
|
|
|
|
|
|
|
|
|
|
|
|
|
|
|
|
UNITED STATES
SECURITIES AND EXCHANGE COMMISSION
Washington, D.C. 20549

FORM 10-Q
|
ý
|
QUARTERLY REPORT PURSUANT TO SECTION 13 OR 15(d) OF THE SECURITIES EXCHANGE ACT OF 1934
|
For the quarterly period ended
June 30, 2018
OR
|
o
|
TRANSITION REPORT PURSUANT TO SECTION 13 OR 15(d) OF THE SECURITIES EXCHANGE ACT OF 1934
|
Commission file number 1-14287
Centrus Energy Corp.
|
Delaware
|
52-2107911
|
|
(State of incorporation)
|
(I.R.S. Employer Identification No.)
|
6901 Rockledge Drive, Suite 800, Bethesda, Maryland 20817
(301) 564-3200
Indicate by check mark whether the registrant (1) has filed all reports required to be filed by Section 13 or 15(d) of the Securities Exchange Act of 1934 during the preceding 12 months (or for such shorter period that the registrant was required to file such reports), and (2) has been subject to such filing requirements for the past 90 days. Yes
ý
No
o
Indicate by check mark whether the registrant has submitted electronically and posted on its corporate Web site, if any, every Interactive Data File required to be submitted and posted pursuant to Rule 405 of Regulation S-T (§232.405 of this chapter) during the preceding 12 months (or for such shorter period that the registrant was required to submit and post such files). Yes
ý
No
o
Indicate by check mark whether the registrant is a large accelerated filer, an accelerated filer, a non-accelerated filer, a smaller reporting company or an emerging growth company. See the definitions of “large accelerated filer,” “accelerated filer,” “smaller reporting company,” and “emerging growth company” in Rule 12b-2 of the Exchange Act.
|
Large accelerated filer
|
o
|
|
Smaller reporting company
|
ý
|
|
Accelerated filer
|
o
|
|
Emerging growth company
|
o
|
|
Non-accelerated filer
|
o
|
|||
If an emerging growth company, indicate by check mark if the registrant has elected not to use the extended transition period for complying with any new or revised financial accounting standards provided pursuant to Section 13(a) of the Exchange Act.
o
Indicate by check mark whether the registrant is a shell company (as defined in Rule 12b-2 of the Exchange Act).
Yes
o
No
ý
Indicate by check mark whether the registrant has filed all documents and reports required to be filed by Sections 12, 13 or 15(d) of the Securities Exchange Act of 1934 subsequent to the distribution of securities under a plan confirmed by a court.
Yes
ý
No
o
As of August 1, 2018, there were 7,632,669 shares of the registrant’s Class A Common Stock, par value $0.10 per share, and 1,406,082 shares of the registrant’s Class B Common Stock, par value $0.10 per share, outstanding.
TABLE OF CONTENTS
|
|
|
Page
|
|
|
PART I – FINANCIAL INFORMATION
|
|
|
|
|
|
|
|
||
|
|
||
|
|
||
|
|
||
|
|
||
|
|
||
|
|
||
|
|
|
|
|
|
PART II – OTHER INFORMATION
|
|
FORWARD-LOOKING STATEMENTS
This Quarterly Report on Form 10-Q, including
Management’s Discussion and Analysis of Financial Condition and Results of Operations
in Part I, Item 2, contains “forward-looking statements” within the meaning of Section 21E of the Securities Exchange Act of 1934, as amended (the “Exchange Act”) - that is, statements related to future events. In this context, forward-looking statements may address our expected future business and financial performance, and often contain words such as “expects”, “anticipates”, “intends”, “plans”, “believes”, “will”, “should”, “could”, “would” or “may” and other words of similar meaning. Forward-looking statements by their nature address matters that are, to different degrees, uncertain. For Centrus Energy Corp., particular risks and uncertainties that could cause our actual future results to differ materially from those expressed in our forward-looking statements include risks: related to our significant long-term liabilities, including material unfunded defined benefit pension plan obligations and postretirement health and life benefit obligations; risks relating to our outstanding 8.0% paid-in-kind (“PIK”) toggle notes (the “8% PIK Toggle Notes”) maturing in September 2019, our 8.25% notes (the “8.25% Notes”) maturing in February 2027 and our Series B Senior Preferred Stock, including the potential termination of the guarantee by United States Enrichment Corporation of the 8% PIK Toggle Notes; risks related to the use of our net operating losses (“NOLs”) and net unrealized built-in losses (“NUBILs”) to offset future taxable income and the use of the Rights Agreement (as defined herein) to prevent an “ownership change” as defined in Section 382 of the Internal Revenue Code of 1986, as amended (the “Code”) and our ability to generate taxable income to utilize all or a portion of the NOLs and NUBILs prior to the expiration thereof; risks related to the limited trading markets in our securities; risks related to our ability to maintain the listing of our Class A Common Stock on the NYSE American LLC (the “NYSE American”); risks related to decisions made by our Class B stockholders regarding their investment in the Company based upon factors that are unrelated to the Company’s performance; the continued impact of the March 2011 earthquake and tsunami in Japan on the nuclear industry and on our business, results of operations and prospects; the impact and potential extended duration of the current supply/demand imbalance in the market for low-enriched uranium (“LEU”); our dependence on others for deliveries of LEU including deliveries from the Russian government entity Joint Stock Company “TENEX” (“TENEX”) under a commercial supply agreement with TENEX and deliveries under a long-term supply agreement with Orano Cycle; risks related to our
2
ability to sell the LEU we procure pursuant to our purchase obligations under our supply agreements; risks relating to our sales order book, including uncertainty concerning customer actions under current contracts and in future contracting due to market conditions and lack of current production capability; risks related to financial difficulties experienced by customers, including possible bankruptcies, insolvencies or any other inability to pay for our products or services; pricing trends and demand in the uranium and enrichment markets and their impact on our profitability; movement and timing of customer orders; risks related to the value of our intangible assets related to the sales order book and customer relationships; risks associated with our reliance on third-party suppliers to provide essential services to us; risks related to existing or new trade barriers and contract terms that limit our ability to deliver LEU to customers; risks related to actions that may be taken by the U.S. government, the Russian government or other governments that could affect our ability to perform or the ability of our sources of supply to perform under their contract obligations to us, including the imposition of sanctions, restrictions or other requirements; the impact of government regulation including by the U.S. Department of Energy and the United States Nuclear Regulatory Commission; uncertainty regarding our ability to commercially deploy competitive enrichment technology; risks and uncertainties regarding funding for the American Centrifuge project and our ability to perform under our agreement with UT-Battelle, LLC (“UT-Battelle”), the management and operating contractor for Oak Ridge National Laboratory (“ORNL”), for continued research and development of the American Centrifuge technology; the potential for further demobilization or termination of the American Centrifuge project; risks related to the current demobilization of portions of the American Centrifuge project, including risks that the schedule could be delayed and costs could be higher than expected; failures or security breaches of our information technology systems; potential strategic transactions, which could be difficult to implement, disrupt our business or change our business profile significantly; the outcome of legal proceedings and other contingencies (including lawsuits and government investigations or audits); the competitive environment for our products and services; changes in the nuclear energy industry; the impact of financial market conditions on our business, liquidity, prospects, pension assets and insurance facilities; revenue and operating results can fluctuate significantly from quarter to quarter, and in some cases, year to year; and other risks and uncertainties discussed in this and our other filings with the Securities and Exchange Commission, including our Annual Report on Form 10-K for the year ended December 31, 2017.
Readers are urged to carefully review and consider the various disclosures made in this report and in our other filings with the Securities and Exchange Commission that attempt to advise interested parties of the risks and factors that may affect our business. We do not undertake to update our forward-looking statements to reflect events or circumstances that may arise after the date of this Quarterly Report on Form 10-Q, except as required by law.
3
CENTRUS ENERGY CORP.
(Unaudited; in millions, except share and per share data)
|
|
June 30,
2018 |
December 31,
2017 |
|||||
|
ASSETS
|
|
|
|||||
|
Current assets
|
|
|
|||||
|
Cash and cash equivalents
|
$
|
140.1
|
|
$
|
208.8
|
|
|
|
Accounts receivable
|
27.9
|
|
60.2
|
|
|||
|
Inventories
|
100.0
|
|
153.1
|
|
|||
|
Deferred costs associated with deferred revenue
|
130.2
|
|
122.3
|
|
|||
|
Other current assets
|
22.7
|
|
22.5
|
|
|||
|
Total current assets
|
420.9
|
|
566.9
|
|
|||
|
Property, plant and equipment, net of accumulated depreciation of $2.2 as of June 30, 2018 and $1.9 as of December 31, 2017
|
4.5
|
|
4.9
|
|
|||
|
Deposits for financial assurance
|
19.8
|
|
19.7
|
|
|||
|
Intangible assets, net
|
79.9
|
|
82.7
|
|
|||
|
Other long-term assets
|
0.7
|
|
1.1
|
|
|||
|
Total assets
|
$
|
525.8
|
|
$
|
675.3
|
|
|
|
LIABILITIES AND STOCKHOLDERS’ DEFICIT
|
|
|
|
|
|||
|
Current liabilities
|
|
|
|
|
|||
|
Accounts payable and accrued liabilities
|
$
|
47.0
|
|
$
|
54.3
|
|
|
|
Payables under SWU purchase agreements
|
19.5
|
|
79.4
|
|
|||
|
Inventories owed to customers and suppliers
|
45.1
|
|
77.9
|
|
|||
|
Deferred revenue and advances from customers
|
195.0
|
|
191.8
|
|
|||
|
Total current liabilities
|
306.6
|
|
403.4
|
|
|||
|
Long-term debt
|
155.3
|
|
157.5
|
|
|||
|
Postretirement health and life benefit obligations
|
151.7
|
|
154.2
|
|
|||
|
Pension benefit liabilities
|
155.2
|
|
161.6
|
|
|||
|
Advances from customers
|
14.5
|
|
—
|
|
|||
|
Other long-term liabilities
|
12.3
|
|
17.5
|
|
|||
|
Total liabilities
|
795.6
|
|
894.2
|
|
|||
|
Commitments and contingencies (Note 11)
|
|
|
|
|
|||
|
Stockholders’ deficit
|
|||||||
|
Preferred stock, par value $1.00 per share, 20,000,000 shares authorized
|
|||||||
|
Series A Participating Cumulative Preferred Stock, none issued
|
—
|
|
—
|
|
|||
|
Series B Senior Preferred Stock, 7.5% cumulative, 104,574 shares issued and outstanding and an aggregate liquidation preference of $115.4 as of June 30, 2018 and $111.5 as of December 31, 2017
|
4.6
|
|
4.6
|
|
|||
|
Class A Common Stock, par value $0.10 per share, 70,000,000 shares authorized, 7,632,669 shares issued and outstanding as of June 30, 2018 and December 31, 2017
|
0.8
|
|
0.8
|
|
|||
|
Class B Common Stock, par value $0.10 per share, 30,000,000 shares authorized, 1,406,082 shares issued and outstanding as of June 30, 2018 and December 31, 2017
|
0.1
|
|
0.1
|
|
|||
|
Excess of capital over par value
|
60.2
|
|
60.0
|
|
|||
|
Accumulated deficit
|
(335.5
|
)
|
(284.5
|
)
|
|||
|
Accumulated other comprehensive income, net of tax
|
—
|
|
0.1
|
|
|||
|
Total stockholders’ deficit
|
(269.8
|
)
|
(218.9
|
)
|
|||
|
Total liabilities and stockholders’ deficit
|
$
|
525.8
|
|
$
|
675.3
|
|
|
The accompanying notes are an integral part of these unaudited condensed consolidated financial statements.
4
CENTRUS ENERGY CORP.
(
Unaudited;
in millions, except share and per share data)
|
Three Months Ended
June 30, |
Six Months Ended
June 30, |
||||||||||||||
|
2018
|
2017
|
2018
|
2017
|
||||||||||||
|
Revenue:
|
|||||||||||||||
|
Separative work units
|
$
|
32.9
|
|
$
|
37.9
|
|
$
|
50.6
|
|
$
|
38.7
|
|
|||
|
Uranium
|
—
|
|
—
|
|
3.6
|
|
—
|
|
|||||||
|
Contract services
|
6.5
|
|
6.1
|
|
20.9
|
|
12.5
|
|
|||||||
|
Total revenue
|
39.4
|
|
44.0
|
|
75.1
|
|
51.2
|
|
|||||||
|
Cost of Sales:
|
|||||||||||||||
|
Separative work units and uranium
|
42.9
|
|
42.5
|
|
77.7
|
|
45.2
|
|
|||||||
|
Contract services
|
7.2
|
|
6.2
|
|
13.4
|
|
13.6
|
|
|||||||
|
Total cost of sales
|
50.1
|
|
48.7
|
|
91.1
|
|
58.8
|
|
|||||||
|
Gross loss
|
(10.7
|
)
|
(4.7
|
)
|
(16.0
|
)
|
(7.6
|
)
|
|||||||
|
Advanced technology license and decommissioning costs
|
5.4
|
|
4.4
|
|
13.4
|
|
10.5
|
|
|||||||
|
Selling, general and administrative
|
9.7
|
|
9.7
|
|
20.9
|
|
22.1
|
|
|||||||
|
Amortization of intangible assets
|
1.5
|
|
2.0
|
|
2.8
|
|
3.2
|
|
|||||||
|
Special charges for workforce reductions and advisory costs
|
0.3
|
|
2.3
|
|
0.9
|
|
4.7
|
|
|||||||
|
Gains on sales of assets
|
(0.2
|
)
|
(0.7
|
)
|
(0.3
|
)
|
(1.7
|
)
|
|||||||
|
Operating loss
|
(27.4
|
)
|
(22.4
|
)
|
(53.7
|
)
|
(46.4
|
)
|
|||||||
|
Gain on early extinguishment of debt
|
—
|
|
—
|
|
—
|
|
(33.6
|
)
|
|||||||
|
Nonoperating components of net periodic benefit expense (income)
|
(1.7
|
)
|
(0.4
|
)
|
(3.3
|
)
|
(0.8
|
)
|
|||||||
|
Interest expense
|
1.0
|
|
0.7
|
|
2.0
|
|
3.6
|
|
|||||||
|
Investment income
|
(0.6
|
)
|
(0.3
|
)
|
(1.2
|
)
|
(0.6
|
)
|
|||||||
|
Loss before income taxes
|
(26.1
|
)
|
(22.4
|
)
|
(51.2
|
)
|
(15.0
|
)
|
|||||||
|
Income tax benefit
|
—
|
|
—
|
|
(0.1
|
)
|
(0.2
|
)
|
|||||||
|
Net loss
|
(26.1
|
)
|
(22.4
|
)
|
(51.1
|
)
|
(14.8
|
)
|
|||||||
|
Preferred stock dividends - undeclared and cumulative
|
2.0
|
|
2.0
|
|
4.0
|
|
3.0
|
|
|||||||
|
Net loss allocable to common stockholders
|
$
|
(28.1
|
)
|
$
|
(24.4
|
)
|
$
|
(55.1
|
)
|
$
|
(17.8
|
)
|
|||
|
Net loss per common share - basic and diluted
|
$
|
(3.08
|
)
|
$
|
(2.69
|
)
|
$
|
(6.05
|
)
|
$
|
(1.96
|
)
|
|||
|
Average number of common shares outstanding - basic and diluted (in thousands):
|
9,118
|
|
9,077
|
|
9,111
|
|
9,070
|
|
|||||||
The accompanying notes are an integral part of these unaudited condensed consolidated financial statements.
5
CENTRUS ENERGY CORP.
CONDENSED CONSOLIDATED STATEMENTS OF COMPREHENSIVE INCOME (LOSS)
(
Unaudited;
in millions)
|
|
Three Months Ended
June 30, |
Six Months Ended
June 30, |
|||||||||||||
|
|
2018
|
2017
|
2018
|
2017
|
|||||||||||
|
Net loss
|
$
|
(26.1
|
)
|
$
|
(22.4
|
)
|
$
|
(51.1
|
)
|
$
|
(14.8
|
)
|
|||
|
Other comprehensive loss, before tax (Note 12):
|
|||||||||||||||
|
Amortization of prior service credits, net
|
(0.1
|
)
|
—
|
|
(0.1
|
)
|
(0.1
|
)
|
|||||||
|
Other comprehensive loss, before tax
|
(0.1
|
)
|
—
|
|
(0.1
|
)
|
(0.1
|
)
|
|||||||
|
Income tax benefit related to items of other comprehensive income
|
—
|
|
—
|
|
—
|
|
—
|
|
|||||||
|
Other comprehensive loss, net of tax benefit
|
(0.1
|
)
|
—
|
|
(0.1
|
)
|
(0.1
|
)
|
|||||||
|
Comprehensive loss
|
$
|
(26.2
|
)
|
$
|
(22.4
|
)
|
$
|
(51.2
|
)
|
$
|
(14.9
|
)
|
|||
The accompanying notes are an integral part of these unaudited condensed consolidated financial statements.
6
CENTRUS ENERGY CORP.
(
Unaudited;
in millions)
|
|
Six Months Ended
June 30, |
||||||
|
|
2018
|
2017
|
|||||
|
Operating Activities
|
|
||||||
|
Net loss
|
$
|
(51.1
|
)
|
$
|
(14.8
|
)
|
|
|
Adjustments to reconcile net loss to cash used in operating activities:
|
|||||||
|
Depreciation and amortization
|
3.3
|
|
3.6
|
|
|||
|
PIK interest on paid-in-kind toggle notes
|
0.9
|
|
0.8
|
|
|||
|
Gain on early extinguishment of debt
|
—
|
|
(33.6
|
)
|
|||
|
Gain on sales of assets
|
(0.3
|
)
|
(1.7
|
)
|
|||
|
Changes in operating assets and liabilities:
|
|||||||
|
Accounts receivable
|
32.1
|
|
(32.1
|
)
|
|||
|
Inventories, net
|
20.4
|
|
42.7
|
|
|||
|
Payables under SWU purchase agreements
|
(59.9
|
)
|
(39.7
|
)
|
|||
|
Deferred revenue, net of deferred costs
|
(4.7
|
)
|
13.9
|
|
|||
|
Accounts payable and other liabilities
|
(7.0
|
)
|
(15.7
|
)
|
|||
|
Other, net
|
0.6
|
|
(1.4
|
)
|
|||
|
Cash used in operating activities
|
(65.7
|
)
|
(78.0
|
)
|
|||
|
Investing Activities
|
|||||||
|
Capital expenditures
|
(0.1
|
)
|
(0.1
|
)
|
|||
|
Proceeds from sales of assets
|
0.3
|
|
1.7
|
|
|||
|
Cash provided by investing activities
|
0.2
|
|
1.6
|
|
|||
|
Financing Activities
|
|||||||
|
Payment of interest classified as debt
|
(3.0
|
)
|
—
|
|
|||
|
Repurchase of debt
|
—
|
|
(27.6
|
)
|
|||
|
Payment of securities transaction costs
|
—
|
|
(9.0
|
)
|
|||
|
Cash used in financing activities
|
(3.0
|
)
|
(36.6
|
)
|
|||
|
Decrease in cash, cash equivalents and restricted cash
|
(68.5
|
)
|
(113.0
|
)
|
|||
|
Cash, cash equivalents and restricted cash at beginning of period
(1)
|
244.8
|
|
296.7
|
|
|||
|
Cash, cash equivalents and restricted cash at end of period
(1)
|
$
|
176.3
|
|
$
|
183.7
|
|
|
|
Supplemental cash flow information:
|
|||||||
|
Interest paid in cash
|
$
|
0.4
|
|
$
|
2.1
|
|
|
|
Non-cash activities:
|
|||||||
|
Conversion of interest payable-in-kind to long-term debt
|
$
|
0.9
|
|
$
|
0.8
|
|
|
|
Exchange of debt for Series B preferred stock
|
$
|
—
|
|
$
|
4.6
|
|
|
_______________
(1)
Refer to
Note 4
regarding cash, cash equivalents and restricted cash.
The accompanying notes are an integral part of these unaudited condensed consolidated financial statements.
7
CENTRUS ENERGY CORP.
CONDENSED CONSOLIDATED STATEMENTS OF STOCKHOLDERS’ DEFICIT
(
Unaudited;
in millions, except per share data)
|
|
Preferred Stock,
Series B
|
Common Stock,
Class A,
Par Value
$.10 per Share
|
Common Stock,
Class B,
Par Value
$.10 per Share
|
Excess of
Capital Over
Par Value
|
Accumulated Deficit
|
Accumulated
Other Comprehensive Income
|
Total
|
||||||||||||||||||||
|
Balance at December 31, 2016
|
$
|
—
|
|
$
|
0.8
|
|
$
|
0.1
|
|
$
|
59.5
|
|
$
|
(296.7
|
)
|
$
|
0.2
|
|
$
|
(236.1
|
)
|
||||||
|
Net loss
|
—
|
|
—
|
|
—
|
|
—
|
|
(14.8
|
)
|
—
|
|
(14.8
|
)
|
|||||||||||||
|
Issuance of preferred stock
|
4.6
|
|
—
|
|
—
|
|
—
|
|
—
|
|
—
|
|
4.6
|
|
|||||||||||||
|
Other comprehensive loss, net of tax benefit (Note 12)
|
—
|
|
—
|
|
—
|
|
—
|
|
—
|
|
(0.1
|
)
|
(0.1
|
)
|
|||||||||||||
|
Restricted stock units and stock options issued, net of amortization
|
—
|
|
—
|
|
—
|
|
0.2
|
|
—
|
|
—
|
|
0.2
|
|
|||||||||||||
|
Balance at June 30, 2017
|
$
|
4.6
|
|
$
|
0.8
|
|
$
|
0.1
|
|
$
|
59.7
|
|
$
|
(311.5
|
)
|
$
|
0.1
|
|
$
|
(246.2
|
)
|
||||||
|
Balance at December 31, 2017
|
$
|
4.6
|
|
$
|
0.8
|
|
$
|
0.1
|
|
$
|
60.0
|
|
$
|
(284.5
|
)
|
$
|
0.1
|
|
$
|
(218.9
|
)
|
||||||
|
Adoption of ASC 606 as of January 1, 2018 (Note 1)
|
—
|
|
—
|
|
—
|
|
—
|
|
0.1
|
|
—
|
|
0.1
|
|
|||||||||||||
|
Net loss
|
—
|
|
—
|
|
—
|
|
—
|
|
(51.1
|
)
|
—
|
|
(51.1
|
)
|
|||||||||||||
|
Other comprehensive loss, net of tax benefit (Note 12)
|
—
|
|
—
|
|
—
|
|
—
|
|
—
|
|
(0.1
|
)
|
(0.1
|
)
|
|||||||||||||
|
Restricted stock units and stock options issued, net of amortization
|
—
|
|
—
|
|
—
|
|
0.2
|
|
—
|
|
—
|
|
0.2
|
|
|||||||||||||
|
Balance at June 30, 2018
|
$
|
4.6
|
|
$
|
0.8
|
|
$
|
0.1
|
|
$
|
60.2
|
|
$
|
(335.5
|
)
|
$
|
—
|
|
$
|
(269.8
|
)
|
||||||
The accompanying notes are an integral part of these unaudited condensed consolidated financial statements.
8
CENTRUS ENERGY CORP.
NOTES TO CONDENSED CONSOLIDATED FINANCIAL STATEMENTS (Unaudited)
1. BASIS OF PRESENTATION
Basis of Presentation and Principles of Consolidation
The unaudited condensed consolidated financial statements of Centrus Energy Corp. (“Centrus” or the “Company”), which include the accounts of the Company, its principal subsidiary United States Enrichment Corporation (“Enrichment Corp.”) and its other subsidiaries, as of June 30, 2018, and for the three and six months ended June 30, 2018 and 2017, have been prepared pursuant to the rules and regulations of the Securities and Exchange Commission (“SEC”). The condensed consolidated balance sheet as of December 31, 2017, was derived from audited consolidated financial statements, but does not include all disclosures required by generally accepted accounting principles in the United States (“GAAP”). In the opinion of management, the unaudited condensed consolidated financial statements reflect all adjustments, including normal recurring adjustments, necessary for a fair statement of the financial results for the interim period. Certain prior year amounts have been reclassified for consistency with the current year presentation. Certain information and notes normally included in financial statements prepared in accordance with GAAP have been omitted pursuant to such rules and regulations. All material intercompany transactions have been eliminated.
Operating results for the three and six months ended June 30, 2018, are not necessarily indicative of the results that may be expected for the year ending December 31, 2018. The unaudited condensed consolidated financial statements should be read in conjunction with the consolidated financial statements and related notes and
Management's Discussion and Analysis of Financial Condition and Results of Operations
included in the Annual Report on Form 10-K for the year ended December 31, 2017.
Correction of Error
Management identified a classification error for
$0.3 million
of costs that had been previously included in
Cost of Sales
for the Contract Services Segment in the condensed consolidated statement of operations for the three months ended March 31, 2018. These costs are now included in
Advanced Technology License and Decommissioning Costs
in the condensed consolidated statement of operations for the six months ended June 30, 2018. The Company considered quantitative and qualitative factors in assessing the materiality of the classification error and determined that the classification error was not material. This revision had no impact to the Company’s net loss for the three months ended March 31, 2018 or the six months ended June 30, 2018.
New Accounting Standards
Recently Adopted Accounting Standards
In 2014, the Financial Accounting Standards Board (the “FASB”) issued Accounting Standards Update (“ASU”) 2014-09,
Revenue from Contracts with Customers,
which requires revenue to be recognized when a customer obtains control of promised goods and services at an amount that reflects the consideration the Company expects to receive in exchange for those goods and services. In addition, ASU 2014-09 and subsequent amendments, collectively known as Accounting Standards Codification (“ASC”) 606 (“ASC 606”) require certain additional disclosures regarding the nature, amount, timing, and uncertainty of revenues and cash flows arising from contracts with customers.
9
The Company adopted ASC 606 on January 1, 2018, using the modified retrospective method. The new standard was applied to contracts that were not completed as of the adoption date. The Company recognized the cumulative effect of initially applying ASC 606 of
$0.1 million
as an adjustment to the opening balance of accumulated deficit. The comparative information has not been restated and continues to be presented according to accounting standards in effect for those periods. Refer to
Note 2, Revenue Recognition and Contracts with Customers,
for additional information.
The following table summarizes the cumulative effect of the changes to the Company’s condensed consolidated balance sheet as of January 1, 2018, from the adoption of ASC 606 (in millions):
|
|
Balance at December 31, 2017
|
Adjustment for ASC 606
|
Balance at
January 1, 2018
|
||||||||
|
Assets:
|
|||||||||||
|
Unbilled contract revenue
|
$
|
—
|
|
$
|
0.1
|
|
$
|
0.1
|
|
||
|
Stockholders’ Deficit:
|
|||||||||||
|
Accumulated Deficit
|
(284.5
|
)
|
0.1
|
|
(284.4
|
)
|
|||||
The following table summarizes the impact of adopting ASC 606 on revenue and net loss for the three and six months ended June 30, 2018 (in millions):
|
Three Months Ended
June 30, 2018
|
Six Months Ended
June 30, 2018
|
||||||||||||||||||||||
|
|
As Reported
|
Under Previous Accounting
|
Effect of Adoption
|
As Reported
|
Under Previous Accounting
|
Effect of Adoption
|
|||||||||||||||||
|
Revenue - Contract services
|
$
|
6.5
|
|
$
|
8.1
|
|
$
|
(1.6
|
)
|
$
|
20.9
|
|
$
|
22.9
|
|
$
|
(2.0
|
)
|
|||||
|
Net loss
|
(26.1
|
)
|
(24.5
|
)
|
(1.6
|
)
|
(51.1
|
)
|
(49.1
|
)
|
(2.0
|
)
|
|||||||||||
The effect of adoption for the six months ended June 30, 2018, includes the opening balance adjustment of $0.1 million and
$1.9 million
of amounts billed as of June 30, 2018, that are included in
Deferred Revenue and Advances with Customers
pending transfer of control of contractual services to the customer.
In March 2017, the FASB issued ASU 2017-07,
Compensation-Retirement Benefits (Topic 715): Improving the Presentation of Net Periodic Pension Cost and Net Periodic Postretirement Benefit Cost
. ASU 2017-07 requires changes to the presentation of the components of net periodic benefit cost on the statement of operations by requiring service cost to be presented with other employee compensation costs and other components of net periodic benefit cost to be presented outside of any subtotal of operating income. The Company adopted this standard on January 1, 2018, on a retrospective basis for all periods presented, and certain prior period amounts have been recast to conform with the current presentation as follows (in millions):
|
|
Three Months Ended
June 30, 2017
|
Six Months Ended
June 30, 2017
|
|||||||||||||||||||||
|
|
As Previously Reported
|
Adjustments
|
Current Presentation
|
As Previously Reported
|
Adjustments
|
Current Presentation
|
|||||||||||||||||
|
Cost of sales - separative work units and uranium
|
$
|
42.1
|
|
$
|
0.4
|
|
$
|
42.5
|
|
$
|
44.4
|
|
$
|
0.8
|
|
$
|
45.2
|
|
|||||
|
Nonoperating components of net periodic benefit expense (income)
|
—
|
|
(0.4
|
)
|
(0.4
|
)
|
—
|
|
(0.8
|
)
|
(0.8
|
)
|
|||||||||||
Refer to
Note 9, Pension and Postretirement Benefits
for additional information.
10
In August 2016, the FASB issued ASU 2016-15,
Statement of Cash Flows (Topic 230): Classification of Certain Cash Receipts and Cash Payments
. ASU 2016-15 addresses the presentation and classification of certain cash receipts and cash payments in the statement of cash flows. It is intended to reduce diversity in practice by providing guidance on eight specific cash flow issues. ASU 2016-15 became effective for the Company on January 1, 2018. Upon adoption, the Company reclassified $9.0 million of transaction costs incurred in the first quarter of 2017 related to the note exchange (see
Note 7, Debt
) in the statement of cash flows as follows (in millions):
|
|
Six Months Ended
June 30, 2017
|
||||||||||
|
|
As Previously Reported
|
Adjustments
|
Current Presentation
|
||||||||
|
Cash used in operating activities
|
$
|
(87.0
|
)
|
$
|
9.0
|
|
$
|
(78.0
|
)
|
||
|
Cash used in financing activities
|
(27.6
|
)
|
(9.0
|
)
|
(36.6
|
)
|
|||||
In November 2016, the FASB issued ASU 2016-18,
Statement of Cash Flows (Topic 230): Restricted Cash
. ASU 2016-18 requires that the statement of cash flows explain the change during the period in the total of cash, cash equivalents, and amounts generally described as restricted cash or restricted cash equivalents. ASU 2016-18 is to be applied retrospectively for each period presented. The Company adopted the new standard on January 1, 2018. Upon adoption, the Company added its restricted cash balances to the consolidated statement of cash flows, and the prior period amounts have been recast to conform with the current presentation.
In October 2016, the FASB issued ASU 2016-16,
Income Taxes (Topic 740): Intra-Entity Transfers of Assets Other Than Inventory,
requiring an entity to recognize the income tax consequences of an intra-entity transfer of an asset other than inventory when the transfer occurs. Consequently, an entity is required to recognize the current and deferred income taxes resulting from an intra-entity transfer of assets other than inventory when the transfer occurs. ASU 2016-16 became effective for the Company in 2018, including interim reporting periods. In applying the new standard on a modified retrospective basis, there is no material cumulative-effect adjustment to retained earnings or net assets in its consolidated balance sheet as of January 1, 2018 due to the Company’s full valuation allowance against net deferred assets. In addition, the adoption did not have an impact to the Company’s net income (loss) for the three and six months ended June 30, 2018.
Accounting Standards Effective in Future Periods
In February 2016, the FASB issued ASU 2016-02,
Leases (Topic 842),
which requires lessees to recognize a right-of-use asset and lease liability on the balance sheet for all leases with terms longer than 12 months. Leases will be classified as either finance or operating, with classification affecting expense recognition in the statement of operations. ASU 2016-02 will become effective for the Company beginning in the first quarter of 2019, with early adoption permitted, and is to be applied using a modified retrospective approach. In the Company’s most recent Annual Report on Form 10-K, the Company reported undiscounted operating lease obligations of
$12.9 million
as of December 31, 2017. The Company’s principal leases relate to its headquarters office and its use of U.S. government facilities in Piketon, Ohio and Oak Ridge, Tennessee. The Company is evaluating the effect that the provisions of ASU 2016-02 will have on its condensed consolidated financial statements.
Significant Accounting Policies
The accounting policies of the Company are set forth in Note 1 to the Consolidated Financial Statements contained in the Company’s 2017 Annual Report on Form 10-K. Updates to those policies as a result of the adoption of ASC 606 have been included in
Note 2, Revenue Recognition and Contracts with Customers
.
11
2. REVENUE RECOGNITION AND CONTRACTS WITH CUSTOMERS
On January 1, 2018, the Company adopted ASC 606 using the modified retrospective method as applied to customer contracts that were not completed as of the adoption date. As a result, financial information for reporting periods beginning on or after January 1, 2018, are presented under ASC 606, while comparative financial information has not been adjusted and continues to be reported in accordance with the Company’s historical accounting policy for revenue recognition prior to the adoption of ASC 606. There was no material impact of adopting ASC 606 for sales under the LEU Segment. For sales under the Contract Services Segment, revenue is now recognized using a cost-to-cost method to measure the transfer of control of contract services to the customer.
Revenue Recognition
Revenue for product and service sales is recognized when or as the Company transfers control of the promised products or services to the customer. Revenue is measured at the transaction price which is based on the amount of consideration that the Company expects to receive in exchange for transferring the promised goods or services to the customer. The transaction price will include estimates of variable consideration to the extent it is probable that a significant reversal of revenue recognized will not occur.
Revenue for the Company’s LEU Segment is derived from sales of the separative work units (“SWU”) component of low enriched uranium (“LEU”), from sales of both the SWU and uranium components of LEU, and from sales of uranium. Contracts with customers are primarily long-term, fixed-commitment contracts under which its customers are obligated to purchase a specified quantity of the SWU component of LEU or the SWU and uranium components of LEU. The Company’s contracts for natural uranium are generally shorter-term, fixed- commitment contracts.
Revenue is recognized at the time the customer obtains control of the LEU or uranium. Customers generally obtain control of LEU at fuel fabricators. Centrus ships LEU to nuclear fuel fabricators for scheduled or anticipated orders from utility customers. Based on customer orders, Centrus arranges for the transfer of title of LEU from Centrus to the customer for the specified quantity of LEU at the fuel fabricator. Revenue is recognized when control of LEU is transferred to the customer at the fuel fabricator. Each such delivery to a customer is accounted for as a distinct performance obligation under a contract, and a contract may call for multiple deliveries over a number of periods. The contract’s transaction price is allocated to each performance obligation based on the observable standalone selling price of each distinct delivery of SWU or uranium.
Utility customers in general have the option to defer physical receipt of LEU or uranium purchased from the Company beyond the contractual sale period. In such cases, title to LEU or uranium is transferred to the customer and a performance obligation for Centrus is created and a receivable is recorded. Cash is collected for the receivable under normal credit terms. The performance obligation is represented as
Deferred Revenue
on the balance sheet and the customer-titled product is classified as
Deferred Costs Associated with Deferred Revenue
. Risk of loss remains with Centrus until physical delivery occurs. The recognition of revenue and related cost of sales occurs at the time physical delivery occurs and control and risk of loss of the product transfer to the customer, which may occur beyond one year. The timing of physical delivery, subject to notice period requirements, is at the option of the customer. As such, deferred costs and deferred revenue are classified within current assets and current liabilities, respectively.
On occasion, the Company will accept payment in the form of uranium. Revenue from the sale of SWU under such contracts is recognized at the time LEU is delivered and is based on the fair value of the uranium at contract inception or as the quantity of uranium is finalized, if variable. In the three months ended June 30, 2018, the Company received uranium valued at
$14.5 million
from a customer that elected to defer a SWU purchase obligation for a period greater than one year. Under the contract, the customer has not received title to SWU or LEU product from the Company. The Company’s contract liability to the customer is classified as
Advances from Customers
, a noncurrent liability.
12
Amounts billed to customers for handling costs are included in sales. Handling costs are accounted for as a fulfillment cost and are included in cost of sales. The Company does not have shipping costs associated with outbound freight after control over a product has transferred to a customer. The Company’s contracts with customers do not provide for significant payment terms or financing components.
Revenue for the Contract Services Segment, principally representing engineering and testing activities performed by the Company as well as technical and resource support, is recognized over the contractual period as services are rendered. The contract services segment also includes limited services provided by Centrus to the U.S. Department of Energy (“DOE”) and its contractors at the Portsmouth site related to facilities the Company leases from DOE. In the six months ended June 30, 2018, revenue for the contract services segment included
$9.5 million
under a settlement agreement with DOE and the United States government. Refer below to
Contract Balances
for additional details.
The Company recognizes revenue over time as it performs on these contracts because of the continuous transfer of control to the customer. With control transferring over time, revenue is recognized based on the extent of progress towards completion of the performance obligation. A contract may contain one or more performance obligations. Two or more promises to transfer goods or services to a customer may be considered a single performance obligation if the goods or services are highly interdependent or highly interrelated such that utility of the promised goods or services to the customer includes integration services provided by the Company.
The Company principally uses the cost-to-cost input method of progress for its contracts because it best depicts the transfer of control to the customer that occurs as the Company incurs costs. Under the cost-to-cost method, the extent of progress towards completion is measured based on the proportion of direct costs incurred to date to the total estimated direct costs at completion of the performance obligation. Revenues are recorded proportionally as costs are incurred. If transaction prices are not stated in the contract for each performance obligation, contractual prices are allocated to performance obligations based on estimated relative standalone selling prices of the promised services. For contracts that are not accounted for under the percentage of completion method, the Company records revenue as services are provided. The Company recognizes time-and-material contract revenue at negotiated, fixed, contractually billable rates as it delivers labor hours and incurs other direct expenses.
The Company has applied the practical expedient in paragraph ASC 606 and does not provide t
he value of r
emaining performance obligations under service contracts having original expected terms of one year or less.
The timing of revenue recognition may differ from the timing of invoicing to customers. Progress on satisfying performance obligations under contracts with customers and the related billings and cash collections are recorded on the consolidated balance sheet as contract assets or contract liabilities. Contract balances are classified as assets or liabilities on a contract-by-contract basis at the end of each reporting period.
Unbilled receivables (contract assets) are included in
Accounts Receivable
and arise when the timing of cash collected from customers differs from the timing of revenue recognition, such as when contract provisions require specific milestones to be met before a customer can be billed. Those assets are recognized when the revenue associated with the contract is recognized prior to billing and derecognized when billed in accordance with the terms of the contract. To the extent billings to the customer precede the recognition of contract services revenue, the Company recognizes a liability included in
Deferred Revenue and Advances from Customers
on the consolidated balance sheet.
13
Disaggregation of Revenue
The following table presents revenue from SWU and uranium sales disaggregated by geographical region based on the billing addresses of customers (in millions):
|
Three Months Ended
June 30, |
Six Months Ended
June 30, |
||||||||||||||
|
2018
|
2017
|
2018
|
2017
|
||||||||||||
|
United States
|
$
|
32.9
|
|
$
|
10.9
|
|
$
|
54.0
|
|
$
|
11.1
|
|
|||
|
Asia
|
—
|
|
27.0
|
|
0.1
|
|
27.6
|
|
|||||||
|
Other
|
—
|
|
—
|
|
0.1
|
|
—
|
|
|||||||
|
Revenue - SWU and uranium
|
$
|
32.9
|
|
$
|
37.9
|
|
$
|
54.2
|
|
$
|
38.7
|
|
|||
Refer to
Note 13, Segment Information
, for disaggregation of revenue by segment. Disaggregation by end-market is provided in Note 13 and the condensed consolidated statement of operations. SWU and uranium sales are made to electric utility customers. Contract services revenue results primarily from services provided to government contractors and, in the first quarter of 2018, the settlement with DOE and the United States government. SWU and uranium revenue is recognized at point of sale and contract services revenue is generally recognized over time.
Contract Balances
The following table represents changes in our contract assets and contract liabilities balances (in millions):
|
June 30,
2018
|
January 1, 2018
|
Year-To-Date Change
|
||||||||||
|
Contract assets
|
||||||||||||
|
Accounts receivable:
|
||||||||||||
|
Billed
|
$
|
27.9
|
|
$
|
60.2
|
|
$
|
(32.3
|
)
|
|||
|
Unbilled contract revenue
|
—
|
|
0.1
|
|
(0.1
|
)
|
||||||
|
Accounts receivable
|
$
|
27.9
|
|
$
|
60.3
|
|
$
|
(32.4
|
)
|
|||
|
Deferred costs associated with deferred revenue
|
$
|
130.2
|
|
$
|
122.3
|
|
$
|
7.9
|
|
|||
|
Contract liabilities
|
||||||||||||
|
Deferred revenue and advances from customers - current:
|
||||||||||||
|
Deferred revenue
|
$
|
193.1
|
|
$
|
172.5
|
|
$
|
20.6
|
|
|||
|
Advances from customers
|
1.9
|
|
19.3
|
|
(17.4
|
)
|
||||||
|
Deferred revenue and advances from customers - current
|
$
|
195.0
|
|
$
|
191.8
|
|
$
|
3.2
|
|
|||
|
Advances from customers - noncurrent
|
$
|
14.5
|
|
$
|
—
|
|
$
|
14.5
|
|
|||
Deferred cost and deferred revenue activity in the six months ended June 30, 2018, follows (in millions):
|
|
Deferred Sales in the Period
|
Previously Deferred Sales Recognized in the Period
|
Year-To-Date Change
|
||||||||
|
Deferred costs associated with deferred revenue
|
$
|
10.6
|
|
$
|
(2.7
|
)
|
$
|
7.9
|
|
||
|
Deferred revenue
|
23.3
|
|
(2.7
|
)
|
20.6
|
|
|||||
14
On January 11, 2018, the Company entered into a settlement agreement with DOE and the United States government regarding breach of contract claims relating to work performed by the Company under contracts with DOE and subcontracts with DOE contractors. DOE agreed to settle all claims raised as part of and subsequent to the litigation, except with respect to certain claims for pension and postretirement benefits, for a total of
$24.0 million
and provide a complete close out of all such contracts and subcontracts settled under the settlement agreement without any further audit or review of the Company’s costs or incurred cost submissions. Prior to the settlement, the Company had a receivables balance related to the claims being settled of
$14.5 million
. In the six months ended June 30, 2018, the Company (a) received
$4.7 million
from the United States government, (b) applied approximately
$19.3 million
of advances from the United States government received in prior years against the receivables balance, and (c) recorded additional revenue of
$9.5 million
.
Centrus and DOE have yet to fully settle the Company’s claims for reimbursements for certain pension and postretirement benefits costs related to past contract work performed for DOE. There is the potential for additional revenue to be recognized for this work pending the outcome of legal proceedings related to the Company’s claims for payment and the potential release of previously established valuation allowances on receivables. As a result of the application of fresh start accounting following the Company’s emergence from Chapter 11 bankruptcy on September 30, 2014, the receivables related to the Company’s claims for payment are carried at fair value as of September 30, 2014, which is net of the valuation allowances.
LEU Segment Order Book
The SWU component of LEU is typically bought and sold under long-term contracts with deliveries over several years. The Company’s agreements for natural uranium sales are generally shorter-term, fixed-commitment contracts. The Company’s order book of sales under contract in the LEU Segment (“order book”) extends for more than a decade. The order book represents the Company’s remaining performance obligations under these contracts and includes the
Deferred Revenue
amounts in the Contract Balances table above.
As of December 31, 2017, the order book was
$1.3 billion
and approximately 14% of the order book was reported to be at risk due to milestones related to the deployment of the American Centrifuge Plant or due to customer financial conditions. As of June 30, 2018, the order book was
$1.3 billion
, reflecting completed deliveries and new contracts in the six months ended June 30, 2018. On July 26, 2018, a customer that had filed for bankruptcy court protection in March 2018 signed a new contract with the Company and rejected the existing long-term contract. The rejection of the prior contract and the acceptance of the new contract are subject to court approval. After giving effect to the expected contract rejection and the new contract, the order book will be
$1.1 billion
, absent the impact of other order activity in the interim, and the specific risks the Company had previously identified to the order book will have been resolved.
Most of
the Company’s
contracts provide for fixed purchases of SWU during a given year. T
he Company’s
estimate of the aggregate dollar amount of future SWU and uranium sales is partially based on customers’ estimates of the timing and size of their fuel requirements and other assumptions that are subject to change. For example, depending on the terms of specific contracts, the customer may be able to increase or decrease the quantity delivered within an agreed range. T
he Company’s
order book estimate is also based on
the Company’s
estimates of selling prices, which are subject to change. For example, depending on the terms of specific contracts, prices may be adjusted based on escalation using a general inflation index, published SWU price indicators prevailing at the time of delivery, and other factors, all of which are variable. T
he Company
uses external composite forecasts of future market prices and inflation rates in its pricing estimates.
Refer to Item 1A,
Risk Factors
, of the Company’s 2017 Annual Report on Form 10-K for a discussion of risks related to the Company’s order book.
15
3. SPECIAL CHARGES
Special charges totaled
$0.9 million
and
$4.7 million
in the six months ended June 30, 2018, and 2017, respectively, including advisory costs of
$0.1 million
and
$3.3 million
. In both 2017 and 2018, advisory costs related to updating the Company’s information technology systems.
Workforce reductions have resulted from evolving business needs and the completion of the demonstration of American Centrifuge technology at the Company’s facility in Piketon, Ohio. A summary of termination benefit activity and related liabilities follows. Based on current expectations of required employee levels, the remaining balance of
$3.3 million
related to the Piketon facility is classified in
Other Long-Term Liabilities
in the condensed consolidated balance sheet and is expected to be paid in the third quarter of 2019.
|
(in millions)
|
Liability
December 31,
2017
|
Six Months Ended
June 30, 2018 |
Liability
June 30,
2018
|
|||||||||||||
|
Charges for Termination Benefits
|
Paid/Settled
|
|||||||||||||||
|
Workforce reductions:
|
||||||||||||||||
|
Evolving business needs
|
$
|
0.8
|
|
$
|
0.7
|
|
$
|
(1.1
|
)
|
$
|
0.4
|
|
||||
|
Piketon demonstration facility
|
5.7
|
|
0.1
|
|
(2.5
|
)
|
3.3
|
|
||||||||
|
$
|
6.5
|
|
$
|
0.8
|
|
$
|
(3.6
|
)
|
$
|
3.7
|
|
|||||
4. CASH, CASH EQUIVALENTS AND RESTRICTED CASH
The following table summarizes the Company’s cash, cash equivalents and restricted cash as presented on the unaudited condensed consolidated balance sheet to amounts on the condensed consolidated statement of cash flows (in millions):
|
June 30, 2018
|
December 31, 2017
|
||||||
|
Cash and cash equivalents
|
$
|
140.1
|
|
$
|
208.8
|
|
|
|
Restricted cash included in other current assets
|
16.4
|
|
16.3
|
|
|||
|
Restricted cash included in other long-term assets
|
19.8
|
|
19.7
|
|
|||
|
Total cash, cash equivalents and restricted cash
|
$
|
176.3
|
|
$
|
244.8
|
|
|
The following provides additional detail regarding the Company’s restricted cash (in millions):
|
June 30,
2018
|
December 31, 2017
|
||||||
|
Current assets
|
|||||||
|
Deposits for surety bonds - NRC
|
$
|
16.2
|
|
$
|
16.1
|
|
|
|
Deposits for financial assurance - other
|
0.2
|
|
0.2
|
|
|||
|
Included in other current assets
|
$
|
16.4
|
|
$
|
16.3
|
|
|
|
Long-term assets
|
|||||||
|
Deposits for surety bonds - DOE
|
$
|
13.6
|
|
$
|
13.5
|
|
|
|
Deposits for financial assurance - workers compensation
|
5.9
|
|
5.9
|
|
|||
|
Deposits for financial assurance - other
|
0.3
|
|
0.3
|
|
|||
|
Deposits for financial assurance
|
$
|
19.8
|
|
$
|
19.7
|
|
|
16
Piketon Facility Obligations and Surety Bonds
Centrus performs engineering and testing work related to the American Centrifuge technology under an agreement with UT-Battelle, LLC (“UT-Battelle”), the management and operating contractor for Oak Ridge National Laboratory (“ORNL”). American Centrifuge expenses that are outside of the Company’s contract with UT-Battelle are included in
Advanced Technology License and Decommissioning Costs,
including ongoing costs for work related to the termination of the license from the U.S. Nuclear Regulatory Commission (“NRC”) and the lease with DOE for the Piketon facility. Centrus commenced with the decontamination and decommissioning (“D&D”) of the Piketon facility in accordance with NRC requirements in 2016. Most of the D&D work has been completed as of June 30, 2018. The estimated fair value of the remaining costs to complete the D&D work, included in
Accounts Payable and Accrued Liabilities
on the condensed consolidated balance sheet, is
$1.0 million
as of June 30, 2018, and December 31, 2017.
Centrus has previously provided financial assurance to the NRC for the D&D work in the form of surety bonds that are fully cash collateralized by Centrus for
$16.2 million
. Centrus expects to receive cash when surety bonds are reduced and/or cancelled as the Company fulfills its D&D obligations and the NRC license for the test facility is terminated.
Centrus leases the Piketon facility from DOE. At the conclusion of the lease on June 30, 2019, without mutual agreement between Centrus and DOE regarding other possible uses for the facility, Centrus is obligated to return the facility to DOE in a condition that meets NRC requirements and in the same condition as the facility was in when it was leased to Centrus (other than due to normal wear and tear). Centrus must remove all Company-owned capital improvements at the Piketon facility, unless otherwise consented to by DOE, by the conclusion of the lease term. The estimated cost for these lease termination obligations, included in
Accounts Payable and Accrued Liabilities
on the condensed consolidated balance sheet, is
$0.7 million
and
$0.8 million
as of June 30, 2018 and December 31, 2017, respectively.
Centrus has previously provided financial assurance to DOE for the lease obligations in the form of surety bonds that are fully cash collateralized by Centrus for
$13.6 million
. Centrus expects to receive cash when surety bonds are reduced and/or cancelled as the Company fulfills its lease termination obligations.
Financial Assurance for Workers’ Compensatio
n
The Company has provided financial assurance to states in which it was previously self-insured for workers’ compensation in accordance with the state requirements in the form of a surety bond and a letter of credit that are fully cash collateralized by Centrus for
$5.9 million
. The surety bond and letter of credit will be cancelled and the Company expects to receive cash when each state determines the Company has no further workers’ compensation obligations.
17
5. INVENTORIES
Centrus holds uranium at licensed locations in the form of natural uranium and as the uranium component of LEU. Centrus also holds SWU as the SWU component of LEU at licensed locations (e.g., fabricators) to meet book transfer requests by customers. Fabricators process LEU into fuel for use in nuclear reactors. Components of inventories follow (in millions):
|
|
June 30, 2018
|
December 31, 2017
|
|||||||||||||||||||||
|
|
Current
Assets
|
Current
Liabilities
(a)
|
Inventories, Net
|
Current
Assets
|
Current
Liabilities
(a)
|
Inventories, Net
|
|||||||||||||||||
|
Separative work units
|
$
|
7.3
|
|
$
|
3.8
|
|
$
|
3.5
|
|
$
|
47.2
|
|
$
|
15.0
|
|
$
|
32.2
|
|
|||||
|
Uranium
|
92.7
|
|
41.3
|
|
51.4
|
|
105.9
|
|
62.9
|
|
43.0
|
|
|||||||||||
|
|
$
|
100.0
|
|
$
|
45.1
|
|
$
|
54.9
|
|
$
|
153.1
|
|
$
|
77.9
|
|
$
|
75.2
|
|
|||||
|
(a)
|
Inventories owed to customers and suppliers, included in current liabilities, include SWU and uranium inventories owed to fabricators.
|
6. INTANGIBLE ASSETS
Intangible assets originated from the Company’s reorganization and application of fresh start accounting as of the date the Company emerged from bankruptcy, September 30, 2014, and reflect the conditions at that time. The intangible asset related to the sales order book is amortized as the order book existing at emergence is reduced, principally as a result of deliveries to customers. The intangible asset related to customer relationships is amortized using the straight-line method over the estimated average useful life of
15
years. Amortization expense is presented below gross profit on the condensed consolidated statements of operations.
|
June 30, 2018
|
December 31, 2017
|
||||||||||||||||||||||
|
(in millions)
|
|||||||||||||||||||||||
|
Gross Carrying Amount
|
Accumulated Amortization
|
Net Amount
|
Gross Carrying Amount
|
Accumulated Amortization
|
Net Amount
|
||||||||||||||||||
|
Sales order book
|
$
|
54.6
|
|
$
|
26.4
|
|
$
|
28.2
|
|
$
|
54.6
|
|
$
|
25.9
|
|
$
|
28.7
|
|
|||||
|
Customer relationships
|
68.9
|
|
17.2
|
|
51.7
|
|
68.9
|
|
14.9
|
|
54.0
|
|
|||||||||||
|
Total
|
$
|
123.5
|
|
$
|
43.6
|
|
$
|
79.9
|
|
$
|
123.5
|
|
$
|
40.8
|
|
$
|
82.7
|
|
|||||
18
A summary of long-term debt follows (in millions):
|
Maturity
|
June 30,
2018
|
December 31, 2017
|
|||||||
|
8.25% Notes:
|
Feb. 2027
|
||||||||
|
Principal
|
$
|
74.3
|
|
$
|
74.3
|
|
|||
|
Interest
|
55.1
|
|
58.1
|
|
|||||
|
8.25% Notes
|
129.4
|
|
132.4
|
|
|||||
|
8% PIK Toggle Notes
|
Sep. 2019
(a)
|
32.1
|
|
31.3
|
|
||||
|
Subtotal
|
161.5
|
|
163.7
|
|
|||||
|
Less deferred issuance costs
|
0.1
|
|
0.1
|
|
|||||
|
Total debt
|
161.4
|
|
163.6
|
|
|||||
|
Less current portion
|
6.1
|
|
6.1
|
|
|||||
|
Long-term debt
|
$
|
155.3
|
|
$
|
157.5
|
|
|||
(a) Maturity can be extended to September 2024 upon the satisfaction of certain funding conditions described in the Indenture.
Note Exchange
On February 14, 2017, pursuant to an exchange offer and consent solicitation, Centrus exchanged
$204.9 million
principal amount of the Company’s
8%
paid-in-kind (“PIK”) toggle notes (the “8% PIK Toggle Notes”) for
$74.3 million
principal amount of
8.25%
notes due February 2027 (the “8.25% Notes”),
104,574
shares of Series B Preferred Stock with a liquidation preference of
$1,000
per share, and
$27.6 million
of cash. The exchange is accounted for as a troubled debt restructuring under ASC Subtopic 470-60,
Debt-Troubled Debt Restructurings by Debtors
. The Company recognized the 8.25% Notes on the condensed consolidated balance sheet as the sum of the principal balance and all future interest payments and recognized a gain of
$33.6 million
related to the note exchange for the quarter ended March 31, 2017, which is net of transaction costs of
$9.0 million
and previously deferred issuance costs related to the 8% PIK Toggle Notes of
$0.4 million
. Refer to
Note 12, Stockholders’ Equity
for details related to the preferred stock.
8.25% Notes
Interest on the 8.25% Notes is payable semi-annually in arrears as of February 28 and August 31 based on a 360-day year consisting of twelve 30-day months. The 8.25% Notes mature on February 28, 2027. As described above, all future interest payment obligations on the 8.25% Notes are included in the carrying value of the 8.25% Notes. As a result, the Company’s reported interest expense will be less than its contractual interest payments throughout the term of the 8.25% Notes. As of June 30, 2018, and December 31, 2017,
$6.1 million
of interest is recorded as current and classified as
Accounts Payable and Accrued Liabilities
in the condensed consolidated balance sheet.
8% PIK Toggle Notes
Interest on the 8% PIK Toggle Notes is payable semi-annually in arrears on March 31 and September 30 based on a 360-day year consisting of twelve 30-day months. The principal amount is increased by any payment of interest in the form of PIK payments. The Company has the option to pay up to 5.5% per annum of interest due on the 8% PIK Toggle Notes in the form of PIK payments. For the semi-annual interest periods ended March 31, 2018 and September 30, 2018, the Company elected to pay interest in the form of PIK payments at 5.5% per annum. Financing costs for the issuance of the 8% PIK Toggle Notes were deferred and are being amortized on a straight-line basis, which approximates the effective interest method, over the life of the 8% PIK Toggle Notes. The 8% PIK Toggle Notes mature on September 20, 2019. However, the maturity date may be extended to September 30, 2024, upon the satisfaction of certain funding conditions.
19
Additional terms and conditions of the 8.25% Notes and the 8% PIK Toggle Notes are described in
Note 9, Debt
, of the audited consolidated financial statements in the Company’s Annual Report on Form 10-K for the year ended December 31, 2017.
8. FAIR VALUE
Fair value is the price that would be received from selling an asset or paid to transfer a liability in an orderly transaction between market participants at the measurement date. When determining the fair value of assets and liabilities, the following hierarchy is used in selecting inputs, with the highest priority given to Level 1, as these are the most transparent or reliable:
|
•
|
Level 1 – quoted prices for identical instruments in active markets.
|
|
•
|
Level 2 – quoted prices for similar instruments in active markets; quoted prices for identical or similar instruments in markets that are not active; and model-derived valuations in which all significant inputs are observable in active markets.
|
|
•
|
Level 3 – valuations derived using one or more significant inputs that are not observable.
|
Financial Instruments Recorded at Fair Value (in millions)
|
June 30, 2018
|
December 31, 2017
|
||||||||||||||||||||||||||||||
|
|
Level 1
|
Level 2
|
Level 3
|
Total
|
Level 1
|
Level 2
|
Level 3
|
Total
|
|||||||||||||||||||||||
|
Assets:
|
|
|
|
|
|
|
|
|
|||||||||||||||||||||||
|
Cash and cash equivalents
|
$
|
140.1
|
|
$
|
—
|
|
$
|
—
|
|
$
|
140.1
|
|
$
|
208.8
|
|
$
|
—
|
|
$
|
—
|
|
$
|
208.8
|
|
|||||||
|
Deferred compensation asset (a)
|
1.5
|
|
—
|
|
—
|
|
1.5
|
|
1.4
|
|
—
|
|
—
|
|
1.4
|
|
|||||||||||||||
|
Liabilities:
|
|
|
|
|
|
|
|
|
|
|
|
|
|||||||||||||||||||
|
Deferred compensation obligation (a)
|
1.5
|
|
—
|
|
—
|
|
1.5
|
|
1.4
|
|
—
|
|
—
|
|
1.4
|
|
|||||||||||||||
|
(a)
|
The deferred compensation obligation represents the balance of deferred compensation plus net investment earnings. The deferred compensation plan is funded through a rabbi trust. Trust funds are invested in mutual funds for which unit prices are quoted in active markets and are classified within Level 1 of the valuation hierarchy.
|
There were no transfers between Level 1, 2 or 3 during the periods presented.
Other Financial Instruments
As of
June 30, 2018
, and December 31, 2017, the balance sheet carrying amounts for
Accounts Receivable
,
Accounts Payable and Accrued Liabilities
(excluding the deferred compensation obligation described above), and
Payables under SWU Purchase Agreements
approximate fair value because of their short-term nature.
The carrying value and estimated fair value of long-term debt follow (in millions):
|
June 30, 2018
|
December 31, 2017
|
||||||||||||||
|
Carrying Value
|
Estimated Fair Value
(a)
|
Carrying Value
|
Estimated Fair Value
(a)
|
||||||||||||
|
8.25% Notes
|
$
|
129.4
|
|
(b)
|
$
|
60.5
|
|
$
|
132.4
|
|
(b)
|
$
|
61.7
|
|
|
|
8% PIK Toggle Notes
|
32.1
|
|
27.0
|
|
31.3
|
|
25.1
|
|
|||||||
(a)
Based on the most recent trading price as of the balance sheet date, which is considered a Level 2 input based on the frequency of trading.
|
(b)
|
The carrying value of the 8.25% Notes consists of the principal balance of
$74.3 million
and the sum of current and noncurrent interest payment obligations until maturity. Refer to
Note 7, Debt
.
|
20
9. PENSION AND POSTRETIREMENT HEALTH AND LIFE BENEFITS
The components of net periodic benefit expense (income) for the defined benefit pension plans were as follows (in millions):
|
Three Months Ended
June 30, |
Six Months Ended
June 30, |
||||||||||||||
|
2018
|
2017
|
2018
|
2017
|
||||||||||||
|
Service costs
|
$
|
0.9
|
|
$
|
1.0
|
|
$
|
1.7
|
|
$
|
1.9
|
|
|||
|
Interest costs
|
7.2
|
|
8.0
|
|
14.4
|
|
16.1
|
|
|||||||
|
Expected gains on plan assets
|
(10.3
|
)
|
(10.2
|
)
|
(20.5
|
)
|
(20.4
|
)
|
|||||||
|
Net periodic benefit income
|
$
|
(2.2
|
)
|
$
|
(1.2
|
)
|
$
|
(4.4
|
)
|
$
|
(2.4
|
)
|
|||
The components of net periodic benefit expense for the postretirement health and life benefit plans were as follows (in millions):
|
Three Months Ended
June 30, |
Six Months Ended
June 30, |
||||||||||||||
|
2018
|
2017
|
2018
|
2017
|
||||||||||||
|
Interest costs
|
$
|
1.5
|
|
$
|
1.8
|
|
$
|
2.9
|
|
$
|
3.6
|
|
|||
|
Amortization of prior service credits
|
(0.1
|
)
|
—
|
|
(0.1
|
)
|
(0.1
|
)
|
|||||||
|
Net periodic benefit expense
|
$
|
1.4
|
|
$
|
1.8
|
|
$
|
2.8
|
|
$
|
3.5
|
|
|||
The Company reports service costs for its defined benefit pension plans and its postretirement health and life benefit plans in
Cost of Sales
and
Selling, General and Administrative Expenses
. The remaining components of net periodic benefit expense (income) are reported as
Nonoperating Components of Net Periodic Benefit Expense (Income).
21
10. NET LOSS PER COMMON SHARE
Basic net income (loss) per common share is calculated by dividing income (loss) allocable to common stockholders by the weighted average number of shares of common stock outstanding during the period. In calculating diluted net income (loss) per common share, the number of shares is increased by the weighted average number of potential shares related to stock compensation awards. No dilutive effect is recognized in a period in which a net loss has occurred.
|
|
Three Months Ended
June 30, |
Six Months Ended
June 30, |
|||||||||||||
|
2018
|
2017
|
2018
|
2017
|
||||||||||||
|
Net loss allocable to common stockholders (in millions)
|
$
|
(28.1
|
)
|
$
|
(24.4
|
)
|
$
|
(55.1
|
)
|
$
|
(17.8
|
)
|
|||
|
Shares in thousands:
|
|||||||||||||||
|
Average common shares outstanding - basic
|
9,118
|
|
9,077
|
|
9,111
|
|
9,070
|
|
|||||||
|
Potentially dilutive shares related to stock options
(a)
|
—
|
|
—
|
|
—
|
|
—
|
|
|||||||
|
Average common shares outstanding - diluted
|
9,118
|
|
9,077
|
|
9,111
|
|
9,070
|
|
|||||||
|
Net loss per common share (in dollars):
|
|||||||||||||||
|
Basic
|
$
|
(3.08
|
)
|
$
|
(2.69
|
)
|
$
|
(6.05
|
)
|
$
|
(1.96
|
)
|
|||
|
Diluted
|
$
|
(3.08
|
)
|
$
|
(2.69
|
)
|
$
|
(6.05
|
)
|
$
|
(1.96
|
)
|
|||
|
(a)
|
For the three and six months ended June 30, 2018, common stock equivalents of less than
0.1 million
shares are excluded from the diluted calculation as a result of the net loss. For the three and six months ended June 30, 2017, common stock equivalents of less than
0.1 million
shares are excluded from the diluted calculation as a result of the net loss.
|
Options outstanding, which are considered anti-dilutive if their exercise price exceeds the average share market price, were less than
0.4 million
shares for the three and six months ended June 30, 2018 and less than
0.1 million
shares for the three and six months ended June 30, 2017.
22
11. COMMITMENTS AND CONTINGENCIES
Commitments under SWU Purchase Agreements
TENEX
A major supplier of SWU to the Company is the Russian government entity Joint Stock Company “TENEX” (“TENEX”). Under a 2011 agreement with TENEX, as amended, (the “Russian Supply Agreement”), the Company purchases SWU contained in LEU received from TENEX, and the Company delivers natural uranium to TENEX for the LEU’s uranium component. The LEU that the Company obtains from TENEX under the agreement is subject to quotas and other restrictions applicable to commercial Russian LEU. The Company may reschedule SWU quantities scheduled for purchase through 2022 into the period 2023–2026, in return for the purchase of additional SWU in those years. Depending on the total purchase obligations rescheduled to 2023–2026, the Company may defer certain limited quantities beyond 2026.
The Russian Supply Agreement provides that the Company must pay for all SWU in its minimum purchase obligation each year, even if it fails to submit orders for such SWU. The Company would then have the right to take the unordered SWU in the following year. Pricing terms for SWU under the Russian Supply Agreement are based on a mix of market-related price points and other factors.
Orano
On April 27, 2018, the Company entered into a long-term agreement (the “Orano Supply Agreement”) with Orano Cycle (formerly, AREVA NC) (“Orano”) for the long-term supply to the Company of SWU contained in LEU, nominally commencing in 2023. Under the Agreement, the Company purchases SWU contained in LEU received from Orano, and the Company delivers natural uranium to Orano for the natural uranium feed material component of LEU. The Company may elect to begin to accept deliveries as early as 2021 or to defer the commencement of purchases until 2024 and has the option to extend the six-year purchase period for an additional two (2) years. The Orano Supply Agreement provides significant flexibility to adjust purchase volumes, subject to annual minimums and maximums in fixed amounts that vary year by year. The pricing for the SWU purchased by the Company is determined by a formula that uses a combination of market-related price points and other factors, and is subject to certain floors and ceilings. Prices are payable in a combination of dollars and Euros.
U.S. imports of LEU from France are currently subject to an antidumping order that will remain in effect through at least the second quarter of 2019. Under the terms of the Orano Supply Agreement, Orano will have the right to partially limit the amount of LEU that can be delivered in the United States for so long as the LEU is subject to the antidumping order.
Milestones Under the 2002 DOE-USEC Agreement
The Company and DOE signed an agreement dated June 17, 2002, as amended (the “2002 DOE-USEC Agreement”), pursuant to which the parties made long-term commitments directed at resolving issues related to the stability and security of the domestic uranium enrichment industry. DOE consented to the assumption by Centrus of the 2002 DOE-USEC Agreement and other agreements between the Company and DOE subject to an express reservation of all rights, remedies and defenses by DOE and Centrus under those agreements as part of the Company’s Chapter 11 bankruptcy process. The 2002 DOE-USEC Agreement requires Centrus to develop, demonstrate and deploy advanced enrichment technology in accordance with milestones and provides for remedies in the event of a failure to meet a milestone under certain circumstances.
DOE has specific remedies under the 2002 DOE-USEC Agreement if Centrus fails to meet a milestone that would adversely impact its ability to begin commercial operations of the American Centrifuge Plant on schedule, and such delay was within Centrus’ control or was due to its fault or negligence or if Centrus abandons or constructively abandons the commercial deployment of an advanced enrichment technology. These remedies
23
include terminating the 2002 DOE-USEC Agreement, revoking Centrus’ access to DOE’s centrifuge technology that is required for the success of the American Centrifuge project, requiring Centrus to transfer certain rights in the American Centrifuge technology and facilities to DOE, and requiring Centrus to reimburse DOE for certain costs associated with the American Centrifuge project.
The 2002 DOE-USEC Agreement provides that if a delaying event beyond the control and without the fault or negligence of Centrus occurs that could affect Centrus’ ability to meet an American Centrifuge Plant milestone, DOE and Centrus will jointly meet to discuss in good faith possible adjustments to the milestones as appropriate to accommodate the delaying event. The Company notified DOE that it had not met the June 2014 milestone within the time period provided due to events beyond its control and without the fault or negligence of the Company. The assumption of the 2002 DOE-USEC Agreement provided for under the Plan of Reorganization did not affect the ability of either party to assert all rights, remedies and defenses under the agreement and all such rights, remedies and defenses are specifically preserved and all time limits tolled expressly including all rights, remedies and defenses and time limits relating to any missed milestones. DOE and Centrus have agreed that all rights, remedies and defenses of the parties with respect to any missed milestones since March 5, 2014, including the June 2014 and November 2014 milestones, and all other matters under the 2002 DOE-USEC Agreement continue to be preserved, and that the time limits for each party to respond to any missed milestones continue to be tolled.
Legal Matters
Centrus is subject to various legal proceedings and claims, either asserted or unasserted, which arise in the ordinary course of business. While the outcome of these claims cannot be predicted with certainty, Centrus does not believe that the outcome of any of these legal matters will have a material adverse effect on its results of operations or financial condition.
24
12. STOCKHOLDERS’ EQUITY
Series B Preferred Stock
On February 14, 2017, Centrus issued
104,574
shares of Series B Preferred Stock as part of the securities exchange described in
Note 7, Debt
. The issuance of the Series B Preferred Stock was a non-cash financing transaction. The Series B Preferred Stock has a par value of
$1.00
per share and a liquidation preference of
$1,000
per share (the “Liquidation Preference”). The Series B Preferred Stock is recorded on the condensed consolidated balance sheet at fair value less transaction costs, or
$4.6 million
, as of June 30, 2018, and December 31, 2017.
Holders of the Series B Preferred Stock are entitled to cumulative dividends of
7.5%
per annum of the Liquidation Preference. Centrus is obligated to pay cash dividends on the Series B Preferred Stock in an amount equal to the Liquidation Preference to the extent that dividends are declared by the Board and:
|
(a)
|
its pension plans and Enrichment Corp.’s pension plans are at least
90%
funded on a variable rate premium calculation in the current plan year;
|
|
(b)
|
its net income calculated in accordance with GAAP (excluding the effect of pension remeasurement) for the immediately preceding fiscal quarter exceeds
$7.5 million
;
|
|
(c)
|
its free cash flow (defined as the sum of cash provided by (used in) operating activities and cash provided by (used in) investing activities) for the immediately preceding four fiscal quarters exceeds
$35 million
;
|
|
(d)
|
the balance of cash and cash equivalents calculated in accordance with GAAP on the last day of the immediately preceding quarter would exceed
$150 million
after pro forma application of the dividend payment; and
|
|
(e)
|
dividends may be legally paid under Delaware law.
|
Centrus has not met these criteria for the periods from issuance through June 30, 2018, and has not declared, accrued or paid dividends on the Series B Preferred Stock as of June 30, 2018. Dividends on the Series B Preferred Stock are cumulative to the extent not paid at any quarter-end, whether or not declared and whether or not there are assets of the Company legally available for the payment of such dividends in whole or in part. As of June 30, 2018, the Series B Preferred Stock has an aggregate liquidation preference of
$115.4 million
including accumulated dividends of
$10.8 million
. As of December 31, 2017, the Series B Preferred Stock had an aggregate liquidation preference of
$111.5 million
, including accumulated dividends of
$6.9 million
.
Outstanding shares of the Series B Senior Preferred Stock are redeemable at the Company’s option, in whole or in part, for an amount of cash equal to the Liquidation Preference, plus an amount equal to the accrued and unpaid dividends, if any, whether or not declared, through date of redemption.
Rights Agreement
On April 6, 2016 (the “Effective Date”), the Company’s Board of Directors (the “Board”) adopted a Section 382 Rights Agreement (the “Rights Agreement”). The Board adopted the Rights Agreement in an effort to protect shareholder value by, among other things, attempting to protect against a possible limitation on the Company’s ability to use its net operating loss carryforwards and other tax benefits, which may be used to reduce potential future income tax obligations. As reported on the Company’s Annual Report on Form 10-K for the year ended December 31, 2017, the Company had federal net operating losses of
$789.7 million
as of December 31, 2017, that currently expire through 2037.
25
In connection with the adoption of the Rights Agreement, the Board declared a dividend of one preferred-share-purchase-right for each share of the Company’s Class A Common Stock and Class B Common Stock outstanding as of the Effective Date. The rights initially trade together with the common stock and are not exercisable. In the absence of further action by the Board, the rights would generally become exercisable and allow a holder to acquire shares of a new series of the Company’s preferred stock if any person or group acquires
4.99%
or more of the outstanding shares of the Company’s common stock, or if a person or group that already owns 4.99% or more of the Company’s Class A Common Stock acquires additional shares representing
0.5%
or more of the outstanding shares of the Company’s Class A Common Stock. The rights beneficially owned by the acquirer would become null and void, resulting in significant dilution in the ownership interest of such acquirer.
The Board may exempt any acquisition of the Company’s common stock from the provisions of the Rights Agreement if it determines that doing so would not jeopardize or endanger the Company’s use of its tax assets or is otherwise in the best interests of the Company. The Board also has the ability to amend or terminate the Rights Agreement prior to a triggering event.
Effective on February 14, 2017, in connection with the settlement and completion of the exchange offer and consent solicitation, the Company amended the Rights Agreement solely to exclude acquisitions of the Series B Preferred Stock issued as part of the exchange offer and consent solicitation from the definition of “Common Shares.”
The Company’s stockholders approved the Rights Agreement at the 2017 annual meeting of stockholders on May 31, 2017. Unless earlier terminated in accordance with the Rights Agreement, the rights issued under the Rights Agreement expire on April 6, 2019.
Shares Outstanding
Changes in the number of shares outstanding follow:
|
|
Preferred Stock,
Series B
|
Common Stock,
Class A
|
Common Stock,
Class B
|
|||||
|
Balance at December 31, 2016
|
—
|
|
7,563,600
|
|
1,436,400
|
|
||
|
Issuance of Preferred Stock
|
104,574
|
|
—
|
|
—
|
|
||
|
Issuance of Class A Common Stock
|
—
|
|
38,751
|
|
—
|
|
||
|
Conversion of Common Stock from Class B to Class A
|
—
|
|
28,018
|
|
(28,018
|
)
|
||
|
Balance at June 30, 2017
|
104,574
|
|
7,630,369
|
|
1,408,382
|
|
||
|
Balance at December 31, 2017 and June 30, 2018
|
104,574
|
|
7,632,669
|
|
1,406,082
|
|
||
Accumulated Other Comprehensive Income (Loss)
The sole component of accumulated other comprehensive income (loss) (“AOCI”) relates to activity in the accounting for pension and postretirement health and life benefit plans. Amortization of prior service credits is reclassified from AOCI and included in the computation of net periodic benefit expense as detailed in
Note 9, Pension and Postretirement Health and Life Benefits
.
26
13. SEGMENT INFORMATION
Gross profit is Centrus’ measure for segment reporting. There were no intersegment sales in the periods presented. Refer to
Note 2, Revenue Recognition and Contracts with Customers,
for additional details on revenue for each segment.
|
|
Three Months Ended
June 30, |
Six Months Ended
June 30, |
|||||||||||||
|
2018
|
2017
|
2018
|
2017
|
||||||||||||
|
(in millions)
|
|||||||||||||||
|
Revenue
|
|||||||||||||||
|
LEU Segment:
|
|||||||||||||||
|
Separative work units
|
$
|
32.9
|
|
$
|
37.9
|
|
$
|
50.6
|
|
$
|
38.7
|
|
|||
|
Uranium
|
—
|
|
—
|
|
3.6
|
|
—
|
|
|||||||
|
|
32.9
|
|
37.9
|
|
54.2
|
|
38.7
|
|
|||||||
|
Contract Services Segment
|
6.5
|
|
6.1
|
|
20.9
|
|
12.5
|
|
|||||||
|
Revenue
|
$
|
39.4
|
|
$
|
44.0
|
|
$
|
75.1
|
|
$
|
51.2
|
|
|||
|
Segment Gross Profit (Loss)
|
|||||||||||||||
|
LEU Segment
|
$
|
(10.0
|
)
|
$
|
(4.6
|
)
|
$
|
(23.5
|
)
|
$
|
(6.5
|
)
|
|||
|
Contract Services Segment
|
(0.7
|
)
|
(0.1
|
)
|
7.5
|
|
(1.1
|
)
|
|||||||
|
Gross loss
|
$
|
(10.7
|
)
|
$
|
(4.7
|
)
|
$
|
(16.0
|
)
|
$
|
(7.6
|
)
|
|||
27
Item 2.
Management’s Discussion and Analysis of Financial Condition and Results of Operations
The following discussion should be read in conjunction with, and is qualified in its entirety by reference to, the unaudited condensed consolidated financial statements and related notes appearing elsewhere in this report.
Overview
Centrus Energy Corp. (“Centrus” or the “Company”) is a trusted supplier of nuclear fuel and services for the nuclear power industry. References to “Centrus”, the “Company”, or “we” include Centrus Energy Corp. and its wholly owned subsidiaries as well as the predecessor to Centrus, unless the context otherwise indicates.
Our primary business involves the sale of low-enriched uranium (“LEU”) or its components and natural uranium to utilities operating commercial nuclear power plants. LEU is a critical component in the production of nuclear fuel for reactors that produce electricity. We supply LEU to both domestic and international utilities for use in nuclear reactors worldwide. We provide LEU from multiple sources including our inventory, medium- and long- term supply contracts, and spot purchases. As a long-term supplier of LEU to our customers, our objective is to provide value through the reliability and diversity of our supply sources. Our long-term goal is to resume commercial enrichment production, and we are exploring approaches to that end.
With our multi-decade experience in uranium enrichment, we continue to be a leader in the development of advanced uranium enrichment technology. We are performing research and demonstration work on our advanced centrifuge technology to support U.S. energy and national security through our contract with UT-Battelle, LLC (“UT-Battelle”), the management and operating contractor of Oak Ridge National Laboratory (“ORNL”) for the U.S. Department of Energy (“DOE”). We believe that this technology could play a critical role in meeting U.S. national and energy security needs and advancing our nation’s nonproliferation objectives.
The nuclear industry in general, and the nuclear fuel industry in particular, is in a period of significant change, which continues to affect the competitive landscape we face. The nuclear fuel industry remains oversupplied, creating downward pressures on pricing, with uncertainty regarding the timing of industry expansion globally. Changes in the competitive landscape may adversely affect pricing trends, change customer spending patterns, or create uncertainty. To address these changes, we have adjusted and will continue to address our cost structure and operations and may evaluate opportunities to grow our business organically or through acquisitions and other strategic transactions.
We are working to leverage our unique technical expertise and facilities to support leading companies in the nuclear industry, including supporting development of advanced nuclear reactors and related industries, as well as supporting the U.S. government. Our experience developing, licensing and manufacturing advanced nuclear technologies positions us to provide critical design, engineering, manufacturing and other services to a broad range of potential clients, including those involving sensitive or classified technologies.
We are also actively considering, and expect to consider from time to time in the future, potential strategic transactions, which could involve, without limitation, acquisitions and/or dispositions of businesses or assets. These transactions could also involve joint ventures or investments in businesses, products or technologies. In connection with any such transaction, we may seek additional debt or equity financing, contribute or dispose of assets, assume additional indebtedness, or partner with other parties to consummate a transaction.
28
Revenue
We have two reportable segments: the LEU Segment and the Contract Services Segment. The LEU Segment is currently our primary business focus. Revenue from our LEU Segment is derived primarily from:
|
•
|
sales of the SWU component of LEU,
|
|
•
|
sales of both the SWU and uranium components of LEU, and
|
|
•
|
sales of natural uranium.
|
Our Contract Services Segment reflects our technical, manufacturing and engineering services offered to public and private sector customers, including engineering and testing activities as well as technical and resource support currently being performed by the Company.
SWU and Uranium Sales
Revenue from our LEU Segment accounted for approximately 89% of our total revenue in 2017. The majority of our customers are domestic and international utilities that operate nuclear power plants, with international sales constituting approximately 25% to 45% of revenue from our LEU Segment in recent years. Our agreements with electric utilities are primarily long-term, fixed-commitment contracts under which our customers are obligated to purchase a specified quantity of the SWU component of LEU (or the SWU and uranium components of LEU) from us. Our agreements for natural uranium sales are generally shorter-term, fixed-commitment contracts.
Our revenues, operating results and cash flows can fluctuate significantly from quarter to quarter and year to year. Revenue is recognized at the time LEU or uranium is delivered under the terms of our contracts. The timing of customer demand is affected by, among other things, electricity markets, reactor operations, maintenance and refueling outages, and customer inventories. In the current market environment, some customers are building inventories and may choose to take deliveries under annual purchase obligations later in the year. Customer payments for the SWU component of LEU average generally $10 million to $15 million per order. As a result, a relatively small change in the timing of customer orders for LEU may cause significant variability in operating results.
Utility customers in general have the option to defer physical receipt of LEU or uranium purchased from Centrus beyond the contractual sale period, resulting in the deferral of costs and revenue recognition. Refer to
Note 2, Revenue Recognition and Contracts with Customers,
to the unaudited condensed consolidated financial statements for further details.
Our financial performance over time can be significantly affected by changes in prices for SWU and uranium. Since 2011, market prices for SWU and uranium have significantly declined. Since our sales order book includes contracts awarded to us in previous years, the average SWU price billed to customers typically lags behind published price indicators by several years, which means that average prices under contract today exceed current market prices. The long-term SWU price indicator, as published by TradeTech, LLC in
Nuclear Market Review
, is an indication of base-year prices under new long-term enrichment contracts in our primary markets. The following chart summarizes TradeTech’s long-term and spot SWU price indicators, the long-term price for natural uranium hexafluoride (“UF6”), as calculated by Centrus using indicators published in
Nuclear Market Review
, and TradeTech’s spot price indicator for UF6:
29
SWU and Uranium Market Price Indicators*
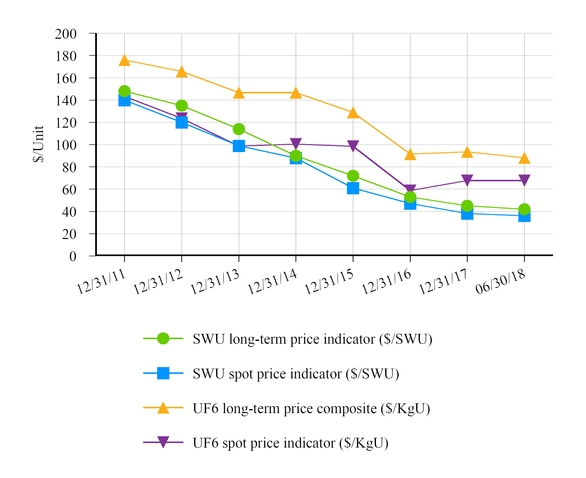
* Source:
Nuclear Market Review
, a TradeTech publication, www.uranium.com
Our contracts with customers are denominated in U.S. dollars, and although revenue has not been directly affected by changes in the foreign exchange rate of the U.S. dollar, we may have a competitive price advantage or disadvantage obtaining new contracts in a competitive bidding process depending upon the weakness or strength of the U.S. dollar. Costs of our primary competitors are denominated in other currencies. Our contracts with suppliers have historically been denominated in U.S. dollars. On April 27, 2018, we entered into an agreement with Orano Cycle (formerly, AREVA NC) for the long-term supply of SWU. We may elect to begin deliveries as early as 2021. Purchases will be payable in a combination of U.S dollars and Euros and we may be subject to exchange rate risk for the portion of purchases payable in Euros.
On occasion, we will accept payment in the form of uranium. Revenue from the sale of SWU under such contracts is recognized at the time LEU is delivered and is based on the fair value of the uranium at contract inception, or as the quantity of uranium is finalized, if variable.
Cost of sales for SWU and uranium is based on the amount of SWU and uranium sold and delivered during the period and unit inventory costs. Unit inventory costs are determined using the monthly moving average cost method. Changes in purchase costs have an effect on inventory costs and cost of sales over current and future periods. Cost of sales includes costs for inventory management at off-site licensed locations. Cost of sales also includes certain legacy costs related to former employees of the Portsmouth and Paducah gaseous diffusion plants.
30
Contract Services
Our Contract Services Segment reflects our technical, manufacturing and engineering services offered to public and private sector customers, including the American Centrifuge engineering and testing activities we perform as a contractor for UT-Battelle. With our private sector customers, we seek to leverage our domestic enrichment experience and engineering know-how to assist customers with a range of engineering and advanced manufacturing projects including the production of fuel for next-generation nuclear reactors and the development of related facilities.
American Centrifuge
We have a long record as a global leader in advanced technology, manufacturing and engineering. Our manufacturing, engineering and testing facilities and our highly-trained workforce are deeply engaged in advancing the next generation of uranium enrichment technology. We are exploring a number of options for returning to domestic production in the future.
Our government contracts with UT-Battelle provide for engineering and testing work on the American Centrifuge technology at our facilities in Oak Ridge, Tennessee. Our current contract with UT-Battelle which was executed on October 26, 2017, is a fixed price contract for the period from October 1, 2017, through September 30, 2018, that is expected to generate total revenue of approximately $16.0 million upon completion of defined milestones. The ORNL contracts have been funded incrementally. Funding for the program is provided to UT-Battelle by the federal government. Our previous contract with UT-Battelle was for the period from October 1, 2016, through September 30, 2017, and generated revenue of approximately $25.0 million.
American Centrifuge expenses that are outside of our contracts with UT-Battelle are included in
Advanced Technology License and Decommissioning Costs
on the consolidated statement of operations, including ongoing costs for work related to the termination of the NRC license and DOE lease for the Piketon facility. Centrus commenced the decontamination and decommissioning (“D&D”) of the Piketon facility in accordance with NRC requirements in 2016. As of June 30, 2018, most of the D&D work has been completed. The estimated fair value of the remaining costs to complete the D&D work, included in
Accounts Payable and Accrued Liabilities
on the condensed consolidated balance sheet, is $1.0 million as of June 30, 2018, and December 31, 2017. We anticipate incurring costs of approximately $12 million from the third quarter of 2018 through the second quarter of 2019 to terminate the NRC license and complete the DOE lease turnover activities required to return the facility to DOE when the lease expires in June 2019.
X-energy
On March 26, 2018, we entered into a Services Agreement to Provide Technical and Resource Support, effective March 26, 2018, with X Energy, LLC (“X-energy”). Under the terms of the services agreement, we will provide (i) technical and resource support to X-energy for criticality safety evaluation of processing equipment, design of fresh fuel transport packages, and conceptual mock-up of a nuclear fuel production facility and (ii) non-cash in-kind contributions to X-energy subject to a cooperative agreement between X-energy and the United States government. The technical and resource support provided by us to X-energy will be performed pursuant to separate task orders issued under and pursuant to the services agreement.
The initial task orders run through December 31, 2018. The awarding of any additional task orders to us will be dependent upon the receipt of additional funding.
Depending upon the pricing outlined in the task orders, payment for work performed by us pursuant to the services agreement will either be fixed price based or time-and-materials based. The initial task orders in 2018 provide for time-and-materials based pricing with payments to be made to us totaling approximately $4.4 million with the value of our non-cash in-kind contributions expected to be approximately $2.5 million.
31
Site Services Work
We formerly performed sites services work under contracts with DOE and its contractors at the former Portsmouth and Paducah gaseous diffusion plants. On January 11, 2018, we entered into a settlement agreement with DOE and the United States government regarding breach of contract claims relating to this work. Refer to
Note 2, Revenue Recognition and Contracts with Customers.
Centrus and DOE have yet to fully settle the Company’s claims for reimbursements for certain pension and postretirement benefits costs related to past contract work performed at the Portsmouth and Paducah sites. There is the potential for additional revenue to be recognized for this work pending the outcome of legal proceedings related to the Company’s claims for payment and the potential release of previously established valuation allowances on receivables.
2018 Outlook
We anticipate SWU and uranium revenue in 2018 in a range of $150 million to $175 million, reflecting a decline in average sales prices compared to 2017 as more sales are made under contracts that reflect more recent market conditions. We anticipate total revenue in a range of $175 million to $200 million. Consistent with prior years, revenue continues to be most heavily weighted to the fourth quarter; we expect nearly one-half of our 2018 revenue to be generated in the fourth quarter. We expect to end 2018 with a cash and cash equivalents balance in a range of $100 million to $125 million. The anticipated decrease in cash and cash equivalents in 2018 is driven by the expected timing of purchases under supply agreements and an increase in required cash contributions to our postretirement benefit plans.
Our financial guidance is subject to a number of assumptions and uncertainties that could affect results either positively or negatively. Variations from our expectations could cause differences between our guidance and our ultimate results. Among the factors that could affect our results are:
|
•
|
Additional short-term purchases or sales of SWU and uranium;
|
|
•
|
Timing of customer orders, related deliveries, and purchases of LEU or components;
|
|
•
|
The outcome of legal proceedings and other contingencies;
|
|
•
|
Potential use of cash for strategic initiatives;
|
|
•
|
Actions taken by our customers, including actions that might affect our existing contracts, as a result of market and other conditions impacting our customers and the industry; and
|
|
•
|
Additional costs for decontamination and decommissioning of our facility in Ohio.
|
See also
“Forward Looking Statements
” earlier in this report for additional information.
Results of Operations
Basis of Presentation
On January 1, 2018, we adopted several new accounting standards and certain prior period amounts have been recast to conform with the current presentation. For the adoption of the new revenue standard using the modified retrospective method, results for reporting periods beginning after January 1, 2018, are presented under the new guidance, while prior period amounts are not adjusted and continue to be reported in accordance with the previous guidance. Refer to
Note 1, Basis of Presentation,
to the unaudited condensed consolidated financial statements for further details.
32
Segment Information
The following tables present elements of the accompanying condensed consolidated statements of operations that are categorized by segment (dollar amounts in millions):
|
Three Months Ended
June 30, |
||||||||||||||
|
|
2018
|
2017
|
$ Change
|
% Change
|
||||||||||
|
LEU Segment
|
|
|
||||||||||||
|
Revenue:
|
|
|
||||||||||||
|
SWU revenue
|
$
|
32.9
|
|
$
|
37.9
|
|
$
|
(5.0
|
)
|
(13
|
)%
|
|||
|
Uranium revenue
|
—
|
|
—
|
|
—
|
|
–
|
|
||||||
|
Total
|
32.9
|
|
37.9
|
|
(5.0
|
)
|
(13
|
)%
|
||||||
|
Cost of sales
|
42.9
|
|
42.5
|
|
(0.4
|
)
|
(1
|
)%
|
||||||
|
Gross loss
|
$
|
(10.0
|
)
|
$
|
(4.6
|
)
|
$
|
(5.4
|
)
|
|
|
|||
|
Contract Services Segment
|
|
|
|
|
||||||||||
|
Revenue
|
$
|
6.5
|
|
$
|
6.1
|
|
$
|
0.4
|
|
7
|
%
|
|||
|
Cost of sales
|
7.2
|
|
6.2
|
|
(1.0
|
)
|
(16
|
)%
|
||||||
|
Gross loss
|
$
|
(0.7
|
)
|
$
|
(0.1
|
)
|
$
|
(0.6
|
)
|
|
|
|||
|
Total
|
|
|
|
|
||||||||||
|
Revenue
|
$
|
39.4
|
|
$
|
44.0
|
|
$
|
(4.6
|
)
|
(10
|
)%
|
|||
|
Cost of sales
|
50.1
|
|
48.7
|
|
(1.4
|
)
|
(3
|
)%
|
||||||
|
Gross loss
|
$
|
(10.7
|
)
|
$
|
(4.7
|
)
|
$
|
(6.0
|
)
|
|
|
|||
|
Six Months Ended
June 30, |
||||||||||||||
|
|
2018
|
2017
|
$ Change
|
% Change
|
||||||||||
|
LEU Segment
|
|
|
||||||||||||
|
Revenue:
|
|
|
||||||||||||
|
SWU revenue
|
$
|
50.6
|
|
$
|
38.7
|
|
$
|
11.9
|
|
31
|
%
|
|||
|
Uranium revenue
|
3.6
|
|
—
|
|
3.6
|
|
–
|
|
||||||
|
Total
|
54.2
|
|
38.7
|
|
15.5
|
|
40
|
%
|
||||||
|
Cost of sales
|
77.7
|
|
45.2
|
|
(32.5
|
)
|
(72
|
)%
|
||||||
|
Gross loss
|
$
|
(23.5
|
)
|
$
|
(6.5
|
)
|
$
|
(17.0
|
)
|
|||||
|
Contract Services Segment
|
|
|
|
|
||||||||||
|
Revenue
|
$
|
20.9
|
|
$
|
12.5
|
|
$
|
8.4
|
|
67
|
%
|
|||
|
Cost of sales
|
13.4
|
|
13.6
|
|
0.2
|
|
1
|
%
|
||||||
|
Gross profit (loss)
|
$
|
7.5
|
|
$
|
(1.1
|
)
|
$
|
8.6
|
|
|||||
|
Total
|
|
|
|
|
||||||||||
|
Revenue
|
$
|
75.1
|
|
$
|
51.2
|
|
$
|
23.9
|
|
47
|
%
|
|||
|
Cost of sales
|
91.1
|
|
58.8
|
|
(32.3
|
)
|
(55
|
)%
|
||||||
|
Gross loss
|
$
|
(16.0
|
)
|
$
|
(7.6
|
)
|
$
|
(8.4
|
)
|
|||||
33
Revenue
Revenue from the LEU Segment declined $5.0 million in the three months and increased $15.5 million in the six months ended June 30, 2018, compared to the corresponding periods in 2017. The volume of SWU sales increased 18% in the three-month period and 97% in the six-month period ended June 30, 2018, reflecting the variability in timing of utility customer orders. The average price billed to customers for sales of SWU declined 26% in the three-month period and 34% in the six-month period ended June 30, 2018, reflecting the particular contracts under which SWU were sold during the periods and the trend of lower SWU market prices in recent years.
Revenue from the Contract Services Segment increased $0.4 million in the three months and $8.4 million in the six months ended June 30, 2018, compared to the corresponding periods in 2017, reflecting services provided under the X-energy contract beginning in the second quarter of 2018, partially offset by the reduced scope of work under the contract with UT-Battelle in the current periods. The increase in the six-month period also reflects $9.5 million of revenue related to the January 2018 settlement with DOE related to past work performed.
Cost of Sales
Cost of sales for the LEU Segment increased $0.4 million in the three months and $32.5 million in the six months ended June 30, 2018, compared to the corresponding period in 2017, due to the increases in sales volumes partially offset by declines in the average cost of sales per SWU.
Cost of sales is affected by sales volumes, unit costs of inventory, and direct charges to cost of sales such as legacy costs related to former GDP employees. Refer to
Impact of Legacy Costs
below
.
The average cost of sales per SWU declined approximately 15% in the six months ended June 30, 2018, or 13% excluding legacy costs, reflecting declines in our purchase costs per SWU in recent periods. We anticipate our average cost of sales per SWU from our diverse sources of supply will decline in 2019 and subsequent years.
Cost of sales for the Contract Services Segment increased $1.0 million in the three months and declined $0.2 million in the six months ended June 30, 2018, compared to the corresponding periods in 2017, reflecting services provided under the X-energy contract beginning in the second quarter of 2018, and the reduced scope of work under the contract with UT-Battelle over the current six-month period.
Gross Loss
We realized a gross loss of $10.7 million in the three months ended June 30, 2018, an increase of $6.0 million compared to the gross loss of $4.7 million in the corresponding period in 2017. In the six months ended June 30, 2018, we realized a gross loss of $16.0 million, an increase of $8.4 million compared to the gross loss of $7.6 million in the corresponding period in 2017. Excluding the $9.5 million of revenue in the current period from the January 2018 settlement with DOE related to past work performed, the gross loss in the six months ended June 30, 2018, was $25.5 million.
The gross loss for the LEU Segment in the three months ended June 30, 2018, was $10.0 million, an increase of $5.4 million compared to the gross loss of $4.6 million in the corresponding period in 2017. In the six months ended June 30, 2018, the gross loss for the LEU Segment was $23.5 million, an increase of $17.0 million compared to the gross loss of $6.5 million in the corresponding period in 2017. The particular SWU sales in the three and six months ended June 30, 2018, reflect a greater concentration of sales made under contracts that reflect lower prices under more recent market conditions.
34
For the Contract Services Segment, we realized a gross loss of $0.7 million in the three months ended June 30, 2018, compared to a gross loss of $0.1 million in the corresponding period in 2017. We realized a gross profit of $7.5 million in the six months ended June 30, 2018, including $9.5 million of revenue from the January 2018 settlement with DOE, compared to a gross loss of $1.1 million in the corresponding period in 2017. Gross losses are due to costs incurred which are greater than the revenue under the contracts with UT-Battelle and X-energy.
Impact of Legacy Costs
We ceased uranium enrichment at the Portsmouth GDP in 2001 and the Paducah GDP in 2013. Included in cost of sales are costs related to benefits for former GDP employees. These legacy costs are distinct from our current costs of acquiring SWU and uranium for sale. The following table presents the impact of legacy costs on gross profit for the LEU Segment (dollar amounts in millions):
|
Six Months Ended
June 30, |
|||||||
|
2018
|
2017
|
||||||
|
LEU Segment (GAAP)
|
|||||||
|
Gross loss
|
$
|
(23.5
|
)
|
$
|
(6.5
|
)
|
|
|
Gross margin
|
(43.4
|
)%
|
(16.8
|
)%
|
|||
|
Legacy costs included in cost of sales:
|
|||||||
|
Pension and postretirement health and life benefits
|
$
|
1.5
|
|
$
|
1.7
|
|
|
|
Disability obligations and other
|
0.3
|
|
(0.1
|
)
|
|||
|
Legacy costs
|
$
|
1.8
|
|
$
|
1.6
|
|
|
|
LEU Segment excluding legacy costs (non-GAAP)
|
|||||||
|
Gross loss excluding legacy costs
|
$
|
(21.7
|
)
|
$
|
(4.9
|
)
|
|
|
Gross margin excluding legacy costs
|
(40.0
|
)%
|
(12.7
|
)%
|
|||
We believe the non-GAAP financial measures above, when considered together with the corresponding GAAP measures and the reconciliation above, can provide additional understanding of the Company’s financial performance and underlying profitability. Management uses the non-GAAP financial measures to provide investors with a more complete understanding of the Company’s historical results and trends.
These non-GAAP financial measures are used in addition to and in conjunction with results presented in accordance with our GAAP results. The non-GAAP financial measures should be viewed in addition to, and not as a substitute for, or superior to, financial measures calculated in accordance with GAAP. The non-GAAP financial measures used by the Company may be calculated differently from, and therefore may not be comparable to, non-GAAP financial measures used by other companies.
35
Non-Segment Information
The following tables present elements of the accompanying condensed consolidated statements of operations that are not categorized by segment (dollar amounts in millions):
|
Three Months Ended
June 30, |
||||||||||||||
|
|
2018
|
2017
|
$ Change
|
% Change
|
||||||||||
|
Gross loss
|
$
|
(10.7
|
)
|
$
|
(4.7
|
)
|
$
|
(6.0
|
)
|
(128
|
)%
|
|||
|
Advanced technology license and decommissioning costs
|
5.4
|
|
4.4
|
|
(1.0
|
)
|
(23
|
)%
|
||||||
|
Selling, general and administrative
|
9.7
|
|
9.7
|
|
—
|
|
—
|
%
|
||||||
|
Amortization of intangible assets
|
1.5
|
|
2.0
|
|
0.5
|
|
25
|
%
|
||||||
|
Special charges for workforce reductions and advisory costs
|
0.3
|
|
2.3
|
|
2.0
|
|
87
|
%
|
||||||
|
Gains on sales of assets
|
(0.2
|
)
|
(0.7
|
)
|
(0.5
|
)
|
(71
|
)%
|
||||||
|
Operating loss
|
(27.4
|
)
|
(22.4
|
)
|
(5.0
|
)
|
(22
|
)%
|
||||||
|
Nonoperating components of net periodic benefit expense (income)
|
(1.7
|
)
|
(0.4
|
)
|
1.3
|
|
325
|
%
|
||||||
|
Interest expense
|
1.0
|
|
0.7
|
|
(0.3
|
)
|
(43
|
)%
|
||||||
|
Investment income
|
(0.6
|
)
|
(0.3
|
)
|
0.3
|
|
100
|
%
|
||||||
|
Loss before income taxes
|
(26.1
|
)
|
(22.4
|
)
|
(3.7
|
)
|
(17
|
)%
|
||||||
|
Income tax benefit
|
—
|
|
—
|
|
—
|
|
—
|
|
||||||
|
Net loss
|
(26.1
|
)
|
(22.4
|
)
|
(3.7
|
)
|
(17
|
)%
|
||||||
|
Preferred stock dividends - undeclared and cumulative
|
2.0
|
|
2.0
|
|
—
|
|
—
|
%
|
||||||
|
Net loss allocable to common stockholders
|
$
|
(28.1
|
)
|
$
|
(24.4
|
)
|
$
|
(3.7
|
)
|
(15
|
)%
|
|||
|
Six Months Ended
June 30, |
||||||||||||||
|
|
2018
|
2017
|
$ Change
|
% Change
|
||||||||||
|
Gross loss
|
$
|
(16.0
|
)
|
(7.6
|
)
|
$
|
(8.4
|
)
|
(111
|
)%
|
||||
|
Advanced technology license and decommissioning costs
|
13.4
|
|
10.5
|
|
(2.9
|
)
|
(28
|
)%
|
||||||
|
Selling, general and administrative
|
20.9
|
|
22.1
|
|
1.2
|
|
5
|
%
|
||||||
|
Amortization of intangible assets
|
2.8
|
|
3.2
|
|
0.4
|
|
13
|
%
|
||||||
|
Special charges for workforce reductions and advisory costs
|
0.9
|
|
4.7
|
|
3.8
|
|
81
|
%
|
||||||
|
Gains on sales of assets
|
(0.3
|
)
|
(1.7
|
)
|
(1.4
|
)
|
(82
|
)%
|
||||||
|
Operating loss
|
(53.7
|
)
|
(46.4
|
)
|
(7.3
|
)
|
(16
|
)%
|
||||||
|
Gain on early extinguishment of debt
|
—
|
|
(33.6
|
)
|
(33.6
|
)
|
(100
|
)%
|
||||||
|
Nonoperating components of net periodic benefit expense (income)
|
(3.3
|
)
|
(0.8
|
)
|
2.5
|
|
313
|
%
|
||||||
|
Interest expense
|
2.0
|
|
3.6
|
|
1.6
|
|
44
|
%
|
||||||
|
Investment income
|
(1.2
|
)
|
(0.6
|
)
|
0.6
|
|
100
|
%
|
||||||
|
Loss before income taxes
|
(51.2
|
)
|
(15.0
|
)
|
(36.2
|
)
|
(241
|
)%
|
||||||
|
Income tax benefit
|
(0.1
|
)
|
(0.2
|
)
|
(0.1
|
)
|
(50
|
)%
|
||||||
|
Net loss
|
(51.1
|
)
|
(14.8
|
)
|
(36.3
|
)
|
(245
|
)%
|
||||||
|
Preferred stock dividends - undeclared and cumulative
|
4.0
|
|
3.0
|
|
(1.0
|
)
|
33
|
%
|
||||||
|
Net loss allocable to common stockholders
|
$
|
(55.1
|
)
|
$
|
(17.8
|
)
|
$
|
(37.3
|
)
|
(210
|
)%
|
|||
36
Advanced Technology License and Decommissioning Costs
Advanced technology license and decommissioning costs consist of American Centrifuge expenses that are outside of our customer contracts in the Contract Services Segment, including ongoing costs for work at the Piketon facility. Costs increased $1.0 million (or 23%) in the three months and $2.9 million (or 28%) in the six months ended June 30, 2018, compared to the corresponding periods in 2017. In the current periods, efforts at the Piketon facility were focused on NRC license termination and DOE lease turnover activities and the related costs were charged to expense. In the prior period, efforts were primarily focused on decontamination and decommissioning (“D&D”) of the Piketon facility and the related costs were recorded as a reduction of the D&D liability. In addition, a greater allocation of Piketon facility costs was charged to advanced technology license and decommissioning costs in the current periods following the relocation of certain corporate functions from the Piketon facility.
Selling, General and Administrative
Selling, general and administrative (“SG&A”) expenses were unchanged in the three months and decreased $1.2 million (or 5%) in the six months ended June 30, 2018, compared to the corresponding periods in 2017. Overhead allocated to SG&A expenses declined $0.9 million in the three months and $1.5 million in the six months ended June 30, 2018, following the relocation of certain corporate functions from the Piketon facility. Compensation and benefits declined $0.2 million in the three-month period and $0.4 million in the six-month period. Consulting costs increased $0.9 million in the three-month period and $0.6 million in the six-month period, primarily for work related to business development.
Amortization of Intangible Assets
Amortization expense for the intangible asset related to the September 2014 sales order book is a function of SWU sales volume under that order book, which declined in the three and six months ended June 30, 2018, compared to the corresponding periods in 2017. The intangible asset related to customer relationships is amortized on a straight-line basis.
Special Charges for Workforce Reductions and Advisory Costs
Special charges declined $2.0 million (or 87%) in the three months and $3.8 million (or 81%) in the six months ended June 30, 2018, compared to the corresponding periods in 2017. Special charges in the six months ended June 30, 2018, and 2017, consisted of estimated employee termination benefits of $0.8 million and $1.4 million and advisory costs of $0.1 million and $3.3 million, respectively. Advisory costs related to updating the Company’s information technology systems.
Gain on Early Extinguishment of Debt
In the first quarter of 2017, we recognized a gain of $33.6 million related to the exchange of securities and cash on February 14, 2017, which is net of transaction costs of $9.0 million and previously deferred issuance costs related to the 8% PIK Toggle Notes of $0.4 million. Refer to
Note 7, Debt,
of the unaudited condensed consolidated financial statements.
Nonoperating Components of Net Periodic Benefit Expense (Income)
Effective January 1, 2018, a new accounting standard requires components of retirement benefit expense/income other than service cost to be presented below the subtotal for operating income (loss). The increases in nonoperating components of net periodic benefit income for the three and six months ended June 30, 2018, reflect a decline in market interest rates used to measure retirement benefit obligations on a present value basis, compared to the corresponding periods in 2017. For the three and six months ended June 30, 2017, $0.4 million and $0.8 million of income was reclassified from Cost of Sales of the LEU Segment to conform with the current presentation.
37
Interest Expense
Interest expense increased $0.3 million (or 43%) in the three months and decreased $1.6 million (or 44%) in the six months ended June 30, 2018, compared to the corresponding periods in 2017. The decline for the six-month period was the result of the early extinguishment of 87% of the outstanding principal amount of the 8% PIK Toggle Notes on February 14, 2017. No interest expense is recognized on the 8.25% Notes as described in
Note 7, Debt
, of the unaudited condensed consolidated financial statements.
Income Tax Benefit
The income tax benefit was $0 and $0.1 million in the three and six months ended June 30, 2018. The income tax benefit was $0 and $0.2 million in the three and six months ended June 30, 2017. The income tax benefit in both six-month periods resulted from discrete items for reversals of previously accrued amounts associated with liabilities for unrecognized benefits.
Net Loss
Our net loss was $26.1 million in the three months ended June 30, 2018, compared to a net loss of $22.4 million in the three months ended June 30, 2017. The unfavorable variance of $3.7 million was impacted by a $6.0 million increase in the gross loss, partially offset by a $2.0 million decline in special charges and a $1.3 million increase in net periodic benefit income.
Our net loss was $51.1 million in the six months ended June 30, 2018, compared to net loss of $14.8 million in the six months ended June 30, 2017. The net loss for the six months ended June 30, 2017, included the non-recurring gain on early extinguishment of debt of $33.6 million. Additionally, the unfavorable variance of $36.3 million was impacted by a $8.4 million increase in the gross loss ($17.9 million excluding the settlement with DOE), partially offset by a $3.8 million decline in special charges and a $2.5 million increase in net periodic benefit income.
Preferred Stock Dividends - Undeclared and Cumulative
Holders of the Series B Preferred Stock are entitled to cumulative dividends of 7.5% per annum of the aggregate liquidation preference at origination of $104.6 million. We did not meet the criteria for a dividend payment obligation for the three and six months ended June 30, 2018, and we have not declared, accrued or paid dividends on the Series B Preferred Stock since issuance on February 14, 2017. Dividends on the Series B Preferred Stock are cumulative to the extent not paid at any quarter-end, whether or not declared and whether or not there are assets of the Company legally available for the payment of such dividends in whole or in part.
38
Liquidity and Capital Resources
We ended the second quarter of 2018 with a consolidated cash balance of
$140.1 million
. We anticipate having adequate liquidity to support our business operations for at least the next 12 months from the date of this report. Our view of liquidity is dependent on, among other things, our operations and the level of expenditures and government funding for our services contracts and the timing of customer payments. Liquidity requirements for our existing operations are affected primarily by the timing and amount of customer sales and our inventory purchases.
We believe our sales order book in our LEU Segment is a source of stability for our liquidity position. Our
sales order book extends for more than a decade.
Although, based on current market conditions, we see limited uncommitted demand for LEU for the remainder of this decade before an anticipated rise in uncommitted demand in the 2020s, we continue to seek and make additional sales, including sales for delivery during that time period.
Substantially all revenue-generating operations of the Company are conducted at the subsidiary level. Centrus’ principal source of funding for American Centrifuge activities is provided: (i) under the contract with UT-Battelle, the operator of ORNL; and (ii) from Centrus’ wholly-owned subsidiary, Enrichment Corp. to Centrus and its 100% indirectly owned subsidiary American Centrifuge Operating, LLC pursuant to two secured intercompany financing notes. The financing obtained from Enrichment Corp. funds American Centrifuge activities pending receipt of payments related to work performed under the contract with UT-Battelle, American Centrifuge costs that are outside the scope of work under the contract with UT-Battelle, including D&D and other costs of the Piketon facility, and general corporate expenses, including cash interest payments on our debt.
Capital expenditures are expected to be insignificant for at least the next 12 months.
In February 2016, Centrus completed a successful three-year demonstration of the American Centrifuge technology at its facility in Piketon, Ohio. U.S. government funding for American Centrifuge since October 2015 is now limited to research and development work at our facilities in Oak Ridge, Tennessee. As a result of reduced program funding, workforce reductions commenced in the fourth quarter of 2015 and, as of June 30, 2018, we expect to make payments of $3.3 million for remaining workforce reductions in the third quarter of 2019. In the event that funding by the U.S. government is further reduced or discontinued, the American Centrifuge project may be subject to further demobilization, costs, delays and termination. Any such actions may have a material adverse impact on our ability to deploy the American Centrifuge technology and on our liquidity.
The D&D of the Piketon facility was substantially complete as of June 30, 2018, with remaining estimated costs of $1.0 million. We have previously provided financial assurance to the NRC for the D&D work in the form of surety bonds that are fully cash collateralized by us for $16.2 million. We expect to receive cash when surety bonds are reduced and/or cancelled as the Company fulfills its D&D obligations and the NRC license for the test facility is terminated.
We lease the Piketon facility from DOE. At the conclusion of the lease on June 30, 2019, without mutual agreement between us and DOE regarding other possible uses for the facility, we are obligated to return the facility to DOE in a condition that meets NRC requirements and in the same condition as the facility was in when it was leased to us (other than due to normal wear and tear). We estimate the cost for these lease termination obligations to be $0.7 million as of June 30, 2018. We have previously provided financial assurance to DOE for the lease obligations in the form of surety bonds that are fully cash collateralized by us for $13.6 million. We expect to receive cash when surety bonds are reduced and/or cancelled as the Company fulfills its lease termination obligations.
We anticipate incurring costs of approximately $12 million from the third quarter of 2018 through the second quarter of 2019 to terminate the NRC license and complete the DOE lease turnover activities required to return the facility to DOE when the lease expires in June 2019. If costs to terminate the NRC license or complete the DOE lease turnover activities are greater than our estimates then such increased costs could have an adverse impact on our results of operations and liquidity.
39
The change in cash, cash equivalents and restricted cash from our condensed consolidated statements of cash flows are as follows on a summarized basis (in millions):
|
Six Months Ended
June 30, |
|||||||
|
|
2018
|
2017
|
|||||
|
Cash used in operating activities
|
$
|
(65.7
|
)
|
$
|
(78.0
|
)
|
|
|
Cash provided by investing activities
|
0.2
|
|
1.6
|
|
|||
|
Cash used in financing activities
|
(3.0
|
)
|
(36.6
|
)
|
|||
|
Decrease in cash and cash equivalents
|
$
|
(68.5
|
)
|
$
|
(113.0
|
)
|
|
Operating Activities
The net reduction of $59.9 million in the SWU purchase payables balance, due to the timing of purchase deliveries, was a significant use of cash in the six months ended June 30, 2018. The operating loss of $53.7 million in the six months ended June 30, 2018, net of non-cash expenses, was a use of cash. Sources of cash included the net reduction in receivables from utility customers of $18.9 million.
In the corresponding period in 2017, the net reduction of $39.7 million in the SWU purchase payables balance, due to the timing of purchase deliveries, was a significant use of cash in the six months ended June 30, 2017. Other uses of cash were reflected in the reduction of accounts payable and other liabilities of $24.7 million and SG&A expenses of $22.1 million. The net decline of $42.7 million in inventories had yet to be fully monetized as indicated by the net increase of $40.9 million in receivables from utility customers resulting from sales in June 2017.
Investing Activities
There were no significant capital expenditures in the six months ended June 30, 2018 and 2017. Sales of unneeded assets and property yielded net proceeds of $0.3 million and $1.7 million in the six months ended June 30, 2018 and 2017, respectively.
Financing Activities
In the six months ended June 30, 2018, the $3.0 million payment of interest classified as debt is classified as a financing activity. Refer to
Note 7, Debt,
of the unaudited condensed consolidated financial statements regarding the accounting for the 8.25% Notes.
In February 2017, Centrus exchanged $204.9 million principal amount of the Company’s 8% PIK Toggle Notes for $74.3 million principal amount of 8.25% Notes, 104,574 shares of Series B Preferred Stock and $27.6 million of cash. Refer to
Note 7, Debt
of the unaudited condensed consolidated financial statements.
Working Capital
|
June 30,
2018 |
December 31,
2017 |
||||||
|
(in millions)
|
|||||||
|
Cash and cash equivalents
|
$
|
140.1
|
|
$
|
208.8
|
|
|
|
Accounts receivable
|
27.9
|
|
60.2
|
|
|||
|
Inventories, net
|
54.9
|
|
75.2
|
|
|||
|
Other current assets and liabilities, net
|
(108.6
|
)
|
(180.7
|
)
|
|||
|
Working capital
|
$
|
114.3
|
|
$
|
163.5
|
|
|
40
Capital Structure and Financial Resources
Interest on the 8.25% Notes is payable semi-annually in arrears as of February 28 and August 31 based on a 360-day year consisting of twelve 30-day months. The 8.25% Notes are guaranteed on a subordinated and limited basis by, and secured by substantially all assets of, Enrichment Corp. The 8.25% Notes mature on February 28, 2027.
The principal amount of the 8% PIK Toggle Notes is increased by any payment of interest in the form of PIK payments. We have the option to pay up to 5.5% per annum of interest due on the 8% PIK Toggle Notes in the form of PIK payments. The 8% PIK Toggle Notes are guaranteed and secured on a subordinated, conditional, and limited basis by Enrichment Corp. The 8.0% PIK Toggle Notes mature on September 30, 2019. However, the maturity date can be extended to September 30, 2024, upon the satisfaction of certain funding conditions described in the Indenture relating to the funding, under binding agreements, of (i) the American Centrifuge project or (ii) the implementation and deployment of a National Security Train Program utilizing American Centrifuge technology.
Additional terms and conditions of the 8.25% Notes and the 8% PIK Toggle Notes are described in
Note 7, Debt,
of the unaudited condensed consolidated financial statements and
Note 9, Debt
, of the audited consolidated financial statements in our Annual Report on Form 10-K for the year ended December 31, 2017.
Holders of the Series B Preferred Stock are entitled to cumulative dividends of 7.5% per annum of the Liquidation Preference. We are obligated to pay cash dividends on our Series B Preferred Stock to the extent dividends are declared by the Board and certain criteria are met. We have not met these criteria for the periods from issuance through June 30, 2018, and have not declared, accrued or paid dividends on the Series B Preferred Stock as of June 30, 2018. Additional terms and conditions of the Series B Preferred Stock, including the criteria that must be met for the payment of dividends, are described in
Note 12, Stockholders’ Equity
of the unaudited condensed consolidated financial statements.
The nuclear industry in general, and the nuclear fuel industry in particular, are in a period of significant change. We are actively considering, and expect to consider from time to time in the future, potential strategic transactions, which at any given time may be in various stages of discussions, diligence or negotiation. If we pursue opportunities that require capital, we believe we would seek to satisfy these needs through a combination of working capital, cash generated from operations or additional debt or equity financing.
We are managing our working capital to seek to improve the long-term value of our LEU business and are planning to continue funding the Company’s qualified pension plans in the ordinary course because we believe that is in the best interest of all stakeholders. We expect that any other uses of working capital will be undertaken in light of these strategic priorities and will be based on the Company’s determination as to the relative strength of its operating performance and prospects, financial position and expected liquidity requirements. In addition, we expect that any such other uses of working capital will be subject to compliance with contractual restrictions to which the Company and its subsidiaries are subject, including the terms and conditions of their debt securities and credit facilities. We continually evaluate alternatives to manage our capital structure, and may opportunistically repurchase, exchange or redeem Company securities from time to time.
Off-Balance Sheet Arrangements
Other than outstanding letters of credit and surety bonds, our SWU purchase commitments and the license agreement with DOE relating to the American Centrifuge technology disclosed in our Annual Report on Form 10-K for the year ended December 31, 2017, there were no material off-balance sheet arrangements at June 30, 2018, or December 31, 2017.
New Accounting Standards
Reference is made to
New Accounting Standards
in
Note 1, Basis of Presentation,
of the unaudited condensed consolidated financial statements for information on new accounting standards.
41
Item 4.
Controls and Procedures
Evaluation of Disclosure Controls and Procedures
Centrus maintains disclosure controls and procedures (as defined in Rules 13a-15(e) and 15d-15(e) under the Exchange Act) that are designed to ensure that information required to be disclosed by Centrus in reports it files or submits under the Exchange Act is recorded, processed, summarized and reported on a timely basis and that such information is accumulated and communicated to management, including the Chief Executive Officer and the Chief Financial Officer, as appropriate to allow for timely decisions regarding required disclosures.
As of
June 30, 2018
, the end of the period covered by this report, our management performed an evaluation, under the supervision and with the participation of the Chief Executive Officer and the Chief Financial Officer, of the effectiveness of our disclosure controls and procedures (as defined in Rule 13a-15(e) under the Exchange Act). Based on this evaluation, the Chief Executive Officer and the Chief Financial Officer concluded, as of
June 30, 2018
, that the Company’s disclosure controls and procedures were effective.
Changes in Internal Control Over Financial Reporting
There were no changes in our internal control over financial reporting during the quarter ended June 30, 2018, that have materially affected, or are reasonably likely to materially affect, our internal control over financial reporting.
42
Item 1.
Legal Proceedings
There have been no material changes to the Legal Proceedings set forth under Part I, Item 3,
Legal Proceedings,
in our Annual Report on Form 10-K for the year ended December 31, 2017.
Centrus is subject to various legal proceedings and claims, either asserted or unasserted, which arise in the ordinary course of business. While the outcome of these claims cannot be predicted with certainty, we do not believe that the outcome of any of these legal matters, individually and in the aggregate, will have a material adverse effect on our cash flows, results of operations or consolidated financial condition.
Item 1A.
Risk Factors
There have been no material changes to the Risk Factors described in Part I, Item 1A,
Risk Factors
, in our Annual Report on Form 10-K for the year ended December 31, 2017.
Item 6.
Exhibits
|
10.47
|
|
|
31.1
|
|
|
31.2
|
|
|
32.1
|
|
|
101
|
Unaudited condensed consolidated financial statements from the Quarterly Report on Form 10-Q for the quarter ended June 30, 2018, filed in interactive data file (XBRL) format.
|
43
SIGNATURES
Pursuant to the requirements of the Securities Exchange Act of 1934, the registrant has duly caused this report to be signed on its behalf by the undersigned thereunto duly authorized.
|
|
Centrus Energy Corp.
|
|||
|
|
|
|
|
|
|
|
|
|
|
|
|
Date:
|
August 9, 2018
|
By:
|
/s/ Marian K. Davis
|
|
|
|
|
Marian K. Davis
|
|
|
|
|
Senior Vice President, Chief Financial Officer and Treasurer
|
|||
|
|
(Duly Authorized Officer and Principal Financial Officer)
|
|||
44
TABLE OF CONTENTS
Note 2, Revenue Recognition and Contracts with Customers,Note 9, Pension and Postretirement BenefitsNote 7, DebtNote 2, Revenue Recognition and Contracts with CustomersNote 13, Segment InformationNote 12, Stockholders EquityNote 9, DebtNote 9, Pension and Postretirement Health and Life BenefitsItem 2. Management S Discussion and Analysis Of Financial Condition and Results Of OperationsNote 1, Basis Of Presentation,Note 7, Debt,Item 4. Controls and ProceduresPart IIItem 1. Legal ProceedingsItem 1A. Risk FactorsItem 6. Exhibits