CENTRUS ENERGY CORP
10-Ks and 10-Qs
|
|
|
|
|
|
|
|
|
|
|
|
|
|
|
|
|
|
|
|
|
|
|
|
|
|
|
|
|
|
|
|
|
|
|
|
|
|
|
|
|
|
|
|
|
|
|
|
|
|
|
|
|
UNITED STATES
SECURITIES AND EXCHANGE COMMISSION
Washington, D.C. 20549
FORM 10-Q
|
ý
|
QUARTERLY REPORT PURSUANT TO SECTION 13 OR 15(d) OF THE SECURITIES EXCHANGE ACT OF 1934
|
For the quarterly period ended
March 31, 2020
OR
|
o
|
TRANSITION REPORT PURSUANT TO SECTION 13 OR 15(d) OF THE SECURITIES EXCHANGE ACT OF 1934
|
Commission file number 1-14287
Centrus Energy Corp.
|
Delaware
|
52-2107911
|
|
(State of incorporation)
|
(I.R.S. Employer Identification No.)
|
6901 Rockledge Drive, Suite 800, Bethesda, Maryland 20817
(301) 564-3200
Securities registered pursuant to Section 12(b) of the Act:
|
Title of Each Class
|
Trading Symbol
|
Name of Each Exchange on Which Registered
|
|
Class A Common Stock, par value $0.10 per share
|
LEU
|
NYSE American
|
Indicate by check mark whether the registrant (1) has filed all reports required to be filed by Section 13 or 15(d) of the Securities Exchange Act of 1934 during the preceding 12 months (or for such shorter period that the registrant was required to file such reports), and (2) has been subject to such filing requirements for the past 90 days. Yes
ý
No
o
Indicate by check mark whether the registrant has submitted electronically, if any, every Interactive Data File required to be submitted pursuant to Rule 405 of Regulation S-T (§232.405 of this chapter) during the preceding 12 months (or for such shorter period that the registrant was required to submit such files). Yes
ý
No
o
Indicate by check mark whether the registrant is a large accelerated filer, an accelerated filer, a non-accelerated filer, a smaller reporting company or an emerging growth company. See the definitions of “large accelerated filer,” “accelerated filer,” “smaller reporting company,” and “emerging growth company” in Rule 12b-2 of the Exchange Act.
|
Large accelerated filer
|
o
|
|
Accelerated filer
|
o
|
Non-accelerated filer
|
ý
|
|
|
Smaller reporting company
|
ý
|
|
Emerging growth company
|
o
|
|||
If an emerging growth company, indicate by check mark if the registrant has elected not to use the extended transition period for complying with any new or revised financial accounting standards provided pursuant to Section 13(a) of the Exchange Act.
o
Indicate by check mark whether the registrant is a shell company (as defined in Rule 12b-2 of the Exchange Act).
Yes
o
No
ý
As of
April 20, 2020
, there were 8,783,189 shares of the registrant’s Class A Common Stock, par value $0.10 per share, and 719,200 shares of the registrant’s Class B Common Stock, par value $0.10 per share, outstanding.
TABLE OF CONTENTS
|
|
|
Page
|
|
|
PART I – FINANCIAL INFORMATION
|
|
|
|
|
|
|
|
||
|
|
||
|
|
||
|
|
||
|
|
||
|
|
||
|
|
|
|
|
|
PART II – OTHER INFORMATION
|
|
FORWARD-LOOKING STATEMENTS
This Quarterly Report on Form 10-Q, including
Management’s Discussion and Analysis of Financial Condition and Results of Operations
in Part I, Item 2, contains “forward-looking statements” within the meaning of Section 21E of the Securities Exchange Act of 1934. In this context, forward-looking statements mean statements related to future events,
may address our expected future business and financial performance, and often contain words such as “expects”, “anticipates”, “intends”, “plans”, “believes”, “will”, “should”, “could”, “would” or “may” and other words of similar meaning. Forward-looking statements by their nature address matters that are, to different degrees, uncertain. For Centrus Energy Corp., particular risks and uncertainties that could cause our actual future results to differ materially from those expressed in our forward-looking statements include but are not limited to the following, which may be amplified by the novel coronavirus (COVID-19) pandemic: risks related to our significant long-term liabilities, including material unfunded defined benefit pension plan obligations and postretirement health and life benefit obligations; risks relating to our 8.25% notes (the “8.25% Notes”) maturing in February 2027 and our Series B Senior Preferred Stock; risks related to the use of our net operating loss (“NOLs”) carryforwards and net unrealized built-in losses (“NUBILs”) to offset future taxable income and the use of the Rights Agreement (as defined herein) to prevent an “ownership change” as defined in Section 382 of the Internal Revenue Code of 1986, as amended (the “Code”) and our ability to generate taxable income to utilize all or a portion of the NOLs and NUBILs prior to the expiration thereof; risks related to the limited trading markets in our securities; risks related to our ability to maintain the listing of our Class A Common Stock on the NYSE American LLC (the “NYSE American”); risks related to decisions made by our Class B stockholders and our Series B Senior Preferred stockholders regarding their investment in the Company based upon factors that are unrelated to the Company’s performance; risks related to the Company’s capital concentration; risks related to natural and other disasters, including the continued impact of the March 2011 earthquake and tsunami in Japan on the nuclear industry and on our business, results of operations and prospects; the impact and potential extended duration of the current supply/demand imbalance in the market for low-enriched uranium (“LEU”); our dependence on others for deliveries of LEU including deliveries from the Russian government-owned entity TENEX, Joint-Stock Company (“TENEX”), under a commercial supply agreement with TENEX and deliveries under a long-term supply agreement with Orano Cycle (“Orano”); risks related to existing or new trade barriers and contract terms that limit our ability to deliver LEU to customers; risks related to actions, including government reviews, that may be taken by the United States government, the Russian government or other governments that could affect our ability to perform under our contract obligations or the ability of our sources of supply to perform under their contract obligations to us, including the imposition of sanctions, restrictions or other requirements, and risks relating to the potential expiration of the 1992 Russian Suspension Agreement (“RSA”) and/or a renewal of the RSA on
2
terms not favorable to us or legislation imposing new or increased limits on imports of Russian LEU; risks related to our ability to sell the LEU we procure pursuant to our purchase obligations under our supply agreements; risks relating to our sales order book, including uncertainty concerning customer actions under current contracts and in future contracting due to market conditions and lack of current production capability; risks related to financial difficulties experienced by customers, including possible bankruptcies, insolvencies or any other inability to pay for our products or services or delays in making timely payment; pricing trends and demand in the uranium and enrichment markets and their impact on our profitability; movement and timing of customer orders; risks related to the value of our intangible assets related to the sales order book and customer relationships; risks associated with our reliance on third-party suppliers to provide essential products and services to us; the impact of government regulation including by the U.S. Department of Energy (“DOE”) and the U.S. Nuclear Regulatory Commission; uncertainty regarding our ability to commercially deploy competitive enrichment technology; risks and uncertainties regarding funding for deployment of the American Centrifuge technology and our ability to perform and absorb costs under our agreement with DOE to demonstrate the capability to produce high assay low enriched uranium (“HALEU”) and our ability to obtain and/or perform under other agreements; risks relating to whether or when government or commercial demand for HALEU will materialize; the potential for further demobilization or termination of our American Centrifuge work; risks related to our ability to perform and receive timely payment under agreements with DOE or other government agencies, including risk and uncertainties related to the ongoing funding of the government and potential audits; the competitive bidding process associated with obtaining a federal contract; risks related to our ability to perform fixed-price and cost-share contracts, including the risk that costs could be higher than expected; risks that we will be unable to obtain new business opportunities or achieve market acceptance of our products and services or that products or services provided by others will render our products or services obsolete or noncompetitive; risks that we will not be able to timely complete the work that we are obligated to perform; failures or security breaches of our information technology systems; risks related to pandemics and other health crises, such as the global COVID-19 pandemic; potential strategic transactions, which could be difficult to implement, disrupt our business or change our business profile significantly; the outcome of legal proceedings and other contingencies (including lawsuits and government investigations or audits); the competitive environment for our products and services; changes in the nuclear energy industry; the impact of financial market conditions on our business, liquidity, prospects, pension assets and insurance facilities; the risks of revenue and operating results fluctuating significantly from quarter to quarter, and in some cases, year to year; and other risks and uncertainties discussed in this and our other filings with the Securities and Exchange Commission, including under Part 1. Item1A - “Risk Factors” in our Annual Report on Form 10-K for the year ended December 31, 2019.
These factors may not constitute all factors that could cause actual results to differ from those discussed in any forward-looking statement. Accordingly, forward-looking statements should be not be relied upon as a predictor of actual results. Readers are urged to carefully review and consider the various disclosures made in this report and in our other filings with the Securities and Exchange Commission that attempt to advise interested parties of the risks and factors that may affect our business. We do not undertake to update our forward-looking statements to reflect events or circumstances that may arise after the date of this Quarterly Report on Form 10-Q, except as required by law.
3
CENTRUS ENERGY CORP.
CONDENSED CONSOLIDATED BALANCE SHEETS
(Unaudited; in millions, except share and per share data)
|
|
March 31,
2020 |
December 31,
2019 |
|||||
|
ASSETS
|
|
|
|||||
|
Current assets:
|
|
|
|||||
|
Cash and cash equivalents
|
$
|
109.2
|
|
$
|
130.7
|
|
|
|
Accounts receivable
|
17.5
|
|
21.1
|
|
|||
|
Inventories
|
67.9
|
|
64.5
|
|
|||
|
Deferred costs associated with deferred revenue
|
144.1
|
|
144.1
|
|
|||
|
Other current assets
|
7.8
|
|
9.2
|
|
|||
|
Total current assets
|
346.5
|
|
369.6
|
|
|||
|
Property, plant and equipment, net of accumulated depreciation of $2.3 as of March 31, 2020 and $2.2 as of December 31, 2019
|
3.6
|
|
3.7
|
|
|||
|
Deposits for financial assurance
|
5.7
|
|
5.7
|
|
|||
|
Intangible assets, net
|
68.1
|
|
69.5
|
|
|||
|
Other long-term assets
|
6.9
|
|
7.4
|
|
|||
|
Total assets
|
$
|
430.8
|
|
$
|
455.9
|
|
|
|
LIABILITIES AND STOCKHOLDERS’ DEFICIT
|
|
|
|
|
|||
|
Current liabilities:
|
|
|
|
|
|||
|
Accounts payable and accrued liabilities
|
$
|
50.7
|
|
$
|
50.7
|
|
|
|
Payables under SWU purchase agreements
|
6.1
|
|
8.1
|
|
|||
|
Inventories owed to customers and suppliers
|
7.4
|
|
5.6
|
|
|||
|
Deferred revenue and advances from customers
|
243.0
|
|
266.3
|
|
|||
|
Current debt
|
6.1
|
|
6.1
|
|
|||
|
Total current liabilities
|
313.3
|
|
336.8
|
|
|||
|
Long-term debt
|
111.0
|
|
114.1
|
|
|||
|
Postretirement health and life benefit obligations
|
134.7
|
|
138.6
|
|
|||
|
Pension benefit liabilities
|
137.2
|
|
141.8
|
|
|||
|
Advances from customers
|
29.4
|
|
29.4
|
|
|||
|
Other long-term liabilities
|
30.6
|
|
32.1
|
|
|||
|
Total liabilities
|
756.2
|
|
792.8
|
|
|||
|
Commitments and contingencies (Note 11)
|
|
|
|
|
|||
|
Stockholders’ deficit:
|
|||||||
|
Preferred stock, par value $1.00 per share, 20,000,000 shares authorized
|
|||||||
|
Series A Participating Cumulative Preferred Stock, none issued
|
—
|
|
—
|
|
|||
|
Series B Senior Preferred Stock, 7.5% cumulative, 104,574 shares issued and outstanding and an aggregate liquidation preference of $129.2 as of March 31, 2020 and $127.2 as of December 31, 2019
|
4.6
|
|
4.6
|
|
|||
|
Class A Common Stock, par value $0.10 per share, 70,000,000 shares authorized, 8,783,189 and 8,347,427 shares issued and outstanding as of March 31, 2020 and December 31, 2019, respectively
|
0.8
|
|
0.8
|
|
|||
|
Class B Common Stock, par value $0.10 per share, 30,000,000 shares authorized, 719,200 and 1,117,462 shares issued and outstanding as of March 31, 2020 and December 31, 2019, respectively
|
0.1
|
|
0.1
|
|
|||
|
Excess of capital over par value
|
61.8
|
|
61.5
|
|
|||
|
Accumulated deficit
|
(393.7
|
)
|
(405.0
|
)
|
|||
|
Accumulated other comprehensive income, net of tax
|
1.0
|
|
1.1
|
|
|||
|
Total stockholders’ deficit
|
(325.4
|
)
|
(336.9
|
)
|
|||
|
Total liabilities and stockholders’ deficit
|
$
|
430.8
|
|
$
|
455.9
|
|
|
The accompanying notes are an integral part of these unaudited condensed consolidated financial statements.
4
CENTRUS ENERGY CORP.
CONDENSED
CONSOLIDATED STATEMENTS OF OPERATIONS AND COMPREHENSIVE INCOME (LOSS)
(
Unaudited;
in millions, except share and per share data)
|
Three Months Ended
March 31, |
|||||||
|
2020
|
2019
|
||||||
|
Revenue:
|
|||||||
|
Separative work units
|
$
|
30.7
|
|
$
|
12.4
|
|
|
|
Uranium
|
—
|
|
22.7
|
|
|||
|
Technical solutions
|
14.3
|
|
3.6
|
|
|||
|
Total revenue
|
45.0
|
|
38.7
|
|
|||
|
Cost of Sales:
|
|||||||
|
Separative work units and uranium
|
13.3
|
|
38.3
|
|
|||
|
Technical solutions
|
12.1
|
|
5.9
|
|
|||
|
Total cost of sales
|
25.4
|
|
44.2
|
|
|||
|
Gross profit (loss)
|
19.6
|
|
(5.5
|
)
|
|||
|
Advanced technology costs
|
0.9
|
|
6.6
|
|
|||
|
Selling, general and administrative
|
8.5
|
|
8.1
|
|
|||
|
Amortization of intangible assets
|
1.4
|
|
1.1
|
|
|||
|
Special charges (credits) for workforce reductions
|
(0.1
|
)
|
(0.1
|
)
|
|||
|
Gain on sales of assets
|
—
|
|
(0.4
|
)
|
|||
|
Operating income (loss)
|
8.9
|
|
(20.8
|
)
|
|||
|
Nonoperating components of net periodic benefit expense (income)
|
(2.2
|
)
|
(0.1
|
)
|
|||
|
Interest expense
|
0.1
|
|
1.0
|
|
|||
|
Investment income
|
(0.4
|
)
|
(0.7
|
)
|
|||
|
Income (loss) before income taxes
|
11.4
|
|
(21.0
|
)
|
|||
|
Income tax expense (benefit)
|
0.1
|
|
(0.1
|
)
|
|||
|
Net income (loss) and comprehensive income (loss)
|
11.3
|
|
(20.9
|
)
|
|||
|
Preferred stock dividends - undeclared and cumulative
|
2.0
|
|
2.0
|
|
|||
|
Net income (loss) allocable to common stockholders
|
$
|
9.3
|
|
$
|
(22.9
|
)
|
|
|
Net income (loss) per common share:
|
|
|
|
|
|||
|
Basic
|
$
|
0.97
|
|
$
|
(2.40
|
)
|
|
|
Diluted
|
$
|
0.95
|
|
$
|
(2.40
|
)
|
|
|
Average number of common shares outstanding (in thousands):
|
|
|
|
|
|||
|
Basic
|
9,619
|
|
9,532
|
|
|||
|
Diluted
|
9,839
|
|
9,532
|
|
|||
The accompanying notes are an integral part of these unaudited condensed consolidated financial statements.
5
CENTRUS ENERGY CORP.
CONDENSED
CONSOLIDATED STATEMENTS OF CASH FLOWS
(
Unaudited;
in millions)
|
Three Months Ended
March 31, |
|||||||
|
|
2020
|
2019
|
|||||
|
OPERATING
|
|
||||||
|
Net income (loss)
|
$
|
11.3
|
|
$
|
(20.9
|
)
|
|
|
Adjustments to reconcile net loss to cash used in operating activities:
|
|||||||
|
Depreciation and amortization
|
1.5
|
|
1.3
|
|
|||
|
PIK interest on paid-in-kind toggle notes
|
—
|
|
0.4
|
|
|||
|
Gain on sales of assets
|
—
|
|
(0.4
|
)
|
|||
|
Changes in operating assets and liabilities:
|
|||||||
|
Accounts receivable
|
3.6
|
|
11.2
|
|
|||
|
Inventories, net
|
0.1
|
|
25.6
|
|
|||
|
Accounts payable and other liabilities
|
1.3
|
|
1.2
|
|
|||
|
Payables under SWU purchase agreements
|
(1.9
|
)
|
(46.0
|
)
|
|||
|
Deferred revenue and advances from customers, net of deferred costs
|
(23.3
|
)
|
—
|
|
|||
|
Accrued loss on long-term contract
|
(3.5
|
)
|
—
|
|
|||
|
Pension and postretirement benefit liabilities
|
(8.6
|
)
|
(4.2
|
)
|
|||
|
Other, net
|
1.0
|
|
(0.1
|
)
|
|||
|
Cash used in operating activities
|
(18.5
|
)
|
(31.9
|
)
|
|||
|
INVESTING
|
—
|
|
—
|
|
|||
|
FINANCING
|
|||||||
|
Payments for deferred financing costs
|
(0.1
|
)
|
—
|
|
|||
|
Exercise of stock options
|
0.2
|
|
—
|
|
|||
|
Payment of interest classified as debt
|
(3.1
|
)
|
(3.1
|
)
|
|||
|
Cash used in financing activities
|
(3.0
|
)
|
(3.1
|
)
|
|||
|
Decrease in cash, cash equivalents and restricted cash
|
(21.5
|
)
|
(35.0
|
)
|
|||
|
Cash, cash equivalents and restricted cash, beginning of period (Note 4)
|
136.6
|
|
159.7
|
|
|||
|
Cash, cash equivalents and restricted cash, end of period (Note 4)
|
$
|
115.1
|
|
$
|
124.7
|
|
|
|
Supplemental cash flow information:
|
|||||||
|
Interest paid in cash
|
$
|
—
|
|
$
|
0.4
|
|
|
|
Non-cash activities:
|
|||||||
|
Conversion of interest payable-in-kind to debt
|
$
|
—
|
|
$
|
0.7
|
|
|
|
Deferred financing costs included in accounts payable and accrued liabilities
|
$
|
(0.5
|
)
|
$
|
—
|
|
|
The accompanying notes are an integral part of these unaudited condensed consolidated financial statements.
6
CENTRUS ENERGY CORP.
CONDENSED
CONSOLIDATED STATEMENTS OF STOCKHOLDERS’ DEFICIT
(
Unaudited;
in millions, except per share data)
|
|
Preferred Stock,
Series B
|
Common Stock,
Class A,
Par Value
$.10 per Share
|
Common Stock,
Class B,
Par Value
$.10 per Share
|
Excess of
Capital Over
Par Value
|
Accumulated Deficit
|
Accumulated
Other Comprehensive Income (Loss)
|
Total
|
||||||||||||||||||||
|
Balance at December 31, 2018
|
$
|
4.6
|
|
$
|
0.8
|
|
$
|
0.1
|
|
$
|
61.2
|
|
$
|
(388.5
|
)
|
$
|
(0.1
|
)
|
$
|
(321.9
|
)
|
||||||
|
Net loss for the three months ended March 31, 2019
|
—
|
|
—
|
|
—
|
|
—
|
|
(20.9
|
)
|
—
|
|
(20.9
|
)
|
|||||||||||||
|
Issuance and amortization of restricted stock units and stock options
|
—
|
|
—
|
|
—
|
|
0.1
|
|
—
|
|
—
|
|
0.1
|
|
|||||||||||||
|
Balance at March 31, 2019
|
4.6
|
|
0.8
|
|
0.1
|
|
61.3
|
|
(409.4
|
)
|
(0.1
|
)
|
(342.7
|
)
|
|||||||||||||
|
Balance at December 31, 2019
|
$
|
4.6
|
|
$
|
0.8
|
|
$
|
0.1
|
|
$
|
61.5
|
|
$
|
(405.0
|
)
|
$
|
1.1
|
|
$
|
(336.9
|
)
|
||||||
|
Net income for the three months ended March 31, 2020
|
—
|
|
—
|
|
—
|
|
—
|
|
11.3
|
|
—
|
|
11.3
|
|
|||||||||||||
|
Issuance and amortization of restricted stock units and stock options
|
—
|
|
—
|
|
—
|
|
0.3
|
|
—
|
|
(0.1
|
)
|
0.2
|
|
|||||||||||||
|
Balance at March 31, 2020
|
4.6
|
|
0.8
|
|
0.1
|
|
61.8
|
|
(393.7
|
)
|
1.0
|
|
$
|
(325.4
|
)
|
||||||||||||
The accompanying notes are an integral part of these unaudited condensed consolidated financial statements.
7
CENTRUS ENERGY CORP.
NOTES TO CONDENSED CONSOLIDATED FINANCIAL STATEMENTS
1. BASIS OF PRESENTATION
Basis of Presentation and Principles of Consolidation
The unaudited condensed consolidated financial statements of Centrus Energy Corp. (“Centrus” or the “Company”), which include the accounts of the Company, its principal subsidiary, United States Enrichment Corporation, and its other subsidiaries, as of
March 31, 2020
, and for the three months ended
March 31, 2020
and 2019, have been prepared pursuant to the rules and regulations of the Securities and Exchange Commission (“SEC”). The condensed consolidated balance sheet as of December 31, 2019, was derived from audited consolidated financial statements, but does not include all disclosures required by generally accepted accounting principles in the United States (“GAAP”). In the opinion of management, the unaudited condensed consolidated financial statements reflect all adjustments, including normal recurring adjustments, necessary for a fair statement of the financial results for the interim period. Certain prior year amounts have been reclassified for consistency with the current year presentation. Certain information and notes normally included in financial statements prepared in accordance with GAAP have been omitted pursuant to such rules and regulations. All material intercompany transactions have been eliminated. The Company’s components of comprehensive income for the three months ended
March 31, 2020
and 2019 are insignificant.
Operating results for the three months ended
March 31, 2020
, are not necessarily indicative of the results that may be expected for the year ending December 31, 2020. The unaudited condensed consolidated financial statements should be read in conjunction with the consolidated financial statements and related notes and
Management's Discussion and Analysis of Financial Condition and Results of Operations
included in the Annual Report on Form 10-K for the year ended December 31, 2019.
New Accounting Standards
Recently Adopted Accounting Standards
In June 2016, the Financial Accounting Standard Board (“FASB”) issued Accounting Standards Update (“ASU”) 2016-13,
Measurement of Credit Losses on Financial Instruments
, which requires estimating all expected credit losses for certain types of financial instruments, including trade receivables, held at the reporting date based on historical experience, current conditions and reasonable and supportable forecasts. ASU 2016-13 is effective for fiscal years beginning after December 15, 2019, including interim periods within those fiscal years. The Company adopted this standard in the first quarter of fiscal 2020 and there was no material impact.
Accounting Standards Effective in Future Periods
In August 2018, the FASB issued ASU 2018-14,
Compensation - Retirement Benefits - Defined Benefit Plans - General (Subtopic 715-20),
which modifies the disclosure requirements for employers that sponsor defined benefit pension plans and other postretirement plans. ASU 2018-14 is effective for public companies for fiscal years, and interim periods within those fiscal years, beginning after December 15, 2020. The standard is to be applied on a retrospective basis to all periods presented and early adoption is permitted. The Company is evaluating the effect that the provisions of ASU 2018-14 will have on its consolidated financial statements.
Significant Accounting Policies
The accounting policies of the Company are set forth in Note 1 to the Consolidated Financial Statements contained in the Company’s Annual Report on Form 10-K for the year ended December 31, 2019.
8
2. REVENUE AND CONTRACTS WITH CUSTOMERS
Disaggregation of Revenue
The following table presents revenue from separative work units (“SWU”) and uranium sales disaggregated by geographical region based on the billing addresses of customers (in millions):
|
Three Months Ended
March 31, |
|||||||
|
2020
|
2019
|
||||||
|
United States
|
$
|
7.3
|
|
$
|
35.1
|
|
|
|
Foreign
|
23.4
|
|
—
|
|
|||
|
Revenue - SWU and uranium
|
$
|
30.7
|
|
$
|
35.1
|
|
|
Refer to
Note 12, Segment Information,
for disaggregation of revenue by segment. Disaggregation by end-market is provided in Note 12 and the condensed consolidated statements of operations. SWU sales are made primarily to electric utility customers and uranium sales are primarily made to other nuclear fuel related companies. Technical solutions revenue resulted primarily from services provided to the government and its contractors. SWU and uranium revenue is recognized at point of sale and technical solutions revenue is generally recognized over time.
Accounts Receivable
|
March 31, 2020
|
December 31,
2019
|
|||||||
|
($ millions)
|
||||||||
|
Accounts receivable:
|
||||||||
|
Billed
|
$
|
7.5
|
|
$
|
13.2
|
|
||
|
Unbilled *
|
10.0
|
|
7.9
|
|
||||
|
Accounts receivable
|
$
|
17.5
|
|
$
|
21.1
|
|
||
|
* Billings under certain contracts in the technical services segment are invoiced based on approved provisional billing rates. Unbilled revenue represents the difference between actual costs incurred and invoiced amounts. The Company expects to invoice and collect the unbilled amounts after actual rates are submitted to the customer and approved. Unbilled revenue also includes unconditional rights to revenue that are not yet billable under applicable contracts pending the compilation of supporting documentation.
|
||||||||
Contract Liabilities
The following table presents changes in contract liability balances (in millions):
|
March 31,
2020
|
December 31, 2019
|
Year-To-Date Change
|
||||||||||
|
Accrued loss on HALEU Contract:
|
||||||||||||
|
Current -
Accounts payable and accrued liabilities
|
$
|
9.7
|
|
$
|
10.0
|
|
$
|
(0.3
|
)
|
|||
|
Noncurrent -
Other long-term liabilities
|
$
|
5.6
|
|
$
|
8.3
|
|
$
|
(2.7
|
)
|
|||
|
Deferred revenue - current
|
$
|
243.0
|
|
$
|
243.0
|
|
$
|
—
|
|
|||
|
Advances from customers - current
|
$
|
—
|
|
$
|
23.3
|
|
$
|
(23.3
|
)
|
|||
|
Advances from customers - noncurrent
|
$
|
29.4
|
|
$
|
29.4
|
|
$
|
—
|
|
|||
9
LEU Segment
The SWU component of LEU is typically bought and sold under long-term contracts with deliveries over several years. The Company’s agreements for natural uranium sales are generally shorter-term, fixed-commitment contracts. The Company’s order book of sales under contract in the low-enriched uranium (“LEU”) segment (“order book”) extends to 2030. As of March 31, 2020, and December 31, 2019, the order book was $1.0 billion. The order book represents the estimated aggregate dollar amount of revenue for future SWU and uranium deliveries under contract and includes $0.3 billion of
Deferred Revenue
and
Advances from Customers.
Refer to Contract Liabilities table above.
Most of
the Company’s
contracts provide for fixed purchases of SWU during a given year. T
he Company’s
order book is partially based on customers’ estimates of the timing and size of their fuel requirements and other assumptions that are subject to change. For example, depending on the terms of specific contracts, the customer may be able to increase or decrease the quantity delivered within an agreed range. T
he Company’s
order book estimate is also based on
the Company’s
estimates of selling prices, which may be subject to change. For example, depending on the terms of specific contracts, prices may be adjusted based on escalation using a general inflation index, published SWU price indicators prevailing at the time of delivery, and other factors, all of which are variable. T
he Company
uses external composite forecasts of future market prices and inflation rates in its pricing estimates.
Under the terms of certain contracts with customers in the LEU segment, the Company will accept payment in the form of uranium. Revenue from the sale of SWU under such contracts is recognized at the time LEU is delivered and is based on the fair value of the uranium at contract inception, or as the quantity of uranium is finalized, if variable. In the three months ended March 31, 2020, SWU revenue of
$23.4 million
was recognized under such contracts based on the fair market value of uranium acquired in exchange for SWU delivered. Uranium received from customers as advance payments for the future sales of SWU totaled
$29.4 million
as of March 31, 2020. The advance payments are included in
Advances from Customers, Noncurrent,
based on the anticipated SWU sales period.
In the three months ended March 31, 2020, the Company borrowed SWU inventory valued at $1.7 million from a customer under terms that require repayment within 48 months. The Company recorded the SWU and the related liability for the borrowing using an average purchase price over the borrowing period. The cumulative liability to the customer of
$10.8 million
for borrowed inventory is included in
Other Liabilities,
which is included in noncurrent liabilities.
Technical Solutions Segment
Revenue for the technical solutions segment, representing the Company’s technical, manufacturing, engineering, procurement, construction and operations services offered to public and private sector customers, is recognized over the contractual period as services are rendered.
On October 31, 2019, the Company signed a three-year cost-share contract with the U.S. Department of Energy (“DOE”) (“the HALEU Contract”) to deploy a cascade of centrifuges to demonstrate production of high-assay, low-enriched uranium (“HALEU”) for advanced reactors. HALEU is a component of an advanced nuclear reactor fuel that is not commercially available today and may be required for a number of advanced reactor and fuel designs currently under development in both the commercial and government sectors. The program has been under way since May 31, 2019, when the Company and DOE signed a preliminary letter agreement that allowed work to begin while the full contract was being finalized.
Under the HALEU Contract, DOE agreed to reimburse the Company for 80% of its costs incurred in performing the contract, up to a maximum of
$115 million
. The Company’s cost share is the corresponding 20% and any costs incurred above these amounts. Costs under the HALEU Contract include
program costs
, including direct labor and materials and associated indirect costs that are classified as
Cost of Sales
, and an allocation of corporate costs supporting the program that are classified as
Selling, General and Administrative Expenses
. Services to be provided
10
over the three-year contract include constructing and assembling centrifuge machines and related infrastructure in a cascade formation. When estimates of remaining program costs to be incurred for such an integrated, construction-type contract exceed estimates of total revenue to be earned, a provision for the remaining loss on the contract is recorded to
Cost of Sales
in the period the loss is determined. The Company’s corporate costs supporting the program are recognized as expense as incurred over the duration of the contract term. As of December 31, 2019, the portion of the Company’s anticipated cost share under the HALEU Contract representing the Company’s share of remaining projected program costs was recognized in
Cost of Sales
as an accrued loss of
$18.3 million
. The accrued loss on the contract is being adjusted over the remaining contract term based on actual results and remaining program cost projections. As of March 31, 2020, the accrued contract loss balance was
$15.3 million
, consisting of $9.7 million included in
Accounts Payable and Accrued Liabilities
and $5.6 million included in
Other Long-Term Liabilities
. Cost of sales in the three months ended March 31, 2020 was reduced by $3.0 million for previously accrued contract losses attributable to work performed in the first quarter of 2020.
The HALEU Contract is incrementally funded and DOE is currently obligated for costs up to approximately
$53.2 million
of the $115 million. The Company has received aggregate cash payments of
$19.0 million
through March 31, 2020.
Centrus and DOE have yet to fully settle the Company’s claims for reimbursements for certain pension and postretirement benefits costs related to past contract work performed for DOE. There is the potential for additional income to be recognized for this work pending the outcome of legal proceedings related to the Company’s claims for payment and the potential release of previously established valuation allowances on receivables. As a result of the application of fresh start accounting following the Company’s emergence from Chapter 11 bankruptcy on September 30, 2014, the receivables related to the Company’s claims for payment are carried at fair value as of September 30, 2014, which is net of the valuation allowances. Refer to
Note 11, Commitments and Contingencies
.
3. SPECIAL CHARGES (CREDITS)
Special charges (credits) in both the three months ended March 31, 2020 and 2019 consisted of income of
$0.1 million
for the reversal of accrued termination benefits related to unvested employee departures.
The remaining balance of termination benefits of
$0.2 million
is expected to be paid within twelve months and is classified in
Accounts Payable and Accrued Liabilities
in the condensed consolidated balance sheet.
A summary of termination benefit activity an
d the accrued liability follows (in millions):
|
Liability
December 31,
2019
|
Three Months Ended
March 31, 2020 |
Liability
March 31,
2020
|
||||||||||||||
|
Charges (Credits) for Termination Benefits
|
Paid/
Settled
|
|||||||||||||||
|
Workforce reductions:
|
||||||||||||||||
|
Corporate functions
|
$
|
1.2
|
|
$
|
(0.1
|
)
|
$
|
(1.1
|
)
|
$
|
—
|
|
||||
|
Piketon facility
|
0.2
|
|
—
|
|
—
|
|
0.2
|
|
||||||||
|
Total
|
$
|
1.4
|
|
$
|
(0.1
|
)
|
$
|
(1.1
|
)
|
$
|
0.2
|
|
||||
11
4. CASH, CASH EQUIVALENTS AND RESTRICTED CASH
The following table summarizes the Company’s cash, cash equivalents and restricted cash as presented on the condensed consolidated balance sheet to amounts on the condensed consolidated statement of cash flows (in millions):
|
March 31,
2020
|
December 31, 2019
|
||||||
|
Cash and cash equivalents
|
$
|
109.2
|
|
$
|
130.7
|
|
|
|
Deposits for financial assurance - current
|
0.2
|
|
0.2
|
|
|||
|
Deposits for financial assurance - noncurrent
|
5.7
|
|
5.7
|
|
|||
|
Total cash, cash equivalents and restricted cash
|
$
|
115.1
|
|
$
|
136.6
|
|
|
The Company has provided financial assurance to states in which it was previously self-insured for workers’ compensation in accordance with each state’s requirements in the form of a surety bond or deposit that are fully cash collateralized by Centrus. As each state determines that the likelihood of further workers’ compensation obligations related to the period of self-insurance is reduced, the surety bond or deposit are subject to reduction and/or cancellation and the Company would receive the cash collateral.
5. INVENTORIES
Centrus holds uranium at licensed locations in the form of natural uranium and as the uranium component of LEU. Centrus also holds SWU as the SWU component of LEU at licensed locations (e.g., fabricators) to meet book transfer requests by customers. Fabricators process LEU into fuel for use in nuclear reactors. Components of inventories are as follows (in millions):
|
|
March 31, 2020
|
December 31, 2019
|
|||||||||||||||||||||
|
|
Current
Assets
|
Current
Liabilities
(a)
|
Inventories, Net
|
Current
Assets
|
Current
Liabilities
(a)
|
Inventories, Net
|
|||||||||||||||||
|
Separative work units
|
$
|
9.2
|
|
$
|
2.8
|
|
$
|
6.4
|
|
$
|
7.8
|
|
$
|
—
|
|
$
|
7.8
|
|
|||||
|
Uranium
|
58.7
|
|
4.6
|
|
54.1
|
|
56.7
|
|
5.6
|
|
51.1
|
|
|||||||||||
|
Total
|
$
|
67.9
|
|
$
|
7.4
|
|
$
|
60.5
|
|
$
|
64.5
|
|
$
|
5.6
|
|
$
|
58.9
|
|
|||||
|
(a)
|
Inventories owed to customers and suppliers, included in current liabilities, include SWU and uranium inventories owed to fabricators.
|
12
6. INTANGIBLE ASSETS
Intangible assets originated from the Company’s reorganization and application of fresh start accounting as of the date the Company emerged from bankruptcy, September 30, 2014, and reflect the conditions at that time. The intangible asset related to the sales order book is amortized as the order book existing at emergence is reduced, principally as a result of deliveries to customers. The intangible asset related to customer relationships is amortized using the straight-line method over the estimated average useful life of
15
years. Amortization expense is presented below gross profit on the consolidated statements of operations. Intangible asset balances are as follows (in millions):
|
March 31, 2020
|
December 31, 2019
|
||||||||||||||||||||||
|
Gross Carrying Amount
|
Accumulated Amortization
|
Net Amount
|
Gross Carrying Amount
|
Accumulated Amortization
|
Net Amount
|
||||||||||||||||||
|
Sales order book
|
$
|
54.6
|
|
$
|
30.1
|
|
$
|
24.5
|
|
$
|
54.6
|
|
$
|
29.9
|
|
$
|
24.7
|
|
|||||
|
Customer relationships
|
68.9
|
|
25.3
|
|
43.6
|
|
68.9
|
|
24.1
|
|
44.8
|
|
|||||||||||
|
Total
|
$
|
123.5
|
|
$
|
55.4
|
|
$
|
68.1
|
|
$
|
123.5
|
|
$
|
54.0
|
|
$
|
69.5
|
|
|||||
7. DEBT
A summary of debt is as follows (in millions):
|
March 31, 2020
|
December 31, 2019
|
||||||||||||||||
|
Maturity
|
Current
|
Long-Term
|
Current
|
Long-Term
|
|||||||||||||
|
8.25% Notes:
|
Feb. 2027
|
||||||||||||||||
|
Principal
|
$
|
—
|
|
$
|
74.3
|
|
$
|
—
|
|
$
|
74.3
|
|
|||||
|
Interest
|
6.1
|
|
36.7
|
|
6.1
|
|
39.8
|
|
|||||||||
|
Total
|
$
|
6.1
|
|
$
|
111.0
|
|
$
|
6.1
|
|
$
|
114.1
|
|
|||||
Interest on the
8.25%
Notes is payable semi-annually in arrears as of February 28 and August 31 based on a 360-day year consisting of twelve 30-day months. The 8.25% Notes mature on February 28, 2027. As shown in the table above, all future interest payment obligations on the 8.25% Notes are included in the carrying value of the 8.25% Notes. As a result, the Company’s reported interest expense will be less than its contractual interest payments throughout the term of the 8.25% Notes. As of March 31, 2020, and December 31, 2019,
$6.1 million
of interest is recorded as current and classified as
Current Debt
in the condensed consolidated balance sheet. Additional terms and conditions of the 8.25% Notes are described in
Note 9, Debt
, of the consolidated financial statements in the Company’s Annual Report on Form 10-K for the year ended December 31, 2019.
13
8. FAIR VALUE
Fair value is the price that would be received from selling an asset or paid to transfer a liability in an orderly transaction between market participants at the measurement date. When determining the fair value of assets and liabilities, the following hierarchy is used in selecting inputs, with the highest priority given to Level 1, as these are the most transparent or reliable:
|
•
|
Level 1 – quoted prices for identical instruments in active markets.
|
|
•
|
Level 2 – quoted prices for similar instruments in active markets; quoted prices for identical or similar instruments in markets that are not active; and model-derived valuations in which all significant inputs are observable in active markets.
|
|
•
|
Level 3 – valuations derived using one or more significant inputs that are not observable.
|
Financial Instruments Recorded at Fair Value (in millions):
|
March 31, 2020
|
December 31, 2019
|
||||||||||||||||||||||||||||||
|
|
Level 1
|
Level 2
|
Level 3
|
Total
|
Level 1
|
Level 2
|
Level 3
|
Total
|
|||||||||||||||||||||||
|
Assets:
|
|
|
|
|
|
|
|
|
|||||||||||||||||||||||
|
Cash and cash equivalents
|
$
|
109.2
|
|
$
|
—
|
|
$
|
—
|
|
$
|
109.2
|
|
$
|
130.7
|
|
$
|
—
|
|
$
|
—
|
|
$
|
130.7
|
|
|||||||
|
Deferred compensation asset (a)
|
1.5
|
|
—
|
|
—
|
|
1.5
|
|
1.8
|
|
—
|
|
—
|
|
1.8
|
|
|||||||||||||||
|
Liabilities:
|
|
|
|
|
|
|
|
|
|
|
|
|
|||||||||||||||||||
|
Deferred compensation obligation (a)
|
$
|
1.5
|
|
$
|
—
|
|
$
|
—
|
|
$
|
1.5
|
|
$
|
1.8
|
|
$
|
—
|
|
$
|
—
|
|
$
|
1.8
|
|
|||||||
|
(a)
|
The deferred compensation obligation represents the balance of deferred compensation plus net investment earnings. The deferred compensation plan is funded through a rabbi trust. Trust funds are invested in mutual funds for which unit prices are quoted in active markets and are classified within Level 1 of the valuation hierarchy.
|
There were no transfers between Level 1, 2 or 3 during the periods presented.
Other Financial Instruments
As of
March 31, 2020
, and
December 31, 2019
, the balance sheet carrying amounts for
Accounts Receivable
,
Accounts Payable and Accrued Liabilities
(excluding the deferred compensation obligation described above), and
Payables under SWU Purchase Agreements
approximate fair value because of their short-term nature.
The carrying value and estimated fair value of long-term debt are as follows (in millions):
|
March 31, 2020
|
December 31, 2019
|
||||||||||||||
|
Carrying Value
|
Estimated Fair Value
(a)
|
Carrying Value
|
Estimated Fair Value
(a)
|
||||||||||||
|
8.25% Notes
|
$
|
117.1
|
|
(b)
|
$
|
54.7
|
|
$
|
120.2
|
|
(b)
|
$
|
61.5
|
|
|
(a)
Based on recent trading prices and bid/ask quotes as of or near the balance sheet date, which are considered Level 2 inputs based on the frequency of trading.
|
(b)
|
The carrying value of the 8.25% Notes consists of the principal balance of
$74.3 million
and the sum of current and noncurrent interest payment obligations until maturity. Refer to
Note 7, Debt
.
|
14
9. PENSION AND POSTRETIREMENT HEALTH AND LIFE BENEFITS
The components of net periodic benefit (credits) for the defined benefit pension plans were as follows (in millions):
|
Three Months Ended
March 31, |
|||||||
|
2020
|
2019
|
||||||
|
Service costs
|
$
|
0.9
|
|
$
|
0.8
|
|
|
|
Interest costs
|
6.1
|
|
7.6
|
|
|||
|
Amortization of prior service costs (credits), net
|
(0.1
|
)
|
—
|
|
|||
|
Expected return on plan assets (gains)
|
(9.4
|
)
|
(9.1
|
)
|
|||
|
Net periodic benefit (credits)
|
$
|
(2.5
|
)
|
$
|
(0.7
|
)
|
|
The components of net periodic benefit costs for the postretirement health and life benefit plans were as follows (in millions):
|
Three Months Ended
March 31, |
|||||||
|
2020
|
2019
|
||||||
|
Interest costs
|
$
|
1.2
|
|
$
|
1.5
|
|
|
|
Net periodic benefit costs
|
$
|
1.2
|
|
$
|
1.5
|
|
|
The Company reports service costs for its defined benefit pension plans and its postretirement health and life benefit plans in
Cost of Sales
and
Selling, General and Administrative Expenses
. The remaining components of net periodic benefit (credits) costs are reported as
Nonoperating Components of Net Periodic Benefit Expense (Income).
15
10. NET INCOME (LOSS) PER COMMON SHARE
Basic net income (loss) per common share is calculated by dividing income (loss) allocable to common stockholders by the weighted average number of shares of common stock outstanding during the period. In calculating diluted net income (loss) per common share, the number of shares is increased by the weighted average number of potential shares related to stock compensation awards. No dilutive effect is recognized in a period in which a net loss has occurred. The weighted average number of common and common equivalent shares used in the calculation of basic and diluted income (loss) per common share are as follows:
|
|
Three Months Ended
March 31, |
||||||
|
2020
|
2019
|
||||||
|
Numerator (in millions):
|
|||||||
|
Net income (loss)
|
$
|
11.3
|
|
$
|
(20.9
|
)
|
|
|
Preferred stock dividends - undeclared and cumulative
|
2.0
|
|
2.0
|
|
|||
|
Net income (loss) allocable to common stockholders
|
$
|
9.3
|
|
$
|
(22.9
|
)
|
|
|
Denominator (in thousands):
|
|||||||
|
Average common shares outstanding - basic
|
9,619
|
|
9,532
|
|
|||
|
Potentially dilutive shares related to stock options and restricted stock units
(a)
|
220
|
|
—
|
|
|||
|
Average common shares outstanding - diluted
|
9,839
|
|
9,532
|
|
|||
|
Net income (loss) per common share (in dollars):
|
|
|
|
|
|||
|
Basic
|
$
|
0.97
|
|
$
|
(2.40
|
)
|
|
|
Diluted
|
$
|
0.95
|
|
$
|
(2.40
|
)
|
|
|
(a) Common stock equivalents excluded from the diluted calculation as a result of a net loss in the period (in thousands)
|
—
|
|
41
|
|
|||
|
Options outstanding and considered anti-dilutive as their exercise price exceeded the average share market price (in thousands)
|
—
|
|
360
|
|
|||
16
11. COMMITMENTS AND CONTINGENCIES
Commitments under SWU Purchase Agreements
TENEX
A major supplier of SWU to the Company is the Russian government entity TENEX, Joint-Stock Company (“TENEX”). Under a 2011 agreement with TENEX, as amended, (the “Russian Supply Agreement”), the Company purchases SWU contained in LEU received from TENEX, and the Company delivers natural uranium to TENEX for the LEU’s uranium component. The LEU that the Company obtains from TENEX under the agreement is subject to quotas and other restrictions applicable to commercial Russian LEU.
The Russian Supply Agreement was originally signed with commitments through 2022 but was modified in 2015 to give the Company the right to reschedule certain quantities of SWU of the original commitments into the period 2023 and beyond, in return for the purchase of additional SWU in those years. The Company has exercised this right to reschedule in each year through December 31, 2019. If the Company exercises this right to reschedule in full during the remaining years of the contract’s original term, the Company will have a rescheduled post-2022 purchase commitment through 2028.
The Russian Supply Agreement provides that the Company must pay for all SWU in its minimum purchase obligation each year, even if it fails to submit orders for such SWU. In such a case, the Company would pay for the SWU but have to take the unordered SWU in the following year.
Pricing terms for SWU under the Russian Supply Agreement are based on a combination of market-related price points and other factors. This formula was subject to an adjustment at the end of 2018 that reduced the unit costs of SWU under this contract in 2019 and for the duration of the contract.
Orano
On April 27, 2018, the Company entered into an agreement (the “Orano Supply Agreement”) with Orano Cycle (“Orano”) for the long-term supply to the Company of SWU contained in LEU, nominally commencing in 2023. Under the Orano Supply Agreement, the Company purchases SWU contained in LEU received from Orano, and the Company delivers natural uranium to Orano for the natural uranium feed material component of LEU. The Company may elect to defer the commencement of purchases until 2024 and has the option to extend the six-year purchase period for an additional two years. The Orano Supply Agreement provides significant flexibility to adjust purchase volumes, subject to annual minimums and maximums in fixed amounts that vary year by year. The pricing for the SWU purchased by the Company is determined by a formula that uses a combination of market-related price points and other factors and is subject to certain floors and ceilings. Prices are payable in a combination of U.S. dollars and euros.
Milestones Under the 2002 DOE-USEC Agreement
The Company and DOE signed an agreement dated June 17, 2002, as amended (the “2002 DOE-USEC Agreement”), pursuant to which the parties made long-term commitments directed at resolving issues related to the stability and security of the domestic uranium enrichment industry. DOE consented to the assumption by Centrus of the 2002 DOE-USEC Agreement and other agreements between the Company and DOE subject to an express reservation of all rights, remedies and defenses by DOE and the Company under those agreements. The 2002 DOE-USEC Agreement requires Centrus to develop, demonstrate and deploy advanced enrichment technology in accordance with milestones, including the deployment of a commercial American Centrifuge Plant, and provides for remedies in the event of a failure to meet a milestone under certain circumstances, including terminating the 2002 DOE-USEC Agreement, revoking Centrus’ access to DOE’s centrifuge technology that is required for the success of the Company’s ongoing work with the American Centrifuge technology, requiring Centrus to transfer certain rights in the American Centrifuge technology and facilities to DOE, and requiring Centrus to reimburse DOE for certain
17
costs associated with the American Centrifuge technology. The 2002 DOE-USEC Agreement provides that if a delaying event beyond the control and without the fault or negligence of Centrus occurs that could affect Centrus’ ability to meet the American Centrifuge Plant milestone under the 2002 DOE-USEC Agreement, DOE and the Company will jointly meet to discuss in good faith possible adjustments to the milestones as appropriate to accommodate the delaying event. The assumption of the 2002 DOE-USEC Agreement provided for in the plan of reorganization in the Company’s 2014 Chapter 11 bankruptcy (now completed) did not affect the ability of either party to assert all rights, remedies and defenses under the agreement and all such rights, remedies and defenses are specifically preserved and all-time limits tolled expressly including all rights, remedies and defenses and time limits relating to any missed milestones. DOE and the Company have agreed that all rights, remedies and defenses of the parties with respect to any missed milestones and all other matters under the 2002 DOE-USEC Agreement continue to be preserved, and that the time limits for each party to respond to any missed milestones continue to be tolled.
Legal Matters
From time to time, the Company is involved in various pending legal proceedings, including the pending legal proceedings described below.
On August 30, 2013, the Company submitted a claim to DOE under the Contract Disputes Act for payment of
$42.8 million
, representing DOE’s share of pension and postretirement benefits costs related to the transition of employees at the former Portsmouth, Ohio, Gaseous Diffusion Plant (the “Portsmouth GDP”) to DOE’s decontamination and decommissioning contractor. On August 27, 2014, the DOE contracting officer denied the Company’s claim. As a result, the Company filed an appeal of the decision in the U.S. Court of Federal Claims in January 2015. Centrus believes that DOE is responsible for a significant portion of any pension and postretirement benefit costs associated with the transition of employees at Portsmouth. The receivable for DOE’s share of pension and postretirement benefits costs has a full valuation allowance due to the lack of a resolution with DOE and uncertainty regarding the amounts owed and the timing of collection. While proceeding with litigation, the Company is still pursuing settlement.
On May 26, 2019, the Company, Enrichment Corp., and five other DOE contractors who have operated facilities at the Portsmouth GDP site (including, in the case of the Company, the American Centrifuge Plant site located on the premises) were named as defendants in a class action complaint filed by Ursula McGlone, Jason McGlone, Julia Dunham, and K.D. and C.D., minor children by and through their parent and natural guardian Julia Dunham (collectively, the “McGlone Plaintiffs”) in the U.S. District Court in the Southern District of Ohio, Eastern Division. The complaint seeks damages for alleged off-site contamination allegedly resulting from activities on the Portsmouth GDP site. The McGlone Plaintiffs are seeking to represent a class of (i) all current or former residents within a seven-mile radius of the Portsmouth GDP site and (ii) all students and their parents at the Zahn’s Corner Middle School from 1993-present. The Company believes that its operations at the Portsmouth GDP site were fully in compliance with the Nuclear Regulatory Commission’s regulations. Further, the Company believes that any such liability should be covered by indemnification under the Price-Anderson Nuclear Industries Indemnity Act (“Price-Anderson Act”). The Company and Enrichment Corp. have provided notifications to DOE required to invoke indemnification under the Price-Anderson Act and other contractual provisions.
On June 28, 2019, the Company, Enrichment Corp. and four other DOE contractors who have operated facilities at the Portsmouth GDP site were named as defendants in a class action complaint filed by Ray Pritchard and Sharon Melick (collectively, the “Pritchard Plaintiffs”) in the U.S. District Court in the Southern District of Ohio, Eastern Division. The complaint seeks damages for alleged off-site contamination allegedly resulting from activities on the Portsmouth GDP site. The Pritchard Plaintiffs are seeking to represent a class of all current or former residents within a seven-mile radius of the Portsmouth GDP site. The Company believes that its operations at the Portsmouth GDP site were fully in compliance with the Nuclear Regulatory Commission’s regulations. Further, the Company believes that any such liability should be covered by indemnification under the Price-Anderson Act. The Company and Enrichment Corp. have provided notifications to DOE required to invoke indemnification under the Price-Anderson Act and other contractual provisions.
18
On November 27, 2019, the Company, Enrichment Corp. and six other DOE contractors who have operated facilities at the Portsmouth GDP site were named as defendants in a class action complaint filed by James Matthews, Jennifer Brownfield Clark, Joanne Ross, the Estate of A.R., and others similarly situated (the “Matthews Plaintiffs”), in the Common Pleas Court of Pike County, Ohio. The complaint seeks injunctive relief, compensatory damages, statutory damages, and any other relief allowed by law for alleged off-site contamination allegedly resulting from activities on the Portsmouth GDP site. The Matthews Plaintiffs expressly contend that the ongoing and continuous releases that injured the Plaintiffs and Class Members are not “nuclear incidents” as that term is defined in the Price-Anderson Act, but rather “freestanding state law claims concerning traditional-style state regulation.” The Company believes that its operations at the Portsmouth GDP site were fully in compliance with the Nuclear Regulatory Commission’s regulations. Further, the Company believes that any such liability should be covered by indemnification under the Price-Anderson Act. The Company and Enrichment Corp. have provided notifications to DOE required to invoke indemnification under the Price-Anderson Act and other contractual provisions.
On October 11, 2018, the Company’s subsidiaries, Enrichment Corp. and American Centrifuge Enrichment, LLC (“ACE”, together with Enrichment Corp., the “Company Subsidiaries”) filed proofs of claim in the U.S. Bankruptcy Court for the Northern District of Ohio (the “Bankruptcy Court”) against each of FirstEnergy Nuclear Operating Company (“FENOC”), FirstEnergy Nuclear Generation, LLC (“FENG,” and together with FENOC, the “FirstEnergy Contract Parties”), FirstEnergy Solutions Corp. (“FES”) and FirstEnergy Generation, LLC (“FG”). The claims relate to damages arising from the rejection and breach of a long-term contract between the Company Subsidiaries and the FirstEnergy Contract Parties that was approved by the Bankruptcy Court and made effective as of July 26, 2018. The proofs of claim filed by the Company Subsidiaries include claims against the FirstEnergy Contract Parties based on their liability as parties to the contract that was rejected and breached. The proofs of claim filed by the Company Subsidiaries also included claims against FES and FG based on their liability under guaranties they issued that may obligate FES and FG to satisfy the rejection and breach of contract damages claims.
On November 15, 2019, FENOC, FENG, FES and FG filed objections to the Company Subsidiaries’ claims in the Bankruptcy Court. No decision on the claims against FENOC and FENG has yet been reached by the Bankruptcy Court. The Company Subsidiaries and FES and FG submitted cross motions for summary judgment on the issue of whether the guaranties of FES and FG apply. On March 13, 2020, the Bankruptcy Court ruled in favor of FES and FG on their motion, finding that the guaranties did not apply to the Company Subsidiaries’ claims. The Company Subsidiaries have filed a notice of appeal of this decision. The ruling does not apply to the Company Subsidiaries’ claims against the FirstEnergy Contract Parties.
Centrus is subject to various legal proceedings and claims, either asserted or unasserted, which arise in the ordinary course of business. While the outcome of these claims cannot be predicted with certainty, other than the above, Centrus does not believe that the outcome of any of these legal matters, individually and in the aggregate, will have a material adverse effect on its cash flows, results of operations or consolidated financial condition.
19
12. SEGMENT INFORMATION
Gross profit is Centrus’ measure for segment reporting. There were no intersegment sales in the periods presented. Refer to
Note 2, Revenue and Contracts with Customers,
for additional details on revenue for each segment. The following table presents the Company’s segment information (in millions):
|
|
Three Months Ended
March 31, |
||||||
|
2020
|
2019
|
||||||
|
Revenue
|
|||||||
|
LEU segment:
|
|||||||
|
Separative work units
|
$
|
30.7
|
|
$
|
12.4
|
|
|
|
Uranium
|
—
|
|
22.7
|
|
|||
|
Total
|
30.7
|
|
35.1
|
|
|||
|
Technical solutions segment
|
14.3
|
|
3.6
|
|
|||
|
Total revenue
|
$
|
45.0
|
|
$
|
38.7
|
|
|
|
Segment Gross Profit (Loss)
|
|||||||
|
LEU segment
|
$
|
17.4
|
|
$
|
(3.2
|
)
|
|
|
Technical solutions segment
|
2.2
|
|
(2.3
|
)
|
|||
|
Gross profit (loss)
|
$
|
19.6
|
|
$
|
(5.5
|
)
|
|
Revenue from Major Customers (10% or More of Total Revenue)
In the three months ended
March 31, 2020
, two customers in the LEU segment represented
$23.4 million
and
$7.3 million
, respectively, of revenue and one customer in the technical solutions segment represented
$9.7 million
of revenue.
In the three months ended
March 31, 2019
, one customer in the LEU segment represented
$35.0 million
of revenue.
20
Item 2.
Management’s Discussion and Analysis of Financial Condition and Results of Operations
The following discussion should be read in conjunction with, and is qualified in its entirety by reference to, the unaudited condensed consolidated financial statements and related notes appearing elsewhere in this report.
This discussion contains forward-looking statements that involve risks and uncertainties. Actual results could differ significantly from the results discussed in the forward-looking statements particularly in light of the economic, social and market uncertainty created by the COVID-19 pandemic. See “Forward-Looking Statements” at the beginning of this Quarterly Report on Form 10-Q.
Overview
Centrus Energy Corp., a Delaware corporation (“Centrus” or the “Company”), is a trusted supplier of nuclear fuel and services for the nuclear power industry. References to “Centrus”, the “Company”, “our”, or “we” include Centrus Energy Corp. and its wholly owned subsidiaries as well as the predecessor to Centrus, unless the context otherwise indicates.
Centrus operates two business segments: (a) low-enriched uranium (“LEU”), which supplies various components of nuclear fuel to utilities, and (b) technical solutions, which provides advanced engineering, design, and manufacturing services to government and private sector customers.
Our LEU segment provides most of the Company’s revenue and involves the sale of separative work units (“SWU”) and occasionally LEU to utilities operating commercial nuclear power plants. The company also sells natural uranium to other nuclear fuel related companies.
LEU is a critical component in the production of nuclear fuel for reactors that produce electricity. We supply LEU to both domestic and international utilities for use in nuclear reactors worldwide. We provide LEU from multiple sources including our inventory, medium- and long- term supply contracts and spot purchases. As a long-term supplier of LEU to our customers, our objective is to provide value through the reliability and diversity of our supply sources. Our long-term goal is to resume commercial enrichment production, and we are exploring approaches to that end.
Our technical solutions segment utilizes the unique technical expertise, operational experience and specialized facilities that we developed over nearly two decades as part of our uranium enrichment technology program. We are leveraging these capabilities to expand and diversify our business beyond uranium enrichment, offering new services to existing and new customers in complementary markets.
With the specialized capabilities and workforce at our Technology and Manufacturing Center in Oak Ridge, Tennessee, we are performing technical, engineering and manufacturing services for a range of commercial and government customers and actively working to secure new customers. Our experience developing, licensing, manufacturing and operating advanced nuclear components and systems positions us to provide critical design, engineering, manufacturing and other services to a broad range of potential clients, including those involving sensitive or classified technologies. This work includes design, engineering, manufacturing and licensing services support for advanced reactor and fuel fabrication projects as well as decontamination and decommissioning (“D&D”) work.
With several decades of experience in enrichment, we continue to be a leader in the development of an advanced U.S. uranium enrichment technology, which we believe could play a critical role in supplying fuel for advanced reactors, meeting U.S. national and energy security needs, and achieving our nation’s nonproliferation objectives.
21
In April 2020, Centrus signed a nonbinding Letter of Intent with Advanced Reactor Concepts (“ARC”), reflecting the parties’ long-term commitment to enter into a purchase agreement that would enable Centrus to supply commercial high-assay, low-enriched uranium (“HALEU”) fuel that ARC needs to deploy its reactor technology in the late 2020s. In other recent developments, DOE released the Nuclear Fuel Working Group report, which called for “immediate action to support domestic uranium miners and restore the viability of the entire front-end of the nuclear fuel cycle”.
In October 2019, we signed a three-year cost-share contract (the “HALEU Contract”) with DOE to deploy a cascade of centrifuges to demonstrate production of HALEU fuel with existing United States origin enrichment technology and provide DOE with HALEU for near term use in its research and development for the advancement of civilian nuclear energy and national security, as well as other programmatic missions. The program has been under way since May 31, 2019, when the Company and DOE signed a preliminary agreement that allowed work to begin while the HALEU Contract was being finalized.
Under the HALEU Contract, DOE agreed to reimburse the Company for 80% of its costs incurred in performing the contract, up to a maximum of $115 million. The Company’s cost share is the corresponding 20% and any costs incurred above these amounts. Services to be provided over the three-year contract include constructing and assembling centrifuge machines and related infrastructure in a cascade formation. When estimates of remaining program costs to be incurred for such an integrated, construction-type contract exceed estimates of total revenue to be earned, a provision for the remaining loss on the contract is recorded. A loss provision of $18.3 million was recognized in the fourth quarter of 2019. The accrued loss on the contract is being adjusted over the remaining contract term based on actual results and remaining program cost projections. As of March 31, 2020, the accrued contract loss balance was $15.3 million, and
Cost of Sales
in the three months ended March 31, 2020 was reduced by $3.0 million for previously accrued contract losses attributable to work performed in the first quarter of 2020. Refer to “
Technical Solutions - Government Contracting
” below for additional details. The HALEU Contract is incrementally funded and DOE is currently obligated for costs up to approximately $53.2 million of the $115 million. The Company has received aggregate cash payments of $19.0 million through March 31, 2020.
HALEU is a component of an advanced nuclear reactor fuel that is not commercially available today and may be required for a number of advanced reactor and fuel designs currently under development in both the commercial and government sectors. Existing reactors typically operate on LEU with the uranium-235 isotope concentration below 5%. HALEU has a uranium-235 concentration ranging from 5% to 20%, giving it several potential technical and economic advantages. For example, the higher concentration of uranium-235 means that fuel assemblies and reactors can be smaller and reactors will require less frequent refueling. Reactors can also achieve higher “burnup” rates, meaning a smaller volume of fuel will be required overall and less waste will be produced. HALEU may also be used in the future to fabricate next-generation fuel forms for the existing fleet of reactors in the United States and around the world. These new HALEU-based fuels could improve the economics of nuclear reactors and inherent safety features while increasing the amount of electricity that can be generated at existing reactors. HALEU fuel may also ultimately be used in new commercial and government applications in the future, such as reactors for the military.
We believe our investment in the HALEU technology will position the Company to meet the needs of our customers in the future as they deploy advanced reactors and next generation fuels. By investing in HALEU technology now, and as the only domestically-owned company with HALEU enrichment capability, we believe the Company could be well positioned to capitalize on a potential new market as the demand for HALEU-based fuels increases with the development of advanced reactors. There are no guarantees about whether or when government or commercial demand for HALEU will materialize, and there are a number of technical, regulatory and economic hurdles that must be overcome for these fuels and reactors to come to the market.
22
The nuclear industry in general, and the nuclear fuel industry in particular, is in a period of significant change, which continues to affect the competitive landscape. In the years following the 2011 Fukushima accident, the published market prices for uranium enrichment declined more than 75% through mid-2018. While the monthly price indicators have since gradually started to increase, the uranium enrichment segment of the nuclear fuel market remains oversupplied, including because foreign-owned enrichers continued to expand even as demand fell, and faces uncertainty about future demand for nuclear power generation. Changes in the competitive landscape affect pricing trends, change customer spending patterns, and create uncertainty. To address these changes, we have taken steps to adjust our cost structure; we may seek further adjustments to our cost structure and operations and evaluate opportunities to grow our business organically or through acquisitions and other strategic transactions.
We are also actively considering, and expect to consider from time to time in the future, potential strategic transactions, which could involve, without limitation, acquisitions and/or dispositions of businesses or assets, joint ventures or investments in businesses, products or technologies or changes to our capital structure. In connection with any such transaction, we may seek additional debt or equity financing, contribute or dispose of assets, assume additional indebtedness, or partner with other parties to consummate a transaction.
COVID-19 Update
On March 11, 2020, the World Health Organization declared the novel strain of coronavirus (COVID-19) a global pandemic and recommended containment and mitigation measures worldwide. The Company has taken actions to protect its workforce and to maintain critical operations. Travel, operational and other restrictions imposed by the U.S. and foreign governments may impact our ability to make future sales and may impact the ability of our suppliers, including our suppliers of low enriched uranium, to perform under their contracts. As of the date of this filing, our LEU segment operations have not been materially affected by the pandemic and we are working with our suppliers, fabricators and customers to monitor the situation closely.
Further, the governments of states and counties in which we operate have issued orders prohibiting holding gatherings and closing nonessential businesses. As a result, the Company has instituted measures such as expanded telework to protect our workforce, to comply with government orders, and to maintain critical operations. Not all work, however, can be performed remotely. Consequently, we have instituted limited operations for personnel working on the HALEU program to maintain critical systems and security. Further, the actions taken by government regulatory agencies to protect their workforce may impact our ability to obtain the necessary reviews and approvals to complete the project. At this time, other than the restrictions on a limited number of our employees, our technical solutions segment’s operations have not been significantly affected.
We are working closely with DOE and we are continuing to work to make progress while implementing measures to protect our workforce. To date, there has been minimal impact to our financial results; however, we cannot reasonably estimate the length or severity of this pandemic, or the extent to which the disruption may materially impact our consolidated financial position, consolidated results of operations, and consolidated cash flows in fiscal 2020 at this time.
For further discussion, refer to Part I, Item 1A,
Risk Factors - The effects of the COVID-19 pandemic could adversely affect our business, operations, financial condition and results of operations, and the extent to which the effects of the pandemic will impact our business, operations, financial condition and results of operations remains uncertain
, in our Annual Report on Form 10-K for the year ended December 31, 2019.
23
Quarterly Operating Results
Our revenues, operating results and cash flows can fluctuate significantly from quarter to quarter and year to year.
Operating results for the three months ended March 31, 2020, are not necessarily indicative of the results that may be expected for the year ending December 31, 2020. Our future operating results are subject to a number of uncertainties that could affect results either positively or negatively. Among the factors that could affect our results are:
|
•
|
Additional purchases or sales of SWU and uranium;
|
|
•
|
Conditions in the LEU and energy markets, including pricing, demand, operations, and regulations;
|
|
•
|
Timing of customer orders, related deliveries, and purchases of LEU or components;
|
|
•
|
Financial market conditions and other factors that may affect pension and benefit liabilities and the value of related assets;
|
|
•
|
The outcome of legal proceedings and other contingencies;
|
|
•
|
Potential use of cash for strategic or financial initiatives;
|
|
•
|
Actions taken by customers, including actions that might affect existing contracts;
|
|
•
|
Market, international trade and other conditions impacting Centrus’ customers and the industry; and
|
|
•
|
The length and severity of the COVID-19 pandemic and its impact on our operations.
|
Revenue
We have two reportable segments: the LEU segment and the technical solutions segment.
Revenue from our LEU segment is derived primarily from:
|
•
|
sales of the SWU component of LEU;
|
|
•
|
sales of both the SWU and uranium components of LEU; and
|
|
•
|
sales of natural uranium.
|
Our technical solutions segment reflects our technical, manufacturing, engineering and operations services offered to public and private sector customers, including engineering and testing activities as well as technical and resource support currently being performed by the Company. This includes the HALEU Contract and a variety of other contracts with public and private sector customers.
SWU and Uranium Sales
Revenue from our LEU segment accounted for approximately 81% of our total revenue in 2019. The majority of our customers are domestic and international utilities that operate nuclear power plants, with international sales constituting approximately one-third of revenue from our LEU segment in recent years. Our agreements with electric utilities are primarily long-term, fixed-commitment contracts under which our customers are obligated to purchase a specified quantity of the SWU component of LEU from us. Contracts where we sell both the SWU and uranium component of LEU to utilities or where we sell natural uranium to
other nuclear fuel related companies are generally shorter-term, fixed-commitment contracts.
Revenue is recognized at the time LEU or uranium is delivered under the terms of our contracts. The timing of customer deliveries is affected by, among other things, electricity markets, reactor operations, maintenance and refueling outages, and customer inventories. In the current market environment, some customers are building inventories and may choose to take deliveries under annual purchase obligations later in the year. Customer payments for the SWU component of LEU average roughly $10 million per order. As a result, a relatively small change in the timing of customer orders for LEU may cause significant variability in operating results.
24
Utility customers in general have the option to defer receipt of uranium products purchased from Centrus beyond the contractual sale period, resulting in the deferral of costs and revenue recognition. Refer to
Note 2, Revenue and Contracts with Customers,
in the condensed consolidated financial statements for further details.
Our financial performance over time can be significantly affected by changes in prices for SWU and uranium. Since 2011, market prices for SWU and uranium have significantly declined. Since our sales order book includes contracts awarded to us in previous years, the average SWU price billed to customers typically lags behind published price indicators by several years. While newer sales reflect the low prices prevalent in recent years, certain contracts included in our order book have sales prices that are significantly above current market prices.
The following chart summarizes long-term and spot SWU price indicators, and a spot price indicator for natural uranium hexafluoride (“UF6”), as published by TradeTech, LLC in
Nuclear Market Review
:
SWU and Uranium Market Price Indicators*
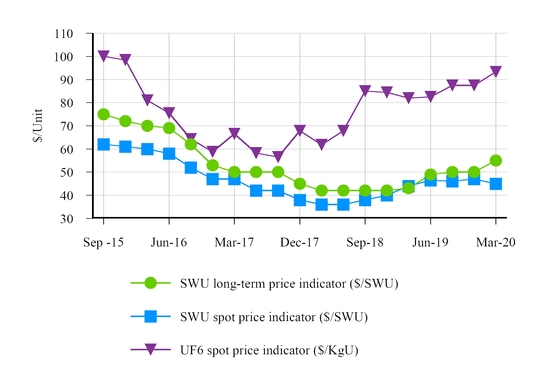
* Source:
Nuclear Market Review
, a TradeTech publication, www.uranium.info
Our contracts with customers are primarily denominated in U.S. dollars, and although revenue has not been directly affected by changes in the foreign exchange rate of the U.S. dollar, we may have a competitive price advantage or disadvantage obtaining new contracts in a competitive bidding process depending upon the weakness or strength of the U.S. dollar. Costs of our primary competitors are denominated in other currencies. Our contracts with suppliers have historically been denominated in U.S. dollars. In 2018, however, we entered into an agreement with Orano Cycle (“Orano”) for the long-term supply of SWU. Purchases under the contract with Orano will be payable in a combination of U.S dollars and euros and we may be subject to exchange rate risk for the portion of purchases payable in euros.
On occasion, we will accept payment in the form of uranium. Revenue from the sale of SWU under such contracts is recognized at the time LEU is delivered and is based on the fair value of the uranium at contract inception, or as the quantity of uranium is finalized, if variable.
25
Cost of sales for SWU and uranium is based on the amount of SWU and uranium sold and delivered during the period and unit inventory costs. Unit inventory costs are determined using the average cost method. Changes in purchase costs have an effect on inventory costs and cost of sales over current and future periods. Cost of sales includes costs for inventory management at off-site licensed locations. Cost of sales also includes certain legacy costs related to former employees of the Portsmouth and Paducah gaseous diffusion plants.
Market Uncertainties
Imports into the United States of LEU and other uranium products produced in the Russian Federation, including LEU imported by Centrus under the Russian Supply Agreement, are subject, through December 31, 2020, to quotas imposed under legislation enacted into law in September 2008 and under the 1992 Russian Suspension Agreement (“RSA”), as amended in 2008. These quotas limit the amount of Russian LEU that can be imported into the United States for U.S. consumption.
The U.S. Department of Commerce (“DOC”) is currently conducting an administrative review of the current status of, and compliance with, the RSA during the period October 2017 through September 2018 (the “Second Administrative Review”) and in December 2019, initiated another review of the period October 2018 through September 2019 (the “Third Administrative Review”). In an earlier review (the “First Administrative Review”), which covered the period October 2016 through September 2017 and was completed in December 2017, the DOC found that TENEX, Centrus and others had complied with the terms of the RSA during the period of review, but deferred until the Second Administrative Review any decision on whether the RSA continues to meet the statutory requirements that the RSA (i) prevent the suppression or undercutting of price levels of domestic uranium products and (ii) continue to be in the public interest. In a preliminary determination in the Second Administrative Review, issued in December 2019, the DOC again found that Centrus and others had complied with the RSA, but again deferred making a determination on the statutory requirements, which it said would be addressed in a post-preliminary analysis, which has yet to be issued. A final determination in the Second Administrative Review was due to be issued in June 2020. On April 24, 2020, the DOC announced that in response to operational adjustments due to the COVID-19 pandemic, it was tolling the deadlines for all administrative reviews currently pending with the DOC for 50 days, which means that the final determination could be issued in early August 2020.
If, in the final determination of the Second Administrative Review, the DOC finds evidence either of non-compliance with the RSA, or that the statutory requirements are no longer being met, it could terminate the RSA, reinitiate the antidumping investigation that the RSA suspended, and begin collecting duties in excess of 115% of the value of imports of Russian uranium products, including the LEU that the Company imports under the Russian Supply Agreement.
In February 2019, the DOC formally opened negotiations with the Russian Federation State Atomic Energy Corporation (Rosatom) with respect to a possible extension of the term of the RSA. In connection with these negotiations, the DOC is seeking a significant extension of the RSA. We are working with industry stakeholders and others to ensure that the extension will include sufficient quota to allow all existing contracts with TENEX, including the Russian Supply Agreement, to be fully implemented, but it is possible that the terms of the extension will not expressly protect our ability to import LEU under the Russian Supply Agreement or require that available quota be allocated to those imports.
An extension of the RSA would continue the existing suspension of the antidumping investigation and therefore not require payment of the duties or duty deposits described above, as long as the suspension remained in place. Centrus does not currently have in place any agreement with TENEX to share quotas that may apply after 2020, when the existing quotas terminate. Unless the RSA extension provides for sufficient quota or other relief that would allow Centrus to deliver in the United States all the Russian LEU that we procure under the Russian Supply Agreement, (i) our ability to meet our commitments under our order book and to obtain new sales commitments would be substantially jeopardized, and (ii) our ability to earn revenues with the Russian LEU we are required to procure under the Russian Supply Agreement would be substantially reduced. As a result, we could lose both revenue and market share to our competitors.
26
If, instead of an extension of the RSA, the DOC reached an adverse final determination in the Second Administrative Review and elected to restart the antidumping investigation of Russian uranium products, including LEU, we would be obligated to deposit funds with the U.S. government to cover potential duties (and potentially pay antidumping duties on a going-forward basis if the antidumping investigation resulted in an antidumping order) that would render the LEU containing the SWU that we purchase under the Russian Supply Agreement too expensive to place into the market. Such an outcome would cause us to incur significant losses in fulfilling our existing contracts, and make it commercially challenging to win new contracts.
As a result of the uncertainty regarding the outcome of the pending trade matter, customers may be reluctant to contract long-term for material from the Company and the Company may not be able to secure adequate alternative supplies. Further, the outcome of the pending trade matter could materially impact future demand and market prices. For further details, refer to Part I, Item 1A,
Risk Factors - Restrictions on imports or sales of LEU or SWU that we buy could adversely affect profitability and the viability of our business
, in our Annual Report on Form 10-K for the year ended December 31, 2019.
Technical Solutions
Our technical solutions segment reflects our technical, manufacturing, engineering and operations services offered to public and private sector customers, including the American Centrifuge engineering and testing activities we have performed as a contractor for UT-Battelle and the engineering, procurement, construction, manufacturing and operations services being performed under the HALEU Contract. With our private sector customers, we seek to leverage our domestic enrichment experience, engineering know-how, and precision manufacturing facility to assist customers with a range of engineering, design, and advanced manufacturing projects, including the production of fuel for next-generation nuclear reactors and the development of related facilities.
Government Contracting
On October 31, 2019, we signed the three-year cost-share HALEU Contract with DOE to deploy a cascade of centrifuges to demonstrate production of HALEU for advanced reactors. The program has been under way since May 31, 2019, when the Company and DOE signed an interim HALEU letter agreement that allowed work to begin while the full contract was being finalized.
Under the HALEU Contract, DOE agreed to reimburse the Company for 80% of its costs incurred in performing the contract, up to a maximum of $115 million. The Company’s cost share is the corresponding 20% and any costs incurred above these amounts. Costs under the HALEU Contract include
program costs
, including direct labor and materials and associated indirect costs that are classified as
Cost of Sales
, and an allocation of corporate costs supporting the program that are classified as
Selling, General and Administrative Expenses
. Services to be provided over the three-year contract include constructing and assembling centrifuge machines and related infrastructure in a cascade formation. When estimates of remaining program costs to be incurred for such an integrated, construction-type contract exceed estimates of total revenue to be earned, a provision for the remaining loss on the contract is recorded to
Cost of Sales
in the period the loss is determined. Our corporate costs supporting the program are recognized as expense as incurred over the duration of the contract term. As of December 31, 2019, the portion of our anticipated cost share under the HALEU Contract representing our share of remaining projected program costs was recognized in
Cost of Sales
as an accrued loss of $18.3 million. The accrued loss on the contract will be adjusted over the remaining contract term based on actual results and remaining program cost projections. As of March 31, 2020, the accrued contract loss balance was $15.3 million, and
Cost of Sales
in the three months ended March 31, 2020 was reduced by $3.0 million for previously accrued contract losses attributable to work performed in the first quarter of 2020.
Effective June 1, 2019, with the commencement of the HALEU work, ongoing costs of the Piketon facility that were included in
Advanced Technology Costs
on the consolidated statement of operations prior to June 1, 2019, are included in
Cost of Sales
of the technical solutions segment with the exception of costs for two minor items that must be repaired under a previous agreement with DOE.
27
Over the past five years, our government contracts with UT-Battelle have provided for engineering and testing work on the American Centrifuge technology at our facilities in Oak Ridge, Tennessee. Our completed fixed-price contract with UT-Battelle for the period from October 2017 through September 2018 generated revenue of approximately $16.0 million upon completion of defined milestones. Although the contract expired September 30, 2018, we continued to perform work towards the expected milestones as the parties worked toward a successor agreement. Costs for work performed in the first quarter of 2019 were classified as
Cost of Sales
. As the scope of work became more limited than originally anticipated, costs for work performed in the second quarter and most of the third quarter of 2019 were classified as
Advanced Technology Costs.
A successor fixed-price agreement was entered into with UT-Battelle in September 2019 and was completed in 2019 resulting in revenue of $1.2 million. In February 2020, an additional $4.4 million fixed-price agreement was entered into with UT-Battelle with scheduled completion in the second quarter of 2020. The Company began this scope of work in 2019. Revenue was $3.5 million in the first quarter of 2020, with approximately 70% of associated costs recognized in 2019 and 30% in the first quarter of 2020.
We continue to invest in advanced technology because of the potential for future growth into new areas of business for the Company, while also preserving our unique workforce at our Technology and Manufacturing Center in Oak Ridge, Tennessee.
In addition, we have entered into other contracts with DOE, other agencies and their contractors to provide engineering, design and manufacturing services.
Commercial Contracting
In March 2018, we entered into a services agreement with X Energy, LLC (“X-energy”) to provide X-energy with technical and resource support for criticality safety evaluation of processing equipment, design of fresh fuel transport packages, and conceptual mock-up of a nuclear fuel production facility. In November 2018, we entered into a second services agreement with X-energy to provide technical and resource support to the design and license application development of its nuclear fuel production facility. Under both agreements, we provide X-energy with non-cash in-kind contributions subject to a cooperative agreement between X-energy and the United States government. In November 2019, the parties extended the period of performance through June 30, 2020.
Under the X-energy agreements, services are performed pursuant to separate task orders issued and provide for time-and-materials based pricing. The cumulative value of task orders issued provides for payments to us of $11.9 million and in-kind contributions to be provided by us of $6.5 million. Revenue in 2018-2019 for payments received or pending totaled $9.1 million, and in-kind contributions provided by us totaled $5.0 million.
In addition, we have entered into other contracts for engineering, design, and advanced manufacturing services with other commercial entities.
Prior Site Services Work
We formerly performed sites services work under contracts with DOE and its contractors at the former Portsmouth (Ohio) and Paducah (Kentucky) Gaseous Diffusion Plants. The Company and DOE have yet to fully settle the Company’s claims for reimbursements for certain pension and postretirement benefits costs related to past contract work performed at the Portsmouth and Paducah plant sites. There is the potential to recognize additional income for this work pending the outcome of legal proceedings related to the Company’s claims for payment and the potential release of previously established valuation allowances on receivables. Refer to Part II, Item 1,
Legal Proceedings,
for additional information.
28
Results of Operations
Segment Information
The following table presents elements of the accompanying condensed consolidated statements of operations that are categorized by segment (dollar amounts in millions):
|
Three Months Ended
March 31, |
||||||||||||||
|
|
2020
|
2019
|
$ Change
|
% Change
|
||||||||||
|
LEU segment
|
|
|
||||||||||||
|
Revenue:
|
|
|
||||||||||||
|
SWU revenue
|
$
|
30.7
|
|
$
|
12.4
|
|
$
|
18.3
|
|
148
|
%
|
|||
|
Uranium revenue
|
—
|
|
22.7
|
|
(22.7
|
)
|
(100
|
)%
|
||||||
|
Total
|
30.7
|
|
35.1
|
|
(4.4
|
)
|
(13
|
)%
|
||||||
|
Cost of sales
|
13.3
|
|
38.3
|
|
25.0
|
|
65
|
%
|
||||||
|
Gross profit (loss)
|
$
|
17.4
|
|
$
|
(3.2
|
)
|
$
|
20.6
|
|
|||||
|
Technical solutions segment
|
|
|
|
|
||||||||||
|
Revenue
|
$
|
14.3
|
|
$
|
3.6
|
|
$
|
10.7
|
|
297
|
%
|
|||
|
Cost of sales
|
12.1
|
|
5.9
|
|
(6.2
|
)
|
(105
|
)%
|
||||||
|
Gross profit (loss)
|
$
|
2.2
|
|
$
|
(2.3
|
)
|
$
|
4.5
|
|
|||||
|
Total
|
|
|
|
|
||||||||||
|
Revenue
|
$
|
45.0
|
|
$
|
38.7
|
|
$
|
6.3
|
|
16
|
%
|
|||
|
Cost of sales
|
25.4
|
|
44.2
|
|
18.8
|
|
43
|
%
|
||||||
|
Gross profit (loss)
|
$
|
19.6
|
|
$
|
(5.5
|
)
|
$
|
25.1
|
|
|||||
Revenue
Revenue from the LEU segment declined $4.4 million (or 13%) in the three months ended March 31, 2020, compared to the corresponding period in 2019. Revenue from the sales of SWU increased $18.3 million (or 148%), reflecting an increase in the average SWU selling price partially offset by a 7% decline in sales volume. The average price billed to customers for sales of SWU increased 166%, reflecting the particular contracts under which SWU were sold during the periods. There were no uranium sales in the three months ended March 31, 2020.
Revenue from the technical solutions segment increased $10.7 million (or 297%) in the three months ended March 31, 2020, compared to the corresponding period in 2019. The increase was primarily the result of work performed under the HALEU Contract. Revenue in the current period included work performed under the UT-Battelle contract and revenue in the prior period included work performed under an agreement with DOE to decontaminate and decommission its K-1600 facility in Tennessee. The K-1600 contract was completed in October 2019.
Cost of Sales
Cost of sales for the LEU segment declined $25.0 million (or 65%) in the three months ended March 31, 2020, compared to the corresponding period in 2019, reflecting declines in SWU and uranium sales volumes and a decline in the average cost of sales per SWU. The average cost of sales per SWU declined approximately 26% in the three months ended March 31, 2020, compared to the corresponding period in 2019, primarily due to lower pricing in supply contracts. Cost of sales includes legacy costs related to former employees of the Portsmouth and Paducah Gaseous Diffusion Plants of $0.9 million in the three months ended March 31, 2020 and $1.0 million in the three months ended March 31, 2019.
29
Cost of sales for the technical solutions segment increased $6.2 million (or 105%) in the three months ended March 31, 2020, compared to the corresponding period in 2019, reflecting in part the mix of technical solutions work performed in each of the periods including work performed under the HALEU Contract in the current period. Cost of sales in the current period was reduced by $3.0 million for previously accrued contract losses attributable to work performed under the HALEU Contract in the first quarter of 2020. For details on HALEU Contract accounting, refer to “
Technical Solutions - Government Contracting
” above.
Gross Profit (Loss)
We realized a gross profit of $19.6 million in the three months ended March 31, 2020, compared to a gross loss of $5.5 million in the corresponding period in 2019.
The gross profit for the LEU segment was $17.4 million in the three months ended March 31, 2020, compared to a gross loss of $3.2 million in the corresponding period in 2019. The improvement for the LEU segment was primarily due to the increase in average SWU selling price and the decline in the average cost of sales per SWU.
For the technical solutions segment, we realized a gross profit of $2.2 million for the three months ended March 31, 2020, compared to a gross loss of $2.3 million in the corresponding period in 2019. The gross profit in the current period was primarily attributable to the UT-Battelle contract awarded in February 2020. The Company began this scope of work in 2019 and associated costs were recognized in both 2019 and the first quarter of 2020.
Non-Segment Information
The following table presents elements of the accompanying condensed consolidated statements of operations that are not categorized by segment (dollar amounts in millions):
|
Three Months Ended
March 31, |
||||||||||||||
|
|
2020
|
2019
|
$ Change
|
% Change
|
||||||||||
|
Gross profit (loss)
|
$
|
19.6
|
|
(5.5
|
)
|
$
|
25.1
|
|
456
|
%
|
||||
|
Advanced technology costs
|
0.9
|
|
6.6
|
|
5.7
|
|
86
|
%
|
||||||
|
Selling, general and administrative
|
8.5
|
|
8.1
|
|
(0.4
|
)
|
(5
|
)%
|
||||||
|
Amortization of intangible assets
|
1.4
|
|
1.1
|
|
(0.3
|
)
|
(27
|
)%
|
||||||
|
Special charges (credits) for workforce reductions
|
(0.1
|
)
|
(0.1
|
)
|
—
|
|
—
|
%
|
||||||
|
Gain on sales of assets
|
—
|
|
(0.4
|
)
|
(0.4
|
)
|
(100
|
)%
|
||||||
|
Operating income (loss)
|
8.9
|
|
(20.8
|
)
|
29.7
|
|
143
|
%
|
||||||
|
Nonoperating components of net periodic benefit expense (income)
|
(2.2
|
)
|
(0.1
|
)
|
2.1
|
|
2,100
|
%
|
||||||
|
Interest expense
|
0.1
|
|
1.0
|
|
0.9
|
|
90
|
%
|
||||||
|
Investment income
|
(0.4
|
)
|
(0.7
|
)
|
(0.3
|
)
|
(43
|
)%
|
||||||
|
Income (loss) before income taxes
|
11.4
|
|
(21.0
|
)
|
32.4
|
|
154
|
%
|
||||||
|
Income tax expense (benefit)
|
0.1
|
|
(0.1
|
)
|
(0.2
|
)
|
(200
|
)%
|
||||||
|
Net income (loss)
|
11.3
|
|
(20.9
|
)
|
32.2
|
|
154
|
%
|
||||||
|
Preferred stock dividends - undeclared and cumulative
|
2.0
|
|
2.0
|
|
—
|
|
—
|
%
|
||||||
|
Net income (loss) allocable to common stockholders
|
$
|
9.3
|
|
$
|
(22.9
|
)
|
$
|
32.2
|
|
141
|
%
|
|||
30
Advanced Technology Costs
Advanced technology costs consist of American Centrifuge expenses that are outside of our customer contracts in the technical solutions segment, including costs for work at the Piketon facility prior to the commencement of the HALEU work in June 2019. Costs declined $5.7 million (or 86%) in the three months ended March 31, 2020, compared to the corresponding period in 2019.
Selling, General and Administrative
Selling, general and administrative (“SG&A”) expenses increased $0.4 million (or 5%) in the three months ended March 31, 2020, compared to the corresponding period in 2019. Consulting costs increased $0.8 million and compensation and benefit costs declined $0.4 million.
Amortization of Intangible Assets
Amortization expense for the intangible asset related to the September 2014 sales order book is a function of SWU sales volume under that order book, which increased $0.3 million in the three months ended March 31, 2020, compared to the corresponding period in 2019. Amortization expense for the intangible asset related to customer relationships is amortized on a straight-line basis.
Special Charges (Credits) for Workforce Reductions
Special charges (credits) in both the three months ended March 31, 2020 and 2019 consisted of income of $0.1 million for the reversal of accrued termination benefits related to unvested employee departures.
Nonoperating Components of Net Periodic Benefit Expense (Income)
Nonoperating components of net periodic benefit expense (income) netted to income of $2.2 million for the three months ended March 31, 2020, compared to income of $0.1 million in the corresponding period in 2019. Nonoperating components of net periodic benefit expense (income) consist primarily of the expected return on plan assets, offset by interest cost as the discounted present value of benefit obligations nears payment. Interest cost declined in 2020 as a result of lower market interest rates.
Income Tax Expense (Benefit)
The income tax expense was $0.1 million in the three months ended March 31, 2020, and the income tax benefit was $0.1 million in the three months ended March 31, 2019. The 2020 income tax expense resulted primarily from an accrual for a current unrecognized tax benefit. The 2019 income tax benefit resulted from discrete items to reverse previously accrued liabilities for unrecognized tax benefits.
Net Income (Loss)
Our net income was $11.3 million in the three months ended March 31, 2020, compared to a net loss of $20.9 million in the three months ended March 31, 2019. The favorable variance of $32.2 million was primarily a result of a $25.1 million increase in gross profit, a $5.7 million decline in advanced technology costs, and a $2.1 million increase in nonoperating components of net periodic benefit income.
31
Preferred Stock Dividends - Undeclared and Cumulative
Holders of the Series B Preferred Stock are entitled to cumulative dividends of 7.5% per annum of the aggregate liquidation preference at origination of $104.6 million. We did not meet the criteria for a dividend payment obligation for the three months ended March 31, 2020 and the corresponding period in 2019, and we have not declared, accrued or paid dividends on the Series B Preferred Stock since issuance on February 14, 2017. Dividends on the Series B Preferred Stock are cumulative to the extent not paid at any quarter-end, whether or not declared and whether or not there are assets of the Company legally available for the payment of such dividends in whole or in part.
Liquidity and Capital Resources
We ended the first quarter of 2020 with a consolidated cash balance of
$109.2 million
. We anticipate having adequate liquidity to support our business operations for at least the next 12 months from the date of this report. Our view of liquidity is dependent on, among other things, conditions affecting our operations, including market, international trade, COVID-19 and other conditions and the level of expenditures and government funding for our services contracts and the timing of customer payments. Liquidity requirements for our existing operations are affected primarily by the timing and amount of customer sales and our inventory purchases.
We believe our sales order book in our LEU segment is a source of stability for our liquidity position. Subject to market conditions, we see the potential for growing uncommitted demand for LEU during the next few years with accelerated open demand in 2025 and beyond.
Cash resources and net sales proceeds from our LEU segment fund technology costs that are outside of our customer contracts in the technical solutions segment and general corporate expenses, including cash interest payments on our debt. We believe our investment in advanced U.S. uranium enrichment technology will position the Company to meet the needs of our customers as they deploy advanced reactors and next generation fuels. We signed the three-year HALEU Contract with DOE in October 2019 to deploy a cascade of centrifuges to demonstrate production of HALEU for advanced reactors. Under the agreement, the Company is contributing a portion of the program costs. The program has been under way since May 31, 2019, when Centrus and DOE signed a preliminary letter agreement that allowed work to begin while the full contract was being finalized.
Under the HALEU Contract, DOE agreed to reimburse the Company for 80% of its costs incurred in performing the contract, up to a maximum of $115 million. The Company’s cost share is the corresponding 20% and any costs incurred above these amounts. The HALEU Contract is incrementally funded and DOE is currently obligated for costs up to approximately $53.2 million of the $115 million. The Company has received aggregate cash payments of $19.0 million through March 31, 2020.
There are no guarantees about whether or when government or commercial demand for HALEU will materialize, and there are a number of technical, regulatory and economic hurdles that must be overcome for these fuels and reactors to come to the market.
We lease facilities and related personal property in Piketon, Ohio from DOE. In connection with the HALEU program, DOE and Centrus renewed the lease agreement in 2019 and extended the lease term through May 31, 2022. Any facilities or equipment constructed or installed under contract with DOE will be owned by DOE, may be returned to DOE in an “as is” condition at the end of the lease term, and DOE would be responsible for its D&D. If we determine the equipment and facilities may benefit Centrus after completion of the HALEU program, we can extend the facility lease and ownership of the equipment will be transferred to us, subject to mutual agreement regarding D&D and other issues.
In the event that funding by the U.S. government for research, development and demonstration of gas centrifuge technology is reduced or discontinued, such actions may have a material adverse impact on our ability to deploy the American Centrifuge technology and on our liquidity.
32
Capital expenditures of approximately $2 to $3 million are anticipated over the next 12 months.
The change in cash, cash equivalents and restricted cash from our condensed consolidated statements of cash flows are as follows on a summarized basis (in millions):
|
Three Months Ended
March 31, |
|||||||
|
|
2020
|
2019
|
|||||
|
Cash used in operating activities
|
$
|
(18.5
|
)
|
$
|
(31.9
|
)
|
|
|
Cash provided by investing activities
|
—
|
|
—
|
|
|||
|
Cash used in financing activities
|
(3.0
|
)
|
(3.1
|
)
|
|||
|
Decrease in cash, cash equivalents and restricted cash
|
$
|
(21.5
|
)
|
$
|
(35.0
|
)
|
|
Operating Activities
In the three months ended March 31, 2020, net cash used in operating activities was $18.5 million. The net reduction of $23.3 million in deferred revenue and advances from customers reflects revenue recognized in the current period related to payments received in advance in a prior period. Uses of cash are reflected in the decrease in pension and postretirement benefit liabilities of $8.6 million. The uses of cash were partially offset by net income of $11.3 million in the quarter, net of non-cash expenses.
In the corresponding period in 2019, net cash used in operating activities was $31.9 million. Sources of cash included the monetization of inventory purchased in prior periods, with inventories declining $25.6 million in the three-month period and the net reduction in receivables from utility customers of $22.4 million. The net reduction of $46.0 million in the SWU purchase payables balance, due to the timing of purchase deliveries, was a significant use of cash in the period. Uses of cash also included the net loss of $20.9 million in the quarter, net of non-cash expenses.
Investing Activities
There were no significant capital expenditures or other investing activities in either of the three months ended March 31, 2020 and 2019.
Financing Activities
In both the three months ended March 31, 2020 and 2019, payments of $3.1 million of interest classified as debt are classified as a financing activity. Refer to
Note 7, Debt,
of the condensed consolidated financial statements regarding the accounting for the 8.25% Notes.
Working Capital
The following table summarizes the Company’s working capital (in millions):
|
March 31,
2020 |
December 31,
2019 |
||||||
|
Cash and cash equivalents
|
$
|
109.2
|
|
$
|
130.7
|
|
|
|
Accounts receivable
|
17.5
|
|
21.1
|
|
|||
|
Inventories, net
|
60.5
|
|
58.9
|
|
|||
|
Current debt
|
(6.1
|
)
|
(6.1
|
)
|
|||
|
Deferred revenue and advances from customers, net of deferred costs
|
(98.9
|
)
|
(122.2
|
)
|
|||
|
Other current assets and liabilities, net
|
(49.0
|
)
|
(49.6
|
)
|
|||
|
Working capital
|
$
|
33.2
|
|
$
|
32.8
|
|
|
33
Capital Structure and Financial Resources
Interest on the 8.25% Notes is payable semi-annually in arrears as of February 28 and August 31 based on a 360-day year consisting of twelve 30-day months. The 8.25% Notes are guaranteed on a subordinated and limited basis by, and secured by substantially all assets of, Enrichment Corp. The 8.25% Notes mature on February 28, 2027. Additional terms and conditions of the 8.25% Notes are described in
Note 7, Debt,
of the condensed consolidated financial statements and
Note 9, Debt,
of the consolidated financial statements in the Company’s Annual Report on Form 10-K for the year ended December 31, 2019.
Holders of the Series B Preferred Stock are entitled to cumulative dividends of 7.5% per annum of the liquidation preference at origination of $104.6 million. We are obligated to pay cash dividends on our Series B Preferred Stock to the extent certain criteria are met and dividends are declared by the Board of Directors. We have not met these criteria for the periods from issuance through March 31, 2020, and have not declared, accrued or paid dividends on the Series B Preferred Stock as of March 31, 2020. Additional terms and conditions of the Series B Preferred Stock, including the criteria that must be met for the payment of dividends, are described in
Note 16, Stockholders’ Equity,
of the consolidated financial statements of the Company’s Annual Report on Form 10-K for the year ended December 31, 2019.
The nuclear industry in general, and the nuclear fuel industry in particular, are in a period of significant change. We are actively considering, and expect to consider from time to time in the future, potential strategic transactions, which at any given time may be in various stages of discussions, diligence or negotiation. If we pursue opportunities that require capital, we believe we would seek to satisfy these needs through a combination of working capital, cash generated from operations or additional debt or equity financing.
We are managing our working capital to seek to improve the long-term value of our LEU and technical solutions businesses and are planning to continue funding the Company’s qualified pension plans in the ordinary course because we believe that is in the best interest of all stakeholders. We expect that any other uses of working capital will be undertaken in light of these strategic priorities and will be based on the Company’s determination as to the relative strength of its operating performance and prospects, financial position and expected liquidity requirements. In addition, we expect that any such other uses of working capital will be subject to compliance with contractual restrictions to which the Company and its subsidiaries are subject, including the terms and conditions of their debt securities and credit facilities. We continually evaluate alternatives to manage our capital structure, and may opportunistically repurchase, exchange or redeem Company securities from time to time.
Commitments under Long-Term SWU Purchase Agreements
The Company purchases SWU contained in LEU from Russia supplied to us under a long-term agreement, as amended, signed in 2011 with the Russian government owned entity TENEX. Under a 2018 agreement, the Company will purchase SWU contained in LEU from Orano. Refer to
Note 11,
Commitments and Contingencies,
of the condensed consolidated financial statements for additional information.
DOE Technology License
We have a non-exclusive license in DOE inventions that pertain to enriching uranium using gas centrifuge technology. The license agreement with DOE provides for annual royalty payments based on a varying percentage (1% up to 2%) of our annual revenues from sales of the SWU component of LEU produced by us using DOE centrifuge technology. There is a minimum annual royalty payment of $100,000 and the maximum cumulative royalty over the life of the license is $100 million. There is currently no commercial enrichment facility producing LEU using DOE centrifuge technology. We are continuing to advance our U.S. centrifuge technology that has evolved from DOE inventions at specialized facilities in Oak Ridge, Tennessee, with a view to deploying a commercial enrichment facility over the long term once market conditions recover.
34
Off-Balance Sheet Arrangements
Other than outstanding surety bonds, our SWU purchase commitments and the license agreement with DOE relating to the American Centrifuge technology, there were no material off-balance sheet arrangements at March 31, 2020, or December 31, 2019.
New Accounting Standards
Reference is made to
New Accounting Standards
in
Note 1, Basis of Presentation,
of the unaudited condensed consolidated financial statements for information on new accounting standards.
Item 4.
Controls and Procedures
Evaluation of Disclosure Controls and Procedures
Centrus maintains disclosure controls and procedures that are designed to ensure that information required to be disclosed by Centrus in reports it files or submits under the Securities Exchange Act of 1934, as amended, (the “Exchange Act”) is recorded, processed, summarized and reported in the time periods specified in the SEC’s rules and forms and that such information is accumulated and communicated to management, including the Chief Executive Officer and the Chief Financial Officer, as appropriate to allow for timely decisions regarding required disclosures.
As of
March 31, 2020
, the end of the period covered by this report, our management performed an evaluation, under the supervision and with the participation of the Chief Executive Officer and the Chief Financial Officer, of the effectiveness of our disclosure controls and procedures (as defined in Rule 13a-15(e) under the Exchange Act). Based on this evaluation, the Chief Executive Officer and the Chief Financial Officer concluded that the Company’s disclosure controls and procedures were effective.
Changes in Internal Control Over Financial Reporting
There were no changes in our internal control over financial reporting during the quarter ended
March 31, 2020
, that have materially affected, or are reasonably likely to materially affect, our internal control over financial reporting.
35
PART II
Item 1.
Legal Proceedings
From time to time, we are involved in various pending legal proceedings, including the pending legal proceedings described below.
On August 30, 2013, the Company submitted a claim to DOE under the Contract Disputes Act for payment of $42.8 million, representing DOE’s share of pension and postretirement benefits costs related to the transition of employees at the former Portsmouth, Ohio, Gaseous Diffusion Plant (the “Portsmouth GDP”) to DOE’s decontamination and decommissioning contractor. On August 27, 2014, the DOE contracting officer denied the Company’s claim. As a result, the Company filed an appeal of the decision in the U.S. Court of Federal Claims in January 2015. Centrus believes that DOE is responsible for a significant portion of any pension and postretirement benefit costs associated with the transition of employees at Portsmouth. The receivable for DOE’s share of pension and postretirement benefits costs has a full valuation allowance due to the lack of a resolution with DOE and uncertainty regarding the amounts owed and the timing of collection. While proceeding with litigation, the Company is still pursuing settlement.
On May 26, 2019, the Company, Enrichment Corp., and five other DOE contractors who have operated facilities at the Portsmouth GDP site (including, in the case of the Company, the American Centrifuge Plant site located on the premises) were named as defendants in a class action complaint filed by Ursula McGlone, Jason McGlone, Julia Dunham, and K.D. and C.D., minor children by and through their parent and natural guardian Julia Dunham (collectively, the “McGlone Plaintiffs”) in the U.S. District Court in the Southern District of Ohio, Eastern Division. The complaint seeks damages for alleged off-site contamination allegedly resulting from activities on the Portsmouth GDP site. The McGlone Plaintiffs are seeking to represent a class of (i) all current or former residents within a seven-mile radius of the Portsmouth GDP site and (ii) all students and their parents at the Zahn’s Corner Middle School from 1993-present. The Company believes that its operations at the Portsmouth GDP site were fully in compliance with the Nuclear Regulatory Commission’s regulations. Further, the Company believes that any such liability should be covered by indemnification under the Price-Anderson Nuclear Industries Indemnity Act (“Price-Anderson Act”). The Company and Enrichment Corp. have provided notifications to DOE required to invoke indemnification under the Price-Anderson Act and other contractual provisions.
On June 28, 2019, the Company, Enrichment Corp. and four other DOE contractors who have operated facilities at the Portsmouth GDP site were named as defendants in a class action complaint filed by Ray Pritchard and Sharon Melick (collectively, the “Pritchard Plaintiffs”) in the U.S. District Court in the Southern District of Ohio, Eastern Division. The complaint seeks damages for alleged off-site contamination allegedly resulting from activities on the Portsmouth GDP site. The Pritchard Plaintiffs are seeking to represent a class of all current or former residents within a seven-mile radius of the Portsmouth GDP site. The Company believes that its operations at the Portsmouth GDP site were fully in compliance with the Nuclear Regulatory Commission’s regulations. Further, the Company believes that any such liability should be covered by indemnification under the Price-Anderson Act. The Company and Enrichment Corp. have provided notifications to DOE required to invoke indemnification under the Price-Anderson Act and other contractual provisions.
On November 27, 2019, the Company, Enrichment Corp. and six other DOE contractors who have operated facilities at the Portsmouth GDP site were named as defendants in a class action complaint filed by James Matthews, Jennifer Brownfield Clark, Joanne Ross, the Estate of A.R., and others similarly situated (the “Matthews Plaintiffs”), in the Common Pleas Court of Pike County, Ohio. The complaint seeks injunctive relief, compensatory damages, statutory damages, and any other relief allowed by law for alleged off-site contamination allegedly resulting from activities on the Portsmouth GDP site. The Matthews Plaintiffs expressly contend that the ongoing and continuous releases that injured the Plaintiffs and Class Members are not “nuclear incidents” as that term is defined in the Price-Anderson Act, but rather “freestanding state law claims concerning traditional-style state regulation.” The Company believes that its operations at the Portsmouth GDP site were fully in compliance with the Nuclear Regulatory Commission’s regulations. Further, the Company believes that any such liability should be
36
covered by indemnification under the Price-Anderson Act. The Company and Enrichment Corp. have provided notifications to DOE required to invoke indemnification under the Price-Anderson Act and other contractual provisions.
On October 11, 2018, the Company’s subsidiaries, Enrichment Corp. and American Centrifuge Enrichment, LLC (“ACE”, together with Enrichment Corp., the “Company Subsidiaries”) filed proofs of claim in the U.S. Bankruptcy Court for the Northern District of Ohio (the “Bankruptcy Court”) against each of FirstEnergy Nuclear Operating Company (“FENOC”), FirstEnergy Nuclear Generation, LLC (“FENG,” and together with FENOC, the “FirstEnergy Contract Parties”), FirstEnergy Solutions Corp. (“FES”) and FirstEnergy Generation, LLC (“FG”). The claims relate to damages arising from the rejection and breach of a long-term contract between the Company Subsidiaries and the FirstEnergy Contract Parties that was approved by the Bankruptcy Court and made effective as of July 26, 2018. The proofs of claim filed by the Company Subsidiaries include claims against the FirstEnergy Contract Parties based on their liability as parties to the contract that was rejected and breached. The proofs of claim filed by the Company Subsidiaries also included claims against FES and FG based on their liability under guaranties they issued that may obligate FES and FG to satisfy the rejection and breach of contract damages claims.
On November 15, 2019, FENOC, FENG, FES and FG filed objections to the Company Subsidiaries’ claims in the Bankruptcy Court. No decision on the claims against FENOC and FENG has yet been reached by the Bankruptcy Court. The Company Subsidiaries and FES and FG submitted cross motions for summary judgment on the issue of whether the guaranties of FES and FG apply. On March 13, 2020, the Bankruptcy Court ruled in favor of FES and FG on their motion, finding that the guaranties did not apply to the Company Subsidiaries’ claims. The Company Subsidiaries have filed a notice of appeal of this decision. The ruling does not apply to the Company Subsidiaries’ claims against the “FirstEnergy Contract Parties.
We are subject to various legal proceedings and claims, either asserted or unasserted, which arise in the ordinary course of business. While the outcome of these claims cannot be predicted with certainty, other than the above, we do not believe that the outcome of any of these legal matters, individually or in the aggregate, will have a material adverse effect on our cash flows, results of operations or consolidated financial condition.
37
Item 1A.
Risk Factors
There have been no material changes to the Risk Factors described in Part I, Item 1A,
Risk Factors
, in our Annual Report on Form 10-K for the year ended December 31, 2019.
Item 6.
Exhibits
|
Exhibit No.
|
Description
|
|
4.1
|
Third Amendment to the Section 382 Rights Agreement, dated as of April 13, 2020, by and among Centrus Energy Corp., Computershare Trust Company N.A. and Computershare Inc. (incorporated by reference to Exhibit 4.1 to the Company’s Current Report on Form 8-K, filed with the SEC on April 14, 2020).
|
|
10.1
|
Voting and Nomination Agreement, dated April 13, 2020, by and among Centrus Energy Corp. and the MB Group (incorporated by reference to Exhibit 10.1 to the Company’s Current Report on Form 8-K, filed with the SEC on April 14, 2020).
|
|
10.2
|
Consulting Agreement dated January 2, 2020 between the Company and Stephen S. Greene (certain personally identifiable information has been omitted) (incorporated by reference to Exhibit 10.62 to the Company’s Annual Report on Form 10-K for the year ended December 31, 2019, filed with the SEC on March 27, 2020). (b)
|
|
10.3
|
|
|
10.4
|
|
|
31.1
|
|
|
31.2
|
|
|
32.1
|
|
|
101
|
Unaudited condensed consolidated financial statements from the Quarterly Report on Form 10-Q for the quarter ended March 31, 2020, filed in interactive data file (XBRL) format.
|
|
(a)
|
Filed herewith.
|
|
(b)
|
Management contracts and compensatory plans and arrangements required to be filed as exhibits pursuant to Item 6 of this report.
|
38
SIGNATURES
Pursuant to the requirements of Section 13 or 15(d) of the Securities Exchange Act of 1934, the registrant has duly caused this report to be signed on its behalf by the undersigned, thereunto duly authorized.
|
Centrus Energy Corp.
|
|
|
May 12, 2020
|
/s/ Philip O. Strawbridge
|
|
Philip O. Strawbridge
|
|
|
Senior Vice President, Chief Financial Officer,
|
|
|
Chief Administrative Officer and Treasurer
|
|
|
(Duly Authorized Officer and Principal Financial Officer)
|
|
39
TABLE OF CONTENTS
Note 12, Segment Information,Note 11, Commitments and ContingenciesNote 9, DebtNote 7, DebtNote 2, Revenue and Contracts with Customers,Item 2. Management S Discussion and Analysis Of Financial Condition and Results Of OperationsNote 7, Debt,Note 9, Debt,Note 16, Stockholders Equity,Note 1, Basis Of Presentation,Item 4. Controls and ProceduresPart IIItem 1. Legal ProceedingsItem 1A. Risk FactorsItem 6. Exhibits