LITTELFUSE INC /DE
10-Ks and 10-Qs
|
|
|
|
|
|
|
|
|
|
|
|
|
|
|
|
|
|
|
|
|
|
|
|
|
|
|
|
|
|
|
|
|
|
|
|
|
|
|
|
|
|
|
|
|
|
|
|
|
|
|
|
|
|
|
|
UNITED STATES
SECURITIES AND EXCHANGE COMMISSION
Washington, D.C. 20549
FORM 10-K
|
[X]
|
Annual Report Pursuant to Section 13 or 15(d)
|
|||
|
of the Securities Exchange Act of 1934
|
||||
|
(Mark one)
|
for the fiscal year ended December 31, 2011
|
|||
|
Or
|
||||
|
[ ]
|
Transition Report Pursuant to Section 13 or 15(d)
|
|||
|
of the Securities Exchange Act of 1934
|
||||
|
for the transition period from to .
|
||||
Commission file number 0-20388
LITTELFUSE, INC.
(Exact name of registrant as specified in its charter)
|
Delaware
|
36-3795742
|
|
(State or other jurisdiction of
|
(I.R.S. Employer Identification No.)
|
|
incorporation or organization)
|
|
|
8755 West Higgins Road, Suite 500,
|
|
|
Chicago, Illinois
|
60631
|
|
(Address of principal executive offices)
|
(ZIP Code)
|
773/628-1000
(Registrant’s telephone number, including area code)
Securities registered pursuant to Section 12(b) of the Act:
|
|
Name of Each Exchange
|
|
Title of Each Class
|
On Which Registered
|
|
Common Stock, $0.01 par value
|
NASDAQ Global Select Market
SM
|
Indicate by check mark if the registrant is a well-known seasoned issuer, as defined in Rule 405 of the Securities Act. Yes [X] No [ ]
Indicate by check mark if the registrant is not required to file reports pursuant to Section 13 or Section 15(d) of the Act. Yes [ ] No [X]
Indicate by check mark whether the registrant (1) has filed all reports required to be filed by Section 13 or 15(d) of the Securities Exchange Act of 1934 during the preceding 12 months (or for such shorter period that the registrant was required to file such reports), and (2) has been subject to such filing requirements for the past 90 days. Yes [X] No [ ]
(Cover continued from previous page)
Indicate by check mark whether the registrant has submitted electronically and posted on its corporate Web site, if any, every Interactive Data File required to be submitted and posted pursuant to Rule 405 of Regulation S-T (Section 232.405 of this chapter) during the preceding 12 months (or for such shorter period that the registrant was required to submit and post such files). Yes [ X ] No [ ]
Indicate by check mark if disclosure of delinquent filers pursuant to Item 405 of Regulation S-K is not contained herein, and will not be contained, to the best of registrant’s knowledge, in definitive proxy or information statements incorporated by reference in Part III of this Form 10-K or any amendment to this Form 10-K. [ X]
Indicate by check mark whether the registrant is a large accelerated filer, an accelerated filer, a non-accelerated filer, or a smaller reporting company. See the definitions of “large accelerated filer,” “accelerated filer” and “small reporting company” in Rule 12b-2 of the Exchange Act (Check one): Large accelerated filer [X] Accelerated filer [ ] Non-accelerated filer [ ] Smaller reporting company [ ]
Indicate by check mark whether the registrant is a shell company (as defined in Rule 12b-2 of the Exchange Act). Yes [ ] No [X]
The aggregate market value of 22,117,146 shares of voting stock held by non-affiliates of the registrant was approximately $1,338,972,019 based on the last reported sale price of the registrant’s Common Stock as reported on the NASDAQ Global Select Market
SM
on July 2, 2011.
As of February 17, 2012, the registrant had outstanding 23,135,321 shares of Common Stock.
RDGPreambleEnd
DOCUMENTS INCORPORATED BY REFERENCE
Portions of the Littelfuse, Inc. Proxy Statement for the 2012 Annual Meeting of Stockholders (the “Proxy Statement”) are incorporated by reference into Part III of this Form 10-K.
2
TABLE OF CONTENTS
|
Page
|
||
|
FORWARD-LOOKING STATEMENTS
|
4
|
|
|
PART I
|
||
|
Item 1.
|
Business.
|
4
|
|
Item 1A.
|
Risk Factors.
|
12
|
|
Item 1B.
|
Unresolved Staff Comments.
|
16
|
|
Item 2.
|
Properties.
|
16
|
|
Item 3.
|
Legal Proceedings.
|
18
|
|
Item 4.
|
Mine Safety Disclosures.
|
18
|
|
PART II
|
||
|
Item 5.
|
Market for Registrant’s Common Equity, Related Stockholder Matters and Issuer Purchases of Equity Securities.
|
19
|
|
Item 6.
|
Selected Financial Data.
|
21
|
|
Item 7.
|
Management’s Discussion and Analysis of Financial Condition and Results of Operations.
|
21
|
|
Item 7A.
|
Quantitative and Qualitative Disclosures About Market Risk.
|
34
|
|
Item 8.
|
Financial Statements and Supplementary Data.
|
36
|
|
Item 9.
|
Changes in and Disagreements With Accountants on Accounting and Financial Disclosure.
|
73
|
|
Item 9A.
|
Controls and Procedures.
|
73
|
|
Item 9B.
|
Other Information.
|
74
|
|
PART III
|
||
|
Item 10.
|
Directors, Executive Officers and Corporate Governance.
|
75
|
|
Item 11.
|
Executive Compensation.
|
77
|
|
Item 12.
|
Security Ownership of Certain Beneficial Owners and Management and Related Stockholder Matters.
|
77
|
|
Item 13.
|
Certain Relationships and Related Transactions, and Director Independence.
|
77
|
|
Item 14.
|
Principal Accounting Fees and Services.
|
77
|
|
PART IV
|
||
|
Item 15.
|
Exhibits, Financial Statement Schedules.
|
78
|
|
Schedule II – Valuation and Qualifying Accounts and Reserves.
|
79
|
|
|
Signatures.
|
80
|
|
|
Exhibit Index.
|
81
|
|
3
FORWARD-LOOKING STATEMENTS
Certain statements contained in this Annual Report on Form 10-K that are not historical facts are intended to constitute “forward-looking statements” entitled to the safe-harbor provisions of the Private Securities Litigation Reform Act of 1995 (“PSRLA”). These statements may involve risks and uncertainties, including, but not limited to, risks relating to product demand and market acceptance, economic conditions, the impact of competitive products and pricing, product quality problems or product recalls, capacity and supply difficulties or constraints, coal mining exposures, failure of an indemnification for environmental liability, exchange rate fluctuations, commodity price fluctuations, the effect of the company’s accounting policies, labor disputes, restructuring costs in excess of expectations, pension plan asset returns being less than assumed, integration of acquisitions and other risks that may be detailed in “Item 1A. Risk Factors” below and in the company’s other Securities and Exchange Commission filings.
GENERAL
Littelfuse, Inc. and its subsidiaries (the “company” or “Littelfuse” or “we” or “our”) is the world’s leading supplier of circuit protection products for the electronics industry, providing a broad line of circuit protection solutions to worldwide customers.
In the electronics market, the company supplies leading manufacturers such as Alcatel-Lucent, Apple, Cisco, Celestica, Delta, Flextronics, Foxconn, Hewlett-Packard, HTC, Huawei, IBM, Intel, Jabil, LG, Motorola, Nokia, Panasonic, Quanta, Samsung, Sanmina-SCI, Seagate, Siemens and Sony. The company is also the leading provider of circuit protection for the automotive industry and the third largest producer of electrical fuses in North America. In the automotive market, the company’s end customers include major automotive manufacturers in North America, Europe and Asia such as BMW, Caterpillar, Chrysler, Ford Motor Company, General Motors, Hyundai Group, and Volkswagen. The company also supplies wiring harness manufacturers and auto parts suppliers worldwide, including Advance Auto Parts, Continental, Delphi, Lear, Leoni, O’Reilly Auto Parts, Pep Boys, Sumitomo, Valeo, and Yazaki. In the electrical market, the company supplies representative customers such as Abbott, Acuity Brands, Dow Chemical, DuPont, GE, General Motors, Heinz, International Paper, John Deere, SMA, First Solar, Samsung, Merck, Poland Springs, Procter & Gamble, Rockwell, United Technologies and 3M. Through the company’s Electrical business, the company supplies industrial ground fault protection in mining and other large industrial operations to customers such as Potash Corporation, Mosaic, Agrium, and Cameco. See “Business Environment: Circuit Protection Market.”
The company reports its operations by three business unit segments: Electronics, Automotive, and Electrical. For segment and geographical information and consolidated net sales and operating earnings see “Item 7. Management’s Discussion And Analysis Of Financial Condition And Results Of Operations” and Note 15 of the Notes to Consolidated Financial Statements included in this report.
During 2011, the company invested $6.0 million in certain preferred stock of Shocking Technologies, Inc., a research and development company in the electronics industry located in San Jose, California. Shocking Technologies, Inc. is a developer of circuit protection products for the computer and telecommunication markets.
4
On August 3, 2011, the company acquired 100% of Selco A/S, a manufacturer of relays and generator controls for the marine industry, for approximately $11.1 million. The acquisition allows the company to further expand its global relay business within its Electrical business unit segment. Selco A/S is located in Roskilde, Denmark with a sales office located in Dubai, United Arab Emirates. The company funded the acquisition with available cash.
Net sales by business unit segment for the periods indicated are as follows (in thousands):
|
Fiscal Year
|
||||||||||||
|
2011
|
2010
|
2009
|
||||||||||
|
Electronics
|
$ | 354,487 | $ | 373,370 | $ | 253,758 | ||||||
|
Automotive
|
197,586 | 139,096 | 104,647 | |||||||||
|
Electrical
|
112,882 | 95,555 | 71,742 | |||||||||
|
Total
|
$ | 664,955 | $ | 608,021 | $ | 430,147 | ||||||
During 2011, the company adjusted its business segment reporting methodology to report results by product line rather than by sales organization. Accordingly, results for 2010 and 2009 have been restated to reflect this change. The company’s total consolidated revenues and operating income did not change.
The company operates in three geographic regions: the Americas, Europe, and Asia-Pacific. The company manufactures products and sells to customers in all three regions.
Net sales in the company’s three geographic regions, based upon the shipped to destination, are as follows (in thousands):
|
Fiscal Year
|
||||||||||||
|
2011
|
2010
|
2009
|
||||||||||
|
Americas
|
$ | 288,592 | $ | 227,747 | $ | 166,137 | ||||||
|
Europe
|
114,895 | 115,113 | 83,449 | |||||||||
|
Asia-Pacific
|
261,468 | 265,161 | 180,561 | |||||||||
|
Total
|
$ | 664,955 | $ | 608,021 | $ | 430,147 | ||||||
The company’s products are sold worldwide through distributors, a direct sales force and manufacturers’ representatives. For the year ended December 31, 2011, approximately 66% of the company’s net sales were to customers outside the United States, including approximately 22% to China.
The company manufactures many of its products on fully integrated manufacturing and assembly equipment. The company maintains product quality through a Global Quality Management System with most manufacturing sites certified under ISO 9001:2000. In addition, several of the Littelfuse manufacturing sites are also certified under TS 16949 and ISO 14001.
References herein to “2011” or “fiscal 2011” refer to the fiscal year ended December 31, 2011. References herein to “2010” or “fiscal 2010” refer to the fiscal year ended January 1, 2011. References herein to “2009” or “fiscal 2009” refer to the fiscal year ended January 2, 2010. The company operates on a “4-4-5” fiscal calendar that normally keeps the number of weeks constant during each quarter. As a result of using this convention, each of fiscal 2011 and fiscal 2010 contained 52 weeks whereas fiscal 2009 contained 53 weeks.
5
The company’s annual report on Form 10-K, quarterly reports on Form 10-Q, current reports on Form
8-K and all amendments to those reports are available free of charge through the “Investors” section of the company’s Internet web site (http://www.littelfuse.com), as soon as practicable after such material is electronically filed with, or furnished to, the Securities and Exchange Commission (the “SEC”), accessible via a link to the web site maintained by the SEC. Except as otherwise provided herein, such information is not incorporated by reference into this Annual Report on Form 10-K.
BUSINESS ENVIRONMENT: CIRCUIT PROTECTION MARKET
Electronic Products
Electronic circuit protection products are used to protect circuits in a multitude of electronic systems. The company’s product offering includes a complete line of overcurrent and overvoltage solutions, including (i) fuses and protectors, (ii) positive temperature coefficient (“PTC”) resettable fuses, (iii) varistors, (iv) polymer electrostatic discharge (“ESD”) suppressors, (v) discrete transient voltage suppression (“TVS”) diodes, TVS diode arrays and protection thyristors, (vi) gas discharge tubes, (vii) power switching components and (viii) fuseholders, blocks and related accessories.
Electronic fuses and protectors are devices that contain an element that melts in an overcurrent condition. Electronic miniature and subminiature fuses are designed to provide circuit protection in the limited space requirements of electronic equipment. The company’s fuses are used in a wide variety of electronic products, including mobile phones, flat-screen TVs, computers, and telecommunications equipment. The company markets these products under trademarked brand names including PICO® II and NANO2® SMF.
Resettable fuses are PTC polymer devices that limit the current when an overcurrent condition exists and then reset themselves once the overcurrent condition has cleared. The company’s product line offers both radial leaded and surface mount products. Varistors are ceramic-based, high-energy absorption devices that provide transient overvoltage and surge suppression for automotive, telecommunication, consumer electronics and industrial applications. The company’s product line offers both radial leaded and multilayer surface mount products.
Polymer ESD suppressors are polymer-based devices that protect an electronic system from failure due to rapid transfer of electrostatic charge to the circuit. The company’s PulseGuard® line of ESD suppressors is used in PC and PC peripherals, digital consumer electronics and wireless applications.
Discrete diodes, diode arrays and protection thyristors are fast switching silicon semiconductor structures. Discrete diodes protect a wide variety of applications from overvoltage transients such as ESD, inductive load switching or lightning, while diode arrays are used primarily as ESD suppressors. Protection thyristors are commonly used to protect telecommunications circuits from overvoltage transients such as those resulting from lightning. Applications include telephones, modems, data transmission lines and alarm systems. The company markets these products under trademarked brand names including TECCOR®, SIDACtor®, Battrax® and SPA™.
Gas discharge tubes are very low capacitance devices designed to suppress any transient voltage event that is greater than the breakover voltage of the device. These devices are primarily used in telecommunication interface and conversion equipment applications as protection from overvoltage transients such as lightning.
6
Power switching components are used to regulate energy to various types of loads most commonly found in industrial and home applications. These components are easily activated from simple control circuits or interfaced to computers for more complex load control. Typical applications include heating, cooling, battery chargers and lighting.
In addition to the above products, the company is also a supplier of fuse holders (including OMNI-BLOK®), fuse blocks and fuse clips primarily to customers that purchase circuit protection devices from the company.
Automotive Products
Fuses are extensively used in automobiles, trucks, buses and off-road equipment to protect electrical circuits and the wires that supply electrical power to operate lights, heating, air conditioning, radios, windows and other controls. Currently, a typical automobile contains 30 to 100 fuses, depending upon the options installed. The fuse content per vehicle is expected to continue to grow as more electronic features are included in automobiles. The company also supplies fuses for the protection of electric and hybrid vehicles.
The company is a primary supplier of automotive fuses to United States, Asian and European automotive original equipment manufacturers (“OEM”), automotive component parts manufacturers and automotive parts distributors. The company also sells its fuses in the replacement parts market, with its products being sold through merchandisers, discount stores and service stations, as well as under private label by national firms. The company invented and owns U.S. and foreign patents related to blade-type fuses, which is the standard and most commonly used fuse in the automotive industry. The company’s automotive fuse products are marketed under trademarked brand names, including ATO®, MINI®, MAXI, MIDI®, MEGA®, MasterFuse, JCASE® and CablePro™.
A majority of the company’s automotive fuse sales are made to main-fuse box and wire harness manufacturers that incorporate the fuses into their products. The remaining automotive fuse sales are made directly to automotive manufacturers, retailers who sell automotive parts and accessories, and distributors who in turn sell most of their products to wholesalers, service stations and non-automotive OEMs.
The company has expanded the Automotive Business Segment into the commercial vehicle market with the acquisition of Cole Hersee. Additional products in this market include: power distribution modules, low current switches, high current switches, solenoids and relays, electronic switches, battery management products and ignition key switches.
Electrical Products
The company entered the electrical market in 1983 and manufactures and sells a broad range of low-voltage and medium-voltage circuit protection products to electrical distributors and their customers in the construction, OEM and industrial maintenance, repair and operating supplies (“MRO”) markets. The company also designs and manufactures portable custom electrical equipment for the mining industry in Canada as well as protection relays for the global mining, oil and gas, industrial and marine markets.
Power fuses are used to protect circuits in various types of industrial equipment and in industrial and commercial buildings. They are rated and listed under one of many Underwriters Laboratories’ fuse classifications. Major applications for power fuses include protection from over-load and short-circuit currents in motor branch circuits, heating and cooling systems, control systems, lighting circuits and electrical distribution networks.
The company’s POWR-GARD® product line features the Indicator™ series power fuse used in both the OEM and MRO markets. The Indicator™ technology provides visual blown-fuse indication at a glance, reducing maintenance and downtime on production equipment. The Indicator™ product offering is widely used in motor protection and industrial control panel applications.
7
Protection relays are used to protect personnel and equipment in industrial environments and commercial buildings from excessive currents, over voltages and electrical shock hazards called ground-faults. Major applications for protection relays include protection of motor, transformer and power-line distribution circuits. Ground-fault relays are used to protect personnel and equipment in wet environments such as underground mining or water treatment applications where there is a greater risk for electricity to come in contact with water and create a shock hazard.
Custom electrical equipment is used in harsh environments such as underground mining where standard electrical gear will not meet customer needs for reliability and durability. Portable power substations are used to transform and distribute electrical power to mobile equipment such as mining cutting machines and other electrical machinery. Miner control units provide power management for critical electrically operated underground production equipment.
PRODUCT DESIGN AND DEVELOPMENT
The company employs scientific, engineering and other personnel to continually improve its existing product lines and to develop new products at its research and engineering facilities in Champaign and Chicago, Illinois, Boston, Massachusetts, Canada, China, Germany, the Philippines and Mexico. The Product & Development Technology departments maintain a staff of engineers, chemists, material scientists and technicians whose primary responsibility is to design and develop new products.
Proposals for the development of new products are initiated primarily by sales and marketing personnel with input from customers. The entire product development process usually ranges from a few months to 18 months based on the complexity of development, with continuous efforts to reduce the development cycle. During fiscal years 2011, 2010 and 2009, the company expended $19.4 million, $17.6 million and $18.1 million, respectively, on research, product design and development (“R&D”). During 2010, the company completed moving R&D operations to lower cost locations closer to its customers. R&D operations are now in Canada, China, Germany, the Philippines and Mexico as well as the United States.
PATENTS, TRADEMARKS AND OTHER INTELLECTUAL PROPERTY
The company generally relies on patent and trademark laws and license and nondisclosure agreements to protect intellectual property and proprietary products. In cases where it is deemed necessary by management, key employees are required to sign an agreement that they will maintain the confidentiality of the company’s proprietary information and trade secrets.
As of December 31, 2011, the company owned 197 patents in North America, 85 patents in the European Union and 63 patents in other foreign countries. The company also has registered trademark protection for certain of its brand names and logos. The 197 North American patents are in the following product categories: 124 electronics, 44 automotive and 29 electrical. Patents and licenses are amortized over a period of 7-12 years, with a weighted average life of 11.9 years. Distribution networks are amortized over a period of 3-20 years, with a weighted average life of 13.8 years. Trademarks and tradenames are amortized over a period of 5-20 years, with a weighted average life of 13.8 years. The company recorded amortization expense of $6.6 million, $5.0 million and $5.0 million in 2011, 2010 and 2009, respectively, related to amortizable intangible assets.
8
New products are continually being developed to replace older products. The company regularly applies for patent protection on such new products. Although, in the aggregate, the company’s patents are important in the operation of its businesses, the company believes that the loss by expiration or otherwise of any one patent or group of patents would not materially affect its business.
License royalties amounted to $1.0 million, $0.2 million and $0.1 million for fiscal 2011, 2010 and 2009, respectively, and are included in other expense (income), net on the Consolidated Statements of Income.
MANUFACTURING
The company performs the majority of its own fabrication, stamps some of the metal components used in its fuses, holders and switches from raw metal stock and makes its own contacts and springs. In addition, the company fabricates silicon wafers for certain applications and performs its own plating (silver, nickel, zinc, tin and oxides). All thermoplastic molded component requirements used for such products as the ATO®, MINI® and MAXI fuse product lines are met through the company’s in-house molding capabilities. After components are stamped, molded, plated and readied for assembly, final assembly is accomplished on fully automatic and semi-automatic assembly machines. Quality assurance and operations personnel, using techniques such as statistical process control, perform tests, checks and measurements during the production process to maintain the highest levels of product quality and customer satisfaction.
The principal raw materials for the company’s products include copper and copper alloys, heat-resistant plastics, zinc, melamine, glass, silver, gold, raw silicon, solder and various gases. The company uses a sole source for several heat-resistant plastics and for zinc, but believes that suitable alternative heat-resistant plastics and zinc are available from other sources at comparable prices. All other raw materials are purchased from a number of readily available outside sources.
A computer-aided design and manufacturing system (CAD/CAM) expedites product development and machine design and the company’s laboratories test new products, prototype concepts and production run samples. The company participates in “just-in-time” delivery programs with many of its major suppliers and actively promotes the building of strong cooperative relationships with its suppliers by utilizing early supplier involvement techniques and engaging them in pre-engineering product and process development.
MARKETING
The company’s domestic sales and marketing staff of over 35 people maintains relationships with major OEMs and distributors. The company’s sales, marketing and engineering personnel interact directly with OEM engineers to ensure appropriate circuit protection and reliability within the parameters of the OEM’s circuit design. Internationally, the company maintains a sales and marketing staff of over 100
people with sales offices in the U.K., Germany, Spain, Italy, Singapore, Taiwan, Japan, Brazil, Hong Kong, Korea, China and India. The company also markets its products indirectly through a worldwide organization of over 60 manufacturers’ representatives and distributes through an extensive network of electronics, automotive and electrical distributors.
9
Electronics
The company uses manufacturers’ representatives to sell its electronics products domestically and to call on major domestic and international OEMs and distributors. The company sells approximately 15% of its domestic products directly to OEMs, with the remainder sold through distributors nationwide.
In the Asia-Pacific region, the company maintains a direct sales staff and utilizes distributors in Japan, Singapore, Korea, Taiwan, China, Malaysia, Thailand, Hong Kong, India, Indonesia, the Philippines, New Zealand and Australia. In the Americas, the company maintains a direct sales staff in Brazil and utilizes manufacturers’ representatives and distributors in Canada. In Europe, the company maintains a direct sales force and utilizes manufacturers’ representatives and distributors to support a wide array of customers.
Automotive
The company maintains a direct sales force to service all the major automotive and commercial vehicle OEMs and system suppliers domestically. Approximately 23 manufacturers’ representatives sell the company’s products to aftermarket fuse retailers such as O’Reilly Auto Parts and Pep Boys. The company also uses about 15 manufacturers' representatives to sell to the commercial vehicle aftermarket. In Europe, the company uses both a direct sales force and manufacturers’ representatives to distribute its products to OEMs, major system suppliers and aftermarket distributors. In the Asia-Pacific region, the company uses both a direct sales force and distributors to supply to major OEMs and system suppliers.
Electrical
The company markets and sells its power fuses and protection relays through approximately 38 manufacturers’ representatives across North America. These representatives sell power fuse products through an electrical and industrial distribution network comprised of approximately 2,000 distributor buying locations. These distributors have customers that include electrical contractors, municipalities, utilities and factories (including both MRO and OEM).
The company’s field sales force (including regional sales managers and application engineers) and manufacturers’ representatives call on both distributors and end-users (consulting engineers, municipalities, utilities and OEMs) in an effort to educate these customers on the capabilities and characteristics of the company’s products.
CUSTOMERS
The company sells to over 5,000 customers and distributors worldwide. Sales to Arrow Electronics (an Electronics distributor) were less than 10% of net sales for 2011 and 2009, respectively, but were 10.4% for 2010. No other single customer accounted for more than 10% of net sales during any of the last three years. During fiscal 2011, 2010 and 2009, net sales to customers outside the United States accounted for approximately 66%, 69% and 68%, respectively, of the company’s total net sales.
COMPETITION
The company’s products compete with similar products of other manufacturers, some of which have substantially greater financial resources than the company. In the electronics market, the company’s competitors include Cooper Industries, Bel Fuse, Bourns, EPCOS, On Semiconductor, STMicroelectronics, Semtech, Vishay and TE Connectivity. In the automotive market, the company’s competitors include Cooper Industries, Pacific Engineering (a private company in Japan) and MTA (a private company in Italy). In the electrical market, the company’s major competitors include Cooper Industries and Mersen. The company believes that it competes on the basis of innovative products, the breadth of its product line, the quality and design of its products and the responsiveness of its customer service, in addition to price.
10
BACKLOG
The backlog of unfilled orders at December 31, 2011, was approximately $92.4 million, compared to $107.5 million at January 1, 2011. Substantially all of the orders currently in backlog are scheduled for delivery in 2012.
EMPLOYEES
As of December 31, 2011, the company employed approximately 6,000 employees worldwide.
Approximately 750 employees in Mexico and 3 employees in Germany are covered by collective bargaining agreements. The Mexico collective bargaining agreement, covering employees in Piedras Negras, expires January 31, 2014. During 2010, a collective bargaining agreement covering approximately 160 employees at the company’s Matamoros, Mexico facility was terminated as a result of the plant’s closure.
The Germany collective bargaining agreement, covering 3 employees in Essen, expires March 31, 2012. During 2011, a collective bargaining agreement covering 28 employees at the company’s Dünsen, Germany facility was terminated as a result of plant closure.
Approximately 13% of the company's total workforce was employed under collective bargaining agreements at December 31, 2011. The employees covered by a collective bargaining agreement that will expire within one year of December 31, 2011 represent approximately less than 1% of the company's total workforce.
Overall, the company has historically maintained satisfactory employee relations and considers employee relations to be good.
ENVIRONMENTAL REGULATION
The company is subject to numerous foreign, federal, state and local regulations relating to air and water quality, the disposal of hazardous waste materials, safety and health. Compliance with applicable environmental regulations has not significantly changed the company’s competitive position, capital spending or earnings in the past and the company does not presently anticipate that compliance with such regulations will change its competitive position, capital spending or earnings for the foreseeable future.
The company employs an environmental engineer to monitor regulatory matters and believes that it is currently in compliance in all material respects with applicable environmental laws and regulations, except with respect to its facilities located in Ireland. The Ireland facility was acquired in October 1999 in connection with the acquisition from Harris Corporation of its suppression products division. Certain containment actions have been ongoing and full disclosure with appropriate agencies in Ireland has been initiated. The company received an indemnity from Harris Corporation with respect to these matters.
Littelfuse GmbH, which was acquired by the company in May 2004, is responsible for maintaining closed coal mines from legacy acquisitions. The company is compliant with German regulations pertaining to the maintenance of the mines and has an accrual related to certain of these coal mine shafts based on an engineering study estimating the cost of remediating the dangers (such as a shaft collapse) of certain of these closed coal mine shafts in Germany. The reserve is reviewed annually and calculated based upon the cost of remediating the shafts that the study deems most risky. Further information regarding the coal mine liability reserve is provided in Note 10 of the Notes to Consolidated Financial Statements included in this report.
11
Our business, financial condition and results of operations are subject to various risks and uncertainties, including the risk factors we have identified below. These factors are not necessarily listed in order of importance. We may amend or supplement the risk factors from time to time by other reports that we file with the SEC in the future.
Our industry is subject to intense competitive pressures.
We operate in markets that are highly competitive. We compete on the basis of price, quality, service and/or brand name across the industries and markets we serve. Competitive pressures could affect the prices we are able to charge our customers or the demand for our products.
We may not always be able to compete on price, particularly when compared to manufacturers with lower cost structures. Some of our competitors have substantially greater sales, financial and manufacturing resources and may have greater access to capital than Littelfuse. As other companies enter our markets or develop new products, competition may further intensify. Our failure to compete effectively could materially adversely affect our business, financial condition and results of operations.
We may be unable to manufacture and deliver products in a manner that is responsive to our customers’ needs.
The end markets for our products are characterized by technological change, frequent new product introductions and enhancements, changes in customer requirements and emerging industry standards. The introduction of products embodying new technologies and the emergence of new industry standards could render our existing products obsolete and unmarketable before we can recover any or all of our research, development and commercialization expenses on capital investments. Furthermore, the life cycles of our products may change and are difficult to estimate.
Our future success will depend upon our ability to manufacture and deliver products in a manner that is responsive to our customers’ needs. We will need to develop and introduce new products and product enhancements on a timely basis that keep pace with technological developments and emerging industry standards and address increasingly sophisticated requirements of our customers. We invest heavily in research and development without knowing that we will recover these costs. Our competitors may develop products or technologies that will render our products non-competitive or obsolete. If we cannot develop and market new products or product enhancements in a timely and cost-effective manner, our business, financial condition and results of operations could be materially adversely affected.
Our business may be interrupted by labor disputes or other interruptions of supplies.
A work stoppage could occur at certain of our facilities, most likely as a result of disputes under collective bargaining agreements or in connection with negotiations of new collective bargaining agreements. In addition, we may experience a shortage of supplies for various reasons, such as financial distress, work stoppages, natural disasters or production difficulties that may affect one of our suppliers. A significant work stoppage, or an interruption or shortage of supplies for any reason, if protracted, could substantially adversely affect our business, financial condition and results of operations. The transfer of our manufacturing operations and changes in our distribution model could disrupt operations for a limited time.
12
Our revenues may vary significantly from period to period.
Our revenues may vary significantly from one accounting period to another due to a variety of factors including:
|
|
·
|
changes in our customers’ buying decisions;
|
|
|
·
|
changes in demand for our products;
|
|
|
·
|
our product mix;
|
|
|
·
|
our effectiveness in managing manufacturing processes;
|
|
|
·
|
costs and timing of our component purchases;
|
|
|
·
|
the effectiveness of our inventory control;
|
|
|
·
|
the degree to which we are able to utilize our available manufacturing capacity;
|
|
|
·
|
our ability to meet delivery schedules;
|
|
|
·
|
general economic and industry conditions;
|
|
|
·
|
local conditions and events that may affect our production volumes, such as labor conditions and political instability; and
|
|
|
·
|
seasonality of certain product lines.
|
The bankruptcy or insolvency of a major customer could adversely affect us.
The bankruptcy or insolvency of a major customer could result in lower sales revenue and cause a material adverse effect on our business, financial condition and results of operations. In addition, the bankruptcy or insolvency of a major U.S. auto manufacturer or significant supplier likely could lead to substantial disruptions in the automotive supply base, resulting in lower demand for our products, which likely would cause a decrease in sales revenue and have a substantial adverse impact on our business, financial condition and results of operations.
Our ability to manage currency or commodity price fluctuations or shortages is limited.
As a resource-intensive manufacturing operation, we are exposed to a variety of market and asset risks, including the effects of changes in foreign currency exchange rates, commodity prices and interest rates. We have multiple sources of supply for the majority of our commodity requirements. However, significant shortages that disrupt the supply of raw materials or result in price increases could affect prices we charge our customers, our product costs, and the competitive position of our products and services. We monitor and manage these exposures as an integral part of our overall risk management program, which recognizes the unpredictability of markets and seeks to reduce the potentially adverse effects on our results. Nevertheless, changes in currency exchange rates, commodity prices and interest rates cannot always be predicted. In addition, because of intense price competition and our high level of fixed costs, we may not be able to address such changes even if they are foreseeable. Substantial changes in these rates and prices could have a material adverse effect on our results of operations and financial condition. For additional discussion of interest rate, currency or commodity price risk, see "Item 7A. Quantitative and Qualitative Disclosures about Market Risks.”
13
Operations and supply sources located outside the United States, particularly in emerging markets, are subject to greater risks.
Our operating activities outside the United States contribute significantly to our revenues and earnings. Serving a global customer base and remaining competitive in the global marketplace requires the company to place our production in countries outside the United States, including emerging markets, to capitalize on market opportunities and maintain a cost-efficient structure. In addition, we source a significant amount of raw materials and other components from third-party suppliers in low-cost countries. Our international operating activities are subject to a number of risks generally associated with international operations, including risks relating to the following:
|
|
·
|
general economic conditions;
|
|
|
·
|
currency fluctuations and exchange restrictions;
|
|
|
·
|
import and export duties and restrictions;
|
|
|
·
|
the imposition of tariffs and other import or export barriers;
|
|
|
·
|
compliance with regulations governing import and export activities;
|
|
|
·
|
current and changing regulatory requirements;
|
|
|
·
|
political and economic instability;
|
|
|
·
|
potentially adverse income tax consequences;
|
|
|
·
|
transportation delays and interruptions;
|
|
|
·
|
labor unrest;
|
|
|
·
|
natural disasters;
|
|
|
·
|
terrorist activities;
|
|
|
·
|
public health concerns;
|
|
|
·
|
difficulties in staffing and managing multi-national operations; and
|
|
|
·
|
limitations on our ability to enforce legal rights and remedies.
|
Any of these factors could have a material adverse effect on our business, financial condition and results of operations.
We
are in the process of relocating our manufacturing operations and changing our distribution and customer service model.
We are a company that, from time to time, seeks to optimize its manufacturing capabilities and efficiencies through restructurings, consolidations, plant closings or asset sales. We may make further specific determinations to consolidate, close or sell additional facilities. Possible adverse consequences related to such actions may include various charges for such items as idle capacity, disposition costs, severance costs, impairments of goodwill and possibly an immediate loss of revenues, in addition to normal or attendant risks and uncertainties. We may be unsuccessful in any of our current or future efforts to restructure or consolidate our business. Our plans to minimize or eliminate any loss of revenues during restructuring or consolidation may not be achieved. These activities may have a material adverse effect upon our business, financial condition or results of operations.
We engage in acquisitions and may encounter difficulties in integrating these businesses.
We are a company that, from time to time, seeks to grow through strategic acquisitions. We have in the past acquired a number of businesses or companies and additional product lines and assets. We intend to continue to expand and diversify our operations with additional acquisitions. The success of these transactions depends on our ability to integrate the assets and personnel acquired in these acquisitions. We may encounter difficulties in integrating acquisitions with our operations and may not realize the degree or timing of the benefits that we anticipated from an acquisition.
14
Environmental liabilities could adversely impact our financial position.
Federal, state and local laws and regulations impose various restrictions and controls on the discharge of materials, chemicals and gases used in our manufacturing processes or in our finished goods. These environmental regulations have required us to expend a portion of our resources and capital on relevant compliance programs. Under these laws and regulations, we could be held financially responsible for remedial measures if our current or former properties are contaminated or if we send waste to a landfill or recycling facility that becomes contaminated, even if we did not cause the contamination. We may be subject to additional common law claims if we release substances that damage or harm third parties. In addition, future changes in environmental laws or regulations may require additional investments in capital equipment or the implementation of additional compliance programs. Any failure to comply with new or existing environmental laws or regulations could subject us to significant liabilities and could have a material adverse effect on our business, financial condition or results of operations.
In the conduct of our manufacturing operations, we have handled and do handle materials that are considered hazardous, toxic or volatile under federal, state and local laws. The risk of accidental release of such materials cannot be completely eliminated. In addition, we operate or own facilities located on or near real property that was formerly owned and operated by others. Certain of these properties were used in ways that involved hazardous materials. Contaminants may migrate from, within or through these properties. These releases or migrations may give rise to claims. Where third parties are responsible for contamination, the third parties may not have funds, or not make funds available when needed, to pay remediation costs imposed upon us under environmental laws and regulations.
The company is responsible for the maintenance of discontinued coal mining operations in Germany. The risk of environmental remediation exists and the company is in the process of remediating the mines considered to be the most at risk.
We derive a substantial portion of our revenues from customers in the automotive, consumer electronics and communications industries, and we are susceptible to trends and factors affecting those industries as well as the success of our customers’ products.
Net sales to the automotive, consumer electronics and communications industries represent a substantial portion of our revenues. Factors negatively affecting these industries and the demand for products also negatively affect our business, financial condition or results of operations. Any adverse occurrence, including industry slowdown, recession, political instability, costly or constraining regulations, armed hostilities, terrorism, excessive inflation, prolonged disruptions in one or more of our customers’ production schedules or labor disturbances, that results in significant decline in the volume of sales in these industries, or in an overall downturn in the business and operations of our customers in these industries, could materially adversely affect our business, financial condition or results of operations. For example, the automotive industry as well as the consumer electronics market is highly cyclical in nature and sensitive to changes in general economic conditions, consumer preferences and interest rates. In addition, the global automotive and electronic industries have overall manufacturing capacity far exceeding demand. To the extent that demand for certain of our customers’ products declines, the demand for our products may decline. Reduced demand relating to general economic conditions, consumer preferences, interest rates or industry over-capacity may have a material adverse effect upon our business, financial condition or results of operations.
15
The inability to maintain access to capital markets may adversely affect our business and financial results.
Our ability to invest in our businesses, make strategic acquisitions and refinance maturing debt obligations may require access to the capital markets and sufficient bank credit lines to support short-term borrowings. If we are unable to access the capital markets or bank credit facilities, we could experience a material adverse affect on our business, financial condition and results of operations.
Fixed costs may reduce operating results if our sales fall below expectations.
Our expense levels are based, in part, on our expectations for future sales. Many of our expenses, particularly those relating to capital equipment and manufacturing overhead, are relatively fixed. We might be unable to reduce spending quickly enough to compensate for reductions in sales. Accordingly, shortfalls in sales could materially and adversely affect our operating results.
The volatility of our stock price could affect the value of an investment in our stock and our future financial position.
The market price of our stock has fluctuated widely. Between January 2, 2011 and December 31, 2011, the closing sale price of our common stock ranged between a low of $38.56 and a high of $64.82, experiencing greater volatility over that time than the broader markets. The volatility of our stock price may be related to any number of factors, such as general economic conditions, industry conditions, analysts’ expectations concerning our results of operations, or the volatility of our revenues as discussed above under “Our Revenues May Vary Significantly from Period to Period.” The historic market price of our common stock may not be indicative of future market prices. We may not be able to sustain or increase the value of our common stock. Declines in the market price of our stock could adversely affect our ability to retain personnel with stock incentives, to acquire businesses or assets in exchange for stock and/or to conduct future financing activities with or involving our common stock.
Customer demands and new regulations related to conflict-free minerals may force us to incur additional expenses.
The Dodd-Frank Wall Street Reform and Consumer Protection Act requires disclosure of use of “conflict” minerals mined from the Democratic Republic of Congo and adjoining countries and efforts to prevent the use of such minerals. In the semiconductor industry, these minerals are most commonly found in metals. As there may be only a limited number of suppliers offering “conflict free” metals, we cannot be sure that we will be able to obtain necessary metals in sufficient quantities or at competitive prices. Also, we may face challenges with our customers and suppliers if we are unable to sufficiently verify that the metals used in our products are “conflict free.”
None.
LITTELFUSE FACILITIES
The company’s operations are located in 44 owned or leased facilities worldwide, representing an aggregate of 1,458,374 square feet. The company’s corporate headquarters is located in the U.S. in Chicago, Illinois. The company has North American manufacturing facilities in Saskatoon, Canada, Piedras Negras, Mexico and Melchor Muzquiz, Mexico. The manufacturing facilities previously located in Irving, Texas and Matamoros, Mexico were closed in 2010. During 2010, the European headquarters and the primary European distribution center, previously located in Utrecht, the Netherlands, until the property was sold in 2010, were relocated to Dünsen, Germany. The Dünsen facility was closed during 2011. Manufacturing operations were transferred to Piedras Negras, Mexico. The office and European headquarters were subsequently transferred to Bremen, Germany. In addition to the Dünsen, Germany, facility, the company is currently marketing for sale its Des Plaines, Illinois, property and Dundalk, Ireland, facility, both of which closed during fiscal year 2009. The Des Plaines building was demolished in 2010 to facilitate the sale of the underlying property.
16
Asia-Pacific operations include sales and distribution centers located in Singapore, Taiwan, Japan, China and Korea, with manufacturing plants in China, Taiwan and the Philippines. The manufacturing plant in Taiwan is expected to close in 2012. The company does not believe that it will encounter any difficulty in renewing its existing leases upon the expiration of their current terms. Management believes that the company’s facilities are adequate to meet its requirements for the foreseeable future.
The following table provides certain information concerning the company’s facilities at December 31, 2011, and the use of these facilities during fiscal 2011:
|
Location
|
Use
|
Size
(sq. ft.)
|
Lease/Own
|
Lease
Expiration
Date
|
Primary Product
|
|||||||||
|
Chicago, Illinois
|
Administrative, Engineering, Research and Testing
|
54,838 |
Leased
|
2024 |
Auto, Electronics and Electrical
|
|||||||||
|
Elk Grove Village, Illinois
|
Engineering and Research
|
5,000 |
Leased
|
2012 |
Auto and Electronics
|
|||||||||
|
Bensenville, Illinois
|
Research and Development
|
3,140 |
Leased
|
2013 |
Electronic
|
|||||||||
|
Champaign, Illinois
|
Research and Development
|
13,503 |
Leased
|
2025 |
Auto and Electronics
|
|||||||||
|
Campbell, California
|
Engineering
|
1,710 |
Leased
|
2012 |
Electronics
|
|||||||||
|
Troy, Michigan
|
Sales
|
2,224 |
Leased
|
2016 |
Auto
|
|||||||||
|
Boston, Massachusetts
|
Administrative, Engineering, Research and Development
|
26,000 |
Leased
|
2016 |
Auto
|
|||||||||
|
Schertz, Texas
|
Warehouse and Distribution
|
32,000 |
Leased
|
2014 |
Auto
|
|||||||||
|
Melchor Muzquiz, Mexico
|
Manufacturing
|
39,365 |
Leased
|
2016 |
Auto
|
|||||||||
|
Savoy, Illinois
|
Warehouse
|
566 |
Leased
|
2012 |
Electrical
|
|||||||||
|
Piedras Negras, Mexico
|
Administrative / Manufacturing
|
99,822 |
Leased
|
2015 |
Auto
|
|||||||||
|
Piedras Negras, Mexico
|
Manufacturing
|
68,088 |
Leased
|
2012 |
Electrical
|
|||||||||
|
Piedras Negras, Mexico
|
Manufacturing
|
22,381 |
Leased
|
2012 |
Electrical
|
|||||||||
|
Piedras Negras, Mexico
|
Manufacturing
|
164,785 |
Owned
|
— |
Auto
|
|||||||||
|
Eagle Pass, Texas
|
Distribution
|
7,700 |
Leased
|
2016 |
Auto, Electronics and Electrical
|
|||||||||
|
Saskatoon, Canada
|
Manufacturing
|
67,500 |
Owned
|
— |
Electrical
|
|||||||||
|
Sao Paulo, Brazil
|
Sales
|
538 |
Leased
|
2012 |
Electronic and Auto
|
|||||||||
|
Manaus, Brazil
|
Warehouse
|
2,002 |
Leased
|
2012 |
Electronic and Auto
|
|||||||||
|
Roskilde, Denmark
|
Administrative, Manufacturing, Research and Development and Sales
|
18,740 |
Leased
|
2013 |
Electrical
|
|||||||||
|
Dubai, UAE
|
Sales
|
691 |
Leased
|
2012 |
Electrical
|
|||||||||
|
Dubai, UAE
|
Sales
|
1,356 |
Leased
|
2014 |
Electrical
|
|||||||||
|
Swindon, U.K.
|
Administrative
|
304 |
Leased
|
2012 |
Electronics
|
|||||||||
17
|
Location
|
Use
|
Size
(sq. ft.)
|
Lease/Own
|
Lease
Expiration
Date
|
Primary Product
|
||
|
Bremen, Germany
|
Administrative
|
13,455 |
Leased
|
2015 |
Auto, Electronics and Electrical
|
||
|
Essen, Germany
|
Administrative
|
8,378 |
Leased
|
2012 |
Auto and Electronics
|
||
|
Essen, Germany
|
Leased to third party
|
37,244 |
Owned
|
— | — | ||
|
Dünsen, Germany
|
Not in use/Idle
|
43,966 |
Owned
|
— |
Auto
|
||
|
Amsterdam, Netherlands
|
Warehouse
|
2,000 |
Leased
|
2012 |
Auto and Electronic
|
||
|
Dundalk, Ireland
|
Not in use/Idle
|
120,000 |
Owned
|
— |
Electronic
|
||
|
Singapore
|
Sales and Distribution
|
1,572 |
Leased
|
2012 |
Electronics
|
||
|
Taipei, Taiwan
|
Sales
|
7,876 |
Leased
|
2014 |
Electronics
|
||
|
Seoul, Korea
|
Sales
|
3,643 |
Leased
|
2012 |
Auto and Electronics
|
||
|
Lipa City, Philippines
|
Manufacturing
|
116,046 |
Owned
|
— |
Electronics
|
||
|
Lipa City, Philippines
|
Manufacturing
|
22,733 |
Leased
|
2012 |
Electronics
|
||
|
Dongguan, China
|
Manufacturing
|
24,600 |
Leased
|
2013 |
Electronics
|
||
|
Suzhou, China
|
Manufacturing
|
143,458 |
Owned
|
— |
Electronics
|
||
|
Beijing, China
|
Sales
|
452 |
Leased
|
2012 |
Electronics
|
||
|
Shenzen, China
|
Sales
|
3,100 |
Leased
|
2015 |
Electronics
|
||
|
Shanghai, China
|
Sales
|
4,774 |
Leased
|
2015 |
Electronics
|
||
|
Yangmei, Taiwan
|
Manufacturing, Sales, Distribution and Administrative
|
40,080 |
Owned
|
— |
Electronics
|
||
|
Chu-Pei City, Taiwan
|
Research and Development
|
5,328 |
Leased
|
2013 |
Electronics
|
||
|
Wuxi, China
|
Manufacturing
|
221,429 |
Owned
|
— |
Electronics
|
||
|
Hong Kong, China
|
Sales
|
2,478 |
Leased
|
2012 |
Electronics
|
||
|
Yokohama, Japan
|
Sales
|
3,509 |
Leased
|
2012 |
Electronics
|
||
Properties with lease expirations in 2012 renew at various times throughout the year. The company does not anticipate any material impact as a result of such expirations.
The company is not a party to any material legal proceedings, other than routine litigation incidental to our business.
Not applicable.
18
Shares of the company’s common stock are traded under the symbol “LFUS” on the NASDAQ Global Select Market
SM
. As of February 17, 2012, there were 105 holders of record of the company’s common stock.
Stock Performance Graph
The following stock performance graph and related information shall not be deemed “soliciting material” or “filed” with the Securities and Exchange Commission, nor shall such information be incorporated by reference into any future filings under the Securities Act of 1933 or Securities Act of 1934, each as amended, except to the extent that the company specifically incorporates it by reference into such filing.
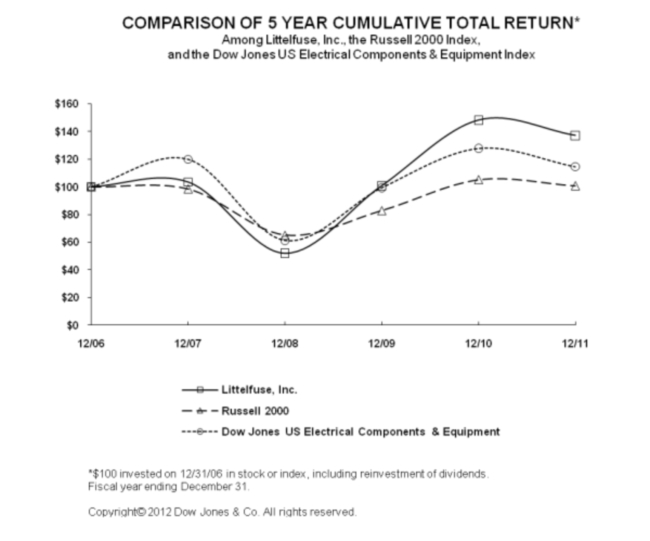
The following stock performance graph compares the five-year cumulative total return on Littelfuse common stock to the five-year cumulative total returns on the Russell 2000 Index and the Dow Jones Electrical Components and Equipment Industry Group Index. The company believes that the Russell 2000 Index and the Dow Jones Electrical Components and Equipment Industry Group Index represent a broad market index and peer industry group for total return performance comparison. The stock performance shown on the graph below represents historical stock performance and is not necessarily indicative of future stock price performance.
19
The Dow Jones Electrical Components and Equipment Industry Group Index includes the common stock of American Superconductor Corp.; Amphenol Corp.; Anaren Microwave, Inc.; Arrow Electronics, Inc.; Avnet, Inc.; AVX Corp.; Benchmark Electronics, Inc.; C&D Technologies, Inc.; Capstone Turbine Corp.; CTS Corp.; General Cable Corp.; Hubbell Inc. Class B; Jabil Circuit, Inc.; KEMET Corp.; Littelfuse, Inc.; Methode Electronics, Inc.; Molex, Inc. and Molex, Inc. Class A; Park Electrochemical Corp.; Plexus Corp.; Power-One, Inc.; Powerwave Technologies, Inc.; Pulse Electronics, Inc.; Regal-Beloit Corp.; Sanmina Corp.; Thomas & Betts Corp.; Valence Technology, Inc.; Vicor Corp.; and Vishay Intertechnology, Inc.
In the case of the Russell 2000 Index and the Dow Jones Electrical Components and Equipment Industry Group Index, a $100 investment made on December 31, 2006, and reinvestment of all dividends is assumed. In the case of the company, a $100 investment made on December 31, 2006, is assumed. (The company paid no dividends in 2006, 2007, 2008, or 2009 but did pay dividends in 2010 and 2011.) Returns for the company’s fiscal years presented above are as of the last day of the respective fiscal year which were December 29, 2007, December 27, 2008, January 2, 2010, January 1, 2011, and December 31, 2011, for the fiscal years 2007, 2008, 2009, 2010, and 2011 respectively.
The company initiated cash dividends in the fourth quarter of 2010. The company previously had not paid any cash dividends prior to fiscal 2010. Future dividend policy will be determined by the Board of Directors based upon its evaluation of earnings, cash availability and general business prospects. Currently, there are restrictions on the payment of dividends contained in the company’s credit agreements that relate to the maintenance of a minimum net worth and certain financial ratios. However, the company expects to continue paying cash dividends on a quarterly basis for the foreseeable future.
The Board of Directors authorized the repurchase of up to 1,000,000 shares of the company’s common stock under a program for the period May 1, 2011 to April 30, 2012, of which 859,029 shares were purchased, at an average price of $43.18, through December 31, 2011, and 140,971 shares remain available for purchase under the initial program as of December 31, 2011.
On October 28, 2011, the Board of Directors increased the share repurchase authorization from 1,000,000 shares to 1,500,000 shares. This provides authority to purchase up to 640,971 additional shares between October 28, 2011 and the April 30, 2012 expiration date.
The company withheld 20,537 shares of stock in lieu of withholding taxes on behalf of employees who became vested in restricted share units during fiscal 2011. Shares withheld were 16,512 during the period March 2, 2011 to April 30, 2011 and 4,025 during the period July 2, 2011 to July 30, 2011. Shares withheld are classified as Treasury stock on the Consolidated Balance Sheet.
The table below provides information with respect to the company’s quarterly stock prices and cash dividends declared and paid for each quarter during fiscal 2011 and 2010:
|
2011
|
2010
|
|||||||||||||||||||||||||||||||
| 4Q | 3Q | 2Q | 1Q | 4Q | 3Q | 2Q | 1Q | |||||||||||||||||||||||||
|
High
|
$ | 52.04 | $ | 61.76 | $ | 64.82 | $ | 58.10 | $ | 49.09 | $ | 44.65 | $ | 43.83 | $ | 40.18 | ||||||||||||||||
|
Low
|
38.65 | 38.56 | 54.40 | 48.44 | 41.39 | 30.74 | 30.54 | 28.30 | ||||||||||||||||||||||||
|
Close
|
42.98 | 40.21 | 60.54 | 58.10 | 47.06 | 43.79 | 31.32 | 38.13 | ||||||||||||||||||||||||
|
Dividends
|
0.18 | 0.15 | 0.15 | 0.15 | 0.15 | — | — | — | ||||||||||||||||||||||||
20
The information presented below provides selected financial data of the company during the past five fiscal years and should be read in conjunction with Management’s Discussion and Analysis of Financial Condition and Results of Operations and the Consolidated Financial Statements and Notes to Consolidated Financial Statements set forth in Item 7 and Item 8, respectively, for the respective years presented (amounts in thousands, except per share data):
|
2011
|
2010
|
2009
|
2008
|
2007
|
||||||||||||||||
|
Net sales
|
$ | 664,955 | $ | 608,021 | $ | 430,147 | $ | 530,869 | $ | 536,144 | ||||||||||
|
Gross profit
|
256,694 | 233,872 | 125,361 | 143,669 | 171,537 | |||||||||||||||
|
Operating income
|
113,904 | 107,574 | 13,695 | 8,495 | 51,309 | |||||||||||||||
|
Net income
|
87,024 | 78,663 | 9,411 | 8,016 | 36,835 | |||||||||||||||
|
Per share of common stock:
|
||||||||||||||||||||
|
Income from continuing operations
|
||||||||||||||||||||
|
- Basic
|
3.96 | 3.58 | 0.43 | 0.37 | 1.66 | |||||||||||||||
|
- Diluted
|
3.90 | 3.52 | 0.43 | 0.37 | 1.64 | |||||||||||||||
|
Cash dividends paid
|
0.63 | 0.15 | — | — | — | |||||||||||||||
|
Cash and cash equivalents
|
164,016 | 109,720 | 70,354 | 70,937 | 64,943 | |||||||||||||||
|
Total assets
|
678,424 | 621,129 | 533,127 | 538,928 | 491,365 | |||||||||||||||
|
Long-term debt, less current portion
|
— | 41,000 | 49,000 | 72,000 | 1,223 | |||||||||||||||
Littelfuse, Inc. and its subsidiaries (the “company” or “Littelfuse”) design, manufacture, and sell circuit protection devices for use in the electronics, automotive and electrical markets throughout the world. The following Management’s Discussion and Analysis of Financial Condition and Results of Operations (“MD&A”) is designed to provide the reader with information that will assist in understanding the company’s Consolidated Financial Statements, the changes in certain key items in those financial statements from year to year, and the primary factors that accounted for those changes, as well as how certain accounting principles affect the Consolidated Financial Statements. The discussion also provides information about the financial results of the various business unit segments to provide a better understanding of how those segments and their results affect the financial condition and results of operations of Littelfuse as a whole.
Business Segment Information
U.S.
Generally Accepted Accounting Principles
(“GAAP”) dictates annual and interim reporting standards for an enterprise's operating segments and related disclosures about its products, services, geographic areas and major customers. Within U.S. GAAP, an operating segment is defined as a component of an enterprise that engages in business activities from which it may earn revenues and incur expenses, and about which separate financial information is regularly evaluated by the Chief Operating Decision Maker (“CODM”) in deciding how to allocate resources. The CODM is the company’s President and Chief Executive Officer.
21
The company reports its operations by three business unit segments: Electronics, Automotive and Electrical. The following table is a summary of the company’s operating segments’ net sales by business unit and geography (in millions):
|
Fiscal Year
|
||||||||||||
|
2011
|
2010
(b)
|
2009
(b)
|
||||||||||
|
Business Unit
|
||||||||||||
|
Electronics
|
$ | 354.5 | $ | 373.4 | $ | 253.8 | ||||||
|
Automotive
(c)
|
197.6 | 139.1 | 104.6 | |||||||||
|
Electrical
(d)
|
112.9 | 95.5 | 71.7 | |||||||||
|
Total
|
$ | 665.0 | $ | 608.0 | $ | 430.1 | ||||||
|
Geography
(a)
|
||||||||||||
|
Americas
(c)
|
$ | 288.6 | $ | 227.7 | $ | 166.1 | ||||||
|
Europe
(d)
|
114.9 | 115.1 | 83.4 | |||||||||
|
Asia-Pacific
|
261.5 | 265.2 | 180.6 | |||||||||
|
Total
|
$ | 665.0 | $ | 608.0 | $ | 430.1 | ||||||
(a) Sales by geography represent sales to customer or distributor locations.
(b) During 2011, the company adjusted its business segment reporting methodology to report results by product line rather than by sales organization. Accordingly, results for 2010 and 2009 have been restated to reflect this change. There was no change to total consolidated results.
(c) 2011 includes Cole Hersee net sales of $46.9 million for fiscal year 2011.
(d) 2011 includes Selco net sales of $3.2 million for fiscal year 2011.
Business unit segment information is described more fully in Note 15 of the Notes to Consolidated Financial Statements. The following discussion provides an analysis of the information contained in the Consolidated Financial Statements and accompanying Notes to Consolidated Financial Statements at December 31, 2011 and January 1, 2011, and for the three fiscal years ended December 31, 2011, January 1, 2011 and January 2, 2010.
Results of Operations — 2011 compared with 2010
Net sales increased $57.0 million or 9% to $665.0 million for fiscal year 2011 compared to $608.0 million in fiscal year 2010 due primarily to an incremental $50.1 million from business acquisitions and growth in protection relays, custom mining products and automotive products, offset by lower electronics sales. The company also experienced $10.4 million in favorable foreign currency effects in 2011 as compared to 2010. The favorable foreign currency impact primarily resulted from sales denominated in euros and, to a lesser extent, Canadian dollars and Japanese yen. Excluding acquisitions and currency effects, net sales decreased $3.5 million or 1% year over year. The Automotive business segment sales increased $58.5 million or 42% to $197.6 million. The Electronics business segment sales decreased $18.9 million or 5% to $354.5 million, and the Electrical business segment sales increased $17.4 million or 18% to $112.9 million. Sales levels in 2011, excluding acquisitions and currency effects, were negatively impacted by slowing demand for the company’s electronics products coupled with inventory de-stocking in the supply chain. Sales levels in 2010 were positively impacted by the global economic recovery, distributor inventory replenishment and effective execution of the company’s strategic growth plans.
The increase in Automotive sales was primarily due to an incremental $46.9 million in sales related to Cole Hersee, organic growth in all regions and favorable currency effects. Excluding Cole Hersee, automotive sales increased $11.6 million or 8.4% year over year. Currency effects added $4.3 million to sales in 2011 compared to 2010 primarily due to the stronger euro.
22
The decrease in Electronics sales reflected slowing demand across all geographies coupled with inventory de-stocking in the supply chain. In addition, the effects of the Japan disaster in March 2011 negatively impacted sales by approximately $3 to $4 million in 2011. The negative impact from a decrease in volume was partially offset by net favorable currency effects of $4.0 million primarily from sales denominated in euros and Japanese yen.
The increase in Electrical sales was due to continued strong growth for protection relays and custom mining products and steady improvement in the industrial fuse market. This was partially offset by a slowdown in the solar market. The Electrical segment experienced net favorable currency effects of $2.0 million primarily from sales denominated in Canadian dollars.
On a geographic basis, sales in the Americas increased $60.8 million or 27% in 2011 compared to 2010. This increase resulted from increases in the company’s Automotive and Electrical business segments offset by a decline in the Electronics business segment. Automotive sales increased $46.8 million or 100% primarily reflecting incremental sales from Cole Hersee. Excluding Cole Hersee, Automotive sales increased $2.7 million or 6% reflecting increased demand in the passenger and commercial vehicle markets. Electrical sales increased $17.5 million or 21% resulting from increases in demand for protection relays, custom products and industrial power fuses partially offset by a decline in solar fuse sales. Electronics sales decreased $3.5 million or 4% reflecting slowing end-market demand and inventory de-stocking. The Americas region also experienced $1.9 million in favorable currency effects resulting from sales denominated in Canadian dollars.
Europe sales decreased $0.2 million for fiscal year 2011 compared to 2010. This resulted from decreases in the company’s Electronics and Electrical business segments offset by an increase in the Automotive business segment. Automotive sales increased $7.2 million or 12% in 2011 primarily reflecting increased end-market demand and favorable currency effects. Electronics sales decreased $6.9 million or 14% reflecting lower demand resulting from a weaker economy during 2011. Electrical sales decreased $0.5 million or 9%. Overall Europe sales in 2011 included favorable currency effects of $5.3 million, resulting from sales denominated in euros.
Asia-Pacific sales decreased $3.7 million or 1% in 2011 compared to 2010. This decrease resulted from a decrease in the Electronics business segment offset by increases at the company’s Automotive and Electrical business segments. Electronics sales decreased $8.5 million or 4% reflecting slowing end-market demand and inventory de-stocking. Automotive sales increased $ 4.4 million or 14% reflecting continued increased demand for passenger vehicles in the developing Asian markets as well as gains in market share. Also contributing to the increase in Automotive sales was incremental sales from Cole Hersee. Excluding Cole Hersee, Automotive sales increased $2.3 million or 7%. Electrical sales increased $0.4 million or 7%. Current year results included favorable currency effects of $3.2 million resulting from sales denominated in Japanese yen, Korean won and Chinese renminbi.
Gross profit was $256.7 million or 38.6% of sales in 2011, compared to $233.9 million or 38.5% of sales in 2010. Gross profit in 2011 was negatively impacted by $4.1 million of purchase accounting adjustments recorded in cost of sales. These charges were the additional cost of goods sold for Cole Hersee and Selco inventory which had been stepped-up to fair value at the acquisition dates as required by purchase accounting rules. Excluding the impact of these charges, gross profit was $260.8 million or 39.2% of sales for 2011. The improvement in gross margin was attributable to improved operating leverage resulting from higher production volumes in 2011 as well as cost reductions related to manufacturing transfers.
23
Total operating expense was $142.8 million or 21.5% of net sales for 2011 compared to $126.3 million or 20.8% of net sales for 2010. The increase in operating expenses primarily reflects incremental operating expenses of $12.8 million from business acquisitions.
Operating income was $113.9 million or 17.1% of net sales in 2011 compared to $107.6 million or 17.7% of net sales in the prior year. The increase in operating income in the current year was due primarily to the increase in sales and reduction in costs as described above.
Interest expense, net, increased to $1.7 million in 2011 compared to $1.4 million for 2010 primarily due to amortization of debt issuance costs incurred related to the new credit agreement in 2011.
Other expense (income), net, consisting of interest income, royalties, non-operating income and foreign currency items, was $2.9 million of income in 2011 compared to $1.5 million of income in 2010. The year over year increase resulted primarily from dividend and royalty income.
Income before income taxes was $115.1 million in 2011 compared to $107.7 million in 2010. Income tax expense was $28.1 million in 2011 compared to $29.0 million in 2010. The 2011 effective income tax rate was 24.4% compared to 27.0% in 2010. The decrease in the 2011 effective tax rate reflects more income earned in low tax jurisdictions and a large tax benefit from revaluation of a deferred tax asset in 2011.
Results of Operations — 2010 Compared with 2009
Net sales increased in 2010 to $608.0 million compared to $430.1 million in 2009 reflecting strong growth in all market segments and geographies. The Automotive business segment sales increased $34.5 million or 33% to $139.1 million. The Electronics business segment sales increased $119.6 million or 47% to $373.4 million, and the Electrical business segment sales increased $23.8 million or 33% to $95.5 million. Sales levels were negatively impacted in 2009 due to the sharp downturn in the global economy and credit crisis. The strong revenue growth in 2010 was the result of the global economic recovery, distributor inventory replenishment and effective execution of the company’s strategic growth plans. The company experienced $1.4 million in favorable currency effects in 2010 as compared to 2009. This favorable impact resulted primarily from sales denominated in the Canadian dollar, Japanese yen and Korean won and were offset by the unfavorable impact of sales denominated in euros.
The increase in Automotive sales was due to continued growth in Asian demand for passenger vehicles and recovery in the North American and European passenger vehicle and commercial vehicle products. The positive impact from increases in sales volume in 2010 was partially offset by unfavorable currency effects of $1.9 million mainly due to the weaker euro.
The increase in Electronics sales reflected stronger demand and distributor inventory replenishment in all three geographic regions as well as successful new product introductions and other market share gains. The positive impact from an increase in volume was offset by net unfavorable currency effects of $0.3 million largely due to the weakness of the euro, partially offset by the favorable impact of a stronger Japanese yen and Korean won.
24
The increase in Electrical sales was due to continued strong growth for protection relays and custom products driven primarily by strength in the potash mining market. Additionally, electrical fuse products realized steady improvement in demand as the industrial market continued to recover in 2010. The Electrical segment experienced net favorable currency effects of $3.6 million primarily from sales denominated in the Canadian dollar.
On a geographic basis, sales in the Americas increased $61.6 million or 37% in 2010 compared to 2009. This increase resulted from increases at all three of the company’s business segments. Automotive sales increased $9.1 million or 24% primarily reflecting recovery in the passenger vehicle market. Electronics sales increased $34.1 million or 55% reflecting strong end market demand and distributor restocking. Electrical sales increased $18.4 million or 28% resulting from an increase in demand for protection relays, custom products and power fuses. The Americas region also experienced $3.6 million in favorable currency effects resulting from sales denominated in the Canadian dollar.
Europe sales increased $31.7 million or 38% in 2010 compared to 2009. This increase resulted from increases at all three of the company’s business segments. Automotive sales increased $14.1 million or 31% reflecting strong end market demand and increased car production resulting from the economic recovery in Europe during 2010. Electronics sales increased $14.7 million or 42% reflecting strong end market demand and distributor inventory replenishment. Electrical sales increased $2.9 million. Current year results included unfavorable currency effects of $5.6 million, reflecting a weaker euro in 2010.
Asia-Pacific sales increased $84.6 million or 47% in 2010 compared to 2009. This increase resulted from increases at all three of the company’s business segments. Automotive sales increased $11.3 million or 54% reflecting continued increased demand for passenger vehicles in the developing Asian markets as well as gains in market share. Electronics sales increased $70.8 million or 45% primarily reflecting growth in demand for consumer products and restocking by distributors. Electrical sales increased $2.5 million or 80%. Current year results included favorable currency translation effects of $3.2 million primarily due to the impact of a stronger Japanese yen and Korean won.
Gross profit was $233.9 million or 38.5% of sales in 2010, compared to $125.4 million or 29.1% of sales in 2009. The increase in gross profit margin percentage in 2010 resulted from operating leverage on higher sales, an improved cost structure due to consolidation of manufacturing facilities and the impact of restructuring activities in 2009. The company recorded approximately $4.2 million of restructuring charges in cost of sales in 2009 due primarily to the reorganization of the company’s European and Asian operations. The European restructuring charges included the transfer of its manufacturing operations from Dünsen, Germany, to Piedras Negras, Mexico. The Asian restructuring included the planned closure of a manufacturing facility in Taiwan.
Total operating expense was $126.3 million or 20.8% of net sales for 2010 compared to $111.7 million or 26.0% of net sales for 2009. The increase in operating expenses primarily reflects the increased cost of company incentive programs driven by significantly improved financial performance in 2010. Higher transportation costs driven by higher sales volumes also contributed to the increase in operating expenses. Operating expenses as a percentage of sales improved in 2010 as compared to 2009 as a result of cost reduction plans initiated in 2009 resulting in improved operating efficiencies across the company.
Operating income was $107.6 million or 17.7% of net sales in 2010 compared to $13.7 million or 3.2% of net sales in the prior year. The increase in operating income in the current year was due primarily to the increase in sales and reduction in costs as described above.
Interest expense, net, decreased to $1.4 million in 2010 compared to $2.4 million for 2009 primarily due to lower borrowing in 2010.
25
Other expense (income), net, consisting of interest income, royalties, non-operating income and foreign currency items, was $1.5 million of income in 2010 compared to $0.5 million of expense in 2009. The increase reflected a favorable net change of approximately $1.3 million in foreign currency translation effects primarily due to the strengthening of the Philippine peso and Mexican peso against the U.S. dollar.
Income before income taxes was $107.7 million in 2010 compared to $10.8 million in 2009. Income tax expense was $29.0 million in 2010 compared to $1.4 million in 2009. The 2010 effective income tax rate was 27.0% compared to 13.2% in 2009. The increase in the 2010 effective tax rate reflects more income earned in high tax jurisdictions in 2010 (primarily the U.S.) as well as the favorable effects of one-time tax adjustments in 2009.
Liquidity and Capital Resources
As of December 31, 2011, $156.1 million of the $164.0 million of the company’s cash and cash equivalents was held by foreign subsidiaries. Of the $156.1 million held by foreign subsidiaries, approximately $38.0 million could be repatriated with no tax consequences. The company expects to maintain its foreign cash balances (other than the aforementioned $38.0 million) for local operating requirements, to provide funds for future capital expenditures and for potential acquisitions. The company does not expect to repatriate these funds to the U.S.
The company historically has financed capital expenditures through cash flows from operations. Management expects that cash flows from operations and available lines of credit will be sufficient to support both the company’s operations and its debt obligations for the foreseeable future.
Term Loan
On September 29, 2008, the company entered into a Loan Agreement with various lenders that provided the company with a five-year term loan facility of up to $80.0 million for the purposes of (i) refinancing certain existing indebtedness; (ii) funding working capital needs; and (iii) funding capital expenditures and other lawful corporate purposes, including permitted acquisitions. The company terminated this loan agreement on June 13, 2011 at which time any outstanding amounts were refinanced under the company’s new revolving credit facility effective June 13, 2011.
Revolving Credit Facilities
The company had an unsecured domestic financing arrangement, which expired on July 21, 2011, consisting of a credit agreement with banks that provided a $75.0 million revolving credit facility, with a potential to increase up to $125.0 million upon request of the company and agreement with the lenders. The company refinanced this loan agreement with proceeds from a new revolving credit facility on June 13, 2011.
On June 13, 2011, the company entered into a new credit agreement with certain commercial banks that provides an unsecured revolving credit facility in an amount of up to $150.0 million, with a potential to increase up to $225.0 million. At December 31, 2011, the company had available $64.4 million of borrowing capacity under the revolver credit agreement at an interest rate of LIBOR plus 1.25% (1.55% as of December 31, 2011). The credit agreement replaces the company’s previous credit agreement dated July 21, 2006 and term loan agreement dated September 29, 2008, and, unless terminated earlier, will terminate on June 13, 2016. During the second quarter of 2011, $0.2 million of previously capitalized debt issuance costs were written off and $0.7 million of new debt issuance costs incurred were capitalized and will be amortized over the life of the new credit agreement.
26
This arrangement contains covenants that, among other matters, impose limitations on the incurrence of additional indebtedness, future mergers, sales of assets, payment of dividends, and changes in control, as defined in the agreement. In addition, the company is required to satisfy certain financial covenants and tests relating to, among other matters, interest coverage, working capital, leverage and net worth. At December 31, 2011, the company was in compliance with all covenants under the revolving credit facility.
During the second quarter of 2011, as part of the new refinancing arrangement discussed above, $47.0 million of indebtedness that was due on the previous term loan was settled and rolled-over into the revolving credit facility by the lender.
Other Obligations
For the fiscal year ended December 31, 2011, the company had $0.8 million outstanding in letters of credit. No amounts were drawn under these letters of credit at December 31, 2011. For the fiscal year ended January 1, 2011, the company had $2.3 million available in letters of credit. No amounts were drawn under these letters of credit at January 1, 2011.
Cash Flows and Working Capital
The company started 2011 with $109.7 million of cash. Net cash provided by operating activities in 2011 was approximately $120.8 million and included $87.0 million in net income and $39.6 million in non-cash adjustments (primarily $32.3 million in depreciation and amortization), partially offset by $5.8 million of changes in operating assets and liabilities.
Changes in operating assets and liabilities in 2011 (including short-term and long-term items) that negatively impacted cash flows in 2011 consisted of decreases in accounts payble ($5.3 million), accrued expenses including post-retirement ($0.4 million), accrued payroll and severance ($3.2 million), and accrued taxes ($6.1 million). The decrease in accounts payable resulted from decreased purchases related to low production levels at the end of 2011. The decrease in accrued payroll and severance resulted from lower severance accruals in 2011. Positively impacting cash flows were decreases in accounts receivable ($4.8 million), a decrease in inventory ($2.6 million) and, a decrease in prepaid expenses and other current assets ($1.8 million).
Net cash used in investing activities in 2011 was approximately $48.6 million and included $17.6 million in purchases of property, plant and equipment (primarily production equipment for capacity expansion and new products at the company’s facilities in Mexico, China and the Philippines), $14.2 million for purchases of short-term investments, $11.1 million for the acquisition of Selco and $6.0 million for a minority investment in a start-up technology company.
Net cash used in financing activities in 2011 was approximately $14.1 million, which included $11.0 million in net proceeds from borrowing and $23.0 million in cash proceeds from the exercise of stock options. Additionally the company repurchased $37.1 million of its common stock during 2011 and paid cash dividends of $14.5 million during the year. The net payments from debt include $47.0 million on the previous term loan that was settled and rolled-over into the revolving credit facility by the lender as discussed above. Further information regarding the company’s debt is provided in Note 6 of the Notes to Consolidated Financial Statements included in this report.
27
The effect of exchange rate changes decreased cash by $3.8 million in 2011. The net cash provided by operating activities less net cash used in financing and investing activities plus the effect of exchange rate changes, resulted in a $54.3 million increase in cash and cash equivalents in 2011. This left the company with a cash balance of $164.0 million at the end of 2011.
Days sales outstanding (DSO) in accounts receivable decreased to 57 days at year-end 2011 compared to 58 days at year-end 2010 (excluding the year-end Cole Hersee balance) and 61 days at year-end 2009. Days inventory outstanding was 73 days at year-end 2011, compared to 70 days at year-end 2010 (excluding the year-end Cole Hersee balance) and 62 days at year-end 2009.
The ratio of current assets to current liabilities was 2.5 to 1 at year-end 2011, compared to 2.9 to 1 at year-end 2010 and 3.2 to 1 at year-end 2009. The change in the current ratio at the end of 2011 compared to the prior year reflected increased current liabilities in 2011, primarily related to higher current portion of long term debt balances. The carrying amounts of total debt increased $11.0 million in 2011, compared to an increase of $10.8 million in 2011 and a decrease of $16.8 million in 2009, due to an increase in the amount borrowed under the revolving credit facility in 2010. The ratio of long-term debt to equity was 0.00 to 1 at year-end 2011, compared to 0.09 to 1 at year-end 2010 and 0.13 to 1 at year-end 2009. Further information regarding the company’s debt is provided in Note 6 of the Notes to Consolidated Financial Statements included in this report.
The company started 2010 with $70.4 million of cash. Net cash provided by operating activities in 2010 was approximately $104.1 million in the year and included $78.7 million in net income and $46.1 million in non-cash adjustments (primarily $32.0 million in depreciation and amortization), partially offset by $20.7 million of changes in operating assets and liabilities.
Changes in various operating assets and liabilities (including short-term and long-term items) that negatively impacted cash flows in 2010 consisted of increases in accounts receivable ($12.8 million), a decrease in accounts payable ($1.8 million) and accrued expenses including post-retirement ($13.6 million). The increase in accounts receivable resulted from increased sales activity. Additionally, the company made contributions to its domestic and foreign pension plans of $16.2 million in 2010. Positively impacting cash flows were increases in accrued payroll and severance ($2.4 million), accrued taxes ($14.9 million), accounts payable ($15.1 million) and a decrease in prepaid expenses and other current assets ($5.4 million).
The company’s capital expenditures were $17.6 million in 2011, $22.4 million in 2010, and $15.5 million in 2009. The company expects capital expenditures in 2012 to increase to between $32 and $36 million primarily related to building expansions in Canada, the Philippines and Mexico to support the company’s growth initiatives. The company expects to fund 2012 capital expenditures from operating cash flows.
The company’s Board of Directors authorized the repurchase of up to 1,000,000 shares of the company’s common stock under a program for the period May 1, 2011 to April 30, 2012. The company repurchased 859,029 shares of its common stock during 2011 under this program.
On October 28, 2011, the Board of Directors increased the share repurchase authorization from 1,000,000 shares to 1,500,000 shares. This increase provided authority to purchase up to 640,971 additional shares between October 28, 2011 and the April 30, 2012 expiration date as of December 31, 2011. The company withheld 20,537 shares of stock in lieu of withholding taxes on behalf of employees who became vested in restricted stock option grants during 2011.
28
Contractual Obligations and Commitments
The following table summarizes contractual obligations and commitments as of December 31, 2011:
|
(In thousands )
|
Total
|
< 1 Year
|
> 1 - < 3 Years
|
> 3 - < 5 Years
|
> 5 Years
|
|||||||||||||||
|
Revolving credit facility
|
$ | 85,000 | $ | 85,000 | $ | — | $ | — | $ | — | ||||||||||
|
Supplemental Executive
Retirement Plan
|
2,366 | 31 | 62 | 62 | 2,211 | |||||||||||||||
|
Operating lease payments
|
36,247 | 6,167 | 8,033 | 5,553 | 16,494 | |||||||||||||||
|
Purchase obligations
|
19,934 | 19,934 | — | — | — | |||||||||||||||
|
Total
|
$ | 143,547 | $ | 111,132 | $ | 8,095 | $ | 5,615 | $ | 18,705 | ||||||||||
Off-Balance Sheet Arrangements
As of December 31, 2011, the company did not have any off-balance sheet arrangements, as defined under SEC rules. Specifically, the company was not liable for guarantees of indebtedness owed by third parties; the company was not directly liable for the debt of any unconsolidated entity, and the company did not have any retained or contingent interest in assets; and the company does not participate in transactions that generate relationships with unconsolidated entities or financial partnerships, such as entities often referred to as structured finance or special purpose entities. In 2009, the company entered into derivative financial instruments. Further information regarding these arrangements is provided in Note 7 of the Notes to Consolidated Financial Statements included in this report.
Recent Accounting Pronouncements
In May 2011, the Financial Accounting Standards Board (“FASB”) issued authoritative guidance that provides a consistent definition of fair value and ensures that the fair value measurement and disclosure requirements are similar between U.S. GAAP and International Financial Reporting Standards. The new guidance changes certain fair value measurement principles and enhances the disclosure requirements particularly for Level 3 fair value measurements. The new guidance will be effective for the company as of January 1, 2012 and will be applied prospectively. The adoption of this guidance is not expected to have a material impact on the company’s consolidated financial statements.
In June 2011, the FASB issued authoritative guidance that will require companies to present the components of net income and other comprehensive income either as one continuous statement or as two consecutive statements. It eliminates the option to present components of other comprehensive income as part of the statement of changes in stockholders’ equity. The guidance does not change the items which must be reported in other comprehensive income, how such items are measured or when they must be reclassified to net income. This guidance is effective for interim and annual periods beginning after December 15, 2011. Because this guidance impacts presentation only, it will have no effect on the company’s consolidated financial statements.
In September 2011, the FASB issued authoritative guidance on testing goodwill for impairment. Under the revised guidance, entities testing goodwill for impairment have the option of performing a qualitative assessment before calculating the fair value of the reporting unit (i.e., step 1 of the goodwill impairment test). If entities determine, on the basis of qualitative factors, that the fair value of the reporting unit is more likely than not less than the carrying amount, the two-step impairment test would be required. The guidance does not change how goodwill is calculated or assigned to reporting units, nor does it revise the requirement to test goodwill annually for impairment. In addition, the guidance does not amend the requirement to test goodwill for impairment between annual tests if events or circumstances warrant; however, it does revise the examples of events and circumstances that an entity should consider. The amendments are effective for annual and interim goodwill impairment tests performed for fiscal years beginning after December 15, 2011. Early adoption is permitted; however the company did not adopt this guidance early. The company is evaluating the impact of adopting the new guidance but currently believes there will be no material impact on its consolidated financial statements. Goodwill testing was completed in October 2011 using the previous methodology, as permitted.
29
Critical Accounting Policies and Estimates
Certain of the accounting policies as discussed below require the application of significant judgment by management in selecting the appropriate estimates and assumptions for calculating amounts to record in the financial statements. Actual results could differ from those estimates and assumptions, impacting the reported results of operations and financial position. Significant accounting policies are more fully described in the Notes to Consolidated Financial Statements included elsewhere in this Annual Report. Certain accounting policies, however, are considered to be critical in that they are most important to the depiction of the company’s financial condition and results of operations and their application requires management’s subjective judgment in making estimates about the effect of matters that are inherently uncertain. The company believes the following accounting policies are the most critical to aid in fully understanding and evaluating its reported financial results, as they require management’s most difficult, subjective or complex judgments, resulting from the need to make estimates about the effect of matters that are inherently uncertain. The company has reviewed these critical accounting policies and related disclosures with the Audit Committee of its Board of Directors.
Net Sales
Revenue Recognition
: The company recognizes revenue on product sales in the period in which the sales process is complete. This generally occurs when products are shipped (FOB origin) to the customer in accordance with the terms of the sale, the risk of loss has been transferred, collectability is reasonably assured and the pricing is fixed and determinable. At the end of each period, for those shipments where title to the products and the risk of loss and rewards of ownership do not transfer until the product has been received by the customer, the company adjusts revenues and cost of sales for the delay between the time that the products are shipped and when they are received by the customer. The company’s distribution channels are primarily through direct sales and independent third party distributors.
Revenue and Billing
: The company accepts orders from customers based on long term purchasing contracts and written sales agreements. Contract pricing and selling agreement terms are based on market factors, costs and competition. Pricing normally is negotiated as an adjustment (premium or discount) from the company’s published price lists. The customer is invoiced when the company’s products are shipped to them in accordance with the terms of the sales agreement.
Returns and Credits
: Some of the terms of the company’s sales agreements and normal business conditions provide customers (distributors) the ability to receive price adjustments on products previously shipped and invoiced. This practice is common in the industry and is referred to as a “ship and debit” program. This program allows the distributor to debit the company for the difference between the distributors’ contracted price and a lower price for specific transactions. Under certain circumstances (usually in a competitive situation or large volume opportunity), a distributor will request authorization to reduce its price to its buyer. If the company approves such a reduction, the distributor is authorized to “debit” its account for the difference between the contracted price and the lower approved price. The company establishes reserves for this program based on historic activity and actual authorizations for the debit and recognizes these debits as a reduction of revenue.
30
The company has a return to stock policy whereby a customer with previous authorization from Littelfuse management can return previously purchased goods for full or partial credit. The company establishes an estimated allowance for these returns based on historic activity. Sales revenue and cost of sales are reduced to anticipate estimated returns.
The company properly meets all of the criteria for recognizing revenue when the right of return exists. Specifically, the company meets those requirements because:
|
|
1.
|
The company’s selling price is fixed or determinable at the date of the sale.
|
|
|
2.
|
The company has policies and procedures to accept only credit worthy customers with the ability to pay the company.
|
|
|
3.
|
The company’s customers are obligated to pay the company under the contract and the obligation is not contingent on the resale of the product. (All “ship and debit” and “returns to stock” require specific circumstances and authorization.)
|
|
|
4.
|
The risk ownership transfers to the company’s customers upon shipment and is not changed in the event of theft, physical destruction or damage of the product.
|
|
|
5.
|
The company bills at the ship date and establishes a reserve to reduce revenue from the in-transit time until the product is delivered for FOB destination sales.
|
|
|
6.
|
The company’s customers acquiring the product for resale have economic substance apart from that provided by Littelfuse. All distributors are independent of the company.
|
|
|
7.
|
The company does not have any obligations for future performance to bring about resale of the product by its customers.
|
|
|
8.
|
The company can reasonably estimate the amount of future returns.
|
Volume Rebates:
The company offers incentives to certain customers to achieve specific quarterly or annual sales targets. If customers achieve their sales targets, they are entitled to rebates. The company estimates the future cost of these rebates and recognizes this estimated cost as a reduction to revenue as products are sold.
Allowance for Doubtful Accounts:
The company evaluates the collectability of its trade receivables based on a combination of factors. The company regularly analyzes its significant customer accounts and, when the company becomes aware of a specific customer’s inability to meet its financial obligations, the company records a specific reserve for bad debt to reduce the related receivable to the amount the company reasonably believes is collectible. The company also records allowances for all other customers based on a variety of factors including the length of time the receivables are past due, the financial health of the customer, macroeconomic considerations and past experience. Historically, the allowance for doubtful accounts has been adequate to cover bad debts. If circumstances related to specific customers change, the estimates of the recoverability of receivables could be further adjusted.
Inventory
The company performs regular detailed assessments of inventory, which include a review of, among other factors, demand requirements, product life cycle and development plans, component cost trends, product pricing, shelf life and quality issues. Based on the analysis, the company records adjustments to inventory for excess quantities, obsolescence or impairment when appropriate to reflect inventory at net realizable value. Historically, inventory reserves have been adequate to reflect inventory at net realizable values. During 2011 and 2010, the company was required to step up the value of inventory acquired in business combinations to its selling prices less the cost to sell under business combination accounting. This was aproximately $3.7 million in 2010 for Cole Hersee and $0.4 million in 2011 for Selco A/S.
31
Goodwill and Other Intangible Assets
The company annually tests goodwill for impairment on the first day of its fiscal fourth quarter or at an interim date if there is an event or change in circumstances that indicates the asset may be impaired. The company has seven reporting units for goodwill testing purposes. Management determines the fair value of each of its reporting units by using a discounted cash flow model (which includes forecasted five-year income statement and working capital projections, a market-based weighted average cost of capital and terminal values after five years) to estimate market value. In addition, the company compares its derived enterprise value on a consolidated basis to the company’s market capitalization as of its test date to ensure its derived value approximates the market value of the company when taken as a whole.
As of the most recent annual test conducted on October 1, 2011, the company concluded the fair value of each of the reporting units exceeded its carrying value of invested capital and therefore, no potential goodwill impairment existed. Specifically, the company noted that its headroom, defined as the excess of fair value over the carrying value of invested capital, was 84%, 96%, 41%, 14%, 88%, 131%, and 42% for its electronics (non-silicon), electronics (silicon), automotive (excluding Cole Hersee), Cole Hersee, relay, custom products, and fuse reporting units, respectively, at October 1, 2011. Certain key assumptions used in the annual test included a discount rate of 14.5% for all reporting units except for Cole Hersee and a discount rate of 14.2% for Cole Hersee. A long-term growth rate of 3.0% was used for all seven reporting units.
In addition, the company performed a sensitivity test at October 1, 2011 that showed either a 100 basis point increase in its discount rate or a 100 basis point decrease in the long-term growth rate for each reporting unit would not have changed the company’s conclusion that no potential goodwill impairment existed at October 1, 2011.
The company will continue to perform a goodwill impairment test as required on an annual basis and on an interim basis, if certain conditions exist. Factors the company considers important, which could result in changes to its estimates, include underperformance relative to historical or projected future operating results and declines in acquisitions and trading multiples. Due to the diverse end user base and non-discretionary product demand, the company does not believe its future operating results will vary significantly relative to its historical and projected future operating results.
Long-Lived Assets
The company evaluates long-lived asset groups on an ongoing basis. Long-lived asset groups are reviewed for impairment whenever events or changes in circumstances indicate that the carrying amount of the related asset may not be recoverable. Recoverability of assets to be held and used is measured by a comparison of the carrying amount of the asset to future undiscounted cash flows expected to be generated by the asset group. If it is determined to be impaired, the impairment recognized is measured by the amount by which the carrying value of the asset exceeds its fair value. The company’s estimates of future cash flows from such assets could be impacted if it underperforms relative to historical or projected future operating results. The company recorded asset impairment charges of $2.3 million, $3.0 million and $0.8 million for the fiscal years ended 2011, 2010 and 2009 respectively. Further information regarding asset impairments is provided in Note 11 of the Notes to Consolidated Financial Statements included in this report.
32
Environmental Liabilities
Environmental liabilities are accrued based on estimates of the probability of potential future environmental exposure. Expenses related to on-going maintenance of environmental sites are expensed as incurred. If actual or estimated probable future losses exceed the company’s recorded liability for such claims, it would record additional charges as other expense during the period in which the actual loss or change in estimate occurred.
Pension and
Supplemental Executive Retirement Plan
Littelfuse has a number of company-sponsored defined benefit plans primarily in North America, Europe and the Asia-Pacific region. The company recognizes the full unfunded status of these plans on the balance sheet. Actuarial gains and losses and prior service costs and credits are recognized as a component of accumulated other comprehensive income. Accounting for pensions requires estimating the future benefit cost and recognizing the cost over the employee’s expected period of employment with the company. Certain assumptions are required in the calculation of pension costs and obligations. These assumptions include the discount rate, salary scales and the expected long-term rate of return on plan assets. The discount rate is intended to represent the rate at which pension benefit obligations could be settled by purchase of an annuity contract. These assumptions are subject to change based on stock and bond market returns and other economic factors. Actual results that differ from the company’s assumptions are accumulated and amortized over future periods and, therefore, generally affect its recognized expense and accrued liability in such future periods. While the company believes that its assumptions are appropriate given current economic conditions and its actual experience, significant differences in results or significant changes in the company’s assumptions may materially affect its pension obligations and related future expense. Further information regarding these plans is provided in Note 12 of the Notes to Consolidated Financial Statements included in this report.
Stock-based Compensation
Stock-based compensation expense is recorded for stock-option grants and restricted share units based upon the fair values of the awards. The fair value of stock option awards is estimated at the grant date using the Black-Scholes option pricing model, which includes assumptions for volatility, expected term, risk-free interest rate and dividend yield. Expected volatility is based on implied volatilities from traded options on Littelfuse stock, historical volatility of Littelfuse stock and other factors. Historical data is used to estimate employee termination experience and the expected term of the options. The risk-free interest rate is based on the U.S. Treasury yield curve in effect at the time of grant. The company initiated a quarterly cash dividend in 2010 and expects to continue making cash dividend payments in the foreseeable future.
Total stock-based compensation expense was $5.8 million, $5.2 million and $5.5 million in 2011, 2010 and 2009, respectively. Further information regarding this expense is provided in Note 13 of the Notes to Consolidated Financial Statements included in this report.
Income Taxes
The company accounts for income taxes using the liability method. Deferred taxes are recognized for the future effects of temporary differences between financial and income tax reporting using tax rates in effect for the years in which the differences are expected to reverse. The company recognizes deferred taxes for temporary differences, operating loss carryforwards and tax credit carryforwards. Deferred tax assets are reduced by a valuation allowance if it is more likely than not that some portion, or all, of the deferred tax assets will not be realized. Federal and state income taxes are provided on the portion of foreign income that is expected to be remitted to the U.S. and be taxable.
33
The company recognizes the tax benefit from an uncertain tax position only if it is more likely than not that the tax position will be sustained on examination by the taxing authorities, based on the technical merits of the position. The tax benefits recognized in the financial statements from such a position are measured based on the largest benefit that has a greater than 50% likelihood of being realized upon ultimate settlement.
Further information regarding income taxes, including a detailed reconciliation of current year activity, is provided in Note 14 of the Notes to Consolidated Financial Statements included in this report.
Outlook
The company’s 2011 revenue, excluding acquisitions, was slightly (1%) better than 2010. Total revenue, including acquisitions was $665.0 million in 2011 compared to revenue of $608.0 million in 2010. Strong organic growth in the Electrical (15%) and Automotive (9%) segments were offset by a decline in the Electronics segment. Revenues for 2012 are expected to be in the range of $680.0 to $720.0 million. Capital expenditures are expected to be in the range of $32.0 to $36.0 million.
The company is exposed to market risk from changes in interest rates, foreign exchange rates and commodities.
Interest Rates
The company had $85.0 million in debt outstanding at December 31, 2011, related to the unsecured revolving credit facility, which is described in Item 7 under
Liquidity and Capital Resources
. While this debt has a variable interest rate of LIBOR plus 1.25%, the company’s interest expense is not materially sensitive to changes in interest rate levels since debt levels and potential interest expense increases are insignificant relative to earnings.
Foreign Exchange Rates
The majority of the company’s operations consist of manufacturing and sales activities in foreign countries. The company has manufacturing facilities in Mexico, Canada, Denmark, China, Taiwan and the Philippines. During 2011, sales to customers outside the U.S. were approximately 66% of total net sales. Substantially all sales in Europe are denominated in euros and substantially all sales in the Asia-Pacific region are denominated in U.S. dollars, Japanese yen, Korean won, Chinese yuan and Taiwanese dollars.
The company’s foreign exchange exposures result primarily from sale of products in foreign currencies, foreign currency denominated purchases, employee-related and other costs of running operations in foreign countries and translation of balance sheet accounts denominated in foreign currencies. The company’s most significant long exposure is to the euro, with lesser long exposures to the Canadian dollar, Japanese yen and Korean won. The company’s most significant short exposures are to the Mexican peso, Philippine peso and Chinese yuan. Changes in foreign exchange rates could affect the company’s sales, costs, balance sheet values and earnings. The company uses netting and offsetting intercompany account management techniques to reduce known foreign currency exposures where possible and also, from time to time, utilizes derivative instruments to hedge certain foreign currency exposures deemed to be material.
34
Commodities
The company uses various metals in the manufacturing of its products, including copper, zinc, tin, gold and silver. Prices of these commodities can and do fluctuate significantly, which can impact the company’s earnings. The most significant of these exposures is to copper, zinc, gold, and silver where at current prices and volumes, a 10% price change would affect annual pre-tax profit by approximately $2.0 million for copper, $0.6 million for zinc, $0.7 million for gold, and $0.6 million for silver. During 2011, the increase in gold and silver prices caused these commodities to become major cost components.
The cost of oil fluctuated dramatically over the past several years. Consequently, there is a risk that a return to high prices for oil and electricity in 2012 could have a significant impact on the company’s transportation and utility expenses.
While the company is exposed to significant changes in certain commodity prices and foreign currency exchange rates, the company actively monitors these exposures and takes various actions to mitigate any negative impacts of these exposures.
35
|
Index
|
Page
|
|
|
Report of Independent Registered Public Accounting Firm – Consolidated Financial Statements
|
37
|
|
|
Report of Independent Registered Public Accounting Firm – Internal Control Over Financial Reporting
|
38
|
|
|
Consolidated Financial Statements
|
||
|
Consolidated Balance Sheets
|
39
|
|
|
Consolidated Statements of Income
|
40
|
|
|
Consolidated Statements of Cash Flows
|
41
|
|
|
Consolidated Statements of Equity
|
42
|
|
|
Notes to Consolidated Financial Statements
|
||
|
1. Summary of Significant Accounting Policies and Other Information
|
43
|
|
|
2. Acquisition of Businesses
|
49
|
|
|
3. Inventories
|
50
|
|
|
4. Goodwill and Other Intangible Assets
|
51
|
|
|
5. Investments
|
52
|
|
|
6. Debt
|
52
|
|
|
7. Financial Instruments and Risk Management
|
54
|
|
|
8. Fair Value of Financial Assets and Liabilities
|
55
|
|
|
9. Restructuring
|
57
|
|
|
10. Coal Mine Liability
|
57
|
|
|
11. Asset Impairments
|
58
|
|
|
12. Benefit Plans
|
58
|
|
|
13. Shareholders’ Equity
|
64
|
|
|
14. Income Taxes
|
66
|
|
|
15. Business Unit Segment Information 71
|
68
|
|
|
16. Lease Commitments
|
71
|
|
|
17. Earnings Per Share
|
71
|
|
|
18. Selected Quarterly Financial Data (Unaudited)
|
72
|
|
36
REPORT OF INDEPENDENT REGISTERED PUBLIC ACCOUNTING FIRM
The Board of Directors and Shareholders of Littelfuse, Inc.
We have audited the accompanying consolidated balance sheets of Littelfuse, Inc. and subsidiaries (Company) as of December 31, 2011 and January 1, 2011, and the related consolidated statements of income, equity, and cash flows for each of the three years in the period ended December 31, 2011. Our audits also included the financial statement schedule listed in the Index at Item 15(a). These financial statements and schedule are the responsibility of the Company's management. Our responsibility is to express an opinion on these financial statements and schedule based on our audits.
We conducted our audits in accordance with the standards of the Public Company Accounting Oversight Board (United States). Those standards require that we plan and perform the audit to obtain reasonable assurance about whether the financial statements are free of material misstatement. An audit includes examining, on a test basis, evidence supporting the amounts and disclosures in the financial statements. An audit also includes assessing the accounting principles used and significant estimates made by management, as well as evaluating the overall financial statement presentation. We believe that our audits provide a reasonable basis for our opinion.
In our opinion, the financial statements referred to above present fairly, in all material respects, the consolidated financial position of Littelfuse, Inc. and subsidiaries at December 31, 2011 and January 1, 2011, and the consolidated results of their operations and their cash flows for each of the three years in the period ended December 31, 2011, in conformity with U.S. generally accepted accounting principles. Also, in our opinion, the related financial statement schedule, when considered in relation to the basic financial statements taken as a whole, presents fairly in all material respects the information set forth therein.
We also have audited, in accordance with the standards of the Public Company Accounting Oversight Board (United States), Littelfuse, Inc. and subsidiaries’ internal control over financial reporting as of December 31, 2011, based on criteria established in Internal Control-Integrated Framework issued by the Committee of Sponsoring Organizations of the Treadway Commission and our report dated February 24, 2012, expressed
an unqualified opinion thereon.
Chicago, Illinois
February 24, 2012
37
REPORT OF INDEPENDENT REGISTERED PUBLIC ACCOUNTING FIRM
The Board of Directors and Shareholders of Littelfuse, Inc.
We have audited Littelfuse, Inc. and subsidiaries’ internal control over financial reporting as of December 31, 2011, based on criteria established in Internal Control—Integrated Framework issued by the Committee of Sponsoring Organizations of the Treadway Commission (the COSO criteria). Littelfuse, Inc.’s management is responsible for maintaining effective internal control over financial reporting, and for its assessment of the effectiveness of internal control over financial reporting included in the accompanying Form 10-K. Our responsibility is to express an opinion on the company’s internal control over financial reporting based on our audit.
We conducted our audit in accordance with the standards of the Public Company Accounting Oversight Board (United States). Those standards require that we plan and perform the audit to obtain reasonable assurance about whether effective internal control over financial reporting was maintained in all material respects. Our audit included obtaining an understanding of internal control over financial reporting, assessing the risk that a material weakness exists, testing and evaluating the design and operating effectiveness of internal control based on the assessed risk, and performing such other procedures as we considered necessary in the circumstances. We believe that our audit provides a reasonable basis for our opinion.
A company’s internal control over financial reporting is a process designed to provide reasonable assurance regarding the reliability of financial reporting and the preparation of financial statements for external purposes in accordance with generally accepted accounting principles. A company’s internal control over financial reporting includes those policies and procedures that (1) pertain to the maintenance of records that, in reasonable detail, accurately and fairly reflect the transactions and dispositions of the assets of the company; (2) provide reasonable assurance that transactions are recorded as necessary to permit preparation of financial statements in accordance with generally accepted accounting principles, and that receipts and expenditures of the company are being made only in accordance with authorizations of management and directors of the company; and (3) provide reasonable assurance regarding prevention or timely detection of unauthorized acquisition, use, or disposition of the company’s assets that could have a material effect on the financial statements.
Because of its inherent limitations, internal control over financial reporting may not prevent or detect misstatements. Also, projections of any evaluation of effectiveness to future periods are subject to the risk that controls may become inadequate because of changes in conditions, or that the degree of compliance with the policies or procedures may deteriorate.
In our opinion, Littelfuse, Inc. and subsidiaries maintained, in all material respects, effective internal control over financial reporting as of December 31, 2011, based on
the COSO criteria
.
We also have audited, in accordance with the standards of the Public Company Accounting Oversight Board (United States), the consolidated balance sheets of Littelfuse, Inc. and subsidiaries as of December 31, 2011 and January 1, 2011, and the related consolidated statements of income, equity, and cash flows for each of the three years in the period ended December 31, 2011, and our report dated February 24, 2012 expressed an unqualified opinion thereon.
/s/ ERNST & YOUNG LLP
Chicago, Illinois
February 24, 2012
38
RDGXBRLParseBegin
(In thousands of USD)
|
December 31, 2011
|
January 1, 2011
|
|||||||
|
ASSETS
|
||||||||
|
Current assets:
|
||||||||
|
Cash and cash equivalents
|
$ | 164,016 | $ | 109,720 | ||||
|
Short-term investments
|
13,997 | — | ||||||
|
Accounts receivable, less allowances
(2011 - $12,306; 2010 - $13,469)
|
92,088 | 97,753 | ||||||
|
Inventories
|
75,575 | 80,182 | ||||||
|
Deferred income taxes
|
11,895 | 10,588 | ||||||
|
Prepaid expenses and other current assets
|
14,219 | 13,882 | ||||||
|
Assets held for sale
|
6,592 | 6,831 | ||||||
|
Total current assets
|
378,382 | 318,956 | ||||||
|
Property, plant, and equipment:
|
||||||||
|
Land
|
4,888 | 5,688 | ||||||
|
Buildings
|
52,730 | 53,089 | ||||||
|
Equipment
|
281,521 | 276,371 | ||||||
|
Accumulated depreciation
|
(220,255 | ) | (205,001 | ) | ||||
|
Net property, plant and equipment
|
118,884 | 130,147 | ||||||
|
Intangible assets, net of amortization:
|
||||||||
|
Patents, licenses and software
|
10,753 | 11,211 | ||||||
|
Distribution network
|
19,307 | 9,752 | ||||||
|
Customer lists, trademarks and tradenames
|
14,523 | 20,865 | ||||||
|
Goodwill
|
115,697 | 112,687 | ||||||
|
Investments
|
14,867 | 11,660 | ||||||
|
Deferred income taxes
|
4,191 | 3,271 | ||||||
|
Other assets
|
1,820 | 2,580 | ||||||
|
Total assets
|
$ | 678,424 | $ | 621,129 | ||||
|
LIABILITIES AND EQUITY
|
||||||||
|
Current liabilities:
|
||||||||
|
Accounts payable
|
$ | 19,934 | $ | 24,079 | ||||
|
Accrued payroll
|
23,048 | 24,186 | ||||||
|
Accrued expenses
|
8,861 | 10,307 | ||||||
|
Accrued severance
|
1,843 | 3,279 | ||||||
|
Accrued income taxes
|
10,591 | 14,997 | ||||||
|
Current portion of long-term debt
|
85,000 | 33,000 | ||||||
|
Total current liabilities
|
149,277 | 109,848 | ||||||
|
Long-term debt, less current portion
|
— | 41,000 | ||||||
|
Accrued severance
|
— | 486 | ||||||
|
Accrued post-retirement benefits
|
15,292 | 5,564 | ||||||
|
Other long-term liabilities
|
12,752 | 11,571 | ||||||
|
Shareholders’ equity:
|
||||||||
|
Preferred stock, par value $0.01 per share: 1,000,000 shares authorized; no shares issued and outstanding
|
— | — | ||||||
|
Common stock, par value $0.01 per share: 34,000,000 shares authorized; shares issued and outstanding, 2011 –21,552,529; 2010 - 21,752,536
|
216 | 218 | ||||||
|
Treasury stock, at cost
:
1,534,550 and 654,984 shares, respectively
|
(58,834 | ) | (23,546 | ) | ||||
|
Additional paid-in capital
|
174,375 | 150,548 | ||||||
|
Accumulated other comprehensive income
|
8,631 | 21,241 | ||||||
|
Retained earnings
|
376,572 | 304,056 | ||||||
|
Littelfuse, Inc. shareholders’ equity
|
500,960 | 452,517 | ||||||
|
Non-controlling interest
|
143 | 143 | ||||||
|
Total equity
|
501,103 | 452,660 | ||||||
|
Total liabilities and equity
|
$ | 678,424 | $ | 621,129 | ||||
See accompanying Notes to Consolidated Financial Statements.
39
(In thousands of USD, except per share amounts)
|
Year Ended
|
||||||||||||
|
December 31, 2011
|
January 1, 2011
|
January 2, 2010
|
||||||||||
|
Net sales
|
$ | 664,955 | $ | 608,021 | $ | 430,147 | ||||||
|
Cost of sales
|
408,261 | 374,149 | 304,786 | |||||||||
|
Gross profit
|
256,694 | 233,872 | 125,361 | |||||||||
|
Selling, general and administrative expenses
|
116,740 | 103,671 | 88,506 | |||||||||
|
Research and development expenses
|
19,439 | 17,602 | 18,134 | |||||||||
|
Amortization of intangibles
|
6,611 | 5,025 | 5,026 | |||||||||
|
Total operating expenses
|
142,790 | 126,298 | 111,666 | |||||||||
|
Operating income
|
113,904 | 107,574 | 13,695 | |||||||||
|
Interest expense, net
|
1,691 | 1,437 | 2,377 | |||||||||
|
Other expense (income), net
|
(2,888 | ) | (1,542 | ) | 481 | |||||||
|
Income before income taxes
|
115,101 | 107,679 | 10,837 | |||||||||
|
Income taxes
|
28,077 | 29,016 | 1,426 | |||||||||
|
Net income
|
$ | 87,024 | $ | 78,663 | $ | 9,411 | ||||||
|
Income per share:
|
||||||||||||
|
Basic
|
$ | 3.96 | $ | 3.58 | $ | 0.43 | ||||||
|
Diluted
|
$ | 3.90 | $ | 3.52 | $ | 0.43 | ||||||
|
Weighted-average shares and equivalent
shares outstanding:
|
||||||||||||
|
Basic
|
21,901 | 21,875 | 21,743 | |||||||||
|
Diluted
|
22,255 | 22,214 | 21,812 | |||||||||
See accompanying Notes to Conoslidated Financial Statements.
40
|
Year Ended
|
||||||||||||
|
(In thousands of USD)
|
December 31, 2011
|
January 1, 2011
|
January 2, 2010
|
|||||||||
|
OPERATING ACTIVITIES
|
||||||||||||
|
Net income
|
$ | 87,024 | $ | 78,663 | $ | 9,411 | ||||||
|
Adjustments to reconcile net income to net cash provided by operating activities:
|
||||||||||||
|
Depreciation
|
25,641 | 26,980 | 31,596 | |||||||||
|
Impairment of assets
|
2,320 | 2,988 | 829 | |||||||||
|
Non-cash inventory charge
|
4,145 | — | — | |||||||||
|
Amortization of intangibles
|
6,611 | 5,025 | 5,026 | |||||||||
|
Provision for bad debts
|
444 | 353 | 319 | |||||||||
|
Loss (gain) on sale of property, plant and equipment
|
183 | (615 | ) | 703 | ||||||||
|
Stock-based compensation
|
5,805 | 5,243 | 5,503 | |||||||||
|
Excess tax benefit on share-based compensation
|
(4,220 | ) | (1,617 | ) | (15 | ) | ||||||
|
Deferred income taxes
|
(1,363 | ) | 7,784 | (2,905 | ) | |||||||
|
Changes in operating assets and liabilities:
|
||||||||||||
|
Accounts receivable
|
4,768 | (12,804 | ) | (15,569 | ) | |||||||
|
Inventories
|
2,612 | (15,147 | ) | 15,549 | ||||||||
|
Accounts payable
|
(5,272 | ) | (1,800 | ) | 4,360 | |||||||
|
Accrued expenses (including post-retirement)
|
(421 | ) | (13,645 | ) | (12,294 | ) | ||||||
|
Accrued payroll and severance
|
(3,226 | ) | 2,384 | (9,018 | ) | |||||||
|
Accrued taxes
|
(6,057 | ) | 14,878 | (3,322 | ) | |||||||
|
Prepaid expenses and other
|
1,756 | 5,399 | (562 | ) | ||||||||
|
Net cash provided by operating activities
|
120,750 | 104,069 | 29,611 | |||||||||
|
INVESTING ACTIVITIES
|
||||||||||||
|
Purchases of property, plant and equipment
|
(17,555 | ) | (22,433 | ) | (15,536 | ) | ||||||
|
Acquisitions of businesses, net of cash acquired
|
(11,077 | ) | (48,292 | ) | (920 | ) | ||||||
|
Purchases of short-term investments
|
(14,228 | ) | — | — | ||||||||
|
Purchases of other investment
|
(6,000 | ) | — | — | ||||||||
|
Proceeds from sale of investment
|
— | — | 133 | |||||||||
|
Proceeds from sale of property, plant and equipment
|
217 | 4,997 | 1,558 | |||||||||
|
Net cash used in investing activities
|
(48,643 | ) | (65,728 | ) | (14,765 | ) | ||||||
|
FINANCING ACTIVITIES
|
||||||||||||
|
Proceeds from debt
|
110,000 | 39,345 | 32,374 | |||||||||
|
Payments of term debt
|
(49,000 | ) | (8,000 | ) | (19,000 | ) | ||||||
|
Payments of revolving credit facility
|
(50,000 | ) | (20,624 | ) | (31,076 | ) | ||||||
|
Proceeds from exercise of stock options
|
23,036 | 18,496 | 1,505 | |||||||||
|
Debt issuance costs
|
(716 | ) | — | — | ||||||||
|
Cash dividends paid
|
(14,508 | ) | (3,248 | ) | — | |||||||
|
Excess tax benefit on share-based compensation
|
4,220 | 1,617 | 15 | |||||||||
|
Purchases of common stock
|
(37,092 | ) | (25,377 | ) | — | |||||||
|
Net cash (used in) provided by financing activities
|
(14,060 | ) | 2,209 | (16,182 | ) | |||||||
|
Effect of exchange rate changes on cash and cash equivalents
|
(3,751 | ) | (1,184 | ) | 753 | |||||||
|
Increase (decrease) in cash and cash equivalents
|
54,296 | 39,366 | (583 | ) | ||||||||
|
Cash and cash equivalents at beginning of year
|
109,720 | 70,354 | 70,937 | |||||||||
|
Cash and cash equivalents at end of year
|
$ | 164,016 | $ | 109,720 | $ | 70,354 | ||||||
See accompanying Notes to Consolidated Financial Statements.
41
CONSOLIDATED STATEMENTS OF EQUITY
|
Littelfuse, Inc. Shareholders’ Equity
|
||||||||||||||||||||||||||||
|
(In thousands of USD)
|
Common
Stock
|
Addl. Paid
in Capital
|
Treasury
Stock
|
Accum.
Other
Comp. Inc.
(Loss)
|
Retained
Earnings
|
Non-
controlling
Interest
|
Total
|
|||||||||||||||||||||
|
Balance at December 27, 2008
|
$ | 217 | $ | 124,384 | $ | — | $ | (10,123 | ) | $ | 219,230 | $ | 143 | $ | 333,851 | |||||||||||||
|
Comprehensive income:
|
||||||||||||||||||||||||||||
|
Net income for the year
|
— | — | — | — | 9,411 | — | 9,411 | |||||||||||||||||||||
|
Change in net unrealized gain on derivatives*
|
— | — | — | 311 | — | — | 311 | |||||||||||||||||||||
|
Min. pension liability adj. *
|
— | — | — | 11,657 | — | — | 11,657 | |||||||||||||||||||||
|
Unrealized gain on invest.*
|
— | — | — | 8,648 | — | — | 8,648 | |||||||||||||||||||||
|
Foreign currency trans. adj.
|
— | — | — | 8,234 | — | — | 8,234 | |||||||||||||||||||||
|
Comprehensive income
|
38,261 | |||||||||||||||||||||||||||
|
Stock-based compensation
|
— | 5,503 | — | — | — | — | 5,503 | |||||||||||||||||||||
|
Stock options exercised, including tax impact of ($521)
|
1 | 983 | — | — | — | — | 984 | |||||||||||||||||||||
|
Balance at January 2, 2010
|
$ | 218 | $ | 130,870 | $ | — | $ | 18,727 | $ | 228,641 | $ | 143 | $ | 378,599 | ||||||||||||||
|
Comprehensive income:
|
||||||||||||||||||||||||||||
|
Net income for the year
|
— | — | — | — | 78,663 | — | 78,663 | |||||||||||||||||||||
|
Change in net unrealized gain on derivatives*
|
— | — | — | 92 | — | — | 92 | |||||||||||||||||||||
|
Min. pension liability adj. *
|
— | — | — | (3,044 | ) | — | — | (3,044 | ) | |||||||||||||||||||
|
Unrealized gain on invest.*
|
— | — | — | 696 | — | — | 696 | |||||||||||||||||||||
|
Foreign currency trans. adj.
|
— | — | — | 4,770 | — | — | 4,770 | |||||||||||||||||||||
|
Comprehensive income
|
81,177 | |||||||||||||||||||||||||||
|
Stock-based compensation
|
— | 5,243 | — | — | — | — | 5,243 | |||||||||||||||||||||
|
Withheld 11,207 shares on restricted stock grants for withholding taxes
|
— | — | (422 | ) | — | — | — | (422 | ) | |||||||||||||||||||
|
Purchase of 643,777 shares of common stock
|
(6 | ) | (2,247 | ) | (23,124 | ) | — | — | — | (25,377 | ) | |||||||||||||||||
|
Stock options exercised, including tax impact of ($1,808)
|
6 | 16,682 | — | — | — | — | 16,688 | |||||||||||||||||||||
|
Cash dividends paid ($0.15 per share)
|
— | — | — | — | (3,248 | ) | — | (3,248 | ) | |||||||||||||||||||
|
Balance at January 1, 2011
|
$ | 218 | $ | 150,548 | $ | (23,546 | ) | $ | 21,241 | $ | 304,056 | $ | 143 | $ | 452,660 | |||||||||||||
|
Comprehensive income:
|
||||||||||||||||||||||||||||
|
Net income for the year
|
— | — | — | — | 87,024 | — | 87,024 | |||||||||||||||||||||
|
Min. pension liability adj. *
|
— | — | — | (6,703 | ) | — | — | (6,703 | ) | |||||||||||||||||||
|
Unrealized (loss) on invest.*
|
— | — | — | (2,702 | ) | — | — | (2,702 | ) | |||||||||||||||||||
|
Foreign currency trans. adj.
|
— | — | — | (3,205 | ) | — | — | (3,205 | ) | |||||||||||||||||||
|
Comprehensive income
|
74,414 | |||||||||||||||||||||||||||
|
Stock-based compensation
|
— | 5,805 | — | — | — | — | 5,805 | |||||||||||||||||||||
|
Withheld 20,537 shares on restricted stock grants for withholding taxes
|
— | — | (1,203 | ) | — | — | — | (1,203 | ) | |||||||||||||||||||
|
Purchase of 859,029 shares of common stock
|
(9 | ) | (2,998 | ) | (34,085 | ) | — | — | — | (37,092 | ) | |||||||||||||||||
|
Stock options exercised, including tax impact of ($2,009)
|
7 | 21,020 | — | — | — | — | 21,027 | |||||||||||||||||||||
|
Cash dividends paid ($0.63 per share)
|
— | — | — | — | (14,508 | ) | — | (14,508 | ) | |||||||||||||||||||
|
Balance at December 31, 2011
|
$ | 216 | $ | 174,375 | $ | (58,834 | ) | $ | 8,631 | $ | 376,572 | $ | 143 | $ | 501,103 | |||||||||||||
*Including related tax impact (see Note 14).
See accompanying Notes to Consolidated Financial Statements.
42
NOTES TO CONSOLIDATED FINANCIAL STATEMENTS
1. Summary of Significant Accounting Policies and Other Information
Nature of Operations
: Littelfuse, Inc. and subsidiaries (the “company”) design, manufacture, and sell circuit protection devices for use in the automotive, electronic and electrical markets throughout the world.
Fiscal Year
: The company’s fiscal years ended December 31, 2011 and January 1, 2011 contained 52 weeks. The fiscal year ended January 2, 2010 contained 53 weeks.
Basis of Presentation
:
The Consolidated Financial Statements include the accounts of Littelfuse, Inc. and its subsidiaries. All significant intercompany accounts and transactions have been eliminated. The company’s Consolidated Financial Statements were prepared in accordance with generally accepted accounting principles in the United States of America and include the assets, liabilities, revenues and expenses of all wholly-owned subsidiaries and majority-owned subsidiaries over which the company exercises control.
Use of Estimates
: The process of preparing financial statements in conformity with U.S. generally accepted accounting principles requires management to make estimates and assumptions that affect the amounts of assets and liabilities at the date of the Consolidated Financial Statements, and the reported amounts of revenues and expenses and the accompanying notes. The company evaluates and updates its assumptions and estimates on an ongoing basis and may employ outside experts to assist in its evaluation, as considered necessary. Actual results could differ from those estimates.
Cash Equivalents
: All highly liquid investments, with a maturity of three months or less when purchased, are considered to be cash equivalents.
Short-Term and Long-Term Investments
: The company has determined that certain of its investment securities are to be classified as available-for-sale. Available-for-sale securities are carried at fair value with the unrealized gains and losses reported as a component of “Accumulated Other Comprehensive Income (Loss).” Realized gains and losses and declines in unrealized value judged to be other-than-temporary on available-for-sale securities are included in other expense (income), net. The cost of securities sold is based on the specific identification method. Interest and dividends on securities classified as available-for-sale are included in interest income.
Fair Value of Financial Instruments
: The company’s financial instruments include cash and cash equivalents, accounts receivable, investments and long-term debt. The carrying values of such financial instruments approximate their estimated fair values.
Accounts Receivable
:
The company performs credit evaluations of customers’ financial condition and generally does not require collateral. Credit losses are provided for in the financial statements based upon specific knowledge of a customer’s inability to meet its financial obligations to the company. Historically, credit losses have consistently been within management’s expectations and have not been a material amount. A receivable is considered past due if payments have not been received within agreed upon invoice terms. Write-offs are recorded at the time a customer receivable is deemed uncollectible.
The company also maintains allowances against accounts receivable for the settlement of rebates and sales discounts to customers. These allowances are based upon specific customer sales and sales discounts
as well as actual historical experience.
43
NOTES TO CONSOLIDATED FINANCIAL STATEMENTS
1. Summary of Significant Accounting Policies and Other Information, continued
Inventories
: Inventories are stated at the lower of cost or market (first in, first out method), which approximates current replacement cost. The company maintains excess and obsolete allowances against inventory to reduce the carrying value to the expected net realizable value. These allowances are based upon a combination of factors including historical sales volume, market conditions, lower of cost or market analysis and expected realizable value of the inventory.
Property, Plant and Equipment
: Land, buildings, and equipment are carried at cost. Depreciation is calculated using the straight-line method with useful lives of 21 years for buildings, seven to nine years for equipment, seven years for furniture and fixtures, five years for tooling and three years for computer equipment.
Goodwill and Indefinite-Lived Intangible Assets:
The company annually tests goodwill and indefinite-lived intangible assets for impairment on the first day of its fiscal fourth quarter or at other dates if there is an event or change in circumstances that indicates the asset may be impaired. The company has seven reporting units for testing purposes. Management determines the fair value of each of its reporting units by using a discounted cash flow model (which includes forecasted five-year income statement and working capital projections, a market-based weighted average cost of capital and terminal values after five years) to estimate market value. In addition, the company compares its derived enterprise value on a consolidated basis to the company’s market capitalization as of its test date to ensure its derived value approximates the market value of the company when taken as a whole.
As of the most recent annual test conducted on October 1, 2011, the company concluded the fair value of each of the reporting units exceeded its carrying value of invested capital and therefore, no potential goodwill impairment existed. Specifically, the company noted that its headroom, defined as the excess of fair value over the carrying value of invested capital, was 84%, 96%, 41%, 14%, 88%, 131%, and 42% for its electronics (non-silicon), electronics (silicon), automotive (excluding Cole Hersee), Cole Hersee, relay, custom products, and fuse reporting units, respectively, at October 1, 2011. Certain key assumptions used in the annual test included a discount rate of 14.5% for all reporting units except for Cole Hersee which had discount rate of 14.2%. A long-term growth rate of 3.0% was used for all seven reporting units.
In addition, the company performed a sensitivity test at October 1, 2011 that showed a 100 basis point increase in its discount rate or a 100 basis point decrease in the long-term growth rate for each reporting unit would not have changed the company’s conclusion that no potential goodwill impairment existed at October 1, 2011.
The company will continue to perform a goodwill and indefinite-lived intangible asset impairment test as required on an annual basis and on an interim basis, if certain conditions exist. Factors the company considers important, which could result in changes to its estimates, include underperformance relative to historical or projected future operating results and declines in acquisitions and trading multiples. Due to the diverse end user base and non-discretionary product demand, the company does not believe its future operating results will vary significantly relative to its historical and projected future operating results.
44
NOTES TO CONSOLIDATED FINANCIAL STATEMENTS
1. Summary of Significant Accounting Policies and Other Information, continued
Other Intangible Assets
: Trademarks and tradenames are amortized using the straight-line method over estimated useful lives that have a range of five to 20 years. Patents, licenses and software are amortized using the straight-line method or an accelerated method over estimated useful lives that have a range of seven to 12 years. The distribution networks are amortized on either a straight-line or accelerated basis over estimated useful lives that have a range of three to 20 years. Other intangible assets are also tested for impairment when there is a significant event that may cause the asset to be impaired.
Environmental Liabilities
: Environmental liabilities are accrued based on engineering studies estimating the cost of remediating sites. Expenses related to on-going maintenance of environmental sites are expensed as incurred. If actual or estimated probable future losses exceed the company’s recorded liability for such claims, the company would record additional charges during the period in which the actual loss or change in estimate occurred.
Pension and Other Post-retirement Benefits
: Accounting for pensions requires estimating the future benefit cost and recognizing the cost over the employee’s expected period of employment with the company. Certain assumptions are required in the calculation of pension costs and obligations. These assumptions include the discount rate, salary scales and the expected long-term rate of return on plan assets. The discount rate is intended to represent the rate at which pension benefit obligations could be settled by purchase of an annuity contract. These assumptions are subject to change based on stock and bond market returns and other economic factors. Actual results that differ from the company’s assumptions are accumulated and amortized over future periods and therefore generally affect its recognized expense and accrued liability in such future periods. While the company believes that its assumptions are appropriate given current economic conditions and its actual experience, significant differences in results or significant changes in the company’s assumptions may materially affect its pension obligations and related future expense. On April 1, 2009, the company elected to freeze its U.S. benefit plan. As a result of the freeze decision, the company remeasured its pension plan assets and obligations which resulted in a decrease in the net obligation at that date. See Note 12 for additional information.
Reclassifications
: Certain items in the 2010 and 2009 financial statements have been reclassified to conform to the 2011 presentation. These reclassifications had no impact on net income or shareholders’ equity for any period.
Revenue Recognition
: The company recognizes revenue on product sales in the period in which the sales process is complete. This generally occurs when products are shipped (FOB origin) to the customer in accordance with the terms of the sale, the risk of loss has been transferred, collectability is reasonably assured and the pricing is fixed and determinable. At the end of each period, for those shipments where title to the products and the risk of loss and rewards of ownership do not transfer until the product has been received by the customer, the company adjusts revenues and cost of sales for the delay between the time that the products are shipped and when they are received by the customer. The company’s distribution channels are primarily through direct sales and independent third party distributors.
Revenue and Billing
: The company accepts orders from customers based on long term purchasing contracts and written sales agreements. Contract pricing and selling agreement terms are based on market factors, costs, and competition. Pricing normally is negotiated as an adjustment (premium or discount)
from the company’s published price lists. The customer is invoiced when the company’s products are shipped to them in accordance with the terms of the sales agreement.
45
NOTES TO CONSOLIDATED FINANCIAL STATEMENTS
1. Summary of Significant Accounting Policies and Other Information, continued
Returns and Credits
: Some of the terms of the company’s sales agreements and normal business conditions provide customers (distributors) the ability to receive price adjustments on products previously shipped and invoiced. This practice is common in the industry and is referred to as a “ship and debit” program. This program allows the distributor to debit the company for the difference between the distributors’ contracted price and a lower price for specific transactions. Under certain circumstances (usually in a competitive situation or large volume opportunity), a distributor will request authorization to reduce its price to its buyer. If the company approves such a reduction, the distributor is authorized to “debit” its account for the difference between the contracted price and the lower approved price. The company establishes reserves for this program based on historic activity and actual authorizations for the debit and recognizes these debits as a reduction of revenue.
The company has a return to stock policy whereby a customer with prior authorization from Littelfuse management can return previously purchased goods for full or partial credit. The company establishes an estimated allowance for these returns based on historic activity. Sales revenue and cost of sales are reduced to anticipate estimated returns.
The company properly meets all of the criteria for recognizing revenue when the right of return exists. Specifically, the company meets those requirements because:
|
|
1.
|
The company’s selling price is fixed or determinable at the date of the sale.
|
|
|
2.
|
The company has policies and procedures to accept only credit worthy customers with the ability to pay the company.
|
|
|
3.
|
The company’s customers are obligated to pay the company under the contract and the obligation is not contingent on the resale of the product. (All “ship and debit” and “returns to stock” require specific circumstances and authorization.)
|
|
|
4.
|
The risk ownership transfers to the company’s customers upon shipment and is not changed in the event of theft, physical destruction or damage of the product.
|
|
|
5.
|
The company bills at the ship date and establishes a reserve to reduce revenue from the in transit time until the product is delivered for FOB destination sales.
|
|
|
6.
|
The company’s customers acquiring the product for resale have economic substance apart from that provided by Littelfuse, and all distributors are independent of the company.
|
|
|
7.
|
The company does not have any obligations for future performance to bring about resale of the product by its customers.
|
|
|
8.
|
The company can reasonably estimate the amount of future returns.
|
Volume Rebates:
The company offers incentives to certain customers to achieve specific quarterly or annual sales targets. If customers achieve their sales targets, they are entitled to rebates. The company estimates the future cost of these rebates and recognizes this estimated cost as a reduction to revenue as products are sold.
46
NOTES TO CONSOLIDATED FINANCIAL STATEMENTS
1. Summary of Significant Accounting Policies and Other Information, continued
Allowance for Doubtful Accounts:
The company evaluates the collectability of its trade receivables based on a combination of factors. The company regularly analyzes its significant customer accounts and, when
the company becomes aware of a specific customer’s inability to meet its financial obligations, the company records a specific reserve for bad debt to reduce the related receivable to the amount the company reasonably believes is collectible. The company also records allowances for all other customers based on a variety of factors including the length of time the receivables are past due, the financial health
of the customer, macroeconomic considerations and past experience. Historically, the allowance for doubtful accounts has been adequate to cover bad debts. If circumstances related to specific customers change, the estimates of the recoverability of receivables could be further adjusted. However, due to the company’s diverse customer base and lack of credit concentration, the company does not believe its estimates would be materially impacted by changes in its assumptions.
Advertising Costs
: The company expenses advertising costs as incurred, which amounted to $1.9 million in 2011, $1.2 million in 2010 and $1.1 million in 2009, and are included as a component of selling, general and administrative expenses.
Shipping and Handling Fees and Costs
: Amounts billed to customers related to shipping and handling are classified as revenue. Costs incurred for shipping and handling of $5.9 million, $10.9 million, and $5.0 million in 2011, 2010 and 2009, respectively, are classified in selling, general and administrative expenses.
Restructuring Costs
: The company incurred severance charges and plant closure expenses as part of the company’s on-going cost reduction efforts. These charges are included in cost of sales, selling, general and administrative expenses, or research and development expenses depending on the personnel being included in the charge. See Note 9 for additional information on restructuring costs.
Foreign Currency Translation
: The company’s foreign subsidiaries use the local currency or the U.S. dollar as their functional currency, as appropriate. Assets and liabilities are translated using exchange rates at the balance sheet date, and revenues and expenses are translated at weighted average rates. The amount of foreign currency conversion recognized in the income statement related to currency translation were losses of $0.9 million, $3.3 million and $0.4 million in 2011, 2010 and 2009, respectively and is included as a component of other expense (income), net. Adjustments from the translation process are recognized in “Shareholders’ equity” as a component of “Accumulated other comprehensive income.”
Stock-based Compensation
: The company recognizes compensation expense for the cost of awards of equity compensation using a fair value method. Benefits of tax deductions in excess of recognized compensation expense are reported as both operating and financing cash flows.
On certain occasions, the company has granted stock options for a fixed number of shares with an exercise price below that of the underlying stock on the date of the grant and recognizes compensation expense accordingly. This compensation expense has historically not been significant. See Note 13 for additional information on stock-based compensation.
Other Expense (Income), Net:
Other expense (income), net consisting of interest income, royalties, non-operating income and foreign currency items, was $2.9 million of income in 2011 compared to $1.5 million of income in 2010. The year over year increase resulted primarily from dividend and royalty income.
47
NOTES TO CONSOLIDATED FINANCIAL STATEMENTS
1. Summary of Significant Accounting Policies and Other Information, continued
Income Taxes:
The company accounts for income taxes using the liability method. Deferred taxes are recognized for the future effects of temporary differences between financial and income tax reporting using enacted tax rates in effect for the years in which the differences are expected to reverse. The company recognizes deferred taxes for temporary differences, operating loss carryforwards and tax credit carryforwards. Deferred tax assets are reduced by a valuation allowance if it is more likely than not that some portion, or all, of the deferred tax assets will not be realized. Federal and state income taxes are provided on the portion of foreign income that is expected to be remitted to the U.S. and be taxable.
Accounting Pronouncements
: In May 2011, the Financial Accounting Standards Board (“FASB”) issued authoritative guidance that provides a consistent definition of fair value and ensures that the fair value measurement and disclosure requirements are similar between U.S. GAAP and International Financial Reporting Standards. The new guidance changes certain fair value measurement principles and enhances the disclosure requirements particularly for Level 3 fair value measurements. The new guidance will be effective for the company as of January 1, 2012 and will be applied prospectively. The adoption of this guidance is not expected to have a material impact on the company’s consolidated financial statements.
In June 2011, the FASB issued authoritative guidance that will require companies to present the components of net income and other comprehensive income either as one continuous statement or as two consecutive statements. It eliminates the option to present components of other comprehensive income as part of the statement of changes in stockholders’ equity. The guidance does not change the items which must be reported in other comprehensive income, how such items are measured or when they must be reclassified to net income. This guidance is effective for interim and annual periods beginning after December 15, 2011. Because this guidance impacts presentation only, it will have no effect on the company’s consolidated financial statements.
In September 2011, the FASB issued authoritative guidance on testing goodwill for impairment. Under the revised guidance, entities testing goodwill for impairment have the option of performing a qualitative assessment before calculating the fair value of the reporting unit (i.e., step 1 of the goodwill impairment test). If entities determine, on the basis of qualitative factors, that the fair value of the reporting unit is more likely than not less than the carrying amount, the two-step impairment test would be required. The guidance does not change how goodwill is calculated or assigned to reporting units, nor does it revise the requirement to test goodwill annually for impairment. In addition, the guidance does not amend the requirement to test goodwill for impairment between annual tests if events or circumstances warrant; however, it does revise the examples of events and circumstances that an entity should consider. The amendments are effective for annual and interim goodwill impairment tests performed for fiscal years beginning after December 15, 2011. Early adoption is permitted; however the company did not adopt this guidance early. The company is evaluating the impact of adopting the new guidance but currently believes there will be no material impact on its consolidated financial statements.
Goodwill testing was completed in October 2011 using the previous methodology, as permitted.
48
NOTES TO CONSOLIDATED FINANCIAL STATEMENTS
2. Acquisition of Businesses
On December 17, 2010, the company acquired the Cole Hersee Company (“Cole Hersee”), a leading manufacturer of power management products and heavy duty electromechanical and solid-state switches, for approximately $50.0 million. The acquisition allows the company to further expand its off-road, truck and bus business. Cole Hersee is located in Boston, Massachusetts with manufacturing operations in Melchor Muzquiz, Mexico. The company funded the acquisition with available cash.
The following table sets forth the final purchase price allocation for Cole Hersee’s net assets in accordance with the purchase method of accounting with adjustments to record the acquired net assets at their estimated fair market or net realizable values.
|
Cole Hersee final purchase price allocation (in thousands):
|
||||
|
Cash
|
$ | 1,708 | ||
|
Current assets, net
|
17,628 | |||
|
Property, plant and equipment, net
|
5,368 | |||
|
Customer list
|
10,700 | |||
|
Distribution network
|
500 | |||
|
Trademarks
|
2,900 | |||
|
Goodwill
|
15,564 | |||
|
Other assets
|
533 | |||
|
Current liabilities
|
(2,575 | ) | ||
|
Other long-term liabilities
|
(2,376 | ) | ||
| $ | 49,950 | |||
All Cole Hersee goodwill and other assets and liabilities were recorded in the Automotive business unit segment and reflected in the Americas geographical area. The customer list is being amortized over 13 years. The distribution network is being amortized over five years. The trademarks are being amortized over 10 years. Goodwill for the above acquisition is expected to be deductible for tax purposes.
As required by purchase accounting rules, the company recorded a $3.7 million step-up of inventory to its fair value as of the acquisition date. During the first quarter of 2011, as this inventory was sold, cost of goods sold included $3.7 million of non-cash charges for this step-up.
On August 3, 2011, the company acquired 100% of Selco A/S (“Selco”), a manufacturer of relays and generator controls for the marine industry, for approximately $11.1 million. The acquisition allows the company to further expand its global relay business within its Electrical business unit segment. Selco is located in Roskilde, Denmark with a sales office located in Dubai, United Arab Emirates. The company funded the acquisition with available cash.
The following table sets forth the preliminary purchase price allocation for Selco’s net assets, as of August 3, 2011, in accordance with the purchase method of accounting with adjustments to record the acquired net assets at their estimated fair market or net realizable values.
49
NOTES TO CONSOLIDATED FINANCIAL STATEMENTS
2. Acquisition of Businesses, continued
|
Selco’s preliminary purchase price allocation (in thousands):
|
||||
|
Cash
|
$ | 5 | ||
|
Current assets, net
|
3,826 | |||
|
Property, plant and equipment, net
|
183 | |||
|
Distribution network
|
3,355 | |||
|
Trademarks
|
378 | |||
|
Patents and licenses
|
1,418 | |||
|
Goodwill
|
6,457 | |||
|
Current liabilities
|
(4,490 | ) | ||
| $ | 11,132 | |||
All Selco goodwill and other assets and liabilities were recorded in the Electrical business unit segment and reflected in the Europe geographical area. The goodwill resulting from this acquisition consists largely of the company's expected future product sales and synergies from combining Selco’s products with the company's existing product offerings. The distribution network is being amortized over three to ten years. The trademarks are being amortized over five years. The patents and licenses are being amortized over 10 years. Goodwill for the above acquisition is not expected to be deductible for tax purposes.
As required by purchase accounting rules, the company recorded a $0.7 million step-up of inventory to its fair value as of the acquisition date. During the fourth quarter of 2011, as this inventory was sold, cost of goods sold included $0.5 million of non-cash charges for this step-up.
Pro forma financial information is not presented for the company’s business acquisitions described above due to amounts not being materially different than actual results.
3. Inventories
The components of inventories at December 31, 2011 and January 1, 2011 are as follows (in thousands):
|
2011
|
2010
|
|||||||
|
Raw materials
|
$ | 26,919 | $ | 20,994 | ||||
|
Work in process
|
10,704 | 9,719 | ||||||
|
Finished goods
|
37,952 | 49,469 | ||||||
|
Total
|
$ | 75,575 | $ | 80,182 | ||||
50
NOTES TO CONSOLIDATED FINANCIAL STATEMENTS
4. Goodwill and Other Intangible Assets
The amounts for goodwill and changes in the carrying value by operating segment are as follows at December 31, 2011 and January 1, 2011 (in thousands):
|
2011
|
Additions (Reductions)
(a)
|
Adjust.
(b)
|
2010
|
Additions (Reductions)
(c)
|
Adjust.
(b)
|
2009
|
||||||||||||||||||||||
|
Electronics
|
$ | 34,976 | $ | — | $ | (330 | ) | $ | 35,306 | $ | — | $ | 223 | $ | 35,083 | |||||||||||||
|
Automotive
|
39,187 | (1,979 | ) | (204 | ) | 41,370 | 17,543 | (858 | ) | 24,685 | ||||||||||||||||||
|
Electrical
|
41,534 | 6,457 | (934 | ) | 36,011 | — | 793 | 35,218 | ||||||||||||||||||||
|
Total
|
$ | 115,697 | $ | 4,478 | $ | (1,468 | ) | $ | 112,687 | $ | 17,543 | $ | 158 | $ | 94,986 | |||||||||||||
There were no accumulated goodwill impairment losses at December 31, 2011, January 1, 2011 or January 2, 2010.
(a)
Automotive reductions in 2011 of $2.0 million resulted from the finalization of the Cole Hersee purchase price allocation. Electrical additions in 2011 are from the acquisition of Selco A/S.
(b)
Adjustments reflect the impact of changes in foreign exchange rates.
(c)
Automotive additions in 2010 of $17.5 million resulted from the acquisition of Cole Hersee.
The company recorded amortization expense of $6.6 million in 2011 and $5.0 million in both 2010 and 2009. The details of other intangible assets and related future amortization expense of existing intangible assets at December 31, 2011 and January 1, 2011 are as follows:
|
2011
|
2010
|
|||||||||||||||||||||||
|
(in thousands)
|
Weighted Average Useful Life
|
Gross Carrying Value
|
Accumulated Amortization
|
Weighted Average Useful Life
|
Gross Carrying Value
|
Accumulated Amortization
|
||||||||||||||||||
|
Patents, licenses and software
(a)
|
11.9 | $ | 41,909 | $ | 31,156 | 11.9 | $ | 40,745 | $ | 29,534 | ||||||||||||||
|
Distribution network
(b)
|
13.8 | 44,738 | 25,431 | 14.7 | 31,830 | 22,078 | ||||||||||||||||||
|
Customer lists, trademarks and tradenames
(c)
|
13.8 | 17,451 | 8,651 | 14.9 | 22,341 | 7,318 | ||||||||||||||||||
|
Tradenames
(d)
|
— | 5,723 | — | — | 5,842 | — | ||||||||||||||||||
|
Total
|
12.4 | $ | 109,821 | $ | 65,238 | 12.8 | $ | 100,758 | $ | 58,930 | ||||||||||||||
|
(a)
|
Increase to gross carrying value for patents, licenses and software in 2011 is related to the prelimnary Selco A/S acquisition purchase price allocation discussed in Note 2. Other changes are primarily due to the impact of foreign currency translation adjustments.
|
|
(b)
|
Increase to gross carrying value for distribution network in 2011 is related to the preliminary Selco A/S acquisition purchase price allocation and the finalization of the Cole Hersee purchase price allocation both of which are discussed in Note 2. Other changes are primarily due to the impact of foreign currency translation adjustments.
|
|
(c)
|
Decrease to gross carrying value for customer lists, trademarks and tradenames in 2011 are related to the finalization of the Cole Hersee purchase price allocation offset partially by an increase related to the preliminary Selco A/S acquisition purchase price allocation, both of which are discussed in Note 2. Other changes are primarily due to the impact foreign currency translation adjustments.
|
|
(d)
|
Tradenames with indefinite lives.
|
51
NOTES TO CONSOLIDATED FINANCIAL STATEMENTS
4. Goodwill and Other Intangible Assets, continued
Estimated amortization expense related to intangible assets with definite lives at December 31, 2011 is as follows (in thousands):
|
2012
|
$ | 5,562 | ||
|
2013
|
5,393 | |||
|
2014
|
4,487 | |||
|
2015
|
3,936 | |||
|
2016
|
3,418 | |||
|
2017 and thereafter
|
16,064 | |||
| $ | 38,860 |
5. Investments
Included in investments are shares of Polytronics Technology Corporation Ltd. (“Polytronics”), a Taiwanese company. The Polytronics investment was acquired as part of the Littelfuse GmbH acquisition. The company’s Polytronics shares held at the end of fiscal 2011 and 2010 represent approximately 7.3% and 8.0% of total Polytronics shares outstanding, respectively. The fair value of the Polytronics investment was €6.8 million (approximately $8.9 million) at December 31, 2011 and €8.8 million (approximately $11.7 million) at January 1, 2011. Included in 2011 other comprehensive income is an unrealized loss of $2.7 million, due to the decrease in fair market value of the Polytronics investment. The remaining movement year over year was due to the impact of changes in exchange rates.
In 2011, the company invested $6.0 million in certain preferred stock of Shocking Technologies, Inc., (“Shocking Technologies”) a research and development company in the electronics industry located in San Jose, California. Shocking Technologies is a developer of circuit protection products for the computer and telecommunication markets. The company has accounted for its investment in Shocking Technologies at cost as the fair market value is not readily determinable.
The carrying amounts of long-term debt at December 31, 2011 and January 1, 2011 are as follows:
|
In thousands
|
2011
|
2010
|
||||||
|
Term loan
|
$ | — | $ | 49,000 | ||||
|
Revolving credit facility
|
85,000 | 25,000 | ||||||
| 85,000 | 74,000 | |||||||
|
Less: Current maturities
|
85,000 | 33,000 | ||||||
|
Total
|
$ | — | $ | 41,000 | ||||
Term Loan
On September 29, 2008, the company entered into a Loan Agreement with various lenders that provides the company with a five-year term loan facility of up to $80.0 million for the purposes of (i) refinancing certain existing indebtedness; (ii) funding working capital needs; and (iii) funding capital expenditures and other lawful corporate purposes, including permitted acquisitions. The company terminated this loan
agreement on June 13, 2011 at which time any outstanding amounts were refinanced under the company’s new revolving credit facility effective June 13, 2011.
52
NOTES TO CONSOLIDATED FINANCIAL STATEMENTS
6. Debt, continued
Revolving Credit Facilities
The company had an unsecured domestic financing arrangement, which expired on July 21, 2011, consisting of a credit agreement with banks that provided a $75.0 million revolving credit facility, with a potential to increase up to $125.0 million upon request of the company and agreement with the lenders. The company refinanced this loan agreement with proceeds from a new revolving credit facility on June 13, 2011.
On June 13, 2011, the company entered into a new credit agreement with certain commercial banks that provides an unsecured revolving credit facility in an amount of up to $150.0 million, with a potential to increase up to $225.0 million. At December 31, 2011, the company had available $64.4 million of borrowing capacity under the revolver credit agreement at an interest rate of LIBOR plus 1.25% (1.55% as of December 31, 2011). The credit agreement replaces the company’s previous credit agreement dated July 21, 2006 and term loan agreement dated September 29, 2008, and, unless terminated earlier, will terminate on June 13, 2016. During the second quarter of 2011, $0.2 million of previously capitalized debt issuance costs were written off and $0.7 million of new debt issuance costs incurred were capitalized and will be amortized over the life of the new credit agreement.
This arrangement contains covenants that, among other matters, impose limitations on the incurrence of additional indebtedness, future mergers, sales of assets, payment of dividends, and changes in control, as defined in the agreement. In addition, the company is required to satisfy certain financial covenants and tests relating to, among other matters, interest coverage, working capital, leverage and net worth. At December 31, 2011, the company was in compliance with all covenants under the revolving credit facility.
During the second quarter of 2011, as part of the new refinancing arrangement discussed above, $47.0 million of indebtedness that was due on the previous term loan was settled and rolled-over into the revolving credit facility by the lender.
For the fiscal year ended December 31, 2011, the company had $0.8 million outstanding in letters of credit. No amounts were drawn under these letters of credit at December 31, 2011. For the fiscal year ended January 1, 2011, the company had $2.3 million available in letters of credit. No amounts were drawn under these letters of credit at January 1, 2011.
Interest paid on debt was approximately $1.6 million in 2011, $1.3 million in 2010, and $2.3 million in 2009. Aggregate maturities of obligations at December 31, 2011, are as follows (in thousands):
|
2012
|
$ | 85,000 |
53
NOTES TO CONSOLIDATED FINANCIAL STATEMENTS
7. Financial Instruments and Risk Management
Occasionally, the company uses financial instruments to manage its exposures to movements in commodity prices, foreign exchange and interest rates. The use of these financial instruments modifies the company’s exposure to these risks with the goal of reducing the risk or cost to the company. The company does not use derivatives for trading purposes and is not a party to leveraged derivative contracts.
The company recognizes all derivative instruments as either assets or liabilities at fair value in the Consolidated Balance Sheets. The fair value is based upon either market quotes for actively traded instruments or independent bids for non-exchange traded instruments. The company formally documents its hedge relationships, including identifying the hedging instruments and the hedged items, as well as its risk management objectives and strategies for undertaking the hedge transaction. This process includes linking derivatives that are designated as hedges of specific assets, liabilities, firm commitments or forecasted transactions to the hedged risk. On the date the derivative is entered into, the company designates the derivative as a fair value hedge, cash flow hedge or a net investment hedge, and accounts for the derivative in accordance with its designation. The company also formally assesses, both at inception and at least quarterly thereafter, whether the derivatives are highly effective in offsetting changes in either the fair value or cash flows of the hedged item. If it is determined that a derivative ceases to be a highly effective hedge, or if the anticipated transaction is no longer likely to occur, the company discontinues hedge accounting, and any deferred gains or losses are recorded in the respective measurement period. The company currently does not have any outstanding hedge instruments.
Cash Flow Hedges
A hedge of a forecasted transaction or of the variability of cash flows to be received or paid related to a recognized asset or liability is designated as a cash flow hedge. The effective portion of the change in the fair value of a derivative that is designated as a cash flow hedge is recorded in other comprehensive income (loss). When the impact of the hedged item is recognized in the income statement, the gain or loss included in other comprehensive income (loss) is reported on the same line in the Consolidated Statements of Income as the hedged item.
Cash Flow Hedges - Currency Risk Management
In January 2009, the company entered into a series of weekly forward contracts to buy Mexican pesos to manage its exposure to fluctuations in the cost of this currency through December 28, 2009. The company uses Mexican pesos to fund payroll and operating expenses at one of the company’s Mexico manufacturing facilities. The operations of the Mexico facility are accounted for within an entity where the U.S. dollar is the functional currency. In September 2009, the company extended the arrangement through June 28, 2010. Amounts included in other comprehensive income (loss) are reclassified into cost of sales in the period in which the hedged transaction is recognized in earnings. As of July 3, 2010, the company’s Mexican peso forward contracts expired.
54
NOTES TO CONSOLIDATED FINANCIAL STATEMENTS
7. Financial Instruments and Risk Management, continued
Net Derivative Gain or Loss
The effect of cash flow hedge derivative instruments on the Consolidated Statements of Income and Other Comprehensive Income (Loss) is as follows (in thousands):
|
Amount of Gain (Loss) Recognized in Other Comprehensive Income (Loss) (Effective Portion)
|
Location of Gain (Loss) Reclassified from Other Comprehensive Income (Loss)
into Income
(Effective Portion)
|
Amount of Gain (Loss) Reclassified from Other Comprehensive Income (Loss) into Income (Effective Portion)
|
|||||||||||||||
|
Twelve Months Ended
|
Twelve Months Ended
|
||||||||||||||||
|
December 31, 2011
|
January 1, 2011
|
December 31, 2011
|
January 1, 2011
|
||||||||||||||
|
Foreign exchange contracts
|
$ | — | $ | 92 |
Cost of Sales
|
$ | — | $ | (191 | ) | |||||||
|
Total
|
$ | — | $ | 92 | $ | — | $ | (191 | ) | ||||||||
Derivative Transactions
At December 31, 2011 and January 1, 2011, accumulated other comprehensive income (loss) included $0.0 million and $0.0 million in unrealized losses, respectively, for derivatives, net of income taxes.
8. Fair Value of Financial Assets and Liabilities
In determining fair value, the company uses various valuation approaches within the fair value measurement framework. Fair value measurements are determined based on the assumptions that market participants would use in pricing an asset or liability.
Applicable accounting literature establishes a hierarchy for inputs used in measuring fair value that maximizes the use of observable inputs and minimizes the use of unobservable inputs by requiring that the most observable inputs be used when available. Applicable accounting literature defines levels within the hierarchy based on the reliability of inputs as follows:
Level 1—Valuations based on unadjusted quoted prices for identical assets or liabilities in active markets;
Level 2—Valuations based on quoted prices for similar assets or liabilities or identical assets or liabilities in less active markets, such as dealer or broker markets; and
Level 3—Valuations derived from valuation techniques in which one or more significant inputs or significant value drivers are unobservable, such as pricing models, discounted cash flow models and similar techniques not based on market, exchange, dealer or broker-traded transactions.
Following is a description of the valuation methodologies used for instruments measured at fair value and their classification in the valuation hierarchy.
55
NOTES TO CONSOLIDATED FINANCIAL STATEMENTS
8. Fair Value of Financial Assets and Liabilities, continued
Available-for-sale securities
Equity securities listed on a national market or exchange are valued at the last sales price. Such securities are classified within Level 1 of the valuation hierarchy.
Derivative instruments
The fair values of commodity derivatives are valued based on quoted futures prices for the underlying commodity and are categorized as Level 2. The fair values of interest rate and foreign exchange rate derivatives are determined based on inputs that are readily available in public markets or can be derived from information available in publicly quoted markets and are categorized as Level 2.
The company does not have any financial assets or liabilities measured at fair value on a recurring basis categorized as Level 3, and there were no transfers in or out of Level 3 during 2011 or 2010. There were no changes during the year ended December 31, 2011 to the company’s valuation techniques used to measure asset and liability fair values on a recurring basis. As of December 31, 2011 and January 1, 2011, the company held no non-financial assets or liabilities that are required to be measured at fair value on a recurring basis.
The following table presents assets measured at fair value by classification within the fair value hierarchy as of December 31, 2011 (in thousands):
|
Fair Value Measurements Using
|
||||||||||||||||
|
Quoted Prices in
Active Markets for
Identical Assets
(Level 1)
|
Significant
Other
Observable
Inputs
(Level 2)
|
Significant
Unobservable
Inputs
(Level 3)
|
Total
|
|||||||||||||
|
Available-for-sale securities
|
$ | 8,867 | $ | — | $ | — | $ | 8,867 | ||||||||
|
Total
|
$ | 8,867 | $ | — | $ | — | $ | 8,867 | ||||||||
The following table presents assets measured at fair value by classification within the fair value hierarchy as of January 1, 2011 (in thousands):
|
Fair Value Measurements Using
|
||||||||||||||||
|
Quoted Prices in
Active Markets for
Identical Assets
(Level 1)
|
Significant
Other
Observable
Inputs
(Level 2)
|
Significant
Unobservable
Inputs
(Level 3)
|
Total
|
|||||||||||||
|
Available-for-sale securities
|
$ | 11,660 | $ | — | $ | — | $ | 11,660 | ||||||||
|
Total
|
$ | 11,660 | $ | $ | — | $ | 11,660 | |||||||||
56
NOTES TO CONSOLIDATED FINANCIAL STATEMENTS
8. Fair Value of Financial Assets and Liabilities, continued
The company’s other financial instruments include cash and cash equivalents, short-term investments, accounts receivable and long-term debt. Due to their short-term maturity, the carrying amounts of cash and cash equivalents, short-term investments and accounts receivable approximate their fair values. The company’s long-term debt fair value approximates book value at December 31, 2011 and January 1, 2011, respectively, as the long-term debt variable interest rates fluctuate along with market interest rates.
9. Restructuring
During the period 2006 through 2009, the company announced closures of its facilities in Dundalk, Ireland, Irving, Texas, Des Plaines, Illinois, Elk Grove, Illinois, Matamoros, Mexico, Swindon, U.K., Dünsen, Germany, Utrecht, Netherlands, and Yangmei, Taiwan. These manufacturing and distribution center closures were part of a multi-year plan to improve the company’s cost structure and margins by rationalizing the company’s footprint, reducing labor costs and moving closer to customers. As of December 31, 2011, all of these facility closures have been completed except for Yangmei, Taiwan. Together, these initiatives have impacted approximately 946 employees and resulted in aggregate restructuring charges of $53.8 million through December 31, 2011. The company does not expect to incur any additional costs associated with these facility closures and related restructuring.
A summary of activity for the restructuring liability is as follows:
|
Littelfuse, Inc. restructuring (in thousands)
|
||||
|
Balance at December 27, 2008
|
$ | 12,093 | ||
|
Additions
|
11,196 | |||
|
Payments
|
(12,472 | ) | ||
|
Exchange rate impact
|
100 | |||
|
Balance at January 2, 2010
|
10,917 | |||
|
Additions
|
1,687 | |||
|
Payments
|
(8,732 | ) | ||
|
Exchange rate impact
|
(107 | ) | ||
|
Balance at January 1, 2011
|
3,765 | |||
|
Additions
|
594 | |||
|
Payments
|
(2,941 | ) | ||
|
Exchange rate impact
|
23 | |||
|
Balance at December 31, 2011
|
$ | 1,441 | ||
Additional costs recorded that are not related to the initial restructuring plans discussed above were $0.4 million and $0.0 million for the fiscal years ended December 31, 2011 and January 1, 2011, respectively.
10. Coal Mine Liability
Included in other long-term liabilities is an accrual related to former coal mining operations at Littelfuse GmbH (formerly known as Heinrich Industries, AG) for the amounts of €3.1 million ($4.0 million) and €3.3 million ($4.4 million) at December 31, 2011, and January 1, 2011, respectively. Management accrues for losses associated with litigation and environmental claims based on management's best estimate of future costs when such losses are probable and reasonably able to be estimated. Management, in conjunction with an independent third-party used to prepare an annual engineering study, performs an annual evaluation of the former coal mining operations in order to develop its estimate of their probable future obligations in regard to remediating the dangers (such as a shaft collapse) of abandoned coal mine shafts in the former coal mining operations. The ultimate determination can only be done after respective investigations because the concrete conditions are mostly unknown at this time. The
accrual is not discounted as management cannot reasonably estimate when such remediation efforts will take place.
57
NOTES TO CONSOLIDATED FINANCIAL STATEMENTS
11. Asset Impairments
During 2011, the company recorded asset impairment charges of approximately $2.3 million within selling, general and administrative expenses. These charges resulted from the shut-down of the company’s manufacturing facility in Dünsen, Germany during the third quarter of 2011 and continuing declines in commercial real estate prices affecting the value of the company’s previously closed manufacturing sites in Des Plaines, Illinois and Dundalk, Ireland. The charges were recognized as an “other” charge for segment reporting purposes. Impairment charges and fair value measurements related to these facilities were based on independent broker valuations (market approach) and are considered Level 3 measurements within the fair value hierarchy for financial reporting purposes. The carrying values of the company’s assets held for sale are $5.4 million for Des Plaines, $0.4 million for Dundalk and $0.8 million for Dünsen as of December 31, 2011.
During 2010, based on an estimated fair value of $6.8 million, the company recorded a charge of approximately $3.0 million within selling, general and administrative expenses related to asset impairments which resulted from the downturn in commercial real estate prices. The impairment charges were associated with the closure of the company’s manufacturing facilities in Des Plaines, Illinois and Dundalk, Ireland. The charge was recognized as an “other” charge for segment reporting purposes. Impairment charges and fair value measurements related to these facilities were based on independent broker valuations (market approach) and are considered Level 3 assets within the fair value hierarchy for financial reporting purposes.
During 2009, the company recorded a charge of approximately $0.8 million within selling, general and administrative expenses related to asset impairments. The impairment charge was associated with the closure of the company’s distribution facility located in Utrecht, Netherlands. The charge was recognized as an “other” charge for segment reporting purposes.
12. Benefit Plans
The company has a company-sponsored defined benefit pension plan covering certain of its North American employees. The amount of the retirement benefit is based on years of service and final average pay. The plan also provides post-retirement medical benefits to retirees and their spouses if the retiree has reached age 62 and has provided at least ten years of service prior to retirement. Such benefits
generally cease once the retiree attains age 65. The company also has company-sponsored defined benefit pension plans covering employees in the U.K., Germany, Japan, Taiwan and the Netherlands. The amount of the retirement benefits provided under the plans is based on years of service and final average pay.
On March 26, 2009, the company amended its U.S.-based Amended and Restated Littelfuse, Inc. Retirement Plan (the "Pension Plan"), freezing benefit accruals effective April 1, 2009. The amendment provides that participants in the Pension Plan will not receive credit, other than for vesting purposes, for eligible earnings paid or for any months of service worked after the effective date. All accrued benefits under the Pension Plan as of the effective date will remain intact, and service credits for vesting and
retirement eligibility will continue in accordance with the terms of the Pension Plan. As a result of the formal decision to freeze the Pension Plan benefit accruals, the company re-measured its Pension Plan assets and obligations at April 1, 2009, which resulted in a decrease of the Pension Plan obligation of $10.5 million, with a corresponding adjustment to other comprehensive income (loss), net of income taxes, on that date.
58
NOTES TO CONSOLIDATED FINANCIAL STATEMENTS
12. Benefit Plans, continued
Liabilities resulting from the plan that covers employees in the Netherlands are settled annually through the purchase of insurance contracts. Separate from the foreign pension data presented below, net periodic expense for the plan covering the Netherlands employees was $0.0 million, $0.0 million, and $0.2 million in 2011, 2010, and 2009, respectively.
During the fourth quarter of 2010, the company elected to fully fund its German pension liability for approximately $10.2 million in cash. The German pension plan was frozen in 2009.
The company’s contributions are made in amounts sufficient to satisfy legal requirements. The company is not expected to be required to make a minimum funding contribution in accordance with the Employee Retirement Income Securities Act of 1974 (“ERISA”) for fiscal year 2012.
Total pension expense (income) was $0.5 million, ($0.3) million and $1.3 million in 2011, 2010 and 2009, respectively. The increase in pension expense in 2011 resulted from required service and interest costs exceeding net earnings from plan assets for the year. The decrease in pension expense resulting in income in 2010 resulted from net earnings from plan assets that exceeded the required service and interest cost for the year.
59
NOTES TO CONSOLIDATED FINANCIAL STATEMENTS
12. Benefit Plans, continued
Benefit plan related information is as follows:
|
2011
|
2010
|
|||||||||||||||||||||||
|
(In thousands)
|
U.S.
|
Foreign
|
Total
|
U.S.
|
Foreign
|
Total
|
||||||||||||||||||
|
Change in benefit obligation:
|
||||||||||||||||||||||||
|
Benefit obligation at beginning of year
|
$ | 91,264 | $ | 12,627 | $ | 103,891 | $ | 58,774 | $ | 12,670 | $ | 71,444 | ||||||||||||
|
Service cost
|
560 | 429 | 989 | 500 | 266 | 766 | ||||||||||||||||||
|
Interest cost
|
5,110 | 632 | 5,742 | 3,927 | 591 | 4,518 | ||||||||||||||||||
|
Acquisition
|
— | — | — | 25,230 | — | 25,230 | ||||||||||||||||||
|
Curtailment (gain) loss
|
— | (19 | ) | (19 | ) | — | 8 | 8 | ||||||||||||||||
|
Net actuarial gain
|
2,723 | 614 | 3,337 | 7,124 | 726 | 7,850 | ||||||||||||||||||
|
Benefits paid from the trust
|
(5,274 | ) | (37 | ) | (5,311 | ) | (4,291 | ) | (99 | ) | (4,390 | ) | ||||||||||||
|
Benefits paid directly by company
|
— | (874 | ) | (874 | ) | — | (855 | ) | (855 | ) | ||||||||||||||
|
Effect of exchange rate movements
|
— | (179 | ) | (179 | ) | — | (680 | ) | (680 | ) | ||||||||||||||
|
Benefit obligation at end of year
|
$ | 94,383 | $ | 13,193 | $ | 107,576 | $ | 91,264 | $ | 12,627 | $ | 103,891 | ||||||||||||
|
Change in plan assets at fair value:
|
||||||||||||||||||||||||
|
Fair value of plan assets at beginning
of year
|
$ | 87,522 | $ | 11,158 | $ | 98,680 | $ | 52,645 | $ | 974 | $ | 53,619 | ||||||||||||
|
Actual return on plan assets
|
(1,047 | ) | 431 | (616 | ) | 7,938 | 16 | 7,954 | ||||||||||||||||
|
Employer contributions
|
— | — | — | 6,000 | 10,186 | 16,186 | ||||||||||||||||||
|
Business acquisition
|
— | — | — | 25,230 | — | 25,230 | ||||||||||||||||||
|
Benefits paid
|
(5,274 | ) | (37 | ) | (5,311 | ) | (4,291 | ) | (99 | ) | (4,390 | ) | ||||||||||||
|
Effect of exchange rate movements
|
— | (274 | ) | (274 | ) | — | 81 | 81 | ||||||||||||||||
|
Fair value of plan assets at end of year
|
81,201 | 11,278 | 92,479 | 87,522 | 11,158 | 98,680 | ||||||||||||||||||
|
Net amount recognized/unfunded status
|
$ | (13,182 | ) | $ | (1,915 | ) | $ | (15,097 | ) | $ | (3,742 | ) | $ | (1,469 | ) | $ | (5,211 | ) | ||||||
|
Amounts recognized in the Consolidated Balance Sheet consist of:
|
||||||||||||||||||||||||
|
Prepaid benefit cost
|
$ | — | $ | 195 | $ | 195 | $ | — | $ | 353 | $ | 353 | ||||||||||||
|
Accrued benefit liability
|
(13,182 | ) | (2,110 | ) | (15,292 | ) | (3,742 | ) | (1,822 | ) | (5,564 | ) | ||||||||||||
|
Net liability recognized
|
$ | (13,182 | ) | $ | (1,915 | ) | $ | (15,097 | ) | $ | (3,742 | ) | $ | (1,469 | ) | $ | (5,211 | ) | ||||||
|
Accumulated other comprehensive loss
|
$ | 19,728 | $ | 1,036 | $ | 20,764 | $ | 10,188 | $ | 405 | $ | 10,593 | ||||||||||||
Amounts recognized in accumulated other comprehensive income (loss), pre-tax consist of:
|
2011
|
2010
|
|||||||||||||||||||||||
|
(In thousands)
|
U.S.
|
Foreign
|
Total
|
U.S.
|
Foreign
|
Total
|
||||||||||||||||||
|
Net actuarial loss (gain)
|
$ | 19,728 | $ | 1,051 | $ | 20,779 | $ | 10,188 | $ | 423 | $ | 10,611 | ||||||||||||
|
Prior service (cost) credit
|
— | (15 | ) | (15 | ) | — | (18 | ) | (18 | ) | ||||||||||||||
|
Net amount recognized / occurring, pre-tax
|
$ | 19,728 | $ | 1,036 | $ | 20,764 | $ | 10,188 | $ | 405 | $ | 10,593 | ||||||||||||
60
NOTES TO CONSOLIDATED FINANCIAL STATEMENTS
12. Benefit Plans, continued
The estimated net actuarial loss (gain) which will be amortized from accumulated other comprehensive income (loss) into benefit cost in 2012 is less than $0.1 million.
|
U.S.
|
Foreign
|
|||||||||||||||||||||||
|
(In thousands)
|
2011
|
2010
|
2009
|
2011
|
2010
|
2009
|
||||||||||||||||||
|
Components of net periodic benefit cost:
|
||||||||||||||||||||||||
|
Service cost
|
$ | 560 | $ | 500 | $ | 866 | $ | 429 | $ | 266 | $ | 323 | ||||||||||||
|
Interest cost
|
5,110 | 3,927 | 4,076 | 632 | 591 | 735 | ||||||||||||||||||
|
Expected return on plan assets
|
(6,518 | ) | (5,018 | ) | (4,343 | ) | (507 | ) | (15 | ) | (72 | ) | ||||||||||||
|
Amortization of prior service cost (credit)
|
— | — | 2 | (1 | ) | (1 | ) | (12 | ) | |||||||||||||||
|
Amortization of losses/(gains)
|
748 | — | — | 25 | (3 | ) | 13 | |||||||||||||||||
|
Total cost of the plan for the year
|
(100 | ) | (591 | ) | 601 | 578 | 838 | 987 | ||||||||||||||||
|
Expected plan participants’ contributions
|
— | — | — | — | — | — | ||||||||||||||||||
|
Net periodic benefit cost
|
(100 | ) | (591 | ) | 601 | 578 | 838 | 987 | ||||||||||||||||
|
Settlement loss (curtailment gain)
|
— | — | 74 | 11 | 27 | (345 | ) | |||||||||||||||||
|
Total (income) expense for the year
|
$ | (100 | ) | $ | (591 | ) | $ | 675 | $ | 589 | $ | 865 | $ | 642 | ||||||||||
Weighted average assumptions used to determine net periodic benefit cost for the years 2011, 2010 and 2009 are as follows:
|
U.S.
|
Foreign
|
|||||||||||||||||||||||
|
2011
|
2010
|
2009
|
2011
|
2010
|
2009
|
|||||||||||||||||||
|
Discount rate
|
5.9%/5.4 | %** | 7.0 | % | 6.4/7.5 | %* | 5.3 | % | 5.6 | % | 6.6 | % | ||||||||||||
|
Expected return on plan assets
|
8.5%/7.5 | %*** | 8.5 | % | 8.5 | % | 4.5 | % | 1.5 | % | 3.6 | % | ||||||||||||
|
Compensation increase rate
|
— | — | 4.5 | % | 5.3 | % | 4.8 | % | 4.0 | % | ||||||||||||||
|
Measurement dates
|
12/31/11
|
12/31/10
|
12/31/09
|
12/31/11
|
12/31/10
|
12/31/09
|
||||||||||||||||||
|
* Denotes discount rate of 6.4% used through April 1, 2009, with an interest rate of 7.5% used thereafter.
|
||||||||||||||||||||||||
|
**5.9% used for the Littelfuse, Inc. Plan, and 5.4% used for the Cole Hersee plan.
|
||||||||||||||||||||||||
|
*** 8.5% used for the Littelfuse, inc. Plan, and 7.5% used for the Cole Hersee plan.
|
||||||||||||||||||||||||
The accumulated benefit obligation for the U.S. defined benefits plans was $94.4 million and $66.0 million at December 31, 2011 and January 1, 2011, respectively. The accumulated benefit obligation for the foreign plan was $1.2 million and $0.9 million at December 31, 2011 and January 1, 2011, respectively.
Weighted average assumptions used to determine benefit obligations at year-end 2011, 2010 and 2009 are as follows:
|
U.S.
|
Foreign
|
|||||||||||||||||||||||
|
2011
|
2010
|
2009
|
2011
|
2010
|
2009
|
|||||||||||||||||||
|
Discount rate
|
5.4 | % | 5.9/5.4 | %* | 7.0 | % | 5.5 | % | 5.3 | % | 5.6 | % | ||||||||||||
|
Compensation increase rate
|
— | — | — | 5.6 | % | 5.3 | % | 4.8 | % | |||||||||||||||
|
Measurement dates
|
12/31/11
|
12/31/10
|
12/31/09
|
12/31/11
|
12/31/10
|
12/31/09
|
||||||||||||||||||
*5.9% used for the Littelfuse, Inc. plan and 5.4% used for the Cole Hersee plan.
61
NOTES TO CONSOLIDATED FINANCIAL STATEMENTS
12. Benefit Plans, continued
Expected benefit payments to be paid to participants for the fiscal year ending are as follows (in thousands):
|
Year
|
U.S.
|
Foreign
|
||||||
|
2012
|
$ | 4,999 | $ | 1,288 | ||||
|
2013
|
5,087 | 1,039 | ||||||
|
2014
|
5,260 | 847 | ||||||
|
2015
|
5,377 | 869 | ||||||
|
2016
|
5,536 | 945 | ||||||
Defined Benefit Plan Assets
Based upon analysis of the target asset allocation and historical returns by type of investment, the company has assumed that the expected long-term rate of return will be 8.5% on the Littelfuse, Inc. domestic plan assets, 7.5% on the Cole Hersee domestic plan assets and 4.5% on foreign plan assets. Assets are invested to maximize long-term return taking into consideration timing of settlement of the retirement liabilities and liquidity needs for benefits payments. Pension plan assets were invested as follows, and were not materially different from the target asset allocation:
|
U.S. Asset Allocation
|
Foreign Asset Allocation
|
|||||||||||||||
|
2011
|
2010
|
2011
|
2010
|
|||||||||||||
|
Equity securities
|
71 | % | 70 | % | 3 | % | 3 | % | ||||||||
|
Debt securities
|
28 | % | 29 | % | 95 | % | 2 | % | ||||||||
|
Cash
|
1 | % | 1 | % | 2 | % | 95 | % | ||||||||
| 100 | % | 100 | % | 100 | % | 100 | % | |||||||||
The following table presents the company’s U.S and German pension plan assets measured at fair value by classification within the fair value hierarchy as of January 1, 2011 (in thousands):
62
NOTES TO CONSOLIDATED FINANCIAL STATEMENTS
12. Benefit Plans, continued
|
Fair Value Measurements Using
|
||||||||||||||||
|
Quoted Prices in
Active Markets for
Identical Assets
(Level 1)
|
Significant
Other
Observable
Inputs
(Level 2)
|
Significant
Unobservable
Inputs
(Level 3)
|
Total
|
|||||||||||||
|
Equities:
|
||||||||||||||||
|
U.S. large-cap core funds
|
$ | — | $ | 32,555 | $ | — | $ | 32,555 | ||||||||
|
U.S. mid-cap core funds
|
— | 11,347 | — | 11,347 | ||||||||||||
|
U.S. small-cap core funds
|
— | 4,077 | — | 4,077 | ||||||||||||
|
International funds
|
— | 9,719 | — | 9,719 | ||||||||||||
|
Fixed income:
|
||||||||||||||||
|
Investment grade corporate bond funds
|
— | 24,834 | — | 24,834 | ||||||||||||
|
High yield corporate bond funds
|
— | 8,401 | — | 8,401 | ||||||||||||
|
Other
|
— | 871 | — | 871 | ||||||||||||
|
Cash and equivalents
|
675 | — | — | 675 | ||||||||||||
|
Total pension plan assets
|
$ | 675 | $ | 91,804 | $ | — | $ | 92,479 | ||||||||
Defined Contribution Plans
The company also maintains a 401(k) savings plan covering substantially all U.S. employees. The company matches 100% of the employee’s annual contributions for the first 4% of the employee’s gross wages. Employees are immediately vested in their contributions plus actual earnings thereon, as well as the company contributions. Company matching contributions amounted to $1.3 million, $1.1 million and $0.4 million in each of the years 2011, 2010 and 2009, respectively.
On January 1, 2010, the company adopted a non-qualified Supplemental Retirement and Savings Plan. The company will provide additional retirement benefits for certain management employees and named executive officers by allowing participants to contribute up to 90% of their annual compensation with matching contributions of 4% and 5% of the participant’s annual compensation in excess of the IRS compensation limits.
The company previously provided additional retirement benefits for certain key executives through its unfunded defined contribution Supplemental Executive Retirement Plan (“SERP”). The company amended the SERP during 2009 to freeze contributions and set the annual interest rate credited to the accounts until distributed at the five-year Treasury constant maturity rate. The charge to expense for the SERP plan amounted to $0.1 million, $0.1 million and $0.3 million in each of the years 2011, 2010 and 2009, respectively.
63
NOTES TO CONSOLIDATED FINANCIAL STATEMENTS
13. Shareholders’ Equity
Equity Plans
: The company has equity-based compensation plans authorizing the granting of stock options, restricted shares, restricted share units, performance shares, and other stock rights of up to 5,925,000 shares of common stock to employees and directors.
Stock options granted prior to 2002 vested over a five-year period and are exercisable over a ten-year period commencing from the date of vesting. The stock options granted in 2002 through February 2005, vested over a five-year period and are exercisable over a ten-year period commencing from the date of the grant. Stock options granted after February 2005 vest over a three, four or five-year period and are exercisable over either a seven or ten-year period commencing from the date of the grant. Restricted shares and share units granted by the company vest over three to four years.
The company also has performance share agreements under its equity-based compensation plans pursuant to which a target amount of performance share awards have been granted based on the company attaining certain financial performance goals relating to return on net tangible assets (for performance shares granted prior to 2008) or return on net assets (for performance shares granted in 2008) and earnings before interest, taxes, depreciation and amortization over a three-year performance period. The performance-based restricted stock awards granted prior to 2008 vest in thirds over a three-year period (following the three-year performance period). When vested, half of the stock awards are paid in cash and half will be settled through the issuance of the company’s common stock. The performance-based restricted stock awards granted in 2008 vest after a three-year performance period and are satisfied completely by the issuance of the company’s common stock at the end of the performance period. The fair value of the performance-based restricted stock awards that are settled in common stock is measured at the market price on the grant date, and the fair value of the portion paid in cash is measured at the current market price of a share.
The following table provides a reconciliation of outstanding stock options for the fiscal year ended December 31, 2011.
|
Shares Under Option
|
Weighted Average Price
|
Weighted Average Remaining Contract Life (Years)
|
Aggregate Intrinsic Value (000’s)
|
|||||||||||||
|
Outstanding January 1, 2011
|
1,562,800 | $ | 30.63 | |||||||||||||
|
Granted
|
103,578 | 61.64 | ||||||||||||||
|
Exercised
|
(572,611 | ) | 28.73 | |||||||||||||
|
Forfeited
|
(29,516 | ) | 39.59 | |||||||||||||
|
Outstanding December 31, 2011
|
1,064,251 | 34.42 | 3.5 | $ | 10,913 | |||||||||||
|
Exercisable December 31, 2011
|
720,374 | 33.79 | 2.8 | 6,618 | ||||||||||||
64
NOTES TO CONSOLIDATED FINANCIAL STATEMENTS
13. Shareholders’ Equity, continued
The following table provides a reconciliation of nonvested restricted share and share unit awards for the 12 month period ending December 31, 2011.
|
Shares
|
Weighted Average
Grant-Date Fair Value
|
|||||||
|
Nonvested January 1, 2011
|
208,842 | $ | 28.36 | |||||
|
Granted
|
73,067 | 60.32 | ||||||
|
Vested
|
(80,021 | ) | 28.09 | |||||
|
Forfeited
|
(10,721 | ) | 46.69 | |||||
|
Nonvested December 31, 2011
|
191,167 | 39.66 | ||||||
The total intrinsic value of options exercised during 2011, 2010 and 2009 was $15.6 million, $7.6 million, and $0.2 million, respectively.
The company recognizes compensation cost of all share-based awards as an expense on a straight-line basis over the vesting period of the awards. At December 31, 2011, the unrecognized compensation cost for options, restricted shares and performance shares was $7.6 million before tax, and will be recognized over a weighted-average period of 1.8 years. Compensation cost included as a component of selling, general and administrative expense for all equity compensation plans discussed above was $5.8 million, $5.2 million and $5.5 million for 2011, 2010 and 2009, respectively. The total income tax benefit recognized in the Consolidated Statements of Income was $2.1 million, $1.9 million and $2.1 million for 2011, 2010 and 2009, respectively.
The company uses the Black-Scholes option valuation model to determine the fair value of awards granted. The weighted average fair value of and related assumptions for options granted are as follows:
|
2011
|
2010
|
2009
|
||||||||||
|
Weighted average fair value of options granted
|
$ | 24.25 | $ | 17.40 | $ | 5.72 | ||||||
|
Assumptions:
|
||||||||||||
|
Risk-free interest rate
|
2.07 | % | 2.25 | % | 2.19 | % | ||||||
|
Expected dividend yield
|
0.97 | % | 0 | % | 0 | % | ||||||
|
Expected stock price volatility
|
46.0 | % | 47.0 | % | 43.5 | % | ||||||
|
Expected life of options
|
5.1 years
|
4.5 years
|
4.7 years
|
|||||||||
Expected volatilities are based on the historical volatility of the company’s stock price. The expected life of options is based on historical data for options granted by the company and the SEC simplified method. The risk-free rates are based on yields available at the time of grant on U.S. Treasury bonds with maturities consistent with the expected life assumption.
65
NOTES TO CONSOLIDATED FINANCIAL STATEMENTS
13. Shareholders’ Equity, continued
Accumulated Other Comprehensive Income (Loss)
: The components of accumulated other comprehensive income (loss) at the end of the fiscal years 2011, 2010 and 2009 are as follows (in thousands):
|
2011
|
2010
|
2009
|
||||||||||
|
Minimum pension liability adjustment*
|
$ | (13,578 | ) | $ | (6,875 | ) | $ | (3,831 | ) | |||
|
Gain (loss) on investments**
|
6,642 | 9,344 | 8,648 | |||||||||
|
Gain (loss) on derivative instruments***
|
— | — | (92 | ) | ||||||||
|
Foreign currency translation adjustment
|
15,567 | 18,772 | 14,002 | |||||||||
|
Total
|
$ | 8,631 | $ | 21,241 | $ | 18,727 | ||||||
* Net of tax of $7,186, $3,718 and $1,768 for 2011, 2010 and 2009, respectively.
** Net of tax of $0, $0 and $0 for 2011, 2010 and 2009, respectively.
*** Net of tax of $191 for 2009.
Preferred Stock
: The Board of Directors may authorize the issuance of preferred stock from time to time in one or more series with such designations, preferences, qualifications, limitations, restrictions, and optional or other special rights as the Board may fix by resolution.
The Board of Directors authorized the repurchase of up to 1,000,000 shares of the company’s common stock under a program for the period May 1, 2011 to April 30, 2012, of which 859,029 shares were purchased, at an average price of $43.18, through December 31, 2011, and 140,971 shares remain available for purchase under the initial program as of December 31, 2011.
On October 28, 2011, the Board of Directors increased the share repurchase authorization from 1,000,000 shares to 1,500,000 shares. This provides authority to purchase up to 640,971 additional shares between October 28, 2011 and the April 30, 2012 expiration date.
14. Income Taxes
Domestic and foreign income (loss) before income taxes is as follows (in thousands):
|
2011
|
2010
|
2009
|
||||||||||
|
Domestic
|
$ | 25,206 | $ | 15,956 | $ | (10,865 | ) | |||||
|
Foreign
|
89,895 | 91,723 | 21,702 | |||||||||
|
Income before income taxes
|
$ | 115,101 | $ | 107,679 | $ | 10,837 | ||||||
Federal, state, and foreign income tax (benefit) expense consists of the following (in thousands):
|
Current:
|
||||||||||||
|
Federal
|
$ | 6,663 | $ | 2,917 | $ | (2,618 | ) | |||||
|
State
|
1,647 | 586 | 330 | |||||||||
|
Foreign
|
21,130 | 17,729 | 6,619 | |||||||||
|
Subtotal
|
29,440 | 21,232 | 4,331 | |||||||||
|
Deferred:
|
||||||||||||
|
Federal and State
|
(700 | ) | 6,919 | (2,100 | ) | |||||||
|
Foreign
|
(663 | ) | 865 | (805 | ) | |||||||
|
Subtotal
|
(1,363 | ) | 7,784 | (2,905 | ) | |||||||
|
Provision for income taxes
|
$ | 28,077 | $ | 29,016 | $ | 1,426 |
66
NOTES TO CONSOLIDATED FINANCIAL STATEMENTS
14. Income Taxes, continued
A reconciliation between income taxes computed on income before income taxes at the federal statutory rate and the provision for income taxes is provided below (in thousands):
|
2011
|
2010
|
2009
|
||||||||||
|
Tax expense at statutory rate of 35%
|
$ | 40,284 | $ | 37,688 | $ | 3,793 | ||||||
|
State and local taxes, net of federal tax benefit
|
1,484 | 420 | 492 | |||||||||
|
Foreign income tax rate differential
|
(13,052 | ) | (10,554 | ) | (1,741 | ) | ||||||
|
Tax on unremitted earnings
|
(254 | ) | 1,267 | 904 | ||||||||
|
Uncertain tax positions
|
— | — | (2,629 | ) | ||||||||
|
Other, net
|
(385 | ) | 195 | 607 | ||||||||
|
Provision for income taxes
|
$ | 28,077 | $ | 29,016 | $ | 1,426 | ||||||
Deferred income taxes are provided for the tax effects of temporary differences between the financial reporting bases and the tax bases of the company’s assets and liabilities. Significant components of the company’s deferred tax assets and liabilities at December 31, 2011 and January 1, 2011, are as follows (in thousands):
|
2011
|
2010
|
|||||||
|
DEFERRED TAX ASSETS:
|
||||||||
|
Accrued expenses
|
$ | 15,764 | $ | 15,012 | ||||
|
Foreign tax credit carryforwards
|
9,627 | 13,009 | ||||||
|
R&D credit carryforwards
|
1,013 | 867 | ||||||
|
AMT credit carryforwards
|
1,318 | 1,318 | ||||||
|
Accrued restructuring
|
300 | 671 | ||||||
|
Domestic and foreign net operating loss carryforwards
|
1,608 | 3,411 | ||||||
|
Gross deferred tax assets
|
29,630 | 34,288 | ||||||
|
Less: Valuation allowance
|
(708 | ) | (708 | ) | ||||
|
Total deferred tax assets
|
28,922 | 33,580 | ||||||
|
DEFERRED TAX LIABILITIES:
|
||||||||
|
Tax depreciation and amortization in excess of book
|
10,919 | 17,549 | ||||||
|
Other
|
1,917 | 2,171 | ||||||
|
Total deferred tax liabilities
|
12,836 | 19,720 | ||||||
|
NET DEFERRED TAX ASSETS
|
$ | 16,086 | $ | 13,860 | ||||
The deferred tax asset valuation allowance is related to certain deferred tax assets from foreign net operating losses. The remaining domestic and foreign net operating losses either have no expiration date or are expected to be utilized prior to expiration. The foreign tax credit carryforwards begin to expire in 2018. The company paid income taxes of approximately $27.1 million, $6.4 million and $9.9 million in 2011, 2010 and 2009, respectively. U.S. income taxes were not provided for on a cumulative total of approximately $158.0 million of undistributed earnings for certain non-U.S. subsidiaries as of December 31, 2011, and accordingly, no deferred tax liability has been established relative to these earnings. The determination of the deferred tax liability associated with the distribution of these earnings is not practicable. The company has one subsidiary in China and one subsidiary in the Philippines on “tax holidays.” The “tax holidays” expire in China in three years and within the next one to three years in the Philippines.
67
NOTES TO CONSOLIDATED FINANCIAL STATEMENTS
14. Income Taxes, continued
A reconciliation of the beginning and ending amount of unrecognized tax benefits as of December 31, 2011, January 1, 2011 and January 2, 2010 is as follows (in thousands):
|
Balance at December 27, 2008
|
$ | 2,755 | ||
|
Additions for tax positions of prior years
|
204 | |||
|
Additions for tax positions of current year
|
62 | |||
|
Settlements
|
(668 | ) | ||
|
Reductions based on lapse of statue
|
(1,857 | ) | ||
|
Balance at January 2, 2010
|
496 | |||
|
Additions for tax positions of prior years
|
233 | |||
|
Settlements
|
(617 | ) | ||
|
Balance at January 1, 2011 and December 31, 2011
|
$ | 112 |
The amount of unrecognized tax benefits at December 31, 2011 was approximately $0.1 million. Of this total, approximately $0.1 million represents the amount of tax benefits that, if recognized, would favorably affect the effective income tax rate in future periods. The company does not reasonably expect a decrease in unrecognized tax benefits in the next 12 months. None of the positions included in unrecognized tax benefits are related to tax positions for which the ultimate deductibility is highly certain, but for which there is uncertainty about the timing of such deductibility. The U.S. federal statute of limitations remains open for 2009 onward. Foreign and U.S. state statute of limitations generally range from three to six years. The company is currently under examination in Singapore for tax years 2008 and 2009 and in the Philippines for the 2008 tax year. The company does not expect to recognize a significant amount of additional tax expense as a result of concluding either audit.
The company recognizes accrued interest and penalties associated with uncertain tax positions as part of income tax expense.
15. Business Unit Segment Information
An operating segment is defined as a component of an enterprise that engages in business activities from which it may earn revenues and incur expenses, and about which separate financial information is regularly evaluated by the Chief Operating Decision Maker (“CODM”) in deciding how to allocate resources. The CODM is the company’s President and Chief Executive Officer (“CEO”).
68
NOTES TO CONSOLIDATED FINANCIAL STATEMENTS
15. Business Unit Segment Information, continued
The company reports its operations by the following business unit segments: Electronics, Automotive and Electrical.
|
●
|
Electronics.
Provides circuit protection components and expertise to leading global manufacturers of a wide range of electronic products including mobile phones, computers, LCD TVs, telecommunications equipment, medical devices, lighting products and white goods. The Electronics business segment has the broadest product offering in the industry including fuses and protectors, positive temperature coefficient (“PTC”) resettable fuses, varistors, polymer electrostatic discharge (“ESD”) suppressors, discrete transient voltage suppression (“TVS”) diodes, TVS diode arrays and protection thyristors, gas discharge tubes, power switching components and fuseholders, blocks and related accessories.
|
|
●
|
Automotive.
Provides circuit protection products to the worldwide automotive original equipment manufacturers (“OEM”) and parts distributors of passenger automobiles, trucks, buses and off-road equipment. The company also sells its fuses in the automotive replacement parts market. Products include blade fuses, high current fuses, battery cable protectors and varistors.
|
|
●
|
Electrical.
Provides circuit protection products for industrial and commercial customers. Products include power fuses and other circuit protection devices that are used in commercial and industrial buildings and large equipment such as HVAC systems, elevators and machine tools.
|
Each of the operating segments is directly responsible for sales, marketing and research and development. Manufacturing, purchasing, logistics, customer service, finance, information technology and human resources are shared functions that are allocated back to the three operating segments. The CEO allocates resources to and assesses the performance of each operating segment using information about its revenue and operating income (loss), but does not evaluate the operating segments using discrete balance sheet information.
Sales, marketing and research and development expenses are charged directly into each operating segment. All other functions are shared by the operating segments and expenses for these shared functions are allocated to the operating segments and included in the operating results reported below. The company does not report inter-segment revenue because the operating segments do not record it. The company does not allocate interest and other income, interest expense, or taxes to operating segments. Although the CEO uses operating income to evaluate the segments, operating costs included in one segment may benefit other segments. Except as discussed above, the accounting policies for segment reporting are the same as for the company as a whole.
69
NOTES TO CONSOLIDATED FINANCIAL STATEMENTS
15. Business Unit Segment Information, continued
The company has provided this business unit segment information for all comparable prior periods. Segment information is summarized as follows (in thousands):
|
2011
|
2010
|
2009
|
||||||||||
|
Net sales
|
||||||||||||
|
Electronics
|
$ | 354,487 | $ | 373,370 | $ | 253,758 | ||||||
|
Automotive
|
197,586 | 139,096 | 104,647 | |||||||||
|
Electrical
|
112,882 | 95,555 | 71,742 | |||||||||
|
Total net sales
|
$ | 664,955 | $ | 608,021 | $ | 430,147 | ||||||
|
Operating income (loss)
|
||||||||||||
|
Electronics
|
$ | 62,982 | $ | 69,676 | $ | (4,396 | ) | |||||
|
Automotive
|
30,002 | 17,038 | 9,043 | |||||||||
|
Electrical
|
28,902 | 24,697 | 17,389 | |||||||||
|
Other*
|
(7,982 | ) | (3,837 | ) | (8,341 | ) | ||||||
|
Total operating income
|
113,904 | 107,574 | 13,695 | |||||||||
|
Interest expense, net
|
1,691 | 1,437 | 2,377 | |||||||||
|
Other expense (income), net
|
(2,888 | ) | (1,542 | ) | 481 | |||||||
|
Income before income taxes
|
$ | 115,101 | $ | 107,679 | $ | 10,837 | ||||||
* Included in “Other” Operating income for 2011 are acquisition related fees ($1.0 million), a non-cash charge for the sale of inventory that had been stepped-up to fair value at the acquisition date of Cole Hersee ($3.7 million), asset impairment charges related to closure of the company’s Des Plaines, Illinois ($0.8 million), Dundalk, Ireland ($0.6 million) and Duensen, Germany ($0.9 million) manufacturing facilities (see Note 11) and purchase accounting adjustments related to the Selco A/S acquisition ($0.7 million). Included in “Other” Operating income (loss) for 2010 are asset impairment charges related to closure of the company’s Des Plaines, Illinois ($1.3 million) and Dundalk, Ireland ($1.7 million) manufacturing facilities (see Note 11). Included in “Other” Operating income (loss) for 2009 are severance and asset impairment charges related to restructuring activities in the U.S. ($1.6 million), Europe ($5.5 million) and Asia-Pacific ($1.5 million) locations (see Note 9).
The company’s revenues and long-lived assets (total net property, plant and equipment) by geographical area for the fiscal years ended 2011, 2010 and 2009 are as follows (in thousands):
|
2011
|
2010
|
2009
|
||||||||||
|
Net sales
|
||||||||||||
|
Americas
|
$ | 288,592 | $ | 227,747 | $ | 166,137 | ||||||
|
Europe
|
114,895 | 115,113 | 83,449 | |||||||||
|
Asia-Pacific
|
261,468 | 265,161 | 180,561 | |||||||||
|
Total net sales
|
$ | 664,955 | $ | 608,021 | $ | 430,147 | ||||||
|
Long-lived assets
|
||||||||||||
|
Americas
|
$ | 53,887 | $ | 58,869 | $ | 56,603 | ||||||
|
Europe
|
783 | 3,080 | 11,101 | |||||||||
|
Asia-Pacific
|
64,214 | 68,198 | 68,218 | |||||||||
|
Consolidated total
|
$ | 118,884 | $ | 130,147 | $ | 135,922 | ||||||
For the year ended December 31, 2011, approximately 66% of the company’s net sales were to customers outside the United States (exports and foreign operations) including 22% to China. Sales to Arrow Pemco were less than 10% for 2011 and 2009, respectively, but 10.4% in 2010. No other single customer accounted for more than 10% of net sales during the last three years.
70
NOTES TO CONSOLIDATED FINANCIAL STATEMENTS
16. Lease Commitments
The company leases certain office and warehouse space as well as certain machinery and equipment under non-cancellable operating leases. Rent expense under these leases was approximately $7.1 million in 2011, $6.7 million in 2010 and $7.1 million in 2009.
Rent expense is recognized on a straight-line basis over the term of the leases. The difference between straight-line basis rent and the amount paid has been recorded as accrued lease obligations. The company also has leases that have lease renewal provisions. As of December 31, 2011, all operating leases outstanding were with third parties. The company did not have any capital leases as of December 31, 2011.
Future minimum payments for all non-cancelable operating leases with initial terms of one year or more at December 31, 2011, are as follows (in thousands):
|
2012
|
$ | 6,167 | ||
|
2013
|
4,365 | |||
|
2014
|
3,668 | |||
|
2015
|
2,907 | |||
|
2016
|
2,646 | |||
|
2017 and thereafter
|
16,494 | |||
| $ | 36,247 |
17. Earnings Per Share
In June 2008, the FASB issued authoritative guidance which states that unvested share-based payment awards that contain nonforfeitable rights to dividends or dividend equivalents (whether paid or unpaid) are participating securities and shall be included in the computation of earnings per share pursuant to the two-class method.
Effective December 28, 2008, the company adopted the authoritative guidance. The company’s unvested share-based payment awards, such as certain performance shares, restricted shares and restricted share units that contain nonforfeitable rights to dividends, meet the criteria of a participating security. The adoption changed the methodology of computing the company’s earnings per share to the two-class method from the treasury stock method. This change has not affected previously reported earnings per share, consolidated net earnings or net cash flows from operations. Under the two-class method, earnings are allocated between common stock and participating securities. The guidance provides that the presentation of basic and diluted earnings per share is required only for each class of common stock and not for participating securities. As such, the company presents basic and diluted earnings per share for its one class of common stock.
The two-class method includes an earnings allocation formula that determines earnings per share for each class of common stock according to dividends declared and undistributed earnings for the period. The company’s reported net earnings is reduced by the amount allocated to participating securities to arrive at the earnings allocated to common stock shareholders for purposes of calculating earnings per share.
The dilutive effect of participating securities is calculated using the more dilutive of the treasury stock or the two-class method. The company has determined the two-class method to be the more dilutive. As
such, the earnings allocated to common stock shareholders in the basic earnings per share calculation is adjusted for the reallocation of undistributed earnings to participating securities to arrive at the earnings allocated to common stock shareholders for calculating the diluted earnings per share.
71
NOTES TO CONSOLIDATED FINANCIAL STATEMENTS
17. Earnings Per Share, continued
The following table sets forth the computation of basic and diluted earnings per share under the two-class method:
|
(In thousands, except per share amounts)
|
2011
|
2010
|
2009
|
|||||||||
|
Net income as reported
|
$ | 87,024 | $ | 78,663 | $ | 9,411 | ||||||
|
Less: Distributed earnings available to participating securities
|
(16 | ) | (3 | ) | — | |||||||
|
Less: Undistributed earnings available to participating securities
|
(288 | ) | (411 | ) | (78 | ) | ||||||
|
Numerator for basic earnings per share —
|
||||||||||||
|
Undistributed and distributed earnings available to common shareholders
|
$ | 86,720 | $ | 78,249 | $ | 9,333 | ||||||
|
Add: Undistributed earnings allocated to participating securities
|
288 | 411 | 78 | |||||||||
|
Less: Undistributed earnings reallocated to participating securities
|
(283 | ) | (405 | ) | (78 | ) | ||||||
|
Numerator for diluted earnings per share —
|
||||||||||||
|
Undistributed and distributed earnings available to common shareholders
|
$ | 86,725 | $ | 78,255 | $ | 9,333 | ||||||
|
Denominator for basic earnings per share —
|
||||||||||||
|
Weighted-average shares
|
21,901 | 21,875 | 21,743 | |||||||||
|
Effect of dilutive securities:
|
||||||||||||
|
Common stock equivalents
|
354 | 339 | 69 | |||||||||
|
Denominator for diluted earnings per share —
|
||||||||||||
|
Adjusted for weighted-average shares & assumed conversions
|
22,255 | 22,214 | 21,812 | |||||||||
|
Basic earnings per share
|
$ | 3.96 | $ | 3.58 | $ | 0.43 | ||||||
|
Diluted earnings per share
|
$ | 3.90 | $ | 3.52 | $ | 0.43 | ||||||
The following potential shares of common stock attributable to stock options were excluded from the earnings per share calculation because their effect would be anti-dilutive: 85,563 in 2011; 77,729 in 2010; and 1,812,414 in 2009.
18. Selected Quarterly Financial Data (Unaudited)
The quarterly periods listed in the table below for 2011 are for the 13-weeks ending December 31, 2011, October 1, 2011, July 2, 2011 and April 2, 2011, respectively. The quarterly periods for 2010 are for the 13-weeks ending January 1, 2011, October 2, 2010, July 3, 2010 and April 3, 2010, respectively.
72
NOTES TO CONSOLIDATED FINANCIAL STATEMENTS
18. Selected Quarterly Financial data (Unaudited), continued
(In thousands, except per share data)
|
2011
|
2010
|
|||||||||||||||||||||||||||||||
|
4Q
a
|
3Q
b
|
2Q |
1Q
c
|
4Q |
3Q
d
|
2Q | 1Q | |||||||||||||||||||||||||
|
Net sales
|
$ | 147,193 | $ | 173,987 | $ | 176,615 | $ | 167,160 | $ | 142,646 | $ | 163,465 | $ | 157,508 | $ | 144,402 | ||||||||||||||||
|
Gross profit
|
53,526 | 68,471 | 69,994 | 64,703 | 53,956 | 67,253 | 59,383 | 53,280 | ||||||||||||||||||||||||
|
Operating income
|
18,121 | 29,574 | 35,291 | 30,918 | 24,316 | 34,108 | 27,507 | 21,643 | ||||||||||||||||||||||||
|
Net income
|
15,238 | 24,939 | 25,269 | 21,578 | 19,578 | 23,338 | 20,278 | 15,469 | ||||||||||||||||||||||||
|
Net income
per share:
|
||||||||||||||||||||||||||||||||
|
Basic
|
$ | 0.71 | $ | 1.13 | $ | 1.13 | $ | 0.98 | $ | 0.89 | $ | 1.06 | $ | 0.91 | $ | 0.70 | ||||||||||||||||
|
Diluted
|
$ | 0.70 | $ | 1.12 | $ | 1.11 | $ | 0.96 | $ | 0.88 | $ | 1.04 | $ | 0.90 | $ | 0.69 | ||||||||||||||||
|
|
a – In the fourth quarter of 2011, the company recorded $0.5 million of non-cash charges related to the step-up of inventory from the Selco A/S acquisition. (See Note 2). The company also recorded a $1.7 million decrease to income tax expense related to a deferred tax asset write-up due to an increase in the statutory rate in China.
|
|
|
b – In the third quarter of 2011, the company recorded a $2.3 million charge related to asset impairments in Europe.
|
|
|
c – In the first quarter of 2011, the company recorded $3.7 million of non-cash charges related to the step-up of inventory from the Cole Hersee acquisition. (See Note 2).
|
|
|
d – In the third quarter of 2010, the company recorded a $3.0 million charge related to asset impairments in the U.S. and Europe.
|
RDGXBRLParseEnd
None.
Section 404 of the Sarbanes-Oxley Act of 2002 requires management to include in this Annual Report on Form 10-K a report on management’s assessment of the effectiveness of the company’s internal control over financial reporting, as well as an attestation report from the company’s independent registered accounting firm on the effectiveness of the company’s internal control over financial reporting.
Management’s Report on Internal Control over Financial Reporting
The management of Littelfuse is responsible for establishing and maintaining adequate internal control over financial reporting as such term is defined in Exchange Act Rule 13a-15(f). Littelfuse’s internal control system was designed to provide reasonable assurance to its management and the Board of Directors regarding the preparation and fair presentation of published financial statements.
All internal control systems, no matter how well designed, have inherent limitations. Therefore, even those systems determined effective can provide only reasonable assurance with respect to financial statement preparation and presentation.
Littelfuse’s management assessed the effectiveness of the company’s internal control over financial reporting as of December 31, 2011, based upon the framework in Internal Control — Integrated Framework issued by the Committee of Sponsoring Organizations of the Treadway Commission (“COSO”). Based on this assessment, the company’s management concluded that, as of December 31, 2011, the company’s internal control over financial reporting is effective.
73
Littelfuse’s independent registered public accounting firm, Ernst & Young LLP, has audited the effectiveness of the company’s internal control over financial reporting as of December 31, 2011. Their report appears on page 38 hereof.
Changes in Internal Control over Financial Reporting
There was no change in the company’s internal control over financial reporting that occurred during the company’s fourth fiscal quarter ended December 31, 2011 that has materially affected, or is reasonably likely to materially affect, the company’s internal control over financial reporting.
Disclosure Controls and Procedures
The company maintains disclosure controls and procedures that are designed to ensure that information required to be disclosed in the company’s Exchange Act reports is recorded, processed, summarized and reported within the time periods specified in the Securities and Exchange Commission’s rules and forms, and that such information is accumulated and communicated to the company’s management, including the Chief Executive Officer and Chief Financial Officer, as appropriate, to allow timely decisions regarding required disclosure.
As of December 31, 2011, the Chief Executive Officer and Chief Financial Officer of the company evaluated the effectiveness of the disclosure controls and procedures of the company and concluded that these disclosure controls and procedures were effective.
None.
74
Executive Officers of the Registrant
The executive officers of the company are as follows:
|
Name
|
Age
|
Position
|
|
Gordon Hunter
|
60
|
Chairman of the Board of Directors, President and Chief Executive Officer
|
|
Philip G. Franklin
|
60
|
Vice President, Operations Support, Chief Financial Officer and Treasurer
|
|
Dal Ferbert
|
58
|
Vice President and General Manager of the Electrical Business Unit
|
|
Dieter Roeder
|
55
|
Vice President and General Manager of the Automotive Business Unit
|
|
Deepak Nayar…………
|
53
|
Vice President and General Manager of the Electronics Business Unit
|
|
David W. Heinzmann
|
48
|
Vice President of Global Operations
|
|
Ryan K. Stafford
|
44
|
General Counsel and Vice President, Human Resources
|
|
Paul Dickinson
|
40
|
Vice President and General Manager, Semiconductor Products
|
|
Mary S. Muchoney
|
66
|
Corporate Secretary
|
Officers of Littelfuse are elected by the Board of Directors and serve at the discretion of the Board.
Gordon Hunter was elected as the Chairman of the Board of Directors of the company and President and Chief Executive Officer effective January 1, 2005. Mr. Hunter served as Chief Operating Officer of the company from November 2003 to January 2005. Mr. Hunter has been a member of the Board of Directors of the company since June 2002, where he has served as Chairman of the Technology Committee. Prior to joining Littelfuse, Mr. Hunter was employed with Intel Corporation, where he was Vice President, Intel Communications Group, and General Manager, Optical Products Group, responsible for managing the access and optical communications business segments, from 2002 to 2003. Mr. Hunter was CEO for Calmar Optcom during 2001. From 1997 to 2002, he also served as a Vice President for Raychem Corporation. His experience includes 20 years with Raychem Corporation in the United States and Europe, with responsibilities in sales, marketing, engineering and general management.
Philip G. Franklin, Vice President, Operations Support, Chief Financial Officer and Treasurer, joined the company in 1998 and is responsible for finance and accounting, investor relations, mergers and acquisitions, and information systems. Prior to joining Littelfuse, Mr. Franklin was Vice President and Chief Financial Officer for OmniQuip International, a private equity sponsored roll-up in the construction equipment industry, which he helped take public. Before that, Mr. Franklin served as Chief Financial Officer for both Monarch Marking Systems, a subsidiary of Pitney Bowes, and Hill Refrigeration, a company controlled by Sam Zell. Earlier in his career, he worked in a variety of finance and general management positions at FMC Corporation. Mr. Franklin currently serves on the Board of Directors of TTM Technologies, where he is Chairman of the Audit Committee.
Dal Ferbert, Vice President and General Manager, Electrical Business Unit, is responsible for the management of daily operations, sales, marketing and strategic planning efforts of the Electrical Business Unit (POWR-GARD®) products. Mr. Ferbert joined the company in 1976 as a member of the electronic distributor sales team. From 1980 to 1989 he served in the Materials Management Department as a buyer and then Purchasing Manager. In 1990, he was promoted to National Sales Manager of the Electrical Business Unit and then promoted to his current position in 2004.
75
Executive Officers of the Registrant, continued
Dieter Roeder, Vice President and General Manager, Automotive Business Unit, is responsible for marketing, sales, product development and customer relationships for all automotive business units. Mr. Roeder joined the company in 2005 leading the Automotive Business Unit’s European sales team, based in Germany, before he was promoted to his current position in August 2007. Prior to joining the company, Mr. Roeder served as Director of Business Development Europe for TDS Automotive from 2002 to 2005. Before that, Mr. Roeder spent ten years with Raychem GmbH (later Tyco Electronics) where he had various sales and marketing responsibilities within the European automotive industry.
Deepak Nayar, Vice President and General Manager, Electronics Business Unit, is responsible for marketing, sales, product development and customer relationships of the Electronics Business Unit. Mr. Nayar joined the company in 2005 as Business Line Director of the Electronics Business Unit. In July 2007, Mr. Nayar was promoted to Vice President, Global Sales, Electronics Business Unit, before he was promoted to his current position in 2011. Prior to joining the company, Mr. Nayar served as Worldwide Sales Director of Tyco Electronics Power Components Division from 1999 to 2005. Before that, Mr. Nayar served as Director of Business Development, Raychem Electronics OEM Group from 1997 to 1999.
David W. Heinzmann, Vice President, Global Operations, is responsible for Littelfuse’s manufacturing and supply chain groups for all three of the company’s business units. Mr. Heinzmann began his career at the company in 1985 and possesses a broad range of experience within the organization. He has held positions as a Manufacturing Manager, Quality Manager, Plant Manager and Product Development Manager. Mr. Heinzmann also served as Director of Global Operations of the Electronics Business Unit from early 2000 through 2003. He served as Vice President and General Manager, Automotive Business Unit, from 2004 through August 2007 and then was promoted to his current position.
Ryan K. Stafford, General Counsel and Vice President, Human Resources, leads the company’s legal, compliance, internal audit and human resources functions. Mr. Stafford joined the company’s executive team as its first general counsel in January 2007. Prior to joining the company, Mr. Stafford served in a number of roles at Tyco International Ltd., including Vice President of China Operations and Vice President & General Counsel for its Engineered Products & Services Business Segment. Prior to that he was with the law firm Sulloway & Hollis P.L.L.C.
Paul Dickinson, Vice President and General Manager, Semiconductor Products, is responsible for the marketing, sales, product development and strategic planning efforts of the company’s semiconductor products. Mr. Dickinson joined the company in 1993 and has held a broad range of positions with responsibility for corporate and international accounting and finance. Most recently, Mr. Dickinson served as Vice President, Corporate Development and Treasurer from 2005 through 2008, with responsibility for corporate acquisition, strategy, treasury, tax and finance functions. Mr. Dickinson was promoted to his current position in August 2008.
Mary S. Muchoney has served as Corporate Secretary since 1991, after joining Littelfuse in 1977. She is responsible for providing all secretarial and administrative functions for the President and Littelfuse Board of Directors. Ms. Muchoney is a member of the Society of Corporate Secretaries & Governance Professionals, as well as honorary member of the Society’s Silver Quill Society.
76
The information set forth under “Election of Directors” and “Section 16(a) Beneficial Ownership Reporting Compliance” in the Proxy Statement is incorporated herein by reference. The company maintains a code of conduct, which applies to all employees, executive officers and directors. The company’s code of conduct meets the requirements of a “code of ethics” as defined by Item 406 of Regulation S-K and applies to our Chief Executive Officer, Chief Financial Officer and Chief Accounting Officer as well as all other executive officers and employees. The code of conduct is available for public viewing on the company’s web site at www.littelfuse.com under the heading “Investors – Corporate Governance.”
If the company makes substantive amendments to the code of conduct or grants any waiver to its Chief Executive Officer, Chief Financial Officer or persons performing similar functions, Littelfuse will disclose the nature of such amendment or waiver on its website or in a Current Report on Form 8-K in accordance with applicable rules and regulations. The information contained on or connected to the company’s web site is not incorporated by reference into this Form 10-K and should not be considered part of this or any other report Littelfuse files or furnishes with the SEC. There have been no material changes to the procedures by which security holders may recommend nominees to the company’s Board of Directors in 2011.
The information set forth under “Election of Directors – Compensation of Directors” and “Executive Compensation” in the Proxy Statement is incorporated herein by reference, except the section captioned “Compensation Committee Report” is hereby “furnished” and not “filed” with this Annual Report on Form 10-K.
The information set forth under “Ownership of Littelfuse, Inc. Common Stock” and “Compensation Plan Information” in the Proxy Statement is incorporated herein by reference.
The information set forth under “Certain Relationships and Related Transactions” and “Election of Directors” in the Proxy Statement is incorporated herein by reference.
The information set forth under “Audit and Non-Audit Fees” in the Proxy Statement is incorporated herein by reference.
77
|
(a)
|
Financial Statements and Schedules
|
|
|
(1)
|
The following Financial Statements are filed as a part of this report:
|
|
|
(i)
|
Report of Independent Registered Public Accounting Firm (pages 37-38).
|
|
|
(ii)
|
Consolidated Balance Sheets as of December 31, 2011, and January 1, 2011 (page 39).
|
|
|
(iii)
|
Consolidated Statements of Income for the years ended December 31, 2011, January 1, 2011, and January 2, 2010, (page 40).
|
|
|
(iv)
|
Consolidated Statements of Cash Flows for the years ended December 31, 2011, January 1, 2011, and January 2, 2010, (page 41).
|
|
|
(v)
|
Consolidated Statements of Equity for the years ended December 31, 2011, January 1, 2011, and January 2, 2010, (page 42).
|
|
|
(vi)
|
Notes to Consolidated Financial Statements (pages 43-73).
|
|
|
(2)
|
The following Financial Statement Schedule is submitted herewith for the periods indicated therein.
|
|
|
(i)
|
Schedule II - Valuation and Qualifying Accounts and Reserves (page 79).
|
All other schedules for which provision is made in the applicable accounting regulations of the Securities and Exchange Commission are not required under the related instructions or are inapplicable and, therefore, have been omitted.
|
|
(3)
|
Exhibits. See Exhibit Index on pages 81-83.
|
78
SCHEDULE II
VALUATION AND QUALIFYING ACCOUNTS AND RESERVES
(In thousands of USD)
|
Description
|
Balance at
Beginning
Of Year
|
Charged to
Costs and
Expenses
(1)
|
Deductions
(2)
|
Other
(3)
|
Balance at
End of
Year
|
|||||||||||||||
|
Year ended December 31, 2011
|
||||||||||||||||||||
|
Allowance for losses on accounts receivable
|
$ | 1,127 | $ | 444 | $ | 953 | $ | (224 | ) | $ | 394 | |||||||||
|
Reserves for sales discounts and allowances
|
$ | 12,342 | $ | 61,031 | $ | 61,681 | $ | 220 | $ | 11,912 | ||||||||||
|
Year ended January1, 2011
|
||||||||||||||||||||
|
Allowance for losses on accounts receivable
|
$ | 657 | $ | 353 | $ | 99 | $ | 216 | $ | 1,127 | ||||||||||
|
Reserves for sales discounts and allowances
|
$ | 9,318 | $ | 53,942 | $ | 50,760 | $ | (158 | ) | $ | 12,342 | |||||||||
|
Year ended January 2, 2010
|
||||||||||||||||||||
|
Allowance for losses on accounts receivable
|
$ | 896 | $ | 319 | $ | 583 | $ | 25 | $ | 657 | ||||||||||
|
Reserves for sales discounts and allowances
|
$ | 11,874 | $ | 40,512 | $ | 43,112 | $ | 44 | $ | 9,318 | ||||||||||
|
|
(1)
|
Includes provision for doubtful accounts, sales returns and sales discounts granted to customers.
|
|
|
(2)
|
Represents uncollectible accounts written off, net of recoveries and credits issued to customers.
|
|
|
(3)
|
Represents business acquisitions and foreign currency translation adjustments.
|
79
SIGNATURES
Pursuant to the requirements of Section 13 or 15(d) of the Securities Exchange Act of 1934, the registrant has duly caused this report to be signed on its behalf by the undersigned, thereunto duly authorized.
|
Littelfuse, Inc.
|
|||
|
|
By:
|
/s/ Gordon Hunter | |
|
Gordon Hunter,
|
|||
|
Chairman of the Board of Directors,
|
|||
|
President and Chief Executive Officer
|
|||
Date: February 24, 2012
Pursuant to the requirements of the Securities Exchange Act of 1934, this report has been signed below by the following persons on behalf of the registrant on February 24, 2012 and in the capacities indicated.
|
/s/ Gordon Hunter
|
Chairman of the Board of Directors, President and
|
|
Gordon Hunter
|
Chief Executive Officer (Principal Executive Officer)
|
|
/s/ Tzau-Jin Chung
|
Director
|
|
Tzau-Jin Chung
|
|
|
/s/ John P. Driscoll
|
Director
|
|
John P. Driscoll
|
|
|
/s/ Anthony Grillo
|
Director
|
|
Anthony Grillo
|
|
|
/s/ John E. Major
|
Director
|
|
John E. Major
|
|
|
/s/ William P. Noglows
|
Director
|
|
William P. Noglows
|
|
|
/s/ Ronald L. Schubel
|
Director
|
|
Ronald L. Schubel
|
|
|
/s/ Philip G. Franklin
|
Vice President, Operations Support, Chief Financial Officer and Treasurer (Principal Financial and Principal Accounting Officer)
|
|
Philip G. Franklin
|
80
The following documents listed below that have been previously filed with the SEC (1934 Act File No. 0-20388) are incorporated herein by reference:
|
Exhibit No.
|
Description
|
|
|
3.1
|
Certificate of Incorporation, as amended to date (filed as Exhibit 3(I) to the company’s Form 10-K for the fiscal year ended January 3, 1998).
|
|
|
3.2
|
Certificate of Designations of Series A Preferred Stock (filed as Exhibit 4.2 to the company’s Current Report on Form 8-K dated December 1, 1995).
|
|
|
3.3
|
Bylaws, as amended to date (filed as Exhibit 3.1 to the company’s Current Report on Form 8-K dated October 26, 2007).
|
|
|
10.1
|
Amendment to Non-Qualified Stock Option Agreement and Agreement for Deferred Compensation between Littelfuse, Inc., and Gordon Hunter (filed as Exhibit 10.27 to the company’s Form 10-K for the fiscal year ended December 31, 2005).
|
|
|
10.2
|
Amended and Restated Employment Agreement dated as of December 31, 2007, between Littelfuse, Inc., and Gordon Hunter (filed as Exhibit 10.1 to the company’s Form 10-K for the fiscal year ended December 29, 2007).
|
|
|
10.3*
|
Change of Control Agreement effective as of January 1, 2012, between Littelfuse, Inc., and Gordon Hunter.
|
|
|
10.4*
|
Change of Control Agreement effective as of January 1, 2012, between Littelfuse, Inc., and Philip G. Franklin.
|
|
|
10.5*
|
Change of Control Agreement effective as of January 1, 2012, between Littelfuse, Inc., and David W. Heinzmann.
|
|
|
10.6*
|
Change of Control Agreement effective as of January 1, 2012, between Littelfuse, Inc., and Hugh Dalsen Ferbert.
|
|
|
10.7*
|
Change of Control Agreement effective as of January 1, 2012, between Littelfuse, Inc., and Ryan K. Stafford.
|
|
|
10.8
|
Summary of Director Compensation (filed as Exhibit 10.18 to the company’s Form 10-K for the fiscal year ended December 29, 2007).
|
|
|
10.9
|
Amended and restated Littelfuse, Inc. 401(k) Retirement and Savings Plan (filed as Exhibit 10.1 to the company’s Form 8-K dated October 9, 2009).
|
|
|
10.10
|
1993 Stock Plan for Employees and Directors of Littelfuse, Inc., as amended (filed as Exhibit 10.1 to the company’s Form 10-Q for the quarterly period ended July 2, 2005).
|
|
|
10.11
|
Form of Non-Qualified Stock Option Agreement under the 1993 Stock Plan for Employees and Directors of Littelfuse, Inc. for employees of the company (filed as Exhibit 99.1 to the company’s Current Report on Form 8-K dated November 8, 2004).
|
|
|
10.12
|
Form of Performance Shares Agreement under the 1993 Stock Plan for Employees and Directors of Littelfuse, Inc. (filed as Exhibit 10.23 to the company’s Form 10-K for the fiscal year ended January 1, 2005).
|
|
|
10.13
|
Form of Non-Qualified Stock Option Agreement under the 1993 Stock Plan for Employees and Directors of Littelfuse, Inc., for non-employee directors of the company (filed as Exhibit 10.24 to the company’s Form 10-K for the fiscal year ended January 1, 2005).
|
|
|
10.14
|
Stock Plan for New Directors of Littelfuse, Inc., as amended (filed as Exhibit 10.2 to the company’s Form 10-Q for the quarterly period ended July 2, 2005).
|
81
|
Exhibit No.
|
Description
|
|
|
10.15
|
Stock Plan for Employees and Directors of Littelfuse, Inc., as amended (filed as Exhibit 10.3 to the company’s Form 10-Q for the quarterly period ended July 2, 2005).
|
|
|
10.16
|
Littelfuse, Inc., Equity Incentive Compensation Plan (filed as Exhibit A to the company’s Proxy Statement for Annual Meeting of Stockholders held on May 5, 2006).
|
|
|
10.17
|
First Amendment to the Littelfuse, Inc., Equity Incentive Compensation Plan dated as of July 28, 2008 (filed as Exhibit 10.2 to the company’s Form 10-Q for the quarterly period ended March 28, 2009).
|
|
|
10.18
|
Form of Non-Qualified Stock Option Agreement under the Littelfuse, Inc., Equity Incentive Compensation Plan (filed as Exhibit 99.4 to the company’s Current Report on Form 8-K dated May 5, 2006).
|
|
|
10.19
|
Form of Performance Shares Agreement under the Littelfuse, Inc., Equity Incentive Compensation Plan (filed as Exhibit 99.1 to the company’s Current Report on Form 8-K dated March 12, 2008).
|
|
|
10.20
|
Littelfuse, Inc., Outside Directors’ Stock Option Plan (filed as Exhibit B to the company’s Proxy Statement for Annual Meeting of Stockholders held on May 5, 2006).
|
|
|
10.21
|
Form of Non-Qualified Stock Option Agreement under the Littelfuse, Inc., Outside Directors Stock Option Plan (filed as Exhibit 99.6 to the company’s Current Report on Form 8-K dated May 5, 2006).
|
|
|
10.22
|
Littelfuse, Inc., Outside Directors’ Equity Plan (filed as Exhibit A to the company’s Proxy Statement for Annual Meeting of Stockholders held on April 27, 2007).
|
|
|
10.23
|
First Amendment to the Littelfuse, Inc., Outside Directors’ Equity Plan, dated as of July 28, 2008 (filed as Exhibit 10.1 to the company’s Form 10-Q for the quarterly period ended March 28, 2009).
|
|
|
10.24
|
Form of Stock Option Award Agreement under the Littelfuse, Inc., Outside Directors' Equity Plan (filed as Exhibit 99.3 to the company’s Current Report on Form 8-K dated April 25, 2008).
|
|
|
10.25
|
Form of Restricted Stock Unit Award Agreement under the Littelfuse, Inc., Outside Directors' Equity Plan (filed as Exhibit 99.4 to the company’s Current Report on Form 8-K dated April 25, 2008).
|
|
|
10.26
|
Amended and Restated, Littelfuse, Inc., Supplemental Executive Retirement Plan (filed as Exhibit 10.3 to the company’s Form 10-K for the fiscal year ended December 29, 2007).
|
|
|
10.27
|
Termination Amendment to Littelfuse, Inc., Supplemental Executive Retirement Plan (filed as Exhibit 10.2 to the company’s Current Report on form 8-K dated October 9, 2009).
|
|
|
10.28
|
Amended and Restated, Littelfuse, Inc., Deferred Compensation Plan for Non-employee Directors (filed as Exhibit 10.4 to the company’s Form 10-K for the fiscal year ended December 29, 2007).
|
|
|
10.29
|
Amended and Restated Littelfuse, Inc., Retirement Plan (filed as Exhibit 10.13 to the company’s Form 10-K for the fiscal year ended December 29, 2007).
|
|
|
10.30
|
Amendment to Amended and Restated Littelfuse, Inc., Retirement Plan (filed as Exhibit 10.30 to the company’s Form 10-K for the fiscal year ended January 2, 2010).
|
|
|
10.31
|
Amended and Restated, Littelfuse, Inc., Annual Incentive Plan (filed as Exhibit 10.1 to the company’s form 10-Q for the quarterly period ended April 2, 2010).
|
|
|
10.32
|
Form of Restricted Stock Award Agreement under the Littelfuse, Inc., Equity Incentive Compensation Plan (filed as Exhibit 10.1 to the company’s Current Report on form 8-K dated April 28, 2009).
|
82
|
Exhibit No.
|
Description
|
|
|
10.33
|
Form of Stock Option Award Agreement under the Littelfuse, Inc., Equity Incentive Compensation Plan (filed as Exhibit 10.2 to the company’s Current Report on form 8-K dated April 28, 2009).
|
|
|
10.34
|
Littelfuse, Inc., Supplemental Retirement and Savings Plan (filed as Exhibit 10.3 to the company’s Current Report on form 8-K dated October 9, 2009).
|
|
|
10.35
|
Littelfuse, Inc. Long-Term Incentive Plan (filed as Exhibit 10.1 to the company’s Form 8-K dated May 5, 2010).
|
|
|
10.36
|
Form of Restricted Stock Unit Award Agreement (Outside Director) under the Littelfuse, Inc. Long-Term Incentive Plan (filed as Exhibit 4.4 to the company’s Form S-8 dated May 19, 2010).
|
|
|
10.37
|
Form of Restricted Stock Unit Award Agreement (Executive) under the Littelfuse, Inc. Long-Term Incentive Plan (filed as Exhibit 4.5 to the company’s Form S-8 dated May 19, 2010).
|
|
|
10.38
|
Form of Stock Option Award Agreement under the Littelfuse, Inc. Long-Term Incentive Plan (filed as Exhibit 4.6 to the company’s Form S-8 dated May 19, 2010).
|
|
|
10.39
|
Bank credit agreement among Littelfuse, Inc., as borrower, the lenders named therein and the Bank of America N.A., as agent, dated as of July 21, 2006 (filed as Exhibit 10.1 to the company’s Form 10-Q for the quarterly period ended September 30, 2006).
|
|
|
10.40
|
First Amendment, dated as of September 29, 2008, to that certain Credit Agreement, dated as of July 21, 2006, among Littelfuse, Inc., the lenders named therein and Bank of America, N.A., as agent (filed as Exhibit 10.2 to the company’s Form 10-Q for the quarterly period ended September 27, 2008).
|
|
|
10.41
|
Loan Agreement, dated as of September 29, 2008, among Littelfuse, Inc., the lenders named therein and JPMorgan Chase Bank, N.A., as agent (filed as Exhibit 10.1 to the company’s Form 10-Q for the quarterly period ended September 27, 2008).
|
|
|
14.1
|
Code of Conduct (filed as Exhibit 14.1 to the company’s Current Report on Form 8-K dated October 24, 2008).
|
|
|
21.1*
|
Subsidiaries.
|
|
|
23.1*
|
Consent of Independent Registered Public Accounting Firm.
|
|
|
31.1*
|
Rule 13a-14(a)/15d-14(a) certification of Gordon Hunter.
|
|
|
31.2*
|
Rule 13a-14(a)/15d-14(a) certification of Philip G. Franklin.
|
|
|
32.1+
|
Section 1350 certification.
|
|
|
101.INS
|
XBRL Instance Document
|
|
|
101.SCH
|
XBRL Taxonomy Extension Schema Document
|
|
|
101.CAL
|
XBRL Taxonomy Extension Calculation Linkbase Document
|
|
|
101.LAB
|
XBRL Taxonomy Extension Label Linkbase Document
|
|
|
101.PRE
|
XBRL Taxonomy Extension Presentation Linkbase Document
|
|
|
101.DEF
|
XBRL Taxonomy Extension Definition Linkbase Document
|
Exhibits 10.1 through 10.38 are management contracts or compensatory plans or arrangements.
* Filed with this Report.
+ Furnished with this Report.
83
TABLE OF CONTENTS
Part IItem 1. BusinessItem 1A. Risk FactorsItem 1B. Unresolved Staff CommentsItem 2. PropertiesItem 3. Legal ProceedingsItem 4. Mine Safety DisclosuresPart IIItem 5. Market For Registrant S Common Equity, Related Stockholder Matters and Issuer Purchases Of Equity SecuritiesItem 6. Selected Financial DataItem 7. Management S Discussion and Analysis Of Financial Condition and Results Of OperationsItem 7A. Quantitative and Qualitative Disclosures About Market RiskItem 8. Financial Statements and Supplementary DataItem 9. Changes in and Disagreements with Accountants on Accounting and Financial DisclosureItem 9A. Controls and ProceduresItem 9B. Other InformationPart IIIItem 10. Directors, Executive Officers and Corporate GovernanceItem 11. Executive CompensationItem 12. Security Ownership Of Certain Beneficial Owners and Management and Related Stockholder MattersItem 13. Certain Relationships and Related Transactions, and Director IndependenceItem 14. Principal Accounting Fees and ServicesPart IVItem 15. Exhibits, Financial Statement Schedules