REWALK ROBOTICS LTD.
10-Ks,20-Fs and 10-Qs
|
|
|
|
|
|
|
|
|
|
|
|
|
|
|
|
|
|
|
|
|
|
|
|
|
|
|
|
|
|
|
|
|
|
|
UNITED STATES
SECURITIES AND EXCHANGE COMMISSION
Washington, D.C. 20549
FORM 10-K
|
x
|
ANNUAL REPORT PURSUANT TO SECTION 13 OR 15(d) OF THE SECURITIES EXCHANGE ACT OF 1934
|
For the fiscal year ended
December 31, 2015
or
|
¨
|
TRANSITION REPORT PURSUANT TO SECTION 13 OR 15(d) OF THE SECURITIES EXCHANGE ACT OF 1934
|
For the transition period from _____ to ______
Commission File Number: 001-36612

ReWalk Robotics Ltd.
(Exact name of registrant as specified in charter)
|
Israel
|
Not applicable
|
|
|
(State or other jurisdiction of incorporation or organization)
|
(I.R.S. employer identification no.)
|
|
|
3 Hatnufa Street, Floor 6, Yokneam Ilit, Israel
|
2069203
|
|
|
(Address of principal executive offices)
|
(Zip Code)
|
|
Registrant's telephone number, including area code:
+972.4.959.0123
Securities registered pursuant to Section 12(b) of the Act:
|
Title of Each Class
|
Name of Each Exchange on Which Registered
|
|
Ordinary Shares, par value NIS 0.01 per share
|
The Nasdaq Stock Market LLC
|
Securities Registered Pursuant to Section 12(g) of the Act: None
Indicate by check mark if the registrant is a well-known seasoned issuer, as defined in Rule 405 of the Securities Act. Yes
o
No
x
Indicate by check mark if the registrant is not required to file reports pursuant to Section 13 or Section 15(d) of the Act. Yes
o
No
x
Indicate by a check mark whether the Registrant (1) has filed all reports required to be filed by Section 13 or 15(d) of the Securities Exchange Act of 1934 during the preceding 12 months (or for such shorter period that the Registrant was required to file such reports), and (2) has been subject to such filing requirements for the past 90 days. Yes
x
No
o
Indicate by check mark whether the registrant has submitted electronically and posted on its corporate Web site, if any, every Interactive Data File required to be submitted and posted pursuant to Rule 405 of Regulation S-T during the preceding 12 months (or for such shorter period that the registrant was required to submit and post such files). Yes
x
No
o
Indicate by check mark if disclosure of delinquent filers pursuant to Item 405 of Regulation S-K is not contained herein, and will not be contained, to the best of the Registrant's knowledge, in definitive proxy or information statements incorporated by reference in Part III of this Form 10-K or any amendment to this Form 10-K.
o
Indicate by check mark whether the registrant is a large accelerated filer, an accelerated filer, a non-accelerated filer, or a smaller reporting company. See the definitions of “large accelerated filer”, “accelerated filer” and “smaller reporting company” in Rule 12b-2 of the Exchange Act.
|
Large accelerated filer
o
|
Accelerated filer
x
|
|
Non-accelerated filer
o
(Do not check if a smaller reporting company)
|
Smaller reporting company
o
|
Indicate by check mark whether the registrant is a shell company (as defined in Rule 12b-2 of the Exchange Act). Yes
o
No
x
The aggregate market value of the Ordinary Shares held by non-affiliates of the Registrant based upon the closing price
of the Ordinary Shares as reported by the Nasdaq Global Market on June 30, 2015 (the last business day of the Registrant’s most recently completed second fiscal quarter) was $92,501,337.
As o
f February 22,
2016, the Registrant had outstanding 12,340,578 Ordinary Shares, par value NIS 0.01 per share.
DOCUMENTS INCORPORATED BY REFERENCE
Portions of our proxy statement for our 2016 Annual Meeting of Shareholders, which is to be filed within 120 days after the end of our 2015 fiscal year, are incorporated by reference into Part III of this annual report on Form 10-K
.
REWALK ROBOTICS LTD.
FORM 10-K FOR THE YEAR ENDED
DECEMBER 31, 2015
TABLE OF CONTENTS
|
Page No
|
||
|
PART I
|
||
|
PART II
|
||
|
PART III
|
||
|
PART IV
|
||
|
INDEX TO CONSOLIDATED FINANCIAL STATEMENTS
|
F-1
|
|
i
Definitions and Introduction
Our legal and commercial name is ReWalk Robotics Ltd.
We are a company limited by shares organized under the laws of the State of Israel and were founded in 2001. In September 2014, we listed our shares on the Nasdaq Global Market. We have irrevocably appointed ReWalk Robotics, Inc. as our agent to receive service of process in any action against us in any United States federal or state court. The address of ReWalk Robotics, Inc. is 33 Locke Drive, Marlborough, MA 01752. As used herein, and unless the context suggests otherwise, the terms ReWalk, the Company, we, us or ours refer to ReWalk Robotics Ltd
.
Special Note Regarding Forward-Looking Statements
This annual report on Form 10-K, or annual report, contains forward-looking statements within the meaning of Section 27A of the Securities Act of 1933, as amended, or the Securities Act, Section 21E of the Securities Exchange Act of 1934, as amended, or the Exchange Act, and the safe harbor provisions of the U.S. Private Securities Litigation Reform Act of 1995, that are based on our management’s beliefs and assumptions and on information currently available to our management. Forward-looking statements include information concerning our possible or assumed future results of operations, business strategies, financing plans, competitive position, industry environment, potential growth opportunities, potential market opportunities and the effects of competition. Forward-looking statements include all statements that are not historical facts and can be identified by terms such as “anticipates,” “believes,” “could,” “seeks,” “estimates,” “expects,” “intends,” “may,” “plans,” “potential,” “predicts,” “projects,” “should,” “will,” “would" or similar expressions that convey uncertainty of future events or outcomes and the negatives of those terms. These statements include, but are not limited to, statements regarding:
|
•
|
our expectations regarding future growth, including our ability to increase sales in our existing geographic markets and to expand to new markets;
|
|
•
|
our ability to maintain and grow our reputation and the market acceptance of our products;
|
|
•
|
our ability to achieve reimbursement from third-party payors for our products;
|
|
•
|
our expectations as to our clinical research program and clinical results;
|
|
•
|
our ability to improve our products and develop new products;
|
|
•
|
our ability to maintain adequate protection of our intellectual property and to avoid violation of the intellectual property rights of others;
|
|
•
|
our ability to gain and maintain regulatory approvals; and
|
|
•
|
our ability to maintain relationships with existing customers and develop relationships with new customers.
|
The preceding list is not intended to be an exhaustive list of all of our statements. The statements are based on our beliefs, assumptions and expectations of future performance, taking into account the information currently available to us. These statements are only predictions based upon our current expectations and projections about future events. There are important factors that could cause our actual results, levels of activity, performance or achievements to differ materially from the results, levels of activity, performance or achievements expressed or implied by the statements. In particular, you should consider the risks provided under Item 1A. "Risk Factors" in this annual report.
You should not rely upon forward-looking statements as predictions of future events. Although we believe that the expectations reflected in the forward-looking statements are reasonable, we cannot guarantee that future results, levels of activity, performance and events and circumstances reflected in the forward-looking statements will be achieved or will occur.
These statements may be found in the sections of this annual report titled Item 1. "Business," Item 1A. "Risk Factors," Item 7. "Management’s Discussion and Analysis of Financial Condition and Results of Operations" and elsewhere in this annual report.
You should not put undue reliance on any forward-looking statements. Except as required by law, we undertake no obligation to update publicly any forward-looking statements for any reason after the date of this annual report, to conform these statements to actual results or to changes in our expectations.
ii
Where You Can Find Other Information
Our principal executive offices are located at 3 Hatnufa Street, Floor 6, Yokneam Ilit 2069203, Israel, and our telephone number is +972 (4) 959-0123. Our website is www.rewalk.com
.
Information contained, or that can be accessed through, our website does not constitute a part of this annual report and is not incorporated by reference herein. We have included our website address in this annual report solely for informational purposes. Information that we furnish with or file with the Securities and Exchange Commission, or the SEC, including annual reports on Form 10-K, quarterly reports on Form 10-Q, current reports on Form 8-K and any amendments to, or exhibits included in, these reports are available for download, free of charge, on our website as soon as reasonably practicable after such materials are filed or furnished with the SEC. As we were subject to the information reporting requirements applicable to foreign private issuers prior to January 1, 2016, we filed with the SEC an annual report on Form 20-F for the year ended December 31, 2014 and submitted to the SEC, on Form 6-K, unaudited quarterly financial information during the fiscal year ended December 31, 2015. These reports may also be downloaded free of charge on our website. Our SEC filings, including exhibits filed or furnished therewith, are also available on the SEC’s website at SEC.gov. You may obtain and copy any document we furnish or file with the SEC at the SEC’s public reference room at 100 F Street, NE, Room 1580, Washington, D.C. 20549. You may obtain information on the operation of the SEC’s public reference facilities by calling the SEC at 1-800-SEC-0330. You may request copies of these documents, upon payment of a duplicating fee, by writing to the SEC at its principal office at 100 F Street, NE, Room 1580, Washington, D.C. 20549.
iii
ITEM 1.
BUSINESS
Overview
We are an innovative medical device company that is designing, developing and commercializing exoskeletons that allow wheelchair-bound individuals with mobility impairments or other medical conditions the ability to stand and walk once again. We have developed and are continuing to commercialize ReWalk, an exoskeleton that uses our patented tilt-sensor technology and an on-board computer and motion sensors to drive motorized legs that power movement.
Current ReWalk designs are intended for people with paraplegia, a spinal cord injury resulting in complete or incomplete paralysis of the legs, who have the use of their upper bodies and arms. We currently offer two products: ReWalk Personal and ReWalk Rehabilitation. ReWalk Personal is designed for everyday use by individuals at home and in their communities, and is custom fitted for each user. ReWalk Rehabilitation is designed for the clinical rehabilitation environment where it provides valuable exercise and therapy. It also enables individuals to evaluate their capacity for using ReWalk Personal in the future. In 2011, we launched ReWalk Rehabilitation for use in hospitals and rehabilitation centers in the United States, Europe and Asia. We began marketing ReWalk Personal in Europe with CE mark clearance at the end of 2012 and received U.S. Food and Drug Administration, or FDA, clearance to market it in the United States in June 2014. ReWalk is the first exoskeleton cleared by the FDA for personal use. In September 2013, we received clearance to sell ReWalk in Canada and, in January 2015, we received regulatory approval to distribute ReWalk systems in Australia from the Therapeutic Goods Administration, or the TGA. In the future, we will need to obtain approval from the applicable regulatory agency of any additional jurisdiction in which we seek to market ReWalk.
ReWalk is a breakthrough product that can fundamentally change the health and life experiences of users. ReWalk is currently the only commercialized exoskeleton using a tilt sensor to restore self-initiated walking. Designed for all-day use, ReWalk is battery-powered and consists of a light, wearable exoskeleton with integrated motors at the joints, an array of sensors and a computer-based control system to power knee and hip movement. ReWalk controls movement using subtle shifts in the user’s center of gravity. A forward tilt of the upper body is sensed by the system, which initiates the first step. Repeated body shifting generates a sequence of steps which allows for natural gait with functional walking speed. Because the exoskeleton supports its own weight and facilitates the user’s natural gait, users do not expend unnecessary energy while walking. While ReWalk does not allow side-to-side actuation, users are able to turn by shifting their weight to the side. ReWalk also allows users to sit, stand and, depending on local regulatory approvals, climb and descend stairs. ReWalk users are able to independently operate the devices, and most are able to put on and remove the devices by themselves. However, our safety guidelines and FDA specifications require users to be accompanied by a trained companion.
Published clinical studies demonstrate ReWalk’s ability to deliver a natural gait and functional walking speed, which has not been shown in studies for any competing exoskeleton. In addition, our interim analysis of an ongoing clinical study and our experience working with health care practitioners and ReWalk users suggests that ReWalk has the potential to provide secondary health benefits. These benefits include reducing pain and spasticity and improving bowel and urinary tract function, body and bone composition, metabolism and physical fitness, as well as reducing hospitalizations and dependence on medications. Because of these secondary medical benefits, we believe that ReWalk has the ability to reduce the lifetime healthcare costs of individuals with spinal cord injuries, making it economically attractive for individuals and third-party payors. While we believe that ReWalk offers significant advantages over competing technologies and therapies, disadvantages include the time it takes for a user to put on ReWalk, the slower pace of ReWalk compared to a wheelchair, the weight of ReWalk when carried, which makes it more burdensome for a companion to transport than a wheelchair, and the requirement that users be accompanied by a trained companion.
Development of ReWalk took over a decade and was spurred by the experiences of our founder, Dr. Amit Goffer, who became a quadriplegic due to an accident. As of December 31, 2015, we had placed 104 units in use at rehabilitation centers and 107 in a home or community use.
Our commercialization strategy is to penetrate rehabilitation centers, hospitals and similar facilities that treat patients with spinal cord injuries to become an integral part of their rehabilitation programs and to develop a broad based training network with these facilities to prepare users for home and community use. According to the National Spinal Cord Injury Statistical Center, 87% of persons with spinal cord injuries are sent to private, non-institutional residences (in most cases, their homes) after hospital discharge. As a result, while almost half of our sales to date have been for use in a Rehabilitation setting, the primary focus of our commercialization efforts going forward will be marketing ReWalk Personal for routine use at home, work or in the community, and we expect sales of ReWalk Personal to account for the substantial majority of our revenues in the future.
We expect to generate revenues from a combination of third-party payors, self-payors and institutions. While no uniform policy of coverage and reimbursement by third-party payors currently exists for electronic exoskeleton technologies such as ReWalk, we plan to pursue various paths of reimbursement and support fundraising efforts by institutions and clinics. In December 2015, the Veterans’ Administration, or the VA, issued a national policy for the evaluation, training and procurement of ReWalk
1
Personal exoskeleton systems for all qualifying veterans across the United States. The VA policy, which is exclusive to ReWalk Robotics exoskeleton systems, is the first national coverage policy in the United States for qualifying individuals who have suffered spinal cord injury. Additionally, to date several private insurers in the United States and Europe have provided reimbursement for ReWalk in certain cases.
Overview of Spinal Anatomy and Spinal Cord Injury
Spinal Anatomy
The spine is the central core of the human skeleton and provides structural support, alignment and flexibility to the body. It consists of 24 interlocking bones, called vertebrae, which are stacked on top of one another. The spine is comprised of five regions, of which there are three primary regions: cervical, thoracic and lumbar. In addition, there is also the sacral region, or sacrum, a triangular-shaped bone and the coccyx, or “tailbone,” the bottom portion of the spine.
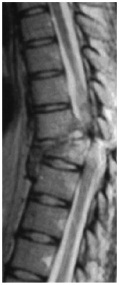
The spinal cord, housed inside the bony spinal column, is a complex bundle of nerves serving as the main pathway for information connecting the brain and nervous system. The spinal cord is divided into 31 segments that feed sensory impulses into the spinal cord, which in turn relays them to the brain. Conversely, motor impulses generated in the brain are relayed by the spinal cord to the spinal nerves, which pass the impulses to muscles and glands. The spinal cord mediates the reflex responses to some sensory impulses directly, without recourse to the brain, for example, when a person’s leg is tapped, producing the knee jerk reflex.
|
Spinal Cord Injury
|
|
|
Spinal cord injury is the result of a direct trauma to the nerves themselves or damage to the surrounding bones and soft tissues which ultimately impacts the spinal cord. Spinal cord damage results in a loss of function, such as mobility or feeling. In most people who have spinal cord injury, the spinal cord is intact. Spinal cord injury is not the same as back injury, which may result from pinched nerves or ruptured disks. Even when a person sustains a break in a vertebra or vertebrae, there may not be any spinal cord injury if the spinal cord itself is not affected. There are two types of spinal cord injury – complete and incomplete. In a complete injury, a person loses all ability to feel and voluntarily move below the level of the injury. In an incomplete injury, there is some functioning below the level of the injury.
Upon examination, a patient is assigned a level of injury depending on the location of the spinal cord injury. Cervical level injuries cause paralysis or weakness in both arms and legs and is referred to as quadriplegia. Sometimes this type of injury is accompanied by loss of physical sensation, respiratory issues, bowel, bladder, and sexual dysfunction. Thoracic level injuries can cause paralysis or weakness of the legs (paraplegia) along with loss of physical sensation, bowel, bladder, and sexual dysfunction. In most cases, arms and hands are not affected. Lumbar level injuries result in paralysis or weakness of the legs (paraplegia). Loss of physical sensation, bowel, bladder, and sexual dysfunction can occur. The shoulder, arm, and hand functions are usually unaffected. Sacral level injuries primarily cause loss of bowel and bladder function as well as sexual dysfunction.
|
|
|
Image of Separated Spinal Cord of an Adult
|
|
|
The history of exoskeleton development began in the 19
th
century, with the first patent for a mechanical suit appearing in 1890. The use of motors and gears to power these suits is not new, with General Electric developing an early exoskeleton device in the 1960s. Called the Hardiman, it was a hydraulic and electric body suit, but its weight and bulk made practical use prohibitive. Innovation of an advanced exoskeleton that restores a natural walking experience has been a key technological goal of the industry, and the lack of such a system has hindered sector growth. Advances in computer hardware and software and proprietary technological breakthroughs pioneered by us have resulted in the development of an advanced exoskeleton, ReWalk, that restores walking with a natural gait and functional speed.
|
|
2
Market Opportunity
Confinement to a wheelchair can cause severe physical and psychological deterioration, resulting in bad health, poor quality of life, low self-esteem and high medical expenses. In addition, the secondary medical consequences of paralysis can include difficulty with bowel and urinary tract function, osteoporosis, loss of lean mass, gain in fat mass, insulin resistance, diabetes and heart disease. The cost of treating these conditions is substantial. The National Spinal Cord Injury Statistical Center, or the NSCISC, estimates that complications related to paraplegia cost, excluding indirect costs such as losses in wages, fringe benefits and productivity, approximately $500,000 in the first year post-injury and significant additional amounts over the course of an individual’s lifetime. Further, secondary complications related to spinal cord injury can reduce life expectancies for spinal cord injury, or SCI, patients.
The NSCISC estimates as of 2014 that there were 276,000 people in the United States living with spinal cord injury, with an annual incidence of approximately 12,500 new cases per year. Approximately 42,000 of such patients are veterans, and are eligible for medical care and other benefits from the VA. With 24 VA spinal cord injury centers, the VA has the largest single network of spinal cord injury care in the United States.
The University of Alabama-Birmingham Department of Physical Medicine and Rehabilitation operates the NSCISC, which maintains the world’s largest database on spinal cord injury research. Between September 2005 and March 2015, motor vehicle crashes have been the leading cause of reported spinal cord injury cases (39%), followed by falls (30%), acts of violence (14%) and sports injuries (8%). Nearly 80% of spinal cord injuries occur among the male population. According to NSCISC data, upon hospital discharge, 87% of persons with spinal cord injuries are sent to private, non-institutional residence (in most cases, their homes prior to injury).
Three published ReWalk trials for SCI patients had an aggregate screening acceptance rate of 81%, when exclusions due to logistics, scheduling and weight were removed. The weight exclusion can be considered potentially short term addressable, as focus was on determining medical exclusions such as insufficient bone material density. This indicates that approximately 80% of the SCI population could be candidates for current or future ReWalk products. The young average age at time of injury and significant remaining life expectancy, the likelihood of living at home and lifetime cost of treatment highlight the need for an out-of-hospital solution with demonstrated health and social benefits.
In addition to developing the next generation of ReWalk, we are currently engaged in research and development efforts to adapt ReWalk to address the mobility needs of multiple sclerosis and stroke patients.
According to the Multiple Sclerosis Foundation, as many as 400,000 Americans suffer from multiple sclerosis. Research indicates that approximately half of these individuals would be classified as somewhere between a 4.0 and a 7.0 on the Kurtzke Disability Status Scale (DSS), a measure of the need for walking assistance. Individuals with DSS 4.0 suffer from relatively severe disability while individuals with DSS 7.0 are generally restricted to a wheelchair. Multiple sclerosis is a progressive disease, as approximately one-third of multiple sclerosis patients end up with full paralysis while two-thirds remain able to walk, though many will need an aid, such as a cane or crutches, and some will use a scooter or wheelchair due to fatigue, weakness or balance problems, or due to a need to conserve energy.
Over five million Americans have suffered a stroke, with 780,000 new incidences expected each year. Physical limitations after stroke vary from case to case, but approximately 60% of these individuals will have lower limb disability, which could require them to seek additional assistance in walking.
Our Solutions
ReWalk is a breakthrough product that can fundamentally change the quality of life for individuals with lower limb disability through the creation and development of market leading robotic technologies. Published clinical studies demonstrate ReWalk’s ability to deliver a natural gait and functional walking speed. ReWalk’s patented tilt-sensor technology and an on-board computer and motion sensors drive motorized legs that power knee and hip movement and allow self-initiated walking. ReWalk controls movement using subtle changes in the user’s center of gravity. A forward tilt of the upper body is sensed by the system, which initiates the first step. Repeated body shifting generates a sequence of steps, which allows natural ambulation with functional walking speed. While ReWalk does not allow side-to-side actuation, users are able to turn by shifting their weight to the side. ReWalk also allows users to sit, stand and, depending on local regulatory approvals, climb and descend stairs. Use on stairs is not cleared by the FDA in the United States.
Designed for all-day use and worn over the clothes of users, ReWalk consists of a light wearable exoskeleton with integrated motors at the joints, an array of sensors and a backpack or waist pack that contains the batteries and the computer-based control system. The control system utilizes proprietary algorithms to analyze upper-body motions and trigger and maintain gait patterns and other modes of operation (such as stair-climbing and shifting from sitting to standing), leaving the user’s hands free for self-support and other functions. Because the exoskeleton supports its own weight, users do not expend unnecessary energy while walking. Safety measures include crutches, which provide additional stability, fall protection, which lowers users slowly and safely in the event of a malfunction, and the secure “stand” mode, which automatically initiates if the user does not begin walking within
3
two seconds. ReWalk is also equipped with maintenance alarms, warnings and backup batteries. The rechargeable batteries are easily accessible and can be recharged in any standard power outlet. Upon completion of training, which generally consists of approximately 15 one-hour sessions, most users are able to put on and remove the device by themselves while sitting, typically in less than 15 minutes.
Current ReWalk designs are intended for people with paraplegia who have the use of their upper bodies and arms. We currently offer two ReWalk products: ReWalk Personal and ReWalk Rehabilitation. For a breakdown of our revenues from sales of each of ReWalk Personal and ReWalk Rehabilitation, see Item 7. “Management’s Discussion and Analysis of Financial Condition and Results of Operations."
|
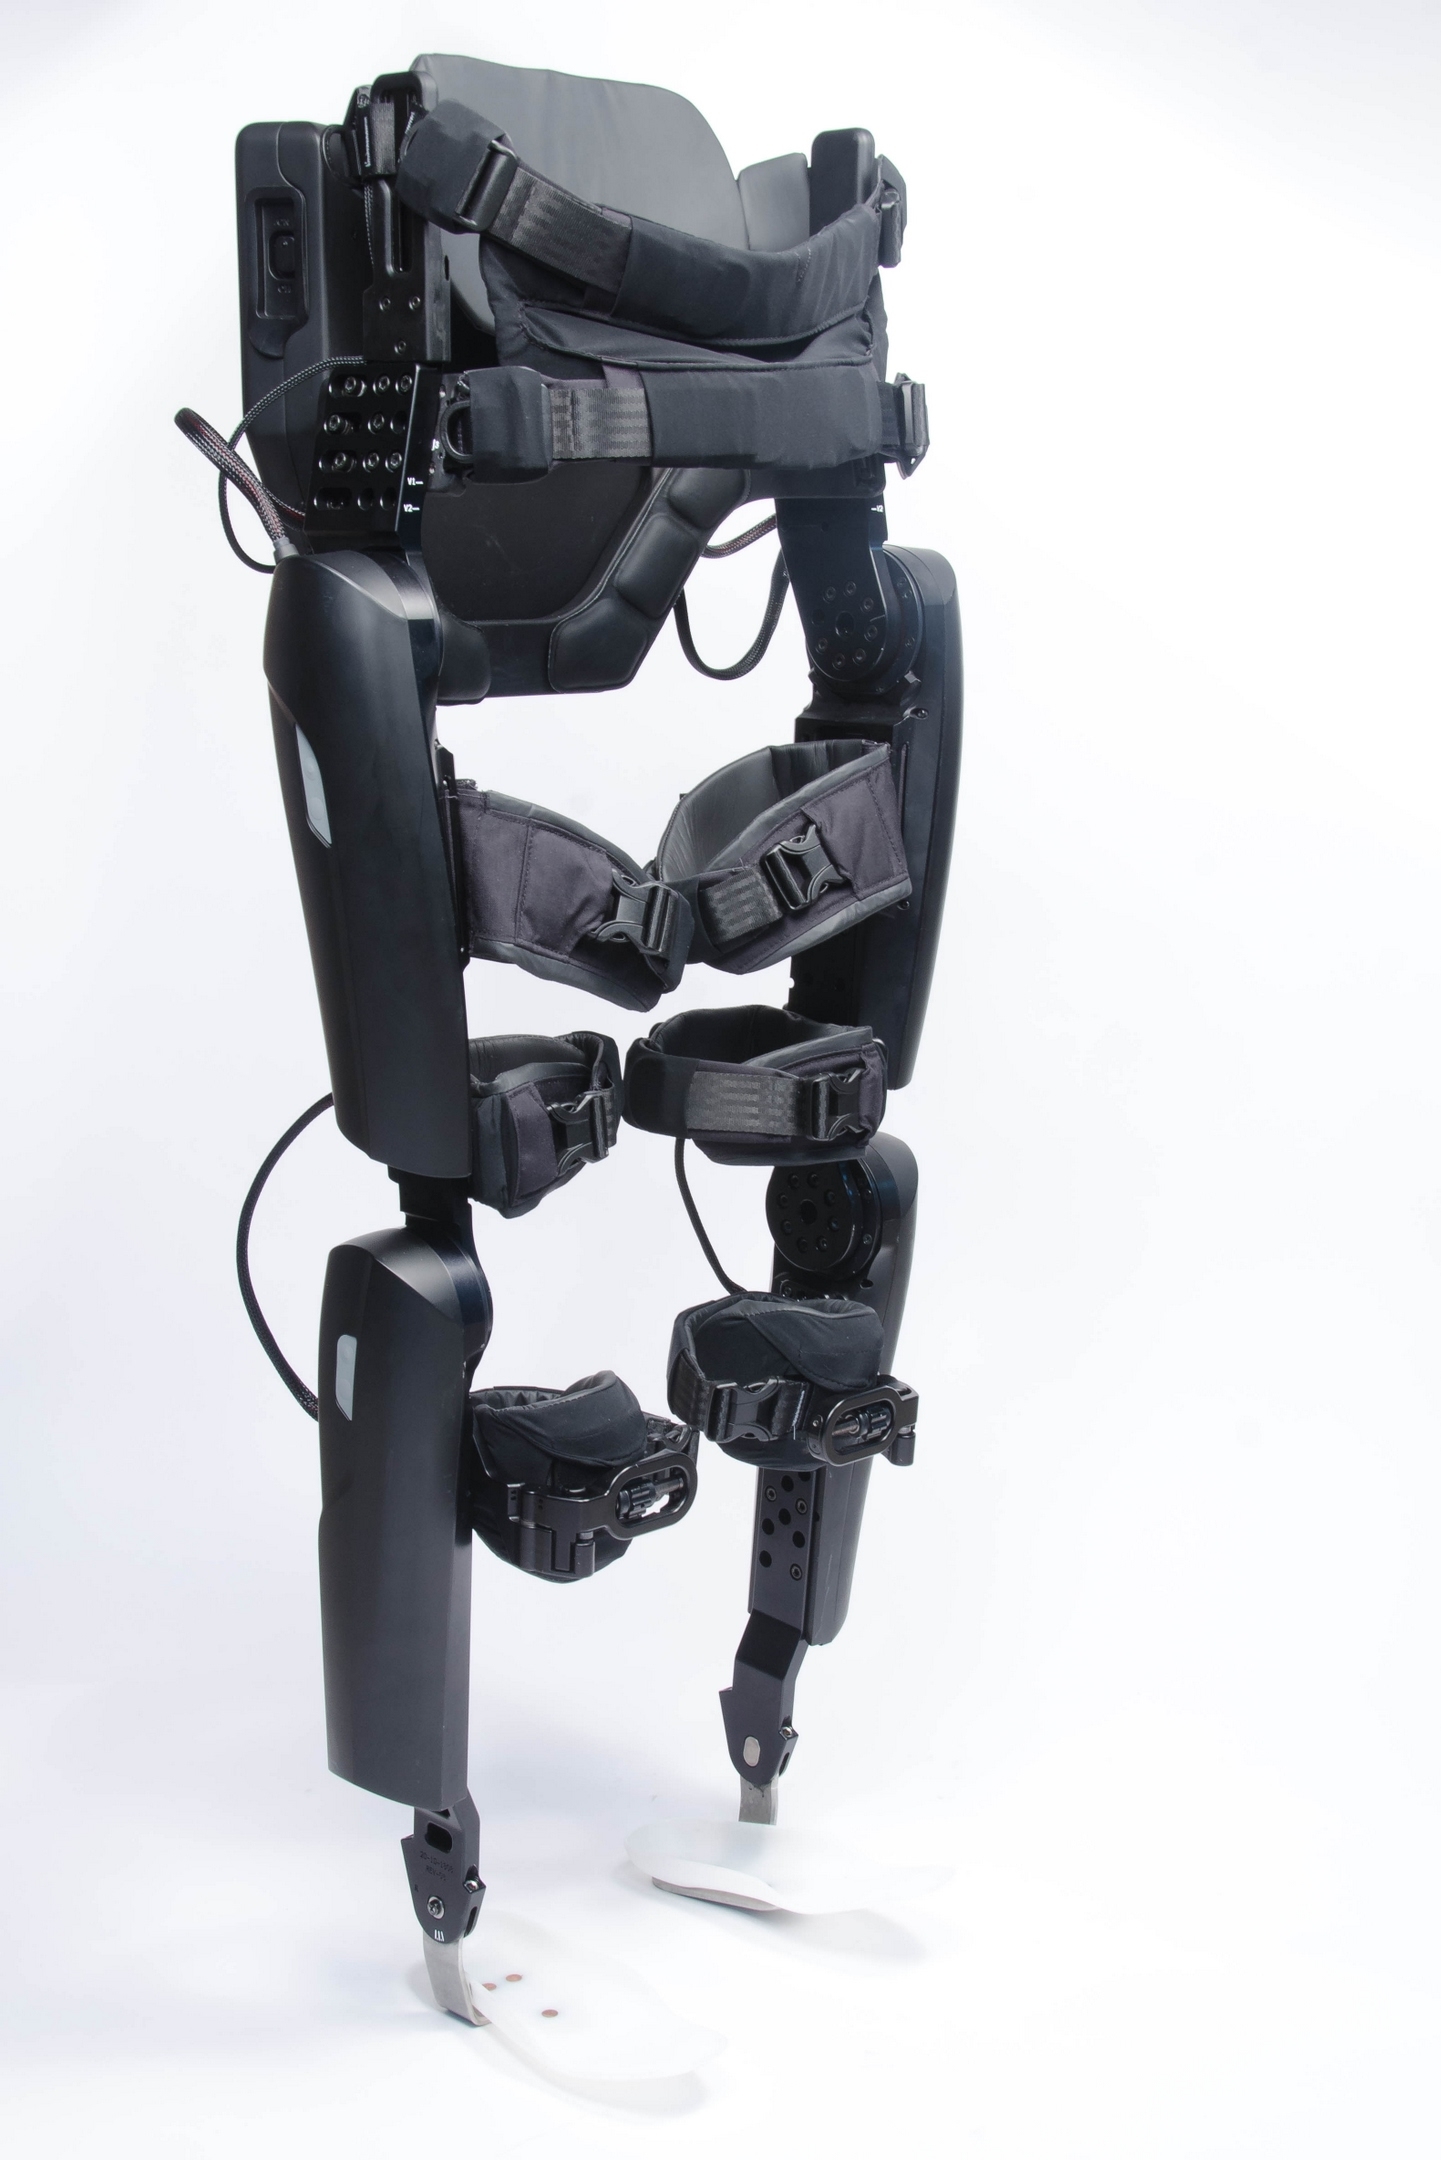
ReWalk Personal 6.0
|
||
|
•
ReWalk Personal
: intended for everyday use at home, at work or in the community. We began marketing ReWalk Personal in Europe with CE mark clearance at the end of 2012. We received clearance to market ReWalk Personal in the United States in June 2014. ReWalk Personal units are all manufactured according to the same specifications. Each unit is then permanently sized to fit the individual user and the software is configured for the user’s specifications by the rehabilitation center, clinic or distributor.
•
ReWalk Rehabilitation
: designed for the clinical rehabilitation environment, ReWalk Rehabilitation has adjustable sizing enabling multiple patient use. ReWalk Rehabilitation provides a valuable means of exercise and therapy. It also enables individuals to evaluate their capacity for using ReWalk Personal in the future. We began marketing ReWalk Rehabilitation for use in hospitals, rehabilitation centers and stand-alone training centers in the United States, Europe and Asia in 2011. ReWalk Rehabilitation units are all manufactured according to the same specifications and are equipped with adjustable sizing for multi-patient use.
|
|
|
Our interim analysis of an ongoing clinical study and our experience working with health care practitioners and ReWalk users suggest that ReWalk has the potential to provide secondary health benefits. These benefits include reducing pain and spasticity and improving bowel and urinary tract function, body and bone composition, metabolism and physical fitness, as well as reducing hospitalizations and dependence on medications. Because of these secondary medical benefits, we believe that ReWalk has the ability to reduce the lifetime healthcare costs of individuals with spinal cord injuries, making it economically attractive for individuals, healthcare providers such as hospitals and rehabilitation centers, and third-party payors.
We intend to continue to develop future generations of ReWalk, with a range of improvements including additional functionality, more efficient drive mechanism, slimmer profile and lighter body, as well as other improvements. We plan to expand the designs and indications that we address beyond paraplegia to include other disabilities affecting gait and ability to walk, such as multiple sclerosis, stroke and cerebral palsy.
4
Third-Party Reimbursements
United States
In the United States, purchasers of ReWalk Rehabilitation have received reimbursement in certain cases. Private rehabilitation centers generally purchase ReWalk Rehabilitation out-of-pocket and then charge patients for ReWalk therapy on a per-session basis. Patients can then seek reimbursement from their insurance companies. Academic facilities such as teaching hospitals generally purchase ReWalk Rehabilitation out-of-pocket and provide patients the opportunity to use the ReWalk without charging for each session. These institutions may then seek reimbursement from insurance companies and may be willing to accept lower reimbursement rates than private facilities due to fewer pricing pressures.
In December 2015, the VA issued a national policy for the evaluation, training and procurement of ReWalk Personal exoskeleton systems for all qualifying veterans across the United States. The VA policy, which is exclusive to ReWalk Robotics exoskeleton systems, is the first national coverage policy in the United States for qualifying individuals who have suffered spinal cord injury.
While in some cases insurance companies have provided reimbursement for ReWalk Rehabilitation upon request, certain insurance companies view ReWalk as an experimental therapy and therefore will not provide coverage at this time. Medicaid and Medicare have provided reimbursement for ReWalk Rehabilitation sessions, although this coverage may have limits in terms of number or frequency of sessions. Worker’s Compensation has also provided reimbursement.
Private insurance companies do not currently cover or provide reimbursement for any personal medical exoskeleton products, including ReWalk Personal, and are limited to case-by-case decisions.
As part of our plan for growth, we intend to work with ReWalk users, health care practitioners, researchers, and the spinal cord injury community to support efforts to demonstrate to insurance companies the health benefits and the economic case for reimbursement of ReWalk Personal. Initially, coverage from private payers will be made on a case-by-case basis. Once a sufficient number of these cases have been approved, applications for local coverage decisions from the private payers will be made. We currently sponsor clinical studies and academic publications that demonstrate the medical benefits of ReWalk. In the future, we will pursue economic benefit clinical studies for the Centers for Medicare/Medicaid Services, or CMS, which would demonstrate the secondary medical benefits and long-term cost savings potential of ReWalk. We believe that a positive response from CMS in respect of such studies will broaden coverage by private insurers. We expect that it could take three to five years to receive a decision from CMS, but we believe that other sources of payment will be sufficient to support our business.
Western Europe
Reimbursement for ReWalk in Europe varies by country. While we are not aware of any public or private payor that regularly covers ReWalk for rehabilitation or personal use, third-party payors have provided reimbursement for our products in certain cases in Germany, France and Italy.
We are initially focusing our efforts in Europe in Germany, which has a single-payer system and where we believe we have made significant progress toward achieving ReWalk coverage from the government. Because ReWalk is not currently covered in Germany, a patient who wishes to use ReWalk must apply for coverage and receive an official denial. He or she must then appeal the decision in court, relying on supporting documentation from a health care provider and other medical evidence. There are approximately 61 such cases pending in Germany, and we believe that these will result in eventual coverage. We plan to continue to pursue this case-by-case strategy and expect that once the precedent for coverage is established, seeking coverage will become easier and more routine. We continue to support clinical research and academic publications, which we believe will further support the case for coverage.
We are also pursuing reimbursement by private insurers and worker’s compensation in various European countries.
Other Funding Sources
In addition to being funded by third-party payors, including private insurance plans, government programs such as the VA, and Worker's Compensation, ReWalk is also funded by self-payers. Self-payers also include individuals who purchase ReWalk with funds from legal settlements with insurance companies or third parties.
5
Research and Development
We are committed to investing in a robust research and development program to enhance our current ReWalk products and to develop our pipeline of new and complementary products, and we believe that ongoing research and development efforts are essential to our success. Our research and development team includes engineers, machinists, researchers, marketing, quality, manufacturing, regulatory and clinical personnel, who work closely together to design, enhance and validate our technologies. This research and development team conceptualizes technologies and then builds and tests prototypes before refining and/or redesigning as necessary. Our regulatory and clinical personnel work in parallel with engineers and researchers, allowing us to anticipate and resolve potential issues at early stages in the development cycle.
We plan to increase our investment in research and development in the future by continually improving our functional technological platform, developing our next generation of ReWalk with design improvements and building upon our technological platform to address new medical indications that affect the ability to walk such as quadriplegia, multiple sclerosis, stroke and cerebral palsy.
We conduct our research and development efforts at our facility in Yokneam, Israel. We believe that the close interaction among our research and development, marketing and manufacturing groups allows for timely and effective realization of our new product concepts.
Our research and development efforts have been financed, in part, through funding from the Office of the Chief Scientist in the Israel Ministry of Economy, or the OCS, and from the BIRD Foundation. From our inception through December 31, 2015, we received funding totaling $740,000 from the OCS and $500,000 from the BIRD Foundation. Our research and development expenses, net were approximately $5.9 million, $8.6 million and $2.5 million for the fiscal years ended December 31, 2015, December 31, 2014 and December 31, 2013, respectively. For more information regarding our research and development financing arrangements and expenses, see Item 7. “Management’s Discussion and Analysis of Financial Condition and Results of Operations - Components of Our Statements of Operations - Operating Expenses," "—Liquidity and Capital Resources” and “—Grants and Other Funding.”
In September 2013, we entered into a strategic alliance with Yaskawa Electric Corporation, pursuant to which, among other arrangements, Yaskawa can apply its expertise in product and quality improvements to ReWalk. Yaskawa is a global leader in the fields of industrial robotics and automation, and we believe that this relationship provides us with opportunities for product improvement and increased product offerings in the future. For more information regarding our relationship with Yaskawa, see “—Sales and Marketing” and Item 13. “Certain Relationships and Related Transactions, and Director Independence.”
Clinical Studies
There have been multiple clinical studies to establish the effectiveness and benefits of ReWalk for individuals with spinal cord injuries that have resulted in publications in peer-reviewed journals, as follows:
|
•
|
The first study, published in
The Journal of Spinal Cord Medicine
in 2012, included six participants and was designed to assess the safety and tolerance of use of ReWalk by patients with a spinal cord injury. The participants were all able to walk 100 meters with ReWalk. The study found no adverse safety events (which included falls, status of the skin, status of the spine and joints, blood pressure, pulse and electrocardiography) and concluded that use of ReWalk was well-tolerated by participants with no increase in pain and a moderate level of fatigue after use. The participants generally had positive feedback regarding ReWalk. No adverse effects were noted.
|
|
•
|
The second study included 24 participants and was designed to assess the safety and performance of ReWalk in enabling individuals with paraplegia to carry out routine ambulatory functions. Results with respect to a 12-participant subset were published in the
American Journal of Physical Medicine & Rehabilitation
in 2012. The results from this subset demonstrated that all participants were able to independently walk, without assistance from another person, for at least 50 meters and at least five minutes. Some participants reported improvements in pain, bowel function, bladder function and spasticity. All participants had strong positive feedback regarding the emotional and psychosocial benefits of using ReWalk. ReWalk was found to hold significant potential as a safe ambulatory powered orthotic for spinal cord injury patients. Significant performance variability was noted between participants. There were no serious adverse events reported. Five participants reported mild to moderate adverse effects, consisting of skin abrasions, lightheadedness and edema of the lower limbs. These adverse effects were managed by the appropriate use of padding, caffeine intake and adjustment of blood pressure medication, elastic stockings and rest.
|
|
•
|
The third study, published in
The Journal of Spinal Cord Medicine
in 2013, included six participants and found that participants with spinal cord injury, walking independently with ReWalk, demonstrated a stance and gait similar to that of an able-bodied individual. No adverse effects were noted.
|
|
•
|
The fourth study, which is ongoing and includes 30 participants, was designed to assess the mobility skills and levels of training and assistance needed to use and benefit from ReWalk. Results with respect to a seven-participant subset
|
6
have been finalized and were presented at the
STO Human Factors and Medicine Panel Symposium
, Milan, Italy, in 2013. The results from this subset demonstrated that over the course of the training, all of the participants learned to move from sitting to standing and standing to sitting and to walk 50 to 166 meters in six minutes. Some assistance was needed for participants with the most limiting spinal cord injuries. Four of the participants were able to climb and descend stairs. The study concluded that ReWalk assisted walking can be performed independently by individuals with certain cases of spinal cord injury and that future technological advances and ongoing training could improve mobility and independence. Certain participants reported adverse effects in the form of mild to moderate skin abrasions, which were resolved with equipment adjustments, additional padding, and, in certain cases, allowing the skin to heal.
|
•
|
The fifth study, published in International Journal of Physical Therapy and Rehabilitation in November 2014 reported on 16 patients who had undergone gait training using the ReWalk Rehabilitation device. These subjects demonstrated significant increases in joint range of motions for the hip and ankle joints. No adverse results were reported.
|
|
•
|
A sixth study, which was a continuation of the fourth study mentioned above, was presented at a scientific session of the 2015 American Academy of Physical Medicine and Rehabilitation. This study demonstrated improvements in quality of life measurements for pain reduction, fatigue, and improved sleep. Restoration of physiological loading to the legs. Improvements in bowel function, seated balance and reduction in fat mass were also documented.
|
|
•
|
A seventh study published in the Journal of Rehabilitation Research and Development in 2015 assessed heart rate and oxygen demand of powered exoskeleton-assisted walking in person with paraplegia. As part of an ongoing clinical study, eight non-ambulatory persons with paraplegia were trained to ambulate with a powered exoskeleton. Measurements of oxygen uptake and heart rate were recorded for six minutes each during each maneuver while sitting, standing, and walking. The average value of oxygen uptake and heart rate response during walking were significantly higher than for sitting and standing. Persons with paraplegia were able to ambulate efficiently using the powered exoskeleton for over-ground ambulation, providing the potential for functional gain and improved fitness. This report is the first to determine energy expenditure of powered exoskeletal-assisted walking by use of the ReWalk system in persons with SCI. Although the results of this study did not address long-term changes in oxygen demand with habitual use, routine use of the device to increase activity energy expenditure would be expected to have positive cardiopulmonary and metabolic benefits.
|
|
•
|
An eighth study published in Topics in Spinal Cord Injury Rehabilitation in April 2015 assessed in-hospital walking velocity and level of assistance in a powered exoskeleton for persons with SCI. Twelve individuals that had SCI for 1.5 years or more who were wheelchair-users participated, and seven were able to ambulate greater than 0.4 meters per second, which is a velocity that may be conductive to outdoor activity related community ambulation. The maximum velocity recorded was 0.74 meters per second.
|
|
•
|
A ninth publication is a case report on the effects of training with the ReWalk exoskeleton on quality of life in incomplete spinal cord injury. The study was carried out at a hospital for neurological rehabilitation in Germany. One patient, initially unable to walk independently after suffering a traumatic spinal cord injury, was recruited for this study one year after suffering such injury. The progress of the first six months of training was documented and as a primary outcome measure the quality of life was measured using the industry-standard SF-36 questionnaire. At the end of the six-month study period the patient was able to walk independently supervised by one person. Quality of life, mobility, risk of falling, motor skills and control of bladder and bowel functions were improved. A positive effect of robot-assisted gait training on various areas of quality of life was shown.
|
Although study participants and other ReWalk users have reported secondary physical and mental health benefits such as reduced pain and spasticity and improved bowel function and urinary tract function, fewer hospitalizations, reduced dependence on medications and improvements in mood, currently there is no formal clinical data establishing any secondary health benefits of ReWalk.
Community Engagement and Education
We devote significant resources to engagement with and education of the spinal cord injury community with respect to the benefits of ReWalk. We actively seek opportunities to partner with hospitals, rehabilitation centers and key opinion leaders to engage in research and development and clinical activities. We also seek to support educational and charitable organizations with fundraising and outreach programs. We believe that our success has been, and will continue to be driven in part by, our reputation and acceptance within the spinal cord injury community.
Sales and Marketing
We market and sell our products directly to third party payors, institutions, including rehabilitation centers, individuals and through third-party distributors. We sell our products directly in Germany and the United States and primarily through
7
distributors in our other markets. In our direct markets, we have established relationships with rehabilitation centers and the spinal cord injury community, and in our indirect markets, our distributors maintain these relationships. Sales of ReWalk Personal are generated primarily from the patient base at our rehabilitation centers, referrals through the spinal cord injury community and direct inquiries from potential users. One customer accounted for 14.8% and 15.0% of our total revenues for the years ended December 31, 2015 and 2014, respectively.
We have established centers of operations in Marlborough, Massachusetts, Berlin, Germany and Yokneam, Israel, to manage sales in North America, Europe, and the rest of world, respectively.
Services and Customer Support
Our centers of operations in Marlborough, Massachusetts and Berlin, Germany coordinate all customer support and product service functions for North America and Europe, respectively, through dedicated technical service personnel who provide product services and customer support through training to healthcare providers and support to product users.
Competition
The market in which we operate is characterized by active competition and rapid technological change, and we expect competition to increase. Competition arises from providers of other mobility systems and prosthetic devices.
We are aware of a number of other companies developing competing technology and devices, and some of these competitors may have greater resources, greater name recognition, broader product lines, or larger customer bases than we do. Our principal competitors in the medical exoskeleton market consist of Ekso Bionics (OTC: EKSO), Rex Bionics (London Stock Exchange: RXB), Cyberdyne (Tokyo Stock Exchange: 7779), and Parker Hannifin (NYSE: PH). We believe we have key competitive advantages over these companies, such as our tilt-sensor technology that provides a self-initiated walking experience, more natural gait and faster functional walking speed, ReWalk’s ability to support its own weight and broad user specifications. Additionally, we are not aware of any medical exoskeleton product that is cleared by the FDA for personal use. ReWalk Personal is the first and only medical exoskeleton cleared by the FDA for personal use in the United States.
In addition, we compete with alternative devices and alternative therapies, including treadmill-based gait therapies, such as those offered by Hocoma, AlterG, Aretech and Reha Technology. Other medical device or robotics companies, academic and research institutions, or others may develop new technologies or therapies that provide a superior walking experience, are more effective in treating the secondary medical conditions that we target or are less expensive than our current or future products. Our technologies and products could be rendered obsolete by such developments.
We may also compete with other treatments and technologies that address the secondary medical conditions that ReWalk seeks to mitigate.
8
Intellectual Property
Protection of our intellectual property is important to our business. We seek to protect our intellectual property through a combination of patents, trademarks, confidentiality and assignment agreements with our employees and certain of our contractors and confidentiality agreements with certain of our consultants, scientific advisors and other vendors and contractors. In addition, we rely on trade secrets law to protect our proprietary software and product candidates/products in development.
As of February 1, 2016, we have four issued patents in the United States and one issued patent in Europe, as well as eight pending patent applications in various countries around the world for our technology. As such, we have apparatus patent claims in the United States and Europe covering aspects of ReWalk and similar devices which use a plurality of sensors to empower tilt-sensor technology. In addition, in the United States, we have method patent claims covering certain methods of user activation and control of systems such as ReWalk, including by sensing the user's torso lean or weight shifts. While our apparatus claims focus on protecting ReWalk in terms of its physical and structural characteristics, we believe that our method claims, which protect the process behind how ReWalk is controlled by the user, provide additional protection for our tilt sensor technology. We do not currently license any of the technology contained in our products other than with respect to technology that is generally publicly available, but we may do so in the future.
Patents filed both in the United States and Europe generally have a life of 20 years from the filing date. As the oldest of our issued patents relating to our tilt-sensor technology was filed in May 2001, our patents on that technology do not begin to expire until May 2021.
We currently hold a registered trademark in Israel for the mark “ReWalk” and are in the process of registering this trademark in the United States.
The employment agreement of our founder and former President and Chief Technology Officer, Dr. Amit Goffer, provides that a patent pending relating to a standing wheelchair is his individual property and that he may independently engage in the development of a standing wheelchair. The agreement also provides that we and any of our affiliates or successors have the royalty-free right to the exclusive use in the field of exoskeletons of any intellectual property developed by Dr. Goffer, alone or jointly with others (whether or not as part of the development of a standing wheelchair and whether or not developed through a company), while he is our employee, consultant or board member and for three years thereafter. Mr. Goffer ceased serving as our President and Chief Technology Officer on November 18, 2015, and as a member of our board of directors on December 3, 2015. See Item 13. “Certain Relationships and Related Transactions, and Director Independence.”
We cannot be sure that our intellectual property will provide us with a competitive advantage or that we will not infringe on the intellectual property rights of others. In addition, we cannot be sure that any patents will be granted in a timely manner or at all with respect to any of our patent pending applications. For a more comprehensive discussion of the risks related to our intellectual property, see Item 1A. “Risk Factors—Risks Related to Our Intellectual Property.”
Government Regulation
U.S. Regulation
Our medical products and manufacturing operations are subject to regulation by the FDA and other federal and state agencies. Our products are regulated as medical devices in the United States under the Federal Food, Drug, and Cosmetic Act, or the FFDCA, as implemented and enforced by the FDA. The FDA regulates the development, testing, manufacturing, labeling, storage, installation, servicing, advertising, promotion, marketing, distribution, import, export, and market surveillance of our medical devices.
Premarket Regulation
Unless an exemption applies, each medical device commercially distributed in the United States requires either a substantial equivalence determination under a 510(k) premarket notification submission, or an approval of a premarket approval application (PMA). Under the FFDCA, medical devices are classified into one of three classes—Class I, Class II or Class III—depending on the degree of risk associated with each medical device and the extent of control needed to provide reasonable assurance of safety and effectiveness. Classification of a device is important because the class to which a device is assigned determines, among other things, the necessity and type of FDA review required prior to marketing the device. Class I devices are those for which reasonable assurance of safety and effectiveness can be assured by adherence to general controls that include compliance with the applicable portions of the FDA’s Quality System Regulation, or QSR, facility registration and product listing, reporting of adverse medical events, and appropriate, truthful and non-misleading labeling, advertising, and promotional materials. Class I also includes devices for which there is insufficient information to determine that general controls are sufficient to provide reasonable assurance of the safety and effectiveness of the device or to establish special controls to provide such assurance, but that are not life-supporting or life-sustaining or for a use which is of substantial importance in preventing impairment of human health, and that do not present a potential unreasonable risk of illness of injury.
9
Class II devices are those for which general controls alone are insufficient to provide reasonable assurance of safety and effectiveness and there is sufficient information to establish “special controls.” These special controls can include performance standards, postmarket surveillance, patient registries and FDA guidance documents. While most Class I devices are exempt from the 510(k) premarket notification requirement, only about 60 types of Class II devices are exempt from premarket notification. As a result, manufacturers of most Class II devices are required to submit to the FDA premarket notifications under Section 510(k) of the FFDCA requesting classification of their devices in order to market or commercially distribute those devices. To obtain a 510(k), a substantial equivalence determination for their devices, manufacturers must submit to the FDA premarket notifications demonstrating that the proposed device is “substantially equivalent” to a predicate device already on the market. A predicate device is a legally marketed device that is not subject to premarket approval,
i.e.
, a device that was legally marketed prior to May 28, 1976 (pre-amendments device) and for which a PMA is not required, a device that has been reclassified from Class III to Class II or I, or a device that was found substantially equivalent through the 510(k) process. If the FDA agrees that the device is substantially equivalent to a predicate device currently on the market, it will grant 510(k) clearance to commercially market the device. If the device is not “substantially equivalent” to a previously cleared device, the device is automatically a Class III device. The device sponsor must then fulfill more rigorous premarket approval requirements, or can request a risk-based classification determination for the device in accordance with the “de novo” process, which is a route to market for medical devices that are low to moderate risk, but are not substantially equivalent to a predicate device.
Devices that are intended to be life sustaining or life supporting, devices that are implantable, devices that present a potential unreasonable risk of harm or are of substantial importance in preventing impairment of health, and devices that are not substantially equivalent to a predicate device are placed in Class III and generally require approval of a PMA, unless the device is a pre-amendment device not yet subject to a regulation requiring premarket approval. The PMA process is more demanding than the 510(k) premarket notification process. In a PMA, the manufacturer must demonstrate that the device is safe and effective, and the PMA must be supported by extensive data, including data from preclinical studies and clinical trials. The PMA must also contain a full description of the device and its components, a full description of the methods, facilities and controls used for manufacturing, and proposed labeling. Following receipt of a PMA, the FDA determines whether the application is sufficiently complete to permit a substantive review. If the FDA accepts the application for review, it has 180 days under the FFDCA to complete its review of a PMA, although in practice, the FDA’s review often takes significantly longer, and can take up to several years.
Clinical trials are almost always required to support PMAs and are sometimes required to support 510(k) submissions. All clinical investigations of devices to determine safety and effectiveness must be conducted in accordance with the FDA’s investigational device exemption, or IDE, regulations that govern investigational device labeling, prohibit promotion of the investigational device, and specify recordkeeping, reporting and monitoring responsibilities of study sponsors and study investigators. If the device presents a “significant risk,” as defined by the FDA, the agency requires the device sponsor to submit an IDE application to the FDA, which must become effective prior to commencing human clinical trials. The IDE will automatically become effective 30 days after receipt by the FDA, unless the FDA denies the application or notifies the company that the investigation is on hold and may not begin. If the FDA determines that there are deficiencies or other concerns with an IDE that requires modification, the FDA may permit a clinical trial to proceed under a conditional approval. In addition, the study must be approved by, and conducted under the oversight of, an Institutional Review Board, or IRB, for each clinical site. If the device presents a non-significant risk to the patient, a sponsor may begin the clinical trial after obtaining approval for the trial by one or more IRBs without separate approval from the FDA, but must still comply with abbreviated IDE requirements, such as monitoring the investigation, ensuring that the investigators obtain informed consent, and labeling and record-keeping requirements.
In June 2014, the FDA granted our petition for “
de novo
” classification, which provides a route to market for medical devices that are low to moderate risk, but are not substantially equivalent to a predicate device, and classified ReWalk as Class II subject to special controls. The ReWalk is intended to enable individuals with spinal cord injuries to perform ambulatory functions under supervision of a specially trained companion, and inside rehabilitation institutions. The special controls established in the
de novo
order include compliance with medical device consensus standards; clinical study demonstrating testing to safe and effective use considering the level of supervision necessary and the use environment; non-clinical performance testing of the system’s function durability and performance to demonstrate that the device performs as intended under anticipated conditions of use; a training program; and labeling related to device use and user training. The special controls of this
de novo
order also apply to competing products seeking FDA clearance.
10
Postmarket Regulation
After a device is cleared for marketing, and prior to marketing, numerous regulatory requirements apply. These include:
|
•
|
establishment registration and device listing;
|
|
•
|
development of a quality assurance system, including establishing and implementing procedures to design and manufacture devices;
|
|
•
|
labeling regulations that prohibit the promotion of products for unapproved or “off-label” uses and impose other restrictions on labeling; and
|
|
•
|
medical device reporting regulations that require manufacturers to report to the FDA if a device may have caused or contributed to a death or serious injury or malfunctioned in a way that would likely cause or contribute to a death or serious injury if it were to recur; and corrections and removal reporting regulations that require manufacturers report to the FDA field corrections and product recalls or removals if undertaken to reduce a risk to health posed by the device or to remedy a violation of the U.S. Food, Drug and Cosmetic Act that may present a risk to health.
|
Our manufacturing processes are required to comply with the applicable portions of the Quality System Regulation that covers the methods and the facilities and controls for the design, manufacture, testing, production, processes, controls, quality assurance, labeling, packaging, distribution, installation and servicing of finished devices intended for human use. We actively maintain compliance with the FDA’s Quality System Regulation, 21 CFR Part 820, and the European Union’s Quality Management Systems requirements, ISO 13485:2003.
As a manufacturer, we are subject to periodic scheduled or unscheduled inspections by the FDA. If the FDA believes we or any of our contract manufacturers are not in compliance with the quality system requirements, or other postmarket requirements, it has significant enforcement authority. Specifically, if the FDA determines that we failed to comply with applicable regulatory requirements, it can take a variety of compliance or enforcement actions, which may result in any of the following sanctions:
|
•
|
warning letters, untitled letters, fines, injunctions, consent decrees and civil penalties;
|
|
•
|
recalls, withdrawals, or administrative detention or seizure of our products;
|
|
•
|
operating restrictions or partial suspension or total shutdown of production;
|
|
•
|
refusing or delaying requests for 510(k) marketing clearance or PMA approvals of new products or modified products;
|
|
•
|
refusal to grant export approvals for our products; or
|
|
•
|
criminal prosecution.
|
Any such action by the FDA would have a material adverse effect on our business. In addition, these regulatory controls, as well as any changes in FDA policies, can affect the time and cost associated with the development, introduction and continued availability of new products. Where possible, we anticipate these factors in our product development processes.
Foreign Regulation
In addition to regulations in the United States, we are subject to a variety of foreign regulations governing clinical trials and commercial sales and distribution of our products. In particular, we are subject to regulation in the E.U., which has directives and standards regulating the design, manufacture, clinical trials, labeling and adverse event reporting for medical devices. Devices that comply with the requirements of a relevant directive are entitled to bear the CE conformity marking, indicating that the device conforms to the essential requirements of the applicable directive and, accordingly, can be commercially distributed throughout Europe. The method of assessing conformity varies depending on the class of the product, but normally involves a combination of self-assessment by the manufacturer and a third party assessment by a “Notified Body.” This third party assessment may consist of an audit of the manufacturer’s quality system or specific testing of the manufacturer’s product. We comply with the E.U. requirements and have received the CE mark for all of our ReWalk systems distributed in the E.U.
In Australia, the TGA is responsible for administering the Australian Therapeutics Goods Act. The Office of Devices, Blood and Tissues is the department within the TGA responsible for devices. The TGA recognizes five classes of medical devices and ReWalk falls under the category of Class II for low-medium risk medical devices.
The Australian Register of Therapeutic Goods, or ARTG, is the register of information about therapeutic goods for human use that may be imported, supplied in, or exported from Australia. Medical devices cannot generally be imported, supplied in, or exported from Australia unless they are included in the ARTG. To clinically investigate a product that is not included in the ARTG, or to use a registered or listed product in a clinical trial beyond the conditions of its marketing approval, the sponsor must receive approval of an application from the TGA under the Clinical Trial Exemption Scheme, or must submit a notification to the Human
11
Research Ethics Committee under the Clinical Trial Notification Scheme and receive approval from the
institution or organization at which the trial will be conducted.
In January 2015, we received regulatory approval to sell ReWalk systems commercially in Australia from the TGA, and as such, are subject to regulation in Australia.
We are also subject to regulation in certain Asian markets in connection with our distribution agreement with Yaskawa. Pursuant to such agreement, Yaskawa has the rights to distribute ReWalk in Japan, China, Taiwan, Korea, Singapore and Thailand. The Japanese Ministry of Health, Labour and Welfare, or the MHLW, approved ReWalk in February 2014 as a welfare device due to its ability to restore mobility to users. Yaskawa has begun evaluating ReWalk at several hospitals and, with such approval of MHLW, Yaskawa may begin selling ReWalk in Japan. In each other country listed above, we will need to obtain approval from the relevant governmental agency prior to marketing ReWalk. We have begun to evaluate the approval process in China, Taiwan, Korea and Singapore but have not yet begun to do so in Thailand. Taiwan recently issued a class 1 registration for the rehabilitation device and we expect clearance for the personal device later this year.
We expect that obtaining the necessary approvals in these countries could take between one and a half and two years after we submit the initial application.
Foreign sales outside of the E.U., Australia and the Asian markets described above are subject to the foreign government regulations of the relevant jurisdiction, and we must obtain approval by the appropriate regulatory authorities before we can commence clinical trials or marketing activities in those countries. The approval process varies from country to country, and the time may be longer or shorter than that required to obtain a marketing authorization in the U.S., the E.U., Australia or the Asian markets described above. The requirements governing the conduct of clinical trials, product licensing, pricing and reimbursement vary greatly from country to country.
The policies of the FDA and foreign regulatory authorities may change and additional government regulations may be enacted that could prevent or delay regulatory approval of our products and could also increase the cost of regulatory compliance. We cannot predict the likelihood, nature or extent of adverse governmental regulation that might arise from future legislative or administrative action, either in the United States or abroad.
U.S. Anti-kickback, False Claims and Other Healthcare Fraud and Abuse Laws
In the United States, there are federal and state anti-kickback laws that prohibit the payment or receipt of kickbacks, bribes or other remuneration intended to induce the purchase or recommendation of healthcare products and services. Violations of these laws can lead to civil and criminal penalties, including exclusion from participation in federal healthcare programs. These laws apply to manufacturers of products, such as us, with respect to our financial relationship with hospitals, physicians and other potential purchasers or acquirers of our products. The U.S. government has published regulations that identify “safe harbors” or exemptions for certain practices from enforcement actions under the federal anti-kickback statute, and we will seek to comply with the safe harbors where possible. To qualify for a safe harbor, the activity must fit squarely within the safe harbor. Arrangements that do not meet a safe harbor are not necessarily illegal, but must be evaluated on a case by case basis. Other provisions of state and federal law provide civil and criminal penalties for presenting, or causing to be presented, to third-party payers for reimbursement claims that are false or fraudulent, or for items or services that were not provided as claimed. False claims allegations under federal and some state laws may be brought on behalf of the government by private persons, “whistleblowers,” who then receive a share of any recovery.
In March 2010, President Obama signed into law the Patient Protection and Affordable Care Act, as amended by the Health Care and Education Affordability Reconciliation Act, or collectively, the PPACA. The PPACA, among other things, amends the intent requirement of the federal anti-kickback and criminal healthcare fraud statutes. A person or entity no longer needs to have actual knowledge of these statutes or specific intent to violate them. In addition, the PPACA provides that the government may assert that a claim that includes items or services resulting from a violation of the federal anti-kickback statute constitutes a false or fraudulent claim for purposes of the False Claims Act. The PPACA also imposes new reporting and disclosure requirements on device manufacturers for any “transfer of value” made or distributed to physicians and teaching hospitals. Device manufacturers will also be required to report and disclose any investment interests held by physicians and their immediate family members during the preceding calendar year. A number of provisions of PPACA also reflect increased focus on and funding of healthcare fraud enforcement.
Environmental Matters
We are subject to various environmental, health and safety laws and regulations, including those governing air emissions, water and wastewater discharges, noise emissions, the use, transport, management and disposal of chemicals and hazardous materials, the import, export and registration of chemicals, and the cleanup of contaminated sites. Based on information currently available to us, we do not expect environmental costs and contingencies to have a material adverse effect on us. The operation of our business and facilities, however, entails risks in these areas. Significant expenditures could be required in the future to comply with environmental or health and safety laws, regulations or requirements.
12
In Israel, where our contract manufacturer produces all of our products, businesses storing or using certain hazardous materials (including materials necessary for our manufacturing process) are required, pursuant to the Israeli Dangerous Substances Law 5753-1993, to obtain a toxin permit from the Ministry of Environmental Protection.
In the European marketplace, electrical and electronic equipment is required to comply with the Directive on Waste Electrical and Electronic Equipment, which aims to prevent waste by encouraging reuse and recycling, and the Directive on Restriction of Use of Certain Hazardous Substances, which restricts the use of six hazardous substances in electrical and electronic products. Our products and certain components of such products “put on the market” in the EU (whether or not manufactured in the EU) are subject to these directives. Additionally, we are required to comply with certain laws, regulations and directives, including the Toxic Substances Control Act in the United States and REACH in the EU, governing chemicals. These and similar laws and regulations require the testing, reporting and registration of certain chemicals we use and ship. We believe we are in compliance in all material respects with applicable environmental laws and regulations.
Manufacturing
ReWalk includes off-the-shelf and custom-made components produced to our specifications by various third parties, for technical and cost effectiveness. We have contracted with Sanmina Corporation ("Sanmina"), a well-established contract manufacturer with expertise in the medical device industry, for the manufacture of all of our products. Pursuant to this contract, Sanmina manufactures ReWalk at its facility in Ma’alot, Israel. All ReWalk Personal units are manufactured pursuant to the same set of specifications, and all ReWalk Rehabilitation units are manufactured pursuant to another set. We place our manufacturing orders with Sanmina pursuant to purchase orders or by providing forecasts for future requirements. We may terminate our relationship with Sanmina at any time upon written notice. Either we or Sanmina may terminate the relationship in the event of a material breach, subject to a 30-day cure period. Our agreement with Sanmina contains a limitation on liability that applies equally to both us and Sanmina.
We believe that this relationship allows us to operate our business efficiently by focusing our internal efforts on the development of our technology and our products and provides us with substantial scale-up capacity. We regularly test quality on-site at Sanmina’s facility and we obtain full quality inspection reports. We maintain a non-disclosure agreement with Sanmina.
We develop certain of the software components internally and license other software components that are generally available for commercial use as open source software.
We manufacture products based upon internal sales forecasts. We deliver products to customers and distributors based upon purchase orders received, and our goal is to fulfill each customer’s order for products in regular production within two weeks of receipt of the order.
Suppliers
We have contracted with Sanmina for the sourcing of all components and raw materials necessary for the manufacture of our products. Components of our products and raw materials come from suppliers in Europe, China and Israel, and we depend on certain of these components and raw materials, including certain electronic parts, for the manufacture of our products. To date, we have not experienced significant volatility in the prices of these components and raw materials. However, such prices are subject to a number of factors, including purchase volumes, general economic conditions, currency exchange rates, industry cycles, production levels and scarcity of supply.
We believe that our and Sanmina’s facilities, our contracted manufacturing arrangement, and our supply arrangements are sufficient to support our potential capacity needs for the foreseeable future.
Employees
As of December 31, 2015, we had 87 employees (including full-time and hourly employees), of whom 32 are located in the United States, 39 are located in Israel and 16 are located in Germany. As of December 31, 2014, we had 66 employees, of whom 20 are located in the United States, 33 are located in Israel and 13 are located in Germany, and as of December 31, 2013, we had 45 employees, of whom 10 were located in the United States, 27 were located in Israel and eight were located in Germany. The majority of our employees are, and have been, engaged in sales and marketing and research and development activities. We do not employ a significant number of temporary or part time employees.
We are subject to Israeli labor laws and regulations with respect to our employees located in Israel. These laws and regulations principally concern matters such as pensions, paid annual vacation, paid sick days, length of the workday and work week, minimum wages, overtime pay, insurance for work-related accidents, severance pay and other conditions of employment. Our employees are not represented by a labor union. We consider our relationship with our employees to be good. To date, we have not experienced any work stoppages.
The employees of our U.S. and German subsidiaries are subject to local labor laws and regulations.
13
Financial Information about Geographic Areas and Significant Customer Information
The following table sets forth the geographical breakdown of our revenues for each of the years ended December 31, 2015, 2014 and 2013:
|
Years Ended December 31,
|
|||||||||
|
2015
|
2014
|
2013
|
|||||||
|
Revenue:
|
|||||||||
|
United States
|
$
|
2,439
|
|
$
|
2,186
|
|
$
|
941
|
|
|
Europe
|
820
|
|
1,254
|
|
476
|
|
|||
|
Asia - Pacific
|
487
|
|
511
|
|
88
|
|
|||
|
Israel
|
—
|
|
—
|
|
83
|
|
|||
|
Total Revenue
|
$
|
3,746
|
|
$
|
3,951
|
|
$
|
1,588
|
|
Additional discussion of financial information by reportable segment and geographic area and sales in excess of 10% of total revenues to certain of our customers is contained in Note 14 to our consolidated financial statements set forth in Item 8. “Financial Statements and Supplementary Data” of this annual report.
ITEM 1A.
RISK FACTORS
Our business faces significant risks. You should carefully consider all of the information set forth in this annual report and in our other filings with the United States Securities and Exchange Commission, or the SEC, including the following risk factors which we face and which are faced by our industry. Our business, financial condition and results of operations could be materially and adversely affected by any of these risks. In that event, the trading price of our ordinary shares would likely decline and you might lose all or part of your investment. This report also contains forward-looking statements that involve risks and uncertainties. Our results could materially differ from those anticipated in these forward-looking statements, as a result of certain factors including the risks described below and elsewhere in this report and our other SEC filings. See also “Special Note Regarding Forward-Looking Statements” on page (iii).
Risks Related to Our Business and Our Industry
We currently rely, and in the future will rely, on sales of our ReWalk systems and related service contracts and extended warranties for our revenue, and we may not be able to achieve or maintain market acceptance.
We currently rely, and in the future will rely, on sales of our ReWalk systems and related service contracts and extended warranties for our revenue. We have sold only a limited number of ReWalk systems, and market acceptance and adoption depend on educating people with limited upright mobility and health care providers as to the distinct features, ease-of-use, positive lifestyle impact and other benefits of ReWalk compared to alternative technologies and treatments. ReWalk may not be perceived to have sufficient potential benefits compared with these alternatives. Users may also choose other therapies due to disadvantages of ReWalk, including the time it takes for a user to put on ReWalk, the slower pace of ReWalk compared to a wheelchair, the weight of ReWalk when carried, which makes it more burdensome for a companion to transport than a wheelchair, and the requirement that users be accompanied by a trained companion. Also, we believe that healthcare providers tend to be slow to change their medical treatment practices because of perceived liability risks arising from the use of new products and the uncertainty of third-party reimbursement. Accordingly, healthcare providers may not recommend ReWalk until there is sufficient evidence to convince them to alter the treatment methods they typically recommend, such as prominent healthcare providers or other key opinion leaders in the spinal cord injury community recommending ReWalk as effective in providing identifiable immediate and long-term health benefits.
In addition, health insurance companies and other third-party payors may not provide adequate coverage or reimbursement for our products, and the VA may cancel or materially curtail its current policy of providing coverage in the United States for qualifying individuals who have suffered spinal cord injury. We may be unable to sell ReWalk systems on a profitable basis if third-party payors deny coverage, limit reimbursement or reduce their levels of payment, or if our costs of production increase faster than increases in reimbursement levels. In addition, we may not obtain coverage and reimbursement approvals in a timely manner. Our failure to receive such approvals would negatively impact market acceptance of ReWalk.
Achieving and maintaining market acceptance of ReWalk could be negatively impacted by many other factors, including, but not limited to:
14
|
•
|
lack of sufficient evidence supporting the benefits of ReWalk over competitive products or other available treatment, or lifestyle management, methodologies;
|
|
•
|
results of clinical studies relating to ReWalk or similar products;
|
|
•
|
claims that ReWalk, or any component thereof, infringes on patent or other intellectual property rights of third-parties;
|
|
•
|
perceived risks associated with the use of ReWalk or similar products or technologies;
|
|
•
|
the introduction of new competitive products or greater acceptance of competitive products;
|
|
•
|
adverse regulatory or legal actions relating to ReWalk or similar products or technologies; and
|
|
•
|
problems arising from the outsourcing of our manufacturing capabilities, or our existing manufacturing and supply relationships.
|
Any factors that negatively impact sales of ReWalk would adversely affect our business, financial condition and operating results.
The market for medical exoskeletons is new and unproven, and important assumptions about the potential market for our products may be inaccurate.
The market for medical exoskeletons is new and unproven. Accordingly, it is difficult to predict the future size and rate of growth of the market. We cannot be certain whether the market will continue to develop or if medical exoskeletons will achieve and sustain a level of market acceptance and demand sufficient for us to continue to generate revenue and achieve profitability.
Limited sources exist to obtain reliable market data with respect to the number of mobility impaired individuals and the incurrence of spinal cord injuries in our target markets. In addition, there are no third-party reports or studies regarding what percentage of those with limited mobility or spinal cord injuries would be able to use exoskeletons in general, or our current or planned future products in particular. In order to use our current products marketed to those with paraplegia, users must have healthy hands and shoulders, weigh less than 220 pounds/100 kilograms and be between 5 ft. 3 inches and 6 ft. 2 inches/1.60 meters and 1.88 meters. Users must also not have balance, brain or vestibular disorders that would affect their balance. Future products for those with paraplegia, quadriplegia or other mobility impairments or spinal cord injuries may have the same or other restrictions. Our business strategy is based, in part, on our estimates of the number of mobility impaired individuals and the incurrence of spinal cord injuries in our target markets and the percentage of those groups that would be able to use our current and future products. Our assumptions may be inaccurate and may change.
If the medical exoskeleton market fails to develop or develops more slowly than we expect, or if we have relied on sources or made assumptions that are not accurate, our business could be adversely affected.
In addition, because we operate in a new market, the actions of our competitors could adversely affect our business. Adverse events such as product defects or legal claims with respect to competing or similar products could cause reputational harm to the exoskeleton market on the whole. Further, adverse regulatory findings or reimbursement-related decisions with respect to other exoskeleton products could negatively impact the entire market and, accordingly, our business.
We have a limited operating history upon which you can evaluate our business plan and prospects.
Although we were incorporated in 2001, we did not begin selling ReWalk Rehabilitation until 2011, and we did not begin selling ReWalk Personal in Europe until 2012. We began selling ReWalk Personal in the United States in the third quarter of 2014, as we received FDA clearance to do so in June 2014. Therefore, we have limited operating history upon which you can evaluate our business plan and prospects. Our business plan and prospects must be considered in the light of the potential problems, delays, uncertainties and complications encountered in connection with a newly established business. The risks include, but are not limited to, that:
|
•
|
a market will not develop for our products;
|
|
•
|
we will not be able to develop scalable products and services, or that, although scalable, our products and services will not be economical to market;
|
|
•
|
we will not be able to establish brand recognition and competitive advantages for our products;
|
|
•
|
we will not receive necessary regulatory clearances or approvals for our products; and
|
|
•
|
our competitors market an equivalent or superior product or hold proprietary rights that preclude us from marketing our products.
|
There are no assurances that we can successfully address these challenges. If we are unsuccessful, our business, financial condition and operating results could be materially and adversely affected.
15
If we are unable to leverage and expand our sales, marketing and training infrastructure, we may fail to increase our sales.
A key element of our long-term business strategy is the continued expansion of our sales and marketing infrastructure, through the hiring, training, retaining and motivating of skilled sales and marketing representatives with industry experience and knowledge. In order to continue growing our business efficiently, we must coordinate the expansion of this infrastructure with the timing of regulatory approvals, decisions regarding reimbursements, and other factors in various geographies. Managing and maintaining our sales and marketing infrastructure is expensive and time consuming and an inability to leverage such an organization effectively, or in coordination with regulatory or other developments, could inhibit potential sales and the penetration and adoption of ReWalk into both existing and new markets.
We expect to face significant challenges as we manage and continue to grow our sales and marketing infrastructure and work to retain the individuals who make up those networks. Recently hired sales representatives require training and take time to achieve full productivity. If we fail to train recent hires adequately, or if we experience high turnover in our sales force in the future, we cannot be certain that new hires will become as productive as may be necessary to maintain or increase our sales. In addition, if we are not able to retain and continue to recruit our network of internal trainers, we may not be able to successfully train customers on the use of ReWalk, which could inhibit new sales and harm our reputation. If we are unable to expand our sales, marketing and training capabilities, we may not be able to effectively commercialize ReWalk, or enhance the strength of our brand, which could have a material adverse effect on our operating results.
The health benefits of ReWalk have not been substantiated by long-term clinical data, which could limit sales.
Although our interim analysis of an ongoing study demonstrates improvements in secondary physical conditions such as reduction in pain and spasticity and improving bowel and urinary tract function, decreasing pain, emotional and psychosocial benefits, the health benefits of our current ReWalk products have not been substantiated by long-term clinical data. As a result, potential customers and healthcare providers may be slower to adopt or recommend ReWalk and third-party payors may not be willing to provide coverage or reimbursement for our products. In addition, future studies or clinical experience may indicate that treatment with our current or future ReWalk products is not superior to treatment with alternative products or therapies. Such results could slow the adoption of our products and significantly reduce our sales.
We may fail to secure or retain adequate coverage or reimbursement for ReWalk by third-party payors.
We expect that in the future a significant source of payment for ReWalk systems will be private insurance plans and managed care programs, government programs such as the VA, Medicare and Medicaid, worker’s compensation and other third-party payors. In December 2015, the VA issued a national reimbursement policy for the ReWalk system; however, no other uniform policy of coverage and reimbursement for electronic exoskeleton medical technology exists among third-party payors in the United States or elsewhere, although reimbursement may be achieved on a case-by-case basis. To date, payments for our products have been made primarily by self-payors and through case-by-case determinations by third-party payors, and, to a lesser extent, through the use of funds from insurance and/or accident settlements. There is limited clinical data related to ReWalk, and third-party payors may consider use of ReWalk to be experimental and therefore refuse to cover it. For example, Aetna has determined that certain lower-limb prostheses, including ReWalk, are experimental and investigational because there is inadequate evidence of their effectiveness. Generally, private insurance companies do not cover or provide reimbursement for any medical exoskeleton products for personal use, including ReWalk, and may ultimately provide no coverage at all.
Many private third-party payors use coverage decisions and payment amounts determined by the CMS, which administers the Medicare program, as guidelines in setting their coverage and reimbursement policies. In the future, we will pursue economic benefit clinical studies for CMS, which we expect to demonstrate the secondary medical benefits and long-term cost savings potential of ReWalk. While we believe that a positive response from CMS in respect of such studies will broaden coverage by private insurers, we expect that it could take three to five years to receive a decision from CMS. Even with a positive decision from CMS regarding ReWalk Personal, future action by CMS or other government agencies may diminish possible payments to physicians, outpatient centers and/or hospitals that purchase ReWalk Rehabilitation, and possible payments to individuals who purchase ReWalk Personal. Additionally, a decision by CMS to provide reimbursement could influence other payors, including private insurers. If CMS declines to provide for reimbursements of ReWalk or if its reimbursement price is lower than that of other payors, ReWalk may not be reimbursed at a cost-effective level or at all. Those private third-party payors that do not follow the Medicare guidelines may adopt different coverage and reimbursement policies for purchase of ReWalk, or use of ReWalk Rehabilitation at a hospital or rehabilitation center. In addition, we expect that the purchase of ReWalk Rehabilitation systems will require the approval of senior management at hospitals or rehabilitation facilities, inclusion in the hospitals’ or rehabilitation facilities’ budget process for capital expenditures, and in the case of ReWalk Personal, fundraising and financial planning or assistance.
16
Third-party payors are developing increasingly sophisticated methods of controlling healthcare costs. These cost control methods include prospective payment systems, capitated rates, benefit redesigns and an exploration of other cost-effective methods of delivering healthcare. These cost control methods potentially limit the amount that healthcare providers may be willing to pay for electronic exoskeleton medical technology, if they provide coverage at all. We may be unable to sell ReWalk systems on a profitable basis if third-party payors deny coverage or provide insufficient levels of reimbursement.
We depend on a single third party to manufacture ReWalk and a limited number of third-party suppliers for certain components of ReWalk.
We have contracted with Sanmina Corporation, a well-established contract manufacturer with expertise in the medical device industry, for the manufacture of all of our products and the sourcing of all of our components and raw materials. Pursuant to this contract, Sanmina manufactures ReWalk, pursuant to our specifications, at its facility in Ma’alot, Israel. We may terminate our relationship with Sanmina at any time upon written notice. In addition, either we or Sanmina may terminate the relationship in the event of a material breach, subject to a 30-day cure period. For our business strategy to be successful, Sanmina must be able to manufacture our products in sufficient quantities, in compliance with regulatory requirements and quality control standards, in accordance with agreed upon specifications, at acceptable costs and on a timely basis. Increases in our product sales, whether forecasted or unanticipated, could strain the ability of Sanmina to manufacture an increasingly large supply of our current or future products in a manner that meets these various requirements. In addition, although we are not restricted from engaging an alternative manufacturer, and have the capabilities to manufacture ReWalk in-house, the process of moving our manufacturing activities would be time consuming and costly, and may limit our ability to meet our sales commitments, which could harm our reputation and could have a material adverse effect on our business.
We also rely on third-party suppliers, which contract directly with Sanmina, to supply certain components of ReWalk. Sanmina does not have long-term supply agreements with most of its suppliers and, in many cases, makes purchases on a purchase order basis. Sanmina’s ability to secure adequate quantities of such products may be limited. Suppliers may encounter problems that limit their ability to manufacture components for our products, including financial difficulties or damage to their manufacturing equipment or facilities. If Sanmina fails to obtain sufficient quantities of high quality components to meet demand on a timely basis, we could lose customer orders, our reputation may be harmed and our business could suffer.
Sanmina generally uses a small number of suppliers for ReWalk. Depending on a limited number of suppliers exposes us to risks, including limited control over pricing, availability, quality and delivery schedules. If any one or more of our suppliers ceases to provide sufficient quantities of components in a timely manner or on acceptable terms, Sanmina would have to seek alternative sources of supply. It may be difficult to engage additional or replacement suppliers in a timely manner. Failure of these suppliers to deliver products at the level our business requires would limit our ability to meet our sales commitments, which could harm our reputation and could have a material adverse effect on our business. Sanmina also may have difficulty obtaining similar components from other suppliers that are acceptable to the FDA or other regulatory agencies, and the failure of Sanmina’s suppliers to comply with strictly enforced regulatory requirements could expose us to regulatory action including warning letters, product recalls, termination of distribution, product seizures or civil penalties. It could also require Sanmina to cease using the components, seek alternative components or technologies and we could be forced to modify our products to incorporate alternative components or technologies, which could result in a requirement to seek additional regulatory approvals. Any disruption of this nature or increased expenses could harm our commercialization efforts and adversely affect our operating results.
We also rely on a limited number of suppliers for the batteries used by ReWalk and do not maintain any long-term supply agreement with respect to batteries. If we or our third-party distributors fail to obtain sufficient quantities of batteries in a timely manner, our reputation may be harmed and our business could suffer.
Our future growth and operating results will depend on our ability to develop and commercialize new products and penetrate new markets.
We are currently engaged in research and development efforts to adapt ReWalk to address the mobility needs of patients with mobility impairments besides paraplegia, such as multiple sclerosis patients, and, in the future, we plan to address these needs in stroke, cerebral palsy and quadriplegia patients. We expect that a significant portion of our revenues will be derived, in the next few years, from ReWalk products that we adapt for use by individuals with multiple sclerosis, and, in later years, from products that we create to address other medical indications affecting the ability to walk, including quadriplegia, strokes and cerebral palsy. As such, our future results will depend on our ability to successfully develop and commercialize such products. We cannot ensure you that we will be able to introduce new products, products currently under development and products contemplated for future development for additional indications in a timely manner, or at all. In addition, we may not be able to clinically demonstrate the medical benefits of our products for new indications, and we do not yet have any clinical data demonstrating the benefits of our products for indications other than paraplegia. We may also be unable to gain necessary regulatory approvals to enable us to market ReWalk for additional indications or the regulatory process may be more costly and time consuming than expected.
Even if we are successful in the design and development of new products, our growth and results of operations will depend on our ability to penetrate new markets and gain acceptance by non-spinal cord injury markets such as the multiple sclerosis
17
community, and, in the longer term, stroke and cerebral palsy patients or individuals with quadriplegia. We may not be able to gain such market acceptance in these communities in a timely manner, or at all.
While they will utilize the same core technology platform, our new products and products currently under development will have design features and components that differ from our current products. Accordingly, these products will also be subject to the risks described above under “—We currently rely, and in the future will rely, on sales of our ReWalk systems and related service contracts and extended warranties for our revenue, and we may not be able to achieve or maintain market acceptance.” To the extent we are unable to successfully develop and commercialize products to address indications other than paraplegia, we will not meet our projected results of operations and future growth.
We operate in a competitive industry that is subject to rapid technological change, and we expect competition to increase.
There are several other companies developing technology and devices that compete with ReWalk. Our principal competitors in the medical exoskeleton market consist of Ekso Bionics, Rex Bionics, Cyberdyne, and Parker Hannifin. These companies have products currently available for institutional use and Parker Hannifin has filed with the FDA for clearance to commercialize its Indego device for personal use. We expect some of such products to become available for personal use in the next few years. In addition, we compete with alternative devices and alternative therapies, including treadmill-based gait therapies, such as those offered by Hocoma, AlterG, Aretech and Reha Technology. These or other medical device or robotics companies, academic and research institutions, or others, may develop new technologies or therapies that provide a superior walking experience, are more effective in treating the secondary medical conditions that we target or are less expensive than ReWalk or future products. Our technologies and products could be rendered obsolete by such developments. We may also compete with other treatments and technologies that address the secondary medical conditions that ReWalk seeks to mitigate.
Our competitors may respond more quickly to new or emerging technologies, undertake more extensive marketing campaigns, have greater financial, marketing and other resources than we do or may be more successful in attracting potential customers, employees and strategic partners. In addition, potential customers, such as hospitals and rehabilitation centers, could have long-standing or contractual relationships with competitors or other medical device companies. Potential customers may be reluctant to adopt ReWalk, particularly if it competes with or has the potential to compete with or diminish the need/utilization of products or treatments supported through these existing relationships. If we are not able to compete effectively, our business and results of operations will be negatively impacted.
We have incurred net losses since our inception.
We have experienced operating losses since our inception in 2001. We expect that we will continue to incur losses for at least the next two years as we continue to commercialize our ReWalk systems, expand our sales and marketing capabilities, continue our ongoing research and development and continue to develop the corporate infrastructure necessary to market and sell our products. Additionally, as we became subject to the Exchange Act’s domestic reporting regime following the loss of our foreign private issuer status as of January 1, 2016, due to the increased reporting requirements applicable to domestic issuers we may face significantly higher regulatory, compliance and financial costs than those we incurred as a foreign private issuer, and our general and administrative expenses could increase. Our ability to achieve profitability and positive cash flow is subject to the risks described in this section. If we are unable to become profitable with positive cash flow, the value of your investment may be adversely affected.
We may not have sufficient funds to meet our future capital requirements.
We believe we have sufficient cash resources to meet our anticipated cash requirements for at least the next 12 months. However, if we require additional funds during that period or in later periods, we may need to seek additional sources of funds, including potentially by borrowing, selling or licensing our assets or selling additional equity securities. However, we may be unable to obtain additional funds on reasonable terms, or at all. As a result, we may be required to reduce the scope of, or delay or eliminate, some or all of our current and planned commercialization and research and development activities. We also may have to reduce marketing, customer service or other resources devoted to our business. Any of these actions could materially harm our business and results of operations. Any sale of additional equity may result in dilution to our shareholders and agreements governing any borrowing arrangement may contain covenants that could restrict our operations.
In the event that we default under our loan agreement with Kreos, Kreos could exercise its lien and take possession over all of our assets.
As described below under Item 7. "Management’s Discussion and Analysis of Financial Condition and Results of Operations - Liquidity and Capital Resources," on December 30, 2015, we entered into a loan agreement, or the Loan Agreement, with Kreos Capital V (Expert Fund) Limited, or Kreos, pursuant to which Kreos extended a line of credit to us in the amount of $20.0 million. On January 4, 2016, we drew down $12.0 million and, in the event that prior to December 31, 2016 we raise $10.0 million or more in connection with the issuance of shares of our capital stock (including debt convertible into shares of our capital stock), we will be able to draw down up to an additional $8.0 million in separate tranches until December 31, 2016, with a minimum
18
required drawdown of $2.0 million each. Pursuant to the Loan Agreement, we granted Kreos a first priority security interest over all of our assets, including intellectual property and equity interests in our subsidiaries, subject to certain permitted security interests. In the event that we are unable to make the interest payments when due under the Loan Agreement or to pay the outstanding principal amount following the termination of the Loan Agreement, Kreos could take actions under the Loan Agreement and seek to take possession of or sell our assets to satisfy our obligations thereunder. Any of these actions would have an immediate material adverse effect on our business, operating results and financial condition.
We utilize independent distributors who are free to market products that compete with ReWalk.
While we expect that the percentage of our sales generated from independent distributors will decrease over time as we continue to increase our direct sales efforts in the United States in response to the receipt of FDA clearance for ReWalk Personal, we believe that a meaningful percentage of our sales will continue to be generated by independent distributors in the future. None of our independent distributors has been required to sell our products exclusively. Our distributor agreements generally have one year initial terms and automatic renewals for an additional year. If any of our key independent distributors were to cease to distribute our products, our sales could be adversely affected. In such a situation, we may need to seek alternative independent distributors or increase our reliance on our other independent distributors or our direct sales representatives, which may not prevent our sales from being adversely affected. Additionally, to the extent that we enter into additional arrangements with independent distributors to perform sales, marketing, or distribution services, the terms of the arrangements could cause our product margins to be lower than if we directly marketed and sold our products.
We are dependent on a single facility for the manufacturing and assembly of our products.
All manufacturing and assembly of our products is conducted at a single facility of our contract manufacturer, Sanmina, located in Ma’alot, Israel. Accordingly, we are highly dependent on the uninterrupted and efficient operation of this facility. If operations at this facility were to be disrupted as a result of equipment failures, earthquakes and other natural disasters, fires, accidents, work stoppages, power outages, acts of war or terrorism or other reasons, our business, financial condition and results of operations could be materially adversely affected. In particular, this facility is located in the north of Israel within range of rockets that have from time to time been fired into the country during armed conflicts with Hezbollah in Lebanon. Although our manufacturing and assembly operations could be transferred elsewhere, either in-house or to an alternative Sanmina facility, the process of relocating these operations would cause delays in production. Lost sales or increased costs that we may experience during the disruption, or a forced relocation, of operations may not be recoverable under our insurance policies, and longer-term business disruptions could result in a loss of customers. If this were to occur, our business, financial condition and operations could be materially negatively impacted.
We may receive a significant number of warranty claims or our ReWalk system may require significant amounts of service after sale.
Sales of ReWalk generally include a two-year warranty for parts and services, other than for normal wear and tear. We also provide customers with the option to purchase an extended warranty for up to an additional three years. If product returns or warranty claims are significant or exceed our expectations, we could incur unanticipated expenditures for parts and services, which could have a material adverse effect on our operating results.
Defects in our products or the software that drives them could adversely affect the results of our operations.
The design, manufacture and marketing of ReWalk involve certain inherent risks. Manufacturing or design defects, unanticipated use of ReWalk, or inadequate disclosure of risks relating to the use of ReWalk can lead to injury or other adverse events. In addition, because the manufacturing of our products is outsourced to Sanmina, our original equipment manufacturer, we may not be aware of manufacturing defects that could occur. Such adverse events could lead to recalls or safety alerts relating to ReWalk (either voluntary or required by the FDA or similar governmental authorities in other countries), and could result, in certain cases, in the removal of ReWalk from the market. A recall could result in significant costs. To the extent any manufacturing defect occurs, our agreement with Sanmina contains a limitation on Sanmina’s liability, and therefore we could be required to incur the majority of related costs. Product defects or recalls could also result in negative publicity, damage to our reputation or, in some circumstances, delays in new product approvals.
When a human exoskeleton is used by a paralyzed individual to walk, the individual relies completely on the exoskeleton to hold him or her upright. In addition, ReWalk incorporates sophisticated computer software. Complex software frequently contains errors, especially when first introduced. Our software may experience errors or performance problems in the future. If any part of ReWalk’s hardware or software were to fail, the user could experience death or serious injury. Additionally, users may not use ReWalk in accordance with safety protocols and training, which could enhance the risk of death or injury. Any such occurrence could cause delay in market acceptance of ReWalk, damage to our reputation, additional regulatory filings, product recalls, increased service and warranty costs, product liability claims and loss of revenue relating to such hardware or software defects.
19
The medical device industry has historically been subject to extensive litigation over product liability claims. We have been, and anticipate that as part of our ordinary course of business we may be, subject to product liability claims alleging defects in the design, manufacture or labeling of our products. A product liability claim, regardless of its merit or eventual outcome, could result in significant legal defense costs and high punitive damage payments. Although we maintain product liability insurance, the coverage is subject to deductibles and limitations, and may not be adequate to cover future claims. Additionally, we may be unable to maintain our existing product liability insurance in the future at satisfactory rates or adequate amounts.
We may not be able to enhance our product offerings through our research and development efforts.
In order to increase our sales and our market share in the exoskeleton market, we must enhance and broaden our research and development efforts and product offerings in response to the evolving demands of people with paraplegia or paralysis and healthcare providers, as well as competitive technologies. We may not be successful in developing, obtaining regulatory approval for, or marketing our proposed products. In addition, notwithstanding our market research efforts, our future products may not be accepted by consumers, their caregivers, healthcare providers or third-party payors who reimburse consumers for our products. The success of any proposed product offerings will depend on numerous factors, including our ability to:
|
•
|
identify the product features that people with paraplegia or paralysis, their caregivers and healthcare providers are seeking in a medical device that restores upright mobility and successfully incorporate those features into our products;
|
|
•
|
develop and introduce proposed products in sufficient quantities and in a timely manner;
|
|
•
|
adequately protect our intellectual property and avoid infringing upon the intellectual property rights of third-parties;
|
|
•
|
demonstrate the safety, efficacy and health benefits of proposed products; and
|
|
•
|
obtain the necessary regulatory approvals for proposed products.
|
If we fail to generate demand by developing products that incorporate features desired by consumers, their caregivers or healthcare providers, or if we do not obtain regulatory clearance or approval for proposed products in time to meet market demand, we may fail to generate sales sufficient to achieve or maintain profitability. We have in the past experienced, and we may in the future experience, delays in various phases of product development, including during research and development, manufacturing, limited release testing, marketing and customer education efforts. Such delays could cause customers to delay or forego purchases of our products, or to purchase our competitors’ products. Even if we are able to successfully develop proposed products when anticipated, these products may not produce sales in excess of the costs of development, and they may be quickly rendered obsolete by changing consumer preferences or the introduction by our competitors of products embodying new technologies or features.
There is no long-term clinical data with respect to the effects of ReWalk, and our products could cause unforeseen negative effects.
While short-term clinical studies have established the safety of ReWalk, there is no long-term clinical data with respect to the safety or physical effects of ReWalk. Future results and experience could indicate that our products are not safe for long-term use or cause unexpected complications or other unforeseen negative effects. Because ReWalk users generally do not have feeling in their lower body, users may not immediately notice damaging effects, which could exacerbate their impact. If in the future ReWalk is shown to be unsafe or cause such unforeseen effects, we could be subject to mandatory product recalls, suspension or withdrawal of FDA or other regulatory clearance or approval, significant legal liability or harm to our business reputation.
We may enter into collaborations, in-licensing arrangements, joint ventures, strategic alliances or partnerships with third-parties that may not result in the development of commercially viable products or the generation of significant future revenues.
In the ordinary course of our business, in the future we may enter into collaborations, in-licensing arrangements, joint ventures, strategic alliances or partnerships to develop ReWalk and to pursue new markets. Proposing, negotiating and implementing collaborations, in-licensing arrangements, joint ventures, strategic alliances or partnerships may be a lengthy and complex process. We may not identify, secure, or complete any such transactions or arrangements in a timely manner, on a cost-effective basis, on acceptable terms or at all. We have limited institutional knowledge and experience with respect to these business development activities, and we may also not realize the anticipated benefits of any such transaction or arrangement. In particular, these collaborations may not result in the development of products that achieve commercial success or result in significant revenues and could be terminated prior to developing any products. For example, we have entered into arrangements with Yaskawa for the distribution of our products in certain Asian markets and with Making Strides for the distribution of our products in Australia. Additionally, on December 17, 2015, the VA issued a national policy, which is exclusive to ReWalk Robotics exoskeleton systems, for the evaluation, training and procurement of ReWalk Personal exoskeleton systems for all qualifying veterans suffering spinal cord injury across the United States. Our arrangement with Yaskawa and any arrangement we enter into with the VA pursuant to its policy may not be as productive or successful as we hope.
20
If we pursue collaborations, in-licensing arrangements, joint ventures, strategic alliances or partnerships, we may not be in a position to exercise sole decision making authority regarding the transaction or arrangement, which could create the potential risk of creating impasses on decisions, and our collaborators may have economic or business interests or goals that are, or that may become, inconsistent with our business interests or goals. It is possible that conflicts may arise with our collaborators. Our collaborators may act in their self-interest, which may be adverse to our best interest, and they may breach their obligations to us. Any such disputes could result in litigation or arbitration which would increase our expenses and divert the attention of our management. Further, these transactions and arrangements are contractual in nature and may be terminated or dissolved under the terms of the applicable agreements.
Exchange rate fluctuations between the U.S. dollar, the Euro and the NIS may negatively affect our earnings.
The U.S. dollar is our functional and reporting currency. In 2015, most of our revenues were denominated in U.S. dollars and the remainder of our revenues was denominated in euros, and most of our expenses were denominated in U.S. dollars and the remainder of our expenses was denominated in NIS and euros. In 2016, we expect that the denominations of our revenues and expenses will be consistent with what we experienced in 2015. Accordingly, any appreciation of the NIS or Euro relative to the U.S. dollar would adversely impact our net loss or net income, if any. For example, we are exposed to the risks that the shekel may appreciate relative to the dollar, or, if the shekel instead devalues relative to the dollar, that the inflation rate in Israel may exceed such rate of devaluation of the shekel, or that the timing of such devaluation may lag behind inflation in Israel. In any such event, the dollar cost of our operations in Israel would increase and our dollar-denominated results of operations would be adversely affected. We cannot predict any future trends in the rate of inflation in Israel or the rate of devaluation (if any) of the shekel against the dollar. For example, the rate of devaluation of the shekel against the dollar was approximately 0.3% in 2015, and approximately 12.0% in 2014, respectively. This had the effect of increasing the dollar cost of our operations in Israel. If the dollar cost of our operations in Israel increases, our dollar-measured results of operations will be adversely affected. Our operations also could be adversely affected if we are unable to effectively hedge against currency fluctuations in the future.
We have in the past engaged in limited hedging activities, and any hedging strategies that we may implement in the future to mitigate currency risks, such as forward contracts, options and foreign exchange swaps related to transaction exposures, may not eliminate our exposure to foreign exchange fluctuations. For further information, see Item 7A. “Quantitative and Qualitative Disclosures About Market Risk"
We may seek to grow our business through acquisitions of complementary products or technologies, and the failure to manage acquisitions, or the failure to integrate them with our existing business, could have a material adverse effect on our business, financial condition and operating results.
From time to time, we may consider opportunities to acquire other products or technologies that may enhance our product platform or technology, expand the breadth of our markets or customer base, or advance our business strategies. Potential acquisitions involve numerous risks, including:
|
•
|
problems assimilating the acquired products or technologies;
|
|
•
|
issues maintaining uniform standards, procedures, controls and policies;
|
|
•
|
unanticipated costs associated with acquisitions;
|
|
•
|
diversion of management’s attention from our existing business;
|
|
•
|
risks associated with entering new markets in which we have limited or no experience; and
|
|
•
|
increased legal and accounting costs relating to the acquisitions or compliance with regulatory matters.
|
We have no current commitments with respect to any acquisition. We do not know if we will be able to identify acquisitions we deem suitable, whether we will be able to successfully complete any such acquisitions on favorable terms or at all, or whether we will be able to successfully integrate any acquired products or technologies. Our potential inability to integrate any acquired products or technologies effectively may adversely affect our business, operating results and financial condition.
If there are significant disruptions in our information technology systems, our business, financial condition and operating results could be adversely affected.
The efficient operation of our business depends on our information technology systems. We rely on our information technology systems to effectively manage sales and marketing data, accounting and financial functions, inventory management, product development tasks, research and development data, customer service and technical support functions. Our information technology systems are vulnerable to damage or interruption from earthquakes, fires, floods and other natural disasters, terrorist attacks, attacks by computer viruses or hackers, power losses, and computer system or data network failures. In addition, our data management application is hosted by a third-party service provider whose security and information technology systems are subject to similar risks, and ReWalk systems contain software which could be subject to computer virus or hacker attacks or other failures.
21
The failure of our or our service providers’ information technology systems or ReWalk’s software to perform as we anticipate or our failure to effectively implement new information technology systems could disrupt our entire operation or adversely affect our software products and could result in decreased sales, increased overhead costs, and product shortages, all of which could have a material adverse effect on our reputation, business, financial condition and operating results.
If we fail to properly manage our anticipated growth, our business could suffer.
Our rapid growth has placed, and we expect that it will continue to place, a significant strain on our management team and on our financial resources. Failure to manage our growth effectively could cause us to misallocate management or financial resources, and result in losses or weaknesses in our infrastructure, which could materially adversely affect our business. Additionally, our anticipated growth will increase the demands placed on our suppliers, resulting in an increased need for us to manage our suppliers and monitor for quality assurance. Any failure by us to manage our growth effectively could have an adverse effect on our ability to achieve our business objectives.
We depend on the knowledge and skills of our senior management.
We have benefited substantially from the leadership and performance of our senior management. For example, we depend on our Chief Executive Officer’s experience successfully scaling an early stage medical device company, as well as the experience of other members of management. Our success will depend on our ability to retain our current management. Competition for senior management in our industry is intense and we cannot guarantee that we will be able to retain our personnel. Additionally, we do not carry key man insurance on any of our current executive officers. The loss of the services of certain members of our senior management could prevent or delay the implementation and completion of our strategic objectives, or divert management’s attention to seeking qualified replacements.
Risks Related to Government Regulation
We are subject to extensive governmental regulations relating to the manufacturing, labeling and marketing of our products, and a failure to comply with such regulations could lead to withdrawal or recall of our products from the market.
Our medical products and manufacturing operations are subject to regulation by the FDA, the European Union, the Ministry of Health in Israel, the TGA in Australia, and other governmental authorities both inside and outside of the United States. These agencies enforce laws and regulations that govern the development, testing, manufacturing, labeling, storage, installation, servicing, advertising, promoting, marketing, distribution, import, export and market surveillance of ReWalk.
Our products are regulated as medical devices in the United States under the FFDCA as implemented and enforced by the FDA. Under the FFDCA, medical devices are classified into one of three classes-Class I, Class II or Class III-depending on the degree of risk associated with the medical device, what is known about the type of device, and the extent of control needed to provide reasonable assurance of safety and effectiveness. Classification of a device is important because the class to which a device is assigned determines, among other things, the necessity and type of FDA review required prior to marketing the device. See Item 1. “Business - Government Regulation.”
In June 2014, the FDA granted our petition for “de novo” classification, which provides a route to market for medical devices that are low to moderate risk, but are not substantially equivalent to a predicate device, and classified ReWalk as Class II subject to certain special controls. The ReWalk is intended to enable individuals with spinal cord injuries to perform ambulatory functions under supervision of a specially trained companion, and inside rehabilitation institutions. The special controls established in the de novo order include compliance with medical device consensus standards; clinical study demonstrating testing to safe and effective use considering the level of supervision necessary and the use environment; non-clinical performance testing of the system’s function and durability; and performance to demonstrate that the device performs as intended under anticipated conditions of use; a training program; and labeling related to device use and user training. In order for us to market ReWalk, we must comply with both general controls, including controls related to quality, facility registration, reporting of adverse events and labeling, and the special controls established for the device. Failure to comply with the general and special controls could lead to removal of ReWalk from the market, which would have a material adverse effect on our business.
Following the introduction of a product, the governmental agencies will periodically review our manufacturing processes and product performance, and we are under a continuing obligation to ensure that all applicable regulatory requirements continue to be met. The process of complying with the applicable good manufacturing practices, adverse event reporting and other requirements can be costly and time consuming, and could delay or prevent the production, manufacturing or sale of the ReWalk. In addition, if we fail to comply with applicable regulatory requirements, it could result in fines, delays or suspensions of regulatory clearances, closure of manufacturing sites, seizures or recalls of products and damage to our reputation. Recent changes in enforcement practice by the FDA, European Union and other agencies have resulted in increased enforcement activity, which increases the compliance risk that we and other companies in our industry are facing.
22
In addition, governmental agencies may impose new requirements regarding registration, labeling or prohibited materials that may require us to modify or re-register ReWalk once it is already on the market or otherwise impact our ability to market ReWalk in those countries. The process of complying with these governmental regulations can be costly and time consuming, and could delay or prevent the production, manufacturing or sale of ReWalk. For instance, the FDA may issue mandates, known as 522 orders, requiring us to conduct post-market studies of products for which the FDA has already granted us pre-market clearance. Failure to comply could result in enforcement of the Federal Food, Drug, and Cosmetic Act against us or our products. Additionally, the agency could request that we recall our ReWalk Personal 6.0 device.
In February 2016, the FDA sent us a letter citing deficiencies in the protocol for the mandatory post-market study (conducted pursuant to a 522 order) on our ReWalk Personal 6.0 model and expressing the FDA’s belief that we should submit a second premarket notification for the device. We intend to meet and discuss the February 2016 letter with the FDA. We expect that we may continue to sell our ReWalk Personal 6.0 model notwithstanding the outcome because of our good faith belief that our past 510(k) clearance covers the ReWalk Personal 6.0 and the public health significance of the device. Further, we currently expect that we will be able to address any deficiencies in our post-market study protocol. However, if the FDA were to decide instead to seek enforcement against us, the ReWalk Personal 6.0 model or any other product due to failure to satisfy this or any other 522 order, we could be prevented from selling the product in the United States, which could materially adversely affect our revenues and results of operations.
If we or our third-party manufacturers or suppliers fail to comply with the FDA’s Quality System Regulation, or QSR, our manufacturing operations could be interrupted.
We, Sanmina and some of our suppliers are required to comply with the FDA’s QSR which covers the methods and documentation of the design, testing, production, control, quality assurance, labeling, packaging, sterilization, storage and shipping of our products. We and Sanmina and our suppliers are also subject to the regulations of foreign jurisdictions regarding the manufacturing process if we or our distributors market our products abroad. We continue to monitor our quality management in order to improve our overall level of compliance. Our facilities are subject to periodic and unannounced inspection by U.S. and foreign regulatory agencies to audit compliance with the QSR and comparable foreign regulations. If our facilities or those of Sanmina or our suppliers are found to be in violation of applicable laws and regulations, or if we or Sanmina or our suppliers fail to take satisfactory corrective action in response to an adverse inspection, the regulatory authority could take enforcement action, including any of the following sanctions:
|
•
|
untitled letters, warning letters, fines, injunctions, consent decrees and civil penalties;
|
|
•
|
customer notifications or repair, replacement or refunds;
|
|
•
|
detention or seizure of our products;
|
|
•
|
operating restrictions or partial suspension or total shutdown of production;
|
|
•
|
refusing or delaying requests for 510(k) marketing clearance or PMA approvals of new products or modified products;
|
|
•
|
withdrawing 510(k) marketing clearances or PMA approvals that have already been granted;
|
|
•
|
refusing to provide Certificates for Foreign Government;
|
|
•
|
refusing to grant export approval for our products; or
|
|
•
|
pursuing criminal prosecution.
|
Any of these sanctions could impair our ability to produce ReWalk in a cost-effective and timely manner in order to meet our customers’ demands, and could have a material adverse effect on our reputation, business, results of operations and financial condition. We may also be required to bear other costs or take other actions that may have a negative impact on our future sales and our ability to generate profits.
We are subject to various laws and regulations, including “fraud and abuse” laws and anti-bribery laws, which, if violated, could subject us to substantial penalties.
Medical device companies such as ours have faced lawsuits and investigations pertaining to alleged violations of numerous statutes and regulations, including anti-corruption laws and health care “fraud and abuse” laws, such as the federal False Claims Act, the federal Anti-Kickback Statute and the U.S. Foreign Corrupt Practices Act, or the FCPA. See Item 1. “Business—Government Regulation.” U.S. federal and state laws, including the federal Physician Payments Sunshine Act, or the Sunshine Act, and the implementation of Open Payments regulations under the Sunshine Act, require medical device companies to disclose certain payments or other transfers of value made to healthcare providers and teaching hospitals or funds spent on marketing and promotion of medical device products. It is widely believed that public reporting under the Sunshine Act and implementing Open
23
Payments regulations results in increased scrutiny of the financial relationships between industry, physicians and teaching hospitals. These anti-kickback, anti-bribery, public reporting and aggregate spending laws affect our sales, marketing and other promotional activities by limiting the kinds of financial arrangements, including sales programs, we may have with hospitals, rehabilitation centers, physicians or other potential purchasers or users of ReWalk. They also impose additional administrative and compliance burdens on us. In particular, these laws influence, among other things, how we structure our sales offerings, including discount practices, customer support, education and training programs and physician consulting and other service arrangements. If we are in violation of any of these requirements or any actions are instituted against us, and we are not successful in defending ourselves or asserting our rights, those actions could have a significant impact on our business, including the imposition of significant criminal and civil fines and penalties, exclusion from federal healthcare programs or other sanctions.
The FCPA applies to companies, including ours, with a class of securities registered under the Exchange Act. The FCPA and other anti-bribery laws to which various aspects of our operations may be subject generally prohibit companies and their intermediaries from making improper payments to officials for the purpose of obtaining or retaining business. In various jurisdictions, our operations require that we and third parties acting on our behalf routinely interact with government officials, including medical personnel who may be considered government officials for purposes of these laws because they are employees of state-owned or controlled facilities. Other anti-bribery laws to which various aspects of our operations may be subject, including the United Kingdom Bribery Act, also prohibit improper payments to private parties and prohibit receipt of improper payments. Our policies prohibit our employees from making or receiving corrupt payments, including, among other things, to require compliance by third parties engaged to act on our behalf. Our policies mandate compliance with these anti-bribery laws; however, we operate in many parts of the world that have experienced governmental and/or private corruption to some degree. As a result, the existence and implementation of a robust anti-corruption program cannot eliminate all risk that unauthorized reckless or criminal acts have been or will be committed by our employees or agents. Violations of these laws, or allegations of such violations, could disrupt our business and harm our financial condition, results of operations, cash flows and reputation.
If we are found to have violated laws protecting the confidentiality of patient health information, we could be subject to civil or criminal penalties, which could increase our liabilities and harm our reputation or our business.
There are a number of federal, state and foreign laws protecting the confidentiality of certain patient health information, including patient records, and restricting the use and disclosure of that protected information. In particular, the U.S. Department of Health and Human Services, or HHS, promulgated patient privacy rules under the Health Insurance Portability and Accountability Act of 1996, or HIPAA. These privacy rules protect medical records and other personal health information by limiting their use and disclosure, giving individuals the right to access, amend and seek accounting of their own health information and limiting most use and disclosures of health information to the minimum amount reasonably necessary to accomplish the intended purpose. If we or any of our service providers are found to be in violation of the promulgated patient privacy rules under HIPAA, we could be subject to civil or criminal penalties, which could increase our liabilities, harm our reputation and have a material adverse effect on our business, financial condition and operating results.
Compliance with various regulations, including those related to our status as a U.S. public company and the manufacturing, labeling and marketing of our products, may result in heightened general and administrative expenses and costs, divert management’s attention from revenue-generating activities and pose challenges for our management team, which has limited time, personnel and finances to devote to regulatory compliance.
As a U.S. public company, we are subject to various regulatory and reporting requirements, including those imposed by the SEC, the Sarbanes-Oxley Act, the Dodd-Frank Wall Street Reform and Consumer Protection Act, the listing requirements of the NASDAQ Global Market and other applicable securities rules and regulations. Additionally, our medical products and manufacturing operations are regulated by the FDA, the European Union, the Ministry of Health in Israel, the TGA in Australia and other governmental authorities both inside and outside of the United States. Compliance with the rules and regulations applicable to us as a publicly traded company in the United States and medical device manufacturer has greatly increased, and may continue to increase, our legal, general and administrative and financial compliance costs and has made, and may continue to make, some activities more difficult, time-consuming or costly. Additionally, these regulatory requirements have diverted, and may continue to divert, management’s attention from revenue-generating activities and may increase demands on management’s already-limited resources. Our management team consists of few employees, as the majority of our employees are engaged in sales and marketing and research and development activities, and we do not employ in-house counsel. In light of such constraints on its time, personnel and finances, our management may not be able to implement programs and policies in an effective and timely manner to respond adequately to the heightened legal, regulatory and reporting requirements applicable to us. In the past, for example, we have not always been able to respond on a timely basis to requests from regulators, although we have not to date experienced any material adverse consequences as a result. Similar deficiencies, weaknesses or lack of compliance with public company, medical device and other regulations could harm our reputation in the capital markets or for quality and safety, negatively affect our ability to maintain our public company status and to develop, commercialize or continue selling our products on a timely and effective basis, and cause us to incur sanctions, including fines, injunctions and penalties.
24
In addition, complying with public disclosure rules makes our business more visible, which we believe may result in threatened or actual litigation, including by competitors and other third parties. If such claims are successful, our business and operating results could be harmed, and even if the claims do not result in litigation or are resolved in our favor, these claims, and the time and resources necessary to resolve them, could divert the resources of our management and harm our business and operating results.
Risks Related to Our Intellectual Property
Our success depends in part on our ability to obtain and maintain protection for the intellectual property relating to or incorporated into our products.
Our success depends in part on our ability to obtain and maintain protection for the intellectual property relating to or incorporated into our products. We seek to protect our intellectual property through a combination of patents, trademarks, confidentiality and assignment agreements with our employees and certain of our contractors and confidentiality agreements with certain of our consultants, scientific advisors and other vendors and contractors. In addition, we rely on trade secrets law to protect our proprietary software and product candidates/products in development.
The patent position of robotic and exoskeleton inventions can be highly uncertain and involves many new and evolving complex legal, factual and technical issues. Patent laws and interpretations of those laws are subject to change and any such changes may diminish the value of our patents or narrow the scope of protection. In addition, we may fail to apply for or be unable to obtain patents necessary to protect our technology or products or enforce our patents due to lack of information about the exact use of technology or processes by third parties. Also, we cannot be sure that any patents will be granted in a timely manner or at all with respect to any of our patent pending applications or that any patents that are granted will be adequate to protect our intellectual property for any significant period of time or at all.
Litigation to establish or challenge the validity of patents, or to defend against or assert against others infringement, unauthorized use, enforceability or invalidity claims, can be lengthy and expensive and may result in our patents being invalidated or interpreted narrowly and our not being granted new patents related to our pending patent applications. Even if we prevail, litigation may be time consuming and force us to incur significant costs, and any damages or other remedies awarded to us may not be valuable and management’s attention could be diverted from managing our business. In addition, U.S. patents and patent applications may be subject to interference proceedings, and U.S. patents may be subject to re-examination and review proceedings in the U.S. Patent and Trademark Office. Foreign patents may also be subject to opposition or comparable proceedings in the corresponding foreign patent offices. Any of these proceedings may be expensive and could result in the loss of a patent or denial of a patent application, or the loss or reduction in the scope of one or more of the claims of a patent or patent application.
In addition, we seek to protect our trade secrets, know-how and confidential information that is not patentable by entering into confidentiality and assignment agreements with our employees and certain of our contractors and confidentiality agreements with certain of our consultants, scientific advisors and other vendors and contractors. However, we may fail to enter into the necessary agreements, and even if entered into, these agreements may be breached or otherwise fail to prevent disclosure, third-party infringement or misappropriation of our proprietary information, may be limited as to their term and may not provide an adequate remedy in the event of unauthorized disclosure or use of proprietary information. Enforcing a claim that a third party illegally obtained and is using our trade secrets is expensive and time consuming, and the outcome is unpredictable.
We also have taken precautions to initiate reasonable safeguards to protect our information technology systems. However, these measures may not be adequate to safeguard our proprietary information, which could lead to the loss or impairment thereof or to expensive litigation to defend our rights against competitors who may be better funded and have superior resources. In addition, unauthorized parties may attempt to copy or reverse engineer certain aspects of our products that we consider proprietary or our proprietary information may otherwise become known or may be independently developed by our competitors or other third parties. If other parties are able to use our proprietary technology or information, our ability to compete in the market could be harmed.
Further, unauthorized use of our intellectual property may have occurred, or may occur in the future, without our knowledge.
If we are unable to obtain or maintain adequate protection for intellectual property, or if any protection is reduced or eliminated, competitors may be able to use our technologies, resulting in harm to our competitive position.
Our patents and proprietary technology and processes may not provide us with a competitive advantage.
Robotics and exoskeleton technologies have been developing rapidly in recent years. We are aware of several other companies developing competing exoskeleton devices for individuals with limited mobility and we expect the level of competition and the pace of development in our industry to increase. See Item 1. “Business—Competition.” While we believe our tilt-sensor technology provides a more natural and superior method of exoskeleton activation, which creates a better user experience, a variety of other activation and control methods exist for exoskeletons, several of which are being developed by our competitors, or may
25
be developed in the future. As a result, our patent portfolio and proprietary technology and processes may not provide us with a significant advantage over our competitors, and competitors may be able to design and sell alternative products that are equal to or superior to our products without infringing on our patents. In addition, upon the expiration of our current patents, we may be unable to adequately develop new technologies and obtain future patent protection to preserve our competitive advantage. If we are unable to maintain a competitive advantage, our business and results of operations may be materially adversely affected.
Even in instances where others are found to infringe on our patents, many countries have laws under which a patent owner may be compelled to grant licenses for the use of the patented technology to other parties. In addition, many countries limit the enforceability of patents against other parties, including government agencies or government contractors. In these countries, a patent owner may have limited remedies, which could diminish the value of a patent in those countries. Further, the laws of some countries do not protect intellectual property rights to the same extent as the laws of the United States, particularly in the field of medical products, and effective enforcement in those countries may not be available. The ability of others to market comparable products could adversely affect our business.
We are not able to protect our intellectual property rights in all countries.
Filing, prosecuting, maintaining and defending patents on each of our products in all countries throughout the world would be prohibitively expensive, and thus our intellectual property rights outside the United States are limited. In addition, the laws of some foreign countries, especially developing countries, do not protect intellectual property rights to the same extent as federal and state laws in the United States. Also, it may not be possible to effectively enforce intellectual property rights in some countries at all or to the same extent as in the United States and other countries. Consequently, we are unable to prevent third parties from using our inventions in all countries, or from selling or importing products made using our inventions in the jurisdictions in which we do not have (or are unable to effectively enforce) patent protection. Competitors may use our technologies in jurisdictions where we have not obtained patent protection to develop, market or otherwise commercialize their own products, and we may be unable to prevent those competitors from importing those infringing products into territories where we have patent protection, but enforcement is not as strong as in the United States. These products may compete with our products and our patents and other intellectual property rights may not be effective or sufficient to prevent them from competing in those jurisdictions. Moreover, competitors or others in the chain of commerce may raise legal challenges against our intellectual property rights or may infringe upon our intellectual property rights, including through means that may be difficult to prevent or detect.
Many companies have encountered significant problems in protecting and defending intellectual property rights in foreign jurisdictions. Proceedings to enforce our patent rights in the United States or foreign jurisdictions could result in substantial costs and divert our efforts and attention from other aspects of our business, could put our patents at risk of being invalidated or interpreted narrowly and our patent applications at risk of not issuing, and could provoke third parties to assert patent infringement or other claims against us. We may not prevail in any lawsuits that we initiate and the damages or other remedies awarded, if any, may not be commercially meaningful. Accordingly, our efforts to enforce our intellectual property rights in the United States and around the world may be inadequate to obtain a significant commercial advantage from the intellectual property that we develop or license from third parties.
We may be subject to patent infringement claims, which could result in substantial costs and liability and prevent us from commercializing our current and future products.
The medical device industry is characterized by competing intellectual property and a substantial amount of litigation over patent rights. In particular, our competitors in both the United States and abroad, many of which have substantially greater resources and have made substantial investments in competing technologies, have been issued patents and filed patent applications with respect to their products and processes and may apply for other patents in the future. The large number of patents, the rapid rate of new patent issuances, and the complexities of the technology involved increase the risk of patent litigation.
Determining whether a product infringes a patent involves complex legal and factual issues and the outcome of patent litigation is often uncertain. Even though we have conducted research of issued patents, no assurance can be given that patents containing claims covering our products, technology or methods do not exist, have not been filed or could not be filed or issued. In addition, because patent applications can take years to issue and because publication schedules for pending applications vary by jurisdiction, there may be applications now pending of which we are unaware and may result in issued patents which our current or future products infringe. Also, because the claims of published patent applications can change between publication and parent grant, published applications may issue with claims that potentially cover our products, technology or methods.
Infringement actions and other intellectual property claims brought against us, with or without merit, may cause us to incur substantial costs and could place a significant strain on our financial resources, divert the attention of management and harm our reputation. We cannot be certain that we will successfully defend against any allegations of infringement. If we are found to infringe another party’s patents, we could be required to pay damages. We could also be prevented from selling our products that infringe, unless we could obtain a license to use the technology covered by such patents or could redesign our products so that they do not infringe. A license may be available on commercially reasonable terms or none at all, and we may not be able to redesign our products to avoid infringement. Further, any modification to our products could require us to conduct clinical trials
26
and revise our filings with the FDA and other regulatory bodies, which would be time consuming and expensive. In these circumstances, we may not be able to sell our products at competitive prices or at all, and our business and operating results could be harmed.
We rely on trademark protection to distinguish our products from the products of our competitors.
We rely on trademark protection to distinguish our products from the products of our competitors. We have registered the trademark “ReWalk” in Israel and are in the process of registering our trademark in the United States. In jurisdictions where we have not registered our trademark and are using it, and as permitted by applicable local law, we rely on common law trademark protection. Third-parties may oppose our trademark applications, or otherwise challenge our use of the trademarks, and may be able to use our trademarks in jurisdictions where they are not registered or otherwise protected by law. If our trademarks are successfully challenged or if a third party is using confusingly similar or identical trademarks in particular jurisdictions before we do, we could be forced to rebrand our products, which could result in loss of brand recognition, and could require us to devote additional resources to marketing new brands. If others are able to use our trademarks, our ability to distinguish our products may be impaired, which could adversely affect our business. Further, we cannot assure you that competitors will not infringe upon our trademarks, or that we will have adequate resources to enforce our trademarks.
We may be subject to damages resulting from claims that our employees or we have wrongfully used or disclosed alleged trade secrets of their former employers.
Many of our employees were previously employed at other medical device companies, including our competitors or potential competitors, and we may hire employees in the future that are so employed. We could in the future be subject to claims that these employees, or we, have inadvertently or otherwise used or disclosed trade secrets or other proprietary information of their former employers. If we fail in defending against such claims, a court could order us to pay substantial damages and prohibit us from using technologies or features that are found to incorporate or be derived from the trade secrets or other proprietary information of the former employers. If any of these technologies or features that are important to our products, this could prevent us from selling those products and could have a material adverse effect on our business. Even if we are successful in defending against these claims, such litigation could result in substantial costs and divert the attention of management.
Risks Related to Our Ordinary Shares
Our share price may be volatile, and you may lose all or part of your investment.
Our ordinary shares were first publicly offered in our initial public offering in September 2014, at a price of $12.00 per share and our ordinary shares have subsequently traded as high as $43.71 per share and as low as $5.55 per share through February 22, 2016. The market price of our ordinary shares could be highly volatile and may fluctuate substantially as a result of many factors, including, but not limited to:
|
•
|
actual or anticipated fluctuations in our growth rate or results of operations or those of our competitors;
|
|
•
|
customer acceptance of our products;
|
|
•
|
announcements by us or our competitors of new products or services, commercial relationships, acquisitions or expansion plans;
|
|
•
|
announcements by us or our competitors of other material developments;
|
|
•
|
our involvement in litigation;
|
|
•
|
changes in government regulation applicable to us and our products;
|
|
•
|
sales, or the anticipation of sales, of our ordinary shares, warrants and debt securities by us, or sales of our ordinary shares by our insiders or other shareholders, including upon expiration of contractual lock-up agreements;
|
|
•
|
developments with respect to intellectual property rights;
|
|
•
|
competition from existing or new technologies and products;
|
|
•
|
changes in key personnel;
|
|
•
|
the trading volume of our ordinary shares;
|
|
•
|
changes in the estimation of the future size and growth rate of our markets; and
|
|
•
|
general economic and market conditions.
|
In addition, the stock markets have experienced extreme price and volume fluctuations. Broad market and industry factors may materially harm the market price of our ordinary shares, regardless of our operating performance. In the past, following periods of volatility in the market price of a company’s securities, securities class action litigation has often been instituted against
27
that company. If we were involved in any similar litigation, we could incur substantial costs and our management’s attention and resources could be diverted.
If we do not meet the expectations of equity research analysts, if they do not continue to publish research or reports about our business or if they issue unfavorable commentary or downgrade our ordinary shares, the price of our ordinary shares could decline.
The trading market for our ordinary shares relies in part on the research and reports that equity research analysts publish about us and our business. The analysts’ estimates are based upon their own opinions and are often different from our estimates or expectations. If our results of operations are below the estimates or expectations of public market analysts and investors, our share price could decline. Moreover, the price of our ordinary shares could decline if one or more securities analysts downgrade our ordinary shares or if those analysts issue other unfavorable commentary or do not publish research or reports about us or our business.
A small number of our shareholders have a significant influence over matters requiring shareholder approval, which could delay or prevent a change of control.
The largest beneficial owners of our shares, entities affiliated with SCP Vitalife Partners and Yaskawa Electric Corporation, beneficially own in the aggregate 27.0% of our ordinary shares. As a result, these shareholders, should they choose to act together or and even if they act individually, will exert significant influence over our operations and business strategy and would together have sufficient voting power to influence significantly the outcome of matters requiring shareholder approval. These matters may include:
|
•
|
the composition of our board of directors, which has the authority to direct our business and to appoint and remove our officers;
|
|
•
|
approving or rejecting a merger, consolidation or other business combination;
|
|
•
|
raising future capital; and
|
|
•
|
amending our articles of association, which govern the rights attached to our ordinary shares.
|
This concentration of ownership of our ordinary shares could delay or prevent proxy contests, mergers, tender offers, open-market purchase programs or other purchases of our ordinary shares that might otherwise give you the opportunity to realize a premium over the then-prevailing market price of our ordinary shares. This concentration of ownership may also adversely affect our share price.
As of January 1, 2016, we are required to comply with the Exchange Act’s domestic reporting regime, which may cause us to incur significant legal, accounting and other expenses and resources.
Prior to January 1, 2016, we were a foreign private issuer and therefore were not required to comply with all of the periodic disclosure and current reporting requirements of the Exchange Act applicable to U.S. domestic issuers. As we are no longer a foreign private issuer as of January 1, 2016, we are required to comply with all of the periodic disclosure and current reporting requirements of the Exchange Act applicable to U.S. domestic issuers, which are more detailed and extensive than the requirements for foreign private issuers. In addition, our officers, directors and principal shareholders are no longer exempt from the reporting and short-swing profit recovery provisions contained in Section 16 of the Exchange Act and are no longer exempt from the requirements of Regulation FD. We are also no longer permitted to follow our home country rules in lieu of the corporate governance obligations imposed by the NASDAQ, and may be required to comply with the governance practices required of U.S. domestic issuers. The regulatory and compliance costs associated with the reporting and governance requirements applicable to U.S. domestic issuers may be significantly higher than the costs we previously incurred as a foreign private issuer. As a result, we expect that the loss of foreign private issuer status will increase our legal and financial compliance costs and will make some activities highly time consuming and costly. In addition, we need to develop our reporting and compliance infrastructure and may face challenges in complying with the new requirements applicable to us.
We are an “emerging growth company” and we cannot be certain whether the reduced requirements applicable to emerging growth companies will make our ordinary shares less attractive to investors.
We are an “emerging growth company,” as defined in the Jumpstart Our Business Startups Act of 2012, or the JOBS Act. As a result, we may take advantage of certain exemptions from various requirements that are applicable to other public companies that are not “emerging growth companies.” For instance, we are subject to reduced compensation disclosure obligations under the JOBS Act, and we are not required to conduct votes seeking shareholder approval on an advisory basis of (i) the compensation of our named executive officers or the frequency with which such votes must be conducted or (ii) compensation arrangements and understandings in connection with merger transactions, known as “golden parachute” arrangements. Additionally, we are not required to comply with the auditor attestation requirements of Section 404 of the Sarbanes-Oxley Act of 2002, or the Sarbanes-Oxley Act, for up to five fiscal years after the date of our initial public offering. We will remain an emerging growth company
28
until the earliest of: (a) the last day of our fiscal year during which we have total annual gross revenues of at least $1.0 billion; (b) the last day of our fiscal year following the fifth anniversary of the completion of our initial public offering; (c) the date on which we have, during the previous three-year period, issued more than $1.0 billion in non-convertible debt; or (d) the date on which we are deemed to be a “large accelerated filer” under the Exchange Act. When we are no longer deemed to be an emerging growth company, we will not be entitled to the exemptions provided in the JOBS Act discussed above. We cannot predict if investors will find our ordinary shares less attractive as a result of our reliance on exemptions under the JOBS Act. If some investors find our ordinary shares less attractive as a result, there may be a less active trading market for our ordinary shares and our share price may be more volatile.
The market price of our ordinary shares could be negatively affected by future sales of our ordinary shares.
Sales by us or our shareholders of a substantial number of ordinary shares in the public market, or the perception that these sales might occur, could cause the market price of our ordinary shares to decline or could impair our ability to raise capital through a future sale of, or pay for acquisitions using, our equity securities. If we or our existing shareholders, particularly our largest shareholders, our directors, their affiliates, or our executive officers, sell a substantial number of our ordinary shares in the public market, the market price of our ordinary shares could decrease significantly. The perception in the public market that we or these shareholders might sell our ordinary shares could also depress the market price of our ordinary shares and could impair our future ability to obtain capital, especially through an offering of equity securities.
We are party to an Amended and Restated Shareholders’ Rights Agreement with certain of our shareholders. Pursuant to that agreement, as of February 1, 2016, the beneficial owners of 4,317,883 of our ordinary shares are entitled to require that we register their shares under the Securities Act for resale into the public markets. All shares sold pursuant to an offering covered by such registration statement will be freely transferable. See Item 13. “Certain Relationships and Related Transactions, and Director Independence.”
In addition, as of February 1, 2016, 1,846,334 ordinary shares were subject to outstanding option awards granted to employees under our equity incentive plans, including 680,020 ordinary shares issuable under currently exercisable share options. As of February 1, 2016, 2,743,892 shares remained available for issuance under our equity incentive plans, which amount includes 1,846,334 ordinary shares subject to outstanding awards. Shares issued pursuant to our share incentive plans may be freely sold in the public market upon issuance, subject to vesting provisions, except for shares held by affiliates who have certain restrictions on their ability to sell.
Our U.S. shareholders may suffer adverse tax consequences if we are characterized as a passive foreign investment company.
Generally, if for any taxable year 75% or more of our gross income is passive income, or at least 50% of the average quarterly value of our assets (which may be determined in part by the market value of our ordinary shares, which is subject to change) are held for the production of, or produce, passive income, we would be characterized as a passive foreign investment company, or PFIC, for U.S. federal income tax purposes. Passive income for this purpose generally includes, among other things, certain dividends, interest, royalties, rents and gains from commodities and securities transactions and from the sale or exchange of property that gives rise to passive income. Passive income also includes amounts derived by reason of the temporary investment of funds, including those raised in a public offering. In determining whether a non-U.S. corporation is a PFIC, a proportionate share of the income and assets of each corporation in which it owns, directly or indirectly, at least a 25% interest (by value) is taken into account. Based on our gross income and assets and the nature of our business, we do not believe that we were a PFIC for the taxable year ended December 31, 2015. There can be no assurance that we will not be considered a PFIC for 2016 or any taxable year. PFIC status is determined as of the end of the taxable year and depends on a number of factors, including the value of a corporation’s assets and the amount and type of its gross income. Further, because the value of our gross assets is likely to be determined in large part by reference to our market capitalization (assuming we are treated as publicly traded for purposes of PFIC rules), a decline in the value of our ordinary shares may result in our becoming a PFIC. If we are characterized as a PFIC, our U.S. shareholders may suffer adverse tax consequences, including having gains realized on the sale of our ordinary shares treated as ordinary income, rather than a capital gain, the loss of the preferential rate applicable to dividends received on our ordinary shares by individuals who are U.S. Holders (as defined below), and having interest charges apply to distributions by us and the proceeds of share sales. Certain elections exist that may alleviate some of the adverse consequences of PFIC status and would result in an alternative treatment (such as mark-to-market treatment) of our ordinary shares; however, we do not intend to provide the information necessary for U.S. holders to make qualified electing fund elections if we are classified as a PFIC. For purposes of the above discussion, a “U.S. Holder” is a citizen or resident of the United States; a corporation (or other entity treated as a corporation for U.S. federal income tax purposes) created or organized in or under the laws of the United States or any state thereof, including the District of Columbia;
an estate the income of which is subject to U.S. federal income taxation regardless of its source; or
a trust if such trust has validly elected to be treated as a United States person for U.S. federal income tax purposes or if (1) a court within the United States is able to exercise primary supervision over its administration and (2) one or more United States persons have the authority to control all of the substantial decisions of such trust
.
29
We are subject to ongoing costs and risks associated with determining whether our existing internal controls over financial reporting systems are compliant with Section 404 of the Sarbanes-Oxley Act, and if we fail to achieve and maintain adequate internal controls it could have a material adverse effect on our stated results of operations and harm our reputation.
Starting in the fiscal year ended December 31, 2015, we are required to comply with the internal control, evaluation, and certification requirements of Section 404 of the Sarbanes-Oxley Act and the Public Company Accounting Oversight Board. Unless we lose our status as an emerging growth company under the JOBS Act prior to the end of the fiscal year in which the fifth anniversary of our IPO occurred, we will not be required to obtain an auditor attestation under Section 404 of the Sarbanes-Oxley Act until the year ended December 31, 2019. However once we no longer qualify as an emerging growth company under the JOBS Act our independent registered public accounting firm will need to attest to the effectiveness of our internal control over financial reporting under Section 404.
The process of determining whether our existing internal controls over financial reporting systems are compliant with Section 404 and whether there are any material weaknesses or significant deficiencies in our existing internal controls requires the investment of substantial time and resources, including by our Chief Financial Officer and other members of our senior management. This determination and any remedial actions required could divert internal resources and take a significant amount of time and effort to complete and could result in us incurring additional costs that we did not anticipate, including the hiring of outside consultants. We could experience higher than anticipated operating expenses and higher independent auditor fees during and after the implementation of these changes.
Irrespective of compliance with Section 404, any failure of our internal controls could have a material adverse effect on our stated results of operations and harm our reputation. If we are unable to implement any of the required changes to our internal control over financial reporting effectively or efficiently or are required to do so earlier than anticipated, it could adversely affect our operations, financial reporting and/or results of operations and could result in an adverse opinion on internal controls from our management and, once we lose our emerging growth company status, our independent auditors. Further, if our internal control over financial reporting is not effective, the reliability of our financial statements may be questioned and our share price may suffer.
Risks Relating to Our Incorporation and Location in Israel
Our technology development and quality headquarters and the manufacturing facility for our products are located in Israel and, therefore, our results may be adversely affected by economic restrictions imposed on, and political and military instability in, Israel.
Our technology development and quality headquarters, which houses substantially all of our research and development and our core research and development team, including engineers, machinists, researchers, and clinical and regulatory personnel, as well as the facility of our contract manufacturer, Sanmina, are located in Israel. Many of our employees, directors and officers are residents of Israel. Accordingly, political, economic and military conditions in Israel and the surrounding region may directly affect our business. Since the establishment of the State of Israel in 1948, a number of armed conflicts have taken place between Israel and its Arab neighbors, Hamas (an Islamist militia and political group in the Gaza Strip) and Hezbollah (an Islamist militia and political group in Lebanon). Any hostilities involving Israel or the interruption or curtailment of trade within Israel or between Israel and its trading partners could materially and adversely affect our business, financial condition and results of operations and could make it more difficult for us to raise capital. In particular, an interruption of operations at the Tel Aviv airport related to the conflict in the Gaza Strip or otherwise could prevent or delay shipments of our components or products. Although we maintain inventory in the United States and Germany, an extended interruption could materially and adversely affect our business, financial condition and results of operations. Recent political uprisings, social unrest and violence in various countries in the Middle East and North Africa, including Israel’s neighbors Egypt and Syria, are affecting the political stability of those countries. This instability may lead to deterioration of the political relationships that exist between Israel and these countries and has raised concerns regarding security in the region and the potential for armed conflict. Our commercial insurance does not cover losses that may occur as a result of an event associated with the security situation in the Middle East. Any losses or damages incurred by us could have a material adverse effect on our business. In addition, Iran has threatened to attack Israel and is widely believed to be developing nuclear weapons. Iran is also believed to have a strong influence among parties hostile to Israel in areas that neighbor Israel, such as the Syrian government, Hamas in Gaza and Hezbollah in Lebanon. Any armed conflicts, terrorist activities or political instability in the region could materially and adversely affect our business, financial condition and results of operations.
Our operations and the operations of our contract manufacturer, Sanmina, may be disrupted as a result of the obligation of Israeli citizens to perform military service.
Many Israeli citizens are obligated to perform one month, and in some cases more, of annual military reserve duty until they reach the age of 45 (or older, for reservists with certain occupations) and, in the event of a military conflict, may be called to active duty. In response to terrorist activity, there have been periods of significant call-ups of military reservists. For example, the Israeli armed forces called up a significant number of reservists to active duty in connection with the recent conflict in the
30
Gaza Strip. It is possible that there will be additional military reserve duty call-ups in the future in connection with this conflict or otherwise. Some of our executive officers and employees, as well as those of Sanmina, the manufacturer of all of our products, are required to perform annual military reserve duty in Israel and may be called to active duty at any time under emergency circumstances. Although these call-ups have not had a material impact on our operations or on Sanmina’s ability to manufacture our products, our operations and the operations of Sanmina could be disrupted by such call-ups.
Our sales may be adversely affected by boycotts of Israel.
Several countries, principally in the Middle East, restrict doing business with Israel and Israeli companies, and additional countries may impose restrictions on doing business with Israel and Israeli companies whether as a result of hostilities in the region or otherwise. In addition, there have been increased efforts by activists to cause companies and consumers to boycott Israeli goods based on Israeli government policies. Such actions, particularly if they become more widespread, may adversely impact our ability to sell our products.
The tax benefits that are available to us require us to continue to meet various conditions and may be terminated or reduced in the future, which could increase our costs and taxes.
Some of our operations in Israel, referred to as “Beneficiary Enterprises,” carry certain tax benefits under the Israeli Law for the Encouragement of Capital Investments, 5719-1959, or the Investment Law. Substantially all of our future income before taxes can be attributed to these programs. If we do not meet the requirements for maintaining these benefits or if our assumptions regarding the key elements affecting our tax rates are rejected by the tax authorities, they may be reduced or cancelled and the relevant operations would be subject to Israeli corporate tax at the standard rate, which is currently set at 25.0% for 2016 and thereafter. In addition to being subject to the standard corporate tax rate, we could be required to refund any tax benefits that we may receive in the future, plus interest and penalties thereon. Even if we continue to meet the relevant requirements, the tax benefits that our current “Beneficiary Enterprises” receive may not be continued in the future at their current levels or at all. If these tax benefits were reduced or eliminated, the amount of taxes that we pay would likely increase, as all of our Israeli operations would consequently be subject to corporate tax at the standard rate, which could adversely affect our results of operations. Additionally, if we increase our activities outside of Israel, for example, by way of acquisitions, our increased activities may not be eligible for inclusion in Israeli tax benefit programs. See Note 12 to our consolidated financial statements for a discussion of our current tax obligations.
We have received Israeli government grants for certain of our research and development activities and we may receive additional grants in the future. The terms of those grants restrict our ability to manufacture products or transfer technologies outside of Israel, and we may be required to pay penalties in such cases or upon the sale of our company.
From our inception through December 31, 2015, we received a total of $740,000 from the OCS. We may in the future apply to receive additional grants from the OCS to support our research and development activities. With respect to such grants we are committed to pay royalties at a rate of 3% to 3.5% on sales proceeds up to the total amount of grants received, linked to the dollar and bearing interest at an annual rate of LIBOR applicable to dollar deposits. Even after payment in full of these amounts, we will still be required to comply with the requirements of the Israeli Encouragement of Industrial Research and Development Law, 1984, or the R&D Law, and related regulations, with respect to those past grants. When a company develops know-how, technology or products using OCS grants, the terms of these grants and the R&D Law restrict the transfer outside of Israel of such know-how, and the manufacturing or manufacturing rights of such products, technologies or know-how, without the prior approval of the OCS. Therefore, if aspects of our technologies are deemed to have been developed with OCS funding, the discretionary approval of an OCS committee would be required for any transfer to third parties outside of Israel of know-how or manufacturing or manufacturing rights related to those aspects of such technologies. Furthermore, the OCS may impose certain conditions on any arrangement under which it permits us to transfer technology or development out of Israel or may not grant such approvals at all.
The transfer of OCS-supported technology or know-how outside of Israel may involve the payment of significant amounts to the OCS, depending upon the value of the transferred technology or know-how, the amount of OCS support, the time of completion of the OCS-supported research project and other factors. These restrictions and requirements for payment may impair our ability to sell our technology assets outside of Israel or to outsource or transfer development or manufacturing activities with respect to any product or technology outside of Israel. Furthermore, the consideration available to our shareholders in a transaction involving the transfer outside of Israel of technology or know-how developed with OCS funding (such as a merger or similar transaction) may be reduced by any amounts that we are required to pay to the OCS.
In addition to the above, any non-Israeli citizen, resident or entity that, among other things, (i) becomes a holder of 5% or more
of our share capital or voting rights, (ii) is entitled to appoint one or more of our directors or our chief executive officer or (iii) serves
as one of our directors or as our chief executive officer (including holders of 25% or more of the voting power, equity or the right to
nominate directors in such direct holder, if applicable) is required to notify the OCS and undertake to comply with the rules and
regulations applicable to the grant programs of the OCS, including the restrictions on transfer described above.
31
We may become subject to claims for remuneration or royalties for assigned service invention rights by our employees, which could result in litigation and adversely affect our business.
A significant portion of our intellectual property has been developed by our employees in the course of their employment for us. Under the Israeli Patent Law, 5727-1967, or the Patent Law, and recent decisions by the Israeli Supreme Court and the Israeli Compensation and Royalties Committee, a body constituted under the Patent Law, employees may be entitled to remuneration for intellectual property that they develop for us unless they explicitly waive any such rights, although the validity of any such waivers remains open to judicial review. Although we enter into agreements with our employees pursuant to which they agree that any inventions created in the scope of their employment or engagement are owned exclusively by us, we may face claims demanding remuneration. As a consequence of such claims, we could be required to pay additional remuneration or royalties to our current and former employees, or be forced to litigate such claims, which could negatively affect our business.
Provisions of Israeli law and our articles of association may delay, prevent or otherwise impede a merger with, or an acquisition of, us, even when the terms of such a transaction are favorable to us and our shareholders.
Israeli corporate law regulates mergers, requires tender offers for acquisitions of shares above specified thresholds, requires special approvals for transactions involving directors, officers or significant shareholders and regulates other matters that may be relevant to such types of transactions. For example, a tender offer for all of a company’s issued and outstanding shares can only be completed if the acquirer receives positive responses from the holders of at least 95% of the issued share capital. Completion of the tender offer also requires approval of a majority of the offerees that do not have a personal interest in the tender offer, unless at least 98% of the company’s outstanding shares are tendered. Furthermore, the shareholders, including those who indicated their acceptance of the tender offer (unless the acquirer stipulated in its tender offer that a shareholder that accepts the offer may not seek appraisal rights), may, at any time within six months following the completion of the tender offer, petition an Israeli court to alter the consideration for the acquisition.
Our articles of association provide that our directors (other than external directors) are elected on a staggered basis, such that a potential acquirer cannot readily replace our entire board of directors at a single annual general shareholder meeting. This could prevent a potential acquirer from receiving board approval for an acquisition proposal that our board of directors opposes.
Furthermore, Israeli tax considerations may make potential transactions unappealing to us or to our shareholders whose country of residence does not have a tax treaty with Israel exempting such shareholders from Israeli tax. For example, Israeli tax law does not recognize tax-free share exchanges to the same extent as U.S. tax law. With respect to mergers involving an exchange of shares, Israeli tax law allows for tax deferral in certain circumstances but makes the deferral contingent on the fulfillment of a number of conditions, including, in some cases, a holding period of two years from the date of the transaction during which sales and dispositions of shares of the participating companies are subject to certain restrictions. Moreover, with respect to certain share swap transactions, the tax deferral is limited in time, and when such time expires, the tax becomes payable even if no disposition of the shares has occurred. These and other similar provisions could delay, prevent or impede an acquisition of us or our merger with another company, even if such an acquisition or merger would be beneficial to us or to our shareholders.
It may be difficult to enforce a judgment of a U.S. court against us, our officers and directors, to assert U.S. securities laws claims in Israel or to serve process on our officers and directors.
We are incorporated in Israel. Although the majority of our directors and executive officers reside within the United States and most of the assets of these persons are also likely located within the United States, some of our directors and officers reside and may have the majority of their assets outside the United States. Additionally, most of our assets are located outside of the United States. Therefore, a judgment obtained against us, or those of our directors and executive officers residing outside of the United States, including a judgment based on the civil liability provisions of the U.S. federal securities laws, may not be collectible in the United States and may not be enforced by an Israeli court. It also may be difficult for you to effect service of process in the United States on those directors and executive officers residing outside of the United States or to assert U.S. securities law claims in original actions instituted in Israel. Israeli courts may refuse to hear a claim based on an alleged violation of U.S. securities laws reasoning that Israel is not the most appropriate forum in which to bring such a claim In addition, even if an Israeli court agrees to hear a claim, it may determine that Israeli law and not U.S. law is applicable to the claim. If U.S. law is found to be applicable, the content of applicable U.S. law must be proven as a fact by expert witnesses, which can be a time-consuming and costly process. Certain matters of procedure will also be governed by Israeli law. There is little binding case law in Israel that addresses the matters described above. As a result of the difficulty associated with enforcing a judgment against us in Israel, you may be able to collect only limited, or may be unable to collect any, damages awarded by either a U.S. or foreign court.
32
Your rights and responsibilities as a shareholder will be governed by Israeli law which differs in some material respects from the rights and responsibilities of shareholders of U.S. companies.
The rights and responsibilities of the holders of our ordinary shares are governed by our articles of association and by Israeli law. These rights and responsibilities differ in some material respects from the rights and responsibilities of shareholders in U.S.-based corporations. In particular, a shareholder of an Israeli company has a duty to act in good faith and in a customary manner in exercising its rights and performing its obligations towards the company and other shareholders, and to refrain from abusing its power in the company, including, among other things, in voting at a general meeting of shareholders on matters such as amendments to a company’s articles of association, increases in a company’s authorized share capital, mergers and acquisitions and related party transactions requiring shareholder approval. In addition, a shareholder who is aware that it possesses the power to determine the outcome of a shareholder vote or to appoint or prevent the appointment of a director or executive officer in the company has a duty of fairness toward the company. There is limited case law available to assist us in understanding the nature of this duty or the implications of these provisions. These provisions may be interpreted to impose additional obligations and liabilities on holders of our ordinary shares that are not typically imposed on shareholders of U.S. corporations.
ITEM 1B.
UNRESOLVED STAFF COMMENTS
None.
ITEM 2.
PROPERTIES
Our corporate headquarters are located in Yokneam, Israel, our U.S. headquarters are located in Marlborough, Massachusetts, and our European headquarters are located in Berlin, Germany.
All of our facilities are leased and we do not own any real property. The table below sets forth details of the square footage of our current leased properties, all of which are fully utilized. We have no material tangible fixed assets apart from the properties described below.
|
Square feet(approximate)
|
||
|
Marlborough, Massachusetts
|
3,300
|
|
|
Yokneam, Israel
|
11,080
|
|
|
Berlin, Germany
|
600
|
|
|
Total
|
14,980
|
|
We believe our facilities are adequate and suitable for our current needs.
ITEM 3.
LEGAL PROCEEDINGS
In the ordinary course of our business, we are party to various legal proceedings and claims that we believe are incidental to the operation of our business. We do not believe that the outcomes of these legal proceedings have had in the recent past, or will have (with respect to any pending proceedings), significant effects on our financial position or profitability. For more information, see the information in Note 2t and Note 8e to our consolidated financial statements set forth in Item 8. "Financial Statements and Supplementary Data" of this annual report.
Not applicable.
33
Market Information
Our ordinary shares began trading publicly on the Nasdaq Global Market on September 12, 2014 under the symbol “RWLK”. The following table sets forth, for the periods indicated, the high and low sales prices of our ordinary shares as reported by the Nasdaq Global Market.
|
High
|
Low
|
||||||
|
2015
|
|||||||
|
Fourth quarter 2015
|
$
|
17.40
|
|
$
|
5.55
|
|
|
|
Third quarter 2015
|
$
|
11.90
|
|
$
|
7.20
|
|
|
|
Second quarter 2015
|
$
|
14.65
|
|
$
|
10.35
|
|
|
|
First quarter 2015
|
$
|
22.74
|
|
$
|
12.03
|
|
|
|
2014
|
|||||||
|
Fourth quarter 2014
|
$
|
34.29
|
|
$
|
18.01
|
|
|
|
Third quarter 2014 (beginning on September 12, 2014)
|
$
|
43.71
|
|
$
|
11.50
|
|
|
As of February 1, 2016, there were 41 record holders of our ordinary shares.
Dividend Policy
We have never declared or paid any cash dividends on our ordinary shares. We do not anticipate paying any cash dividends in the foreseeable future. We currently intend to retain future earnings, if any, to finance operations and expand our business. Our board of directors has sole discretion whether to pay dividends. Any future determination relating to our dividend policy will be made at the discretion of our board of directors and will depend on a number of factors, including future earnings, capital requirements, financial condition and future prospects and other factors our board of directors may deem relevant. The distribution of dividends may also be limited by Israeli law, which permits the distribution of dividends only out of retained earnings or otherwise upon the permission of an Israeli court.
Israeli Taxes Applicable to U.S. Holders
A non-Israeli resident who derives capital gains from the sale of shares in an Israeli resident company that were purchased after the company was listed for trading on a stock exchange outside of Israel will be exempt from Israeli tax so long as the shares were not held through a permanent establishment that the non-resident maintains in Israel. However, non-Israeli corporations will not be entitled to the foregoing exemption if Israeli residents (i) have a controlling interest of more than 25% in such non-Israeli corporation or (ii) are the beneficiaries of, or are entitled to, 25% or more of the revenues or profits of such non-Israeli corporation, whether directly or indirectly. Such exemption is not applicable to a person whose gains from selling or otherwise disposing of the shares are deemed to be a business income. Additionally, under the United States-Israel Tax Treaty, or the treaty, the disposition of shares by a shareholder who (i) is a U.S. resident (for purposes of the treaty), (ii) holds the shares as a capital asset, and (iii) is entitled to claim the benefits afforded to such person by the treaty, is generally exempt from Israeli capital gains tax, subject to certain exceptions. In some instances where our shareholders may be liable for Israeli tax on the sale of their ordinary shares, the payment of the consideration may be subject to the withholding of Israeli tax at source. If the above exemptions from capital gains tax are not available, individuals will be subject to a 25% tax rate on real capital gains derived from the sale of shares as long as the individual is not a substantial shareholder of the corporation issuing the shares (in which case the individual will be subject to a 30% tax rate), and corporations will be subject to a 25% corporate tax rate. A substantial shareholder is generally a person who alone or together with such person’s relative or another person who collaborates with such person on a permanent basis, holds, directly or indirectly, at least 10% of any of the means of control of the corporation, including the right to vote, receive profits, nominate a director or an executive officer, receive assets upon liquidation, or order someone who holds any of the aforesaid rights how to act, regardless of the source of such right.
Dividends paid on publicly traded shares, like our ordinary shares, to non-Israeli residents are generally subject to Israeli withholding tax at a rate of 25%, unless a different rate is provided under an applicable tax treaty, provided that a certificate from the Israeli Tax Authority allowing for a reduced withholding tax rate is obtained in advance. Under the treaty, the maximum rate
34
of tax withheld at source in Israel on dividends paid to a holder of our ordinary shares who is a U.S. resident (for purposes of the treaty) is 25%. The treaty provides for reduced tax rates on dividends if (a) the shareholder is a U.S. corporation holding at least 10% of our issued voting power during the part of the tax year that precedes the date of payment of the dividend and held such minimal percentage during the whole of its prior tax year, and (b) not more than 25% of the Israeli company’s gross income consists of interest or dividends, other than dividends or interest received from subsidiary corporations or corporations 50% or more of the outstanding voting shares of which is owned by the Israeli company. The reduced treaty rate, if applicable, is 15% in the case of dividends paid from income derived from Beneficiary or Preferred Enterprise or 12.5% otherwise. We cannot assure you that in the event we declare a dividend we will designate the income out of which the dividend is paid in a manner that will reduce shareholders’ tax liability. If the dividend is attributable partly to income derived from a Beneficiary or Preferred Enterprise and partly to other sources of income, the withholding rate will be a blended rate reflecting the relative portions of the two types of income. U.S. residents who are subject to Israeli withholding tax on a dividend may be entitled to a credit or deduction for U.S. federal income tax purposes in the amount of the taxes withheld.
Stock Performance Graph
The following stock performance graph represents the cumulative total shareholder return for the period September 12, 2014 (the date upon which trading of our ordinary shares commenced) through December 31, 2015 for our ordinary shares, compared to the NASDAQ Composite Index and the NASDAQ Medical Equipment Index. The returns shown in the graph below may not be indicative of future performance.
*$100 invested on 9/12/14 in ordinary shares of ReWalk or in the applicable indexes, including reinvestment of dividends.
The above stock performance graph shall not be deemed to be soliciting material or to be filed with the SEC under the Securities Act and the Exchange Act except to the extent that we specifically request that such information be treated as soliciting material or specifically incorporates it by reference into a filing under the Securities Act or the Exchange Act.
35
Recent Sales of Unregistered Securities
As described below under Item 7. “Management’s Discussion and Analysis of Financial Condition and Results of Operations - Liquidity and Capital Resources,” on December 30, 2015, we entered into a loan agreement, or the Loan Agreement, with Kreos Capital V (Expert Fund) Limited, or Kreos, pursuant to which Kreos extended a line of credit to us in the amount of $20.0 million. In connection with the Loan Agreement we issued to Kreos a warrant, or the Warrant, to purchase up to 119,295 of our ordinary shares at an exercise price of $9.64 per share, which represented the average of the closing prices of our ordinary shares for the thirty-day calendar period prior to the date of the issuance of the Warrant, subject to adjustment as set forth in the Warrant. In the event we draw down any additional amounts under the line of credit the amount of the Warrant will be increased by 5.75% of any such additional draw down.
No underwriters or underwriter discounts or commissions were involved in these issuances. We believe that the issuance of the Warrant was exempt from registration under the Securities Act in reliance on Regulation D or Regulation S under the Securities Act or pursuant to Section 4(2) of the Securities Act regarding transactions by an issuer not involving a public offering or involving offers and sales of securities outside the United States. The recipient of the Warrant represented its intention to acquire the Warrant and the ordinary shares underlying the Warrant for investment only and not with a view to, or in connection with, the sale or distribution thereof. No general advertising or solicitation was used in selling the securities and the Warrant was offered only to Kreos, a non-U.S. entity, in an offshore transaction outside the United States.
Purchases of Equity Securities by the Issuer and Affiliated Purchasers
None.
The following table presents our selected historical consolidated financial data, which is derived from our consolidated financial statements, which have been prepared in accordance with U.S. Generally Accepted Accounting Principles, or U.S. GAAP. The selected consolidated statements of operations data for the years ended December 31, 2015, 2014 and 2013 and the selected consolidated balance sheet data as of December 31, 2015 and 2014 are derived from our audited consolidated financial statements set forth in Item 8. “Financial Statements and Supplementary Data” of this annual report. The selected consolidated statement of operations data for the year ended December 31, 2012 and the selected consolidated balance sheet data as of December 31, 2013 and 2012 has been derived from our audited consolidated financial statements not included in this annual report.
You should read the following selected consolidated financial data in conjunction with Item 7. “Management’s Discussion and Analysis of Financial Condition and Results of Operations,” and it is qualified in its entirety by, reference to our consolidated financial statements and the related notes set forth in Item 8. “Financial Statements and Supplementary Data” of this annual report. The historical results set forth below are not necessarily indicative of the results to be expected in future periods.
36
|
Year Ended December 31,
|
|||||||||||||||
|
2015
|
2014
|
2013
|
2012
|
||||||||||||
|
(in thousands, except per share data)
|
|||||||||||||||
|
Statements of Operations Data:
|
|||||||||||||||
|
Revenues
|
$
|
3,746
|
|
$
|
3,951
|
|
$
|
1,588
|
|
$
|
972
|
|
|||
|
Cost of revenues
|
3,532
|
|
4,106
|
|
2,017
|
|
983
|
|
|||||||
|
Expense related to settlement of BIRD Foundation grants
|
—
|
|
466
|
|
—
|
|
—
|
|
|||||||
|
Gross profit (loss)
|
214
|
|
(621
|
)
|
(429
|
)
|
(11
|
)
|
|||||||
|
Operating expenses:
|
|||||||||||||||
|
Research and development, net
|
5,937
|
|
8,563
|
|
2,463
|
|
1,757
|
|
|||||||
|
Sales and marketing, net
|
13,056
|
|
7,389
|
|
4,091
|
|
2,334
|
|
|||||||
|
General and administrative
|
6,395
|
|
3,352
|
|
1,762
|
|
1,657
|
|
|||||||
|
Total operating expenses
|
25,388
|
|
19,304
|
|
8,316
|
|
5,748
|
|
|||||||
|
Operating loss
|
(25,174
|
)
|
(19,925
|
)
|
(8,745
|
)
|
(5,759
|
)
|
|||||||
|
Financial expenses, net
|
188
|
|
1,698
|
|
3,410
|
|
878
|
|
|||||||
|
Loss before income taxes
|
(25,362
|
)
|
(21,623
|
)
|
(12,155
|
)
|
(6,637
|
)
|
|||||||
|
Income taxes
|
53
|
|
45
|
|
22
|
|
21
|
|
|||||||
|
Net loss
|
$
|
(25,415
|
)
|
$
|
(21,668
|
)
|
$
|
(12,177
|
)
|
$
|
(6,658
|
)
|
|||
|
Net loss per ordinary share, basic and diluted(1)
|
$
|
(2.10
|
)
|
$
|
(6.34
|
)
|
$
|
(74.53
|
)
|
$
|
(41.26
|
)
|
|||
|
Weighted average number of shares used in computing net loss per ordinary share, basic and diluted
|
12,115,038
|
|
3,766,694
|
|
185,688
|
|
185,688
|
|
|||||||
|
As of December 31,
|
|||||||||||||||
|
2015
|
2014
|
2013
|
2012
|
||||||||||||
|
(in thousands)
|
|||||||||||||||
|
Balance Sheet Data:
|
|||||||||||||||
|
Cash and cash equivalents
|
$
|
17,869
|
|
$
|
41,829
|
|
$
|
8,860
|
|
$
|
769
|
|
|||
|
Total assets
|
25,574
|
|
47,665
|
|
11,059
|
|
2,094
|
|
|||||||
|
Accumulated deficit
|
(73,989
|
)
|
(48,574
|
)
|
(26,906
|
)
|
(14,729
|
)
|
|||||||
|
Total shareholders’ equity
|
$
|
20,920
|
|
$
|
43,853
|
|
$
|
5,631
|
|
$
|
(2,264
|
)
|
|||
_____________________________
|
(1)
|
Net loss per ordinary share, basic and diluted, is calculated by dividing our net loss excluding dividends accrued on our convertible preferred shares outstanding during the period presented by the weighted average number of shares outstanding during the period presented. See Note 2s to our consolidated financial statements set forth in Item 8. "Financial Statements and Supplementary Data" of this annual report.
|
37
The following discussion and analysis should be read in conjunction with Item 6.“Selected Financial Data” and our consolidated financial statements and the related notes included elsewhere in this annual report. This discussion contains forward-looking statements that are based on our management’s current expectations, estimates and projections for our business, which are subject to a number of risks and uncertainties. Our actual results may differ materially from those anticipated in these forward-looking statements as a result of many factors, including those set forth under “Special Note Regarding Forward-Looking Statements” and Item 1A. “Risk Factors.”
Overview
We are an innovative medical device that derives revenue from selling the ReWalk Personal and ReWalk Rehabilitation exoskeleton devices that allow individuals with paraplegia the ability to stand and walk once again. Since obtaining FDA clearance in June 2014 we have continued to increase our focus on selling the Personal device through third party payors in the U.S. and Germany, and through distributors in other parts of the world.
We expect to generate revenues from a combination of third-party payors, self-payors and institutions. While no uniform policy of coverage and reimbursement by third-party payors currently exists for electronic exoskeleton technologies such as ReWalk, we plan to pursue various paths of reimbursement and support fundraising efforts by institutions and clinics. In December 2015, the VA issued a national policy for the evaluation, training and procurement of ReWalk Personal exoskeleton systems for all qualifying veterans across the United States. The VA policy, which is exclusive to ReWalk Robotics exoskeleton systems, is the first national coverage policy in the United States for qualifying individuals who have suffered spinal cord injury. Additionally, to date several private insurers in the United States have provided reimbursement for ReWalk in certain cases. For more information regarding reimbursement of our products, see Item 1. “Business—Third party reimbursement and Other Funding Sources.”
We have incurred net losses and negative cash flows from operations since inception and anticipate this to continue in the near term as we continue to focus our efforts on expanding reimbursement and developing the next generation of ReWalk devices.
Revenues
We currently rely, and in the future will rely, on sales and rentals of our ReWalk systems and related service contracts and extended warranties for our revenue. Our revenue is generated from a combination of third-party payors, institutions and self-payors. Payments for our products by third party payors have been made primarily through case-by-case determinations. Third-party payors include, without limitation, private insurance plans and managed care programs, government programs including the US Department of Veterans Affairs, Workers Compensation and Medicare and Medicaid. We expect that third-party payors will be an increasingly important source of revenue in the future. In December 2015, the VA issued a national policy for the evaluation, training and procurement of ReWalk Personal exoskeleton systems for all qualifying veterans across the United States. The VA policy, which is exclusive to ReWalk Robotics exoskeleton systems, is the first national coverage policy in the United States for qualifying individuals who have suffered spinal cord injury.
All of our ReWalk systems are covered by a two-year warranty from the date of purchase, which is included in the purchase price. We offer customers the ability to purchase, any time during the initial warranty period, an extended warranty for up to three additional years. Both warranties cover all elements of the ReWalk system, including the batteries, other than normal wear and tear.
Revenues are presented net of the amounts of any provision we record for expected future product returns.
38
Cost of Revenues and Gross Profit (Loss)
Cost of revenue consists primarily of systems purchased from our outsourced manufacturer, Sanmina Corporation, salaries, personnel costs including non-cash share based compensation, associated with manufacturing and inventory management, training and inspection, warranty and service costs, shipping and handling and manufacturing startup and transition costs. Prior to the first quarter of 2014, when we completed the manufacturing transition to Sanmina, cost of revenues also included costs of components, compensation related costs associated with manufacturing and costs to transition manufacturing to Sanmina. Cost of revenues also includes royalties and expenses related to royalty-bearing research and development grants and sales and marketing grants.
In the future we expect our unit cost to decrease as our sales increase due to product cost improvements including economies of scale realized in connection with larger quantities and increased efficiency.
Our gross profit (loss) and gross margin as a percentage of sales is influenced by a number of factors, including primarily the volume and price of our products sold and fluctuations in our cost of revenues. Certain one-time expenses also impact gross margins including a 2014 expense relating to the early settlement, at a discount, of a royalty-bearing grant to the BIRD Foundation, and the 2015 cost to transition manufacturing to the ReWalk Personal 6.0 model. We expect gross profit (loss) as a percentage of sales will improve in the future as we increase our sales volumes and decrease the product manufacturing costs.
Operating Expenses
Research and Development Expenses, Net
Research and development expenses, net, consist primarily of salaries, related personnel costs including share-based compensation, supplies, materials and expenses related to product design and development, clinical studies, regulatory submissions, patent costs, sponsored research costs and other expenses related to our product development and research programs. We expense all research and development expenses as they are incurred. We believe that continued investment in research and development is crucial to attaining our strategic product objectives.
Research and development expenses are presented net of the amount of any grants we receive for research and development in the period in which we receive the grant. We previously received grants and other funding from the BIRD Foundation and the Office of the Chief Scientist (OCS). Certain of those grants require us to pay royalties on sales of ReWalk systems, which are recorded as cost of revenues. See “—Grants and Other Funding.” We may receive additional funding from these entities or others in the future.
Sales and Marketing Expenses, Net
Our sales and marketing expenses, net, consist primarily of salaries, related personnel costs including share-based compensation for sales, marketing and reimbursement personnel, travel, marketing and public relations activities and consulting costs. Included in the Sales and Marketing expenses are the costs associated with our reimbursement activities in the United States and Germany. Sales and marketing expenses in 2013 are presented net of the amount of any grants we received in such period for sales and marketing.
General and Administrative Expenses
Our general and administrative expenses consist primarily of salaries, related personnel costs including share-based compensation for our administrative, finance, and general management personnel, professional services and insurance.
Financial Income (Expenses), Net
Financial income and expenses consist of bank commissions, foreign exchange gains and losses, interest earned on investments in short term deposits, and revaluation of the fair value of warrants to purchase our preferred shares and expenses related to our convertible loans.
Warrants to purchase our convertible preferred shares were classified as a liability on our consolidated balance sheet at fair value. The warrants were subject to revaluation at each balance sheet date and any change in fair value is recognized as a component of financial income (expense), net, on our consolidated statements of operations. All such warrants were exercised, expired or converted into warrants to purchase ordinary shares in connection with our initial public offering, and therefore as of December 31, 2014 and for periods beginning with the fourth quarter of 2014, we no longer record any liability in respect of them on our balance sheet or financial expenses in respect of them on our statement of operations.
Interest income and expenses consist of interest earned on our cash and cash equivalent balances and interest accrued on and certain other costs with respect to any indebtedness. Foreign currency exchange changes reflect gains or losses related to transactions denominated in currencies other than the U.S. dollar.
As described above in Item 5. “Market for Registrant’s Common Equity, Related Stockholder Matters and Issuer Purchases of Equity Securities – Unregistered Sales of Equity Securities”, on December 30, 2015 we entered into the Loan Agreement
with
39
Kreos pursuant to which Kreos extended a line of credit to us in the amount of $20.0 million. In connection with the Loan Agreement we issued to Kreos the Warrant to purchase up to 119,295 of our ordinary shares at an exercise price of $
9.64
.
Taxes on Income
As of December 31, 2015, we had not yet generated taxable income in Israel. As of that date, our net operating loss carry forwards for Israeli tax purposes amounted to approximately $56.5 million. After we utilize our net operating loss carry forwards, we are eligible for certain tax benefits in Israel under the Law for the Encouragement of Capital Investments, 1959. Our benefit period currently ends ten years after the year in which we first have taxable income in Israel provided that the benefit period will not extend beyond 2024.
Our taxable income generated outside of Israel will be subject to the regular corporate tax rate in the applicable jurisdictions. As a result, our effective tax rate will be a function of the relative proportion of our taxable income that is generated in those locations compared to our overall net income.
Grants and Other Funding
BIRD Foundation and AO&P
In July 2009, we entered into a grant agreement with the BIRD Foundation and Allied Orthotics & Prosthetics Inc., or the AO&P. AO&P was the distributor of our products at the time. We received $500,000 and AO&P received $60,000. The agreement with the BIRD Foundation required us to pay a royalty at a rate of 5% on sales of ReWalk systems and related services. The repayment requirement is equal to the amount of the grant multiplied by an increasing contractual percentage in an amount up to 150%.
Under the agreement AO&P is responsible for repayment of its grant. However, pursuant to the agreement, we are required to make any payments on which AO&P defaults. As of December 31, 2015, there was no contingent liability to the BIRD Foundation.
In 2014, we recorded an expense of $466,000 as a settlement for the prepayment, at a discount, of amounts due under the agreement.
Office of the Chief Scientist
We have also received a total of $740,000 in funding from the OCS, $340,000 of which are royalty-bearing grants, while $400,000 were received in consideration for an investment in our preferred shares. Out of the royalty-bearing grants received, we have paid royalties to the OCS in the total amount of $50,000. We may apply to receive additional grants to support our research and development activities in 2016. The agreements with OCS require us to pay royalties at a rate of 3% to 3.5% on sales of ReWalk systems and related services up to the total amount of funding received, linked to the dollar and bearing interest at an annual rate of LIBOR applicable to dollar deposits. If we transfer OCS-supported technology or know-how outside of Israel, we will be liable for additional payments to OCS depending upon the value of the transferred technology or know-how, the amount of OCS support, the time of completion of the OCS-supported research project and other factors. As of December 31, 2015, the aggregate contingent liability to the OCS was $300,000.
Fund for Promoting Overseas Marketing
We also received a total of $100,000 in funding from the Fund for Promoting Overseas Marketing under the Israeli Ministry of Economy, which are non-royalty-bearing grants, to support our marketing activities. We may in the future apply to receive additional grants to support our marketing activities.
Results of Operations
Year Ended December 31, 2015 Compared to Year Ended December 31, 2014
Revenues
40
Our revenues for 2015 and 2014 were as follows (dollars in thousands):
|
Years Ended December 31,
|
|||||||
|
2015
|
2014
|
||||||
|
Personal units placed
|
53
|
|
43
|
|
|||
|
Rehabilitation units placed
|
20
|
|
31
|
|
|||
|
Total units placed
|
73
|
|
74
|
|
|||
|
Personal unit revenues
|
$
|
2,766
|
|
$
|
2,191
|
|
|
|
Rehabilitation unit revenues
|
$
|
980
|
|
$
|
1,760
|
|
|
|
Revenues
|
$
|
3,746
|
|
$
|
3,951
|
|
|
Revenues decreased $205,000, or 5%, for the year ended December 31, 2015 compared to the year ended December 31, 2014. Increased sales of the Personal devices of $575,000, or 26%, were offset by a decrease in sales of Rehabilitation devices by $780,000, or 44%. During 2015 our sales transitioned to focus on third party payors of our Personal devices, compared to 2014 when initial demand from FDA clearance in June 2014 drove a majority of self funded and donated Personal device sales. In the future we expect our growth to be driven by sales of our Personal device to third party payors.
Gross Profit (Loss)
Our gross profit (loss) for 2015 and 2014 were as follows (in thousands):
|
Years Ended December 31,
|
|||||||
|
2015
|
2014
|
||||||
|
Gross profit (loss)
|
$
|
214
|
|
$
|
(621
|
)
|
|
Gross profit was 6% of revenue for the year ended December 31, 2015, compared to gross loss of 16% of revenue for the year ended December 31, 2014. The increase of gross profit is driven by completing the transition of our manufacturing to Sanmina in the second half of 2014 and the manufacturing economies of scale that resulted therefrom, partially offset by costs associated with the transition of manufacturing to the ReWalk Personal 6.0 in 2015. Additionally, in the fourth quarter of 2014 we incurred a one-time charge related to the early settlement, at a discount, of a royalty-bearing grant from the BIRD Foundation in the amount of $466,000.
We expect our gross profit to increase in the future as we increase revenue and lower our unit manufacturing costs through specific cost reduction projects and economies of scale.
Research and Development Expenses, Net
Our research and development expenses, net for 2015 and 2014 were as follows (in thousands):
|
Years Ended December 31,
|
|||||||
|
2015
|
2014
|
||||||
|
Research and development expenses, net
|
$
|
5,937
|
|
$
|
8,563
|
|
|
Research and development expenses, net, decreased $2.6 million, or 31%, for the year ended December 31, 2015 compared to the year ended December 31, 2014. The decrease in expenses is attributable to a one-time, non-cash, share-based compensation award to our founder at the time of our initial public offering in 2014, which is offset by increased personnel and personnel-related costs related to regulatory, quality and research and development activities for the year ended December 31, 2015.
We expect research and development costs to increase in the near future as we continue to devote resources to developing the next generation of our products and increase spending on clinical studies.
41
Sales and Marketing Expenses
Our sales and marketing expenses for 2015 and 2014 were as follows (in thousands):
|
Years Ended December 31,
|
|||||||
|
2015
|
2014
|
||||||
|
Sales and marketing expenses
|
$
|
13,056
|
|
$
|
7,389
|
|
|
Sales and marketing expenses increased $5.7 million, or 77%, for the year ended December 31, 2015 compared to the year ended December 31, 2014. This increase is attributable to an increase in personnel and personnel-related costs and marketing and reimbursement related costs associated with expanding our sales, marketing and reimbursement activities as we expand commercialization of the ReWalk Personal and Rehabilitation systems.
Over the near future we expect growth in our sales and an increase in our marketing expense will be driven by our continued investment in our reimbursement efforts, as we continue to pursue insurance claims on a cases by case basis, manage claims through the review process and through external appeals, and invest in efforts to expand coverage.
General and Administrative Expenses
Our general and administrative expenses for 2015 and 2014 were as follows (in thousands):
|
Years Ended December 31,
|
|||||||
|
2015
|
2014
|
||||||
|
General and administrative
|
$
|
6,395
|
|
$
|
3,352
|
|
|
General and administrative expenses increased $3.0 million, or 91%, for the year ended December 31, 2015 compared to the year ended December 31, 2014. The increase in expenses is primarily attributable to personnel and personnel-related costs, professional services and other expenses related to our being a publicly traded company for the first full consecutive year.
Financial Expenses, Net
Our financial expenses, net for 2015 and 2014 were as follows (in thousands):
|
Years Ended December 31,
|
|||||||
|
2015
|
2014
|
||||||
|
Financial expenses, net
|
$
|
188
|
|
$
|
1,698
|
|
|
Financial expenses, net, decreased $1.5 million, or 89% for the year ended December 31, 2015, compared to the year ended December 31, 2014. This decrease is attributable mainly to the revaluation of the fair value of warrants to purchase preferred shares and the issuance of convertible preferred shares and warrants to purchase convertible preferred shares in the year ended December 31, 2014.
Income Tax
Our income tax for 2015 and 2014 were as follows (in thousands):
|
Years Ended December 31,
|
|||||||
|
2015
|
2014
|
||||||
|
Income tax
|
$
|
53
|
|
$
|
45
|
|
|
Income taxes increased $8,000 for the year ended December 31, 2015, compared to the year ended December 31, 2014.
42
Year Ended December 31, 2014 Compared to Year Ended December 31, 2013
Revenues
Our revenues for 2014 and 2013 were as follows (dollars in thousands):
|
Years Ended December 31,
|
|||||||
|
2014
|
2013
|
||||||
|
Personal units placed
|
43
|
|
8
|
|
|||
|
Rehabilitation units placed
|
31
|
|
17
|
|
|||
|
Total units placed
|
74
|
|
25
|
|
|||
|
Personal unit revenues
|
$
|
2,191
|
|
$
|
442
|
|
|
|
Rehabilitation unit revenues
|
$
|
1,760
|
|
$
|
1,146
|
|
|
|
Revenues
|
$
|
3,951
|
|
$
|
1,588
|
|
|
Revenues increased $2.4 million, or 149%, for the year ended December 31, 2014 compared to the year ended December 31, 2013. This increase is attributable primarily to an increase in the number of ReWalk systems sold, in particular an increase in sales in the United States as a result of our June 2014 FDA clearance.
Gross Loss
Our gross loss for 2014 and 2013 were as follows (in thousands):
|
Years Ended December 31,
|
|||||||
|
2014
|
2013
|
||||||
|
Gross loss
|
$
|
621
|
|
$
|
429
|
|
|
Gross loss was 16% of revenue for the year ended December 31, 2014, compared to 27% of revenue, for the year ended December 31, 2013. The decrease of gross loss as a percentage of revenue is primarily attributable to an increase in the number of ReWalk system sold and lower manufacturing cost per unit, partially offset by costs related to the transition of manufacturing to Sanmina and a one-time expense relating to the early repayment, at a discount, of a royalty-bearing grant to the BIRD Foundation in the amount of $466,000.
Research and Development Expenses, Net
Our research and development, net for 2014 and 2013 were as follows (in thousands):
|
Years Ended December 31,
|
|||||||
|
2014
|
2013
|
||||||
|
Research and development expenses, net
|
$
|
8,563
|
|
$
|
2,463
|
|
|
Research and development expenses increased $6.1 million, or 248%, for the year ended December 31, 2014 compared to the year ended December 31, 2013. The increase in expenses is attributable to a one-time, non-cash, share-based compensation award to our founder and increased personnel and personnel-related costs related to regulatory, quality and research and development activities.
Sales and Marketing Expenses, Net
Our sales and marketing expenses, net for 2014 and 2013 were as follows (in thousands):
|
Years Ended December 31,
|
|||||||
|
2014
|
2013
|
||||||
|
Sales and marketing expenses, net
|
$
|
7,389
|
|
$
|
4,091
|
|
|
Sales and marketing expenses, net, increased $3.3 million, or 81%, for the year ended December 31, 2014 compared to the year ended December 31, 2013. This increase is attributable to an increase in personnel and personnel-related costs and
43
marketing-related costs associated with expanding our sales and marketing activities as we expand commercialization of the ReWalk Personal and Rehabilitation systems.
General and Administrative Expenses
Our general and administrative expenses for 2014 and 2013 were as follows (in thousands):
|
Years Ended December 31,
|
|||||
|
2014
|
2013
|
||||
|
General and administrative
|
3,352
|
|
1,762
|
|
|
General and administrative expenses increased $1.6 million, or 90%, for the year ended December 31, 2014 compared to the year ended December 31, 2013. The increase in expenses is primarily attributable to personnel and personnel-related costs, professional services and other expenses related to our being a publicly traded company.
Financial Expenses, Net
Our financial expenses, net for 2014 and 2013 were as follows (in thousands):
|
Years Ended December 31,
|
|||||
|
2014
|
2013
|
||||
|
Financial expenses, net
|
1,698
|
|
3,410
|
|
|
Financial expenses, net, decreased $1.7 million, or 50%, for the year ended December 31, 2014 compared to the year ended December 31, 2013. This decrease is attributable mainly to a decrease in financial expenses related to the revaluation of the fair value of warrants to purchase preferred shares in an amount of $1.9 million and a decrease in financial expenses related to convertible loans in an amount of $2.2 million, offset by an increase in financial expenses related to issuance of convertible preferred shares in an amount of $800,000 and an increase in financial expenses related to issuance of warrants to purchase preferred shares in an amount of $1.1 million.
Income Tax
Our income tax for 2014 and 2013 were as follows (in thousands):
|
Years Ended December 31,
|
|||||||
|
2014
|
2013
|
||||||
|
Income tax
|
$
|
45
|
|
$
|
22
|
|
|
Income taxes increased $23,000 for the year ended December 31, 2014, compared to the year ended December 31, 2013 due to tax in respect of prior years.
44
Critical Accounting Policies
Our consolidated financial statements are prepared in accordance with United States generally accepted accounting principles. The preparation of our financial statements requires us to make estimates, judgments and assumptions that can affect the reported amounts of assets and liabilities, disclosure of contingent assets and liabilities at the date of the financial statements and the reported amounts of revenues and expenses during the reporting period. We base our estimates, judgments and assumptions on historical experience and other factors that we believe to be reasonable under the circumstances. Materially different results can occur as circumstances change and additional information becomes known. Besides the estimates identified above that are considered critical, we make many other accounting estimates in preparing our financial statements and related disclosures. See Note 2 to our audited consolidated financial statements presented elsewhere in this annual report for a description of the significant accounting policies that we used to prepare our consolidated financial statements. The critical accounting policies that were impacted by the estimates, judgments and assumptions used in the preparation of our consolidated financial statements are discussed below.
Revenue Recognition
We recognize revenues in accordance with ASC 605, “Revenue Recognition,” when delivery has occurred, persuasive evidence of an agreement exists, the fee is fixed and determinable, collectability is reasonably assured and no further obligations exist. Provisions are made at the time of revenue recognition for any applicable warranty cost expected to be incurred. The timing for revenue recognition among the various products and customers is dependent upon satisfaction of such criteria and generally varies from either shipment or delivery to the customer depending on the specific shipping terms of a given transaction, as stipulated in the agreement with each customer. Other than pricing terms which may differ due to the different volumes of purchases between distributors and end-users, there are no material differences in the terms and arrangements involving direct and indirect customers. Our products sold through agreements with distributors are non-exchangeable, non-refundable, non-returnable and without any rights of price protection or stock rotation. Accordingly, we consider all the distributors as end-users. We generally do not grant a right of return for our products. There have been a few occasions in which we experienced a return of our products. Therefore, we record reductions to revenue for expected future product returns based on our historical experience.
For the majority of sales of Rehabilitation systems, we include training and consider the elements in the arrangement to be a single unit of accounting. In accordance with ASC 605, we have concluded that the training is essential to the functionality of our systems. Therefore, we recognize revenue for the system and training only after delivery, in accordance with the agreement delivery terms, to the customer and after the training has been completed, once all other revenue recognition criteria have been met. For sales of Personal systems to end users, and for sales of Personal or Rehabilitation systems to third party distributors, we do not provide training to the end user as this training is completed by the rehabilitation centers or by the distributor that have previously completed the ReWalk Training program. In certain cases, when product arrangements are bundled with an extended warranty, the separation of the extended warranty falls under the scope of ASC 605- 20-25-1 through 25-6, and the separate price of the extended warranty stated in the agreement is deferred and recognized ratably over the extended warranty period. Deferred revenue includes primarily unearned amounts received in respect of service contracts but not yet recognized as revenues.
Share-Based Compensation – Option Valuations
We account for share-based compensation in accordance with ASC No. 718, “Compensation-Stock Compensation.” ASC No. 718 requires companies to estimate the fair value of equity-based payment awards on the date of grant using an Option-Pricing Model, or OPM. The value of the portion of the award that is ultimately expected to vest is recognized as an expense over the requisite service periods in our consolidated statements of operations.
We selected the Black-Scholes-Merton option pricing model as the most appropriate method for determining the estimated fair value of options. The resulting cost of an equity incentive award is recognized as an expense over the requisite service period of the award, which is usually the vesting period. We recognize compensation expense over the vesting period using the straight-line method and classify these amounts in the consolidated financial statements based on the department to which the related employee reports.
The determination of the grant date fair value of options using the Black-Scholes-Merton option pricing model is affected by estimates and assumptions regarding a number of complex and subjective variables. These variables include the expected volatility of our share price over the expected term of the options, share option exercise and cancellation behaviors, risk-free interest rates and expected dividends, which are estimated as follows:
Fair Value of Our Ordinary Shares.
Prior to our initial public offering, due to the absence of a public market for our ordinary shares, the fair value for our ordinary shares for purposes of determining the exercise price for award grants was determined in good faith by our management and approved by our board of directors. In connection with preparing our financial statements, our management considered the fair value of our ordinary shares based on a number of objective and subjective factors consistent with the methodologies outlined in the American Institute of Certified Public Accountants Practice Aid, Valuation of Privately-Held-Company Equity Securities Issued as Compensation, referred to as the AICPA Practice Aid. We also considered independent
45
third party valuations. The fair value of our ordinary shares is now determined based on the trading price on the Nasdaq Global Market.
Risk-free Interest Rate.
The risk-free interest rate is based on the yield from U.S. Treasury zero-coupon bonds with a term equivalent to the contractual life of the options.
Dividend Yield.
We have never declared or paid any cash dividends and do not presently plan to pay cash dividends in the foreseeable future. Consequently, we used an expected dividend yield of zero.
Expected Volatility.
We estimated the expected share price volatility for our ordinary shares by considering the historic price volatility for industry peers based on price observations over a period equivalent to the expected term of the share option grants. Industry peers consist of public companies in the medical device and healthcare industries. We intend to continue to consistently apply this process using the same or similar industry peers until a sufficient amount of historical information regarding the volatility of our ordinary share price becomes available, or unless circumstances change such that the identified companies are no longer similar to us, in which case, more suitable companies whose share prices are publicly available would be utilized in the calculation.
Expected Term
. The expected term of options granted represents the period of time that options granted are expected to be outstanding, and is determined based on the simplified method in accordance with ASC No. 718-10-S99-1 (SAB No. 110), as adequate historical experience is not available to provide a reasonable estimate. ASC No. 718 requires forfeitures to be estimated at the time of grant and revised, if necessary, in subsequent periods if actual forfeitures differ from those estimates.
Income Taxes
As part of the process of preparing our consolidated financial statements, we are required to estimate our taxes in each of the jurisdictions in which we operate. We account for income taxes in accordance with ASC Topic 740, “Income Taxes,” or ASC Topic 740. ASC Topic 740 prescribes the use of an asset and liability method whereby deferred tax asset and liability account balances are determined based on the difference between book value and the tax bases of assets and liabilities and carryforward tax losses. Deferred taxes are measured using the enacted tax rates and laws that are expected to be in effect when the differences are expected to reverse. We exercise judgment and provide a valuation allowance, if necessary, to reduce deferred tax assets to their estimated realizable value if it is more likely than not that some portion or all of the deferred tax asset will not be realized. We have established a full valuation allowance with respect to our deferred tax assets.
Deferred tax assets are classified as short or long-term based on the classification of the related asset or liability for financial reporting, or according to the expected reversal dates of the specific temporary differences, if not related to an asset or liability for financial reporting. We account for uncertain tax positions in accordance with ASC 740 and recognize the tax benefit from an uncertain tax position only if it is more likely than not that the tax position will be sustained on examination by the taxing authorities, based on the technical merits of the position. The tax benefits recognized in the financial statements from such a position should be measured based on the largest benefit that has a greater than 50% likelihood of being realized upon ultimate settlement. Accordingly, we report a liability for unrecognized tax benefits resulting from uncertain tax positions taken or expected to be taken in a tax return. We recognize interest and penalties, if any, related to unrecognized tax benefits in tax expense.
New and Revised Financial Accounting Standards
The JOBS Act permits emerging growth companies such as us to delay adopting new or revised accounting standards until such time as those standards apply to private companies. We have irrevocably elected not to avail ourselves of this and, therefore, we are subject to the same new or revised accounting standards as other public companies that are not emerging growth companies.
Recently Issued and Adopted Accounting Pronouncements
In May 2014, the FASB issued ASU 2014-09, “Revenue from Contracts with Customers,” (ASU 2014-09), which creates a new Topic, Accounting Standards Codification Topic 606. The standard is principle-based and provides a five-step model to determine when and how revenue is recognized. The core principle of ASU 2014-09 is that an entity should recognize revenue to depict the transfer of promised goods or services to customers in an amount that reflects the consideration to which the entity expects to be entitled in exchange for those goods or services.
The effective date of ASU 2014-09 is for annual reporting periods beginning after December 15, 2017. In July 2015, the FASB decided to defer by one year the effective date of this ASU and early adoption is permitted for annual reporting periods beginning after December 15, 2016. ASU 2014-09 has not yet been adopted
We are currently evaluating the impact of adopting this guidance.
On August 2014, the FASB issued ASU 2014-15, Presentation of Financial Statements - Going Concern (Subtopic 205-40): Disclosure of Uncertainties about an Entity’s Ability to Continue as a Going Concern. ASU 2014-15 is intended to define management’s responsibility to evaluate whether there is substantial doubt about an organization’s ability to continue as a going
46
concern and to provide related footnote disclosures. The amendments in this ASU are effective for reporting periods ending after December 15, 2016, with early adoption permitted. We are currently evaluating the impact of adopting this guidance.
On July 2015, the FASB issued ASU 2015-11, "Inventory (Topic 330), Simplifying the Measurement of Inventory," which changes the measurement principle for inventory from the lower of cost or market to lower of cost and net realizable value. Net realizable value is defined as the estimated selling prices in the ordinary course of business, less reasonably predictable costs of completion, disposal and transportation. ASU 2015-11 eliminates the guidance that entities consider replacement cost or net realizable value less an approximately normal profit margin in the subsequent measurement of inventory when cost is determined on a first-in, first-out or average cost basis. The provisions of ASU 2015-11 are effective for public entities with fiscal years beginning after December 15, 2016, and interim periods within those fiscal years. Early adoption is permitted. We are currently evaluating the impact of adopting this guidance.
In November 2015, the FASB issued ASU 2015-17," Income Taxes (Topic 740) Balance Sheet Classification of Deferred Taxes," which will require that the presentation of deferred tax liabilities and assets be classified as noncurrent in a classified statement of financial position. The amendments in this update are effective for financial statements issued for annual periods beginning after December 15, 2016, and interim periods within those annual periods. Earlier application is permitted for all entities as of the beginning of an interim or annual reporting period. We are currently evaluating the impact of adopting this guidance.
Liquidity and Capital Resources
Since inception, we have funded our operations primarily through the sale of equity securities and convertible notes to investors in private placements and the sale of our ordinary shares in our initial public offering. Our September 2014 initial public offering generated $36.3 million in net proceeds.
On December 30, 2015, we entered into the Loan Agreement with Kreos pursuant to which Kreos extended a line of credit to us in the amount of $20.0 million. On January 4, 2016, we drew down $12.0 million and, in the event that prior to December 31, 2016 we raise $10.0 million or more in connection with the issuance of shares of our capital stock (including debt convertible into shares of our capital stock), we will be able to draw down up to an additional $8.0 million in separate tranches until December 31, 2016, with a minimum required drawdown of $2.0 million each. Interest is payable monthly in arrears on any amounts drawn down at a rate of 10.75% per year from the applicable drawdown date through the date on which all principal is repaid. Principal is repayable monthly over a period of 24 months commencing 12 months after the applicable drawdown date, which period will be extended to 36 months if we raise $20.0 million or more in connection with the issuance of shares of our capital stock (including debt convertible into shares of our capital stock) prior to the expiration of the 24-month period. Pursuant to the Loan Agreement, we paid Kreos a transaction fee equal to 1.0% of the total available amount of the line of credit upon the execution of the agreement and will be required to pay Kreos an end of loan payment equal to 1.0% of the amount of each tranche drawn down upon the expiration of each such tranche. Pursuant to the Loan Agreement, we granted Kreos a first priority security interest over all of our assets, including intellectual property and equity interests in its subsidiaries, subject to certain permitted security interests.
In connection with the Loan Agreement we issued to Kreos the Warrant to purchase up to 119,295 of our ordinary shares at an exercise price of $9.64 per share, which represented the average of the closing prices of our ordinary shares for the thirty-day calendar period prior to the date of the issuance of the Warrant, subject to adjustment as set forth in the Warrant. In the event we draw down any additional amounts under the line of credit the amount of the Warrant will be increased by 5.75% of any such additional draw down. The Warrant is exercisable, in whole or in part, at any time prior to the earliest of (i) December 30, 2025 or (ii) immediately prior to the consummation of a merger, consolidation, or reorganization of our company with or into, or the sale or license of all or substantially all our assets or shares to, any other entity or person, other than a wholly-owned subsidiary of our company, excluding any transaction in which our shareholders prior to the transaction will hold more than 50% of the voting and economic rights of the surviving entity after the transaction.
As of December 31, 2015, we had cash and cash equivalents of $17.9 million.
We believe we have sufficient cash resources to meet our anticipated cash requirements for at least the next 12 months. Our anticipated primary uses of cash are sales, marketing and reimbursement expenses related to market development activities and broadening third party payor coverage, and research and development costs for enhancements to our current product and activities related to the development of the next generation of ReWalk systems.
Our future cash requirements will depend on many factors, including our rate of revenue growth, the expansion of our sales and marketing activities, the timing and extent of our spending on research and development efforts and international expansion. If our current estimates of revenue, expenses or capital or liquidity requirements change or are inaccurate, we may seek to sell additional equity or debt securities, or arrange debt financing. We cannot be certain that additional funds will be available to us on favorable terms when required, or at all.
47
Net Cash Used in Operating Activities
Net cash used in operating activities increased from $15.3 million in 2014 to $25.2 million in 2015 primarily as a result of higher operating expenses and working capital change.Net cash used in operating activities increased from $8.8 million in 2013 to $15.3 million in 2014 primarily as a result of higher operating expenses partially offset by higher non-cash financial expenses. Our net losses in 2013 were offset primarily by non-cash expenses and also by net changes in our working capital.
Net Cash Used in Investing Activities
Net cash provided by (used in) investing activities increased from ($1.8 million) in 2014 to $1.1 million in 2015 primarily as a result of cash provided by disposing of a net investment in short-term deposits partially offset by cash used for the purchases of property and equipment. Net cash used in investing activities increased from $200,000 in 2013 to $1.8 million in 2014 primarily as a result of net investment in short-term deposits. Investing activities in these periods consisted of purchases of property and equipment and, to a lesser extent, increases and decreases in long-term deposits.
Net Cash Provided by (Used in) Financing Activities
We generated $137,000 from financing activities for the year ended December 31, 2015, due to the exercise of stock options by our employees and non employees. We generated $50.1 million in cash from financing activities in the year ended December 31, 2014, which reflects $36.3 million of net proceeds from our initial public offering, and $12.8 million received in an investment in our preferred shares and warrants in our series E investment round and $1.1 million received upon exercise of our warrants. Our financing activities in 2013 consisted of the issuance of convertible notes and the sale of preferred shares. In 2013, we issued convertible notes in anticipation of new issuances of preferred shares. Upon our subsequent issuance of preferred shares to holders of the convertible notes and others, the convertible notes were converted into preferred shares. As of December 31, 2013, no convertible loans remained outstanding. Net cash provided by financing activities was $17.1 million for the year ended December 31, 2013.
Obligations and Commercial Commitments
The following summarizes our contractual obligations as of December 31, 2015.
|
Payments due by period (in dollars, in thousands)
|
|||||||||||||
|
Contractual obligations
|
Total
|
Less than 1 year
|
1-3 years
|
3-5 years
|
More than 5 years
|
||||||||
|
Purchase obligations
|
958
|
958
|
|
-
|
|
-
|
|
-
|
|
||||
|
Operating lease obligations
|
3,593
|
322
|
|
972
|
|
1,014
|
|
1,285
|
|
||||
|
Total
|
4,551
|
1,280
|
|
972
|
|
1,014
|
|
1,285
|
|
||||
Our purchase obligations consist of purchase commitments to our manufacturer, our operating leases consist of leases for our facilities and motor vehicles. We calculated the payments due under our operating lease obligation for our Israeli ofice that were paid in NIS at a rate of exchange of NIS 3.9 : $1.00, and the payments due under our operating lease obligation for our German subsidiary that were paid in euros at a rate of exchange of 0.9 Euro: $1:00, both of which were the applicable exchange rates as of December 31, 2015.
Off-Balance Sheet Arrangements
We had no off-balance sheet arrangements or guarantees of third-party obligations during the periods presented.
Trend Information
For information on significant known trends, please see Item 1. “Business - Overview” in this annual report.
Our results of operations and cash flows are affected by fluctuations due to changes in foreign currency exchange rates. In 2013, most of our revenues were denominated in U.S. dollars, approximately half of our expenses were denominated in U.S. dollars, and the remainder of our expenses were denominated in NIS and euros. In each of 2014 and 2015, most of our revenues were denominated in U.S. dollars and the remainder of our revenues was denominated in euros, most of our expenses were denominated in U.S. dollars and the remainder of our expenses was denominated in NIS and euros. Accordingly, changes in the value of the NIS and Euro relative to the U.S. dollar in each of 2013, 2014 and 2015 impacted amounts recorded on our consolidated
48
statements of operations for those periods. We expect that the denominations of our revenue and expenses in 2016 will be consistent with what we experienced in 2014 and 2015.
The following table presents information about the changes in the exchange rates of the NIS and Euro against the U.S. dollar in 2013, 2014 and 2015:
|
Change in Average Exchange Rate
|
||||||
|
Period
|
NIS against the
U.S. Dollar (%) |
Euro against the
U.S. Dollar (%) |
||||
|
2013
|
(6.4
|
)
|
(3.4
|
)
|
||
|
2014
|
(0.89
|
)
|
(0.01
|
)
|
||
|
2015
|
8.24
|
|
16.44
|
|
||
The figures above represent the change in the average exchange rate in the given period compared to the average exchange rate in the immediately preceding period. Negative figures represent depreciation of the U.S. dollar compared to the NIS or Euro. A 10% increase or decrease in the value of the NIS against the U.S. dollar would have decreased or increased our net loss by approximately $800,000 million in 2015. A 10% increase or decrease in the value of the Euro against the U.S. dollar would have decreased or increased our net loss by approximately $300,000 in 2015.
From time to time, we enter into limited hedging arrangements with financial institutions. We do not use derivative financial instruments for speculative or trading purposes.
Other Market Risks
We do not believe that we have material exposure to interest rate risks or to inflationary risks.
ITEM 8.
FINANCIAL STATEMENTS AND SUPPLEMENTARY DATA
The information required hereunder is set forth under Report of Independent Registered Public Accounting Firm, Consolidated Balance Sheets, Consolidated Statements of Operations, Statements of Changes in Shareholders’ Equity (Deficiency), Consolidated Statements of Cash Flows and Notes to Consolidated Financial Statements included in the Consolidated Financial Statements that are a part of this Report. Other financial information is included in the Consolidated Financial Statements that are a part of this Report.
.
None.
ITEM 9A.
CONTROLS AND PROCEDURES
Disclosure Controls and Procedures
We maintain disclosure controls and procedures that are designed to ensure that information required to be disclosed in
our Exchange Act reports is recorded, processed, summarized and reported within the time periods specified in the SEC’s rules
and forms, and that such information is accumulated and communicated to our management, including our Chief Executive Officer and Chief Financial Officer, as appropriate, to allow timely decisions regarding required financial disclosure.
As of the end of the period covered by this Report, we carried out an evaluation, under the supervision and with the participation of our management, including our Chief Executive Officer and Chief Financial Officer, of the effectiveness of the design and operation of our disclosure controls and procedures (as defined in Rule 13a-15(e) and Rule 15d-15(e) of the Exchange Act). Based upon, and as of the date of, this evaluation, the Chief Executive Officer and the Chief Financial Officer concluded that our disclosure controls and procedures were effective such that the information required to be disclosed by us in our SEC reports is recorded, processed, summarized and reported within the time periods specified in SEC rules and forms, and is accumulated and communicated to our management, including our Chief Executive Officer and Chief Financial Officer, as appropriate to allow timely decisions regarding required disclosure.
49
Management’s Report on Internal Control over Financial Reporting
Our management is responsible for establishing and maintaining adequate internal control over financial reporting, as defined in Rules 13a-15(f) and 15d-15(f) under the Exchange Act. Our internal control over financial reporting is a process designed to provide reasonable assurance regarding the reliability of financial reporting and the preparation of financial statements for external purposes in accordance with U.S. GAAP.
Our internal control over financial reporting includes those policies and procedures that:
|
•
|
pertain to the maintenance of records that, in reasonable detail, accurately and fairly reflect the transactions and dispositions of our assets;
|
|
•
|
provide reasonable assurance that transactions are recorded as necessary to permit preparation of financial statements in accordance with U.S. GAAP, and that our receipts and expenditures are being made only in accordance with authorizations of our management and directors; and
|
|
•
|
provide reasonable assurance regarding prevention or timely detection of unauthorized acquisition, use, or disposition of our assets that could have a material effect on our financial statements.
|
Management has assessed the effectiveness of our internal control over financial reporting as of December 31, 2015. In making its assessment, management used the criteria described in Internal Control — Integrated Framework (2013) issued by the Committee of Sponsoring Organizations of the Treadway Commission.
Based on management’s assessment, management has concluded that our internal control over financial reporting was effective as of December 31, 2015 to provide reasonable assurance regarding the reliability of financial reporting and the preparation of consolidated financial statements for external reporting purposes in accordance with U.S. GAAP.
This annual report does not include an attestation report of our independent registered public accounting firm regarding internal controls over financial reporting because the JOBS Act provides an exemption from such requirement as we qualify as an emerging growth company.
Changes in Internal Control over Financial Reporting
During the
fourth q
uarter of the fiscal year ended December 31, 2015, there were no changes in our internal control over financial reporting (as defined in Rules 13a-15(f) and 15d-15(f) of the Exchange Act) that materially affected, or that are reasonably likely to materially affect, our internal control over financial reporting.
ITEM 9B.
OTHER INFORMATION
Effective December 3, 2015, at the annual general meeting of shareholders, our shareholders adopted an amendment to Article 23 of our articles of association. This amendment replaces our previous quorum requirement with a quorum requirement that complies with NASDAQ rules applicable to domestic issuers. This amendment was adopted effective December 3, 2015, in preparation for our transition to becoming a domestic filer effective January 1, 2016.
This summary of the amendment is qualified in its entirety by reference to the complete copy of the amendment to the articles of association, a copy of which is attached as Exhibit 3.1 to this annual report on Form 10-K and is incorporated by reference herein
.
50
ITEM 10.
DIRECTORS, EXECUTIVE OFFICERS AND CORPORATE GOVERNANCE
Identification of Executive Officers
The following table sets forth the name, age and position of each of our executive officers as of February 1, 2016:
|
Name
|
Age
|
Position
|
||
|
Larry Jasinski
|
58
|
Chief Executive Officer and Director
|
||
|
Kevin Hershberger
|
51
|
Chief Financial Officer
|
||
|
Ofir Koren
|
46
|
Vice President, Research & Development
|
||
|
Jodi Gricci
|
48
|
Vice President, Global Marketing and Training
|
||
|
John Hamilton
|
62
|
Vice President, Regulatory and Clinical
|
||
_____________________________________________________
Larry Jasinski
has served as our Chief Executive Officer and as a member of our board since February 2012. From 2005 until 2012, Mr. Jasinski served as the President and Chief Executive Officer of Soteira, Inc., a company engaged in development and commercialization of products used to treat individuals with vertebral compression fractures, which was acquired by Globus Medical in 2012. From 2001 to 2005, Mr. Jasinski was President and Chief Executive Officer of Cortek, Inc., a company that developed next-generation treatments for degenerative disc disease, which was acquired by Alphatec in 2005. From 1985 until 2001, Mr. Jasinski served in multiple sales, research and development, and general management roles at Boston Scientific Corporation. Mr. Jasinski has served on the board of directors of Massachusetts Bay Lines since 2015 and of LeMaitre Vascular, Inc. since 2003. Mr. Jasinski holds a B.Sc. in marketing from Providence College and an MBA from the University of Bridgeport.
Kevin Hershberger
has served as our Chief Financial Officer since January 2015. From 2008 to 2014, Mr. Hershberger served as Vice President, Controller and Chief Accounting Officer at NxStage Medical Inc., a manufacturer of dialysis products. Prior to NxStage Mr. Hershberger served in multiple finance and management roles with Boston Scientific and USG Corporation. Mr. Hershberger holds a B.S. in accounting from West Virginia University.
Ofir Koren
has served as our Vice President, Research and Development since joining us in February 2013. From 2009 to 2013, Mr. Koren served as General Manager of RuggedCOM Israel, a developer of communications equipment. From 2007 to 2009, he served as the Vice President of Research and Development of Alvarion Technologies Ltd., an Israeli provider of wireless services. Mr. Koren holds a B.Sc. in electrical engineering from Tel Aviv University and an MBA from the University of Herriot Watt, Scotland.
Jodi Gricci
has served as our Vice President, Global Marketing and Training since June 2012. Prior to joining us, Ms. Gricci was the Managing Director of Soteira GmbH, a medical device company based in Berlin, Germany, from November 2008 to June 2012.
John Hamilton
has served as our Vice President, Regulatory and Clinical since he joined us in June 2012. From 2006 to 2012, he was Director, Regulatory at Soteira, Inc. Prior to that, he held a variety of management and engineering positions at Smith & Nephew, Tensegra and Johnson & Johnson. Mr. Hamilton holds a B.Sc. in chemistry from Canisius College and a M.Sc. in mechanical engineering from Northeastern University.
The remaining information required by this Item will be included in and is incorporated herein by reference from our definitive proxy statement for our 2016 Annual Meeting of Shareholders to be filed with the SEC pursuant to Regulation 14A within 120 days after the end of our 2015 fiscal year ended December 31, 2015, or our Proxy Statement.
ITEM 11.
EXECUTIVE COMPENSATION
The information required by this Item will be included in and is incorporated herein by reference from our Proxy Statement.
ITEM 12.
SECURITY OWNERSHIP OF CERTAIN BENEFICIAL OWNERS AND MANAGEMENT AND RELATED STOCKHOLDER MATTERS
The information required by this Item will be included in and is incorporated herein by reference from our Proxy Statement.
51
ITEM 13.
CERTAIN RELATIONSHIPS AND RELATED TRANSACTIONS, AND DIRECTOR INDEPENDENCE
The information required by this Item will be included in and is incorporated herein by reference from our Proxy Statement.
ITEM 14.
PRINCIPAL ACCOUNTING FEES AND SERVICES
The information required by this Item will be included in and is incorporated herein by reference from our Proxy Statement.
(a)(1) Financial Statements.
The Consolidated Financial Statements filed as part of this annual report are identified in the Index to Consolidated Financial Statements on page F-1 hereto.
(a)(2) Financial Statement Schedules.
Financial Statement Schedules have been omitted because the information required to be set forth therein is not applicable or is shown in the financial statements or notes thereto.
(a)(3) Exhibits.
See accompanying Exhibit Index included after the signature page of this report for a list of the exhibits filed or furnished with or incorporated by reference in this report.
52
SIGNATURES
Pursuant to the requirements of Section 13 or 15(d) of the Securities Exchange Act of 1934, the registrant has duly caused this report to be signed on its behalf by the undersigned, thereunto duly authorized.
|
ReWalk Robotics Ltd.
|
||
|
By:
|
/s/ Larry Jasinski
|
|
|
Larry Jasinski
|
||
|
Chief Executive Officer
|
||
Date: February 29, 2016
POWER OF ATTORNEY
KNOW ALL PERSONS BY THESE PRESENT: That the undersigned officers and directors of ReWalk Robotics Ltd. do hereby constitute and appoint Larry Jasinski and Kevin Hershberger the lawful attorney and agent with power and authority to do any and all acts and things and to execute any and all instruments which said attorney and agent determines may be necessary or advisable or required to enable ReWalk Robotics Ltd. to comply with the Securities and Exchange Act of 1934, as amended, and any rules or regulations or requirements of the Securities and Exchange Commission in connection with this report. Without limiting the generality of the foregoing power and authority, the powers granted include the power and authority to sign the names of the undersigned officers and directors in the capacities indicated below to this report or amendments or supplements thereto, and each of the undersigned hereby ratifies and confirms all that said attorneys and agents, or either of them, shall do or cause to be done by virtue hereof. This Power of Attorney may be signed in several counterparts.
53
Pursuant to the requirements of the Securities Exchange Act of 1934, this report has been signed by the following persons on behalf of the registrant and in the capacities and on the dates indicated.
|
Signature
|
Title
|
Date
|
||
|
/s/ Larry Jasinski
|
Director and Chief Executive Officer
(Principal Executive Officer)
|
February 29, 2016
|
||
|
Larry Jasinski
|
||||
|
/s/ Kevin Hershberger
|
Chief Financial Officer (Principal
Financial Officer and Principal Accounting Officer)
|
February 29, 2016
|
||
|
Kevin Hershberger
|
||||
|
/s/ Jeff Dykan
|
Chairman of the Board
|
February 29, 2016
|
||
|
Jeff Dykan
|
||||
|
/s/ Dr. John William Poduska
|
Director
|
February 29, 2016
|
||
|
Dr. John William Poduska
|
||||
|
/s/ Deborah DiSanzo
|
Director
|
February 29, 2016
|
||
|
Deborah DiSanzo
|
||||
|
/s/ Wayne B. Weisman
|
Director
|
February 29, 2016
|
||
|
Wayne B. Weisman
|
||||
|
/s/ Yasushi Ichiki
|
Director
|
February 29, 2016
|
||
|
Yasushi Ichiki
|
||||
|
/s/ Aryeh Dan
|
Director
|
February 29, 2016
|
||
|
Aryeh Dan
|
||||
|
/s/ Glenn Muir
|
Director
|
February 29, 2016
|
||
|
Glenn Muir
|
||||
|
/s/ Jay Kalish
|
Director
|
February 29, 2016
|
||
|
Jay Kalish
|
||||
54
EXHIBIT INDEX
|
Number
|
Description
|
|
|
3.1
|
Second Amended and Restated Articles of Association of the Company, as amended by the First Amendment thereto.
|
|
|
4.1
|
Specimen share certificate (incorporated by reference to Exhibit 4.1 to the Company's registration statement on Form F-1/A (File No. 333-197344), filed with the SEC on August 20, 2014).
|
|
|
4.2
|
Amended and Restated Shareholders’ Rights Agreement, dated July 14, 2014, among the Company and the other parties named therein (incorporated by reference to Exhibit 10.9 to the Company's registration statement on Form F-1/A (File No. 333-197344), filed with the SEC on July 16, 2014).
|
|
|
4.3
|
Fourth Amended and Restated Shareholders Agreement, dated July 14, 2014, among the Company and the shareholders party thereto (incorporated by reference to Exhibit 10.10 to the Company's registration statement on Form F-1/A (File No. 333-197344), filed with the SEC on July 16, 2014).
|
|
|
4.4
|
Form of Indenture relating to debt securities (incorporated by reference to Exhibit 4.1 to the Company's registration statement on Form F-3 (File No. 333-207219), filed with the SEC on October 1, 2015).
|
|
|
10.1
|
Letter of Agreement, dated July 11, 2013, between the Company and Sanmina Corporation (incorporated by reference to Exhibit 10.1 to the Company's registration statement on Form F-1 (File No. 333-197344), filed with the SEC on July 10, 2014).*
|
|
|
10.2
|
Strategic Alliance Agreement, dated September 24, 2013, between the Company and Yaskawa Electric Corporation (incorporated by reference to Exhibit 10.2 to the Company's registration statement on Form F-1 (File No. 333-197344), filed with the SEC on July 10, 2014).
|
|
|
10.3
|
Exclusive Distribution Agreement, dated September 24, 2013, between the Company and Yaskawa Electric Corporation (incorporated by reference to Exhibit 10.3 to the Company's registration statement on Form F-1 (File No. 333-197344), filed with the SEC on July 10, 2014).*
|
|
|
10.4
|
Confidentiality and Non-Disclosure Agreement, dated September 24, 2013, between the Company and Yaskawa Electric Corporation (incorporated by reference to Exhibit 10.4 to the Company's registration statement on Form F-1 (File No. 333-197344), filed with the SEC on July 10, 2014).
|
|
|
10.5
|
Side Letter, dated September 30, 2013, between the Company and Yaskawa Electric Corporation (incorporated by reference to Exhibit 10.5 to the Company's registration statement on Form F-1 (File No. 333-197344), filed with the SEC on July 10, 2014).
|
|
|
10.6
|
Series E Preferred Securities Purchase Agreement, dated June 26, 2014, among the Company and the parties named therein (incorporated by reference to Exhibit 10.7 to the Company's registration statement on Form F-1/A (File No. 333-197344), filed with the SEC on July 16, 2014).
|
|
|
10.7
|
Loan Agreement, dated December 30, 2015, between the Company and Kreos Capital V (Expert Fund) Limited (incorporated by reference to Exhibit 10.1 to the Company's Current Report on Form 8-K filed with the SEC on January 4, 2016).
|
|
|
10.8
|
Warrant, dated December 30, 2015, between the Company and Kreos Capital V (Expert Fund) Limited (incorporated by reference to Exhibit 10.2 to the Company's Current Report on Form 8-K filed with the SEC on January 4, 2016).
|
|
|
10.9
|
Form of indemnification agreement between the Company and each of its directors and executive officers (incorporated by reference to Exhibit 10.11 to the Company's registration statement on Form F-1/A (File No. 333-197344), filed with the SEC on August 20, 2014).
|
|
|
10.10
|
2012 Equity Incentive Plan (incorporated by reference to Exhibit 10.12 to the Company's registration statement on Form F-1 (File No. 333-197344), filed with the SEC on July 10, 2014). **
|
|
|
10.11
|
2012 Israeli Equity Incentive Sub Plan (incorporated by reference to Exhibit 10.13 to the Company's registration statement on Form F-1 (File No. 333-197344), filed with the SEC on July 10, 2014). **
|
|
|
10.12
|
2012 U.S. Equity Incentive Sub Plan (incorporated by reference to Exhibit 10.14 to the Company's registration statement on Form F-1 (File No. 333-197344), filed with the SEC on July 10, 2014). **
|
|
|
10.13
|
2006 Stock Option Plan (incorporated by reference to Exhibit 10.15 to the Company's registration statement on Form F-1 (File No. 333-197344), filed with the SEC on July 10, 2014). **
|
|
|
10.14
|
2014 Equity Incentive Plan (incorporated by reference to Exhibit 10.16 to the Company's registration statement on Form F-1/A (File No. 333-197344), filed with the SEC on August 20, 2014). **
|
|
|
10.15
|
Employment Agreement, dated as of December 17, 2014, between the Company and Kevin Hershberger.**
|
|
|
10.16
|
Executive Employment Agreement, dated as of January 17, 2011, between the Company and Larry Jasinski.**
|
|
|
10.17
|
Employment Agreement, dated of June 18, 2012, between the Company and John Hamilton.**
|
|
|
10.18
|
2014 Incentive Compensation Plan Form of Option Award Agreement.**
|
|
|
10.19
|
2014 Incentive Compensation Plan Form of Restricted Stock Unit Award Agreement for employees and executives.**
|
|
55
|
10.20
|
2014 Incentive Compensation Plan Form of Restricted Stock Unit Award Agreement for directors.**
|
|
|
10.21
|
ReWalk Robotics Ltd. Compensation Policy for Executive Officers and Non-Executive Directors (incorporated by reference to Exhibit A of Exhibit 99.1 of the Company's Current Report on Form 6-K, furnished to the SEC on November 10, 2014). **
|
|
|
21.1
|
List of subsidiaries of the Company (incorporated by reference to Exhibit 21.1 to the Company's registration statement on Form F-1 (File No. 333-197344), filed with the SEC on July 10, 2014).
|
|
|
23.1
|
Consent of Kost Forer Gabbay & Kasierer.
|
|
|
31.1
|
Certification of Principal Executive Officer pursuant to Section 302 of the Sarbanes-Oxley Act 2002.
|
|
|
31.2
|
Certification of Principal Financial Officer pursuant to Section 302 of the Sarbanes-Oxley Act 2002.
|
|
|
32.1
|
Certification of Principal Executive Officer pursuant to 18 U.S.C. Section 1350, as adopted pursuant to Section 906 of the Sarbanes-Oxley Act of 2002.***
|
|
|
32.2
|
Certification of Principal Financial Officer pursuant to 18 U.S.C. Section 1350, as adopted pursuant to Section 906 of the Sarbanes-Oxley Act of 2002.***
|
|
|
101.INS
|
XBRL Instance Document
|
|
|
101.SCH
|
XBRL Taxonomy Extension Schema Document
|
|
|
101.PRE
|
XBRL Taxonomy Presentation Linkbase Document
|
|
|
101.CAL
|
XBRL Taxonomy Calculation Linkbase Document
|
|
|
101.LAB
|
XBRL Taxonomy Label Linkbase Document
|
|
|
101.DEF
|
XBRL Taxonomy Extension Definition Linkbase Document
|
|
__________________________
|
*
|
Portions of the agreement were omitted and a complete copy of the agreement has been provided separately to the Securities and Exchange Commission pursuant to the Company’s application requesting confidential treatment under Rule 406 of the Securities Act of 1933, as amended.
|
|
**
|
Management contract or compensatory plan, contract or arrangement.
|
|
***
|
Furnished herewith.
|
56
REWALK ROBOTICS LTD
CONSOLIDATED FINANCIAL STATEMENTS
U.S. DOLLARS IN THOUSANDS
INDEX
F-1

|
Kost Forer Gabbay & Kasierer
3 Aminadav St.
Tel-Aviv 6706703, Israel
|
Tel: +972-3-6232525
Fax: +972-3-5622555
ey.com
|
REPORT OF INDEPENDENT REGISTERED PUBLIC ACCOUNTING FIRM
To the Board of Directors and Shareholders of
REWALK ROBOTICS LTD.
We have audited the accompanying consolidated balance sheets of ReWalk Robotics Ltd. and its subsidiaries (the “Company”) as of
December 31, 2015
, and
2014
, and the related consolidated statements of operations, changes in shareholders’ equity (deficiency) and cash flows for each of the three years in the period ended
December 31, 2015
. These financial statements are the responsibility of Company’s management. Our responsibility is to express an opinion on these financial statements based on our audits.
We conducted our audits in accordance with the standards of the Public Company Accounting Oversight Board (United States). Those standards require that we plan and perform the audit to obtain reasonable assurance about whether the financial statements are free of material misstatement. We were not engaged to perform an audit of the Company’s internal control over financial reporting. Our audits included consideration of internal control over financial reporting as a basis for designing audit procedures that are appropriate in the circumstances, but not for the purpose of expressing an opinion on the effectiveness of the Company’s internal control over financial reporting. Accordingly, we express no such opinion. An audit also includes examining, on a test basis, evidence supporting the amounts and disclosures in the financial statements, assessing the accounting principles used and significant estimates made by management, and evaluating the overall financial statement presentation. We believe that our audits provide a reasonable basis for our opinion.
In our opinion, the financial statements referred to above present fairly, in all material respects, the consolidated financial position of the Company and its subsidiaries at
December 31, 2015
and
2014
, and the consolidated results of their operations and their cash flows for each of the three years in the period ended
December 31, 2015
, in conformity with U.S. generally accepted accounting principles.
|
Tel-Aviv, Israel
|
/s/ KOST FORER GABBAY & KASIERER
|
|
February 29, 2016
|
KOST FORER GABBAY & KASIERER
|
|
|
A Member of Ernst & Young Global
|
F-2
REWALK ROBOTICS LTD. AND SUBSIDIARIES
U.S. dollars in thousands
|
|
December 31,
|
||||||
|
|
2015
|
2014
|
|||||
|
ASSETS
|
|
|
|||||
|
CURRENT ASSETS:
|
|
|
|||||
|
Cash and cash equivalents
|
$
|
17,869
|
|
$
|
41,829
|
|
|
|
Short-term deposit
|
—
|
|
1,667
|
|
|||
|
Trade receivable, net of allowance for doubtful accounts of $144 and $36, respectively
|
2,146
|
|
1,955
|
|
|||
|
Prepaid expenses and other current assets
|
1,227
|
|
756
|
|
|||
|
Inventories
|
2,534
|
|
777
|
|
|||
|
Total current assets
|
23,776
|
|
46,984
|
|
|||
|
LONG-TERM ASSETS
|
|
|
|
|
|||
|
Other long term assets
|
470
|
|
267
|
|
|||
|
Property and equipment, net
|
1,328
|
|
414
|
|
|||
|
Total long-term assets
|
1,798
|
|
681
|
|
|||
|
Total assets
|
$
|
25,574
|
|
$
|
47,665
|
|
|
The accompanying notes are an integral part of these consolidated financial statements.
F-3
REWALK ROBOTICS LTD. AND SUBSIDIARIES
CONSOLIDATED BALANCE SHEETS
U.S. dollars in thousands (except share and per share data)
|
|
December 31,
|
||||||
|
|
2015
|
2014
|
|||||
|
LIABILITIES AND SHAREHOLDERS’ EQUITY
|
|
|
|||||
|
CURRENT LIABILITIES:
|
|
|
|||||
|
Trade payables
|
$
|
2,474
|
|
$
|
1,390
|
|
|
|
Employees and payroll accruals
|
1,221
|
|
872
|
|
|||
|
Deferred revenues and customers advances
|
199
|
|
77
|
|
|||
|
Other current liabilities
|
449
|
|
769
|
|
|||
|
Other liabilities related to settlement of BIRD Foundation grants (see Note 8c)
|
—
|
|
466
|
|
|||
|
Total current liabilities
|
4,343
|
|
3,574
|
|
|||
|
LONG-TERM LIABILITIES
|
|
|
|
|
|||
|
Deferred revenues
|
171
|
|
172
|
|
|||
|
Other long-term liabilities
|
140
|
|
66
|
|
|||
|
Total long-term liabilities
|
311
|
|
238
|
|
|||
|
Total liabilities
|
4,654
|
|
3,812
|
|
|||
|
COMMITMENTS AND CONTINGENT LIABILITIES
|
|
|
|
|
|||
|
Shareholders’ equity:
|
|
|
|
|
|||
|
Share capital
|
|
|
|
|
|||
|
Ordinary share of NIS 0.01 par value-Authorized: 250,000,000 shares at December 31, 2015 and 2014; Issued and outstanding: 12,222,583 and 11,978,554 shares at December 31, 2015 and 2014, respectively
|
33
|
|
32
|
|
|||
|
Additional paid-in capital
|
94,876
|
|
92,395
|
|
|||
|
Accumulated deficit
|
(73,989
|
)
|
(48,574
|
)
|
|||
|
Total shareholders’ equity
|
20,920
|
|
43,853
|
|
|||
|
Total liabilities and shareholders’ equity
|
$
|
25,574
|
|
$
|
47,665
|
|
|
The accompanying notes are an integral part of these consolidated financial statements.
F-4
REWALK ROBOTICS LTD. AND SUBSIDIARIES
CONSOLIDATED STATEMENTS OF OPERATIONS
U.S. dollars in thousands (except share and per share data)
|
|
Year ended
December 31
|
||||||||||
|
|
2015
|
2014
|
2013
|
||||||||
|
Revenues
|
$
|
3,746
|
|
$
|
3,951
|
|
$
|
1,588
|
|
||
|
Cost of revenues
|
3,532
|
|
4,106
|
|
2,017
|
|
|||||
|
Expense related to settlement of BIRD Foundation grants (see Note 8c)
|
—
|
|
466
|
|
—
|
|
|||||
|
Gross profit (loss)
|
214
|
|
(621
|
)
|
(429
|
)
|
|||||
|
Operating expenses:
|
|
|
|
|
|
|
|||||
|
Research and development, net
|
5,937
|
|
8,563
|
|
2,463
|
|
|||||
|
Sales and marketing, net
|
13,056
|
|
7,389
|
|
4,091
|
|
|||||
|
General and administration
|
6,395
|
|
3,352
|
|
1,762
|
|
|||||
|
Total operating expenses
|
25,388
|
|
19,304
|
|
8,316
|
|
|||||
|
Operating loss
|
(25,174
|
)
|
(19,925
|
)
|
(8,745
|
)
|
|||||
|
Financial expenses, net
|
188
|
|
1,698
|
|
3,410
|
|
|||||
|
Loss before income taxes
|
(25,362
|
)
|
(21,623
|
)
|
(12,155
|
)
|
|||||
|
Income taxes
|
53
|
|
45
|
|
22
|
|
|||||
|
Net loss
|
$
|
(25,415
|
)
|
$
|
(21,668
|
)
|
$
|
(12,177
|
)
|
||
|
Net loss per ordinary share, basic and diluted
|
$
|
(2.10
|
)
|
$
|
(6.34
|
)
|
$
|
(74.53
|
)
|
||
|
Weighted average number of shares used in computing net loss per ordinary share, basic and diluted
|
12,115,038
|
|
3,766,694
|
|
185,688
|
|
|||||
The accompanying notes are an integral part of these consolidated financial statements.
F-5
;
REWALK ROBOTICS LTD. AND SUBSIDIARIES
STATEMENTS OF CHANGES IN SHAREHOLDERS’ EQUITY (DEFICIENCY)
U.S. dollars in thousands (except share data)
|
|
Convertible
Preferred Shares
(1)(3)
|
Ordinary Share
(2)(3)
|
Additional
paid-in
capital
|
Accumulated
deficit
|
Total
shareholders’
equity
(deficiency)
|
||||||||||||||||||
|
|
Number
|
Amount
|
Number
|
Amount
|
|||||||||||||||||||
|
Balance as of January 1, 2013
|
161,718
|
|
*)
|
|
185,688
|
|
*)
|
|
$
|
12,465
|
|
$
|
(14,729
|
)
|
$
|
(2,264
|
)
|
||||||
|
Conversion of convertible loans into Series D convertible preferred share
|
81,677
|
|
*)
|
|
—
|
|
—
|
|
9,896
|
|
—
|
|
9,896
|
|
|||||||||
|
Issuance of Series D convertible preferred share, net of issuance expense in an amount of $204
|
84,008
|
|
*)
|
|
—
|
|
—
|
|
9,961
|
|
—
|
|
9,961
|
|
|||||||||
|
Share-based compensation to employees and non-employees
|
—
|
|
—
|
|
—
|
|
—
|
|
215
|
|
—
|
|
215
|
|
|||||||||
|
Net loss
|
—
|
|
—
|
|
—
|
|
—
|
|
—
|
|
(12,177
|
)
|
(12,177
|
)
|
|||||||||
|
Balance as of December 31, 2013
|
327,403
|
|
*)
|
|
185,688
|
|
*)
|
|
32,537
|
|
(26,906
|
)
|
5,631
|
|
|||||||||
|
Exercise of warrants into Series C Convertible preferred Shares
|
17,705
|
|
*)
|
|
—
|
|
—
|
|
3,825
|
|
—
|
|
3,825
|
|
|||||||||
|
Exercise of warrants into Series D Convertible preferred Shares
|
263
|
|
*)
|
|
—
|
|
—
|
|
57
|
|
—
|
|
57
|
|
|||||||||
|
Issuance of Series D convertible preferred shares
|
4,131
|
|
*)
|
|
—
|
|
—
|
|
1,114
|
|
—
|
|
1,114
|
|
|||||||||
|
Issuance of Series E convertible preferred shares, net of issuance expense in an amount of $212
|
75,695
|
|
*)
|
|
—
|
|
—
|
|
7,895
|
|
—
|
|
7,895
|
|
|||||||||
|
Conversion of convertible preferred shares into ordinary shares
|
(425,197
|
)
|
*)
|
|
7,838,640
|
|
22
|
|
(22
|
)
|
—
|
|
—
|
|
|||||||||
|
Balance as of
Reclassification of liability warrants to equity warrants |
—
|
|
—
|
|
—
|
|
—
|
|
5,555
|
|
—
|
|
5,555
|
|
|||||||||
|
Issuance of ordinary shares in IPO, net
of issuance expenses in an amount of $5,138 |
—
|
|
—
|
|
3,450,000
|
|
9
|
|
36,254
|
|
—
|
|
36,263
|
|
|||||||||
|
Exercise of warrants into ordinary shares
|
—
|
|
—
|
|
157,618
|
|
—
|
|
—
|
|
—
|
|
—
|
|
|||||||||
|
Share-based compensation to employees and non employees
|
—
|
|
—
|
|
—
|
|
—
|
|
5,179
|
|
—
|
|
5,179
|
|
|||||||||
|
Issuance of ordinary share upon exercise of stock options by employees
|
—
|
|
—
|
|
346,608
|
|
1
|
|
1
|
|
—
|
|
2
|
|
|||||||||
|
Net loss
|
—
|
|
—
|
|
—
|
|
—
|
|
—
|
|
(21,668
|
)
|
(21,668
|
)
|
|||||||||
|
Balance as of December 31, 2014
|
—
|
|
—
|
|
11,978,554
|
|
32
|
|
92,395
|
|
(48,574
|
)
|
43,853
|
|
|||||||||
|
Share-based compensation to employees and non employees
|
—
|
|
—
|
|
—
|
|
—
|
|
2,345
|
|
—
|
|
2,345
|
|
|||||||||
|
Issuance of ordinary share upon exercise of stock options and RSUs by employees and non employees
|
—
|
|
—
|
|
194,345
|
|
1
|
|
136
|
|
—
|
|
137
|
|
|||||||||
|
Cashless exercise of warrants into ordinary shares
|
—
|
|
—
|
|
49,684
|
|
*)
|
|
*)
|
|
—
|
|
—
|
|
|||||||||
|
Net loss
|
—
|
|
—
|
|
—
|
|
—
|
|
—
|
|
(25,415
|
)
|
(25,415
|
)
|
|||||||||
|
Balance as of December 31, 2015
|
—
|
|
—
|
|
12,222,583
|
|
33
|
|
94,876
|
|
(73,989
|
)
|
20,920
|
|
|||||||||
|
*)
|
Represents an amount lower than $1.
|
|
(1)
|
The convertible preferred shares consist of several series, see Note 10b.
|
|
(2)
|
The ordinary shares consist of
two
series, see note 10b.
|
|
(3)
|
All shares amount have been restated to reflect an
18
-for-1 share split, see Note 10a.
|
The accompanying notes are an integral part of these consolidated financial statements.
F-6
REWALK ROBOTICS LTD. AND SUBSIDIARIES
U.S. dollars in thousands
|
|
Year ended
December 31
|
||||||||||
|
|
2015
|
2014
|
2013
|
||||||||
|
Cash flows from operating activities:
|
|
|
|
||||||||
|
Net loss
|
$
|
(25,415
|
)
|
$
|
(21,668
|
)
|
$
|
(12,177
|
)
|
||
|
Adjustments to reconcile net loss to net cash used in operating activities:
|
|
|
|
|
|
|
|||||
|
Depreciation
|
438
|
|
111
|
|
92
|
|
|||||
|
Share-based compensation to employees and non employees
|
2,345
|
|
5,179
|
|
215
|
|
|||||
|
Deferred taxes
|
(61
|
)
|
(60
|
)
|
16
|
|
|||||
|
Financial expenses related to convertible loans
|
—
|
|
—
|
|
2,166
|
|
|||||
|
Revaluation of fair value of warrants to purchase convertible preferred share
|
—
|
|
(776
|
)
|
1,111
|
|
|||||
|
Issuance of Warrants to venture lending
|
—
|
|
835
|
|
—
|
|
|||||
|
Issuance of Warrants to service provider
|
—
|
|
73
|
|
—
|
|
|||||
|
Financial expenses resulted from Issuance of Series D preferred shares to related party
|
—
|
|
1,114
|
|
—
|
|
|||||
|
Changes in assets and liabilities:
|
|
|
|
|
|
|
|||||
|
Trade receivables, net
|
(191
|
)
|
(1,651
|
)
|
(70
|
)
|
|||||
|
Prepaid expenses and other current assets
|
(613
|
)
|
(440
|
)
|
(305
|
)
|
|||||
|
Inventories
|
(2,525
|
)
|
196
|
|
(413
|
)
|
|||||
|
Trade payables
|
1,084
|
|
445
|
|
10
|
|
|||||
|
Employees and payroll accruals
|
349
|
|
308
|
|
269
|
|
|||||
|
Deferred revenues and advances from customers
|
121
|
|
(72
|
)
|
272
|
|
|||||
|
Other liabilities
|
(712
|
)
|
1,105
|
|
2
|
|
|||||
|
Severance pay, net
|
—
|
|
(18
|
)
|
12
|
|
|||||
|
Net cash used in operating activities
|
(25,180
|
)
|
(15,319
|
)
|
(8,800
|
)
|
|||||
|
Cash flows from investing activities:
|
|
|
|
|
|
|
|||||
|
Change in long-term deposits
|
—
|
|
—
|
|
7
|
|
|||||
|
Investment in short-term deposits
|
—
|
|
(10,000
|
)
|
—
|
|
|||||
|
Maturities of short-term deposits
|
1,667
|
|
8,333
|
|
—
|
|
|||||
|
Purchase of property and equipment
|
(584
|
)
|
(169
|
)
|
(187
|
)
|
|||||
|
Net cash provided by (used in) investing activities
|
1,083
|
|
(1,836
|
)
|
(180
|
)
|
|||||
|
Cash flows from financing activities:
|
|
|
|
|
|
|
|||||
|
Issuance of convertible loans
|
—
|
|
—
|
|
7,048
|
|
|||||
|
Issuance of ordinary share upon exercise of stock options by employees and non employees
|
137
|
|
2
|
|
—
|
|
|||||
|
Issuance of Series D convertible preferred share, net
|
—
|
|
—
|
|
10,023
|
|
|||||
|
Issuance of Series E convertible preferred shares, including warrants, net
|
—
|
|
12,781
|
|
—
|
|
|||||
|
Exercise of warrants into Series C and D to convertible preferred shares
|
—
|
|
1,078
|
|
—
|
|
|||||
F-7
|
REWALK ROBOTICS LTD. AND SUBSIDIARIES
CONSOLIDATED STATEMENTS OF CASH FLOWS U.S. dollars in thousands |
|||||||||||
|
Year ended
December 31
|
|||||||||||
|
2015
|
2014
|
2013
|
|||||||||
|
Issuance of ordinary shares in IPO, net of issuance expenses in an amount of $5,138
|
—
|
|
36,263
|
|
—
|
|
|||||
|
Net cash provided by financing activities
|
137
|
|
50,124
|
|
17,071
|
|
|||||
|
Increase (decrease) in cash and cash equivalents
|
(23,960
|
)
|
32,969
|
|
8,091
|
|
|||||
|
Cash and cash equivalents at beginning of period
|
41,829
|
|
8,860
|
|
769
|
|
|||||
|
Cash and cash equivalents at end of period
|
$
|
17,869
|
|
$
|
41,829
|
|
$
|
8,860
|
|
||
|
Supplemental disclosures of non-cash flow information
|
|
|
|
|
|
|
|||||
|
Conversion of convertible loan into Series D convertible preferred share
|
$
|
—
|
|
$
|
—
|
|
$
|
9,896
|
|
||
|
Warrants to purchase Series D convertible preferred share issued to service provider
|
$
|
—
|
|
$
|
—
|
|
$
|
62
|
|
||
|
Exercise of warrants to purchase preferred shares into Series C and D preferred shares
|
$
|
—
|
|
$
|
2,804
|
|
$
|
—
|
|
||
|
Reclassification of liability warrants to equity warrants
|
$
|
—
|
|
$
|
5,555
|
|
$
|
—
|
|
||
|
Classification of inventory to property and equipment, net
|
$
|
768
|
|
$
|
—
|
|
$
|
—
|
|
||
|
Supplemental disclosures of cash flow information:
|
|||||||||||
|
Cash paid for income taxes
|
$
|
163
|
|
$
|
—
|
|
$
|
123
|
|
||
The accompanying notes are an integral part of these consolidated financial statements.
F-8
REWALK ROBOTICS LTD. AND SUBSIDIARIES
NOTES TO CONSOLIDATED FINANCIAL STATEMENTS
(U.S. dollars in thousands, except share and per share data)
|
a.
|
ReWalk Robotics Ltd. (“RRL”, and together with its subsidiaries, the “Company”) was incorporated under the laws of the State of Israel on June 20, 2001 and commenced operations on the same date.
|
|
b.
|
RRL has
two
wholly-owned subsidiaries: (i) ReWalk Robotics Inc. (“RRI”) incorporated under the laws of Delaware on February 15, 2012 and (ii) Argo Medical Technologies GmbH (“AMG”) incorporated under the laws of Germany on January 14, 2013.
|
|
c.
|
The Company is designing, developing and commercializing the ReWalk system, an innovative exoskeleton that allow wheelchair-bound persons with mobility impairments or other medical conditions to stand and walk once again. The ReWalk system consists of a light wearable brace support suit which integrates motors at the joints, rechargeable batteries, an array of sensors and a computer-based control system to power knee and hip movement. There are currently
two
types of products: ReWalk Personal and ReWalk Rehabilitation. ReWalk Personal is designed for everyday use by individuals at home and in their communities, and is custom fitted for each user. ReWalk Rehabilitation is designed for the clinical rehabilitation environment where it provides valuable exercise and therapy. It also enables individuals to evaluate their capacity for using ReWalk Personal system in the future.
|
|
d.
|
The Company markets and sells its products directly to institutions and individuals and through third-party distributors. The Company sells its products directly primarily in Germany and the United States, and primarily through distributors in other markets. In its direct markets, the Company has established relationships with rehabilitation centers and the spinal cord injury community, and in its indirect markets, the Company’s distributors maintain these relationships. RRI markets and sells products mainly in the United States and Canada. AMG sell the Company’s products mainly in Germany and Europe.
|
|
e.
|
In September 2014, the Company completed its Initial Public Offering ("IPO") in which the Company issued and sold
|
3,000,000
ordinary shares at a public offering price of
$12.00
per share and the underwriters exercised their option to purchase an additional
450,000
ordinary shares at the same price per share. The total net proceeds received from the IPO were
$36.3 million
after deducting underwriting discounts and commissions of
$2.7 million
and other offering expenses of
$2.5 million
(refer also to Note 10c).
|
f.
|
The Company depends on
one
contract manufacturer. Reliance on this vendor makes the Company vulnerable to possible capacity constraints and reduced control over component availability, delivery schedules, manufacturing yields and costs. This vendor account for
24%
and
12%
of the Company's total trade payables as of
December 31, 2015
and
2014
, respectively.
|
|
g.
|
The Company has incurred losses in the amount of
$25,415
during the year ended
December 31, 2015
. The Company has an accumulated deficit in the total amount of
$73,989
as of
December 31, 2015
and negative cash flow from operating activity is in the amount of
$25,180
for the year then ended. The Company has sufficient funds to support its operations in
2016
. See note 7 regarding loan received in January 2016.
|
F-9
REWALK ROBOTICS LTD. AND SUBSIDIARIES
NOTES TO CONSOLIDATED FINANCIAL STATEMENTS
(U.S. dollars in thousands, except share and per share data)
The consolidated financial statements are prepared according to United States generally accepted accounting principles (“U.S. GAAP”), applied on a consistent basis, as follows:
|
a.
|
Use of Estimates
|
The preparation of the consolidated financial statements in conformity with U.S. generally accepted accounting principles requires management to make estimates, judgments and assumptions. The Company’s management believes that the estimates, judgments and assumptions used are reasonable based upon information available at the time they are made. These estimates, judgments and assumptions can affect the reported amounts of assets and liabilities and disclosure of contingent assets and liabilities at the dates of the financial statements, and the reported amounts of revenues and expenses during the reporting period. Actual results could differ from those estimates. On an ongoing basis, the Company’s management evaluates estimates, including those related to inventories, fair values of share-based awards and warrants, contingent liabilities, provision for warranty, allowance for doubtful account and sales return reserve. Such estimates are based on historical experience and on various other assumptions that are believed to be reasonable, the results of which form the basis for making judgments about the carrying values of assets and liabilities.
|
b.
|
Financial Statements in U.S. Dollars:
|
Most of the revenues and costs of the Company are denominated in United States dollars (“dollars”). Some of the Company’s and its subsidiaries’ revenues and costs are incurred in Euros and New Israeli Shekels (“NIS”). however, the selling prices are linked to the Company’s price list which is determined in dollars, the budget is managed in dollars, financing activities including loans and cash investments, are made in U.S. dollars and the Company’s management believes that the dollar is the primary currency of the economic environment in which the Company and each of its subsidiaries operate. Thus, the dollar is the Company’s and its subsidiaries’ functional and reporting currency.
Accordingly, transactions denominated in currencies other than the functional currency are re-measured to the functional currency in accordance with Accounting Standards Codification (“ASC”) No. 830, “Foreign Currency Matters” at the exchange rate at the date of the transaction or the average exchange rate in the relevant reporting period. At the end of each reporting period, financial assets and liabilities are re-measured to the functional currency using exchange rates in effect at the balance sheet date. Non-financial assets and liabilities are re-measured at historical exchange rates. Gains and losses related to re-measurement are recorded as financial income (expense) in the consolidated statements of operations as appropriate.
|
c.
|
Principles of Consolidation:
|
The consolidated financial statements include the accounts of the Company and its wholly-owned subsidiaries, RRI and AMG. All intercompany transactions and balances have been eliminated upon consolidation.
|
d.
|
Cash Equivalents:
|
Cash equivalents are short-term highly liquid investments that are readily convertible to cash with original maturities of three months or less, at the date acquired.
|
e.
|
Short term deposits:
|
Short term bank deposits are deposits with original maturities of more than three months but less than one year from the balance sheet date.
F-10
REWALK ROBOTICS LTD. AND SUBSIDIARIES
NOTES TO CONSOLIDATED FINANCIAL STATEMENTS
(U.S. dollars in thousands, except share and per share data)
|
f.
|
Inventories:
|
Inventories are stated at the lower of cost or market value. Inventory reserves are provided to cover risks arising from slow-moving items or technological obsolescence.
The Company periodically evaluates the quantities on hand relative to historical, current and projected sales volume. Based on this evaluation, an impairment charge is recorded when required to write-down inventory to its market value.
Cost is determined as follows:
Raw materials, auxiliary materials and spare parts - on the basis of raw materials cost on “first in, first out” basis.
Finished products - on the basis of raw materials and manufacturing costs on an average basis.
The Company regularly evaluates the ability to realize the value of inventory based on a combination of factors, including historical usage rates and forecasted sales according to outstanding backlogs. Purchasing requirements and alternative usage are explored within these processes to mitigate inventory exposure. When recorded, the reserves are intended to reduce the carrying value of inventory to its net realizable value. In the years ended
December 31, 2015
,
2014
and
2013
, the Company wrote off inventory in the amount of
$127
,
$76
and
$88
, respectively. If actual demand for the Company’s products deteriorates, or market conditions are less favorable than those projected, additional inventory reserves may be required.
|
g.
|
Related party:
|
The Company has a substantial shareholder named Yaskawa Electric Corporation (“YEC”).
In September 2013 the Company entered into a share purchase agreement (see Note 10e) and a strategic alliance with YEC, pursuant to which YEC has agreed to distribute the Company’s products, in addition to providing sales, marketing, service and training functions, in Japan, China (including Hong-Kong and Macau), Taiwan, South Korea, Singapore and Thailand.
As of
December 31, 2015
and
2014
related party receivable in the amount of
$242
and
$215
, respectively, were included in trade receivable, net. Revenues from YEC during the years ended
December 31, 2015
,
2014
and
2013
amounted to
$246
,
$394
and
$88
, respectively.
|
h.
|
Property and Equipment:
|
Property and equipment are stated at cost, net of accumulated depreciation. Depreciation is calculated using the straight-line method over the estimated useful lives of the assets at the following annual rates:
|
|
%
|
|
Computer equipment
|
20-33 (mainly 33)
|
|
Office furniture and equipment
|
6 - 10 (mainly 10)
|
|
Machinery and laboratory equipment
|
15
|
|
Field service units
|
50
|
|
Leasehold improvements
|
Over the shorter of the lease
term or estimated useful life |
F-11
REWALK ROBOTICS LTD. AND SUBSIDIARIES
NOTES TO CONSOLIDATED FINANCIAL STATEMENTS
(U.S. dollars in thousands, except share and per share data)
|
i.
|
Impairment of Long-Lived Assets:
|
The Company’s long-lived assets are reviewed for impairment in accordance with ASC No. 360, “Property, Plant and Equipment” whenever events or changes in circumstances indicate that the carrying amount of an asset (or asset group) may not be recoverable. Recoverability of assets (or asset group) to be held and used is measured by a comparison of the carrying amount of an asset to the future undiscounted cash flows expected to be generated by the assets. If such assets are considered to be impaired, the impairment to be recognized is measured by the amount by which the carrying amount of the assets exceeds the fair value of the assets. During the years ended
December 31, 2015
,
2014
and
2013
,
no
impairment losses have been recorded.
|
j.
|
Other long term assets:
|
Other long term assets include long-term prepaid expenses and deposits for office and cars leasing.
|
k.
|
Revenue Recognition:
|
The Company and its subsidiaries generate revenues from sales of products. The Company and its subsidiaries sell their products through a direct sales force and through distributors.
Revenues are recognized in accordance with ASC No. 605, “Revenue Recognition” (“ASC 605”), when delivery has occurred, persuasive evidence of an agreement exists, the fee is fixed and determinable, collectability is reasonably assured and no further obligations exist. Provisions are made at the time of revenue recognition for any applicable warranty cost expected to be incurred.
The timing for revenue recognition amongst the various products and customers is dependent upon satisfaction of such criteria and generally varies from either shipment or delivery to the customer depending on the specific shipping terms of a given transaction, as stipulated in the agreement with each customer.
Other than pricing terms which may differ due to the different volumes of purchases between distributors and end-users, there are no material differences in the terms and arrangements involving direct and indirect customers.
The Company’s products sold through agreements with distributors are non-exchangeable, non-refundable, non-returnable and without any rights of price protection or share rotation. Accordingly, the Company considers all the distributors to be end-users.
The Company generally does not grant a right of return for its products.
There have been a few occasions in which the Company experienced a return of its products. Therefore, the Company records reductions to revenue for expected future product returns based on the Company’s historical experience.
For systems sold to rehabilitation facilities the Company includes training and considers the elements in the arrangement to be a single unit of accounting. In accordance with ASC 605, the Company has concluded that the training is essential to the functionality of the Company’s systems. Therefore the Company recognizes revenue for the system and training only after delivery in accordance with the agreement delivery terms to the customer and after the training has been completed, once all other revenue recognition criteria have been met.
For sales of Personal systems to end users, and for sales of Personal or Rehabilitation systems to third party distributors, the Company does not provide training to the end user as this training is completed by the Rehabilitation centers or by the distributor that have previously completed the ReWalk Training program. Therefore the Company recognizes revenue in such sales upon delivery, assuming the other conditions for revenue recognition have been met.
In certain cases, when product arrangements are bundled with extended warranty, the separation of the extended warranty falls under the scope of ASC 605-20-25-1 through 25-6, and the separately price of the extended warranty stated in the agreement is deferred and recognized ratably over the extended warranty period.
Deferred revenue includes primarily unearned amounts received in respect of service contracts but not yet recognized as revenues.
F-12
REWALK ROBOTICS LTD. AND SUBSIDIARIES
NOTES TO CONSOLIDATED FINANCIAL STATEMENTS
(U.S. dollars in thousands, except share and per share data)
|
l.
|
Accounting for Share-Based Compensation:
|
The Company accounts for share-based compensation in accordance with ASC No. 718, “Compensation-Stock Compensation” (“ASC No. 718”). ASC No. 718 requires companies to estimate the fair value of equity-based payment awards on the date of grant using an Option-Pricing Model (“OPM”). The value of the portion of the award that is ultimately expected to vest is recognized as an expense over the requisite service periods in the Company’s consolidated statements of operations.
The Company recognizes compensation expenses for the value of its awards granted based on the straight-line method over the requisite service period of each of the awards, net of estimated forfeitures. ASC No. 718 requires forfeitures to be estimated at the time of grant and revised, if necessary, in subsequent periods if actual forfeitures differ from those estimates. Estimated forfeitures are based on actual historical pre-vesting forfeitures.
The Company selected the Black-Scholes-Merton option pricing model as the most appropriate fair value method for its share-option awards. The option-pricing model requires a number of assumptions, of which the most significant are the fair market value of the underlying ordinary share, expected share price volatility and the expected option term. Expected volatility was calculated based upon certain peer companies that the Company considered to be comparable. The expected option term represents the period of time that options granted are expected to be outstanding. The expected option term is determined based on the simplified method in accordance with Staff Accounting Bulletin No. 110, as adequate historical experience is not available to provide a reasonable estimate. The simplified method will continue to apply until enough historical experience is available to provide a reasonable estimate of the expected term. The risk-free interest rate is based on the yield from U.S. treasury bonds with an equivalent term. The Company has historically not paid dividends and has no foreseeable plans to pay dividends.
The fair value of the ordinary shares underlying the share options has historically been determined by the Company’s board of directors. As prior to the Company’s IPO, there had been no public market for the Company’s ordinary shares, the board of directors determined fair value of the ordinary shares at the time of grant of the option by considering a number of objective and subjective factors including data from other comparable companies, sales of ordinary shares and convertible preferred share to unrelated third parties, operating and financial performance, the lack of liquidity of capital share and general and industry specific economic outlook, among other factors.
Since the distributions and participation rights to security holders are different in a sale/liquidation scenario versus an IPO, the valuation of the Company was performed using a weighted average of the values derived from the following scenarios: 1) discounted cash flow (DCF) model, and the OPM method was then employed to allocate the enterprise value amongst the Company’s various equity classes, deriving a fully marketable value per share for the ordinary share; 2) IPO scenario; and 3) Implied value approach. Before the per share value was determined, a discount for lack of marketability and a voting right differential was applied, as applicable, to the ordinary shares and the founders shares.
Following the IPO in September 2014, the fair value of ordinary shares is observable as they are publicly traded.
The fair value of Restricted Stock Units (RSUs) granted is determined based on the price of the Company's ordinary shares on the date of grant.
The fair value for options granted in
2015
,
2014
and
2013
is estimated at the date of grant using a Black-Scholes-Merton option pricing model with the following assumptions:
|
|
December 31,
|
||||
|
|
2015
|
2014
|
2013
|
||
|
Expected volatility
|
60%
|
60%-70%
|
70%-75%
|
||
|
Risk-free rate
|
1.60%-1.95%
|
1.74%-1.95%
|
0.95%-2.08%
|
||
|
Dividend yield
|
—%
|
—%
|
—%
|
||
|
Expected term (in years)
|
5.73 - 6.11
|
5.81 - 6.11
|
6.02 - 6.08
|
||
|
Share price
|
$7.30 - $20.97
|
$1.49 - $20.77
|
$3.62 - $5.80
|
||
F-13
REWALK ROBOTICS LTD. AND SUBSIDIARIES
NOTES TO CONSOLIDATED FINANCIAL STATEMENTS
(U.S. dollars in thousands, except share and per share data)
The Company accounts for options granted to consultants and other service providers under ASC No. 718 and ASC No. 505, “Equity-based payments to non-employees.” The fair value of these options was estimated using a Black-Scholes-Merton option-pricing model. In
2015
,
2014
and
2013
the non-cash compensation expenses related to nonemployees were immaterial.
The non-cash compensation expenses related to employees and non employees for the years ended
December 31, 2015
,
2014
and
2013
amounted to
$2,345
,
$5,179
and
$215
, respectively.
|
m.
|
Research and Development Costs:
|
Research and development costs are charged to the consolidated statement of operations as incurred and are presented net of the amount of any grants we receive for research and development in the period in which we receive the grant.
|
n.
|
Income Taxes
|
The Company accounts for income taxes in accordance with ASC No. 740, “Income Taxes” (“ASC No. 740”), using the liability method whereby deferred tax assets and liability account balances are determined based on the differences between financial reporting and the tax basis for assets and liabilities and are measured using the enacted tax rates and laws that will be in effect when the differences are expected to reverse. The Company provides a valuation allowance, if necessary, to reduce deferred tax assets to the amounts that are more likely-than-not to be realized.
ASC No. 740 contains a two-step approach to recognizing and measuring a liability for uncertain tax positions. The first step is to evaluate the tax position taken or expected to be taken in a tax return by determining if the weight of available evidence indicates that it is more likely than not that, on an evaluation of the technical merits, the tax position will be sustained on audit, including resolution of any related appeals or litigation processes. The second step is to measure the tax benefit as the largest amount that is more than 50% likely to be realized upon ultimate settlement. The Company accrues interest and penalties related to unrecognized tax benefits in its taxes on income.
|
o.
|
Warranty:
|
The Company provides a
two
-year standard warranty for its products. The Company records a provision for the estimated cost to repair or replace products under warranty at the time of sale. Factors that affect the Company’s warranty reserve include the number of units sold, historical and anticipated rates of warranty repairs and the cost per repair.
The Company periodically assesses the adequacy of its recorded warranty liabilities and adjusts the amounts as necessary.
As of
December 31, 2015
and
2014
, the provision for warranty amounted to
$502
and
$387
, respectively, and was presented under other liabilities and long-term liabilities.
|
p.
|
Concentrations of Credit Risks:
|
Financial instruments that potentially subject the Company to concentrations of credit risk consist principally of cash, cash equivalents and trade receivables.
The Company’s cash and cash equivalents are deposited in major banks in Israel, the United States and Germany. Such deposits in the United States may be in excess of insured limits and are not insured in other jurisdictions. The Company maintains cash and cash equivalents with diverse financial institutions and monitors the amount of credit exposure to each financial institution.
The Company’s trade receivables are geographically diversified and derived primarily from sales to customers in various countries, mainly in the United States and Europe. Concentration of credit risk with respect to trade receivables is limited by credit limits, ongoing credit evaluation and account monitoring procedures. The Company performs ongoing credit evaluations of its distributors based upon a specific review of all significant outstanding invoices. The Company writes off receivables when they are deemed uncollectible and having exhausted all collection efforts. As of
December 31, 2015
and
2014
trade receivables are presented net of
$144
and
$36
allowance for doubtful accounts, respectively.
F-14
REWALK ROBOTICS LTD. AND SUBSIDIARIES
NOTES TO CONSOLIDATED FINANCIAL STATEMENTS
(U.S. dollars in thousands, except share and per share data)
|
q.
|
Accrued Severance Pay:
|
Pursuant to Israel’s Severance Pay Law, Israeli employees are entitled to severance pay equal to
one
month’s salary for each year of employment, or a portion thereof. All of the employees of the RRL elected to be included under section 14 of the Severance Pay Law, 1963 (“section 14”). According to this section, these employees are entitled only to monthly deposits, at a rate of
8.33%
of their monthly salary, made in their name with insurance companies. Payments in accordance with section 14 release the Company from any future severance payments (under the above Israeli Severance Pay Law) in respect of those employees; therefore, related assets and liabilities are not presented in the balance sheet.
Total Company expenses related to severance pay amounted to
$202
,
$170
and
$126
for the years ended
December 31, 2015
,
2014
and
2013
, respectively.
|
r.
|
Fair Value Measurements:
|
Fair value is defined as the exchange price that would be received for an asset or paid to transfer a liability (an exit price) in the principal or most advantageous market for the asset or liability in an orderly transaction between market participants on the measurement date. The Company uses a three-tier fair value hierarchy to classify and disclose all assets and liabilities measured at fair value on a recurring basis, as well as assets and liabilities measured at fair value on a non-recurring basis, in periods subsequent to their initial measurement. The hierarchy requires the Company to use observable inputs when available, and to minimize the use of unobservable inputs when determining fair value. If a financial instrument uses inputs that fall in different levels of the hierarchy, the instrument will be categorized based upon the lowest level of input that is significant to the fair value calculation. The three-tiers are defined as follows:
|
•
|
Level 1.
Observable inputs based on unadjusted quoted prices in active markets for identical assets or liabilities;
|
|
•
|
Level 2.
Inputs, other than quoted prices in active markets, that are observable either directly or indirectly; and
|
|
•
|
Level 3.
Unobservable inputs for which there is little or no market data requiring the Company to develop its own assumptions.
|
The carrying amounts of cash and cash equivalents, short term deposits, trade receivables and trade payables approximate their fair value due to the short-term maturity of such instruments.
|
s.
|
Basic and Diluted Net Loss Per Share:
|
Basic net loss per share is computed by dividing the net loss by the weighted-average number of shares of ordinary shares outstanding during the period.
Diluted net loss per share is computed by giving effect to all potential shares of ordinary shares, including stock options, convertible preferred share warrants, to the extent dilutive, all in accordance with ASC No. 260, “Earning Per Share”.
The following table sets forth the computation of the Company’s basic and diluted net loss per ordinary share:
|
|
Year ended
December 31
|
||||||||||
|
|
2015
|
2014
|
2013
|
||||||||
|
Net loss
|
$
|
(25,415
|
)
|
$
|
(21,668
|
)
|
$
|
(12,177
|
)
|
||
|
Convertible preferred shares dividend
|
—
|
|
(2,229
|
)
|
(1,663
|
)
|
|||||
|
Net loss attributable to ordinary shares
|
(25,415
|
)
|
(23,897
|
)
|
(13,840
|
)
|
|||||
|
Shares used in computing net loss per ordinary shares, basic and diluted
|
12,115,038
|
|
3,766,694
|
|
185,688
|
|
|||||
|
Net loss per ordinary share, basic and diluted
|
$
|
(2.10
|
)
|
$
|
(6.34
|
)
|
$
|
(74.53
|
)
|
||
Basic and diluted net loss per share was the same for each period presented as the inclusion of all potential shares of ordinary shares outstanding would have been anti-dilutive.
F-15
REWALK ROBOTICS LTD. AND SUBSIDIARIES
NOTES TO CONSOLIDATED FINANCIAL STATEMENTS
(U.S. dollars in thousands, except share and per share data)
|
t.
|
Contingent liabilities
|
The Company accounts for its contingent liabilities in accordance with ASC No. 450, “Contingencies”. A provision is recorded when it is both probable that a liability has been incurred and the amount of the loss can be reasonably estimated.
With respect to legal matters, provisions are reviewed and adjusted to reflect the impact of negotiations, estimated settlements, legal rulings, advice of legal counsel and other information and events pertaining to a particular matter.
As of
December 31, 2015
and
2014
, the Company is not a party to any ligation that could have a material adverse effect on the Company’s business, financial position, results of operations or cash flows (see Note 8e).
|
u.
|
Government grants
|
Government grants received by the Company relating to categories of operating expenditures are credited to the consolidated statements of operations during the period in which the expenditure to which they relate is charged. Royalty and non-royalty-bearing grants from the Israeli Office of the Chief Scientist (“OCS”), from the Israel-U.S. Binational Industrial Research and Development Foundation (“BIRD”) and from the Israeli Fund for Promoting Overseas Marketing for funding certain approved research and development projects and sales and marketing activities are recognized at the time when the Company is entitled to such grants, on the basis of the related costs incurred, and are included as a deduction from research and development or sales and marketing expenses (see Note 8c).
The Company recorded non-royalty-bearing grants in the amount of
$0
,
$0
and
$101
for the years ended
December 31, 2015
,
2014
and
2013
, respectively, as part of the sales and marketing expenses.
The Company recorded royalty-bearing grants in the amount of
$214
,
$76
and
$0
for the years ended
December 31, 2015
,
2014
and
2013
, respectively, as part of the research and development expenses.
The Company recorded royalty expenses in the amount of
$0
,
$204
and
$136
for the years ended
December 31, 2015
,
2014
and
2013
, respectively, as part of the cost of revenues.
On December 2014, the Company recorded a liability of $
466
as a settlement for the prepayment of amounts due under its agreement with BIRD, representing the full balance of the contingent liability related to grants received (including interest), which was paid during 2015 (see Note 8c).
|
v.
|
New Accounting Pronouncements
|
|
i.
|
Revenue recognition:
|
In May 2014, the Financial Accounting Standards Board (FASB) issued Accounting Standards Update (ASU) 2014-09, Revenue from Contracts with Customers. ASU 2014-09 requires an entity to recognize revenue to depict the transfer of promised goods or services to customers in an amount that reflects the consideration to which the entity expects to be entitled in exchange for those goods and services. Insurance contracts do not fall within the scope of this ASU. The effective date of ASU 2014-09 is for annual reporting periods beginning after December 15, 2017. In July 2015, the FASB decided to defer by one year the effective date of this ASU and early adoption is permitted for annual reporting periods beginning after December 15, 2016. The ASU has not yet been adopted and the Company is currently evaluating the impact that the adoption of ASU 2014-09 will have on its consolidated financial statements.
|
ii.
|
Going Concern:
|
On August 2014, the FASB issued ASU 2014-15, “Presentation of Financial Statements - Going Concern (Subtopic 205-40): Disclosure of Uncertainties about an Entity’s Ability to Continue as a Going Concern.” The ASU is intended to define management’s responsibility to evaluate whether there is substantial doubt about an organization’s ability to continue as a going concern and to provide related footnote disclosures. The amendments in this ASU are effective for reporting periods ending after December 15, 2016, with early adoption permitted. The Company is currently assessing the impact the adoption of ASU 2014-15 will have on its ongoing financial reporting.
F-16
REWALK ROBOTICS LTD. AND SUBSIDIARIES
NOTES TO CONSOLIDATED FINANCIAL STATEMENTS
(U.S. dollars in thousands, except share and per share data)
|
iii.
|
Inventory:
|
On July 2015, the FASB issued ASU 2015-11, Inventory (Topic 330), Simplifying the Measurement of Inventory, which changes the measurement principle for inventory from the lower of cost or market to lower of cost and net realizable value. Net realizable value is defined as the “estimated selling prices in the ordinary course of business, less reasonably predictable costs of completion, disposal and transportation.” ASU 2015-11 eliminates the guidance that entities consider replacement cost or net realizable value less an approximately normal profit margin in the subsequent measurement of inventory when cost is determined on a first-in, first-out or average cost basis. The provisions of ASU 2015-11 are effective for public entities with fiscal years beginning after December 15, 2016, and interim periods within those fiscal years. Early adoption is permitted. The Company is in the process of evaluating the impact of the adoption of ASU 2015-11 on its consolidated financial position, consolidated results of operations, and consolidated cash flows
|
iv.
|
Deferred tax:
|
In November 2015, the FASB issued ASU 2015-17, Income Taxes (Topic740) Balance Sheet Classification of Deferred Taxes, which will require that the presentation of deferred tax liabilities and assets be classified as noncurrent in a classified statement of financial position. The amendments in this update are effective for financial statements issued for annual periods beginning after December 15, 2016, and interim periods within those annual periods. Earlier application is permitted for all entities as of the beginning of an interim or annual reporting period. The Company is in the process of evaluating the impact of the adoption of ASU 2015-17 on its consolidated financial statements.
|
|
December 31,
|
||||||
|
|
2015
|
2014
|
|||||
|
Government institutions
|
$
|
209
|
|
$
|
298
|
|
|
|
Prepaid expenses
|
316
|
|
227
|
|
|||
|
Deposit
|
43
|
|
56
|
|
|||
|
Deferred tax
|
147
|
|
86
|
|
|||
|
Other assets
|
512
|
|
89
|
|
|||
|
|
$
|
1,227
|
|
$
|
756
|
|
|
F-17
REWALK ROBOTICS LTD. AND SUBSIDIARIES
NOTES TO CONSOLIDATED FINANCIAL STATEMENTS
(U.S. dollars in thousands, except share and per share data)
|
|
December 31,
|
||||||
|
|
2015
|
2014
|
|||||
|
Raw materials
|
$
|
450
|
|
$
|
41
|
|
|
|
Finished products
|
2,084
|
|
736
|
|
|||
|
|
$
|
2,534
|
|
$
|
777
|
|
|
|
|
December 31,
|
||||||
|
|
2015
|
2014
|
|||||
|
Cost:
|
|
|
|||||
|
Computer equipment
|
$
|
656
|
|
$
|
338
|
|
|
|
Office furniture and equipment
|
286
|
|
144
|
|
|||
|
Machinery and laboratory equipment
|
471
|
|
235
|
|
|||
|
Field service units
|
575
|
|
—
|
|
|||
|
Leasehold improvements
|
113
|
|
32
|
|
|||
|
|
2,101
|
|
749
|
|
|||
|
|
December 31,
|
||||||
|
|
2015
|
2014
|
|||||
|
Accumulated depreciation
|
773
|
|
335
|
|
|||
|
Property and equipment, net
|
$
|
1,328
|
|
$
|
414
|
|
|
Depreciation expenses amounted to $
438
, $
111
and $
92
for the years ended
December 31, 2015
,
2014
and
2013
, respectively.
In December 2012, certain of the Company’s existing shareholders signed an agreement to make several convertible loans in an aggregate principal amount of $
1.5 million
with such loans bearing annual interest of
7%
. The convertible loans were made during December 2012 and January 2013. Under the loan agreements, the convertible loan amount and accrued interest was to be repaid by the Company to each lender (in proportion to its portion of the principal amount), on
December 31, 2013
, unless earlier there was a closing of an investment by any investor(s), the convertible loan amount was to be automatically converted into ordinary shares of the Company at a price per share equal to the price per share paid by the investors, reduced by a percentage equal to
0.167%
multiplied by the number of days elapsed from the date of the disbursement of the principal amount by the applicable lender until the conversion date. In no event could the discount exceed
20%
.
During the period between April and June 2013, a number of the Company’s shareholders and a new investor made additional convertible loans (with the same terms and conditions as the above mentioned convertible loans) in an aggregate principal amount of
$6.23 million
.
F-18
REWALK ROBOTICS LTD. AND SUBSIDIARIES
NOTES TO CONSOLIDATED FINANCIAL STATEMENTS
(U.S. dollars in thousands, except share and per share data)
The Company recorded the convertible loans as a liability in accordance with ASC No. 480, “Distinguishing Liabilities from Equity” (“ASC No. 480”) as the predominant scenario of the convertible loans embodies an obligation to issue variable number of shares that at inception represents a fixed monitory amount. The fair value is measured at each respective balance sheet date.
Upon the closing of the Series D Transaction, on September 24, 2013, all the above convertible loans were converted into
81,677
convertible preferred D shares at a price per share of
$96.8
-
$103
(which reflects
14.9%
-
20%
discount rate) in accordance with the series D convertible preferred share purchase agreement. The total amount of convertible loans converted (including accrued interest and revaluation financial expenses) was
$9,896
, which was classified to additional paid-in capital in shareholders’ equity (deficiency).
Financial expenses related to convertible loans amounted to
$0
,
$0
and
$2,166
in the years ended
December 31, 2015
,
2014
and
2013
, respectively (there were
no
convertible loans in
2015
and
2014
).
Following the conversion of its existing convertible loans as of series D transaction,
no
additional loans are obtained by the Company.
On December 30, 2015 (the "Agreement Date"), the Company entered into a loan facility agreement (the "Loan Agreement") with Kreos Capital V (Expert Fund) Limited (“Kreos”),pursuant to which Kreos agreed to loan the Company up to $
20,000
. On January 4, 2016, the Company received a total of $
12,000
, less $
415
loan transaction fees and less $
660
of advance payment (the "Loan"). The Loan is for a period of 36 months and bears annual interest of
10.75%
, which is to be paid monthly. The principal of the loan is to be paid in
24
monthly payments, beginning in January 2017, except for the last loan payment which was paid in advance on the Agreement Date, but will be extended to
36
months if the Company raises $
20,000
or more in connection with the issuance of shares of its capital stock (including debt convertible into shares of our capital stock) prior to the expiration of the
24
-months period.
Repayment of the Loan and payment of all other amounts owed to the Lender is to be made in dollars.
Pursuant to the Loan Agreement, the Company granted Kreos a first priority security interest over all of its assets, including intellectual property and equity interests in its subsidiaries, subject to certain permitted security interests.
In connection with the Loan Agreement, on the agreement date, the Company granted Kreos
119,295
warrants (see note 10h) to purchase ordinary shares at an exercise price of $
9.64
per share (the "Warrants"). The warrants are exercisable, in whole or in part, at any time prior to the earliest of (i) December 30, 2025 or (ii) immediately prior to the consummation of a merger, consolidation, or reorganization of the Company with or into, or the sale or license of all or substantially all the assets or shares of the Company to, any other entity or person, other than a wholly-owned subsidiary of the Company, excluding any transaction in which shareholders of the Company prior to the transaction will hold more than
50%
of the voting and economic rights of the surviving entity after the transaction.
On the Agreement Date, the Company calculated the value of its freestanding Warrants to purchase its ordinary shares in the amount of $
1,161
(net of $
42
issuance expenses) , by using the relative fair value method and utilizing an option pricing method.
The following assumptions were used to estimate the value of the Company's warrants to purchase ordinary shares:
|
|
December 30, 2015
|
|
|
Expected volatility
|
60
|
%
|
|
Risk-free rate
|
2.52
|
%
|
|
Dividend yield
|
—
|
%
|
|
Expected term (in years)
|
10
|
|
F-19
REWALK ROBOTICS LTD. AND SUBSIDIARIES
NOTES TO CONSOLIDATED FINANCIAL STATEMENTS
(U.S. dollars in thousands, except share and per share data)
|
a.
|
Purchase commitment
|
The Company has contractual obligations to purchase
goods from its contract manufacturer. Purchase obligations do not include contracts that may be canceled without penalty. As of December 31, 2015, non-cancelable outstanding obligations amounted to approximately $
958
.
|
b.
|
Lease commitment: the Company operates from leased facilities in Israel, the Unites States and Germany. These leases expire between 2016 and 2025.
|
The future minimum lease commitments of the Company and its subsidiaries under various non-cancelable operating lease agreements in respect of premises, that are in effect as of December 31, 2015, are as follows:
|
2016
|
322
|
|
|
|
2017
|
474
|
|
|
|
2018
|
498
|
|
|
|
2019
|
507
|
|
|
|
2020 and Thereafter
|
1,792
|
|
|
|
Total
|
$
|
3,593
|
|
Total rent expenses for the years ended December 31, 2015, 2014 and 2013 were $
260
, $
168
and $
156
, respectively.
RRL and AMG lease cars for their employees under cancelable operating lease agreements expiring at various dates in 2016-2018.
RRL and AMG have an option to be released from these agreements, which may result in penalties in a maximum amount of approximately $
56
as of December 31, 2015.
|
c.
|
Royalties:
|
The Company’s research and development efforts are financed, in part, through funding from the OCS and BIRD. Since the Company’s inception through December 31, 2015, the Company received funding from the OCS and BIRD in the total amount of $
740
and $
500
, respectively. Out of the $
740
in funding from the OCS, a total amount of $
340
were royalty bearing grants (as of December 31, 2015, the Company paid royalties to the OCS in the total amount of $
50
), while a total amount of $
400
was received in consideration of
5,237
convertible preferred A shares. The Company is obligated to pay royalties to the OCS, amounting to
3%
-
3.5%
of the sales of the products and other related revenues generated from such projects, up to
100%
of the grants received. The royalty payment obligations also bear interest at the LIBOR rate. The obligation to pay these royalties is contingent on actual sales of the applicable products and in the absence of such sales, no payment is required. The Company was obligated to pay royalties to the BIRD amounting to
5%
of the sales of the products and other related revenues generated from such projects, up to
150%
of the grants received. During December 2014, the Company recorded a liability of $
466
as a settlement for the prepayment of amounts due under the agreement with BIRD, representing the full balance of the contingent liability related to grants received (including interest), which was paid in January 2015. Upon making this payment, the Company eliminated all future royalty obligations related to its anticipated revenues. These expenses are included in the cost of revenues in the consolidated statement of operations.
For the years ended December 31, 2015, 2014 and 2013, the royalties expenses recorded in cost of revenues amounted to $
0
, $
204
and $
136
respectively.
As of December 31, 2015, the contingent liability to the OCS amounted to $
290
, and there was no contingent liability to the BIRD. The Israeli Research and Development Law provides that know-how developed under an approved research and development program may not be transferred to third parties without the approval of the OCS. Such approval is not required for the sale or export of any products resulting from such research or development. The OCS,
F-20
REWALK ROBOTICS LTD. AND SUBSIDIARIES
NOTES TO CONSOLIDATED FINANCIAL STATEMENTS
(U.S. dollars in thousands, except share and per share data)
under special circumstances, may approve the transfer of OCS-funded know-how outside Israel, in the following cases:
(a) the grant recipient pays to the OCS a portion of the sale price paid in consideration for such OCS-funded know-how or in consideration for the sale of the grant recipient itself, as the case may be, which portion will not exceed
six
times the amount of the grants received plus interest (or
three
times the amount of the grant received plus interest, in the event that the recipient of the know-how has committed to retain the R&D activities of the grant recipient in Israel after the transfer); (b) the grant recipient receives know-how from a third party in exchange for its OCS-funded know-how; (c) such transfer of OCS-funded know-how arises in connection with certain types of cooperation in research and development activities; or (d) If such transfer of know-how arises in connection with a liquidation by reason of insolvency or receivership of the grant recipient.
d. Liens
In connection with the Loan Agreement, the Company granted Kreos a first priority security interest over all of its assets, including intellectual property and equity interests in its subsidiaries, subject to certain permitted security interests.
The Company's long-term other assets in the amount of $
242
have been pledged as security in respect of a guarantee granted to a third party on April 29, 2015
.
Such deposit cannot be pledged to others or withdrawn without the consent of such third party.
|
e.
|
Legal Claims:
|
In September 2013, a claim was filed against the Company and the University of Utah Hospital and
Medical Center (UUHMC) in the Third Judicial District Court for the County of Salt Lake, State of Utah, in connection with allegations made by a ReWalk user who was injured while using ReWalk. The plaintiff claimed that in April 2013 the ReWalk system malfunctioned while transitioning from sitting to standing mode and sought damages totaling $
2,900
from the Company and UUHMC for an injury she alleged was caused by such malfunction. In April 2015, the case was settled with the plaintiff. The settlement did not have a material effect on the Company’s business, financial position, results of operations or cash flows.
Financial instruments measured at fair value on a recurring basis include warrants for convertible preferred share. The warrants were classified as a liability in accordance with ASC No. 480 (see Note 11). These warrants were classified as level 3 in the fair value hierarchy since some of the inputs used in the valuation were determined based on management’s assumptions. The fair value of the warrants on the issuance date and on subsequent reporting dates was determined using OPM utilizing the assumptions noted below. The fair value of the underlying preferred share price was determined by the board of directors considering, among others, third party valuations. The valuation of the Company was performed using a DCF model. The OPM method was then employed to allocate the enterprise value among the Company’s various equity classes, deriving a fully marketable value per share for the preferred share. The expected terms of the warrants were based on the remaining contractual expiration period. The expected share price volatility for the shares was determined by examining the historical volatilities of a group of the Company’s industry peers as there is no trading history of the Company’s shares. The risk-free interest rate was calculated using the average of the published interest rates for U.S. Treasury zero-coupon issues with maturities that approximate the expected term. The dividend yield assumption was
zero
as there is no history of dividend payments.
The following assumptions were used to estimate the value of the warrants to purchase series C convertible preferred shares:
|
|
September 17, 2014
(conversion date)
|
December 31, 2013
|
|||
|
Expected volatility
|
70
|
%
|
70
|
%
|
|
|
Risk-free rate
|
0.1
|
%
|
0.1
|
%
|
|
|
Dividend yield
|
—
|
%
|
—
|
%
|
|
|
Expected term (in years)
|
0
|
|
1.25
|
|
|
F-21
REWALK ROBOTICS LTD. AND SUBSIDIARIES
NOTES TO CONSOLIDATED FINANCIAL STATEMENTS
(U.S. dollars in thousands, except share and per share data)
The following assumptions were used to estimate the value of the warrants to purchase series D convertible preferred shares:
|
|
September 11,
2014 (IPO date)
|
December 31,
2013 |
September 24,
2013
(issuance date)
|
|||||
|
Expected volatility
|
70
|
%
|
70
|
%
|
70
|
%
|
||
|
Risk-free rate
|
1.7
|
%
|
0.1
|
%
|
0.2
|
%
|
||
|
Dividend yield
|
—
|
%
|
—
|
%
|
—
|
%
|
||
|
Expected term (in years)
|
4.80
|
|
1.25
|
|
1.50
|
|
||
The following assumptions were used to estimate the value of the warrants to purchase series E convertible preferred shares:
|
|
September 11,
2014
(IPO date)
|
June 26, 2014
(issuance date)
|
|||
|
Expected volatility
|
70
|
%
|
70
|
%
|
|
|
Risk-free rate
|
1.4
|
%
|
0.1
|
%
|
|
|
Dividend yield
|
—
|
%
|
—
|
%
|
|
|
Expected term (in years)
|
3.80
|
|
4.00
|
|
|
The change in the fair value of warrants to purchase convertible preferred shares liability is summarized below:
|
|
Balance at
beginning of
period
|
Issuance of
warrants to
purchase
preferred
share
|
Exercise of
warrants to
purchase
preferred
share
|
Change in fair
value
|
Conversion to Warrants to purchase ordinary
share following IPO
|
Balance at
end of
period
|
|||||||||||||||||
|
December 31, 2014
|
$
|
3,341
|
|
$
|
5,794
|
|
$
|
(2,804
|
)
|
$
|
(776
|
)
|
$
|
(5,555
|
)
|
|
|
||||||
|
December 31, 2013
|
$
|
2,168
|
|
$
|
62
|
|
$
|
—
|
|
$
|
1,111
|
|
$
|
—
|
|
$
|
3,341
|
|
|||||
|
a.
|
All ordinary shares, options, exercise prices and loss per share amounts have been adjusted retroactively for all periods presented in these financial statements, to reflect the
17
-to-one bonus share issuance (equivalent to an
18
-for-1 share split) effected on August 26, 2014.
|
|
b.
|
Composition of convertible preferred share capital and ordinary shares:
|
F-22
REWALK ROBOTICS LTD. AND SUBSIDIARIES
NOTES TO CONSOLIDATED FINANCIAL STATEMENTS
(U.S. dollars in thousands, except share and per share data)
|
|
Authorized
|
Issued and outstanding
|
|||||||||||||||
|
|
December 31,
|
December 31,
|
|||||||||||||||
|
|
2015
|
2014
|
2013
|
2015
|
2014
|
2013
|
|||||||||||
|
|
Number of shares
|
||||||||||||||||
|
Preferred shares of NIS 0.01 par value:
|
|
|
|
|
|
|
|
|
|||||||||
|
Series A preferred shares
|
—
|
|
—
|
|
11,000
|
|
—
|
|
—
|
|
10,677
|
|
|||||
|
Series B preferred shares
|
—
|
|
—
|
|
100,000
|
|
—
|
|
—
|
|
63,880
|
|
|||||
|
Series C-1 preferred shares
|
—
|
|
—
|
|
200,000
|
|
—
|
|
—
|
|
67,486
|
|
|||||
|
Series C-2 preferred shares
|
—
|
|
—
|
|
40,000
|
|
—
|
|
—
|
|
19,675
|
|
|||||
|
Series D-1 preferred shares
|
—
|
|
—
|
|
100,000
|
|
—
|
|
—
|
|
84,008
|
|
|||||
|
Series D-2 preferred shares
|
—
|
|
—
|
|
69,387
|
|
—
|
|
—
|
|
69,387
|
|
|||||
|
Series D-3 preferred shares
|
—
|
|
—
|
|
10,323
|
|
—
|
|
—
|
|
10,323
|
|
|||||
|
Series D-4 preferred shares
|
—
|
|
—
|
|
1,967
|
|
—
|
|
—
|
|
1,967
|
|
|||||
|
Series E preferred shares
|
—
|
|
—
|
|
—
|
|
—
|
|
—
|
|
—
|
|
|||||
|
Total preferred shares
|
—
|
|
—
|
|
532,677
|
|
—
|
|
—
|
|
327,403
|
|
|||||
|
Ordinary shares of NIS 0.01 par value:
|
|
|
|
|
|
|
|
|
|
|
|||||||
|
Ordinary shares
|
250,000,000
|
|
250,000,000
|
|
—
|
|
12,222,583
|
|
11,978,554
|
|
—
|
|
|||||
|
Ordinary A shares
|
—
|
|
—
|
|
168,613,056
|
|
—
|
|
—
|
|
180,000
|
|
|||||
|
Ordinary B non-voting shares
|
—
|
|
—
|
|
1,800,000
|
|
—
|
|
—
|
|
5,688
|
|
|||||
|
Total ordinary shares
|
250,000,000
|
|
250,000,000
|
|
170,413,056
|
|
12,222,583
|
|
11,978,554
|
|
185,688
|
|
|||||
|
c.
|
Initial Public Offering:
|
In September 2014, the Company completed its IPO in which the Company issued and sold
3,000,000
ordinary shares at a public offering price of
$12.00
per share. During the IPO the underwriters received an option to purchase
450,000
ordinary shares of the company at the price of
$12.00
for a period of
30 days
following the IPO date.
During September 2014, the underwriters exercised their option to purchase additional
450,000
ordinary shares at the same IPO price per share.
The total net proceeds received from the IPO were
$36.3 million
after deducting underwriting discounts and commissions of
$2.7 million
and other offering expenses of
$2.5 million
.
|
d.
|
1. Ordinary shares:
|
The ordinary shares of the Company confer on the holders thereof voting rights, rights to receive dividends and rights to participate in distribution of assets upon liquidation after any outstanding preferred shares receive their preference amount. The ordinary A shares and ordinary B shares were restated as ordinary shares in accordance with the following:
On August 26, 2014, in a duly convened extraordinary general meeting of the shareholders of the Company, the shareholders (i) duly approved an amendment of the Company's Articles of Association which subsequently entered effect upon the Company's initial public offering, under which the Company's authorized share capital was increased and restated as NIS
2,500,000
divided into
250,000,000
ordinary shares, par value NIS
0.01
, and (ii) ratified an updated capitalization table of the Company, which represented each shareholder's holdings in the Company following the aforementioned restatement of the Company's authorized share capital.
F-23
REWALK ROBOTICS LTD. AND SUBSIDIARIES
NOTES TO CONSOLIDATED FINANCIAL STATEMENTS
(U.S. dollars in thousands, except share and per share data)
2. Convertible preferred shares:
Following the Company's IPO, as described in Note 9c above, all of the Company's convertible preferred shares were automatically converted into
7,838,640
ordinary shares in a conversion ratio of
1
-to-1
|
e.
|
Preferred Share purchase agreements:
|
The Company entered into a Share Purchase Agreement dated as of September 24, 2013 (the “Series D SPA”) with several existing shareholders and with a new investor, YEC, for the private placement of Series D-1, Series D-2, Series D-3 and Series D-4 convertible preferred shares in connection with the conversion of previously-issued convertible loans. Pursuant to the Series D SPA, the Company issued a total of
84,008
Series D-1 convertible preferred shares for an aggregate purchase price of $
9,961
(net of $
204
issuance expenses) and a total of
81,677
Series D-2, Series D-3 and Series D-4 convertible preferred shares, converting convertible loans of $
9,896
(including financial expenses), including interest. The price per share was $
121.00
per Series D-1 convertible preferred share, $
96.80
per Series D-2 convertible preferred share, $
101.197
per Series D-3 convertible preferred share and $
103.016
per Series D-4 convertible preferred share.
The Series D SPA provides that YEC shall be issued additional shares for no consideration on certain specified dates, beginning on April 1, 2014 and ending on September 1, 2014, if the following
two
events have not occurred as of such date: (i) receipt of FDA clearance to market ReWalk Personal in the United States and (ii) reimbursement by any German insurance provider of the full cost of at least one ReWalk Personal. An aggregate of
8,264
shares are issuable pursuant to the Series D SPA in connection with the failure to achieve both of these events (see also Note 14). The fair value of those warrants as of the issuance date and as of December 31, 2013 was immaterial.
Pursuant to the Series D SPA, the Company issued
1,377
convertible preferred D Shares to YEC on each of April 1, May 1 and June 1, 2014 (a total of
4,131
convertible preferred D shares). Following the issuance of these shares, during the year ended December 31, 2014, the Company recorded their fair value in the amount of $
1,114
in its consolidated statement of operations under financial expenses, net.
The fair value of the Series D convertible preferred shares issued to YEC on each of these dates was determined by the board of directors of the Company considering, among others, third party valuations, and was classified as level 3 in the fair value hierarchy since some of the inputs used in the valuation were determined based on management’s assumptions. The valuation of the Company was performed using a DCF model. The OPM method was then employed to allocate the enterprise value among the Company’s various equity classes, deriving a fully marketable value per share for the preferred share. The expected share price volatility for the shares was determined by examining the historical volatilities of a group of the Company’s industry peers as there is no trading history of the Company’s shares. The risk-free interest rate was calculated using the average of the published interest rates for U.S. Treasury zero-coupon issues with maturities that approximate the expected term. The dividend yield assumption was
zero
as there is no history of dividend payments.
The following assumptions were used to estimate the fair value of the Series D convertible preferred shares issued to YEC on each of these dates: expected volatility-
70%
; Risk-free rate-
0.1%
and Dividend yield-
0%
.
As of June 30, 2014, YEC agreed that both of the above events had been satisfied and as such commencing July 1, 2014
no
convertible preferred D Shares will be issued to YEC.
On June 26, 2014, the Company entered into a Securities Purchase Agreement with Gabriel Capital Fund (US), L.P. and affiliated entities, and the other parties named therein (the “Series E SPA”). The transaction closed in July 2014. Pursuant to the Series E SPA, the Company issued an aggregate of
75,695
of its preferred E Shares and warrants to purchase an aggregate of
37,850
preferred E Shares (see Note 11d) to Gabriel and the other investors named in the Series E SPA for an aggregate purchase price in cash of $
13.0 million
. The preferred E Shares were issued at a price of $
171.74
per share.
The Company’s articles of association in effect prior to the IPO provided for antidilution protections to certain holders of convertible preferred shares based on the price to the public in the IPO. As a result, the conversion price of certain holders of convertible preferred shares was reduced, and the
75,695
Series E convertible preferred shares are convertible into
1,547,604
ordinary shares.
|
f.
|
Share option plans:
|
On March 30, 2012, the Company’s board of directors adopted the ReWalk Robotics Ltd. 2012 Equity Incentive Plan.
F-24
REWALK ROBOTICS LTD. AND SUBSIDIARIES
NOTES TO CONSOLIDATED FINANCIAL STATEMENTS
(U.S. dollars in thousands, except share and per share data)
On August 19, 2014, the Company’s board of directors adopted the ReWalk Robotics Ltd. 2014 Incentive Compensation Plan (the "Plan"). The Plan provides for the grant of stock options, stock appreciation rights, restricted stock awards, restricted stock units, cash-based awards, other stock-based awards and dividend equivalents to the Company’s and its affiliates’ respective employees, non-employee directors and consultants.
Starting in 2014, the Company granted to directors and the chief executive officer of the Company RSUs under this Plan. An RSU award is an agreement to issue shares of our common stock at the time the award is vested.
As of
December 31, 2015
and
2014
, the Company had reserved
420,469
and
25,056
shares of ordinary shares, respectively, available for issuance to employees, directors, officers and non-employees of the Company.
The share reserve pool will increase on January 1 of each calendar year during the term of the 2014 Plan in an amount equal to the lesser of: (x)
972,000
, (y)
4%
of the total number of shares outstanding on December 31 of the immediately preceding calendar year, and (z) an amount determined by the Company's board of directors.
The options generally vest over
four
years. Any option that is forfeited or canceled before expiration becomes available for future grants under the Plan.
A summary of employee share options and RSUs activity during the year ended
2015
is as follows:
|
|
Year Ended December 31, 2015
|
||||||||||
|
|
Number
|
Average
exercise
price
|
Average
remaining
contractual
life (years) (1)
|
Aggregate
intrinsic
value (in
thousands)
|
|||||||
|
Options and RSUs outstanding at the beginning of the year
|
1,350,846
|
|
3.80
|
|
8.27
|
20,373
|
|
||||
|
Options granted
|
709,105
|
|
9.26
|
|
|
|
|
||||
|
RSUs granted
|
43,466
|
|
—
|
|
|
|
|
||||
|
Options exercised
|
(158,101
|
)
|
$
|
0.96
|
|
||||||
|
RSUs vested
|
(19,586
|
)
|
$
|
—
|
|
||||||
|
RSUs forfeited
|
(13,970
|
)
|
$
|
—
|
|
|
|
|
|||
|
Options forfeited
|
(58,391
|
)
|
$
|
3.37
|
|
|
|
|
|||
|
Options and RSUs outstanding at the end of the year
|
1,853,369
|
|
6.12
|
|
8.37
|
17,048
|
|
||||
|
Options and RSUs vested and expected to vest
|
1,807,787
|
|
6.09
|
|
8.33
|
16,699
|
|
||||
|
Options exercisable at the end of the year
|
649,156
|
|
2.65
|
|
7.01
|
7,961
|
|
||||
|
(1)
|
Calculation of weighted average remaining contractual term does not include the RSUs that were granted, which have an indefinite contractual term.
|
The weighted average grant date fair values of options granted during the year ended
December 31, 2015
,
2014
and
2013
were
$5.36
, $
4.74
and $
2.03
respectively. The weighted average grant date fair values of RSUs granted during the year ended
December 31, 2015
and
2014
were
$20.77
and $
20.97
respectively.
The aggregate intrinsic value in the table above represents the total intrinsic value that would have been received by the option holders had all option holders, which hold options with positive intrinsic value, exercised their options on the last date of the exercise period. Total intrinsic value of options exercised for the year ended
December 31, 2015
and
2014
were
$2,135
and
$38
respectively,
no
options was exercised during the year ended
December 31, 2013
. As of
December 31, 2015
, there were
$7,864
of total unrecognized compensation cost related to non-vested share-based compensation arrangements granted under the
2012
, and
2014
Plan. This cost is expected to be recognized over a period of approximately
3 years
.
F-25
REWALK ROBOTICS LTD. AND SUBSIDIARIES
NOTES TO CONSOLIDATED FINANCIAL STATEMENTS
(U.S. dollars in thousands, except share and per share data)
The options and RSUs outstanding as of
December 31, 2015
have been separated into ranges of exercise price as follows:
|
Range of exercise price
|
Options Outstanding as of December 31, 2015
|
Weighted
average
remaining
contractual
life (years) (1)
|
Options exercisable as of December 31, 2015
|
Weighted
average
remaining
contractual
life (years) (1)
|
||||||
|
—(including options and RSUs)
|
95,599
|
|
3.95
|
7,338
|
|
3.95
|
||||
|
$0.82
|
34,377
|
|
5.04
|
34,377
|
|
5.04
|
||||
|
$1.32
|
400,990
|
|
6.46
|
356,166
|
|
6.42
|
||||
|
$1.48
|
441,412
|
|
8.03
|
207,155
|
|
8.02
|
||||
|
$7.30- $8.99
|
620,027
|
|
9.82
|
—
|
|
0.00
|
||||
|
$19.62-$20.97
|
260,964
|
|
8.98
|
44,120
|
|
8.96
|
||||
|
|
1,853,369
|
|
8.37
|
649,156
|
|
7.01
|
||||
|
(1)
|
Calculation of weighted average remaining contractual term does not include the RSUs that were granted, which have an indefinite contractual term.
|
|
|
g.
|
Options issued to consultants:
|
The Company’s outstanding options granted to non-employees as of
December 31, 2015
were as follows:
|
Issuance date
|
Options for
shares of
ordinary
share
|
Exercise
price
per share
|
Options
exercisable
|
Exercisable
through
|
|||||||
|
|
(number)
|
|
(number)
|
|
|||||||
|
March 12, 2007
|
3,454
|
|
$
|
—
|
|
3,454
|
|
March 12, 2017
|
|||
|
|
h.
|
Warrants to purchase ordinary shares
|
In May 2015 a total of
123,888
warrants were exercised on a cashless basis into
49,684
ordinary shares.
The following table summarizes information about warrants outstanding and exercisable as of December 31, 2015:
|
Issuance date
|
Warrants outstanding
|
Exercise
price per warrant |
Warrants
exercisable |
Contractual term
|
|||||||
|
|
(number)
|
|
(number)
|
|
|||||||
|
July 14, 2014
|
542,506
|
|
$
|
10.08
|
|
542,506
|
|
July 13, 2018
|
|||
|
December 30, 2015
|
119,295
|
|
$
|
9.64
|
|
119,295
|
|
The earlier of: (i) December 30, 2025 (ii) a merger, consolidation, or reorganization of the Company.
|
|||
|
661,801
|
|
661,801
|
|
||||||||
F-26
REWALK ROBOTICS LTD. AND SUBSIDIARIES
NOTES TO CONSOLIDATED FINANCIAL STATEMENTS
(U.S. dollars in thousands, except share and per share data)
|
|
i.
|
Share-based compensation expense for employees and non-employees:
|
The Company recognized non-cash share-based compensation expense in the consolidated statements of operations as follows:
|
|
Year Ended December 31,
|
||||||||||
|
|
2015
|
2014
|
2013
|
||||||||
|
Cost of revenues
|
$
|
64
|
|
$
|
33
|
|
$
|
5
|
|
||
|
Research and development, net
|
425
|
|
4,364
|
|
73
|
|
|||||
|
Sales and marketing, net
|
571
|
|
275
|
|
42
|
|
|||||
|
General and administrative
|
1,285
|
|
507
|
|
95
|
|
|||||
|
Total
|
$
|
2,345
|
|
$
|
5,179
|
|
$
|
215
|
|
||
In May 2012, the Company granted its CEO options to purchase
82,728
ordinary shares at an exercise price of $
1.32
per share. The options will vest immediately prior to and subject to the occurrence of (i) a merger of the Company into another corporation; (ii) the consummation of a merger, acquisition or sale of the securities of the Company; or (iii) an IPO of the Company’s ordinary shares (“Exit Event”). The above options vesting are also contingent upon market conditions related to the consideration paid to the shareholders of the Company in an Exit Event. The fair value of the above options at the grant date was $
165
. Following the IPO in September 2014 the Company recorded the $
165
compensation costs under general and administrative expenses.
In accordance with the Company’s articles of association and the Third Amended and Restated Shareholders Agreement, immediately prior to and subject to the occurrence of (i) the consummation of a merger, acquisition or sale of the securities of the Company (“M&A Event”); or (ii) an IPO, the Company’s founder and Chief Technology Officer has the right to receive (i) in case of an M&A Event,
6%
of the total proceeds; or (ii) in case of an IPO, for no consideration, shares or immediately exercisable options with cashless exercise in an amount such that the value of his interests equals
6%
of the Company’s valuation. Prior to the IPO in September 2014, the Company recorded $
4,134
compensation costs under research and development expenses in respect thereof.
F-27
REWALK ROBOTICS LTD. AND SUBSIDIARIES
NOTES TO CONSOLIDATED FINANCIAL STATEMENTS
(U.S. dollars in thousands, except share and per share data)
|
Issuance with respect to
|
Warrants
to purchase
|
Issuance
date
|
Number
of
warrants
|
Exercise
price
|
Contractual term
|
||||||||
|
Series C Transaction
|
Preferred C-1
|
8/2/2011
|
7,615
|
|
$
|
105.815
|
|
The earlier of: (i) a merger (ii) the consummation of an initial public offering and (iii) 3 years from the issuance date (all as stipulated in the specific warrant agreement)
|
|||||
|
Series C Transaction
|
Preferred C-1
|
1/31/2012
|
7,231
|
|
$
|
105.815
|
|
The earlier of: (i) a merger (ii) the consummation of an initial public offering and (iii) 3 years from the issuance date (all as stipulated in the specific warrant agreement)
|
|||||
|
Series C Transaction
|
Preferred C-1
|
5/10/2012
|
4,252
|
|
$
|
105.815
|
|
The earlier of: (i) a merger (ii) the consummation of an initial public offering and (iii) 3 years from the issuance date (all as stipulated in the specific warrant agreement)
|
|||||
|
Series C Transaction
|
Preferred C-1
|
8/20/2012
|
5,870
|
|
$
|
105.815
|
|
The earlier of: (i) a merger (ii) the consummation of an initial public offering and (iii) 3 years from the issuance date (all as stipulated in the specific warrant agreement)
|
|||||
|
Fee agreement with a service provider
|
Preferred D
|
9/24/2013
|
600
|
|
$
|
121
|
|
The earlier of: (i) a merger (ii) the consummation of an initial public offering and (iii) 5 years from the issuance date (all as stipulated in the specific warrant agreement)
|
|||||
|
Venture loan from Kreos
|
Preferred D
|
6/19/2014
|
5,372
|
|
$
|
206.09
|
|
The earlier of: (i) a merger (ii) 5 years from the consummation of an initial public offering and (iii) 10 years from the issuance date (all as stipulated in the specific warrant agreement)
|
|||||
|
Series E Transaction
(refer to Note 10d) |
Preferred E
|
6/26/2014
|
37,850
|
|
$
|
206.09
|
|
4 years from the issuance date (all as stipulated in the specific warrant agreement)
|
|||||
|
a.
|
In July 26, 2011, the Company signed a series C convertible preferred share purchase agreement (the “Series C Transaction”) with the Company’s shareholders and new investors (collectively the “Investors”), pursuant to which the Company issued to each of the Investors an aggregate amount of
67,486
convertible preferred C-1 shares, at a price per share of
$105.815
totaling to approximately
$7.1 million
.
|
The Investment was made in
three
installments as follows: (i) the first installment was made at the First Closing, in an aggregate amount of approximately
$1 million
by means of the issuance of
9,640
convertible preferred C-1 shares (ii) the second installment was made at the Second Closing, subject to the terms of the agreement and fulfillment of the First Milestone, in an aggregate amount of approximately
$2.6 million
, by means of the issuance of
24,102
convertible preferred C-1 shares and (iii) the third and final installment was made at the Third Closing, subject to
F-28
REWALK ROBOTICS LTD. AND SUBSIDIARIES
NOTES TO CONSOLIDATED FINANCIAL STATEMENTS
(U.S. dollars in thousands, except share and per share data)
the terms of the agreement and fulfillment of the Second Milestone, in an aggregate amount of approximately
$3.6 million
, by means of the issuance of
33,744
convertible preferred C-1 shares.
In conjunction with the Series C Transaction, the Company granted warrants to purchase a number of shares of Series C-1 convertible preferred share upon achieving
three
milestones, each referred to as closing. At each of the Closings, the investor was granted warrants, at a price per each investment share of
$105.815
(i) to purchase an aggregate amount of
7,615
Series C-1 convertible preferred shares to the investors at the First Closing and the holders of C-2 preferred shares, subject to consummation of the First Closing (ii) to purchase an aggregate amount of
7,231
Series C-1 convertible preferred share to the investors at the Second Closing, subject to consummation of the second closing and (iii) to purchase an aggregate amount of
10,122
Series C-1 convertible preferred share to the investors at the third closing, subject to consummation of the third closing.
As of
December 31, 2013
, all of the three milestones were achieved and all of the above warrants were granted.
The warrants to purchase Series C-1 convertible preferred shares were determined to be freestanding instruments and were accounted under ASC No. 480 as a liability in the Company’s financial statements. At each reporting date, the Company re-measures its warrants for convertible preferred shares to fair value using the OPM. Since the warrants to purchase Series C-1 convertible preferred shares were issued in conjunction with the Series C Transaction, the Company first allocated the fair value of the warrants to purchase Series C-1 convertible preferred shares to warrant liability, with the residual proceeds from the Series C Transaction classified as shareholders’ equity (deficiency).
On July 30, 2014, all of the
7,615
warrants to purchase series C-1 convertible preferred shares, which were issued on August 2, 2011, were exercised into series C-1 convertible preferred shares as follows: (i) a total of
6,197
warrants were exercised into
6,197
series C-1 convertible preferred shares for cash consideration of
$656
and (ii) the remaining
1,418
warrants were exercised on a cashless basis into
721
series C-1 convertible preferred shares.
On August 26, 2014, all of the remaining
17,353
warrants to purchase series C-1 convertible preferred shares, which were issued between January 2012 and August 2012, were exercised into series C-1 convertible preferred shares as follows: (i) a total of
3,988
warrants were exercised into
3,988
series C-1 convertible preferred shares for cash consideration of
$422
and (ii) the remaining
13,365
warrants were exercised on a cashless basis into
6,799
series C-1 convertible preferred shares.
The fair value of the warrants to purchase Series C-1 convertible preferred shares as of June 27, 2011, January 31, 2012, May 10, 2012 and August 20, 2012 (the issuance dates) was
$43.09
,
$46.74
,
$57.68
and
$72.26
, per warrant, respectively.
|
b.
|
On May 30, 2013, the Company entered into a fee agreement with one of its service providers, pursuant to which the Company granted the service provider warrants to purchase shares equal to
5%
of any shares issued upon cash receipt from an external investor identified by the service provider. As part of the Series D Transaction, on September 30, 2013 the service provider was granted warrants to purchase
600
Series D convertible preferred share. The Company accounted for the warrants to purchase Series D convertible preferred shares under ASC 505 and recorded the warrants at fair value as issuance expense, which was determined to be
$62
as of September 24, 2013 (their issuance date), and classified as a liability in the Company’s financial statement.
|
On the August 26, 2014, all of the
600
warrants to purchase series D convertible preferred shares mentioned above, which were issued on September 24, 2013, were exercised on a cashless basis into
263
series D convertible preferred shares.
F-29
REWALK ROBOTICS LTD. AND SUBSIDIARIES
NOTES TO CONSOLIDATED FINANCIAL STATEMENTS
(U.S. dollars in thousands, except share and per share data)
|
c.
|
On June 19, 2014, the Company entered into a loan agreement with Kreos pursuant to which Kreos agreed to grant a line of credit to the Company of
$5.0 million
. The line of credit was available for drawdown until September 30, 2014, with a minimum required drawdown of
$1.0 million
. In October 2014, the Company extended the line of credit until December 31, 2015. Amounts drawn were required to be repaid in
36
monthly installments. The Company did not draw down any funds under this line of credit. Pursuant to the loan agreement, the Company was required to pay a transaction fee of
1.0%
of the total amount of the line of credit upon both the execution and the expiration of the loan agreement. In the year ended
December 31, 2014
the Company paid and accrued, as part of the Company's financial expenses, a transaction fee expenses an amount of
$100
. Pursuant to the loan agreement, the Company granted to Kreos a security interest over all of the Company’s assets, including intellectual property and equity interests in its subsidiaries.
|
In connection with this agreement, the Company granted Kreos warrants to purchase
5,372
Series D-1 convertible preferred shares. The Company accounted for the warrants to purchase Series D-1 convertible preferred shares under ASC No. 480 and recorded the warrants at fair value as financial expense, which was determined to be
$835
as of June 19, 2014 (their issuance date), and classified as a liability in the Company’s financial statement.
On the September 11, 2014, following the IPO, all of the
5,372
warrants to purchase series D-1 convertible preferred shares mentioned above were converted into warrants to purchase
96,696
ordinary shares.
On the September 15, 2014, all of the
96,696
warrants to purchase ordinary shares mentioned above, which were issued on June 19, 2014, were exercised on a cashless basis into
79,200
ordinary shares.
|
d.
|
On June 26, 2014, the Company entered into the series E SPA with Gabriel and the other parties named therein (the “Series E SPA”). The transaction closed in July 2014. Pursuant to the Series E SPA, the Company issued warrants to purchase an aggregate of
37,850
preferred E Shares (which, upon the consummation of the IPO, converted on an
18
-for-
1
basis into warrants to purchase the Company’s ordinary shares) to Gabriel and the other investors named in the Series E SPA. The warrants have an exercise price of
$206.09
per share and are exercisable until
four
years from date of grant, subject to certain adjustments.
|
The Company’s articles of association in effect prior to the IPO provided for antidilution protections to certain holders of convertible preferred shares based on the price to the public in the IPO. Following the IPO, on September 11, 2014 the warrants to purchase
37,850
series D-1 convertible preferred shares mentioned above were converted into warrants to purchase
785,754
ordinary shares.
On the September 30, 2014, a total of
26,784
warrants to purchase ordinary shares mentioned above, which were issued on June 26, 2014, were exercised on a cashless basis into
18,192
ordinary shares.
On the October 12, 2014, a total of
89,280
warrants to purchase ordinary shares mentioned above, which were issued on June 26, 2014, were exercised on a cashless basis into
60,226
ordinary shares.
|
e.
|
As of
December 31, 2013
, the fair value of the warrants to purchase convertible preferred shares was
$3,341
. Following the closing of the IPO on September 17, 2014, all outstanding warrants to purchase convertible preferred stock were converted into warrants to purchase ordinary shares which resulted in classification of the remaining warrants liability to additional paid-in capital in the amount of
$5,555
.
|
The Company recorded financial expenses (income), net in the amount of
$0
,
$(776)
and
$1,111
in
2015
,
2014
and
2013
, respectively, resulting from the revaluation of the warrants to purchase convertible preferred shares.
F-30
REWALK ROBOTICS LTD. AND SUBSIDIARIES
NOTES TO CONSOLIDATED FINANCIAL STATEMENTS
(U.S. dollars in thousands, except share and per share data)
The Company’s subsidiaries are separately taxed under the domestic tax laws of the jurisdiction of incorporation of each entity.
|
a.
|
Corporate tax rates in Israel:
|
Presented hereunder are the tax rates relevant to the Company in the years 2013-2015:
The Israeli statutory corporate tax rate was,
25%
in 2013 and
26.5%
in 2015 and 2014. On January 4, 2016, the statutory tax rate was changed to
25%
following a reduction of corporate tax by the government.
|
b.
|
Profit (loss) before taxes on income is comprised as follows:
|
|
|
Year Ended December 31,
|
||||||||||
|
|
2015
|
2014
|
2013
|
||||||||
|
Domestic
|
$
|
(25,485
|
)
|
$
|
(21,743
|
)
|
$
|
(12,219
|
)
|
||
|
Foreign
|
123
|
|
120
|
|
64
|
|
|||||
|
|
$
|
(25,362
|
)
|
$
|
(21,623
|
)
|
$
|
(12,155
|
)
|
||
|
c.
|
Taxes on income are comprised as follows:
|
|
|
Year Ended December 31,
|
||||||||||
|
|
2015
|
2014
|
2013
|
||||||||
|
Current
|
$
|
114
|
|
$
|
76
|
|
$
|
6
|
|
||
|
Deferred
|
(61
|
)
|
(60
|
)
|
16
|
|
|||||
|
Prior year taxes
|
—
|
|
29
|
|
—
|
|
|||||
|
|
$
|
53
|
|
$
|
45
|
|
$
|
22
|
|
||
|
|
Year Ended December 31,
|
||||||||||
|
|
2015
|
2014
|
2013
|
||||||||
|
Domestic
|
$
|
—
|
|
$
|
—
|
|
$
|
—
|
|
||
|
Foreign
|
53
|
|
45
|
|
22
|
|
|||||
|
|
$
|
53
|
|
$
|
45
|
|
$
|
22
|
|
||
|
d.
|
Deferred income taxes:
|
Deferred income taxes reflect the net tax effects of temporary differences between the carrying amounts of assets and liabilities for financial reporting purposes and the amounts used for income tax purposes. The Company’s deferred tax assets as of
December 31, 2015
and
2014
are derived from temporary differences.
In assessing the realization of deferred tax assets, the Company considers whether it is more likely than not that all or some portion of the deferred tax assets will not be realized. Based on the Company’s history of losses, the Company established a full valuation allowance for RRL.
Undistributed earnings of certain subsidiaries as of December 31, 2015 were immaterial. The Company intends to reinvest these earnings indefinitely in the foreign subsidiaries. As a result, the Company has not provided for any deferred income taxes.
F-31
REWALK ROBOTICS LTD. AND SUBSIDIARIES
NOTES TO CONSOLIDATED FINANCIAL STATEMENTS
(U.S. dollars in thousands, except share and per share data)
|
|
December 31,
|
||||||
|
|
2015
|
2014
|
|||||
|
Carry forward tax losses
|
$
|
14,961
|
|
$
|
9,152
|
|
|
|
Research and Development carry forward expenses-temporary differences
|
1,176
|
|
870
|
|
|||
|
Accrual and reserves
|
206
|
|
153
|
|
|||
|
Deferred tax assets before valuation allowance
|
16,343
|
|
10,175
|
|
|||
|
Valuation allowance
|
(16,196
|
)
|
(10,089
|
)
|
|||
|
Net deferred tax assets
|
$
|
147
|
|
$
|
86
|
|
|
|
e.
|
Reconciliation of the theoretical tax expenses:
|
A reconciliation between the theoretical tax expense, assuming all income is taxed at the statutory tax rate applicable to income of the Company, and the actual tax expense (benefit) as reported in the consolidated statements of operations is as follows:
|
|
Year Ended December 31,
|
||||||||||
|
|
2015
|
2014
|
2013
|
||||||||
|
Loss before taxes, as reported in the consolidated statements of operations
|
$
|
(25,362
|
)
|
$
|
(21,623
|
)
|
$
|
(12,155
|
)
|
||
|
Statutory tax rate
|
26.5
|
%
|
26.5
|
%
|
25.0
|
%
|
|||||
|
Theoretical tax benefits on the above amount at the Israeli statutory tax rate
|
$
|
(6,721
|
)
|
$
|
(5,730
|
)
|
$
|
(3,039
|
)
|
||
|
Income tax at rate other than the Israeli statutory tax rate
|
16
|
|
12
|
|
7
|
|
|||||
|
Non-deductible expenses including equity based compensation expenses and other
|
651
|
|
1,864
|
|
895
|
|
|||||
|
Operating losses and other temporary differences for which valuation allowance was provided
|
6,107
|
|
3,870
|
|
2,159
|
|
|||||
|
Taxes in respect of prior years
|
—
|
|
29
|
|
—
|
|
|||||
|
Actual tax expense
|
$
|
53
|
|
$
|
45
|
|
$
|
22
|
|
||
|
f.
|
Foreign tax rates:
|
Taxable income of RRI was subject to tax at the rate of
35%
in
2015
,
2014
, and
2013
.
Taxable income of AMG was subject to tax at the rate of
30%
in
2015
,
2014
, and
2013
.
|
g.
|
Tax benefits under the Law for the Encouragement of Capital Investments, 1959 (the “Investment Law”):
|
Conditions for entitlement to the benefits:
Under the Investment Law, in 2012 the Company elected “Beneficiary Enterprise” status which provides certain benefits, including tax exemptions and reduced tax rates. Income not eligible for Beneficiary Enterprise benefits is taxed at a regular rate.
Income derived from Beneficiary Enterprise from productive activity will be exempt from tax for
ten
years from the year in which the Company first has taxable income, providing that
12
years have not passed from the beginning of the year
F-32
REWALK ROBOTICS LTD. AND SUBSIDIARIES
NOTES TO CONSOLIDATED FINANCIAL STATEMENTS
(U.S. dollars in thousands, except share and per share data)
of election. In the event of a dividend distribution from income that is exempt from company tax, as aforementioned, the Company will be required to pay tax of
10%
-
25%
on that income.
In the event of distribution of dividends from the said tax-exempt income, the amount distributed will be subject to corporate tax at the rate ordinarily applicable to the Beneficiary Enterprise’s income. Tax-exempt income generated under the Company’s “Beneficiary Enterprise” program will be subject to taxes upon dividend distribution or complete liquidation.
The entitlement to the above benefits is conditional upon the Company’s fulfilling the conditions stipulated by the Law and regulations published thereunder.
On December 29, 2010, the Knesset approved an additional amendment to the Law for the Encouragement of Capital Investments, 1959. According to the amendment, a reduced uniform corporate tax rate for exporting industrial enterprises (over
25%
) was established. The reduced tax rate will not be program dependent and will apply to the industrial enterprise’s entire income. The tax rates for industrial enterprises have been reduced gradually over a period of five years as follows: In 2011-2012, the reduced tax rate for development area A will be
10%
and for the rest of the country-
15%
. In 2013-2014, the reduced tax rate for development area A will be
7%
and for the rest of the country-
12.5%
. Starting 2015 and thereafter, the reduced tax rate for development area A will be
6%
and for the rest of the country-
12%
. However, in August 2013, the Israeli Knesset approved an amendment to the Investment Law, pursuant to which such scheduled gradual reduction was repealed beginning in 2014 and the rates for development area A will be
9%
and for the rest of the country-
16%
in 2014 and thereafter.
The Company has examined the effect of the adoption of the Amendment on its financial statements, and as of the date of the publication of the financial statements, the Company estimates that it will not apply the Amendment. The Company’s estimate may change in the future.
|
h.
|
Tax assessments:
|
RRL has final tax assessments up to and including the 2011 tax year.
RRI and AMG do not have final tax assessment, since their inception.
|
i.
|
Net operating carry-forward losses for tax purposes:
|
As of
December 31, 2015
, RRL has carry-forward losses amounting to approximately
$56,500
, which can be carried forward for an indefinite period.
F-33
REWALK ROBOTICS LTD. AND SUBSIDIARIES
NOTES TO CONSOLIDATED FINANCIAL STATEMENTS
(U.S. dollars in thousands, except share and per share data)
The components of financial expenses (income), net were as follows:
|
|
Year Ended December 31,
|
||||||||||
|
|
2015
|
2014
|
2013
|
||||||||
|
Financial expenses related to convertible loans
|
$
|
—
|
|
$
|
—
|
|
2,166
|
|
|||
|
Issuance of warrants to purchase convertible preferred share
|
—
|
|
835
|
|
—
|
|
|||||
|
Revaluation of fair value of warrants to purchase convertible preferred shares
|
—
|
|
(776
|
)
|
1,111
|
|
|||||
|
Issuance of convertible preferred shares
|
—
|
|
1,114
|
|
—
|
|
|||||
|
Foreign currency transactions and other
|
170
|
|
200
|
|
93
|
|
|||||
|
Financial expenses related to loan agreement with Kreos
|
—
|
|
100
|
|
—
|
|
|||||
|
Issuance cost related to warrants liability
|
—
|
|
128
|
|
—
|
|
|||||
|
Bank commissions
|
36
|
|
36
|
|
40
|
|
|||||
|
(Income) Expenses related to hedging transactions
|
(18
|
)
|
61
|
|
—
|
|
|||||
|
|
$
|
188
|
|
$
|
1,698
|
|
$
|
3,410
|
|
||
F-34
REWALK ROBOTICS LTD. AND SUBSIDIARIES
NOTES TO CONSOLIDATED FINANCIAL STATEMENTS
(U.S. dollars in thousands, except share and per share data)
Summary information about geographic areas:
ASC 280, “Segment Reporting” establishes standards for reporting information about operating segments. Operating segments are defined as components of an enterprise about which separate financial information is available that is evaluated regularly by the chief operating decision maker in deciding how to allocate resources and in assessing performance. The Company manages its business on the basis of
one
reportable segment, and derives revenues from selling systems and services (see Note 1 for a brief description of the Company’s business). The following is a summary of revenues within geographic areas:
|
|
Year Ended December 31,
|
||||||||||
|
|
2015
|
2014
|
2013
|
||||||||
|
Revenues based on customer’s location:
|
|
|
|
||||||||
|
Israel
|
$
|
—
|
|
$
|
—
|
|
$
|
83
|
|
||
|
United States
|
2,439
|
|
2,186
|
|
941
|
|
|||||
|
Europe
|
820
|
|
1,254
|
|
476
|
|
|||||
|
Asia-Pacific
|
487
|
|
511
|
|
88
|
|
|||||
|
Total revenues
|
$
|
3,746
|
|
$
|
3,951
|
|
$
|
1,588
|
|
||
|
|
December 31,
|
||||||
|
|
2015
|
2014
|
|||||
|
Long-lived assets by geographic region:
|
|
|
|||||
|
Israel
|
$
|
605
|
|
$
|
279
|
|
|
|
United States
|
483
|
|
88
|
|
|||
|
Germany
|
240
|
|
47
|
|
|||
|
|
$
|
1,328
|
|
$
|
414
|
|
|
(*) Long-lived assets are comprised of property and equipment, net.
Major customer data as a percentage of total revenues:
|
|
Year Ended December 31,
|
||||||
|
|
2015
|
2014
|
2013
|
||||
|
Customer A
|
14.8
|
%
|
15
|
%
|
*)
|
||
*) Less than 10%
F-35
REWALK ROBOTICS LTD. AND SUBSIDIARIES
NOTES TO CONSOLIDATED FINANCIAL STATEMENTS
(U.S. dollars in thousands, except share and per share data)
a. On January 4, 2016 the Company received from Kreos $
10,924
net of transaction fees and advance payment. See note 7.
b. In January and February 2016 the Company has granted to employees and non employees a total of
37,496
options to purchase the Company's ordinary shares under the Plan.
F-36
TABLE OF CONTENTS
Part IItem 1. BusinessItem 1A. Risk FactorsItem 1B. Unresolved Staff CommentsItem 2. PropertiesItem 3. Legal ProceedingsItem 4. Mine Safety DisclosuresPart IIItem 5. Market For Registrant's Common Equity, Related Stockholder Matters and Issuer Purchases Of Equity SecuritiesItem 6. Selected Financial DataItem 7. Management's Discussion and Analysis Of Financial Condition and Results Of OperationsItem 7A. Quantitative and Qualitative Disclosures About Market RiskItem 8. Financial Statements and Supplementary DataItem 9. Changes in and Disagreements with Accountants on Accounting and Financial DisclosureItem 9A. Controls and ProceduresItem 9B. Other InformationPart IIIItem 10. Directors, Executive Officers and Corporate GovernanceItem 11. Executive CompensationItem 12. Security Ownership Of Certain Beneficial Owners and Management and Related Stockholder MattersItem 13. Certain Relationships and Related Transactions, and Director IndependenceItem 14. Principal Accounting Fees and ServicesPart IVItem 15. Exhibits, Financial Statement SchedulesNote 1:- GeneralNote 2:- Significant Accounting PoliciesNote 3:- Prepaid Expenses and Other Current AssetsNote 4:- InventoriesNote 5:- Property and Equipment, NetNote 6:- Short Term Convertible LoansNote 7:- Loan and Warrants To Purchase Ordinary SharesNote 8:- Commitments and Contingent LiabilitiesNote 9:- Fair Value MeasurementsNote 10:- Shareholders Equity (deficiency)Note 11:- Warrants To Purchase Preferred ShareNote 12:- Income TaxesNote 13:- Financial Expenses (income), NetNote 14:- Geographic Information and Major Customer and Product DataNote 15:- Subsequent Events