LABORATORY CORP OF AMERICA HOLDINGS
10-Ks and 10-Qs
|
|
|
|
|
|
|
|
|
|
|
|
|
|
|
|
|
|
|
|
|
|
|
|
|
|
|
|
|
|
|
|
|
|
|
|
|
|
|
|
|
|
|
|
|
|
|
|
|
|
|
|
|
|
|
|
|
|
|
UNITED STATES
SECURITIES AND EXCHANGE COMMISSION
Washington, DC 20549
FORM 10-K
[X] Annual Report Pursuant to Section 13 or 15(d) of the Securities Exchange Act of 1934
For the fiscal year ended
December 31, 2013
or
[ ] Transition report pursuant to Section 13 or 15(d) of the Securities Exchange Act of 1934
For the transition period from ______ to ______
Commission file number - 1-11353
LABORATORY CORPORATION OF AMERICA HOLDINGS
(Exact name of registrant as specified in its charter)
|
Delaware
|
13-3757370
|
|
(State or other jurisdiction of incorporation or organization)
|
(I.R.S. Employer Identification No.)
|
|
358 South Main Street,
|
|
|
Burlington, North Carolina
|
27215
|
|
(Address of principal executive offices)
|
(Zip Code)
|
(Registrant's telephone number, including area code)
336-229-1127
Securities registered pursuant to Section 12(b) of the Act:
|
Title of each class
|
|
Name of exchange on which registered
|
|
Common Stock, $0.10 par value
|
|
New York Stock Exchange
|
Securities registered pursuant to Section 12(g) of the Act: None
Indicate by check mark whether the registrant is well-known seasoned issuer, as defined in Rule 405 of the Securities Act. Yes [X] No [ ].
Indicate by check mark if the registrant is not required to file reports pursuant to Section 13 or 15(d) of the Act. Yes [ ] No [X].
Indicate by check mark whether the registrant (1) has filed all reports required to be filed by Section 13 or 15(d) of the Securities Exchange Act of 1934 during the preceding 12 months (or for such shorter period that the registrant was required to file such reports), and (2) has been subject to such filing requirements for the past 90 days. Yes [X] No [ ].
Indicate by check mark whether the registrant has submitted electronically and posted on its corporate Website, if any, every Interactive Data File required to be submitted and posted pursuant to Rule 405 of Regulation S-T (§ 232.405 of this chapter) during the preceding 12 months (or for such shorter period that the registrant was required to submit and post such files). Yes [X] No [ ].
1
Indicate by check mark if disclosure of delinquent filers pursuant to Item 405 of Regulation S-K (§ 232.405) is not contained herein, and will not be contained, to the best of registrant's knowledge, in definitive proxy or information statements incorporated by reference in Part III of this Form 10-K or any amendment to this Form 10-K. [ ].
Indicate by check mark whether the registrant is a large accelerated filer, an accelerated filer, a non-accelerated filer, or a smaller reporting company. See the definitions of “large accelerated filer,” “accelerated filer” and “small reporting company” in Rule 12b-2 of the Exchange Act.
|
Large accelerated filer [X]
|
Accelerated Filer [ ]
|
|
Non-accelerated filer [ ] (Do not check if a smaller reporting company)
|
Smaller reporting company [ ]
|
Indicate by check mark whether the registrant is a shell company (as defined in Rule 12b-2 of the Act). Yes [ ] No [X].
As of
June 30, 2013
, the aggregate market value of the common stock held by non-affiliates of the registrant was approximately
$9.7 billion
, based on the closing price on such date of the registrant’s common stock on the New York Stock Exchange.
Indicate the number of shares outstanding of each of the registrant's classes of common stock, as of the latest practicable date:
85.3 million
shares as of
February 20, 2014
.
DOCUMENTS INCORPORATED BY REFERENCE
List hereunder the following documents if incorporated by reference and the Part of the Form 10-K into which the document is incorporated:
Portions of the Registrant’s Notice of Annual Meeting and Proxy Statement to be filed no later than 120 days following
December 31, 2013
are incorporated by reference into Part III.
2
Index
|
|
|
Page
|
|
|
|
|
|
Item 1.
|
||
|
|
||
|
|
||
|
|
||
|
|
||
|
|
||
|
|
||
|
|
||
|
|
||
|
|
||
|
|
||
|
|
||
|
|
||
|
|
||
|
|
||
|
|
||
|
Item 1A.
|
||
|
Item 1B.
|
||
|
Item 2.
|
||
|
Item 3.
|
||
|
Item 4.
|
||
|
|
|
|
|
|
|
|
|
Item 5.
|
||
|
Item 6.
|
||
|
Item 7.
|
||
|
Item 7A.
|
||
|
Item 8.
|
||
|
Item 9.
|
||
|
Item 9A.
|
||
|
Item 9B.
|
||
|
|
|
|
|
|
|
|
|
Item 10.
|
||
|
Item 11.
|
||
|
Item 12.
|
||
|
Item 13.
|
||
|
Item 14.
|
||
|
|
|
|
|
|
|
|
|
Item 15.
|
||
3
PART I
|
Item 1.
|
BUSINESS
|
Laboratory Corporation of America
®
Holdings and its subsidiaries (the “Company”), headquartered in Burlington, North Carolina, is the second largest independent clinical laboratory company in the United States based on 2013 net revenues. Since the Company’s founding in 1971 as a Delaware corporation, it has grown into a national network of 44 primary laboratories and approximately 1,700 patient service centers (“PSCs”) along with a network of branches and STAT laboratories (which are laboratories that have the ability to perform certain core tests and report the results to the physician quickly). Through its national network of laboratories, the Company offers a broad range of clinical laboratory tests that are used by the medical profession in core testing, patient diagnosis, and in the monitoring and treatment of disease. In addition, the Company has developed specialty testing operations, such as oncology testing, HIV genotyping and phenotyping, diagnostic genetics, cardiovascular disease risk assessment, HCV diagnosis and monitoring and clinical trials.
With over 34,000 employees worldwide, the Company processes tests on approximately 490,000 patient specimens daily and provides clinical laboratory testing services to clients throughout the United States and other countries including Mexico, the Bahamas, Belgium, Germany, Italy, Spain, the United Kingdom, China, Hong Kong, Singapore, Japan, South Korea, and three provinces in Canada. Its clients include physicians, hospitals, managed care organizations, governmental agencies, employers, pharmaceutical companies and other independent clinical laboratories that do not have the breadth of its testing capabilities. The Company offers a menu of several hundred tests that are frequently used in general patient care by physicians to establish or support a diagnosis, to monitor treatment or to search for an otherwise undiagnosed condition. The most frequently-requested of these tests include blood chemistry analyses, urinalyses, blood cell counts, thyroid tests, Pap tests, Hemoglobin A1C, PSA, STD tests (Ct, Ng, Tv, HIV), HCV tests, Vitamin D, microbiology cultures and procedures, and alcohol and other substance-abuse tests. The Company performs this core group of tests in its major laboratories using sophisticated and computerized instruments, with most results reported within 24 hours. In addition, the Company provides specialty testing services in the areas of allergy, clinical trials, diagnostic genetics, women's health, cardiovascular disease, identity, forensics, infectious disease, endocrine sciences, oncology, occupational testing and pain management.
The Company’s Annual Report on Form 10-K, Quarterly Reports on Form 10-Q, Current Reports on Form 8-K, and all amendments to those reports are made available free of charge through the Investor Relations section of the Company’s Website at www.labcorp.com as soon as practicable after such material is electronically filed with, or furnished to, the Securities and Exchange Commission. Additionally, the Securities and Exchange Commission ("SEC") maintains an Internet Website at http://www.sec.gov that contains reports, proxy and information statements, and other information regarding issuers that file electronically with the SEC, including the Company. The public may also read and copy any materials that the Company files with the SEC at the SEC's Public Reference Room at 100 F Street, NE, Washington, DC 20549. Information on the operation of the Public Reference Room may be obtained by calling the SEC at 1-800-SEC-0330.
The matters discussed in this "Business" section should be read in conjunction with the Consolidated Financial Statements found under Item 8 of Part II of this annual report, which include additional financial information about the Company's total assets, revenue, measures of profit and loss, and other important financial information.
The Company is committed to providing the highest quality laboratory services to its clients in full compliance with all applicable laws and regulations. The Company’s Code of Business Conduct and Ethics outlines ethics and compliance policies adopted by the Company to meet this commitment. These policies apply to all employees of the Company as well as the Company’s Board of Directors. The Code of Business Conduct and Ethics, as well as the Charters for the Audit, Compensation, Quality and Compliance, and Nominating and Corporate Governance Committees, and the Company’s Corporate Governance Guidelines, are posted on the Company’s Website www.labcorp.com. The Company has established a Compliance Action hotline (1-800-801-1005), which provides a confidential and anonymous method to report a possible violation of a LabCorp compliance policy or procedure, or an applicable law or regulation; a HIPAA Privacy hotline (1-877-234-4722), which provides a confidential and anonymous method to report a possible violation of a HIPAA privacy, security or billing policy or procedure; an Accounting hotline (1-866-469-6893), which provides a confidential and anonymous method to report a possible violation of internal accounting controls or auditing matters; and a global hotline (1-800-1-777-9999), which provides a confidential and anonymous method for non-US based employees to report, in local languages, a possible violation of LabCorp compliance policy or procedure or applicable law or regulation.
4
The Clinical Laboratory Testing Industry and Competition
Laboratory tests and procedures are used generally by hospitals, physicians and other health care providers and commercial clients to assist in the diagnosis, evaluation, detection, therapy selection, monitoring and treatment of diseases and other medical conditions through the examination of substances in the blood, tissues and other specimens. Clinical laboratory testing is generally categorized as either clinical pathology testing, which is performed on body fluids including blood, or anatomical pathology testing, in which a pathologist examines histologic or cytologic samples (e.g., tissue and other samples, including human cells). Clinical and anatomical pathology procedures are frequently ordered as part of regular physician office visits and hospital admissions in connection with the diagnosis and treatment of illnesses. Certain of these tests and procedures are used in the diagnosis and management of a wide variety of medical conditions such as cancer, infectious disease, endocrine disorders, cardiac disorders and genetic disease. It is estimated that although laboratory services account for less than 3% of total U.S. healthcare spending (and less than 2% of Medicare expenditures), they influence 60% to 70% of physician medical decisions.
The clinical laboratory industry consists primarily of three types of providers: hospital-based laboratories, physician-office laboratories and independent clinical laboratories, such as those operated by the Company. The Company believes that in 2013, the U.S. clinical laboratory testing industry generated revenues of approximately $60 billion based on Washington G-2 reports and other industry publications. The Centers for Medicare and Medicaid Services (“CMS”) of the Department of Health and Human Services ("HHS") has estimated that in 2013 there were more than 8,800 hospital-based laboratories, 118,900 physician-office laboratories and 5,700 independent clinical laboratories in the U.S.
The clinical laboratory business is intensely competitive. There are presently two major national independent clinical laboratories: the Company and Quest Diagnostics
®
Incorporated ("Quest"), which had approximately $7.1 billion in revenues in 2013. In addition, the Company competes with many smaller independent clinical and anatomical laboratories as well as laboratories owned by hospitals and physicians. The Company believes that health care providers selecting a laboratory often consider the following factors, among others:
|
•
|
accuracy, timeliness and consistency in reporting test results;
|
|
•
|
reputation of the laboratory in the medical community or field of specialty;
|
|
•
|
contractual relationships with managed care companies;
|
|
•
|
service capability and convenience offered by the laboratory;
|
|
•
|
number and type of tests performed;
|
|
•
|
connectivity solutions offered; and
|
|
•
|
pricing of the laboratory’s services.
|
The Company believes that ongoing consolidation in the clinical laboratory testing business will continue. In addition, the Company believes that it and the other large independent clinical laboratory testing companies will be able to increase their share of the overall clinical laboratory testing market due to a number of factors, including cost efficiencies afforded by large-scale automated testing, reimbursement reductions and managed health care entities that require cost efficient testing services and large service networks. In addition, legal restrictions on physician referrals and their ownership of laboratories, as well as increased regulation of laboratories, are expected to contribute to the continuing consolidation of the industry.
Effect of Market Changes on the Clinical Laboratory Business
The clinical laboratory business is undergoing significant change. Medicare (which principally serves patients 65 and older), Medicaid (which principally services low-income patients) and insurers have increased their efforts to control the cost, utilization and delivery of health care services. Measures to regulate health care delivery in general and clinical laboratories in particular have resulted in reduced prices, added costs and decreased test utilization for the clinical laboratory industry by increasing complexity and adding new regulatory and administrative requirements. From time to time, Congress has also considered changes to the Medicare fee schedules, and the Company believes that pressure to reduce government reimbursement will continue. In March 2010, comprehensive health care reform legislation, the Patient Protection and Affordable Care Act (“ACA”), was enacted. Among its provisions were reductions in the Medicare clinical laboratory fee schedule updates, one of which is a permanent reduction and the other to be applied in 2011 through 2015. On February 17, 2012, Congress passed legislation that reduced payment rates under the Medicare Clinical Laboratory Fee Schedule ("CLFS") by 2%, effective January 1, 2013. This reduction was applied after the adjustment of the fee schedule by the annual CPI update as reduced by the productivity adjustment (0.9%) and the 1.75% reduction under the ACA, and before the scheduled 2% sequestration reduction mandated by the Budget Control Act of 2011, which became effective April 1, 2013. The 2% sequestration reduction applied to both the Clinical Lab Fee Schedule, which represents approximately 11.7% of the Company's revenue, and the Physician Fee Schedule ("PFS"), which represents
5
approximately 1.1% of the Company's revenue. During 2013, the Company also faced significant payment reductions to certain surgical pathology procedures and a variety of other government reimbursement reductions. During 2014, the Company faces a 0.75% payment reduction to the CLFS and an estimated $6.6 million payment reduction to the PFS, assuming Congress acts to prevent further reductions mandated under the Sustainable Growth Rate (SGR) formula. On November 27, 2013, CMS finalized its proposal to begin annual evaluations of reimbursement rates for CLFS codes based on technological changes, volume, growth in utilization, cost and time on the CLFS. Under this proposal, test codes for which CMS is contemplating a payment adjustment will be listed in the Proposed PFS Rule each year, and the first adjustments to payment rates are scheduled to begin January 1, 2015. CMS is proposing to conduct its initial evaluation of all 1,250 codes on the CLFS over a five-year period ending December 31, 2019.
In addition, there are continuing market-based changes in the clinical laboratory business as diagnostic testing continues to shift away from traditional, fee-for-service medicine to managed care. The growth of the managed care sector and consolidation of managed care companies present various challenges and opportunities to the Company and other independent clinical laboratories. In 2006, the Company signed a ten-year agreement with UnitedHealthcare
®
to become its exclusive national laboratory. This agreement represented an industry first in terms of its length and exclusivity at a national level. In September 2011, the Company extended this agreement for an additional two years through the end of 2018. The various managed care organizations (“MCOs”) have different contracting philosophies, which are influenced by the design of their products. Some MCOs contract with a limited number of clinical laboratories and engage in direct negotiation of rates. Other MCOs adopt broader networks with generally uniform fee structures for participating clinical laboratories. In addition, some MCOs use capitation to fix the cost of laboratory testing services for their enrollees. Under a capitated reimbursement mechanism, the clinical laboratory and the managed care organization agree to a per member, per month payment for all authorized laboratory tests ordered during the month, regardless of the number or cost of the tests performed. For the year ended December 31, 2013, capitated contracts with MCOs accounted for approximately $187.3 million, or 3.2% of the Company’s net sales. The Company's ability to attract and retain managed care clients will become even more important as the impact of various health care reform initiatives continue, including expanded Health Insurance Exchanges and Accountable Care Organizations ("ACOs" or "ACO").
Despite the potential market changes discussed above, the Company believes that the volume of clinical laboratory testing will be positively influenced by several factors, including an expanded insured population under ACA, increased knowledge of the human genome leading to an enhanced appreciation of the value of gene-based diagnostic assays and the development of new therapeutics that have a “companion diagnostic” to help identify the subset of the population for whom it is effective or that may suffer adverse events.
The Company believes its enhanced esoteric menu, geographic footprint and operating efficiency provide a strong platform for growth. Additional factors that may lead to future volume growth include an increase in the number and types of tests that are readily available (due to advances in technology and increased cost efficiencies) for testing and diagnosis of disease and the general aging of the population in the U.S. The impact of these factors is expected to be partially offset by declines in volume as a result of increased controls over the utilization of laboratory services by Medicare, Medicaid, and other third-party payers, particularly MCOs. In addition, movement by patients into consumer driven health plans may have an impact on the utilization of laboratory testing.
Company Mission and Strategy
The Company's mission is to be a trusted knowledge partner for stakeholders, leading to growth in its businesses and continued creation of shareholder value. The Company will achieve this plan through the disciplined execution of a five-pillar strategy.
|
•
|
Deploy capital to investments that enhance its business and return capital to shareholders,
|
|
•
|
Enhance IT capabilities to improve the physician and patient experience,
|
|
•
|
Continue to improve efficiency to remain the most efficient and highest value provider of laboratory services,
|
|
•
|
Continue scientific innovation to offer new tests at reasonable and appropriate pricing, and
|
|
•
|
Develop knowledge services
|
The Company believes that the successful execution of this five-pillar strategy will fulfill its core mission of becoming a trusted knowledge partner for stakeholders, by offering the highest quality laboratory testing and most compelling value to its customers.
Pillar One:
Deploy capital to investments that enhance the Company's business and return capital to shareholders
The Company remains committed to growing its business through strategic acquisitions and licensing agreements. Since 2008, the Company has invested approximately $2.4 billion in strategic business acquisitions. These acquisitions have strengthened the Company's geographic presence and expanded its specialty testing operations. The Company believes the acquisition market
6
remains attractive with a number of opportunities to strengthen its scientific capabilities, grow esoteric testing and increase presence in key geographic areas.
The Company believes it has some of the premier genetics, oncology and infectious disease businesses in the laboratory industry. With its acquisition of Genzyme Genetics
1
in December of 2010, combined with its existing genomic capabilities, the Company offers prenatal genetic testing and access to novel testing technologies such as the SMA molecular genetics assay, and the entire Reveal
®
family of SNP Microarrays, the Inheritest
®
carrier testing assays and a complete suite of BRCA mutation tests. As market demand for prenatal genetics increases, the Company believes it is well positioned to provide the broadest range of offerings, including the services of approximately 150 genetic counselors. In oncology, the Company's broad molecular oncology test menu and specialized sales force complement the strong pathology expertise of Genzyme Genetics and two of the Company's earlier acquisitions - Accupath Diagnostic Laboratories, Inc. dba US Labs
2
and Dianon Systems, Inc.
3
In the area of Infectious Disease, with the acquisition of Monogram Biosciences, Inc. ("Monogram Biosciences") in 2009, the Company expanded its offerings around HIV and HCV detection and monitoring for enhanced management of these diseases.
In 2013, the Company continued to deploy cash and return value to shareholders through share repurchase. During the year, the Company acquired approximately 10.4 million LabCorp shares for $1,015.6 million. Since 2003, the Company has repurchased approximately $5.6 billion in shares at an average price of approximately $68 per share.
1. Genzyme Genetics and its logo are trademarks of Genzyme Corporation and used by Esoterix Genetic Laboratories, LLC, a wholly-owned subsidiary of LabCorp, under license. Esoterix Genetic Laboratories and LabCorp are operated independently from Genzyme Corporation. The reproductive genetics services of Esoterix Genetic Laboratories are now offered through the Company’s Integrated Genetics business.
2. The oncology services of Accupath Diagnostic Laboratories and Esoteric Genetic Laboratories are now offered through the Company's Integrated Oncology business.
3. The services of Dianon Systems are now offered through the Company's Dianon Pathology business.
Pillar Two:
Enhance IT capabilities to improve the physician and patient experience
The Company is committed to becoming a trusted knowledge partner, as new developments in analytics and trending are changing existing ordering and workflow processes in the clinical laboratory industry. The Company's LabCorp Beacon
®
platform is a series of assets and functionalities that enhance the customer experience and provide an end-to-end lab solution. These assets and functionalities include:
|
•
|
Physician, patient and payer portals
|
|
•
|
Express electronic ordering for essentially all of the Company's brands and services
|
|
•
|
Integrated results viewing and enhanced reports
|
|
•
|
Lab analytics that provide one-click trending of patient, test and population data
|
|
•
|
Clinical decision support tools at the point of ordering and resulting
|
|
•
|
AccuDraw
®
which assists phlebotomists in improving accuracy, workflow and turnaround time
|
|
•
|
Online appointment scheduling
|
|
•
|
LabCorp Beacon
®
: Mobile solutions for market leading mobile devices
|
|
•
|
Services-oriented architecture with rules-based engines, content aggregation and seamless integration with practice workflow
|
In 2013, the Company introduced its new population health analytics programs, called LabCorp Beacon
®
: Analytics, which provide healthcare business intelligence tools to hospitals, physician practices and ACOs. These tools assist customers in their compliance and reporting requirements with respect to efficient management of their productivity, quality and patient outcome metrics. The Company's robust rules engine maintains more than 600 clinical quality measures that are highly customizable and provide full compliance with Meaningful Use requirements and ACO, Joint Commission and Physician Quality Reporting System (“PQRS”) reporting requirements. Real time clinical alerts highlight gaps in care for patients and patient populations. These industry-leading, data driven services position LabCorp as a trusted partner to healthcare stakeholders, providing the knowledge to optimize decision making, improve health outcomes, and reduce treatment costs.
The Company continues to see steady adoption of LabCorp Beacon
®
: Patient, a tool that was launched in the fourth quarter of 2012. This Patient Portal is a secure and easy-to-use online solution that enables patients to receive and share lab results, make lab appointments, pay bills, set up automatic alerts and notifications and manage health information for the entire family.
LabCorp Beacon: Mobile allows health care providers to review lab test results as they become available via their iPhone
®
, iPad
®
, or Android™ mobile digital devices. Providers can view patient lab results, patient demographics, and contact information related to those results. LabCorp Beacon: Mobile also offers the capability to search the Company’s Directory of Services or view contact information for the Company’s scientific/medical experts by discipline directly from within the application.
7
The Company continues to improve its Electronic Medical Record (“EMR”) connectivity, interfacing to more than 650 different EMR partner solutions. The Company is working closely with leading EMR partners to streamline connectivity and enhance lab workflow, ensuring that clients can take advantage of these solutions. Over 8,500 new client EMR interfaces were added during 2013, bringing its total EMR interfaces to over 38,000. The Company remains committed to its open platform strategy, allowing customers to connect seamlessly to LabCorp directly or via their EMR of choice.
In 2014, the Company will continue to improve the physician and patient experience by enhancing LabCorp Beacon, LabCorp Beacon: Analytics, LabCorp Beacon: Patient, LabCorp Beacon: Mobile and EMR connectivity solutions. Additional key enhancements will include decision support, enhanced results reporting, and services aimed at further optimizing the lab ordering and resulting processes, to ensure LabCorp's position as a trusted knowledge partner.
Pillar Three:
Continue to improve efficiency to remain the most efficient and highest value provider of laboratory services
The Company maintains a constant focus on improving productivity and lowering costs throughout all phases of its operations from specimen collection to processing and testing, result reporting and billing. The Company's automation initiatives, improvements to its logistics network and enhancements to its supply chain operations have increased its per-employee throughput in primary laboratories more than 50% since the beginning of 2008. The Company has also focused on its call center operations by improving call response time while enhancing efficiency by reducing the number of call center facilities by over 65%. Further, the Company's service metrics, customer satisfaction ratings and turnaround times consistently exceed expectations.
In 2013, the Company completed construction of a new 147,000 square-foot testing hub in Phoenix, Arizona. This location offers the Company excellent logistical synergies and access to a quality labor pool. The facility began testing operations in September 2013 and will be used to consolidate a number of the Company's laboratories, including the Company's regional primary laboratory, and laboratories for its Integrated Oncology, Colorado Coagulation and Endocrine Sciences businesses.
In 2013, the Company began installation of its Propel™ robot in its Burlington, North Carolina primary laboratory. The Company plans to deploy Propel throughout its major laboratories and expects these robotics to enhance efficiency and quality by replacing the manual splitting and sorting process. The Company has commenced installation of Propel in its Tampa laboratory, and the robot should be operational in the second quarter of 2014. Propel complements LabCorp Touch
TM
accessioning, which provides leading-edge automation at the Company's PSCs and allows the Company to reduce the amount of accessioning that is performed in its primary laboratories.
The Company's expansion of the Center for Esoteric Testing ("CET") and its Burlington, N.C. primary laboratory, completed in 2011, leverages LEAN principles to conduct testing more efficiently and consolidate satellite locations. The Company has consolidated a number of specialty testing businesses into this facility, including ViroMed Laboratories, and infectious disease testing from its Center for Molecular Biology and Pathology (“CMBP”) laboratory. LEAN strategies have also proved to be effective in creating process improvements in the Company's billing and collection operations. The Company will continue to examine and adjust its test menu and facility testing matrix to optimize service and efficiency. As part of an ongoing commitment to efficiency, the Company has also begun a comprehensive enterprise-wide review of its cost structure.
Pillar Four:
Continue scientific innovation to offer new tests at reasonable and appropriate pricing
Innovative tests continue to be an important growth driver for the Company. In 2013, the Company introduced 152 new assays, collaborating with leading companies and academic institutions to provide physicians and patients with the most scientifically advanced testing in the industry.
The Company is playing an important role in many aspects of the emerging model of personalized healthcare in which treatments and therapeutics are tailored to an individual, often based on his or her genetic signature (or that of a particular tumor/strain of virus). LabCorp was a leader in HIV genotyping, one of the first major advances in personalized medicine, which was used to test for resistance to specific drugs. The Company continues to build on this legacy through publications and the development of new tests and/or resources such as the QIAGEN therascreen®KRAS RGQ PCR Kit, which is a new FDA-approved companion diagnostic for certain colorectal cancer patients that the Company introduced in 2013. The Company's other significant offerings in 2013 include an expanded testing menu to help clinicians diagnose, treat and monitor the course of Inflammatory Bowel Disease (IBD), a 4th generation HIV assay for earlier detection of acute HIV infection, a suite of BRCA 1/2 Breast Cancer Mutation tests, Hepatitis C Virus Q80k polymorphism screening for the drug OLYSIO
TM
(simeprevir) and the COBAS
®
AmpliPrep/COBAS
®
TaqMAN
®
HCV Test, v2.0. COBAS AmpliPrep is a quantitative viral load assay for Hepatitis C (HCV) patients that enables more accurate assessments of response to antiviral therapy.
8
Through its clinical trials division, the Company has taken a leadership role in working with pharmaceutical, biotechnology and in vitro diagnostics companies, providing innovative laboratory services to support drug and device development. This includes a strong focus on the development of companion diagnostics, such as the genetic tests for ALK, BRAF, EGFR, KRAS and others linked to targeted therapy options. The Company's capabilities in assay development, its access to a broad spectrum of testing platforms, and its experience with clinical trials has positioned LabCorp as a market leader. The Company continues to add capabilities to strengthen this companion diagnostics offering. The Company opened a new state-of-the-art biorepository for sample storage and retention in 2009. In 2011, the Company acquired Clearstone
®
Central Laboratories, a global central laboratory specializing in drug development and pharmaceutical services. This acquisition provided the Company with access to a global network of labs, including sites in Asia and Europe. The pharmaceutical industry is increasingly conducting work outside of North America and the Company is expanding its ability to perform work internationally.
Beyond clinical trials, there are also many examples where companion diagnostics have moved into the commercial setting and are helping improve care, such as: (1) assisting in determining the efficacy of a drug for an individual; (2) helping the physician select the correct dosage; and (3) reducing adverse events. The Company will continue to play an important role in both bringing new companion diagnostics to the market and making them commercially available once the drug has been approved, leveraging its experience from supporting the clinical trials that demonstrate the safety and efficacy of such products.
Pillar Five:
Develop knowledge services
The Company recognizes that fundamental changes are taking place in the U.S. healthcare system and the clinical laboratory industry and anticipates the continued movement of healthcare delivery toward large health systems, integrated delivery networks, ACOs, patient-centered medical homes, and mega-physician practices. The Company believes that its capabilities provide an end-to-end lab solution for these customers, meeting the requirements of new care models with population health management tools, decision support programs, patient counseling, integrated clinical reports and patient-centric data solutions. These offerings are focused around IT, but it is the completeness of these solutions for lab needs that differentiates LabCorp and provides value for its customers.
The Company's BeaconLBS
®
Platform is a point-of-care decision support service that interfaces with test ordering systems to assist physicians in lab and test selection, helping them to order the right test for the patient at the right time. Physicians, patients healthcare delivery systems and payers will benefit from this innovation, which will improve quality and more effectively manage costs without disrupting physician work flow. The Company's rules engine interfaces with payer policies for ordering, utilization, adjudication and payment.
In 2013, BeaconLBS signed an agreement with UnitedHealthCare to implement its products in Florida. The Company anticipates implementation to begin in the latter half of 2014.
Laboratory Testing Operations and Services
The Company has a national network of primary testing laboratories, specialty testing laboratories, branches, PSCs and STAT laboratories. A branch is a central facility that collects specimens in a region for shipment to one of the Company's laboratories for testing. A branch is also frequently used as a base for sales and distribution staff. Generally, a PSC is a facility maintained by the Company to serve the patients of physicians in a medical professional building or other strategic location. The PSC staff collects the specimens for testing if requested by the physician. Most patient specimens are collected by the customer's staff. The specimens, and any accompanying documents including test request forms if the test order was not placed electronically, are collected from customer locations or PSCs and sent, principally through the Company's in-house courier system (and, to a lesser extent, through independent couriers), to one of the Company's primary testing facilities for testing. Test requests are completed by the client or transcribed by a Company patient service technician from a client order to indicate the tests to be performed and provide the necessary billing information. Some of the Company's PSCs also function as STAT labs, which are laboratories that have the ability to perform certain core tests and report results to the physician quickly.
Each specimen and related request form is checked for completeness and then given a unique identification number. The unique identification number assigned to each specimen helps to ensure that the results are attributed to the correct patient. The test request forms are sent to a data entry operator who ensures that a file is established for each patient and the necessary testing and billing information is entered. Once this information is entered into the software system, the tests are performed and the results are entered through an electronic data interchange interface or manually, depending upon the tests and the type of equipment involved. Most of the Company's automated testing equipment is connected to the Company's information systems. Most core testing is completed by early the next morning and test results are in most cases electronically delivered to clients via LabCorp Beacon, smart printers, personal computer-based products or electronic interfaces.
9
Testing Services
Core Testing
The Company offers a broad range of clinical laboratory tests and procedures. Several hundred of these are frequently used in general patient care by physicians to establish or support a diagnosis, to monitor treatment or medication, or to search for an otherwise undiagnosed condition. The most frequently-requested of these core tests include blood chemistry analyses, urinalyses, blood cell counts, thyroid tests, Pap tests, Hemoglobin A1C, PSA, STD tests (Ct, Ng, Tv, HIV), HCV tests, microbiology cultures and procedures, and alcohol and other substance-abuse tests. These core procedures are most often used by physicians in their outpatient office practices. Physicians may elect to send such procedures to an independent laboratory (including hospital laboratories) or they may choose to establish their own laboratory to perform some of the tests.
The Company performs this core group of core tests in each of its primary laboratories. This testing constitutes a majority of the tests performed by the Company. The Company generally performs and reports most core procedures within 24 hours, utilizing a variety of sophisticated and computerized laboratory testing instruments.
Specialty Testing
The Company’s Specialty Testing Group performs esoteric testing, cancer diagnostics, clinical trials central lab services and other complex procedures. The Company's specialty testing businesses and their areas of expertise are summarized in the chart below.
The Specialty Testing Group offers advanced methods and access to scientific expertise in the following disciplines:
Anatomic Pathology/Oncology.
The Company offers advanced comprehensive tumor tissue analysis, including immunohistochemistry (IHC), cancer cytogenetics and fluorescence in situ hybridization (FISH) through its DIANON Pathology (“DIANON”) and Integrated Oncology specialty testing laboratories. Applications for molecular diagnostics continue to increase in oncology for both the analysis of leukemia as well as the assessment of solid tumors. In cancers such as colon and lung cancer, assays such as K-ras, BRAF and EGFR mutation analysis are associated with appropriate therapy choices for a given patient (Pharmacogenomics).
Cardiovascular Disease.
The Company's cardiovascular menu includes core cholesterol tests and expanded lipid profiles as well as a metabolic syndrome profile and tests for thrombosis and stroke. The Company also offers complete testing for monitoring disease progression and response to therapy.
10
Coagulation.
The Company offers an extensive menu of tests for hemostasis and thrombosis, including bleeding profiles and screening tests, profiles for reproductive health, factor analysis, thrombin generation markers, and thrombotic risk evaluation.
Diagnostic Genetics.
The Company offers cytogenetic, molecular cytogenetic, biochemical and molecular genetic tests. The biochemical genetics offerings include a variety of prenatal screening options including integrated and sequential prenatal assays for more sensitive assessment of Down Syndrome risk. The Company has expanded its cytogenetics offerings through the use of whole genome single-nucleotide polymorphism ("SNP") microarray technology, which provides enhanced detection of subtle chromosomal changes associated with the etiology of mental retardation, developmental delay and autism. The molecular genetics services include multiplex analyses of a variety of disorders and gene sequencing applications for both somatic and germ-line alterations. Through Integrated Genetics, the Company provides the most comprehensive genetic test menu in the industry as well as approximately 150 genetic counselors and 8 medical geneticists to work with the Company's physician clients in optimizing patient outcomes.
Endocrinology.
The Company has emerged as a leading provider of advanced hormone/steroid testing including comprehensive services for the endocrine specialist. The Company has expanded its menu in esoteric endocrine testing and has launched a companywide initiative to develop steroid testing utilizing mass spectrometry technology. Mass spectrometry is quickly becoming the gold standard for detection of low levels of small molecule steroids including testosterone in women, children and hypogonadal men. The Company additionally offers several endocrine related genetic tests that include CYP21 mutation for congenital adrenal hyperplasia, SHOX gene for short stature, RET mutation for thyroid cancer as well as extensive age and gender-related reference intervals.
Infectious Disease
.
The Company provides complete HIV testing services including viral load measurements, genotyping and phenotyping and host genetic factors (e.g., HLA B*5701 test) that are important tools in managing and treating HIV infections. The addition of resistance tests, PhenoSense
®
, PhenoSenseGT
®
, Trofile
®
, and GenoSure PRIme
SM
complement the existing HIV GenoSure
®
assay and provide an industry-leading, comprehensive portfolio of HIV resistance testing services. The Company also provides extensive testing services for HCV infections, including both viral load determinations and strain genotyping and host genetic factors (e.g. IL-28B test and HCV GenoSure
®
NS3/4A). The Company continues to develop molecular assays for infectious disease. In January 2011, the Company published on its website a comprehensive virology report that detailed the results from hundreds of thousands of infectious disease tests. The report analyzes vast amounts of data gathered by the Company to inform clinicians, public health authorities and other laboratory scientists regarding viral frequencies, distributions, trends, genotypes and associations.
Obstetrics/Gynecology.
The Company offers a comprehensive menu of women's health testing, including NuSwab
®
high quality convenient STD testing, as well as liquid-based Pap testing with image-guided cervical cytology for improved cervical cancer detection, and out-of-the-vial Pap testing with options for HPV, Chlamydia, and gonorrhea. The Company also offers tests and technologies that span the continuum of care for reproductive health, including maternal serum screening, prenatal diagnostics, ethnicity carrier screening, testing for causes of infertility or miscarriage and postnatal testing services.
Pharmacogenetics.
The Company provides access to the latest tests in the emerging field of pharmacogenetics. These tests can help physicians understand how a patient will metabolize certain drugs, allowing them to recommend the most appropriate therapies or adjust dosing.
Clinical Trials
.
The Company regularly performs clinical laboratory testing for pharmaceutical and diagnostics companies conducting clinical research trials on new drugs or diagnostic assays. This testing often involves periodic testing of patients participating in the trial over several years. In 2011, the Company acquired Clearstone Central Laboratories, a global central laboratory specializing in drug development and pharmaceutical services. The Company has made a concerted effort in companion diagnostics to translate predictive biomarkers used in clinical trials into clinical practice.
Identity
.
The Company provides forensic identity testing used in connection with criminal proceedings and parentage evaluation services which are used to assist in determining parentage for child support enforcement proceedings and determining genetic relationships for immigration purposes. Parentage testing involves the evaluation of immunological and genetic markers in specimens obtained from the child, the mother and the alleged father. The Company also provides testing services in reconstruction cases, which assist in determining parentage without the presence of the parent in question.
Occupational Testing Services
.
The Company provides testing services for the detection of drug and alcohol abuse for private and government customers. These testing services are designed to produce forensic quality test results that satisfy the rigorous requirements for admissibility as evidence in legal proceedings. The Company also provides other analytical testing and a
11
variety of management support services.
Chronic Disease Programs.
Litholink is a nationally-recognized kidney stone analysis laboratory which has also developed a programmatic approach to the comprehensive treatment of chronic diseases, including kidney disease, cardiovascular disease, and metabolic bone disease. The Company believes these chronic disease programs represent potential significant savings to the health care system by increasing the detection of early-stage diseases and effectively managing chronic disease conditions.
Development of New Tests
Advances in medicine continue to fundamentally change diagnostic testing, and new tests are allowing clinical laboratories to provide unprecedented amounts of health-related information to physicians and patients. New molecular diagnostic tests that have been introduced over the past several years, including a gene-based test for human papillomavirus, HIV drug resistance assays, and molecular genetic testing for cystic fibrosis, have now become part of standard clinical practice. The Company continued its industry leadership in gene-based and esoteric testing in 2013, generating $2.0 billion in revenue. As science continues to advance, the Company expects new testing technologies to emerge; therefore, it intends to continue to invest in advanced testing capabilities so that it can remain on the cutting edge of diagnostic laboratory testing. The Company has added, and expects to continue to add, new testing technologies and capabilities through a combination of internal development initiatives, technology licensing and partnership transactions and selected business acquisitions. Through its national sales force, the Company rapidly introduces new testing technologies to physician customers. This differentiation is important in the retention and growth of business.
In 2013, the Company continued its emphasis on scientific vision and leadership with the introduction of 152 significant test menu and automation enhancements. The Company is focused on the expansion of existing programs in molecular diagnostics as well as the introduction of new assay and assay platforms through licensing partnerships, acquisitions and internal development. Evidence of the commitment to the development of new diagnostics and applications for those diagnostics was provided in the more than 117 scientific publications (articles, book chapters, books and abstracts) and presentations at scientific meetings authored by the Company's scientific team in 2013. Examples of new tests and services introduced in 2013 include:
Cardiovascular Disease Risk Assessment
- The Company launched a program to assist clinicians in the screening and risk assessment, diagnosis and confirmation as well as the management of cardiovascular-related disorders. The program includes innovative visual result displays, analytics, and trending as well as a Cardiovascular Disease Risk Assessment decision support for lipid assessment and individualized patient counseling material. The program is available through the LabCorp Beacon
®
solution, other client products and the customer's EMR.
BRCA
1/2
Tests
- The Company added to its industry leading menu of genetic tests by introducing a suite of BRCA 1/2 tests. The BRCA1 and BRCA2 (breast cancer 1 and 2) genes are found within normal human genetic material. The BRCA 1/2 tests detect mutations or alterations found within these genes that signal an increased risk for several specific types of cancer, including breast cancer and ovarian cancer.
Infectious Disease Companion Diagnostics
- The Company launched an enhanced version of its HCV GenoSure® NS3/4, a drug resistance test that screens for the Q80K polymorphism. Q80K is a naturally occurring polymorphism that develops in certain strains of HCV, making the virus less susceptible to Janssen Therapeutics’ OLYSIO™ (simeprevir), which was approved by the U.S. Food and Drug Administration for the treatment of certain adult patients diagnosed with genotype 1chronic hepatitis C (HCV). In clinical trials, patients with HCV genotype 1 containing the Q80K polymorphism demonstrated significantly lower response rates to treatment with OLYSIO. Approximately one-third of HCV patients have the virus with the Q80K polymorphism. Given the high frequency of the Q80K polymorphism and its significant impact on OLYSIO’s success rate, it is recommended that clinicians screen patients before initiating treatment.
HIV Diagnostics -
The Company offers a 4th generation HIV antigen/antibody combination assay and a new diagnostic algorithm that improves screening for HIV infection. Earlier detection of HIV can improve individual treatment and help reduce the spread of HIV infection.
Companion Diagnostics
- The Company launched QIAGEN’s therascreen® KRAS RGQ PCR Kit, a new FDA-approved companion diagnostic for certain colorectal cancer patients. The therascreen KRAS test is the only FDA-approved companion diagnostic for use with ERBITUX® (cetuximab), for patients with KRAS mutation-negative (wild type) epidermal growth factor receptor (EGFR)-expressing metastatic colorectal cancer.
12
Oncology -
The Company launched a new multi-gene oncology panel called IntelliGEN
SM
on its NGS platform. The IntelliGEN assay improves sensitivity and detection rates for somatic mutations in cancer, assessing approximately 2600 mutations within 50 oncogenes/tumor suppressor genes. IntelliGEN is available through Integrated Oncology.
Infectious Disease -
The Company is the first major clinical reference laboratory to offer the Roche COBAS AmpliPrep/COBAS TaqMan HCV Test, v2.0. The COBAS AmpliPrep is a quantitative viral load assay for HCV patients with enhanced sensitivity, enabling more accurate assessments of response to antiviral therapy.
Expanded Services for Inflammatory Bowel Disease -
The Company expanded its test menu to help clinicians diagnose, treat and monitor the course of Inflammatory Bowel Disease (IBD). These enhancements are adjuncts to LabCorp’s broader offering of digestive disease testing that includes cost-efficient cascade testing to help physicians diagnose and treat Irritable Bowel Syndrome and non-Celiac Gluten Sensitivity.
The Company continues its collaboration with university, hospital and academic institutions such as Duke University, The Johns Hopkins University, the University of Minnesota and Yale University to license and commercialize new diagnostic tests.
Clients
The Company provides testing services to a broad range of health care providers and other customers. During the year ended December 31, 2013, no client or group of clients under the same contract accounted for more than 11% of the Company’s consolidated net sales. The primary client groups serviced by the Company include:
Independent Physicians and Physician Groups.
Physicians requiring testing for their patients are one of the Company’s primary sources of requests for testing services. Fees for clinical laboratory testing services rendered for these physicians are billed either to the physician, to the patient or the patient’s third-party payer such as an insurance company, Medicare or Medicaid. Billings are typically on a fee-for-service basis. If the billings are to the physician, they are based on a customer fee schedule and are subject to negotiation. Otherwise, the patient or third-party payer is billed at the Company's patient fee schedule, subject to third-party payer contract terms and negotiation by physicians on behalf of their patients. Revenues received from Medicare and Medicaid billings are based on government-set fee schedules and reimbursement rules.
Hospitals.
The Company provides hospitals with services ranging from core and specialty testing to laboratory management services. Hospitals generally maintain an on-site laboratory to perform immediately needed testing of patients receiving care. However, they also refer less time sensitive procedures, less frequently needed procedures and highly specialized procedures to outside facilities, including independent clinical laboratories and larger medical centers. The Company typically charges hospitals for any such tests on a fee-for-service basis which is derived from the Company’s client fee schedule. Fees for management services are typically billed monthly at contractual rates.
Managed Care Organizations.
The Company serves many MCOs, and these organizations have different contracting philosophies, that are influenced by the design of the products. Some MCOs contract with a limited number of clinical laboratories and engage in direct negotiation of rates. Other MCOs adopt broader networks with generally uniform fee structures for participating clinical laboratories. In addition, some MCOs use capitation to fix the cost of laboratory testing services for their enrollees. Under a capitated reimbursement mechanism, the clinical laboratory and the managed care organization agree to a per member, per month payment to pay for all authorized laboratory tests ordered.
Other Institutions.
The Company serves other institutions, including government agencies, large employers, pharmaceutical companies and other independent clinical laboratories that do not have the breadth of the Company’s testing capabilities. These institutions typically pay on a negotiated fee-for-service basis.
Payers
Testing services are billed to private patients, Medicare, Medicaid, commercial clients, MCOs and other insurance companies. Tests ordered by a physician may be billed to different payers depending on the medical benefits of a particular patient. Most testing services are billed to a party other than the physician or other authorized person who ordered the test. For the year ended December 31, 2013, requisitions (based on the total volume of requisitions excluding the Company's non-U.S. clinical diagnostic laboratory operations in Ontario, Canada, which is reviewed separately by corporate management for the purposes of allocation of resources) and average revenue per requisition by payer are as follows:
13
|
Requisition
Volume
as a % of Total
|
Revenue
per
Requisition
|
|||||
|
Private Patients
|
1.7
|
%
|
$
|
181.61
|
|
|
|
Medicare and Medicaid
|
15.1
|
%
|
$
|
50.76
|
|
|
|
Commercial Clients
|
34.5
|
%
|
$
|
40.02
|
|
|
|
Managed Care
|
48.7
|
%
|
$
|
42.38
|
|
|
A portion of the managed care fee-for-service revenues are collectible from patients in the form of deductibles, copayments and coinsurance.
For the Company's subsidiary operations in Ontario, Canada, the Ministry of Health determines who can establish a licensed community medical laboratory and caps the amount that each of these licensed laboratories can bill the government sponsored healthcare plan. The Ontario government-sponsored healthcare plan covers the cost of clinical laboratory testing performed by the licensed laboratories. The provincial government discounts the annual testing volumes based on certain utilization discounts and establishes an annual maximum it will pay for all community laboratory tests. The agreed-upon reimbursement rates are subject to Ministry of Health review at the end of each year and can be adjusted (at the government's discretion) based upon the actual volume and mix of test work performed by the licensed providers in the province during the year. In 2013, the amount of the Company's cap revenue derived from the Ontario government sponsored healthcare plan was CN$206.8.
Seasonality
The Company experiences seasonality in its testing business. The volume of testing generally declines during the year-end holiday periods and other major holidays. Volume can also decline due to inclement weather, reducing net revenues and cash flows. Given the seasonality of the testing business, comparison of results for successive quarters may not accurately reflect trends or results for the full year.
Investments in Joint Venture Partnerships
The Company holds investments in three joint venture partnerships; located in Milwaukee, Wisconsin, Alberta, Canada and Florence, South Carolina. These businesses represent partnership agreements between the Company and other independent diagnostic laboratory investors. Under these agreements, all partners share in the profits and losses of the businesses in proportion to their respective ownership percentages. All partners are actively involved in the major business decisions made by each joint venture.
The Canadian partnership has a license to conduct diagnostic testing services in the province of Alberta. Substantially all of its revenue is received as reimbursement from the Alberta government's health care programs. While the Canadian license guarantees the joint venture the ability to conduct diagnostic testing in Alberta, it does not guarantee that the provincial government will continue to reimburse diagnostic laboratory testing in future years at current levels. If the provincial government decides to limit or reduce its reimbursement of laboratory diagnostic services, it would have a negative impact on the profits and cash flows the Company derives from its Canadian joint venture. The Alberta government's health care program has recently issued a request for proposals for laboratory services that includes the scope of services performed by the Canadian partnership. If this contract were awarded to another provider, the Canadian partnership's revenues would decrease substantially and the carrying value of the Company's investment could potentially be impaired.
Sales, Marketing and Client Service
The Company offers its services through a sales force focused on serving the specific needs of customers in different market segments. These market segments generally include Primary Care, Obstetrics-Gynecology, Specialty Medicine (e.g. Infectious Disease, Endocrinology, Gastroenterology and Rheumatology), Oncology and Hospitals.
The Company’s sales force is compensated through a combination of salaries, commissions and bonuses at levels commensurate with each individual’s qualifications, performance and responsibilities. The general sales force is responsible for both new sales and customer retention. This general sales force is also supported by a team of clinical specialists who focus on selling esoteric testing and meeting the unique needs of the specialty medicine markets.
14
The Company competes primarily on the basis of quality of testing, breadth of menu, price, innovation of services, convenience and access points throughout the nation.
Information Systems
The Company has developed and implemented information management systems (“IS”) supporting its operations, as well as positioning the Company as a trusted knowledge partner. The Company operates standard platforms for its core business services including laboratory, billing, financial and reporting systems. These standard systems ensure consistency and availability on a national scale. Additionally, the Company continues to expand its primary laboratory capabilities with services supporting digital pathology and enhanced specialty lab solutions. With approximately 91% of its domestic revenue (approximately 86% of consolidated revenue) processed through these systems, the Company's centralized IS platforms provide tremendous operational efficiencies, enabling the Company to provide consistent, structured, and standardized laboratory results and superior patient care at a national level.
In response to continued market demand for electronic laboratory data and a commitment to improving the physician and patient experience, the Company continues to expand its LabCorp Beacon
®
platform with new capabilities and services. The Company continues to leverage information technology advancements to deliver enhanced services through its LabCorp Beacon: Patient product and expanded access to AccuDraw
®
capabilities. Additionally, the Company will continue to expand and improve client connectivity through its LabCorp Beacon platform designed to improve lab related workflow such as ordering tests and sharing, viewing and analyzing lab results. The platform is also available in a mobile edition accessible via market leading mobile devices. LabCorp Beacon is a key component of the Company's connectivity portfolio, whereby the Company provides physicians a choice of tailored solutions that also include robust integration with electronic medical records/electronic health records and personal health records ("PHR") applications.
The focus on the advancement of health information technology is a reflection of the growing demand for self-service, integrated healthcare data and decision support capabilities. The Company's centralized analytic platform delivers enhanced analytic services and decision support to physicians, hospitals, local communities, state agencies and national networks. The Company has a number of new population health analytics programs in development to provide healthcare business intelligence tools to hospitals, physician practices, and ACOs. These tools assist customers in their compliance and reporting requirements with respect to efficient management of their productivity, quality and patient outcome metrics. The Company's robust rules engine maintains more than 600 clinical quality measures that are highly customizable and provide full compliance with Meaningful Use requirements and ACO, Joint Commission and PQRS reporting requirements. Real time clinical alerts highlight gaps in care for patients and patient populations. These industry-leading, data driven services position LabCorp as a trusted partner to healthcare stakeholders, providing the knowledge to optimize decision making, improve health outcomes and reduce treatment costs.
Billing
Billing for laboratory services is a complicated process involving many payers such as MCOs, Medicare, Medicaid, doctors, hospitals, patients and employer groups, all of which have different billing requirements. In addition, billing process arrangements with third-party administrators may further complicate the billing process.
The Company utilizes a centralized billing system in the collection of approximately 91% of its domestic revenue (86% of consolidated revenue). This system generates bills to customers based on the payer type. Client billing is typically generated monthly, whereas patient and third-party billing are typically generated daily. Agings of accounts receivable are then monitored by billing personnel and re-bills and follow-up activities are conducted as necessary. Bad debt expense is recorded within selling, general and administrative expenses as a percentage of sales considered necessary to maintain the allowance for doubtful accounts at an appropriate level, based on the Company's experience with its accounts receivable. The Company writes off accounts against the allowance for doubtful accounts when accounts receivable are deemed to be uncollectible. For client billing, third party and managed care, accounts are written off when all reasonable collection efforts prove to be unsuccessful. Patient accounts are written off after the normal dunning cycle has occurred and the account has been transferred to a third-party collection agency.
A significant portion of the Company’s bad debt expense is related to accounts receivable from patients. This portion of the Company’s bad debt expense is from the patient’s unwillingness or inability to pay. In 2013, the Company continued its focus on process initiatives to reduce the negative impact of patient accounts receivable by collecting payment at the point of service and refining its internal patient collection cycle. The Company also provides ongoing training for billing personnel to improve collections during phone calls.
15
Another component of the Company’s bad debt expense is the result of non-credit related issues that slow the billing process, such as missing or incorrect billing information on requisitions. The Company vigorously attempts to obtain any missing information or rectify any incorrect billing information received from the health care provider. However, the Company typically performs the requested tests and returns the test results regardless of whether billing information is incorrect or incomplete. The Company believes that this experience is similar to that of its primary competitors. The Company continues to focus on process initiatives aimed at reducing the impact of these non-credit related issues by reducing the number of requisitions received that are missing billing information or have incorrect information. This is accomplished through on-going identification of root-cause issues, training provided to internal and external resources involved in the patient data capture process, and an emphasis on the use of electronic requisitions.
Quality
The Company has established a comprehensive quality management program for its laboratories and other facilities designed to assure quality systems and processes are in place to facilitate accurate and timely test results. This includes licensing, credentialing, training and competency of professional and technical staff, and process audits. In addition to the external inspections and proficiency testing programs required by CMS and other regulatory agencies, systems and procedures are in place to emphasize and monitor quality. All of the Company’s laboratories are subject to on-site regulatory evaluations, external proficiency testing programs (e.g., the College of American Pathologists, or “CAP”), state surveys and the Company's own quality audit programs.
Quality also encompasses all facets of the Company’s service, including turnaround time, client service, patient satisfaction, and billing. The Company’s quality assessment program includes measures that compare its current performance against desired performance goals detailed in its quality improvement plan. Using quality assessment techniques, the Company’s laboratories employ a variety of programs to monitor critical aspects of service to its clients and patients.
In addition, the Company’s supply chain management department provides oversight to monitoring and controlling vendor products and performance, and plays an essential role in the Company’s approach to quality through improvements in automation.
Customer Interaction
.
Processes to continually improve the customers’ experience with the Company are essential. Use of technology and improvements in workflow within the Company’s PSCs are helping to reduce patient wait times by expediting the patient registration process (through LabCorp Patient Appointment Scheduling) and ensuring that appropriate specimens are obtained based upon requested test requirements (through LabCorp Touch
SM
).
Specimen Management
.
The use of logistics and specimen tracking technology allows the timely transportation, monitoring, and storage of specimens. The Company is continually improving its ability to timely collect, transport and track specimens from clients and between LabCorp locations.
Quality Control
.
The Company regularly performs quality control testing by running quality control samples with known values at the same time patient samples are tested. Quality control test results are entered into the Company's computerized quality control database. This allows for real-time monitoring for any statistically and clinically significant analytical differences, and enables technologists and technicians to take immediate and appropriate corrective action prior to release of patient results.
Internal Proficiency Testing
.
The Company has an extensive internal proficiency testing program in which each laboratory receives samples to test. This internal proficiency program serves to test the Company’s analytical and post-analytical phases of laboratory testing service including order entry, requisitioning systems, accuracy, precision of its testing protocols, and technologist/technician performance. This program supplements the external proficiency programs required by the laboratory accrediting agencies.
Accreditation
.
The Company participates in numerous externally-administered quality surveillance programs, including the CAP program. CAP is an independent non-governmental organization of board-certified pathologists which offers an accreditation program to which laboratories voluntarily subscribe. CAP has been granted deemed status authority by CMS to inspect clinical laboratories to determine adherence to the Clinical Laboratory Improvement Amendments of 1988 (“CLIA”) standards. The CAP program involves both on-site inspections of the laboratory and participation in CAP's proficiency testing program for all categories in which the laboratory is accredited. All of the Company's major laboratories are accredited by CAP. A laboratory’s receipt of accreditation by CAP satisfies the CMS requirement for certification.
The Company's forensic crime laboratory located in Dallas, TX is accredited to ISO/IEC 17025:2005 by the American Society of Crime Laboratory Directors, Laboratory Accreditation Board (“ASCLD/LAB”) under the International program in the category of Biology and subcategories of nuclear DNA, mitochondrial DNA and Serology testing. Under the International Accreditation Program managed by the ASCLD/LAB, a crime laboratory undergoes a comprehensive and in-depth inspection to demonstrate
16
that its management, operations, employees, procedures and instruments, physical plant, and security and personnel safety procedures meet stringent quality standards. The Dallas laboratory is one of 246 ASCLD-International accredited crime laboratories worldwide and is one of only 26 private crime laboratories holding any ASCLD/LAB accreditation. The Dallas facility is also one of a few forensic laboratories to hold AABB accreditation for relationship testing.
The company' full service forensic facilities in the United Kingdom are accredited to ISO/IEC 17025:2005 by the United Kingdom Accreditation Service in many areas of forensic analysis. These facilities provide crime scene investigative services, collecting samples for DNA analysis, mitochondrial DNA, microscopic analysis, tool marks, paint, and other forms of forensic testing.
The Company has thirteen labs that have received ISO 15189:2007 accreditation. The ISO 15189:2007 standard recognizes the technical competence of medical laboratories, thus providing a ready means for customers to find reliable high quality testing. The list below reflects the Company's labs that have achieved this accreditation and the year in which they achieved it.
|
•
|
Integrated Genetics, Santa Fe, NM - Notification December, 2013
|
|
•
|
LabCorp's Regional Testing Facility, Denver, CO - Notification, December 2013
|
|
•
|
Integrated Genetics, Westborough, MA - September, 2013
|
|
•
|
LabCorp's Regional Testing Facility, Dallas, TX - August, 2013
|
|
•
|
LabCorp's Regional Testing Facility, Phoenix, AZ- December, 2012
|
|
•
|
LabCorp's Regional Testing Facility, Birmingham, AL - November 2012
|
|
•
|
Integrated Oncology, Brentwood, TN - April, 2012
|
|
•
|
Integrated Oncology, Irvine, CA - April, 2012
|
|
•
|
Viromed, Burlington, NC - January, 2012
|
|
•
|
Center for Molecular Biology and Pathology (CMBP), Research Triangle Park, North Carolina - February, 2011
|
|
•
|
Integrated Genetics, Monrovia, CA - April, 2010
|
|
•
|
LabCorp's Regional Testing Facility, Tampa, FL - January, 2010
|
|
•
|
Integrated Oncology, Phoenix, AZ - September, 2009
|
Intellectual Property Rights
The Company relies on a combination of patents, trademarks, copyrights, trade secrets and nondisclosure and non-competition agreements to establish and protect its proprietary technology. The Company has filed and obtained numerous patents in the U.S. and abroad, and regularly files patent applications, when appropriate, to establish and protect its proprietary technology. From time to time, the Company also licenses U.S. and non-U.S. patents, patent applications, technology, trade secrets, know-how, copyrights or trademarks owned by others. The Company believes, however, that no single patent, technology, trademark, intellectual property asset or license is material to its business as a whole.
Employees
As of December 31, 2013 the Company had over 34,000 full-time equivalent employees worldwide. Subsidiaries of the Company have three collective bargaining agreements, which cover approximately 642 employees. The Company’s success is highly dependent on its ability to attract and retain qualified employees, and the Company believes that it has good working relationships with its employees.
Regulation and Reimbursement
General
The clinical laboratory industry is subject to significant governmental regulation at the federal, state and local levels. As described below, these regulations concern licensure and operation of clinical laboratories, claim submission and reimbursement for laboratory services, health care fraud and abuse, security and confidentiality of health information, quality, and environmental and occupational safety.
Regulation of Clinical Laboratories
CLIA extends federal oversight to virtually all clinical laboratories by requiring that they be certified by the federal government or by a federally-approved accreditation agency. CLIA requires that all clinical laboratories meet quality assurance, quality control and personnel standards. Laboratories also must undergo proficiency testing and are subject to inspections.
17
Standards for testing under CLIA are based on the complexity of the tests performed by the laboratory, with tests classified as "high complexity," "moderate complexity," or "waived." Laboratories performing high complexity testing are required to meet more stringent requirements than moderate complexity laboratories. Laboratories performing only waived tests, which are tests determined by the Food and Drug Administration to have a low potential for error and requiring little oversight, may apply for a certificate of waiver exempting them from most of the requirements of CLIA. All major and many smaller Company facilities hold CLIA certificates to perform high complexity testing. The Company's remaining smaller testing sites hold CLIA certificates to perform moderate complexity testing or a certificate of waiver. The sanctions for failure to comply with CLIA requirements include suspension, revocation or limitation of a laboratory's CLIA certificate, which is necessary to conduct business, cancellation or suspension of the laboratory's approval to receive Medicare and/or Medicaid reimbursement, as well as significant fines and/or criminal penalties. The loss or suspension of a CLIA certification, imposition of a fine or other penalties, or future changes in the CLIA law or regulations (or interpretation of the law or regulations) could have a material adverse effect on the Company.
The Company is also subject to state and local laboratory regulation. CLIA provides that a state may adopt laboratory regulations different from or more stringent than those under federal law, and a number of states have implemented their own laboratory regulatory requirements. State laws may require that laboratory personnel meet certain qualifications, specify certain quality controls, or require maintenance of certain records.
The Company believes that it is in compliance with all applicable laboratory requirements. The Company's laboratories have continuing programs to ensure that their operations meet all such regulatory requirements, but no assurances can be given that the Company's laboratories will pass all future licensure or certification inspections.
FDA Laws and Regulations
The Food and Drug Administration ("FDA") has regulatory responsibility over instruments, test kits, reagents and other devices used by clinical laboratories. On July 26, 2007, the Food and Drug Administration (“FDA”) issued
Draft Guidance for Industry, Clinical Laboratories, and FDA Staff: In Vitro Diagnostic Multivariate Index Assays
(“the Draft Guidance”). The Draft Guidance announced that devices deemed In Vitro Diagnostic Multivariate Index Assays (“IVDMIAs”) are Class II or Class III devices requiring, among other things, pre-market notification clearance or pre-market approval from FDA. This guidance would change the agency’s historical practice regarding regulation of certain laboratory-developed tests. While the Draft Guidance is still in place, FDA indicated in June 2010 that it would not be issuing final guidance at this time but would, instead, consider exercising greater oversight of laboratory developed tests using a risk-based approach. In July 2010 the FDA held a series of public meetings regarding issues and stakeholder concerns related to lab developed tests but has taken no further action and issued no further guidance at this time. There are other regulatory and legislative proposals that would increase general FDA oversight of clinical laboratories and laboratory-developed tests. The outcome and ultimate impact of such proposals on the business is difficult to predict at this time.
The FDA enforces laws and regulations that govern the development, testing, manufacturing, labeling, advertising, marketing, distribution and surveillance of diagnostic products. MedTox Diagnostic, Inc.'s point of collection testing devices are regulated by the FDA. The FDA periodically inspects and reviews the manufacturing processes and product performance of diagnostic products. The FDA has the authority to take various administrative and legal actions for non-compliance such as fines, product suspensions, warning letters, recalls, injunctions and other civil and criminal sanctions.
Payment for Clinical Laboratory Services
In 2013, the Company derived approximately 16.0% of its net sales directly from the Medicare and Medicaid programs. In addition, the Company's other business depends significantly on continued participation in these programs and in other government healthcare programs, in part because clients often want a single laboratory to perform all of their testing services. In recent years, both governmental and private sector payers have made efforts to contain or reduce health care costs, including reducing reimbursement for clinical laboratory services.
Reimbursement under the Medicare program for clinical diagnostic laboratory services is subject to a clinical laboratory fee schedule that sets the maximum amount payable in each Medicare carrier's jurisdiction. This clinical laboratory fee schedule is updated annually. Laboratories bill the program directly for covered tests performed on behalf of Medicare beneficiaries. State Medicaid programs are prohibited from paying more than the Medicare fee schedule limit for clinical laboratory services furnished to Medicaid recipients. Approximately 11.7% of the Company’s revenue is reimbursed under the Medicare clinical laboratory fee schedule.
18
Payment under the Medicare fee schedule has been limited from year to year by Congressional action, including imposition of national limitation amounts and freezes on the otherwise applicable annual Consumer Price Index ("CPI") updates. For most diagnostic lab tests, the national limitation is now 74.0% of the national median of all local fee schedules established for each test. Under a provision of the Medicare, Medicaid, and SCHIP Benefits Improvement and Protection Act of 2000 (“BIPA”), for tests performed after January 1, 2001 that the Secretary of Health and Human Services determines are new tests for which no limitation amount has previously been established, the cap is set at 100% of the median.
Following a five year freeze on CPI updates to the CLFS, there was a 1.2% increase in the fee schedule in 2003. In late 2003, the Medicare Prescription Drug, Improvement and Modernization Act of 2003 (“MMA”) again imposed a freeze in the CPI update of the CLFS from 2004 through 2008. The MMA freeze expired December 31, 2008. Pursuant to the Medicare Improvements for Patients and Providers Act of 2008 ("MIPPA"), the CPI update for labs for the years 2009 through 2013 would have been reduced by 0.5%. After such reduction, the 2009 CPI update to the CLFS was an increase of 4.5% and the 2010 CPI update was a reduction of 1.9%. In March 2010, comprehensive health care reform legislation, the Patient Protection and Affordable Care Act (“ACA”), was enacted, which replaced the MIPPA provisions with new provisions that may fundamentally change the health care delivery system in the U.S. Among the ACA’s provisions were reductions in the Medicare clinical laboratory fee schedule updates, one of which is a permanent reduction and the other to be applied in 2011 through 2015. On February 17, 2012, Congress passed legislation that reduced payment rates under the Medicare Clinical Laboratory Fee Schedule ("CLFS") by 2%, effective January 1, 2013. This reduction was applied after the adjustment of the fee schedule by the annual CPI update as reduced by the productivity adjustment (0.9%) and the 1.75% reduction under the ACA, and before the scheduled 2% sequestration reduction mandated by the Budget Control Act of 2011, which became effective April 1, 2013. The 2% sequestration reduction applied to both the Clinical Lab Fee Schedule, which represents approximately 11.7% of the Company's revenue, and the Physician Fee Schedule ("PFS"), which represents approximately 1.1% of the Company's revenue. During 2013, the Company also faced significant payment reductions to certain surgical pathology procedures and a variety of other government reimbursement reductions.
Many of the most significant changes from the implementation of the ACA will not take place until 2014 and beyond, and its details will be shaped by regulatory efforts that have not been proposed, or have not been finalized. During 2014, the Company faces a 0.75% payment reduction to the CLFS and an estimated $6.6 million payment reduction to the PFS, assuming Congress acts to prevent further reductions mandated under the Sustainable Growth Rate (SGR) formula. On November 27, 2013, CMS finalized its proposal to begin annual evaluations of reimbursement rates for CLFS codes based on technological changes, volume, growth in utilization, cost and time on the CLFS. Under this proposal, test codes for which CMS is contemplating a payment adjustment will be listed in the Proposed PFS Rule each year, and the first adjustments to payment rates are scheduled to begin January 1, 2015. CMS is proposing to conduct its initial evaluation of all 1,250 codes on the CLFS over a five-year period ending December 31, 2019.
Separate from clinical laboratory services, which generally are reimbursed under the CLFS, many pathology services are reimbursed under the PFS. The PFS assigns relative value units to each procedure or service, and a conversion factor is applied to calculate the reimbursement. The PFS is also subject to adjustment on an annual basis. The formula used to calculate the fee schedule conversion factor would have resulted in significant decreases in payment for most physician services for each year since 2003. However, since that time Congress has intervened repeatedly to prevent these payment reductions, and the conversion factor has been increased or frozen for the subsequent year. Decreases continue in future years unless Congress acts to change the formula used to calculate the fee schedule or continues to mandate freezes or increases each year. On February 17, 2012, Congress passed legislation to avert significant payment reductions in March, and extended existing Medicare physician rates through December 31, 2012 and Congress took action again at the end of 2012, passing the American Taxpayer Relief Act of 2012, which maintained current rates through 2013. It is not clear when or how Congress will address this issue in the long term. If Congress does not continue to block payment reductions under the statutory formula, significant reductions in the PFS rates could have an adverse effect on the Company. Approximately 1.1% of the Company’s revenue is reimbursed under the PFS.
Because a significant portion of the Company's costs are relatively fixed, Medicare, Medicaid and other government program payment reductions could have a direct adverse effect on the Company's net earnings and cash flows. The Company cannot predict whether changes will be implemented that will result in further payment reductions.
Congressional action in 1997 required HHS to adopt uniform coverage, administration and payment policies for many of the most commonly performed lab tests using a negotiated rulemaking process. The negotiated rulemaking committee established uniform policies limiting Medicare coverage for certain tests to patients with specified medical conditions or diagnoses, replacing local Medicare coverage policies which varied around the country. Since the final rules generally became effective in 2002, the use of uniform policies has improved the Company’s ability to obtain necessary billing information in some cases. However, Medicare, Medicaid and private payer diagnosis code requirements and payment policies continue to negatively impact the Company’s ability to be paid for some of the tests it performs. The Company has also experienced delays in the pricing and implementation of new molecular pathology codes among various payers, including Medicaid, Medicare and commercial carriers.
19
While some delays were expected, several non-commercial payers have still not priced key molecular codes and a number of these payers, mostly government entities, have indicated that they will no longer pay for tests that they have previously covered. Further, several payers are requiring additional information to process claims or have implemented prior authorization policies. Many commercial payers were delayed in becoming aware of the impact of their claim edits which impeded access to services which previously have been covered and reimbursed. These delays had a negative impact on 2013 revenue, revenue per requisition, margins and cash flows and until resolved, or if not favorably resolved, will have a continuing negative impact.
Future changes in federal, state and local laws and regulations (or in the interpretation of current regulations) affecting government payment for clinical laboratory testing could have a material adverse effect on the Company. Based on currently available information, the Company is unable to predict what type of changes in legislation or regulations, if any, will occur.
Standard Electronic Transactions, Security and Confidentiality of Health Information
The Health Insurance Portability and Accountability Act of 1996 ("HIPAA") was designed to address issues related to the security and confidentiality of health insurance information. In an effort to improve the efficiency and effectiveness of the health care system by facilitating the electronic exchange of information in certain financial and administrative transactions, HIPAA regulations were promulgated. These regulations apply to health plans, health care providers that conduct standard transactions electronically and health care clearinghouses (“covered entities”). Five such regulations have been finalized: (i) the Transactions and Code Sets Rule; (ii) the Privacy Rule; (iii) the Security Rule; (iv) the Standard Unique Employer Identifier Rule, which requires the use of a unique employer identifier in connection with certain electronic transactions; and (v) the National Provider Identifier Rule, which requires the use of a unique health care provider identifier in connection with certain electronic transactions.
The Privacy Rule regulates the use and disclosure of protected health information (“PHI”) by covered entities. It also sets forth certain rights that an individual has with respect to his or her PHI maintained by a covered entity, such as the right to access or amend certain records containing PHI or to request restrictions on the use or disclosure of PHI. The Privacy Rule requires covered entities to contractually bind third parties, known as business associates, in the event that they perform an activity or service for or on behalf of the covered entity that involves access to PHI. The Security Rule establishes requirements for safeguarding patient information that is electronically transmitted or electronically stored. The Company believes that it is in compliance in all material respects with the requirements of the HIPAA Privacy and Security Rules.
The federal Health Information Technology for Economic and Clinical Health (“HITECH”) Act, which was enacted in February 2009, strengthens and expands the HIPAA Privacy and Security Rules and their restrictions on use and disclosure of PHI. HITECH includes, but is not limited to, prohibitions on exchanging patient identifiable health information for remuneration and additional restrictions on the use of PHI for marketing. HITECH also fundamentally changes a business associate’s obligations by imposing a number of Privacy Rule requirements and a majority of Security Rule provisions directly on business associates that were previously only directly applicable to covered entities. Moreover, HITECH requires covered entities to provide notice to individuals, HHS, and, as applicable, the media when unsecured protected health information is breached, as that term is defined by HITECH. Business associates are similarly required to notify covered entities of a breach. The omnibus HIPAA regulation implementing most of the HITECH provisions was issued in January 2013 and makes significant changes to the HIPAA Privacy, Security, Enforcement, and Breach Notification Rules. Compliance with most of the change became required on September 23, 2013. HHS had already issued interim final regulations governing breach notification, which were effective in September 2009 and which were modified by the January 2013 final rule. The Company's policies and procedures are fully compliant with the HITECH Act requirements.
On February 6, 2014, CMS published final regulations that amend the HIPAA Privacy Rule to provide individuals (or their personal representatives) with the right to receive copies of their test reports from laboratories subject to HIPAA, or to request that copies of their test reports be transmitted to designated third parties. Previously laboratories that were CLIA-certified or CLIA-exempt were not subject to the provision in the Privacy Rule that provides individuals with the right of access to PHI. The HIPAA Privacy Rule amendment will result in the preemption of a number of state laws that prohibit a laboratory from releasing a test report directly to the individual. The Company will revise its policies and procedures as necessary to comply with these new access requirements and will make changes to its privacy notice to reflect individuals’ new access rights under this final rule. The compliance date for the new requirement is October 4, 2014.
The total cost associated with the requirements of HIPAA and HITECH, is not expected to be material to the Company’s operations or cash flows. There are, however, many unresolved issues in these areas and future regulations and interpretations of HIPAA and HITECH could impose significant costs on the Company.
In addition to the federal HIPAA regulations described above, there are a number of state laws regarding the confidentiality of medical information, some of which apply to clinical laboratories. These laws vary widely but they most commonly restrict the
20
use and disclosure of medical and financial information. In some cases, state laws are more restrictive than and therefore not preempted by HIPAA. Penalties for violation of these laws may include sanctions against a laboratory's licensure, as well as civil and/or criminal penalties. Violations of the HIPAA provisions could result in civil and/or criminal penalties, including significant fines and up to 10 years in prison. HITECH also significantly strengthened HIPAA enforcement. It increases the civil penalty amounts that may be imposed, requires HHS to conduct periodic audits to confirm compliance and also authorizes state attorneys general to bring civil actions seeking either injunctions or damages in response to violations of the HIPAA privacy and security regulations that affect the privacy of state residents. Additionally, numerous other countries have or are developing similar laws governing the collection, use, disclosure and transmission of personal or patient information.
The administrative simplification provisions of HIPAA mandate the adoption of standard unique identifiers for health care providers. The intent of these provisions is to improve the efficiency and effectiveness of the electronic transmission of health information. The National Provider Identification rule requires that all HIPAA-covered health care providers, whether they are individuals or organizations, must obtain a National Provider Identifier (“NPI”) to identify themselves in standard HIPAA transactions. NPI replaces the unique provider identification number - as well as other provider numbers previously assigned by payers and other entities - for the purpose of identifying providers in standard electronic transactions. The Company believes that it is in compliance with the HIPAA National Provider Identification Rule in all material respects.
The standard unique employer identifier regulations require that employers have standard national numbers that identify them on standard transactions. The Employer Identification Number (also known as a Federal Tax Identification Number) issued by the Internal Revenue Service was selected as the identifier for employers and was adopted effective July 30, 2002. The Company believes it is in compliance with these requirements.
The Company believes that it is in compliance in all material respects with the current Transactions and Code Sets Rule. The Company implemented Version 5010 of the HIPAA Transaction Standards and is within the testing and implementation phase of the rule to adopt the ICD-10-CM code set. The compliance date for ICD-10-CM is October 1, 2014. The costs associated with ICD-10-CM Code Set were substantial, and failure of the Company, third party payers or physicians to transition within the required timeframe could have an adverse impact on reimbursement, days sales outstanding and cash collections. As a result of inconsistent application of transaction standards by payers or the Company’s inability to obtain certain billing information not usually provided to the Company by physicians, the Company could face increased costs and complexity, a temporary disruption in receipts and ongoing reductions in reimbursements and net revenues.
The Company believes it is in compliance in all material respects with the Operating Rules for electronic funds transfers and remittance advice transactions, for which the compliance date was January 1, 2014. The Company will continue its assessment and remediation of computer systems, applications and processes for compliance with these requirements.
Fraud and Abuse Laws and Regulations
Existing federal laws governing federal health care programs, including Medicare and Medicaid, as well as similar state laws, impose a variety of broadly described fraud and abuse prohibitions on health care providers, including clinical laboratories. These laws are interpreted liberally and enforced aggressively by multiple government agencies, including the U.S. Department of Justice, HHS’ Office of Inspector General ("OIG"), and various state agencies. Historically, the clinical laboratory industry has been the focus of major governmental enforcement initiatives. The federal government's enforcement efforts have been increasing over the past decade, in part as a result of the enactment of HIPAA, which included several provisions related to fraud and abuse enforcement, including the establishment of a program to coordinate and fund federal, state and local law enforcement efforts. The Deficit Reduction Act of 2005 also included new requirements directed at Medicaid fraud, including increased spending on enforcement and financial incentives for states to adopt false claims act provisions similar to the federal False Claims Act. Recent amendments to the False Claims Act, as well as other enhancements to the federal fraud and abuse laws enacted as part of the ACA, are widely expected to further increase fraud and abuse enforcement efforts. For example, the ACA established an obligation to report and refund overpayments from Medicare within 60 days of identification; failure to comply with this new requirement can give rise to additional liability under the False Claims Act and Civil Monetary Penalties statute. On February 16, 2012, CMS issued a proposed rule to establish regulations addressing the reporting and returning of overpayments. The rule has not been finalized.
The federal health care program’s anti-kickback law (the "Anti-Kickback Law") prohibits knowingly providing anything of value in return for, or to induce, the referral of Medicare, Medicaid or other federal health care program business. Violations can result in imprisonment, fines, penalties, and/or exclusion from participation in federal health care programs. The OIG has published “safe harbor” regulations which specify certain arrangements that are protected from prosecution under the Anti-Kickback law if all conditions of the relevant safe harbor are met. Failure to fit within a safe harbor does not necessarily constitute a violation of the Anti-Kickback Law; rather, the arrangement would be subject to scrutiny by regulators and prosecutors and would be evaluated on a case by case basis. Many states have their own Medicaid anti-kickback laws and several states also have anti-kickback laws that apply to all payers (i.e., not just government health care programs).
21
From time to time, the OIG issues alerts and other guidance on certain practices in the health care industry that implicate the Anti-Kickback Law or other federal fraud and abuse laws. Examples of such guidance documents particularly relevant to the Company and its operations follow.
In October 1994, the OIG issued a Special Fraud Alert on arrangements for the provision of clinical laboratory services. The Fraud Alert set forth a number of practices allegedly engaged in by some clinical laboratories and health care providers that raise issues under the federal fraud and abuse laws, including the Anti-Kickback Law. These practices include: (i) providing employees to furnish valuable services for physicians (other than collecting patient specimens for testing) that are typically the responsibility of the physicians’ staff; (ii) offering certain laboratory services at prices below fair market value in return for referrals of other tests which are billed to Medicare at higher rates; (iii) providing free testing to physicians’ managed care patients in situations where the referring physicians benefit from such reduced laboratory utilization; (iv) providing free pick-up and disposal of bio-hazardous waste for physicians for items unrelated to a laboratory’s testing services; (v) providing general-use facsimile machines or computers to physicians that are not exclusively used in connection with the laboratory services; and (vi) providing free testing for health care providers, their families and their employees (i.e., so-called “professional courtesy” testing). The OIG emphasized in the Special Fraud Alert that when one purpose of such arrangements is to induce referrals of program-reimbursed laboratory testing, both the clinical laboratory and the health care provider (
e.g.,
physician) may be liable under the Anti-Kickback Law, and may be subject to criminal prosecution and exclusion from participation in the Medicare and Medicaid programs.
Another issue the OIG has expressed concern about involves the provision of discounts on laboratory services billed to customers in return for the referral of federal health care program business. In a 1999 Advisory Opinion, the OIG concluded that a proposed arrangement whereby a laboratory would offer physicians significant discounts on non-federal health care program laboratory tests might violate the Anti-Kickback Law. The OIG reasoned that the laboratory could be viewed as providing such discounts to the physician in exchange for referrals by the physician of business to be billed by the laboratory to Medicare at non-discounted rates. The OIG indicated that the arrangement would not qualify for protection under the discount safe harbor to the Anti-Kickback Law because Medicare and Medicaid would not get the benefit of the discount. Similarly, in a 1999 correspondence, the OIG stated that if any direct or indirect link exists between a discount that a laboratory offers to a skilled nursing facility ("SNF") for tests covered under Medicare’s payments to the SNF and the referral of tests billable by the laboratory under Medicare Part B, then the Anti-Kickback Law would be implicated.
The OIG also has issued guidance regarding joint venture arrangements that may be viewed as suspect under the Anti-Kickback Law. These documents have relevance to clinical laboratories that are part of (or are considering establishing) joint ventures with potential sources of federal health care program business. The first guidance document, which focused on investor referrals to such ventures was issued in 1989 and another concerning contractual joint ventures was issued in April 2003. Some of the elements of joint ventures that the OIG identified as “suspect” include: arrangements in which the capital invested by the physicians is disproportionately small and the return on investment is disproportionately large when compared to a typical investment; specific selection of investors who are in a position to make referrals to the venture; and arrangements in which one of the parties to the joint venture expands into a line of business that is dependent on referrals from the other party (sometimes called "shell" joint ventures). In a 2004 advisory opinion, the OIG expressed concern about a proposed joint venture in which a laboratory company would assist physician groups in establishing off-site pathology laboratories. The OIG indicated that the physicians' financial and business risk in the venture was minimal and that the physicians would contract out substantially all laboratory operations, committing very little in the way of financial, capital, or human resources. The OIG was unable to exclude the possibility that the arrangement was designed to permit the laboratory to pay the physician groups for their referrals, and therefore was unwilling to find that the arrangement fell within a safe harbor or had sufficient safeguards to protect against fraud or abuse.
Violations of other fraud and abuse laws also can result in exclusion from participation in federal health care programs, including Medicare and Medicaid. One basis for such exclusion is an individual or entity’s submission of claims to Medicare or Medicaid that are substantially in excess of that individual or entity’s usual charges for like items or services. In 2003, the OIG issued a notice of proposed rulemaking that would have defined the terms "usual charges" and "substantially in excess" in ways that might have required providers, including the Company, to either lower their charges to Medicare and Medicaid or increase charges to certain other payers to avoid the risk of exclusion. On June 18, 2007, however, the OIG withdrew the proposed rule, saying it preferred to continue evaluating billing patterns on a case-by-case basis. In its withdrawal notice, the OIG also said it “remains concerned about disparities in the amounts charged to Medicare and Medicaid when compared to private payers,” that it continues to believe its exclusion authority for excess charges “provides useful backstop protection for the public fisc from providers that routinely charge Medicare or Medicaid substantially more than their other customers” and that it will continue to use “all tools available … to address instances where Medicare or Medicaid are charged substantially more than other payers.” Thus, although the OIG did not proceed with its rulemaking, an enforcement action under this statutory exclusion basis is possible and, if pursued, could have an adverse effect on the Company. The enforcement by Medicaid officials of similar state law restrictions also could have a material adverse effect on the Company.
22
Under another federal statute, known as the "Stark Law" or "self-referral" prohibition, physicians who have a financial or a compensation relationship with a clinical laboratory may not, unless an exception applies, refer Medicare patients for testing to the laboratory, regardless of the intent of the parties. Similarly, laboratories may not bill Medicare or any other party for services furnished pursuant to a prohibited self-referral. There are several Stark law exceptions that are relevant to arrangements involving clinical laboratories, including: 1) fair market value compensation for the provision of items or services; 2) payments by physicians to a laboratory for clinical laboratory services; 3) an exception for certain ancillary services (including laboratory services) provided within the referring physician's own office, if certain criteria are satisfied; 4) physician investment in a company whose stock is traded on a public exchange and has stockholder equity exceeding $75.0 million; and 5) certain space and equipment rental arrangements that are set at a fair market value rate and satisfy other requirements. All of the requirements of a Stark Law exception must be met in order for the exception to apply. Many states have their own self-referral laws as well, which in some cases apply to all patient referrals, not just Medicare.
There are a variety of other types of federal and state fraud and abuse laws, including laws prohibiting submission of false or fraudulent claims. The Company seeks to conduct its business in compliance with all federal and state fraud and abuse laws. The Company is unable to predict how these laws will be applied in the future, and no assurances can be given that its arrangements will not be subject to scrutiny under such laws. Sanctions for violations of these laws may include exclusion from participation in Medicare, Medicaid and other federal or state health care programs, significant criminal and civil fines and penalties, and loss of licensure. Any exclusion from participation in a federal health care program, or any loss of licensure, arising from any action by any federal or state regulatory or enforcement authority, would likely have a material adverse effect on the Company's business. In addition, any significant criminal or civil penalty resulting from such proceedings could have a material adverse effect on the Company's business.
Environmental, Health and Safety
The Company is subject to licensing and regulation under federal, state and local laws and regulations relating to the protection of the environment and human health and safety and laws and regulations relating to the handling, transportation and disposal of medical specimens, infectious and hazardous waste and radioactive materials. All Company laboratories are subject to applicable federal and state laws and regulations relating to biohazard disposal of all laboratory specimens and the Company generally utilizes outside vendors for disposal of such specimens. In addition, the federal Occupational Safety and Health Administration (“OSHA”) has established extensive requirements relating to workplace safety for health care employers, including clinical laboratories, whose workers may be exposed to blood-borne pathogens such as HIV, the hepatitis B virus and the hepatitis C virus. These regulations, among other things, require work practice controls, protective clothing and equipment, training, medical follow-up, vaccinations and other measures designed to minimize exposure to, and transmission of, blood-borne pathogens.
In 2012, the federal OSHA Hazard Communication Standard was revised based on the adoption of the Globally Harmonized System (GHS) that provides criteria for the classification of chemical hazards. Updated copies of Safety Data Sheets for chemical products used across the Company are being obtained prior to the effective date of June 1, 2015.
The Company seeks to comply with such federal, state and local laws and regulations. Failure to comply could subject the Company to various administrative and/or other enforcement actions.
Drug Testing
Drug testing for public sector employees is regulated by the Substance Abuse and Mental Health Services Administration (“SAMHSA”), which has established detailed performance and quality standards that laboratories must meet to be approved to perform drug testing on employees of federal government contractors and certain other entities. To the extent that the Company’s laboratories perform such testing, each must be certified as meeting SAMHSA standards. The Company’s laboratories in Research Triangle Park, North Carolina, Raritan, New Jersey, Houston, Texas, Southaven, Mississippi, and St. Paul, Minnesota are all SAMHSA certified.
Controlled Substances
The use of controlled substances in testing for drugs of abuse is regulated by the Federal Drug Enforcement Administration.
Compliance Program
The Company maintains a comprehensive, company-wide compliance program. The Company continuously evaluates and monitors its compliance with all Medicare, Medicaid and other rules and regulations. The objective of the Company’s compliance
23
program is to develop, implement, and update compliance safeguards as necessary. Emphasis is placed on developing compliance policies and guidelines, personnel training programs and various monitoring and audit procedures to attempt to achieve implementation of all applicable rules and regulations.
The Company seeks to conduct its business in compliance with all statutes, regulations, and other requirements applicable to its clinical laboratory operations. The clinical laboratory testing industry is, however, subject to extensive regulation, and many of these statutes and regulations have not been interpreted by the courts. There can be no assurance that applicable statutes and regulations will not be interpreted or applied by a prosecutorial, regulatory or judicial authority in a manner that would adversely affect the Company. Potential sanctions for violation of these statutes and regulations include significant fines and the loss of various licenses, certificates, and authorizations, which could have a material adverse effect on the Company’s business.
|
Item 1A.
|
Risk Factors
|
Risks Associated with the Company’s Business
Changes in federal, state, local and third-party payer regulations or policies (or in the interpretation of current regulations or policies), insurance regulation or approvals or changes in other laws, regulations or policies may adversely affect governmental and third-party coverage and reimbursement for clinical laboratory testing and may have a material adverse effect upon the Company’s business.
Government payers, such as Medicare and Medicaid, as well as insurers, including MCOs, have increased their efforts to control the cost, utilization and delivery of health care services. From time to time, Congress has considered and implemented changes in the Medicare fee schedules in conjunction with budgetary legislation. Further reductions of reimbursement for Medicare and Medicaid services or changes in policy regarding coverage of tests or other requirements for payment, such as prior authorization or a physician or qualified practitioner’s signature on test requisitions, may be implemented from time to time. Reimbursement for the pathology services component of the Company’s business is also subject to statutory and regulatory reduction. Reductions in the reimbursement rates and changes in payment policies of other third-party payers may occur as well. Such changes in the past have resulted in reduced payments as well as added costs and have decreased test utilization for the clinical laboratory industry by adding more complex new regulatory and administrative requirements. Further changes in federal, state, local and third-party payer regulations or policies may have a material adverse impact on the Company’s business. Actions by agencies regulating insurance or changes in other laws, regulations, or policies may also have a material adverse effect upon the Company’s business.
The Company could face significant monetary damages and penalties and/or exclusion from the Medicare and Medicaid programs if it violates health care anti-fraud and abuse laws.
The Company is subject to extensive government regulation at the federal, state and local levels. The Company’s failure to meet governmental requirements under these regulations, including those relating to billing practices and financial relationships with physicians and hospitals, could lead to civil and criminal penalties, exclusion from participation in Medicare and Medicaid and possible prohibitions or restrictions on the use of its laboratories. While the Company believes that it meets all statutory and regulatory requirements, there is a risk that government authorities might take a contrary position. Such occurrences, regardless of their outcome, could damage the Company’s reputation and adversely affect important business relationships it has with third parties.
The Company’s business could be harmed from the loss or suspension of a license or imposition of a fine or penalties under, or future changes in, or interpretations of, the law or regulations of the Clinical Laboratory Improvement Act of 1967, and the Clinical Laboratory Improvement Amendments of 1988, the FDA or those of Medicare, Medicaid or other federal, state or local agencies.
The clinical laboratory testing industry is subject to extensive regulation, and many of these statutes and regulations have not been interpreted by the courts. CLIA extends federal oversight to virtually all clinical laboratories by requiring that they be certified by the federal government or by a federally-approved accreditation agency. The sanction for failure to comply with CLIA requirements may be suspension, revocation or limitation of a laboratory’s CLIA certificate, which is necessary to conduct business, as well as significant fines and/or criminal penalties. In addition, the Company is subject to regulation under state law. State laws may require that laboratories and/or laboratory personnel meet certain qualifications, specify certain quality controls or require maintenance of certain records. The FDA regulates diagnostic products and periodically inspects and reviews their manufacturing processes and product performance. The Company's MedTox Diagnostic's point of collection testing devices are subject to regulation by the FDA.
24
Applicable statutes and regulations could be interpreted or applied by a prosecutorial, regulatory or judicial authority in a manner that would adversely affect the Company's business. Potential sanctions for violation of these statutes and regulations include significant fines and the suspension or loss of various licenses, certificates and authorizations, or product suspensions or recalls which could have a material adverse effect on the Company’s business. In addition, compliance with future legislation could impose additional requirements on the Company which may be costly.
Failure to comply with environmental, health and safety laws and regulations, including the federal Occupational Safety and Health Administration Act and the Needlestick Safety and Prevention Act, could result in fines and penalties and loss of licensure, and have a material adverse effect upon the Company’s business.
The Company is subject to licensing and regulation under federal, state and local laws and regulations relating to the protection of the environment and human health and safety, including laws and regulations relating to the handling, transportation and disposal of medical specimens, infectious and hazardous waste and radioactive materials, as well as regulations relating to the safety and health of laboratory employees. All of the Company’s laboratories are subject to applicable federal and state laws and regulations relating to biohazard disposal of all laboratory specimens, and they utilize outside vendors for disposal of such specimens. In addition, the federal Occupational Safety and Health Administration has established extensive requirements relating to workplace safety for health care employers, including clinical laboratories, whose workers may be exposed to blood-borne pathogens such as HIV and the hepatitis B virus. These requirements, among other things, require work practice controls, protective clothing and equipment, training, medical follow-up, vaccinations and other measures designed to minimize exposure to, and transmission of, blood-borne pathogens. In addition, the Needlestick Safety and Prevention Act requires, among other things, that the Company include in its safety programs the evaluation and use of engineering controls such as safety needles if found to be effective at reducing the risk of needlestick injuries in the workplace.
Failure to comply with federal, state and local laws and regulations could subject the Company to denial of the right to conduct business, fines, criminal penalties and/or other enforcement actions which would have a material adverse effect on its business. In addition, compliance with future legislation could impose additional requirements on the Company which may be costly.
Regulations requiring the use of “standard transactions” for health care services issued under HIPAA may negatively impact the Company’s profitability and cash flows.
Pursuant to HIPAA, the Secretary of HHS has issued regulations designed to improve the efficiency and effectiveness of the health care system by facilitating the electronic exchange of information in certain financial and administrative transactions while protecting the privacy and security of the information exchanged.
The HIPAA transaction standards are complex, and subject to differences in interpretation by payers. For instance, some payers may interpret the standards to require the Company to provide certain types of information, including demographic information not usually provided to the Company by physicians. In addition, new requirements for additional standard transactions, such as claims attachments, and the ICD-10-CM Code Set, could prove technically difficult, time-consuming or expensive to implement.
The costs associated with ICD-10-CM Code Set were substantial, and failure of the Company, third party payers or physicians to transition within the required timeframe could have an adverse impact on reimbursement, days sales outstanding and cash collections. As a result of inconsistent application of other transaction standards by payers or the Company’s inability to obtain certain billing information not usually provided to the Company by physicians, the Company could face increased costs and complexity, a temporary disruption in receipts and ongoing reductions in reimbursements and net revenues. The Company is working closely with its payers to establish acceptable protocols for claim submission and with its trade association and an industry coalition to present issues and problems as they arise to the appropriate regulators and standards setting organizations.
Failure to maintain the security of customer-related information or compliance with security requirements could damage the Company’s reputation with customers, cause it to incur substantial additional costs and to become subject to litigation.
The Company receives certain personal and financial information about its customers. In addition, the Company depends upon the secure transmission of confidential information over public networks, including information permitting cashless payments. A compromise in the Company’s security systems that results in customer personal information being obtained by unauthorized persons or the Company’s failure to comply with security requirements for financial transactions could adversely affect the Company’s reputation with its customers and others, as well as the Company’s results of operations, financial condition and liquidity. It could also result in litigation against the Company or the imposition of penalties.
Failure of the Company, third party payers or physicians to comply with the ICD-10-CM Code Set by the compliance date of October 1, 2014, could negatively impact the Company's reimbursement, profitability and cash flow.
25
The Company believes that it is in compliance in all material respects with the current Transactions and Code Sets Rule. The Company implemented Version 5010 of the HIPAA Transaction Standards, and is within the testing and implementation phase of the rule to adopt the ICD-10-CM Code Set. The compliance date for ICD-10-CM is October 1, 2014. The Company believes that it is in compliance in all material respects with the Operating Rules for electronic funds transfers and remittance advice transactions, for which the compliance date was January 1, 2014. The Company will continue its assessment and remediation of computer systems, applications and processes for compliance with these requirements. Clinical laboratories are typically required to submit health care claims with diagnosis codes to third party payers. The diagnosis codes must be obtained from the ordering physician. The failure of the Company, third party payers or physicians to transition within the required timeframe could have an adverse impact on reimbursement, days sales outstanding and cash collections.
Compliance with the HIPAA security regulations and privacy regulations may increase the Company’s costs.
The HIPAA privacy and security regulations, including the expanded requirements under HITECH, establish comprehensive federal standards with respect to the use and disclosure of protected health information by health plans, healthcare providers and healthcare clearinghouses, in addition to setting standards to protect the confidentiality, integrity and security of protected health information. The regulations establish a complex regulatory framework on a variety of subjects, including:
|
•
|
the circumstances under which the use and disclosure of protected health information are permitted or required without a specific authorization by the patient, including but not limited to treatment purposes, activities to obtain payments for the Company’s services, and its healthcare operations activities;
|
|
•
|
a patient’s rights to access, amend and receive an accounting of certain disclosures of protected health information as well as a new right of access to laboratory test reports under the HIPAA Privacy Rule which preempts a number of state laws that prohibit a laboratory from releasing a test report directly to the individual, for which compliance will be required by October 4, 2014;
|
|
•
|
the content of notices of privacy practices for protected health information;
|
|
•
|
administrative, technical and physical safeguards required of entities that use or receive protected health information; and
|
|
•
|
the protection of computing systems maintaining ePHI.
|
The Company has implemented policies and procedures related to compliance with the HIPAA privacy and security regulations, as required by law. The privacy and security regulations establish a “floor” and do not supersede state laws that are more stringent. Therefore, the Company is required to comply with both federal privacy and security regulations and varying state privacy and security laws. In addition, for healthcare data transfers from other countries relating to citizens of those countries, the Company must comply with the laws of those other countries. The federal privacy regulations restrict the Company’s ability to use or disclose patient identifiable laboratory data, without patient authorization, for purposes other than payment, treatment or healthcare operations (as defined by HIPAA), except for disclosures for various public policy purposes and other permitted purposes outlined in the privacy regulations. HIPAA, as amended by HITECH, provides for significant fines and other penalties for wrongful use or disclosure of protected health information in violation of the privacy and security regulations, including potential civil and criminal fines and penalties. Due to the enactment of HITECH, it is not possible to predict what the extent of the impact on business will be; however, if the Company does not comply with existing or new laws and regulations related to protecting the privacy and security of health information it could be subject to monetary fines, civil penalties or criminal sanctions. In addition, other federal and state laws that protect the privacy and security of patient information may be subject to enforcement and interpretations by various governmental authorities and courts resulting in complex compliance issues. For example, the Company could incur damages under state laws pursuant to an action brought by a private party for the wrongful use or disclosure of confidential health information or other private personal information.
Increased competition, including price competition, could have a material adverse impact on the Company’s net revenues and profitability.
The clinical laboratory business is intensely competitive both in terms of price and service. Pricing of laboratory testing services is often one of the most significant factors used by health care providers and third-party payers in selecting a laboratory. As a result of the clinical laboratory industry undergoing significant consolidation, larger clinical laboratory providers are able to increase cost efficiencies afforded by large-scale automated testing. This consolidation results in greater price competition. The Company may be unable to increase cost efficiencies sufficiently, if at all, and as a result, its net earnings and cash flows could be negatively impacted by such price competition. The Company may also face increased competition from companies that do not comply with existing laws or regulations or otherwise disregard compliance standards in the industry. Additionally, the Company may also
26
face changes in fee schedules, competitive bidding for laboratory services or other actions or pressures reducing payment schedules as a result of increased or additional competition.
Discontinuation or recalls of existing testing products; failure to develop, or acquire, licenses for new or improved testing technologies; or the Company’s customers using new technologies to perform their own tests could adversely affect the Company’s business.
From time to time, manufacturers discontinue or recall reagents, test kits or instruments used by the Company to perform laboratory testing. Such discontinuations or recalls could adversely affect the Company’s costs, testing volume and revenue.
The clinical laboratory industry is subject to changing technology and new product introductions. The Company’s success in maintaining a leadership position in genomic and other advanced testing technologies will depend, in part, on its ability to develop, acquire or license new and improved technologies on favorable terms and to obtain appropriate coverage and reimbursement for these technologies. The Company may not be able to negotiate acceptable licensing arrangements and it cannot be certain that such arrangements will yield commercially successful diagnostic tests. If the Company is unable to license these testing methods at competitive rates, its research and development costs may increase as a result. In addition, if the Company is unable to license new or improved technologies to expand its esoteric testing operations, its testing methods may become outdated when compared with the Company’s competition and testing volume and revenue may be materially and adversely affected.
In addition, advances in technology may lead to the development of more cost-effective technologies such as point-of-care testing equipment that can be operated by physicians or other healthcare providers in their offices or by patients themselves without requiring the services of freestanding clinical laboratories. Development of such technology and its use by the Company’s customers could reduce the demand for its laboratory testing services and negatively impact its revenues.
Currently, most clinical laboratory testing is categorized as “high” or “moderate” complexity, and thereby is subject to extensive and costly regulation under CLIA. The cost of compliance with CLIA makes it impractical for most physicians to operate clinical laboratories in their offices, and other laws limit the ability of physicians to have ownership in a laboratory and to refer tests to such a laboratory. Manufacturers of laboratory equipment and test kits could seek to increase their sales by marketing point-of-care laboratory equipment to physicians and by selling test kits approved for home or physician office use to both physicians and patients. Diagnostic tests approved for home use are automatically deemed to be “waived” tests under CLIA and may be performed in physician office laboratories as well as by patients in their homes with minimal regulatory oversight. Other tests meeting certain FDA criteria also may be classified as “waived” for CLIA purposes. The FDA has regulatory responsibility over instruments, test kits, reagents and other devices used by clinical laboratories and has taken responsibility from the Centers for Disease Control for classifying the complexity of tests for CLIA purposes. Increased approval of “waived” test kits could lead to increased testing by physicians in their offices or by patients at home, which could affect the Company’s market for laboratory testing services and negatively impact its revenues.
Health care reform and related products (e.g. Health Insurance Exchanges), changes in government payment and reimbursement systems, or changes in payer mix, including an increase in capitated reimbursement mechanisms and evolving delivery models, could have a material adverse impact on the Company's net revenues, profitability and cash flow.
Testing services are billed to private patients, Medicare, Medicaid, commercial clients, managed care organizations ("MCOs") and other insurance companies. Tests ordered by a physician may be billed to different payers depending on the medical insurance benefits of a particular patient. Most testing services are billed to a party other than the physician or other authorized person that ordered the test. Increases in the percentage of services billed to government and managed care payers could have an adverse impact on the Company’s net revenues. For the year ended December 31, 2013, requisitions (based on the total volume of requisitions excluding the Company's Other segment) by payer were:
|
•
|
private patients – 1.7%
|
|
•
|
Medicare and Medicaid – 15.1%
|
|
•
|
commercial clients – 34.5%
|
|
•
|
managed care – 48.7%
|
The various MCOs have different contracting philosophies, which are influenced by the design of the products they offer to their members. Some MCOs contract with a limited number of clinical laboratories and engage in direct negotiation of the rates reimbursed to participating laboratories. Other MCOs adopt broader networks with a generally largely uniform fee structure for participating clinical laboratories. In addition, some MCOs have used capitation in an effort to fix the cost of laboratory testing
27
services for their enrollees. Under a capitated reimbursement mechanism, the clinical laboratory and the managed care organization agree to a per member, per month payment to pay for all authorized laboratory tests ordered during the month by the physician for the members, regardless of the number or cost of the tests actually performed. Capitation shifts the risk of increased test utilization (and the underlying mix of testing services) to the clinical laboratory provider. The Company makes significant efforts to ensure that its services are adequately compensated in its capitated arrangements. For the year ended December 31, 2013, such capitated contracts accounted for approximately $187.3 million, or 3.2%, of the Company's net sales.
The Company's ability to attract and retain managed care clients is critical given the impact of health care reform, related products and expanded coverage (e.g. Health Insurance Exchanges and Medicaid Expansion) and evolving delivery models (e.g. Accountable Care Organizations).
A portion of the managed care fee-for-service revenues are collectible from patients in the form of deductibles, copayments and coinsurance. As patient cost-sharing increases, collectibility may be impacted.
In addition, Medicare and Medicaid and private insurers have increased their efforts to control the cost, utilization and delivery of health care services, including clinical laboratory services. Measures to regulate health care delivery in general, and clinical laboratories in particular, have resulted in reduced prices, added costs and decreased test utilization for the clinical laboratory industry by increasing complexity and adding new regulatory and administrative requirements. Pursuant to legislation passed in late 2003, the percentage of Medicare beneficiaries enrolled in Medicare managed care plans has increased. The percentage of Medicaid beneficiaries enrolled in Medicaid managed care plans has also increased, and is expected to continue to increase. Implementation of the ACA, the health care reform legislation passed in 2010, also may affect coverage, reimbursement, and utilization of laboratory services, as well as administrative requirements.
The Company has experienced delays in the pricing and implementation of new molecular pathology codes among various payers, including Medicaid, Medicare and commercial carriers. While some delays were expected, several non-commercial payers have still not priced key molecular codes and a number of these payers, mostly government entities, have indicated that they will no longer pay for tests that they have previously covered. Further, several payers are requiring additional information to process claims or have implemented prior authorization policies. Many payers were delayed in understanding the impact of their claim edits, which impeded access to services that were previously covered and reimbursed. These delays and decisions had a negative impact on the Company’s 2013 financial performance and, if not favorably resolved, will have a negative impact on the Company’s future revenue, revenue per requisition, margins and cash flows until resolved.
The Company expects efforts to impose reduced reimbursement, more stringent payment policies and utilization and cost controls by government and other payers to continue. If the Company cannot offset additional reductions in the payments it receives for its services by reducing costs, increasing test volume and/or introducing new procedures, it could have a material adverse impact on the Company’s net revenues, profitability and cash flows.
As an employer, health care reform legislation also contains numerous regulations that will require the Company to implement significant process and record keeping changes to be in compliance. These changes increase the cost of providing healthcare coverage to employees and their families. Given the limited release of regulations to guide compliance, the exact impact to employers including the Company is uncertain.
A failure to obtain and retain new customers, a loss of existing customers or material contracts, a reduction in tests ordered or specimens submitted by existing customers, or the inability to retain existing and create new relationships with health systems could impact the Company’s ability to successfully grow its business.
To offset efforts by payers to reduce the cost and utilization of clinical laboratory services, the Company needs to obtain and retain new customers and business partners. In addition, a reduction in tests ordered or specimens submitted by existing customers, without offsetting growth in its customer base, could impact the Company’s ability to successfully grow its business and could have a material adverse impact on the Company’s net revenues and profitability. The Company competes primarily on the basis of the quality of testing, reporting and information systems, reputation in the medical community, the pricing of services and ability to employ qualified personnel. The Company’s failure to successfully compete on any of these factors could result in the loss of customers and a reduction in the Company’s ability to expand its customer base.
In addition, as the broader healthcare industry trend of consolidation continues, including the acquisition of physician practices by health systems, relationships with hospital-based health systems and integrated delivery networks are becoming more important. The Company has a well-established base of relationships with those systems and networks, including collaborative agreements. The Company's inability to retain its existing relationships with those provider systems and networks and to create new relationships could impact its ability to successfully grow its business.
28
A failure to identify and successfully close and integrate strategic acquisition targets could have a material adverse impact on the Company's business objectives and its net revenues and profitability.
Part of the Company's strategy involves deploying capital in investments that enhance the Company's business, which includes pursuing strategic acquisitions to strengthen the Company's scientific capabilities, grow esoteric testing capabilities and increase presence in key geographic areas. Since 2008, the Company has invested approximately $2.4 billion in strategic business acquisitions for these purposes. However, the Company cannot assure that it will be able to identify acquisition targets that are attractive to the Company or that are of a large enough size to have a meaningful impact on the Company's operating results. Furthermore, the successful closing and integration of a strategic acquisition entails numerous risks, including, among others:
|
•
|
failure to obtain regulatory clearance, including due to antitrust concerns;
|
|
•
|
loss of key customers or employees;
|
|
•
|
difficulty in consolidating redundant facilities and infrastructure and in standardizing information and other systems;
|
|
•
|
unidentified regulatory problems;
|
|
•
|
failure to maintain the quality of services that such companies have historically provided;
|
|
•
|
coordination of geographically-separated facilities and workforces; and
|
|
•
|
diversion of management's attention from the day-to-day business of the Company.
|
The Company cannot assure that current or future acquisitions, if any, or any related integration efforts will be successful, or that the Company's business will not be adversely affected by any future acquisitions, including with respect to net revenues and profitability. Even if the Company is able to successfully integrate the operations of businesses that it may acquire in the future, the Company may not be able to realize the benefits that it expects from such acquisitions.
Adverse results in material litigation matters could have a material adverse effect upon the Company’s business.
The Company may become subject in the ordinary course of business to material legal action related to, among other things, intellectual property disputes, professional liability and employee-related matters, as well as inquiries and requests for information from governmental agencies and bodies and Medicare or Medicaid carriers requesting comment and/or information on allegations of billing irregularities or billing and pricing arrangements that are brought to their attention through billing audits or third parties. Legal actions could result in substantial monetary damages as well as damage to the Company’s reputation with customers, which could have a material adverse effect upon its business.
An inability to attract and retain experienced and qualified personnel could adversely affect the Company’s business.
The loss of key management personnel or the inability to attract and retain experienced and qualified employees at the Company’s clinical laboratories and research centers could adversely affect the business. The success of the Company is dependent in part on the efforts of key members of its management team. Success in maintaining the Company’s leadership position in genomic and other advanced testing technologies will depend in part on the Company’s ability to attract and retain skilled research professionals. In addition, the success of the Company’s clinical laboratories also depends on employing and retaining qualified and experienced laboratory professionals, including specialists, who perform clinical laboratory testing services. In the future, if competition for the services of these professionals increases, the Company may not be able to continue to attract and retain individuals in its markets. The Company’s revenues and earnings could be adversely affected if a significant number of professionals terminate their relationship with the Company or become unable or unwilling to continue their employment.
Unionization of employees, union strikes, or work stoppages could adversely affect the Company's operations and have a material effect upon the Company's business.
The Company is a party to collective bargaining agreements with various labor unions. Disputes with regard to the terms of these agreements or its potential inability to negotiate acceptable contracts with these unions could result in, among other things, labor unrest, strikes, work stoppages, or other slowdowns by the affected workers. If unionized workers were to engage in a strike, work stoppage, or other slowdown, or other employees were to become unionized, the Company could experience a significant disruption of its operations or higher ongoing labor costs, either of which could have a material adverse effect upon the Company's business. Additionally, future labor agreements, or renegotiation of labor agreements or provisions of labor agreements, could compromise its service reliability and significantly increase its costs, which could have a material adverse impact upon the Company's business.
29
A significant increase in the Company’s days sales outstanding could increase bad debt expense and have an adverse effect on the Company’s business including its cash flow.
Billing for laboratory services is a complex process. Laboratories bill many different payers including doctors, patients, hundreds of insurance companies, Medicare, Medicaid and employer groups, all of which have different billing requirements. In addition to billing complexities, the Company is experiencing increasing patient responsibility as a result of managed care fee-for-service plans which continue to increase patient copayments, coinsurance and deductibles. A material increase in the Company’s days sales outstanding level (“DSO”) resulting in an increase in the Company’s bad debt expense could have an adverse effect on the Company’s business including its cash flow.
Failure in the Company’s information technology systems or delays or failures in the development and implementation of the Company's LabCorp Beacon
®
platform could significantly increase testing turn-around time or billing processes and otherwise disrupt the Company’s operations or customer relationships.
The Company’s laboratory operations and customer relationships depend, in part, on the continued performance of its information technology systems. Despite network security measures and other precautions the Company has taken, its information technology systems are potentially vulnerable to physical or electronic break-ins, computer viruses and similar disruptions. In addition, the Company is in the process of integrating the information technology systems of its recently acquired subsidiaries, and the Company may experience system failures or interruptions as a result of this process. Sustained system failures or interruption of the Company’s systems in one or more of its laboratory operations could disrupt the Company’s ability to process laboratory requisitions, perform testing, provide test results in a timely manner and/or bill the appropriate party. The Company is also continuing to enhance its LabCorp Beacon platform and could experience delays or deficiencies in the development process. Failure of the Company’s information technology systems could adversely affect the Company’s business, profitability and financial condition.
Operations may be disrupted and adversely impacted by the effects of natural disasters such as hurricanes and earthquakes, or acts of terrorism, or other criminal activities, or disease pandemics.
Such events may result in a temporary decline in the number of patients who seek laboratory testing services. In addition, such events may temporarily interrupt the Company’s ability to transport specimens, the Company’s information technology systems, the Company’s ability to utilize certain laboratories, and/or the Company’s ability to receive material from its suppliers.
A significant deterioration in the economy could negatively impact testing volumes, cash collections and the availability of credit.
The Company’s operations are dependent upon ongoing demand for diagnostic testing services by patients, physicians, hospitals, MCOs, and others. A significant downturn in the economy could negatively impact the demand for diagnostic testing as well as the ability of patients and other payers to pay for services ordered. In addition, uncertainty in the credit markets could reduce the availability of credit and impact the Company’s ability to meet its financing needs in the future.
Changes in reimbursement by foreign governments and foreign currency exchange fluctuations could have an adverse impact on the Company’s business.
The Company has business and operations outside the U.S. Changes by foreign governments in reimbursement for the Company’s services and foreign currency fluctuations could have an adverse impact on the Company’s business.
The Company's growing international operations could subject it to additional risks and expenses that could adversely impact the business or results of operations.
The expansion of the Company's international operations exposes it to risks from failure to comply with foreign laws and regulations that differ from those under which the Company operates in the U.S. In addition, the Company may be adversely affected by other risks of expanded operations in foreign countries, including export controls and trade regulations, changes in tax policies or other foreign laws, restrictions on currency repatriation, judicial systems that less strictly enforce contractual rights, countries that provide less protection for intellectual property rights, and procedures and actions affecting approval, production, pricing, reimbursement and marketing of products and services. Further, international operations could subject the Company to additional expenses that the Company may not fully anticipate, including those related to enhanced time and resources necessary to comply with foreign laws and regulations, difficulty in collecting accounts receivable and longer collection periods, and difficulties and costs of staffing and managing foreign operations. In some countries, the Company's success will depend in part on its ability to form relationships with local partners. The Company's inability to identify appropriate partners or reach mutually satisfactory arrangements could adversely affect the business and operations.
30
Item 1B. UNRESOLVED STAFF COMMENTS
None.
31
Item 2. PROPERTIES
The Company operates through a national network of primary laboratories, branches, PSCs and STAT laboratories. The table below summarizes certain information as to the Company’s principal operating and administrative facilities as of
December 31, 2013
.
|
Location
|
Nature of
Occupancy
|
|
Primary Laboratories:
|
|
|
Birmingham, Alabama
|
Leased
|
|
Phoenix, Arizona
|
Leased
|
|
Prescott, Arizona
|
Owned
|
|
Calabasas, California
|
Leased
|
|
Los Angeles, California
|
Leased
|
|
Monrovia, California
|
Leased
|
|
San Diego, California
|
Leased
|
|
San Francisco, California
|
Leased
|
|
Tustin, California
|
Leased
|
|
Englewood, Colorado
|
Leased
|
|
Shelton, Connecticut
|
Leased
|
|
Hollywoood, Florida
|
Leased
|
|
Tampa, Florida
|
Leased
|
|
Boise, Idaho
|
Leased
|
|
Chicago, Illinois
|
Leased
|
|
Elmhurst, Illinois
|
Leased
|
|
Rockville, Maryland
|
Leased
|
|
Westborough, Massachusetts
|
Leased
|
|
St. Paul, Minnesota
|
Owned
|
|
Cranford, New Jersey
|
Leased
|
|
Raritan, New Jersey
|
Owned/Leased
|
|
West Trenton, New Jersey
|
Leased
|
|
Santa Fe, New Mexico
|
Owned
|
|
New York, New York
|
Leased
|
|
Uniondale, New York
|
Leased
|
|
Burlington, North Carolina
|
Owned/Leased
|
|
Charlotte, North Carolina
|
Leased
|
|
Durham, North Carolina
|
Leased
|
|
Research Triangle Park, North Carolina
|
Leased
|
|
Dublin, Ohio
|
Owned
|
|
Oklahoma City, Oklahoma
|
Leased
|
|
Brentwood, Tennessee
|
Leased
|
|
Knoxville, Tennessee
|
Leased
|
|
Memphis, Tennessee
|
Leased
|
|
Austin, Texas
|
Leased
|
|
Dallas, Texas
|
Leased
|
|
Farmers Branch, Texas
|
Leased
|
|
Houston, Texas
|
Leased
|
|
San Antonio, Texas
|
Leased
|
|
Seattle, Washington
|
Leased
|
|
Mechelen, Belgium
|
Leased
|
|
Edmonton, Canada
|
Leased
|
32
|
Ontario, Canada
|
Owned
|
|
Mississauga, Canada
|
Leased
|
|
Beijing, China
|
Leased
|
|
Singapore
|
Leased
|
|
Chorley, United Kingdom
|
Leased
|
|
Oxfordshire, United Kingdom
|
Leased
|
|
Corporate Headquarters Facilities:
|
|
|
Burlington, North Carolina
|
Owned
|
|
Burlington, North Carolina
|
Leased
|
All of the Company’s primary laboratory facilities have been built or improved for the single purpose of providing clinical laboratory testing services. The Company believes that these facilities are suitable and adequate and have sufficient production capacity for its currently foreseeable level of operations. The Company believes that if it were unable to renew a lease or if a lease were to be terminated on any of the facilities it presently leases, it could find alternate space at competitive market rates and readily relocate its operations to such new locations without material disruption to its operations.
|
Item 3.
|
LEGAL PROCEEDINGS
|
The Company is involved from time to time in various claims and legal actions, including arbitrations, class actions, and other litigation (including those described in more detail below), arising in the ordinary course of business. Some of these actions involve claims that are substantial in amount. These matters include, but are not limited to, intellectual property disputes, professional liability, employee related matters, and inquiries, including subpoenas and other civil investigative demands, from governmental agencies, Medicare or Medicaid payers and managed care payers reviewing billing practices or requesting comment on allegations of billing irregularities that are brought to their attention through billing audits or third parties. The Company receives civil investigative demands or other inquiries from various governmental bodies in the ordinary course of its business. Such inquiries can relate to the Company or other healthcare providers. The Company works cooperatively to respond to appropriate requests for information.
The Company is also named from time to time in suits brought under the qui tam provisions of the False Claims Act and comparable state laws. These suits typically allege that the Company has made false statements and/or certifications in connection with claims for payment from federal or state health care programs. They may remain under seal (hence, unknown to the Company) for some time while the government decides whether to intervene on behalf of the qui tam plaintiff. Such claims are an inevitable part of doing business in the health care field today.
The Company believes that it is in compliance in all material respects with all statutes, regulations and other requirements applicable to its clinical laboratory operations. The clinical laboratory testing industry is, however, subject to extensive regulation, and the courts have not interpreted many of the applicable statutes and regulations. There can be no assurance, therefore, that such statutes and regulations will not be interpreted or applied by a prosecutorial, regulatory or judicial authority in a manner that would adversely affect the Company. Potential sanctions for violation of these statutes and regulations include significant fines and the loss of various licenses, certificates and authorizations.
Many of the claims and legal actions against the Company are in preliminary stages, and many of the cases seek an indeterminate amount of damages. The Company records an aggregate legal reserve, which is determined using actuarial calculations around historical loss rates and assessment of trends experienced in settlements and defense costs. In accordance with ASC 450 “Contingencies”, the Company establishes reserves for judicial, regulatory, and arbitration matters outside the aggregate legal reserve if and when those matters present loss contingencies that are both probable and estimable and would exceed the aggregate legal reserve. When loss contingencies are not both probable and estimable, the Company does not establish separate reserves.
The Company is unable to estimate a range of reasonably probable loss for cases described in more detail below in which damages either have not been specified or, in the Company's judgment, are unsupported and/or exaggerated and (i) the proceedings are in early stages; (ii) there is uncertainty as to the outcome of pending appeals or motions; (iii) there are significant factual issues to be resolved; and/or (iv) there are novel legal issues. For these cases, however, the Company does not believe, based on currently available information, that the outcomes of these proceedings will have a material adverse effect on the Company's financial condition, though the outcomes could be material to the Company's operating results for any particular period, depending, in part, upon the operating results for such period.
33
As previously reported, the Company reached a settlement in the previously disclosed lawsuit,
California ex rel. Hunter
Laboratories, LLC et al. v. Quest Diagnostics Incorporated, et al.
("Hunter Labs Settlement Agreement"), to avoid the uncertainty and costs associated with prolonged litigation. Pursuant to the executed settlement agreement, the Company recorded a litigation settlement expense of
$34.5 in the second quarter of 2011 (net of a previously recorded reserve of $15.0) and paid the settlement amount of $49.5 in the third quarter of 2012
. The Company also agreed to certain reporting obligations regarding its pricing for a limited time period and, at the option of the Company in lieu of such reporting obligations, to provide Medi-Cal with a discount from Medi-Cal's otherwise applicable maximum reimbursement rate from November 1, 2011 through October 31, 2012. In June of 2012, the California legislature enacted Assembly Bill No. 1494, Section 9 of which directs the Department of Health Care Services ("DHCS") to establish new reimbursement rates for Medi-Cal clinical laboratory services that will be based on payments made to California clinical laboratories for similar services by other third-party payers. With stakeholder input, DHCS established data elements and a format for laboratories to report payment data from comparable third-party payers. After reviewing the submitted data, DHCS will propose new reimbursement rates and solicit stakeholder input before their implementation. The bill provides that until the new rates are set through this process, Medi-Cal payments for clinical laboratory services will be reduced (in addition to a 10% payment reduction imposed by statute in 2011) by “up to 10 percent” for tests with dates of service on or after July 1, 2012, with a cap on payments set at 80% of the lowest maximum allowance established under the federal Medicare program. Under the terms of the Hunter Labs Settlement Agreement, the enactment of this California legislation terminates the Company's reporting obligations (or obligation to provide a discount in lieu of reporting) under that agreement. Taken together, these changes are not expected to have a material impact on the Company's consolidated revenues or results of operations.
As previously reported, the Company responded to an October 2007 subpoena from the United States Department of Health & Human Services Office of Inspector General's regional office in New York. On August 17, 2011, the Southern District of New York unsealed a False Claims Act lawsuit,
United States of America ex rel. NPT Associates v. Laboratory Corporation of America Holdings
, which alleges that the Company offered UnitedHealthcare kickbacks in the form of discounts in return for Medicare business. The Plaintiff's third amended complaint further alleges that the Company's billing practices violated the false claims acts of fourteen states plus the District of Columbia. The lawsuit seeks actual and treble damages and civil penalties for each alleged false claim, as well as recovery of costs, attorney's fees, and legal expenses. Neither the U.S. government nor any state government has intervened in the lawsuit. The Company will vigorously defend the lawsuit.
In addition, the Company has received various subpoenas since 2007 related to Medicaid billing. In February 2009, the Company received a subpoena from the Commonwealth of Virginia Office of the Attorney General requesting documents related to its billing to Virginia Medicaid. In April 2013, the Commonwealth of Virginia Office of the Attorney General closed its investigation. In October 2009, the Company received a subpoena from the State of Michigan Department of Attorney General seeking documents related to its billing to Michigan Medicaid. In October 2013, the Company received a civil investigative demand from the State of Texas Office of the Attorney General requesting documents related to its billing to Texas Medicaid. The Company is cooperating with these requests.
In June of 2010, the Company received a subpoena from the State of Florida Office of the Attorney General requesting documents related to its billing to Florida Medicaid. On November 4, 2013, the State of Florida through the Office of the Attorney General filed an Intervention Complaint in a False Claims Act lawsuit,
State of Florida ex rel. Hunter Laboratories, LLC and Chris Riedel v. Quest Diagnostics Incorporated, et al.
in the Circuit Court for the Second Judicial Circuit for Leon County, Case No. 2007-CA-003549. The lawsuit, originally filed by a competitor laboratory, alleges that the Company overcharged Florida's Medicaid program. The lawsuit seeks actual and treble damages and civil penalties for each alleged false claim, as well as recovery of costs, attorney's fees, and legal expenses. The Company will vigorously defend the lawsuit.
On May 2, 2013, the Company was served with a False Claims Act lawsuit,
State of Georgia ex rel. Hunter Laboratories, LLC
and
Chris Riedel v. Quest Diagnostics Incorporated, et al.
, filed in the State Court of Fulton County, Georgia. The lawsuit, filed by a competitor laboratory, alleges that the Company overcharged Georgia's Medicaid program. The case has been removed to the United States District Court for the Northern District of Georgia. The lawsuit seeks actual and treble damages and civil penalties for each alleged false claim, as well as recovery of costs, attorney's fees, and legal expenses. The government filed a notice declining to intervene in the case. The Company will vigorously defend the lawsuit.
On August 19, 2013, the Company was served with a False Claims Act lawsuit,
Commonwealth of Virginia ex rel. Hunter Laboratories, LLC and Chris Riedel v. Quest Diagnostics Incorporated, et al
., filed in the Circuit Court of Fairfax County, Virginia. The lawsuit, filed by a competitor laboratory, alleges that the Company overcharged Virginia’s Medicaid program. The case has been removed to the United States District Court for the Eastern District of Virginia. The lawsuit seeks actual and treble damages and civil penalties for each alleged false claim, as well as recovery of costs, attorney's fees, and legal expenses. The government filed a notice declining to intervene in the case. The Company's Motion to Dismiss was granted and the plaintiffs were granted the right to seek relief to replead their complaint. An amended complaint was filed and the Company's motion to dismiss is pending. The Company will vigorously defend the lawsuit.
34
In October 2011, a putative stockholder of the Company made a letter demand through his counsel for inspection of documents related to policies and procedures concerning the Company's Board of Directors' oversight and monitoring of the Company's billing and claim submission process. The letter also seeks documents prepared for or by the Board regarding allegations from the
California ex rel. Hunter Laboratories, LLC et al. v. Quest Diagnostics Incorporated, et al.
, a lawsuit that was settled in 2011, and documents reviewed and relied upon by the Board in connection with the settlement. The Company responded to the request pursuant to Delaware law.
On November 18, 2011, the Company received a letter from U.S. Senators Baucus and Grassley requesting information regarding the Company's relationships with its largest managed care customers. The letter requested information about the Company's contracts and financial data regarding its managed care customers. Company representatives met with Senate Finance Committee staff after receiving the request and subsequently produced documents in response. The Company continues to cooperate with the request for information.
On February 27, 2012, the Company was served with a False Claims Act lawsuit,
United States ex rel. Margaret Brown v. Laboratory Corporation of America Holdings and Tri-State Clinical Laboratory Services, LLC
, filed in the United States District Court for the Southern District of Ohio, Western Division. The Company owned 50% of Tri-State Clinical Laboratory Services, LLC, which was dissolved in June 2011 pursuant to a voluntary petition under Chapter 7 of Title 11 of the United States Code. The lawsuit alleges that the defendants submitted false claims for payment for laboratory testing services performed as a result of financial relationships that violated the federal Stark and Anti-Kickback Laws. The lawsuit seeks actual and treble damages and civil penalties for each alleged false claim, as well as recovery of costs, attorney's fees, and legal expenses. The U.S. government has not intervened in the lawsuit. The Company will vigorously defend the lawsuit.
On June 7, 2012, the Company was served with a putative class action lawsuit,
Yvonne Jansky v. Laboratory Corporation of America, et al.
, filed in the Superior Court of the State of California, County of San Francisco. The lawsuit alleges that the defendants committed unlawful and unfair business practices, and violated various other state laws by changing screening codes to diagnostic codes on laboratory test orders, thereby resulting in customers being responsible for co-payments and other debts. The lawsuit seeks injunctive relief, actual and punitive damages, as well as recovery of attorney's fees, and legal expenses. The Company will vigorously defend the lawsuit.
On June 7, 2012, the Company was served with a putative class action lawsuit,
Ann Baker Pepe v. Genzyme Corporation and Laboratory Corporation of America Holdings
, filed in the United States District Court for the District of Massachusetts. The lawsuit alleges that the defendants failed to preserve DNA samples allegedly entrusted to the defendants and thereby breached a written agreement with plaintiff and violated state laws. The lawsuit seeks injunctive relief, actual, double and treble damages, as well as recovery of attorney's fees and legal expenses. The Company will vigorously defend the lawsuit.
On August 24, 2012, the Company was served with a putative class action lawsuit,
Sandusky Wellness Center, LLC, et al. v. MEDTOX Scientific, Inc., et al.
, filed in the United States District Court for the District of Minnesota. The complaint alleges that on or about February 21, 2012, the defendants violated the federal Telephone Consumer Protection Act ("TCPA") by sending unsolicited facsimiles to Plaintiff and more than 39 other recipients without the recipients' prior express permission or invitation. The lawsuit seeks the greater of actual damages or the sum of $0.0005 for each violation, subject to trebling under the TCPA, and injunctive relief. The Company will vigorously defend the lawsuit.
The Company was a defendant in two separate putative class action lawsuits,
Christine Bohlander v. Laboratory Corporation of America, et al.,
and
Jemuel Andres, et al. v. Laboratory Corporation of America Holdings, et. al.,
related to overtime pay. After the filing of the two lawsuits on July 8, 2013, the
Bohlander
lawsuit was consolidated into the
Andres
lawsuit, and the consolidated lawsuit is now pending in the Superior Court of California for the County of Los Angeles. In the consolidated lawsuit, the Plaintiffs allege on behalf of similarly situated phlebotomists and couriers that the Company failed to pay overtime, failed to provide meal and rest breaks, and committed other violations of the California Labor Code. The complaint seeks monetary damages, civil penalties, costs, injunctive relief, and attorney's fees. The Company intends to vigorously defend the lawsuit.
On December 17, 2010, the Company was served with a lawsuit,
Oliver Wuth, et al. v. Laboratory Corporation of America, et al.
,
filed in the State Superior Court of King County, Washington. The lawsuit alleges that the Company was negligent in the handling of a prenatal genetic test order that allegedly resulted in the parents being given incorrect information. The matter was tried to a jury beginning on October 21, 2013. On December 10, 2013, the jury returned a verdict in in plaintiffs’ favor in the amount of $50.0, with 50% of liability apportioned to the Company and 50% of liability apportioned to co-defendant Valley Medical Center. The Company filed post-judgment motions for a new trial, which were denied, and intends to vigorously pursue an appeal of the judgment on multiple grounds. The Company carries self-insurance reserves and excess liability insurance sufficient to cover the potential liability in this case.
35
Under the Company's present insurance programs, coverage is obtained for catastrophic exposure as well as those risks required to be insured by law or contract. The Company is responsible for the uninsured portion of losses related primarily to general, professional and vehicle liability, certain medical costs and workers' compensation. The self-insured retentions are on a per occurrence basis without any aggregate annual limit. Provisions for losses expected under these programs are recorded based upon the Company's estimates of the aggregated liability of claims incurred. As of December 31, 2013, the Company had provided letters of credit aggregating approximately $42.5, primarily in connection with certain insurance programs. The Company's availability under its Revolving Credit Facility is reduced by the amount of these letters of credit.
|
Item 4.
|
MINE SAFETY DISCLOSURES
|
Not applicable.
36
PART II
Market Information
The Company's common stock, par value $0.10 per share (the "Common Stock"), trades on the New York Stock Exchange (“NYSE”) under the symbol "LH." The following table sets forth for the calendar periods indicated the high and low sales prices for the Common Stock reported on the NYSE Composite Tape.
|
|
High
|
Low
|
|||||
|
Year Ended December 31, 2012
|
|
|
|
|
|||
|
First Quarter
|
$
|
93.30
|
|
$
|
85.58
|
|
|
|
Second Quarter
|
$
|
94.33
|
|
$
|
81.56
|
|
|
|
Third Quarter
|
$
|
95.30
|
|
$
|
83.50
|
|
|
|
Fourth Quarter
|
$
|
94.30
|
|
$
|
82.15
|
|
|
|
Year Ended December 31, 2013
|
|
|
|
|
|||
|
First Quarter
|
$
|
91.84
|
|
$
|
85.80
|
|
|
|
Second Quarter
|
$
|
101.69
|
|
$
|
89.68
|
|
|
|
Third Quarter
|
$
|
101.92
|
|
$
|
95.36
|
|
|
|
Fourth Quarter
|
$
|
108.00
|
|
$
|
87.01
|
|
|
Holders
On
February 20, 2014
, there were 85.3 holders of record of the Common Stock.
Dividends
The Company has not historically paid dividends on its Common Stock and does not presently anticipate paying any dividends on its Common Stock in the foreseeable future.
37
Common Stock Performance
The Company’s common stock is traded on the NYSE. The graph below shows the cumulative total return assuming an investment of $100 on December 31, 2008 in each of the Company’s common stock, the Standard & Poor’s (the “S&P”) Composite-500 Stock Index and the S&P 500 Health Care Index (the “Peer Group”) and assuming that all dividends were reinvested.
Comparison of Five Year Cumulative Total Return
|
|
12/2008
|
12/2009
|
12/2010
|
12/2011
|
12/2012
|
12/2013
|
|||||||||||||||||
|
Laboratory Corporation of America Holdings
|
$
|
100
|
|
$
|
116.19
|
|
$
|
136.50
|
|
$
|
133.47
|
|
$
|
134.48
|
|
$
|
141.86
|
|
|||||
|
S&P 500 Index
|
$
|
100
|
|
$
|
126.46
|
|
$
|
145.51
|
|
$
|
148.59
|
|
$
|
172.37
|
|
$
|
228.19
|
|
|||||
|
S&P 500 Health Care Index
|
$
|
100
|
|
$
|
119.70
|
|
$
|
123.17
|
|
$
|
138.85
|
|
$
|
163.69
|
|
$
|
231.55
|
|
|||||
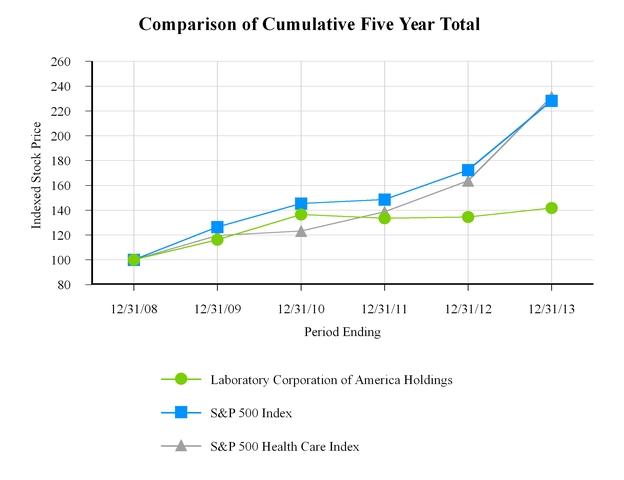
38
Issuer Purchases of Equity Securities
The following table sets forth information with respect to purchases of shares of the Company’s Common Stock made during the quarter ended
December 31, 2013
, by or on behalf of the Company (dollar amounts in millions):
|
Total
Number
of Shares
Repurchased
|
Average
Price
Paid
Per
Share
|
Total Number
of Shares
Repurchased as
Part of Publicly
Announced
Program
|
Maximum
Dollar Value
of Shares
that May Yet Be
Repurchased
Under
the Program
|
||||||||||
|
October 1 – October 31
|
0.7
|
|
$
|
102.19
|
|
0.7
|
|
$
|
1,239.6
|
|
|||
|
November 1 – November 30
|
1.5
|
|
103.38
|
|
1.5
|
|
1,088.8
|
|
|||||
|
December 1 – December 31
|
0.3
|
|
92.33
|
|
0.3
|
|
1,058.5
|
|
|||||
|
|
2.5
|
|
$
|
101.58
|
|
2.5
|
|
|
|
||||
The Board of Directors has authorized the repurchase of specified amounts of the Company's common stock since 2007, including the Board of Director's authorization on February 10, 2012 to purchase up to $500.0 of additional shares of the Company's common stock. As of December 31, 2012, the Company had outstanding authorization from the Board of Directors to purchase up to $74.0 of Company common stock based on settled trades as of that date. On February 8, 2013, the Company announced the Board of Directors authorized the purchase of up to $1,000.0 of additional shares of the Company's common stock. On October 18, 2013, the Company announced the Board of Directors authorized the purchase of up to $1,000.0 of additional shares of the Company's stock. As of December 31, 2013, the Company had outstanding authorization from the Board of Directors to purchase $1,058.5 of Company common stock. The repurchase authorization has no expiration date.
39
|
Item 6.
|
SELECTED FINANCIAL DATA
|
The selected financial data presented below under the captions "Statement of Operations Data" and "Balance Sheet Data" as of and for the five-year period ended
December 31, 2013
are derived from consolidated financial statements of the Company, which have been audited by an independent registered public accounting firm. This data should be read in conjunction with the accompanying notes, the Company's consolidated financial statements and the related notes thereto, and "Management's Discussion and Analysis of Financial Condition and Results of Operations," all included elsewhere herein.
|
|
Year Ended December 31,
|
||||||||||||||||||
|
(a)
2013
|
(b)
2012
|
(c) (d)
2011
|
(e)
2010
|
(f)
2009
|
|||||||||||||||
|
|
(In millions, except per share amounts)
|
||||||||||||||||||
|
Statement of Operations Data
:
|
|
|
|
|
|
||||||||||||||
|
Net sales
|
$
|
5,808.3
|
|
$
|
5,671.4
|
|
$
|
5,542.3
|
|
$
|
5,003.9
|
|
$
|
4,694.7
|
|
||||
|
Gross profit
|
2,223.2
|
|
2,249.7
|
|
2,274.7
|
|
2,097.8
|
|
1,970.9
|
|
|||||||||
|
Operating income
|
990.9
|
|
1,023.5
|
|
948.4
|
|
978.8
|
|
935.9
|
|
|||||||||
|
Net earnings attributable to Laboratory
|
|
|
|
|
|
|
|
|
|
|
|||||||||
|
Corporation of America Holdings
|
573.8
|
|
583.1
|
|
519.7
|
|
558.2
|
|
543.3
|
|
|||||||||
|
Basic earnings per common share
|
$
|
6.36
|
|
$
|
6.09
|
|
$
|
5.20
|
|
$
|
5.42
|
|
$
|
5.06
|
|
||||
|
Diluted earnings per common share
|
$
|
6.25
|
|
$
|
5.99
|
|
$
|
5.11
|
|
$
|
5.29
|
|
$
|
4.98
|
|
||||
|
Basic weighted average common
|
|
|
|
|
|
|
|
|
|
|
|||||||||
|
shares outstanding
|
90.2
|
|
95.7
|
|
100.0
|
|
103.0
|
|
107.4
|
|
|||||||||
|
Diluted weighted average common
|
|
|
|
|
|
|
|
|
|||||||||||
|
shares outstanding
|
91.8
|
|
97.4
|
|
101.8
|
|
105.4
|
|
109.1
|
|
|||||||||
|
Balance Sheet Data:
|
|
|
|
|
|
|
|
|
|
|
|||||||||
|
Cash and cash equivalents, and
|
|
|
|
|
|
|
|
|
|
|
|||||||||
|
short-term investments
|
$
|
404.0
|
|
$
|
466.8
|
|
$
|
159.3
|
|
$
|
230.7
|
|
$
|
148.5
|
|
||||
|
Goodwill and intangible assets, net
|
4,594.8
|
|
4,569.4
|
|
4,302.5
|
|
4,275.4
|
|
3,239.3
|
|
|||||||||
|
Total assets
|
6,965.9
|
|
6,795.0
|
|
6,111.8
|
|
6,187.8
|
|
4,837.8
|
|
|||||||||
|
Long-term obligations (g)
|
3,000.4
|
|
2,655.0
|
|
2,221.0
|
|
2,188.4
|
|
1,394.4
|
|
|||||||||
|
Total shareholders' equity
|
2,491.3
|
|
2,717.4
|
|
2,503.5
|
|
2,466.3
|
|
2,106.1
|
|
|||||||||
|
(a)
|
During
2013
, the Company recorded net restructuring charges of
$21.8
. The charges were comprised of
$15.4
in severance and other personnel costs and
$9.5
in facility-related costs primarily associated with facility closures and general integration initiatives. These charges were offset by the reversal of previously established reserves of
$0.7
in unused severance and
$2.4
in unused facility-related costs.
|
|
(b)
|
During 2012, the Company recorded net restructuring charges of $25.3. The charges were comprised of $16.2 in severance and other personnel costs and $19.6 in facility-related costs primarily associated with the ongoing integration activities of Orchid and the Integrated Genetics business (formerly Genzyme Genetics) and costs associated with the previously announced termination of an executive vice president. These charges were offset by the reversal of previously established reserves of $6.3 in unused severance and $4.2 in unused facility-related costs. As part of the Clearstone integration, the Company also recorded a $6.9 loss on the disposal of one of its European subsidiaries in Other, net under Other income (expenses) during 2012. In addition, the Company recorded $6.2 in accelerated amortization relating to the termination of a licensing agreement.
|
|
(c)
|
During 2011, the Company recorded net restructuring charges of $44.6. Of this amount, $27.4 related to severance and other personnel costs, and $22.0 primarily related to facility-related costs associated with the ongoing integration of certain acquisitions including Genzyme Genetics and Westcliff Medical Laboratories, Inc. ("Westcliff"). These charges were offset by restructuring credits of $4.8 resulting from the reversal of unused severance and facility closure liabilities. In addition, the Company recorded fixed assets impairment charges of $18.9 primarily related to equipment, computer systems and leasehold improvements in closed facilities. The Company also recorded special charges of $14.8 related to the write-off of certain assets and liabilities related to an investment made in prior years, along with a $2.6 write-off of an uncollectible receivable from a past installment sale of one of the Company's lab operations.
|
40
|
(d)
|
Following the closing of its acquisition of Orchid in mid-December 2011, the Company recorded a net $2.8 loss on its divestiture of certain assets of Orchid's U.S. government paternity business, under the terms of the agreement reached with the U.S. Federal Trade Commission. This non-deductible loss on disposal was recorded in Other Income and Expense in the Company's Consolidated Statements of Operations and decreased net earnings for the twelve months ended December 31, 2011 by $2.8.
|
|
(e)
|
During 2010, the Company recorded net restructuring charges of $5.8 primarily related to work force reductions and the closing of redundant and underutilized facilities. In addition, the Company recorded a special charge of $6.2 related to the write-off of development costs incurred on systems abandoned during the year.
|
The Company incurred approximately $25.7 in professional fees and expenses in connection with the acquisition of Genzyme Genetics and other acquisition activity, including significant costs associated with the Federal Trade Commission’s review of the Company’s purchase of specified net assets of Westcliff. These fees and expenses are included in selling, general and administrative expenses for the year ended December 31, 2010.
The Company also incurred $7.0 of financing commitment fees (included in interest expense for the year ended December 31, 2010) in connection with the acquisition of Genzyme Genetics.
|
(f)
|
During 2009, the Company recorded net restructuring charges of $13.5 primarily related to the closing of redundant and underutilized facilities.
|
In October 2009, the Company received approval from its Board of Directors to freeze any additional service-based credits for any years of service after December 31, 2009 on the defined benefit retirement plan (the “Company Plan”) and the nonqualified supplemental retirement plan (the “PEP”). As a result of the changes to the Company Plan and PEP which were adopted in the fourth quarter of 2009, the Company recognized a net curtailment charge of $2.8 due to remeasurement of the PEP obligation at December 31, 2009 and the acceleration of unrecognized prior service for that plan. In addition, the Company recorded favorable adjustments of $21.5 to its tax provision relating to the resolution of certain state income tax issues under audit, as well as the realization of foreign tax credits.
In connection with the Monogram Biosciences acquisition, the Company incurred $2.7 in transaction fees and expenses in the third quarter of 2009.
|
(g)
|
Long-term obligations primarily include the Company’s zero-coupon convertible subordinated notes, 5 1/2% senior notes due 2013, 5 5/8% senior notes due 2015, 3 1/8% senior notes due 2016, 2 1/5% senior notes due 2017, 2 1/2% senior notes due 2018, 4 5/8% senior notes due 2020, 3 3/4% senior notes due 2022, 4% senior notes due 2023, term loan, revolving credit facility and other long-term obligations. The accreted balance of the zero-coupon convertible subordinated notes was $110.8, $130.0, $135.5, $286.7, and $292.2 at December 31, 2013, 2012, 2011, 2010, and 2009, respectively. The balance of the 5
1/2% senior notes, including principal and unamortized portion of a deferred gain on an interest rate swap agreement, was $0.0, $350.0, $350.5, $350.9, and $351.3 at December 31, 2013, 2012, 2011, 2010, and 2009, respectively. The principal balance of the 5 5/8% senior notes was $250.0 at December 31, 2013, 2012, 2011, 2010, and 2009. The principal balance of the 3 1/8% senior notes was $325.0 at December 31, 2013, 2012, 2011 and 2010, and $0.0 for 2009. The principal balance of the 4 5/8% senior notes was $600.0 at December 31, 2013, 2012, 2011 and 2010 and $0 for 2009. The principal balances of the 2 1/5% and 3 3/4% senior notes were $500.0 each at December 31, 2013 and 2012 and $0.0 for all other years presented. The principal balances of the 2 1/2% and 4% senior notes were $400.0 and $300.0, respectively, at December 31, 2013 and $0.0 for all other years presented. The term loan was $0.0, $0.0, $0.0, $375.0, and $425.0 at December 31, 2013, 2012, 2011, 2010, and 2009, respectively. The revolving credit facility was $0.0, $0.0, $560.0, $0.0, and $75.0 at December 31, 2013, 2012, 2011, 2010, and 2009, respectively. The remainder of other long-term obligations consisted primarily of capital leases and mortgages payable with balances of $14.6, $0.0, $0.0, $0.8, and $0.9 at December 31, 2013, 2012, 2011, 2010, and 2009, respectively. Long-term obligations exclude amounts due to affiliates.
|
41
|
Item 7.
|
MANAGEMENT'S DISCUSSION AND ANALYSIS OF FINANCIAL CONDITION AND RESULTS OF OPERATIONS (in millions)
|
General
Net sales for 2013 increased 2.4% in comparison to 2012 on a 4.0% increase in volume and a 1.6% decrease in revenue per requisition. The Company's acquisition of MEDTOX on July 31, 2012 increased revenue and volume by 1.6% and 2.1%, respectively in 2013 compared to 2012 and 1.0% and 1.4%, respectively, in 2012 compared to 2011. The Company's acquisition of Orchid in December 2011 increased revenue and volume by 1.1% and 0.3%, respectively, in 2012 compared to 2011.
During 2013, government payment reductions and molecular pathology payment issues reduced the Company’s year over year margins by approximately 150 basis points, reduced year over year revenue per requisition by approximately 2% and reduced year over year operating flow by more than an estimated $100.0. Also, growth in the Company’s toxicology business reduced 2013 year over year revenue per requisition by approximately 1%.
During 2013, the impact of weather reduced the Company's revenues and diluted earnings per share by an estimated $12.7 and $0.07, respectively. During 2012, the impact of weather (notably from Super Storm Sandy in October 2012) reduced the Company's revenues and diluted earnings per share by an estimated $16.0 and $0.09, respectively.
The Company has seen growth in the amount of its patient accounts receivable. A significant portion of the Company’s bad debt expense is related to accounts receivable from patients. The Company believes its current allowance for doubtful accounts is sufficient to properly record its accounts receivable at their estimated net realizable value. Should this shift towards increased patient responsibility continue, the Company may need to increase its allowance for doubtful accounts and bad debt expense in future periods.
The Company manages its operations through two reportable segments: the Clinical diagnostics laboratory segment, which includes core testing as well as genomic and esoteric testing, and the Other segment, comprised of the Company's non-U.S. clinical diagnostic laboratory operations in Ontario, Canada, which is reviewed separately by corporate management for the purposes of allocation of resources. As mentioned above, the Clinical diagnostics laboratory segment results of operations have been negatively impacted by the reductions in payments for laboratory services, primarily from federal and state government entities. Operating results for the Other segment have declined slightly as compared to 2012, primarily due to the expansion of that segment through acquisitions not fully integrated and synergies not fully realized, as well as the impact of the stronger U.S. dollar in 2013 as compared with 2012.
Seasonality
The majority of the Company’s testing volume is dependent on patient visits to physician offices and other providers of health care. Volume of testing generally declines during the year-end holiday periods and other major holidays. In addition, volume declines due to inclement weather may reduce net revenues and cash flows. Therefore, comparison of the results of successive periods may not accurately reflect trends or results from one year to the next.
Results of Operations (amounts in millions except Revenue Per Requisition info)
Years ended December 31, 2013, 2012, and 2011
Net Sales
|
|
Years Ended December 31,
|
Change
|
|||||||||||||||
|
Net sales
|
2013
|
2012
|
2011
|
2013
|
2012
|
||||||||||||
|
Clinical diagnostics laboratory:
|
|||||||||||||||||
|
Core Testing
|
$
|
3,445.1
|
|
$
|
3,246.6
|
|
$
|
3,143.9
|
|
6.1
|
%
|
3.3
|
%
|
||||
|
Genomic and Esoteric Testing
|
2,020.1
|
|
2,089.8
|
|
2,089.0
|
|
(3.3
|
)%
|
0.0
|
%
|
|||||||
|
Other
|
343.1
|
|
335.0
|
|
309.4
|
|
2.4
|
%
|
8.3
|
%
|
|||||||
|
Total
|
$
|
5,808.3
|
|
$
|
5,671.4
|
|
$
|
5,542.3
|
|
2.4
|
%
|
2.3
|
%
|
||||
42
|
|
Years Ended December 31,
|
Change
|
||||||||||||
|
Volume
|
2013
|
2012
|
2011
|
2013
|
2012
|
|||||||||
|
Clinical diagnostics laboratory:
|
||||||||||||||
|
Core Testing
|
89.9
|
|
86.2
|
|
85.2
|
|
4.4
|
%
|
1.2
|
%
|
||||
|
Genomic and Esoteric Testing
|
31.2
|
|
29.9
|
|
29.3
|
|
4.3
|
%
|
1.8
|
%
|
||||
|
Other
|
9.9
|
|
9.8
|
|
9.3
|
|
0.7
|
%
|
6.2
|
%
|
||||
|
Total
|
131.0
|
|
125.9
|
|
123.8
|
|
4.0
|
%
|
1.7
|
%
|
||||
|
|
Years Ended December 31,
|
Change %
|
|||||||||||||||
|
Revenue Per Requisition
|
2013
|
2012
|
2011
|
2013
|
2012
|
||||||||||||
|
Clinical diagnostics laboratory:
|
|||||||||||||||||
|
Core Testing
|
$
|
38.31
|
|
$
|
37.68
|
|
$
|
36.91
|
|
1.7
|
%
|
2.1
|
%
|
||||
|
Genomic and Esoteric Testing
|
64.84
|
|
69.94
|
|
71.19
|
|
(7.3
|
)%
|
(1.8
|
)%
|
|||||||
|
Other
|
34.53
|
|
33.94
|
|
33.29
|
|
1.7
|
%
|
2.0
|
%
|
|||||||
|
Total
|
$
|
44.33
|
|
$
|
45.04
|
|
$
|
44.76
|
|
(1.6
|
)%
|
0.6
|
%
|
||||
The increase in net sales for the three years ended December 31, 2013 has been driven primarily by acquisitions made in all years in both of the Company's segments, along with growth in the Company's managed care business and toxicology testing.
During 2013, the impact of weather, reduced the Company's revenues by an estimated $12.7, of which $5.3 occurred in the fourth quarter. The 2013 decline in revenue per requisition in genomic and esoteric testing is a result of a change in mix of genetic and histology testing. Histology revenue per requisition was also impacted by payment reductions on the Medicare physician fee schedule. Further, revenue per requisition also decreased due to delays in payments and denials of coverage for existing tests by some payers after implementation of new molecular pathology codes at the beginning of the year and the implementation of sequestration on April 1, 2013.
During the fourth quarter of 2012, the impact of weather reduced revenue by an estimated $16.0. The increase in net sales for the year ended December 31, 2012 as compared with 2011 was driven primarily by the MEDTOX and Orchid acquisitions and by contributions from the milder winter weather experienced in the first quarter of 2012, along with positive volume growth in genomic and esoteric testing and the Other segment, offset by volume losses sustained in the fourth quarter of 2012 due to Super Storm Sandy. Genomic and esoteric testing volume as a percentage of total volume was 23.7% in both 2012 and 2011. Volume growth for genomic and esoteric testing was primarily due to the incremental volume from Orchid as well as growth in the NuSwab
®
series of women's health tests, offset by declines in histology and surgical pathology volumes. The decline in price in genomic and esoteric testing is a result of a lower mix of reproductive and histology testing.
Net sales of the Other segment were $343.1 for 2013 compared to $335.0 in 2012, an increase of $8.1, or 2.4%. Net sales of the Other segment were negatively impacted by a stronger U.S. dollar in 2013 as compared with 2012 and 2011. In Canadian dollars, net sales of the Other segment for the twelve months ended December 31, 2013, 2012 and 2011 were CN$353.2,
CN$334.7 and CN$306.0, respectively.
|
Cost of Sales
|
Years Ended December 31,
|
Change
|
|||||||||||||||
|
|
2013
|
2012
|
2011
|
2013
|
2012
|
||||||||||||
|
Cost of sales
|
$
|
3,585.1
|
|
$
|
3,421.7
|
|
$
|
3,267.6
|
|
4.8
|
%
|
4.7
|
%
|
||||
|
Cost of sales as a % of sales
|
61.7
|
%
|
60.3
|
%
|
59.0
|
%
|
|
|
|
|
|||||||
Cost of sales (primarily laboratory and distribution costs) increased 4.8% in 2013 as compared with 2012 primarily due to increased test volumes and test mix changes. The increase in cost of sales as a percentage of net sales in 2013 as compared to 2012 is primarily due to lower revenues resulting from the Medicare fee reductions, the impact of delays and denials of coverage of molecular pathology codes and sequestration in 2013, as mentioned above. The increase in cost of sales as a percentage of net sales in 2012 as compared to 2011 was primarily due to the impact of weather, lower margins on acquired operations that have not yet been fully integrated as well as slower volume growth.
Labor and testing supplies for the year ended December 31, 2013, comprise over 77.4% of the Company’s cost of sales. Cost of sales has increased over the three year period ended December 31, 2013 primarily due to overall growth in the Company's
43
volume, the impact of acquisitions, increases in labor, and the continued shift in test mix to genomic and esoteric testing which contributed to the higher cost of testing supplies.
Selling, General and Administrative Expenses
|
|
Years Ended December 31,
|
Change
|
|||||||||||||||
|
|
2013
|
2012
|
2011
|
2013
|
2012
|
||||||||||||
|
Selling, general and administrative expenses
|
$
|
1,128.8
|
|
$
|
1,114.6
|
|
$
|
1,159.6
|
|
1.3
|
%
|
(3.9
|
)%
|
||||
|
SG&A as a % of sales
|
19.4
|
%
|
19.7
|
%
|
20.9
|
%
|
|
|
|
|
|||||||
Selling, general and administrative expenses as a percentage of net sales decreased to 19.4% in 2013 compared to 19.7% in 2012. The decrease in selling, general and administrative expenses as a percentage of net sales is primarily due to $9.9 in fees related to the MEDTOX acquisition recorded in 2012 and to efficiencies from acquired operations that are being integrated into the Company's operating cost structure. Additionally, bad debt expense increased to 4.4% of net sales in 2013 as compared to 4.3% of net sales in 2012.
Selling, general and administrative expenses as a percentage of net sales decreased to 19.7% in 2012 compared to 20.9% in 2011. The decrease in selling, general and administrative expenses as a percentage of net sales was partially due to expense management and to efficiencies from acquired operations that were integrated into the Company's cost structure. Additionally, bad debt expense decreased to 4.3% of net sales in 2012 as compared with 4.6% in 2011 primarily due to improved collection trends resulting from process improvement programs within the Company's billing department and field operations. These decreases in selling, general and administrative expenses were partially offset by $9.9 in transaction fees related to the MEDTOX acquisition, mentioned above. During 2011, the Company recorded the settlement of the Hunter Labs litigation in California for $34.5 ($49.5 settlement less previously recorded reserves of $15.0) in selling, general and administrative expenses.
Amortization of Intangibles and Other Assets
|
|
Years Ended December 31,
|
Change
|
|||||||||||||||
|
|
2013
|
2012
|
2011
|
2013
|
2012
|
||||||||||||
|
Amortization of intangibles and other assets
|
$
|
81.7
|
|
$
|
86.3
|
|
$
|
85.8
|
|
(5.3
|
)%
|
0.6
|
%
|
||||
The decrease in amortization of intangibles and other assets over the three year period ended December 31, 2013 primarily reflects the net impact of acquisitions closed during all three years offset by adjustments to the fair value of deferred acquisition payments. During 2012, the Company recorded $6.2 in accelerated amortization relating to the termination of a licensing agreement.
Restructuring and Other Special Charges
|
|
Years Ended December 31,
|
||||||||||
|
|
2013
|
2012
|
2011
|
||||||||
|
Restructuring and other special charges
|
$
|
21.8
|
|
$
|
25.3
|
|
$
|
80.9
|
|
||
During
2013
, the Company recorded net restructuring charges of
$21.8
. The charges were comprised of
$15.4
in severance and other personnel costs and
$9.5
in facility-related costs primarily associated with general integration activities. These charges were offset by the reversal of previously established reserves of
$0.7
in unused severance and
$2.4
in unused facility-related costs.
During
2012
, the Company recorded net restructuring charges of
$25.3
. These charges were comprised of
$16.2
in severance and other personnel costs and
$19.6
in facility-related costs primarily associated with the ongoing integration activities of Orchid and the Integrated Genetics business and costs associated with the previously announced termination of an executive vice president. These charges were offset by the reversal of previously established reserves of
$6.3
in unused severance and
$4.2
in unused facility-related costs.
During
2011
, the Company recorded net restructuring charges of
$44.6
. Of this amount,
$27.4
related to severance and other personnel costs, and
$22.0
primarily related to facility related costs associated with the ongoing integration of certain acquisitions including Genzyme Genetics and Westcliff. These charges were offset by restructuring credits of
$4.8
, resulting from the reversal of unused severance and facility closure liabilities. In addition, the Company recorded fixed assets impairment charges of
$18.9
44
primarily related to equipment, computer systems and leasehold improvements in closed facilities. The Company also recorded special charges of
$14.8
related to the write-off of certain assets and liabilities related to an investment made in prior years, along with a
$2.6
write-off of an uncollectible receivable from a past installment sale of one of the Company's lab operations.
From time to time, the Company implements cost savings initiatives. These initiatives result from the integration of recently acquired businesses and from reducing the number of facilities and employees in an effort to balance the Company's cost of operations with current test volume trends while maintaining the high quality of its services that the marketplace demands. It is difficult to determine the nature, timing and extent of these activities until adequate planning has been completed and reviewed. The continuing economic downturn being experienced in the U.S. and globally has had an impact on the Company's business. The Company believes that any restructuring costs which may be incurred in future periods will be more than offset by subsequent savings realized from these potential actions and that any related restructuring charges will not have a material impact on the Company's operations or liquidity.
As part of the Clearstone integration, the Company also recorded a
6.9
loss on the disposal of one of its European subsidiaries in Other, net under Other income (expenses) during 2012.
|
Interest Expense
|
Years Ended December 31,
|
Change %
|
|||||||||||||
|
|
2013
|
2012
|
2011
|
2013
|
2012
|
||||||||||
|
Interest expense
|
$
|
96.5
|
|
$
|
94.5
|
|
$
|
87.5
|
|
2.1
|
8.0
|
||||
The increase in interest expense for 2013 as compared with 2012 is primarily due to the issuance of $700.0 of senior notes in November 2013 and $1,000.0 of senior notes in August 2012, net of the payoff of the 5.5% senior notes due 2013 and the reductions in borrowings under the Revolving Credit Facility due to paydowns with proceeds from the 2012 and 2013 issuances. This increase was also partially offset by a decrease in interest expense on the senior notes due 2020 as a result of entering into a fixed to floating interest rate swap in the third quarter of 2013.
The increase in interest expense for 2012 as compared with 2011 is primarily due to the issuance of $1,000.0 of senior notes in August 2012. This increase was partially offset by the settlement of approximately $155.1 of the zero-coupon subordinated notes during 2011. In addition, during December 2011, the Company replaced its existing term loan facility (the "Term Loan Facility") with a new revolving credit facility (the "Revolving Credit Facility"), which is described further in "Note 11 to Consolidated Financial Statements." The new Revolving Credit Facility had a lower effective interest rate during 2012 compared with the effective interest rate on the Term Loan Facility during 2011.
Equity Method Income
|
|
Years Ended December 31,
|
Change %
|
|||||||||||||
|
|
2013
|
2012
|
2011
|
2013
|
2012
|
||||||||||
|
Equity method income
|
$
|
16.9
|
|
$
|
21.4
|
|
$
|
9.5
|
|
(21.0)
|
125.3
|
||||
Equity method income represents the Company's ownership share in joint venture partnerships along with equity investments in other companies in the healthcare industry. The decrease in income in 2013 compared to 2012 is primarily the result of a $2.9 increase recorded in 2012 due to the liquidation of one of its joint ventures and a decline in profitability of one of the Company's joint venture partnerships due to a challenging business climate in its market.
The increase in income in 2012 compared with 2011 is primarily due to the Company's share of losses during 2011 in the Cincinnati, Ohio joint venture (liquidation initiated in the second half of 2011) and the Canada, China, Singapore and Western Europe equity method investments (acquired by the Company in the second half of 2011) and the $2.9 increase in equity method income recorded in 2012, in conjunction with the liquidation of one of its joint ventures.
|
Income Tax Expense
|
Years Ended December 31,
|
||||||||||
|
|
2013
|
2012
|
2011
|
||||||||
|
Income tax expense
|
$
|
340.2
|
|
$
|
359.4
|
|
$
|
333.0
|
|
||
|
Income tax expense as a % of income before tax
|
37.2
|
%
|
38.1
|
%
|
38.4
|
%
|
|||||
45
The effective rate for 2013 was favorably impacted by the release of a capital loss valuation allowance and recording two years of the R&D tax credit. The American Taxpayer Relief Act of 2012 was enacted in early 2013 and reinstated the R&D tax credit for 2012 and extended the credit for calendar year 2013.
The effective tax rate for
2012
was favorably impacted by a decrease in the reserve for unrecognized income tax benefits compared to 2011, partially offset by an increase in tax on the additional investment in the Company's Canadian subsidiary. The effective tax rate for 2011 was negatively impacted by an increase in the reserve for unrecognized income tax benefits, the divestiture of certain Orchid paternity contracts, and foreign losses not tax effected.
Liquidity, Capital Resources and Financial Position
The Company's strong cash-generating capability and financial condition typically have provided ready access to capital markets. The Company's principal source of liquidity is operating cash flow, supplemented by proceeds from debt offerings. This cash-generating capability is one of the Company's fundamental strengths and provides substantial financial flexibility in meeting operating, investing and financing needs. The Company's senior unsecured Revolving Credit Facility is further discussed in "Note 11 to Consolidated Financial Statements."
On November 1, 2013, the Company issued $700.0 in new senior notes pursuant to the Company’s effective shelf registration on Form S-3. The senior notes consisted of $400.0 aggregate principal amount of 2.50% Senior Notes due 2018 and $300.0 aggregate principal amount of 4.00% Senior Notes due 2023. The net proceeds were first used to repay all of the outstanding borrowings under the Company’s Revolving Credit Facility and the remainder was used for general corporate purposes.
During the third quarter of 2013, the Company entered into fixed-to-variable interest rate swap agreements for the 4.625% senior notes due 2020 with an aggregate notional amount of $600.0 and variable interest rates based on one-month LIBOR plus 2.298% to hedge against changes in the fair value of a portion of the Company's long term debt. These derivative financial instruments are accounted for as fair value hedges of the senior notes due 2020. These interest rate swaps are included in other long term assets and added to the value of the senior notes, with an aggregate fair value of $
0.0
at December 31, 2013. As the specific terms and notional amounts of the derivative financial instruments match those of the fixed-rate debt being hedged, the derivative instruments are assumed to be perfectly effective hedges and accordingly, there is no impact to the Company's Consolidated Statements of Operations. There were no derivative instruments designated as accounting hedges in 2012.
On August 23, 2012, the Company issued $1,000.0 in new senior notes pursuant to the Company's effective shelf registration statement on Form S-3. The new senior notes consisted of $500.0 aggregate principal amount of 2.20% Senior Notes due 2017 and $500.0 aggregate principal amount of 3.75% Senior Notes due 2022. The net proceeds were used to repay $625.0 of the outstanding borrowings under the Company's Revolving Credit Facility. The remaining proceeds were available for other general corporate purposes.
On July 31, 2012, the Company completed its acquisition of MEDTOX for $236.4 in cash, excluding transaction fees. The acquisition was financed through borrowings from the Company’s Revolving Credit Facility and cash on hand.
The Company has discussed its intention to increase its ratio of total debt to consolidated Earnings Before Interest, Taxes, Depreciation, and Amortization ("EBITDA") over time from 2.0 to 1.0 as of December 2012 to 2.5 to 1.0. The Company believes that it can achieve this through the use of its Revolving Credit Facility and its ready access to debt capital markets. As of December 31, 2013, the ratio of total debt to consolidated EBITDA was 2.4 to 1.0. The Company continues to monitor the debt capital markets and, given current market conditions, believes it can readily increase its ratio of total debt to consolidated EBITDA. The Company believes that its cash from operations, in combination with cash on hand and borrowing capacity, will be sufficient to satisfy its obligations in 2014 and beyond.
Operating Activities
In 2013, the Company’s operations provided $
818.7
of cash, reflecting the Company’s solid business results. The decrease in cash provided from operations in 2013 as compared with 2012 is primarily attributable to the delays and denials of coverage for existing tests by some payers after implementation of newly established molecular pathology codes as well as government payment reductions. These delays, denials and government reductions reduced year over year operating cash flow by more than an estimated $100.0. The Company continues to focus on efforts to increase cash collections from all payers and to generate ongoing improvements to the claim submission processes.
46
In 2012, the Company’s operations provided $841.4 of cash, reflecting the Company’s solid business results. The Company continued to focus on efforts to increase cash collections from all payers and to generate on-going improvements to the claim submission processes.
Investing Activities
Capital expenditures were $202.2, $173.8 and $145.7 for 2013, 2012 and 2011, respectively. The increase in capital spending in 2013 was related to certain integration and cost savings initiatives started by the Company. The Company expects capital expenditures of approximately $185.0 to $205.0 in 2014. Such expenditures are expected to be funded by cash flow from operations, as well as borrowings under the Company’s Revolving Credit Facility as needed.
The Company remains committed to growing its business through strategic acquisitions and licensing agreements. The Company has invested a total of $632.9 over the past three years in strategic business acquisitions, including MEDTOX Scientific in 2012 and Orchid in 2011. These acquisitions have helped strengthen the Company’s geographic presence along with expanding capabilities in the specialty testing operations. The Company believes the acquisition market remains attractive with a number of opportunities to strengthen its scientific capabilities, grow esoteric testing capabilities and increase presence in key geographic areas.
The Company has invested a total of $2.9 over the past three years in licensing new testing technologies and had $41.0 net book value of capitalized patents, licenses and technology as of December 31, 2013. While the Company continues to believe its strategy of entering into licensing and technology distribution agreements with the developers of leading-edge technologies will provide future growth in revenues, there are certain risks associated with these investments. These risks include, but are not limited to, the failure of the licensed technology to gain broad acceptance in the marketplace and/or that insurance companies, managed care organizations, or Medicare and Medicaid will not approve reimbursement for these tests at a level commensurate with the costs of running the tests. Any or all of these circumstances could result in impairment in the value of the related capitalized licensing costs.
Financing Activities
On
December 21, 2011
, the Company entered into a Credit Agreement (the "Credit Agreement") providing for the Revolving Credit Facility, a
five-year
$1,000.0
senior unsecured revolving credit facility with Bank of America, N.A., acting as Administrative Agent, Barclays Capital as Syndication Agent, and a group of financial institutions as lending parties. As part of the new Revolving Credit Facility, the Company repaid all of the outstanding principal balances of
$318.8
on its existing term loan facility and
$235.0
on its existing revolving credit facility. In conjunction with the repayment and cancellation of its old credit facility, the Company recorded approximately
$1.0
of remaining unamortized debt costs as interest expense in the accompanying Consolidated Statements of Operations for the year ended December 31, 2011.
There were no balances outstanding on the Company's Revolving Credit Facility at
December 31, 2013
or
December 31, 2012
. The Revolving Credit Facility
bears interest at varying rates based upon a base rate or LIBOR plus (in each case) a percentage based on the Company's debt rating with Standard & Poor's and Moody's Rating Services
.
The Revolving Credit Facility is available for general corporate purposes, including working capital, capital expenditures, acquisitions, funding of share repurchases and other restricted payments permitted under the Credit Agreement.
The Credit Agreement also contains limitations on aggregate subsidiary indebtedness and a debt covenant that requires that the Company maintain on the last day of any period of four consecutive fiscal quarters, in each case taken as one accounting period, a ratio of total debt to consolidated EBITDA of not more than 3.0 to 1.0.
The Company was in compliance with all covenants in the Credit Agreement at
December 31, 2013
. As of
December 31, 2013
, the ratio of total debt to consolidated EBITDA was
2.4
.
As of
December 31, 2013
, the effective interest rate on the Revolving Credit Facility was
1.1%
.
On November 1, 2013, the Company issued $700.0 in new senior notes pursuant to the Company’s effective shelf registration on Form S-3. The new senior notes consisted of $400.0 aggregate principal amount of 2.50% Senior Notes due 2018 and $300.0 aggregate principal amount of 4.00% Senior Notes due 2023. The net proceeds were used to repay all of the outstanding borrowings under the Company’s Revolving Credit Facility and for general corporate purposes.
The Senior Notes due 2018 and Senior Notes due 2023 bear interest at the rate of 2.50% per annum and 4.00% per annum, respectively, payable semi-annually on May 1 and November of each year, commencing on May 1, 2014.
47
On August 23, 2012, the Company issued $1,000.0 in new senior notes pursuant to the Company's effective shelf registration statement on Form S-3. The new senior notes consisted of $500.0 aggregate principal amount of 2.20% Senior Notes due 2017 and $500.0 aggregate principal amount of 3.75% Senior Notes due 2022. The net proceeds were used to repay $625.0 of the outstanding borrowings under the Company's Revolving Credit Facility. The remaining proceeds are available for other general corporate purposes.
The Senior Notes due
2017
and Senior Notes due
2022
bear interest at the rate of
2.20%
per annum and
3.75%
per annum, respectively, payable semi-annually on
February 23
and
August 23
of each year, commencing
February 23, 2013
.
During
2013
, the Company purchased
$1,015.6
of its stock representing
10.4
shares. As of
December 31, 2013
, the Company had remaining outstanding authorization from the Board of Directors to purchase
$1,058.5
of Company common stock.
During
2013
, the Company settled notices to convert
$25.5
aggregate principal amount at maturity of its zero-coupon subordinated notes with a conversion value of
$31.8
. The total cash used for these settlements was
$21.5
and the Company also issued 0.1 additional shares of common stock.
On
September 12, 2013
, the Company announced that for the period of
September 12, 2013 to March 11, 2014
, the zero-coupon subordinated notes will accrue contingent cash interest at a rate of
no less than 0.125% of the average market price of a zero-coupon subordinated note for the five trading days ended September 6, 2013, in addition to the continued accrual of the original issue discount
.
On January 2, 2014, the Company announced that its zero-coupon subordinated notes may be converted into cash and common stock at the conversion rate of 13.4108 per $1,000 principal amount at maturity of the notes, subject to the terms of the zero-coupon subordinated notes and the Indenture, dated as of October 24, 2006 between the Company and The Bank of New York Mellon, as trustee and conversion agent. In order to exercise the option to convert all or a portion of the zero-coupon subordinated notes, holders are required to validly surrender their zero-coupon subordinated notes at any time during the calendar quarter beginning January 1, 2014, through the close of business on the last business day of the calendar quarter, which is 5:00 p.m., New York City time, on Monday, March 31, 2014. If notices of conversion are received, the Company plans to settle the cash portion of the conversion obligation with cash on hand and/or borrowings under the revolving credit facility.
Credit Ratings
The Company’s debt ratings of Baa2 from Moody’s and BBB+ from Standard and Poor’s contribute to its ability to access capital markets.
|
Contractual Cash Obligations
|
|||||||||||||||||||
|
Payments Due by Period
|
|||||||||||||||||||
|
|
|
|
2015-
|
2017-
|
2019 and
|
||||||||||||||
|
|
Total
|
2014
|
2016
|
2018
|
thereafter
|
||||||||||||||
|
Operating lease obligations
|
$
|
373.4
|
|
$
|
132.3
|
|
$
|
139.9
|
|
$
|
60.2
|
|
$
|
41.0
|
|
||||
|
Contingent future licensing payments (a)
|
15.6
|
|
3.0
|
|
5.7
|
|
5.0
|
|
1.9
|
|
|||||||||
|
Minimum royalty payments
|
6.0
|
|
1.2
|
|
1.9
|
|
1.9
|
|
1.0
|
|
|||||||||
|
Zero-coupon subordinated notes (b)
|
110.8
|
|
110.8
|
|
—
|
|
—
|
|
—
|
|
|||||||||
|
Scheduled interest payments on Senior Notes
|
630.5
|
|
103.7
|
|
188.3
|
|
148.0
|
|
190.5
|
|
|||||||||
|
Long-term debt, other than revolving credit facility
|
2,904.3
|
|
2.4
|
|
579.9
|
|
905.0
|
|
1,417.0
|
|
|||||||||
|
Total contractual cash obligations (c) and (d)
|
$
|
4,040.6
|
|
$
|
353.4
|
|
$
|
915.7
|
|
$
|
1,120.1
|
|
$
|
1,651.4
|
|
||||
|
(a)
|
Contingent future licensing payments will be made if certain events take place, such as the launch of a specific test, the transfer of certain technology, and when specified revenue milestones are met.
|
|
(b)
|
As announced by the Company on January 2, 2014, holders of the zero-coupon subordinated notes may choose to convert their notes during the first quarter of 2014 subject to terms as defined in the note agreement. See “Note 11 to Consolidated Financial Statements” and "Credit Ratings" above for further information regarding the Company’s zero-coupon subordinated notes.
|
48
|
(c)
|
The table does not include obligations under the Company’s pension and postretirement benefit plans, which are included in "Note 16 to Consolidated Financial Statements." Benefits under the Company's postretirement medical plan are made when claims are submitted for payment, the timing of which is not practicable to estimate.
|
|
(d)
|
The table does not include the Company’s reserves for unrecognized tax benefits. The Company had a $34.9 and $46.2 reserve for unrecognized tax benefits, including interest and penalties, at
December 31, 2013
and
2012
, respectively, which is included in “Note 13 to Consolidated Financial Statements.” Substantially all of these tax reserves are classified in other long-term liabilities in the Company’s Consolidated Balance Sheets at
December 31, 2013
and
2012
.
|
Off-Balance Sheet Arrangements
The Company does not have transactions or relationships with “special purpose” entities, and the Company does not have any off balance sheet financing other than normal operating leases.
Other Commercial Commitments
As of
December 31, 2013
, the Company provided letters of credit aggregating approximately $42.5, primarily in connection with certain insurance programs. Letters of credit provided by the Company are secured by the Company’s Revolving Credit Facility and are renewed annually, around mid-year.
On October 14, 2011, the Company issued notice to a noncontrolling interest holder in its Other segment of its intent to purchase the holder's partnership units in accordance with the terms of the joint venture's partnership agreement. On November 28, 2011, this purchase was completed for a total purchase price of CN$151.7 as outlined in the partnership agreement (CN$147.8 plus certain adjustments relating to cash distribution hold backs made to finance recent business acquisitions and capital expenditures). The purchase of these additional partnership units brings the Company's percentage interest owned to 98.2%.
The contractual value of the remaining noncontrolling interest put totals $19.4 at
December 31, 2013
. At
December 31, 2013
and
2012
, $19.4 and $20.7, respectively, have been classified as mezzanine equity in the Company's consolidated balance sheet.
Based on current and projected levels of operations, coupled with availability under its Revolving Credit Facility, the Company believes it has sufficient liquidity to meet both its anticipated short-term and long-term cash needs; however, the Company continually reassesses its liquidity position in light of market conditions and other relevant factors.
New Accounting Pronouncements
In March 2013, the FASB issued a new accounting standard on foreign currency matters that clarifies the guidance of a parent company's accounting for the cumulative translation adjustment upon derecognition of certain subsidiaries or groups of assets within a foreign entity or of an investment in a foreign entity. Under this new standard, a parent company that ceases to have a controlling financial interest in a foreign subsidiary or group of assets within a foreign entity shall release any related cumulative translation adjustment into net income only if a sale or transfer results in complete or substantially complete liquidation of the foreign entity. This standard shall be applied prospectively and will become effective for the Company on January 1, 2014. The Company expects that the adoption of this standard will not have a material effect on its consolidated financial statements.
Critical Accounting Policies
The preparation of financial statements in conformity with generally accepted accounting principles requires management to make estimates and assumptions that affect the reported amounts of assets and liabilities and disclosure of contingent assets and liabilities at the date of the financial statements and the reported amounts of revenues and expenses during the reported periods. While the Company believes these estimates are reasonable and consistent, they are by their very nature, estimates of amounts that will depend on future events. Accordingly, actual results could differ from these estimates. The Company’s Audit Committee periodically reviews the Company’s significant accounting policies. The Company’s critical accounting policies arise in conjunction with the following:
|
•
|
Revenue recognition and allowance for doubtful accounts;
|
|
•
|
Pension expense;
|
|
•
|
Accruals for self insurance reserves;
|
|
•
|
Income taxes; and
|
|
•
|
Goodwill and indefinite-lived assets
|
49
Revenue recognition and allowance for doubtful accounts
Revenue is recognized for services rendered when the testing process is complete and test results are reported to the ordering physician. The Company’s sales are generally billed to three types of payers – clients, patients and third parties such as managed care companies, Medicare and Medicaid. For clients, sales are recorded on a fee-for-service basis at the Company’s client list price, less any negotiated discount. Patient sales are recorded at the Company’s patient fee schedule, net of any discounts negotiated with physicians on behalf of their patients, or fees made available through patient hardship programs. The Company bills third-party payers in two ways – fee-for-service and capitated agreements. Fee-for-service third-party payers are billed at the Company's patient fee schedule amount, and third-party revenue is recorded net of contractual discounts. These discounts are recorded at the transaction level at the time of sale based on a fee schedule that is maintained for each third-party payer. The majority of the Company’s third-party sales are recorded using an actual or contracted fee schedule at the time of sale. For the remaining third-party sales, estimated fee schedules are maintained for each payer. Adjustments to the estimated payment amounts are recorded at the time of final collection and settlement of each transaction as an adjustment to revenue. These adjustments are not material to the Company’s results of operations in any period presented. The Company periodically adjusts these estimated fee schedules based upon historical payment trends. Under capitated agreements with managed care companies, the Company recognizes revenue based on a negotiated monthly contractual rate for each member of the managed care plan regardless of the number or cost of services performed.
The Company has a formal process to estimate and review the collectibility of its receivables based on the period of time they have been outstanding. Bad debt expense is recorded within selling, general and administrative expenses as a percentage of sales considered necessary to maintain the allowance for doubtful accounts at an appropriate level. The Company’s process for determining the appropriate level of the allowance for doubtful accounts involves judgment, and considers such factors as the age of the underlying receivables, historical and projected collection experience, and other external factors that could affect the collectibility of its receivables. Accounts are written off against the allowance for doubtful accounts based on the Company’s write-off policy (
e.g.,
when they are deemed to be uncollectible). In the determination of the appropriate level of the allowance, accounts are progressively reserved based on the historical timing of cash collections relative to their respective aging categories within the Company’s receivables. These collection and reserve processes, along with the close monitoring of the billing process, help reduce the risks of material revisions to reserve estimates resulting from adverse changes in collection or reimbursement experience.
The following table presents the percentage of the Company’s net accounts receivable outstanding by aging category at
December 31, 2013
and
2012
:
|
Days Outstanding
|
2013
|
2012
|
|
|
0 – 30
|
46.4%
|
48.9%
|
|
|
31 – 60
|
19.3%
|
18.6%
|
|
|
61 – 90
|
11.5%
|
11.7%
|
|
|
91 – 120
|
7.1%
|
6.5%
|
|
|
121 – 150
|
3.4%
|
3.9%
|
|
|
151 – 180
|
3.8%
|
3.3%
|
|
|
181 – 270
|
7.3%
|
6.1%
|
|
|
271 – 360
|
0.9%
|
0.8%
|
|
|
Over 360
|
0.3%
|
0.2%
|
|
The above table excludes the percentage of net accounts receivable outstanding by aging category for the Other segment, and its other smaller foreign operations. Combined, these foreign net accounts receivable balances comprise less than 8.0% of the Company's total net accounts receivable balances. The Company believes that including the agings for these foreign operations would not be representative of the majority of the accounts receivable by aging category for the Company. The majority of the foreign accounts receivable are due from the provincial government and are generally paid within 30-60 days of billing.
Pension Expense
In October 2009, the Company received approval from its Board of Directors to freeze any additional service-based credits for any years of service after December 31, 2009 on the Company Plan and the PEP. Both plans have been closed to new participants. Employees participating in the Company Plan and the PEP no longer earn service-based credits, but continue to earn interest
50
credits. In addition, effective January 1, 2010, all employees eligible for the defined contribution retirement plan (the “401K Plan”) receive a minimum 3% non-elective contribution (“NEC”) concurrent with each payroll period. The 401K Plan also permits discretionary contributions by the Company of 1% to 3% of pay for eligible employees based on service.
The Company Plan covers substantially all employees hired prior to December 31, 2009. The benefits to be paid under the Company Plan are based on years of credited service through December 31, 2009, interest credits and average compensation. The Company also has the PEP which covers its senior management group. Prior to 2010, the PEP provided for the payment of the difference, if any, between the amount of any maximum limitation on annual benefit payments under the Employee Retirement Income Security Act of 1974 and the annual benefit that would be payable under the Company Plan but for such limitation.
The Company's net pension cost is developed from actuarial valuations. Inherent in these valuations are key assumptions, including discount rates and expected return on plan assets, which are updated on an annual basis at the beginning of each year. The Company is required to consider current market conditions, including changes in interest rates, in making these assumptions. Changes in pension costs may occur in the future due to changes in these assumptions. The key assumptions used in accounting for the defined benefit retirement plans were a
4.80%
discount rate and a
7.0%
expected long-term rate of return on plan assets as of
December 31, 2013
.
Discount Rate
The Company evaluates several approaches toward setting the discount rate assumption that is used to value the benefit obligations of its retirement plans. At year-end, priority was given to use of the Towers Watson Bond:Link model, which simulates the purchase of investment-grade corporate bonds at current market yields with principal amounts and maturity dates closely matching the Company's projected cash disbursements from its plans. This completed model represents the yields to maturity that the Company could theoretically settle its plan obligations at year end. The weighted-average yield on the modeled bond portfolio is then used to form the discount rate assumption used for each retirement plan. A one percentage point decrease or increase in the discount rate would have resulted in a respective increase or decrease in
2013
retirement plan expense of $2.7.
Return on Plan Assets
In establishing its expected return on plan assets assumption, the Company reviews its asset allocation and develops return assumptions based on different asset classes adjusting for plan operating expenses. Actual asset over/under performance compared to expected returns will respectively decrease/increase unrecognized loss. The change in the unrecognized loss will change amortization cost in upcoming periods. A one percentage point increase or decrease in the expected return on plan assets would have resulted in a corresponding change in
2013
pension expense of $2.5.
Net pension cost for
2013
was
$11.0
as compared with
$12.1
in
2012
and
$8.6
in
2011
. The decrease in pension expense was due to decreases in the amount of net amortization and deferral as a result of higher discount rates. The increase in pension expense in
2012
was due to increases in the amount of net amortization and deferral as a result of lower discount rates and a 25 basis points decrease in the expected return on assets as a result of declines in asset market values in 2011. Projected pension expense for the Company Plan and the PEP is expected to
decrease to
$7.8
in
2014
.
Further information on the Company’s defined benefit retirement plan is provided in Note 16 to the consolidated financial statements.
Accruals for Self-insurance Reserves
Accruals for self-insurance reserves (including workers’ compensation, auto and employee medical) are determined based on a number of assumptions and factors, including historical payment trends and claims history, actuarial assumptions and current and estimated future economic conditions. These estimated liabilities are not discounted.
The Company is self-insured (up to certain limits) for professional liability claims arising in the normal course of business, generally related to the testing and reporting of laboratory test results. The Company maintains excess insurance which limits the Company’s maximum exposure on individual claims. The Company estimates a liability that represents the ultimate exposure for aggregate losses below those limits. The liability is discounted and is based on actuarial assumptions and factors for known and incurred but not reported claims, including the frequency and payment trends of historical claims.
If actual trends differ from these estimates, the financial results could be impacted. Historical trends have not differed materially from these estimates.
51
Income Taxes
The Company accounts for income taxes utilizing the asset and liability method. Under this method deferred tax assets and liabilities are recognized for the future tax consequences attributable to differences between the financial statement carrying amounts of existing assets and liabilities and their respective tax bases and for tax loss carryforwards. Deferred tax assets and liabilities are measured using enacted tax rates expected to apply to taxable income in the years in which those temporary differences are expected to be recovered or settled. The effect on deferred tax assets and liabilities of a change in tax rates is recognized in income in the period that includes the enactment date. The Company does not recognize a tax benefit, unless the Company concludes that it is more likely than not that the benefit will be sustained on audit by the taxing authority based solely on the technical merits of the associated tax position. If the recognition threshold is met, the Company recognizes a tax benefit measured at the largest amount of the tax benefit that the Company believes is greater than 50% likely to be realized. The Company records interest and penalties in income tax expense.
Goodwill and Indefinite-Lived Assets
The Company assesses goodwill and indefinite lived intangibles for impairment at least annually and more frequently if triggering events occur. The timing of the Company's annual impairment testing is the end of the fiscal year. In accordance with the Financial Accounting Standards Board (“FASB”) updates to their authoritative guidance regarding goodwill and indefinite-lived intangible asset impairment testing, an entity is allowed to first assess qualitative factors as a basis for determining whether it is necessary to perform quantitative impairment testing. If an entity determines that it is not more likely than not that the estimated fair value of an asset is less than its carrying value, then no further testing is required. Otherwise, impairment testing must be performed in accordance with the original accounting standards. The updated FASB guidance also allows an entity to bypass the qualitative assessment for any reporting unit in its goodwill assessment and proceed directly to performing the first step of the two-step assessment. Similarly, a Company can proceed directly to a quantitative assessment in the case of impairment testing for indefinite-lived intangible assets as well. In
2013
and
2012
, the Company elected to bypass the purely qualitative assessments for its goodwill and indefinite-lived intangible assets and proceed to quantitative assessments utilizing methodologies as described in the following paragraphs.
Step One of the goodwill impairment test includes the estimation of the fair value of each reporting unit as compared to the book value of the reporting unit. The Company uses a market value approach for determining fair value and utilizes a number of factors such as publicly available information regarding the market capitalization of the Company as well as operating results, business plans, and present value techniques. If Step One indicates potential impairment, the second step is performed to measure the amount of the impairment.
The Company has indefinite-lived assets consisting of acquired Canadian licenses. When a quantitative analysis is considered necessary for indefinite-lived intangible assets, the Company utilizes an income approach to determine the fair value. It then compares the carrying value of the indefinite-lived asset to its fair value. Impairment losses are recorded to the extent that the carrying value of the indefinite-lived intangible asset exceeds its fair value.
There are inherent uncertainties related to the factors described above and judgment related to our impairment assessments of goodwill and indefinite-lived intangibles. The assumptions underlying the impairment analyses may change in such a manner that impairment in value may occur in the future. Any such impairment will be recognized in the period in which it becomes known.
52
FORWARD-LOOKING STATEMENTS
The Company has made in this report, and from time to time may otherwise make in its public filings, press releases and discussions by Company management, forward-looking statements concerning the Company’s operations, performance and financial condition, as well as its strategic objectives. Some of these forward-looking statements can be identified by the use of forward-looking words such as “believes”, “expects”, “may”, “will”, “should”, “seeks”, “approximately”, “intends”, “plans”, “estimates”, or “anticipates” or the negative of those words or other comparable terminology. Such forward-looking statements are subject to various risks and uncertainties and the Company claims the protection afforded by the safe harbor for forward-looking statements contained in the Private Securities Litigation Reform Act of 1995. Actual results could differ materially from those currently anticipated due to a number of factors in addition to those discussed elsewhere herein and in the Company’s other public filings, press releases and discussions with Company management, including:
|
1.
|
changes in federal, state, local and third party payer regulations or policies or other future reforms in the health care system (or in the interpretation of current regulations), new insurance or payment systems, including state, regional or private insurance cooperatives (Health Insurance Exchanges), new public insurance programs or a single-payer system, affecting governmental and third-party coverage or reimbursement for clinical laboratory testing;
|
|
2.
|
significant monetary damages, fines, penalties, assessments, refunds, repayments, and/or exclusion from Medicare and Medicaid programs resulting from investigations, audits, regulatory examinations, information requests, and other inquires by the government;
|
|
3.
|
loss or suspension of a license or imposition of a fine or penalties under, or future changes in, or interpretations of, the law or regulations of the Clinical Laboratory Improvement Act of 1967, and the Clinical Laboratory Improvement Amendments of 1988, or those of Medicare, Medicaid, the False Claims Act or other federal, state or local agencies;
|
|
4.
|
penalties or loss of license arising from the failure to comply with the Federal Occupational Safety and Health Administration requirements and the Needlestick Safety and Prevention Act;
|
|
5.
|
increased costs, denial of claims and/or significant penalties arising from the failure to comply with HIPAA, including changes to federal and state privacy and security obligations and changes to HITECH and any subsequent amendments;
|
|
6.
|
subsequent costs due to damage to the Company's reputation and significant litigation exposure arising from the failure to maintain the security of business information or systems or protect against cyber security attacks;
|
|
7.
|
negative impact on the Company's reimbursement, cash collections, days sales outstanding and profitability arising from the failure of the Company, third party payers or physicians to comply with the ICD-10-CM Code Set by the compliance date of October 1, 2014;
|
|
8.
|
increased competition, including competition from companies that do not comply with existing laws or regulations or otherwise disregard compliance standards in the industry;
|
|
9.
|
increased price competition, competitive bidding for laboratory tests and/or changes or reductions to fee schedules;
|
|
10.
|
changes in payer mix, including an increase in capitated reimbursement mechanisms or the impact of a shift to consumer-driven health plans and adverse changes in payer reimbursement or payer coverage policies related to specific testing procedures or categories of testing;
|
|
11.
|
failure to obtain and retain new customers or a reduction in tests ordered or specimens submitted by existing customers;
|
|
12.
|
failure to retain or attract managed care business as a result of changes in business models, including new risk based or network approaches, or other changes in strategy or business models by managed care companies;
|
|
13.
|
failure to effectively integrate and/or manage newly acquired businesses and the cost related to such integrations;
|
|
14.
|
adverse results in litigation matters;
|
|
15.
|
inability to attract and retain experienced and qualified personnel;
|
|
16.
|
business interruption, increased costs, and other adverse effects on the Company's operations due to the unionization of employees, union strikes, work stoppages, or general labor unrest;
|
|
17.
|
failure to maintain the Company's days sales outstanding and/or bad debt expense levels;
|
|
18.
|
decrease in the Company's credit ratings by Standard & Poor's and/or Moody's;
|
|
19.
|
discontinuation or recalls of existing testing products;
|
53
|
20.
|
failure to develop or acquire licenses for new or improved technologies, or if customers use new technologies to perform their own tests;
|
|
21.
|
substantial costs arising from the inability to commercialize newly licensed tests or technologies or to obtain appropriate coverage or reimbursement for such tests;
|
|
22.
|
failure to identify and successfully close and integrate strategic acquisition targets;
|
|
23.
|
changes in government regulations or policies, including regulations and policies of the Food and Drug Administration, affecting the approval, availability of, and the selling and marketing of diagnostic tests;
|
|
24.
|
inability to obtain and maintain adequate patent and other proprietary rights for protection of the Company's products and services and successfully enforce the Company's proprietary rights;
|
|
25.
|
the scope, validity and enforceability of patents and other proprietary rights held by third parties which might have an impact on the Company's ability to develop, perform, or market the Company's tests or operate its business;
|
|
26.
|
failure in the Company's information technology systems resulting in an increase in testing turnaround time or billing processes or the failure to meet future regulatory or customer information technology, data security and connectivity requirements;
|
|
27.
|
failure to meet required financial reporting deadlines arising from a failure of the Company's financial information systems;
|
|
28.
|
failure of the Company's disaster recovery plans to provide adequate protection against the interruption of business and/or to permit the recovery of business operations;
|
|
29.
|
business interruption or other impact on the business due to adverse weather (including hurricanes), fires and/or other natural disasters, terrorism or other criminal acts, and/or widespread outbreak of influenza or other pandemic illness;
|
|
30.
|
liabilities that result from the inability to comply with corporate governance requirements;
|
|
31.
|
impact on the Company's testing volumes, cash collections and the availability of credit for general liquidity or other financing needs arising from a significant deterioration in the economy or financial markets;
|
|
32.
|
changes in reimbursement by foreign governments and foreign currency fluctuations; and
|
|
33.
|
expenses and risks associated with international operations, including but not limited to compliance with the Foreign Corrupt Practices Act, the U.K. Bribery Act, as well as laws and regulations that differ from those of the U.S., and economic, political, legal and other operational risks associated with foreign markets.
|
|
Item 7A.
|
QUANTITATIVE AND QUALITATIVE DISCLOSURE ABOUT MARKET RISK
|
The Company addresses its exposure to market risks, principally the market risk associated with changes in interest rates, through a controlled program of risk management that includes, from time to time, the use of derivative financial instruments such as interest rate swap agreements. Although, as set forth below, the Company’s zero-coupon subordinated notes contain features that are considered to be embedded derivative instruments, the Company does not hold or issue derivative financial instruments for trading purposes. The Company does not believe that its exposure to market risk is material to the Company’s financial position or results of operations.
During the third quarter of 2013, the Company entered into two fixed-to-variable interest rate swap agreements for the 4.625% senior notes due 2020 with an aggregate notional amount of $600.0 and variable interest rates based on one-month LIBOR plus 2.298% to hedge against changes in the fair value of a portion of the Company's long term debt.
The Company’s zero-coupon subordinated notes contain the following two features that are considered to be embedded derivative instruments under authoritative guidance in connection with accounting for derivative instruments and hedging activities:
|
1)
|
The Company will pay contingent cash interest on the zero-coupon subordinated notes after September 11, 2006, if the average market price of the notes equals 120% or more of the sum of the issue price, accrued original issue discount and contingent additional principal, if any, for a specified measurement period.
|
|
2)
|
Holders may surrender zero-coupon subordinated notes for conversion during any period in which the rating assigned to the zero-coupon subordinated notes by Standard & Poor’s Ratings Services is BB- or lower.
|
Borrowings under the Company’s revolving credit facility are subject to variable interest rates, unless fixed through interest rate swaps or other agreements.
54
The Company’s Ontario, Canada consolidated joint venture operates in Canada and, accordingly, the earnings and cash flows generated from the Ontario operations are subject to foreign currency exchange risk.
The Company's wholly-owned subsidiary, Clearstone Central Laboratories, has operations in China and Singapore, and, accordingly the earnings and cash flows generated from these operations are subject to foreign currency risk.
The Company's wholly-owned subsidiary, Orchid, has operations in the United Kingdom and, accordingly the earnings and cash flows generated from Orchid's United Kingdom operation are subject to foreign currency risk.
The Alberta, Canada joint venture partnership operates in Canada and remits the Company’s share of partnership income in Canadian dollars. Accordingly, the cash flow received from this affiliate is subject to foreign currency exchange risk.
|
Item 8.
|
FINANCIAL STATEMENTS AND SUPPLEMENTARY DATA
|
Reference is made to the Index on Page F-1 of the Financial Report included herein.
|
Item 9.
|
CHANGES IN AND DISAGREEMENTS WITH ACCOUNTANTS ON ACCOUNTING AND FINANCIAL DISCLOSURE
|
Not Applicable.
|
Item 9A.
|
CONTROLS AND PROCEDURES
|
Disclosure Controls and Procedures
As of the end of the period covered by this report, the Company carried out an evaluation under the supervision and with the participation of the Company’s management, including the Company’s Chief Executive Officer and Chief Financial Officer, of the Company's disclosure controls and procedures (as defined in Rules 13a-15(e) and 15d-15(e) under the Securities Exchange Act of 1934, as amended). Based upon this evaluation, the Company’s Chief Executive Officer and Chief Financial Officer concluded that the Company’s disclosure controls and procedures were effective as of the end of the period covered by this annual report.
Changes in Internal Control Over Financial Reporting
There was no change in the Company’s internal control over financial reporting (as defined in Rules 13a-15(f) and 15d-15(f) under the Securities Exchange Act of 1934, as amended) during the most recently completed fiscal quarter that has materially affected, or is reasonably likely to materially affect, the Company’s internal control over financial reporting.
Report of Management on Internal Control Over Financial Reporting
The Company's management is responsible for establishing and maintaining adequate internal control over financial reporting (as defined in Rules 13a-15(f) and 15d-15(f) under the Securities Exchange Act of 1934).
The internal control over financial reporting at the Company was designed to provide reasonable assurance regarding the reliability of financial reporting and the preparation of financial statements for external purposes in accordance with accounting principles generally accepted in the United States of America. Internal control over financial reporting includes those policies and procedures that:
|
•
|
pertain to the maintenance of records that, in reasonable detail, accurately and fairly reflect the transactions and dispositions of the assets of the Company;
|
|
•
|
provide reasonable assurance that transactions are recorded as necessary to permit preparation of financial statements in accordance with accounting principles generally accepted in the United States of America;
|
|
•
|
provide reasonable assurance that receipts and expenditures of the Company are being made only in accordance with authorization of management and directors of the Company; and
|
|
•
|
provide reasonable assurance regarding prevention or timely detection of unauthorized acquisition, use or disposition of assets that could have a material effect on the consolidated financial statements.
|
Because of its inherent limitations, internal control over financial reporting may not prevent or detect misstatements.
55
The Company's management assessed the effectiveness of the Company’s internal control over financial reporting as of
December 31, 2013
. Management based this assessment on criteria for effective internal control over financial reporting described in “Internal Control - Integrated Framework 1992” issued by the Committee of Sponsoring Organizations of the Treadway Commission ("COSO"). Based on this assessment, the Company's management determined that, as of
December 31, 2013
, the Company maintained effective internal control over financial reporting. Management reviewed the results of its assessment with the Audit Committee of the Company’s Board of Directors.
PricewaterhouseCoopers LLP, an independent registered public accounting firm, who audited and reported on the consolidated financial statements of the Company included in this annual report, also audited the effectiveness of the Company’s internal control over financial reporting as of
December 31, 2013
as stated in its report, which is included herein immediately preceding the Company’s audited financial statements.
|
Item 9B.
|
OTHER INFORMATION
|
On October 17, 2013, William B. Hayes, Executive Vice President, Chief Financial Officer and Treasurer, announced his intention to retire effective in or about the second quarter of 2014. The Company has retained a national search firm and is conducting an external and internal search for a new CFO. The Company expects that Mr. Hayes will continue in his capacity as CFO through the first half of 2014, unless a successor is named and the transition is completed before that time.
PART III
|
Item 10.
|
DIRECTORS, EXECUTIVE OFFICERS and CORPORATE GOVERNANCE
|
The information required by the item regarding directors is incorporated by reference to the Company’s Definitive Proxy Statement to be filed with the Securities and Exchange Commission in connection with the Annual Meeting of Stockholders to be held in
2014
(the "
2014
Proxy Statement") under the caption "Election of Directors." Information regarding executive officers is incorporated by reference to the Company’s
2014
Proxy Statement under the caption "Executive Officers."
Information concerning the Company’s Audit Committee, including the designation of audit committee financial experts and information regarding compliance with Section 16(a) of the Exchange Act responsive to this item is incorporated by reference to the Company’s
2014
Proxy Statement under the captions "Corporate Governance" and "Section 16(a) Beneficial Ownership Reporting Compliance" respectively. Information concerning the Company's code of ethics is incorporated by reference to the Company's
2014
Proxy Statement under the caption "Corporate Governance Policies and Procedures."
|
Item 11.
|
EXECUTIVE COMPENSATION
|
The information required by this item is incorporated by reference to the
2014
Proxy Statement under the captions "Executive Compensation” and “Director Compensation."
|
Item 12.
|
SECURITY OWNERSHIP OF CERTAIN BENEFICIAL OWNERS AND MANAGEMENT AND RELATED STOCKHOLDER MATTERS
|
See "Note 14 to the Consolidated Financial Statements" for a discussion of the Company’s Stock Compensation Plans. Except for the above referenced footnote, the information called for by this Item is incorporated by reference to information in the
2014
Proxy Statement under the captions "Security Ownership of Certain Beneficial Owners and Management," "Compensation Discussion and Analysis" and "Executive Compensation."
Item 13. CERTAIN RELATIONSHIPS AND RELATED TRANSACTIONS, AND DIRECTOR INDEPENDENCE
The information required by this item is incorporated by reference to information in the
2014
Proxy Statement under the captions “Director Independence” and “Related Party Transactions."
56
|
Item 14.
|
PRINCIPAL ACCOUNTANT FEES AND SERVICES
|
The information required by this item is incorporated by reference to the
2014
Proxy Statement under the caption "Fees to Independent Registered Public Accounting Firm."
57
PART IV
Item 15. EXHIBITS AND FINANCIAL STATEMENT SCHEDULES
(a) List of documents filed as part of this Report:
|
(1)
|
Consolidated Financial Statements and Report of Independent Registered Public Accounting Firm included herein:
|
|
See Index on page F-1
|
|
|
(2)
|
Financial Statement Schedules:
|
|
See Index on page F-1
|
|
|
All other schedules are omitted as they are inapplicable or the required information is furnished in the Consolidated Financial Statements or notes thereto.
|
|
|
(3)
|
Index to and List of Exhibits
|
Exhibits 10.1 through 10.30 and 10.32 through 10.33 are management contracts or compensatory plans or arrangements.
58
|
2.1
|
Asset Purchase Agreement by and among Genzyme Corporation and Laboratory Corporation of America Holdings dated as of September 13, 2010 (incorporated herein by reference to Exhibit 2.1 to the Company's Current Report on Form 8-K filed on September 16, 2010).
|
|
3.1
|
Amended and Restated Certificate of Incorporation of the Company dated May 24, 2001 (incorporated herein by reference to the Company's Registration Statement on Form S-3, filed with the Commission on October 19, 2001, File No. 333-71896).
|
|
3.2
|
Amended and Restated By-Laws of the Company dated March 25, 2008 (incorporated herein by reference to the Company's current report on Form 8-K, filed with the Commission on March 31, 2008).
|
|
4.1
|
Specimen of the Company's Common Stock Certificate (incorporated herein by reference to the Company's Annual Report on Form 10-K for the fiscal year ended December 31, 2001).
|
|
4.2
|
Indenture dated as of January 31, 2003 between the Company and Wachovia Bank, National Association, as trustee (incorporated herein by reference to the January 31, 2003 Form 8-K, filed with the Commission on February 3, 2003).
|
|
4.3
|
Registration Rights Agreement, dated as of January 28, 2003 between the Company and the Initial Purchasers (incorporated herein by reference to the January 31, 2003 Form 8-K, filed with the Commission on February 3, 2003).
|
|
4.4
|
Indenture dated as of December 5, 2005, between the Company and The Bank of New York, as trustee (Senior Debt Securities) (incorporated herein by reference to Exhibit 4.1 to the Company's Current Report on Form 8-K dated December 14, 2005).
|
|
4.5
|
Indenture, dated as of October 23, 2006, between the Company and The Bank of New York, as trustee, including the Form of Global Note attached as Exhibit A thereto (incorporated herein by reference to Exhibit 4.1 to the Company's Current Report on Form 8-K filed on October 24, 2006).
|
|
4.6
|
Indenture, dated as of November 19, 2010, between the Company and U.S. Bank National Association, as trustee (incorporated herein by reference to Exhibit 4.1 to the Company's Current Report on Form 8-K filed on November 19, 2010).
|
|
4.7
|
First Supplemental Indenture, dated as of November 19, 2010, between the Company and U.S. Bank National Association, as trustee, including the form of the 2016 Notes (incorporated herein by reference to Exhibit 4.2 to the Company's Current Report on Form 8-K filed on November 19, 2010).
|
|
4.8
|
Second Supplemental Indenture, dated as of November 19, 2010, between the Company and U.S. Bank National Association, as trustee, including the form of the 2020 Notes (incorporated herein by reference to Exhibit 4.3 to the Company's Current Report on Form 8-K filed on November 19, 2010).
|
|
4.9
|
Third Supplemental Indenture, dated as of August 23, 2012, between the Company and U.S. Bank National Association, as trustee, including the form of the 2017 Notes (incorporated herein by reference to Exhibit 4.2 to the Company's Current Report on Form 8-K filed on August 23, 2012).
|
|
4.10
|
Third Supplemental Indenture, dated as of August 23, 2012, between the Company and U.S. Bank National Association, as trustee, including the form of the 2017 Notes (incorporated herein by reference to Exhibit 4.2 to the Company's Current Report on Form 8-K filed on August 23, 2012).
|
|
10.1
|
National Health Laboratories Incorporated Pension Equalization Plan (incorporated herein by reference to the Company's Annual Report on Form 10-K for the fiscal year ended December 31, 1992).
|
|
10.2
|
Laboratory Corporation of America Holdings amended and restated new Pension Equalization Plan (incorporated herein by reference to the Company's Quarterly Report for the period ended September 30, 2004).
|
|
10.3
|
First Amendment to the Laboratory Corporation of America Holdings amended and restated new Pension Equalization Plan (incorporated herein by reference to the Company's Quarterly Report for the period ended September 30, 2004).
|
|
10.4
|
Second Amendment to the Laboratory Corporation of America Holdings amended and restated new Pension Equalization Plan. (incorporated herein by reference to the Company's Annual Report on Form 10-K for the fiscal year ended December 31, 2004).
|
|
10.5
|
National Health Laboratories 1988 Stock Option Plan, as amended (incorporated herein by reference to the Company's Registration Statement on Form S-1, filed with the Commission on July 9, 1990, File No. 33-35782).
|
59
|
10.6
|
National Health Laboratories 1994 Stock Option Plan (incorporated herein by reference to the Company's Registration Statement on Form S-8, filed with the Commission on August 12, 1994, File No. 33-55065).
|
|
10.7
|
Laboratory Corporation of America Holdings Senior Executive Transition Policy (incorporated herein by reference to the Company's Quarterly Report for the period ended June 30, 2004).
|
|
10.8
|
Laboratory Corporation of America Holdings 1995 Stock Plan for Non-Employee Directors dated September 26, 1995 (incorporated herein by reference to the Company's Registration Statement on Form S-8, filed with the Commission on September 26, 1995, File No. 33-62913).
|
|
10.9
|
Amendment to the 1995 Stock Plan for Non-Employee Directors (incorporated herein by reference to the Company's 1997 Annual Proxy Statement, filed with the Commission on June 6, 1997).
|
|
10.10
|
Amendment to the 1995 Stock Plan for Non-Employee Directors (incorporated herein by reference to Annex I of the Company's 2001 Annual Proxy Statement, filed with the Commission on April 25, 2001).
|
|
10.11
|
Laboratory Corporation of America Holdings 1997 Employee Stock Purchase Plan (incorporated herein by reference to Annex I of the Company's Registration Statement on Form S-8 filed with the Commission on December 13, 1996, File No. 333-17793).
|
|
10.12
|
Amendments to the Laboratory Corporation of America Holdings 1997 Employee Stock Purchase Plan (incorporated herein by reference to the Company's Registration Statement on Form S-8, filed with the Commission on January 10, 2000, File No. 333-94331).
|
|
10.13
|
Amendments to the Laboratory Corporation of America Holdings 1997 Employee Stock Purchase Plan (incorporated herein by reference to the Company's Registration Statement on Form S-8, filed with the Commission on May 26, 2004, File No. 333-115905).
|
|
10.14
|
Laboratory Corporation of America Holdings Amended and Restated 1999 Stock Incentive Plan (incorporated herein by reference to Annex I of the Company's 1999 Annual Proxy Statement filed with the Commission of May 3, 1999).
|
|
10.15
|
Laboratory Corporation of America Holdings 2000 Stock Incentive Plan (incorporated herein by reference to the Company's Registration Statement on Form S-8, filed with the Commission on June 5, 2000, File No. 333-38608).
|
|
10.16
|
Amendments to the 2000 Stock Incentive Plan (incorporated herein by reference to the Company's Registration Statement on Form S-8, filed with the Commission on June 19, 2002, File No. 333-90764).
|
|
10.17
|
Dynacare Inc., Amended and Restated Employee Stock Option Plan (incorporated herein by reference to the Company's Registration Statement on Form S-8, filed with the Commission on August 7, 2002, File No. 333-97745).
|
|
10.18
|
DIANON Systems, Inc. 1996 Stock Incentive Plan, DIANON Systems, Inc. 1999 Stock Incentive Plan, DIANON Systems, Inc. 2000 Stock Incentive Plan, DIANON Systems, Inc. 2001 Stock Incentive Plan, and UroCor, Inc. Second Amended and Restated 1992 Stock Option Plan (incorporated herein by reference to the Company's Registration Statement on Form S-8, filed with the Commission on January 21, 2003, File No. 333-102602).
|
|
10.19
|
Laboratory Corporation of America Holdings Deferred Compensation Plan (incorporated herein by reference to the Company's Annual Report on Form 10-K for the fiscal year ended December 31, 2004).
|
|
10.20
|
First Amendment to the Laboratory Corporation of America Holdings Deferred Compensation Plan (incorporated herein by reference to the Company's Annual Report on Form 10-K for the fiscal year ended December 31, 2004).
|
|
10.21
|
Third Amendment to the Laboratory Corporation of America Amended and Restated New Pension Equalization Plan (incorporated herein by reference to the Company's Quarterly Report for the period ended June 30, 2005).
|
|
10.22
|
Second Amendment to the Laboratory Corporation of America Holdings Deferred Compensation Plan (incorporated herein by reference to the Company's Quarterly Report for the period ended June 30, 2005).
|
|
10.23
|
Third Amendment to the Laboratory Corporation of America Holdings Deferred Compensation Plan (incorporated herein by reference to the Company's Annual Report on Form 10-K for the fiscal year ended December 31, 2006).
|
|
10.24
|
Consulting Agreement between Thomas P. Mac Mahon and the Company dated July 20, 2006 (incorporated herein by reference to Exhibit 10.1 to the Company's Current Report on Form 8-K filed on July 21, 2006).
|
|
10.25
|
Fourth Amendment to the Laboratory Corporation of America Holdings Deferred Compensation Plan (incorporated herein by reference to the Company's Annual Report on Form 10-K for the fiscal year ended December 31, 2007).
|
60
|
10.26
|
Laboratory Corporation of America Holdings 2008 Stock Incentive Plan (incorporated herein by reference to Exhibit 10.2 to the Company's Current Report on Form 8-K filed on May 7, 2008).
|
|
10.27
|
Laboratory Corporation of America Holdings Amended and Restated Master Senior Executive Severance Plan (incorporated herein by reference to Exhibit 10.1 to the Company's Quarterly Report on Form 10-Q for the period ended March 31, 2009).
|
|
10.28
|
Laboratory Corporation of America Holdings Master Senior Executive Change in Control Severance Plan (incorporated herein by reference to Exhibit 10.2 to the Company's Quarterly Report on Form 10-Q for the period ended March 31, 2009).
|
|
10.29
|
First Amendment to the Laboratory Corporation of America Holdings Master Senior Executive Change in Control Severance Plan (incorporated herein by reference to Exhibit 10.1 to the Company's Quarterly Report on Form 10-Q for the period ended March 31, 2010).
|
|
10.30
|
Second Amendment to the Laboratory Corporation of America Holdings Master Senior Executive Change in Control Severance Plan (incorporated herein by reference to Exhibit 10.2 to the Company's Quarterly Report on Form 10-Q for the period ended March 31, 2010).
|
|
10.31
|
$1 Billion Credit Agreement dated as of December 21, 2011, among the Company, Bank of America, N.A. as Administrative Agent, Swing Line Lender and L/C Issuer, Wells Fargo Bank, National Association and Credit Suisse AG, Cayman Islands Branch as Documentation Agents, Barclays Capital as Syndication Agent, Merrill Lynch, Pierce, Fenner & Smith Incorporated, Barclays Capital, Wells Fargo Securities, LLC and Credit Suisse Securities (USA) LLC as Joint Lead Arrangers and Joint Book Managers, and the lenders named therein (incorporated herein by reference to the Company's Annual Report on Form 10-K for the fiscal year ended December 31, 2011).
|
|
10.32
|
Laboratory Corporation of America Holdings 2012 Omnibus Incentive Plan (incorporated herein by reference to Exhibit 10.1 to the Company's Current Report on Form 8-K filed on May 2, 2012).
|
|
10.33
|
Fourth Amendment to the Laboratory Corporation of America Holdings 1997 Employee Stock Purchase Plan (incorporated herein by reference to Exhibit 10.2 to the Company's Current Report on Form 8-K filed on May 2, 2012).
|
|
12.1*
|
Ratio of earnings to fixed charges
|
|
21*
|
List of Subsidiaries of the Company
|
|
23.1*
|
Consent of PricewaterhouseCoopers LLP, an independent registered public accounting firm
|
|
24.1*
|
Power of Attorney of Kerrii B. Anderson
|
|
24.2*
|
Power of Attorney of Jean-Luc Bélingard
|
|
24.3*
|
Power of Attorney of Garheng Kong, M.D., Ph.D.
|
|
24.4*
|
Power of Attorney of Wendy E. Lane
|
|
24.5*
|
Power of Attorney of Robert E. Mittelstaedt, Jr.
|
|
24.6*
|
Power of Attorney of Peter M. Neupert
|
|
24.7*
|
Power of Attorney of Arthur H. Rubenstein, MBBCh
|
|
24.8*
|
Power of Attorney of Adam H. Schechter
|
|
24.9*
|
Power of Attorney of M. Keith Weikel, Ph.D.
|
|
24.10*
|
Power of Attorney of R. Sanders Williams, M.D.
|
|
31.1*
|
Certification by the Chief Executive Officer pursuant to Rule 13a-14(a) or Rule 15d-14(a)
|
|
31.2*
|
Certification by the Chief Financial Officer pursuant to Rule 13a-14(a) or Rule 15d-14(a)
|
|
32*
|
Written Statement of Chief Executive Officer and Chief Financial Officer pursuant to Section 906 of the Sarbanes-Oxley Act of 2002 (18 U.S.C. Section 1350)
|
|
101.INS*
|
XBRL Instance Document
|
|
101.SCH*
|
XBRL Taxonomy Extension Schema
|
|
101.CAL*
|
XBRL Taxonomy Extension Calculation Linkbase
|
|
101.DEF*
|
XBRL Taxonomy Extension Definition Linkbase
|
|
101.LAB*
|
XBRL Taxonomy Extension Label Linkbase
|
|
101.PRE*
|
XBRL Taxonomy Extension Presentation Linkbase
|
|
*
|
Filed herewith
|
61
SIGNATURES
Pursuant to the requirements of Section 13 or 15(d) of the Securities Exchange Act of 1934, the registrant has duly caused this report to be signed on its behalf by the undersigned, thereunto duly authorized.
LABORATORY CORPORATION OF AMERICA HOLDINGS
Registrant
|
|
By:
|
/s/ DAVID P. KING
|
|
|
|
|
David P. King
|
|
|
|
|
Chairman of the Board, President
|
|
|
|
|
and Chief Executive Officer
|
|
|
Dated:
|
February 25, 2014
|
|
|
62
Pursuant to the requirements of the Securities Exchange Act of 1934, this report has been signed below by the following persons on behalf of the registrant on
February 25, 2014
in the capacities indicated.
|
Signature
|
|
Title
|
|
|
|
|
|
/s/ DAVID P. KING
|
|
Chairman of the Board, President and Chief
|
|
David P. King
|
|
Executive Officer (Principal Executive Officer)
|
|
|
|
|
|
/s/ WILLIAM B. HAYES
|
|
Executive Vice President, Chief Financial
|
|
William B. Hayes
|
|
Officer and Treasurer (Principal Financial
|
|
|
|
Officer and Principal Accounting Officer)
|
|
|
|
|
|
/s/ KERRII B. ANDERSON*
|
|
Director
|
|
Kerrii B. Anderson
|
|
|
|
|
|
|
|
/s/ JEAN-LUC BÉLINGARD*
|
|
Director
|
|
Jean-Luc Bélingard
|
|
|
|
|
|
|
|
/s/ GARHENG KONG, M.D., PH.D.*
|
|
Director
|
|
Garheng Kong, M.D., Ph.D.
|
|
|
|
|
|
|
|
/s/ WENDY E. LANE*
|
|
Director
|
|
Wendy E. Lane
|
|
|
|
|
|
|
|
/s/ ROBERT E. MITTELSTAEDT, JR.*
|
|
Director
|
|
Robert E. Mittelstaedt, Jr.
|
|
|
|
/s/ PETER M. NEUPERT*
|
|
Director
|
|
Peter M.Neupert
|
|
|
|
|
|
|
|
/s/ ARTHUR H. RUBENSTEIN, MBBCH*
|
|
Director
|
|
Arthur H. Rubenstein, MBBCh
|
|
|
|
|
|
|
|
/s/ ADAM H. SCHECHTER*
|
|
Director
|
|
Adam H. Schecter
|
|
|
|
|
|
|
|
/s/ M. KEITH WEIKEL, PH.D.*
|
|
Director
|
|
M. Keith Weikel, Ph.D.
|
|
|
|
|
|
|
|
/s/ R. SANDERS WILLIAMS, M.D.*
|
|
Director
|
|
R. Sanders Williams, M.D.
|
|
|
* F. Samuel Eberts III, by his signing his name hereto, does hereby sign this report on behalf of the directors of the Registrant after whose typed names asterisks appear, pursuant to powers of attorney duly executed by such directors and filed with the Securities and Exchange Commission.
|
By:
|
/s/ F. SAMUEL EBERTS III
|
|
|
|
F. Samuel Eberts III
|
|
|
|
Attorney-in-fact
|
|
63
LABORATORY CORPORATION OF AMERICA HOLDINGS AND SUBSIDIARIES
INDEX TO CONSOLIDATED FINANCIAL STATEMENTS
AND SCHEDULE
|
|
Page
|
|
|
|
|
|
|
|
Consolidated Financial Statements:
|
|
|
|
|
|
|
|
|
|
|
|
|
|
|
|
|
|
|
|
|
Financial Statement Schedule:
|
|
|
|
|
F-1
Report of Independent Registered Public Accounting Firm
To the Board of Directors and Shareholders of
Laboratory Corporation of America Holdings:
In our opinion, the consolidated financial statements listed in the accompanying index present fairly, in all material respects, the financial position of Laboratory Corporation of America Holdings and its subsidiaries at
December 31, 2013
and
2012
, and the results of their operations and their cash flows for each of the three years in the period ended
December 31, 2013
in conformity with accounting principles generally accepted in the United States of America. In addition, in our opinion, the financial statement schedule listed in the accompanying index presents fairly, in all material respects, the information set forth therein when read in conjunction with the related consolidated financial statements. Also in our opinion, the Company maintained, in all material respects, effective internal control over financial reporting as of
December 31, 2013
, based on criteria established in
Internal Control–Integrated Framework 1992
issued by the Committee of Sponsoring Organizations of the Treadway Commission (COSO). The Company’s management is responsible for these financial statements and financial statement schedule, for maintaining effective internal control over financial reporting and for its assessment of the effectiveness of internal control over financial reporting, included in the Report of Management on Internal Control Over Financial Reporting appearing under Item 9A. Our responsibility is to express opinions on these financial statements, on the financial statement schedule, and on the Company’s internal control over financial reporting based on our integrated audits. We conducted our audits in accordance with the standards of the Public Company Accounting Oversight Board (United States). Those standards require that we plan and perform the audits to obtain reasonable assurance about whether the financial statements are free of material misstatement and whether effective internal control over financial reporting was maintained in all material respects. Our audits of the financial statements included examining, on a test basis, evidence supporting the amounts and disclosures in the financial statements, assessing the accounting principles used and significant estimates made by management, and evaluating the overall financial statement presentation. Our audit of internal control over financial reporting included obtaining an understanding of internal control over financial reporting, assessing the risk that a material weakness exists, and testing and evaluating the design and operating effectiveness of internal control based on the assessed risk. Our audits also included performing such other procedures as we considered necessary in the circumstances. We believe that our audits provide a reasonable basis for our opinions.
A company’s internal control over financial reporting is a process designed to provide reasonable assurance regarding the reliability of financial reporting and the preparation of financial statements for external purposes in accordance with generally accepted accounting principles. A company’s internal control over financial reporting includes those policies and procedures that (i) pertain to the maintenance of records that, in reasonable detail, accurately and fairly reflect the transactions and dispositions of the assets of the company; (ii) provide reasonable assurance that transactions are recorded as necessary to permit preparation of financial statements in accordance with generally accepted accounting principles, and that receipts and expenditures of the company are being made only in accordance with authorizations of management and directors of the company; and (iii) provide reasonable assurance regarding prevention or timely detection of unauthorized acquisition, use, or disposition of the company’s assets that could have a material effect on the financial statements.
Because of its inherent limitations, internal control over financial reporting may not prevent or detect misstatements. Also, projections of any evaluation of effectiveness to future periods are subject to the risk that controls may become inadequate because of changes in conditions, or that the degree of compliance with the policies or procedures may deteriorate.
/s/ PricewaterhouseCoopers LLP
Charlotte, North Carolina
February 25, 2014
F-2
LABORATORY CORPORATION OF AMERICA HOLDINGS AND SUBSIDIARIES
(In Millions)
|
December 31,
2013 |
December 31,
2012 |
||||||
|
ASSETS
|
|
|
|||||
|
Current assets:
|
|
|
|||||
|
Cash and cash equivalents
|
$
|
404.0
|
|
$
|
466.8
|
|
|
|
Accounts receivable, net of allowance for doubtful accounts of $198.3 and $191.5 at December 31, 2013 and 2012, respectively
|
784.7
|
|
718.5
|
|
|||
|
Supplies inventories
|
136.5
|
|
121.0
|
|
|||
|
Prepaid expenses and other
|
106.9
|
|
74.6
|
|
|||
|
Deferred income taxes
|
—
|
|
10.9
|
|
|||
|
Total current assets
|
1,432.1
|
|
1,391.8
|
|
|||
|
Property, plant and equipment, net
|
707.4
|
|
630.8
|
|
|||
|
Goodwill, net
|
3,022.8
|
|
2,901.7
|
|
|||
|
Intangible assets, net
|
1,572.0
|
|
1,667.7
|
|
|||
|
Joint venture partnerships and equity method investments
|
88.5
|
|
78.1
|
|
|||
|
Other assets, net
|
143.1
|
|
124.9
|
|
|||
|
Total assets
|
$
|
6,965.9
|
|
$
|
6,795.0
|
|
|
|
LIABILITIES AND SHAREHOLDERS’ EQUITY
|
|
|
|
|
|||
|
Current liabilities:
|
|
|
|
|
|||
|
Accounts payable
|
$
|
304.5
|
|
$
|
236.9
|
|
|
|
Accrued expenses and other
|
310.0
|
|
311.6
|
|
|||
|
Deferred income taxes
|
9.9
|
|
—
|
|
|||
|
Short-term borrowings and current portion of long-term debt
|
111.3
|
|
480.0
|
|
|||
|
Total current liabilities
|
735.7
|
|
1,028.5
|
|
|||
|
Long-term debt, less current portion
|
2,889.1
|
|
2,175.0
|
|
|||
|
Deferred income taxes and other tax liabilities
|
563.9
|
|
546.0
|
|
|||
|
Other liabilities
|
266.5
|
|
307.4
|
|
|||
|
Total liabilities
|
4,455.2
|
|
4,056.9
|
|
|||
|
Commitments and contingent liabilities
|
|
|
|
|
|||
|
Noncontrolling interest
|
19.4
|
|
20.7
|
|
|||
|
Shareholders’ equity
|
|
|
|
|
|||
|
Common stock, 85.7 and 93.5 shares outstanding at December 31, 2013 and 2012, respectively
|
10.5
|
|
11.3
|
|
|||
|
Additional paid-in capital
|
—
|
|
—
|
|
|||
|
Retained earnings
|
3,373.5
|
|
3,588.5
|
|
|||
|
Less common stock held in treasury
|
(958.9
|
)
|
(951.8
|
)
|
|||
|
Accumulated other comprehensive income
|
66.2
|
|
69.4
|
|
|||
|
Total shareholders’ equity
|
2,491.3
|
|
2,717.4
|
|
|||
|
Total liabilities and shareholders’ equity
|
$
|
6,965.9
|
|
$
|
6,795.0
|
|
|
The accompanying notes are an integral part of these consolidated financial statements.
F-3
LABORATORY CORPORATION OF AMERICA HOLDINGS AND SUBSIDIARIES
(In Millions, Except Per Share Data)
|
|
Years Ended December 31,
|
||||||||||
|
|
2013
|
2012
|
2011
|
||||||||
|
Net sales
|
$
|
5,808.3
|
|
$
|
5,671.4
|
|
$
|
5,542.3
|
|
||
|
Cost of sales
|
3,585.1
|
|
3,421.7
|
|
3,267.6
|
|
|||||
|
Gross profit
|
2,223.2
|
|
2,249.7
|
|
2,274.7
|
|
|||||
|
Selling, general and administrative expenses
|
1,128.8
|
|
1,114.6
|
|
1,159.6
|
|
|||||
|
Amortization of intangibles and other assets
|
81.7
|
|
86.3
|
|
85.8
|
|
|||||
|
Restructuring and other special charges
|
21.8
|
|
25.3
|
|
80.9
|
|
|||||
|
Operating income
|
990.9
|
|
1,023.5
|
|
948.4
|
|
|||||
|
Other income (expenses):
|
|
|
|
|
|
|
|||||
|
Interest expense
|
(96.5
|
)
|
(94.5
|
)
|
(87.5
|
)
|
|||||
|
Equity method income, net
|
16.9
|
|
21.4
|
|
9.5
|
|
|||||
|
Investment income
|
2.2
|
|
1.0
|
|
1.3
|
|
|||||
|
Other, net
|
2.1
|
|
(7.2
|
)
|
(5.6
|
)
|
|||||
|
Earnings before income taxes
|
915.6
|
|
944.2
|
|
866.1
|
|
|||||
|
Provision for income taxes
|
340.2
|
|
359.4
|
|
333.0
|
|
|||||
|
Net earnings
|
575.4
|
|
584.8
|
|
533.1
|
|
|||||
|
Less: Net earnings attributable to the noncontrolling interest
|
(1.6
|
)
|
(1.7
|
)
|
(13.4
|
)
|
|||||
|
Net earnings attributable to Laboratory Corporation of America Holdings
|
$
|
573.8
|
|
$
|
583.1
|
|
$
|
519.7
|
|
||
|
Basic earnings per common share
|
$
|
6.36
|
|
$
|
6.09
|
|
$
|
5.20
|
|
||
|
Diluted earnings per common share
|
$
|
6.25
|
|
$
|
5.99
|
|
$
|
5.11
|
|
||
The accompanying notes are an integral part of these consolidated financial statements.
F-4
LABORATORY CORPORATION OF AMERICA HOLDINGS AND SUBSIDIARIES
CONSOLIDATED STATEMENTS OF COMPREHENSIVE EARNINGS
(In Millions, Except Per Share Data)
|
|
Years Ended December 31,
|
||||||||||
|
|
2013
|
2012
|
2011
|
||||||||
|
Net earnings
|
$
|
575.4
|
|
$
|
584.8
|
|
$
|
533.1
|
|
||
|
Foreign currency translation adjustments
|
(63.2
|
)
|
31.3
|
|
(13.2
|
)
|
|||||
|
Interest rate swap adjustments
|
—
|
|
—
|
|
2.4
|
|
|||||
|
Net benefit plan adjustments
|
42.1
|
|
7.3
|
|
(57.5
|
)
|
|||||
|
Investment adjustments
|
16.4
|
|
—
|
|
—
|
|
|||||
|
Other comprehensive earnings (loss) before tax
|
(4.7
|
)
|
38.6
|
|
(68.3
|
)
|
|||||
|
Provision for income tax related to items of comprehensive earnings
|
1.5
|
|
(14.7
|
)
|
25.3
|
|
|||||
|
Other comprehensive earnings (loss), net of tax
|
(3.2
|
)
|
23.9
|
|
(43.0
|
)
|
|||||
|
Comprehensive earnings
|
572.2
|
|
608.7
|
|
490.1
|
|
|||||
|
Less: Net earnings attributable to the noncontrolling interest
|
(1.6
|
)
|
(1.7
|
)
|
(13.4
|
)
|
|||||
|
Net earnings attributable to Laboratory Corporation of America Holdings
|
$
|
570.6
|
|
$
|
607.0
|
|
$
|
476.7
|
|
||
The accompanying notes are an integral part of these consolidated financial statements.
F-5
LABORATORY CORPORATION OF AMERICA HOLDINGS AND SUBSIDIARIES
CONSOLIDATED STATEMENTS OF CHANGES IN SHAREHOLDERS’ EQUITY
(In Millions)
|
Common
Stock
|
Additional
Paid-in
Capital
|
Retained
Earnings
|
Treasury
Stock
|
Accumulated
Other
Comprehensive
Income (Loss)
|
Total
Shareholders’
Equity
|
||||||||||||||||||
|
BALANCE AT DECEMBER 31, 2010
|
$
|
12.2
|
|
$
|
53.9
|
|
$
|
3,246.6
|
|
$
|
(934.9
|
)
|
$
|
88.5
|
|
$
|
2,466.3
|
|
|||||
|
Net earnings attributable to Laboratory Corporation of America Holdings
|
—
|
|
—
|
|
519.7
|
|
—
|
|
—
|
|
519.7
|
|
|||||||||||
|
Other comprehensive earnings, net of tax
|
—
|
|
—
|
|
—
|
|
—
|
|
(43.0
|
)
|
(43.0
|
)
|
|||||||||||
|
Issuance of common stock under employee stock plans
|
0.1
|
|
117.9
|
|
—
|
|
—
|
|
—
|
|
118.0
|
|
|||||||||||
|
Surrender of restricted stock and performance share awards
|
—
|
|
—
|
|
—
|
|
(6.0
|
)
|
—
|
|
(6.0
|
)
|
|||||||||||
|
Conversion of zero-coupon convertible debt
|
0.1
|
|
36.1
|
|
—
|
|
—
|
|
—
|
|
36.2
|
|
|||||||||||
|
Stock compensation
|
—
|
|
48.9
|
|
—
|
|
—
|
|
—
|
|
48.9
|
|
|||||||||||
|
Purchase of noncontrolling interest
|
—
|
|
(3.7
|
)
|
—
|
|
—
|
|
—
|
|
(3.7
|
)
|
|||||||||||
|
Income tax benefit from stock options exercised
|
—
|
|
11.0
|
|
—
|
|
—
|
|
—
|
|
11.0
|
|
|||||||||||
|
Purchase of common stock
|
(0.7
|
)
|
(264.1
|
)
|
(379.1
|
)
|
—
|
|
—
|
|
(643.9
|
)
|
|||||||||||
|
BALANCE AT DECEMBER 31, 2011
|
$
|
11.7
|
|
$
|
—
|
|
$
|
3,387.2
|
|
$
|
(940.9
|
)
|
$
|
45.5
|
|
$
|
2,503.5
|
|
|||||
|
Net earnings attributable to Laboratory Corporation of America Holdings
|
—
|
|
—
|
|
583.1
|
|
—
|
|
—
|
|
583.1
|
|
|||||||||||
|
Other comprehensive earnings, net of tax
|
—
|
|
—
|
|
—
|
|
—
|
|
23.9
|
|
23.9
|
|
|||||||||||
|
Issuance of common stock under employee stock plans
|
0.1
|
|
85.1
|
|
—
|
|
—
|
|
—
|
|
85.2
|
|
|||||||||||
|
Surrender of restricted stock and performance share awards
|
—
|
|
—
|
|
—
|
|
(10.9
|
)
|
—
|
|
(10.9
|
)
|
|||||||||||
|
Conversion of zero-coupon convertible debt
|
—
|
|
—
|
|
—
|
|
—
|
|
—
|
|
—
|
|
|||||||||||
|
Stock compensation
|
—
|
|
40.7
|
|
—
|
|
—
|
|
—
|
|
40.7
|
|
|||||||||||
|
Purchase of noncontrolling interest
|
—
|
|
—
|
|
—
|
|
—
|
|
—
|
|
—
|
|
|||||||||||
|
Income tax benefit from stock options exercised
|
—
|
|
8.4
|
|
—
|
|
—
|
|
—
|
|
8.4
|
|
|||||||||||
|
Purchase of common stock
|
(0.5
|
)
|
(134.2
|
)
|
(381.8
|
)
|
—
|
|
—
|
|
(516.5
|
)
|
|||||||||||
|
BALANCE AT DECEMBER 31, 2012
|
$
|
11.3
|
|
$
|
—
|
|
$
|
3,588.5
|
|
$
|
(951.8
|
)
|
$
|
69.4
|
|
$
|
2,717.4
|
|
|||||
|
Net earnings attributable to Laboratory Corporation of America Holdings
|
—
|
|
—
|
|
573.8
|
|
—
|
|
—
|
|
573.8
|
|
|||||||||||
|
Other comprehensive earnings, net of tax
|
—
|
|
—
|
|
—
|
|
—
|
|
(3.2
|
)
|
(3.2
|
)
|
|||||||||||
|
Issuance of common stock under employee stock plans
|
0.2
|
|
173.8
|
|
—
|
|
—
|
|
—
|
|
174.0
|
|
|||||||||||
|
Surrender of restricted stock and performance share awards
|
—
|
|
—
|
|
—
|
|
(7.1
|
)
|
—
|
|
(7.1
|
)
|
|||||||||||
|
Conversion of zero-coupon convertible debt
|
—
|
|
4.1
|
|
—
|
|
—
|
|
—
|
|
4.1
|
|
|||||||||||
|
Stock compensation
|
—
|
|
37.3
|
|
—
|
|
—
|
|
—
|
|
37.3
|
|
|||||||||||
|
Income tax benefit from stock options exercised
|
—
|
|
10.6
|
|
—
|
|
—
|
|
—
|
|
10.6
|
|
|||||||||||
|
Purchase of common stock
|
(1.0
|
)
|
(225.8
|
)
|
(788.8
|
)
|
—
|
|
—
|
|
(1,015.6
|
)
|
|||||||||||
|
BALANCE AT DECEMBER 31, 2013
|
$
|
10.5
|
|
$
|
—
|
|
$
|
3,373.5
|
|
$
|
(958.9
|
)
|
$
|
66.2
|
|
$
|
2,491.3
|
|
|||||
The accompanying notes are an integral part of these consolidated financial statements.
F-6
LABORATORY CORPORATION OF AMERICA HOLDINGS AND SUBSIDIARIES
(In Millions)
|
|
Years Ended December 31,
|
||||||||||
|
|
2013
|
2012
|
2011
|
||||||||
|
CASH FLOWS FROM OPERATING ACTIVITIES:
|
|
|
|
||||||||
|
Net earnings
|
$
|
575.4
|
|
$
|
584.8
|
|
$
|
533.1
|
|
||
|
Adjustments to reconcile net earnings to net cash provided by operating activities:
|
|
|
|
|
|
|
|||||
|
Depreciation and amortization
|
230.1
|
|
229.8
|
|
231.4
|
|
|||||
|
Stock compensation
|
37.3
|
|
40.7
|
|
48.9
|
|
|||||
|
(Gain)/loss on sale of assets
|
(3.9
|
)
|
5.5
|
|
7.2
|
|
|||||
|
Accrued interest on zero-coupon subordinated notes
|
2.3
|
|
2.7
|
|
3.9
|
|
|||||
|
Cumulative earnings less than (in excess of) distributions from equity method investments
|
(4.2
|
)
|
(0.4
|
)
|
1.4
|
|
|||||
|
Deferred income taxes
|
56.2
|
|
53.3
|
|
2.2
|
|
|||||
|
Change in assets and liabilities (net of effects of acquisitions):
|
|
|
|
|
|
|
|||||
|
(Increase) decrease in accounts receivable (net)
|
(67.5
|
)
|
0.6
|
|
(37.1
|
)
|
|||||
|
Increase in inventories
|
(15.3
|
)
|
(6.3
|
)
|
(6.1
|
)
|
|||||
|
(Increase) decrease in prepaid expenses and other
|
(32.3
|
)
|
7.1
|
|
9.8
|
|
|||||
|
Increase (decrease) in accounts payable
|
60.8
|
|
(30.0
|
)
|
(8.7
|
)
|
|||||
|
Increase (decrease) in accrued expenses and other
|
(20.2
|
)
|
(46.4
|
)
|
69.6
|
|
|||||
|
Net cash provided by operating activities
|
818.7
|
|
841.4
|
|
855.6
|
|
|||||
|
CASH FLOWS FROM INVESTING ACTIVITIES:
|
|
|
|
|
|
|
|||||
|
Capital expenditures
|
(202.2
|
)
|
(173.8
|
)
|
(145.7
|
)
|
|||||
|
Proceeds from sale of assets
|
1.1
|
|
3.2
|
|
3.7
|
|
|||||
|
Proceeds from sale of investments
|
7.5
|
|
—
|
|
—
|
|
|||||
|
Acquisition of licensing technology
|
—
|
|
(2.5
|
)
|
—
|
|
|||||
|
Investments in equity affiliates
|
(6.5
|
)
|
(26.0
|
)
|
—
|
|
|||||
|
Acquisition of businesses, net of cash acquired
|
(159.5
|
)
|
(335.1
|
)
|
(138.3
|
)
|
|||||
|
Net cash used for investing activities
|
(359.6
|
)
|
(534.2
|
)
|
(280.3
|
)
|
|||||
|
CASH FLOWS FROM FINANCING ACTIVITIES:
|
|
|
|
|
|
|
|||||
|
Proceeds from senior notes offerings
|
700.0
|
|
1,000.0
|
|
—
|
|
|||||
|
Proceeds from revolving credit facilities
|
412.0
|
|
305.0
|
|
880.0
|
|
|||||
|
Payments on revolving credit facilities
|
(412.0
|
)
|
(865.0
|
)
|
(320.0
|
)
|
|||||
|
Principal payments on term loan
|
—
|
|
—
|
|
(375.0
|
)
|
|||||
|
Payments on zero-coupon subordinated notes
|
(21.5
|
)
|
(8.2
|
)
|
(155.1
|
)
|
|||||
|
Payments on long-term debt
|
(350.0
|
)
|
—
|
|
(0.9
|
)
|
|||||
|
Payment of debt issuance costs
|
(9.3
|
)
|
(8.9
|
)
|
(3.6
|
)
|
|||||
|
Payments on long-term lease obligations
|
(0.4
|
)
|
—
|
|
—
|
|
|||||
|
Cash paid to acquire an interest in a consolidated subsidiary
|
—
|
|
—
|
|
(147.9
|
)
|
|||||
|
Noncontrolling interest distributions
|
(0.9
|
)
|
(1.2
|
)
|
(7.4
|
)
|
|||||
|
Deferred payments on acquisitions
|
(5.6
|
)
|
—
|
|
—
|
|
|||||
|
Excess tax benefits from stock based compensation
|
11.0
|
|
8.2
|
|
10.4
|
|
|||||
|
Net proceeds from issuance of stock to employees
|
174.0
|
|
85.8
|
|
118.4
|
|
|||||
|
Purchase of common stock
|
(1,015.6
|
)
|
(516.5
|
)
|
(643.9
|
)
|
|||||
|
Net cash used for financing activities
|
(518.3
|
)
|
(0.8
|
)
|
(645.0
|
)
|
|||||
|
Effect of exchange rate changes on cash and cash equivalents
|
(3.6
|
)
|
1.1
|
|
(1.7
|
)
|
|||||
|
Net increase (decrease) in cash and cash equivalents
|
(62.8
|
)
|
307.5
|
|
(71.4
|
)
|
|||||
|
Cash and cash equivalents at beginning of period
|
466.8
|
|
159.3
|
|
230.7
|
|
|||||
|
Cash and cash equivalents at end of period
|
$
|
404.0
|
|
$
|
466.8
|
|
$
|
159.3
|
|
||
The accompanying notes are an integral part of these consolidated financial statements.
F-7
LABORATORY CORPORATION OF AMERICA HOLDINGS AND SUBSIDIARIES
NOTES TO CONSOLIDATED FINANCIAL STATEMENTS
(Dollars and shares in millions, except per share data)
1. SUMMARY OF SIGNIFICANT ACCOUNTING POLICIES
Basis of Financial Statement Presentation
Laboratory Corporation of America Holdings with its subsidiaries (the “Company”) is the
second
largest independent clinical laboratory company in the U.S. based on
2013
net revenues. Through a national network of laboratories, the Company offers a broad range of testing services used by the medical profession in core testing, patient diagnosis, and in the monitoring and treatment of disease. In addition, the Company has developed specialty and niche operations based on certain types of specialized testing capabilities and client requirements, such as oncology testing, HIV genotyping and phenotyping, diagnostic genetics and clinical research trials.
Since its founding in 1971, the Company has grown into a network of
44
primary laboratories and over
1,700
patient service centers along with a network of branches and STAT laboratories. With over
34,000
employees, the Company processes tests on approximately
490,000
patient specimens daily and provides clinical laboratory testing services to clients throughout the United States and other countries including Mexico, the Bahamas, Belgium, Germany, Italy, Spain, the United Kingdom, China, Singapore, Japan, South Korea, and
three
provinces in Canada. The Company operates within two reportable segments based on the way the Company manages its business.
The consolidated financial statements include the accounts of the Company and its majority-owned subsidiaries for which it exercises control. Long-term investments in affiliated companies in which the Company exercises significant influence, but which it does not control, are accounted for using the equity method. Investments in which the Company does not exercise significant influence (generally, when the Company has an investment of less than
20%
and no representation on the investee's board of directors) are accounted for using the cost method. All significant inter-company transactions and accounts have been eliminated. The Company does not have any variable interest entities or special purpose entities whose financial results are not included in the consolidated financial statements.
The financial statements of the Company's foreign subsidiaries are measured using the local currency as the functional currency. Assets and liabilities are translated at exchange rates as of the balance sheet date. Revenues and expenses are translated at average monthly exchange rates prevailing during the year. Resulting translation adjustments are included in "Accumulated other comprehensive income.”
Revenue Recognition
Sales are recognized on the accrual basis at the time test results are reported, which approximates when services are provided. Services are provided to certain patients covered by various third-party payer programs including various managed care organizations, as well as the Medicare and Medicaid programs. Billings for services under third-party payer programs are included in sales net of allowances for contractual discounts and allowances for differences between the amounts billed and estimated program payment amounts. Adjustments to the estimated payment amounts based on final settlement with the programs are recorded upon settlement as an adjustment to revenue. In
2013
,
2012
and
2011
, approximately
16.0%
,
17.6%
and
19.0%
, respectively, of the Company's revenues were derived
directly from the Medicare and Medicaid programs. The Company has capitated agreements with certain managed care customers and recognizes related revenue based on a predetermined monthly contractual rate for each member of the managed care plan regardless of the number or cost of services provided by the Company. In
2013
,
2012
and
2011
, approximately
3.2%
,
3.0%
and
2.9%
, respectively, of the Company's revenues were derived
from such capitated agreements.
The Company's net sales are comprised of the following:
|
|
Years Ended December 31,
|
||||||||||
|
Net sales
|
2013
|
2012
|
2011
|
||||||||
|
Clinical diagnostics laboratory:
|
|||||||||||
|
Core Testing
|
$
|
3,445.1
|
|
$
|
3,246.6
|
|
$
|
3,143.9
|
|
||
|
Genomic and Esoteric Testing
|
2,020.1
|
|
2,089.8
|
|
2,089.0
|
|
|||||
|
Other
|
343.1
|
|
335.0
|
|
309.4
|
|
|||||
|
Total
|
$
|
5,808.3
|
|
$
|
5,671.4
|
|
$
|
5,542.3
|
|
||
F-8
LABORATORY CORPORATION OF AMERICA HOLDINGS AND SUBSIDIARIES
NOTES TO CONSOLIDATED FINANCIAL STATEMENTS
(Dollars and shares in millions, except per share data)
Use of Estimates
The preparation of financial statements in conformity with generally accepted accounting principles requires the Company to make estimates and assumptions that affect the reported amounts of assets and liabilities and disclosure of contingent assets and liabilities at the date of the financial statements and the reported amounts of revenues and expenses during the reported periods. Significant estimates include the allowances for doubtful accounts, deferred tax assets, fair values and amortization lives for intangible assets, and accruals for self-insurance reserves and pensions. The allowance for doubtful accounts is determined based on historical collections trends, the aging of accounts, current economic conditions and regulatory changes. Actual results could differ from those estimates.
Concentration of Credit Risk
Financial instruments that potentially subject the Company to concentrations of credit risk consist primarily of cash and cash equivalents and accounts receivable.
The Company maintains cash and cash equivalents with various major financial institutions. The total cash balances on deposit that exceeded the balances insured by the F.D.I.C., were approximately
$52.8
at
December 31, 2013
. Cash equivalents at
December 31, 2013
, totaled
$367.5
, which includes amounts invested in money market funds, time deposits, municipal, treasury and government funds.
Substantially all of the Company’s accounts receivable are with companies in the health care industry and individuals. However, concentrations of credit risk are limited due to the number of the Company’s clients as well as their dispersion across many different geographic regions.
While the Company has receivables due from federal and state governmental agencies, the Company does not believe that such receivables represent a credit risk since the related healthcare programs are funded by federal and state governments, and payment is primarily dependent upon submitting appropriate documentation. Accounts receivable balances (gross) from Medicare and Medicaid were
$128.6
and
$121.1
at
December 31, 2013
and
2012
, respectively.
For the Company's subsidiary operations in Ontario, Canada, the Ministry of Health determines who can establish a licensed community medical laboratory and caps the amount that each of these licensed laboratories can bill the government sponsored healthcare plan. The Ontario government-sponsored healthcare plan covers the cost of clinical laboratory testing performed by the licensed laboratories. The provincial government discounts the annual testing volumes based on certain utilization discounts and establishes an annual maximum it will pay for all community laboratory tests. The agreed-upon reimbursement rates are subject to Ministry of Health review at the end of year and can be adjusted (at the government's discretion) based upon the actual volume and mix of test work performed by the licensed providers in the province during the year. The accounts receivable balances from the Ontario government sponsored healthcare plan was
$33.2
and
$26.7
at December 31, 2013 and 2012, respectively.
The portion of the Company's accounts receivable due from patients comprises the largest portion of credit risk. At December 31, 2013 and 2012, receivables due from patients represent approximately
27.8%
and
28.3%
of the Company's consolidated gross accounts receivable. The Company applies assumptions and judgments including historical collection experience for assessing collectibility and determining allowances for doubtful accounts for accounts receivable from patients.
Earnings per Share
Basic earnings per share is computed by dividing net earnings attributable to Laboratory Corporation of America Holdings by the weighted average number of common shares outstanding. Diluted earnings per share is computed by dividing net earnings including the impact of dilutive adjustments by the weighted average number of common shares outstanding plus potentially dilutive shares, as if they had been issued at the earlier of the date of issuance or the beginning of the period presented. Potentially dilutive common shares result primarily from the Company’s outstanding stock options, restricted stock awards, performance share awards, and shares issuable upon conversion of zero-coupon subordinated notes.
The following represents a reconciliation of basic earnings per share to diluted earnings per share:
F-9
LABORATORY CORPORATION OF AMERICA HOLDINGS AND SUBSIDIARIES
NOTES TO CONSOLIDATED FINANCIAL STATEMENTS
(Dollars and shares in millions, except per share data)
|
|
2013
|
2012
|
2011
|
|||||||||||||||||||||||||||||
|
Income
|
Shares
|
Per Share
Amount
|
Income
|
Shares
|
Per Share
Amount
|
Income
|
Shares
|
Per Share
Amount
|
||||||||||||||||||||||||
|
Basic earnings per share
|
$
|
573.8
|
|
90.2
|
|
$
|
6.36
|
|
$
|
583.1
|
|
95.7
|
|
$
|
6.09
|
|
$
|
519.7
|
|
100.0
|
|
$
|
5.20
|
|
||||||||
|
Stock options
|
—
|
|
1.1
|
|
|
|
—
|
|
0.8
|
|
|
|
—
|
|
0.9
|
|
|
|
||||||||||||||
|
Restricted stock awards and other
|
—
|
|
—
|
|
|
|
—
|
|
0.3
|
|
|
|
—
|
|
0.3
|
|
|
|
||||||||||||||
|
Effect of convertible debt, net of tax
|
—
|
|
0.5
|
|
|
|
—
|
|
0.6
|
|
|
|
—
|
|
0.6
|
|
|
|
||||||||||||||
|
Diluted earnings per share
|
$
|
573.8
|
|
91.8
|
|
$
|
6.25
|
|
$
|
583.1
|
|
97.4
|
|
$
|
5.99
|
|
$
|
519.7
|
|
101.8
|
|
$
|
5.11
|
|
||||||||
The following table summarizes the potential common shares not included in the computation of diluted earnings per share because their impact would have been antidilutive:
|
|
Years Ended December 31,
|
||||
|
|
2013
|
2012
|
2011
|
||
|
Stock options
|
0.1
|
2.4
|
1.3
|
||
Stock Compensation Plans
The Company measures stock compensation cost for all equity awards at fair value on the date of grant and recognizes compensation expense over the service period for awards expected to vest. The fair value of restricted stock awards and performance shares is determined based on the number of shares granted and the quoted price of the Company’s common stock on the grant date. Such value is recognized as expense over the service period, net of estimated forfeitures. The estimation of equity awards that will ultimately vest requires judgment and the Company considers many factors when estimating expected forfeitures, including types of awards, employee class, and historical experience. The cumulative effect on current and prior periods of a change in the estimated forfeiture rate is recognized as compensation cost in earnings in the period of the revision. Actual results and future estimates may differ substantially from the Company’s current estimates.
See Note 14 for assumptions used in calculating compensation expense for the Company’s stock compensation plans.
Cash Equivalents
Cash and cash equivalents consist of highly liquid instruments, such as commercial paper, time deposits, and other money market instruments, which have original maturities of three months or less.
Inventories
Inventories, consisting primarily of purchased laboratory and client supplies, are stated at the lower of cost (first-in, first-out) or market.
Property, Plant and Equipment
Property, plant and equipment are recorded at cost. The cost of properties held under capital leases is equal to the lower of the net present value of the minimum lease payments or the fair value of the leased property at the inception of the lease. Depreciation and amortization expense is computed on all classes of assets based on their estimated useful lives, as indicated below, using the straight-line method.
F-10
LABORATORY CORPORATION OF AMERICA HOLDINGS AND SUBSIDIARIES
NOTES TO CONSOLIDATED FINANCIAL STATEMENTS
(Dollars and shares in millions, except per share data)
|
|
Years
|
||
|
Buildings and building improvements
|
10
|
-
|
35
|
|
Machinery and equipment
|
3
|
-
|
10
|
|
Furniture and fixtures
|
5
|
-
|
10
|
|
Software
|
3
|
-
|
10
|
Leasehold improvements and assets held under capital leases are amortized over the shorter of their estimated useful lives or the term of the related leases. Expenditures for repairs and maintenance are charged to operations as incurred. Retirements, sales and other disposals of assets are recorded by removing the cost and accumulated depreciation from the related accounts with any resulting gain or loss reflected in the consolidated statements of operations.
Capitalized Software Costs
The Company capitalizes purchased software which is ready for service and capitalizes software development costs incurred on significant projects starting from the time that the preliminary project stage is completed and the Company commits to funding a project until the project is substantially complete and the software is ready for its intended use. Capitalized costs include direct material and service costs and payroll and payroll-related costs. Research and development costs and other computer software maintenance costs related to software development are expensed as incurred. Capitalized software costs are amortized using the straight-line method over the estimated useful life of the underlying system, generally
five
years.
Long-Lived Assets
The Company assesses goodwill and indefinite lived intangibles for impairment at least annually and more frequently if triggering events occur. The timing of the Company's annual impairment testing is the end of the fiscal year. In accordance with the Financial Accounting Standards Board (“FASB”) updates to their authoritative guidance regarding goodwill and indefinite-lived intangible asset impairment testing, an entity is allowed to first assess qualitative factors as a basis for determining whether it is necessary to perform quantitative impairment testing. If an entity determines that it is not more likely than not that the estimated fair value of an asset is less than its carrying value, then no further testing is required. Otherwise, impairment testing must be performed in accordance with the original accounting standards. The updated FASB guidance also allows an entity to bypass the qualitative assessment for any reporting unit in its goodwill assessment and proceed directly to performing the first step of the two-step assessment. Similarly, a Company can proceed directly to a quantitative assessment in the case of impairment testing for indefinite-lived intangible assets as well. In
2013
and
2012
, the Company elected to bypass the purely qualitative assessments for its goodwill and indefinite-lived intangible assets and proceed to quantitative assessments utilizing methodologies as described in the following paragraphs.
Step One of the goodwill impairment test includes the estimation of the fair value of each reporting unit as compared to the book value of the reporting unit. The Company uses a market value approach for determining fair value and utilizes a number of factors such as publicly available information regarding the market capitalization of the Company as well as operating results, business plans, and present value techniques. If Step One indicates potential impairment, the second step is performed to measure the amount of the impairment.
The Company has indefinite-lived assets consisting of acquired Canadian licenses. When a quantitative analysis is considered necessary for indefinite-lived intangible assets, the Company utilizes an income approach to determine the fair value. It then compares the carrying value of the indefinite-lived asset to its fair value. Impairment losses are recorded to the extent that the carrying value of the indefinite-lived intangible asset exceeds its fair value.
There are inherent uncertainties related to the factors described above and judgment related to the Company's impairment assessments of goodwill and indefinite-lived intangibles. The assumptions underlying the impairment analyses may change in such a manner that impairment in value may occur in the future. Any such impairment will be recognized in the period in which it becomes known.
The Company completed an annual impairment analysis of its indefinite lived assets, including goodwill, and has found no instances of impairment as of
December 31, 2013
or
2012
.
F-11
LABORATORY CORPORATION OF AMERICA HOLDINGS AND SUBSIDIARIES
NOTES TO CONSOLIDATED FINANCIAL STATEMENTS
(Dollars and shares in millions, except per share data)
Long-lived assets, other than goodwill and indefinite-lived assets, are reviewed for impairment whenever events or changes in circumstances indicate that the carrying amounts may not be recoverable. Recoverability of assets to be held and used is determined by the Company at the level for which there are identifiable cash flows by comparison of the carrying amount of the assets to future undiscounted net cash flows before interest expense and income taxes expected to be generated by the assets. Impairment, if any, is measured by the amount by which the carrying amount of the assets exceeds the fair value of the assets (based on market prices in an active market or on discounted cash flows). Assets to be disposed of are reported at the lower of the carrying amount or fair value. The Company found no instances of impairment as of
December 31, 2013
or
2012
.
Intangible Assets
Intangible assets are amortized on a straight-line basis over the expected periods to be benefited, as set forth in the table below, such as legal life for patents and technology and contractual lives for non-compete agreements.
|
|
Years
|
||
|
Customer relationships
|
10
|
-
|
30
|
|
Patents, licenses and technology
|
3
|
-
|
15
|
|
Non-compete agreements
|
5
|
-
|
10
|
|
Trade names
|
5
|
-
|
10
|
The costs related to the issuance of debt are capitalized and amortized to interest expense over the terms of the related debt.
Professional Liability
The Company is self-insured (up to certain limits) for professional liability claims arising in the normal course of business, generally related to the testing and reporting of laboratory test results. The Company estimates a liability that represents the ultimate exposure for aggregate losses below those limits. The liability is discounted and is based on actuarial assumptions and factors for known and incurred but not reported claims, including the frequency and payment trends of historical claims.
Income Taxes
The Company accounts for income taxes utilizing the asset and liability method. Under this method deferred tax assets and liabilities are recognized for the future tax consequences attributable to differences between the financial statement carrying amounts of existing assets and liabilities and their respective tax bases and for tax loss carryforwards. Deferred tax assets and liabilities are measured using enacted tax rates expected to apply to taxable income in the years in which those temporary differences are expected to be recovered or settled. The effect on deferred tax assets and liabilities of a change in tax rates is recognized in income in the period that includes the enactment date. The Company does not recognize a tax benefit unless the Company concludes that it is more likely than not that the benefit will be sustained on audit by the taxing authority based solely on the technical merits of the associated tax position. If the recognition threshold is met, the Company recognizes a tax benefit measured at the largest amount of the tax benefit that the Company believes is greater than
50%
likely to be realized. The Company records interest and penalties in income tax expense.
Derivative Financial Instruments
Interest rate swap agreements, which have been used by the Company from time to time in the management of interest rate exposure, are accounted for at fair value. The Company’s zero-coupon subordinated notes contain two features that are considered to be embedded derivative instruments under authoritative guidance in connection with accounting for derivative instruments and hedging activities. The Company believes these embedded derivatives had no fair value at
December 31, 2013
and
2012
.
See Note 18 for the Company’s objectives in using derivative instruments and the effect of derivative instruments and related hedged items on the Company’s financial position, financial performance and cash flows.
F-12
LABORATORY CORPORATION OF AMERICA HOLDINGS AND SUBSIDIARIES
NOTES TO CONSOLIDATED FINANCIAL STATEMENTS
(Dollars and shares in millions, except per share data)
Fair Value of Financial Instruments
Fair value measurements for financial assets and liabilities are determined based on the assumptions that a market participant would use in pricing an asset or liability. A three-tiered fair value hierarchy draws distinctions between market participant assumptions based on (i) observable inputs such as quoted prices in active markets (Level 1), (ii) inputs other than quoted prices in active markets that are observable either directly or indirectly (Level 2) and (iii) unobservable inputs that require the Company to use present value and other valuation techniques in the determination of fair value (Level 3).
Research and Development
The Company expenses research and development costs as incurred.
New Accounting Pronouncements
In March 2013, the FASB issued a new accounting standard on foreign currency matters that clarifies the guidance of a parent company's accounting for the cumulative translation adjustment upon derecognition of certain subsidiaries or groups of assets within a foreign entity or of an investment in a foreign entity. Under this new standard, a parent company that ceases to have a controlling financial interest in a foreign subsidiary or group of assets within a foreign entity shall release any related cumulative translation adjustment into net income only if a sale or transfer results in complete or substantially complete liquidation of the foreign entity. This standard shall be applied prospectively and will become effective for the Company on January 1, 2014. The Company expects that the adoption of this standard will not have a material effect on its consolidated financial statements.
2. BUSINESS ACQUISITIONS
During the year ended
December 31, 2013
, the Company acquired various laboratories and related assets for approximately
$159.5
in cash (net of cash acquired). These acquisitions were made primarily to extend the Company's geographic reach in important market areas and/or enhance the Company's scientific differentiation and esoteric testing capabilities. The purchase consideration for these acquisitions has been allocated to the estimated fair market value of the net assets acquired, including approximately
$40.9
in identifiable intangible assets (primarily customer relationships and non-compete agreements) and a residual amount of goodwill of approximately
$127.0
. The purchase price allocations for certain of these acquisitions are preliminary and subject to adjustment based on changes in the fair value of working capital and other assets and liabilities on the effective acquisition dates and final valuation of intangible assets.
On July 31, 2012, the Company completed its acquisition of MEDTOX Scientific, Inc. ("MEDTOX"), a provider of high quality specialized laboratory testing services and on-site/point-of-collection testing (POCT) devices, for $
236.4
in cash, excluding transaction fees. The MEDTOX acquisition was made to extend the Company's specialty toxicology testing group and enhance the Company's scientific differentiation and esoteric testing capabilities.
The MEDTOX purchase consideration has been allocated to the estimated fair market value of the net assets acquired, including approximately $
78.0
in identifiable intangible assets (primarily non-tax deductible customer relationships, trade names and trademarks) with weighted-average useful lives of approximately
18 years
; $
33.2
in deferred tax liabilities (relating to identifiable intangible assets); and a residual amount of non-tax deductible goodwill of approximately $
154.2
.
During the year ended December 31, 2012, the Company also acquired various other laboratories and related assets for approximately
$95.8
in cash (net of cash acquired). These acquisitions were made primarily to extend the Company's geographic reach in important market areas and/or enhance the Company's scientific differentiation and esoteric testing capabilities.
In April 2011, the Company and
Orchid Cellmark Inc.
(“Orchid”) announced that they had entered into a definitive agreement and plan of merger under which the Company would acquire all of the outstanding shares of Orchid in a cash tender offer for
$2.80
per share for a total purchase price to stockholders and option holders of approximately
$85.4
. The tender offer and the merger were subject to customary closing conditions set forth in the agreement and plan of merger, including the acquisition in the tender offer of a majority of Orchid's fully diluted shares and the expiration or early termination of the waiting period under the Hart-Scott-Rodino Antitrust Improvements Act of 1976, as amended (“HSR Act”). The Company received lawsuits filed by putative classes of shareholders of Orchid in New Jersey and Delaware state courts and federal court in New Jersey alleging
F-13
LABORATORY CORPORATION OF AMERICA HOLDINGS AND SUBSIDIARIES
NOTES TO CONSOLIDATED FINANCIAL STATEMENTS
(Dollars and shares in millions, except per share data)
breaches of fiduciary duty and/or other violations of state law arising out of the proposed acquisition of Orchid. Both Orchid and the Company were named in the lawsuits. The lawsuits were subsequently dismissed.
On December 8, 2011, the Company announced that it had reached an agreement with the U.S. Federal Trade Commission allowing the Company to complete its acquisition of Orchid. Under the terms of the proposed consent decree that was accepted by the FTC for public comment, the Company was required to divest certain assets of Orchid's U.S. government paternity business following closing of the acquisition. On December 16, 2011, the Company sold those assets to DNA Diagnostics Center, a privately held provider of DNA paternity testing. The Company completed its acquisition of Orchid on
December 15, 2011
. It has recorded a
$2.8
non-deductible loss on the divestiture of Orchid's U.S. government paternity business in Other Income and Expense in the accompanying Consolidated Statements of Operations.
The Orchid purchase consideration has been allocated to the estimated fair market value of the net assets acquired, including approximately
$28.8
in identifiable intangible assets (primarily non-tax deductible customer relationships, trade names and trademarks) with weighted-average useful lives of approximately
12 years
;; $
9.1
in deferred tax liabilities (relating to identifiable intangible assets); net operating loss tax assets of approximately
$20.4
, which are expected to be realized over a period of
20
years; and a residual amount of non-tax deductible goodwill of approximately
$27.4
.
During the twelve months ended December 31, 2011, the Company also acquired various laboratories and related assets for approximately
$51.9
in cash (net of cash acquired). These acquisitions were made primarily to extend the Company's geographic reach in important market areas and/or enhance the Company's scientific differentiation and esoteric testing capabilities.
On
October 14, 2011
, the Company issued notice to a noncontrolling interest holder in its Other segment of its intent to purchase the holder's partnership units in accordance with the terms of the partnership agreement. On
November 28, 2011
, this purchase was completed for a total purchase price of
$147.9
(CN$
151.7
) as outlined in the partnership agreement (CN
$147.8
plus certain adjustments relating to cash distribution hold backs made to finance recent business acquisitions and capital expenditures). The purchase of these additional partnership units brought the Company's percentage interest owned to
98.2%
.
Contingent consideration liabilities associated with the Company's business acquisitions are recorded at fair value based upon the estimated probability assessment of the earn-out criteria. Changes in the fair value of contingent consideration liabilities are recognized in earnings until the arrangement is settled.
3. RESTRUCTURING AND OTHER SPECIAL CHARGES
During
2013
, the Company recorded net restructuring charges of
$21.8
. The charges were comprised of
$15.4
in severance and other personnel costs and
$9.5
in facility-related costs primarily associated with general integration activities. These charges were offset by the reversal of previously established reserves of
$0.7
in unused severance and
$2.4
in unused facility-related costs.
During
2012
, the Company recorded net restructuring charges of
$25.3
. The charges were comprised of
$16.2
in severance and other personnel costs and
$19.6
in facility-related costs primarily associated with the ongoing integration activities of Orchid and Integrated Genetics Division (formerly Genzyme Genetics) and costs associated with the previously announced termination of an executive vice president. These charges were offset by the reversal of previously established reserves of
$6.3
in unused severance and
$4.2
in unused facility related costs.
As part of the Clearstone integration, the Company also recorded a
6.9
loss on the disposal of one of its European subsidiaries in Other, net under Other income (expenses) during
2012
.
During
2011
, the Company recorded net restructuring charges of
$44.6
. Of this amount,
$27.4
related to severance and other personnel costs, and
$22.0
primarily related to facility-related costs associated with the ongoing integration of certain acquisitions including Genzyme Genetics and Westcliff. These charges were offset by restructuring credits of
$4.8
, resulting from the reversal of unused severance and facility closure liabilities. In addition, the Company recorded fixed assets impairment charges of
$18.9
primarily related to equipment, computer systems and leasehold improvements in closed facilities. The Company also recorded special charges of
$14.8
related to the write-off of certain assets and liabilities related to an investment made in prior years, along with a
$2.6
write-off of an uncollectible receivable from a past installment sale of one of the Company's lab operations.
F-14
LABORATORY CORPORATION OF AMERICA HOLDINGS AND SUBSIDIARIES
NOTES TO CONSOLIDATED FINANCIAL STATEMENTS
(Dollars and shares in millions, except per share data)
4. RESTRUCTURING RESERVES
The following represents the Company’s restructuring activities for the period indicated:
|
Severance
and Other
Employee
Costs
|
Lease
and Other
Facility
Costs
|
Total
|
|||||||||
|
Balance as of December 31, 2012
|
$
|
1.4
|
|
$
|
26.2
|
|
$
|
27.6
|
|
||
|
Restructuring charges
|
15.4
|
|
9.5
|
|
24.9
|
|
|||||
|
Reduction of prior restructuring accruals
|
(0.6
|
)
|
(2.5
|
)
|
(3.1
|
)
|
|||||
|
Cash payments and other adjustments
|
(15.4
|
)
|
(8.3
|
)
|
(23.7
|
)
|
|||||
|
Balance as of December 31, 2013
|
$
|
0.8
|
|
$
|
24.9
|
|
$
|
25.7
|
|
||
|
Current
|
|
|
|
|
$
|
9.3
|
|
||||
|
Non-current
|
|
|
|
|
16.4
|
|
|||||
|
|
|
|
|
|
$
|
25.7
|
|
||||
The non-current portion of the restructuring liabilities is expected to be paid out over
7
years.
5. JOINT VENTURE PARTNERSHIPS AND EQUITY METHOD INVESTMENTS
At
December 31, 2013
the Company had investments in the following unconsolidated joint venture partnerships and equity method investments:
|
Locations
|
Net Investment
|
Interest Owned
|
||||
|
Joint Venture Partnerships
:
|
|
|
||||
|
Milwaukee, Wisconsin
|
$
|
15.5
|
|
50.00
|
%
|
|
|
Alberta, Canada
|
58.5
|
|
43.37
|
%
|
||
|
Florence, South Carolina
|
10.0
|
|
49.00
|
%
|
||
|
Equity Method Investments
:
|
||||||
|
Various
|
4.5
|
|
various
|
|
||
The joint venture agreements that govern the conduct of business of these partnerships mandates unanimous agreement between partners on all major business decisions as well as providing other participating rights to each partner. The equity method investments represent the Company’s purchase of shares in clinical diagnostic companies. The investments are accounted for under the equity method of accounting as the Company does not have control of these investments. The Company has no material obligations or guarantees to, or in support of, these unconsolidated investments and their operations.
Condensed unconsolidated financial information for joint venture partnerships and equity method investments is shown in the following table.
F-15
LABORATORY CORPORATION OF AMERICA HOLDINGS AND SUBSIDIARIES
NOTES TO CONSOLIDATED FINANCIAL STATEMENTS
(Dollars and shares in millions, except per share data)
|
As of December 31
:
|
2013
|
2012
|
|||||
|
Current assets
|
$
|
43.4
|
|
$
|
36.8
|
|
|
|
Other assets
|
40.9
|
|
39.9
|
|
|||
|
Total assets
|
$
|
84.3
|
|
$
|
76.7
|
|
|
|
Current liabilities
|
$
|
21.9
|
|
$
|
19.6
|
|
|
|
Other liabilities
|
1.3
|
|
1.7
|
|
|||
|
Total liabilities
|
23.2
|
|
21.3
|
|
|||
|
Partners' equity
|
61.1
|
|
55.4
|
|
|||
|
Total liabilities and partners’ equity
|
$
|
84.3
|
|
$
|
76.7
|
|
|
|
For the period January 1 - December 31
:
|
2013
|
2012
|
2011
|
||||||||
|
Net sales
|
$
|
255.2
|
|
$
|
249.0
|
|
$
|
247.4
|
|
||
|
Gross profit
|
84.1
|
|
86.4
|
|
73.1
|
|
|||||
|
Net earnings
|
37.7
|
|
42.2
|
|
28.0
|
|
|||||
The Company’s recorded investment in the Alberta joint venture partnership at
December 31, 2013
includes
$45.6
of value assigned to the partnership’s Canadian license (with an indefinite life and deductible for tax) to conduct diagnostic testing services in the province.
6. ACCOUNTS RECEIVABLE, NET
|
December 31,
2013 |
December 31,
2012 |
||||||
|
Gross accounts receivable
|
$
|
983.0
|
|
$
|
910.0
|
|
|
|
Less allowance for doubtful accounts
|
(198.3
|
)
|
(191.5
|
)
|
|||
|
|
$
|
784.7
|
|
$
|
718.5
|
|
|
The provision for doubtful accounts was
$254.8
,
$246.0
and
$255.1
in
2013
,
2012
and
2011
respectively.
7. PROPERTY, PLANT AND EQUIPMENT, NET
|
December 31, 2013
|
December 31, 2012
|
||||||
|
Land
|
$
|
29.0
|
|
$
|
24.9
|
|
|
|
Buildings and building improvements
|
188.8
|
|
138.8
|
|
|||
|
Machinery and equipment
|
712.1
|
|
655.5
|
|
|||
|
Software
|
404.9
|
|
348.5
|
|
|||
|
Leasehold improvements
|
196.5
|
|
193.3
|
|
|||
|
Furniture and fixtures
|
58.1
|
|
58.6
|
|
|||
|
Construction in progress
|
127.9
|
|
154.6
|
|
|||
|
Equipment and real estate under capital leases
|
14.6
|
|
1.5
|
|
|||
|
|
1,731.9
|
|
1,575.7
|
|
|||
|
Less accumulated depreciation and amortization of capital lease assets
|
(1,024.5
|
)
|
(944.9
|
)
|
|||
|
|
$
|
707.4
|
|
$
|
630.8
|
|
|
Depreciation expense and amortization of property, plant and equipment was
$144.7
,
$141.1
and
$141.5
for
2013
,
2012
and
2011
, respectively, including software depreciation of
$39.3
,
$35.1
, and
$34.0
for
2013
,
2012
and
2011
, respectively.
F-16
LABORATORY CORPORATION OF AMERICA HOLDINGS AND SUBSIDIARIES
NOTES TO CONSOLIDATED FINANCIAL STATEMENTS
(Dollars and shares in millions, except per share data)
8. GOODWILL AND INTANGIBLE ASSETS
The changes in the carrying amount of goodwill (net of accumulated amortization) for the years ended
December 31, 2013
and
2012
are as follows:
|
Clinical Diagnostics Laboratory Segment
|
Other Segment
|
Total
|
|||||||||||||||||||||
|
December 31,
2013 |
December 31, 2012
|
December 31,
2013 |
December 31, 2012
|
December 31,
2013 |
December 31, 2012
|
||||||||||||||||||
|
Balance as of January 1
|
$
|
2,857.1
|
|
$
|
2,643.5
|
|
$
|
44.6
|
|
$
|
38.3
|
|
$
|
2,901.7
|
|
$
|
2,681.8
|
|
|||||
|
Goodwill acquired during the period
|
107.5
|
|
219.1
|
|
19.5
|
|
5.4
|
|
127.0
|
|
224.5
|
|
|||||||||||
|
Adjustments to goodwill
|
(4.4
|
)
|
(5.5
|
)
|
(1.5
|
)
|
0.9
|
|
(5.9
|
)
|
(4.6
|
)
|
|||||||||||
|
Balance at end of period
|
$
|
2,960.2
|
|
$
|
2,857.1
|
|
$
|
62.6
|
|
$
|
44.6
|
|
$
|
3,022.8
|
|
$
|
2,901.7
|
|
|||||
The components of identifiable intangible assets are as follows:
|
|
December 31, 2013
|
December 31, 2012
|
|||||||||||||||||||||
|
Gross
Carrying
Amount
|
Accumulated
Amortization
|
Net
Carrying
Amount
|
Gross
Carrying
Amount
|
Accumulated
Amortization
|
Net
Carrying
Amount
|
||||||||||||||||||
|
Customer relationships
|
$
|
1,327.0
|
|
$
|
(545.1
|
)
|
$
|
781.9
|
|
$
|
1,296.1
|
|
$
|
(483.3
|
)
|
$
|
812.8
|
|
|||||
|
Patents, licenses and technology
|
116.2
|
|
(85.4
|
)
|
30.8
|
|
117.2
|
|
(76.2
|
)
|
41.0
|
|
|||||||||||
|
Non-compete agreements
|
41.6
|
|
(25.3
|
)
|
16.3
|
|
32.3
|
|
(19.6
|
)
|
12.7
|
|
|||||||||||
|
Trade names
|
131.4
|
|
(83.0
|
)
|
48.4
|
|
131.3
|
|
(73.4
|
)
|
57.9
|
|
|||||||||||
|
Canadian licenses
|
694.6
|
|
—
|
|
694.6
|
|
743.3
|
|
—
|
|
743.3
|
|
|||||||||||
|
|
$
|
2,310.8
|
|
$
|
(738.8
|
)
|
$
|
1,572.0
|
|
$
|
2,320.2
|
|
$
|
(652.5
|
)
|
$
|
1,667.7
|
|
|||||
A summary of amortizable intangible assets acquired during
2013
, and their respective weighted average amortization periods are as follows:
|
Amount
|
Weighted
Average
Amortization
Period
|
||||
|
Customer relationships
|
$
|
31.6
|
|
16.2
|
|
|
Non-compete agreements
|
9.3
|
|
5.0
|
||
|
|
$
|
40.9
|
|
13.7
|
|
Amortization of intangible assets was
$81.7
,
$86.3
and
$85.8
in
2013
,
2012
and
2011
, respectively. During 2012, the Company recorded
$6.2
accelerated amortization expense relating to the termination of a technology licensing agreement. Amortization expense of intangible assets is estimated to be
$84.7
in fiscal
2014
,
$81.3
in fiscal
2015
,
$75.9
in fiscal
2016
,
$68.7
in fiscal
2017
,
$58.4
in fiscal
2018
, and
$504.7
thereafter.
The Company paid
$0.0
,
$2.5
and
$0.0
in
2013
,
2012
and
2011
for certain exclusive and non-exclusive licensing rights to diagnostic testing technology. These amounts are being amortized over the life of the licensing agreements.
F-17
LABORATORY CORPORATION OF AMERICA HOLDINGS AND SUBSIDIARIES
NOTES TO CONSOLIDATED FINANCIAL STATEMENTS
(Dollars and shares in millions, except per share data)
9. ACCRUED EXPENSES AND OTHER
|
December 31, 2013
|
December 31, 2012
|
||||||
|
Employee compensation and benefits
|
$
|
166.0
|
|
$
|
158.0
|
|
|
|
Self-insurance reserves
|
33.3
|
|
34.2
|
|
|||
|
Accrued taxes payable
|
24.2
|
|
24.0
|
|
|||
|
Royalty and license fees payable
|
8.1
|
|
13.8
|
|
|||
|
Restructuring reserves
|
9.3
|
|
8.4
|
|
|||
|
Acquisition related reserves
|
14.2
|
|
11.5
|
|
|||
|
Interest payable
|
19.7
|
|
24.0
|
|
|||
|
Other
|
35.2
|
|
37.7
|
|
|||
|
|
$
|
310.0
|
|
$
|
311.6
|
|
|
10. OTHER LIABILITIES
|
December 31, 2013
|
December 31, 2012
|
||||||
|
Post-retirement benefit obligation
|
$
|
60.6
|
|
$
|
60.7
|
|
|
|
Defined benefit plan obligation
|
80.0
|
|
122.5
|
|
|||
|
Restructuring reserves
|
16.4
|
|
19.2
|
|
|||
|
Self-insurance reserves
|
31.6
|
|
44.5
|
|
|||
|
Acquisition related reserves
|
7.2
|
|
10.2
|
|
|||
|
Deferred revenue
|
4.0
|
|
5.4
|
|
|||
|
Other
|
66.7
|
|
44.9
|
|
|||
|
$
|
266.5
|
|
$
|
307.4
|
|
||
11. DEBT
Short-term borrowings and current portion of long-term debt at
December 31, 2013
and
2012
consisted of the following:
|
December 31, 2013
|
December 31, 2012
|
||||||
|
Zero-coupon convertible subordinated notes
|
$
|
110.8
|
|
$
|
130.0
|
|
|
|
5.5% Senior Notes due 2013
|
—
|
|
350.0
|
|
|||
|
Capital lease obligation
|
0.5
|
|
—
|
|
|||
|
Total short-term borrowings and current portion of long-term debt
|
$
|
111.3
|
|
$
|
480.0
|
|
|
Long-term debt at
December 31, 2013
and
2012
consisted of the following:
F-18
LABORATORY CORPORATION OF AMERICA HOLDINGS AND SUBSIDIARIES
NOTES TO CONSOLIDATED FINANCIAL STATEMENTS
(Dollars and shares in millions, except per share data)
|
December 31, 2013
|
December 31, 2012
|
||||||
|
5.625% Senior Notes due 2015
|
$
|
250.0
|
|
$
|
250.0
|
|
|
|
3.125% Senior Notes due 2016
|
325.0
|
|
325.0
|
|
|||
|
2.20% Senior Notes due 2017
|
500.0
|
|
500.0
|
|
|||
|
2.50% Senior Notes due 2018
|
400.0
|
|
—
|
|
|||
|
4.625% Senior Notes due 2020
|
600.0
|
|
600.0
|
|
|||
|
3.75% Senior Notes due 2022
|
500.0
|
|
500.0
|
|
|||
|
4.00% Senior Notes due 2023
|
300.0
|
|
—
|
|
|||
|
Capital leases
|
14.1
|
|
—
|
|
|||
|
Total long-term debt
|
$
|
2,889.1
|
|
$
|
2,175.0
|
|
|
Credit Facilities
On
December 21, 2011
, the Company entered into a Credit Agreement ("the "Credit Agreement") providing for a
five
-year
$1,000.0
senior unsecured revolving credit facility (the “Revolving Credit Facility”) with Bank of America, N.A., acting as Administrative Agent, Barclays Capital as Syndication Agent, and a group of financial institutions as lending parties. As part of the Revolving Credit Facility, the Company repaid all of the outstanding principal balances of
$318.8
on its existing term loan facility and
$235.0
on its existing revolving credit facility. In conjunction with the repayment and cancellation of its old credit facility, the Company recorded approximately
$1.0
of remaining unamortized debt costs as interest expense in the accompanying Consolidated Statements of Operations for the year ended December 31, 2011.
There were no balances outstanding on the Company's Revolving Credit Facility at
December 31, 2013
or
December 31, 2012
. The Revolving Credit Facility
bears interest at varying rates based upon a base rate or LIBOR plus (in each case) a percentage based on the Company's debt rating with Standard & Poor's and Moody's Rating Services
.
The Revolving Credit Facility is available for general corporate purposes, including working capital, capital expenditures, acquisitions, funding of share repurchases and other restricted payments permitted under the Credit Agreement.
The Credit Agreement also contains limitations on aggregate subsidiary indebtedness and a debt covenant that requires that the Company maintain on the last day of any period of four consecutive fiscal quarters, in each case taken as one accounting period, a ratio of total debt to consolidated EBITDA of not more than 3.0 to 1.0.
The Company was in compliance with all covenants in the Credit Agreement at
December 31, 2013
. As of
December 31, 2013
, the ratio of total debt to consolidated EBITDA was
2.4
.
As of
December 31, 2013
, the effective interest rate on the Revolving Credit Facility was
1.1%
.
Zero-Coupon Convertible Subordinated Notes
The Company had
$128.8
and
$154.3
aggregate principal amount at maturity of zero-coupon convertible subordinated notes (the “notes”) due
2021
outstanding at
December 31, 2013
and
2012
, respectively. The notes, which are subordinate to the Company’s bank debt, were sold at an issue price of
$671.65
per
$1,000
principal amount at maturity (representing a yield to maturity of
2.0%
per year). Each one thousand dollar principal amount at maturity of the notes is convertible into
13.4108
shares of the Company’s common stock, subject to adjustment in certain circumstances, if one of the following conditions occurs:
|
1)
|
If the sales price of the Company’s common stock for at least
20
trading days in a period of
30
consecutive trading days ending on the last trading day of the preceding quarter reaches specified thresholds (beginning at
120%
and declining
0.1282%
per quarter until it reaches approximately
110%
for the quarter beginning
July 1, 2021
of the accreted conversion price per share of common stock on the last day of the preceding quarter). The accreted conversion price per share will equal the issue price of a note plus the accrued original issue discount and any accrued contingent additional principal, divided by the number of shares of common stock issuable upon conversion of a note on that day. The conversion trigger price for the fourth quarter of
2013
was
$72.55
.
|
|
2)
|
If the credit rating assigned to the notes by Standard & Poor’s Ratings Services is at or below BB-.
|
|
3)
|
If the notes are called for redemption.
|
F-19
LABORATORY CORPORATION OF AMERICA HOLDINGS AND SUBSIDIARIES
NOTES TO CONSOLIDATED FINANCIAL STATEMENTS
(Dollars and shares in millions, except per share data)
|
4)
|
If specified corporate transactions have occurred (such as if the Company is party to a consolidation, merger or binding share exchange or a transfer of all or substantially all of its assets).
|
The Company may redeem for cash all or a portion of the notes at any time at specified redemption prices per one thousand dollar principal amount at maturity of the notes.
The Company has registered the notes and the shares of common stock issuable upon conversion of the notes with the Securities and Exchange Commission.
During
2013
and
2012
, the Company settled notices to convert $
25.5
and $
9.8
aggregate principal amount at maturity of its zero-coupon subordinated notes with a conversion value of $
31.8
and $
12.0
, respectively. The total cash used for these settlements was $
21.5
and $
8.2
and the Company also issued
0.1
and
0.0
additional shares of common stock, respectively. As a result of these conversions, in
2013
and
2012
the Company also reversed approximately $
3.4
and $
0.6
, respectively, of deferred tax liability to reflect the tax benefit realized upon issuance of the shares.
On
September 12, 2013
, the Company announced that for the period of
September 12, 2013 to March 11, 2014
, the zero-coupon subordinated notes will accrue contingent cash interest at a rate of
no less than 0.125% of the average market price of a zero-coupon subordinated note for the five trading days ended September 6, 2013, in addition to the continued accrual of the original issue discount
.
On
January 2, 2014
, the Company announced that its zero-coupon subordinated notes may be converted into cash and common stock at the conversion rate of
13.4108
per
$1,000
principal amount at maturity of the notes, subject to the terms of the zero-coupon subordinated notes and the Indenture, dated as of
October 24, 2006
between the Company and The Bank of New York Mellon, as trustee and conversion agent. In order to exercise the option to convert all or a portion of the zero-coupon subordinated notes, holders are required to validly surrender their zero-coupon subordinated notes at any time during the calendar quarter beginning
January 1, 2014
, through the close of business on the last business day of the calendar quarter, which is 5:00 p.m., New York City time, on Monday,
March 31, 2014
. If notices of conversion are received, the Company plans to settle the cash portion of the conversion obligation with cash on hand and/or borrowings under the revolving credit facility.
Senior Notes
On
November 1, 2013
, the Company issued
$700.0
in new senior notes pursuant to the Company’s effective shelf registration on Form S-3. The new senior notes consisted of
$400.0
aggregate principal amount of
2.50%
Senior Notes due 2018 and
$300.0
aggregate principal amount of
4.00%
Senior Notes due 2023. The net proceeds were used to repay all of the outstanding borrowings under the Company’s Revolving Credit Facility and for general corporate purposes.
The Senior Notes due 2018 and Senior Notes due 2023 bear interest at the rate of
2.50%
per annum and
4.00%
per annum, respectively, payable semi-annually on
November 1
and
May 1
of each year, commencing on
May 1, 2014
.
During the third quarter of 2013, the Company entered into two fixed-to-variable interest rate swap agreements for the
4.625%
senior notes due 2020 with an aggregate notional amount of
$600.0
and variable interest rates based on one-month LIBOR plus
2.298%
to hedge against changes in the fair value of a portion of the Company's long term debt. These derivative financial instruments are accounted for as fair value hedges of the senior notes due 2020. These interest rate swaps are included in other long term assets or liabilities, as applicable, and added to the value of the senior notes, with an aggregate fair value of
$0.0
at
December 31, 2013
.
On
August 23, 2012
, the Company issued $
1,000.0
in new senior notes pursuant to the Company's effective shelf registration statement on Form S-3. The new senior notes consisted of $
500.0
aggregate principal amount of
2.20%
Senior Notes due
2017
and $
500.0
aggregate principal amount of
3.75%
Senior Notes due
2022
. The net proceeds were used to repay $
625.0
of the outstanding borrowings under the Company's Revolving Credit Facility. The remaining proceeds were available for other general corporate purposes.
The Senior Notes due
2017
and Senior Notes due
2022
bear interest at the rate of
2.20%
per annum and
3.75%
per annum, respectively, payable semi-annually on
February 23
and
August 23
of each year, commencing
February 23, 2013
.
On
October 28, 2010
, in conjunction with the acquisition of Genzyme Genetics, the Company entered into a
$925.0
Bridge Term Loan Credit Agreement, among the Company, the lenders named therein and Citibank, N.A., as administrative agent (the
F-20
LABORATORY CORPORATION OF AMERICA HOLDINGS AND SUBSIDIARIES
NOTES TO CONSOLIDATED FINANCIAL STATEMENTS
(Dollars and shares in millions, except per share data)
“Bridge Facility”). The Company replaced and terminated the Bridge Facility in
November 2010
by making an offering in the debt capital markets. On
November 19, 2010
, the Company sold
$925.0
in debt securities, consisting of
$325.0
aggregate principal amount of
3.125%
Senior Notes due
May 15, 2016
and
$600.0
aggregate principal amount of
4.625%
Senior Notes due
November 15, 2020
. Beginning on
May 15, 2011
, interest on the Senior Notes due
2016
and
2020
is payable semi-annually on
May 15,
and
November 15,
. On
December 1, 2010
, the acquisition of Genzyme Genetics was funded by the net proceeds from the issuance of these Notes (
$915.4
) and with cash on hand.
The Senior Notes due
2015
bear interest at the rate of
5.625%
per annum from
December 14, 2005
, payable
semi-annually
on
June 15
and
December 15
.
The scheduled payments of long term debt and future minimum lease payments for capital leases at the end of 2013 are summarized as follows:
|
Notes and Other
|
Capital Leases
|
Total
|
|||||||||
|
2014
|
$
|
110.8
|
|
$
|
2.4
|
|
$
|
113.2
|
|
||
|
2015
|
250.0
|
|
2.4
|
|
252.4
|
|
|||||
|
2016
|
325.0
|
|
2.5
|
|
327.5
|
|
|||||
|
2017
|
500.0
|
|
2.5
|
|
502.5
|
|
|||||
|
2018
|
400.0
|
|
2.5
|
|
402.5
|
|
|||||
|
Thereafter
|
1,400.0
|
|
17.0
|
|
1,417.0
|
|
|||||
|
2,985.8
|
|
29.3
|
|
3,015.1
|
|
||||||
|
Less amounts representing interest
|
—
|
|
(14.7
|
)
|
(14.7
|
)
|
|||||
|
Total long-term debt
|
2,985.8
|
|
14.6
|
|
3,000.4
|
|
|||||
|
Less current portion
|
(110.8
|
)
|
(0.5
|
)
|
(111.3
|
)
|
|||||
|
Long-term debt, due beyond one year
|
$
|
2,875.0
|
|
$
|
14.1
|
|
$
|
2,889.1
|
|
||
12. PREFERRED STOCK AND COMMON SHAREHOLDERS’ EQUITY
The Company is authorized to issue up to
265.0
shares of common stock, par value
$0.10
per share. The Company’s treasury shares are recorded at aggregate cost. Common shares issued and outstanding are summarized in the following table:
|
|
2013
|
2012
|
|||
|
Issued
|
108.1
|
|
115.8
|
|
|
|
In treasury
|
(22.4
|
)
|
(22.3
|
)
|
|
|
Outstanding
|
85.7
|
|
93.5
|
|
|
The Company is authorized to issue up to
30.0
shares of preferred stock, par value
$0.10
per share. There were no preferred shares outstanding as of
December 31, 2013
and
2012
.
The changes in common shares issued and held in treasury are summarized below:
F-21
LABORATORY CORPORATION OF AMERICA HOLDINGS AND SUBSIDIARIES
NOTES TO CONSOLIDATED FINANCIAL STATEMENTS
(Dollars and shares in millions, except per share data)
|
Common shares issued
|
|
|
|
|||||
|
|
2013
|
2012
|
2011
|
|||||
|
Common stock issued at January 1
|
115.8
|
|
120.0
|
|
124.5
|
|
||
|
Common stock issued under employee stock plans
|
2.6
|
|
1.6
|
|
1.9
|
|
||
|
Common stock issued upon conversion of zero-coupon subordinated notes
|
0.1
|
|
—
|
|
1.0
|
|
||
|
Retirement of common stock
|
(10.4
|
)
|
(5.8
|
)
|
(7.4
|
)
|
||
|
Common stock issued at December 31
|
108.1
|
|
115.8
|
|
120.0
|
|
||
|
Common shares held in treasury
|
|
|
|
|||||
|
|
2013
|
2012
|
2011
|
|||||
|
Common shares held in treasury at January 1
|
22.3
|
|
22.2
|
|
22.1
|
|
||
|
Surrender of restricted stock and performance share awards
|
0.1
|
|
0.1
|
|
0.1
|
|
||
|
Common shares held in treasury at December 31
|
22.4
|
|
22.3
|
|
22.2
|
|
||
Share Repurchase Program
During
2013
, the Company purchased
10.4
shares of its common stock at a total cost of
$1,015.6
. As of
December 31, 2013
, the Company had outstanding authorization from the Board of Directors to purchase
$1,058.5
of Company common stock.
Accumulated Other Comprehensive Earnings
The components of accumulated other comprehensive earnings are as follows:
|
Foreign
Currency
Translation
Adjustments
|
Net
Benefit
Plan
Adjustments
|
Investment Adjustments
|
Interest
Rate
Swap
Adjustments
|
Accumulated
Other
Comprehensive
Earnings
|
|||||||||||||||
|
Balance at December 31, 2010
|
$
|
152.8
|
|
$
|
(62.9
|
)
|
—
|
|
$
|
(1.4
|
)
|
$
|
88.5
|
|
|||||
|
Current year adjustments
|
(13.2
|
)
|
(65.3
|
)
|
—
|
|
2.4
|
|
(76.1
|
)
|
|||||||||
|
Amounts reclassified from accumulated other comprehensive income
(a)
|
—
|
|
7.8
|
|
—
|
|
—
|
|
7.8
|
|
|||||||||
|
Tax effect of adjustments
|
3.9
|
|
22.4
|
|
—
|
|
(1.0
|
)
|
25.3
|
|
|||||||||
|
Balance at December 31, 2011
|
143.5
|
|
(98.0
|
)
|
—
|
|
—
|
|
45.5
|
|
|||||||||
|
Current year adjustments
|
31.3
|
|
(4.8
|
)
|
—
|
|
—
|
|
26.5
|
|
|||||||||
|
Amounts reclassified from accumulated other comprehensive income
(a)
|
—
|
|
12.1
|
|
—
|
|
—
|
|
12.1
|
|
|||||||||
|
Tax effect of adjustments
|
(11.9
|
)
|
(2.8
|
)
|
—
|
|
—
|
|
(14.7
|
)
|
|||||||||
|
Balance at December 31, 2012
|
162.9
|
|
(93.5
|
)
|
—
|
|
—
|
|
69.4
|
|
|||||||||
|
Current year adjustments
|
(63.2
|
)
|
31.6
|
|
16.4
|
|
—
|
|
(15.2
|
)
|
|||||||||
|
Amounts reclassified from accumulated other comprehensive income
(a)
|
—
|
|
10.5
|
|
—
|
|
—
|
|
10.5
|
|
|||||||||
|
Tax effect of adjustments
|
23.5
|
|
(15.7
|
)
|
(6.3
|
)
|
—
|
|
1.5
|
|
|||||||||
|
Balance at December 31, 2013
|
$
|
123.2
|
|
$
|
(67.1
|
)
|
$
|
10.1
|
|
$
|
—
|
|
$
|
66.2
|
|
||||
(a)
The amortization of prior service cost is included in the computation of net periodic benefit cost. Refer to Note 16 Pension and Postretirement Plans for additional information regarding the Company's net periodic benefit cost.
F-22
LABORATORY CORPORATION OF AMERICA HOLDINGS AND SUBSIDIARIES
NOTES TO CONSOLIDATED FINANCIAL STATEMENTS
(Dollars and shares in millions, except per share data)
13. INCOME TAXES
The sources of income before taxes, classified between domestic and foreign entities are as follows:
|
Pre-tax income
|
2013
|
2012
|
2011
|
||||||||
|
Domestic
|
$
|
844.2
|
|
$
|
909.0
|
|
$
|
834.0
|
|
||
|
Foreign
|
71.4
|
|
35.2
|
|
32.1
|
|
|||||
|
Total pre-tax income
|
$
|
915.6
|
|
$
|
944.2
|
|
$
|
866.1
|
|
||
The provisions for income taxes in the accompanying consolidated statements of operations consist of the following:
|
|
Years Ended December 31,
|
||||||||||
|
|
2013
|
2012
|
2011
|
||||||||
|
Current:
|
|
|
|
||||||||
|
Federal
|
$
|
231.6
|
|
$
|
254.1
|
|
$
|
269.7
|
|
||
|
State
|
29.9
|
|
35.1
|
|
54.3
|
|
|||||
|
Foreign
|
22.5
|
|
16.9
|
|
6.8
|
|
|||||
|
|
$
|
284.0
|
|
$
|
306.1
|
|
$
|
330.8
|
|
||
|
Deferred:
|
|
|
|
|
|
|
|||||
|
Federal
|
$
|
55.2
|
|
$
|
58.3
|
|
$
|
5.0
|
|
||
|
State
|
6.1
|
|
0.4
|
|
(4.4
|
)
|
|||||
|
Foreign
|
(5.1
|
)
|
(5.4
|
)
|
1.6
|
|
|||||
|
|
56.2
|
|
53.3
|
|
2.2
|
|
|||||
|
|
$
|
340.2
|
|
$
|
359.4
|
|
$
|
333.0
|
|
||
A portion of the tax benefit associated with option exercises from stock plans reducing taxes currently payable are recorded through additional paid-in capital. The benefits recorded through additional paid-in capital are approximately
$10.6
,
$8.4
and
$11.0
in
2013
,
2012
and
2011
, respectively.
The effective tax rates on earnings before income taxes are reconciled to statutory federal income tax rates as follows:
|
|
Years Ended December 31,
|
|||||||
|
|
2013
|
2012
|
2011
|
|||||
|
Statutory federal rate
|
35.0
|
%
|
35.0
|
%
|
35.0
|
%
|
||
|
State and local income taxes, net of federal income tax effect
|
2.6
|
|
2.4
|
|
3.7
|
|
||
|
Other
|
(0.4
|
)
|
0.7
|
|
(0.3
|
)
|
||
|
Effective rate
|
37.2
|
%
|
38.1
|
%
|
38.4
|
%
|
||
The effective rate for 2013 was favorably impacted by the release of the capital loss valuation allowance and recording two years of the R&D tax credit. The American Taxpayer Relief Act of 2012 was enacted in early 2013 and reinstated the R&D tax credit for 2012 and extended the credit for calendar year 2013.
The effective tax rate for
2012
was favorably impacted by a decrease in the reserve for unrecognized income tax benefits compared to
2011
, partially offset by an increase in tax as a result of the Company's increase in ownership percentage of its Ontario subsidiary. The effective tax rate for 2011 was negatively impacted by an increase in the reserve for unrecognized income tax benefits, the divestiture of certain Orchid paternity contracts, and foreign losses not tax effected.
F-23
LABORATORY CORPORATION OF AMERICA HOLDINGS AND SUBSIDIARIES
NOTES TO CONSOLIDATED FINANCIAL STATEMENTS
(Dollars and shares in millions, except per share data)
The tax effects of temporary differences that give rise to significant portions of the deferred tax assets and deferred tax liabilities are as follows:
|
December 31, 2013
|
December 31, 2012
|
||||||
|
Deferred tax assets:
|
|
|
|||||
|
Accounts receivable
|
$
|
20.2
|
|
$
|
25.0
|
|
|
|
Employee compensation and benefits
|
83.4
|
|
114.4
|
|
|||
|
Self insurance reserves
|
17.8
|
|
17.0
|
|
|||
|
Postretirement benefit obligation
|
23.2
|
|
23.3
|
|
|||
|
Acquisition and restructuring reserves
|
20.6
|
|
18.5
|
|
|||
|
Tax loss carryforwards
|
58.0
|
|
66.3
|
|
|||
|
Other
|
3.8
|
|
2.1
|
|
|||
|
|
227.0
|
|
266.6
|
|
|||
|
Less: valuation allowance
|
(16.5
|
)
|
(18.4
|
)
|
|||
|
Net deferred tax assets
|
$
|
210.5
|
|
$
|
248.2
|
|
|
|
Deferred tax liabilities:
|
|
|
|
|
|||
|
Deferred earnings
|
$
|
(15.1
|
)
|
$
|
(17.9
|
)
|
|
|
Intangible assets
|
(463.4
|
)
|
(434.1
|
)
|
|||
|
Property, plant and equipment
|
(86.4
|
)
|
(73.8
|
)
|
|||
|
Zero-coupon subordinated notes
|
(106.7
|
)
|
(110.5
|
)
|
|||
|
Currency translation adjustment
|
(77.9
|
)
|
(101.0
|
)
|
|||
|
Total gross deferred tax liabilities
|
(749.5
|
)
|
(737.3
|
)
|
|||
|
Net deferred tax liabilities
|
$
|
(539.0
|
)
|
$
|
(489.1
|
)
|
|
The valuation allowance decreased from
$18.4
in
2012
to
$16.5
in
2013
. The decrease in the valuation allowance is primarily due to a current year capital gain resulting from the disposition of a minority investment. A capital loss carryover with a full valuation allowance was released to offset substantially all of the 2013 capital gain income.
The Company has foreign tax loss carryovers of
$11.8
with a
full valuation allowance
. Most of the foreign losses have an indefinite carryover. The Company has federal tax loss carryovers of approximately
$44.2
expiring periodically through 2031
. The utilization of the tax loss carryovers is limited due to change of ownership rules. However, at this time the Company expects to fully utilize substantially all federal tax loss carryovers. In addition to the net operating losses, the Company has a foreign capital loss carryover of
$1.9
. The loss has an indefinite life and has a full valuation allowance.
The gross unrecognized income tax benefits were
$25.6
and
$36.4
at
December 31, 2013
and
2012
, respectively. It is anticipated that the amount of the unrecognized income tax benefits will change within the next twelve months; however, these changes are not expected to have a significant impact on the results of operations, cash flows or the financial position of the Company.
The Company recognizes interest and penalties related to unrecognized income tax benefits in income tax expense. Accrued interest and penalties related to uncertain tax positions totaled
$9.3
and
$9.8
as of
December 31, 2013
and
2012
, respectively. During the years ended
December 31, 2013
,
2012
and
2011
, the Company recognized
$2.4
,
$3.0
and
$3.5
, respectively, in interest and penalties expense, which was offset by a benefit of
$2.9
,
$3.9
and
$4.9
, respectively.
The following table shows a reconciliation of the unrecognized income tax benefits from uncertain tax positions for the years ended
December 31, 2013
,
2012
and
2011
:
F-24
LABORATORY CORPORATION OF AMERICA HOLDINGS AND SUBSIDIARIES
NOTES TO CONSOLIDATED FINANCIAL STATEMENTS
(Dollars and shares in millions, except per share data)
|
|
2013
|
2012
|
2011
|
||||||||
|
Balance as of January 1
|
$
|
36.4
|
|
$
|
52.7
|
|
$
|
53.6
|
|
||
|
Increase in reserve for tax positions taken in the current year
|
1.9
|
|
0.4
|
|
8.6
|
|
|||||
|
Increase (decrease) in reserve for tax positions taken in a prior period
|
—
|
|
(8.0
|
)
|
—
|
|
|||||
|
Decrease in reserve as a result of settlements reached with tax authorities
|
(4.4
|
)
|
(0.1
|
)
|
(0.2
|
)
|
|||||
|
Decrease in reserve as a result of lapses in the statute of limitations
|
(8.3
|
)
|
(8.6
|
)
|
(9.3
|
)
|
|||||
|
Balance as of December 31
|
$
|
25.6
|
|
$
|
36.4
|
|
$
|
52.7
|
|
||
As of
December 31, 2013
and
2012
,
$25.6
and
$37.1
, respectively, is the approximate amount of unrecognized income tax benefits that, if recognized, would favorably affect the effective income tax rate in any future periods.
The Company has substantially concluded all U.S. federal income tax matters for years through 2011. Substantially all material state and local, and foreign income tax matters have been concluded through 2008 and 2001, respectively.
The Internal Revenue Service concluded the examination of the Company's 2010 and 2011 income tax returns during 2013. The Company has various state income tax examinations ongoing throughout the year. Canada Revenue Agency is conducting an audit of the 2009 and 2010 Canadian income tax return. The Company believes adequate provisions have been recorded related to all open tax years.
Substantially all of the profitable foreign earnings are repatriated on an annual basis and U.S. income taxes have been provided accordingly. The unremitted foreign earnings as of December 31, 2013 are approximately
$17.7
. If repatriated to the U.S., the incremental U.S. tax, net of any underlying foreign tax credit, would have increased the Company's overall income tax by approximately
$0.5
.
14. STOCK COMPENSATION PLANS
Stock Incentive Plans
There are currently
10.2
shares authorized for issuance under the Laboratory Corporation of America Holdings 2012 Omnibus Incentive Plan and at
December 31, 2013
there were
6.7
additional shares available for grant under the Plan. This Plan was approved by shareholders at the 2012 annual meeting.
Stock Options
The following table summarizes grants of non-qualified options made by the Company to officers, key employees, and non-employee directors under all plans. Stock options are generally granted at an exercise price equal to or greater than the fair market price per share on the date of grant. Also, for each grant, options vest ratably over a period of
three years
on the anniversaries of the grant date, subject to their earlier expiration or termination.
Changes in options outstanding under the plans for the period indicated were as follows:
F-25
LABORATORY CORPORATION OF AMERICA HOLDINGS AND SUBSIDIARIES
NOTES TO CONSOLIDATED FINANCIAL STATEMENTS
(Dollars and shares in millions, except per share data)
|
Number of
Options
|
Weighted-
Average
Exercise Price
per Option
|
Weighted-
Average
Remaining
Contractual
Term
|
Aggregate
Intrinsic
Value
|
|||||||||
|
Outstanding at December 31, 2012
|
6.9
|
|
$
|
77.62
|
|
|
|
|||||
|
Granted
|
—
|
|
—
|
|
|
|
||||||
|
Exercised
|
(2.2
|
)
|
72.02
|
|
|
|
||||||
|
Cancelled
|
(0.1
|
)
|
82.92
|
|
|
|
||||||
|
Outstanding at December 31, 2013
|
4.6
|
|
$
|
80.18
|
|
6.4
|
$
|
51.5
|
|
|||
|
Vested and expected to vest at December 31, 2013
|
4.5
|
|
$
|
80.13
|
|
6.4
|
$
|
51.3
|
|
|||
|
Exercisable at December 31, 2013
|
3.1
|
|
$
|
77.06
|
|
5.7
|
$
|
44.2
|
|
|||
The aggregate intrinsic value in the table above represents the total pre-tax intrinsic value (the difference between the Company’s closing stock price on the last trading day of
2013
and the exercise price, multiplied by the number of in-the-money options) that would have been received by the option holders had all option holders exercised their options on
December 31, 2013
. The amount of intrinsic value will change based on the fair market value of the Company’s stock.
Cash received by the Company from option exercises, the actual tax benefit realized for the tax deductions and the aggregate intrinsic value of options exercised from option exercises under all share-based payment arrangements during the years ended
December 31, 2013
,
2012
, and
2011
were as follows:
|
|
2013
|
2012
|
2011
|
||||||||
|
Cash received by the Company
|
$
|
158.0
|
|
$
|
69.4
|
|
$
|
106.1
|
|
||
|
Tax benefits realized
|
$
|
21.3
|
|
$
|
9.7
|
|
$
|
17.7
|
|
||
|
Aggregate intrinsic value
|
$
|
55.4
|
|
$
|
25.3
|
|
$
|
45.5
|
|
||
The following table summarizes information concerning currently outstanding and exercisable options.
|
Options Outstanding
|
Options Exercisable
|
|||||||||
|
Range of
Exercise Prices
|
Number
Outstanding
|
Weighted Average
|
Number
Exercisable
|
Weighted
Average
Exercise
Price
|
||||||
|
Remaining
Contractual
Life
|
Average
Exercise
Price
|
|||||||||
|
$ 6.80 - 59.37
|
0.1
|
1.6
|
$53.25
|
0.1
|
$53.25
|
|||||
|
$59.38 - 67.60
|
0.4
|
5.1
|
$60.32
|
0.4
|
$60.32
|
|||||
|
$67.61 - 75.63
|
1.1
|
5.3
|
$72.82
|
1.1
|
$72.82
|
|||||
|
$75.64 - 80.37
|
0.4
|
3.4
|
$80.07
|
0.4
|
$80.07
|
|||||
|
$80.38 - 98.49
|
2.6
|
7.8
|
$87.39
|
1.1
|
$88.57
|
|||||
|
|
4.6
|
6.4
|
$80.18
|
3.1
|
$77.06
|
|||||
The following table shows the weighted average grant-date fair values of options issued during the respective year and the weighted average assumptions that the Company used to develop the fair value estimates:
F-26
LABORATORY CORPORATION OF AMERICA HOLDINGS AND SUBSIDIARIES
NOTES TO CONSOLIDATED FINANCIAL STATEMENTS
(Dollars and shares in millions, except per share data)
|
|
2013
|
2012
|
2011
|
||||||
|
Fair value per option
|
N/A
|
$
|
13.43
|
|
$
|
17.06
|
|
||
|
Valuation assumptions
|
|
|
|
|
|
||||
|
Weighted average expected life (in years)
|
N/A
|
3.4
|
|
3.4
|
|
||||
|
Risk free interest rate
|
N/A
|
0.4
|
%
|
1.0
|
%
|
||||
|
Expected volatility
|
N/A
|
0.2
|
|
0.2
|
|
||||
|
Expected dividend yield
|
N/A
|
—
|
|
—
|
|
||||
The Black Scholes model incorporates assumptions to value stock-based awards. The risk-free interest rate for periods within the contractual life of the option is based on a zero-coupon U.S. government instrument over the contractual term of the equity instrument. Expected volatility of the Company’s stock is based on historical volatility of the Company’s stock. The Company uses historical data to calculate the expected life of the option. Groups of employees and non-employee directors that have similar exercise behavior with regard to option exercise timing and forfeiture rates are considered separately for valuation purposes. For
2013
,
2012
and
2011
, expense related to the Company’s stock option plan totaled
$14.5
,
$21.5
and
$24.9
, respectively. The Company did not grant any options to employees during 2013.
Restricted Stock, Restricted Stock Units and Performance Shares
The Company grants restricted stock, restricted stock units and performance shares (“non-vested shares”) to officers, key employees, and non-employee directors under all plans. Restricted stock and restricted stock units become vested annually in equal
one third increments beginning on the first anniversary of the grant
. A performance share grant in
2011
represents a three year award opportunity for the period
2011-2013
and becomes vested in the first quarter of
2014
. A performance share grant in
2012
represents a three year award opportunity for the period of
2012-2014
and becomes vested in the first quarter of
2015
. A performance share grant in
2013
represents a three year award opportunity for the period of
2013-2015
and becomes vested in the first quarter of
2016
.
Performance share awards are subject to certain earnings per share, revenue, operating income, earnings before income taxes and total shareholder return targets
, the achievement of which may increase or decrease the number of shares which the grantee receives upon vesting. The unearned restricted stock and performance share compensation is being amortized to expense over the applicable vesting periods. For
2013
,
2012
and
2011
, total restricted stock, restricted stock units and performance share compensation expense was
$19.3
,
$14.3
and
$21.3
, respectively.
The following table shows a summary of non-vested shares for the year ended
December 31, 2013
:
|
Number of
Shares
|
Weighted-
Average
Grant Date
Fair Value
|
|||||
|
Non-vested at January 1, 2013
|
0.6
|
|
$
|
84.91
|
|
|
|
Granted
|
0.5
|
|
90.19
|
|
||
|
Vested
|
(0.2
|
)
|
75.79
|
|
||
|
Canceled
|
(0.1
|
)
|
90.43
|
|
||
|
Non-vested at December 31, 2013
|
0.8
|
|
$
|
90.70
|
|
|
As of
December 31, 2013
, there was
$28.5
of total unrecognized compensation cost related to non-vested restricted stock and performance share-based compensation arrangements granted under the stock incentive plans. That cost is expected to be recognized over a weighted average period of
1.8
years.
F-27
LABORATORY CORPORATION OF AMERICA HOLDINGS AND SUBSIDIARIES
NOTES TO CONSOLIDATED FINANCIAL STATEMENTS
(Dollars and shares in millions, except per share data)
Employee Stock Purchase Plan
The Company has an employee stock purchase plan, begun in 1997 and amended in 1999, 2004, 2008 and 2012, with
6.3
shares of common stock authorized for issuance. The plan permits substantially all employees to purchase a limited number of shares of Company stock at
85%
of market value. The Company issues shares to participating employees semi-annually in January and July of each year. Approximately
0.2
shares were purchased by eligible employees in
2013
,
2012
and
2011
, respectively. For
2013
,
2012
and
2011
, expense related to the Company’s employee stock purchase plan was
$3.5
,
$4.9
and
$2.7
, respectively.
The Company uses the Black-Scholes model to calculate the fair value of the employee’s purchase right. The fair value of the employee’s purchase right and the assumptions used in its calculation are as follows:
|
|
2013
|
2012
|
2011
|
||||||||
|
Fair value of the employee’s purchase right
|
$
|
17.22
|
|
$
|
23.02
|
|
$
|
15.58
|
|
||
|
Valuation assumptions
|
|
|
|
|
|
|
|||||
|
Risk free interest rate
|
0.1
|
%
|
0.1
|
%
|
0.1
|
%
|
|||||
|
Expected volatility
|
0.2
|
|
0.2
|
|
0.2
|
|
|||||
|
Expected dividend yield
|
—
|
|
—
|
|
—
|
|
|||||
15. COMMITMENTS AND CONTINGENT LIABILITIES
The Company is involved from time to time in various claims and legal actions, including arbitrations, class actions, and other litigation (including those described in more detail below), arising in the ordinary course of business. Some of these actions involve claims that are substantial in amount. These matters include, but are not limited to, intellectual property disputes, professional liability, employee related matters, and inquiries, including subpoenas and other civil investigative demands, from governmental agencies and Medicare or Medicaid payers and managed care payers reviewing billing practices or requesting comment on allegations of billing irregularities that are brought to their attention through billing audits or third parties. The Company receives civil investigative demands or other inquiries from various governmental bodies in the ordinary course of its business. Such inquiries can relate to the Company or other healthcare providers. The Company works cooperatively to respond to appropriate requests for information.
The Company is also named from time to time in suits brought under the qui tam provisions of the False Claims Act and comparable state laws. These suits typically allege that the Company has made false statements and/or certifications in connection with claims for payment from federal or state health care programs. The suits may remain under seal (hence, unknown to the Company) for some time while the government decides whether to intervene on behalf of the qui tam plaintiff. Such claims are an inevitable part of doing business in the health care field today.
The Company believes that it is in compliance in all material respects with all statutes, regulations and other requirements applicable to its clinical laboratory operations. The clinical laboratory testing industry is, however, subject to extensive regulation, and the courts have not interpreted many of these statutes and regulations. There can be no assurance therefore that those applicable statutes and regulations will not be interpreted or applied by a prosecutorial, regulatory or judicial authority in a manner that would adversely affect the Company. Potential sanctions for violation of these statutes and regulations include significant fines and the loss of various licenses, certificates and authorizations.
Many of the claims and legal actions against the Company are at preliminary stages, and many of these cases seek an indeterminate amount of damages. The Company records an aggregate legal reserve, which is determined using actuarial calculations around historical loss rates and assessment of trends experienced in settlements and defense costs. In accordance with FASB Accounting Standards Codification Topic 450 “Contingencies”, the Company establishes reserves for judicial, regulatory, and arbitration matters outside the aggregate legal reserve if and when those matters present loss contingencies that are both probable and estimable and would exceed the aggregate legal reserve. When loss contingencies are not both probable and estimable, the Company does not establish separate reserves.
The Company is unable to estimate a range of reasonably probable loss for cases described in more detail below in which damages either have not been specified or, in the Company's judgment, are unsupported and/or exaggerated and (i) the proceedings are in early stages; (ii) there is uncertainty as to the outcome of pending appeals or motions; (iii) there are significant factual issues
F-28
LABORATORY CORPORATION OF AMERICA HOLDINGS AND SUBSIDIARIES
NOTES TO CONSOLIDATED FINANCIAL STATEMENTS
(Dollars and shares in millions, except per share data)
to be resolved; and/or (iv) there are novel legal issues to be presented. For these cases, however, the Company does not believe, based on currently available information, that the outcomes of these proceedings will have a material adverse effect on the Company's financial condition, though the outcomes could be material to the Company's operating results for any particular period, depending, in part, upon the operating results for such period.
As previously reported, the Company reached a settlement in the previously disclosed lawsuit,
California ex rel. Hunter
Laboratories, LLC et al. v. Quest Diagnostics Incorporated, et al.
("Hunter Labs Settlement Agreement"), to avoid the uncertainty and costs associated with prolonged litigation. Pursuant to the executed settlement agreement, the Company recorded a litigation settlement expense of
$34.5 in the second quarter of 2011 (net of a previously recorded reserve of $15.0) and paid the settlement amount of $49.5 in the third quarter of 2012
. The Company also agreed to certain reporting obligations regarding its pricing for a limited time period and, at the option of the Company in lieu of such reporting obligations, to provide Medi-Cal with a discount from Medi-Cal's otherwise applicable maximum reimbursement rate from November 1, 2011 through October 31, 2012. In June of 2012, the California legislature enacted Assembly Bill No. 1494, Section 9 of which directs the Department of Health Care Services ("DHCS") to establish new reimbursement rates for Medi-Cal clinical laboratory services that will be based on payments made to California clinical laboratories for similar services by other third-party payers. With stakeholder input, DHCS established data elements and a format for laboratories to report payment data from comparable third-party payers. After reviewing the submitted data, DHCS will propose new reimbursement rates and solicit stakeholder input before their implementation. The bill provides that until the new rates are set through this process, Medi-Cal payments for clinical laboratory services will be reduced (in addition to a 10% payment reduction imposed by statute in 2011) by “up to 10 percent” for tests with dates of service on or after July 1, 2012, with a cap on payments set at 80% of the lowest maximum allowance established under the federal Medicare program. Under the terms of the Hunter Labs Settlement Agreement, the enactment of this new California legislation terminates the Company's reporting obligations (or obligation to provide a discount in lieu of reporting) under that agreement. Taken together, these changes are not expected to have a material impact on the Company's consolidated revenues or results of operations.
As previously reported, the Company responded to an October 2007 subpoena from the United States Department of Health & Human Services Office of Inspector General's regional office in New York. On August 17, 2011, the Southern District of New York unsealed a False Claims Act lawsuit,
United States of America ex rel. NPT Associates v. Laboratory Corporation of America Holdings
, which alleges that the Company offered UnitedHealthcare kickbacks in the form of discounts in return for Medicare business. The Plaintiff's third amended complaint further alleges that the Company's billing practices violated False Claims Acts in fourteen states and the District of Columbia. The lawsuit seeks actual and treble damages and civil penalties for each alleged false claim, as well as recovery of costs, attorney's fees, and legal expenses. Neither the U.S. government nor any state government has intervened in the lawsuit. The Company will vigorously defend the lawsuit.
In addition, the Company has received
four
other subpoenas since 2007 related to Medicaid billing. In February 2009, the Company received a subpoena from the Commonwealth of Virginia Office of the Attorney General requesting documents related to its billing to Virginia Medicaid. In April of 2013, the Commonwealth of Virginia Office of Attorney General closed its investigation. In October 2009, the Company received a subpoena from the State of Michigan Department of Attorney General seeking documents related to its billing to Michigan Medicaid. In June 2010, the Company received a subpoena from the State of Florida Office of the Attorney General requesting documents related to its billing to Florida Medicaid. In October 2013, the Company received a civil investigative demand from the State of Texas Office of the Attorney General requesting documents related to its billing to Texas Medicaid. The Company is cooperating with these requests.
On May 2, 2013, the Company was served with a False Claims Act lawsuit,
State of Georgia ex rel. Hunter Laboratories, LLC
and
Chris Riedel v. Quest Diagnostics Incorporated, et al.
, filed in the State Court of Fulton County, Georgia. The lawsuit, filed by a competitor laboratory, alleges that the Company overcharged Georgia's Medicaid program. The case has been removed to the United States District Court for the Northern District of Georgia. The lawsuit seeks actual and treble damages and civil penalties for each alleged false claim, as well as recovery of costs, attorney's fees, and legal expenses. The government filed a notice declining to intervene in the case. The Company will vigorously defend the lawsuit.
On August 19, 2013, the Company was served with a False Claims Act lawsuit,
Commonwealth of Virginia ex rel. Hunter Laboratories, LLC and Chris Riedel v. Quest Diagnostics Incorporated, et al
., filed in the Circuit Court of Fairfax County, Virginia. The lawsuit, filed by a competitor laboratory, alleges that the Company overcharged Virginia’s Medicaid program. The case has been removed to the United States District Court for the Eastern District of Virginia. The lawsuit seeks actual and treble damages and civil penalties for each alleged false claim, as well as recovery of costs, attorney's fees, and legal expenses. The government filed a notice declining to intervene in the case. The Company's Motion to Dismiss was granted and the plaintiffs have been granted the right to replead their complaint. The Company will vigorously defend the lawsuit.
F-29
LABORATORY CORPORATION OF AMERICA HOLDINGS AND SUBSIDIARIES
NOTES TO CONSOLIDATED FINANCIAL STATEMENTS
(Dollars and shares in millions, except per share data)
In October 2011, a putative stockholder of the Company made a letter demand through his counsel for inspection of documents related to policies and procedures concerning the Company's Board of Directors' oversight and monitoring of the Company's billing and claim submission process. The letter also seeks documents prepared for or by the Board regarding allegations from the
California ex rel. Hunter Laboratories, LLC et al. v. Quest Diagnostics Incorporated, et al.
, lawsuit and documents reviewed and relied upon by the Board in connection with the settlement of that lawsuit. The Company is responding to the request pursuant to Delaware law.
On November 18, 2011, the Company received a letter from U.S. Senators Baucus and Grassley requesting information regarding the Company's relationships with its largest managed care customers. The letter requests information about the Company's contracts and financial data regarding its managed care customers. Company representatives met with Senate Finance Committee staff after receiving the request and subsequently produced documents in response. The Company continues to cooperate with the request for information.
On February 27, 2012, the Company was served with a False Claims Act lawsuit,
United States ex rel. Margaret Brown v. Laboratory Corporation of America Holdings and Tri-State Clinical Laboratory Services, LLC
, filed in the United States District Court for the Southern District of Ohio, Western Division. The lawsuit alleges that the defendants submitted false claims for payment for laboratory testing services performed as a result of financial relationships that violated the federal Stark and anti-kickback laws. The Company owned
50%
of Tri-State Clinical Laboratory Services, LLC, which was dissolved in June of 2011. The lawsuit seeks actual and treble damages and civil penalties for each alleged false claim, as well as recovery of costs, attorney's fees, and legal expenses. The U.S. government has not intervened in the lawsuit. The Company will vigorously defend the lawsuit.
On June 7, 2012, the Company was served with a putative class action lawsuit,
Yvonne Jansky v. Laboratory Corporation of America, et al.
, filed in the Superior Court of the State of California, County of San Francisco. The lawsuit alleges that the defendants committed unlawful and unfair business practices, and violated various other state laws by changing screening codes to diagnostic codes on laboratory test orders, thereby resulting in customers being responsible for co-payments and other debts. The lawsuit seeks injunctive relief, actual and punitive damages, as well as recovery of attorney's fees, and legal expenses. The Company will vigorously defend the lawsuit.
On June 7, 2012, the Company was served with a putative class action lawsuit,
Ann Baker Pepe v. Genzyme Corporation and Laboratory Corporation of America Holdings
, filed in the United States District Court for the District of Massachusetts. The lawsuit alleges that the defendants failed to preserve DNA samples allegedly entrusted to the defendants and thereby breached a written agreement with plaintiff and violated state laws. The lawsuit seeks injunctive relief, actual, double and treble damages, as well as recovery of attorney's fees and legal expenses. The Company will vigorously defend the lawsuit.
On August 24, 2012, the Company was served with a putative class action lawsuit,
Sandusky Wellness Center, LLC, et al. v. MEDTOX Scientific, Inc., et al.
, filed in the United States District Court for the District of Minnesota. The lawsuit alleges that on or about February 21, 2012, the defendants violated the federal Telephone Consumer Protection Act by sending unsolicited facsimiles to Plaintiff and more than
39
other recipients without the recipients' prior express invitation or permission. The lawsuit seeks actual damages or the sum of
$0.0005
for each violation, subject to trebling under TCPA, and injunctive relief. The Company will vigorously defend the lawsuit.
The Company was a defendant in
two
separate putative class action lawsuits,
Christine Bohlander v. Laboratory Corporation of America, et al.,
and
Jemuel Andres, et al. v. Laboratory Corporation of America Holdings, et. al.,
related to overtime pay. After the filing of the two lawsuits on July 8, 2013, the
Bohlander
lawsuit was consolidated into the
Andres
lawsuit, and the consolidated lawsuit is now pending in the Superior Court of California for the County of Los Angeles. In the consolidated lawsuit, the Plaintiffs allege on behalf of similarly situated phlebotomists and couriers that the Company failed to pay overtime, failed to provide meal and rest breaks, and committed other violations of the California Labor Code. The complaint seeks monetary damages, civil penalties, costs, injunctive relief, and attorney's fees. The Company intends to vigorously defend the lawsuit.
On December 17, 2010, the Company was served with a lawsuit,
Oliver Wuth, et al. v. Laboratory Corporation of America, et al.
,
filed in the State Superior Court of King County, Washington. The lawsuit alleges that the Company was negligent in the handling of a prenatal genetic test order that allegedly resulted in the parents being given incorrect information. The matter was tried to a jury beginning on October 21, 2013. On December 10, 2013, the jury returned a verdict in in plaintiffs’ favor in the amount of $50.0, with 50% of liability apportioned to the Company and 50% of liability apportioned to co-defendant Valley Medical Center. The Company filed post-judgment motions for a new trial, which were denied, and intends to vigorously pursue an appeal of the judgment on multiple grounds. The Company carries self-insurance reserves and excess liability insurance sufficient to cover the potential liability in this case.
F-30
LABORATORY CORPORATION OF AMERICA HOLDINGS AND SUBSIDIARIES
NOTES TO CONSOLIDATED FINANCIAL STATEMENTS
(Dollars and shares in millions, except per share data)
Under the Company's present insurance programs, coverage is obtained for catastrophic exposure as well as those risks required to be insured by law or contract. The Company is responsible for the uninsured portion of losses related primarily to general, professional and vehicle liability, certain medical costs and workers' compensation. The self-insured retentions are on a per occurrence basis without any aggregate annual limit. Provisions for losses expected under these programs are recorded based upon the Company's estimates of the aggregated liability of claims incurred. At
December 31, 2013
, the Company had provided letters of credit aggregating approximately
$42.5
, primarily in connection with certain insurance programs. The Company’s availability under its Revolving Credit Facility is reduced by the amount of these letters of credit.
The Company leases various facilities and equipment under non-cancelable lease arrangements. Future minimum rental commitments for leases with non-cancelable terms of one year or more at
December 31, 2013
are as follows:
|
|
Operating
|
||
|
2014
|
$
|
132.3
|
|
|
2015
|
81.8
|
|
|
|
2016
|
58.1
|
|
|
|
2017
|
39.7
|
|
|
|
2018
|
20.5
|
|
|
|
Thereafter
|
41.0
|
|
|
|
Total minimum lease payments
|
373.4
|
|
|
|
Less:
|
|
|
|
|
Amounts included in restructuring and acquisition related accruals
|
(12.4
|
)
|
|
|
Non-cancelable sub-lease income
|
—
|
|
|
|
Total minimum operating lease payments
|
$
|
361.0
|
|
Rental expense, which includes rent for real estate, equipment and automobiles under operating leases, amounted to
$235.7
,
$226.0
and
$220.2
for the years ended
December 31, 2013
,
2012
and
2011
, respectively.
16. PENSION AND POSTRETIREMENT PLANS
Pension Plans
The Company has a defined benefit retirement plan (the "Company Plan") and a nonqualified supplemental retirement plan (the “PEP”). Both plans have been closed to new participants since December 31, 2009. Employees participating in the Company Plan and the PEP no longer earn service-based credits, but continue to earn interest credits. In addition, effective January 1, 2010, all employees eligible for the defined contribution retirement plan (the “401K Plan”) receive a minimum
3%
non-elective contribution (“NEC”) concurrent with each payroll period. Employees are not required to make a contribution to the 401K Plan to receive the NEC. The NEC is non-forfeitable and vests immediately. The 401K Plan also permits discretionary contributions by the Company of
1%
to
3%
of pay for eligible employees based on service.
The Company’s 401K Plan covers substantially all employees. Prior to 2010, Company contributions to the plan were based on a percentage of employee contributions. In 2013, 2012 and 2011, the Company made non-elective and discretionary contributions to the plan. Non-elective and discretionary contributions were
$49.4
,
$49.0
and
$44.3
in
2013
,
2012
and
2011
, respectively.
In addition, the Company Plan covers substantially all employees hired prior to December 31, 2009. The benefits to be paid under the Company Plan are based on years of credited service through December 31, 2009, interest credits and average compensation. The Company’s policy is to fund the Company Plan with at least the minimum amount required by applicable regulations. The Company made contributions to the Company Plan of
$8.4
,
$11.3
and
$0.0
in
2013
,
2012
and
2011
, respectively.
The PEP covers the Company’s senior management group. Prior to 2010, the PEP provided for the payment of the difference, if any, between the amount of any maximum limitation on annual benefit payments under the Employee Retirement Income Security Act of 1974 and the annual benefit that would be payable under the Company Plan but for such limitation. Effective January 1, 2010, employees participating in the PEP no longer earn service-based credits. The PEP is an unfunded plan.
F-31
LABORATORY CORPORATION OF AMERICA HOLDINGS AND SUBSIDIARIES
NOTES TO CONSOLIDATED FINANCIAL STATEMENTS
(Dollars and shares in millions, except per share data)
Projected pension expense for the Company Plan and the PEP is expected to
decrease to
$7.8
in
2014
. This amount excludes any accelerated recognition of pension cost due to the total lump-sum payouts exceeding certain components of net periodic pension cost in a fiscal year. If such levels were to be met in
2014
, the Company projects that it would result in an additional
$6.4
of pension expense.
The Company plans to make contributions of
$11.0
to the Company Plan during
2014
.
The effect on operations for both the Company Plan and the PEP are summarized as follows:
|
|
Year ended December 31,
|
||||||||||
|
|
2013
|
2012
|
2011
|
||||||||
|
Service cost for benefits earned
|
$
|
3.1
|
|
$
|
2.4
|
|
$
|
2.6
|
|
||
|
Interest cost on benefit obligation
|
14.7
|
|
14.9
|
|
17.1
|
|
|||||
|
Expected return on plan assets
|
(17.3
|
)
|
(17.3
|
)
|
(18.9
|
)
|
|||||
|
Net amortization and deferral
|
10.5
|
|
12.1
|
|
7.8
|
|
|||||
|
Defined benefit plan costs
|
$
|
11.0
|
|
$
|
12.1
|
|
$
|
8.6
|
|
||
Amounts included in accumulated other comprehensive earnings consist of unamortized net loss of
$99.6
. The accumulated other comprehensive earnings that are expected to be recognized as components of the defined benefit plan costs during
2014
are
$6.2
related to amortization of the net loss.
A summary of the changes in the projected benefit obligations of the Company Plan and the PEP are summarized as follows:
|
|
2013
|
2012
|
|||||
|
Balance at January 1
|
$
|
380.7
|
|
$
|
383.2
|
|
|
|
Service cost
|
3.1
|
|
2.4
|
|
|||
|
Interest cost
|
14.7
|
|
14.9
|
|
|||
|
Actuarial (gain)/loss
|
(22.1
|
)
|
5.8
|
|
|||
|
Benefits and administrative expenses paid
|
(26.7
|
)
|
(25.6
|
)
|
|||
|
Balance at December 31
|
$
|
349.7
|
|
$
|
380.7
|
|
|
The Accumulated Benefit Obligation was
$349.7
and
$380.7
at
December 31, 2013
and
2012
, respectively.
A summary of the changes in the fair value of plan assets follows:
|
|
2013
|
2012
|
|||||
|
Fair value of plan assets at beginning of year
|
$
|
256.8
|
|
$
|
244.5
|
|
|
|
Actual return on plan assets
|
28.1
|
|
25.0
|
|
|||
|
Employer contributions
|
9.9
|
|
12.9
|
|
|||
|
Benefits and administrative expenses paid
|
(26.7
|
)
|
(25.6
|
)
|
|||
|
Fair value of plan assets at end of year
|
$
|
268.1
|
|
$
|
256.8
|
|
|
The net funded status of the Company Plan and the PEP at December 31:
F-32
LABORATORY CORPORATION OF AMERICA HOLDINGS AND SUBSIDIARIES
NOTES TO CONSOLIDATED FINANCIAL STATEMENTS
(Dollars and shares in millions, except per share data)
|
Funded status
|
$
|
81.6
|
|
$
|
123.9
|
|
|
|
Recorded as:
|
|||||||
|
Accrued expenses and other
|
$
|
1.6
|
|
$
|
1.4
|
|
|
|
Other liabilities
|
80.0
|
|
122.5
|
|
|||
|
$
|
81.6
|
|
$
|
123.9
|
|
||
Weighted average assumptions used in the accounting for the Company Plan and the PEP are summarized as follows:
|
|
2013
|
2012
|
2011
|
|||||
|
Discount rate
|
4.8
|
%
|
4.0
|
%
|
4.0
|
%
|
||
|
Expected long term rate of return
|
7.0
|
%
|
7.0
|
%
|
7.3
|
%
|
||
The Company maintains an investment policy for the management of the Company Plan’s assets. The objective of this policy is to build a portfolio designed to achieve a balance between investment return and asset protection by investing in indexed funds that are comprised of equities of high quality companies and in high quality fixed income securities which are broadly balanced and represent all market sectors. The target allocations for plan assets are
50%
equity securities,
45%
fixed income securities and
5%
in other assets. Equity securities primarily include investments in large-cap, mid-cap and small-cap companies located in the U.S. and to a lesser extent international equities in developed and emerging countries. Fixed income securities primarily include U.S. Treasury securities, mortgage-backed bonds and corporate bonds of companies from diversified industries. Other assets include investments in commodities. The weighted average expected long-term rate of return for the Company Plan’s assets is as follows:
|
Target
Allocation
|
Weighted
Average
Expected
Long-Term
Rate
of Return
|
||||
|
Equity securities
|
50.0
|
%
|
5.5
|
%
|
|
|
Fixed income securities
|
45.0
|
%
|
1.2
|
%
|
|
|
Other assets
|
5.0
|
%
|
0.3
|
%
|
|
F-33
LABORATORY CORPORATION OF AMERICA HOLDINGS AND SUBSIDIARIES
NOTES TO CONSOLIDATED FINANCIAL STATEMENTS
(Dollars and shares in millions, except per share data)
The fair values of the Company Plan’s assets at
December 31, 2013
and
2012
, by asset category are as follows:
|
Fair Value Measurements as of
|
|||||||||||||||
|
December 31, 2013
|
|||||||||||||||
|
Fair Value as of December 31, 2013
|
Using Fair Value Hierarchy
|
||||||||||||||
|
Asset Category
|
Level 1
|
Level 2
|
Level 3
|
||||||||||||
|
Cash
|
$
|
2.7
|
|
$
|
2.7
|
|
$
|
—
|
|
$
|
—
|
|
|||
|
Equity securities:
|
|
|
|
|
|
|
|
|
|||||||
|
U.S. large cap - blend (a)
|
65.5
|
|
—
|
|
65.5
|
|
—
|
|
|||||||
|
U.S. mid cap - blend (b)
|
25.1
|
|
—
|
|
25.1
|
|
—
|
|
|||||||
|
U.S. small cap - blend (c)
|
8.1
|
|
—
|
|
8.1
|
|
—
|
|
|||||||
|
International equity - blend (d)
|
40.3
|
|
—
|
|
40.3
|
|
—
|
|
|||||||
|
Commodities index (e)
|
11.3
|
|
—
|
|
11.3
|
|
—
|
|
|||||||
|
Fixed income securities:
|
|
|
|
|
|
|
|
|
|||||||
|
U.S. fixed income (f)
|
104.1
|
|
—
|
|
104.1
|
|
—
|
|
|||||||
|
U.S inflation protection income (g)
|
11.0
|
|
—
|
|
11.0
|
|
—
|
|
|||||||
|
Total fair value of the Company Plan’s assets
|
$
|
268.1
|
|
$
|
2.7
|
|
$
|
265.4
|
|
$
|
—
|
|
|||
|
Fair Value Measurements as of
|
|||||||||||||||
|
December 31, 2012
|
|||||||||||||||
|
Fair Value as of December 31, 2012
|
Using Fair Value Hierarchy
|
||||||||||||||
|
Asset Category
|
Level 1
|
Level 2
|
Level 3
|
||||||||||||
|
Cash
|
$
|
6.9
|
|
$
|
6.9
|
|
$
|
—
|
|
$
|
—
|
|
|||
|
Equity securities:
|
|
|
|
|
|
|
|
|
|||||||
|
U.S. large cap - blend (a)
|
58.1
|
|
—
|
|
58.1
|
|
—
|
|
|||||||
|
U.S. mid cap - blend (b)
|
23.2
|
|
—
|
|
23.2
|
|
—
|
|
|||||||
|
U.S. small cap - blend (c)
|
6.8
|
|
—
|
|
6.8
|
|
—
|
|
|||||||
|
International equity - blend (d)
|
39.4
|
|
—
|
|
39.4
|
|
—
|
|
|||||||
|
Commodities index (e)
|
11.5
|
|
—
|
|
11.5
|
|
—
|
|
|||||||
|
Fixed income securities:
|
|
|
|
|
|
|
|
|
|||||||
|
U.S. fixed income (f)
|
110.9
|
|
—
|
|
110.9
|
|
—
|
|
|||||||
|
Total fair value of the Company Plan’s assets
|
$
|
256.8
|
|
$
|
6.9
|
|
$
|
249.9
|
|
$
|
—
|
|
|||
|
a)
|
This category represents an equity index fund not actively managed that tracks the S&P 500 Index.
|
|
b)
|
This category represents an equity index fund not actively managed that tracks the S&P mid-cap 400 Index.
|
|
c)
|
This category represents an equity index fund not actively managed that tracks the Russell 2000 Index.
|
|
d)
|
This category represents an equity index fund not actively managed that tracks the MSCI ACWI ex USA Index.
|
|
e)
|
This category represents a commodities index fund not actively managed that tracks the Dow Jones - UBS Commodity Index.
|
|
f)
|
This category primarily represents bond index funds not actively managed that track the Barclays Capital U.S. Aggregate Index and Barclays Capital U.S. TIPS Index.
|
|
g)
|
This category primarily represents a bond index fund not actively managed that tracks the Barclays Capital U.S. TIPS Index.
|
F-34
LABORATORY CORPORATION OF AMERICA HOLDINGS AND SUBSIDIARIES
NOTES TO CONSOLIDATED FINANCIAL STATEMENTS
(Dollars and shares in millions, except per share data)
The following assumed benefit payments under the Company Plan and PEP, which were used in the calculation of projected benefit obligations, are expected to be paid as follows:
|
2013
|
$
|
23.4
|
|
|
2014
|
23.4
|
|
|
|
2015
|
23.5
|
|
|
|
2016
|
23.3
|
|
|
|
2017
|
23.4
|
|
|
|
Years 2018-2022
|
120.5
|
|
|
Post-retirement Medical Plan
The Company assumed obligations under a subsidiary's post-retirement medical plan. Coverage under this plan is restricted to a limited number of existing employees of the subsidiary. This plan is unfunded and the Company’s policy is to fund benefits as claims are incurred. The effect on operations of the post-retirement medical plan is shown in the following table:
|
|
Year ended December 31,
|
||||||||||
|
|
2013
|
2012
|
2011
|
||||||||
|
Service cost for benefits earned
|
$
|
0.4
|
|
$
|
0.4
|
|
$
|
0.3
|
|
||
|
Interest cost on benefit obligation
|
2.5
|
|
2.3
|
|
2.2
|
|
|||||
|
Net amortization and deferral
|
1.0
|
|
0.3
|
|
(0.2
|
)
|
|||||
|
Post-retirement medical plan costs
|
$
|
3.9
|
|
$
|
3.0
|
|
$
|
2.3
|
|
||
Amounts included in accumulated other comprehensive earnings consist of unamortized net loss of
$12.7
. The accumulated other comprehensive earnings that are expected to be recognized as components of the post-retirement medical plan costs during
2014
are
$1.3
related to amortization of the net loss.
A summary of the changes in the accumulated post-retirement benefit obligation follows:
|
|
2013
|
2012
|
|||||
|
Balance at January 1
|
$
|
60.7
|
|
$
|
52.7
|
|
|
|
Service cost for benefits earned
|
0.4
|
|
0.4
|
|
|||
|
Interest cost on benefit obligation
|
2.5
|
|
2.3
|
|
|||
|
Participants contributions
|
0.3
|
|
0.4
|
|
|||
|
Actuarial loss
|
4.5
|
|
6.9
|
|
|||
|
Benefits paid
|
(2.7
|
)
|
(2.0
|
)
|
|||
|
Plan amendment
|
(3.0
|
)
|
—
|
|
|||
|
Balance at December 31
|
$
|
62.7
|
|
$
|
60.7
|
|
|
|
Recorded as:
|
|||||||
|
Other liabilities
|
$
|
62.7
|
|
$
|
60.7
|
|
|
The weighted-average discount rates used in the calculation of the accumulated post-retirement benefit obligation were
5.0%
and
4.2%
as of
December 31, 2013
and
2012
, respectively. The health care cost trend rate was assumed to be
7.5%
of
December 31, 2013
and
2012
, declining gradually to
5.0%
in the year
2021
. The health care cost trend rate has a significant effect on the amounts reported. The impact of a percentage point change each year in the assumed health care cost trend rates would change the accumulated post-retirement benefit obligation as of
December 31, 2013
by an increase of
$8.7
or a decrease of
$7.3
. The impact of a percentage point change on the aggregate of the service cost and interest cost components of the
2013
post-retirement benefit costs results in an increase of
$0.5
or decrease of
$0.4
. The plan amendment in 2013 reflects the impact of shifting from projection
F-35
LABORATORY CORPORATION OF AMERICA HOLDINGS AND SUBSIDIARIES
NOTES TO CONSOLIDATED FINANCIAL STATEMENTS
(Dollars and shares in millions, except per share data)
scale AA to projection scale BB for both the RP-2000 Combined Healthy Mortality Table and the RP-2000 Disabled Mortality Table.
The following assumed benefit payments under the Company's post-retirement benefit plan, which reflect expected future service, as appropriate, and were used in the calculation of projected benefit obligations, are expected to be paid as follows:
|
2014
|
$
|
2.5
|
|
|
2015
|
2.7
|
|
|
|
2016
|
2.9
|
|
|
|
2017
|
3.0
|
|
|
|
2018
|
3.1
|
|
|
|
Years 2019-2023
|
17.9
|
|
|
Deferred Compensation Plan
In 2001, the Board approved the Deferred Compensation Plan ("DCP") under which certain of the Company's executives, may elect to defer up to
100.0%
of their annual cash incentive pay and/or up to
50.0%
of their annual base salary and/or eligible commissions subject to annual limits established by the federal government. The DCP provides executives a tax efficient strategy for retirement savings and capital accumulation without significant cost to the Company. The Company makes no contributions to the DCP. Amounts deferred by a participant are credited to a bookkeeping account maintained on behalf of each participant, which is used for measurement and determination of amounts to be paid to a participant, or his or her designated beneficiary, pursuant to the terms of the DCP. The amounts accrued under this plan were
$36.3
and
$26.6
at December 31, 2013 and 2012, respectively. Deferred amounts are the Company's general unsecured obligations and are subject to claims by the Company's creditors. The Company's general assets may be used to fund obligations and pay DCP benefits.
17. FAIR VALUE MEASUREMENTS
The Company’s population of financial assets and liabilities subject to fair value measurements as of
December 31, 2013
and
2012
are as follows:
|
Fair Value Measurements as of
|
|||||||||||||||
|
December 31, 2013
|
|||||||||||||||
|
Fair Value as of December 31, 2013
|
Using Fair Value Hierarchy
|
||||||||||||||
|
|
Level 1
|
Level 2
|
Level 3
|
||||||||||||
|
Noncontrolling interest put
|
$
|
19.4
|
|
$
|
—
|
|
$
|
19.4
|
|
$
|
—
|
|
|||
|
Interest rate swap
|
—
|
|
—
|
|
—
|
|
—
|
|
|||||||
|
Cash surrender value of life insurance policies
|
35.1
|
|
—
|
|
35.1
|
|
—
|
|
|||||||
|
Deferred compensation liability
|
36.3
|
|
—
|
|
36.3
|
|
—
|
|
|||||||
|
Fair Value Measurements as of
|
|||||||||||||||
|
December 31, 2012
|
|||||||||||||||
|
Fair Value as of December 31, 2012
|
Using Fair Value Hierarchy
|
||||||||||||||
|
|
Level 1
|
Level 2
|
Level 3
|
||||||||||||
|
Noncontrolling interest put
|
$
|
20.7
|
|
$
|
—
|
|
$
|
20.7
|
|
$
|
—
|
|
|||
|
Cash surrender value of life insurance policies
|
30.4
|
|
—
|
|
30.4
|
|
—
|
|
|||||||
|
Deferred compensation liability
|
26.6
|
|
—
|
|
26.6
|
|
—
|
|
|||||||
F-36
LABORATORY CORPORATION OF AMERICA HOLDINGS AND SUBSIDIARIES
NOTES TO CONSOLIDATED FINANCIAL STATEMENTS
(Dollars and shares in millions, except per share data)
The noncontrolling interest put is valued at its contractually determined value, which approximate fair value. During the year ended
December 31, 2013
, the carrying value of the noncontrolling interest put decreased by
$1.3
consisting of a
$0.8
increase in the contractually determined value and a
$2.5
decrease for foreign currency translation.
The Company offers certain employees the opportunity to participate in a DCP. A participant's deferrals are "invested" at the direction of the employee in a hypothetical portfolio of investments which are tracked by an administrator. From time to time, the Company purchases life insurance policies, with the Company named as beneficiary of the policies. Changes in the cash surrender value of the life insurance policies are based upon earnings and changes in the value of the underlying investments. Changes in the fair value of the DCP obligation are derived using quoted prices in active markets based on the market price per unit multiplied by the number of units. The cash surrender value and the DCP obligations are classified within Level 2 because their inputs are derived principally from observable market data by correlation to the hypothetical investments.
The carrying amounts of cash and cash equivalents, accounts receivable, income taxes receivable, and accounts payable are considered to be representative of their respective fair values due to their short-term nature. The fair market value of the zero-coupon subordinated notes, based on market pricing, was approximately
$155.5
and
$179.1
as of
December 31, 2013
and
2012
, respectively. The fair market value of the senior notes, based on market pricing, was approximately
$2,907.8
and
$2,720.5
as of
December 31, 2013
and
2012
, respectively. The Company's note and debt instruments are considered level 2 instruments, as the fair market values of these instruments are determined using other observable inputs. The Company's investment in equity securities of
$16.4
is considered a level 1 instrument, as the fair market value of this instrument is determined using observable inputs.
18. DERIVATIVE INSTRUMENTS AND HEDGING ACTIVITIES
The Company addresses its exposure to market risks, principally the market risk associated with changes in interest rates, through a controlled program of risk management that includes, from time to time, the use of derivative financial instruments such as interest rate swap agreements (see Interest Rate Swap section below). Although the Company’s zero-coupon subordinated notes contain features that are considered to be embedded derivative instruments (see Embedded Derivative section below), the Company does not hold or issue derivative financial instruments for trading purposes. The Company does not believe that its exposure to market risk is material to the Company’s financial position or results of operations.
Interest Rate Swap
During the third quarter of 2013, the Company entered into two fixed-to-variable interest rate swap agreements for the
4.625%
senior notes due 2020 with an aggregate notional amount of
$600.0
and variable interest rates based on one-month LIBOR plus
2.298%
to hedge against changes in the fair value of a portion of the Company's long term debt. These derivative financial instruments are accounted for as fair value hedges of the senior notes due 2020. These interest rate swaps are included in other long term assets or liabilities, as applicable, and added to the value of the senior notes, with an aggregate fair value of
$0.0
at
December 31, 2013
. As the specific terms and notional amounts of the derivative financial instruments match those of the fixed-rate debt being hedged, the derivative instruments are assumed to be perfectly effective hedges and accordingly, there is no impact to the Company's consolidated statements of operations. Cash flows from the interest rate swaps are including in operating activities. There were no derivative instruments designated as accounting hedges in 2012.
Embedded Derivatives Related to the Zero-Coupon Subordinated Notes
The Company’s zero-coupon subordinated notes contain the following two features that are considered to be embedded derivative instruments under authoritative guidance in connection with accounting for derivative instruments and hedging activities:
|
1)
|
The Company will pay contingent cash interest on the zero-coupon subordinated notes after September 11, 2006, if the average market price of the notes equals
120%
or more of the sum of the issue price, accrued original issue discount and contingent additional principal, if any, for a specified measurement period.
|
|
2)
|
Holders may surrender zero-coupon subordinated notes for conversion during any period in which the rating assigned to the zero-coupon subordinated notes by Standard & Poor’s Ratings Services is BB- or lower.
|
The Company believes these embedded derivatives had no fair value at
December 31, 2013
and
2012
. These embedded derivatives also had no impact on the consolidated statements of operations for the years ended
December 31, 2013
,
2012
and
2011
.
F-37
LABORATORY CORPORATION OF AMERICA HOLDINGS AND SUBSIDIARIES
NOTES TO CONSOLIDATED FINANCIAL STATEMENTS
(Dollars and shares in millions, except per share data)
19. SUPPLEMENTAL CASH FLOW INFORMATION
|
Years Ended December 31,
|
|||||||||||
|
2013
|
2012
|
2011
|
|||||||||
|
Supplemental schedule of cash flow information:
|
|
|
|
||||||||
|
Cash paid during period for:
|
|
|
|
||||||||
|
Interest
|
$
|
97.2
|
|
$
|
77.5
|
|
$
|
99.6
|
|
||
|
Income taxes, net of refunds
|
301.5
|
|
306.2
|
|
309.4
|
|
|||||
|
Disclosure of non-cash financing and investing activities:
|
|
|
|
|
|
|
|||||
|
Surrender of restricted stock awards and performance shares
|
7.1
|
|
10.9
|
|
6.0
|
|
|||||
|
Conversion of zero-coupon convertible debt
|
10.3
|
|
3.8
|
|
36.2
|
|
|||||
|
Assets acquired under capital leases
|
13.1
|
|
—
|
|
—
|
|
|||||
|
Accrued property, plant and equipment
|
9.1
|
|
1.2
|
|
—
|
|
|||||
20. BUSINESS SEGMENT INFORMATION
The following table is a summary of segment information for the years ended
December 31, 2013
,
2012
, and
2011
. Segment asset information is not presented because it is not used by the chief operating decision maker at the operating segment level. Operating earnings (loss) of each segment represents net revenues less directly identifiable expenses to arrive at operating income for the segment. General management and administrative corporate expenses are included in general corporate expenses below.
Laboratory tests and procedures are used generally by hospitals, physicians and other health care providers and commercial clients to assist in the diagnosis, evaluation, detection, therapy selection, monitoring and treatment of diseases and other medical conditions through the examination of substances in the blood, tissues and other specimens. Clinical diagnostics laboratory segment includes financial information related to the broad range of testing services that are reported primarily through the U.S. business operations. The other reportable segment includes the Company's non-U.S. clinical diagnostic laboratory operations in Ontario, Canada, which are reviewed separately by corporate management for the purposes of allocation of resources.
|
2013
|
2012
|
2011
|
||||||||||
|
Net revenues:
|
||||||||||||
|
Clinical laboratory diagnostics
|
$
|
5,465.2
|
|
$
|
5,336.4
|
|
$
|
5,232.9
|
|
|||
|
Other
|
343.1
|
|
335.0
|
|
309.4
|
|
||||||
|
Total net revenues
|
$
|
5,808.3
|
|
$
|
5,671.4
|
|
$
|
5,542.3
|
|
|||
|
Operating earnings (loss):
|
||||||||||||
|
Clinical laboratory diagnostics
|
$
|
1,440.1
|
|
$
|
1,435.4
|
|
$
|
1,396.2
|
|
|||
|
Other
|
93.9
|
|
96.8
|
|
98.5
|
|
||||||
|
General corporate expenses
|
(543.1
|
)
|
(508.7
|
)
|
(546.3
|
)
|
||||||
|
Total operating income
|
990.9
|
|
1,023.5
|
|
948.4
|
|
||||||
|
Non-operating expenses, net
|
(75.3
|
)
|
(79.3
|
)
|
(82.3
|
)
|
||||||
|
Earnings before income taxes
|
915.6
|
|
944.2
|
|
866.1
|
|
||||||
|
Provision for income taxes
|
340.2
|
|
359.4
|
|
333.0
|
|
||||||
|
Net earnings
|
575.4
|
|
584.8
|
|
533.1
|
|
||||||
|
Less: Net income attributable to noncontrolling interests
|
(1.6
|
)
|
(1.7
|
)
|
(13.4
|
)
|
||||||
|
Net income attributable to Laboratory Corporation of America Holdings
|
$
|
573.8
|
|
$
|
583.1
|
|
$
|
519.7
|
|
|||
F-38
LABORATORY CORPORATION OF AMERICA HOLDINGS AND SUBSIDIARIES
NOTES TO CONSOLIDATED FINANCIAL STATEMENTS
(Dollars and shares in millions, except per share data)
|
2013
|
2012
|
2011
|
||||||||||
|
Depreciation and amortization:
|
||||||||||||
|
Clinical laboratory diagnostics
|
$
|
171.2
|
|
$
|
169.1
|
|
$
|
177.3
|
|
|||
|
Other
|
9.2
|
|
8.1
|
|
6.7
|
|
||||||
|
General corporate
|
42.1
|
|
40.3
|
|
39.6
|
|
||||||
|
Total depreciation and amortization
|
$
|
222.5
|
|
$
|
217.5
|
|
$
|
223.6
|
|
|||
21. QUARTERLY DATA (UNAUDITED)
The following is a summary of unaudited quarterly data:
|
Year ended December 31, 2013
|
|||||||||||||||||||
|
1st
Quarter
|
2nd
Quarter
|
3rd
Quarter
|
4th
Quarter
|
Full
Year
|
|||||||||||||||
|
Net sales
|
$
|
1,440.9
|
|
$
|
1,468.2
|
|
$
|
1,462.2
|
|
$
|
1,437.0
|
|
$
|
5,808.3
|
|
||||
|
Gross profit
|
572.2
|
|
577.3
|
|
547.6
|
|
526.1
|
|
2,223.2
|
|
|||||||||
|
Net earnings attributable to Laboratory Corporation of America Holdings
|
147.2
|
|
151.9
|
|
148.3
|
|
126.4
|
|
573.8
|
|
|||||||||
|
Basic earnings per common share
|
1.58
|
|
1.65
|
|
1.66
|
|
1.46
|
|
6.36
|
|
|||||||||
|
Diluted earnings per common share
|
1.56
|
|
1.62
|
|
1.63
|
|
1.43
|
|
6.25
|
|
|||||||||
|
Year ended December 31, 2012
|
|||||||||||||||||||
|
1st
Quarter
|
2nd
Quarter
|
3rd
Quarter
|
4th
Quarter
|
Full
Year
|
|||||||||||||||
|
Net sales
|
$
|
1,423.3
|
|
$
|
1,423.4
|
|
$
|
1,419.4
|
|
$
|
1,405.3
|
|
$
|
5,671.4
|
|
||||
|
Gross profit
|
576.1
|
|
579.5
|
|
556.1
|
|
538.0
|
|
2,249.7
|
|
|||||||||
|
Net earnings attributable to Laboratory Corporation of America Holdings
|
161.6
|
|
153.3
|
|
148.0
|
|
120.2
|
|
583.1
|
|
|||||||||
|
Basic earnings per common share
|
1.66
|
|
1.59
|
|
1.56
|
|
1.28
|
|
6.09
|
|
|||||||||
|
Diluted earnings per common share
|
1.63
|
|
1.56
|
|
1.53
|
|
1.26
|
|
5.99
|
|
|||||||||
F-39
Schedule II
LABORATORY CORPORATION OF AMERICA HOLDINGS AND SUBSIDIARIES
VALUATION AND QUALIFYING ACCOUNTS AND RESERVES
Years Ended
December 31, 2013
,
2012
and
2011
(Dollars in millions)
|
Balance at
beginning
of year
|
Additions
Charged to Costs and Expense
|
(1)
Other (Deductions)Additions |
Balance
at end
of year
|
||||||||||||
|
Year ended December 31, 2013:
|
|
|
|
|
|
||||||||||
|
Applied against asset accounts:
|
|
|
|
|
|
||||||||||
|
Allowance for doubtful accounts
|
$
|
191.5
|
|
$
|
254.8
|
|
$
|
(248.0
|
)
|
$
|
198.3
|
|
|||
|
Valuation allowance-deferred tax assets
|
$
|
18.4
|
|
$
|
0.2
|
|
$
|
(2.1
|
)
|
$
|
16.5
|
|
|||
|
Year ended December 31, 2012:
|
|
|
|
|
|
|
|
|
|||||||
|
Applied against asset accounts:
|
|
|
|
|
|
|
|
|
|||||||
|
Allowance for doubtful accounts
|
$
|
197.6
|
|
$
|
246.0
|
|
$
|
(252.1
|
)
|
$
|
191.5
|
|
|||
|
Valuation allowance-deferred tax assets
|
$
|
14.4
|
|
$
|
2.1
|
|
$
|
1.9
|
|
$
|
18.4
|
|
|||
|
Year ended December 31, 2011:
|
|
|
|
|
|
|
|
|
|||||||
|
Applied against asset accounts:
|
|
|
|
|
|
|
|
|
|||||||
|
Allowance for doubtful accounts
|
$
|
149.2
|
|
$
|
255.1
|
|
$
|
(206.7
|
)
|
$
|
197.6
|
|
|||
|
Valuation allowance-deferred tax assets
|
$
|
11.4
|
|
$
|
3.1
|
|
$
|
(0.1
|
)
|
$
|
14.4
|
|
|||
(1) Other (Deductions) Additions consists primarily of write-offs of accounts receivable amounts.
F-40
TABLE OF CONTENTS