LABORATORY CORP OF AMERICA HOLDINGS
10-Ks and 10-Qs
|
|
|
|
|
|
|
|
|
|
|
|
|
|
|
|
|
|
|
|
|
|
|
|
|
|
|
|
|
|
|
|
|
|
|
|
|
|
|
|
|
|
|
|
|
|
|
|
|
|
|
|
|
|
|
|
|
|
|
UNITED STATES
SECURITIES AND EXCHANGE COMMISSION
Washington, DC 20549
FORM 10-K
[X] Annual Report Pursuant to Section 13 or 15(d) of the Securities Exchange Act of 1934
For the fiscal year ended
December 31, 2017
or
[ ] Transition report pursuant to Section 13 or 15(d) of the Securities Exchange Act of 1934
For the transition period from ______ to ______
Commission file number - 1-11353
LABORATORY CORPORATION OF AMERICA HOLDINGS
(Exact name of registrant as specified in its charter)
|
Delaware
|
13-3757370
|
|
(State or other jurisdiction of incorporation or organization)
|
(I.R.S. Employer Identification No.)
|
|
358 South Main Street,
|
|
|
Burlington, North Carolina
|
27215
|
|
(Address of principal executive offices)
|
(Zip Code)
|
(Registrant's telephone number, including area code)
336-229-1127
Securities registered pursuant to Section 12(b) of the Act:
|
Title of each class
|
|
Name of exchange on which registered
|
|
Common Stock, $0.10 par value
|
|
New York Stock Exchange
|
Securities registered pursuant to Section 12(g) of the Act: None
Indicate by check mark whether the registrant is well-known seasoned issuer, as defined in Rule 405 of the Securities Act. Yes [X] No [ ].
Indicate by check mark if the registrant is not required to file reports pursuant to Section 13 or 15(d) of the Act. Yes [ ] No [X].
Indicate by check mark whether the registrant (1) has filed all reports required to be filed by Section 13 or 15(d) of the Securities Exchange Act of 1934 during the preceding 12 months (or for such shorter period that the registrant was required to file such reports), and (2) has been subject to such filing requirements for the past 90 days. Yes [X] No [ ].
Indicate by check mark whether the registrant has submitted electronically and posted on its corporate Website, if any, every Interactive Data File required to be submitted and posted pursuant to Rule 405 of Regulation S-T (§ 232.405 of this chapter) during the preceding 12 months (or for such shorter period that the registrant was required to submit and post such files). Yes [X] No [ ].
1
Indicate by check mark if disclosure of delinquent filers pursuant to Item 405 of Regulation S-K (§ 232.405) is not contained herein, and will not be contained, to the best of registrant's knowledge, in definitive proxy or information statements incorporated by reference in Part III of this Form 10-K or any amendment to this Form 10-K. [ ].
Indicate by check mark whether the registrant is a large accelerated filer, an accelerated filer, a non-accelerated filer, a smaller reporting company, or an emerging growth company. See the definitions of “large accelerated filer,” “accelerated filer,” “smaller reporting company”, and “emerging growth company” in Rule 12b-2 of the Exchange Act.
|
Large accelerated filer [X]
|
Accelerated filer [ ]
|
|
Non-accelerated filer [ ] (Do not check if a smaller reporting company)
|
Smaller reporting company [ ]
|
|
Emerging growth company [ ]
|
|
If emerging growth company, indicate by check mark if the registrant has elected not to use the extended transition period for complying with any new or revised financial accounting standards provided pursuant to Section 13(a) of the Exchange Act. [ ]
Indicate by check mark whether the registrant is a shell company (as defined in Rule 12b-2 of the Exchange Act). Yes [ ] No [X].
Indicate by check mark whether the registrant is a shell company (as defined in Rule 12b-2 of the Act). Yes [ ] No [X].
As of
June 30, 2017
, the aggregate market value of the common stock held by non-affiliates of the registrant was approximately
$14.9 billion
, based on the closing price on such date of the registrant’s common stock on the New York Stock Exchange.
Indicate the number of shares outstanding of each of the registrant's classes of common stock, as of the latest practicable date:
101.9 million
shares as of
February 22, 2018
.
DOCUMENTS INCORPORATED BY REFERENCE
List hereunder the following documents if incorporated by reference and the Part of the Form 10-K into which the document is incorporated:
Portions of the Registrant’s Notice of Annual Meeting and Proxy Statement to be filed no later than 120 days following
December 31, 2017
, are incorporated by reference into Part III.
2
Index
|
|
|
Page
|
|
|
|
|
|
Item 1.
|
||
|
|
||
|
|
||
|
|
||
|
|
||
|
|
||
|
|
||
|
|
||
|
|
||
|
Item 1A.
|
||
|
Item 1B.
|
||
|
Item 2.
|
||
|
Item 3.
|
||
|
Item 4.
|
||
|
|
|
|
|
|
|
|
|
Item 5.
|
||
|
Item 6.
|
||
|
Item 7.
|
||
|
Item 7A.
|
||
|
Item 8.
|
||
|
Item 9.
|
||
|
Item 9A.
|
||
|
Item 9B.
|
||
|
|
|
|
|
|
|
|
|
Item 10.
|
||
|
Item 11.
|
||
|
Item 12.
|
||
|
Item 13.
|
||
|
Item 14.
|
||
|
|
|
|
|
|
|
|
|
Item 15.
|
||
|
Item 16.
|
||
3
PART I
|
Item 1.
|
BUSINESS
|
Laboratory Corporation of America
®
Holdings (LabCorp
®
or the Company) is a leading global life sciences company that is deeply integrated in guiding patient care. Through its two business segments, LabCorp Diagnostics (LCD) and Covance Drug Development (CDD), the Company provides comprehensive clinical laboratory and end-to-end drug development services. Employing nearly 60,000 people worldwide, the Company’s mission is to improve health and improve lives by delivering world-class diagnostic solutions, bringing innovative medicines to patients faster, and using technology to improve the delivery of care.
The Company provides diagnostic, drug development and technology-enabled solutions for more than 115 million patient encounters per year. Typically processing tests on more than 2.5 million patient specimens per week, the Company believes that it generated more revenue from laboratory testing than any other Company in the world in 2017. The Company also supports clinical trial activity in approximately 100 countries through its industry-leading central laboratory business, generating more safety and efficacy data to support drug approvals than any other company. The Company collaborated on more than 90% of the novel drugs approved by the U.S. Food and Drug Administration (FDA) in 2017, including more than 90% of the novel rare and orphan disease drugs and two-thirds of the novel oncology drugs. In addition, CDD has been involved in the development of all current top 50 drugs on the market as measured by sales revenue.
The Company has been recognized for its focus on innovation, progressive business practices, and delivering value to customers. Recent accolades include being named to FORTUNE magazine's 2018 List of World's Most Admired Companies, and Forbes’ 2017 ranking of “The World’s Most Innovative Companies,” earning the highest achievable score on the Human Rights Campaign Foundation’s 16th annual scorecard on lesbian, gay, bisexual, transgender, queer (LGBTQ) workplace equality and being designated as a Best Place to Work for LGBTQ Equality, and seeing its Covance business awarded the 2017 Frost & Sullivan Asia-Pacific CRO Customer Value Leadership Award.
The Company, headquartered in Burlington, North Carolina, is a Delaware corporation and was incorporated in 1971. Through a combination of organic growth and disciplined acquisitions, including the 2015 acquisition of Covance Inc. (Covance) and the 2017 acquisition of Chiltern International Group Limited (Chiltern), a specialty contract research organization (CRO), the Company has continually expanded and diversified its business offerings, technological expertise, geographic reach, revenue base, and financial growth opportunities.
Today the Company participates in drug discovery from early development to new drug approval and commercialization, offers a growing portfolio of high-value, high-quality clinical laboratory tests, and increasingly provides guidance to patients and care providers about how to integrate drugs and diagnostics into optimal patient care.
Combined, Global Capabilities
With the acquisition of Covance, the Company began transforming from a leading national laboratory to an integrated global life sciences company. The acquisition of Chiltern further enhanced Covance’s offerings as a major partner serving the top 20 biopharmaceutical segment and expanded the Company’s current offering to include a dedicated focus on the high-growth emerging and mid-market biopharmaceutical segments.
The combination of LabCorp Diagnostics’ patient insights and Covance’s global physician-investigator performance data creates a powerful competitive advantage that presents significant long-term growth potential. It helps the Company to win studies and to recruit patients and investigators for trials more efficiently and at lower cost than competitors. The Company has proprietary data sets with more than 30 billion lab test results, reaching roughly 50% of the United States (U.S.) population and a significant database of experienced investigators and trial sites.
Similarly, the combined capabilities of the businesses have made the Company the market leader in the development and commercialization of companion and complementary diagnostics. Companion diagnostics are tests that must be used before a patient can be treated with a specific therapeutic, to help identify how or if the therapeutic will be effective or if it may cause adverse events. Complementary diagnostics are not required for determining who should receive the therapeutic, or how it should be used, but can give physicians valuable information about a patient’s potential response to a specific therapeutic or class of therapeutics. The Company collaborated with more than 40 clients on more than 165 companion diagnostics projects in 2017 and has supported approximately 70% of companion diagnostics on the market today. The Company believes that the development and use of precision medicine tools, such as companion diagnostics, will become more prevalent as medical understanding of the specific causes of disease increases.
The Company serves a broad range of customers, including managed care organizations (MCOs), biopharmaceutical companies, governmental agencies, physicians and other healthcare providers (e.g. physician assistants and nurse practitioners, generally referred to herein as physicians), hospitals and health systems, employers, patients and consumers, CROs, food and nutritional companies and independent clinical laboratories. The breadth of the Company’s offerings has accelerated revenue and
4
profit growth while generating strong returns for shareholders through share price appreciation. The combination also helps to balance the impact of changes in the U.S. healthcare payment system, such as the recently introduced reductions to the Medicare fee schedule under the Protecting Access to Medicare Act (PAMA).
Positioning the Company for the Future
The Company believes that it can play a larger role in the rapidly evolving healthcare system by focusing on three key initiatives to broaden its role: supporting customers’ transition to value-based care, streamlining the drug development process, and creating a broad consumer engagement platform that integrates diagnostics, devices, and therapeutics. In addition, continued consolidation in healthcare and the Company’s strong relationships with hospitals and health systems will allow it to provide unique solutions to help improve patient outcomes and reduce healthcare costs.
Value-Based Care
The healthcare system is in transition to value-based care, with increased use of reimbursement models based on quality of care and on patient outcomes, and less reliance on traditional fee-for-services based payments. The Company is focused on improving efficiency in care delivery, reducing the overall cost of patient care, and using the Company's combination of diagnostic and drug development capabilities to accelerate progress towards more precise and personalized healthcare.
From helping physicians choose the right test for the patient at the right time, to offering innovative molecular and genetic tests, to delivering the next generation of lifesaving drugs, the Company is a critical player in enabling targeted, tailored, high-value care. The Company’s leadership in companion diagnostics, investments in real-world evidence capabilities and market access solutions, along with its long-standing emphasis on quality, standardized test platforms, information technology (IT) expertise, and payer and provider collaborations support the goal of helping customers successfully transition to value-based care.
Streamlining Drug Development
In today’s healthcare landscape, there is a need to streamline drug development to bring new drugs to market faster. The number of molecules in the pipeline continues to increase. In addition, the development process itself is increasingly complex and costly. These trends have led to growing competition for investigators and patients in clinical studies. In this environment, demand from biopharmaceutical companies for data-driven study designs, scalable tools and relevant biomarkers continues to rise.
CDD’s unique end-to-end global capabilities and leading data and analytics platforms, underpinned by its deep scientific and therapeutic expertise, provide biopharmaceutical and medical device companies with differentiated solutions to streamline development by allowing for more efficient study design, and faster and more targeted identification of eligible patients and investigators. The Company’s investment in CDD’s tools and technology has strengthened its leadership advantage in areas such as companion diagnostics and real-world evidence. In addition, LCD’s strategic relationships with hospitals and health systems create opportunities for those organizations to become research partners to participate in studies and clinical trials with CDD.
The combination of the Company’s unique diagnostic and drug development operating models enables the company to create distinctive and innovative solutions to streamline drug development. An illustrative example is in virtual trials, in which the Company can apply its market access call-center capabilities to enroll and engage patients, its patient service centers (PSCs) to provide blood draws and biometric assessments in locations convenient to patients, and its central laboratory services to perform the associated testing.
Consumer Engagement
Patients are taking a greater role over their own healthcare, with increased responsibility for the costs of their care, and more choice in how, when, and where they access healthcare. This change requires healthcare providers to increasingly view patients as consumers. The Company has made significant investments to engage more directly with patients as consumers, through new and upgraded tools and technology that provide consumers with greater convenience and control over their interactions with the Company.
The Company is committed to enhancing the experience in its PSCs through easier self-check-in options, including advanced check-in and verification of personal information on a mobile device; opportunities to learn more about clinical trials and consent to be contacted about studies for which the consumer may be eligible. In addition, with most commercial insurance plans, the Company is supporting greater transparency about costs, providing estimates of anticipated out-of-pocket cost prior to specimen collection now available at all PSCs and a growing number of in-office phlebotomy sites.
LCD’s online portal offers convenient access to new and historical test results, information about tests, and an option to receive information about clinical trials. The Company is expanding its access points, including the 2017 launch of its “LabCorp at Walgreens” collaboration to open PSCs in Walgreens stores. The Company is also investing in and evaluating new technologies that may enable self-collection of specimens, and it is exploring the potential use of wearable devices for diagnostics and in clinical
5
trials.
The Company performs the DNA testing for 23andMe, which has experienced significant test volume growth over the past several years, indicating increased consumer interest in having direct access to the information that testing provides. The Company also continues to support telemedicine, and other new care delivery models, that enhance consumer access to healthcare.
Hospital and Health System Partnerships
The established trend of healthcare consolidation continues. Private medical practices are joining larger medical groups or affiliating with health systems, while health systems are merging and absorbing additional facilities. MCOs are increasingly becoming not just payers but care providers, and in some markets, large health systems have created their own MCO. These combined organizations can provide economies of scale and the capital to make substantially greater investments in technology, and in some cases they can exercise greater control over how and where patients access care. These changes offer the promise of increased efficiency and reduced costs, while also improving patient outcomes.
The Company supports those goals through its unique combination of diagnostics and drug development. It offers integrated and optimized lab testing across multiple types of care settings. It can dramatically simplify IT structures and interfaces to standardize lab testing and data across a disparate network of providers, facilities and systems. That data can also identify patients that may be eligible for clinical trials and physicians who may be able to serve as trial investigators. The Company believes that its ability to offer these integrated solutions is a differentiator in the marketplace.
For more than three decades, the Company has developed and maintained a broad range of collaborations with hospitals and health systems and the Company continues to develop those relationships. In 2017, the Company entered into or extended strategic relationships with multiple health systems across the country, including Providence Health & Services, Catholic Health Initiatives, Novant Health, and Mount Sinai Health System, among others. These relationships are foundational in delivering high-quality, outcomes-driven, and cost-effective care to patients. The Company will continue to invest in its team and capabilities to support this important strategic initiative.
The Company is uniquely positioned to capitalize on the opportunities of the rapidly changing healthcare system. The combination of it leading diagnostics and drug development businesses adds new dimensions to the Company’s capabilities, strengthens its value proposition to key stakeholders and differentiates the Company from its competitors.
Company Reporting
The Company’s Annual Report on Form 10-K, Quarterly Reports on Form 10-Q, Current Reports on Form 8-K, and all amendments to those reports are made available free of charge through the Investor Relations section of the Company’s website at www.labcorp.com as soon as reasonably practicable after such material is electronically filed with, or furnished to, the Securities and Exchange Commission (SEC). Additionally, the SEC maintains a website at http://www.sec.gov that contains reports, proxy and information statements, and other information regarding issuers, including the Company, that file electronically with the SEC. The public may also read and copy any materials that the Company files with the SEC at the SEC's Public Reference Room at 100 F Street, NE, Washington, D.C. 20549. Information on the operation of the Public Reference Room may be obtained by calling the SEC at 1-800-SEC-0330.
The matters discussed in this “Business” section should be read in conjunction with the Consolidated Financial Statements found in Item 8 of Part II of this report, which include additional financial information about the Company, such as financial information about geographic areas. This report includes forward-looking statements that involve risks or uncertainties. The Company’s results could differ materially from those anticipated in these forward-looking statements as a result of certain factors, including the risk factors described in Item 1A of Part I of this report and elsewhere. For more information about forward-looking statements, see “Forward-Looking Statements” in Item 7.
Business Segments
The Company reports its business in two segments, LCD and CDD. In 2017, LCD and CDD contributed 70.3% and 29.7%, respectively, of net revenues to the Company, and in 2016 contributed 69.9% and 30.1%, respectively. For further financial information about these segments, including information for each of the last three fiscal years regarding revenue, operating income and other important information, see Note 20 to the Consolidated Financial Statements.
LCD Segment
LCD is an independent clinical laboratory business. It offers a comprehensive menu of frequently requested and specialty testing through an integrated network of primary and specialty laboratories across the U.S. This network is supported by a sophisticated information technology system, with more than 65,000 electronic interfaces to deliver test results, nimble and efficient logistics, and local labs offering rapid response testing. The Company also provides patient access points, strategically and conveniently located throughout the U.S., including more than 1,900 PSCs operated by the Company and more than 5,000 in-
6
office phlebotomists who are located in customer offices and facilities. In addition to diagnostic testing, LCD also offers a range of other testing services, including forensic DNA analysis, food safety and integrity services, as well as occupational and wellness testing for employers. LCD offers an expansive test menu including a wide range of clinical, anatomic pathology, genetic and genomic tests, and regularly adds new tests and improves the methodology of existing tests to enhance patient care.
Through the dedicated effort of approximately 39,000 employees, LCD typically processes tests on more than 2.5 million patient specimens each week and has laboratory locations throughout the U.S. and other countries, including Canada and the United Kingdom (U.K.).
Clinical Laboratory Testing Industry
It is estimated that although laboratory services account for less than 3.0% of total U.S. healthcare spending (and less than 2.0% of Medicare expenditures), the results of those tests impact an estimated 70% of all decisions regarding a patient's diagnosis and treatment.
Laboratory tests and procedures are used generally to assist in the diagnosis, monitoring and treatment of diseases and medical conditions through the examination of substances in blood, tissues and other specimens. The results of such tests can help in the evaluation of health, the detection of conditions or pathogens and the selection of appropriate therapies. Clinical laboratory testing is generally categorized as either clinical pathology testing, which is performed on body fluids including blood, or anatomical pathology testing, in which a pathologist examines histologic or cytologic samples (i.e., tissue and other samples, including human cells). Clinical and anatomical pathology procedures are frequently ordered as part of regular healthcare office visits and hospital admissions in connection with the diagnosis and treatment of illnesses. Certain of these tests and procedures are used in the diagnosis and management of a wide variety of medical conditions such as cancer, infectious disease, endocrine disorders, cardiac disorders and genetic disease.
The Company believes that in 2017, the U.S. clinical laboratory testing industry generated revenues of approximately $80.0 billion. The clinical laboratory industry consists primarily of three types of providers: hospital-based laboratories, physician-office laboratories and independent clinical and anatomical pathology laboratories, such as those operated by LCD. The clinical laboratory business is intensely competitive. The Centers for Medicare and Medicaid Services (CMS) of the Department of Health and Human Services (HHS) has estimated that in 2017 there were approximately 9,000 hospital-based laboratories, more than 122,000 physician-office laboratories and more than 6,000 independent clinical laboratories in the U.S. LCD competes with all of those laboratories.
LCD believes that physicians selecting a laboratory often consider the following factors, among others:
|
•
|
Quality, timeliness and consistency in reporting test results;
|
|
•
|
Reputation of the laboratory in the medical community or field of specialty;
|
|
•
|
Contractual relationships with MCOs;
|
|
•
|
Service capability and convenience;
|
|
•
|
Number and type of tests performed;
|
|
•
|
Connectivity solutions offered; and
|
|
•
|
Pricing of the laboratory’s services.
|
LCD believes that it competes favorably in all of these areas.
LCD believes that consolidation in the clinical laboratory testing business will continue. In addition, LCD believes that it and other large, independent clinical laboratory testing companies will be able to increase their share of the overall clinical laboratory testing market due to a number of factors, including cost efficiencies afforded by large-scale automated testing; mergers and acquisitions of complementary businesses; changes in payment models to performance and value-based reimbursement to deliver better outcomes at lower cost; and large, integrated service networks. In addition, legal restrictions on physician referrals and physician ownership of laboratories, as well as ongoing regulation of laboratories, are expected to continue to contribute to the ongoing consolidation of the industry.
Although testing for healthcare purposes and customers who provide healthcare services represents the most significant portion of the clinical laboratory industry, clinical laboratories also perform testing for other purposes and customers, including employment and occupational testing, DNA testing to determine parentage and to assist in forensic investigations, environmental testing, wellness testing, toxicology testing, pain management testing, medical drug monitoring and nutritional analysis and food safety testing.
LCD Testing Operations and Productivity
LCD has a network of PSCs, phlebotomists placed at a customer location, branches, rapid response (STAT) laboratories, primary testing laboratories and specialty testing laboratories, including 19 ISO 15189-certified laboratories that provide customers
7
with the assurance that comes with this rigorous global standard. Generally, a PSC is a facility maintained by LCD to serve the patients of physicians in a medical professional building or other strategic location. The PSC staff collects specimens for testing as requested by the physician. However, most patient specimens are collected by the customer's staff at their office or facility, or in some cases, by an LCD phlebotomist who has been placed in a physician office, hospital or other healthcare facility for the specific purpose of collecting specimens to be tested by LCD. These specimens are collected from PSCs and customer locations and sent principally through LCD's in-house courier system (and to a lesser extent, through independent couriers), to a branch or directly to one of LCD's laboratories for testing. A branch is a central facility that collects specimens in a region for shipment to one of LCD’s laboratories for testing. A branch is also frequently used as a base for sales and distribution staff. STAT laboratories, which are often co-located with a branch or a PSC, perform critical testing for nearby customers, with results typically delivered within 2-3 hours of receipt of the specimen. Primary testing laboratories perform frequently requested testing on a large scale. Specialty testing laboratories perform one or more types of specialty and esoteric testing.
Each specimen and related request form is checked for completeness and given a unique identification number. The unique identification number assigned to each specimen associates the results to the appropriate patient. Once the necessary testing and billing information is entered into the software system, either electronically through an interface with the ordering physician or manually by a data entry operator, the tests are performed and the results are entered through an electronic data interface or manually, depending upon the tests and the type of instrumentation involved. Most of LCD's automated testing equipment is connected to its information systems. Most specimens are picked up from the customer's location by late afternoon or early evening and delivered to the testing laboratory by late evening on the day of collection or overnight. Test results are in most cases electronically delivered to the physician via electronic interfaces, the LabCorp Link
TM
(formerly LabCorp Beacon) platform, smart printers or personal computer-based products.
LCD remains focused on improving quality and productivity while lowering costs throughout all phases of its operations, supported by LCD's technology, automation and facility rationalization initiatives. As part of an ongoing commitment to remain the most efficient and highest-value provider of laboratory services, several years ago LCD began a comprehensive business process improvement initiative, referred to as LaunchPad, to reengineer its systems and processes to create a sustainable and more efficient business model, and to improve the experience of all stakeholders. In 2017, the Company achieved its three-year-goal to deliver net LaunchPad savings of $150.0 million, and expects that the system and process improvements implemented through LaunchPad will yield continuing benefits for the foreseeable future.
LCD Testing Services
LCD offers a growing menu of nearly 5,000 tests. Several hundred of those tests are used in general patient care by physicians to establish or support a diagnosis, to monitor treatment or to search for an otherwise undiagnosed condition. The most frequently requested include blood chemistry analyses, urinalyses, blood cell counts, thyroid tests, Pap tests, hemoglobin A1C, prostate-specific antigen (PSA), tests for sexually-transmitted diseases [e.g. chlamydia, gonorrhea, trichomoniasis and human immunodeficiency virus (HIV)], hepatitis C (HCV) tests, vitamin D, microbiology cultures and procedures, and alcohol and other substance-abuse tests. LCD performs this core group of tests in its major laboratories using sophisticated instruments, with most results reported within 24 hours or less.
In addition, LCD provides a comprehensive range of specialty testing services in the areas of women's health, allergy, diagnostic genetics, cardiovascular disease, infectious disease, endocrinology, oncology, coagulation, pharmacogenetics, toxicology and medical drug monitoring.
LCD also performs a range of other testing services, including DNA testing to determine parentage and to assist in forensic investigations, and occupational testing and wellness testing for employers. In addition, LCD provides testing services to the food, beverage, nutraceutical, animal feed, chemical and agrochemical industries, which include nutritional analysis and equivalency, nutritional content fact labels, microbiological and chemical contaminant safety analysis, product development expertise, sensory testing, pesticide screening and stability testing.
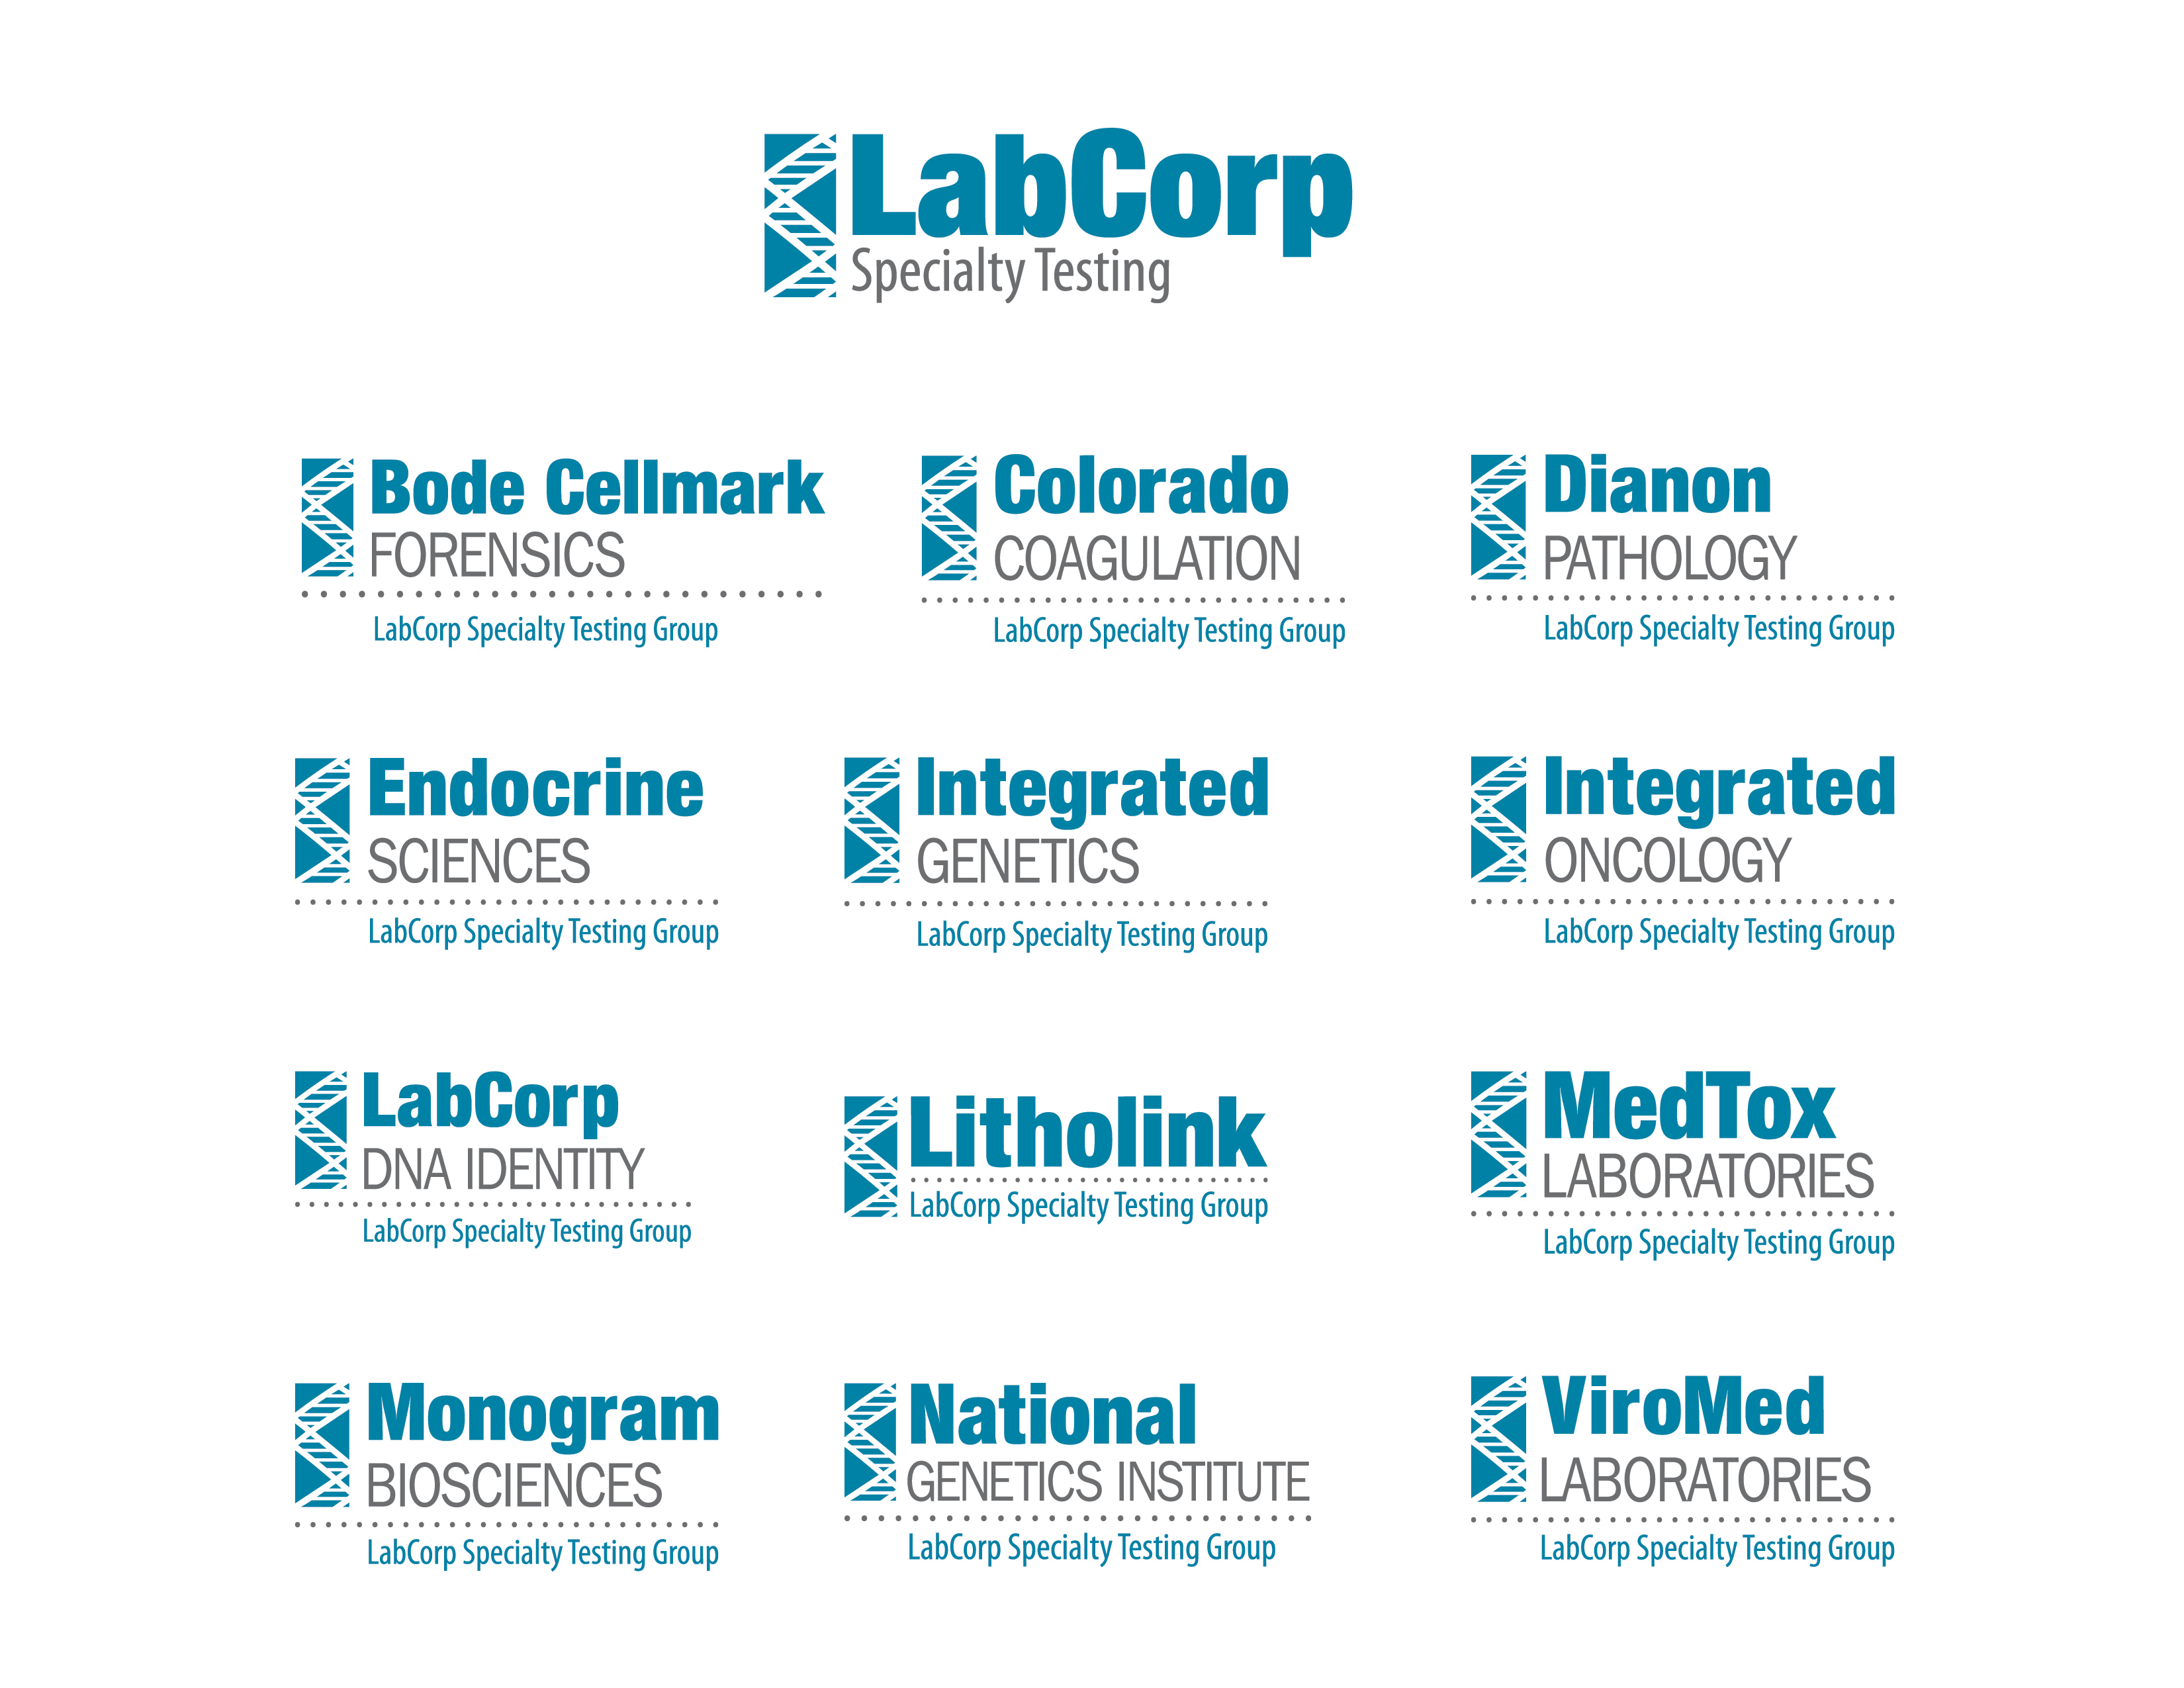
LCD’s Specialty Testing Group performs esoteric testing, cancer diagnostics, and other complex procedures. LCD's specialty testing businesses and their areas of expertise are summarized in the chart below.
8
The Specialty Testing Group offers advanced methods and access to scientific expertise in the following disciplines:
Anatomic Pathology/Oncology.
LCD offers advanced comprehensive tumor tissue analysis, including immunohistochemistry (IHC), cancer cytogenetics and fluorescence in situ hybridization (FISH) through its Dianon Pathology and Integrated Oncology specialty testing laboratories. Applications for molecular diagnostics continue to increase in oncology for leukemia analysis and solid tumor assessment. In cancers such as colon and lung cancer, assays that analyze genetic mutations can help guide appropriate therapy choices for a given patient. Through the combined expertise of LCD and CDD, the Company is a recognized leader in the development and introduction of companion and complementary diagnostics, which are becoming increasingly important in the treatment of cancer with new, targeted therapies for which only certain patients may be eligible, or which may provide greater or lesser benefits to certain patients, based on their individual genetic makeup.
Cardiovascular Disease.
LCD’s cardiovascular menu includes cholesterol tests, expanded lipid profiles, a metabolic syndrome profile and tests for thrombosis and stroke. LCD also offers complete testing for monitoring disease progression and therapy response, including the clinical decision support (CDS) reports available through Litholink.
Coagulation.
LCD offers an extensive menu of tests for hemostasis and thrombosis, including bleeding profiles and screening tests, profiles for reproductive health, factor analysis, thrombin generation markers, and thrombotic risk evaluation. In 2017, LCD introduced a new, internally developed method to test for ADAMTS13, a rare, life-threatening blood clot disorder; the new method offers clinically significant improvements to previously available tests. LCD also performs testing in support of clinical trials for therapies to treat hemophilia.
Diagnostic Genetics.
LCD offers cytogenetic, molecular cytogenetic, biochemical and molecular genetic tests. The biochemical genetics offerings include a variety of prenatal screening options, including integrated and sequential prenatal assays and non-invasive prenatal testing (NIPT) for more sensitive and earlier assessment of risk for multiple fetal chromosomal aneuploidies, such as Down syndrome. LCD has expanded its cytogenetics offerings through the use of whole genome single-nucleotide polymorphism (SNP) microarray technology, which provides enhanced detection of subtle chromosomal changes associated with the etiology of mental retardation, developmental delay and autism. The molecular genetics services include multiplex analyses of a variety of disorders, gene sequencing applications for both somatic and germ-line alterations and whole exome sequencing. Through Integrated Genetics, LCD provides the most comprehensive genetic test menu in the industry, as well as approximately 130 genetic counselors and six medical geneticists to provide patients and their physicians with analysis, assessment and interpretation of genetic test results to help optimize patient decisions and outcomes.
Endocrinology.
LCD is a leading provider of advanced hormone/steroid testing, including comprehensive services for the endocrine specialist. LCD has expanded its menu in esoteric endocrine testing and has launched an initiative to develop steroid testing utilizing mass spectrometry technology. Mass spectrometry is used for detection of low levels of small molecule steroids, including testosterone in women, children and hypogonadal men. Additionally, LCD offers endocrine-related tests for genetic conditions including congenital adrenal hyperplasia, short stature, and thyroid cancer, along with extensive age- and gender-related reference intervals for those tests.
Infectious Disease
.
LCD provides complete HIV testing services, including viral load measurements, genotyping and phenotyping, and host genetic factors that are important tools in managing and treating HIV infections. The addition of resistance tests, including PhenoSense
®
, PhenoSenseGT
®
, Trofile
®
, and GenoSure PRIme
®
complements the existing HIV GenoSure
®
assay and provides LCD with an industry-leading, comprehensive portfolio of HIV resistance testing services.
9
LCD also provides extensive testing services for HCV infections, including both viral load determinations and strain genotyping and host genetic factors. LCD continues to develop molecular assays for infectious disease.
Women's Health.
LCD offers a comprehensive menu of women's health testing. A key feature of this menu is the industry's leading suite of NIPT tests, including MaterniT
®
GENOME, a fully validated genome-wide NIPT test, reflecting the Company's deep prenatal genetics capabilities. Other LCD testing options for women's health include the NuSwab
®
portfolio, featuring high-quality, convenient single-swab tests for common infections of the genital tract; an innovative age-based test protocol for cervical cancer and sexually-transmitted disease screening; liquid-based Pap testing with image-guided cervical cytology for improved cervical cancer detection; and out-of-the-vial Pap testing with options for human papillomavirus (HPV). LCD also offers tests that utilize the latest technical innovations for the full range of reproductive care, including maternal serum screening, prenatal diagnostics, ethnicity carrier screening, testing for causes of infertility or miscarriage as well as postnatal testing services.
Pharmacogenetics.
LCD provides access to the latest tests in the emerging field of pharmacogenetics. These tests can help physicians understand how a patient metabolizes certain drugs, allowing them to select the most appropriate therapies or adjust dosing.
Forensics and Donor Testing
.
LCD provides forensic identity testing used in connection with criminal proceedings. LCD continues to be a leading provider of DNA analysis for sexual assault cases for jurisdictions across the U.S. LCD also provides forensic testing used in connection with parentage evaluation services that assist in determining parentage for child support enforcement proceedings and determining genetic relationships for immigration purposes. Parentage testing involves the evaluation of immunological and genetic markers in specimens obtained from the child, the mother and the alleged father. LCD also provides testing services in reconstruction cases, which assist in determining parentage without the presence of the parent in question. Additionally, LCD provides human leukocyte antigen testing to match organ and tissue transplant recipients with compatible donors.
Occupational Testing Services
.
LCD provides testing services for the detection of drug and alcohol use for private and government customers. These testing services are designed to produce forensic quality test results that satisfy the rigorous requirements of regulated and non-regulated workplace drug testing programs. Additionally, LCD provides employee wellness screenings comprised of biometric measurements and diagnostic tests to assist in the detection of health risks including cardiovascular disease and diabetes. LCD also provides medical drug monitoring tests that detect common pain medications and illicit drugs to assist physicians with assessing the full scope of a patient’s drug use.
Medical Drug Monitoring Services
. Medical drug monitoring is laboratory testing that monitors patients for the use of prescription pain medications or other controlled substances. These testing services are designed to provide physicians with information relevant to the treatment of patients who are prescribed controlled substances, including opioid pain medications, antianxiety medications, and stimulants. This testing can help physicians identify patients who are not taking their prescribed doses, which could be an indication that the drugs are being diverted elsewhere, and also to identify patients who may be supplementing their prescribed medication with other, non-prescribed substances. LCD offers broad choice in medical drug monitoring test options, including LabCorp MedWatch
®
monitor, customizable drug monitoring test options focused on the most commonly prescribed pain medications and illicit drugs, and LabCorp MedWatch ToxAssure
®
, a broad-spectrum drug analysis that analyzes as many as 180 compounds to assess a full range of medication use. LCD testing may assist in identifying patients who may benefit from greater caution and increased monitoring or interventions when risk factors are identified.
Chronic Disease Programs.
Through Litholink, LCD uses a programmatic approach to the comprehensive treatment of chronic diseases, including kidney disease, cardiovascular disease, metabolic bone disease and diabetes, and offers CDS reports to both physicians and patients. LCD believes these chronic disease programs represent potential significant savings to the healthcare system by increasing the detection of early-stage diseases and effectively managing chronic disease conditions.
Development of New Tests
Advances in medicine continue to fundamentally change diagnostic testing. New tests are allowing clinical laboratories to provide unprecedented amounts of health-related information to physicians and patients. New molecular diagnostic tests that have been introduced over the past several years, including a gene-based test for HPV, HIV drug resistance assays, and molecular genetic testing for cystic fibrosis, have now become part of standard clinical practice. LCD continued its industry leadership in gene-based and esoteric testing in 2017, generating more than $2.0 billion in revenue from these testing services. As science continues to advance, LCD expects new testing technologies to emerge and, therefore, intends to continue to invest in advanced testing capabilities so that it can remain on the forefront of diagnostic laboratory testing. The Company has added, and expects to continue to add, new testing technologies and capabilities through a combination of internal development initiatives, technology licensing and partnership transactions, and selected business acquisitions. Through its sales force, LCD rapidly introduces new testing technologies to customers. This differentiation is important in the retention and growth of business.
10
In 2017, LCD continued its emphasis on scientific innovation and leadership with the introduction of significant test menu and automation enhancements and by launching more than 70 new tests. LCD is focused on the expansion of existing programs in molecular diagnostics as well as the introduction of new assays and assay platforms through licensing partnerships, acquisitions and internal development. The Company's commitment to the scientific advancement in the development and assessment of new diagnostics and therapeutics is evidenced by producing nearly 600 peer-reviewed publications and presentations at scientific meetings, along with regular presentations in academic medical center grand rounds and seminars, in 2017.
Examples of new tests and services introduced in 2017 include:
Infectious Diseases.
LCD now offers a series of BioFire
®
test panels, produced by bioMerieux, with application across four clinical areas: respiratory, blood culture, gastrointestinal, and meningitis/encephalitis. These panels identify more than a hundred pathogens, including viruses, bacteria, yeast, parasites, and antimicrobial resistance genes, with faster turnaround times to help physicians more quickly and precisely diagnose and begin treatment in often-critical cases.
Oncology.
LCD continued its leadership in oncology by offering a significant number of new tests focused on the diagnosis and treatment of cancer. LCD was one of the first labs to offer Thermo Fisher Scientific’s Oncomine Dx Target Test, the first next-generation sequencing-based (NGS) test approved by the FDA as a companion diagnostic to aid in the selection of specific targeted therapies for treatment of non-small cell lung cancer patients. LCD was also one of the first laboratories to join Thermo Fisher’s Next-Generation Sequencing Companion Dx Center of Excellence Program, offering enhanced participation in clinical trials and early access to novel testing platforms and assays. With the Omniseq Immune Report Card
SM
test and the OmniSeq Comprehensive
®
panel, LCD became the exclusive laboratory to provide U.S. physicians with unique insights to help guide treatment decisions for cancer patients who may be appropriate candidates for immunotherapy and other targeted treatments. LCD extended its offering of proprietary NGS VistaSeq
SM
Cancer panels. The VistaSeq tests screen for elevated risk of hereditary cancer, and the expanded offering includes tests for multiple additional types of cancer.
Women's Health.
LCD maintained its leading position in women's health testing, including a robust menu of NIPT testing options, ranging from screening for the common autosomal trisomies, to detection of select microdeletions, to a genome-wide assessment of large copy number variants. These offerings provide the most comprehensive menu of noninvasive fetal aneuploidy screening. LCD began to offer ReproSURE™, a blood test designed to provide information about ovarian reserve, which is an indication of a woman's reproductive potential to help physicians and patients in selecting the most appropriate fertility treatment to increase chances of becoming pregnant.
Medical Drug Monitoring and Toxicology.
LCD’s existing expertise in medical drug monitoring and toxicology, through MedTox Laboratories and LabCorp Occupational Testing Services, was enhanced through the acquisition of Pathology Associates Medical Laboratory (PAML) which had particular strength in medical drug monitoring. The combination will allow LCD to provide expanded access and capacity for medical drug monitoring and toxicology services.
LCD continues its collaborations with university, hospital and academic institutions, such as Boston University, Columbia University, Duke University, Johns Hopkins University, The Mount Sinai Hospital, the University of Tennessee and Yale University, to license and commercialize new diagnostic tests.
LCD Technology-Enabled Solutions
LCD’s technology-enabled solutions include innovative decision support programs for chronic diseases, population health analytics tools, and a proprietary set of tools to provide customers and patients with convenient and secure access to LCD’s services. These industry-leading solutions are designed to improve health and improve lives by providing a better laboratory experience for physicians and patients, and ultimately improving the delivery of care.
During 2017, LCD delivered more than 6.0 million enhanced CDS reports for chronic health conditions, including kidney disease, cardiovascular disease, metabolic bone disease and diabetes. LCD’s proprietary CDS reports integrate patient-specific diagnostic information and evidence-based healthcare content to help physicians and patients better manage health. In addition, these decision-support programs promote physician adherence to evidence-based treatment guidelines.
LCD continues to develop new population health analytics programs that provide healthcare business intelligence tools to health systems, physician practices, and accountable care organizations (ACOs). These tools are intended to assist customers in their compliance and reporting requirements with respect to efficient management of their productivity, quality and patient outcome metrics. LCD's robust rules engine maintains a large number of clinical quality measures that are highly customizable and support compliance with meaningful use and quality reporting requirements such as ACO standards, Joint Commission standards and the CMS Physician Quality Reporting System (PQRS). Real-time clinical alerts highlight gaps in care for patients and patient populations.
LCD's centralized and proprietary LabCorp | Link
TM
, which focuses on physicians, is a series of assets and functionalities that enhance the customer experience and provide an end-to-end lab solution. These assets and functionalities include:
11
|
•
|
A physician portal optimized for web and mobile devices;
|
|
•
|
Express electronic ordering for essentially all of LCD's brands and services;
|
|
•
|
Integrated results viewing and enhanced reports;
|
|
•
|
Lab analytics that provide one-click trending of patient, test and population data;
|
|
•
|
CDS tools at the point of testing and resulting;
|
|
•
|
AccuDraw, which provides graphical, step-by-step guidance to help improve accuracy, workflow and turnaround time in the collection and processing of specimens at the point of collection; and
|
|
•
|
Services-oriented architecture with rules-based engines, content aggregation and seamless integration with practice workflow.
|
LCD’s centralized and proprietary LabCorp | Patient
TM
is a series of assets and functionalities that enhance the patience experience. These assets and functionalities include:
|
•
|
A patient portal optimized for web and market-leading mobile devices;
|
|
•
|
Integrated results viewing and patient education materials;
|
|
•
|
Online appointment scheduling and bill payment;
|
|
•
|
An online patient cost estimator for select genetic tests; and
|
|
•
|
An option to receive information about clinical trials.
|
LCD introduced two new patient self-service products in 2017, LabCorp | PreCheck
TM
and LabCorp | Express
TM
, that improve the patient experience across the PSC network. LabCorp | PreCheck is a mobile optimized online application that allows patients to easily schedule a PSC visit in advance. LabCorp | Express uses tablets located in PSCs, allowing patients with or without an appointment to check into the PSC and, if they do not already have an appointment, find the next available one at that or a nearby PSC. Both systems support confirmation and manual entry of demographic and insurance information designed to expedite the intake process and improve patient flow at the PSC, and also provide options to receive testing and appointment notifications via email or text message. LabCorp | PreCheck also offers an image-capture option for driver’s licenses or other state-issued identification and insurance cards. LabCorp | Express supports bar-code scanning of those cards. These systems have demonstrably increased patient and staff satisfaction. In addition, the notifications may help increase test compliance, and the patient data collected will help accelerate enrollment in LabCorp | Patient and further increase the growing population of patients who may receive information about clinical study opportunities with CDD.
LCD’s centralized and proprietary LabCorp | Payer
TM
enables healthcare organizations to obtain test results and quality data through a web-based interface. Results and quality data are increasingly important as the healthcare system focuses on new payment models and the need to deliver better patient outcomes and reduce cost. Over time, this new portal will be expanded to deliver a wide variety of data and analytic value.
LCD's BeaconLBS business provides a technology-enabled solution that provides point-of-care decision support through interfaces with test ordering systems to assist physicians in selecting a lab and the right test for the patient at the right time. Physicians, patients, healthcare delivery systems and payers are expected to benefit from this innovation, which supports the selection of labs that are designed to improve quality, supports evidence-based guidelines for patient care, and more effectively manages laboratory testing utilization trends without disrupting physician work flow. The BeaconLBS
rules engine interfaces with payer policies for ordering, utilization, adjudication and payment.
In 2013, BeaconLBS
signed an agreement with UnitedHealthcare
®
to implement a laboratory benefit management program in Florida utilizing BeaconLBS. UnitedHealthcare launched the laboratory benefit management program with BeaconLBS in Florida on October 1, 2014. In April 2015, BeaconLBS achieved its targeted implementation for UnitedHealthcare in Florida, and LCD began recognizing revenue for providing this service. Results from the Florida program continue to demonstrate improvements in physician use of Labs of Choice (a network of quality, cost-effective labs); improvement in physician test selection based on evidence-based guidelines; reduction in patient out-of-pocket costs; and a reduction in patient use of non-par laboratories. UnitedHealthcare has not yet expanded the laboratory benefit management program beyond Florida. In 2017, BeaconLBS signed an additional agreement with UnitedHealthcare to implement a national molecular testing management program covering approximately 4.2 million fully insured customers across the U.S., which uses a new BeaconLBS molecular test management and decision support platform for test prior authorizations and notifications. The program became effective November 1, 2017.
Billing for Laboratory Services
Billing for laboratory services is a complicated process involving many payers such as MCOs, Medicare, Medicaid, physicians and physician groups, hospitals, patients and employer groups, all of which have different billing requirements. In addition, billing arrangements with third-party administrators may further complicate the billing process. Tests ordered by a physician may be billed to different payers depending on the medical benefits of a particular patient. Most testing services are billed to a party other than the physician or other authorized person who ordered the test. A growing portion of revenue is derived from patients in the form of deductibles, coinsurance, copayments, and charges for non-covered tests.
12
LCD utilizes a centralized billing system in the collection of approximately 89.7% of its domestic revenue (85.2% of consolidated LCD revenue). This system generates bills to LCD customers based on payer type. Customer billing is typically generated monthly, whereas patient and third-party billing are typically generated daily. Accounts receivable are then monitored by billing personnel, and follow-up activities are conducted as necessary. Bad debt expense is recorded within selling, general and administrative expenses as a percentage of sales considered necessary to maintain the allowance for doubtful accounts at an appropriate level, based on LCD's experience. LCD writes off accounts against the allowance for doubtful accounts when accounts receivable are deemed to be uncollectible. For customer billing, third-party and managed care, accounts are written off when all reasonable collection efforts prove to be unsuccessful. Patient accounts are written off after the normal dunning cycle has occurred and the account has been transferred to a third-party collection agency.
A significant portion of LCD's bad debt expense is related to accounts receivable from patients who are unwilling or unable to pay. In 2017, LCD continued its focus on process and account management initiatives to reduce the negative impact of bad debt expense related to patient accounts receivable.
Another component of LCD’s bad debt expense is the result of non-credit-related issues that slow the billing process, such as missing or incorrect billing information on test requisitions. LCD vigorously attempts to obtain any missing information or rectify any incorrect billing information received from the ordering physician. However, LCD typically performs the requested tests and returns the test results regardless of whether billing information is correct or complete. LCD believes that this experience is similar to that of its primary competitors. LCD continues to focus on process initiatives aimed at reducing the impact of these non-credit-related issues. This is accomplished through ongoing identification of root-cause issues, deploying technology-enabled solutions, training provided to internal and external resources involved in the patient data capture process, and an emphasis on the use of electronic test ordering. Specific to technology-enabled solutions, in 2016 LCD deployed insurance eligibility verification and address validation at the time of service in all PSCs. In 2017, the Company implemented system enhancements that provide patients with an estimate of their out-of-pocket costs. In 2018, the Company plans to deploy a self-serve platform for physicians to resolve claim issues related to diagnosis and coverage denials.
For the Company's operations in Ontario, Canada, the Ontario Ministry of Health and Long-Term Care (Ministry) determines who can establish a licensed community medical laboratory and caps the amount that each of these licensed laboratories can bill the government-sponsored healthcare plan. The Ontario government-sponsored healthcare plan covers the cost of clinical laboratory testing performed by the licensed laboratories. The provincial government discounts the annual testing volumes based on certain utilization discounts and establishes an annual maximum it will pay for all community laboratory tests. The agreed-upon reimbursement rates are subject to Ministry review at the end of each year and can be adjusted at the government's discretion based upon the actual volume and mix of testing services performed by the licensed healthcare providers in the province during the year. In 2017, the amount of the Company's capitated revenue derived from the Ontario government-sponsored healthcare plan was CAD $189.3 million.
Effect of U.S. Market Changes on the Clinical Laboratory Business
The delivery of, and reimbursement for, healthcare continues to change in the U.S., impacting all stakeholders, including the clinical laboratory business. Medicare (which principally serves patients who are 65 and older), Medicaid (which principally serves low-income patients) and insurers have increased their efforts to control the cost, utilization and delivery of healthcare services. Measures to regulate healthcare delivery in general and clinical laboratories in particular have resulted in reduced prices, added costs and decreased test utilization for the clinical laboratory industry by imposing new, increasingly complex regulatory and administrative requirements. From time to time, the government also has considered changes to the Medicare and Medicaid fee schedules, and LCD believes that pressure to reduce government reimbursement will continue.
Fees for most laboratory services reimbursed by Medicare are established in the Clinical Laboratory Fee Schedule (CLFS), and fees for other testing reimbursed by Medicare, primarily related to pathology, are covered by the Physician Fee Schedule (PFS). During 2017, approximately 12.1% of LCD’s revenue was reimbursed under the CLFS (12.3% in 2016), and approximately 0.7% was reimbursed under the PFS (0.8% in 2016). Over the past several years, LCD has experienced governmental reimbursement reductions as a direct result of the Patient Protection and Affordable Care Act (ACA), the Medicare Access and CHIP Reauthorization Act of 2015 (MACRA) and the Achieving a Better Life Experience Act of 2014 (ABLE Act). In addition, payer policy changes have impacted the reimbursement for LCD. Further, PAMA, which became law on April 1, 2014, and went into effect on January 1, 2018, is expected to result in a future net reduction in reimbursement revenue under the CLFS. These laws include provisions designed to control healthcare expenses reimbursed by government programs through a combination of reductions to fee schedules, incentives to physicians to participate in alternative payment models such as risk-sharing, and new methods to establish and adjust fees.
In 2017, LCD received a 1.2% payment increase under the CLFS representing approximately $15.6 million. During this same period, LCD experienced a $3.6 million reduction in payments under the PFS.
13
Beginning in 2018, under PAMA, CMS is setting the CLFS using the weighted median of reported private payer prices paid to certain laboratories that receive a majority of their Medicare revenue from the CLFS and PFS and that bill Medicare under their own National Provider Identifier (NPI). On June 23, 2016, CMS issued a final rule to implement PAMA that required applicable laboratories, including LCD, to begin reporting their test-specific private payer payment amounts to CMS during the first quarter of 2017. CMS exercised enforcement discretion to permit reporting for an additional 60 days, through May 30, 2017. CMS used that private market data to calculate weighted median prices for each test (based on applicable current procedural technology (CPT) codes) to represent the new CLFS rates beginning in 2018, subject to certain phase-in limits. For 2018-2020, a test price cannot be reduced by more than 10.0% per year; for 2021-2023, a test price cannot be reduced by more than 15.0% per year. The process of data reporting and repricing will be repeated every three years for Clinical Diagnostic Laboratory Tests (CDLTs). The second data reporting period for CDLTs will occur during the first quarter of 2020, and new CLFS rates for CDLTs will be established based on that data beginning in 2021, subject to the previously described phase-in limits for 2021-2023. The third data reporting period for CDLTs will occur during the first quarter of 2023, and new CLFS rates for CDLTs will be established based on that data beginning in 2024. CLFS rates for 2024 and subsequent periods will not be subject to phase-in limits. CLFS rates for Advanced Diagnostic Laboratory Tests (ADLTs) will be updated annually.
CMS published its initial proposed CLFS rates under PAMA for 2018-2020 on September 22, 2017. Following a public comment period, CMS made adjustments and published final CLFS rates for 2018-2020 on November 17, 2017, with additional adjustments published on December 1, 2017. For 2018, the Company estimates that the CLFS rates will reduce LCD revenue from all payers affected by the CLFS by a total of approximately 8% ($70.0 million).
The final rates published by CMS were based on data reported by only 1% of all laboratories paid by Medicare in 2015, and only 1% of the reported data was from hospital laboratories. Consequently, the American Clinical Laboratory Association (ACLA) filed a federal civil action against HHS for declaratory and injunctive relief on December 11, 2017, arguing that CMS violated the PAMA statute by excluding most of the laboratory market from reporting data on which the rates were based, resulting in rates that do not fairly reflect the private market as the clear language of PAMA requires. While that lawsuit is proceeding, ACLA continues to work with Congress on potential legislative reform of PAMA, which if enacted could reduce the negative impact of PAMA as implemented by CMS. The Company supports the ongoing efforts to prevent or lessen the negative impact of the changes to the CLFS pursuant to PAMA, and the full impact of those efforts, and what the long-term effect will be on the CLFS rates is not yet known.
On November 4, 2016, CMS noted in a final rule implementing MACRA that it intended to apply Merit Based Incentive Payment System (MIPS) requirements to pathologists practicing in independent laboratories, including LCD. Under this requirement, LCD pathologists would have been required to begin reporting certain quality metrics in 2017 for LCD to avoid negative PFS payment adjustments or to qualify for positive PFS payment adjustments beginning in 2019. ACLA met with CMS on March 9, 2017, regarding implementation of this requirement, which was not proposed in the MACRA proposed rule. CMS clarified that it would not apply MIPS requirements to pathologists practicing in independent laboratories.
In 2018, LCD anticipates it will realize an estimated $1.6 million reduction in PFS net revenue, driven by combined reductions in reimbursement for flow cytometry procedures.
Further, healthcare reform could occur in 2018, including changes to the ACA and Medicare reform, as well as administrative requirements that may continue to affect coverage, reimbursement, and utilization of laboratory services in ways that are currently unpredictable.
In addition, market-based changes have affected and will continue to affect the clinical laboratory business. Reimbursement from commercial payers for diagnostic testing has shifted and will continue to shift away from traditional, fee-for-service models to alternatives, including value-based, bundled pay-for-performance, and other risk-sharing payment models. The growth of the managed care sector and consolidation of MCOs present various challenges and opportunities to LCD and other clinical laboratories.
In 2006, the Company signed a 10-year agreement with UnitedHealthcare to become its exclusive national laboratory in the U.S. In September 2011, the Company extended this agreement for an additional two years through the end of 2018. The Company also serves many other MCOs. These organizations have different contracting philosophies, which are influenced by the design of their products. Some MCOs contract with a limited number of clinical laboratories and engage in direct negotiation of rates. Other MCOs adopt broader networks with generally uniform fee structures for participating clinical laboratories. In some cases, those fee structures are specific to independent clinical laboratories, while the fees paid to hospital-based and physician-office laboratories may be different, and are typically higher. MCOs may also offer Managed Medicare or Managed Medicaid plans. In addition, some MCOs use capitation rates to fix the cost of laboratory testing services for their enrollees. Under a capitated reimbursement arrangement, the clinical laboratory receives a per-member, per-month payment for an agreed upon menu of laboratory tests provided to MCO members during the month, regardless of the number of tests performed. For the year ended December 31, 2017, capitated contracts with MCOs accounted for approximately $259.1 million, or 3.6%, of LCD's net revenues. LCD's ability to attract and retain MCO customers has become even more important as the impact of various healthcare reform initiatives continues, including expanded health insurance exchanges and ACOs.
14
In addition to reductions in test reimbursement, the Company also anticipates potential declines in test volumes as a result of increased controls over the utilization of laboratory services by Medicare, Medicaid, and other third-party payers, particularly MCOs. MCOs are implementing, directly or through third parties, various types of laboratory benefit management programs, which may include lab networks, utilization management tools (such as prior authorization and/or prior notification), and claims edits, which impact coverage and reimbursement of clinical laboratory tests. Some of these programs address clinical laboratory testing broadly, while others are focused on molecular and genetic testing. In addition, continued movement by patients into consumer-driven health plans may have an impact on the utilization of laboratory testing.
Despite the overall negative market changes regarding reimbursement discussed above, LCD believes that the volume of clinical laboratory testing is positively influenced by several factors, including the expansion of Medicaid, managed care, and private insurance exchanges. In addition, LCD believes that increased knowledge of the human genome and continued innovation in laboratory medicine will continue to foster greater appreciation of the value of gene-based diagnostic assays. Additional factors that may lead to future volume growth include an increase in the number and types of tests that are readily available (due to advances in technology and increased cost efficiencies) for the diagnosis of disease, and the general aging of the U.S. population. As previously discussed, LCD also believes that it and other large, independent clinical laboratory testing companies will be able to increase their share of the overall clinical laboratory testing market due to a number of market factors, primarily related to a continued drive to improve outcomes and reduce costs across the healthcare system. LCD believes that its enhanced and growing esoteric menu of tests, leading position with companion diagnostics, broad geographic footprint, and operating efficiency provide a strong platform for growth.
CDD Segment
CDD provides end-to-end drug development, medical device and diagnostic services from early-stage research to clinical trial management and commercial market access. CDD provides a wide range of drug research and development (R&D) and market access services to biopharmaceutical companies and medical device companies across the world. With the acquisition of Chiltern, CDD now has more than 20,000 employees worldwide and a global network of operations. It has deep expertise in clinical trials, supporting clinical trial activity in approximately 100 countries through its industry-leading central laboratory business, generating more safety and efficacy data to support drug approvals than any other company. CDD collaborated on more than 90% of the novel drugs approved by the FDA in 2017, including more than 90% of the novel rare and orphan disease drugs and two-thirds of the novel oncology drugs. In addition, CDD has been involved in the development of all current top 50 drugs on the market as measured by sales revenue.
Drug Development Industry
Drug development services companies like CDD are also referred to as CROs and typically derive substantially all of their revenue from R&D as well as marketing expenditures of the biopharmaceutical industry. CDD offers comprehensive global drug, medical device and diagnostic development services from preclinical research through all phases of clinical development and into commercialization. Outsourcing of R&D services from biopharmaceutical companies to CROs has increased in the past, and is expected to continue increasing in the future, because of several factors, including: pressures to improve return on investment, limitations on internal R&D capacity, the need to reduce drug development timelines, stringent government regulation, as well as therapeutic, scientific and other expertise that customers lack internally. The investment and amount of time required to develop new drugs are significant and have been increasing, and these trends create opportunities for CDD and other CROs that can help make the drug development process more efficient.
The drug development industry has many participants ranging from hundreds of small providers to a limited number of large CROs with global capabilities. CDD competes against these small and large CROs, as well as in-house departments of biopharmaceutical, medical device and diagnostic companies, and to a lesser extent, selected universities and teaching hospitals.
CDD believes that customers selecting a CRO often consider the following factors, among others:
•
Reputation for quality, efficient, timely performance and regulatory compliance;
•
Expertise and experience in operations, and the use of technology;
•
Specific therapeutic and scientific expertise;
•
Market access services;
•
Scope of service offerings;
•
Strengths in various geographic markets;
•
Price;
•
Quality of facilities;
•
Ability to acquire, process, analyze and report data in a rapid and accurate manner;
•
Quality of relationships;
15
|
•
|
Ability to manage large-scale clinical trials both domestically and internationally, including the recruitment of appropriate and sufficient clinical-trial subjects; and
|
•
Size and scale.
CDD believes that it competes favorably in all of these areas.
Preclinical Services
CDD’s preclinical service offerings include research models, lead optimization, analytical services, safety assessment, and chemistry manufacturing and control (CMC) services for drug development. CDD offers solution-based approaches by leveraging highly experienced program development directors and project managers to help guide strategic decisions and manage molecule development in an integrated, streamlined manner across CDD's eight analytical laboratories and preclinical laboratories in the U.S., the U.K., Germany and China. CDD's historical innovations in the preclinical area include technologies such as MarketPlace and StudyTracker
®
. Covance MarketPlace is a private, secure web portal providing potential investors or partners access to information about new drugs in development. StudyTracker
®
is an internet-based customer access product, allowing customers of toxicology, bioanalytical, metabolism, and reproductive and developmental toxicology services to review study schedules and data on a near real-time basis.
Research Models.
CDD is an American Association for Accreditation of Laboratory Animal Care (AAALAC) International accredited provider of purpose-bred research models globally. Due to regulation by the FDA and other foreign regulatory bodies, safety and efficacy testing on research models is required as part of the drug development process prior to testing in humans. CDD has a strong commitment to animal welfare, and has instituted progressive enrichment practices and rigorous health testing standards that exceed industry standards to protect the health of CDD's models. CDD is also committed to seeking out alternatives to, or the reduction of, the use of research models when possible. CDD's research models include standard lines as well as disease state and genetically altered models to accommodate customers’ needs. CDD offers purpose-bred-specific, pathogen free rabbits, canines, nonhuman primates, and other species, as well as blood and tissue products and surgical/technical services, including telemetry. The purpose-bred research animals are sold to biopharmaceutical companies, university research centers and CROs.
Lead Optimization
. Lead optimization services are designed to connect early discovery activities to regulated pre-clinical studies. These services include non-good laboratory practice (GLP) toxicology,
in vivo
pharmacology with model development and integrated safety and efficacy capabilities, nonclinical imaging, nonclinical pathology services, pharmacokinetic/toxicokinetic (PK/TK) analysis reporting and immunology services.
Analytical Services
. Bioanalytical testing services help determine the appropriate dose and frequency of drug application from late discovery evaluation through Phase III clinical testing on a full-scale, globally integrated basis. CDD’s analytical services offering includes liquid chromatography-mass spectroscopy immunoanalytical solutions and specialty support, translational biomarker solutions, discovery bioanalysis, vaccine analysis, PK/TK analysis and reporting, and organic synthesis. In addition, CDD offers a growing menu of validated, nonproprietary assays for hundreds of compounds, eliminating method development and validation time, and reducing program cost. CDD has dedicated lab facilities across three continents providing in vitro drug metabolism,
in vivo
radiolabeled absorption, distribution, metabolism and excretion studies; metabolite identification/profiling and nonclinical PK screening; and radiosynthesis services. CDD also provides pharmaceutical chemistry services that determine the metabolic profile and bioavailability of drug candidates.
Safety Assessment.
Safety assessment services include general, genetic, and immunotoxicology services; nonclinical pathology services; safety pharmacology services; and developmental and reproductive toxicology (DART) studies. CDD’s drug development services employ state-of-the-art technology and an integrated program for both large and small molecules with facilities across three continents. CDD's nonclinical pathology group is comprised of certified veterinary pathologists who provide critical insights and recommendations to help customers navigate the drug development process. CDD’s safety pharmacology services utilize the Value Added Safety Pharmacology & Toxicology approach to economically assess pharmacology endpoints during toxicology studies to minimize safety issues during the clinical phases. DART services help customers assess the birth defect risk for potential drug candidates.
Biopharm CMC Manufacturing Solutions.
CMC offers packages supporting FDA Investigational New Drug Application and New Drug Application/Biologic License Application submissions, as well as programs to help CDD's customers meet acceptance criteria for the release of drug products for both biologics and small molecules. CMC provides well-coordinated capabilities and expertise operating within a global quality system framework to deliver robust, cost-effective solutions. Capabilities include safety, identity, strength, quality and purity assessments for biologics.
Early Phase Development Solutions.
Early Phase Development Solutions (EPDS)
offers customers access to a focused, multidisciplinary team of experts that crafts integrated solutions to rapidly identify and develop lead drug candidates and reduce development challenges. EPDS provides customers with seamless integration of the complete array of CDD nonclinical and
16
early clinical services, with a focus on scientific integrity and human subject safety. EPDS also offers an innovative parallel study approach for shorter proof-of-concept studies. This approach can increase clinical return on investment through the application of medical, scientific and therapeutic expertise, along with patient stratification strategies.
Central Laboratory Services
CDD provides central laboratory and specialty testing services to biopharmaceutical customers through its global network of central laboratories in the U.S., Switzerland, Singapore and China as well as its strategic agreement for central laboratory services testing in Japan with BML, Inc., a leading Japanese laboratory testing company.
CDD’s capabilities provide customers the flexibility to conduct studies on a global basis. Because CDD uses consistent laboratory equipment, methods, reagents and calibrators for studies, data can be combined with clinical trials in different regions to produce global trial reference ranges. Combinable data eliminates the cumbersome process of harmonizing results generated using different methods in different laboratories on different equipment. CDD also offers external-facing tools such as LabLink+ and Xcellerate
®
Investigator Portal, which are internet-based customer programs that allow customers to review and query clinical trial lab data on a near real-time basis, that provide an opportunity for enhanced collaboration between the investigator sites, CROs and sponsors.
CDD operates the world’s largest automated clinical trial sample collection kit production line, located in Indianapolis, Indiana. This facility provides kits and supplies to investigator sites around the world, promoting global consistency in sample collection. Extensive automation in the kit production process enables kits to be produced with 5.5 sigma precision, while maintaining the scalability needed to meet increasing global demand. CDD's biorepository facility in Greenfield, Indiana, is dedicated to long-term storage of clinical trial specimens. CDD has additional sample storage facilities in Indianapolis, Indiana; Geneva, Switzerland; Singapore; and Shanghai, China. These actively monitored facilities are able to store a wide range of specimens, including plasma, serum, whole blood, peripheral blood, DNA and tissue.
CDD has five ISO 15189-certified central laboratories that provide customers with the assurance that comes with this rigorous global standard. In addition to utilizing the broad scientific expertise of the LCD Specialty Testing Group, CDD has implemented a novel model for external lab selection and management that provides rigor and reduces internal resource drain for trial sponsors. The extended laboratory management solutions team focuses on managing all aspects of referral laboratory services, including vendor negotiations, governance, quality management, data services and contract services.
CDD, in conjunction with LCD’s expertise in a wide range of specialty and esoteric testing disciplines, offers a scientifically rich and diverse menu of specialty testing capabilities, spanning the clinical development continuum. These include applied genomics, next-generation sequencing, anatomic and molecular pathology, flow cytometry, clinical immunoassays as well as preclinical and exploratory biomarker development. The combination of CDD and LCD differentiated capabilities and unparalleled experience in companion and complementary diagnostic services support the parallel development of a new medicine and its associated diagnostic assay. The Company's dedicated companion diagnostics team has helped develop more than 70% of all currently available FDA-approved companion and complementary diagnostics, and worked on more than 165 global programs in this area in 2017. CDD can support the development of in-vitro diagnostic, companion diagnostics and laboratory-developed tests (LDT). By combining CDD’s strength in central laboratory and early-stage clinical development with LCD’s strength in test commercialization, the Company is well positioned to offer comprehensive, end-to-end support for companion diagnostic development.
Clinical Development and Commercialization Services
CDD offers a comprehensive range of clinical trial services, including the full management of Phase I through IV clinical studies, along with a wide offering of functional service provider (FSP) solutions. CDD has extensive experience in all major therapeutic areas, and provides the following core services either on an individual or aggregated basis to meet its customers’ needs: study design and modeling; coordination of study activities; trial logistics; monitoring of study site performance; clinical data management and biostatistical analysis; pharmacovigilance/safety assessments; and medical writing and regulatory services. CDD also has a dedicated group with extensive experience in the conduct of trials for medical devices, to provide services for the expanding market in medical devices, including wearable diagnostics.
CDD has extensive experience in designing and managing global clinical trials and regional clinical trial activities in North America, Europe, Latin America and the Asia-Pacific region. These trials may be conducted separately or simultaneously as part of a multinational or global development plan. CDD can manage every aspect of a clinical trial, from clinical development plans and protocol design to new drug applications and other supporting services.
CDD provides clinical pharmacology services at its four clinics in the U.S. and Europe, including first-in-human trials, and early clinical trial subject proof-of-concept studies of new pharmaceuticals.
17
CDD offers a range of commercialization solutions, including life cycle management and post-approval studies, which are typically conducted after a drug has successfully undergone clinical efficacy and safety testing and the New Drug Application has been submitted to the FDA and/or other regulatory bodies. CDD also offers market access solutions, including reimbursement consulting and hotlines, patient assistance programs, health economic and outcomes research services, observational studies, real world evidence and analytics services, and value communication services. Biopharmaceutical companies purchase these services to serve patients in need of therapy and to help optimize their return on R&D investments.
CDD Technology-Enabled Solutions
CDD’s technology-enabled solutions are designed to improve the drug development process, providing its biopharmaceutical customers with greater access to key data and improved management of trials. These proprietary tools include the award-winning Xcellerate informatics platform, the PharmAcuity suite of software applications, and the endpoint trial management solution.
Xcellerate integrates multiple sources of data to deliver unique and timely information throughout the course of customer studies. Xcellerate helps to reduce the cost, time, complexity and risk associated with clinical trials. These solutions leverage a highly innovative data integration and visualization technology that provides timely, secure, integrated and contextualized access to all clinical trial data to enable proactive risk management and informed decision making. Key Xcellerate modules include Forecasting & Site Selection, Clinical Trial Management, Monitoring, and Insights:
|
•
|
Xcellerate Forecasting & Site Selection enables customers to identify the optimal sites and investigators by drawing on the world’s largest proprietary clinical trial knowledge base.
|
|
•
|
Xcellerate Clinical Trial Management provides the foundational operating systems to enable frictionless execution of clinical trials.
|
|
•
|
Xcellerate Monitoring enables customers to improve data quality, clinical trial subject safety and protocol compliance in the execution of clinical trials by proactively identifying and mitigating risks at the study site and clinical trial subject level.
|
|
•
|
Xcellerate Insights enables effective operational oversight by providing interactive, up-to-date views of a broad range of operational metrics and key performance indicators at the study and portfolio levels through a secure collaboration portal.
|
PharmAcuity is a cloud-based suite of software applications that helps biopharmaceutical companies fine-tune their clinical trial strategy, planning, and design months before a given trial begins. The performance data available via PharmAcuity is derived from past trials and public data sources covering more than 130 countries, reflecting the worldwide nature of clinical trials. Key PharmAcuity modules include Metrics and Benchmarking, and Trial Forecasting:
PharmAcuity Metrics and Benchmarking enables a client to assess the performance of past trials relative to the current targets as well as set accurate and feasible targets for a variety of future trial milestones. Utilizing the rest of the pharmaceutical industry’s performance data as a benchmark allows the client to evaluate its own clinical trial performance against the industry, thus leading to better trial, enrollment, and country planning.
PharmAcuity Trial Forecasting empowers a client to forecast its own clinical trial performance and build different forecasting scenarios across multiple dimensions, all based on proprietary inputs and historical, contextual industry performances.
CDD’s endpoint trial management solutions offer interactive response technology (IRT) to provide visibility across a customer’s clinical development portfolio, allowing for optimization of study management and reduced trial supply costs while helping to bring novel therapies to market faster. Key endpoint modules include:
|
•
|
endpoint’s proprietary PULSE
®
platform is made up of pre-validated, configurable study components that enable rapid development and quicker modification to a customer’s existing IRT system. PULSE can help to streamline complex trial randomization methods, improve drug supply management, and simplify site, study, and subject management. The fully digital, mobile-ready system allows access to patient data and outcomes in real time.
|
|
•
|
endpoint’s DRIVE platform provides visibility into supplies management for an entire clinical development portfolio. This enables automated supply functionality to help minimize costs, reduce waste, and manage regulatory compliance across multiple trial sites.
|
CDD’s other proprietary technology assets include an investigator database and analytic methodologies that are utilized to design and manage site selection and clinical trial subject enrollment, and MarketPlace, a private, secure web portal providing potential investors or partners access to information about new drugs in development.
Together, CDD's technology-enabled solutions improve the quality and speed of clinical trials, resulting in reduced costs and increased market potential for biopharmaceutical company customers.
18
Customers
The Company provides its services to a broad range of customers. The primary customer groups serviced by the Company include:
MCOs.
The Company serves many MCOs, each of which operate on a national, regional or local basis.
Biopharmaceutical Companies.
The Company serves hundreds of biopharmaceutical companies, ranging from the world’s largest biopharmaceutical companies to emerging to mid-market organizations. Contracts with these institutions generally take the form of fee-for-service or fixed-price arrangements.
Physicians and Other Healthcare Providers.
Physicians who require clinical laboratory testing for their patients are a primary source of requests for LCD's testing services. Physicians may practice individually, or as part of small or large physician groups, including those operated as part of a broader health system. Fees for clinical laboratory testing services rendered for physicians are billed either to the physician, the physician group, the patient or the patient’s third-party payer, such as an MCO, Medicare or Medicaid. Billings are typically on a fee-for-service basis. If the billings are to the physician, they are based on a customer-specific fee schedule and are subject to negotiation. Otherwise, the patient or third-party payer is billed at the Company's patient fee schedule, subject to third-party payer contract terms and negotiation by physicians on behalf of their patients. Patient sales are recorded at the Company’s patient fee schedule, net of any discounts negotiated with physicians on behalf of their patients, or made available through charity care or an uninsured or underinsured patient program. Revenues received from Medicare and Medicaid billings are based on government-set fee schedules and reimbursement rules.
Hospitals and Health Systems.
The Company provides hospitals and health systems with services ranging from core and specialty testing to supply chain and technical support services, and the opportunity to be a research partner for participation in studies and clinical trials with CDD. Individual hospitals generally maintain on-site laboratories to perform immediately needed testing for patients receiving care. However, they also refer less time-sensitive procedures, less frequently needed procedures and highly specialized procedures to outside facilities, including independent clinical laboratories such as the Company and laboratories operated by larger hospitals or health systems. In some cases, a hospital’s on-site laboratory may be operated or managed by an outside contractor or independent laboratory, including the Company. The Company typically charges hospitals for any such tests on a fee-for-service basis that is derived from the Company’s client fee schedule. Fees for laboratory management services are typically billed monthly at contractual rates.
Other Customers.
The Company serves a broad range of other customers, governmental agencies, employers, patients and consumers, CROs, academic institutions, food and nutritional companies and independent clinical laboratories. These customers typically pay on a negotiated fee-for-service basis or based on a set fee schedule.
Capital Allocation
The Company believes it has a strong track record of deploying capital to investments that enhance the Company's business and returning capital to shareholders.
From 2013, the Company has invested net cash of approximately $6.5 billion and equity of $1.8 billion in strategic business acquisitions. These acquisitions have significantly expanded the Company’s service offerings, expanded its customer and revenue mix, as well as strengthened and broadened the scope of its geographic presence. The Company continues to evaluate acquisition opportunities that leverage the Company’s core competencies, complement existing scientific and technological capabilities, increase the Company’s presence in key geographic, therapeutic and strategic areas, and meet or exceed the Company’s financial criteria.
From 2013, the Company repurchased approximately $1.7 billion in shares at an average price of approximately $115.02 per share. Following the November 2014 announcement of the Covance acquisition, the Company temporarily suspended its share repurchases, but the Company subsequently resumed the repurchase program in the fourth quarter of 2016. During
2017
, the Company purchased
2.5
million shares of its common stock at a total cost of
$338.1
million. At the end of 2017, the Company had outstanding authorization from the board of directors to purchase an additional
$401.4
million of Company common stock. The repurchase authorization has no expiration date.
During 2017, the Company repaid $500.1 million of its Senior Notes, $493.0 million of its term loan, and $33.9 million of its zero coupon subordinated notes. In addition, the Company borrowed and repaid $
1,392.2
million of debt through its revolving credit facility within 2017. The Company will continue to evaluate all opportunities for strategic deployment of capital in light of market conditions.
From 2013, capital expenditures other than acquisitions have been $1.3 billion, representing approximately 3.0% of the Company’s total net revenues during the same period. The Company expects such capital expenditures in 2018 to be approximately 3.5% of net revenues, primarily in connection with projects to support growth in the Company's core businesses, facility expansion
19
and updates, ongoing projects related to LaunchPad within the LCD business, LaunchPad's expansion within the CDD business, and further acquisition integration initiatives.
Seasonality and External Factors
The Company experiences seasonality in both segments of its business. For example, testing volume generally declines during the year-end holiday period and other major holidays and can also decline due to inclement weather or natural disasters. Declines in testing volume reduce net revenues, operating margins and cash flows. Operations are also impacted by changes in the global economy, exchange rate fluctuations, political and regulatory changes, the progress of ongoing studies and the startup of new studies, as well as the level of expenditures made by the biopharmaceutical industry in R&D. The results of both segments are impacted by exchange rate fluctuations. Approximately 21.4% of the Company's net revenues are billed in currencies other than the U.S. dollar, with the Swiss franc, British pound, Canadian dollar and the euro representing the largest components of its currency exposure. The Company expects the inclusion of Chiltern for a full twelve months in 2018 will increase the Company's percentage of revenues billed in currencies other than the U.S. dollar. Given the seasonality and changing economic factors impacting the business, comparison of the results for successive quarters may not accurately reflect trends or results for the full year.
Investments in Joint Venture Partnerships
The Company holds investments in joint venture partnerships, with two located in Alberta, Canada, one located in Florence, South Carolina and several that were acquired through the Company's acquisition of PAML. These businesses are primarily represented by partnership agreements between the Company and other independent diagnostic laboratory investors. Under these agreements, all partners share in the profits and losses of the businesses in proportion to their respective ownership percentages. All partners are actively involved in the major business decisions made by each joint venture. The Company does not consolidate the results of these joint ventures. Effective June 30, 2015, the Company liquidated its interest in a joint venture partnership that had been located in Milwaukee, Wisconsin.
The first Canadian partnership is a leader in occupational testing across Canada similar to LCD's U.S. occupational testing services. The second Canadian partnership has a license to conduct diagnostic testing services in the province of Alberta. Substantially all of its revenue is received as reimbursement from the Alberta government's healthcare programs (AHS). In August 2016, AHS and the Canadian partnership reached an agreement to extend the contract for five additional years through March 2022, with the intent to have the services provided pursuant to the contract transferred to AHS at the end of the five-year period. In consideration of AHS acquiring the assets and assuming liabilities in accordance with the parties’ agreement, AHS will pay CAD $50.0 million to the partnership when the transfer is effective, subject to a working capital adjustment.
As a result of the acquisition of PAML, the Company acquired PAML’s ownership interests in six joint ventures. During 2017, the Company further acquired the ownership interests of the other members of two of the six joint ventures, and the Company’s ownership interest in one of the six joint ventures was acquired by the other member. During 2018, the Company intends to acquire the membership interests of the other members of an additional two of these six joint ventures and will continue to evaluate future options for the membership interests in the sixth joint venture. The Company will continue to record minority interests in the consolidated joint ventures for which final transactions have not yet been completed.
Sales, Marketing and Customer Service
LCD offers its diagnostic services through a sales force focused on serving the specific needs of customers in different market segments. These market segments generally include primary care, women's health, specialty medicine (e.g., infectious disease, endocrinology, gastroenterology and rheumatology), oncology, ACOs, and hospitals and health systems. LCD's general sales force is also supported by a team of clinical specialists that focuses on selling esoteric testing and meeting the unique needs of the specialty medicine markets.
CDD’s global sales activities are conducted by sales personnel in North America, Europe and the Asia-Pacific region. The sales force provides customer coverage across the biopharmaceutical industry for services including lead optimization, preclinical safety assessment, analytical services, clinical trials, central laboratories, biomarkers and companion diagnostics, market access and technology solutions. Customer segments called upon include global and regional biopharmaceutical companies, other CROs and academic institutions.
The sales force is responsible for both new sales and for customer retention and relationship building and is compensated through a combination of salaries, commissions and bonuses at levels commensurate with each individual’s qualifications, performance and responsibilities.
Information Systems
The Company is committed to developing and commercializing technology-enabled solutions to support its operations and provide better care. LCD and CDD each operate standard platforms for their core business services, and the Company operates
20
standard platforms for its financial and reporting systems. These standard systems provide consistency within workflows and information as well as a high level of system availability, security, and stability. LCD’s and CDD's primary laboratory systems, including standardized support for molecular diagnostics, digital pathology and enhanced specialty laboratory solutions, facilitate the processing of tests that generate the vast majority of LCD revenue and virtually all of CDD's central laboratory services revenue. The Company's centralized information systems are responsible for tremendous operational efficiencies, enabling the Company to achieve consistent, structured, and standardized operating results and superior patient care.
In addition, LCD and CDD each offer proprietary and industry-leading information systems, which are discussed in more detail in the sections dedicated to each of those segments.
Quality
LCD and CDD have comprehensive quality systems and processes that the Company believes are appropriate for their respective businesses. This includes licensing, credentialing, training and competency of professional and technical staff, and internal auditing. In addition to the Company's own quality assurance programs, many of the Company’s laboratories, facilities and processes are subject to on-site regulatory and accreditation evaluations, external proficiency testing programs, and surveys, as applicable, by local or national government agencies.
Virtually all facets of the Company’s services are subject to quality assurance programs and procedures, including sensitivity, specificity and reproducibility of tests; turnaround time; customer service; data integrity; patient satisfaction; and billing. The Company’s quality assurance program includes measures that compare current performance against desired performance goals to monitor critical aspects of service to its customers and patients.
The Company has procedures for monitoring its internal performance, as well as that of its vendors, suppliers and other key stakeholders. In addition, various groups and departments within the Company, including the Company's supply chain management department, CDD's clinical trial services global vendor management department, CDD's central laboratory services expanded laboratory management services department, LCD's National Office of Quality, and project management staff supporting LCD and CDD, provide oversight to monitor and control vendor products and performance, and play an essential role in the Company’s approach to quality through improvements in processes and automation.
Customer Interaction
.
Continual improvement in the customers’ experience with the Company is essential. Use of technology and workflow improvements within are helping to improve patient experience by: reducing patient wait times at PSCs by offering advance appointment scheduling and patient check-in through through LabCorp | PreCheck
; expediting the patient registration process at the PSC through
LabCorp | Express
;
enhancing the specimen collection process through LabCorp Touch and AccuDraw; and allowing patients to access their test results, obtain educational materials, schedule appointments and pay bills directly through LabCorp | Patient
TM
. LabCorp | Payer provides healthcare organizations with a centralized location to access test results and quality data. CDD processes permit faster clinical trial study start-up and subject enrollment along with timely delivery of established deliverables to enhance and improve customer interaction.
Specimen Management
.
The Company's standardized logistics and specimen tracking technologies allow the timely transportation, monitoring, and storage of specimens. The Company is continually working to maintain and improve its ability to timely collect, transport and track specimens from collection points to all Company or designated external locations. In December 2017, CDD acquired Global Specimen Solutions, Inc. (GSS), which has expertise in streamlined global specimen tracking, as well as tracking for informed consent, and live data analytics that deliver actionable insights from specimens across development programs. CDD had previously entered into a strategic alliance with GSS.
Quality Control
.
The Company regularly performs quality control testing. These may include in-process and post-process quality control checks; use of applicable control materials and reference standards, peer reviews, and data review meetings; programmed data edit checks to detect variances and unusual data patterns; dual programming; and mock runs.
LCD Internal Proficiency Testing
.
LCD has an extensive internal proficiency testing program to assess LCD's analytical and post-analytical phases of laboratory testing, accuracy, precision of its testing protocols, and technologist/technician performance. This program supplements the external proficiency programs required by the laboratory accrediting agencies.
Accreditation
.
The Company participates in numerous externally administered quality surveillance programs, including the College of American Pathologists (CAP) program. CAP is an independent non-governmental organization of board-certified pathologists that offers an accreditation program to which laboratories voluntarily subscribe. CAP has been granted deemed status authority by CMS to inspect clinical laboratories to determine adherence to the Clinical Laboratory Improvement Amendments (CLIA) requirements. The CAP program involves both on-site inspections of the laboratory and participation in CAP's proficiency testing program for all categories in which the laboratory is accredited. A laboratory's receipt of accreditation by CAP satisfies the CMS requirement for CLIA certification. LCD's major diagnostic laboratories, CDD's major central laboratory facilities, and CDD's Phase I clinical research unit in Dallas, Texas, are accredited by CAP.
21
The Company's forensic crime laboratory, located in Lorton, Virginia, is accredited to ISO/IEC 17025:2005 by the American Society of Crime Laboratory Directors/Laboratory Accreditation Board (ASCLD/LAB) in the discipline of biology and categories of nuclear DNA, mitochondrial DNA, body fluid identification and individual characteristic database testing. Under the accreditation program managed by the ASCLD/LAB, a crime laboratory undergoes a comprehensive and in-depth inspection to demonstrate that its management, operations, employees, procedures and instruments, physical plant, and security and personnel safety procedures meet stringent quality standards.
The Company's full-service forensic facilities in the U.K. are accredited to ISO/IEC 17025:2005 by the U.K. Accreditation Service (UKAS) in many areas of forensic analysis. These facilities provide crime scene investigative services, collecting samples for DNA analysis, mitochondrial DNA testing, microscopic analysis of tool marks and paint, and other forms of forensic testing.
The Company has multiple labs that have received ISO 15189 accreditation. ISO 15189 is an international standard that recognizes the quality and technical competence of medical laboratories. The Company has 18 laboratories in the U.S. and five laboratories outside of the U.S. accredited to this standard, in addition to the laboratory operated for CDD pursuant to a strategic agreement with BML, Inc. that also has this accreditation. The list below reflects the Company's labs that have achieved this accreditation and the year in which it was achieved.
LCD
|
▪
|
Regional Testing Facility, Raritan, New Jersey - January 2017
|
|
▪
|
Regional Testing Facility, Knoxville, Tennessee - November 2016
|
|
▪
|
Regional Testing Facility, San Antonio, Texas - July 2016
|
|
▪
|
Colorado Coagulation, Denver, Colorado - January 2016
|
|
•
|
Dynacare, Laval, Québec - March 2015
|
|
•
|
Regional Testing Facility, Dublin, Ohio - March 2015
|
|
•
|
Endocrine Sciences, Calabasas, California - January 2015
|
|
•
|
Regional Testing Facility, Dallas, Texas - April 2014
|
|
•
|
Regional Testing Facility, Denver, Colorado - March 2014
|
|
•
|
Integrated Genetics, Santa Fe, New Mexico - October 2013
|
|
•
|
Integrated Genetics, Westborough, Massachusetts - September 2013
|
|
•
|
Dynacare, Montreal, Québec - June 2013
|
|
•
|
Regional Testing Facility, Phoenix, Arizona - April 2013
|
|
•
|
Regional Testing Facility, Birmingham, Alabama - February 2013
|
|
•
|
Integrated Oncology, Brentwood, Tennessee - February 2012
|
|
•
|
ViroMed, Burlington, North Carolina - January 2012
|
|
•
|
Center for Molecular Biology and Pathology (CMBP), Research Triangle Park, North Carolina - February 2011
|
|
•
|
Regional Testing Facility, Tampa, Florida - January 2010
|
|
•
|
Integrated Oncology, Phoenix, Arizona - September 2009
|
CDD
|
•
|
Covance Central Laboratory Services Inc., Indianapolis, Indiana - August 2015
|
|
•
|
BML Covance Central Laboratory, Tokyo, Japan - March 2015 (Operated for CDD pursuant to a strategic agreement with BML, Inc.)
|
|
•
|
Covance Pharmaceutical Research and Development (Shanghai) Co. Ltd., Shanghai, China - March 2015
|
|
•
|
Covance (Asia) Pte. Ltd., Singapore - June 2014
|
|
•
|
Covance Central Laboratory Services SARL, Geneva, Switzerland - October 2013
|
Intellectual Property Rights
The Company relies on a combination of patents, trademarks, copyrights, trade secrets, and nondisclosure and non-competition agreements to establish and protect its proprietary technology. The Company has filed and obtained numerous patents in the U.S. and abroad, and regularly files patent applications, when appropriate, to establish and protect its proprietary technology. Occasionally, the Company also licenses U.S. and non-U.S. patents, patent applications, technology, trade secrets, know-how, copyrights or trademarks owned by others. The Company believes, however, that no single patent, technology, trademark, intellectual property asset or license is material to its business as a whole.
Patents covering the Company's technologies are subject to challenges. Issued patents may be successfully challenged, invalidated, circumvented, or declared unenforceable so that patent rights would not create an effective competitive barrier. In addition, the laws of some countries may not protect proprietary rights to the same extent as do the laws of the U.S.
Parties may file claims asserting that the Company's technologies infringe on their intellectual property. The Company cannot predict whether parties will assert such claims against it, or whether those claims will harm its business. If the Company is forced to defend against such claims, the Company could face costly litigation and diversion of management’s attention and resources.
22
As result of such disputes, the Company may have to develop costly non-infringing technology or enter into licensing agreements. These agreements, if necessary, may require financial or other terms that could have an adverse effect on the Company's business and financial condition.
Employees
As of December 31, 2017, the Company had nearly 60,000 employees worldwide, approximately 22.0% of whom were employed outside of the U.S. The Company's U.S. based subsidiaries have four collective bargaining agreements, which cover approximately 750 employees. Non-U.S. based subsidiaries have 52 collective bargaining agreements, which cover approximately 1,800 employees.
The Company’s success is highly dependent on its ability to attract and retain qualified employees, and the Company believes that it has good working relationships with its employees.
Regulation and Reimbursement
General
Because the Company operates in a number of distinct operating environments and in a variety of locations worldwide, it is subject to numerous, and sometimes overlapping, regulatory environments. Both the clinical laboratory industry and the drug development business are subject to significant governmental regulation at the national, state and local levels. As described below, these regulations concern licensure and operation of clinical laboratories, claim submission and reimbursement for laboratory services, healthcare fraud and abuse, drug development services, security and confidentiality of health information, quality, and environmental and occupational safety.
Regulation of Clinical Laboratories
Virtually all clinical laboratories operating in the U.S. must be certified by the federal government or by a federally approved accreditation agency. In most cases, that certification is regulated by CMS through CLIA. CLIA requires that applicable clinical laboratories meet quality assurance, quality control and personnel standards. Laboratories also must undergo proficiency testing and are subject to inspections. Clinical laboratories in locations other than the U.S. are generally subject to comparable regulation in their respective jurisdictions.
Standards for testing under CLIA are based on the complexity of the tests performed by the laboratory, with tests classified as “high complexity,” “moderate complexity,” or “waived.” Laboratories performing high-complexity testing are required to meet more stringent requirements than moderate-complexity laboratories. Laboratories performing only waived tests, which are tests determined by the FDA to have a low potential for error and requiring little oversight, may apply for a certificate of waiver exempting them from most CLIA requirements. All major and many smaller Company facilities hold CLIA certificates to perform high-complexity testing. The Company's remaining smaller testing sites hold CLIA certificates to perform moderate-complexity testing or a certificate of waiver. The sanctions for failure to comply with CLIA requirements include suspension, revocation or limitation of a laboratory's CLIA certificate, which is necessary to conduct business; cancellation or suspension of the laboratory's approval to receive Medicare and/or Medicaid reimbursement; as well as significant fines and/or criminal penalties. The loss or suspension of a CLIA certification, imposition of a fine or other penalties, or future changes in the CLIA law or regulations (or interpretation of the law or regulations) could have a material adverse effect on the Company.
The Company is also subject to state and local laboratory regulation. CLIA provides that a state may adopt laboratory regulations different from or more stringent than those under federal law, and a number of states have implemented their own laboratory regulatory requirements. State laws may require that laboratory personnel meet certain qualifications, specify certain quality controls, or require maintenance of certain records.
The Company believes that it is in compliance with all laboratory requirements applicable to its laboratories operated both within the U.S. and in other countries. The Company's laboratories have continuing programs to maintain operations in compliance with all such regulatory requirements, but no assurances can be given that the Company's laboratories will pass all future licensure or certification inspections.
FDA and Other Regulatory Agency Laws and Regulations
Various regulatory agencies, including the FDA in the U.S., have regulatory responsibility over the development, testing, manufacturing, labeling, advertising, marketing, distribution, and surveillance of diagnostic and therapeutic products and services, including certain products and services offered by the Company, and the development of therapeutic products that comprise the majority of CDD’s business. The FDA and other regulatory agencies periodically inspect and review the manufacturing processes and product performance of diagnostic and therapeutic products. These agencies have the authority to take various administrative and legal actions for noncompliance, such as fines, product suspensions, warning letters, recalls, injunctions and other civil and
23
criminal sanctions. There are similar national and regional regulatory agencies in the jurisdictions outside the U.S. in which the Company operates.
On October 3, 2014, the FDA issued draft guidance regarding FDA regulation of LDTs. On November 18, 2016, the FDA announced that it would not release final guidance at this time and instead would continue to work with stakeholders, the new administration, and Congress to determine the right approach, and on January 13, 2017, the FDA released a discussion paper outlining a possible risk-based approach for FDA and CMS oversight of LDTs. Later in 2017, the FDA indicated that Congress should enact legislation to address improved oversight of diagnostics including LDTs, rather than the FDA addressing the issue through administrative policy proposals. There are other regulatory and legislative proposals that would increase general FDA oversight of clinical laboratories and LDTs. The outcome and ultimate impact of such proposals on the Company is difficult to predict at this time.
CDD’s laboratory facilities and LCD's clinical laboratory facilities that perform testing in support of clinical trials, must conform to a range of standards and regulations, including GLP and good clinical practice (GCP), good manufacturing practice (GMP), human subject protection and investigational product exemption regulations, and quality system regulation (QSR) requirements, as applicable. The preclinical and clinical studies that the Company conducts are subject to periodic inspections by the FDA as well as other regulatory agencies in the jurisdictions outside the U.S. in which the Company operates, which may include, without limitation, the Medicines and Healthcare products Regulatory Agency (MHRA) in the U.K., the European Medicines Agency, the China Food and Drug Administration, and the Pharmaceuticals and Medical Devices Agency in Japan, to determine compliance with GLP and GCP as well as other applicable standards and regulations. If a regulatory agency determines during an inspection that the Company’s equipment, facilities, laboratories, operations, or processes do not comply with applicable regulations and conditions of GLP and/or GCP, the regulatory agency may issue a formal notice, which may be followed by a warning letter if observations are not addressed satisfactorily. Noncompliance may result in the regulatory agency seeking civil, criminal or administrative sanctions and/or remedies against the Company, including suspension of its operations.
Additionally, certain CDD services and activities, such as CMC services and manufacturing of investigational medicinal products for use in certain Phase I studies managed by CDD, must conform to current good manufacturing practice (cGMP). CDD is subject to periodic inspections by the FDA and the MHRA, as well as other regulatory agencies in the jurisdictions outside the U.S. in which the Company operates, in order to assess, among other things, cGMP compliance. If a regulatory agency identifies deficiencies during an inspection, it may issue a formal notice, which may be followed by a warning letter if observations are not addressed satisfactorily. Failure to maintain compliance with cGMP regulations and other applicable requirements of various regulatory agencies could result in fines, unanticipated compliance expenditures, suspension of manufacturing, enforcement actions, injunctions, or criminal prosecution.
The U.S Animal Welfare Act (AWA)
The conduct of animal research at CDD’s facilities in the U.S. must be in compliance with the AWA, which
governs the care and use of warm-blooded animals for research in the U.S. other than laboratory rats, mice and chickens, and is enforced through periodic inspections by the U.S. Department of Agriculture (USDA). The AWA establishes facility standards regarding several aspects of animal welfare, including housing, ventilation, lighting, feeding and watering, handling, veterinary care, and recordkeeping.
CDD complies with licensing and registration requirement standards set by the USDA and similar agencies in foreign jurisdictions such as the European Union and China for the care and use of regulated species. If the USDA determines that CDD’s equipment, facilities, laboratories or processes do not comply with applicable AWA standards, it may issue an inspection report documenting the deficiencies and setting deadlines for any required corrective actions. The USDA may impose fines, suspend and/or revoke animal research licenses or confiscate research animals. Other countries where the Company conducts business have similar laws and regulations with which the Company must also comply.
Payment for Clinical Laboratory Services
In 2017, LCD derived approximately 15.1% of its net revenue directly from the Medicare and Medicaid programs. In addition, LCD's other commercial laboratory testing business that is not directly related to Medicare or Medicaid nevertheless depends significantly on continued participation in these programs and in other government healthcare programs, in part because customers often want a single laboratory to perform all of their testing services. In recent years, both governmental and private sector payers have made efforts to contain or reduce healthcare costs, including reducing reimbursement for clinical laboratory services.
Reimbursement under the Medicare PFS is capped at different rates in each Medicare Administrative Contractor's jurisdiction. Pursuant to PAMA, reimbursement under the CLFS is set at a national rate that is updated every three years for most tests. State Medicaid programs are prohibited from paying more than the Medicare fee schedule limit for clinical laboratory services furnished to Medicaid recipients. Laboratories primarily bill and are reimbursed by Medicare and Medicaid directly for covered tests performed on behalf of Medicare and Medicaid beneficiaries; for beneficiaries that participate in Managed Medicare and Managed Medicaid plans, laboratory bills are submitted to and paid by MCOs that manage those plans. Approximately 12.1% of LCD's revenue is reimbursed under the CLFS.
24
Many pathology services performed by LCD are reimbursed by Medicare under the PFS. The PFS assigns relative value units to each procedure or service, and a conversion factor is applied to calculate the reimbursement. The PFS is also subject to adjustment on an annual basis. Such adjustments can impact both the conversion factor and relative value units. The Sustainable Growth Rate (SGR), the formula previously used to calculate the fee schedule conversion factor, would have resulted in significant decreases in payment for most physician services for each year since 2003. However, Congress intervened repeatedly to prevent these payment reductions, and the conversion factor was increased or frozen for the subsequent year. MACRA permanently replaced the SGR formula and transitioned PFS reimbursement to a value-based payment system. MACRA retroactively avoided a 21.2% reduction in PFS reimbursement that had been scheduled for April 1, 2015, and provided for PFS conversion factor increases of 0.5% from July 1, 2015 to December 31, 2015, and 0.5% in each of years 2016-2019, followed by 0.0% updates for 2020-2025, and updates that vary based on participation in alternative payment models in subsequent years. These changes to the conversion factor may be offset by reductions to the relative value units, as was the case with the 2016 PFS reductions. In addition, rates will be adjusted under the new Merit-Based Incentive Payment System beginning in 2019. Approximately 0.7% of LCD's revenue is reimbursed under the PFS.
In addition to changes in reimbursement rates, LCD is also impacted by changes in coverage policies for laboratory tests and annual CPT coding. Medicare, Medicaid and private payer diagnosis code requirements and payment policies negatively impact LCD's ability to be paid for some of the tests it performs. Further, some payers require additional information to process claims or have implemented prior authorization policies which delays or prohibits payment. CLFS coding and billing changes related to toxicology and other procedures were implemented in 2016 and 2017. The Company experienced delays in the pricing and implementation of the new toxicology codes; however, the Company largely overcame issues related to price and margins through direct negotiation with the associated payers. Limited coding and billing changes related to other procedure types are expected to be implemented in 2018. The Company expects some delays in pricing and implementation of these new codes.
Future changes in national, state and local laws and regulations (or in the interpretation of current regulations) affecting government payment for clinical laboratory testing could have a material adverse effect on the Company. Based on currently available information, the Company is unable to predict what type of changes in legislation or regulations, if any, will occur.
Privacy, Security and Confidentiality of Health Information and Other Personal Information
In the U.S., the Health Insurance Portability and Accountability Act of 1996 (HIPAA) was designed to address issues related to the security and confidentiality of health information and to improve the efficiency and effectiveness of the healthcare system by facilitating the electronic exchange of information in certain financial and administrative transactions. These regulations apply to health plans and healthcare providers that conduct standard transactions electronically and healthcare clearinghouses (covered entities). Six such regulations include: (i) the Transactions and Code Sets Rule; (ii) the Privacy Rule; (iii) the Security Rule; (iv) the Standard Unique Employer Identifier Rule, which requires the use of a unique employer identifier in connection with certain electronic transactions; (v) the National Provider Identifier Rule, which requires the use of a unique healthcare provider identifier in connection with certain electronic transactions; and (vi) the Health Plan Identifier Rule, which requires the use of a unique health plan identifier in connection with certain electronic transactions.
The Company believes that it is in compliance in all material respects with the current Transactions and Code Sets Rule. The Company implemented Version 5010 of the HIPAA Transaction Standards and believes it has fully adopted the ICD-10-CM code set. While to date the Company has not experienced any sustained disruption in receipts or indications of substantive reductions to reimbursement and net revenues related to the implementation of the ICD-10-CM code set, further future application of restrictive clinical or payment policies could negatively impact the Company. The Company believes it is in compliance in all material respects with applicable laws and regulations for electronic funds transfers and remittance advice transactions.
The Privacy Rule regulates the use and disclosure of protected health information (PHI) by covered entities. It also sets forth certain rights that an individual has with respect to his or her PHI maintained by a covered entity, such as the right to access or amend certain records containing PHI or to request restrictions on the use or disclosure of PHI. The Privacy Rule requires covered entities to contractually bind third parties, known as business associates, in the event that they perform an activity or service for or on behalf of the covered entity that involves the creation, receipt, maintenance, or transmission of PHI. The Company believes that it is in compliance in all material respects with the requirements of the HIPAA Privacy Rule.
The Security Rule establishes requirements for safeguarding patient information that is electronically transmitted or electronically stored. The Company believes that it is in compliance in all material respects with the requirements of the HIPAA Security Rule.
The U.S. Health Information Technology for Economic and Clinical Health Act (HITECH), which was enacted in February 2009, with regulations effective on September 23, 2013, strengthened and expanded the HIPAA Privacy and Security Rules and their restrictions on use and disclosure of PHI. HITECH includes, but is not limited to, prohibitions on exchanging PHI for remuneration and additional restrictions on the use of PHI for marketing. HITECH also fundamentally changes a business associate’s obligations by imposing a number of Privacy Rule requirements and a majority of Security Rule provisions directly on business
25
associates that were previously only directly applicable to covered entities. Moreover, HITECH requires covered entities to provide notice to individuals, HHS, and, as applicable, the media when unsecured PHI is breached, as that term is defined by HITECH. Business associates are similarly required to notify covered entities of a breach. The Company believes its policies and procedures are fully compliant with the HITECH requirements.
On February 6, 2014, CMS and HHS published final regulations that amended the HIPAA Privacy Rule to provide individuals (or their personal representatives) with the right to receive copies of their test reports from laboratories subject to HIPAA, or to request that copies of their test reports be transmitted to designated third parties. The Company revised its policies and procedures to comply with these new access requirements and updated its privacy notice to reflect individuals’ new access rights under this final rule.
The Standard Unique Employer Identifier Rule requires that employers have standard national numbers that identify them on standard transactions. The Employer Identification Number (also known as a Federal Tax Identification Number) issued by the Internal Revenue Service was selected as the identifier for employers and was adopted effective July 30, 2002. The Company believes it is in compliance with these requirements.
The administrative simplification provisions of HIPAA mandate the adoption of standard unique identifiers for healthcare providers. The intent of these provisions is to improve the efficiency and effectiveness of the electronic transmission of health information. The National Provider Identifier Rule requires that all HIPAA-covered healthcare providers, whether they are individuals or organizations, must obtain a National Provider Identifier (NPI) to identify themselves in standard HIPAA transactions. NPI replaces the unique provider identification number and other provider numbers previously assigned by payers and other entities for the purpose of identifying healthcare providers in standard electronic transactions. The Company believes that it is in compliance with the HIPAA National Provider Identifier Rule in all material respects.
The Health Plan Identifier (HPID) is a unique identifier designed to furnish a standard way to identify health plans in electronic transactions. CMS published the final rule adopting the HPID for health plans required by HIPAA on September 12, 2012. Effective October 31, 2014, CMS announced a delay, until further notice, in enforcement of regulations pertaining to health plan enumeration and use of the HPID in HIPAA transactions adopted in the HPID final rule. This delay remains in effect. The Company will continue to monitor future developments related to the HPID and respond accordingly.
Violations of the HIPAA provisions could result in civil and/or criminal penalties, including significant fines and up to 10 years in prison. HITECH also significantly strengthened HIPAA enforcement by increasing the civil penalty amounts that may be imposed, requiring HHS to conduct periodic audits to confirm compliance and authorizing state attorneys general to bring civil actions seeking either injunctions or damages in response to violations of the HIPAA privacy and security regulations that affect the privacy of state residents.
The total cost associated with meeting the ongoing requirements of HIPAA and HITECH is not expected to be material to the Company’s operations or cash flows. However, future regulations and interpretations of HIPAA and HITECH could impose significant costs on the Company.
In addition to the HIPAA regulations described above, numerous other data protection, privacy and similar laws govern the confidentiality, security, use and disclosure of personal information. These laws vary by jurisdiction, but they most commonly regulate or restrict the collection, use and disclosure of medical and financial information and other personal information. In the U.S., some state laws are more restrictive and, therefore, are not preempted by HIPAA. Penalties for violation of these laws may include sanctions against a laboratory's licensure, as well as civil and/or criminal penalties. Outside the U.S., numerous other countries have laws governing the collection, use, disclosure and transmission (including cross-border transfer) of personal information, including medical information. The legislative and regulatory landscape for privacy and data protection is complex and continually evolving. For example, in December 2015, the European Union approved a General Data Protection Regulation (GDPR) to replace Directive 95/46/EC, which will take effect May 25, 2018, governing use and transfer of personal data and imposing significant penalties for noncompliance. Additionally, data protection regulations have been enacted or updated in countries where the Company does business, including in Asia, Latin America, and Europe. Failure to comply with these regulations may result in, among other things, civil, criminal and contractual liability, fines, regulatory sanctions and damage to the Company’s reputation. The Company has established processes and frameworks to manage compliance with privacy and data protection requirements and is executing on its GDPR readiness project to support compliance with the GDPR.
On January 2, 2018, the Substance Abuse and Mental Health Services Administration (SAMHSA) announced the finalization of proposed changes to the Confidentiality of Substance Use Disorder Patient Records regulation, 42 CFR Part 2. This regulation protects the confidentiality of patient records relating to the identity, diagnosis, prognosis, or treatment that are maintained in connection with the performance of any federally assisted program or activity relating to substance use disorder education, prevention, training, treatment, rehabilitation, or research. Under the regulation, patient identifying information may only be released with the individual’s written consent, subject to certain limited exceptions. The latest changes to this regulation seek to align to its requirements more closely with HIPAA, while maintaining more stringent confidentiality of substance use disorder
26
information. The Company will adopt such changes to its policies and procedures as may be necessary for compliance.
Fraud and Abuse Laws and Regulations
Existing U.S. laws governing federal healthcare programs, including Medicare and Medicaid, as well as similar state laws, impose a variety of broadly described fraud and abuse prohibitions on healthcare providers, including clinical laboratories. These laws are interpreted liberally and enforced aggressively by multiple government agencies, including the U.S. Department of Justice, HHS’ Office of Inspector General (OIG), and various state agencies. Historically, the clinical laboratory industry has been the focus of major governmental enforcement initiatives. The U.S. government's enforcement efforts have been increasing over the past decade, in part as a result of the enactment of HIPAA, which included several provisions related to fraud and abuse enforcement, including the establishment of a program to coordinate and fund U.S., state and local law enforcement efforts. The Deficit Reduction Act of 2005 also included new requirements directed at Medicaid fraud, including increased spending on enforcement and financial incentives for states to adopt false claims act provisions similar to the U.S. False Claims Act. Amendments to the False Claims Act, and other enhancements to the U.S. fraud and abuse laws enacted as part of the ACA, have further increased fraud and abuse enforcement efforts and compliance risks. For example, the ACA established an obligation to report and refund overpayments from Medicare or Medicaid within 60 days of identification (whether or not paid through any fault of the recipient); failure to comply with this new requirement can give rise to additional liability under the False Claims Act and Civil Monetary Penalties statute.
The U.S. Anti-Kickback Statute prohibits knowingly providing anything of value in return for, or to induce the referral of, Medicare, Medicaid or other U.S. healthcare program business. Violations can result in imprisonment, fines, penalties, and/or exclusion from participation in U.S. healthcare programs. The OIG has published “safe harbor” regulations that specify certain arrangements that are protected from prosecution under the Anti-Kickback Statute if all conditions of the relevant safe harbor are met. Failure to fit within a safe harbor does not necessarily constitute a violation of the Anti-Kickback Statute; rather, the arrangement would be subject to scrutiny by regulators and prosecutors and would be evaluated on a case-by-case basis. Many states have their own Medicaid anti-kickback laws, and several states also have anti-kickback laws that apply to all payers (i.e., not just government healthcare programs).
From time to time, the OIG issues alerts and other guidance on certain practices in the healthcare industry that implicate the Anti-Kickback Statute or other fraud and abuse laws. Examples of such guidance documents particularly relevant to the Company and its operations follow.
In October 1994, the OIG issued a Special Fraud Alert on arrangements for the provision of clinical laboratory services. The Fraud Alert set forth a number of practices allegedly engaged in by some clinical laboratories and healthcare providers that raise issues under the U.S. fraud and abuse laws, including the Anti-Kickback Statute. These practices include: (i) providing employees to furnish valuable services for physicians (other than collecting patient specimens for testing) that are typically the responsibility of the physicians’ staff; (ii) offering certain laboratory services at prices below fair market value in return for referrals of other tests that are billed to Medicare at higher rates; (iii) providing free testing to physicians’ managed care patients in situations where the referring physicians benefit from such reduced laboratory utilization; (iv) providing free pickup and disposal of biohazardous waste for physicians for items unrelated to a laboratory’s testing services; (v) providing general-use facsimile machines or computers to physicians that are not exclusively used in connection with the laboratory services; and (vi) providing free testing for healthcare providers, their families and their employees (i.e., so-called “professional courtesy” testing). The OIG emphasized in the Special Fraud Alert that when one purpose of such arrangements is to induce referrals of program-reimbursed laboratory testing, both the clinical laboratory and the healthcare provider (e.g., physician) may be liable under the Anti-Kickback Statute, and may be subject to criminal prosecution and exclusion from participation in the Medicare and Medicaid programs. More recently, in June 2014, the OIG issued another Special Fraud Alert addressing compensation paid by laboratories to referring physicians for blood specimen processing and for submitting patient data to registries. This Special Fraud Alert reiterates the OIG's long-standing concerns about payments from laboratories to physicians in excess of the fair market value of the physician's services and payments that reflect the volume or value of referrals of federal U.S. program business.
The OIG has expressed additional concern about the provision of discounts on laboratory services billed to customers in return for the referral of U.S. healthcare program business. In a 1999 Advisory Opinion, the OIG concluded that a laboratory's offer to a physician of significant discounts on non-U.S. healthcare program laboratory tests might violate the Anti-Kickback Statute on the basis that such discounts could be viewed as in exchange for referrals by the physician of business to be billed by the laboratory to Medicare at non-discounted rates. In a 1999 correspondence, the OIG stated that a discount that a laboratory offers to a skilled nursing facility for tests billed to the skilled nursing facility to induce the referral of tests for which the laboratory is reimbursed by Medicare would implicate the Anti-Kickback Statute.
The OIG has also issued guidance in 1989 and 2003 regarding joint venture arrangements that may be viewed as suspect under the Anti-Kickback Statute. These documents have relevance to clinical laboratories that are part of (or are considering establishing) joint ventures with potential sources of U.S. healthcare program business. Some of the elements of joint ventures that the OIG identified as “suspect” include: arrangements in which the capital invested by referring providers is disproportionately
27
small and the return on investment is disproportionately large when compared to a typical investment; specific selection of investors who are in a position to make referrals to the venture; and arrangements in which one of the parties to the joint venture expands into a line of business that is dependent on referrals from the other party (sometimes called “shell” joint ventures). In a 2004 advisory opinion, the OIG expressed concern about a proposed joint venture in which a laboratory company would assist physician groups in establishing off-site pathology laboratories where the physicians' financial and business risk in the venture was minimal and the physicians would contract out substantially all laboratory operations, committing very little in the way of financial, capital, or human resources.
Violations of other fraud and abuse laws can also result in exclusion from participation in U.S. healthcare programs, including Medicare and Medicaid. One basis for such exclusion is an individual or entity’s submission of claims to Medicare or Medicaid that are substantially in excess of that individual or entity’s usual charges for like items or services. In a June 18, 2007, withdrawal of proposed rulemaking, the OIG stated that it would continue evaluating billing patterns on a case-by-case basis, noting that it is “concerned about disparities in the amounts charged to Medicare and Medicaid when compared to private payers,” that it continues to believe its exclusion authority for excess charges “provides useful backstop protection for the public from providers that routinely charge Medicare or Medicaid substantially more than their other customers” and that it will use “all tools available … to address instances where Medicare or Medicaid are charged substantially more than other payers.” An enforcement action by the OIG under this statutory exclusion basis or an enforcement action by Medicaid officials of similar state law restrictions could have an adverse effect on the Company.
Under another U.S. statute, known as the Stark Law or “self-referral” prohibition, physicians who have a financial or a compensation relationship with a commercial laboratory may not, unless an exception applies, refer Medicare patients for testing to the laboratory, regardless of the intent of the parties. Similarly, laboratories may not bill Medicare for services furnished pursuant to a prohibited self-referral. There are several Stark Law exceptions that are relevant to arrangements involving clinical laboratories, including: i) fair market value compensation for the provision of items or services; ii) payments by physicians to a laboratory for commercial laboratory services; iii) ancillary services (including laboratory services) provided within the referring physician's own office, if certain criteria are satisfied; iv) physician investment in a company whose stock is traded on a public exchange and has stockholder equity exceeding $75.0 million; and v) certain space and equipment rental arrangements that are set at a fair market value rate and satisfy other requirements. Many states have their own self-referral laws as well, which in some cases apply to all patient referrals, not just government reimbursement programs.
There are a variety of other types of U.S. and state fraud and abuse laws, including laws prohibiting submission of false or fraudulent claims. The Company seeks to conduct its business in compliance with all U.S. and state fraud and abuse laws. The Company is unable to predict how these laws will be applied in the future, and no assurances can be given that its arrangements will not be subject to scrutiny under such laws. Sanctions for violations of these laws may include exclusion from participation in Medicare, Medicaid and other U.S. or state healthcare programs, significant criminal and civil fines and penalties, and loss of licensure. Any exclusion from participation in a U.S. healthcare program, or material loss of licensure, arising from any action by any federal or state regulatory or enforcement authority, would likely have a material adverse effect on the Company's business. In addition, any significant criminal or civil penalty resulting from such proceedings could have a material adverse effect on the Company's business.
Environmental, Health and Safety
The Company is subject to licensing and regulation under national, state and local laws and regulations relating to the protection of the environment, and human health and safety laws and regulations relating to the handling, transportation and disposal of medical specimens, infectious and hazardous waste and radioactive materials. All Company laboratories are subject to applicable laws and regulations relating to biohazard disposal of all laboratory specimens, and the Company generally utilizes outside vendors for disposal of such specimens. In addition, the U.S. Occupational Safety and Health Administration (OSHA) has established extensive requirements relating to workplace safety for healthcare employers, including clinical laboratories, whose workers may be exposed to blood-borne pathogens such as HIV, HCV and hepatitis B virus (HCB). These regulations, among other things, require work practice controls, protective clothing and equipment, training, medical follow-up, vaccinations and other measures designed to minimize exposure to, and transmission of, blood-borne pathogens. Other countries where the Company conducts business have similar laws and regulations concerning the environment and human health and safety with which the Company must also comply.
In 2012, the OSHA Hazard Communication Standard was revised based on the adoption of the Globally Harmonized System that provides criteria for the classification of chemical hazards. Updated copies of Safety Data Sheets for chemical products used across the Company were obtained prior to the effective date of June 1, 2015.
The Company seeks to comply with all relevant environmental and human health and safety laws and regulations. Failure to comply could subject the Company to various administrative and/or other enforcement actions.
28
Drug Testing
Drug testing for public sector employees is regulated by the SAMHSA, which has established detailed performance and quality standards that laboratories must meet to be approved to perform drug testing on employees of U.S. government contractors and certain other entities. To the extent that the Company’s laboratories perform such testing, each must be certified as meeting SAMHSA standards. The Company’s laboratories in Research Triangle Park, North Carolina; Raritan, New Jersey; Houston, Texas; Southaven, Mississippi; Spokane, Washington; and St. Paul, Minnesota are all SAMHSA certified.
Controlled Substances
CDD handles controlled substances as part of the services it provides in preclinical testing and clinical trials. The use of controlled substances in testing for drugs of abuse is regulated by the U.S. Drug Enforcement Administration. The Company believes that it is in compliance with these regulations as applicable.
Compliance Program
The Company maintains a comprehensive, global compliance program that includes ongoing evaluation and monitoring of its compliance with the laws and regulations of the U.S. and the other countries in which it has operations. The objective of the Company’s compliance program is to develop, implement and update compliance safeguards, as appropriate. Emphasis is placed on developing and implementing compliance policies and guidelines, personnel training programs and monitoring and auditing activities. The compliance program demonstrates the Company's commitment to conducting business at the highest standards of ethical conduct and integrity.
The Company seeks to conduct its business in compliance with all statutes, regulations, and other requirements applicable to its clinical laboratory operations and drug development business. The clinical laboratory industry and drug development industries are, however, subject to extensive regulation, and many of these statutes and regulations have not been interpreted by the courts. In addition, the applicability or interpretation of statutes and regulations may not be clear in light of emerging changes in clinical testing science, healthcare technology, and healthcare organizations. Applicable statutes and regulations may be interpreted or applied by a prosecutorial, regulatory or judicial authority in a manner that would materially adversely affect the Company. Potential sanctions for violation of these statutes and regulations include significant civil and criminal penalties, fines, exclusion from participation in governmental healthcare programs, and the loss of various licenses, certificates, and authorizations necessary to operate, as well as potential liabilities from third-party claims, all of which could have a material adverse effect on the Company’s business.
Information Security
The Company's success depends on the efficient and uninterrupted operation of its computer and communications systems, and secure maintenance of personal and health information is critical to the Company’s business operations. The Company has experienced and expects to continue to experience attempts by computer programmers and hackers to attack and penetrate the Company’s layered security controls. Disruptions or breaches of security could have a material adverse effect on the Company’s business, regulatory compliance, financial condition and results of operations. The Company maintains information security procedures and has other safeguards in place intended to protect against such disruptions and breaches. These procedures and safeguards are monitored and routinely tested internally and by external parties. The Company has also implemented policies and procedures designed to comply with the HIPAA privacy and security requirements and other laws and regulations related to the privacy and security of personal or health information. In addition, the Company carries property and business interruption insurance. As cyber threats continue to evolve, the Company may be required to expend additional resources to continue to enhance the Company’s information security measures or to investigate and remediate any information security vulnerabilities.
Item 1A. Risk Factors
Investors should carefully consider all of the information set forth in this report, including the following risk factors, before deciding to invest in any of the Company’s securities. The risks below are not the only ones that the Company faces. Additional risks not presently known to the Company, or that it presently deems immaterial, may also negatively impact the Company. The Company’s business, consolidated financial condition, revenues, results of operations, profitability, reputation or cash flows could be materially impacted by any of these factors.
This report also includes forward-looking statements that involve risks or uncertainties. The Company’s results could differ materially from those anticipated in these forward-looking statements as a result of certain factors, including the risks described below and elsewhere. See “Forward-Looking Statements” in Item 7.
Changes in payer regulations or policies (or in the interpretation of current regulations or policies), insurance regulations or approvals, or changes in other laws, regulations or policies in the United States (U.S.) may adversely affect U.S.
29
governmental and third-party coverage or reimbursement for clinical laboratory testing and may have a material adverse effect upon the Company.
U.S. and state government payers, such as Medicare and Medicaid, as well as insurers, including managed care organizations (MCOs), have increased their efforts to control the cost, utilization and delivery of healthcare services. From time to time, Congress has considered and implemented changes in Medicare fee schedules in conjunction with budgetary legislation. The first phase of reductions pursuant to Protecting Access to Medicare Act (PAMA) came into effect on January 1, 2018, and will continue annually subject to certain phase-in limits through 2023, and without limitations for subsequent periods. Further reductions due to changes in policy regarding coverage of tests or other requirements for payment, such as prior authorization, diagnosis code and other claims edits, or a physician or qualified practitioner’s signature on test requisitions, may be implemented from time to time. Reimbursement for pathology services performed by LabCorp Diagnostics (LCD) is also subject to statutory and regulatory reduction. Reductions in the reimbursement rates and changes in payment policies of other third-party payers may occur as well. Such changes in the past have resulted in reduced payments as well as added costs and have decreased test utilization for the commercial laboratory industry by adding more complex new regulatory and administrative requirements. Further changes in third-party payer regulations, policies, or laboratory benefit or utilization management programs may have a material adverse effect on LCD's business. Actions by federal and state agencies regulating insurance, including healthcare exchanges, or changes in other laws, regulations, or policies may also have a material adverse effect upon LCD's business.
The Company could face significant monetary damages and penalties and/or exclusion from government programs if it violates federal, state, local or international laws including, but not limited to, anti-fraud and abuse laws.
The Company is subject to extensive government regulation at the federal, state, and local levels in the U.S. and other countries where it operates. The Company’s failure to meet governmental requirements under these regulations, including those relating to billing practices and financial relationships with physicians, hospitals, and health systems could lead to civil and criminal penalties, exclusion from participation in Medicare and Medicaid and possible prohibitions or restrictions on the use of its laboratories. While the Company believes that it is in material compliance with all statutory and regulatory requirements, there is a risk that government authorities might take a contrary position. Such occurrences, regardless of their outcome, could damage the Company’s reputation and adversely affect important business relationships it has with third parties.
The Company’s business could be harmed from the loss or suspension of a license or imposition of a fine or penalties under, or future changes in, or interpretations of, the law or regulations of the Clinical Laboratory Improvement Act of 1967, and the Clinical Laboratory Improvement Amendments of 1988 (CLIA), or those of Medicare, Medicaid or other national, state or local agencies in the U.S. and other countries where the Company operates laboratories.
The commercial laboratory testing industry is subject to extensive U.S. regulation, and many of these statutes and regulations have not been interpreted by the courts. CLIA extends federal oversight to virtually all clinical laboratories operating in the U.S. by requiring that they be certified by the federal government or by a federally approved accreditation agency. The sanction for failure to comply with CLIA requirements may be suspension, revocation or limitation of a laboratory’s CLIA certificate, which is necessary to conduct business, as well as significant fines and/or criminal penalties. In addition, the Company is subject to regulation under state law. State laws may require that laboratories and/or laboratory personnel meet certain qualifications, specify certain quality controls or require maintenance of certain records. The Company also operates laboratories outside of the U.S. and is subject to laws governing its laboratory operations in the other countries where it operates.
Applicable statutes and regulations could be interpreted or applied by a prosecutorial, regulatory or judicial authority in a manner that would adversely affect the Company's business. Potential sanctions for violation of these statutes and regulations include significant fines and the suspension or loss of various licenses, certificates and authorizations, which could have a material adverse effect on the Company’s business. In addition, compliance with future legislation could impose additional requirements on the Company, which may be costly.
U.S. Food and Drug Administration (FDA) regulation of diagnostic products and increased FDA regulation of laboratory-developed tests (LDTs) could result in increased costs and the imposition of fines or penalties, and could have a material adverse effect upon the Company’s business.
The FDA has regulatory responsibility for instruments, test kits, reagents and other devices used by clinical laboratories. The FDA enforces laws and regulations that govern the development, testing, manufacturing, performance, labeling, advertising, marketing, distribution and surveillance of diagnostic products, and it regularly inspects and reviews the manufacturing processes and product performance of diagnostic products. LCD’s point-of-care testing devices are subject to regulation by the FDA.
There are other regulatory and legislative proposals that would increase general FDA oversight of clinical laboratories and LDTs. On July 26, 2007, the FDA issued
Draft Guidance for Industry, Clinical Laboratories, and FDA Staff: In Vitro Diagnostic Multivariate Index Assays
. The guidance proposed certain changes to the agency's general past practice regarding the regulation of certain LDTs and announced that most devices deemed to be In Vitro Diagnostic Multivariate Index Assays (IVDMIAs) would
30
either be Class II or Class III devices, although it is possible that an IVDMIA for a low-risk indication could be Class I. Class II medical devices typically require FDA clearance or a premarket notification submission. Class III devices require the submission of an application for Premarket Approval. On October 3, 2014, the FDA published two additional draft guidance documents:
Framework for Regulatory Oversight of Laboratory Developed Tests (LDTs),
which provides an overview of how the FDA would regulate LDTs through a risk-based approach, and
FDA Notification and Medical Device Reporting for Laboratory Developed Tests,
which describes the process for clinical laboratories to notify the FDA of the LDTs they "manufacture" and describes the Medical Device Reporting requirements for LDTs. On May 28, 2015, and October 22, 2015, the House Energy and Commerce Health Subcommittee released discussion drafts of a bill that would reform oversight of in vitro clinical tests (IVCTs), including both LDTs and test kits. The bill would establish a new regulatory framework in which the FDA would regulate IVCTs under a new category separate from medical devices, and the Centers for Medicare and Medicaid Services (CMS) regulation of laboratories under CLIA would be modernized. On November 16, 2015, the FDA issued a report titled,
The Public Health Evidence for FDA Oversight of Laboratory Developed Tests: 20 Case Studies
(LDT Report). The LDT Report compiles 20 case studies involving LDTs where the FDA alleges that noncompliance with the FDA regulations led to serious issues, such as false-positive or false-negative results, causing potential or actual harm to patients. On December 29, 2015, the FDA published notice of its intent to finalize guidance on its policy for regulatory oversight of LDTs in 2016. However, on November 18, 2016, the FDA announced it would not release final guidance and instead would continue to work with stakeholders, the new administration and Congress to determine the right approach, and on January 13, 2017, the FDA released a discussion paper outlining a possible risk-based approach for FDA and CMS oversight of LDTs. Later in 2017, the Commissioner of the FDA indicated that Congress should enact legislation to address improved oversight of diagnostics including LDTs, rather than the FDA addressing the issue through administrative policy proposals. There are other regulatory and legislative proposals that would increase general FDA oversight of clinical laboratories and LDTs. The outcome and ultimate impact of such proposals on the business is difficult to predict at this time.
Current FDA regulation of the Company’s diagnostic products and potential
future increased regulation of the Company’s LDTs could result in increased costs and administrative and legal actions for noncompliance, including warning letters, fines, penalties, product suspensions, product recalls, injunctions and other civil and criminal sanctions, which could have a material adverse effect upon the Company.
Failure to comply with U.S., state, local or international environmental, health and safety laws and regulations, including the U.S. Occupational Safety and Health Administration Act and the U.S. Needlestick Safety and Prevention Act, could result in fines and penalties and loss of licensure, and have a material adverse effect upon the Company’s business.
As previously discussed in Item 1 of Part I of this report, the Company is subject to licensing and regulation under laws and regulations relating to the protection of the environment and human health and safety, including laws and regulations relating to the handling, transportation and disposal of medical specimens, infectious and hazardous waste and radioactive materials, as well as regulations relating to the safety and health of laboratory employees. Failure to comply with these laws and regulations could subject the Company to denial of the right to conduct business, fines, criminal penalties and/or other enforcement actions that would have a material adverse effect on its business. In addition, compliance with future legislation could impose additional requirements on the Company that may be costly.
Failure to comply with privacy and security laws and regulations could result in fines, penalties and damage to the Company’s reputation with customers and have a material adverse effect upon the Company’s business.
If the Company does not comply with existing or new laws and regulations related to protecting the privacy and security of personal or health information, it could be subject to monetary fines, civil penalties or criminal sanctions.
In the U.S., the Health Insurance Portability and Accountability Act of 1996 (HIPAA) privacy and security regulations, including the expanded requirements under U.S. Health Information Technology for Economic and Clinical Health Act (HITECH), establish comprehensive standards with respect to the use and disclosure of protected health information (PHI) by covered entities, in addition to setting standards to protect the confidentiality, integrity and security of PHI.
HIPAA restricts the Company’s ability to use or disclose PHI, without patient authorization, for purposes other than payment, treatment or healthcare operations (as defined by HIPAA), except for disclosures for various public policy purposes and other permitted purposes outlined in the privacy regulations. HIPAA and HITECH provide for significant fines and other penalties for wrongful use or disclosure of PHI in violation of the privacy and security regulations, including potential civil and criminal fines and penalties. The regulations establish a complex regulatory framework on a variety of subjects, including:
|
•
|
The circumstances under which the use and disclosure of PHI are permitted or required without a specific authorization by the patient, including, but not limited to, treatment purposes, activities to obtain payments for the Company’s services, and its healthcare operations activities;
|
|
•
|
A patient’s rights to access, amend and receive an accounting of certain disclosures of PHI;
|
|
•
|
The content of notices of privacy practices for PHI;
|
31
|
•
|
Administrative, technical and physical safeguards required of entities that use or receive PHI; and
|
|
•
|
The protection of computing systems maintaining electronic PHI.
|
The Company has implemented policies and procedures designed to comply with the HIPAA privacy and security requirements as applicable. The privacy and security regulations establish a “floor” and do not supersede state laws that are more stringent. Therefore, the Company is required to comply with both additional federal privacy and security regulations and varying state privacy and security laws. In addition, federal and state laws that protect the privacy and security of patient information may be subject to enforcement and interpretations by various governmental authorities and courts, resulting in complex compliance issues. For example, the Company could incur damages under state laws pursuant to an action brought by a private party for the wrongful use or disclosure of health information or other personal information.
The Company may also be required to comply with the data privacy and security laws of other countries in which it operates or with which it transfers and receives data. For example, in Europe both criminal and administrative sanctions are possible for violation of European Union (EU) member state implementations of the general data protection Directive 95/46/EC. In December 2015, the EU enacted a General Data Protection Regulation (GDPR) to replace Directive 95/46/EC, which will take effect May 25, 2018, and which has a broader application and enhanced penalties for noncompliance. The Company is executing on its GDPR readiness project to support compliance with the GDPR. The GDPR creates a range of new compliance obligations for subject companies and substantially increases financial penalties for non-compliance. The costs of compliance with the GDPR and the potential for fines and penalties in the event of a violation of the GDPR may have a significant adverse effect on the Company's business and operations. In addition, similar data protection regulations addressing access, use, disclosure and transfer of personal data have been enacted or updated in countries where the Company does business in Asia, Latin America, Canada and Europe. The Company expects to make changes to its business practices and to incur additional costs associated with compliance with these evolving and complex regulations.
Regulations requiring the use of standard transactions for healthcare services issued under HIPAA may negatively impact the Company’s profitability and cash flows.
Pursuant to HIPAA, the U.S. Department of Health and Human Services (HHS) has issued regulations designed to improve the efficiency and effectiveness of the healthcare system by facilitating the electronic exchange of information in certain financial and administrative transactions while protecting the privacy and security of the information exchanged. The HIPAA transaction standards are complex and subject to differences in interpretation by payers. For instance, some payers may interpret the standards to require the Company to provide certain types of information, including demographic information, not usually provided to the Company by physicians. In addition, requirements for additional standard transactions, such as claims attachments, could prove technically difficult, time-consuming or expensive to implement. As a result of inconsistent application of other transaction standards by payers or the Company’s inability to obtain certain billing information not usually provided to the Company by physicians, the Company could face increased costs and complexity, a temporary disruption in receipts and ongoing reductions in reimbursements and net revenues. While the Company is working closely with its payers to establish acceptable protocols for claim submission and with its trade association and an industry coalition to present issues and problems as they arise to the appropriate regulators and standards-setting organizations, it may not be successful in these efforts.
Failure to maintain the security of customer-related information or compliance with security requirements could damage the Company’s reputation with customers, cause it to incur substantial additional costs and become subject to litigation.
The Company receives certain personal and financial information about its customers. In addition, the Company depends upon the secure transmission of confidential information over public networks, including information permitting cashless payments. A compromise in the Company’s security systems that results in customer personal information being obtained by unauthorized persons or the Company’s failure to comply with security requirements for financial transactions could adversely affect the Company’s reputation with its customers and others, as well as the Company’s results of operations, financial condition and liquidity. It could also result in litigation against the Company and the imposition of fines and penalties.
Discontinuation or recalls of existing testing products; failure to develop or acquire licenses for new or improved testing technologies; or the Company’s customers using new technologies to perform their own tests could adversely affect the Company’s business.
From time to time, manufacturers discontinue or recall reagents, test kits or instruments used by the Company to perform laboratory testing. Such discontinuations or recalls could adversely affect the Company’s costs, testing volume and revenue.
The commercial laboratory industry is subject to changing technology and new product introductions. The Company’s success in maintaining a leadership position in genomic and other advanced testing technologies will depend, in part, on its ability to develop, acquire or license new and improved technologies on favorable terms and to obtain appropriate coverage and reimbursement for these technologies. The Company may not be able to negotiate acceptable licensing arrangements, and it cannot be certain that such arrangements will yield commercially successful diagnostic tests. If the Company is unable to license these
32
testing methods at competitive rates, its research and development (R&D) costs may increase as a result. In addition, if the Company is unable to license new or improved technologies to expand its esoteric testing operations, its testing methods may become outdated when compared with the Company’s competition, and testing volume and revenue may be materially and adversely affected.
In addition, advances in technology may lead to the development of more cost-effective technologies such as point-of-care testing equipment that can be operated by physicians or other healthcare providers (including physician assistants, nurse practitioners and certified nurse midwives, generally referred to herein as physicians) in their offices or by patients themselves without requiring the services of freestanding clinical laboratories. Development of such technology and its use by the Company’s customers could reduce the demand for its laboratory testing services and the utilization of certain tests offered by the Company and negatively impact its revenues.
Currently, most commercial laboratory testing is categorized as high or moderate complexity, and thereby is subject to extensive and costly regulation under CLIA. The cost of compliance with CLIA makes it impractical for most physicians to operate clinical laboratories in their offices, and other laws limit the ability of physicians to have ownership in a laboratory and to refer tests to such a laboratory. Manufacturers of laboratory equipment and test kits could seek to increase their sales by marketing point-of-care laboratory equipment to physicians and by selling test kits approved for home or physician office use to both physicians and patients. Diagnostic tests approved for home use are automatically deemed to be “waived” tests under CLIA and may be performed in physician office laboratories as well as by patients in their homes with minimal regulatory oversight. Other tests meeting certain FDA criteria also may be classified as “waived” for CLIA purposes. The FDA has regulatory responsibility over instruments, test kits, reagents and other devices used by clinical laboratories, and it has taken responsibility from the U.S. Centers for Disease Control and Prevention for classifying the complexity of tests for CLIA purposes. Increased approval of “waived” test kits could lead to increased testing by physicians in their offices or by patients at home, which could affect the Company’s market for laboratory testing services and negatively impact its revenues.
Healthcare reform and changes to related products (e.g., health insurance exchanges), changes in government payment and reimbursement systems, or changes in payer mix, including an increase in capitated reimbursement mechanisms and evolving delivery models, could have a material adverse effect on the Company's net revenues, profitability and cash flow.
LCD's testing services are billed to MCOs, Medicare, Medicaid, physicians and physician groups, hospitals, patients and employer groups. Tests ordered by a physician may be billed to different payers depending on the medical insurance benefits of a particular patient. Most testing services are billed to a party other than the physician or other authorized person who ordered the test. Increases in the percentage of services billed to government and MCOs could have an adverse effect on the Company’s net revenues.
The Company serves many MCOs. These organizations have different contracting philosophies, which are influenced by the design of their products. Some MCOs contract with a limited number of clinical laboratories and engage in direct negotiation of rates. Other MCOs adopt broader networks with generally uniform fee structures for participating clinical laboratories. In some cases, those fee structures are specific to independent clinical laboratories, while the fees paid to hospital-based and physician-office laboratories may be different, and are typically higher. MCOs may also offer Managed Medicare or Managed Medicaid plans. In addition, some MCOs use capitation rates to fix the cost of laboratory testing services for their enrollees. Under a capitated reimbursement arrangement, the clinical laboratory receives a per-member, per-month payment for an agreed upon menu of laboratory tests provided to MCO members during the month, regardless of the number of tests performed.
Capitation shifts the risk of increased test utilization (and the underlying mix of testing services) to the commercial laboratory provider. The Company makes significant efforts to ensure that its services are adequately compensated in its capitated arrangements. For the year ended December 31, 2017, such capitated contracts accounted for approximately $259.1 million, or 3.6%, of LCD's net revenues.
The Company's ability to attract and retain MCOs is critical given the impact of healthcare reform, related products and expanded coverage (e.g. health insurance exchanges and Medicaid expansion) and evolving delivery models (e.g., accountable care organizations).
A portion of the managed care fee-for-service revenues is collectible from patients in the form of deductibles, coinsurance and copayments. As patient cost-sharing has been increasing the Company's collections may be adversely impacted.
In addition, Medicare and Medicaid and private insurers have increased their efforts to control the cost, utilization and delivery of healthcare services, including commercial laboratory services. Measures to regulate healthcare delivery in general, and clinical laboratories in particular, have resulted in reduced prices, added costs and decreased test utilization for the commercial laboratory industry by increasing complexity and adding new regulatory and administrative requirements. Pursuant to legislation passed in late 2003, the percentage of Medicare beneficiaries enrolled in Managed Medicare plans has increased. The percentage of Medicaid beneficiaries enrolled in Managed Medicaid plans has also increased, and is expected to continue to increase; however, changes to, or repeal of, the Patient Protection and Affordable Care Act (ACA) may continue to affect coverage, reimbursement, and
33
utilization of laboratory services, as well as administrative requirements, in ways that are currently unpredictable. Further healthcare reform could adversely affect laboratory reimbursement from Medicare, Medicaid or commercial carriers.
The Company also experienced delays in the pricing and implementation of new molecular pathology codes among various payers, including Medicaid, Medicare and commercial carriers. While some delays were expected, several non-commercial payers required an extended period of time to price key molecular codes, and a number of those payers, mostly government entities, indicated that they would no longer pay for tests that they had previously covered. These issues (particularly payer policy changes) and changes in coverage had a negative impact on revenue, revenue per requisition, and margins and cash flows in 2014 through 2017, and are expected to have a continuing negative impact. Similarly, the Clinical Laboratory Fee Schedule (CLFS) coding and billing changes related to toxicology and other procedures were implemented in 2016 and 2017. The Company experienced delays in the pricing and implementation of the new toxicology codes; however, the Company largely overcame issues related to price and margins through direct negotiation with the associated payers. Limited coding and billing changes related to other procedure types are expected to be implemented in 2018. The Company expects some continued delays in the pricing and implementation of these new codes.
In addition, some MCOs are implementing, directly or through third parties, various types of laboratory benefit management programs that may include lab networks, utilization management tools (such as prior authorization and/or prior notification), and claims edits, which may impact coverage or reimbursement for commercial laboratory tests. Some of these programs address commercial laboratory testing broadly, while others are focused on molecular and genetic testing.
The Company expects the efforts to impose reduced reimbursement, more stringent payment policies, and utilization and cost controls by government and other payers to continue. If LCD cannot offset additional reductions in the payments it receives for its services by reducing costs, increasing test volume, and/or introducing new services and procedures, it could have a material adverse effect on the Company’s net revenues, profitability and cash flows. In 2014, Congress passed PAMA, requiring Medicare to change the way payment rates are calculated for tests paid under the CLFS, and to base the payment on the weighted median of rates paid by private payers. On June 23, 2016, CMS issued a final rule to implement PAMA that required applicable laboratories, including LCD, to begin reporting their test-specific private payer payment amounts to CMS during the first quarter of 2017. CMS exercised enforcement discretion to permit reporting for an additional 60 days, through May 30, 2017. CMS used that private market data to calculate weighted median prices for each test (based on applicable CPT codes) to represent the new CLFS rates beginning in 2018, subject to certain phase-in limits. For 2018-2020, a test price cannot be reduced by more than 10.0% per year; for 2021-2023, a test price cannot be reduced by more than 15.0% per year. The process of data reporting and repricing will be repeated every three years for Clinical Diagnostic Laboratory Tests (CDLTs). The second data reporting period for CDLTs will occur during the first quarter of 2020, and new CLFS rates for CDLTs will be established based on that data beginning in 2021, subject to the previously described phase-in limits for 2021-2023. The third data reporting period for CDLTs will occur during the first quarter of 2023, and new CLFS rates for CDLTs will be established based on that data beginning in 2024. CLFS rates for 2024 and subsequent periods will not be subject to phase-in limits. CLFS rates for Advanced Diagnostic Laboratory Tests (ADLTs) will be updated annually. CMS published its initial proposed CLFS rates under PAMA for 2018-2020 on September 22, 2017. Following a public comment period, CMS made adjustments and published final CLFS rates for 2018-2020 on November 17, 2017, with additional adjustments published on December 1, 2017. For 2018, the Company estimates that CLFS rates will reduce LCD revenue from all payers affected by the CLFS by a total of approximately 8% ($70.0 million). The Company supports the efforts of the American Clinical Laboratory Association (ACLA) to work with Congress on potential legislative reform of PAMA, which if enacted could reduce the negative impact of PAMA as implemented by CMS.
Healthcare reform legislation also contains numerous regulations that will require the Company, as an employer, to implement significant process and record-keeping changes to be in compliance. These changes increase the cost of providing healthcare coverage to employees and their families. Given the limited release of regulations to guide compliance, as well as potential changes to the ACA, the exact impact to employers, including the Company, is uncertain.
Changes in government regulation or in practices relating to the biopharmaceutical industry could decrease the need for certain services that Covance Drug Development (CDD) provides.
CDD assists biopharmaceutical companies in navigating the regulatory drug approval process. Changes in regulations such as a relaxation in regulatory requirements or the introduction of simplified drug approval procedures, or an increase in regulatory requirements that CDD has difficulty satisfying or that make its services less competitive, could eliminate or substantially reduce the demand for its services. Also, if government efforts to contain drug costs impact biopharmaceutical company profits from new drugs, or if health insurers were to change their practices with respect to reimbursement for biopharmaceutical products, some of CDD’s customers may spend less, or reduce their growth in spending on R&D.
On December 13, 2016, the 21st Century Cures Act was signed into law. This Act provides funding designed to increase government spending on certain drug development initiatives; contains several provisions designed to help make the drug development process more streamlined and efficient; and allows the FDA to increase staffing to support drug development, review
34
and regulation. These provisions should be helpful to biopharmaceutical companies and contract research organizations (CROs), including CDD, to the extent that they capitalize on the use of data, adaptive trial designs, real-world evidence, biomarkers and other development tools that are accepted by the FDA.
In addition, implementation of healthcare reform legislation that adds costs could limit the profits that can be made from the development of new drugs. This could adversely affect R&D expenditures by biopharmaceutical companies, which could in turn decrease the business opportunities available to CDD both in the U.S. and other countries. New laws or regulations may create a risk of liability, increase CDD costs or limit service offerings through CDD.
Failure to comply with the regulations of drug regulatory agencies, such as the FDA, the Medicines and Healthcare products Regulatory Agency in the United Kingdom (U.K.), the European Medicines Agency, the China Food and Drug Administration, and the Pharmaceuticals and Medical Devices Agency in Japan, could result in sanctions and/or remedies against CDD and have a material adverse effect upon the Company.
The operation of CDD's preclinical laboratory facilities and clinical trial operations must conform to good laboratory practice (GLP) and good clinical practice (GCP), as applicable, as well as all other applicable standards and regulations, as further described in Item 1 of Part I of this report. The business operations of CDD’s clinical and preclinical laboratories also require the import and export of medical devices, in vitro diagnostic devices, reagents, and human and animal biological products. Such activities are subject to numerous applicable local and international regulations with which CDD must comply or be subject to civil, criminal or administrative sanctions and/or remedies, including suspension of its ability to import or export to or from certain countries, which could have a material adverse effect upon the Company.
Additionally, certain CDD services and activities must conform to current good manufacturing practice (cGMP) as further described in Item 1 of Part I of this report. Failure to maintain compliance with GLP, GCP, or cGMP regulations and other applicable requirements of various regulatory agencies could result in warning letters, fines, unanticipated compliance expenditures, suspension of manufacturing, and civil, criminal or administrative sanctions and/or remedies against CDD, including suspension of its laboratory operations, which could have a material adverse effect upon the Company.
Increased competition, including price competition, could have a material adverse effect on the Company’s net revenues and profitability.
As further described in Item 1 of Part I of this report, both LCD and CDD operate in highly competitive industries. The commercial laboratory business is intensely competitive both in terms of price and service. Pricing of laboratory testing services is often one of the most significant factors used by physicians, third-party payers and consumers in selecting a laboratory. As a result of significant consolidation in the commercial laboratory industry, larger commercial laboratory providers are able to increase cost efficiencies afforded by large-scale automated testing. This consolidation results in greater price competition. LCD may be unable to increase cost efficiencies sufficiently, if at all, and as a result, its net earnings and cash flows could be negatively impacted by such price competition. The Company may also face increased competition from companies that do not comply with existing laws or regulations or otherwise disregard compliance standards in the industry. Additionally, the Company may also face changes in fee schedules, competitive bidding for laboratory services, or other actions or pressures reducing payment schedules as a result of increased or additional competition.
Competitors in the CRO industry range from hundreds of smaller CROs to a limited number of large CROs with global capabilities. CDD’s main competition consists of these small and large CROs, as well as in-house departments of biopharmaceutical companies and, to a lesser extent, select universities and teaching hospitals. CDD’s services have from time to time experienced periods of increased price competition that had an adverse effect on a segment's profitability and consolidated net revenues and net income. There is competition among CROs for both customers and potential acquisition candidates. Additionally, few barriers to entering the CRO industry further increases possible new competition.
These competitive pressures may affect the attractiveness or profitability of LCD’s and CDD’s services, and could adversely affect the financial results of the Company.
Failure to obtain and retain new customers, the loss of existing customers or material contracts, or a reduction in services or tests ordered or specimens submitted by existing customers, or the inability to retain existing and/or create new relationships with health systems could impact the Company’s ability to successfully grow its business.
To maintain and grow its business, the Company needs to obtain and retain new customers and business partners. In addition, a reduction in tests ordered or specimens submitted by existing customers, a decrease in demand for the Company's services from existing customers, or the loss of existing contracts, without offsetting growth in its customer base, could impact the Company's ability to successfully grow its business and could have a material adverse effect on the Company’s net revenues and profitability. The Company competes primarily on the basis of the quality of services, reporting and information systems, reputation in the medical community and the drug development industry, the pricing of services and ability to employ qualified personnel. The
35
Company's failure to successfully compete on any of these factors could result in the loss of existing customers, an inability to gain new customers and a reduction in the Company's business.
Continued and increased consolidation of MCOs, biopharmaceutical companies, health systems, physicians and other customers could adversely affect the Company's business.
Many healthcare companies and providers, including MCOs, biopharmaceutical companies, health systems and physician practices are consolidating through mergers, acquisitions, joint ventures and other types of transactions and collaborations. In addition to these more traditional horizontal mergers that involve entities that previously competed against each other, the healthcare industry is experiencing an increase in vertical mergers, which involve entities that previously did not offer competing goods or services. As the healthcare industry consolidates, competition to provide goods and services may become more intense, and vertical mergers may give those combined companies greater control over more aspects of healthcare, including increased bargaining power. This competition and increased customer bargaining power may adversely affect the price and volume of the Company’s services.
In addition, as the broader healthcare industry trend of consolidation continues, including the acquisition of physician practices by health systems, relationships with hospital-based health systems and integrated delivery networks are becoming more important. LCD has a well-established base of relationships with those systems and networks, including collaborative agreements. LCD's inability to retain its existing relationships with those physicians as they become part of healthcare systems and networks and/or to create new relationships could impact its ability to successfully grow its business.
LCD’s nutritional chemistry and food safety business exposes the Company to various risks, including liability for errors and omissions in work conducted for LCD customers.
LCD offers a range of product-development and product-integrity services to food and beverage manufacturers and retailers, industry organizations and academic institutions. LCD also is exploring the possibility of developing point-of-production testing for food safety. These business offerings and opportunities expose the Company to many of the same, or similar, risks that are applicable to other business activities of the Company, including with respect to the operations of its facilities and compliance with applicable laws and regulations. The agricultural, food, beverage and dietary supplement industries are continuing to gain the attention of governments and regulators around the world, and regulations and applicable laws have increased in recent years. For example, many food and beverage manufacturers and retailers will be subject to new nutrition labeling regulations and new food manufacturing requirements, including regulations issued under the Food Safety Modernization Act (FSMA). With these enhanced requirements on the Company’s customers, there is an increased risk that errors in or omissions from nutritional analysis and food safety tests conducted by the Company for its customers could result in liability for the Company under customer contracts. If LCD determines to further expand its nutritional chemistry and food safety testing business in the future beyond what is currently anticipated, LCD could become subject to additional standards and regulations, including under the FSMA, and could face additional liabilities resulting from new and pending regulatory and other legal actions.
Changes or disruption in services or supplies provided by third parties, including transportation, could adversely affect the Company’s business.
The Company depends on third parties to provide services critical to the Company’s business. Although the Company has a significant proprietary network of ground and air transport capabilities, certain of the Company's businesses are heavily reliant on third-party ground and air travel for transport of clinical trial and diagnostic testing supplies and specimens, research products, and people. A significant disruption to these travel systems, or the Company's access to them, could have a material adverse effect on the Company's business. The Company is also reliant on an extensive network of third-party suppliers and vendors of certain services and products, including for certain animal populations. Disruptions to the continued supply of these services, products, or animal populations may arise from export/import restrictions or embargoes, political or economic instability, pressure from animal rights activists, adverse weather, natural disasters, transportation disruptions, or other causes. Disruption of supply could have a material adverse effect on the Company’s business.
Damage or disruption to the Company’s facilities could adversely affect the Company’s business.
Many of the Company’s facilities could be difficult to replace in a short period of time. Any event that causes a disruption of the operation of these facilities might impact the Company's ability to provide service to customers and, therefore, could have a material adverse effect on the Company's financial condition, results of operations and cash flows.
The Company bears financial risk for contracts that, for reasons beyond the Company's control, may be underpriced, subject to cost overruns, delayed, or terminated or reduced in scope.
The Company has many contracts that are structured as fixed-price for fixed-contracted services or fee-for-service with a cap. The Company bears the financial risk if these contracts are underpriced or if contract costs exceed estimates. Such underpricing or significant cost overruns could have an adverse effect on the Company's business, results of operations, financial condition
36
and cash flows.
Many of CDD’s contracts, in particular, provide for services on a fixed-price or fee-for-service with a cap basis and they may be terminated or reduced in scope either immediately or upon notice. Cancellations may occur for a variety of reasons, including:
|
•
|
Failure of products to satisfy safety requirements;
|
|
•
|
Unexpected or undesired results of the products;
|
|
•
|
Insufficient clinical trial subject enrollment;
|
|
•
|
Insufficient investigator recruitment;
|
|
•
|
A customer's decision to terminate the development of a product or to end a particular study; and
|
|
•
|
CDD’s failure to perform its duties properly under the contract.
|
Although its contracts often entitle it to receive the costs of winding down the terminated projects, as well as all fees earned up to the time of termination, the loss, reduction in scope or delay of a large contract or the loss, delay or conclusion of multiple contracts could materially adversely affect CDD.
Contract research services in the drug development industry create liability risks.
In contracting to work on drug development trials and studies, CDD faces a range of potential liabilities, including:
|
•
|
Errors or omissions that create harm to clinical trial subjects during a trial or to consumers of a drug after the trial is completed and regulatory approval of the drug has been granted;
|
|
•
|
General risks associated with clinical pharmacology facilities, including negative consequences from the administration of drugs to clinical trial participants or the professional malpractice of clinical pharmacology physicians;
|
|
•
|
Risks that animals in CDD’s breeding facilities may be infected with diseases that may be harmful and even lethal to themselves and humans despite preventive measures contained in CDD's business policies, including those for the quarantine and handling of imported animals; and
|
|
•
|
Errors and omissions during a trial that may undermine the usefulness of a trial or data from the trial or study or may delay the entry of a drug to the market.
|
CDD contracts with physicians, also referred to as investigators, to conduct the clinical trials to test new drugs on clinical trial subjects. These tests can create a risk of liability for personal injury or death to clinical trial subjects resulting from negative reactions to the drugs administered or from professional malpractice by third party investigators.
While CDD endeavors to include in its contracts provisions entitling it to be indemnified and entitling it to a limitation of liability, these provisions do not uniformly protect CDD against liability arising from certain of its own actions. CDD could be materially and adversely affected if it were required to pay damages or bear the costs of defending any claim that is not covered by a contractual indemnification provision, or in the event that a party which must indemnify it does not fulfill its indemnification obligations, or in the event that CDD is not successful in limiting its liability or in the event that the damages and costs exceed CDD's insurance coverage. There can be no assurance that CDD will be able to maintain sufficient insurance coverage on acceptable terms.
Adverse results in material litigation matters could have a material adverse effect upon the Company’s business.
The Company may become subject in the ordinary course of business to material legal action related to, among other things, intellectual property disputes, contract disputes, data and privacy issues, professional liability and employee-related matters. The Company may also receive inquiries and requests for information from governmental agencies and bodies, including Medicare or Medicaid payers, requesting comment and/or information on allegations of billing irregularities, billing and pricing arrangements, or privacy practices that are brought to their attention through audits or third parties. Legal actions could result in substantial monetary damages as well as damage to the Company’s reputation with customers, which could have a material adverse effect upon its business.
The Company's quarterly operating results may vary.
The Company's operating results, particularly for CDD, may vary significantly from quarter to quarter and are influenced by factors over which the Company has little control, such as:
|
•
|
Changes in the general global economy;
|
|
•
|
Exchange rate fluctuations;
|
|
•
|
The commencement, completion, delay or cancellation of large projects or groups of projects;
|
|
•
|
The progress of ongoing projects;
|
|
•
|
The timing of and charges associated with completed acquisitions or other events; and
|
|
•
|
Changes in the mix of the Company's services.
|
The Company believes that operating results for any particular quarter are not necessarily a meaningful indication of future results. While fluctuations in the Company's quarterly operating results could negatively or positively affect the market price of
37
the Company's common stock, these fluctuations may not be related to the Company's future overall operating performance.
The failure to successfully obtain, maintain and enforce intellectual property rights and defend against challenges to the Company’s intellectual property rights could adversely affect the Company.
Many of the Company’s services, products and processes rely on intellectual property, including patents, copyrights, trademarks and trade secrets. In some cases, that intellectual property is owned by another party and licensed to the Company, sometimes exclusively. The value of the Company’s intellectual property relies in part on the Company’s ability to maintain its proprietary rights to such intellectual property. If the Company is unable to obtain or maintain the proprietary rights to its intellectual property, if it is unable to prevent attempted infringement against its intellectual property, or if it is unable to defend against claims that it is infringing on another party’s intellectual property, the Company could be adversely affected. These adverse effects could include the Company having to abandon, alter and/or delay the deployment of products, services or processes that rely on such intellectual property; having to procure and pay for licenses from the holders of intellectual property rights that the Company seeks to use; and having to pay damages, fines, court costs and attorney's fees in connection with intellectual property litigation.
CDD’s revenues depend on the biopharmaceutical industry.
CDD’s revenues depend greatly on the expenditures made by the biopharmaceutical industry in R&D. In some instances, biopharmaceutical companies are reliant on their ability to raise capital in order to fund their R&D projects. Biopharmaceutical companies are also reliant on reimbursement for their products from government programs and commercial payers. Accordingly, economic factors and industry trends affecting CDD’s customers in these industries may also affect CDD. If these companies were to reduce the number of R&D projects they conduct or outsource, whether through the inability to raise capital, reductions in reimbursement from governmental programs or commercial payers, industry trends, economic conditions or otherwise, CDD could be materially adversely affected.
Actions of animal rights activists may have an adverse effect on the Company.
CDD's preclinical services utilize animals in preclinical testing of the safety and efficacy of drugs. Such activities are required for the development of new medicines and medical devices under regulatory regimes in the U.S., Europe, Japan and other countries. CDD also breeds and sells animals for biomedical research. Acts of vandalism and other acts by animal rights activists who object to the use of animals in drug development could have an adverse effect on the Company.
Animal populations may suffer diseases that can damage CDD's inventory, harm its reputation, result in decreased sales of research products or result in other liability.
It is important that research products be free of diseases, including infectious diseases. The presence of diseases can distort or compromise the quality of research results, cause loss of animals in CDD’s inventory, result in harm to humans or outside animal populations if the disease is not contained to animals in inventory, or result in other losses. Such results could harm CDD’s reputation or have an adverse effect on CDD's financial condition, results of operations, and cash flows.
Failure to conduct animal research in compliance with animal welfare laws and regulations could result in sanctions and/or remedies against CDD and have a material adverse effect upon the Company.
The conduct of animal research at CDD’s facilities must be in compliance with applicable laws and regulations in the jurisdictions in which those activities are conducted. These laws and regulations include the U.S Animal Welfare Act (AWA), which governs the care and use of warm-blooded animals for research in the U.S. other than laboratory rats, mice and chickens, and is enforced through periodic inspections by the U.S. Department of Agriculture (USDA). The AWA establishes facility standards regarding several aspects of animal welfare, including housing, ventilation, lighting, feeding and watering, handling, veterinary care and recordkeeping. Similar laws and regulations apply in other jurisdictions in which CDD conducts animal research, including the European Union and China. CDD complies with licensing and registration requirement standards set by these laws and regulations in the jurisdictions in which it conducts animal research. If an enforcement agency determines that CDD’s equipment, facilities, laboratories or processes do not comply with applicable standards, it may issue an inspection report documenting the deficiencies and setting deadlines for any required corrective actions. For noncompliance, the agency may take action against CDD that may include fines, suspension and/or revocation of animal research licenses, or confiscation of research animals.
An inability to attract and retain experienced and qualified personnel could adversely affect the Company’s business.
The loss of key management personnel or the inability to attract and retain experienced and qualified employees at the Company’s clinical laboratories and drug development facilities could adversely affect the business. The success of the Company is dependent in part on the efforts of key members of its management team. Success in maintaining the Company’s leadership position in genomic and other advanced testing technologies and in drug development will depend in part on the Company’s ability to attract and retain skilled research professionals. In addition, the success of the Company’s clinical laboratories also depends on employing and retaining qualified and experienced laboratory professionals, including specialists, who perform commercial laboratory testing
38
services. In the future, if competition for the services of these professionals increases, the Company may not be able to continue to attract and retain individuals in its markets. The Company’s revenues and earnings could be adversely affected if a significant number of professionals terminate their relationship with the Company or become unable or unwilling to continue their employment.
Unionization of employees, union strikes, work stoppages or failure to comply with labor or employment laws could adversely affect the Company's operations and have a material adverse effect upon the Company's business.
The Company is a party to a limited number of collective bargaining agreements with various labor unions and is subject to employment and labor laws and unionization activity in the U.S. and other countries in which it conducts business. Disputes with regard to the terms of these agreements, potential inability to negotiate acceptable contracts with these unions, unionization activity, or a failure to comply with labor or employment laws could result in, among other things, labor unrest, strikes, work stoppages, slowdowns by the affected workers, fines and penalties. If any of these events were to occur, or other employees were to become unionized, the Company could experience a significant disruption of its operations or higher ongoing labor costs, either of which could have a material adverse effect upon the Company's business. Additionally, future labor agreements, or renegotiation of labor agreements or provisions of labor agreements, or changes in labor or employment laws, could compromise its service reliability and significantly increase its costs, which could have a material adverse effect upon the Company's business.
A significant increase in LCD's or CDD's days sales outstanding could have an adverse effect on the Company’s business, including its cash flow, by increasing its bad debt or decreasing its cash flow.
Billing for laboratory services is a complex process. Laboratories bill many different payers, including doctors, patients, hundreds of insurance companies, Medicare, Medicaid and employer groups, all of which have different billing requirements. In addition to billing complexities, LCD has experienced an increase in patient responsibility as a result of managed care fee-for-service plans that continue to increase deductibles, coinsurance and patient copayments. LCD expects this trend to continue. A material increase in LCD’s days sales outstanding level could have an adverse effect on the Company's business, including potentially increasing its bad debt rate and decreasing its cash flows. Although CDD does not face the same level of complexity in its billing process, it could also experience delays in billing or collection, and a material increase in CDD’s days sales outstanding could have an adverse effect on the Company’s business, including potentially decreasing its cash flows.
Failure in the Company’s information technology systems or delays or failures in the development and implementation of updates or enhancements to those systems could significantly increase testing turnaround time or delay billing processes and otherwise disrupt the Company’s operations or customer relationships.
The Company’s operations and customer relationships depend, in part, on the continued performance of its information technology systems. Despite network security measures and other precautions the Company has taken, its information technology systems are potentially vulnerable to physical or electronic break-ins, computer viruses and similar disruptions. In addition, the Company is in the process of integrating the information technology systems of its recently acquired subsidiaries, and the Company may experience system failures or interruptions as a result of this process. Sustained system failures or interruption of the Company’s systems in one or more of its operations could disrupt the Company’s ability to process laboratory requisitions, perform testing, provide test results or drug development data in a timely manner and/or bill the appropriate party. Failure of the Company’s information technology systems could adversely affect the Company’s business, profitability and financial condition.
Hardware and software failures, delays in the operation of computer and communications systems, the failure to implement new systems or system enhancements to existing systems, and cyber security breaches may harm the Company.
The Company's success depends on the efficient and uninterrupted operation of its computer and communications systems. A failure of the network or data-gathering procedures could impede the processing of data, delivery of databases and services, customer orders and day-to-day management of the business and could result in the corruption or loss of data. While certain operations have appropriate disaster recovery plans in place, there currently are not redundant facilities everywhere in the world to provide information technology capacity in the event of a system failure. Despite any precautions the Company may take, damage from fire, floods, hurricanes, power loss, telecommunications failures, computer viruses, break-ins, cybersecurity breaches and similar events at the Company's various computer facilities could result in interruptions in the flow of data to the servers and from the servers to customers. In addition, any failure by the computer environment to provide required data communications capacity could result in interruptions in service. In the event of a delay in the delivery of data, the Company could be required to transfer data collection operations to an alternative provider of server-hosting services. Such a transfer could result in delays in the ability to deliver products and services to customers. Additionally, significant delays in the planned delivery of system enhancements, or improvements and inadequate performance of the systems once they are completed could damage the Company's reputation and harm the business. Finally, long-term disruptions in the infrastructure caused by events such as natural disasters, the outbreak of war, the escalation of hostilities, acts of terrorism (particularly involving cities in which the Company has offices) and cybersecurity breaches could adversely affect the business. Although the Company carries property and business interruption insurance, the coverage may not be adequate to compensate for all losses that may occur.
39
Security breaches and unauthorized access to the Company's or its customers’ data could harm the Company’s reputation and adversely affect its business.
The Company has experienced and expects to continue to experience attempts by computer programmers and hackers to attack and penetrate the Company’s layered security controls. These attempts, if successful, could result in the misappropriation or compromise of personal information or proprietary or confidential information stored within the Company's systems, create system disruptions or cause shutdowns. External actors may be able to develop and deploy viruses, worms and other malicious software programs that attack the Company’s systems or otherwise exploit any security vulnerabilities. Outside parties may also attempt to fraudulently induce employees to take actions, including the release of confidential or sensitive information or to make fraudulent payments through illegal electronic spamming, phishing, spear phishing, or other tactics. Although the Company has robust information security procedures and other safeguards in place, which are monitored and routinely tested internally and by external parties, because the techniques used to obtain unauthorized access, disable or degrade service, or sabotage systems change frequently and often are not recognized until launched against a target, the Company may be unable to anticipate all of these techniques or to implement adequate preventive measures. In addition, as cyber threats continue to evolve, the Company may be required to expend additional resources to continue to enhance the Company’s information security measures or to investigate and remediate any information security vulnerabilities. The Company’s remediation efforts may not be successful and could result in interruptions, delays or cessation of service. Breaches of the Company’s security measures and the unauthorized dissemination of personal, proprietary or confidential information about the Company or its customers or other third-parties could expose customers’ private information. Such breaches could expose customers to the risk of financial or medical identity theft or expose the Company or other third-parties to a risk of loss or misuse of this information, result in litigation and potential liability for the Company, damage the Company’s brand and reputation or otherwise harm the Company’s business. Any of these disruptions or breaches of security could have a material adverse effect on the Company’s business, regulatory compliance, financial condition and results of operations.
Operations may be disrupted and adversely impacted by the effects of natural disasters such as adverse weather and earthquakes, acts of terrorism, or other criminal activities, or disease pandemics.
Natural disasters may result in a temporary decline of volumes in both segments. In addition, such events may temporarily interrupt the Company’s ability to transport specimens, the Company's ability to efficiently commence studies, the Company’s information technology systems, the Company’s ability to utilize certain laboratories, and/or the Company’s ability to receive material from its suppliers.
A significant deterioration in the economy could negatively impact testing volumes, drug development services, cash collections and the availability of credit.
The Company’s operations are dependent upon ongoing demand for diagnostic testing and drug development services by patients, physicians, hospitals, MCOs, biopharmaceutical companies and others. A significant downturn in the economy could negatively impact the demand for diagnostic testing and drug development services, as well as the ability of customers to pay for services rendered. In addition, uncertainty in the credit markets could reduce the availability of credit and impact the Company’s ability to meet its financing needs in the future.
Foreign currency exchange fluctuations could have an adverse effect on the Company’s business.
The Company has business and operations outside the U.S., and CDD derives a significant portion of its net revenues from international operations. Since the Company's consolidated financial statements are denominated in U.S. dollars, fluctuations in exchange rates from period to period will have an impact on reported results. In addition, CDD may incur costs in one currency related to its services or products for which it is paid in a different currency. As a result, factors associated with international operations, including changes in foreign currency exchange rates, could significantly affect CDD's results of operations, financial condition and cash flows.
The Company's international operations could subject it to additional risks and expenses that could adversely impact the business or results of operations.
The Company's international operations expose it to risks from failure to comply with foreign laws and regulations that differ from those under which the Company operates in the U.S. In addition, the Company may be adversely affected by other risks of expanded operations in foreign countries, including, but not limited to, changes in reimbursement by foreign governments for services provided by the Company; compliance with export controls and trade regulations; changes in tax policies or other foreign laws; compliance with foreign labor and employee relations laws and regulations; restrictions on currency repatriation; judicial systems that less strictly enforce contractual rights; countries that do not have clear or well-established laws and regulations concerning issues relating to commercial laboratory testing or drug development services; countries that provide less protection for intellectual property rights; and procedures and actions affecting approval, production, pricing, reimbursement and marketing of products and services. Further, international operations could subject the Company to additional expenses that the Company may not fully anticipate, including those related to enhanced time and resources necessary to comply with foreign laws and
40
regulations, difficulty in collecting accounts receivable and longer collection periods, and difficulties and costs of staffing and managing foreign operations. In some countries, the Company's success will depend in part on its ability to form relationships with local partners. The Company's inability to identify appropriate partners or reach mutually satisfactory arrangements could adversely affect the business and operations.
Expanded international operations may increase the Company’s exposure to liabilities under the anti-corruption laws.
Anti-corruption laws in the countries where the Company conducts business, including the FCPA, the Bribery Act, and similar laws in other jurisdictions, prohibit companies and their intermediaries from engaging in bribery including improperly offering, promising, paying or authorizing the giving of anything of value to individuals or entities for the purpose of corruptly obtaining or retaining business. The Company operates in some parts of the world where corruption may be common and where anti-corruption laws may conflict to some degree with local customs and practices. The Company maintains an anti-corruption program including policies, procedures and training and safeguards in the engagement and management of third parties acting on the Company’s behalf. Despite these safeguards, the Company cannot guarantee protection from corrupt acts committed by third parties associated with the Company. Violations or allegations of violations of anti-corruption laws could have a significant adverse effect on the business or results of operations.
Changes in tax laws and regulations or the interpretation of such may have a significant impact on the financial position, results of operations and cash flows of the Company.
U.S. and foreign governments continue to review, reform and modify tax laws, including with respect to the Organisation for Economic Co-operation and Development’s base erosion and profit shifting initiative. Changes in tax laws and regulations could result in material changes to the domestic and foreign taxes that the Company is required to provide for and pay.
In addition, the Company is subject to regular audits with respect to its various tax returns and processes in the jurisdictions in which it operates. Errors or omissions in tax returns, process failures or differences in interpretation of tax laws by tax authorities and the Company may lead to litigation, payments of additional taxes, penalties and interest.
On December 22, 2017, the U.S. Tax Cuts and Jobs Act (TCJA) was passed into law. The TCJA has given rise to significant one-time and ongoing changes to the taxes recognized and paid by the Company, and the full impact of the changes may only become fully understood over time.
A failure to identify and successfully close and integrate strategic acquisition targets could have a material adverse effect on the Company's business objectives and its net revenues and profitability.
Part of the Company's strategy involves deploying capital in investments that enhance the Company's business, which includes pursuing strategic acquisitions to strengthen the Company's scientific capabilities and enhance therapeutic expertise, enhance esoteric testing and global drug development capabilities, and increase presence in key geographic areas. Since 2013, the Company has invested net cash of approximately $6.5 billion and equity of $1.8 billion in strategic business acquisitions. However, the Company cannot assure that it will be able to identify acquisition targets that are attractive to the Company or that are of a large enough size to have a meaningful impact on the Company's operating results. Furthermore, the successful closing and integration of a strategic acquisition entails numerous risks, including, among others:
|
•
|
Failure to obtain regulatory clearance, including due to antitrust concerns;
|
|
•
|
Loss of key customers or employees;
|
|
•
|
Difficulty in consolidating redundant facilities and infrastructure and in standardizing information and other systems;
|
|
•
|
Unidentified regulatory problems;
|
|
•
|
Failure to maintain the quality of services that such companies have historically provided;
|
|
•
|
Coordination of geographically separated facilities and workforces; and
|
|
•
|
Diversion of management's attention from the day-to-day business of the Company.
|
The Company cannot assure that current or future acquisitions, if any, or any related integration efforts will be successful, or that the Company's business will not be adversely affected by any future acquisitions, including with respect to net revenues and profitability. Even if the Company is able to successfully integrate the operations of businesses that it may acquire in the future, the Company may not be able to realize the benefits that it expects from such acquisitions.
The Company’s level of indebtedness could adversely affect the Company’s liquidity, results of operations and business.
At December 31, 2017, indebtedness on the Company's outstanding Senior Notes totaled approximately $5,900.0 million in aggregate principal. The Company is also a party to credit agreements relating to a $1.0 billion revolving credit facility, a 2014 term loan with a principal balance of $72.0 million, and a 2017 term loan with a balance of $750.0 million as of December 31, 2017. Under the term loan facility and the revolving credit facility, the Company is subject to negative covenants limiting subsidiary indebtedness and certain other covenants typical for investment-grade-rated borrowers, and the Company is required to maintain a leverage ratio within certain limits.
41
The Company’s level of indebtedness could adversely affect its business. In particular, it could increase the Company’s vulnerability to sustained, adverse macroeconomic weakness, limit its ability to obtain further financing, and limit its ability to pursue certain operational and strategic opportunities, including large acquisitions.
The Company may also enter into additional transactions or credit facilities, including other long-term debt, which may increase its indebtedness and result in additional restrictions upon the business. In addition, major debt rating agencies regularly evaluate the Company's debt based on a number of factors. There can be no assurance that the Company will be able to maintain its existing debt ratings, and failure to do so could adversely affect the Company's cost of funds, liquidity and access to capital markets.
Global economic conditions and government and regulatory changes, including, but not limited to, the U.K.'s pending exit from the European Union (E.U.), could adversely impact the Company’s business and results of operations.
The Company could be adversely impacted due to the consequences of changes in the economy, governments or regulations across the globe. In June 2016, a majority of voters in the U.K. elected to withdraw from the E.U. (often referred to as Brexit) in a national referendum. Although the referendum was advisory, the current U.K. government is abiding by the referendum and is in negotiations to withdraw from the E.U. in the near future. The terms of any withdrawal and future relations between the E.U. and the U.K. are not yet determined. While it appears that E.U. laws and regulations will continue to apply in the U.K. until the withdrawal is completed, it is difficult to anticipate how the clinical trial landscape in the U.K. might change in the next several years.
This type of development or other government or regulatory change could depress economic activity, which could adversely impact the Company’s business, financial condition and results of operations. This could include long-term volatility in the currency markets and long-term detrimental effects on the value of affected currencies.
Item 1B. UNRESOLVED STAFF COMMENTS
None.
42
Item 2. PROPERTIES
The Company's corporate headquarters are located in Burlington, North Carolina, and include facilities that are both owned and leased.
LCD operates through a network of patient service centers, branches, rapid response laboratories, primary laboratories, and specialty laboratories. The table below summarizes certain information as to LCD's principal operating and administrative facilities as of
December 31, 2017
.
|
Location
|
Nature of Occupancy
|
|
Primary Facilities:
|
|
|
Birmingham, Alabama
|
Leased
|
|
Phoenix, Arizona
|
Owned
|
|
Prescott, Arizona
|
Leased
|
|
Calabasas, California
|
Leased
|
|
Los Angeles, California
|
Leased
|
|
Monrovia, California
|
Leased
|
|
San Diego, California
|
Leased
|
|
San Francisco, California
|
Leased
|
|
Tustin, California
|
Leased
|
|
Englewood, Colorado
|
Leased
|
|
Shelton, Connecticut
|
Leased
|
|
Hollywood, Florida
|
Leased
|
|
Tampa, Florida
|
Leased
|
|
Tucker, Georgia
|
Leased
|
|
Chicago, Illinois
|
Leased
|
|
Itasca, Illinois
|
Leased
|
|
Lenexa, Kansas
|
Leased
|
|
Louisville, Kentucky
|
Leased
|
|
Lafayette, Louisiana
|
Owned
|
|
Westborough, Massachusetts
|
Leased
|
|
Battle Creek, Michigan
|
Owned
|
|
Roseville, Minnesota
|
Leased
|
|
St. Paul, Minnesota
|
Owned
|
|
Kansas City, Missouri
|
Owned
|
|
Ewing, New Jersey
|
Leased
|
|
Raritan, New Jersey
|
Owned
|
|
Santa Fe, New Mexico
|
Owned
|
|
New York, New York
|
Leased
|
|
Burlington, North Carolina (5)
|
Owned/Leased
|
|
Charlotte, North Carolina
|
Leased
|
|
Greensboro, North Carolina
|
Leased
|
|
McLeansville, North Carolina
|
Leased
|
|
Raleigh, North Carolina
|
Leased
|
|
Research Triangle Park, North Carolina (3)
|
Leased
|
|
Dublin, Ohio
|
Owned
|
|
Oklahoma City, Oklahoma
|
Leased
|
|
Brentwood, Tennessee
|
Leased
|
|
Knoxville, Tennessee
|
Leased
|
|
Austin, Texas
|
Leased
|
|
Dallas, Texas
|
Leased
|
|
Houston, Texas
|
Leased
|
|
San Antonio, Texas
|
Leased
|
|
Chesapeake, Virginia
|
Leased
|
|
Herndon, Virginia
|
Leased
|
|
Lorton, Virginia
|
Leased
|
|
Seattle, Washington
|
Leased
|
|
Spokane, Washington (2)
|
Leased
|
|
Charleston, West Virginia
|
Leased
|
|
Abingdon, United Kingdom
|
Leased
|
43
CDD operates on a global scale. The table below summarizes certain information as to CDD's principal operating and administrative facilities as of
December 31, 2017
.
|
Location
|
Nature of Occupancy
|
|
Primary Facilities:
|
|
|
Mechelen, Belgium
|
Leased
|
|
Beijing, China (2)
|
Leased
|
|
Shanghai, China (3)
|
Owned/Leased
|
|
Muenster, Germany
|
Owned
|
|
Bangalore, India
|
Leased
|
|
Singapore
|
Leased
|
|
Harrogate, United Kingdom
|
Owned
|
|
Leeds, United Kingdom
|
Owned
|
|
Maidenhead, United Kingdom
|
Leased
|
|
Slough, United Kingdom
|
Leased
|
|
San Francisco, California
|
Leased
|
|
Indianapolis, Indiana
|
Leased
|
|
Alice, Texas
|
Owned
|
|
Chantilly, Virginia
|
Leased
|
|
Greenfield, Indiana
|
Owned
|
|
Gaithersburg, Maryland
|
Leased
|
|
Cranford, New Jersey
|
Leased
|
|
Princeton, New Jersey
|
Leased
|
|
West Trenton, New Jersey
|
Leased
|
|
Cary, North Carolina
|
Leased
|
|
Denver, Pennsylvania
|
Owned
|
|
Cumberland, Virginia
|
Owned
|
|
Geneva, Switzerland
|
Owned
|
|
Madison, Wisconsin
|
Owned
|
All of the Company’s primary laboratory and drug development facilities have been built or improved for the purpose of providing commercial laboratory testing or drug development services. The Company believes that these existing facilities and plans for expansion are suitable and adequate and will provide sufficient production capacity for the Company's currently foreseeable level of operations. The Company believes that if it were unable to renew a lease or if a lease were to be terminated on any of the facilities it presently leases, it could find alternate space at competitive market rates and readily relocate its operations to such new locations without material disruption to its operations.
|
Item 3.
|
LEGAL PROCEEDINGS (dollars in millions)
|
The Company is involved from time to time in various claims and legal actions, including arbitrations, class actions, and other litigation (including those described in more detail below), arising in the ordinary course of business. Some of these actions involve claims that are substantial in amount. These matters include, but are not limited to, intellectual property disputes; commercial and contract disputes; professional liability; employee-related matters; and inquiries, including subpoenas and other civil investigative demands, from governmental agencies, Medicare or Medicaid payers, managed care organizations (MCOs) reviewing billing practices or requesting comment on allegations of billing irregularities that are brought to their attention through billing audits or third parties. The Company receives civil investigative demands or other inquiries from various governmental bodies in the ordinary course of its business. Such inquiries can relate to the Company or other parties, including physicians and other healthcare providers (e.g., physician assistants and nurse practitioners, generally referred to herein as physicians). The Company works cooperatively to respond to appropriate requests for information.
The Company also is named from time to time in suits brought under the
qui tam
provisions of the False Claims Act and comparable state laws. These suits typically allege that the Company has made false statements and/or certifications in connection with claims for payment from U.S., federal or state healthcare programs. The suits may remain under seal (hence, unknown to the Company) for some time while the government decides whether to intervene on behalf of the
qui tam
plaintiff. Such claims are an inevitable part of doing business in the healthcare field today.
The Company believes that it is in compliance in all material respects with all statutes, regulations and other requirements applicable to its commercial laboratory operations and drug development support services. The healthcare diagnostics and drug development industries are, however, subject to extensive regulation, and the courts have not interpreted many of the applicable statutes and regulations. Therefore, the applicable statutes and regulations could be interpreted or applied by a prosecutorial, regulatory or judicial authority in a manner that would adversely affect the Company. Potential sanctions for violation of these statutes and regulations include significant civil and criminal penalties, fines, the loss of various licenses, certificates and authorizations, additional liabilities from third-party claims, and/or exclusion from participation in government programs.
44
Many of the current claims and legal actions against the Company are in preliminary stages, and many of these cases seek an indeterminate amount of damages. The Company records an aggregate legal reserve, which is determined using calculations based on historical loss rates and assessment of trends experienced in settlements and defense costs. In accordance with Financial Accounting Standards Board (FASB) Accounting Standards Codification Topic 450 “Contingencies,” the Company establishes reserves for judicial, regulatory, and arbitration matters outside the aggregate legal reserve if and when those matters present loss contingencies that are both probable and estimable and would exceed the aggregate legal reserve. When loss contingencies are not both probable and estimable, the Company does not establish separate reserves.
The Company is unable to estimate a range of reasonably probable loss for the proceedings described in more detail below in which damages either have not been specified or, in the Company's judgment, are unsupported and/or exaggerated and (i) the proceedings are in early stages; (ii) there is uncertainty as to the outcome of pending appeals or motions; (iii) there are significant factual issues to be resolved; and/or (iv) there are novel legal issues to be presented. For these proceedings, however, the Company does not believe, based on currently available information, that the outcomes will have a material adverse effect on the Company's financial condition, though the outcomes could be material to the Company's operating results for any particular period, depending, in part, upon the operating results for such period. The amount of ultimate loss may also differ from the Company’s estimates. It is possible that an unfavorable outcome that exceeds the Company’s current accrued estimate, if any, for one or more of the matters below could have a material adverse effect on the Company’s financial condition.
As previously reported, the Company reached a settlement in the previously disclosed lawsuit,
California ex rel. Hunter
Laboratories, LLC et al. v. Quest Diagnostics Incorporated, et al.
(Hunter Labs Settlement Agreement), to avoid the uncertainty and costs associated with prolonged litigation. Pursuant to the executed Hunter Labs Settlement Agreement, the Company recorded a litigation settlement expense of
$34.5
in the second quarter of 2011 (net of a previously recorded reserve of
$15.0
) and paid the settlement amount of
$49.5
in the third quarter of 2011. The Company also agreed to certain reporting obligations regarding its pricing for a limited time period and, at the option of the Company in lieu of such reporting obligations, to provide Medi-Cal with a discount from Medi-Cal's otherwise applicable maximum reimbursement rate from November 1, 2011, through October 31, 2012. In 2011, the California legislature enacted Assembly Bill No. 97, which imposed a
10.0%
Medi-Cal payment cut on most providers of healthcare services, including clinical laboratories. In 2012, the California legislature enacted Assembly Bill No. 1494, which directed the Department of Healthcare Services (DHCS) to establish new reimbursement rates for Medi-Cal commercial laboratory services based on payments made to California clinical laboratories for similar services by other third-party payers, and provided that until the new rates are set through this process, Medi-Cal payments for commercial laboratory services will be reduced (in addition to a
10.0%
payment reduction imposed by Assembly Bill No. 97 in 2011) by “up to 10 percent” for tests with dates of service on or after July 1, 2012, with a cap on payments set at
80.0%
of the lowest maximum allowance established under the Medicare program. Under the terms of the Hunter Labs Settlement Agreement, the enactment of this California legislation terminated the Company's reporting obligations (or obligation to provide a discount in lieu of reporting) under that agreement. In April 2015, CMS approved a
10.0%
payment reduction under Assembly Bill No. 1494. The new rate methodology established new rates that were effective July 1, 2015, but these new rates were not entered into the state computer system until February 2016. The 2016 rates have been implemented and recoupments began in 2017. Taken together, these changes are not expected to have a material impact on the Company's consolidated revenues or results of operations.
As previously reported, the Company responded to an October 2007 subpoena from the U.S. Department of Health & Human Services Office of Inspector General's regional office in New York. On August 17, 2011, the United States District Court for the Southern District of New York unsealed a False Claims Act lawsuit,
United States of America ex rel. NPT Associates v. Laboratory Corporation of America Holdings
, which alleges that the Company offered UnitedHealthcare kickbacks in the form of discounts in return for Medicare business. The Plaintiff's Third Amended Complaint further alleges that the Company's billing practices violated the False Claims Acts of 14 states and the District of Columbia. The lawsuit seeks actual and treble damages and civil penalties for each alleged false claim, as well as recovery of costs, attorney's fees, and legal expenses. Neither the U.S. government nor any state government has intervened in the lawsuit. The Company's Motion to Dismiss was granted in October 2014 and Plaintiff was granted the right to replead. On January 11, 2016, Plaintiff filed a motion requesting leave to file an amended complaint under seal and to vacate the briefing schedule for the Company's motion to dismiss while the government reviews the amended complaint. The Court granted the motion and vacated the briefing dates. Plaintiff then filed an amended complaint under seal. The Company will vigorously defend the lawsuit.
In addition, the Company has received various other subpoenas since 2007 related to Medicaid billing. In October 2009, the Company received a subpoena from the State of Michigan Department of Attorney General seeking documents related to its billing to Michigan Medicaid. The Company cooperated with this request. In October 2013, the Company received a civil investigative demand from the State of Texas Office of the Attorney General requesting documents related to its billing to Texas Medicaid. The Company is cooperating with this request.
On May 2, 2013, the Company was served with a False Claims Act lawsuit,
State of Georgia ex rel. Hunter Laboratories, LLC
and
Chris Riedel v. Quest Diagnostics Incorporated, et al.
, filed in the State Court of Fulton County, Georgia. The lawsuit, filed by a competitor laboratory, alleges that the Company overcharged Georgia's Medicaid program. The State of Georgia filed a Notice
45
of Declination on August 13, 2012, before the Company was served with the Complaint. The case was removed to the United States District Court for the Northern District of Georgia. The lawsuit seeks actual and treble damages and civil penalties for each alleged false claim, as well as recovery of costs, attorney's fees, and legal expenses. On March 14, 2014, the Company's Motion to Dismiss was granted. The Plaintiffs repled their complaint, and the Company filed a Motion to Dismiss the First Amended Complaint. In May 2015, the Court dismissed the Plaintiffs' anti-kickback claim and remanded the remaining state law claims to the State Court of Fulton County. In July 2015, the Company filed a Motion to Dismiss these remaining claims. The Plaintiffs filed an opposition to the Company's Motion to Dismiss in August 2015. Also, the State of Georgia filed a brief as
amicus curiae
. The Company will vigorously defend the lawsuit.
On August 24, 2012, the Company was served with a putative class action lawsuit,
Sandusky Wellness Center, LLC, et al. v. MEDTOX Scientific, Inc., et al.
, filed in the United States District Court for the District of Minnesota. The lawsuit alleges that on or about February 21, 2012, the defendants violated the U.S. Telephone Consumer Protection Act (TCPA) by sending unsolicited facsimiles to Plaintiff and more than
39
other recipients without the recipients' prior express invitation or permission. The lawsuit seeks the greater of actual damages or the sum of
$0.0005
for each violation, subject to trebling under the TCPA, and injunctive relief. In September of 2014, Plaintiff’s Motion for Class Certification was denied. In January of 2015, the Company’s Motion for Summary Judgment on the remaining individual claim was granted. Plaintiff filed a notice of appeal. On May 3, 2016, the United States Court of Appeals for the Eighth Circuit issued its decision and order reversing the District Court’s denial of class certification. The Eighth Circuit remanded the matter for further proceedings. On December 7, 2016, the District Court granted the Plaintiff's renewed Motion for Class Certification. The Company will vigorously defend the lawsuit.
On August 31, 2015, the Company was served with a putative class action lawsuit,
Patty Davis v. Laboratory Corporation of America, et al.,
filed in the Circuit Court of the Thirteenth Judicial Circuit for Hillsborough County, Florida. The complaint alleges that the Company violated the Florida Consumer Collection Practices Act by billing patients who were collecting benefits under the Workers’ Compensation Statutes. The lawsuit seeks injunctive relief and actual and statutory damages, as well as recovery of attorney's fees and legal expenses. In April 2017, the Circuit Court granted the Company's Motion for Judgment on the Pleadings. The Plaintiff has appealed the Circuit Court's ruling to the Florida Second District Court of Appeal. The Company will vigorously defend the lawsuit.
In December 2014, the Company received a Civil Investigative Demand issued pursuant to the U.S. False Claims Act from the U.S. Attorney’s Office for South Carolina, which requests information regarding remuneration and services provided by the Company to physicians who also received draw and processing/handling fees from competitor laboratories Health Diagnostic Laboratory, Inc. and Singulex, Inc. The Company is cooperating with the request.
On August 3, 2016, Covance Inc. was served with a putative class action lawsuit,
Daniel L. Bloomquist v. Covance Inc., et al.
, filed in the Superior Court of California, County of San Diego. The complaint alleges that Covance violated the California Labor Code and California Business & Professions Code by failing to provide overtime wages, failing to provide meal and rest periods, failing to pay for all hours worked, failing to pay for all wages owed upon termination, and failing to provide accurate itemized wage statements to clinical research associates and senior clinical research associates employed by Covance Inc. (Covance) in California. The lawsuit seeks monetary damages, civil penalties, injunctive relief, and recovery of attorney's fees and costs. On October 13, 2016, the case was removed to the United States District Court for the Southern District of California. The Company will vigorously defend the lawsuit.
Prior to the Company’s acquisition of Sequenom, between August 15, 2016 and August 24, 2016, six putative class-action lawsuits were filed on behalf of purported Sequenom stockholders (captioned
Malkoff v. Sequenom, Inc., et al.
, No. 16-cv-02054-JAH-BLM,
Gupta v. Sequenom, Inc., et al.
, No. 16-cv-02084-JAH-KSC,
Fruchter v. Sequenom, Inc., et al.
, No. 16-cv-02101-WQH-KSC,
Asiatrade Development Ltd. v. Sequenom, Inc., et al.
, No. 16-cv-02113-AJB-JMA,
Nunes v. Sequenom, Inc., et al.
, No. 16-cv-02128-AJB-MDD, and
Cusumano v. Sequenom, Inc., et al.
, No. 16-cv-02134-LAB-JMA) in the United States District Court for the Southern District of California challenging the acquisition transaction. The complaints asserted claims against Sequenom and members of its board of directors (the Individual Defendants). The
Nunes
action also named the Company and Savoy Acquisition Corp. (Savoy), a wholly owned subsidiary of the Company, as defendants. The complaints alleged that the defendants violated Sections 14(e), 14(d)(4) and 20 of the Securities Exchange Act of 1934 by failing to disclose certain allegedly material information. In addition, the complaints in the
Malkoff
action,
Asiatrade
action, and the
Cusumano
action alleged that the Individual Defendants breached their fiduciary duties to Sequenom shareholders. The actions sought, among other things, injunctive relief enjoining the merger. On August 30, 2016, the parties entered into a Memorandum of Understanding (MOU) in each of the above-referenced actions. In connection with the settlement, Sequenom agreed to make certain additional disclosures to its stockholders. On September 6, 2016, the Court entered an order consolidating for all pre-trial purposes the six individual actions described above under the caption
In re Sequenom, Inc. Shareholder Litig.
, Lead Case No. 16-cv-02054-JAH-BLM, and designating the complaint from the
Malkoff
action as the operative complaint for the consolidated action. On November 11, 2016, two competing motions were filed by two separate stockholders (James Reilly and Shikha Gupta) seeking appointment as lead plaintiff under the terms of the Private Securities Litigation Reform Act of 1995. On June 7, 2017, the Court entered an order declaring Mr. Reilly as the lead plaintiff and approving Mr. Reilly's selection of lead counsel. The Company is awaiting the Court's
46
appointment of a permanent lead Plaintiff. The parties agree that the MOU has been terminated. The Plaintiffs filed a Consolidated Amended Class Action Complaint on July 24, 2017, and the Defendants filed a Motion to Dismiss, which remains pending. The Company will vigorously defend the lawsuit.
On February 7, 2017, Sequenom received a subpoena from the U.S. Securities and Exchange Commission (SEC) relating to an SEC investigation into the trading activity of Sequenom shares in connection with the Company’s July 2016 announcement regarding the Sequenom merger. On March 7, 2017, the Company received a similar subpoena. The Company is cooperating with these requests.
On March 10, 2017, the Company was served with a putative class action lawsuit,
Victoria Bouffard, et al. v. Laboratory Corporation of America Holdings
, filed in the United States District Court for the Middle District of North Carolina. The complaint alleges that the Company’s patient list prices unlawfully exceed the rates negotiated for the same services with private and public health insurers in violation of various state consumer protection laws. The lawsuit also alleges breach of implied contract or quasi-contract, unjust enrichment, and fraud. The lawsuit seeks statutory, exemplary, and punitive damages, injunctive relief, and recovery of attorney's fees and costs. In May 2017, the Company filed a Motion to Dismiss Plaintiffs’ Complaint and Strike Class Allegations; this motion is currently pending. On October 10, 2017, a second putative class action lawsuit, Sheryl Anderson, et al. v. Laboratory Corporation of America Holdings, was filed in the United States District Court for the Middle District of North Carolina. The complaint contains similar allegations and seeks similar relief to the Bouffard complaint, and adds additional counts regarding state consumer protection laws. The Company will vigorously defend the lawsuits.
On May 24, 2017, a putative class action lawsuit,
Maria T. Gonzalez, et al. v. Examination Management Services, Inc. and Laboratory Corporation of America Holdings
, was filed against the Company in the United States District Court for the Southern District of California. The complaint alleges that the Company misclassified phlebotomists as independent contractors through an arrangement with the co-Defendant temporary staffing agency. The complaint further alleges that the Company violated the California Labor Code and California Business and Professions Code by failing to pay minimum wage, failing to pay for all hours worked, failing to pay for all wages owed upon termination, and failing to provide accurate itemized wage statements. The lawsuit seeks monetary damages, civil penalties, injunctive relief, and recovery of attorney's fees and costs. The Company will vigorously defend the lawsuit.
On August 3, 2017, a putative class action lawsuit,
John Sealock, et al. v. Covance Market Access Services, Inc.
, was filed in the United States District Court for the Southern District of New York. The complaint alleges that Covance Market Access Services, Inc. violated the Fair Labor Standards Act and New York labor laws by failing to provide overtime wages, failing to pay for all hours worked, and failing to provide accurate wage statements. The lawsuit seeks monetary damages, civil penalties, injunctive relief, and recovery of attorney’s fees and costs. In November 2017, the Company filed a Motion to Strike Class Allegations. In December 2017, the Plaintiff filed a Motion for Conditional Certification of a Collective Action. The parties’ motions remain pending. The Company will vigorously defend the lawsuit.
On November 6, 2017, Covance was served with two False Claims Act lawsuits, Health Choice Alliance, LLC on behalf of the
United States of America, et al. v. Eli Lilly and Company, Inc. et al.
, and Health Choice Advocates, LLC, on behalf of the
United States of America v. Gilead Sciences, Inc., et al.
, both filed in the United States District Court for the Eastern District of Texas. The complaints allege under the Federal False Claims Act and various state analogues that Covance and the co-defendants unlawfully provided in-kind remuneration to medical providers in the form of reimbursement support services in order to induce providers to prescribe certain drugs. Neither the U.S. government nor any state government intervened in the lawsuits. The lawsuit seeks actual and treble damages and civil penalties for each alleged false claim, as well as recovery of costs. The Company will vigorously defend the lawsuits.
Under the Company's present insurance programs, coverage is obtained for catastrophic exposure as well as those risks required to be insured by law or contract. The Company is responsible for the uninsured portion of losses related primarily to general, professional and vehicle liability, certain medical costs and workers' compensation. The self-insured retentions are on a per occurrence basis without any aggregate annual limit. Provisions for losses expected under these programs are recorded based upon the Company's estimates of the aggregated liability of claims incurred. At December 31, 2017, the Company had provided letters of credit aggregating approximately $72.2, primarily in connection with certain insurance programs. The Company’s availability under its Revolving Credit Facility is reduced by the amount of these letters of credit.
|
Item 4.
|
MINE SAFETY DISCLOSURES
|
Not applicable.
47
PART II
|
Item 5.
|
MARKET FOR REGISTRANT'S COMMON EQUITY, RELATED STOCKHOLDER MATTERS, AND ISSUER PURCHASES OF EQUITY SECURITIES
|
Market Information
The Company's common stock, par value $0.10 per share (Common Stock), trades on the New York Stock Exchange (NYSE) under the symbol “LH.” The following table sets forth for the calendar periods indicated the high and low sales prices for the Common Stock reported on the NYSE Composite Tape.
|
|
High
|
Low
|
|||||
|
Year Ended December 31, 2016
|
|
|
|
|
|||
|
First Quarter
|
$
|
123.99
|
|
$
|
97.79
|
|
|
|
Second Quarter
|
$
|
131.99
|
|
$
|
115.98
|
|
|
|
Third Quarter
|
$
|
141.32
|
|
$
|
129.68
|
|
|
|
Fourth Quarter
|
$
|
140.27
|
|
$
|
119.51
|
|
|
|
Year Ended December 31, 2017
|
|
|
|
|
|||
|
First Quarter
|
$
|
145.00
|
|
$
|
128.00
|
|
|
|
Second Quarter
|
$
|
154.82
|
|
$
|
134.19
|
|
|
|
Third Quarter
|
$
|
164.22
|
|
$
|
146.68
|
|
|
|
Fourth Quarter
|
$
|
165.18
|
|
$
|
147.28
|
|
|
Holders
On
February 22, 2018
, there were approximately
2,500
holders of record of the Common Stock.
Transfer Agent
The transfer agent for the Company's Common Stock is American Stock Transfer & Trust Company, Shareholder Services, 6201 Fifteenth Avenue, Brooklyn, NY 11219, telephone: 800-937-5449, website: www.amstock.com.
Dividends
The Company has not historically paid dividends on its Common Stock and does not presently anticipate paying any dividends on its Common Stock in the foreseeable future.
Common Stock Performance
The graph below shows the cumulative total return assuming an investment of $100 on December 31, 2012, in each of the Company’s common stock, the Standard & Poor’s (S&P) Composite-500 Stock Index and the S&P 500 healthcare Index (Peer Group) and assuming that all dividends were reinvested.
Comparison of Five Year Cumulative Total Return
|
|
12/2012
|
12/2013
|
12/2014
|
12/2015
|
12/2016
|
12/2017
|
|||||||||||||||||
|
Laboratory Corporation of America Holdings
|
$
|
100.00
|
|
$
|
105.48
|
|
$
|
124.57
|
|
$
|
142.74
|
|
$
|
148.21
|
|
$
|
184.15
|
|
|||||
|
S&P 500 Index
|
$
|
100.00
|
|
$
|
132.39
|
|
$
|
150.51
|
|
$
|
152.59
|
|
$
|
170.84
|
|
$
|
208.14
|
|
|||||
|
S&P 500 Health Care Index
|
$
|
100.00
|
|
$
|
141.46
|
|
$
|
177.30
|
|
$
|
189.52
|
|
$
|
184.42
|
|
$
|
225.13
|
|
|||||
48
Issuer Purchases of Equity Securities (all amounts in millions, except per share amounts)
The following table sets forth information with respect to purchases of shares of the Company’s Common Stock made during the quarter ended December 31, 2017, by or on behalf of the Company:
|
|
Total Number of Shares Repurchased
|
Average Price Paid Per Share
|
Total Number of Shares Repurchased as Part of Publicly Announced Program
|
Maximum Dollar Value of Shares that May Yet Be Repurchased Under the Program
|
|||||||||
|
October 1 - October 31
|
0.3
|
|
$
|
150.67
|
|
0.3
|
|
$
|
401.4
|
|
|||
|
November 1 - November 30
|
—
|
|
—
|
|
—
|
|
—
|
|
|||||
|
December 1 - December 31
|
—
|
|
—
|
|
—
|
|
—
|
|
|||||
|
0.3
|
|
$
|
150.67
|
|
0.3
|
|
$
|
401.4
|
|
||||
At the end of 2016, the Company had outstanding authorization from the board of directors to purchase up to $739.5 of Company common stock. During 2017, the Company purchased 2.5 shares of its common stock at a total cost of $338.1 (inclusive of 0.1 shares of common stock at a cost of $6.0 representing committed purchases as of December 31, 2016, that settled in early 2017). At the end of 2017, the Company had outstanding authorization from its board of directors to purchase an additional
$401.4
of Company common stock. The repurchase authorization has no expiration date.
|
Item 6.
|
SELECTED FINANCIAL DATA (in millions, except per share amounts)
|
The selected financial data presented below under the captions “Statement of Operations Data” and “Balance Sheet Data” as of and for the five-year period ended
December 31, 2017
, are derived from consolidated financial statements of the Company, which have been audited by an independent registered public accounting firm. This data should be read in conjunction with the accompanying notes, the Company's consolidated financial statements and the related notes thereto, and “Management's Discussion and Analysis of Financial Condition and Results of Operations,” all included elsewhere in this annual report.
49
|
|
Year Ended December 31,
|
||||||||||||||||||
|
(a)
2017
|
(b)
2016
|
(c)
2015
|
(d)
2014
|
(e)
2013
|
|||||||||||||||
|
Statement of Operations Data
:
|
|
|
|
|
|
||||||||||||||
|
Net revenues
|
$
|
10,205.9
|
|
$
|
9,437.2
|
|
$
|
8,505.7
|
|
$
|
6,011.6
|
|
$
|
5,808.3
|
|
||||
|
Gross profit
|
3,464.0
|
|
3,180.5
|
|
2,903.3
|
|
2,203.1
|
|
2,223.2
|
|
|||||||||
|
Operating income (i)
|
1,364.2
|
|
1,312.4
|
|
996.8
|
|
904.3
|
|
983.3
|
|
|||||||||
|
Net earnings attributable to Laboratory
|
|
|
|
|
|
|
|
|
|
|
|||||||||
|
Corporation of America Holdings (j)
|
1,268.2
|
|
732.1
|
|
437.6
|
|
511.2
|
|
573.8
|
|
|||||||||
|
Basic earnings per common share
|
$
|
12.39
|
|
$
|
7.14
|
|
$
|
4.43
|
|
$
|
6.03
|
|
$
|
6.36
|
|
||||
|
Diluted earnings per common share
|
$
|
12.21
|
|
$
|
7.02
|
|
$
|
4.35
|
|
$
|
5.91
|
|
$
|
6.25
|
|
||||
|
Basic weighted average common
|
|
|
|
|
|
|
|
|
|
|
|||||||||
|
shares outstanding
|
102.4
|
|
102.5
|
|
98.8
|
|
84.8
|
|
90.2
|
|
|||||||||
|
Diluted weighted average common
|
|
|
|||||||||||||||||
|
shares outstanding
|
103.9
|
|
104.3
|
|
100.6
|
|
86.4
|
|
91.8
|
|
|||||||||
|
Balance Sheet Data:
|
|
|
|
|
|
|
|
|
|
|
|||||||||
|
Cash and cash equivalents, and
|
|
|
|
|
|
|
|
|
|
|
|||||||||
|
short-term investments
|
$
|
316.7
|
|
$
|
433.6
|
|
$
|
716.4
|
|
$
|
580.0
|
|
$
|
404.0
|
|
||||
|
Goodwill and intangible assets, net (h)
|
11,870.8
|
|
9,824.9
|
|
9,526.6
|
|
4,575.2
|
|
4,594.8
|
|
|||||||||
|
Total assets (f)
|
16,568.0
|
|
14,247.0
|
|
14,104.7
|
|
7,262.8
|
|
6,939.8
|
|
|||||||||
|
Long-term obligations (f) (g)
|
6,762.1
|
|
5,849.5
|
|
6,364.2
|
|
2,990.8
|
|
2,974.3
|
|
|||||||||
|
Total shareholders' equity
|
6,830.0
|
|
5,505.8
|
|
4,945.1
|
|
2,820.5
|
|
2,491.3
|
|
|||||||||
|
(a)
|
During
2017
, the Company recorded net restructuring charges of
$70.9
. The charges were comprised of
$36.1
in severance and other personnel costs and
$39.9
in facility-related costs primarily associated with facility closures and general integration initiatives. These charges were offset by the reversal of previously established reserves of
$0.5
in unused severance and
$4.6
in unused facility-related costs. The Company also recognized asset impairment losses of $23.5 related to the termination of software development projects within the CDD segment and the forgiveness of certain indebtedness for LCD customers in areas heavily impacted by hurricanes during the third quarter.
|
|
(b)
|
During 2016, the Company recorded net restructuring charges of $58.4. The charges were comprised of $30.9 in severance and other personnel costs and $33.8 in facility-related costs primarily associated with facility closures and general integration initiatives. These charges were offset by the reversal of previously established reserves of $2.8 in unused severance and $3.5 in unused facility-related costs.
|
|
(c)
|
During 2015, the Company recorded net restructuring charges of $113.9. The charges were comprised of $59.2 in severance and other personnel costs and $55.8 in facility-related costs primarily associated with facility closures and general integration initiatives. These charges were offset by the reversal of previously established reserves of $1.1 in unused facility-related costs.
|
|
(d)
|
During 2014, the Company recorded net restructuring charges of $17.8. The charges were comprised of $10.5 in severance and other personnel costs and $8.4 in facility-related costs primarily associated with facility closures and general integration initiatives. These charges were offset by the reversal of previously established reserves of $0.4 in unused severance and $0.7 in unused facility-related costs.
|
|
(e)
|
During 2013, the Company recorded net restructuring charges of $21.8. The charges were comprised of $15.4 in severance and other personnel costs and $9.5 in facility-related costs primarily associated with facility closures and general integration initiatives. These charges were offset by the reversal of previously established reserves of $0.7 in unused severance and $2.4 in unused facility-related costs.
|
|
(f)
|
During the first quarter of 2016, the Company adopted Accounting Standards Update (ASU) 2015-03, Interest-Imputation of Interest: Simplifying the Presentation of Debt Issuance Costs. In accordance with this guidance, unamortized debt issuance costs of $52.8, $39.0 and $26.1 associated with the Senior Notes and loan obligations have been reclassified from total assets to long-term obligations for fiscal 2015, 2014, 2013, respectively, in the table above.
|
|
(g)
|
Long-term obligations primarily include the Company’s zero-coupon convertible subordinated notes, 5.625% Senior Notes due 2015, 3.125% Senior Notes due 2016, 2.20% Senior Notes due 2017, 2.50% Senior Notes due 2018, 4.625% Senior Notes due 2020, 2.625% Senior Notes due 2020, 3.75% Senior Notes due 2022, 3.20% Senior Notes due 2022, 4.00% Senior Notes due 2023, 3.25% Senior Notes due 2024, 3.60% Senior Notes due 2025, 3.60% Senior Notes due 2027, 4.70% Senior Notes due 2045, 2014 term loan, 2017 term loan, revolving credit facility and other long-term obligations. The accreted balance of the zero-coupon convertible subordinated notes was $8.8, $42.4, $94.5, $93.9, and $110.8 at December 31, 2017, 2016, 2015, 2014, and 2013, respectively. The principal balance of the 5.625% Senior
|
50
Notes was $0.0 at December 31, 2017, 2016 and 2015 and $250.0 at December 31, 2014 and 2013. The principal balance of the 3.125% Senior Notes was $0.0 at December 31, 2017, and 2016 and $325.0 at December 31, 2015, 2014, and 2013. The principal balance of the 4.625% Senior Notes was $600.0 at December 31, 2017, 2016, 2015, 2014, and 2013. The aggregate fair value of the fixed-to-variable interest rate swap on the 4.625% Senior Notes was $4.1 at December 31, 2017, $14.6 at December 31, 2016, $21.6 at December 31, 2015, $18.5 at December 31, 2014, and $0.0 at December 31, 2013. The principal balance of the 2.625% Senior Notes was $500.0 at December 31, 2017, 2016, and 2015, and was $0.0 for the years 2014 and 2013. The principal balances of the 2.20% Senior Notes was $0.0 at December 31, 2017 and $500.0 at December 31, 2016, 2015, 2014, and 2013. The 3.75% Senior Notes was $500.0 at December 31, 2017, 2016, 2015, 2014, and 2013. The principal balance for the 3.20% Senior Notes was $500.0 at December 31, 2017, 2016 and 2015 and was $0.0 at both December 31, 2014 and 2013. The principal balances of the 2.50% Senior Notes due 2018 and 4.00% Senior Notes due 2023 were $400.0 and $300.0, respectively, at December 31, 2017, 2016, 2015, 2014, and 2013. The principal balances of the 3.60% Senior Notes due 2025 and 4.70% Senior Notes due 2045 were $1,000.0 and $900.0, respectively, at December 31, 2017, 2016 and 2015 and were each $0.0 at both December 31, 2014, and 2013. The principal balance of the 3.25% Senior Notes due 2024 was $600.0 at December 31, 2017, and $0.0 for all other years presented. The principal balance of the 3.60% notes due 2027 was $600.0 at December 31, 2017, and $0.0 for all other years presented. The outstanding balance on the 2014 term loan was $72.0 at December 31, 2017, $565.0 at December 31, 2016, $715.0 at December 31, 2015, and $0.0 for all other years presented. The outstanding balance on the 2017 term loan was $750.0 at December 31, 2017, and $0.0 for all other years presented. The outstanding balance on the revolving credit facility was $0.0 at December 31, 2017, 2016, 2015, 2014, and 2013. The remainder of other long-term obligations consisted primarily of capital leases and mortgages payable with balances of $76.8, $71.8, $60.9, $42.4, and $14.6 at December 31, 2017, 2016, 2015, 2014, and 2013, respectively. Long-term obligations exclude amounts due to affiliates.
|
(h)
|
During 2016, the Company revised the final purchase price allocation for Covance. As a result, an out of period adjustment of $25.6 was recorded to reduce goodwill and increase a deferred tax asset as of December 31, 2015. The Company concluded that the impact of this adjustment was not material to the current or prior periods.
|
|
(i)
|
The Company changed its financial statement classification for certain gross receipts taxes in 2016, removing these taxes from its provision for income taxes and moving this expense into selling, general and administrative expenses. Certain gross receipts taxes of $6.1, $6.1, and $7.6 were reclassified in 2015, 2014 and 2013, respectively.
|
|
(j)
|
Net earnings attributable to Laboratory Corporation of America Holdings in 2017 includes a provisional net benefit of $519.0 due to the Tax Cuts and Jobs Act (TCJA). For additional information on the TCJA, see Note 13 to the Consolidated Financial Statements.
|
|
Item 7.
|
MANAGEMENT'S DISCUSSION AND ANALYSIS OF FINANCIAL CONDITION AND RESULTS OF OPERATIONS (in millions)
|
General
Net revenues increased 8.1% in comparison to 2016 primarily due to growth from acquisitions of 5.8% and organic growth (net revenue growth less revenue from acquisitions for the first twelve months after the close of each acquisition) of 2.3%. Operating income increased 3.9% in comparison to 2016 primarily due to acquisitions, organic revenue growth and the Company's LaunchPad business process improvement initiative. During 2017, the Company achieved its three-year-goal to deliver $150.0 in net LaunchPad savings. The Company expects the inclusion of Chiltern International Group Limited (Chiltern) for a full twelve months in 2018 will provide an approximate 13.0% to 14.0% increase in CDD revenue for 2018, excluding the impact of the adoption of the new revenue recognition accounting standard.
On April 25, 2017, the Company announced that it was expanding its LaunchPad business process improvement initiative to include its CDD segment. The Company generated $20.0 in savings in 2017, and expects to achieve additional net savings of $130.0 through the three-year period ending 2020. This initiative is expected to align people and capabilities with client and business demand, utilize automation and new information technology platforms to create efficiencies, and enhance customers' experience with CDD through investments in commercial and operational processes.
During the fourth quarter of 2017, the Company recorded the estimated impact of the Tax Cuts and Jobs Act of 2017 (TCJA), which resulted in a favorable re-valuation of deferred taxes, partially offset by the deemed repatriation tax. Given the significant changes resulting from the TCJA, the estimated financial impact is provisional and subject to further clarification, which could result in changes to these estimates in 2018. The Company expects its consolidated effective tax rate to be approximately 25.0% in 2018, which will benefit earnings per share and cash flow compared to the tax rate in 2017. The Company will invest a portion of this benefit in its employees, and has announced a one-time payment to all eligible employees that will be paid in 2018 based on length of service and certain other criteria.
51
The new accounting standard on revenue recognition will be effective for the Company beginning January 1, 2018. The Company will adopt the full retrospective method allowed by this standard and is continuing to evaluate the expected impact of this adoption. Currently, the Company expects this standard to reduce LCD revenue but increase LCD operating margins due to the recording of substantially all LCD bad debt expense against net revenues (versus selling, general and administrative expense) as an implicit price reduction. The Company expects this standard to increase CDD reported revenue and decrease gross profit margin due to inclusion of reimbursable out-of-pocket expenses and investigator fees in revenues and cost of sales. In addition, the Company expects the timing of revenue recognition for customer contracts in the clinical business to accelerate, as revenue from study related change orders will be included in the total transaction price and recognized as the single performance obligation is satisfied, when reasonably estimated, which is often prior to the signed change order threshold used previously. CDD will also discontinue its current practice of expensing sales commissions when paid upon the execution of a customer contract and instead will recognize this selling expense over the weighted average of the underlying contract terms for each major revenue stream. Based on its preliminary analysis, the Company currently anticipates that 2017 total revenue will be approximately 2.0% to 5.0% higher under the new standard upon retrospective restatement consisting of an increase in CDD revenue (due in large part to the inclusion of out-of-pocket and investigator fees in revenue) partially offset by a decrease in LCD revenue (due to the recording of bad debt expense as an offset within revenue). The Company also anticipates enhanced financial statement disclosures surrounding the nature, amount, timing and uncertainty of revenue and cash flows arising from contracts with customers. The Company is currently performing a detailed contract review which will be completed before the final quantification of the impact of the standard is completed. The impact of the new standard will be finalized upon adoption in the first quarter of 2018 and is therefore subject to change.
The Company notes that changes to the Affordable Care Act may continue to affect coverage, reimbursement and utilization of laboratory services, as well as administrative requirements, in ways that are currently unpredictable. Further, structural reforms of Medicare that could occur, such as imposition of uniform co-insurance and combination of the Medicare Part A and Part B deductibles, could adversely affect Medicare reimbursement for laboratory reimbursement.
CMS published its initial proposed CLFS rates under PAMA for 2018-2020 on September 22, 2017. Following a public comment period, CMS made adjustments and published final CLFS rates for 2018-2020 on November 17, 2017, with additional adjustments published on December 1, 2017. For 2018, the Company estimates that the CLFS rates will reduce LCD revenue from all payers affected by the CLFS by a total of approximately 8% ($70.0 million)
The Company plans to continue to work to maintain its investment grade credit rating and plans to use its operating cash flows to meet its annual capital expenditure requirements and to continue building long-term shareholder value through strategic acquisitions, debt reduction and the return of capital to shareholders.
Seasonality and External Factors
The Company experiences seasonality in both segments of its business. For example, testing volume generally declines during the year-end holiday period and other major holidays and can also decline due to inclement weather, reducing net revenues, operating margins and cash flows. Operations are also impacted by changes in the global economy, exchange rate fluctuations, political and regulatory changes, the progress of ongoing studies and the startup of new studies, as well as the level of expenditures made by the biopharmaceutical industry in R&D. The results of both segments are impacted by exchange rate fluctuations. Approximately 21.4% of the Company's net revenues are billed in currencies other than the U.S. dollar, with the Swiss franc, British pound, Canadian dollar and the euro representing the largest components of its currency exposure. The Company expects the inclusion of Chiltern for a full twelve months in 2018 will increase the Company's percentage of revenues billed in currencies other than the U.S. dollar. Given the seasonality and changing economic factors impacting the business, comparison of the results for successive quarters may not accurately reflect trends or results for the full year.
Results of Operations
Years ended December 31, 2017, 2016, and 2015
Net Revenues
|
|
Years Ended December 31,
|
Change
|
|||||||||||||||
|
2017
|
2016
|
2015
|
2017
|
2016
|
|||||||||||||
|
LCD
|
$
|
7,170.5
|
|
$
|
6,593.9
|
|
$
|
6,199.3
|
|
8.7
|
%
|
6.4
|
%
|
||||
|
CDD
|
3,037.2
|
|
2,844.1
|
|
2,306.4
|
|
6.8
|
%
|
23.3
|
%
|
|||||||
|
Intercompany eliminations
|
(1.8
|
)
|
(0.8
|
)
|
—
|
|
125.0
|
%
|
N/A
|
|
|||||||
|
Total
|
$
|
10,205.9
|
|
$
|
9,437.2
|
|
|
$
|
8,505.7
|
|
8.1
|
%
|
11.0
|
%
|
|||
The 8.1% increase in net revenue for the year ended December 31, 2017, as compared with the corresponding period in 2016 was due to growth from acquisitions of 5.8% and organic growth of 2.3%.
52
LCD net revenues for the year ended December 31, 2017, were $7,170.5, an increase of 8.7% over net revenues of $6,593.9 in the corresponding period in 2016. The increase in net revenue was the result of acquisitions, organic volume growth (measured by requisitions), price and mix. Total volume (measured by requisitions) increased by 5.8%, of which organic volume was 2.2% and acquisition volume was 3.6%. Revenue per requisition increased 2.9%.
CDD net revenues for the year ended December 31, 2017, were $3,037.2, an increase of 6.8% over net revenues of $2,844.1 in the corresponding period in 2016. The increase in net revenue was primarily due to the acquisition of Chiltern, which contributed growth of 6.6%, an increase in organic growth of 0.4% and an unfavorable impact from foreign currency translation of approximately 0.2%.
The increase in net revenues for the year ended December 31, 2016, as compared with the corresponding period in 2015 was driven primarily by the inclusion of Covance's financial results for the entire year as well as solid organic growth and acquisitions, partially offset by the negative impact of foreign currency translation.
LCD net revenues for the year ended December 31, 2016, were $6,593.9, an increase of 6.4% over net revenues of $6,199.3 in the corresponding period in 2015. The increase in net revenues was driven by organic volume growth, measured by requisitions, of 1.2%. The commercial launch of Beacon
LBS, the Company's technology-enabled solution providing point-of-care decision support, contributed 0.3%. The increase in net revenues was unfavorably impacted by 0.3% of currency fluctuations. Revenue per requisition favorably impacted revenue by 2.7%. In addition, acquisitions added 2.5% to net revenues.
CDD net revenues for the year ended December 31, 2016, were $2,844.1, an increase of 23.3% over net revenues of $2,306.4 in the corresponding period in 2015. The increase in revenue is due to the inclusion of a full year of Covance revenue for 2016 as compared to the period from the close of the Covance acquisition on February 19, 2015, through December 31, 2015, as well as demand and mix. This increase was partially offset by the expiration on October 31, 2015, of a minimum volume service contract and an unfavorable currency impact of approximately 160 basis points.
Net Cost of Revenues
|
Years Ended December 31,
|
Change
|
||||||||||||||||
|
|
2017
|
2016
|
2015
|
2017
|
2016
|
||||||||||||
|
Net cost of revenues
|
$
|
6,741.9
|
|
$
|
6,256.7
|
|
$
|
5,602.4
|
|
7.8
|
%
|
11.7
|
%
|
||||
|
Cost of revenues as a % of net revenues
|
66.1
|
%
|
66.3
|
%
|
65.9
|
%
|
|
|
|
|
|||||||
Net cost of revenues (primarily laboratory, labor and distribution costs) increased 7.8% in 2017 as compared with 2016 primarily due to increased volume, measured by requisitions, and test mix changes. The slight decrease in net cost of revenues as a percentage of net revenues in 2017 as compared to 2016 was due to LaunchPad savings and acquisition integration synergies offset by relatively higher costs of revenues for certain 2017 acquisitions. The increase in net cost of revenues in 2017 was negatively impacted by a net increase of 0.1% due to currency fluctuations.
Net cost of revenues (primarily laboratory, labor and distribution costs) increased 11.7% in 2016 as compared with 2015 primarily due to increased volume, measured by requisitions, and test mix changes. The increase in net cost of revenues as a percentage of net revenues in 2016 as compared to 2015 was due to the inclusion of CDD operations, which carry higher personnel costs as a percentage of revenue, for the entire year along with overall growth in the Company's operations. The increase in net cost of revenues in 2016 was negatively impacted by a net increase of 0.6% due to currency fluctuations.
Labor and testing supplies for the year ended December 31, 2017, comprise over 76.3% of the Company’s net cost of revenues. Net cost of revenues has increased over the three-year period ended December 31, 2017, primarily due to the impact of acquisitions, overall growth in the Company's volume and increases in merit-based labor costs.
Selling, General and Administrative Expenses
|
|
Years Ended December 31,
|
Change
|
|||||||||||||||
|
|
2017
|
2016
|
2015
|
2017
|
2016
|
||||||||||||
|
Selling, general and administrative expenses
|
$
|
1,812.4
|
|
$
|
1,630.2
|
|
$
|
1,628.1
|
|
11.2
|
%
|
0.1
|
%
|
||||
|
SG&A as a % of net revenues
|
17.8
|
%
|
17.3
|
%
|
19.1
|
%
|
|
|
|
|
|||||||
Selling, general and administrative expenses as a percentage of net revenues increased to 17.8% in 2017 compared to 17.3% in 2016. The increase in selling, general and administrative expenses as a percentage of net revenues is primarily due
to current year acquisitions offset by LaunchPad savings
. Bad debt expense as a percentage of net revenues for LCD was 4.4% for that segment during 2017 as compared to 4.3% in 2016. The increase in selling, general and administrative expenses in 2017 was impacted by a net increase of 0.1% due to currency fluctuations.
The Company incurred legal and other costs of $49.7 primarily relating to the acquisition of Chiltern. The Company also recorded $25.6 in consulting and other expenses relating to Covance and Chiltern integration initiatives. In addition, the Company
53
incurred $4.4 in consulting expenses relating to fees incurred as part of its integration and management transition costs. The Company also recognized asset impairment losses of $20.9 related to the termination of software development projects within the CDD segment and the forgiveness of certain indebtedness for LCD customers in areas heavily impacted by hurricanes during the third quarter. Excluding these charges, selling, general and administrative expenses as a percentage of net revenues were 16.8% for the year ended December 31, 2017.
Selling, general and administrative expenses as a percentage of net revenues decreased to 17.3% in 2016 compared to 19.1% in 2015. The decrease in selling, general and administrative expenses as a percentage of net revenues is primarily due
to the Covance acquisitio
n, integration synergies, and the impact of LaunchPad, LCD's comprehensive, enterprise-wide business process improvement initiative. Bad debt expense as a percentage of net revenues for LCD remained constant at 4.3% for that segment during 2016 and 2015. The increase in selling, general and administrative expenses in 2016 was impacted by a net increase of 0.5% due to currency fluctuations.
During 2016, the Company incurred additional legal and other costs of $4.6 relating to the wind-down of two operations used to service minimum volume service contract operations. On February 9, 2016, the Company reached an agreement for the sale of assets and business of one of these sites. As required by U.K. law, substantially all of the employees were transferred with the business. On November 21, 2016, following the wind-down of the business, the Company reached an agreement for the sale of the property and assets of the other site. In addition, the Company incurred $8.0 in acquisition fees and expenses. The Company also recorded $6.9 in consulting expenses relating to fees incurred as part of its Covance acquisition integration costs and compensation analysis, along with $2.5 in short-term equity retention arrangements relating to the Covance acquisition and $8.9 of accelerated equity compensation relating to executive transition. In addition, the Company incurred $9.0 of non-capitalized costs associated with the implementation of a major system as part of LaunchPad. Excluding these charges, selling, general and administrative expenses as a percentage of net revenues were 16.9% for the year ended December 31, 2016.
During 2015, the Company incurred additional legal and other costs of $5.7 relating to the wind-down of two operations used to service minimum volume contract operations. The Company also recorded $25.6 in consulting expenses relating to fees incurred as part of LaunchPad as well as Covance integration costs and employee compensation studies, along with $5.4 in short-term equity retention arrangements relating to the Covance acquisition and $0.3 of accelerated equity compensation relating to the previously disclosed retirement of a Company executive. During the fourth quarter, the Company paid $12.2 in settlement costs and litigation expenses related to the resolution of a U.S. federal court putative class action lawsuit. In addition, the Company incurred $3.0 of non-capitalized costs associated with the implementation of a major system as part of LaunchPad. Excluding these charges, selling, general and administrative expenses as a percentage of net revenues were 18.5% for the year ended December 31, 2015.
Amortization Expense
|
|
Years Ended December 31,
|
Change
|
|||||||||||||||
|
|
2017
|
2016
|
2015
|
2017
|
2016
|
||||||||||||
|
LCD
|
$
|
116.7
|
|
$
|
93.4
|
|
$
|
82.4
|
|
24.9
|
%
|
13.3
|
%
|
||||
|
CDD
|
99.8
|
|
86.1
|
|
82.1
|
|
15.9
|
%
|
4.9
|
%
|
|||||||
|
Amortization of intangibles and other assets
|
$
|
216.5
|
|
$
|
179.5
|
|
$
|
164.5
|
|
20.6
|
%
|
9.1
|
%
|
||||
The increase in amortization of intangibles and other assets from 2015 through 2017 primarily reflects the impact of acquisitions offset by the impact of working capital and earnout adjustments.
Restructuring and Other Special Charges
|
|
Years Ended December 31,
|
||||||||||
|
|
2017
|
2016
|
2015
|
||||||||
|
Restructuring and other special charges
|
$
|
70.9
|
|
$
|
58.4
|
|
$
|
113.9
|
|
||
During
2017
, the Company recorded net restructuring charges of
$70.9
;
$16.8
within LCD and
$54.1
within CDD. The charges were comprised of
$36.1
in severance and other personnel costs and
$39.9
in facility-related costs primarily associated with general integration activities. The charges were offset by the reversal of previously established reserves of
$0.5
in unused severance and
$4.6
in unused facility-related costs.
During 2016, the Company recorded net restructuring and other special charges of $58.4; $15.8 within LCD and $42.6 within CDD. The charges were comprised of $30.9 related to severance and other personnel costs along with $33.8 in costs associated with facility closures. A substantial portion of these costs relate to the planned closure of duplicative data center operations and other facilities. These charges were offset by the reversal of previously established reserves of $2.8 in unused severance and $3.5 in unused facility-related costs, as the result of selling one of its minimum volume service contract facilities to a third party.
54
During 2015, the Company recorded net restructuring and other special charges of $113.9; $39.2 within LCD and $74.7 within CDD. The charges were comprised of $59.2 related to severance and other personnel costs along with $55.8 in costs associated with facility closures and general integration initiatives. A substantial portion of these costs relate to the planned closure of two CDD operations that serviced a minimum volume contract that expired on October 31, 2015. These charges were offset by the reversal of previously established reserves of $1.1 in unused facility-related costs. Included within the facility-related charges noted above is a $26.7 asset impairment charge relating to CDD lab and customer service applications that will no longer be used.
Interest Expense
|
Years Ended December 31,
|
Change
|
||||||||||||||||
|
|
2017
|
2016
|
2015
|
2017
|
2016
|
||||||||||||
|
Interest expense
|
$
|
235.1
|
|
$
|
219.1
|
|
$
|
274.9
|
|
7.3
|
%
|
(20.3
|
)%
|
||||
The increase in interest expense for 2017 as compared with the corresponding period in 2016 is primarily due to the issuance of Senior Notes, the addition of the 2017 term loan, and increased borrowings under the Company's Revolving Credit Facility, to fund the acquisition of Chiltern and support growth. This increase was partially offset by the repayment of the 2.20% Senior Notes in August 2017 and a portion of the zero-coupon subordinated notes, and the retirement of the convertible Senior Notes acquired as part of the Sequenom acquisition in October 2016.
The decrease in interest expense for 2016 as compared with the corresponding period in 2015 is primarily due to the reduction of the term loan balance, Covance acquisition-related expenses including a $37.4 make-whole payment that was required in connection with the prepayment of the $250.0 Covance Senior Notes and $15.2 of deferred financing costs associated with the Company's previous credit agreement and the bridge financing facilities used to complete the Covance acquisition. In addition, the Company repaid the 3.125% Senior Notes in May 2016. These decreases were offset by $5.6 of interest expense relating to the early retirement of subsidiary indebtedness and the timing of Covance acquisition-related debt.
Equity Method Income, Net
|
|
Years Ended December 31,
|
Change
|
|||||||||||||||
|
|
2017
|
2016
|
2015
|
2017
|
2016
|
||||||||||||
|
Equity method income, net
|
$
|
11.3
|
|
$
|
7.9
|
|
$
|
10.0
|
|
43.0
|
%
|
(21.0
|
)%
|
||||
Equity method income, net represents the Company's ownership share in joint venture partnerships along with equity investments in other companies in the healthcare industry. All of these partnerships and investments reside within LCD. The increase in income for 2017 as compared with the corresponding period in 2016 was primarily due to the increased profitability in one of the joint ventures and the addition of several joint ventures related to the May 2017 acquisition of Pathology Associates Medical Laboratories (PAML).
Other, Net
|
|
Years Ended December 31,
|
Change
|
|||||||||||||||
|
|
2017
|
2016
|
2015
|
2017
|
2016
|
||||||||||||
|
Other, net
|
$
|
(7.6
|
)
|
$
|
2.6
|
|
$
|
(7.8
|
)
|
392.3
|
%
|
(133.3
|
)%
|
||||
Other, net is primarily comprised of net investment gains and losses as well as the realization of foreign currency transaction losses.
The decrease in other, net for the year ended December 31, 2017, is primarily due to the inclusion of a net gain of $9.7 on the sale of investment securities from the Company's venture fund in 2016, offset by an increase in net realized foreign currency transaction losses.
The increase in other, net for the year ended December 31, 2016, is primarily due to a net gain of $9.7 on the sale of investment securities from the Company's venture fund offset by net realized foreign currency transaction losses and a non-cash loss of $2.3 upon the dissolution of one of the Company's equity investments in 2015.
Income Tax Expense
|
Years Ended December 31,
|
|||||||||||
|
|
2017
|
2016
|
2015
|
||||||||
|
Income tax expense
|
$
|
(139.1
|
)
|
$
|
372.3
|
|
$
|
287.3
|
|
||
|
Income tax expense as a % of income before tax
|
(12.3
|
)%
|
33.7
|
%
|
39.6
|
%
|
|||||
During the fourth quarter of 2017, the Company recorded the estimated provisions of the TCJA, which resulted in a reduction in income tax expense arising from a re-measurement of deferred taxes, and the release of deferred taxes on unremitted foreign
55
earnings, partially offset by the deemed repatriation tax. Given the significant changes resulting from the TCJA, the estimated financial impact is provisional and subject to further clarification, which could result in changes to these estimates in 2018.
The effective rate for 2017 was favorably impacted by the re-measurement of the Company's net deferred tax liabilities to rates enacted in the TCJA, partially offset by the deemed repatriation tax enacted in this legislation. The 2017 rate was also favorably impacted by foreign earnings taxed at rates lower than the U.S. and by share-based compensation.
In 2016 and 2015, the Company's effective rate was favorably impacted by foreign earnings taxed at lower rates than the U.S. statutory tax rate and, for 2016 specifically, by a reduction in certain foreign rates. The 2016 rate also benefited from the early adoption of share-based payment accounting and the reversal of uncertain tax position reserves. The Company considers substantially all of its foreign earnings to be permanently reinvested overseas.
The effective rate for 2015 was unfavorably impacted by restructuring and acquisition items, the recording of additional uncertain tax reserves and a decrease in the benefit recorded from releasing uncertain tax reserves.
Operating Results by Segment
|
|
Years Ended December 31,
|
Change
|
|||||||||||||||
|
|
2017
|
2016
|
2015
|
2017
|
2016
|
||||||||||||
|
LCD
|
$
|
1,298.6
|
|
$
|
1,187.6
|
|
$
|
1,053.7
|
|
9.3
|
%
|
12.7
|
%
|
||||
|
LCD operating margin
|
18.1
|
%
|
18.0
|
%
|
17.0
|
%
|
0.1
|
%
|
1.0
|
%
|
|||||||
|
CDD
|
$
|
206.2
|
|
$
|
272.7
|
|
$
|
73.5
|
|
(24.4
|
)%
|
271.0
|
%
|
||||
|
CDD operating margin
|
6.8
|
%
|
9.6
|
%
|
3.2
|
%
|
(2.8
|
)%
|
6.4
|
%
|
|||||||
|
General corporate expenses
|
$
|
(140.6
|
)
|
$
|
(147.9
|
)
|
$
|
(130.4
|
)
|
(4.9
|
)%
|
13.4
|
%
|
||||
|
Total
|
$
|
1,364.2
|
|
$
|
1,312.4
|
|
$
|
996.8
|
|
3.9
|
%
|
31.7
|
%
|
||||
LCD operating earnings were $1,298.6 for the year ended December 31, 2017, an increase of 9.3% over operating earnings of $1,187.6 in the corresponding period of 2016 and an increase of 0.1% in operating margin year-over-year. The slight increase in operating margin was primarily due to strong revenue growth and LaunchPad savings, offset by lower margins on certain 2017 acquisitions prior to the full impact of synergies. During the year, the Company achieved its three-year goal to deliver $150.0 in net LaunchPad savings.
CDD operating earnings were $206.2 for the year ended December 31, 2017, a decrease of 24.4% over operating earnings of $272.7 in the corresponding period of 2016 and a decrease of 2.8% in operating margin year-over-year. The decrease in operating earning and operating margin was primarily due to acquisitions and transaction costs. The segment also experienced higher personnel costs and increased restructuring and other special charges related to the expansion of LaunchPad and the termination of a software development project. These costs were partially offset by cost synergies. During the year, the Company achieved its three-year goal to deliver cost synergies of $100.0 related to the Covance acquisition.
General corporate expenses are comprised primarily of administrative services such as executive management, human resources, legal, finance, corporate affairs, and information technology. Corporate expenses were $140.6 for the year ended December 31, 2017, a decrease of 4.9% over corporate expenses of $147.9 in the corresponding period of 2016. The decrease in corporate expenses in 2017 is primarily due to a reduction in acquisition related costs and certain incentive compensation.
Liquidity, Capital Resources and Financial Position
The Company's strong cash-generating capability and financial condition typically have provided ready access to capital markets. The Company's principal source of liquidity is operating cash flow, supplemented by proceeds from debt offerings. The Company's senior unsecured revolving credit facility is further discussed in Note 11 to the Company's Consolidated Financial Statements.
In summary the Company's cash flows were as follows:
|
|
For the Year Ended December 31,
|
||||||||||
|
|
2017
|
2016
|
2015
|
||||||||
|
Net cash provided by operating activities
|
$
|
1,459.4
|
|
$
|
1,175.9
|
|
$
|
982.4
|
|
||
|
Net cash used for investing activities
|
(2,228.7
|
)
|
(795.7
|
)
|
(3,994.9
|
)
|
|||||
|
Net cash (used in) provided by financing activities
|
631.9
|
|
(649.8
|
)
|
3,184.6
|
|
|||||
|
Effect of exchange rate on changes in cash and cash equivalents
|
20.5
|
|
(13.2
|
)
|
(35.7
|
)
|
|||||
|
Net change in cash and cash equivalents
|
$
|
(116.9
|
)
|
$
|
(282.8
|
)
|
$
|
136.4
|
|
||
56
Cash and Cash Equivalents
Cash and cash equivalents at December 31, 2017, 2016 and 2015 totaled $316.7, $433.6 and $716.4, respectively. Cash and cash equivalents consist of highly liquid instruments, such as commercial paper, time deposits and other money market investments, substantially all of which have original maturities of three months or less.
Cash Flows from Operating Activities
During the year ended December 31, 2017, the Company's operations provided $
1,459.4
of cash as compared to $
1,175.9
in 2016. The $283.5 increase in cash provided from operations in 2017 as compared with the corresponding 2016 period was primarily due to higher net earnings and improved working capital in 2017. The Company’s 2017 earnings were impacted by $70.9 of restructuring and special items compared to an impact of $58.4 during the same period in 2016.
During the year ended December 31, 2016, the Company's operations provided $
1,175.9
of cash as compared to $982.4 in 2015. The $193.5 increase in cash provided from operations in 2016 as compared with the corresponding 2015 period was primarily due to higher net earnings in 2016. The Company’s 2016 earnings were impacted by $58.4 of restructuring and special items compared to an impact of $113.9 during the same period in 2015, primarily in connection with the Covance acquisition.
Cash Flows from Investing Activities
Net cash used in investing activities for the year ended December 31, 2017, was $2,228.7 as compared to $795.7 for the year ended December 31, 2016. The $1,433.0 increase in cash used in investing activities for the year ended December 31, 2017, was primarily due to a year over year increase of $1,334.0 in cash paid for acquisitions. In addition, the Company had proceeds of $5.5 from the sale of assets during 2017 in comparison to $30.8 during 2016. Capital expenditures were $312.9 and $278.9 for the years ended December 31, 2017 and 2016, respectively. Capital expenditures in 2017 were 3.1% of net revenues primarily in connection with projects to support growth in the Company's core businesses, projects related to LaunchPad and further Covance integration initiatives. The Company intends to continue to pursue acquisitions to fund growth and make important investments in its business, including in information technology, and to improve efficiency and enable the execution of the Company's mission. Such expenditures are expected to be funded by cash flow from operations or, as needed, through borrowings under debt facilities, including the Company's revolving credit facility or any successor facility. The Company expects such capital expenditures in 2018 to be approximately 3.5% of net revenues, primarily in connection with projects to support growth in the Company's core businesses, facility updates, ongoing projects related to LaunchPad within the LCD business, LaunchPad's expansion within the CDD business, and further acquisition integration initiatives.
Net cash used in investing activities for the year ended December 31, 2016, was $795.7 as compared to $3,994.9 for the year ended December 31, 2015. The $3,184.3 decrease in cash used in investing activities for the year ended December 31, 2016, was primarily due to cash paid for the Covance acquisition in the first quarter of 2015. In addition, the Company had proceeds of $30.8 from the sale of assets during 2016 in comparison to $0.6 during 2015. Capital expenditures were $278.9 and $255.8 for the years ended December 31, 2016 and 2015, respectively.
Cash Flows from Financing Activities
Net cash provided by financing activities for the year ended December 31, 2017, was $631.9 compared to cash used for financing activities of $649.8 for the year ended December 31, 2016. This movement in cash within financing activities for 2017, as compared to 2016, was primarily a result of $923.0 of net financing proceeds and $338.1 in share repurchases in 2017 compared to $658.4 in debt repayments combined with $43.9 share repurchases in 2016.
Net cash used in financing activities for the year ended December 31, 2016, was $649.8 compared to $3,184.6 net cash provided by financing activities for the year ended December 31, 2015. This movement in cash within financing activities for 2016, as compared to 2015, was primarily a result of $3,113.7 of net financing proceeds in 2015 compared to $658.4 in debt repayments combined with $43.9 for the re-initiation of the Company's share repurchase program in 2016.
On August 22, 2017, the Company issued new Senior Notes representing $1,200.0 in debt securities consisting of a $600.0 aggregate principal amount of 3.25% Senior Notes due 2024 and a $600.0 aggregate principal amount of 3.60% Senior Notes due 2027. Interest on these notes is payable semi-annually on March 1 and September 1 of each year, commencing on March 1, 2018. Net proceeds from the offering of these notes were $1,190.1 after deducting underwriting discounts and other expenses of the offering. Net proceeds were used to pay off the 2.20% Senior Notes due August 23, 2017, as well as a portion of the cash consideration and the fees and expenses in connection with the Chiltern acquisition.
On September 15, 2017, the Company entered into a new $750.0 term loan. The 2017 term loan facility will mature on September 15, 2022. The 2017 term loan balance at December 31, 2017, was $750.0.
On December 19, 2014, the Company entered into a five-year term loan credit facility in the principal amount of $1,000.0 for the purpose of financing a portion of the cash consideration and the fees and expenses in connection with the transactions
57
contemplated by the November 2, 2014, Merger Agreement to acquire Covance. The term loan credit facility was advanced in full on the Covance acquisition date and was amended on July 13, 2016 and further amended on September 15, 2017. The term loan credit facility will mature five years after the Covance acquisition date and may be prepaid without penalty. The 2014 term loan balance at December 31, 2017, was $72.0.
Also as part of its financing of the Covance acquisition, the Company issued $2,900.0 in debt securities consisting of $500.0 aggregate principal amount of 2.625% Senior Notes due 2020, $500.0 aggregate principal amount of 3.20% Senior Notes due 2022, $1,000.0 aggregate principal amount of 3.60% Senior Notes due 2025 and $900.0 aggregate principal amount of 4.70% Senior Notes due 2045.
On February 13, 2015, the Company entered into a 60-day cash bridge term loan credit facility in the principal amount of $400.0 for the purpose of financing a portion of the cash consideration and the fees and expenses in connection with the Covance acquisition. The 60-day cash bridge term loan credit facility was advanced in full on the Covance acquisition date, and was repaid in March 2015.
On September 15, 2017, the Company also entered into an amendment and restatement of its existing senior revolving credit facility, which was originally entered into on December 21, 2011, and amended on December 21, 2011. The senior revolving credit facility consists of a five-year revolving facility in the principal amount of up to
$1,000.0
, with the option of increasing the facility by up to an additional
$350.0
, subject to the agreement of one or more new or existing lenders to provide such additional amounts and certain other customary conditions. The revolving credit facility also provides for a subfacility of up to
$100.0
for swing line borrowings and a subfacility of up to
$150.0
for issuances of letters of credit. The revolving credit facility is permitted to be used for general corporate purposes, including working capital, capital expenditures, funding of share repurchases and certain other payments, and acquisitions and other investments. There were no balances outstanding on the Company's current revolving credit facility at
December 31, 2017
, or
December 31, 2016
.
On January 30, 2015, the Company issued the Covance acquisition notes, which represent $
2,900.0
in debt securities consisting of
$500.0
aggregate principal amount of
2.625%
Senior Notes due 2020,
$500.0
aggregate principal amount of
3.20%
Senior Notes due 2022,
$1,000.0
aggregate principal amount of
3.60%
Senior Notes due 2025 and
$900.0
aggregate principal amount of
4.70%
Senior Notes due 2045. Net proceeds from the offering of the Covance acquisition notes were $
2,870.2
after deducting underwriting discounts and other estimated expenses of the offering. Net proceeds were used to pay a portion of the cash consideration and the fees and expenses in connection with the acquisition of Covance.
Under the Company's term loan credit facilities and the revolving credit facility, the Company is subject to negative covenants limiting subsidiary indebtedness and certain other covenants typical for investment grade-rated borrowers and the Company is required to maintain certain leverage ratios. The Company was in compliance with all covenants under the term loan credit facilities and the revolving credit facility at December 31, 2017. As of December 31, 2017, the ratio of total debt to consolidated pro forma trailing 12 month earnings before interest, tax, depreciation, and amortization (EBITDA) was
3.2
to 1.0.
The 2014 term loan credit facility accrues interest at a per annum rate equal to, at the Company’s election, either an Intercontinental Exchange London Inter-bank Offered Rate (LIBOR) rate plus a margin ranging from 1.125% to 2.00%, or a base rate determined according to a prime rate or federal funds rate plus a margin ranging from 0.125% to 1.00%. The 2017 term loan credit facility accrues interest at a per annum rate equal to, at the Company’s election, either a LIBOR rate plus a margin ranging from 0.875% to 1.50%, or a base rate determined according to a prime rate or federal funds rate plus a margin ranging from 0.0% to 0.50%. Advances under the revolving credit facility accrue interest at a per annum rate equal to, at the Company’s election, either a LIBOR rate plus a margin ranging from 0.775% to 1.25%, or a base rate determined according to a prime rate or federal funds rate plus a margin ranging from 0.00% to 0.25%. Fees are payable on outstanding letters of credit under the revolving credit facility at a per annum rate equal to the applicable margin for LIBOR loans, and the Company is required to pay a facility fee on the aggregate commitments under the revolving credit facility, at a per annum rate ranging from 0.10% to 0.25%. The interest margin applicable to the credit facilities, and the facility fee and letter of credit fees payable under the revolving credit facility, are based on the Company’s senior credit ratings as determined by S&P and Moody’s.
As of December 31, 2017, the effective interest rate on the revolving credit facility was
2.7%
and the effective interest rate was
2.8%
and
2.6%
on the 2014 and 2017 term loans, respectively.
There was
no
outstanding balance on the Company's revolving credit facility at December 31, 2017, or 2016. As of December 31, 2017, the Company provided letters of credit aggregating
$72.2
, primarily in connection with certain insurance programs. Letters of credit provided by the Company are issued under the Company's revolving credit facility and are renewed annually.
During
2017
, the Company purchased
2.5
shares of its common stock at a total cost of
$338.1
. At the end of 2017, the Company had outstanding authorization from the board of directors to purchase an additional
$401.4
of Company common stock. The repurchase authorization has no expiration date.
58
The Company had a $27.4 and $28.3 reserve for unrecognized income tax benefits, including interest and penalties, as of December 31, 2017, and December 31, 2016, respectively. Substantially all of these tax reserves are classified in other long-term liabilities in the Company's Consolidated Balance Sheets at December 31, 2017, and 2016.
During
2017
and
2016
, the Company settled notices to convert $
37.1
and $
59.4
aggregate principal amount at maturity of its zero-coupon subordinated notes with a conversion value of $
33.9
and $
53.7
, respectively. The total cash used for these settlements was $
33.9
and $
53.7
and the Company also issued
0.3
and
0.4
additional shares of common stock, respectively. As a result of these conversions in
2017
and
2016
, the Company also reversed approximately $
0.0
and $
4.9
, respectively, of deferred tax liability to reflect the tax benefit realized upon issuance of the shares.
On
September 12, 2017
, the Company announced that for the period of
September 12, 2017 to March 10, 2018
, the zero-coupon subordinated notes will accrue contingent cash interest at a rate of no less than 0.125% of the average market price of a zero-coupon subordinated note for the five trading days ended September 8, 2017, in addition to the continued accrual of the original issue discount.
On
January 3, 2018
, the Company announced that its zero-coupon subordinated notes may be converted into cash and common stock at the conversion rate of
13.4108
per
$1,000.0
principal amount at maturity of the notes, subject to the terms of the zero-coupon subordinated notes and the Indenture, dated as of October 23, 2006, between the Company, and The Bank of New York Mellon as trustee and the conversion agent. In order to exercise the option to convert all or a portion of the zero-coupon subordinated notes, holders are required to validly surrender their zero-coupon subordinated notes at any time during the calendar quarter beginning
January 1, 2018
, through the close of business on the last business day of the calendar quarter, which is 5:00 p.m., New York City time, on Friday,
March 31, 2018
. If notices of conversion are received, the Company plans to settle the cash portion of the conversion obligation with cash on hand and/or borrowings under its revolving credit facility.
Credit Ratings
The Company’s debt ratings of Baa2 from Moody’s and BBB from S&P contribute to its ability to access capital markets.
|
Contractual Cash Obligations
|
||||||||||||||||||||
|
Payments Due by Period
|
||||||||||||||||||||
|
|
|
|
2019-
|
2021-
|
2023 and
|
|||||||||||||||
|
|
Total
|
2018
|
2020
|
2022
|
thereafter
|
|||||||||||||||
|
Operating lease obligations
|
$
|
763.4
|
|
$
|
196.1
|
|
$
|
258.7
|
|
$
|
147.8
|
|
$
|
160.8
|
|
|||||
|
Contingent future licensing payments (a)
|
22.4
|
|
3.5
|
|
7.7
|
|
5.6
|
|
9.8
|
|
1.4
|
|
||||||||
|
Minimum royalty payments
|
24.2
|
|
2.5
|
|
8.1
|
|
12.1
|
|
1.5
|
|
||||||||||
|
Purchase obligations
|
29.2
|
|
25.5
|
|
3.7
|
|
—
|
|
—
|
|
||||||||||
|
Capital lease obligations
|
110.4
|
|
15.6
|
|
27.5
|
|
22.3
|
|
45.0
|
|
||||||||||
|
Scheduled interest payments on Senior Notes
|
2,150.7
|
|
218.1
|
|
407.5
|
|
324.3
|
|
1,200.8
|
|
||||||||||
|
Scheduled interest payments on Term Loan
|
117.6
|
|
25.3
|
|
53.8
|
|
38.5
|
|
—
|
|
||||||||||
|
Long-term debt
|
6,741.6
|
|
410.6
|
|
1,258.7
|
|
1,672.3
|
|
3,400.0
|
|
||||||||||
|
Total contractual cash obligations (b) (c)
|
$
|
9,959.5
|
|
$
|
897.2
|
|
$
|
2,025.7
|
|
$
|
2,227.1
|
|
$
|
4,809.5
|
|
|||||
|
(a)
|
Contingent future licensing payments will be made if certain events take place, such as the launch of a specific test, the transfer of certain technology, and the achievement specified revenue milestones.
|
|
(b)
|
The table does not include obligations under the Company’s pension and postretirement benefit plans, which are included in “Note 16 to Consolidated Financial Statements.” Benefits under the Company's postretirement medical plan are made when claims are submitted for payment, the timing of which is not practicable to estimate.
|
|
(c)
|
The table does not include the Company’s reserves for unrecognized tax benefits. The Company had a $27.4 and $28.3 reserve for unrecognized tax benefits, including interest and penalties, at
December 31, 2017
, and
2016
, respectively, which is included in “Note 13 to Consolidated Financial Statements.” Substantially all of these tax reserves are classified in other long-term liabilities in the Company’s Consolidated Balance Sheets at
December 31, 2017
, and
2016
.
|
Off-Balance Sheet Arrangements
The Company does not have transactions or relationships with “special purpose” entities, and the Company does not have any off-balance sheet financing other than normal operating leases and letters of credit.
Other Commercial Commitments
As of
December 31, 2017
, the Company provided letters of credit aggregating approximately
$72.2
, primarily in connection with certain insurance programs. Letters of credit provided by the Company are secured by the Company’s revolving credit facility and are renewed annually.
59
The contractual value of the noncontrolling interest put in the Company's Ontario subsidiary totaled
$20.8
and
$15.2
at
December 31, 2017
, and 2016, respectively, and has been classified as mezzanine equity in the Company's consolidated balance sheet.
Based on current and projected levels of cash flows from operations, coupled with availability under its revolving credit facility, the Company believes it has sufficient liquidity to meet both its anticipated short-term and long-term cash needs; however, the Company continually reassesses its liquidity position in light of market conditions and other relevant factors.
Critical Accounting Policies
The preparation of financial statements in conformity with generally accepted accounting principles requires management to make estimates and assumptions that affect the reported amounts of assets and liabilities and disclosure of contingent assets and liabilities at the date of the financial statements and the reported amounts of revenues and expenses during the reported periods. While the Company believes these estimates are reasonable and consistent, they are by their very nature estimates of amounts that will depend on future events. Accordingly, actual results could differ from these estimates. The Company’s Audit Committee periodically reviews the Company’s significant accounting policies. The Company’s critical accounting policies arise in conjunction with the following:
|
•
|
Revenue recognition and allowance for doubtful accounts;
|
|
•
|
Pension expense;
|
|
•
|
Accruals for self-insurance reserves;
|
|
•
|
Income taxes; and
|
|
•
|
Goodwill and indefinite-lived assets.
|
Revenue Recognition and Allowance for Doubtful Accounts
LCD recognizes revenue for services rendered when the testing process is complete and test results are reported to the ordering physician. The sales are generally billed to three types of payers – customers, patients and third parties such as managed care organizations (MCOs), Medicare and Medicaid. For customers, sales are recorded on a fee-for-service basis at the Company’s customer list price, less any negotiated discount. Patient sales are recorded at the Company’s patient fee schedule, net of any discounts negotiated with physicians on behalf of their patients, or made available through charity care or an uninsured or underinsured patient program. LCD bills third-party payers in two ways: fee-for-service and capitated agreements. Fee-for-service third-party payers are billed at the Company's patient fee schedule amount, and third-party revenue is recorded net of contractual discounts. These discounts are recorded at the transaction level at the time of sale based on a fee schedule that is maintained for each third-party payer. The majority of the Company’s third-party sales are recorded using an actual or contracted fee schedule at the time of sale. For the remaining third-party sales, estimated fee schedules are maintained for each payer. Adjustments to the estimated payment amounts are recorded at the time of final collection and settlement of each transaction as an adjustment to revenue. These adjustments are not material to the Company’s results of operations in any period presented. The Company periodically adjusts these estimated fee schedules based upon historical payment trends. Under capitated agreements with MCOs, the Company recognizes revenue based on a negotiated monthly contractual rate for each member of the managed care plan regardless of the number or cost of the tests performed.
CDD recognizes revenue either as services are performed or products are delivered, depending on the nature of the work contracted. Historically, a majority of CDD’s net revenues have been earned under contracts that range in duration from a few months to a few years, but can extend in duration up to five years or longer. Occasionally, CDD also has committed minimum volume arrangements with certain customers. Under these types of arrangements, if the annual minimum dollar value of service commitment is not reached, the customer is required to pay CDD for the shortfall. Annual minimum commitment shortfalls are not included in net revenues until the amount has been determined and agreed to by the customer.
Service contracts generally take the form of fee-for-service or fixed-price arrangements subject to pricing adjustments based on changes in scope. In cases where performance spans multiple accounting periods, revenue is recognized as services are performed, measured on a proportional-performance basis, generally using output measures that are specific to the service provided. Examples of output measures in preclinical services include, among others, the number of slides read, or specimens prepared. Examples of output measures in the clinical trials services include, among others, the number of investigators enrolled, the number of sites initiated, the number of trial subjects enrolled and the number of monitoring visits completed, or the number of dosings for clinical pharmacology. Revenue is determined by dividing the actual units of work completed by the total units of work required under the contract and multiplying that percentage by the total contract value. The total contract value, or total contractual payments, represents the aggregate contracted price for each of the agreed upon services to be provided. CDD does not have any contractual arrangements spanning multiple accounting periods where revenue is recognized on a proportional-performance basis under which the Company has earned more than an immaterial amount of performance-based revenue (i.e., potential additional revenue tied to specific deliverables or performance). Changes in the scope of work are common, especially under long-term contracts, and generally result in a change in contract value. Once the customer has agreed to the changes in scope and renegotiated pricing
60
terms, the contract value is amended with revenue recognized as described above. Estimates of costs to complete are made to provide, where appropriate, for losses expected on contracts. Costs are not deferred in anticipation of contracts being awarded, but instead are expensed as incurred.
Billing schedules and payment terms are generally negotiated on a contract-by-contract basis. In some cases, CDD bills the customer for the total contract value in progress-based installments as certain non-contingent billing milestones are reached over the contract duration, such as, but not limited to, contract signing, initial dosing, investigator site initiation, patient enrollment or database lock. The term “billing milestone” relates only to a billing trigger in a contract whereby amounts become billable and payable in accordance with a negotiated predetermined billing schedule throughout the term of a project. These billing milestones are generally not performance-based (i.e., there is no potential additional consideration tied to specific deliverables or performance). In other cases, billing and payment terms are tied to the passage of time (e.g., monthly billings). In either case, the total contract value and aggregate amounts billed to the customer would be the same at the end of the project. While CDD attempts to negotiate terms that provide for billing and payment of services prior or within close proximity to the provision of services, this is not always possible, and there are fluctuations in the levels of unbilled services and unearned revenue from period to period. While a project is ongoing, cash payments are not necessarily representative of aggregate revenue earned at any particular point in time, as revenues are recognized when services are provided, while amounts billed and paid are in accordance with the negotiated billing and payment terms.
In some cases, payments received are in excess of revenue recognized. For example, a contract invoicing schedule may provide for an upfront payment of 10% of the full contract value upon contract signing, but at the time of signing performance of services has not yet begun. Payments received in advance of services being provided are deferred as unearned revenue on the balance sheet. As the contracted services are subsequently performed and the associated revenue is recognized, the unearned revenue balance is reduced by the amount of revenue recognized during the period.
In other cases, services may be provided and revenue recognized before the customer is invoiced. In these cases, revenue recognized will exceed amounts billed, and the difference, representing an unbilled receivable, is recorded for the amount that is currently not billable to the customer pursuant to contractual terms. Once the customer is invoiced, the unbilled services are reduced for the amount billed, and a corresponding account receivable is recorded. All unbilled services are billable to customers within one year from the respective balance sheet date.
Most contracts are terminable with or without cause by the customer, either immediately or upon notice. These contracts often require payment to CDD of expenses to wind down the study or project, fees earned to date and, in some cases, a termination fee or a payment to CDD of some portion of the fees or profits that could have been earned by CDD under the contract if it had not been terminated early. Termination fees are included in net revenues when realization is assured. In connection with the management of multi-site clinical trials, CDD pays on behalf of its customers fees to investigators, clinical trial subjects and certain out-of-pocket costs, for which it is reimbursed at cost, without markup or profit. Investigator fees are not reflected in net revenues or expenses where CDD acts in the capacity of an agent on behalf of the biopharmaceutical company sponsor, passing through these costs without markup or profit. All other out-of-pocket costs are included in total revenues and expenses.
LCD has a formal process to estimate and review the collectability of its receivables based on the period of time they have been outstanding. Bad debt expense is recorded within selling, general and administrative expenses as a percentage of sales considered necessary to maintain the allowance for doubtful accounts at an appropriate level. LCD’s process for determining the appropriate level of the allowance for doubtful accounts involves judgment and considers such factors as the age of the underlying receivables, historical and projected collection experience, and other external factors that could affect the collectability of its receivables. Accounts are written off against the allowance for doubtful accounts based on LCD’s write-off policy (e.g.
,
when they are deemed to be uncollectible). In the determination of the appropriate level of the allowance, accounts are progressively reserved based on the historical timing of cash collections relative to their respective aging categories within LCD’s receivables. These collection and reserve processes, along with the close monitoring of the billing process, help reduce the risks of material revisions to reserve estimates resulting from adverse changes in collection or reimbursement experience.
The following table presents the percentage of LCD’s net accounts receivable outstanding by aging category at
December 31, 2017
, and
2016
:
61
|
Days Outstanding
|
2017
|
2016
|
|
|
0 – 30
|
50.1%
|
49.1%
|
|
|
31 – 60
|
19.5%
|
17.3%
|
|
|
61 – 90
|
8.9%
|
9.2%
|
|
|
91 – 120
|
6.1%
|
7.5%
|
|
|
121 – 150
|
3.8%
|
4.2%
|
|
|
151 – 180
|
3.7%
|
3.9%
|
|
|
181 – 270
|
6.9%
|
7.4%
|
|
|
271 – 360
|
0.9%
|
1.3%
|
|
|
Over 360
|
0.1%
|
0.1%
|
|
The above table excludes the percentage of net accounts receivable outstanding by aging category for certain foreign operations, BeaconLBS, and the nutritional chemistry and food safety business. Combined these net accounts receivable balances comprise less than 10.8% of LCD's total net accounts receivable balances. The Company believes that including the agings of the accounts receivable for these businesses would not be representative of the majority of accounts receivable by aging category for LCD. The majority of the accounts receivable for the foreign operations, BeaconLBS, and the nutritional chemistry and food safety business are generally paid within 30 to 60 days of billing.
CDD endeavors to assess and monitor the creditworthiness of its customers to which it grants credit terms in the ordinary course of business. CDD maintains a provision for doubtful accounts relating to amounts due that may not be collected. This bad debt provision is monitored on a monthly basis and adjusted as circumstances warrant. Since the recorded bad debt provision is based upon management's judgment, actual bad debt write-offs may be greater or less than the amount recorded. Historically, bad debt write-offs have not been material. The allowance for doubtful accounts amounted to $2.3 and $2.8 at December 31, 2017, and 2016, respectively.
Pension Expense
The Company has a defined-benefit retirement plan (Company Plan) and a non-qualified supplemental retirement plan (PEP). In October 2009, the Company received approval from its board of directors to freeze any additional service-based credits for any years of service after December 31, 2009, on the Company Plan and the PEP. Both plans have been closed to new participants. Employees participating in the Company Plan and the PEP no longer earn service-based credits, but continue to earn interest credits. In addition, effective January 1, 2010, all employees eligible for the defined-contribution retirement plan (401K Plan) receive a minimum 3% non-elective contribution (NEC) concurrent with each payroll period. The 401K Plan also permits discretionary contributions by the Company of up to 1% and up to 3% of pay for eligible employees, based on service.
The Company Plan covers substantially all employees employed by the Company prior to December 31, 2009. The benefits to be paid under the Company Plan are based on years of credited service through December 31, 2009, interest credits and average compensation. The Company's policy is to fund the Company Plan with at least the minimum amount required by applicable regulations. The PEP covers a portion of the Company's senior management group. Prior to 2010, the PEP provided for the payment of the difference, if any, between the amount of any maximum limitation on annual benefit payments under the Employee Retirement Income Security Act of 1974 and the annual benefit that would be payable under the Company Plan but for such limitation. Effective January 1, 2010, employees participating in the PEP no longer earn service-based credits. The PEP is an unfunded plan.
In addition, as a result of the Covance acquisition, the Company has a frozen non-qualified Supplemental Executive Retirement Plan (SERP). The SERP, which is not funded, is intended to provide retirement benefits for certain employees who were executive officers of Covance prior to the Covance acquisition. Benefit amounts are based upon years of service and compensation of the participating employees. As a result of the Covance acquisition, the Company also sponsors two defined-benefit pension plans for the benefit of its employees at two U.K. subsidiaries (U.K. Plans) and one defined-benefit pension plan for the benefit of its employees at a German subsidiary (German Plan), all of which are legacy plans of previously acquired companies and are closed to new entrants. Benefit amounts for all three plans are based upon years of service and compensation. The German Plan is unfunded while the U.K. Plans are funded. The Company’s funding policy for the U.K. Plans has been to contribute annually amounts at least equal to the local statutory funding requirements.
The Company's net pension cost is developed from actuarial valuations. Inherent in these valuations are key assumptions, including discount rates and expected return on plan assets, which are updated on an annual basis at the beginning of each year. The Company is required to consider current market conditions, including changes in interest rates, in making these assumptions. Changes in pension costs may occur in the future due to changes in these assumptions. The key assumptions used in accounting for the defined-benefit retirement plans were a 3.7% discount rate and a 6.8% expected long-term rate of return on plan assets for the Company Plan, a 3.7% discount rate for the PEP, a 4.2% discount rate for the SERP, a 1.7% discount rate and a 2.0% expected salary increase for the German plan and a 2.7% discount rate and a 3.8% expected salary increase for the U.K. Plans as of
December 31, 2017
.
62
Discount Rate
The Company evaluates several approaches toward setting the discount rate assumption that is used to value the benefit obligations of its retirement plans. At year-end, priority was given to use of the Towers Watson Bond:Link model, which simulates the purchase of investment-grade corporate bonds at current market yields with principal amounts and maturity dates closely matching the Company's projected cash disbursements from its plans. This completed model represents the yields to maturity at which the Company could theoretically settle its plan obligations at year end. The weighted-average yield on the modeled bond portfolio is then used to form the discount rate assumption used for each retirement plan. A one percentage point decrease or increase in the discount rate would have resulted in a respective increase or decrease in
2017
retirement plan expense of $1.5 for the Company Plan and PEP. A one percentage point decrease or increase in the discount rate would have resulted in a respective increase or decrease in
2017
retirement plan expense of $1.1 for the U.K. Plans.
Return on Plan Assets
In establishing its expected return on plan assets assumption, the Company reviews its asset allocation and develops return assumptions based on different asset classes adjusting for plan operating expenses. Actual asset over/under performance compared to expected returns will respectively decrease/increase unrecognized loss. The change in the unrecognized loss will change amortization cost in upcoming periods. A one percentage point increase or decrease in the expected return on plan assets would have resulted in a corresponding change in
2017
pension expense of $2.4 for the Company Plan. A one percentage point increase or decrease in the expected return on plan assets would have resulted in a corresponding change in
2017
pension expense of $2.4 for the U.K. Plans.
Net pension cost for
2017
was
$14.6
as compared with
$14.9
in
2016
and
$12.0
in
2015
. The increase in pension expense was due to increases in the amount of net amortization and deferral as a result of lower discount rates. Pension expense for the Company Plan and the PEP is expected to
increase to
$13.3
in 2018 as a result of a lower assumed discount rate and changes in participant mortality tables. Pension expense for the Germany Plan and the U.K. Plans is expected to
increase to
$0.1
in 2018 as a result of changes in participant mortality tables.
Further information on the Company’s defined-benefit retirement plans is provided in Note 16 to the Consolidated Financial Statements.
Accruals for Self-Insurance Reserves
Accruals for self-insurance reserves (including workers’ compensation, auto and employee medical) are determined based on a number of assumptions and factors, including historical payment trends and claims history, actuarial assumptions and current and estimated future economic conditions. These estimated liabilities are not discounted.
The Company is self-insured (up to certain limits) for professional liability claims arising in the normal course of business, generally related to the testing and reporting of laboratory test results. The Company maintains excess insurance which limits the Company’s maximum exposure on individual claims. The Company estimates a liability that represents the ultimate exposure for aggregate losses below those limits. The liability is based on assumptions and factors for known and incurred but not reported claims, including the frequency and payment trends of historical claims.
If actual trends differ from these estimates, the financial results could be impacted. Historical trends have not differed materially from these estimates.
Income Taxes
The Company accounts for income taxes utilizing the asset and liability method. Under this method, deferred tax assets and liabilities are recognized for the future tax consequences attributable to differences between the financial statement carrying amounts of existing assets and liabilities and their respective tax bases and for tax loss carryforwards. Deferred tax assets and liabilities are measured using enacted tax rates expected to apply to taxable income in the years in which those temporary differences are expected to be recovered or settled. The effect on deferred tax assets and liabilities of a change in tax rates is recognized in income in the period that includes the enactment date. The Company does not recognize a tax benefit, unless the Company concludes that it is more likely than not that the benefit will be sustained on audit by the taxing authority based solely on the technical merits of the associated tax position. If the recognition threshold is met, the Company recognizes a tax benefit measured at the largest amount of the tax benefit that the Company believes is greater than 50% likely to be realized. The Company records interest and penalties in income tax expense.
During the fourth quarter of 2017, the Company recorded the estimated impact of the TCJA, which resulted in a favorable remeasurement of deferred taxes, partially offset by the deemed repatriation tax. Given the significant changes resulting from the TCJA, the estimated financial impact is provisional and subject to further clarification, which could result in changes to these estimates in 2018.
63
Goodwill and Indefinite-Lived Assets
The Company assesses goodwill and indefinite-lived intangibles for impairment at least annually or whenever events or changes in circumstances indicate that the carrying amount of such assets may not be recoverable. In accordance with updates to the FASB's authoritative guidance regarding goodwill and indefinite-lived intangible asset impairment testing, an entity is allowed to first assess qualitative factors as a basis for determining whether it is necessary to perform quantitative impairment testing. If an entity determines that it is not more likely than not that the estimated fair value of an asset is less than its carrying value, then no further testing is required. Otherwise, impairment testing must be performed in accordance with the original accounting standards. The updated FASB guidance also allows an entity to bypass the qualitative assessment for any reporting unit in its goodwill assessment and proceed directly to performing the quantitative assessment. Similarly, a company can proceed directly to a quantitative assessment in the case of impairment testing for indefinite-lived intangible assets as well.
The quantitative goodwill impairment test includes the estimation of the fair value of each reporting unit as compared to the carrying value of the reporting unit. Reporting units are businesses with discrete financial information that is available and reviewed by management. The Company estimates the fair value of a reporting unit using both income-based and market-based valuation methods. The income-based approach is based on the reporting unit's forecasted future cash flows that are discounted to the present value using the reporting unit's weighted average cost of capital. For the market-based approach, the Company utilizes a number of factors such as publicly available information regarding the market capitalization of the Company as well as operating results, business plans, market multiples, and present value techniques. Based upon the range of estimated values developed from the income and market-based methods, the Company determines the estimated fair value for the reporting unit. If the estimated fair value of the reporting unit exceeds the carrying value, the goodwill is not impaired and no further review is required. An entity should recognize an impairment charge for the amount by which the carrying amount exceeds the reporting unit’s fair value; however, the loss recognized should not exceed the total amount of goodwill allocated to that reporting unit.
The income-based fair value methodology requires management's assumptions and judgments regarding economic conditions in the markets in which the Company operates and conditions in the capital markets, many of which are outside of management's control. At the reporting unit level, fair value estimation requires management's assumptions and judgments regarding the effects of overall economic conditions on the specific reporting unit, along with assessment of the reporting unit's strategies and forecasts of future cash flows. Forecasts of individual reporting unit cash flows involve management's estimates and assumptions regarding:
|
•
|
Annual cash flows, on a debt-free basis, arising from future revenues and profitability, changes in working capital, capital spending and income taxes for at least a five-year forecast period.
|
|
•
|
A terminal growth rate for years beyond the forecast period. The terminal growth rate is selected based on consideration of growth rates used in the forecast period, historical performance of the reporting unit and economic conditions.
|
|
•
|
A discount rate that reflects the risks inherent in realizing the forecasted cash flows. A discount rate considers the risk-free rate of return on long-term treasury securities, the risk premium associated with investing in equity securities of comparable companies, the beta obtained from the comparable companies and the cost of debt for investment grade issuers. In addition, the discount rate may consider any company-specific risk in achieving the prospective financial information.
|
Under the market-based fair value methodology, judgment is required in evaluating market multiples and recent transactions. Management believes that the assumptions used for its impairment tests are representative of those that would be used by market participants performing similar valuations of the reporting units.
Management performed its annual goodwill and intangible asset impairment testing as of the beginning of the fourth quarter of 2017. The Company elected to perform the qualitative assessment for goodwill and intangible assets for all reporting units except the Canadian reporting unit and its indefinite-lived assets consisting of acquired Canadian licenses for which a quantitative assessment was performed.
In the qualitative assessment, the Company considered relevant events and circumstances for each reporting unit, including (i) current year results, ii) financial performance versus management’s annual and five-year strategic plans, iii) changes in the reporting unit carrying value since prior year, (iv) industry and market conditions in which the reporting unit operates, (v) macroeconomic conditions, including discount rate changes, and (vi) changes in products or services offered by the reporting unit. If applicable, performance in recent years was compared to forecasts included in prior valuations. Based on the results of the qualitative assessment, the Company concluded that it was not more likely than not that the carrying values of the goodwill and intangible assets were greater than their fair values, and that further quantitative testing was not necessary.
64
In 2017, the Company utilized an income approach to determine the fair value of its Canadian reporting unit and its indefinite-lived assets consisting of acquired Canadian licenses. Based upon the results of the quantitative assessment, the Company concluded that the fair value of the indefinite-lived Canadian licenses was greater than the carrying value.
It is possible that the Company's conclusions regarding impairment or recoverability of goodwill or intangible assets in any reporting unit could change in future periods. There can be no assurance that the estimates and assumptions used in the Company's goodwill and intangible asset impairment testing performed as of the beginning of the fourth quarter of 2017 will prove to be accurate predictions of the future, if, for example, (i) the businesses do not perform as projected, (ii) overall economic conditions in 2018 or future years vary from current assumptions (including changes in discount rates), (iii) business conditions or strategies for a specific reporting unit change from current assumptions, including loss of major customers, (iv) investors require higher rates of return on equity investments in the marketplace or (v) enterprise values of comparable publicly traded companies, or actual sales transactions of comparable companies, were to decline, resulting in lower multiples of revenues and EBITDA. The Company will particularly monitor the financial performance of and assumptions for two of the CDD reporting units for which an income approach was performed in 2017. A future impairment charge for goodwill or intangible assets could have a material effect on the Company's consolidated financial position and results of operations.
65
FORWARD-LOOKING STATEMENTS
The Company has made in this report, and from time to time may otherwise make in its public filings, press releases and discussions by Company management, forward-looking statements concerning the Company’s operations, performance and financial condition, as well as its strategic objectives. Some of these forward-looking statements can be identified by the use of forward-looking words such as “believes”, “expects”, “may”, “will”, “should”, “seeks”, “approximately”, “intends”, “plans”, “estimates”, or “anticipates” or the negative of those words or other comparable terminology. Such forward-looking statements are subject to various risks and uncertainties and the Company claims the protection afforded by the safe harbor for forward-looking statements contained in the Private Securities Litigation Reform Act of 1995. Actual results could differ materially from those currently anticipated due to a number of factors in addition to those discussed elsewhere herein, including in Item 1A Risk Factors, and in the Company’s other public filings, press releases and discussion with Company management, including:
|
1.
|
changes in government and third-party payer regulations, reimbursement, or coverage policies or other future reforms in the healthcare system (or in the interpretation of current regulations), new insurance or payment systems, including state, regional or private insurance cooperatives (e.g., health insurance exchanges), affecting governmental and third-party coverage or reimbursement for commercial laboratory testing, including the impact of the Protecting Access to Medicare Act of 2014 (PAMA);
|
|
2.
|
significant monetary damages, fines, penalties, assessments, refunds, repayments, unanticipated compliance expenditures and/or exclusion or disbarment from or ineligibility to participate in government programs, among other adverse consequences, arising from enforcement of anti-fraud and abuse laws and other laws applicable to the Company in jurisdictions in which the Company conducts business;
|
|
3.
|
significant fines, penalties, costs, unanticipated compliance expenditures and/or damage to the Company’s reputation arising from the failure to comply with national, state or local privacy and security laws and regulations, including the Health Insurance Portability and Accountability Act of 1996, the Health Information Technology for Economic and Clinical Health Act, the European Union's General Data Protection Regulation and similar laws and regulations in jurisdictions in which the Company conducts business;
|
|
4.
|
loss or suspension of a license or imposition of a fine or penalties under, or future changes in, or interpretations of applicable national, state or local licensing laws or regulations regarding the operation of clinical laboratories and the delivery of clinical laboratory test results, including, but not limited to, the U.S. Clinical Laboratory Improvement Act of 1967 and the Clinical Laboratory Improvement Amendments of 1988 and similar laws and regulations in jurisdictions in which the Company conducts business;
|
|
5.
|
penalties or loss of license arising from the failure to comply with applicable national, state or local occupational and workplace safety laws and regulations, including the U.S. Occupational Safety and Health Administration requirements and the U.S. Needlestick Safety and Prevention Act and similar laws and regulations in jurisdictions in which the Company conducts business;
|
|
6.
|
fines, unanticipated compliance expenditures, suspension of manufacturing, enforcement actions, injunctions, or criminal prosecution arising from failure to maintain compliance with current good manufacturing practice regulations and similar requirements of various regulatory agencies in jurisdictions in which the Company conducts business;
|
|
7.
|
sanctions or other remedies, including fines, unanticipated compliance expenditures, enforcement actions, injunctions or criminal prosecution arising from failure to comply with the Animal Welfare Act or similar national, state and local laws and regulations in jurisdictions in which the Company conducts business;
|
|
8.
|
changes in testing guidelines or recommendations by government agencies, medical specialty societies and other authoritative bodies affecting the utilization of laboratory tests;
|
|
9.
|
changes in national, state or local government regulations or policies affecting the approval, availability of, and the selling and marketing of diagnostic tests, drug development, or the conduct of drug development and medical device and diagnostic studies and trials, including regulations and policies of the U.S. Food and Drug Administration, the U.S. Department of Agriculture, the Medicine and Healthcare products Regulatory Agency in the U.K., the China Food and Drug Administration, the Pharmaceutical and Medical Devices Agency in Japan, the European Medicines Agency and similar regulations and policies of agencies in jurisdictions in which the Company conducts business;
|
|
10.
|
changes in government regulations or reimbursement pertaining to the biopharmaceutical and medical device and diagnostic industries, changes in reimbursement of biopharmaceutical products or reduced spending on research and development by biopharmaceutical customers;
|
|
11.
|
liabilities that result from the failure to comply with corporate governance requirements;
|
66
|
12.
|
increased competition, including price competition, potential reduction in rates in response to price transparency and consumerism, competitive bidding and/or changes or reductions to fee schedules and competition from companies that do not comply with existing laws or regulations or otherwise disregard compliance standards in the industry;
|
|
13.
|
changes in payer mix or payment structure, including insurance carrier participation in health insurance exchanges, an increase in capitated reimbursement mechanisms, the impact of a shift to consumer-driven health plans or plans carrying an increased level of member cost-sharing, and adverse changes in payer reimbursement or payer coverage policies (implemented directly or through a third party utilization management organization) related to specific diagnostic tests, categories of testing or testing methodologies;
|
|
14.
|
failure to retain or attract managed care organization (MCO) business as a result of changes in business models, including new risk based or network approaches, out-sourced Laboratory Network Management or Utilization Management companies, or other changes in strategy or business models by MCOs;
|
|
15.
|
failure to obtain and retain new customers, an unfavorable change in the mix of testing services ordered, or a reduction in tests ordered, specimens submitted or services requested by existing customers;
|
|
16.
|
difficulty in maintaining relationships with customers or retaining key employees as a result of uncertainty surrounding the integration of acquisitions and the resulting negative effects on the business of the Company;
|
|
17.
|
consolidation and convergence of MCOs, biopharmaceutical companies, health systems, large physician organizations and other customers, potentially causing material shifts in insourcing, utilization, pricing and reimbursements, including full and partial risk based models;
|
|
18.
|
failure to effectively develop and deploy new systems, system modifications or enhancements required in response to evolving market and business needs;
|
|
19.
|
customers choosing to insource services that are or could be purchased from the Company;
|
|
20.
|
failure to identify, successfully close and effectively integrate and/or manage acquisitions of new businesses;
|
|
21.
|
inability to achieve the expected benefits and synergies of newly acquired businesses, and impact on the Company's cash position, levels of indebtedness and stock price;
|
|
22.
|
termination, loss, delay, reduction in scope or increased costs of contracts, including large contracts and multiple contracts;
|
|
23.
|
liability arising from errors or omissions in the performance of contract research services or other contractual arrangements;
|
|
24.
|
failure to successfully obtain, maintain and enforce intellectual property rights and defend against challenges to the Company’s intellectual property rights;
|
|
25.
|
changes or disruption in services or supplies provided by third parties, including transportation;
|
|
26.
|
damage or disruption to the Company's facilities;
|
|
27.
|
damage to the Company's reputation, loss of business, or other harm from acts of animal rights extremists or potential harm and/or liability arising from animal research activities or the provision of animal research products;
|
|
28.
|
adverse results in litigation matters;
|
|
29.
|
inability to attract and retain experienced and qualified personnel;
|
|
30.
|
failure to develop or acquire licenses for new or improved technologies, such as point-of-care testing, mobile health technologies, and digital pathology, or potential use of new technologies by customers and/or consumers to perform their own tests;
|
|
31.
|
substantial costs arising from the inability to commercialize newly licensed tests or technologies or to obtain appropriate coverage or reimbursement for such tests;
|
|
32.
|
inability to obtain and maintain adequate patent and other proprietary rights for protection of the Company's products and services and successfully enforce the Company's proprietary rights;
|
|
33.
|
scope, validity and enforceability of patents and other proprietary rights held by third parties that may impact the Company's ability to develop, perform, or market the Company's products or services or operate its business;
|
|
34.
|
business interruption or other impact on the business due to adverse weather, fires and/or other natural disasters, acts of war, terrorism or other criminal acts, and/or widespread outbreak of influenza or other pandemic illness;
|
|
35.
|
discontinuation or recalls of existing testing products;
|
67
|
36.
|
a failure in the Company's information technology systems, including with respect to testing turnaround time and billing processes, or the failure to maintain the security of business information or systems or to protect against cyber security attacks such as denial of service attacks, malware, ransomware and computer viruses, or delays or failures in the development and implementation of the Company’s automation platforms, any of which could result in a negative effect on the Company’s performance of services, a loss of business or increased costs, damages to the Company’s reputation, significant litigation exposure, an inability to meet required financial reporting deadlines, or the failure to meet future regulatory or customer information technology, data security and connectivity requirements;
|
|
37.
|
business interruption, increased costs, and other adverse effects on the Company's operations due to the unionization of employees, union strikes, work stoppages, general labor unrest or failure to comply with labor or employment laws;
|
|
38.
|
failure to maintain the Company's days sales outstanding and/or bad debt expense levels including a negative impact on the Company's reimbursement, cash collections and profitability arising from unfavorable changes in third-party payer policies, payment delays introduced by third party benefit management organizations and increasing levels of patient payment responsibility;
|
|
39.
|
impact on the Company's revenue, cash collections and the availability of credit for general liquidity or other financing needs arising from a significant deterioration in the economy or financial markets or in the Company's credit ratings by Standard & Poor's and/or Moody's;
|
|
40.
|
failure to maintain the expected capital structure for the Company, including failure to maintain the Company's investment grade rating;
|
|
41.
|
changes in reimbursement by foreign governments and foreign currency fluctuations;
|
|
42.
|
inability to obtain certain billing information from physicians, resulting in increased costs and complexity, a temporary disruption in receipts and ongoing reductions in reimbursements and net revenues;
|
|
43.
|
expenses and risks associated with international operations, including, but not limited to, compliance with the U.S. Foreign Corrupt Practices Act, the U.K. Bribery Act, other global anti-corruption laws and regulations, trade sanction laws and regulations, and economic, political, legal and other operational risks associated with foreign jurisdictions;
|
|
44.
|
failure to achieve expected efficiencies and savings in connection with the Company's business process improvement initiatives;
|
|
45.
|
changes in tax laws and regulations or changes in their interpretation, including the TCJA; and
|
|
46.
|
global economic conditions and government and regulatory changes, including, but not limited to the United Kingdom's announced intention to exit from the European Union.
|
|
Item 7A.
|
QUANTITATIVE AND QUALITATIVE DISCLOSURE ABOUT MARKET RISK (in millions)
|
Market risk is the potential loss arising from adverse changes in market rates and prices, such as foreign currency exchange rates, interest rates and other relevant market rate or price changes. In the ordinary course of business, the Company is exposed to various market risks, including changes in foreign currency exchange and interest rates, and the Company regularly evaluates the exposure to such changes. The Company addresses its exposure to market risks, principally the market risks associated with changes in foreign currency exchange rates and interest rates, through a controlled program of risk management that includes, from time to time, the use of derivative financial instruments such as foreign currency forward contracts and interest rate swap agreements. Although, as set forth below, the Company’s zero-coupon subordinated notes contain features that are considered to be embedded derivative instruments, the Company does not hold or issue derivative financial instruments for trading purposes.
Foreign Currency Exchange Rates
Approximately 10.2% of the Company's net revenues for the year ended December 31, 2017 and approximately 10.3% of those for the year ended 2016 were denominated in currencies other than the U.S. dollar. The Company's financial statements are reported in U.S. dollars and, accordingly, fluctuations in exchange rates will affect the translation of revenues and expenses denominated in foreign currencies into U.S. dollars for purposes of reporting the Company's consolidated financial results. In both 2017 and 2016, the most significant currency exchange rate exposures were to the Canadian dollar, Swiss franc, euro and British pound. Excluding the impacts from any outstanding or future hedging transactions, a hypothetical change of 10% in average exchange rates used to translate all foreign currencies to U.S. dollars would have impacted income before income taxes for 2016 by approximately $2.3. Gross accumulated currency translation adjustments recorded as a separate component of shareholders’ equity were
$262.3
and
$(250.0)
at December 31, 2017, and 2016, respectively. The Company does not have significant operations in countries in which the economy is considered to be highly inflationary.
The Company earns revenue from service contracts over a period of several months and, in some cases, over a period of several years. Accordingly, exchange rate fluctuations during this period may affect the Company's profitability with respect to such
68
contracts. The Company is also subject to foreign currency transaction risk for fluctuations in exchange rates during the period of time between the consummation and cash settlement of transactions. The Company limits its foreign currency transaction risk through exchange rate fluctuation provisions stated in some of its contracts with customers, or it may hedge transaction risk with foreign currency forward contracts. At December 31, 2017, the Company had 26 open foreign exchange forward contracts with various amounts maturing monthly through January 2018 with a notional value totaling approximately $360.5. At December 31, 2016, the Company had five open foreign exchange forward contracts with various amounts maturing monthly through January 2017 with a notional value totaling approximately $167.9.
Interest Rates
Some of the Company's debt is subject to interest at variable rates. As a result, fluctuations in interest rates affect the Company's financial results. The Company attempts to manage interest rate risk and overall borrowing costs through an appropriate mix of fixed and variable rate debt including the utilization of derivative financial instruments, primarily interest rate swaps.
Borrowings under the Company's term loan credit facilities and revolving credit facility are subject to variable interest rates, unless fixed through interest rate swaps or other agreements. As of December 31, 2017, and 2016, the Company had approximately $
72.0
and $
565.0
, respectively, of unhedged variable rate debt under the 2014 term loan credit facility and
$750.0
and
$0.0
, respectively, under the 2017 term loan credit facility.
During the third quarter of 2013, the Company entered into two fixed-to-variable interest rate swap agreements for its 4.625% Senior Notes due 2020 with an aggregate notional amount of $600.0 and variable interest rates based on one-month LIBOR plus 2.298% to hedge against changes in the fair value of a portion of the Company's long-term debt.
The Company’s zero-coupon subordinated notes contain the following two features that are considered to be embedded derivative instruments under authoritative guidance in connection with accounting for derivative instruments and hedging activities:
|
1)
|
The Company will pay contingent cash interest on the zero-coupon subordinated notes after September 11, 2006, if the average market price of the notes equals 120% or more of the sum of the issue price, accrued original issue discount and contingent additional principal, if any, for a specified measurement period.
|
|
2)
|
Holders may surrender zero-coupon subordinated notes for conversion during any period in which the rating assigned to the zero-coupon subordinated notes by S&P Ratings Services is BB- or lower.
|
Each quarter-point increase or decrease in the variable rate would result in the Company's interest expense changing by approximately $2.1 per year for the Company's unhedged variable rate debt.
|
Item 8.
|
FINANCIAL STATEMENTS AND SUPPLEMENTARY DATA
|
Information required by this item is incorporated to the
Report of Independent Registered Public Accounting Firm
and from the consolidated financial statements, related notes and supplementary data. See the Index on Page F-1.
|
Item 9.
|
CHANGES IN AND DISAGREEMENTS WITH ACCOUNTANTS ON ACCOUNTING AND FINANCIAL DISCLOSURE
|
Not Applicable.
|
Item 9A.
|
CONTROLS AND PROCEDURES
|
Disclosure Controls and Procedures
As of the end of the period covered by this report, the Company carried out under the supervision and with the participation of the Company’s management, including the Company’s principal executive officer and principal financial officer, an evaluation of the effectiveness of the Company's disclosure controls and procedures (as defined in Rules 13a-15(e) and 15d-15(e) under the Securities Exchange Act of 1934, as amended). Based upon this evaluation, the Company’s principal executive officer and principal financial officer concluded that the Company’s disclosure controls and procedures were effective as of the end of the period covered by this annual report.
Changes in Internal Control over Financial Reporting
On May 4, 2017, the Company completed the acquisition of Pathology Associates Medical Laboratories (PAML), and on September 1, 2017, the Company completed the acquisition of Chiltern International Group Limited (Chiltern). The Company’s management has extended its oversight and monitoring processes that support internal control over financial reporting to include PAML and Chiltern's operations. The Company’s management is continuing to integrate the acquired operations of PAML and Chiltern's into the Company’s overall internal control over financial reporting process. However, management has excluded PAML
69
and Chiltern from its assessment of internal controls over financial reporting set forth below. There have been no other changes in the Company’s internal control over financial reporting (as defined in Exchange Act Rules 13a-15(f) and 15d-15(f)) during the fiscal year ended
December 31, 2017
, that have materially affected, or are reasonably likely to materially affect, the Company’s internal control over financial reporting.
Report of Management on Internal Control over Financial Reporting
The Company's management is responsible for establishing and maintaining adequate internal control over financial reporting (as defined in Rules 13a-15(f) and 15d-15(f) under the Securities Exchange Act of 1934).
The internal control over financial reporting at the Company was designed to provide reasonable assurance regarding the reliability of financial reporting and the preparation of financial statements for external purposes in accordance with accounting principles generally accepted in the U.S. Internal control over financial reporting includes those policies and procedures that:
|
•
|
pertain to the maintenance of records that, in reasonable detail, accurately and fairly reflect the transactions and dispositions of the assets of the Company;
|
|
•
|
provide reasonable assurance that transactions are recorded as necessary to permit preparation of financial statements in accordance with accounting principles generally accepted in the U.S.;
|
|
•
|
provide reasonable assurance that receipts and expenditures of the Company are being made only in accordance with authorization of management and directors of the Company; and
|
|
•
|
provide reasonable assurance regarding prevention or timely detection of unauthorized acquisition, use or disposition of assets that could have a material effect on the consolidated financial statements.
|
Because of its inherent limitations, internal control over financial reporting may not prevent or detect misstatements.
The Company's management assessed the effectiveness of the Company’s internal control over financial reporting as of
December 31, 2017
. Management based this assessment on criteria for effective internal control over financial reporting described in “Internal Control - Integrated Framework 2013” issued by the Committee of Sponsoring Organizations of the Treadway Commission (COSO). Based on this assessment, the Company's management determined that, as of
December 31, 2017
, the Company maintained effective internal control over financial reporting. Management reviewed the results of its assessment with the Audit Committee of the Company’s board of directors.
On May 4, 2017, the Company completed the acquisition of PAML, and on September 1, 2017, the Company completed the acquisition of Chiltern. As a result, management has excluded PAML and Chiltern from its assessment of internal control over financial reporting. PAML and Chiltern are wholly-owned subsidiaries whose total assets and total revenues, excluded from management's assessment, represent 1.9% and 4.0%, respectively, of the related consolidated financial statement amounts as of and for the year ended December 31, 2017.
PricewaterhouseCoopers LLP, an independent registered public accounting firm, who audited and reported on the consolidated financial statements of the Company included in this annual report, also audited the effectiveness of the Company’s internal control over financial reporting as of
December 31, 2017
, as stated in its report, which is included herein immediately preceding the Company’s audited financial statements.
|
Item 9B.
|
OTHER INFORMATION
|
None.
PART III
|
Item 10.
|
DIRECTORS, EXECUTIVE OFFICERS and CORPORATE GOVERNANCE
|
Board of Directors
David P. King
- Mr. King (61) has served as chairman of the board, president, and chief executive officer of the Company since May 6, 2009; prior to that date he served as a director, president, and chief executive officer of the Company since January 1, 2007. Mr. King served as executive vice president and chief operating officer from December 2005 to January 2007, as executive vice president of Strategic Planning and Corporate Development from January 2004 to December 2005 and was hired in September 2001 as senior vice president, general counsel, and chief compliance officer. Prior to joining the Company, he was a partner with Hogan & Hartson LLP (now Hogan Lovells US LLP) in Baltimore, Maryland, from 1992 to 2001. Mr. King was appointed to the board of directors of Cardinal Health Inc. in 2011 and chairs its Human Resources and Compensation Committee. He also sits on the boards of directors of the Seattle Science Foundation and the American Clinical Laboratory Association, is board chair of PATH, Inc., on the boards of trustees of Elon University and Durham Academy, and on the advisory board for Duke University’s Robert J. Margolis, MD, Center for Health Policy. Mr. King has over 10 years’ experience with the Company in a variety of roles of increasing responsibility in corporate operations, strategic planning, and corporate administration. Mr. King has a deep
70
understanding of the commercial laboratory industry, business strategy, sales and marketing, and executive management of the Company and its operations. Mr. King holds a bachelor’s degree, cum laude, from Princeton University and a J.D., cum laude, from the University of Pennsylvania Law School.
Kerrii B. Anderson
1,4
- Ms. Anderson (60) has served as a director of the Company since May 17, 2006. Ms. Anderson was chief executive officer of Wendy’s International Inc., a restaurant operating and franchising company, from April 2006 until September 2008, when the company was merged with Triarc. Ms. Anderson served as executive vice president and chief financial officer of Wendy’s International from 2000 to 2006. Prior to this position, she was chief financial officer and senior vice president of M/I Schottenstein Homes Inc. from 1987 to 2000. Ms. Anderson served as the chairwoman of the board of Chiquita Brands International Inc. from October 2012 until the Company was sold on January 6, 2015, and was the chair of the Nominating and Corporate Governance Committee and a member of the Audit Committee. She is also a director and a member of the Compensation Committee and Audit Committee of Worthington Industries Inc. Ms. Anderson serves on the Financial Committee of The Columbus Foundation, and she is also a member of the board of trustees as well as the chair of the Finance and Audit Committee for Ohio Health. She is also the chairman of the board of trustees for Elon University, as well as a member of the Audit Committee for Elon. She also was a director of PF Chang’s China Bistro Inc. from 2010 until June 2012 and Wendy’s International from 2006 until September 30, 2008. She has a strong record of leadership in operations and strategy. Ms. Anderson is also an audit committee financial expert as a result of her experience as CEO and CFO of Wendy’s International. Through her service on other public company boards, Ms. Anderson brings extensive financial, corporate governance and executive compensation experience to the Company’s board.
Jean-Luc Bélingard
2,3
- Mr. Bélingard (69) has served as a director of the Company since April 28, 1995. Mr. Bélingard was chairman of bioMérieux, the worldwide leader of the IVD microbiology segment and a non-U.S. public company from 2011 to December 2017. Mr. Bélingard also served as chief executive officer of bioMérieux from July 2011 to April 2014. Mr. Bélingard retired as chairman and chief executive officer of Ipsen SA, a diversified French healthcare holding company, on November 22, 2010. He had served in that position since 2002. Prior to this position, Mr. Bélingard was chief executive officer from 1999 to 2001 of bioMérieux-Pierre Fabre, a diversified French healthcare holding company, where his responsibilities included the management of that company’s worldwide pharmaceutical and cosmetic business. From 1990 to 1999, Mr. Bélingard was CEO of Roche Diagnostics and a member of the Hoffman La Roche group Executive Committee. Mr. Bélingard is a director of the following non-U.S. public companies: Stallergenes Greer (U.K.) since 2011, Laboratoire Pierre Fabre (France) since 2013, and Lupin Limited (India) since October 27, 2015. Mr. Bélingard holds directorships at various Institut Mérieux Group companies, in particular at Institut Mérieux, the Group’s parent company, and at Transgene SA., a non-U.S. public company. Mr. Bélingard is a member of the Bill and Melinda Gates Foundation CEO Roundtable. Mr. Bélingard has been chairman of “FEFIS,” the French Federation of Health Industries (Fédération Française des Industries de Santé), since 2016, and, since January 2017, he has been a member of the Conseil National de l’Industrie (C.N.I.) chaired by the French government. Mr. Bélingard’s long tenure at Roche, Ipsen and bioMérieux demonstrates his valuable business, leadership and management experience, including leading a large organization with global operations. He brings a strong strategic and operational background to the Company’s board. He also brings an important international perspective to the board’s deliberations. Mr. Bélingard has extensive corporate governance experience through his service on other public company boards.
D. Gary Gilliland, M.D., Ph.D.
1,3
- Dr. Gilliland (63) has served as a director of the Company since April 1, 2014. Since January 2, 2015, Dr. Gilliland has served as president and director of the NCI-designated Fred Hutchinson Cancer Research Center in Seattle, Washington. Prior to that, he was the inaugural vice dean and vice president for precision medicine at the University of Pennsylvania Perelman School of Medicine from 2013 to January 2015, where he was responsible for synthesizing research and clinical-care initiatives across all medical disciplines, including cancer, heart and vascular medicine, neurosciences, genetics and pathology, in order to create a national model for the delivery of precise, personalized medicine. From 2009 until he joined Penn Medicine in October 2013, Dr. Gilliland was senior vice president of Merck Research Laboratories and Oncology Franchise head. At Merck, Dr. Gilliland oversaw first-in-human studies, proof-of-concept trials, and Phase II/III registration trials that included the development of pembrolizumab (anti-PD1) for the treatment of cancer, and managed all preclinical and clinical oncology licensing activities. Prior to joining Merck, Dr. Gilliland was a member of the faculty at Harvard Medical School for nearly 20 years, where he served as professor of medicine and a professor of stem cell and regenerative biology. He was also an investigator of the Howard Hughes Medical Institute from 1996 to 2009, director of the Leukemia Program at the Dana-Farber/Harvard Cancer Center from 2002 to 2009, and director of the Cancer Stem Cell Program of the Harvard Stem Cell Institute from 2004 to 2009. Dr. Gilliland has a Ph.D. in microbiology from UCLA and an M.D. from University of California San Francisco School of Medicine. He is board-certified in internal medicine and had his fellowship training in hematology and oncology, all at Harvard Medical School. Dr. Gilliland’s expertise in cancer genetics and his experience working within medical communities ranging from academia to the pharmaceutical industry position him to provide a practical and balanced perspective to the board.
Garheng Kong, M.D., Ph.D.
2,4
- Dr. Kong (42) has served as a director of the Company since December 1, 2013. Dr. Kong is the managing partner of Sofinnova HealthQuest Capital, a healthcare focused investment firm, and was previously a general partner at Sofinnova Ventures, a position he held from 2010 to 2013. Before joining Sofinnova, Dr. Kong was a general partner from 2000
71
to 2010 at Intersouth Partners, a venture capital firm where he was a founding investor or board member for various life science ventures, several of which were acquired by large pharmaceutical companies. Prior to his investing career, Dr. Kong was employed by GlaxoSmithKline, McKinsey & Company, and TherOx. Dr. Kong has served on the board of directors of public biotechnology companies Histogenics Corporation (since 2012), Melinta Therapeutics (since 2008 and chairman 2008 to 2017), Alimera Sciences (since 2012) and Strongbridge Biopharmaceuticals (since 2015). He also sits on the Duke University Medical Center board of visitors. Dr. Kong holds an M.D., a Ph.D. in biomedical engineering, and an MBA from Duke University. Dr. Kong brings to the board knowledge and experience in both the healthcare and finance fields based on his medical background and his work in life science-related venture capital.
Robert E. Mittelstaedt, Jr
.
2,4
- Mr. Mittelstaedt, Jr. (74) has served as a director of the Company since November 1996. Mr. Mittelstaedt is dean emeritus of the W. P. Carey School of Business at Arizona State University, where he served as dean and professor of management from 2004 to 2013. Prior to June 30, 2004, he was vice dean of executive education of The Wharton School, University of Pennsylvania. Mr. Mittelstaedt had served with The Wharton School since 1973, with the exception of the period from 1985 to 1989 when he founded, served as chief executive officer of, and subsequently sold, Intellego Inc., a company engaged in practice management, systems development, and service bureau billing operations in the medical industry. Mr. Mittelstaedt also serves as a lead independent director and Nominating and Governance Committee chair of Innovative Solutions and Support Inc. He served on the board and was the Compensation Committee chair of W.P. Carey Inc. until his retirement on September 21, 2016. Mr. Mittelstaedt brings to the board experience as a recognized expert in business strategy, corporate governance and executive compensation issues. Mr. Mittelstaedt serves as the board’s lead independent director and brings a deep understanding of the role of the board and its oversight of corporate governance and business strategy.
Peter M. Neupert
1,4
- Mr. Neupert (61) has served as a director of the Company since January 2013. Mr. Neupert was an operating partner at Health Evolution Partners, a health only, middle market private equity firm, from January 2012 until June 2015. Prior to that, Mr. Neupert served as corporate vice president of the Microsoft Health Solutions Group from its formation in 2005 to January 2012. Mr. Neupert served on the President’s Information Technology Advisory Committee (PITAC), co-chairing the Health Information Technology Subcommittee and helping to drive the “Revolutionizing Health Care Through Information Technology” report, published in June 2004. Mr. Neupert served as the founding president and chief executive officer of drugstore.com from 1998 to 2001 and as chairman of the board of directors through September 2004. Mr. Neupert is also a director of Clinithink Ltd., Adaptive Biotechnologies Inc. and higi LLC. He served on the board of directors of QSI from August 2013 to January 2014 and Freedom Innovations LLC from May
2013
to April 2016. He serves as a trustee for the Fred Hutchinson Cancer Research Center and was an active member of the Institute of Medicine’s Roundtable on Value & Science-Driven Healthcare from 2007 to 2011. Mr. Neupert brings to the board experience as a recognized expert in health information technology and perspective on how to grow shareholder value by leveraging business strategies with technology. Mr. Neupert is an audit committee financial expert as a result of his experience, including his experience as CEO and chairman of drugstore.com. His prior experience as a public company CEO and board member of both private and public companies brings practical insight to the board with respect to business strategy, corporate governance, and emerging trends in healthcare. Mr. Neupert’s previous business experience also enables him to provide the board with an understanding of businesses and services adjacent to the diagnostic testing industry.
Richelle Parham
1,4
-
Ms. Parham (50) has served as a director of the Company since February 8, 2016. In October 2016, Ms. Parham joined Camden Partners, a private equity firm, as a general partner focusing on investments in growth stage global consumer companies. Prior to Camden Partners, Ms. Parham served as vice president and chief marketing officer of eBay from November 2010 to March 2015. Ms. Parham was responsible, globally, for eBay brand strategy and brand marketing to reach 108+ million active eBay users, as well as, for internet marketing and for customer relationship management. Prior to joining eBay, Ms. Parham served as head of global marketing innovation and Initiatives and head of Global Marketing Services at Visa Inc. from 2008 to 2010. Her experience also includes 13 years at Digitas Inc., a leading marketing agency, where she held a variety of senior leadership roles, including senior vice president and general manager of the agency's Chicago office. An advocate of empowering female leaders through STEM programs, Ms. Parham is on the advisory board for Girls Who Code. She serves on the board of directors for Scripps Network Interactive Inc. (NYSE:SNI), a position she has held since 2012. Ms. Parham holds double Bachelor of Science degrees in business administration and design arts from Drexel University. She became a member of the Drexel University board of trustees in 2014. Ms. Parham brings to the board extensive senior-level executive experience and more than 20 years of global strategy and marketing experience, as well as expertise in understanding consumers and the consumer decision journey.
Adam H. Schechter
2,3
- Mr. Schechter (53) has served as a director of the Company since April 1, 2013. Mr. Schechter is an executive vice president of Merck & Co. Inc. and since 2010 has been president of Merck’s Global Human Health Division, which includes the company’s worldwide pharmaceutical and vaccine businesses. He is a member of Merck’s Executive Committee and Pharmaceutical and Vaccines Operating Committee. Prior to becoming president, Global Human Health, Mr. Schechter served as president, Global Pharmaceutical Business, from 2007 to 2010. Mr. Schechter’s extensive experience at Merck includes global and U.S.-focused leadership roles spanning sales, marketing, and managed markets, as well as business and product development. Mr. Schechter serves on the board of directors for the European Federation of Pharmaceutical Industries and Associations. He is a board member for Water.org and an executive board member for the National Alliance for Hispanic Health. Mr. Schechter brings
72
to the board global business acumen and general management experience, as well as demonstrated success in leading large, innovation-focused organizations. Mr. Schechter’s deep knowledge of the pharmaceutical and healthcare industries and extensive experience collaborating with many of its key stakeholders to achieve patient-focused outcomes bring practical insight to the board with respect to business strategies to service the changing healthcare environment.
R. Sanders Williams, M.D
.
1,3
- Dr. Williams, M.D. (69) has served as a director of the Company since May 16, 2007. Dr. Williams is chief executive officer of the Gladstone Foundation and president emeritus of the Gladstone Institutes since January 1, 2018. Prior to this appointment, he was president of the Gladstone Institutes since 2009. Dr. Williams is also professor of medicine at the University of California San Francisco. Dr. Williams served Duke University between 2001 and 2010 as dean of the School of Medicine, senior vice chancellor, senior advisor for International Strategy, and founding dean of the Duke-NUS Graduate Medical School Singapore. He has served previously as president of the Association of University Cardiologists, chairman of the Research Committee of the American Heart Association, on the editorial boards of leading biomedical journals, on the Advisory Committee to the Director of the National Institutes of Health and on the board of External Advisors of the National Heart, Lung and Blood Institute. Dr. Williams was a director of Bristol-Meyers Squibb Company from 2006 until May 2013 and has been a director of Amgen since October 2014. Dr. Williams is a member of the National Academy of Medicine, and a Fellow of the American Association for the Advancement of Science. His experience as a physician, biomedical scientist, and executive leader brings important perspective to his service to the Company as a director.
Committees:
1
Audit
2
Compensation
3
Quality and Compliance
4
Nominating and Corporate Governance
Management Team
David P. King
- Mr. King (61) serves as chairman of the board, president, and chief executive officer. Refer to the biography above in the “Board of Directors” section.
Glenn A. Eisenberg -
Mr. Eisenberg (56) has served as executive vice president and chief financial officer since June 2014. Mr. Eisenberg received his Bachelors of Arts degree from Tulane University in 1982 and his Master of Business Administration from Georgia State University in 1988. From 2002 until he joined the Company, he served as the executive vice president of finance and administration and chief financial officer at The Timken Company, a $4.3 billion leading global manufacturer of highly engineered bearings and alloy steels and related products and services. Previously, he served as president and chief operating officer of United Dominion Industries, now a subsidiary of SPX Corporation, after working in several roles in finance, including executive vice president and chief financial officer. Mr. Eisenberg serves on the board of directors of US Ecology Inc., and he served on the boards of directors of Family Dollar Stores Inc. until July 2015, where he chaired the Audit Committee; and Alpha Natural Resources Inc. until May 2015, where he was the lead independent director and chaired the Nominating and Corporate Governance Committee.
John D. Ratliff -
Mr. Ratliff (58) is CEO of Covance Drug Development. Mr. Ratliff is a highly respected biopharmaceutical leader, with extensive experience in increasingly important roles in the industry. Most recently, he served as president and CEO of HUYA Bioscience International, a leader in globalizing biopharmaceutical innovation. Mr. Ratliff’s experience in biopharmaceuticals also includes nearly 10 years at Quintiles (now known as IQVIA), joining as chief financial officer in 2004, becoming chief operating officer in 2006, and president and chief operating officer in 2010. He led Quintiles’ global services organization, with its clinical research, commercial, consulting, and lab operations, and was a member of the company’s board of directors. Mr. Ratliff is chairman of the board of directors of the Association of Clinical Research Organizations. Previous roles throughout his career also include serving as chief financial officer at Acterna, a provider of communications test solutions for telecommunications and cable network operators; and in positions of increasing responsibility during his 19-year tenure at IBM. Mr. Ratliff holds a bachelor’s degree in industrial and systems engineering from the Georgia Institute of Technology in Atlanta and an MBA from Duke University in Durham, North Carolina.
Gary M. Huff -
Mr.
Huff (51) is CEO of LabCorp Diagnostics. Prior to becoming CEO, Huff served as the senior vice president of health systems and strategic alliances for LabCorp Diagnostics. Before joining LabCorp, he was the president and CEO of Baylor Miraca Genetics Laboratories (BMGL), a $68 million precision medicine genetics and genomics company formed by Baylor College of Medicine and Miraca Holdings Inc. Before joining BMGL, Mr. Huff served as the executive vice president and chief operating officer of Solstas Lab Partners. Prior to Solstas, he was a senior executive for LabCorp. During his tenure, he held various leadership positions, including North Atlantic Division senior vice president, national toxicology vice president, associate vice president of sales and marketing operations, and executive director of business development for hospitals and strategic alliances. Mr. Huff started his career in the laboratory industry with Roche Biomedical Laboratories. He serves on the board of
73
directors of the Alzheimer’s Association - Western Carolina Chapter, and he is a graduate of Indiana University with a Bachelor of Arts in general studies/psychology and has been certified in Lean Six Sigma.
Lance V. Berberian -
Mr. Berberian (55) has served as senior vice president and chief information officer since February 2014. Prior to that, he served as chief information officer at IDEXX Laboratories, a global leader in diagnostics and information technology solutions for animal health and food and water quality, from May 2007 to January 2014. Mr. Berberian served as chief information officer and president of Kellstrom Aerospace Defense, a fully integrated supply chain firm, from January 2000 to April 2007. He also served as chief information officer of Interim Healthcare from September 1997 to January 2000.
Edward T. Dodson -
Mr. Dodson (64) has served as senior vice president and chief accounting officer since June 2005. He also has served as the principal accounting officer since December 2014. Mr. Dodson, who has been a certified public accountant for 35 years, joined the Company in August 1997 as vice president and corporate controller and became senior vice president in June 2001. Prior to joining the Company in 1997, Mr. Dodson was a senior manager in the audit and consulting practice of KPMG LLP., where he worked for 17 years in that firm's Greensboro, North Carolina and Brussels, Belgium, offices.
F. Samuel Eberts III -
Mr. Eberts (58) has served as senior vice president, chief legal officer, secretary, and chief compliance officer since January 1, 2009. Prior to that time, he served as senior vice president, and general counsel since August 2004. Prior to joining the Company, he was vice president, secretary, and general counsel of Stepan Company. Before joining Stepan Company, he was assistant general counsel for Cardinal Health Inc. from 1998 to 2001 and associate general counsel for Allegiance Healthcare Corporation (Allegiance Healthcare Corporation was purchased by Cardinal Health in 1998). Prior to that time, he was chief counsel of the Biotech North America division of Baxter International Inc.
Lisa J. Uthgenannt -
Ms. Uthgenannt (57) has served as chief human resources officer since March 2015. Prior to that she served as senior vice president of human resources for Covance since November 2010. Prior to joining Covance, Ms. Uthgenannt held numerous leadership positions at Johnson & Johnson, in both medical devices and pharmaceutical businesses since 2000. In her last role as vice president of human resources for the comprehensive care sector, she served as a key adviser and executive coach to the worldwide chairman, helping to define the initial strategies and plans to advance the corporation’s comprehensive approach to chronic disease management. She also led the organization in designing and implementing a streamlined business model to increase product pipeline performance and accelerate growth opportunities.
Brian Caveney -
Dr. Caveney (44) has served as senior vice president and chief medical officer since September 2017. In this role, he has broad responsibility for the medical and scientific strategy of the enterprise. Most recently, Dr. Caveney was chief medical officer at Blue Cross and Blue Shield of North Carolina (Blue Cross NC) where he joined in 2011. In addition to various roles in the Healthcare Division of the core health plan, Dr. Caveney also served as chief clinical officer of Mosaic Health Solutions, a wholly owned subsidiary of Blue Cross NC for strategic investments in diversified health solutions businesses. Prior to joining Blue Cross NC, Dr. Caveney was a practicing physician and assistant professor at Duke University Medical Center and also provided consulting services for several companies in the Research Triangle Park, North Carolina, region. Dr. Caveney holds an M.D. from the West Virginia University School of Medicine, a J.D. from the West Virginia University College of Law and an M.P.H. in health policy and administration from the University of North Carolina at Chapel Hill. He completed his residency at Duke University Medical Center and is board-certified in preventive medicine, with a specialty in occupational and environmental medicine. He is the past president of the Southeastern Atlantic College of Occupational and Environmental Medicine.
Except for the information regarding the executive officers and directors above, the information called for by this item is incorporated by reference to information in the 2018 Proxy Statement under the captions “Section 16(a) Beneficial Ownership Reporting Compliance,” “Corporate Governance Policies and Procedures - Code of Conduct and Ethics,” and “Corporate Governance”.
|
Item 11.
|
EXECUTIVE COMPENSATION
|
The information required by this item is incorporated by reference to information in the
2018
Proxy Statement under the captions “Executive Compensation” and “Director Compensation.”
|
Item 12.
|
SECURITY OWNERSHIP OF CERTAIN BENEFICIAL OWNERS AND MANAGEMENT AND RELATED STOCKHOLDER MATTERS
|
See “Note 14 to the Consolidated Financial Statements” for a discussion of the Company’s Stock Compensation Plans. Except for the above referenced footnote, the information called for by this item is incorporated by reference to information in the
2018
Proxy Statement under the captions “Security Ownership of Certain Beneficial Holders and Management,” “Compensation Discussion and Analysis” and “Executive Compensation.”
74
|
Item 13.
|
CERTAIN RELATIONSHIPS AND RELATED TRANSACTIONS, AND DIRECTOR INDEPENDENCE
|
The information required by this item is incorporated by reference to information in the
2018
Proxy Statement under the captions “Board Independence” and “Related Party Transactions.”
|
Item 14.
|
PRINCIPAL ACCOUNTANT FEES AND SERVICES
|
The information required by this item is incorporated by reference to information in the
2018
Proxy Statement under the caption “Fees to Independent Registered Public Accounting Firm.”
75
PART IV
Item 15. EXHIBITS AND FINANCIAL STATEMENT SCHEDULES
(a) List of documents filed as part of this report:
|
(1)
|
Consolidated Financial Statements and Report of Independent Registered Public Accounting Firm included herein:
|
|
See Index on page F-1
|
|
|
(2)
|
Financial Statement Schedules:
|
|
See Index on page F-1
|
|
|
All other schedules are omitted as they are inapplicable or the required information is furnished in the Consolidated Financial Statements or notes thereto.
|
|
|
(3)
|
Index to and List of Exhibits
|
Exhibits 10.1 through 10.32 and 10.40 and 10.41 are management contracts or compensatory plans or arrangements.
76
|
2.1
|
|
|
2.2
|
|
|
3.1
|
|
|
3.2
|
|
|
4.1
|
|
|
4.2
|
|
|
4.3
|
|
|
4.4
|
|
|
4.5
|
|
|
4.6
|
|
|
4.7
|
|
|
4.8
|
|
|
4.9
|
|
|
4.10
|
|
|
4.11
|
|
|
4.12
|
|
|
4.13
|
|
|
4.14
|
|
|
4.15
|
|
|
10.1
|
National Health Laboratories Incorporated Pension Equalization Plan (incorporated herein by reference to the Company's Annual Report on Form 10-K for the fiscal year ended December 31, 1992).
|
77
|
10.2
|
|
|
10.3
|
|
|
10.4
|
|
|
10.5
|
National Health Laboratories 1988 Stock Option Plan, as amended (incorporated herein by reference to the Company's Registration Statement on Form S-1, filed with the Commission on July 9, 1990, File No. 33-35782).
|
|
10.6
|
|
|
10.7
|
|
|
10.8
|
|
|
10.9
|
|
|
10.10
|
|
|
10.11
|
|
|
10.12
|
|
|
10.13
|
|
|
10.14
|
|
|
10.15
|
|
|
10.16
|
|
|
10.17
|
|
|
10.18
|
|
|
10.19
|
|
|
10.20
|
|
|
10.21
|
|
|
10.22
|
|
|
10.23
|
|
78
|
10.24
|
|
|
10.25
|
|
|
10.26
|
|
|
10.27
|
|
|
10.28
|
|
|
10.29
|
|
|
10.30
|
|
|
10.31
|
|
|
10.32
|
|
|
10.33
|
|
|
10.34
|
|
|
10.35
|
|
|
10.36
|
|
|
10.37
|
|
|
10.38
|
|
|
10.39
|
|
|
10.40
|
|
79
|
10.41
|
|
|
10.42
|
|
|
12.1*
|
|
|
21*
|
|
|
23.1*
|
|
|
24.1*
|
|
|
24.2*
|
|
|
24.3*
|
|
|
24.4*
|
|
|
24.5*
|
|
|
24.6*
|
|
|
24.7*
|
|
|
24.8*
|
|
|
24.9*
|
|
|
31.1*
|
|
|
31.2*
|
|
|
32*
|
|
|
101.INS*
|
XBRL Instance Document
|
|
101.SCH*
|
XBRL Taxonomy Extension Schema
|
|
101.CAL*
|
XBRL Taxonomy Extension Calculation Linkbase
|
|
101.DEF*
|
XBRL Taxonomy Extension Definition Linkbase
|
|
101.LAB*
|
XBRL Taxonomy Extension Label Linkbase
|
|
101.PRE*
|
XBRL Taxonomy Extension Presentation Linkbase
|
|
*
|
Filed herewith
|
80
Item 16. FORM 10-K SUMMARY
None.
81
SIGNATURES
Pursuant to the requirements of Section 13 or 15(d) of the Securities Exchange Act of 1934, the registrant has duly caused this report to be signed on its behalf by the undersigned, thereunto duly authorized.
LABORATORY CORPORATION OF AMERICA HOLDINGS
Registrant
|
|
By:
|
/s/ DAVID P. KING
|
|
|
|
|
David P. King
|
|
|
|
|
Chairman of the Board, President
|
|
|
|
|
and Chief Executive Officer
|
|
|
Dated:
|
February 27, 2018
|
|
|
82
Pursuant to the requirements of the Securities Exchange Act of 1934, this report has been signed below by the following persons on behalf of the registrant on
February 27, 2018
in the capacities indicated.
|
Signature
|
|
Title
|
|
|
|
|
|
/s/ DAVID P. KING
|
|
Chairman of the Board, President and Chief
|
|
David P. King
|
|
Executive Officer (Principal Executive Officer)
|
|
|
|
|
|
/s/ GLENN A. EISENBERG
|
|
Executive Vice President, Chief Financial
|
|
Glenn A. Eisenberg
|
|
Officer and Treasurer (Principal Financial Officer)
|
|
/s/ EDWARD T. DODSON
|
|
Chief Accounting Officer (Principal Accounting Officer)
|
|
Edward T. Dodson
|
|
|
|
|
|
|
|
*
|
|
Director
|
|
Kerrii B. Anderson
|
|
|
|
|
|
|
|
*
|
|
Director
|
|
Jean-Luc Bélingard
|
|
|
|
|
|
|
|
*
|
|
Director
|
|
D. Gary Gilliland, M.D., Ph.D.
|
|
|
|
|
|
|
|
*
|
|
Director
|
|
Garheng Kong, M.D., Ph.D.
|
|
|
|
|
|
|
|
*
|
|
Director
|
|
Robert E. Mittelstaedt, Jr.
|
|
|
|
*
|
|
Director
|
|
Peter M. Neupert
|
|
|
|
|
|
|
|
*
|
|
Director
|
|
Richelle Parham
|
|
|
|
|
|
|
|
*
|
|
Director
|
|
Adam H. Schechter
|
|
|
|
|
|
|
|
*
|
|
Director
|
|
R. Sanders Williams, M.D.
|
|
|
|
|
|
|
* F. Samuel Eberts III, by his signing his name hereto, does hereby sign this report on behalf of the directors of the Registrant after whose typed names asterisks appear, pursuant to powers of attorney duly executed by such directors and filed with the Securities and Exchange Commission.
|
By:
|
/s/ F. SAMUEL EBERTS III
|
|
|
|
F. Samuel Eberts III
|
|
|
|
Attorney-in-fact
|
|
83
LABORATORY CORPORATION OF AMERICA HOLDINGS AND SUBSIDIARIES
INDEX TO CONSOLIDATED FINANCIAL STATEMENTS
AND SCHEDULE
|
|
Page
|
|
|
|
|
|
|
|
Consolidated Financial Statements:
|
|
|
|
|
|
|
|
|
|
|
|
|
|
|
|
|
|
|
|
|
Financial Statement Schedule:
|
|
|
|
|
F-1
Report of Independent Registered Public Accounting Firm
To the Board of Directors and Shareholders of
Laboratory Corporation of America Holdings:
Opinions on the Financial Statements and Internal Control over Financial Reporting
We have audited the accompanying consolidated balance sheets of Laboratory Corporation of America Holdings and its subsidiaries
as of December 31, 2017,
and December 31, 2016,
and the related consolidated statements of operations, comprehensive earnings, changes in shareholders’ equity and cash flows for each of the three years in the period ended December 31, 2017, including the related notes and schedule of valuation and qualifying accounts and reserves for each of the three years in the period ended December 31, 2017 listed in the accompanying index (collectively referred to as the “consolidated financial statements”).
We also have audited the Company's internal control over financial reporting as of December 31, 2017, based on criteria established in
Internal Control - Integrated Framework
(2013)
issued by the Committee of Sponsoring Organizations of the Treadway Commission (COSO).
In our opinion, the consolidated
financial statements referred to above present fairly, in all material respects, the financial position of the Company as of December 31, 2017, and December 31, 2016
,
and the results of their
operations and their
cash flows for each of the three years in the period ended December 31, 2017,
in conformity with accounting principles generally accepted in the United States of America. Also in our opinion, the Company maintained, in all material respects, effective internal control over financial reporting as of December 31, 2017, based on criteria established in
Internal Control - Integrated Framework
(2013)
issued by the COSO.
Basis for Opinions
The Company's management is responsible for these consolidated financial statements, for maintaining effective internal control over financial reporting, and for its assessment of the effectiveness of internal control over financial reporting, included in the Report of Management on Internal Control over Financial Reporting appearing under Item 9A. Our responsibility is to express opinions on the Company’s consolidated
financial statements and on the Company's internal control over financial reporting based on our audits. We are a public accounting firm registered with the Public Company Accounting Oversight Board (United States) (“PCAOB”) and are required to be independent with respect to the Company in accordance with the U.S. federal securities laws and the applicable rules and regulations of the Securities and Exchange Commission and the PCAOB.
We conducted our audits in accordance with the standards of the PCAOB. Those standards require that we plan and perform the audits to obtain reasonable assurance about whether the consolidated
financial statements are free of material misstatement, whether due to error or fraud, and whether effective internal control over financial reporting was maintained in all material respects.
Our audits of the consolidated
financial statements included performing procedures to assess the risks of material misstatement of the consolidated
financial statements, whether due to error or fraud, and performing procedures that respond to those risks. Such procedures included examining, on a test basis, evidence regarding the amounts and disclosures in the consolidated
financial statements. Our audits also included evaluating the accounting principles used and significant estimates made by management, as well as evaluating the overall presentation of the consolidated
financial statements. Our audit of internal control over financial reporting included obtaining an understanding of internal control over financial reporting, assessing the risk that a material weakness exists, and testing and evaluating the design and operating effectiveness of internal control based on the assessed risk. Our audits also included performing such other procedures as we considered necessary in the circumstances. We believe that our audits provide a reasonable basis for our opinions.
As described in the
Report of Management on Internal Control over Financial Reporting appearing under Item 9A, management has excluded Chiltern International Group Limited and Pathology Associates Medical Laboratories from its assessment of internal control over financial reporting as of December 31, 2017, because they were acquired by the Company in a purchase business combination during 2017. We have also excluded Chiltern International Group Limited and Pathology Associates Medical Laboratories from our audit of internal control over financial reporting. Chiltern International Group Limited and Pathology Associates Medical Laboratories
are wholly-owned subsidiaries whose total assets and total revenues excluded from management’s assessment and our audit of internal control over financial reporting represent 1.9% and 4.0%, respectively, of the related consolidated financial statement amounts as of and for the year ended December 31, 2017.
Definition and Limitations of Internal Control over Financial Reporting
A company’s internal control over financial reporting is a process designed to provide reasonable assurance regarding the reliability of financial reporting and the preparation of financial statements for external purposes in accordance with generally accepted accounting principles. A company’s internal control over financial reporting includes those policies and procedures that (i) pertain
F-2
to the maintenance of records that, in reasonable detail, accurately and fairly reflect the transactions and dispositions of the assets of the company; (ii) provide reasonable assurance that transactions are recorded as necessary to permit preparation of financial statements in accordance with generally accepted accounting principles, and that receipts and expenditures of the company are being made only in accordance with authorizations of management and directors of the company; and (iii) provide reasonable assurance regarding prevention or timely detection of unauthorized acquisition, use, or disposition of the company’s assets that could have a material effect on the financial statements.
Because of its inherent limitations, internal control over financial reporting may not prevent or detect misstatements. Also, projections of any evaluation of effectiveness to future periods are subject to the risk that controls may become inadequate because of changes in conditions, or that the degree of compliance with the policies or procedures may deteriorate.
/s/
PricewaterhouseCoopers LLP
Charlotte, North Carolina
February 27, 2018
We have served as the Company’s auditor since
1997.
F-3
LABORATORY CORPORATION OF AMERICA HOLDINGS AND SUBSIDIARIES
(In Millions)
|
December 31,
2017 |
December 31,
2016 |
||||||
|
ASSETS
|
|
|
|||||
|
Current assets:
|
|
|
|||||
|
Cash and cash equivalents
|
$
|
316.7
|
|
$
|
433.6
|
|
|
|
Accounts receivable, net of allowance for doubtful accounts of $260.9 and $235.6 at December 31, 2017 and 2016, respectively
|
1,481.3
|
|
1,328.7
|
|
|||
|
Unbilled services
|
235.6
|
|
190.0
|
|
|||
|
Supplies inventories
|
227.6
|
|
205.2
|
|
|||
|
Prepaid expenses and other
|
421.4
|
|
321.2
|
|
|||
|
Total current assets
|
2,682.6
|
|
2,478.7
|
|
|||
|
Property, plant and equipment, net
|
1,748.9
|
|
1,718.6
|
|
|||
|
Goodwill, net
|
7,530.0
|
|
6,424.4
|
|
|||
|
Intangible assets, net
|
4,340.8
|
|
3,400.5
|
|
|||
|
Joint venture partnerships and equity method investments
|
58.4
|
|
57.6
|
|
|||
|
Deferred income taxes
|
1.9
|
|
2.1
|
|
|||
|
Other assets, net
|
205.4
|
|
165.1
|
|
|||
|
Total assets
|
$
|
16,568.0
|
|
$
|
14,247.0
|
|
|
|
LIABILITIES AND SHAREHOLDERS’ EQUITY
|
|
|
|
|
|||
|
Current liabilities:
|
|
|
|
|
|||
|
Accounts payable
|
$
|
663.0
|
|
$
|
508.4
|
|
|
|
Accrued expenses and other
|
632.9
|
|
593.7
|
|
|||
|
Unearned revenue
|
332.7
|
|
176.0
|
|
|||
|
Short-term borrowings and current portion of long-term debt
|
417.5
|
|
549.5
|
|
|||
|
Total current liabilities
|
2,046.1
|
|
1,827.6
|
|
|||
|
Long-term debt, less current portion
|
6,344.6
|
|
5,300.0
|
|
|||
|
Deferred income taxes and other tax liabilities
|
948.3
|
|
1,206.4
|
|
|||
|
Other liabilities
|
378.2
|
|
392.0
|
|
|||
|
Total liabilities
|
9,717.2
|
|
8,726.0
|
|
|||
|
Commitments and contingent liabilities
|
|
|
|
|
|||
|
Noncontrolling interest
|
20.8
|
|
15.2
|
|
|||
|
Shareholders’ equity
|
|
|
|
|
|||
|
Common stock, 101.9 and 102.7 shares outstanding at December 31, 2017 and 2016, respectively
|
12.0
|
|
12.1
|
|
|||
|
Additional paid-in capital
|
1,989.8
|
|
2,131.7
|
|
|||
|
Retained earnings
|
6,224.0
|
|
4,955.8
|
|
|||
|
Less common stock held in treasury
|
(1,060.1
|
)
|
(1,012.7
|
)
|
|||
|
Accumulated other comprehensive loss
|
(335.7
|
)
|
(581.1
|
)
|
|||
|
Total shareholders’ equity
|
6,830.0
|
|
5,505.8
|
|
|||
|
Total liabilities and shareholders’ equity
|
$
|
16,568.0
|
|
$
|
14,247.0
|
|
|
The accompanying notes are an integral part of these consolidated financial statements.
F-4
LABORATORY CORPORATION OF AMERICA HOLDINGS AND SUBSIDIARIES
(In Millions, Except Per Share Data)
|
|
Years Ended December 31,
|
||||||||||
|
|
2017
|
2016
|
2015
|
||||||||
|
Net revenues
|
$
|
10,205.9
|
|
$
|
9,437.2
|
|
$
|
8,505.7
|
|
||
|
Reimbursable out-of-pocket expenses
|
235.5
|
|
204.6
|
|
174.4
|
|
|||||
|
Total revenues
|
10,441.4
|
|
9,641.8
|
|
8,680.1
|
|
|||||
|
Net cost of revenue
|
6,741.9
|
|
6,256.7
|
|
5,602.4
|
|
|||||
|
Reimbursable out-of-pocket expenses
|
235.5
|
|
204.6
|
|
174.4
|
|
|||||
|
Total cost of revenue
|
6,977.4
|
|
6,461.3
|
|
5,776.8
|
|
|||||
|
Gross profit
|
3,464.0
|
|
3,180.5
|
|
2,903.3
|
|
|||||
|
Selling, general and administrative expenses
|
1,812.4
|
|
1,630.2
|
|
1,628.1
|
|
|||||
|
Amortization of intangibles and other assets
|
216.5
|
|
179.5
|
|
164.5
|
|
|||||
|
Restructuring and other special charges
|
70.9
|
|
58.4
|
|
113.9
|
|
|||||
|
Operating income
|
1,364.2
|
|
1,312.4
|
|
996.8
|
|
|||||
|
Other income (expenses):
|
|
|
|
|
|
|
|||||
|
Interest expense
|
(235.1
|
)
|
(219.1
|
)
|
(274.9
|
)
|
|||||
|
Equity method income, net
|
11.3
|
|
7.9
|
|
10.0
|
|
|||||
|
Investment income
|
2.1
|
|
1.7
|
|
1.9
|
|
|||||
|
Other, net
|
(7.6
|
)
|
2.6
|
|
(7.8
|
)
|
|||||
|
Earnings before income taxes
|
1,134.9
|
|
1,105.5
|
|
726.0
|
|
|||||
|
Provision for income taxes
|
(139.1
|
)
|
372.3
|
|
287.3
|
|
|||||
|
Net earnings
|
1,274.0
|
|
733.2
|
|
438.7
|
|
|||||
|
Less: Net earnings attributable to the noncontrolling interest
|
(5.8
|
)
|
(1.1
|
)
|
(1.1
|
)
|
|||||
|
Net earnings attributable to Laboratory Corporation of America Holdings
|
$
|
1,268.2
|
|
$
|
732.1
|
|
$
|
437.6
|
|
||
|
Basic earnings per common share
|
$
|
12.39
|
|
$
|
7.14
|
|
$
|
4.43
|
|
||
|
Diluted earnings per common share
|
$
|
12.21
|
|
$
|
7.02
|
|
$
|
4.35
|
|
||
The accompanying notes are an integral part of these consolidated financial statements.
F-5
LABORATORY CORPORATION OF AMERICA HOLDINGS AND SUBSIDIARIES
CONSOLIDATED STATEMENTS OF COMPREHENSIVE EARNINGS
(In Millions, Except Per Share Data)
|
|
Years Ended December 31,
|
||||||||||
|
|
2017
|
2016
|
2015
|
||||||||
|
Net earnings
|
$
|
1,274.0
|
|
$
|
733.2
|
|
$
|
438.7
|
|
||
|
Foreign currency translation adjustments
|
262.3
|
|
(250.0
|
)
|
(370.7
|
)
|
|||||
|
Net benefit plan adjustments
|
20.9
|
|
(40.3
|
)
|
7.7
|
|
|||||
|
Investment adjustments
|
—
|
|
—
|
|
(0.1
|
)
|
|||||
|
Other comprehensive loss before tax
|
283.2
|
|
(290.3
|
)
|
(363.1
|
)
|
|||||
|
Provision for income tax related to items of comprehensive earnings
|
(37.8
|
)
|
(3.8
|
)
|
86.6
|
|
|||||
|
Other comprehensive loss, net of tax
|
245.4
|
|
(294.1
|
)
|
(276.5
|
)
|
|||||
|
Comprehensive earnings
|
1,519.4
|
|
439.1
|
|
162.2
|
|
|||||
|
Less: Net earnings attributable to the noncontrolling interest
|
(5.8
|
)
|
(1.1
|
)
|
(1.1
|
)
|
|||||
|
Net comprehensive earnings attributable to Laboratory Corporation of America Holdings
|
$
|
1,513.6
|
|
$
|
438.0
|
|
$
|
161.1
|
|
||
The accompanying notes are an integral part of these consolidated financial statements.
F-6
LABORATORY CORPORATION OF AMERICA HOLDINGS AND SUBSIDIARIES
CONSOLIDATED STATEMENTS OF CHANGES IN SHAREHOLDERS’ EQUITY
(In Millions)
|
Common
Stock
|
Additional
Paid-in
Capital
|
Retained
Earnings
|
Treasury
Stock
|
Accumulated
Other
Comprehensive
Loss
|
Total
Shareholders’
Equity
|
||||||||||||||||||
|
BALANCE AT DECEMBER 31, 2014
|
$
|
10.4
|
|
$
|
—
|
|
$
|
3,786.1
|
|
$
|
(965.5
|
)
|
$
|
(10.5
|
)
|
$
|
2,820.5
|
|
|||||
|
Net earnings attributable to Laboratory Corporation of America Holdings
|
—
|
|
—
|
|
437.6
|
|
—
|
|
—
|
|
437.6
|
|
|||||||||||
|
Other comprehensive earnings, net of tax
|
—
|
|
—
|
|
—
|
|
—
|
|
(276.5
|
)
|
(276.5
|
)
|
|||||||||||
|
Issuance of common stock for acquisition consideration
|
1.5
|
|
1,761.0
|
|
—
|
|
—
|
|
—
|
|
1,762.5
|
|
|||||||||||
|
Issuance of common stock under employee stock plans
|
0.1
|
|
98.8
|
|
—
|
|
—
|
|
—
|
|
98.9
|
|
|||||||||||
|
Surrender of restricted stock and performance share awards
|
—
|
|
—
|
|
—
|
|
(12.6
|
)
|
—
|
|
(12.6
|
)
|
|||||||||||
|
Conversion of zero-coupon convertible debt
|
—
|
|
0.4
|
|
—
|
|
—
|
|
—
|
|
0.4
|
|
|||||||||||
|
Stock compensation
|
—
|
|
102.1
|
|
—
|
|
—
|
|
—
|
|
102.1
|
|
|||||||||||
|
Income tax benefit from stock options exercised
|
—
|
|
12.2
|
|
—
|
|
—
|
|
—
|
|
12.2
|
|
|||||||||||
|
BALANCE AT DECEMBER 31, 2015
|
12.0
|
|
$
|
1,974.5
|
|
$
|
4,223.7
|
|
$
|
(978.1
|
)
|
$
|
(287.0
|
)
|
$
|
4,945.1
|
|
||||||
|
Net earnings attributable to Laboratory Corporation of America Holdings
|
—
|
|
—
|
|
732.1
|
|
—
|
|
—
|
|
732.1
|
|
|||||||||||
|
Other comprehensive earnings, net of tax
|
—
|
|
—
|
|
—
|
|
—
|
|
(294.1
|
)
|
(294.1
|
)
|
|||||||||||
|
Issuance of common stock under employee stock plans
|
0.1
|
|
70.5
|
|
—
|
|
—
|
|
—
|
|
70.6
|
|
|||||||||||
|
Surrender of restricted stock and performance share awards
|
—
|
|
—
|
|
—
|
|
(34.6
|
)
|
—
|
|
(34.6
|
)
|
|||||||||||
|
Conversion of zero-coupon convertible debt
|
—
|
|
21.0
|
|
—
|
|
—
|
|
—
|
|
21.0
|
|
|||||||||||
|
Stock compensation
|
—
|
|
109.6
|
|
—
|
|
—
|
|
—
|
|
109.6
|
|
|||||||||||
|
Purchase of common stock
|
—
|
|
(43.9
|
)
|
—
|
|
—
|
|
—
|
|
(43.9
|
)
|
|||||||||||
|
BALANCE AT DECEMBER 31, 2016
|
12.1
|
|
$
|
2,131.7
|
|
$
|
4,955.8
|
|
$
|
(1,012.7
|
)
|
$
|
(581.1
|
)
|
$
|
5,505.8
|
|
||||||
|
Net earnings attributable to Laboratory Corporation of America Holdings
|
—
|
|
—
|
|
1,268.2
|
|
—
|
|
—
|
|
1,268.2
|
|
|||||||||||
|
Other comprehensive earnings, net of tax
|
—
|
|
—
|
|
—
|
|
—
|
|
245.4
|
|
245.4
|
|
|||||||||||
|
Issuance of common stock under employee stock plans
|
0.1
|
|
73.5
|
|
—
|
|
—
|
|
—
|
|
73.6
|
|
|||||||||||
|
Surrender of restricted stock and performance share awards
|
—
|
|
—
|
|
—
|
|
(47.4
|
)
|
—
|
|
(47.4
|
)
|
|||||||||||
|
Conversion of zero-coupon convertible debt
|
—
|
|
12.8
|
|
—
|
|
—
|
|
—
|
|
12.8
|
|
|||||||||||
|
Stock compensation
|
—
|
|
109.7
|
|
—
|
|
—
|
|
—
|
|
109.7
|
|
|||||||||||
|
Purchase of common stock
|
(0.2
|
)
|
(337.9
|
)
|
—
|
|
—
|
|
—
|
|
(338.1
|
)
|
|||||||||||
|
BALANCE AT DECEMBER 31, 2017
|
$
|
12.0
|
|
$
|
1,989.8
|
|
$
|
6,224.0
|
|
$
|
(1,060.1
|
)
|
$
|
(335.7
|
)
|
$
|
6,830.0
|
|
|||||
The accompanying notes are an integral part of these consolidated financial statements.
F-7
LABORATORY CORPORATION OF AMERICA HOLDINGS AND SUBSIDIARIES
(In Millions)
|
|
Years Ended December 31,
|
||||||||||
|
|
2017
|
2016
|
2015
|
||||||||
|
CASH FLOWS FROM OPERATING ACTIVITIES:
|
|
|
|
||||||||
|
Net earnings
|
$
|
1,274.0
|
|
$
|
733.2
|
|
$
|
438.7
|
|
||
|
Adjustments to reconcile net earnings to net cash provided by operating activities:
|
|
|
|
|
|
|
|||||
|
Depreciation and amortization
|
533.2
|
|
499.2
|
|
457.8
|
|
|||||
|
Stock compensation
|
109.7
|
|
109.6
|
|
102.1
|
|
|||||
|
(Gain) loss on sale of assets
|
1.5
|
|
(9.2
|
)
|
4.6
|
|
|||||
|
Accrued interest on zero-coupon subordinated notes
|
0.3
|
|
1.6
|
|
2.0
|
|
|||||
|
Cumulative earnings less than distributions from equity method investments
|
0.5
|
|
1.2
|
|
0.1
|
|
|||||
|
Asset impairment
|
23.5
|
|
—
|
|
39.7
|
|
|||||
|
Deferred income taxes
|
(525.8
|
)
|
54.7
|
|
(34.1
|
)
|
|||||
|
Change in assets and liabilities (net of effects of acquisitions):
|
|
|
|
|
|
|
|||||
|
Increase in accounts receivable, net
|
(2.1
|
)
|
(85.5
|
)
|
(71.8
|
)
|
|||||
|
Increase in unbilled services
|
(8.3
|
)
|
(33.4
|
)
|
(16.9
|
)
|
|||||
|
Increase in inventories
|
(16.4
|
)
|
(9.6
|
)
|
(0.2
|
)
|
|||||
|
(Increase) decrease in prepaid expenses and other
|
(20.3
|
)
|
(20.5
|
)
|
62.3
|
|
|||||
|
(Decrease) increase in accounts payable
|
85.6
|
|
(8.7
|
)
|
30.7
|
|
|||||
|
Increase in unearned revenue
|
19.0
|
|
29.9
|
|
5.4
|
|
|||||
|
Decrease in accrued expenses and other
|
(15.0
|
)
|
(86.6
|
)
|
(38.0
|
)
|
|||||
|
Net cash provided by operating activities
|
1,459.4
|
|
1,175.9
|
|
982.4
|
|
|||||
|
CASH FLOWS FROM INVESTING ACTIVITIES:
|
|
|
|
|
|
|
|||||
|
Capital expenditures
|
(312.9
|
)
|
(278.9
|
)
|
(255.8
|
)
|
|||||
|
Proceeds from sale of assets
|
5.5
|
|
30.8
|
|
0.6
|
|
|||||
|
Proceeds from sale of investments
|
—
|
|
13.5
|
|
8.0
|
|
|||||
|
Acquisition of licensing technology
|
(2.5
|
)
|
—
|
|
—
|
|
|||||
|
Investments in equity affiliates
|
(36.2
|
)
|
(12.5
|
)
|
(11.7
|
)
|
|||||
|
Acquisition of businesses, net of cash acquired
|
(1,882.6
|
)
|
(548.6
|
)
|
(3,736.0
|
)
|
|||||
|
Net cash used for investing activities
|
(2,228.7
|
)
|
(795.7
|
)
|
(3,994.9
|
)
|
|||||
|
CASH FLOWS FROM FINANCING ACTIVITIES:
|
|
|
|
|
|
|
|||||
|
Proceeds from Senior Notes offerings
|
1,200.0
|
|
—
|
|
2,900.0
|
|
|||||
|
Proceeds from term loan
|
750.0
|
|
—
|
|
1,000.0
|
|
|||||
|
Payments on term loan
|
(493.0
|
)
|
(150.0
|
)
|
(285.0
|
)
|
|||||
|
Proceeds from revolving credit facilities
|
1,392.2
|
|
139.5
|
|
60.0
|
|
|||||
|
Payments on revolving credit facilities
|
(1,392.2
|
)
|
(139.5
|
)
|
(60.0
|
)
|
|||||
|
Proceeds from bridge loan
|
—
|
|
—
|
|
400.0
|
|
|||||
|
Payments on bridge loan
|
—
|
|
—
|
|
(400.0
|
)
|
|||||
|
Payments on Senior Notes
|
(500.1
|
)
|
(454.7
|
)
|
(500.0
|
)
|
|||||
|
Payments on zero-coupon subordinated notes
|
(33.9
|
)
|
(53.7
|
)
|
(1.3
|
)
|
|||||
|
Payment of debt issuance costs
|
(15.3
|
)
|
—
|
|
(36.7
|
)
|
|||||
|
Payments on long-term lease obligations
|
(7.7
|
)
|
(8.4
|
)
|
(4.3
|
)
|
|||||
|
Noncontrolling interest distributions
|
(1.0
|
)
|
(2.1
|
)
|
—
|
|
|||||
|
Deferred payments on acquisitions
|
(2.6
|
)
|
(7.6
|
)
|
(0.1
|
)
|
|||||
|
Excess tax benefits from stock based compensation
|
—
|
|
—
|
|
13.1
|
|
|||||
|
Net proceeds from issuance of stock to employees
|
73.6
|
|
70.6
|
|
98.9
|
|
|||||
|
Purchase of common stock
|
(338.1
|
)
|
(43.9
|
)
|
—
|
|
|||||
|
Net cash (used for) provided by financing activities
|
631.9
|
|
(649.8
|
)
|
3,184.6
|
|
|||||
|
Effect of exchange rate changes on cash and cash equivalents
|
20.5
|
|
(13.2
|
)
|
(35.7
|
)
|
|||||
|
Net (decrease) increase in cash and cash equivalents
|
(116.9
|
)
|
(282.8
|
)
|
136.4
|
|
|||||
|
Cash and cash equivalents at beginning of year
|
433.6
|
|
716.4
|
|
580.0
|
|
|||||
|
Cash and cash equivalents at end of year
|
$
|
316.7
|
|
$
|
433.6
|
|
$
|
716.4
|
|
||
The accompanying notes are an integral part of these consolidated financial statements.
F-8
LABORATORY CORPORATION OF AMERICA HOLDINGS AND SUBSIDIARIES
NOTES TO CONSOLIDATED FINANCIAL STATEMENTS
(Dollars and shares in millions, except per share data)
1. SUMMARY OF SIGNIFICANT ACCOUNTING POLICIES
Basis of Financial Statement Presentation
Laboratory Corporation of America Holdings
®
together with its subsidiaries (the Company) is a leading global life sciences company that is deeply integrated in guiding patient care, providing comprehensive clinical laboratory and end-to-end drug development services. The Company’s mission is to improve health and improve lives by delivering world-class diagnostic solutions, bringing innovative medicines to patients faster and using technology to provide better care. The Company serves a broad range of customers, including managed care organizations (MCOs), biopharmaceutical companies, governmental agencies, physicians and other healthcare providers (e.g. physician assistants and nurse practitioners, generally referred to herein as physicians), hospitals and health systems, employers, patients and consumers, contract research organizations, food and nutritional companies and independent clinical laboratories. The Company believes that it generated more revenue from laboratory testing than any other company in the world in 2017.
The Company reports its business in two segments, LabCorp Diagnostics (LCD) and Covance Drug Development (CDD). For further financial information about these segments, including information for each of the last three fiscal years regarding revenue, operating income, and other important information, see Note 20 to the Consolidated Financial Statements. In 2017, LCD and CDD contributed
70.3%
and
29.7%
, respectively, of net revenues to the Company, and in 2016 contributed
69.9%
and
30.1%
, respectively.
The consolidated financial statements include the accounts of the Company and its majority-owned subsidiaries for which it exercises control. Long-term investments in affiliated companies in which the Company exercises significant influence, but which it does not control, are accounted for using the equity method. Investments in which the Company does not exercise significant influence (generally, when the Company has an investment of less than
20%
and no representation on the investee's board of directors) are accounted for using the cost method. All significant inter-company transactions and accounts have been eliminated. The Company does not have any variable interest entities or special purpose entities whose financial results are not included in the consolidated financial statements.
The financial statements of the Company's operating foreign subsidiaries are measured using the local currency as the functional currency. Assets and liabilities are translated at exchange rates as of the balance sheet date. Revenues and expenses are translated at average monthly exchange rates prevailing during the year. Resulting translation adjustments are included in “Accumulated other comprehensive income.”
Revenue Recognition
LCD recognizes revenue on the accrual basis at the time test results are reported, which approximates when services are provided. Services are provided to certain patients covered by various third-party payer programs including various MCOs, as well as the Medicare and Medicaid programs. Billings for services under third-party payer programs are included in sales net of allowances for contractual discounts and allowances for differences between the amounts billed and estimated program payment amounts. Adjustments to the estimated payment amounts based on final settlement with the programs are recorded upon settlement as an adjustment to revenue. In
2017
,
2016
and
2015
, approximately
15.1%
,
15.5%
and
16.0%
, respectively, of LCD's revenues were derived
directly from the Medicare and Medicaid programs. LCD has capitated agreements with certain MCO customers and recognizes related revenue based on a predetermined monthly contractual rate for each member of the managed care plan regardless of the number of tests performed. In
2017
,
2016
and
2015
, approximately
3.6%
,
3.4%
and
3.5%
, respectively, of LCD's revenues were derived
from such capitated agreements.
CDD recognizes revenue either as services are performed or products are delivered, depending on the nature of the work contracted. Historically, a majority of CDD’s net revenues have been earned under contracts that range in duration from a few months to a few years, but can extend in duration up to five years or longer. Occasionally, CDD also has committed minimum volume arrangements with certain customers. Underlying these arrangements are individual project contracts for the specific services to be provided. These arrangements enable CDD's customers to secure its services in exchange for which they commit to purchase an annual minimum dollar value of services. Under these types of arrangements, if the annual minimum dollar value of service commitment is not reached, the customer is required to pay CDD for the shortfall. Progress towards the achievement of annual minimum dollar value of service commitments is monitored throughout the year. Annual minimum commitment shortfalls are not included in net revenues until the amount has been determined and agreed to by the customer.
Service contracts generally take the form of fee-for-service or fixed-price arrangements subject to pricing adjustments based on changes in scope. In cases where performance spans multiple accounting periods, revenue is recognized as services are performed, measured on a proportional-performance basis, generally using output measures that are specific to the service provided. Examples of output measures in preclinical services, include among others, the number of slides read, or specimens prepared.
F-9
LABORATORY CORPORATION OF AMERICA HOLDINGS AND SUBSIDIARIES
NOTES TO CONSOLIDATED FINANCIAL STATEMENTS
(Dollars and shares in millions, except per share data)
Examples of output measures in the clinical trials services, include among others, number of investigators enrolled, number of sites initiated, number of trial subjects enrolled and number of monitoring visits completed, or number of dosings for clinical pharmacology. Revenue is determined by dividing the actual units of work completed by the total units of work required under the contract and multiplying that percentage by the total contract value. The total contract value, or total contractual payments, represents the aggregate contracted price for each of the agreed upon services to be provided. CDD does not have any contractual arrangements spanning multiple accounting periods where revenue is recognized on a proportional-performance basis under which the Company has earned more than an immaterial amount of performance-based revenue (i.e., potential additional revenue tied to specific deliverables or performance). Changes in the scope of work are common, especially under long-term contracts, and generally result in a change in contract value. Once the customer has agreed to the changes in scope and renegotiated pricing terms, the contract value is amended with revenue recognized as described above. Estimates of costs to complete are made to provide, where appropriate, for losses expected on contracts. Costs are not deferred in anticipation of contracts being awarded, but instead are expensed as incurred.
Billing schedules and payment terms are generally negotiated on a contract-by-contract basis. In some cases, CDD bills the customer for the total contract value in progress-based installments as certain non-contingent billing milestones are reached over the contract duration, such as, but not limited to, contract signing, initial dosing, investigator site initiation, patient enrollment or database lock. The term “billing milestone” relates only to a billing trigger in a contract whereby amounts become billable and payable in accordance with a negotiated predetermined billing schedule throughout the term of a project. These billing milestones are generally not performance-based (i.e., there is no potential additional consideration tied to specific deliverables or performance). In other cases, billing and payment terms are tied to the passage of time (e.g., monthly billings). In either case, the total contract value and aggregate amounts billed to the customer would be the same at the end of the project. While CDD attempts to negotiate terms that provide for billing and payment of services prior or within close proximity to the provision of services, this is not always possible, and there are fluctuations in the levels of unbilled services and unearned revenue from period to period. While a project is ongoing, cash payments are not necessarily representative of aggregate revenue earned at any particular point in time, as revenues are recognized when services are provided, while amounts billed and paid are in accordance with the negotiated billing and payment terms.
In some cases, payments received are in excess of revenue recognized. For example, a contract invoicing schedule may provide for an upfront payment of 10% of the full contract value upon contract signing, but at the time of signing performance of services has not yet begun. Payments received in advance of services being provided are deferred as unearned revenue on the balance sheet. As the contracted services are subsequently performed and the associated revenue is recognized, the unearned revenue balance is reduced by the amount of revenue recognized during the period.
In other cases, services may be provided and revenue recognized before the customer is invoiced. In these cases, revenue recognized will exceed amounts billed, and the difference, representing an unbilled receivable, is recorded for the amount that is currently unbillable to the customer pursuant to contractual terms. Once the customer is invoiced, the unbilled services are reduced for the amount billed, and a corresponding account receivable is recorded. All unbilled services are billable to customers within one year from the respective balance sheet date.
Most contracts are terminable with or without cause by the customer, either immediately or upon notice. These contracts often require payment to CDD of expenses to wind down the study or project, fees earned to date and, in some cases, a termination fee or a payment to CDD of some portion of the fees or profits that could have been earned by CDD under the contract if it had not been terminated early. Termination fees are included in net revenues when services are performed and realization is assured. In connection with the management of multi-site clinical trials, CDD pays on behalf of its customers fees to investigators, clinical trial subjects and certain out-of-pocket costs, for which it is reimbursed at cost, without markup or profit. Investigator fees are not reflected in net revenues or expenses where CDD acts in the capacity of an agent on behalf of the biopharmaceutical company sponsor, passing through these costs without markup or profit. All other out-of-pocket costs are included in total revenues and expenses.
The Company's total revenues are comprised of the following:
|
|
Years Ended December 31,
|
||||||||||
|
Total revenues
|
2017
|
2016
|
2015
|
||||||||
|
LCD - net revenue
|
$
|
7,170.5
|
|
$
|
6,593.9
|
|
$
|
6,199.3
|
|
||
|
CDD - net revenue
|
3,037.2
|
|
2,844.1
|
|
2,306.4
|
|
|||||
|
CDD - reimbursable out-of-pocket expenses
|
235.5
|
|
204.6
|
|
174.4
|
|
|||||
|
Intercompany eliminations
|
(1.8
|
)
|
(0.8
|
)
|
—
|
|
|||||
|
Total revenues
|
$
|
10,441.4
|
|
$
|
9,641.8
|
|
$
|
8,680.1
|
|
||
F-10
LABORATORY CORPORATION OF AMERICA HOLDINGS AND SUBSIDIARIES
NOTES TO CONSOLIDATED FINANCIAL STATEMENTS
(Dollars and shares in millions, except per share data)
Reimbursable Out-of-Pocket Expenses
CDD pays on behalf of its customers certain out-of-pocket costs for which the Company is reimbursed at cost, without mark-up or profit. Out-of-pocket costs paid by CDD are reflected in operating expenses, while the reimbursements received are reflected in revenues in the consolidated statements of operations. CDD excludes from revenue and expense in the consolidated statements of operations fees paid to investigators and the associated reimbursement because CDD acts as an agent on behalf of the biopharmaceutical company sponsors with regard to investigator payments.
Cost of Revenue
Cost of revenue includes direct labor and related benefit charges, other direct costs, shipping and handling fees, and an allocation of facility charges and information technology costs. Selling, general and administrative expenses consist primarily of administrative payroll and related benefit charges, advertising and promotional expenses, administrative travel and an allocation of facility charges and information technology costs. Cost of advertising is expensed as incurred.
Use of Estimates
The preparation of financial statements in conformity with generally accepted accounting principles requires the Company to make estimates and assumptions that affect the reported amounts of assets and liabilities and disclosure of contingent assets and liabilities at the date of the financial statements and the reported amounts of revenues and expenses during the reported periods. Significant estimates include the allowances for doubtful accounts, deferred tax assets, fair values and amortization lives for intangible assets, and accruals for self-insurance reserves and pensions. The allowance for doubtful accounts is determined based on historical collections trends, the aging of accounts, current economic conditions and regulatory changes. Actual results could differ from those estimates.
Concentration of Credit Risk
Financial instruments that potentially subject the Company to concentrations of credit risk consist primarily of cash and cash equivalents and accounts receivable.
The Company maintains cash and cash equivalents with various major financial institutions. The total cash and cash equivalent balances that exceeded the balances insured by the Federal Deposit Insurance Commission, were approximately
$315.5
at
December 31, 2017
.
Substantially all of the Company’s accounts receivable are with companies in the healthcare or biopharmaceutical industry and individuals. However, concentrations of credit risk are limited due to the number of the Company’s customers as well as their dispersion across many different geographic regions.
Although LCD has receivables due from U.S. and state governmental agencies, the Company does not believe that such receivables represent a credit risk since the related healthcare programs are funded by U.S. and state governments, and payment is primarily dependent upon submitting appropriate documentation. Accounts receivable balances (gross) from Medicare and Medicaid were
$109.8
and
$113.0
at
December 31, 2017
, and
2016
, respectively.
For the Company's operations in Ontario, Canada, the Ontario Ministry of Health and Long-Term Care (Ministry) determines who can establish a licensed community medical laboratory and caps the amount that each of these licensed laboratories can bill the government sponsored healthcare plan. The Ontario government-sponsored healthcare plan covers the cost of commercial laboratory testing performed by the licensed laboratories. The provincial government discounts the annual testing volumes based on certain utilization discounts and establishes an annual maximum it will pay for all community laboratory tests. The agreed-upon reimbursement rates are subject to Ministry review at the end of year and can be adjusted (at the government's discretion) based upon the actual volume and mix of test work performed by the licensed healthcare providers in the province during the year. The capitated accounts receivable balances from the Ontario government sponsored healthcare plan were CAD
$12.9
and CAD
$15.8
at
December 31, 2017
, and
2016
, respectively.
The portion of the Company's accounts receivable due from patients comprises the largest portion of credit risk. At
December 31, 2017
, and
2016
, receivables due from patients represented approximately
20.9%
and
20.0%
of the Company's consolidated gross accounts receivable. The Company applies assumptions and judgments including historical collection experience for assessing collectability and determining allowances for doubtful accounts for accounts receivable from patients.
Earnings per Share
Basic earnings per share is computed by dividing net earnings attributable to Laboratory Corporation of America Holdings by the weighted average number of common shares outstanding. Diluted earnings per share is computed by dividing net earnings including the impact of dilutive adjustments by the weighted average number of common shares outstanding plus potentially dilutive shares, as if they had been issued at the earlier of the date of issuance or the beginning of the period presented. Potentially
F-11
LABORATORY CORPORATION OF AMERICA HOLDINGS AND SUBSIDIARIES
NOTES TO CONSOLIDATED FINANCIAL STATEMENTS
(Dollars and shares in millions, except per share data)
dilutive common shares result primarily from the Company’s outstanding stock options, restricted stock awards, performance share awards, and shares issuable upon conversion of zero-coupon subordinated notes.
The following represents a reconciliation of basic earnings per share to diluted earnings per share:
|
|
2017
|
2016
|
2015
|
|||||||||||||||||||||||||||||
|
Income
|
Shares
|
Per Share
Amount
|
Income
|
Shares
|
Per Share
Amount
|
Income
|
Shares
|
Per Share
Amount
|
||||||||||||||||||||||||
|
Basic earnings per share
|
$
|
1,268.2
|
|
102.4
|
|
$
|
12.39
|
|
$
|
732.1
|
|
102.5
|
|
$
|
7.14
|
|
$
|
437.6
|
|
98.8
|
|
$
|
4.43
|
|
||||||||
|
Stock options
|
—
|
|
1.4
|
|
|
|
—
|
|
1.5
|
|
|
|
—
|
|
1.2
|
|
|
|
||||||||||||||
|
Restricted stock awards and other
|
—
|
|
—
|
|
|
|
—
|
|
—
|
|
|
|
—
|
|
—
|
|
|
|
||||||||||||||
|
Effect of convertible debt, net of tax
|
—
|
|
0.1
|
|
|
|
—
|
|
0.3
|
|
|
|
—
|
|
0.6
|
|
|
|
||||||||||||||
|
Diluted earnings per share
|
$
|
1,268.2
|
|
103.9
|
|
$
|
12.21
|
|
$
|
732.1
|
|
104.3
|
|
$
|
7.02
|
|
$
|
437.6
|
|
100.6
|
|
$
|
4.35
|
|
||||||||
The following table summarizes the potential common shares not included in the computation of diluted earnings per share because their impact would have been antidilutive:
|
|
Years Ended December 31,
|
||||
|
|
2017
|
2016
|
2015
|
||
|
Stock options
|
0.1
|
—
|
—
|
||
Stock Compensation Plans
The Company measures stock compensation cost for all equity awards at fair value on the date of grant and recognizes compensation expense over the service period for awards expected to vest. The fair value of restricted stock units and performance share awards is determined based on the number of shares granted and the quoted price of the Company’s common stock on the grant date. Such value is recognized as expense over the service period, net of estimated forfeitures. The estimation of equity awards that will ultimately vest requires judgment and the Company considers many factors when estimating expected forfeitures, including types of awards, employee class, and historical experience. The cumulative effect on current and prior periods of a change in the estimated forfeiture rate is recognized as compensation expense in earnings in the period of the revision. Actual results and future estimates may differ substantially from the Company’s current estimates.
See Note 14 for assumptions used in calculating compensation expense for the Company’s stock compensation plans.
Cash Equivalents
Cash and cash equivalents consist of highly liquid instruments, such as commercial paper, time deposits, and other money market instruments, substantially all of which have maturities when purchased of three months or less.
Inventories
Inventories, consisting primarily of purchased laboratory and customer supplies and finished goods, are stated at the lower of cost (first-in, first-out) or market. Supplies accounted for $
195.2
and $
171.7
and finished goods accounted for $
32.4
and $
33.5
of total inventory at
December 31, 2017
, and
2016
, respectively.
Prepaid Expenses and Other
In connection with the management of multi-site clinical trials, CDD pays on behalf of its customers certain out-of-pocket costs, for which the Company is reimbursed at cost, without markup or profit. Amounts receivable from customers in connection with such out-of-pocket pass-through costs are included in prepaid expenses and other in the accompanying consolidated balance sheets and totaled
$138.2
at
December 31, 2017
, and
$97.1
at
December 31, 2016
.
Also included in prepaid expenses and other current assets are assets held for sale. The Company records long-lived assets as held for sale when a plan to sell the asset has been initiated and all other held for sale criteria have been satisfied. Assets classified as held for sale of
$55.2
and
$51.2
as of
December 31, 2017
, and 2016, respectively, are recorded in other current assets on the consolidated balance sheet at the lower of their carrying value or fair value less cost to sell.
Property, Plant and Equipment
Property, plant and equipment are recorded at cost. The cost of properties held under capital leases is equal to the lower of the net present value of the minimum lease payments or the fair value of the leased property at the inception of the lease. Depreciation and amortization expense is computed on all classes of assets based on their estimated useful lives, as indicated below, using the straight-line method.
F-12
LABORATORY CORPORATION OF AMERICA HOLDINGS AND SUBSIDIARIES
NOTES TO CONSOLIDATED FINANCIAL STATEMENTS
(Dollars and shares in millions, except per share data)
|
|
Years
|
||
|
Buildings and building improvements
|
10
|
-
|
40
|
|
Machinery and equipment
|
3
|
-
|
10
|
|
Furniture and fixtures
|
5
|
-
|
10
|
|
Software
|
3
|
-
|
10
|
Leasehold improvements and assets held under capital leases are amortized over the shorter of their estimated useful lives or the term of the related leases. Expenditures for repairs and maintenance are charged to operations as incurred. Retirements, sales and other disposals of assets are recorded by removing the cost and accumulated depreciation from the related accounts with any resulting gain or loss reflected in the consolidated statements of operations.
Capitalized Software Costs
The Company capitalizes purchased software which is ready for service and capitalizes software development costs incurred on significant projects starting from the time that the preliminary project stage is completed and the Company commits to funding a project until the project is substantially complete and the software is ready for its intended use. Capitalized costs include direct material and service costs and payroll and payroll-related costs. Research and development (R&D) costs and other computer software maintenance costs related to software development are expensed as incurred. Capitalized software costs are amortized using the straight-line method over the estimated useful life of the underlying system, generally
five
years.
Long-Lived Assets
The Company assesses goodwill and indefinite-lived intangibles for impairment at least annually or whenever events or changes in circumstances indicate that the carrying amount of such assets may not be recoverable. In accordance with the FASB updates to their authoritative guidance regarding goodwill and indefinite-lived intangible asset impairment testing, an entity is allowed to first assess qualitative factors as a basis for determining whether it is necessary to perform quantitative impairment testing. If an entity determines that it is not more likely than not that the estimated fair value of an asset is less than its carrying value, then no further testing is required. Otherwise, impairment testing must be performed in accordance with the original accounting standards. The updated FASB guidance also allows an entity to bypass the qualitative assessment for any reporting unit in its goodwill assessment and proceed directly to performing the quantitative assessment. Similarly, a company can proceed directly to a quantitative assessment in the case of impairment testing for indefinite-lived intangible assets as well.
The quantitative goodwill impairment test includes the estimation of the fair value of each reporting unit as compared to the carrying value of the reporting unit. Reporting units are businesses with discrete financial information that is available and reviewed by management. The Company estimates the fair value of a reporting unit using both income-based and market-based valuation methods. The income-based approach is based on the reporting unit's forecasted future cash flows that are discounted to the present value using the reporting unit's weighted average cost of capital. For the market-based approach, the Company utilizes a number of factors such as publicly available information regarding the market capitalization of the Company as well as operating results, business plans, market multiples, and present value techniques. Based upon the range of estimated values developed from the income and market-based methods, the Company determines the estimated fair value for the reporting unit. If the estimated fair value of the reporting unit exceeds the carrying value, the goodwill is not impaired and no further review is required. An entity should recognize an impairment charge for the amount by which the carrying amount exceeds the reporting unit’s fair value; however, the loss recognized should not exceed the total amount of goodwill allocated to that reporting unit.
Management performed its annual goodwill and intangible asset impairment testing as of the beginning of the fourth quarter of 2017. The Company elected to perform the qualitative assessment for goodwill and intangible assets for all reporting units except the Canadian reporting unit and its indefinite-lived assets consisting of acquired Canadian licenses for which a quantitative assessment was performed.
In this qualitative assessment, the Company considered relevant events and circumstances for each reporting unit, including (i) current year results, (ii) financial performance versus management’s annual and five-year strategic plans, iii) changes in the reporting unit carrying value since prior year, (iv) industry and market conditions in which the reporting unit operates, (v) macroeconomic conditions, including discount rate changes, and (vi) changes in products or services offered by the reporting unit. If applicable, performance in recent years was compared to forecasts included in prior valuations. Based on the results of the qualitative assessment, the Company concluded that it was not more likely than not that the carrying values of the goodwill and intangible assets were greater than their fair values, and that further quantitative testing was not necessary.
In 2017, the Company utilized an income approach to determine the fair value of its Canadian reporting unit and its indefinite-lived assets consisting of acquired Canadian licenses. Based upon the results of the quantitative assessment, the Company concluded that the fair value of the indefinite-lived Canadian licenses was greater than the carrying value.
F-13
LABORATORY CORPORATION OF AMERICA HOLDINGS AND SUBSIDIARIES
NOTES TO CONSOLIDATED FINANCIAL STATEMENTS
(Dollars and shares in millions, except per share data)
It is possible that the Company's conclusions regarding impairment or recoverability of goodwill or intangible assets in any reporting unit could change in future periods. There can be no assurance that the estimates and assumptions used in the Company's goodwill and intangible asset impairment testing performed as of the beginning of the fourth quarter of 2017 will prove to be accurate predictions of the future, if, for example, (i) the businesses do not perform as projected, (ii) overall economic conditions in 2018 or future years vary from current assumptions (including changes in discount rates), (iii) business conditions or strategies for a specific reporting unit change from current assumptions, including loss of major customers, (iv) investors require higher rates of return on equity investments in the marketplace or (v) enterprise values of comparable publicly traded companies, or actual sales transactions of comparable companies, were to decline, resulting in lower multiples of revenues and earnings before interest, tax, depreciation and amortization (EBITDA). A future impairment charge for goodwill or intangible assets could have a material effect on the Company's consolidated financial position and results of operations.
Long-lived assets, other than goodwill and indefinite-lived assets, are reviewed for impairment whenever events or changes in circumstances indicate that the carrying amounts may not be recoverable. Recoverability of assets to be held and used is determined by the Company at the level for which there are identifiable cash flows by comparison of the carrying amount of the assets to future undiscounted net cash flows before interest expense and income taxes expected to be generated by the assets. Impairment, if any, is measured by the amount by which the carrying amount of the assets exceeds the fair value of the assets (based on market prices in an active market or on discounted cash flows). Assets to be disposed of are reported at the lower of the carrying amount or fair value.
Intangible Assets
Intangible assets are amortized on a straight-line basis over the expected periods to be benefited, as set forth in the table below, such as legal life for patents and technology and contractual lives for non-compete agreements.
|
|
Years
|
||
|
Customer relationships
|
10
|
-
|
36
|
|
Patents, licenses and technology
|
3
|
-
|
15
|
|
Non-compete agreements
|
5
|
-
|
10
|
|
Trade names
|
5
|
-
|
15
|
The costs related to the issuance of debt are capitalized, netted against the related debt for presentation purposes and amortized to interest expense over the terms of the related debt.
Professional Liability
The Company is self-insured (up to certain limits) for professional liability claims arising in the normal course of business, generally related to the testing and reporting of laboratory test results. The Company estimates a liability that represents the ultimate exposure for aggregate losses below those limits. The liability is based on assumptions and factors for known and incurred but not reported claims, including the frequency and payment trends of historical claims.
Income Taxes
The Company accounts for income taxes utilizing the asset and liability method. Under this method deferred tax assets and liabilities are recognized for the future tax consequences attributable to differences between the financial statement carrying amounts of existing assets and liabilities and their respective tax bases and for tax loss carryforwards. Deferred tax assets and liabilities are measured using enacted tax rates expected to apply to taxable income in the years in which those temporary differences are expected to be recovered or settled. The effect on deferred tax assets and liabilities of a change in tax rates is recognized in income in the period that includes the enactment date. The Company does not recognize a tax benefit unless the Company concludes that it is more likely than not that the benefit will be sustained on audit by the taxing authority based solely on the technical merits of the associated tax position. If the recognition threshold is met, the Company recognizes a tax benefit measured at the largest amount of the tax benefit that the Company believes is greater than
50%
likely to be realized. The Company records interest and penalties in income tax expense.
Derivative Financial Instruments
Interest rate swap agreements, which have been used by the Company from time to time in the management of interest rate exposure, are accounted for at fair value. The Company’s zero-coupon subordinated notes contain two features that are considered to be embedded derivative instruments under authoritative guidance in connection with accounting for derivative instruments and hedging activities. The Company believes these embedded derivatives had
no
fair value at
December 31, 2017
, and
2016
.
See Note 18 for the Company’s objectives in using derivative instruments and the effect of derivative instruments and related hedged items on the Company’s financial position, financial performance and cash flows.
F-14
LABORATORY CORPORATION OF AMERICA HOLDINGS AND SUBSIDIARIES
NOTES TO CONSOLIDATED FINANCIAL STATEMENTS
(Dollars and shares in millions, except per share data)
Fair Value of Financial Instruments
Fair value measurements for financial assets and liabilities are determined based on the assumptions that a market participant would use in pricing an asset or liability. A three-tiered fair value hierarchy draws distinctions between market participant assumptions based on (i) observable inputs such as quoted prices in active markets (Level 1), (ii) inputs other than quoted prices in active markets that are observable either directly or indirectly (Level 2) and (iii) unobservable inputs that require the Company to use present value and other valuation techniques in the determination of fair value (Level 3).
Research and Development
The Company expenses R&D costs as incurred.
Foreign Currencies
For subsidiaries outside of the U.S. that operate in a local currency environment, income and expense items are translated to U.S. dollars at the monthly average rates of exchange prevailing during the period, assets and liabilities are translated at period-end exchange rates and equity accounts are translated at historical exchange rates. Translation adjustments are accumulated in a separate component of shareholders’ equity in the consolidated balance sheets and are included in the determination of comprehensive income in the consolidated statements of comprehensive earnings and consolidated statements of changes in shareholders’ equity. Transaction gains and losses are included in the determination of net income in the consolidated statements of operations.
New Accounting Pronouncements
In May 2014, the Financial Accounting Standards Board (FASB) issued the converged standard on revenue recognition with the objective of providing a single, comprehensive model for all contracts with customers to improve comparability in the financial statements of companies reporting using International Financial Reporting Standards and U.S. GAAP. The standard contains principles that an entity must apply to determine the measurement of revenue and timing of when it is recognized. The underlying principle is that an entity must recognize revenue to depict the transfer of goods or services to customers at an amount that the entity expects to be entitled to in exchange for those goods or services. An entity can apply the revenue standard retrospectively to each prior reporting period presented (full retrospective method) or retrospectively with the cumulative effect of initially applying the standard recognized at the date of initial application in retained earnings. The standard will be effective for the Company beginning January 1, 2018.
The Company will adopt the full retrospective method allowed by this standard effective January 1, 2018, and is continuing to evaluate the expected impact of the standard. Currently, the Company expects this standard to reduce LCD revenue but increase LCD operating margins due to the recording of substantially all LCD bad debt expense against net revenues (versus selling, general and administrative expense) as an implicit price reduction. The Company expects this standard to increase CDD reported revenue and decrease gross profit margin due to inclusion of reimbursable out-of-pocket expenses and investigator fees in revenues and cost of sales. In addition, the Company expects the timing of revenue recognition for customer contracts in the clinical business to accelerate, as revenue from study related change orders will be included in the total transaction price and recognized as the single performance obligation is satisfied, when reasonably estimated, which is often prior to the signed change order threshold used previously. CDD will also discontinue its current practice of expensing sales commissions when paid upon the execution of a customer contract and instead will recognize this selling expense over the weighted average of the underlying contract terms for each major revenue stream. Based on its preliminary analysis, the Company currently anticipates that 2017 total revenue will be approximately 2% to 5% higher under the new standard upon retrospective restatement consisting of an increase in CDD revenue (due in large part to the inclusion of out-of-pocket and investigator fees in revenue) partially offset by a decrease in LCD revenue (due to the recording of bad debt expense as an offset within revenue). The Company also anticipates enhanced financial statement disclosures surrounding the nature, amount, timing and uncertainty of revenue and cash flows arising from contracts with customers. The Company is currently performing a detailed contract review which will be completed before the final quantification of the impact of the standard is completed. The impact of the new standard will be finalized upon adoption in the first quarter of 2018 and is therefore subject to change.
In January 2016, the FASB issued a new accounting standard that addresses certain aspects of recognition, measurement, presentation and disclosure of financial instruments. A financial instrument is defined as cash, evidence of ownership interest in a company or other entity, or a contract that both: (i) imposes on one entity a contractual obligation either to deliver cash or another financial instrument to a second entity or to exchange other financial instruments on potentially unfavorable terms with the second entity, and (ii) conveys to that second entity a contractual right either to receive cash or another financial instrument from the first entity or to exchange other financial instruments on potentially favorable terms with the first entity. The standard will be effective for the Company beginning January 1, 2018. The Company is evaluating the impact that this new standard will have on the consolidated financial statements.
F-15
LABORATORY CORPORATION OF AMERICA HOLDINGS AND SUBSIDIARIES
NOTES TO CONSOLIDATED FINANCIAL STATEMENTS
(Dollars and shares in millions, except per share data)
In February 2016, the FASB issued a new accounting standard that sets out the principles for the recognition, measurement, presentation and disclosure of leases for both parties to a contract (i.e., lessees and lessors). The new standard requires lessees to apply a dual approach, classifying leases as either finance or operating leases based on the principle of whether or not the lease is effectively a financed purchase by the lessee. This classification will determine whether lease expense is recognized based on an effective interest method or on a straight-line basis over the term of the lease. A lessee is also required to record a right-of-use asset and a lease liability for all leases with a term of greater than 12 months regardless of their classification. Leases with a term of 12 months or less will be accounted for based on guidance similar to current guidance for operating leases. The new standard requires lessors to account for leases using an approach that is substantially equivalent to existing guidance for sales-type leases, direct financing leases and operating leases. The standard is effective for the Company on January 1, 2019. The Company has selected its leasing software solution and is evaluating the impact that this new standard will have on the consolidated financial statements.
In June 2016, the FASB issued a new accounting standard intended to provide financial statement users with more decision-useful information about expected credit losses and other commitments to extend credit held by the reporting entity. The standard replaces the incurred loss impairment methodology in current GAAP with one that reflects expected credit losses and requires consideration of a broader range of reasonable and supportable information to inform credit loss estimates. The update is effective on January 1, 2020, with early adoption permitted. The Company is currently evaluating the impact this new standard will have on the consolidated financial statements.
In August 2016, the FASB issued a new accounting standard that will make eight targeted changes to how cash receipts and cash payments are presented and classified in the statement of cash flows. This update is effective on January 1, 2018, and will require adoption on a retrospective basis. The Company expects the adoption of this standard to reclassify interest paid upon conversion of its zero-coupon subordinated notes from a financing activity to an operating activity and potentially to impact the classification of deferred acquisition payments depending upon timing and amount of final payout.
In January 2017, the FASB issued a new accounting standard that changes the definition of a business to assist entities with evaluating when a set of transferred assets and activities is a business. This update is effective on January 1, 2018, with early adoption permitted. The Company is currently evaluating the impact the application of this new standard will have on the consolidated financial statements. This adoption of this standard is not expected to have a material impact on the consolidated financial statements.
In January 2017, the FASB issued a new accounting standard that eliminates Step 2 of the goodwill impairment test. Instead, an entity should perform its annual or interim goodwill impairment test by comparing the fair value of a reporting unit with its carrying amount. An entity should recognize an impairment charge for the amount by which the carrying amount exceeds the reporting unit’s fair value; however, the loss recognized should not exceed the total amount of goodwill allocated to that reporting unit. An entity still has the option to perform the qualitative assessment for a reporting unit to determine if the quantitative impairment test is necessary. The update is effective for public business entities for the first interim and annual reporting periods beginning after January 1, 2020 with early adoption permitted for interim or annual goodwill impairment tests performed on testing dates after January 1, 2017. The Company adopted this standard effective January 1, 2017.
In March 2017, the FASB issued a new accounting standard that requires employers that present a measure of operating income in their statement of income to include only the service cost component of net periodic pension cost and net periodic post-retirement benefit cost in operating expenses with other employee compensation costs. The other components of net benefit cost, including amortization of prior service cost/credit, and settlement and curtailment effects are to be included in non-operating expenses. This update is effective on January 1, 2018, with early adoption permitted. The Company expects that the adoption of this standard will reduce operating margin due to the service cost remaining in operating expenses with no offset from the other components of net pension cost. This will have no impact on net earnings.
In May 2017, the FASB issued a new accounting standard that amends the scope of modification accounting for share-based payment arrangements and provides guidance on the types of changes to the terms or conditions of share-based payment awards to which an entity would be required to apply modification accounting. Specifically, an entity would not apply modification accounting if the fair value, vesting conditions, and classification of the awards are the same immediately before and after the modification. This update is effective on January 1, 2018, with early adoption permitted and should be applied prospectively to an award modified on or after the adoption date.
In July 2017, the FASB issued a new accounting standard intended to reduce the complexity associated with the issuer's accounting for certain financial instruments with characteristics of liabilities and equity. Specifically, a down round feature would no longer cause a free-standing equity-linked financial instrument (or embedded conversion option) to be accounted for as a derivative liability at fair value with changes in fair value recognized in current earnings. This update is effective on January 1,
F-16
LABORATORY CORPORATION OF AMERICA HOLDINGS AND SUBSIDIARIES
NOTES TO CONSOLIDATED FINANCIAL STATEMENTS
(Dollars and shares in millions, except per share data)
2019, with early adoption permitted and the option to use the retrospective or modified retrospective adoption method. The Company is currently evaluating the impact this new standard will have on the consolidated financial statements.
In August 2017, the FASB issued a new accounting standard intended to more closely align hedge accounting with companies' risk management strategies, simplify the application of hedge accounting and increase transparency as to the scope and results of hedging programs. As a result, more hedging strategies will be eligible for hedge accounting. This update is effective on January 1, 2019, with early adoption permitted. The Company is currently evaluating the impact this new standard will have on the consolidated financial statements.
2. BUSINESS ACQUISITIONS
On September 1, 2017, the Company completed the acquisition of Chiltern International Group Limited (Chiltern), a specialty contract research organization, pursuant to a definitive agreement to acquire all of the share capital of Chiltern, in an all-cash transaction valued at approximately
$1,224.5
. The Company funded the acquisition through a combination of bank financing and the issuance of bonds. Chiltern is part of the Company's CDD segment.
The valuation of acquired assets and assumed liabilities as of September 1, 2017, include the following:
|
Consideration Transferred
|
||||||||
|
Cash consideration
|
$
|
1,224.5
|
|
|||||
|
Initial
|
Measurement Period Adjustments
|
Preliminary as of December 31, 2017
|
||||||||||
|
Net Assets Acquired
|
||||||||||||
|
Cash and cash equivalents
|
$
|
30.7
|
|
$
|
—
|
|
$
|
30.7
|
|
|||
|
Accounts receivable
|
116.9
|
|
(11.3
|
)
|
105.6
|
|
||||||
|
Unbilled services
|
32.6
|
|
—
|
|
32.6
|
|
||||||
|
Prepaid expenses and other
|
57.9
|
|
—
|
|
57.9
|
|
||||||
|
Property, plant and equipment
|
12.1
|
|
—
|
|
12.1
|
|
||||||
|
Goodwill
|
676.6
|
|
83.9
|
|
760.5
|
|
||||||
|
Customer relationships
|
629.0
|
|
(27.0
|
)
|
602.0
|
|
||||||
|
Trade names and trademarks
|
24.1
|
|
(13.5
|
)
|
10.6
|
|
||||||
|
Technology
|
47.0
|
|
(21.0
|
)
|
26.0
|
|
||||||
|
Favorable leases
|
—
|
|
0.9
|
|
0.9
|
|
||||||
|
Total assets acquired
|
1,626.9
|
|
12.0
|
|
1,638.9
|
|
||||||
|
Accounts payable
|
18.1
|
|
27.0
|
|
45.1
|
|
||||||
|
Accrued expenses and other
|
51.0
|
|
(27.6
|
)
|
23.4
|
|
||||||
|
Unearned revenue
|
124.2
|
|
—
|
|
124.2
|
|
||||||
|
Deferred income taxes
|
208.0
|
|
12.6
|
|
220.6
|
|
||||||
|
Other liabilities
|
1.1
|
|
—
|
|
1.1
|
|
||||||
|
Total liabilities acquired
|
402.4
|
|
12.0
|
|
414.4
|
|
||||||
|
Net assets acquired
|
$
|
1,224.5
|
|
$
|
—
|
|
$
|
1,224.5
|
|
|||
The amortization periods for intangible assets acquired are
21
years for customer relationships,
4
years for trade names and trademarks, and
6
years for technology. During the fourth quarter, the Company recorded certain measurement period adjustments to appropriately state the fair value of the net assets acquired from Chiltern. Given the September 1, 2017 closing date of the Chiltern acquisition, these adjustments would have had no material income statement impact had they been recorded as part of the initial purchase price allocation.
The acquisition contributed
$188.4
and
$11.6
of net revenue and operating income, respectively, during the year ended December 31, 2017.
Unaudited Pro Forma Information
The Company completed the Chiltern acquisition on September 1, 2017. Had the Chiltern acquisition been completed as of January 1, 2016, the Company's pro forma results for 2017 would have been as follows:
F-17
LABORATORY CORPORATION OF AMERICA HOLDINGS AND SUBSIDIARIES
NOTES TO CONSOLIDATED FINANCIAL STATEMENTS
(Dollars and shares in millions, except per share data)
|
Year Ended
|
||||||
|
December 31, 2017
|
December 31, 2016
|
|||||
|
Total net revenues
|
$
|
10,576.3
|
|
$
|
9,937.4
|
|
|
Operating income
|
1,377.0
|
|
1,327.2
|
|
||
|
Net income
|
1,258.3
|
|
714.3
|
|
||
|
Earnings per share:
|
||||||
|
Basic
|
$
|
12.29
|
|
$
|
6.97
|
|
|
Diluted
|
$
|
12.11
|
|
$
|
6.85
|
|
During the year ended
December 31, 2017
, the Company also acquired various laboratories and related assets, including Pathology Associates Medical Laboratories (PAML), for approximately
$688.8
in cash (net of cash acquired). These acquisitions were made primarily to extend the Company's geographic reach in important market areas and/or enhance the Company's scientific differentiation and esoteric testing capabilities. The purchase consideration for these acquisitions, including Chiltern, has been allocated to the estimated fair market value of the net assets acquired, including approximately
$1,053.0
in identifiable intangible assets (primarily customer relationships and non-compete agreements) and a residual amount of goodwill of approximately
$1,009.8
.
As a result of the acquisition of PAML, the Company acquired PAML’s ownership interests in six joint ventures. During 2017, the Company further acquired the ownership interests of the other members of two of the six joint ventures, and the Company’s ownership interest in one of the six joint ventures was acquired by the other member. During 2018, the Company intends to acquire the membership interests of the other members of an additional two of these six joint ventures and will continue to evaluate future options for the membership interests in the sixth joint venture. The Company will continue to record minority interests in the consolidated joint ventures for which final transactions have not yet been completed. The purchase consideration for the transaction has been preliminarily allocated to the estimated fair market value of the net assets acquired. The amounts paid in advance for the ownership interest in the three joint ventures are included in other assets on the condensed consolidated balance sheet. The total purchase consideration for the transaction is classified as cash paid for acquisition of a business on the condensed consolidated statement of cash flows.
The purchase price allocation for the Chiltern and PAML acquisitions are still preliminary and subject to change. The areas of the purchase price allocation that are not yet finalized relate primarily to intangible assets, goodwill, investment in joint ventures and the impact of finalizing deferred taxes. Accordingly, adjustments may be made as additional information is obtained about the facts and circumstances that existed as of the valuation date. The Company expects these purchase price allocations to be finalized within a year from each acquisition date. Any adjustments will be recorded in the period in which they are identified.
During the year ended
December 31, 2016
, the Company acquired various laboratories and related assets for approximately
$548.6
in cash (net of cash acquired).
The Company completed the acquisition of Sequenom, Inc., a market leader in non-invasive prenatal testing, women's health and reproductive genetics on September 7, 2016, through a cash tender offer for
$2.40
per share, or a transaction price of
$249.1
, net of cash received, and acquired
$130.0
of debt. The Sequenom purchase consideration has been allocated to the estimated fair market value of the net assets acquired, including approximately
$146.6
in identifiable intangible assets (primarily customer relationships, technology, and trade names) with weighted-average useful lives of approximately
14.6
years;
$45.1
in deferred tax liabilities (relating to identifiable intangible assets); and a residual amount of non-tax deductible goodwill of approximately
$206.0
.
The Company also acquired various other laboratories and related assets for approximately
$299.5
in cash (net of cash acquired). The purchase consideration for these acquisitions has been allocated to the estimated fair market value of the net assets acquired, including approximately
$126.2
in identifiable intangible assets (primarily customer relationships) and a residual amount of goodwill of approximately
$192.3
. These acquisitions were made primarily to extend the Company's geographic reach in important market areas and/or enhance the Company's scientific differentiation and esoteric testing capabilities.
On February 19, 2015, the Company completed its acquisition of Covance Inc. (Covance), a leading drug development services company and a leader in nutritional analysis, for
$6,150.7
. The Company issued debt and common stock to fund the acquisition of Covance. Covance stockholders received
$75.76
in cash and
0.2686
shares of the Company's common stock for each share of Covance common stock they owned. The Company financed the Covance acquisition with
$3,900.0
of debt,
15.3
shares of its common stock and
$488.2
of available cash,
$400.0
of which was derived from a bridge term loan credit facility. On January 30, 2015, the Company issued
$2,900.0
in debt securities, consisting of
$500.0
aggregate principal amount of
2.625%
Senior Notes due 2020,
$500.0
aggregate principal amount of
3.20%
Senior Notes due 2022,
$1,000.0
aggregate principal amount of
3.60%
Senior Notes due 2025 and
$900.0
aggregate principal amount of
4.70%
Senior Notes due 2045. The Company also entered into a
$1,000.0
term loan facility which was advanced in full on the February 19, 2015. The term loan credit facility will mature five years after the closing date of the Covance acquisition and may be prepaid without penalty.
F-18
LABORATORY CORPORATION OF AMERICA HOLDINGS AND SUBSIDIARIES
NOTES TO CONSOLIDATED FINANCIAL STATEMENTS
(Dollars and shares in millions, except per share data)
Unaudited Pro Forma Information
The Company completed the acquisition of Covance on February 19, 2015. Had the acquisition been completed as of the beginning of 2014, the Company's pro forma results for 2015 would have been as follows:
|
Year Ended
December 31, 2015
|
|||
|
Total revenues
|
$
|
9,033.3
|
|
|
Operating income
|
1,117.2
|
|
|
|
Net income
|
547.5
|
|
|
|
Earnings per share:
|
|||
|
Basic
|
$
|
5.05
|
|
|
Diluted
|
$
|
5.03
|
|
During the year ended
December 31, 2015
, the Company also acquired various other laboratories and related assets for approximately
$128.4
in cash (net of cash acquired). These acquisitions were made primarily to extend the Company's geographic reach in important market areas and/or enhance the Company's scientific differentiation and esoteric testing capabilities. The purchase consideration for these acquisitions has been allocated to the estimated fair market value of the net assets acquired, including approximately
$17.4
in identifiable intangible assets (primarily customer relationships and non-compete agreements) and a residual amount of goodwill of approximately
$68.4
.
3. RESTRUCTURING AND OTHER SPECIAL CHARGES
During
2017
, the Company recorded net restructuring charges of
$70.9
;
$16.8
within LCD and
$54.1
within CDD. The charges were comprised of
$36.1
in severance and other personnel costs and
$39.9
in facility-related costs primarily associated with general integration activities. The charges were offset by the reversal of previously established reserves of
$0.5
in unused severance and
$4.6
in unused facility-related costs. The Company also incurred legal and other costs of
$43.9
relating to acquisition initiatives, including Chiltern. The Company recorded
$25.4
in consulting and other expenses relating to the Covance and Chiltern integration and compensation analysis, along with
$0.9
in short-term equity retention arrangements relating to the Covance acquisition. In addition, the Company incurred
$1.3
in consulting expenses relating to fees incurred as part of its integration and management transition costs as well as
$8.2
of non-capitalized costs associated with the implementation of a major system as part of its LaunchPad business process improvement initiative (all recorded in selling, general and administrative expenses). The Company also recognized asset impairment losses of
$23.5
related to the termination of software development projects within the CDD segment and the forgiveness of certain indebtedness for LCD customers in areas heavily impacted by hurricanes during the third quarter.
On April 25, 2017, the Company announced that it was expanding LaunchPad to include its CDD segment. The Company generated
$20.0
in savings in 2017, and expects to achieve additional net savings of
$130.0
through the three-year period ending 2020. This initiative is expected to align people and capabilities with client and business demand, utilize automation and new information technology platforms to create efficiencies, and enhance customers' experience with CDD through investments in commercial and operational processes.
During
2016
, the Company recorded net restructuring charges of
$58.4
;
$15.8
within LCD and
$42.6
within CDD. The charges were comprised of
$30.9
in severance and other personnel costs and
$33.8
in facility-related costs primarily associated with general integration activities. The Company incurred additional legal and other costs of
$4.6
relating to the wind down of its minimum volume service contract operations and incurred
$8.0
in acquisition fees and expenses. The Company also recorded
$6.9
in consulting expenses relating to fees incurred as part of its Covance acquisition integration costs and compensation analysis, along with
$2.5
in short-term equity retention arrangements relating to the Covance acquisition and
$8.9
of accelerated equity compensation and other final compensation relating to executive transition, along with
$9.0
of non-capitalized costs associated with the implementation of a major system as part of LaunchPad, LCD's comprehensive, enterprise-wide business process improvement initiative (all recorded in selling, general and administrative expenses). The Company also recorded a
$3.6
gain on sale for certain assets held for sale. The Company incurred
$5.6
of interest expense relating to the early retirement of subsidiary indebtedness assumed as part of its recent acquisition of Sequenom.
During
2015
, the Company recorded net restructuring charges of
$113.9
;
$39.2
within LCD and
$74.7
within CDD. The charges were comprised of
$59.2
in severance and other personnel costs and
$55.8
in facility-related costs primarily associated with the ongoing integration of Orchid Cellmark, Inc. and the Integrated Genetics business (formerly Genzyme Genetics) and costs associated with the previously announced termination of an executive vice president. These charges were offset by the reversal of previously established reserves of
$1.1
in unused facility-related costs. A substantial portion of these costs relate to the planned closure of two CDD operations that serviced a minimum volume contract that expired on October 31, 2015. These charges were offset by the reversal of previously established reserves of
$3.5
in unused facility related costs. Included within the facility-related
F-19
LABORATORY CORPORATION OF AMERICA HOLDINGS AND SUBSIDIARIES
NOTES TO CONSOLIDATED FINANCIAL STATEMENTS
(Dollars and shares in millions, except per share data)
charges noted above is a
$26.7
asset impairment charge relating to CDD lab and customer service applications that will no longer be used.
In addition, during 2015, the Company recorded
$25.6
in consulting expenses (recorded in selling, general and administrative expenses) relating to fees incurred as part of LaunchPad as well as Covance integration costs and employee compensation studies, along with
$5.4
in short-term equity retention arrangements relating to the acquisition of Covance and
$0.3
of accelerated equity compensation relating to the retirement of a Company executive (all recorded in selling, general and administrative expenses). The Company also incurred
$5.7
relating to the wind down of the minimum volume contract operations referred to in the previous paragraph.
Additionally, the Company recorded
$166.0
of deal costs related to the Covance acquisition, of which
$113.4
is included in selling, general and administrative expenses and
$52.6
is included in interest expense. During 2015, the Company also recorded a non-cash loss of
$2.3
, upon the dissolution of one of its equity investments, which is included in other, net expenses. During the fourth quarter, the Company paid
$12.2
in settlement costs and litigation expenses related to the resolution of a U.S. court putative class action lawsuit. In addition, the Company incurred
$3.0
of non-capitalized costs associated with the implementation of a major system as part of LaunchPad.
4. RESTRUCTURING RESERVES
The following represents the Company’s restructuring activities for the period indicated:
|
LCD
|
CDD
|
Total
|
|||||||||||||||||
|
Severance and Other
Employee Costs
|
Lease and Other
Facility Costs
|
Severance and Other
Employee Costs
|
Lease and Other
Facility Costs
|
||||||||||||||||
|
Balance as of December 31, 2016
|
$
|
7.5
|
|
$
|
14.1
|
|
$
|
28.2
|
|
$
|
32.5
|
|
$
|
82.3
|
|
||||
|
Restructuring charges
|
11.4
|
|
6.6
|
|
24.7
|
|
33.3
|
|
76.0
|
|
|||||||||
|
Reduction of prior restructuring accruals
|
(1.1
|
)
|
(0.1
|
)
|
(3.5
|
)
|
(0.4
|
)
|
(5.1
|
)
|
|||||||||
|
Cash payments and other adjustments
|
(16.1
|
)
|
(10.5
|
)
|
(41.1
|
)
|
(30.8
|
)
|
(98.5
|
)
|
|||||||||
|
Balance as of December 31, 2017
|
$
|
1.7
|
|
$
|
10.1
|
|
$
|
8.3
|
|
$
|
34.6
|
|
$
|
54.7
|
|
||||
|
Current
|
|
|
|
|
$
|
22.2
|
|
||||||||||||
|
Non-current
|
|
|
|
|
32.5
|
|
|||||||||||||
|
|
|
|
|
|
$
|
54.7
|
|
||||||||||||
The non-current portion of the restructuring liabilities is expected to be paid out over
6.4
years. Cash payments and other adjustments include the reclassification of profit sharing, pension, and holiday accrual.
5. JOINT VENTURE PARTNERSHIPS AND EQUITY METHOD INVESTMENTS
At
December 31, 2017
, the Company had investments in the following unconsolidated joint venture partnerships and equity method investments:
|
Locations
|
Net Investment
|
Interest Owned
|
||||
|
Joint Venture Partnerships
:
|
|
|
||||
|
Alberta, Canada (2)
|
$
|
45.5
|
|
43.37
|
%
|
|
|
Florence, South Carolina
|
10.1
|
|
49.00
|
%
|
||
|
PAML joint ventures
|
$
|
(0.1
|
)
|
various
|
|
|
|
Equity Method Investments
:
|
||||||
|
Various
|
3.7
|
|
various
|
|
||
The joint venture agreements that govern the conduct of business of these partnerships mandate unanimous agreement between partners on all major business decisions as well as providing other participating rights to each partner. The equity method investments represent the Company’s purchase of ownership interests in clinical diagnostic companies. The investments are accounted for under the equity method of accounting as the Company does not have control of these investments. The Company has no material obligations or guarantees to, or in support of, these unconsolidated investments and their operations.
As a result of the acquisition of PAML, the Company acquired PAML’s ownership interests in six joint ventures. During 2017, the Company further acquired the ownership interests of the other members of two of the six joint ventures, and the Company’s ownership interest in one of the six joint ventures was acquired by the other member. During 2018, the Company intends to acquire the membership interests of the other members of an additional two of these six joint ventures and will continue to evaluate future options for the membership interests in the sixth joint venture. The Company will continue to record minority interests in the consolidated joint ventures for which final transactions have not yet been completed.
F-20
LABORATORY CORPORATION OF AMERICA HOLDINGS AND SUBSIDIARIES
NOTES TO CONSOLIDATED FINANCIAL STATEMENTS
(Dollars and shares in millions, except per share data)
Condensed unconsolidated financial information for joint venture partnerships and equity method investments is shown in the following table.
|
As of December 31:
|
2017
|
2016
|
|||||
|
Current assets
|
$
|
45.7
|
|
$
|
24.3
|
|
|
|
Other assets
|
14.4
|
|
16.9
|
|
|||
|
Total assets
|
$
|
60.1
|
|
$
|
41.2
|
|
|
|
Current liabilities
|
$
|
31.6
|
|
$
|
15.5
|
|
|
|
Other liabilities
|
1.0
|
|
0.3
|
|
|||
|
Total liabilities
|
32.6
|
|
15.8
|
|
|||
|
Partners' equity
|
27.5
|
|
25.4
|
|
|||
|
Total liabilities and partners’ equity
|
$
|
60.1
|
|
$
|
41.2
|
|
|
|
For the period January 1 - December 31:
|
2017
|
2016
|
2015
|
||||||||
|
Net revenues
|
$
|
212.5
|
|
$
|
156.7
|
|
$
|
213.7
|
|
||
|
Gross profit
|
62.6
|
|
45.7
|
|
54.3
|
|
|||||
|
Net earnings
|
25.7
|
|
20.3
|
|
20.1
|
|
|||||
The Company’s recorded investment in one of its Alberta joint venture partnerships at December 31, 2017, includes
$34.6
of value assigned to that partnership’s Canadian license to conduct diagnostic testing services in the province. Substantially all of the joint venture's revenue is received as reimbursement from the Alberta government's healthcare programs. While the Canadian license provides the joint venture the ability to conduct diagnostic testing in Alberta, it does not guarantee that the provincial government will continue to reimburse diagnostic laboratory testing in future years at current levels. A decision by the provincial government to limit or reduce its reimbursement of laboratory diagnostic services would have a negative impact on the profits and cash flows the Company derives from the joint venture. In August 2016, AHS and the Canadian partnership reached an agreement to extend the contract for five additional years through March 2022, with the intent to have the services provided pursuant to the contract transferred to AHS at the end of the five-year period. In consideration of AHS acquiring the assets and assuming liabilities in accordance with the parties’ agreement, AHS will pay CAD
$50.0
to the partnership when the transfer is effective, subject to a working capital adjustment. The Company will amortize the value of the partnership's Canadian license to its residual over the remaining term of the agreement.
6. ACCOUNTS RECEIVABLE, NET
|
December 31, 2017
|
December 31,
2016 |
||||||
|
Gross accounts receivable
|
$
|
1,742.2
|
|
$
|
1,564.3
|
|
|
|
Less allowance for doubtful accounts
|
(260.9
|
)
|
(235.6
|
)
|
|||
|
|
$
|
1,481.3
|
|
$
|
1,328.7
|
|
|
Bad debt expense was
$314.7
,
$287.3
and
$265.4
in
2017
,
2016
and
2015
respectively.
7. PROPERTY, PLANT AND EQUIPMENT, NET
|
December 31, 2017
|
December 31, 2016
|
||||||
|
Land
|
$
|
78.4
|
|
$
|
78.4
|
|
|
|
Buildings and building improvements
|
708.6
|
|
692.8
|
|
|||
|
Machinery and equipment
|
1,181.0
|
|
1,060.1
|
|
|||
|
Software
|
672.2
|
|
626.2
|
|
|||
|
Leasehold improvements
|
333.5
|
|
302.0
|
|
|||
|
Furniture and fixtures
|
90.6
|
|
76.9
|
|
|||
|
Construction in progress
|
185.1
|
|
193.0
|
|
|||
|
Equipment and real estate under capital leases
|
79.2
|
|
81.3
|
|
|||
|
|
3,328.6
|
|
3,110.7
|
|
|||
|
Less accumulated depreciation and amortization of capital lease assets
|
(1,579.7
|
)
|
(1,392.1
|
)
|
|||
|
|
$
|
1,748.9
|
|
$
|
1,718.6
|
|
|
Depreciation expense and amortization of property, plant and equipment was
$306.8
,
$311.1
and
$269.9
for
2017
,
2016
and
2015
, respectively, including software depreciation of
$85.6
,
$79.2
, and
$66.1
for
2017
,
2016
and
2015
, respectively.
F-21
LABORATORY CORPORATION OF AMERICA HOLDINGS AND SUBSIDIARIES
NOTES TO CONSOLIDATED FINANCIAL STATEMENTS
(Dollars and shares in millions, except per share data)
8. GOODWILL AND INTANGIBLE ASSETS
The changes in the carrying amount of goodwill (net of accumulated amortization) for the years ended
December 31, 2017
and
2016
are as follows:
|
LCD
|
CDD
|
Total
|
|||||||||||||||||||||
|
December 31, 2017
|
December 31, 2016
|
December 31, 2017
|
December 31, 2016
|
December 31, 2017
|
December 31, 2016
|
||||||||||||||||||
|
Balance as of January 1
|
$
|
3,644.8
|
|
$
|
3,137.7
|
|
$
|
2,779.6
|
|
$
|
3,064.4
|
|
$
|
6,424.4
|
|
$
|
6,202.1
|
|
|||||
|
Goodwill acquired during the year
|
198.5
|
|
398.3
|
|
811.3
|
|
—
|
|
1,009.8
|
|
398.3
|
|
|||||||||||
|
Foreign currency impact and other adjustments to goodwill
|
1.1
|
|
108.8
|
|
94.7
|
|
(284.8
|
)
|
95.8
|
|
(176.0
|
)
|
|||||||||||
|
Balance at end of year
|
$
|
3,844.4
|
|
$
|
3,644.8
|
|
$
|
3,685.6
|
|
$
|
2,779.6
|
|
$
|
7,530.0
|
|
$
|
6,424.4
|
|
|||||
The components of identifiable intangible assets are as follows:
|
|
December 31, 2017
|
December 31, 2016
|
|||||||||||||||||||||
|
Gross
Carrying
Amount
|
Accumulated
Amortization
|
Net
Carrying
Amount
|
Gross
Carrying
Amount
|
Accumulated
Amortization
|
Net
Carrying
Amount
|
||||||||||||||||||
|
Customer relationships
|
$
|
4,297.9
|
|
$
|
(1,014.9
|
)
|
$
|
3,283.0
|
|
$
|
3,275.3
|
|
$
|
(855.2
|
)
|
$
|
2,420.1
|
|
|||||
|
Patents, licenses and technology
|
457.9
|
|
(188.6
|
)
|
269.3
|
|
395.3
|
|
(163.3
|
)
|
232.0
|
|
|||||||||||
|
Non-compete agreements
|
79.0
|
|
(49.4
|
)
|
29.6
|
|
53.0
|
|
(42.1
|
)
|
10.9
|
|
|||||||||||
|
Trade names
|
426.3
|
|
(171.4
|
)
|
254.9
|
|
406.3
|
|
(141.6
|
)
|
264.7
|
|
|||||||||||
|
Land use rights
|
10.9
|
|
(2.6
|
)
|
8.3
|
|
10.0
|
|
(1.4
|
)
|
8.6
|
|
|||||||||||
|
Canadian licenses
|
495.7
|
|
—
|
|
495.7
|
|
464.2
|
|
—
|
|
464.2
|
|
|||||||||||
|
|
$
|
5,767.7
|
|
$
|
(1,426.9
|
)
|
$
|
4,340.8
|
|
$
|
4,604.1
|
|
$
|
(1,203.6
|
)
|
$
|
3,400.5
|
|
|||||
A summary of amortizable intangible assets acquired during
2017
, and their respective weighted average amortization periods are as follows:
|
Amount
|
Weighted Average
Amortization Period
|
||||
|
Customer relationships
|
$
|
955.7
|
|
20.7
|
|
|
Patents, licenses and technology
|
52.9
|
|
6.7
|
||
|
Non-compete agreements
|
27.8
|
|
6.6
|
||
|
Trade names
|
15.7
|
|
5.7
|
||
|
Favorable leases
|
0.9
|
|
3.0
|
||
|
$
|
1,053.0
|
|
19.3
|
||
Amortization of intangible assets, including amortization of the Canadian license recorded in other assets, was
$216.5
,
$179.5
and
$164.5
in
2017
,
2016
and
2015
, respectively. The Company recorded earn-out and purchase accounting adjustments through amortization expense of
$3.0
,
$4.9
, and
$1.7
in
2017
,
2016
and
2015
, respectively. Amortization expense of intangible assets is estimated to be
$195.0
in fiscal
2018
,
$187.2
in fiscal
2019
,
$179.8
in fiscal
2020
,
$176.8
in fiscal
2021
,
$175.0
in fiscal
2022
, and
$2,899.7
thereafter.
F-22
LABORATORY CORPORATION OF AMERICA HOLDINGS AND SUBSIDIARIES
NOTES TO CONSOLIDATED FINANCIAL STATEMENTS
(Dollars and shares in millions, except per share data)
9. ACCRUED EXPENSES AND OTHER
|
December 31, 2017
|
December 31, 2016
|
||||||
|
Employee compensation and benefits
|
$
|
324.6
|
|
$
|
288.2
|
|
|
|
Self-insurance reserves
|
45.7
|
|
48.2
|
|
|||
|
Accrued taxes payable
|
64.5
|
|
61.2
|
|
|||
|
Royalty and license fees payable
|
6.2
|
|
9.5
|
|
|||
|
Restructuring reserves
|
22.2
|
|
47.7
|
|
|||
|
Acquisition related reserves
|
21.3
|
|
10.3
|
|
|||
|
Interest payable
|
71.7
|
|
58.6
|
|
|||
|
Rebates
|
24.6
|
|
19.5
|
|
|||
|
Other
|
52.1
|
|
50.5
|
|
|||
|
|
$
|
632.9
|
|
$
|
593.7
|
|
|
10. OTHER LIABILITIES
|
December 31, 2017
|
December 31, 2016
|
||||||
|
Post-retirement benefit obligation
|
$
|
7.4
|
|
$
|
5.8
|
|
|
|
Defined-benefit plan obligation
|
163.4
|
|
195.4
|
|
|||
|
Restructuring reserves
|
32.5
|
|
34.6
|
|
|||
|
Self-insurance reserves
|
28.9
|
|
17.1
|
|
|||
|
Acquisition related reserves
|
3.1
|
|
15.7
|
|
|||
|
Deferred compensation plan obligation
|
64.5
|
|
54.2
|
|
|||
|
Worker's compensation and auto
|
39.0
|
|
33.1
|
|
|||
|
Straight-line rent
|
12.7
|
|
13.3
|
|
|||
|
Escheat liability
|
10.9
|
|
8.3
|
|
|||
|
Other
|
15.8
|
|
14.5
|
|
|||
|
$
|
378.2
|
|
$
|
392.0
|
|
||
11. DEBT
Short-term borrowings and current portion of long-term debt at
December 31, 2017
, and
2016
consisted of the following:
|
December 31, 2017
|
December 31, 2016
|
||||||
|
Zero-coupon convertible subordinated notes
|
$
|
8.8
|
|
$
|
42.4
|
|
|
|
2.20% Senior Notes due 2017
|
—
|
|
500.0
|
|
|||
|
2.50% Senior Notes due 2018
|
400.0
|
|
—
|
|
|||
|
Debt issuance costs
|
(1.4
|
)
|
(1.3
|
)
|
|||
|
Capital lease obligation
|
8.3
|
|
8.4
|
|
|||
|
Current portion of note payable
|
1.8
|
|
—
|
|
|||
|
Total short-term borrowings and current portion of long-term debt
|
$
|
417.5
|
|
$
|
549.5
|
|
|
Long-term debt at
December 31, 2017
, and
2016
consisted of the following:
F-23
LABORATORY CORPORATION OF AMERICA HOLDINGS AND SUBSIDIARIES
NOTES TO CONSOLIDATED FINANCIAL STATEMENTS
(Dollars and shares in millions, except per share data)
|
December 31, 2017
|
December 31, 2016
|
||||||
|
2.50% Senior Notes due 2018
|
—
|
|
400.0
|
|
|||
|
4.625% Senior Notes due 2020
|
604.1
|
|
614.6
|
|
|||
|
2.625% Senior Notes due 2020
|
500.0
|
|
500.0
|
|
|||
|
3.75% Senior Notes due 2022
|
500.0
|
|
500.0
|
|
|||
|
3.20% Senior Notes due 2022
|
500.0
|
|
500.0
|
|
|||
|
4.00% Senior Notes due 2023
|
300.0
|
|
300.0
|
|
|||
|
3.25% Senior Notes due 2024
|
600.0
|
|
—
|
|
|||
|
3.60% Senior Notes due 2025
|
1,000.0
|
|
1,000.0
|
|
|||
|
3.60% Senior Notes due 2027
|
600.0
|
|
—
|
|
|||
|
4.70% Senior Notes due 2045
|
900.0
|
|
900.0
|
|
|||
|
2014 Term loan
|
72.0
|
|
565.0
|
|
|||
|
2017 Term loan
|
750.0
|
|
—
|
|
|||
|
Debt issuance costs
|
(48.2
|
)
|
(43.0
|
)
|
|||
|
Capital leases
|
57.8
|
|
56.2
|
|
|||
|
Note payable
|
8.9
|
|
7.2
|
|
|||
|
Total long-term debt
|
$
|
6,344.6
|
|
$
|
5,300.0
|
|
|
Credit Facilities
On September 15, 2017, the Company entered into a new
$750.0
term loan. The 2017 term loan facility will mature on September 15, 2022. The 2014 term loan balance was
$72.0
and
$565.0
at
December 31, 2017
, and 2016, respectively. The 2017 term loan balance at
December 31, 2017
, was
$750.0
.
On December 19, 2014, the Company entered into a five-year term loan credit facility in the principal amount of
$1,000.0
for the purpose of financing a portion of the cash consideration and the fees and expenses in connection with the transactions contemplated by the November 2, 2014 Merger Agreement to acquire Covance. The term loan credit facility was advanced in full on the Covance acquisition date and was amended on July 13, 2016 and further amended on September 15, 2017. The term loan credit facility will mature
five
years after the Covance acquisition date and may be prepaid without penalty. The term loan balance at
December 31, 2017
, was
$72.0
.
On September 15, 2017, the Company also entered into an amendment and restatement of its existing senior revolving credit facility, which was originally entered into on December 21, 2011, was amended and restated on December 15, 2015 and was further amended on July 13, 2016. The senior revolving credit facility consists of a five-year revolving facility in the principal amount of up to
$1,000.0
, with the option of increasing the facility by up to an additional
$350.0
, subject to the agreement of one or more new or existing lenders to provide such additional amounts and certain other customary conditions. The revolving credit facility also provides for a subfacility of up to
$100.0
for swing line borrowings and a subfacility of up to
$150.0
for issuances of letters of credit. The revolving credit facility is permitted to be used for general corporate purposes, including working capital, capital expenditures, funding of share repurchases and certain other payments, and acquisitions and other investments. There were no balances outstanding on the Company's current revolving credit facility at
December 31, 2017
, or
December 31, 2016
.
On January 30, 2015, the Company issued the Covance acquisition notes, which represent $
2,900.0
in debt securities consisting of
$500.0
aggregate principal amount of
2.625%
Senior Notes due 2020,
$500.0
aggregate principal amount of
3.20%
Senior Notes due 2022,
$1,000.0
aggregate principal amount of
3.60%
Senior Notes due 2025 and
$900.0
aggregate principal amount of
4.70%
Senior Notes due 2045. Net proceeds from the offering of the Covance acquisition notes were $
2,870.2
after deducting underwriting discounts and other estimated expenses of the offering. Net proceeds were used to pay a portion of the cash consideration and the fees and expenses in connection with the Covance acquisition.
On February 13, 2015, the Company entered into a
60
-day cash bridge term loan credit facility in the principal amount of
$400.0
for the purpose of financing a portion of the cash consideration and the fees and expenses in connection with the transactions contemplated by the Merger Agreement. The
60
-day cash bridge term loan credit facility was entered into on the terms set forth in the bridge facility commitment letter for the
$400.0
60
-day cash bridge tranche. The
60
-day cash bridge term loan credit facility was advanced in full on the Covance acquisition date. On March 16, 2015, the Company elected to prepay the bridge facility without penalty.
Under the Company's term loan facilities and the revolving credit facility, the Company is subject to negative covenants limiting subsidiary indebtedness and certain other covenants typical for investment grade-rated borrowers and the Company is required to maintain certain leverage ratios. The Company was in compliance with all covenants in the term loan facility and the revolving credit facility at
December 31, 2017
, and 2016. As of
December 31, 2017
, the ratio of total debt to consolidated
F-24
LABORATORY CORPORATION OF AMERICA HOLDINGS AND SUBSIDIARIES
NOTES TO CONSOLIDATED FINANCIAL STATEMENTS
(Dollars and shares in millions, except per share data)
EBITDA was
3.2
to 1.0.
The 2014 term loan credit facility accrues interest at a per annum rate equal to, at the Company’s election, either an Intercontinental Exchange London Inter-bank Offered Rate (LIBOR) rate plus a margin ranging from
1.125% to 2.00%
, or a base rate determined according to a prime rate or federal funds rate plus a margin ranging from
0.125% to 1.00%
. The 2017 term loan credit facility accrues interest at a per annum rate equal to, at the Company’s election, either a LIBOR rate plus a margin ranging from
0.875% to 1.50%
, or a base rate determined according to a prime rate or federal funds rate plus a margin ranging from
0.0% to 0.50%
. Advances under the revolving credit facility accrue interest at a per annum rate equal to, at the Company’s election, either a LIBOR rate plus a margin ranging from
0.775% to 1.25%
, or a base rate determined according to a prime rate or federal funds rate plus a margin ranging from
0.00% to 0.25%
. Fees are payable on outstanding letters of credit under the revolving credit facility at a per annum rate equal to the applicable margin for LIBOR loans, and the Company is required to pay a facility fee on the aggregate commitments under the revolving credit facility, at a per annum rate ranging from
0.10% to 0.25%
. The interest margin applicable to the credit facilities, and the facility fee and letter of credit fees payable under the revolving credit facility, are based on the Company’s senior credit ratings as determined by S&P and Moody’s.
As of
December 31, 2017
, the effective interest rate on the revolving credit facility was
2.7%
, and the effective interest rate on the 2014 term loan was
2.8%
and on the 2017 term loan was
2.6%
.
Zero-Coupon Convertible Subordinated Notes
The Company had
$9.0
and
$46.0
aggregate principal amount at maturity of zero-coupon convertible subordinated notes (the Notes) due
2021
outstanding at
December 31, 2017
, and
2016
, respectively. The Notes, which are subordinate to the Company’s bank debt, were sold at an issue price of
$671.65
per
$1,000.0
principal amount at maturity (representing a yield to maturity of
2.0%
per year). Each one thousand dollar principal amount at maturity of the Notes is convertible into
13.4108
shares of the Company’s common stock, subject to adjustment in certain circumstances, if one of the following conditions occurs:
|
1)
|
The sales price of the Company’s common stock for at least
20
trading days in a period of
30
consecutive trading days ending on the last trading day of the preceding quarter reaches specified thresholds (beginning at
120%
and declining
0.1282%
per quarter until it reaches approximately
110%
for the quarter beginning
July 1, 2021
of the accreted conversion price per share of common stock on the last day of the preceding quarter). The accreted conversion price per share will equal the issue price of a note plus the accrued original issue discount and any accrued contingent additional principal, divided by the number of shares of common stock issuable upon conversion of a note on that day. The conversion trigger price for the fourth quarter of
2017
was
$77.45
.
|
|
2)
|
The credit rating assigned to the notes by S&P Ratings Services is at or below BB-.
|
|
3)
|
The Notes are called for redemption.
|
|
4)
|
Specified corporate transactions have occurred (such as if the Company is party to a consolidation, merger or binding share exchange or a transfer of all or substantially all of its assets).
|
The Company may redeem for cash all or a portion of the Notes at any time at specified redemption prices per one thousand dollar principal amount at maturity of the Notes.
The Company has registered the notes and the shares of common stock issuable upon conversion of the Notes with the Securities and Exchange Commission.
During
2017
and
2016
, the Company settled notices to convert $
37.1
and $
59.4
aggregate principal amount at maturity of its zero-coupon subordinated notes with a conversion value of $
33.9
and $
53.7
, respectively. The total cash used for these settlements was $
33.9
and $
53.7
and the Company also issued
0.3
and
0.4
additional shares of common stock, respectively. As a result of these conversions, in
2017
and
2016
the Company also reversed approximately $
0.0
and $
4.9
, respectively, of deferred tax liability to reflect the tax benefit realized upon issuance of the shares.
On
September 12, 2017
, the Company announced that for the period of September 12, 2017, to March 10, 2018, the zero-coupon subordinated notes will accrue contingent cash interest at a rate of
no less than 0.125% of the average market price of a zero-coupon subordinated note for the five trading days ended September 8, 2017, in addition to the continued accrual of the original issue discount
.
On
January 3, 2018
, the Company announced that its zero-coupon subordinated notes may be converted into cash and common stock at the conversion rate of
13.4108
per
$1,000.0
principal amount at maturity of the notes, subject to the terms of the zero-coupon subordinated notes and the Indenture, dated as of
October 24, 2006
, between the Company, and The Bank of New York Mellon as trustee and the conversion agent. In order to exercise the option to convert all or a portion of the zero-coupon subordinated
F-25
LABORATORY CORPORATION OF AMERICA HOLDINGS AND SUBSIDIARIES
NOTES TO CONSOLIDATED FINANCIAL STATEMENTS
(Dollars and shares in millions, except per share data)
notes, holders are required to validly surrender their zero-coupon subordinated notes at any time during the calendar quarter beginning
January 1, 2018
, through the close of business on the last business day of the calendar quarter, which is 5:00 p.m., New York City time, on Friday,
March 31, 2018
. If notices of conversion are received, the Company plans to settle the cash portion of the conversion obligation with cash on hand and/or borrowings under its revolving credit facility.
Senior Notes
On August 22, 2017, the Company issued new Senior Notes representing
$1,200.0
in debt securities and consisting of a $
600.0
aggregate principal amount of
3.25%
Senior Notes due 2024 and a $
600.0
aggregate principal amount of
3.60%
Senior Notes due 2027. Interest on these notes is payable semi-annually on March 1 and September 1 of each year, commencing on March 1, 2018. Net proceeds from the offering of these notes were $
1,190.1
after deducting underwriting discounts and other expenses of the offering. Net proceeds were used to pay off the
2.20%
Senior Notes due August 23, 2017, as well as a portion of the cash consideration and the fees and expenses in connection with the Chiltern acquisition.
On September 30, 2016, the Company announced the successful completion of consent solicitations for the 5.00% convertible Senior Notes due 2017 and 2018, totaling
$130.0
, assumed as part of the acquisition of Sequenom. On October 20, 2016, the Company retired
$129.9
of these outstanding notes, and paid an additional
$5.6
relating to the early retirement of the subsidiary indebtedness (recorded as interest expense in the Consolidated Statement of Operations).
On January 30, 2015, the Company issued the Covance acquisition notes, which represent
$2,900.0
in debt securities consisting of
$500.0
aggregate principal amount of
2.625%
Senior Notes due 2020,
$500.0
aggregate principal amount of
3.20%
Senior Notes due 2022,
$1,000.0
aggregate principal amount of
3.60%
Senior Notes due 2025 and
$900.0
aggregate principal amount of
4.70%
Senior Notes due 2045. Interest on these notes is payable semi-annually on
February 1
and
August 1
of each year, commencing on
August 1, 2015
. Net proceeds from the offering of the Covance acquisition notes were
$2,870.2
after deducting underwriting discounts and other estimated expenses of the offering. Net proceeds were used to pay a portion of the cash consideration and the fees and expenses in connection with the Covance acquisition.
On
November 1, 2013
, the Company issued
$700.0
in new Senior Notes pursuant to the Company’s effective shelf registration on Form S-3. The Senior Notes consisted of
$400.0
aggregate principal amount of
2.50%
Senior Notes due 2018 and
$300.0
aggregate principal amount of
4.00%
Senior Notes due 2023. Interest on these notes is payable semi-annually on
November 1
and
May 1
of each year, commencing on
May 1, 2014
. The net proceeds were used to repay all of the outstanding borrowings under the Company’s former revolving credit facility and for general corporate purposes.
During the third quarter of 2013, the Company entered into two fixed-to-variable interest rate swap agreements for the
4.625%
Senior Notes due 2020 with an aggregate notional amount of
$600.0
and variable interest rates based on one-month LIBOR plus
2.298%
to hedge against changes in the fair value of a portion of the Company's long-term debt. These derivative financial instruments are accounted for as fair value hedges of the Senior Notes due 2020 outstanding at that time. These interest rate swaps are included in other long-term assets or liabilities, as applicable, and added to the value of the Senior Notes, with an aggregate fair value of
$4.1
at
December 31, 2017
.
The Senior Notes due
2022
bear interest at the rate of
3.75%
per annum, payable semi-annually on
February 23
and
August 23
of each year, commencing
February 23, 2013
. The Senior Notes due
2017
bore interest at the rate
2.20%
of per annum from November 19, 2010, which was payable
semi-annually
on
February 23
and
August 23
.
The scheduled payments of long-term debt and future minimum lease payments for capital leases at the end of
2017
are summarized as follows:
|
Notes and Other
|
Capital Leases
|
Total
|
|||||||||
|
2018
|
$
|
409.2
|
|
$
|
15.6
|
|
$
|
424.8
|
|
||
|
2019
|
35.9
|
|
14.4
|
|
50.3
|
|
|||||
|
2020
|
1,226.9
|
|
13.1
|
|
1,240.0
|
|
|||||
|
2021
|
71.0
|
|
11.7
|
|
82.7
|
|
|||||
|
2022
|
1,601.3
|
|
10.6
|
|
1,611.9
|
|
|||||
|
Thereafter
|
3,351.7
|
|
45.1
|
|
3,396.8
|
|
|||||
|
6,696.0
|
|
110.5
|
|
6,806.5
|
|
||||||
|
Less amounts representing interest
|
—
|
|
(44.4
|
)
|
(44.4
|
)
|
|||||
|
Total long-term debt
|
6,696.0
|
|
66.1
|
|
6,762.1
|
|
|||||
|
Less current portion
|
(409.2
|
)
|
(8.3
|
)
|
(417.5
|
)
|
|||||
|
Long-term debt, due beyond one year
|
$
|
6,286.8
|
|
$
|
57.8
|
|
$
|
6,344.6
|
|
||
F-26
LABORATORY CORPORATION OF AMERICA HOLDINGS AND SUBSIDIARIES
NOTES TO CONSOLIDATED FINANCIAL STATEMENTS
(Dollars and shares in millions, except per share data)
12. PREFERRED STOCK AND COMMON SHAREHOLDERS’ EQUITY
The Company is authorized to issue up to
265.0
shares of common stock, par value
$0.10
per share. The Company’s treasury shares are recorded at aggregate cost. Common shares issued and outstanding are summarized in the following table:
|
|
2017
|
2016
|
|||
|
Issued
|
125.1
|
|
125.6
|
|
|
|
In treasury
|
(23.2
|
)
|
(22.9
|
)
|
|
|
Outstanding
|
101.9
|
|
102.7
|
|
|
The Company is authorized to issue up to
30.0
shares of preferred stock, par value
$0.10
per share. There were no preferred shares outstanding as of
December 31, 2017
and
2016
.
The changes in common shares issued and held in treasury are summarized below:
|
Common Shares Issued
|
|
|
|
|||||
|
|
2017
|
2016
|
2015
|
|||||
|
Common stock issued at January 1
|
125.6
|
|
123.9
|
|
107.1
|
|
||
|
Common stock issued under employee stock plans
|
1.7
|
|
1.6
|
|
1.5
|
|
||
|
Common stock issued upon conversion of zero-coupon subordinated notes
|
0.3
|
|
0.4
|
|
—
|
|
||
|
Common stock issued in conjunction with the Covance acquisition
|
—
|
|
—
|
|
15.3
|
|
||
|
Retirement of common stock
|
(2.5
|
)
|
(0.3
|
)
|
—
|
|
||
|
Common stock issued at December 31
|
125.1
|
|
125.6
|
|
123.9
|
|
||
|
Common Shares Held in Treasury
|
|
|
|
|||||
|
|
2017
|
2016
|
2015
|
|||||
|
Common shares held in treasury at January 1
|
22.9
|
|
22.6
|
|
22.5
|
|
||
|
Surrender of restricted stock and performance share awards
|
0.3
|
|
0.3
|
|
0.1
|
|
||
|
Common shares held in treasury at December 31
|
23.2
|
|
22.9
|
|
22.6
|
|
||
Share Repurchase Program
During 2017, the Company purchased
2.5
shares of its common stock at a total cost of
$338.1
. At the end of 2017, the Company had outstanding authorization from its board of directors to purchase
$401.4
of Company common stock. The repurchase authorization has no expiration date.
Accumulated Other Comprehensive Earnings
The components of accumulated other comprehensive earnings are as follows:
|
Foreign
Currency
Translation
Adjustments
|
Net
Benefit
Plan
Adjustments
|
Unrealized Gains and Losses on Available for Sale Securities
|
Accumulated
Other
Comprehensive
Earnings
|
||||||||||||
|
Balance at December 31, 2014
|
$
|
68.0
|
|
$
|
(78.6
|
)
|
$
|
0.1
|
|
$
|
(10.5
|
)
|
|||
|
Current year adjustments
|
(370.7
|
)
|
19.0
|
|
(0.1
|
)
|
(351.8
|
)
|
|||||||
|
Amounts reclassified from accumulated other comprehensive income
(a) (b)
|
—
|
|
(11.3
|
)
|
—
|
|
(11.3
|
)
|
|||||||
|
Tax effect of adjustments
|
90.1
|
|
(3.5
|
)
|
—
|
|
86.6
|
|
|||||||
|
Balance at December 31, 2015
|
(212.6
|
)
|
(74.4
|
)
|
—
|
|
(287.0
|
)
|
|||||||
|
Current year adjustments
|
(250.0
|
)
|
(3.3
|
)
|
—
|
|
(253.3
|
)
|
|||||||
|
Amounts reclassified from accumulated other comprehensive income
(a)
|
—
|
|
(37.0
|
)
|
—
|
|
(37.0
|
)
|
|||||||
|
Tax effect of adjustments
|
(8.1
|
)
|
4.3
|
|
—
|
|
(3.8
|
)
|
|||||||
|
Balance at December 31, 2016
|
(470.7
|
)
|
(110.4
|
)
|
—
|
|
(581.1
|
)
|
|||||||
|
Current year adjustments
|
262.3
|
|
2.4
|
|
—
|
|
264.7
|
|
|||||||
|
Amounts reclassified from accumulated other comprehensive income
(a)
|
—
|
|
18.5
|
|
—
|
|
18.5
|
|
|||||||
|
Tax effect of adjustments
|
(34.3
|
)
|
(3.5
|
)
|
—
|
|
(37.8
|
)
|
|||||||
|
Balance at December 31, 2017
|
$
|
(242.7
|
)
|
$
|
(93.0
|
)
|
$
|
—
|
|
$
|
(335.7
|
)
|
|||
F-27
LABORATORY CORPORATION OF AMERICA HOLDINGS AND SUBSIDIARIES
NOTES TO CONSOLIDATED FINANCIAL STATEMENTS
(Dollars and shares in millions, except per share data)
(a)
The amortization of prior service cost is included in the computation of net periodic benefit cost. Refer to Note 16 Pension and Postretirement Plans for additional information regarding the Company's net periodic benefit cost.
(b)
The realized gain from the sale of an available for sale investment and the other-than-temporary impairment on an available for sale investment are included in Other, net on the Consolidated Statement of Operations.
13. INCOME TAXES
The sources of income before taxes, classified between domestic and foreign entities are as follows:
|
Pre-tax income
|
2017
|
2016
|
2015
|
||||||||
|
Domestic
|
$
|
891.8
|
|
$
|
914.0
|
|
$
|
593.5
|
|
||
|
Foreign
|
243.1
|
|
191.5
|
|
132.5
|
|
|||||
|
Total pre-tax income
|
$
|
1,134.9
|
|
$
|
1,105.5
|
|
$
|
726.0
|
|
||
The provisions (benefits) for income taxes in the accompanying consolidated statements of operations consist of the following:
|
|
Years Ended December 31,
|
||||||||||
|
|
2017
|
2016
|
2015
|
||||||||
|
Current:
|
|
|
|
||||||||
|
Federal
|
$
|
300.8
|
|
$
|
235.1
|
|
$
|
218.3
|
|
||
|
State
|
32.9
|
|
38.6
|
|
33.7
|
|
|||||
|
Foreign
|
53.0
|
|
43.9
|
|
69.4
|
|
|||||
|
|
$
|
386.7
|
|
$
|
317.6
|
|
$
|
321.4
|
|
||
|
Deferred:
|
|
|
|
|
|
|
|||||
|
Federal
|
$
|
(534.3
|
)
|
$
|
64.4
|
|
$
|
(14.1
|
)
|
||
|
State
|
12.9
|
|
6.0
|
|
(4.2
|
)
|
|||||
|
Foreign
|
(4.4
|
)
|
(15.7
|
)
|
(15.8
|
)
|
|||||
|
|
(525.8
|
)
|
54.7
|
|
(34.1
|
)
|
|||||
|
|
$
|
(139.1
|
)
|
$
|
372.3
|
|
$
|
287.3
|
|
||
In 2017, a benefit of
$18.9
in excess stock-based compensation was recorded directly to income tax expense. In 2016, as a result of the early adoption of the accounting standard associated with simplifying several aspects of share-based compensation, a benefit of
$14.0
in excess stock-based compensation was recorded directly to income tax expense. For 2015, a portion of the tax benefit associated with option exercises from stock plans, which reduces taxes payable, was recorded through additional paid-in capital. The 2015 benefits recorded through additional paid-in capital were approximately
$13.1
.
The effective tax rates on earnings before income taxes are reconciled to statutory U.S. income tax rates as follows:
|
|
Years Ended December 31,
|
|||||||
|
|
2017
|
2016
|
2015
|
|||||
|
Statutory U.S. rate
|
35.0
|
%
|
35.0
|
%
|
35.0
|
%
|
||
|
State and local income taxes, net of U.S. Federal income tax effect
|
2.5
|
|
2.6
|
|
3.2
|
|
||
|
Foreign earnings taxed at lower rates than the statutory U.S. rate
|
(3.5
|
)
|
(3.1
|
)
|
(1.8
|
)
|
||
|
Restructuring and acquisition items
|
0.6
|
|
—
|
|
2.7
|
|
||
|
Share-based compensation
|
(1.7
|
)
|
(1.2
|
)
|
—
|
|
||
|
Re-measurement of deferred taxes
|
(35.0
|
)
|
—
|
|
—
|
|
||
|
Deferred taxes on unremitted foreign earnings
|
(15.8
|
)
|
—
|
|
—
|
|
||
|
Repatriation tax
|
5.0
|
|
—
|
|
—
|
|
||
|
Other
|
0.6
|
|
0.4
|
|
1.1
|
|
||
|
Effective rate
|
(12.3
|
)%
|
33.7
|
%
|
40.2
|
%
|
||
In December 2017, the U.S. enacted the Tax Cuts and Jobs Act (TCJA) which makes widespread changes to the Internal Revenue Code. The TCJA, among other things, reduces the U.S. federal corporate tax rate from 35% to 21% beginning January 1, 2018, requires companies to pay a repatriation tax on earnings of certain foreign subsidiaries that were previously not subject to U.S. tax, and creates new income taxes on certain foreign sourced earnings. Also on December 22, 2017, the SEC issued Staff Accounting Bulletin No. 118 (SAB 118), which provides companies with additional guidance on how to account for the TCJA in its financial statements, allowing companies to use a measurement period. At December 31, 2017, the Company had not completed the accounting for the tax effects of enactment of the TCJA; however, as described below, a reasonable estimate on the re-measurement of the Company's existing deferred tax balances, the deferred tax revaluation for unremitted foreign earnings, and the one-time repatriation tax has been made. For these items, in accordance with SAB 118, a provisional net benefit has been recognized, totaling
$519.0
, which is included as a component of income tax expense from continuing operations. The Company expects to finalize this provisional estimate before the end of 2018 after completing its reviews and analysis, and after incorporating
F-28
LABORATORY CORPORATION OF AMERICA HOLDINGS AND SUBSIDIARIES
NOTES TO CONSOLIDATED FINANCIAL STATEMENTS
(Dollars and shares in millions, except per share data)
further anticipated guidance from the U.S. Treasury issued during this measurement period. As a result, the reported net benefit could change during 2018.
The effective rate for 2017 was favorably impacted by the re-measurement of the Company's net deferred tax liabilities using the rates enacted in the TCJA and the deferred tax revaluation for unremitted foreign earnings, partially offset by the deemed repatriation tax enacted in this legislation. The 2017 rate was also favorably impacted by foreign earnings taxed at rates lower than the U.S. and by share-based compensation.
The effective rate for 2016 was favorably impacted by foreign earnings taxed at rates lower than the U.S. statutory rate and the early adoption of the share-based compensation standard.
The effective rate for 2015 was favorably impacted by foreign earnings taxed at rates lower than the U.S. statutory rate and unfavorably impacted by restructuring and acquisition items, the recording of additional uncertain tax reserves, and a decrease in the benefit recorded from releasing uncertain tax reserves.
The tax effects of temporary differences that give rise to significant portions of the deferred tax assets and deferred tax liabilities are as follows:
|
December 31, 2017
|
December 31, 2016
|
||||||
|
Deferred tax assets:
|
|
|
|||||
|
Accounts receivable
|
$
|
14.7
|
|
$
|
13.5
|
|
|
|
Employee compensation and benefits
|
113.6
|
|
160.8
|
|
|||
|
Acquisition and restructuring reserves
|
16.8
|
|
38.5
|
|
|||
|
Tax loss carryforwards
|
107.0
|
|
167.7
|
|
|||
|
Other
|
26.0
|
|
44.8
|
|
|||
|
|
278.1
|
|
425.3
|
|
|||
|
Less: valuation allowance
|
(42.8
|
)
|
(31.3
|
)
|
|||
|
Deferred tax assets, net of valuation allowance
|
$
|
235.3
|
|
$
|
394.0
|
|
|
|
Deferred tax liabilities:
|
|
|
|
|
|||
|
Deferred earnings
|
$
|
(5.1
|
)
|
$
|
(193.2
|
)
|
|
|
Intangible assets
|
(913.2
|
)
|
(1,047.4
|
)
|
|||
|
Property, plant and equipment
|
(156.9
|
)
|
(208.8
|
)
|
|||
|
Zero-coupon subordinated notes
|
(10.1
|
)
|
(48.5
|
)
|
|||
|
Currency translation adjustment
|
(0.1
|
)
|
(47.0
|
)
|
|||
|
Other
|
(27.2
|
)
|
(27.9
|
)
|
|||
|
Total gross deferred tax liabilities
|
(1,112.6
|
)
|
(1,572.8
|
)
|
|||
|
Net deferred tax liabilities
|
$
|
(877.3
|
)
|
$
|
(1,178.8
|
)
|
|
The TCJA includes provisions relating to global low-taxed intangible income (GILTI).
Relevant to the current consolidated financial statements is the Company's selection of an accounting policy with respect to the new GILTI tax rules, and whether to account for GILTI as a periodic charge in the period it arises, or to record deferred taxes associated with the basis in the Company’s foreign subsidiaries. Due to the intricacy of this topic, the Company is still in the process of investigating the implications of accounting for the GILTI tax and intends to make an accounting policy decision once additional guidance is available for assessment.
The Company has U.S. federal tax loss carryforwards of approximately
$294.3
, which expire periodically through
2035
. The utilization of tax loss carryforwards is limited due to change of ownership rules; however, at this time, the Company expects to fully utilize substantially all U.S. federal tax loss carryforwards with the exception of approximately $
3.9
for which a full valuation allowance has been provided. The Company has U.S. state tax loss carryforwards of
$602.2
, which also expire periodically through 2036, and on which a valuation allowance of
$485.5
has been provided. The Company has foreign tax loss carryforwards of $
37.4
of which
$27.1
has a full valuation allowance. Most of the foreign losses have an indefinite carryover. In addition to the foreign net operating losses, the Company has a foreign capital loss carryforward of
$6.9
. The capital loss has an indefinite life and has a full valuation allowance.
The valuation allowance increased from
$31.3
in
2016
to
$42.8
in
2017
primarily due to additional state losses for which no benefit is anticipated.
Unrecognized income tax benefits were
$19.5
and
$18.4
at
December 31, 2017
, and
2016
, respectively. It is anticipated that the amount of the unrecognized income tax benefits will change within the next 12 months; however, these changes are not expected to have a significant impact on the results of operations, cash flows or the financial position of the Company.
F-29
LABORATORY CORPORATION OF AMERICA HOLDINGS AND SUBSIDIARIES
NOTES TO CONSOLIDATED FINANCIAL STATEMENTS
(Dollars and shares in millions, except per share data)
The Company recognizes interest and penalties related to unrecognized income tax benefits in income tax expense. Accrued interest and penalties related to uncertain tax positions totaled
$7.9
and
$9.9
as of
December 31, 2017
, and
2016
, respectively. During the years ended
December 31, 2017
,
2016
and
2015
, the Company recognized
$2.3
,
$1.2
and
$1.8
, respectively, in interest and penalties expense, which was offset by a benefit from reversing previous accruals for interest and penalties of
$4.3
,
$4.0
and
$2.2
, respectively.
The following table shows a reconciliation of the unrecognized income tax benefits, excluding interest and penalties, from uncertain tax positions for the years ended
December 31, 2017
,
2016
and
2015
:
|
|
2017
|
2016
|
2015
|
||||||||
|
Balance as of January 1
|
$
|
18.4
|
|
$
|
24.2
|
|
$
|
16.7
|
|
||
|
Increase in reserve for tax positions taken in the current year
|
7.3
|
|
2.3
|
|
4.1
|
|
|||||
|
Increase in reserve as a result of acquisition
|
—
|
|
—
|
|
8.5
|
|
|||||
|
Decrease in reserve as a result of lapses in the statute of limitations
|
(6.2
|
)
|
(8.1
|
)
|
(5.1
|
)
|
|||||
|
Balance as of December 31
|
$
|
19.5
|
|
$
|
18.4
|
|
$
|
24.2
|
|
||
As of
December 31, 2017
, and
2016
,
$19.5
and
$18.4
, respectively, are the approximate amounts of unrecognized income tax benefits that, if recognized, would favorably affect the effective income tax rate in any future periods.
The Company has substantially concluded all U.S. federal income tax matters for years through 2012. Substantially all material state and local and foreign income tax matters have been concluded through 2012 and 2008, respectively.
The Internal Revenue Service concluded the examination of the Company's 2014 federal consolidated income tax return, which did not include Covance Inc., in the third quarter of 2016. Covance Inc.'s 2013 federal consolidated income tax return is under examination. The Canada Revenue Agency is currently examining the Company's 2013 and 2014 Canadian subsidiaries' tax returns. The Company has various state and foreign income tax examinations ongoing throughout the year. The Company believes adequate provisions have been recorded related to all open tax years.
As a result of the TCJA, the Company was effectively taxed on all of its previously unremitted foreign earnings. The TCJA also enacts a territorial tax system that allows, for the most part, tax-free repatriation of foreign earnings. The Company still considers the earnings of its foreign subsidiaries to be permanently reinvested, but if repatriation were to occur we would be required to accrue U.S. taxes, if any, and applicable withholding taxes as appropriate. Along with the provisions of the TCJA, the Company will continue to review its repatriation policy.
14. STOCK COMPENSATION PLANS
Stock Incentive Plans
There are currently
10.7
shares authorized for issuance under the Laboratory Corporation of America Holdings 2016 Omnibus Incentive Plan (the Plan) and at
December 31, 2017
there were
8.3
additional shares available for grant under the Plan. The Plan was approved by shareholders at the 2016 annual meeting.
Stock Options
The following table summarizes grants of non-qualified options made by the Company to officers, key employees, and non-employee directors under all plans. Stock options are generally granted at an exercise price equal to or greater than the fair market price per share on the date of grant. Also, for each grant, options vest ratably over a period of
three
years on the anniversaries of the grant date, subject to their earlier expiration or termination.
Changes in options outstanding under the plans for the period indicated were as follows:
|
Number of
Options
|
Weighted-Average
Exercise Price
per Option
|
Weighted-Average
Remaining
Contractual Term
|
Aggregate
Intrinsic
Value
|
|||||||||
|
Outstanding at December 31, 2016
|
1.6
|
|
$
|
82.43
|
|
|
|
|||||
|
Granted
|
0.1
|
|
130.60
|
|
|
|
||||||
|
Exercised
|
(0.5
|
)
|
83.85
|
|
|
|
||||||
|
Cancelled
|
—
|
|
80.37
|
|
|
|
||||||
|
Outstanding at December 31, 2017
|
1.2
|
|
$
|
86.55
|
|
3.9
|
$
|
85.4
|
|
|||
|
Vested and expected to vest at December 31, 2017
|
1.1
|
|
$
|
81.73
|
|
3.3
|
$
|
82.1
|
|
|||
|
Exercisable at December 31, 2017
|
1.1
|
|
$
|
81.73
|
|
3.3
|
$
|
82.1
|
|
|||
F-30
LABORATORY CORPORATION OF AMERICA HOLDINGS AND SUBSIDIARIES
NOTES TO CONSOLIDATED FINANCIAL STATEMENTS
(Dollars and shares in millions, except per share data)
The aggregate intrinsic value in the table above represents the total pre-tax intrinsic value (the difference between the Company’s closing stock price on the last trading day of
2017
and the exercise price, multiplied by the number of in-the-money options) that would have been received by the option holders had all option holders exercised their options on
December 31, 2017
. The amount of intrinsic value will change based on the fair market value of the Company’s stock.
Cash received by the Company from option exercises, the actual tax benefit realized for the tax deductions and the aggregate intrinsic value of options exercised from option exercises under all share-based payment arrangements during the years ended
December 31, 2017
,
2016
, and
2015
were as follows:
|
|
2017
|
2016
|
2015
|
||||||||
|
Cash received by the Company
|
$
|
43.9
|
|
$
|
52.6
|
|
$
|
82.6
|
|
||
|
Tax benefits realized
|
$
|
13.4
|
|
$
|
13.6
|
|
$
|
16.2
|
|
||
|
Aggregate intrinsic value
|
$
|
34.8
|
|
$
|
35.5
|
|
$
|
42.2
|
|
||
The following table summarizes information concerning currently outstanding and exercisable options.
|
Options Outstanding
|
Options Exercisable
|
|||||||||
|
Range of
Exercise Prices
|
Number
Outstanding
|
Weighted Average
|
Number
Exercisable
|
Weighted
Average
Exercise
Price
|
||||||
|
Remaining
Contractual
Life
|
Average
Exercise
Price
|
|||||||||
|
$59.38 - 67.60
|
0.1
|
1.1
|
$60.64
|
0.1
|
$60.64
|
|||||
|
$67.61 - 75.63
|
0.2
|
1.8
|
$72.06
|
0.2
|
$72.06
|
|||||
|
$75.64 - 84.86
|
0.6
|
4.2
|
$84.73
|
0.6
|
$84.73
|
|||||
|
$84.87 - 130.60
|
0.3
|
5.2
|
$105.29
|
0.3
|
$91.13
|
|||||
|
|
1.2
|
3.9
|
$86.55
|
1.2
|
$81.73
|
|||||
The following table shows the weighted average grant-date fair values of options issued during the respective year and the weighted average assumptions that the Company used to develop the fair value estimates:
|
|
2017
|
2016
|
2015
|
||||
|
Fair value per option
|
$
|
32.75
|
|
N/A
|
N/A
|
||
|
Valuation assumptions
|
|||||||
|
Weighted average expected life (in years)
|
6.0
|
|
N/A
|
N/A
|
|||
|
Risk free interest rate
|
2.1
|
%
|
N/A
|
N/A
|
|||
|
Expected volatility
|
0.2
|
|
N/A
|
N/A
|
|||
|
Expected dividend yield
|
N/A
|
|
N/A
|
N/A
|
|||
The Black Scholes model incorporates assumptions to value stock-based awards. The risk-free interest rate for periods within the contractual life of the option is based on a zero-coupon U.S. government instrument over the contractual term of the equity instrument. Expected volatility of the Company’s stock is based on historical volatility of the Company’s stock. The Company uses historical data to calculate the expected life of the option. Groups of employees and non-employee directors that have similar exercise behavior with regard to option exercise timing and forfeiture rates are considered separately for valuation purposes. For
2017
,
2016
and
2015
, expense related to the Company’s stock option plan totaled
$0.9
,
$0.0
and
$2.2
, respectively. The Company did not grant any options to employees during
2016
or
2015
.
Restricted Stock, Restricted Stock Units and Performance Shares
The Company grants restricted stock, restricted stock units and performance shares (non-vested shares) to officers and key employees and grants restricted stock and restricted stock units to non-employee directors. Restricted stock and units typically vest annually in equal
one third increments beginning on the first anniversary of the grant
. A performance share grant in
2015
represents a three-year award opportunity for the period 2015-2017, and if earned, vests fully (to the extent earned) in the first quarter of 2018. A performance share grant in
2016
represents a three-year award opportunity for the period of 2016-2018 and, if earned, vests fully (to the extent earned) in the first quarter of 2019. A performance share grant in
2017
represents a three-year award opportunity for the period of 2017-2019 and, if earned, vests fully (to the extent earned) in the first quarter of 2020.
Performance share awards are subject to certain earnings per share, revenue, operating income, earnings before income taxes and total shareholder return targets
, the achievement of which may increase or decrease the number of shares which the grantee earns and therefore receives upon vesting. Unearned restricted stock and performance share compensation is amortized to expense over the applicable vesting periods. For
2017
,
2016
and
2015
, total restricted stock, restricted stock unit and performance share compensation expense was
$100.8
,
$104.1
and
$83.8
, respectively.
F-31
LABORATORY CORPORATION OF AMERICA HOLDINGS AND SUBSIDIARIES
NOTES TO CONSOLIDATED FINANCIAL STATEMENTS
(Dollars and shares in millions, except per share data)
The following table shows a summary of non-vested shares for the year ended
December 31, 2017
:
|
Number of
Shares
|
Weighted-Average
Grant Date
Fair Value
|
|||||
|
Non-vested at January 1, 2017
|
1.6
|
|
$
|
108.23
|
|
|
|
Granted
|
0.9
|
|
132.48
|
|
||
|
Vested
|
(0.9
|
)
|
100.86
|
|
||
|
Canceled
|
(0.1
|
)
|
118.74
|
|
||
|
Non-vested at December 31, 2017
|
1.5
|
|
$
|
121.36
|
|
|
As of
December 31, 2017
, there was
$104.0
of total unrecognized compensation cost related to non-vested restricted stock, restricted stock unit and performance share-based compensation arrangements granted under the Company's stock incentive plans. That cost is expected to be recognized over a weighted average period of
1.8
years.
Employee Stock Purchase Plan
Under the 2016 Employee Stock Purchase Plan, the Company is authorized to issue
2.4
shares of common stock. The plan permits substantially all employees to purchase a limited number of shares of Company stock at
85%
of market value. The Company issues shares to participating employees semi-annually in January and July of each year. Approximately
0.3
shares were purchased by eligible employees in each of
2017
,
2016
and
2015
, respectively, under either the 2016 Employee Stock Purchase Plan or the prior plan, which began in 1997 and was amended in 1999, 2004, 2008 and 2012. For
2017
,
2016
and
2015
, expense related to the Company’s employee stock purchase plan was
$8.0
,
$5.5
and
$4.1
, respectively.
The Company uses the Black-Scholes model to calculate the fair value of the employee’s purchase right. The fair value of the employee’s purchase right and the assumptions used in its calculation are as follows:
|
|
2017
|
2016
|
2015
|
||||||||
|
Fair value of the employee’s purchase right
|
$
|
31.54
|
|
$
|
23.32
|
|
$
|
21.95
|
|
||
|
Valuation assumptions
|
|
|
|
|
|
|
|||||
|
Risk free interest rate
|
1.3
|
%
|
0.5
|
%
|
0.3
|
%
|
|||||
|
Expected volatility
|
0.2
|
|
0.2
|
|
0.2
|
|
|||||
|
Expected dividend yield
|
—
|
|
—
|
|
—
|
|
|||||
15. COMMITMENTS AND CONTINGENT LIABILITIES
The Company is involved from time to time in various claims and legal actions, including arbitrations, class actions, and other litigation (including those described in more detail below), arising in the ordinary course of business. Some of these actions involve claims that are substantial in amount. These matters include, but are not limited to, intellectual property disputes; commercial and contract disputes; professional liability; employee-related matters; and inquiries, including subpoenas and other civil investigative demands, from governmental agencies, Medicare or Medicaid payers and MCOs reviewing billing practices or requesting comment on allegations of billing irregularities that are brought to their attention through billing audits or third parties. The Company receives civil investigative demands or other inquiries from various governmental bodies in the ordinary course of its business. Such inquiries can relate to the Company or other parties, including physicians and other healthcare providers (e.g., physician assistants and nurse practitioners, generally referred to herein as physicians). The Company works cooperatively to respond to appropriate requests for information.
The Company also is named from time to time in suits brought under the
qui tam
provisions of the False Claims Act and comparable state laws. These suits typically allege that the Company has made false statements and/or certifications in connection with claims for payment from U.S., federal or state healthcare programs. The suits may remain under seal (hence, unknown to the Company) for some time while the government decides whether to intervene on behalf of the
qui tam
plaintiff. Such claims are an inevitable part of doing business in the healthcare field today.
The Company believes that it is in compliance in all material respects with all statutes, regulations and other requirements applicable to its commercial laboratory operations and drug development support services. The healthcare diagnostics and drug development industries are, however, subject to extensive regulation, and the courts have not interpreted many of the applicable statutes and regulations. Therefore, the applicable statutes and regulations could be interpreted or applied by a prosecutorial, regulatory or judicial authority in a manner that would adversely affect the Company. Potential sanctions for violation of these statutes and regulations include significant civil and criminal penalties, fines, the loss of various licenses, certificates and authorizations, additional liabilities from third-party claims, and/or exclusion from participation in government programs.
F-32
LABORATORY CORPORATION OF AMERICA HOLDINGS AND SUBSIDIARIES
NOTES TO CONSOLIDATED FINANCIAL STATEMENTS
(Dollars and shares in millions, except per share data)
Many of the current claims and legal actions against the Company are in preliminary stages, and many of these cases seek an indeterminate amount of damages. The Company records an aggregate legal reserve, which is determined using calculations based on historical loss rates and assessment of trends experienced in settlements and defense costs. In accordance with FASB Accounting Standards Codification Topic 450 “Contingencies,” the Company establishes reserves for judicial, regulatory, and arbitration matters outside the aggregate legal reserve if and when those matters present loss contingencies that are both probable and estimable and would exceed the aggregate legal reserve. When loss contingencies are not both probable and estimable, the Company does not establish separate reserves.
The Company is unable to estimate a range of reasonably probable loss for the proceedings described in more detail below in which damages either have not been specified or, in the Company's judgment, are unsupported and/or exaggerated and (i) the proceedings are in early stages; (ii) there is uncertainty as to the outcome of pending appeals or motions; (iii) there are significant factual issues to be resolved; and/or (iv) there are novel legal issues to be presented. For these proceedings, however, the Company does not believe, based on currently available information, that the outcomes will have a material adverse effect on the Company's financial condition, though the outcomes could be material to the Company's operating results for any particular period, depending, in part, upon the operating results for such period. The amount of ultimate loss may also differ from the Company’s estimates. It is possible that an unfavorable outcome that exceeds the Company’s current accrued estimate, if any, for one or more of the matters below could have a material adverse effect on the Company’s financial condition.
As previously reported, the Company reached a settlement in the previously disclosed lawsuit,
California ex rel. Hunter
Laboratories, LLC et al. v. Quest Diagnostics Incorporated, et al.
(Hunter Labs Settlement Agreement), to avoid the uncertainty and costs associated with prolonged litigation. Pursuant to the executed Hunter Labs Settlement Agreement, the Company recorded a litigation settlement expense of
$34.5
in the second quarter of 2011 (net of a previously recorded reserve of
$15.0
) and paid the settlement amount of
$49.5
in the third quarter of 2011. The Company also agreed to certain reporting obligations regarding its pricing for a limited time period and, at the option of the Company in lieu of such reporting obligations, to provide Medi-Cal with a discount from Medi-Cal's otherwise applicable maximum reimbursement rate from November 1, 2011, through October 31, 2012. In 2011, the California legislature enacted Assembly Bill No. 97, which imposed a
10.0%
Medi-Cal payment cut on most providers of healthcare services, including clinical laboratories. In 2012, the California legislature enacted Assembly Bill No. 1494, which directed the Department of Healthcare Services (DHCS) to establish new reimbursement rates for Medi-Cal commercial laboratory services based on payments made to California clinical laboratories for similar services by other third-party payers, and provided that until the new rates are set through this process, Medi-Cal payments for commercial laboratory services will be reduced (in addition to a
10.0%
payment reduction imposed by Assembly Bill No. 97 in 2011) by “up to 10 percent” for tests with dates of service on or after July 1, 2012, with a cap on payments set at
80.0%
of the lowest maximum allowance established under the Medicare program. Under the terms of the Hunter Labs Settlement Agreement, the enactment of this California legislation terminated the Company's reporting obligations (or obligation to provide a discount in lieu of reporting) under that agreement. In April 2015, CMS approved a
10.0%
payment reduction under Assembly Bill No. 1494. The new rate methodology established new rates that were effective July 1, 2015, but these new rates were not entered into the state computer system until February 2016. The 2016 rates have been implemented and recoupments began in 2017. Taken together, these changes are not expected to have a material impact on the Company's consolidated revenues or results of operations.
As previously reported, the Company responded to an October 2007 subpoena from the U.S. Department of Health & Human Services Office of Inspector General's regional office in New York. On August 17, 2011, the United States District Court for the Southern District of New York unsealed a False Claims Act lawsuit,
United States of America ex rel. NPT Associates v. Laboratory Corporation of America Holdings
, which alleges that the Company offered UnitedHealthcare kickbacks in the form of discounts in return for Medicare business. The Plaintiff's Third Amended Complaint further alleges that the Company's billing practices violated the False Claims Acts of 14 states and the District of Columbia. The lawsuit seeks actual and treble damages and civil penalties for each alleged false claim, as well as recovery of costs, attorney's fees, and legal expenses. Neither the U.S. government nor any state government has intervened in the lawsuit. The Company's Motion to Dismiss was granted in October 2014 and Plaintiff was granted the right to replead. On January 11, 2016, Plaintiff filed a motion requesting leave to file an amended complaint under seal and to vacate the briefing schedule for the Company's motion to dismiss while the government reviews the amended complaint. The Court granted the motion and vacated the briefing dates. Plaintiff then filed an amended complaint under seal. The Company will vigorously defend the lawsuit.
In addition, the Company has received various other subpoenas since 2007 related to Medicaid billing. In October 2009, the Company received a subpoena from the State of Michigan Department of Attorney General seeking documents related to its billing to Michigan Medicaid. The Company cooperated with this request. In October 2013, the Company received a civil investigative demand from the State of Texas Office of the Attorney General requesting documents related to its billing to Texas Medicaid. The Company is cooperating with this request.
F-33
LABORATORY CORPORATION OF AMERICA HOLDINGS AND SUBSIDIARIES
NOTES TO CONSOLIDATED FINANCIAL STATEMENTS
(Dollars and shares in millions, except per share data)
On May 2, 2013, the Company was served with a False Claims Act lawsuit,
State of Georgia ex rel. Hunter Laboratories, LLC
and
Chris Riedel v. Quest Diagnostics Incorporated, et al.
, filed in the State Court of Fulton County, Georgia. The lawsuit, filed by a competitor laboratory, alleges that the Company overcharged Georgia's Medicaid program. The State of Georgia filed a Notice of Declination on August 13, 2012, before the Company was served with the Complaint. The case was removed to the United States District Court for the Northern District of Georgia. The lawsuit seeks actual and treble damages and civil penalties for each alleged false claim, as well as recovery of costs, attorney's fees, and legal expenses. On March 14, 2014, the Company's Motion to Dismiss was granted. The Plaintiffs repled their complaint, and the Company filed a Motion to Dismiss the First Amended Complaint. In May 2015, the Court dismissed the Plaintiffs' anti-kickback claim and remanded the remaining state law claims to the State Court of Fulton County. In July 2015, the Company filed a Motion to Dismiss these remaining claims. The Plaintiffs filed an opposition to the Company's Motion to Dismiss in August 2015. Also, the State of Georgia filed a brief as amicus curiae. The Company will vigorously defend the lawsuit.
On August 24, 2012, the Company was served with a putative class action lawsuit,
Sandusky Wellness Center, LLC, et al. v. MEDTOX Scientific, Inc., et al.
, filed in the United States District Court for the District of Minnesota. The lawsuit alleges that on or about February 21, 2012, the defendants violated the U.S. Telephone Consumer Protection Act (TCPA) by sending unsolicited facsimiles to Plaintiff and more than
39
other recipients without the recipients' prior express invitation or permission. The lawsuit seeks the greater of actual damages or the sum of
$0.0005
for each violation, subject to trebling under the TCPA, and injunctive relief. In September of 2014, Plaintiff’s Motion for Class Certification was denied. In January of 2015, the Company’s Motion for Summary Judgment on the remaining individual claim was granted. Plaintiff filed a notice of appeal. On May 3, 2016, the United States Court of Appeals for the Eighth Circuit issued its decision and order reversing the District Court’s denial of class certification. The Eighth Circuit remanded the matter for further proceedings. On December 7, 2016, the District Court granted the Plaintiff’s renewed Motion for Class Certification. The Company will vigorously defend the lawsuit.
On August 31, 2015, the Company was served with a putative class action lawsuit,
Patty Davis v. Laboratory Corporation of America, et al.,
filed in the Circuit Court of the Thirteenth Judicial Circuit for Hillsborough County, Florida. The complaint alleges that the Company violated the Florida Consumer Collection Practices Act by billing patients who were collecting benefits under the Workers’ Compensation Statutes. The lawsuit seeks injunctive relief and actual and statutory damages, as well as recovery of attorney's fees and legal expenses. In April 2017, the Circuit Court granted the Company's Motion for Judgment on the Pleadings. The Plaintiff has appealed the Circuit Court's ruling to the Florida Second District Court of Appeal. The Company will vigorously defend the lawsuit.
In December 2014, the Company received a Civil Investigative Demand issued pursuant to the U.S. False Claims Act from the U.S. Attorney’s Office for South Carolina, which requests information regarding remuneration and services provided by the Company to physicians who also received draw and processing/handling fees from competitor laboratories Health Diagnostic Laboratory, Inc. and Singulex, Inc. The Company is cooperating with the request.
On August 3, 2016, Covance Inc. was served with a putative class action lawsuit,
Daniel L. Bloomquist v. Covance Inc., et al.
, filed in the Superior Court of California, County of San Diego. The complaint alleges that Covance violated the California Labor Code and California Business & Professions Code by failing to provide overtime wages, failing to provide meal and rest periods, failing to pay for all hours worked, failing to pay for all wages owed upon termination, and failing to provide accurate itemized wage statements to Clinical Research Associates and Senior Clinical Research Associates employed by Covance, Inc. in California. The lawsuit seeks monetary damages, civil penalties, injunctive relief, and recovery of attorney's fees and costs. On October 13, 2016, the case was removed to the United States District Court for the Southern District of California. The Company will vigorously defend the lawsuit.
Prior to the Company’s acquisition of Sequenom, between August 15, 2016, and August 24, 2016, six putative class-action lawsuits were filed on behalf of purported Sequenom stockholders (captioned
Malkoff v. Sequenom, Inc., et al.
, No. 16-cv-02054-JAH-BLM,
Gupta v. Sequenom, Inc., et al.
, No. 16-cv-02084-JAH-KSC,
Fruchter v. Sequenom, Inc., et al.
, No. 16-cv-02101-WQH-KSC,
Asiatrade Development Ltd. v. Sequenom, Inc., et al.
, No. 16-cv-02113-AJB-JMA,
Nunes v. Sequenom, Inc., et al.
, No. 16-cv-02128-AJB-MDD, and
Cusumano v. Sequenom, Inc., et al.
, No. 16-cv-02134-LAB-JMA) in the United States District Court for the Southern District of California challenging the acquisition transaction. The complaints asserted claims against Sequenom and members of its Board of Directors (the Individual Defendants). The
Nunes
action also named the Company and Savoy Acquisition Corp. (Savoy), a wholly owned subsidiary of the Company, as defendants. The complaints alleged that the defendants violated Sections 14(e), 14(d)(4) and 20 of the Securities Exchange Act of 1934 by failing to disclose certain allegedly material information. In addition, the complaints in the
Malkoff
action,
Asiatrade
action, and the
Cusumano
action alleged that the Individual Defendants breached their fiduciary duties to Sequenom shareholders. The actions sought, among other things, injunctive relief enjoining the merger. On August 30, 2016, the parties entered into a Memorandum of Understanding (MOU) in each of the above-referenced actions. In connection with the settlement, Sequenom agreed to make certain additional disclosures to its stockholders. On September 6, 2016, the Court entered an order consolidating for all pre-trial purposes the six individual
F-34
LABORATORY CORPORATION OF AMERICA HOLDINGS AND SUBSIDIARIES
NOTES TO CONSOLIDATED FINANCIAL STATEMENTS
(Dollars and shares in millions, except per share data)
actions described above under the caption
In re Sequenom, Inc. Shareholder Litig.
, Lead Case No. 16-cv-02054-JAH-BLM, and designating the complaint from the
Malkoff
action as the operative complaint for the consolidated action. On November 11, 2016, two competing motions were filed by two separate stockholders (James Reilly and Shikha Gupta) seeking appointment as lead plaintiff under the terms of the Private Securities Litigation Reform Act of 1995. On June 7, 2017, the Court entered an order declaring Mr. Reilly as the lead plaintiff and approving Mr. Reilly's selection of lead counsel The Company is awaiting the Court’s appointment of a permanent lead plaintiff. The Company is awaiting the Court's appointment of a permanent lead plaintiff. The parties agree that the MOU has been terminated. The Plaintiffs filed a Consolidated Amended Class Action Complaint on July 24, 2017, and the Defendants filed a Motion to Dismiss, which remains pending. The Company will vigorously defend the lawsuit.
On February 7, 2017, Sequenom received a subpoena from the U.S. Securities and Exchange Commission (SEC) relating to an SEC investigation into the trading activity of Sequenom shares in connection with the Company’s July 2016 announcement regarding the Sequenom merger. On March 7, 2017, the Company received a similar subpoena. The Company is cooperating with these requests.
On March 10, 2017, the Company was served with a putative class action lawsuit,
Victoria Bouffard, et al. v. Laboratory Corporation of America Holdings
, filed in the United States District Court for the Middle District of North Carolina. The complaint alleges that the Company’s patient list prices unlawfully exceed the rates negotiated for the same services with private and public health insurers in violation of various state consumer protection laws. The lawsuit also alleges breach of implied contract or quasi-contract, unjust enrichment, and fraud. The lawsuit seeks statutory, exemplary, and punitive damages, injunctive relief, and recovery of attorney's fees and costs. In May 2017, the Company filed a Motion to Dismiss Plaintiffs’ Complaint and Strike Class Allegations; this motion is currently pending. On October 10, 2017, a second putative class action lawsuit,
Sheryl Anderson, et al. v. Laboratory Corporation of America Holdings
, was filed in the United States District Court for the Middle District of North Carolina. The complaint contains similar allegations and seeks similar relief to the Bouffard complaint, and adds additional counts regarding state consumer protection laws. The Company will vigorously defend the lawsuits.
On May 24, 2017, a putative class action lawsuit,
Maria T. Gonzalez, et al. v. Examination Management Services, Inc. and Laboratory Corporation of America Holdings
, was filed against the Company in the United States District Court for the Southern District of California. The complaint alleges that the Company misclassified phlebotomists as independent contractors through an arrangement with the co-Defendant temporary staffing agency. The complaint further alleges that the Company violated the California Labor Code and California Business and Professions Code by failing to pay minimum wage, failing to pay for all hours worked, failing to pay for all wages owed upon termination, and failing to provide accurate itemized wage statements. The lawsuit seeks monetary damages, civil penalties, injunctive relief, and recovery of attorney's fees and costs. The Company will vigorously defend the lawsuit.
On August 3, 2017, a putative class action lawsuit,
John Sealock, et al. v. Covance Market Access Services, Inc.
, was filed in the United States District Court for the Southern District of New York. The complaint alleges that Covance Market Access Services, Inc. violated the Fair Labor Standards Act and New York labor laws by failing to provide overtime wages, failing to pay for all hours worked, and failing to provide accurate wage statements. The lawsuit seeks monetary damages, civil penalties, injunctive relief, and recovery of attorney’s fees and costs. In November 2017, the Company filed a Motion to Strike Class Allegations. In December 2017, the Plaintiff filed a Motion for Conditional Certification of a Collective Action. The parties’ motions remain pending. The Company will vigorously defend the lawsuit.
On November 6, 2017, Covance was served with two False Claims Act lawsuits, Health Choice Alliance, LLC on behalf of the
United States of America, et al. v. Eli Lilly and Company, Inc. et al.
, and Health Choice Advocates, LLC, on behalf of the
United States of America v. Gilead Sciences, Inc., et al.
, both filed in the United States District Court for the Eastern District of Texas. The complaints allege under the Federal False Claims Act and various state analogues that Covance and the co-defendants unlawfully provided in-kind remuneration to medical providers in the form of reimbursement support services in order to induce providers to prescribe certain drugs. Neither the U.S. government nor any state government intervened in the lawsuits. The lawsuit seeks actual and treble damages and civil penalties for each alleged false claim, as well as recovery of costs. The Company will vigorously defend the lawsuits.
Under the Company's present insurance programs, coverage is obtained for catastrophic exposure as well as those risks required to be insured by law or contract. The Company is responsible for the uninsured portion of losses related primarily to general, professional and vehicle liability, certain medical costs and workers' compensation. The self-insured retentions are on a per-occurrence basis without any aggregate annual limit. Provisions for losses expected under these programs are recorded based upon the Company's estimates of the aggregated liability of claims incurred. At
December 31, 2017
, the Company had provided letters of credit aggregating approximately
$72.2
, primarily in connection with certain insurance programs. The Company’s availability under its Revolving Credit Facility is reduced by the amount of these letters of credit.
F-35
LABORATORY CORPORATION OF AMERICA HOLDINGS AND SUBSIDIARIES
NOTES TO CONSOLIDATED FINANCIAL STATEMENTS
(Dollars and shares in millions, except per share data)
The Company leases various facilities and equipment under non-cancelable lease arrangements. Future minimum rental commitments for leases with non-cancelable terms of one year or more at
December 31, 2017
are as follows:
|
|
Operating
|
||
|
2018
|
$
|
196.1
|
|
|
2019
|
149.0
|
|
|
|
2020
|
109.7
|
|
|
|
2021
|
83.5
|
|
|
|
2022
|
64.2
|
|
|
|
Thereafter
|
160.9
|
|
|
|
Total minimum lease payments
|
763.4
|
|
|
|
Less:
|
|
|
|
|
Amounts included in restructuring and acquisition related accruals
|
(17.6
|
)
|
|
|
Non-cancelable sub-lease income
|
—
|
|
|
|
Total minimum operating lease payments
|
$
|
745.8
|
|
Rental expense, which includes rent for real estate, equipment and automobiles under operating leases, amounted to
$313.8
,
$291.2
and
$287.1
for the years ended
December 31, 2017
,
2016
and
2015
, respectively.
16. PENSION AND POSTRETIREMENT PLANS
Pension Plans
The Company has a defined-benefit retirement plan (Company Plan) and a nonqualified supplemental retirement plan (PEP). Both plans have been closed to new participants since December 31, 2009. Employees participating in the Company Plan and the PEP no longer earn service-based credits, but continue to earn interest credits. In addition, effective January 1, 2010, all employees eligible for the defined-contribution retirement plan (401K Plan) receive a minimum
3%
non-elective contribution (NEC) concurrent with each payroll period. Employees are not required to make a contribution to the 401K Plan to receive the NEC. The NEC is non-forfeitable and vests immediately. The 401K Plan also permits discretionary contributions by the Company of up to
1%
and up to
3%
of pay for eligible employees based on service.
The Company’s 401K Plan covers substantially all pre-Covance acquisition employees. Prior to 2010, Company contributions to the plan were based on a percentage of employee contributions. From 2011, the Company made non-elective and discretionary contributions to the plan. In 2017, 2016, and 2015, non-elective and discretionary contributions were
$58.1
,
$56.0
and
$43.3
, respectively. As a result of the Covance acquisition, the Company also incurred expense of
$37.8
for the Covance 401K Plan during the year ended December 31, 2015. Under the Covance 401K Plan, which is available on a voluntary basis to substantially all U.S. Covance employees, the Company matches employee contributions up to a maximum Company contribution of
4.5%
.
The Company Plan covers substantially all employees employed prior to December 31, 2009. The benefits to be paid under the Company Plan are based on years of credited service through December 31, 2009, interest credits and average compensation. The Company’s policy is to fund the Company Plan with at least the minimum amount required by applicable regulations. The Company made contributions to the Company Plan of
$16.0
,
$10.8
and
$9.5
in
2017
,
2016
and
2015
, respectively.
The PEP covers a portion of the Company’s senior management group. Prior to 2010, the PEP provided for the payment of the difference, if any, between the amount of any maximum limitation on annual benefit payments under the Employee Retirement Income Security Act of 1974 and the annual benefit that would be payable under the Company Plan but for such limitation. Effective January 1, 2010, employees participating in the PEP no longer earn service-based credits. The PEP is an unfunded plan.
Projected pension expense for the Company Plan and the PEP is expected to
increase to
$13.3
in
2018
. This amount excludes any accelerated recognition of pension cost due to the total lump-sum payouts exceeding certain components of net periodic pension cost in a fiscal year. If such levels were to be met in
2018
, the Company projects that it would result in additional pension expense of several million dollars. The actual amount would be determined in the fiscal quarter when the lump-sum payments cross the threshold and would be based upon the plan's funded status and actuarial assumptions in effect at that time.
The Company plans to make contributions of $
7.6
to the Company Plan and the PEP during
2018
.
The effect on operations for both the Company Plan and the PEP are summarized as follows:
F-36
LABORATORY CORPORATION OF AMERICA HOLDINGS AND SUBSIDIARIES
NOTES TO CONSOLIDATED FINANCIAL STATEMENTS
(Dollars and shares in millions, except per share data)
|
|
Year ended December 31,
|
||||||||||
|
|
2017
|
2016
|
2015
|
||||||||
|
Service cost for benefits earned
|
$
|
5.5
|
|
$
|
4.9
|
|
$
|
3.9
|
|
||
|
Interest cost on benefit obligation
|
14.4
|
|
15.5
|
|
15.1
|
|
|||||
|
Expected return on plan assets
|
(16.3
|
)
|
(16.7
|
)
|
(18.3
|
)
|
|||||
|
Net amortization and deferral
|
11.0
|
|
11.2
|
|
11.3
|
|
|||||
|
Defined-benefit plan costs
|
$
|
14.6
|
|
$
|
14.9
|
|
$
|
12.0
|
|
||
Amounts included in accumulated other comprehensive earnings consist of unamortized net loss of
$127.4
. The accumulated other comprehensive earnings that are expected to be recognized as components of the defined-benefit plan costs during
2018
are
$10.9
related to amortization of the net loss.
A summary of the changes in the projected benefit obligations of the Company Plan and the PEP are summarized as follows:
|
|
2017
|
2016
|
|||||
|
Balance at January 1
|
$
|
366.5
|
|
$
|
363.1
|
|
|
|
Service cost
|
5.5
|
|
4.9
|
|
|||
|
Interest cost
|
14.4
|
|
15.5
|
|
|||
|
Actuarial loss
|
12.2
|
|
12.1
|
|
|||
|
Benefits and administrative expenses paid
|
(30.6
|
)
|
(29.1
|
)
|
|||
|
Balance at December 31
|
$
|
368.0
|
|
$
|
366.5
|
|
|
The Accumulated Benefit Obligation was
$368.0
and
$366.5
at
December 31, 2017
and
2016
, respectively.
A summary of the changes in the fair value of plan assets follows:
|
|
2017
|
2016
|
|||||
|
Fair value of plan assets at beginning of year
|
$
|
247.5
|
|
$
|
250.6
|
|
|
|
Actual return on plan assets
|
29.2
|
|
13.6
|
|
|||
|
Employer contributions
|
17.6
|
|
12.4
|
|
|||
|
Benefits and administrative expenses paid
|
(30.6
|
)
|
(29.1
|
)
|
|||
|
Fair value of plan assets at end of year
|
$
|
263.7
|
|
$
|
247.5
|
|
|
The net funded status of the Company Plan and the PEP at December 31:
|
2017
|
2016
|
||||||
|
Funded status
|
$
|
104.3
|
|
$
|
119.0
|
|
|
|
Recorded as:
|
|||||||
|
Accrued expenses and other
|
$
|
2.2
|
|
$
|
2.0
|
|
|
|
Other liabilities
|
102.1
|
|
117.0
|
|
|||
|
$
|
104.3
|
|
$
|
119.0
|
|
||
Weighted average assumptions used in the accounting for the Company Plan and the PEP are summarized as follows:
|
|
2017
|
2016
|
2015
|
|||||
|
Discount rate
|
3.7
|
%
|
4.2
|
%
|
4.0
|
%
|
||
|
Expected long term rate of return
|
6.8
|
%
|
6.8
|
%
|
7.0
|
%
|
||
The Company also updated the mortality assumption to the RP-2014 Mortality Tables in 2016 and again in 2017 which decreased the Company's total projected obligation.
The Company maintains an investment policy for the management of the Company Plan’s assets. The objective of this policy is to build a portfolio designed to achieve a balance between investment return and asset protection by investing in indexed funds that are comprised of equities of high quality companies and in high quality fixed income securities which are broadly balanced and represent all market sectors. The target allocations for plan assets are
50%
equity securities,
45%
fixed income securities and
5%
in other assets. Equity securities primarily include investments in large-cap, mid-cap and small-cap companies located in the U.S. and to a lesser extent international equities in developed and emerging countries. Fixed income securities primarily include U.S. Treasury securities, mortgage-backed bonds and corporate bonds of companies from diversified industries. Other assets include investments in commodities. The weighted average expected long-term rate of return for the Company Plan’s assets is as follows:
F-37
LABORATORY CORPORATION OF AMERICA HOLDINGS AND SUBSIDIARIES
NOTES TO CONSOLIDATED FINANCIAL STATEMENTS
(Dollars and shares in millions, except per share data)
|
Target
Allocation |
Weighted Average
Expected Long-Term
Rate of Return
|
||||
|
Equity securities
|
50.0
|
%
|
5.6
|
%
|
|
|
Fixed income securities
|
45.0
|
%
|
1.1
|
%
|
|
|
Other assets
|
5.0
|
%
|
0.1
|
%
|
|
The fair values of the Company Plan’s assets at
December 31, 2017
, and
2016
, by asset category are as follows:
|
Fair Value Measurements as of
|
|||||||||||||||
|
December 31, 2017
|
|||||||||||||||
|
Fair Value as of December 31, 2017
|
Using Fair Value Hierarchy
|
||||||||||||||
|
Asset Category
|
Level 1
|
Level 2
|
Level 3
|
||||||||||||
|
Cash
|
$
|
7.4
|
|
$
|
7.4
|
|
$
|
—
|
|
$
|
—
|
|
|||
|
Equity securities:
|
|
|
|
|
|
|
|
|
|||||||
|
U.S. large cap - blend (a)
|
59.9
|
|
—
|
|
59.9
|
|
—
|
|
|||||||
|
U.S. mid cap - blend (b)
|
23.6
|
|
—
|
|
23.6
|
|
—
|
|
|||||||
|
U.S. small cap - blend (c)
|
7.7
|
|
—
|
|
7.7
|
|
—
|
|
|||||||
|
International equity - blend (d)
|
39.1
|
|
—
|
|
39.1
|
|
—
|
|
|||||||
|
Real estate (e)
|
12.8
|
|
—
|
|
12.8
|
|
—
|
|
|||||||
|
Fixed income securities:
|
|
|
|
|
|
|
|
|
|||||||
|
U.S. fixed income (f)
|
107.0
|
|
—
|
|
107.0
|
|
—
|
|
|||||||
|
U.S inflation protection income (g)
|
6.2
|
|
—
|
|
6.2
|
|
—
|
|
|||||||
|
Total fair value of the Company Plan’s assets
|
$
|
263.7
|
|
$
|
7.4
|
|
$
|
256.3
|
|
$
|
—
|
|
|||
|
Fair Value Measurements as of
|
|||||||||||||||
|
December 31, 2016
|
|||||||||||||||
|
Fair Value as of December 31, 2016
|
Using Fair Value Hierarchy
|
||||||||||||||
|
Asset Category
|
Level 1
|
Level 2
|
Level 3
|
||||||||||||
|
Cash
|
$
|
6.8
|
|
$
|
6.8
|
|
$
|
—
|
|
$
|
—
|
|
|||
|
Equity securities:
|
|
|
|
|
|
|
|
|
|||||||
|
U.S. large cap - blend (a)
|
55.3
|
|
—
|
|
55.3
|
|
—
|
|
|||||||
|
U.S. mid cap - blend (b)
|
21.2
|
|
—
|
|
21.2
|
|
—
|
|
|||||||
|
U.S. small cap - blend (c)
|
7.4
|
|
—
|
|
7.4
|
|
—
|
|
|||||||
|
International equity - blend (d)
|
36.1
|
|
—
|
|
36.1
|
|
—
|
|
|||||||
|
Commodities index (h)
|
12.9
|
|
—
|
|
12.9
|
|
—
|
|
|||||||
|
Fixed income securities:
|
|
|
|
|
|
|
|
|
|||||||
|
U.S. fixed income (f)
|
101.8
|
|
—
|
|
101.8
|
|
—
|
|
|||||||
|
U.S inflation protection income (g)
|
6.0
|
|
—
|
|
6.0
|
|
—
|
|
|||||||
|
Total fair value of the Company Plan’s assets
|
$
|
247.5
|
|
$
|
6.8
|
|
$
|
240.7
|
|
$
|
—
|
|
|||
|
a)
|
This category represents an equity index fund not actively managed that tracks the S&P 500 Index.
|
|
b)
|
This category represents an equity index fund not actively managed that tracks the S&P mid-cap 400 Index.
|
|
c)
|
This category represents an equity index fund not actively managed that tracks the Russell 2000 Index.
|
|
d)
|
This category represents an equity index fund not actively managed that tracks the MSCI ACWI ex USA Index.
|
|
e)
|
This category represents a real estate index fund not actively managed that tracks the MSCI US REIT Index.
|
|
f)
|
This category primarily represents bond index funds not actively managed that track the Barclays Capital U.S. Aggregate Index as well as an actively managed strategy which utilizes the Barclays Capital U.S. Aggregate Bond Index as its primary prospectus benchmark.
|
|
g)
|
This category primarily represents a bond index fund not actively managed that tracks the Barclays Capital U.S. TIPS Index.
|
|
h)
|
This category represents a commodities index fund not actively managed that tracks the Dow Jones - UBS Commodity Index.
|
The following assumed benefit payments under the Company Plan and PEP, which were used in the calculation of projected benefit obligations, are expected to be paid as follows:
F-38
LABORATORY CORPORATION OF AMERICA HOLDINGS AND SUBSIDIARIES
NOTES TO CONSOLIDATED FINANCIAL STATEMENTS
(Dollars and shares in millions, except per share data)
|
2018
|
$
|
27.2
|
|
|
2019
|
26.6
|
|
|
|
2020
|
26.2
|
|
|
|
2021
|
25.5
|
|
|
|
2022
|
25.4
|
|
|
|
Years 2023 and thereafter
|
118.2
|
|
|
In addition to the PEP, as a result of the Covance acquisition, the Company also has a frozen non-qualified Supplemental Executive Retirement Plan (SERP). The SERP, which is not funded, is intended to provide retirement benefits for certain employees who were executive officers of Covance prior to the acquisition. Benefit amounts are based upon years of service and compensation of the participating employees. The pension benefit obligation as of the Covance acquisition date was
$32.8
. The components of the net periodic pension cost for the years ended
December 31, 2017
, and
December 31, 2016
, are as follows:
|
Year Ended December 31, 2017
|
Year Ended December 31, 2016
|
||||||
|
Service cost
|
$
|
—
|
|
$
|
—
|
|
|
|
Interest cost
|
0.2
|
|
0.8
|
|
|||
|
Settlement gain
|
(0.3
|
)
|
—
|
|
|||
|
Net periodic pension cost
|
$
|
(0.1
|
)
|
$
|
0.8
|
|
|
|
Assumptions used to determine defined-benefit plan cost
|
|||||||
|
Discount rate
|
4.2
|
%
|
3.8
|
%
|
|||
|
Expected return on assets
|
N/A
|
|
N/A
|
|
|||
The change in the projected benefit obligation, the funded status of the plan and a reconciliation of such funded status to the amounts reported in the consolidated balance sheet as of
December 31, 2017
, and
December 31, 2016
, is as follows:
|
2017
|
2016
|
||||||
|
Balance at beginning of year
|
$
|
7.5
|
|
$
|
30.9
|
|
|
|
Service cost
|
—
|
|
—
|
|
|||
|
Interest cost
|
0.2
|
|
0.8
|
|
|||
|
Actuarial loss/(gain)
|
0.3
|
|
(0.8
|
)
|
|||
|
Gross benefits paid
|
(3.7
|
)
|
(25.0
|
)
|
|||
|
Termination benefits
|
—
|
|
1.6
|
|
|||
|
Balance at end of year
|
$
|
4.3
|
|
$
|
7.5
|
|
|
|
2017
|
2016
|
||||||
|
Funded status
|
$
|
4.3
|
|
$
|
7.5
|
|
|
|
Recorded as:
|
|||||||
|
Accrued expenses and other
|
$
|
0.9
|
|
$
|
3.7
|
|
|
|
Other liabilities
|
3.4
|
|
3.8
|
|
|||
|
$
|
4.3
|
|
$
|
7.5
|
|
||
The accumulated benefit obligation was
$4.3
and
$7.5
as of
December 31, 2017
, and
December 31, 2016
, respectively.
The following assumed benefit payments under the SERP, which were used in the calculation of projected benefit obligations, are expected to be paid as follows:
|
2018
|
$
|
0.9
|
|
|
2019
|
0.1
|
|
|
|
2020
|
0.1
|
|
|
|
2021
|
0.1
|
|
|
|
2022
|
0.1
|
|
|
|
Year 2023 and thereafter
|
0.9
|
|
|
As a result of the Covance acquisiton, the Company sponsors two defined-benefit pension plans for the benefit of its employees at two U.K. subsidiaries (U.K. Plans) and one defined-benefit pension plan for the benefit of its employees at a German subsidiary (German Plan), all of which are legacy plans of previously acquired companies. Benefit amounts for all three plans are based upon years of service and compensation. The German Plan is unfunded while the U.K. Plans are funded. The Company’s funding policy has been to contribute annually amounts at least equal to the local statutory funding requirements.
F-39
LABORATORY CORPORATION OF AMERICA HOLDINGS AND SUBSIDIARIES
NOTES TO CONSOLIDATED FINANCIAL STATEMENTS
(Dollars and shares in millions, except per share data)
|
U.K. Plans
|
||||||||
|
Year Ended December 31, 2017
|
Year Ended December 31, 2016
|
|||||||
|
Service cost
|
$
|
5.1
|
|
$
|
4.4
|
|
||
|
Interest cost
|
7.6
|
|
8.4
|
|
||||
|
Expected return on plan assets
|
(11.5
|
)
|
(11.6
|
)
|
||||
|
Net amortization and deferral
|
0.7
|
|
—
|
|
||||
|
Expected participant contributions
|
(1.3
|
)
|
(1.5
|
)
|
||||
|
Defined-benefit plan costs
|
$
|
0.6
|
|
$
|
(0.3
|
)
|
||
|
Assumptions used to determine defined-benefit plan cost:
|
||||||||
|
Discount rate
|
2.7
|
%
|
3.8
|
%
|
||||
|
Expected return on assets
|
4.7
|
%
|
5.6
|
%
|
||||
|
Salary increases
|
3.8
|
%
|
3.6
|
%
|
||||
|
German Plan
|
||||||||
|
Year Ended December 31, 2017
|
Year Ended December 31, 2016
|
|||||||
|
Service cost
|
$
|
1.2
|
|
$
|
0.9
|
|
||
|
Interest cost
|
0.5
|
|
0.6
|
|
||||
|
Net amortization and deferral
|
—
|
|
(0.2
|
)
|
||||
|
Defined-benefit plan costs
|
$
|
1.7
|
|
$
|
1.3
|
|
||
|
Assumptions used to determine defined-benefit plan cost:
|
||||||||
|
Discount rate
|
1.7
|
%
|
2.5
|
%
|
||||
|
Expected return on assets
|
N/A
|
|
N/A
|
|
||||
|
Salary increases
|
2.0
|
%
|
2.0
|
%
|
||||
The weighted average expected long-term rate of return on assets of the U.K Plans is based on the target asset allocation and the average rate of growth expected for the asset classes invested. The rate of expected growth is derived from a combination of historic returns, current market indicators, the expected risk premium for each asset class over the risk-free rate, and the opinion of professional advisors.
The change in the projected benefit obligation and plan assets, the funded status of the plan and a reconciliation of such funded status to the amounts reported in the consolidated balance sheet as of
December 31, 2017
, and
December 31, 2016
, is as follows:
|
Change in Projected Benefit Obligation:
|
U.K. Plans
|
|||||||
|
2017
|
2016
|
|||||||
|
Balance at beginning of year
|
$
|
278.1
|
|
$
|
246.5
|
|
||
|
Service cost
|
5.1
|
|
4.4
|
|
||||
|
Interest cost
|
7.6
|
|
8.4
|
|
||||
|
Actuarial (gain) loss
|
(7.7
|
)
|
72.6
|
|
||||
|
Benefits paid
|
(6.1
|
)
|
(4.2
|
)
|
||||
|
Foreign currency exchange rate changes
|
26.4
|
|
(49.6
|
)
|
||||
|
Balance at end of year
|
$
|
303.4
|
|
$
|
278.1
|
|
||
|
Change in Projected Benefit Obligation:
|
German Plan
|
|||||||
|
2017
|
2016
|
|||||||
|
Balance at beginning of year
|
$
|
29.0
|
|
$
|
23.6
|
|
||
|
Service cost
|
1.2
|
|
0.9
|
|
||||
|
Interest cost
|
0.5
|
|
0.6
|
|
||||
|
Actuarial (gain) loss
|
1.0
|
|
5.3
|
|
||||
|
Benefits paid
|
(0.2
|
)
|
(0.2
|
)
|
||||
|
Foreign currency exchange rate changes
|
4.2
|
|
(1.2
|
)
|
||||
|
Balance at end of year
|
$
|
35.7
|
|
$
|
29.0
|
|
||
F-40
LABORATORY CORPORATION OF AMERICA HOLDINGS AND SUBSIDIARIES
NOTES TO CONSOLIDATED FINANCIAL STATEMENTS
(Dollars and shares in millions, except per share data)
|
Change in Fair Value of Assets:
|
U.K. Plans
|
|||||||
|
2017
|
2016
|
|||||||
|
Balance at beginning of year
|
$
|
233.2
|
|
$
|
226.2
|
|
||
|
Company contributions
|
6.3
|
|
6.8
|
|
||||
|
Participant contributions
|
1.3
|
|
1.5
|
|
||||
|
Actual return on assets
|
23.6
|
|
46.2
|
|
||||
|
Benefits paid
|
(6.1
|
)
|
(4.2
|
)
|
||||
|
Foreign currency exchange rate changes
|
23.6
|
|
(43.3
|
)
|
||||
|
Fair value of plan assets at end of year
|
$
|
281.9
|
|
$
|
233.2
|
|
||
|
U.K. Plans
|
||||||||
|
2017
|
2016
|
|||||||
|
Funded status
|
$
|
21.5
|
|
$
|
44.9
|
|
||
|
Recorded as:
|
||||||||
|
Other liabilities
|
21.5
|
|
44.9
|
|
||||
|
$
|
21.5
|
|
$
|
44.9
|
|
|||
|
German Plan
|
||||||||
|
2017
|
2016
|
|||||||
|
Funded status
|
$
|
35.7
|
|
$
|
29.0
|
|
||
|
Recorded as:
|
||||||||
|
Accrued expenses and other
|
$
|
0.3
|
|
$
|
0.2
|
|
||
|
Other liabilities
|
35.4
|
|
28.8
|
|
||||
|
$
|
35.7
|
|
$
|
29.0
|
|
|||
The Company contributed
$6.3
in
2017
to the U.K. Plans and expects to contribute
$6.6
in
2018
.
No
contributions were made to the German plan during
2017
, nor are any contributions expected to be made in
2018
, as the plan is unfunded.
The accumulated benefit obligation for the U.K. Plans and the German Plan was
$261.2
and
$31.5
at
December 31, 2017
, respectively. The accumulated benefit obligation for the U.K. Plans and the German Plan was
$235.8
and
$25.4
at
December 31, 2016
, respectively.
The amounts recognized in accumulated other comprehensive income for the year ended
December 31, 2017
, and
December 31, 2016
, is as follows:
|
U.K. Plans
|
||||||||
|
2017
|
2016
|
|||||||
|
Net actuarial loss
|
$
|
17.2
|
|
$
|
39.2
|
|
||
|
Less: Tax benefit (deferred tax asset)
|
(2.9
|
)
|
(6.7
|
)
|
||||
|
Accumulated other comprehensive income impact
|
$
|
14.3
|
|
$
|
32.5
|
|
||
|
Assumptions used to determine benefit obligations:
|
||||||||
|
Discount rate
|
2.5
|
%
|
2.7
|
%
|
||||
|
Salary increases
|
3.6
|
%
|
3.8
|
%
|
||||
|
German Plan
|
||||||||
|
2017
|
2016
|
|||||||
|
Net actuarial loss/(gain)
|
$
|
0.7
|
|
$
|
(0.4
|
)
|
||
|
Less: Tax expense (deferred tax liability)
|
(0.2
|
)
|
0.1
|
|
||||
|
Accumulated other comprehensive income impact
|
$
|
0.5
|
|
$
|
(0.3
|
)
|
||
|
Assumptions used to determine benefit obligations:
|
||||||||
|
Discount rate
|
1.7
|
%
|
1.7
|
%
|
||||
|
Salary increases
|
2.0
|
%
|
2.0
|
%
|
||||
There is
no
net actuarial loss for the U.K. Plans and German Plan, respectively required to be amortized from accumulated other comprehensive income into net periodic pension cost in
2018
.
The investment policies for the U.K. Plans are set by the plan trustees, based upon the guidance of professional advisors and after consultation with the Company, taking into consideration the plans’ liabilities and future funding levels. The trustees have
F-41
LABORATORY CORPORATION OF AMERICA HOLDINGS AND SUBSIDIARIES
NOTES TO CONSOLIDATED FINANCIAL STATEMENTS
(Dollars and shares in millions, except per share data)
set the long-term investment policy largely in accordance with the asset allocation of a broadly diversified investment portfolio. Assets are generally invested within the target ranges as follows:
|
Equity securities
|
60.0%
|
to
|
70.0%
|
|
|
Debt securities
|
10.0%
|
to
|
15.0%
|
|
|
Annuities
|
10.0%
|
to
|
20.0%
|
|
|
Real estate
|
—%
|
to
|
10.0%
|
|
|
Other
|
—%
|
to
|
5.0%
|
|
The weighted average asset allocation of the U.K. Plans as of
December 31, 2017
, by asset category is as follows:
|
December 31, 2017
|
||
|
Equity securities
|
66.0%
|
|
|
Debt securities
|
19.0%
|
|
|
Annuities
|
11.0%
|
|
|
Real estate
|
4.0%
|
|
Investments are made in pooled investment funds. Pooled investment fund managers are regulated by the Financial Conduct Authority in the U.K. and operate under terms which contain restrictions on the way in which the portfolios are managed and require the managers to ensure that suitable internal operating procedures are in place. The trustees have set performance objectives for each fund manager and routinely monitor and assess the managers’ performance against such objectives. Annuities represent annuity buy-in insurance policies purchased by the plan trustees from large, financially sound insurers. The cash flows from the annuities are intended to match the plan’s obligations to specific groups of participants, typically those participants currently receiving benefits.
The fair value of the Company’s U.K. Plans' assets as of
December 31, 2017
, and
December 31, 2016
, by asset category, are as follows:
|
Fair Value Measurements as of
|
|||||||||||||||
|
December 31, 2017
|
|||||||||||||||
|
December 31,
2017 |
Using Fair Value Hierarchy
|
||||||||||||||
|
Asset Category
|
Level 1
|
Level 2
|
Level 3
|
||||||||||||
|
Cash
|
$
|
0.8
|
|
$
|
0.8
|
|
$
|
—
|
|
$
|
—
|
|
|||
|
Mutual funds (a)
|
249.6
|
|
—
|
|
249.6
|
|
—
|
|
|||||||
|
Annuities (b)
|
31.5
|
|
—
|
|
—
|
|
31.5
|
|
|||||||
|
Total fair value of the Company Plan’s assets
|
$
|
281.9
|
|
$
|
0.8
|
|
$
|
249.6
|
|
$
|
31.5
|
|
|||
|
Fair Value Measurements as of
|
|||||||||||||||
|
December 31, 2016
|
|||||||||||||||
|
December 31,
2016 |
Using Fair Value Hierarchy
|
||||||||||||||
|
Asset Category
|
Level 1
|
Level 2
|
Level 3
|
||||||||||||
|
Cash
|
$
|
0.9
|
|
$
|
0.9
|
|
$
|
—
|
|
$
|
—
|
|
|||
|
Mutual funds (a)
|
202.5
|
|
—
|
|
202.5
|
|
—
|
|
|||||||
|
Annuities (b)
|
29.8
|
|
—
|
|
—
|
|
29.8
|
|
|||||||
|
Total fair value of the Company Plan’s assets
|
$
|
233.2
|
|
$
|
0.9
|
|
$
|
202.5
|
|
$
|
29.8
|
|
|||
|
a)
|
Mutual funds represent pooled investment vehicles offered by investment managers, which are generally comprised of investments in equities, bonds, property and cash. The plans’ trustees hold units in these funds, the value of which is determined by the number of units held multiplied by the unit price calculated by the investment managers. That unit price is derived based on the market value of the securities that comprise the fund, which are determined by quoted prices in active markets. No element of the valuation is based on inputs made by the plans’ trustees.
|
|
b)
|
Annuities represent annuity buy-in insurance policies, whereby the insurer pays the pension payments for the lifetime of the members covered. The annuities are assets of the plan and payments from the insurer are made to the plans’ trustees, who then use those proceeds to pay the pensioners. The cash flows from the annuities are intended to effectively match the payments to the pensioners covered by the policy. As such, these assets are valued actuarially based upon the value of the liabilities with which they are associated. As the valuation of these assets is judgmental, and there are no observable inputs associated with the valuation, these assets are classified as Level 3 in the fair value hierarchy.
|
F-42
LABORATORY CORPORATION OF AMERICA HOLDINGS AND SUBSIDIARIES
NOTES TO CONSOLIDATED FINANCIAL STATEMENTS
(Dollars and shares in millions, except per share data)
Expected future benefit payments are as follows:
|
U.K. Plans
|
German Plan
|
|||||||
|
2018
|
$
|
4.4
|
|
$
|
0.3
|
|
||
|
2019
|
5.3
|
|
0.4
|
|
||||
|
2020
|
5.5
|
|
0.6
|
|
||||
|
2021
|
6.0
|
|
0.6
|
|
||||
|
2022
|
7.4
|
|
0.7
|
|
||||
|
Years 2023 and thereafter
|
43.0
|
|
3.7
|
|
||||
Post-employment Retiree Health and Welfare Plan
As a result of the Covance acquisition, the Company sponsors a post-employment retiree health and welfare plan for the benefit of eligible employees at certain U.S. subsidiaries who retire after satisfying service and age requirements. This plan is funded on a pay-as-you-go basis and the cost of providing these benefits is shared with the retirees. The net periodic post-retirement benefit cost for the year ended
December 31, 2017
, and
December 31, 2016
, was
$(2.0)
and
($2.0)
, respectively, and the pension benefit obligation as of the Covance acquisition date was
$6.3
.
The components of net periodic post-retirement benefit cost for
2017
are as follows:
|
Year Ended December 31, 2017
|
Year Ended December 31, 2016
|
|||||
|
Interest cost
|
$
|
—
|
|
$
|
—
|
|
|
Actuarial gain
|
(0.1
|
)
|
(0.1
|
)
|
||
|
Prior service credit
|
(1.9
|
)
|
(1.9
|
)
|
||
|
Net periodic post-retirement benefit cost
|
$
|
(2.0
|
)
|
$
|
(2.0
|
)
|
|
Assumptions used to determine net periodic post-retirement benefit cost:
|
||||||
|
Discount rate
|
4.1
|
%
|
4.2
|
%
|
||
|
Healthcare cost trend rate
|
N/A
|
|
7.0
|
%
|
||
The change in the projected post-retirement benefit obligation, the funded status of the plan and the reconciliation of such funded status to the amounts reported in the consolidated balance sheets as of
December 31, 2017
, and
December 31, 2016
, is as follows:
|
2017
|
2016
|
|||||
|
Balance at beginning of year
|
$
|
0.8
|
|
$
|
5.2
|
|
|
Interest cost
|
—
|
|
—
|
|
||
|
Participant contributions
|
—
|
|
0.7
|
|
||
|
Actuarial (gain) loss
|
(0.1
|
)
|
0.1
|
|
||
|
Benefits paid
|
—
|
|
(1.3
|
)
|
||
|
Plan amendments
|
—
|
|
(3.9
|
)
|
||
|
Balance at end of year
|
$
|
0.7
|
|
$
|
0.8
|
|
|
2017
|
2016
|
|||||
|
Funded status
|
$
|
0.7
|
|
$
|
0.8
|
|
|
Recorded as:
|
||||||
|
Accrued expenses and other
|
$
|
0.1
|
|
$
|
0.1
|
|
|
Other liabilities
|
0.6
|
|
0.7
|
|
||
|
$
|
0.7
|
|
$
|
0.8
|
|
|
The amounts recognized in accumulated other comprehensive income as of
December 31, 2017
, are as follows:
|
Year Ended December 31, 2017
|
Year Ended December 31, 2016
|
|||||
|
Net actuarial gain
|
$
|
(0.7
|
)
|
$
|
(2.6
|
)
|
|
Less: Deferred tax benefit
|
0.3
|
|
0.9
|
|
||
|
Accumulated other comprehensive income impact
|
$
|
(0.4
|
)
|
$
|
(1.7
|
)
|
|
Assumptions used to determine benefit obligation:
|
||||
|
Discount rate
|
3.6
|
%
|
4.1
|
%
|
|
Healthcare cost trend rate
|
N/A
|
|
6.7
|
%
|
F-43
LABORATORY CORPORATION OF AMERICA HOLDINGS AND SUBSIDIARIES
NOTES TO CONSOLIDATED FINANCIAL STATEMENTS
(Dollars and shares in millions, except per share data)
A one percentage point (1.0%) increase or decrease in the assumed healthcare cost trend rate would not impact the net service and interest cost components of the net periodic post-retirement benefit cost or the post-retirement benefit obligation since future increases in plan costs are paid by participant contributions. The Company expects to contribute
$1.3
to the post-employment retiree health and welfare plan in
2018
.
Expected future gross benefit payments are as follows:
|
2018
|
$
|
0.1
|
|
|
2019
|
0.1
|
|
|
|
2020
|
0.1
|
|
|
|
2021
|
0.1
|
|
|
|
2022
|
0.1
|
|
|
|
2023 and thereafter
|
0.2
|
|
|
Post-retirement Medical Plan
The Company assumed obligations under a subsidiary's post-retirement medical plan. Coverage under this plan is restricted to a limited number of existing employees of the subsidiary. This plan is unfunded and the Company’s policy is to fund benefits as claims are incurred. The effect on operations of the post-retirement medical plan is shown in the following table:
|
|
Year ended December 31,
|
||||||||||
|
|
2017
|
2016
|
2015
|
||||||||
|
Service cost for benefits earned
|
$
|
—
|
|
$
|
—
|
|
$
|
0.1
|
|
||
|
Interest cost on benefit obligation
|
0.3
|
|
0.3
|
|
1.0
|
|
|||||
|
Net amortization and deferral
|
(6.7
|
)
|
(15.9
|
)
|
(10.4
|
)
|
|||||
|
Post-retirement medical plan costs
|
$
|
(6.4
|
)
|
$
|
(15.6
|
)
|
$
|
(9.3
|
)
|
||
Amounts included in accumulated other comprehensive earnings consist of unamortized net loss of
$2.3
. The accumulated other comprehensive earnings that are expected to be recognized as components of the post-retirement medical plan costs during
2018
are
$0.7
related to amortization of the net gain resulting from the shift of Medicare-eligible participants to private exchanges.
A summary of the changes in the accumulated post-retirement benefit obligation follows:
|
|
2017
|
2016
|
|||||
|
Balance at January 1
|
$
|
6.8
|
|
$
|
21.4
|
|
|
|
Service cost for benefits earned
|
—
|
|
—
|
|
|||
|
Interest cost on benefit obligation
|
0.3
|
|
0.3
|
|
|||
|
Actuarial loss
|
2.5
|
|
(0.2
|
)
|
|||
|
Benefits paid
|
(1.0
|
)
|
(1.3
|
)
|
|||
|
Plan amendment
|
—
|
|
(13.4
|
)
|
|||
|
Balance at December 31
|
$
|
8.6
|
|
$
|
6.8
|
|
|
|
Recorded as:
|
|||||||
|
Accrued expenses and other
|
$
|
1.2
|
|
$
|
1.0
|
|
|
|
Other liabilities
|
7.4
|
|
5.8
|
|
|||
|
$
|
8.6
|
|
$
|
6.8
|
|
||
The weighted-average discount rates used in the calculation of the accumulated post-retirement benefit obligation were
3.4%
and
3.8%
as of
December 31, 2017
, and
2016
, respectively. The healthcare cost trend rate was removed due to the expectation of future funding to be at the same level as the previous year's funding.
The following assumed benefit payments under the Company's post-retirement benefit plan, which reflect expected future service, as appropriate, and which were used in the calculation of projected benefit obligations, are expected to be paid as follows:
|
2018
|
$
|
1.3
|
|
|
2019
|
1.1
|
|
|
|
2020
|
1.0
|
|
|
|
2021
|
1.0
|
|
|
|
2022
|
0.9
|
|
|
|
Years 2023 and thereafter
|
2.8
|
|
|
F-44
LABORATORY CORPORATION OF AMERICA HOLDINGS AND SUBSIDIARIES
NOTES TO CONSOLIDATED FINANCIAL STATEMENTS
(Dollars and shares in millions, except per share data)
Deferred Compensation Plan
The Company has a Deferred Compensation Plan (DCP) under which certain of its executives may elect to defer up to
100.0%
of their annual cash incentive pay and/or up to
50.0%
of their annual base salary and/or eligible commissions subject to annual limits established by the U.S. government. The DCP provides executives a tax efficient strategy for retirement savings and capital accumulation without significant cost to the Company. The Company makes no contributions to the DCP. Amounts deferred by a participant are credited to a bookkeeping account maintained on behalf of each participant, which is used for measurement and determination of amounts to be paid to a participant, or his or her designated beneficiary, pursuant to the terms of the DCP. The amounts accrued under this plan were
$64.5
and
$54.2
at
December 31, 2017
, and
2016
, respectively. Deferred amounts are the Company's general unsecured obligations and are subject to claims by the Company's creditors. The Company's general assets may be used to fund obligations and pay DCP benefits.
17. FAIR VALUE MEASUREMENTS
The Company’s population of financial assets and liabilities subject to fair value measurements as of
December 31, 2017
, and
2016
were as follows:
|
Fair Value Measurements as of
|
|||||||||||||||
|
December 31, 2017
|
|||||||||||||||
|
Fair Value as of December 31, 2017
|
Using Fair Value Hierarchy
|
||||||||||||||
|
|
Level 1
|
Level 2
|
Level 3
|
||||||||||||
|
Noncontrolling interest put
|
$
|
16.7
|
|
$
|
—
|
|
$
|
16.7
|
|
$
|
—
|
|
|||
|
Interest rate swap
|
4.1
|
|
—
|
|
4.1
|
|
—
|
|
|||||||
|
Cash surrender value of life insurance policies
|
64.0
|
|
—
|
|
64.0
|
|
—
|
|
|||||||
|
Deferred compensation liability
|
64.5
|
|
—
|
|
64.5
|
|
—
|
|
|||||||
|
Contingent consideration
|
16.5
|
|
—
|
|
—
|
|
16.5
|
|
|||||||
|
Fair Value Measurements as of
|
|||||||||||||||
|
December 31, 2016
|
|||||||||||||||
|
Fair Value as of December 31, 2016
|
Using Fair Value Hierarchy
|
||||||||||||||
|
|
Level 1
|
Level 2
|
Level 3
|
||||||||||||
|
Noncontrolling interest put
|
$
|
15.2
|
|
$
|
—
|
|
$
|
15.2
|
|
$
|
—
|
|
|||
|
Interest rate swap
|
14.6
|
|
—
|
|
14.6
|
|
—
|
|
|||||||
|
Cash surrender value of life insurance policies
|
53.6
|
|
—
|
|
53.6
|
|
—
|
|
|||||||
|
Deferred compensation liability
|
54.2
|
|
—
|
|
54.2
|
|
—
|
|
|||||||
|
Contingent consideration
|
16.8
|
|
—
|
|
—
|
|
16.8
|
|
|||||||
The noncontrolling interest put is valued at its contractually determined value, which approximates fair value. During the year ended
December 31, 2017
, the carrying value of the noncontrolling interest put increased by
$1.0
consisting of a
$0.7
increase in the contractually determined value and a
$0.3
increase for foreign currency translation.
The Company offers certain employees the opportunity to participate in a DCP. A participant's deferrals are allocated by the participant to one or more of 16 measurement funds, which are indexed to externally managed funds. From time to time, to offset the cost of the growth in the participant's investment accounts, the Company purchases life insurance policies, with the Company named as beneficiary of the policies. Changes in the cash surrender value of the life insurance policies are based upon earnings and changes in the value of the underlying investments, which are typically invested in a similar manner to the participants' allocations. Changes in the fair value of the DCP obligation are derived using quoted prices in active markets based on the market price per unit multiplied by the number of units. The cash surrender value and the DCP obligations are classified within Level 2 because their inputs are derived principally from observable market data by correlation to the hypothetical investments.
Contingent accrued earn-out business acquisition consideration liabilities for which fair values are measured as Level 3 instruments. These contingent consideration liabilities were recorded at fair value on the acquisition date and are remeasured quarterly based on the then assessed fair value and adjusted if necessary. The increases or decreases in the fair value of contingent consideration payable can result from changes in anticipated revenue levels and changes in assumed discount periods and rates. As the fair value measure is based on significant inputs that are not observable in the market, they are categorized as Level 3.
The carrying amounts of cash and cash equivalents, accounts receivable, income taxes receivable, and accounts payable are considered to be representative of their respective fair values due to their short-term nature. The fair market value of the zero-coupon subordinated notes, based on market pricing, was approximately
$18.8
and
$79.3
as of
December 31, 2017
, and
2016
,
F-45
LABORATORY CORPORATION OF AMERICA HOLDINGS AND SUBSIDIARIES
NOTES TO CONSOLIDATED FINANCIAL STATEMENTS
(Dollars and shares in millions, except per share data)
respectively. The fair market value of the Senior Notes, based on market pricing, was approximately
$6,078.9
and
$5,254.5
as of
December 31, 2017
, and
2016
, respectively. The Company's note and debt instruments are considered Level 2 instruments, as the fair market values of these instruments are determined using other observable inputs.
18. DERIVATIVE INSTRUMENTS AND HEDGING ACTIVITIES
The Company addresses its exposure to market risks, principally the market risk associated with changes in interest rates, through a controlled program of risk management that includes, from time to time, the use of derivative financial instruments such as interest rate swap agreements (see Interest Rate Swap section below). Although the Company’s zero-coupon subordinated notes contain features that are considered to be embedded derivative instruments (see Embedded Derivative section below), the Company does not hold or issue derivative financial instruments for trading purposes. The Company does not believe that its exposure to market risk is material to the Company’s financial position or results of operations.
Interest Rate Swap
During the third quarter of 2013, the Company entered into two fixed-to-variable interest rate swap agreements for the
4.625%
Senior Notes due 2020 with an aggregate notional amount of
$600.0
and variable interest rates based on one-month LIBOR plus
2.298%
to hedge against changes in the fair value of a portion of the Company's long-term debt. These derivative financial instruments are accounted for as fair value hedges of the Senior Notes due 2020. These interest rate swaps are included in other long-term assets or liabilities, as applicable, and added to the value of the Senior Notes, with an aggregate fair value of
$4.1
at
December 31, 2017
. As the specific terms and notional amounts of the derivative financial instruments match those of the fixed-rate debt being hedged, the derivative instruments are assumed to be perfectly effective hedges and accordingly, there is no impact to the Company's consolidated statements of operations. Cash flows from the interest rate swaps are including in operating activities.
Embedded Derivatives Related to the Zero-Coupon Subordinated Notes
The Company’s zero-coupon subordinated notes contain the following two features that are considered to be embedded derivative instruments under authoritative guidance in connection with accounting for derivative instruments and hedging activities:
|
1)
|
The Company will pay contingent cash interest on the zero-coupon subordinated notes after September 11, 2006, if the average market price of the notes equals
120%
or more of the sum of the issue price, accrued original issue discount and contingent additional principal, if any, for a specified measurement period.
|
|
2)
|
Holders may surrender zero-coupon subordinated notes for conversion during any period in which the rating assigned to the zero-coupon subordinated notes by S&P’s Ratings Services is BB- or lower.
|
The Company believes these embedded derivatives had no fair value at
December 31, 2017
, and
2016
. These embedded derivatives also had no impact on the consolidated statements of operations for the years ended
December 31, 2017
,
2016
and
2015
.
Derivatives Instruments
The Company periodically enters into foreign currency forward contracts, which are recognized as assets or liabilities at their fair value. These contracts do not qualify for hedge accounting and the changes in fair value are recorded directly to earnings. The contracts are short-term in nature and the fair value of these contracts is based on market prices for comparable contracts. The fair value of these contracts is not significant as of
December 31, 2017
.
19. SUPPLEMENTAL CASH FLOW INFORMATION
|
Years Ended December 31,
|
|||||||||||
|
2017
|
2016
|
2015
|
|||||||||
|
Supplemental schedule of cash flow information:
|
|
|
|
||||||||
|
Cash paid during period for:
|
|
|
|
||||||||
|
Interest
|
$
|
239.1
|
|
$
|
210.7
|
|
$
|
166.1
|
|
||
|
Income taxes, net of refunds
|
348.0
|
|
345.7
|
|
237.6
|
|
|||||
|
Disclosure of non-cash financing and investing activities:
|
|
|
|
|
|
|
|||||
|
Surrender of restricted stock awards and performance shares
|
47.4
|
|
34.6
|
|
12.6
|
|
|||||
|
Conversion of zero-coupon convertible debt
|
35.0
|
|
39.1
|
|
1.1
|
|
|||||
|
Assets acquired under capital leases
|
7.3
|
|
16.0
|
|
22.6
|
|
|||||
|
Accrued property, plant and equipment
|
1.6
|
|
4.4
|
|
4.3
|
|
|||||
F-46
LABORATORY CORPORATION OF AMERICA HOLDINGS AND SUBSIDIARIES
NOTES TO CONSOLIDATED FINANCIAL STATEMENTS
(Dollars and shares in millions, except per share data)
20. BUSINESS SEGMENT INFORMATION
The following table is a summary of segment information for the years ended
December 31, 2017
,
2016
, and
2015
. The “management approach” has been used to present the following segment information. This approach is based upon the way the management of the Company organizes segments within an enterprise for making operating decisions and assessing performance. Financial information is reported on the basis that it is used internally by the chief operating decision maker (CODM) for evaluating segment performance and deciding how to allocate resources to segments. The Company’s chief executive officer has been identified as the CODM.
Segment asset information is not presented because it is not used by the CODM at the segment level. Operating earnings (loss) of each segment represents net revenues less directly identifiable expenses to arrive at operating income for the segment. General management and administrative corporate expenses are included in general corporate expenses below.
|
2017
|
2016
|
2015
|
||||||||||
|
Net Revenues:
|
||||||||||||
|
LCD
|
$
|
7,170.5
|
|
$
|
6,593.9
|
|
$
|
6,199.3
|
|
|||
|
CDD
|
3,037.2
|
|
2,844.1
|
|
2,306.4
|
|
||||||
|
Intercompany eliminations
|
(1.8
|
)
|
(0.8
|
)
|
—
|
|
||||||
|
Total net revenues
|
$
|
10,205.9
|
|
$
|
9,437.2
|
|
$
|
8,505.7
|
|
|||
|
Operating Earnings (Loss):
|
||||||||||||
|
LCD
|
$
|
1,298.6
|
|
$
|
1,187.6
|
|
$
|
1,053.7
|
|
|||
|
CDD
|
206.2
|
|
272.7
|
|
73.5
|
|
||||||
|
General corporate expenses
|
(140.6
|
)
|
(147.9
|
)
|
(130.4
|
)
|
||||||
|
Total operating income
|
1,364.2
|
|
1,312.4
|
|
996.8
|
|
||||||
|
Non-operating expenses, net
|
(229.3
|
)
|
(206.9
|
)
|
(270.8
|
)
|
||||||
|
Earnings before income taxes
|
1,134.9
|
|
1,105.5
|
|
726.0
|
|
||||||
|
Provision for income taxes
|
(139.1
|
)
|
372.3
|
|
287.3
|
|
||||||
|
Net earnings
|
1,274.0
|
|
733.2
|
|
438.7
|
|
||||||
|
Less: Net income attributable to noncontrolling interests
|
(5.8
|
)
|
(1.1
|
)
|
(1.1
|
)
|
||||||
|
Net income attributable to Laboratory Corporation of America Holdings
|
$
|
1,268.2
|
|
$
|
732.1
|
|
$
|
437.6
|
|
|||
|
2017
|
2016
|
2015
|
||||||||||
|
Depreciation and Amortization
|
||||||||||||
|
LCD
|
$
|
304.7
|
|
$
|
270.9
|
|
$
|
245.8
|
|
|||
|
CDD
|
217.4
|
|
219.5
|
|
184.4
|
|
||||||
|
General corporate
|
1.2
|
|
0.1
|
|
4.1
|
|
||||||
|
Total depreciation and amortization
|
$
|
523.3
|
|
$
|
490.5
|
|
$
|
434.3
|
|
|||
|
LCD
|
CDD
|
Intercompany Eliminations
|
Total
|
|||||||||||||
|
Geographic distribution of net revenues
|
||||||||||||||||
|
US
|
$
|
6,808.6
|
|
$
|
1,427.2
|
|
$
|
(1.8
|
)
|
$
|
8,234.0
|
|
||||
|
Canada
|
327.8
|
|
—
|
|
—
|
|
327.8
|
|
||||||||
|
United Kingdom
|
29.6
|
|
272.4
|
|
—
|
|
302.0
|
|
||||||||
|
Switzerland
|
—
|
|
484.4
|
|
—
|
|
484.4
|
|
||||||||
|
Other
|
4.5
|
|
853.2
|
|
—
|
|
857.7
|
|
||||||||
|
Total net revenues
|
$
|
7,170.5
|
|
$
|
3,037.2
|
|
$
|
(1.8
|
)
|
$
|
10,205.9
|
|
||||
|
LCD
|
CDD
|
Total
|
||||||||||
|
Geographic distribution of property, plant and equipment, net
|
||||||||||||
|
U.S.
|
$
|
826.2
|
|
$
|
590.6
|
|
$
|
1,416.8
|
|
|||
|
Canada
|
54.6
|
|
—
|
|
54.6
|
|
||||||
|
U.K.
|
2.1
|
|
120.7
|
|
122.8
|
|
||||||
|
Switzerland
|
—
|
|
81.4
|
|
81.4
|
|
||||||
|
Other
|
3.0
|
|
70.3
|
|
73.3
|
|
||||||
|
Total property, plant and equipment, net
|
$
|
885.9
|
|
$
|
863.0
|
|
$
|
1,748.9
|
|
|||
F-47
LABORATORY CORPORATION OF AMERICA HOLDINGS AND SUBSIDIARIES
NOTES TO CONSOLIDATED FINANCIAL STATEMENTS
(Dollars and shares in millions, except per share data)
21. QUARTERLY DATA (UNAUDITED)
The following is a summary of unaudited quarterly data:
|
Year Ended December 31, 2017
|
|||||||||||||||||||
|
1st
Quarter
|
2nd
Quarter
|
3rd
Quarter
|
4th
Quarter
(a)
|
Full
Year
|
|||||||||||||||
|
Net revenues
|
$
|
2,408.1
|
|
$
|
2,498.4
|
|
$
|
2,597.9
|
|
$
|
2,701.5
|
|
$
|
10,205.9
|
|
||||
|
Gross profit
|
803.6
|
|
861.8
|
|
882.8
|
|
915.8
|
|
3,464.0
|
|
|||||||||
|
Net earnings attributable to Laboratory Corporation of America Holdings
|
192.2
|
|
188.6
|
|
180.6
|
|
706.8
|
|
1,268.2
|
|
|||||||||
|
Basic earnings per common share
|
1.87
|
|
1.84
|
|
1.77
|
|
6.91
|
|
12.39
|
|
|||||||||
|
Diluted earnings per common share
|
1.84
|
|
1.82
|
|
1.74
|
|
6.81
|
|
12.21
|
|
|||||||||
(a)
Net earnings attributable to Laboratory Corporation of America Holdings in the fourth quarter of 2017 includes amounts recorded due to TCJA.
|
Year Ended December 31, 2016
|
|||||||||||||||||||
|
1st
Quarter
|
2nd
Quarter
|
3rd
Quarter
|
4th
Quarter
|
Full
Year
|
|||||||||||||||
|
Net revenues
|
$
|
2,295.2
|
|
$
|
2,382.0
|
|
$
|
2,372.7
|
|
$
|
2,387.3
|
|
$
|
9,437.2
|
|
||||
|
Gross profit
|
777.3
|
|
826.8
|
|
788.4
|
|
788.0
|
|
3,180.5
|
|
|||||||||
|
Net earnings attributable to Laboratory Corporation of America Holdings
|
164.1
|
|
204.1
|
|
179.5
|
|
184.4
|
|
732.1
|
|
|||||||||
|
Basic earnings per common share
|
1.61
|
|
2.00
|
|
1.74
|
|
1.79
|
|
7.14
|
|
|||||||||
|
Diluted earnings per common share
|
1.58
|
|
1.96
|
|
1.71
|
|
1.75
|
|
7.02
|
|
|||||||||
F-48
Schedule II
LABORATORY CORPORATION OF AMERICA HOLDINGS AND SUBSIDIARIES
VALUATION AND QUALIFYING ACCOUNTS AND RESERVES
Years Ended
December 31, 2017
,
2016
and
2015
(Dollars in millions)
|
Balance at
beginning
of year
|
Additions
Charged to Costs and Expense
|
(1)
Other (Deductions)Additions |
Balance
at end
of year
|
||||||||||||
|
Year ended December 31, 2017:
|
|
|
|
|
|
||||||||||
|
Applied against asset accounts:
|
|
|
|
|
|
||||||||||
|
Allowance for doubtful accounts
|
$
|
235.6
|
|
$
|
314.7
|
|
$
|
(289.4
|
)
|
$
|
260.9
|
|
|||
|
Valuation allowance-deferred tax assets
|
$
|
31.3
|
|
$
|
11.5
|
|
$
|
—
|
|
$
|
42.8
|
|
|||
|
Year ended December 31, 2016:
|
|
|
|
|
|
|
|
|
|||||||
|
Applied against asset accounts:
|
|
|
|
|
|
|
|
|
|||||||
|
Allowance for doubtful accounts
|
$
|
217.0
|
|
$
|
287.3
|
|
$
|
(268.7
|
)
|
$
|
235.6
|
|
|||
|
Valuation allowance-deferred tax assets
|
$
|
15.1
|
|
$
|
16.2
|
|
$
|
—
|
|
$
|
31.3
|
|
|||
|
Year ended December 31, 2015:
|
|
|
|
|
|
|
|
|
|||||||
|
Applied against asset accounts:
|
|
|
|
|
|
|
|
|
|||||||
|
Allowance for doubtful accounts
|
$
|
211.6
|
|
$
|
265.4
|
|
$
|
(260.0
|
)
|
$
|
217.0
|
|
|||
|
Valuation allowance-deferred tax assets
|
$
|
17.1
|
|
$
|
—
|
|
$
|
(2.0
|
)
|
$
|
15.1
|
|
|||
(1) Other (Deductions) Additions consists primarily of write-offs of accounts receivable amounts.
F-49
TABLE OF CONTENTS
Part I Financial InformationItem 1. Financial Information