LINCOLN EDUCATIONAL SERVICES CORP
10-Ks and 10-Qs
|
|
|
|
|
|
|
|
|
|
|
|
|
|
|
|
|
|
|
|
|
|
|
|
|
|
|
|
|
|
|
|
|
|
|
|
|
|
|
|
|
|
|
|
|
|
|
|
|
|
|
|
|
|
|
|
|
|
|
U.S. SECURITIES AND EXCHANGE COMMISSION
WASHINGTON, D.C. 20549
Form 10-K
| ☒ |
ANNUAL REPORT PURSUANT TO SECTION 13 OR 15(d) OF THE SECURITIES EXCHANGE ACT OF 1934
|
For the fiscal year ended December 31, 2017
Commission File Number 000-51371
LINCOLN EDUCATIONAL SERVICES CORPORATION
(Exact name of registrant as specified in its charter)
|
New Jersey
|
57-1150621
|
|
|
(State or other jurisdiction of incorporation or organization)
|
(IRS Employer Identification No.)
|
200 Executive Drive, Suite 340
West Orange, NJ 07052
(Address of principal executive offices)
(973) 736-9340
(Registrant’s telephone number, including area code)
Securities registered pursuant to Section 12(b) of the Act:
|
Title of each class
|
Name of exchange on which registered
|
|
|
Common Stock, no par value per share
|
The NASDAQ Stock Market LLC
|
Securities registered pursuant to Section 12(g) of the Act:
None
Indicate by check mark if the registrant is a well-known seasoned issuer, as defined in Rule 405 of the Securities Act. Yes ☐
No
☒
Indicate by check mark if the registrant is not required to file reports pursuant to Section 13 or Section 15(d) of the Act. Yes ☐
No
☒
Indicate by check mark whether the registrant (1) has filed all reports required to be filed by Section 13 or 15(d) of the Securities Exchange Act of 1934 during the preceding 12 months (or for such shorter period that the registrant was required to file such reports), and (2) has been subject to such filing requirements for the past 90 days. Yes
☒
No ☐
Indicate by check mark whether the registrant has submitted electronically and posted on its corporate Website, if any, every Interactive Data File required to be submitted and posted pursuant to Rule 405 of Regulation S-T
during the preceding 12 months (or for such shorter period that the registrant was required to submit and post such files). Yes
☒
No
☐
Indicate by check mark if disclosure of delinquent filers pursuant to Item 405 of Regulation S-K is not contained herein, and will not be contained, to the best of registrant’s knowledge, in definitive proxy or information statements incorporated by reference in Part III of this Form 10-K or any amendment to this Form 10-K.
☒
Indicate by check mark whether the registrant is a large accelerated filer, an accelerated filer, a non-accelerated filer, a smaller reporting company or emerging growth company. See the definitions of “large accelerated filer,” “accelerated filer,” “smaller reporting company” and “emerging growth company” in Rule 12b-2 of the Exchange Act.
|
Large accelerated filer ☐
|
Accelerated filer ☐
|
Non-accelerated filer ☐
|
Smaller reporting company
☒
|
|
Emerging growth company ☐
|
If an emerging growth company, indicate by check mark if the registrant has elected not to use the extended transition period for complying with any new or revised financial accounting standards provided pursuant to Section 13(a) of the Exchange Act. ☐
Indicate by check mark whether the registrant is a shell company (as defined in Rule 12b-2 of the Act). Yes ☐
No
☒
The aggregate market value of the 23,240,620 shares of common stock held by non-affiliates of the registrant issued and outstanding as of June 30, 2017, the last business day of the registrant’s most recently completed second fiscal quarter, was $72,045,922. This amount is based on the closing price of the common stock on the Nasdaq Global Select Market of $3.10 per share on June 30, 2017. Shares of common stock held by executive officers and directors and persons who own 5% or more of the outstanding common stock have been excluded since such persons may be deemed affiliates. This determination of affiliate status is not a determination for any other purpose.
The number of shares of the registrant’s common stock outstanding as of March 6, 2018 was 24,703,978.
Documents Incorporated by Reference
Portions of the Proxy Statement for the Registrant’s 2018 Annual Meeting of Stockholders are incorporated by reference in Part III of this Annual Report on Form 10-K. With the exception of those portions that are specifically incorporated by reference in this Annual Report on Form 10-K, such Proxy Statement shall not be deemed filed as part of this Report or incorporated by reference herein.
LINCOLN EDUCATIONAL SERVICES CORPORATION AND SUBSIDIARIES
FOR THE FISCAL YEAR ENDED DECEMBER 31, 2017
| PART I. |
1
|
||
|
ITEM 1.
|
1
|
||
|
ITEM 1A.
|
21
|
||
|
ITEM 1B.
|
29
|
||
|
ITEM 2.
|
30
|
||
|
ITEM 3.
|
31
|
||
|
ITEM 4.
|
31
|
||
| PART II. |
31
|
||
|
ITEM 5.
|
31
|
||
|
ITEM 6.
|
34
|
||
|
ITEM 7.
|
35
|
||
|
ITEM 7A.
|
53
|
||
|
ITEM 8
|
53
|
||
|
ITEM 9.
|
53
|
||
|
ITEM 9A.
|
53
|
||
|
ITEM 9B.
|
54
|
||
| PART III. |
54
|
||
|
ITEM 10.
|
54
|
||
|
ITEM 11.
|
54
|
||
|
ITEM 12.
|
54
|
||
|
ITEM 13.
|
54
|
||
|
ITEM 14.
|
54
|
||
| PART IV. |
55
|
||
|
ITEM 15.
|
55
|
||
Forward-Looking Statements
This Annual Report on Form 10-K contains “forward-looking statements,” within the meaning of Section 21E of the Securities Exchange Act of 1934, as amended, which include information relating to future events, future financial performance, strategies, expectations, competitive environment, regulation and availability of resources. These forward-looking statements include, without limitation, statements regarding: proposed new programs; expectations that regulatory developments or other matters will or will not have a material adverse effect on our consolidated financial position, results of operations or liquidity; statements concerning projections, predictions, expectations, estimates or forecasts as to our business, financial and operating results and future economic performance; and statements of management’s goals and objectives and other similar expressions concerning matters that are not historical facts. Words such as “may,” “should,” “could,” “would,” “predicts,” “potential,” “continue,” “expects,” “anticipates,” “future,” “intends,” “plans,” “believes,” “estimates,” and similar expressions, as well as statements in future tense, identify forward-looking statements.
Forward-looking statements should not be read as a guarantee of future performance or results, and will not necessarily be accurate indications of the times at, or by, which such performance or results will be achieved. Forward-looking statements are based on information available at the time those statements are made and/or management’s good faith belief as of that time with respect to future events, and are subject to risks and uncertainties that could cause actual performance or results to differ materially from those expressed in or suggested by the forward-looking statements. Important factors that could cause such differences include, but are not limited to:
| · |
our failure to comply with the extensive existing regulatory framework applicable to our industry or our failure to obtain timely regulatory approvals in connection with a change of control of our company or acquisitions;
|
| · |
the promulgation of new regulations in our industry as to which we may find compliance challenging;
|
| · |
our success in updating and expanding the content of existing programs and developing new programs in a cost-effective manner or on a timely basis;
|
| · |
our ability to implement our strategic plan;
|
| · |
risks associated with changes in applicable federal laws and regulations including pending rulemaking by the U.S. Department of Education;
|
| · |
uncertainties regarding our ability to comply with federal laws and regulations regarding the 90/10 rule and cohort default rates;
|
| · |
risks associated with maintaining accreditation
|
| · |
risks associated with opening new campuses and closing existing campuses;
|
| · |
risks associated with integration of acquired schools;
|
| · |
industry competition;
|
| · |
conditions and trends in our industry;
|
| · |
general economic conditions; and
|
| · |
other factors discussed under the headings “Business,” “Risk Factors” and “Management’s Discussion and Analysis of Financial Condition and Results of Operations.”
|
Forward-looking statements speak only as of the date the statements are made. Except as required under the federal securities laws and rules and regulations of the United States Securities and Exchange Commission (the “SEC”), we undertake no obligation to update or revise forward-looking statements to reflect actual results, changes in assumptions or changes in other factors affecting forward-looking information. We caution you not to unduly rely on the forward-looking statements when evaluating the information presented herein.
PART I.
OVERVIEW
Lincoln Educational Services Corporation and its subsidiaries (collectively, the “Company”, “we”, “our” and “us”, as applicable) provide diversified career-oriented post-secondary education to recent high school graduates and working adults. The Company, which currently operates 23 schools in 14 states,
offers programs in automotive technology, skilled trades (which include HVAC, welding and computerized numerical control and electronic systems technology, among other programs), healthcare services (which include nursing, dental assistant, medical administrative assistant and pharmacy technician, among other programs), hospitality services (which include culinary, therapeutic massage, cosmetology and aesthetics) and business and information technology (which includes information technology and criminal justice programs). The schools operate under Lincoln Technical Institute, Lincoln College of Technology, Lincoln College of New England, Lincoln Culinary Institute, and Euphoria Institute of Beauty Arts and Sciences and associated brand names. Most of the campuses serve major metropolitan markets and each typically offers courses in multiple areas of study. Five of the campuses are destination schools, which attract students from across the United States and, in some cases, from abroad. The Company’s other campuses primarily attract students from their local communities and surrounding areas. All of the campuses are nationally or regionally accredited and are eligible to participate in federal financial aid programs managed by the U.S. Department of Education (the “DOE”) and applicable state education agencies and accrediting commissions, which allow students to apply for and access federal student loans as well as other forms of financial aid.
The Company was incorporated in New Jersey in 2003 but a predecessor entity had opened its first campus in Newark, New Jersey in 1946.
Our business is organized into three reportable business segments: (a) Transportation and Skilled Trades, (b) Healthcare and Other Professions (“HOPS”), and (c) Transitional, which refers to businesses that have been or are currently being taught out. In November 2015, the Board of Directors of the Company approved a plan for the Company to divest the 18 campuses then comprising the HOPS segment due to a strategic shift in the Company’s business strategy. The Company underwent an exhaustive process to divest the HOPS schools which proved successful in attracting various purchasers but, ultimately, did not result in a transaction that our Board believed would enhance shareholder value. By the end of 2017, we had strategically closed seven underperforming campuses leaving a total of 11 campuses remaining under the HOPS segment. The Company believes that the closures of the aforementioned campuses have positioned the HOPS segment and the Company to be more profitable going forward as well as maximizing returns for the Company’s shareholders.
The combination of several factors, including the inability of a prospective buyer of the HOPS segment to close on the purchase, the improvements the Company has implemented in the HOPS segment operations, the closure of seven underperforming campuses and the change in the United States government administration, resulted in the Board reevaluating its divestiture plan and the determination that shareholder value would more likely be enhanced by continuing to operate our HOPS segment as revitalized. Consequently, in first quarter of 2017 the Board of Directors has abandoned the plan to divest the HOPS segment and the Company now intends to retain and continue to operate the remaining campuses in the HOPS segment. The results of operations of the campuses included in the HOPS segment are reflected as continuing operations in the consolidated financial statements.
In 2016, the Company completed the teach-out of its Hartford, Connecticut, Fern Park, Florida and Henderson (Green Valley), Nevada campuses, which originally operated in the HOPS segment. In 2017, the Company completed the teach-out of its Northeast Philadelphia, Pennsylvania; Center City Philadelphia, Pennsylvania; West Palm Beach, Florida; Brockton, Massachusetts; and Lowell, Massachusetts schools, which also were originally in our HOPS segment and all of which were
taught out and closed by December 2017 and are included in the Transitional segment as of December 31, 2017.
On August 14, 2017, New England Institute of Technology at Palm Beach, Inc., a wholly-owned subsidiary of the Company, consummated the sale of the real property located at 2400 and 2410 Metrocentre Boulevard East, West Palm Beach, Florida, including the improvements and other personal property located thereon (the “West Palm Beach Property”) to Tambone Companies, LLC (“Tambone”), pursuant to a previously disclosed purchase and sale agreement (the “West Palm Sale Agreement”) entered into on March 14, 2017. Pursuant to the terms of the West Palm Sale Agreement, as subsequently amended, the purchase price for the West Palm Beach Property was $15.8 million. As a result, the Company recorded a gain on the sale in the amount of $1.5 million. As previously disclosed, the West Palm Beach Property served as collateral for a short term loan in the principal amount of $8.0 million obtained by the Company from its lender, Sterling National Bank, on April 28, 2017, which loan matured upon the earlier of the sale of the West Palm Beach Property or October 1, 2017. Accordingly, on August 14, 2017, concurrently with the consummation of the sale of the West Palm Beach Property, the Company repaid the term loan in an aggregate amount of $8.0 million, consisting of principal and accrued interest.
On March 31, 2017, the Company entered into a
new revolving credit facility with
Sterling National Bank in the aggregate principal amount of up to $55 million, which consists of up to $50 million of revolving loans, including a $10 million sublimit for letters of credit, and an additional $5 million non-revolving loan. The proceeds of the $5 million non-revolving loan were held in a pledged account at Sterling National Bank as required by the terms of the new credit facility pending the completion of environmental studies undertaken at certain properties owned by the Company and mortgaged to Sterling National Bank. Upon the completion of environmental studies that revealed that no environmental issues existed at the properties, during the quarter ended June 30, 2017, the $5 million held in the pledged account at Sterling National Bank was released and used to repay the $5 million non-revolving loan. The credit facility was amended on November 29, 2017, to provide the Company with an additional $15 million revolving credit loan, resulting in an increase in the aggregate availability under the credit facility to $65 million. The credit facility was again amended on February 23, 2018,
to, among other things, effect certain modifications to the financial covenants and other provisions of the Credit Agreement and to allow the Company to pursue the sale of certain real property assets.
The new credit facility requires that revolving loans in excess of $25 million and all letters of credit issued thereunder be cash collateralized dollar for dollar. The new revolving credit facility replaced a term loan facility which was repaid and terminated concurrently with the effectiveness of the new revolving credit facility. The term of the new revolving credit facility is 38 months, maturing on May 31, 2020. The new revolving credit facility is discussed in further detail under the heading “Liquidity and Capital Resources” below and in Note 7 to the consolidated financial statements included in this report.
On December 22, 2017, the U.S. government enacted comprehensive tax legislation commonly referred to as the Tax Cuts and Jobs Act (the “Tax Act”). The Tax Act made broad and complex changes to the U.S. tax code which impacted 2017, including, but not limited to, reducing the U.S. federal corporate tax rate, repealing the corporate alternative minimum tax, changing how existing corporate alternative minimum tax credits can be realized either to offset regular tax liability or to be refunded, and eliminating or limiting deduction of several expenses which were previously deductible. See below for additional information regarding the impact of the Tax Act as well as Note 10 to our consolidated financial statements included in this Annual Report on Form 10-K.
As of December 31, 2017, we had 10,159 students enrolled at 23 campuses. Our average enrollment for the year ended December 31, 2017 was 10,772 students which represented a decrease of 9.2% from average enrollment in 2016. For the year ended December 31, 2017, our revenues were $261.9 million, which represented a decrease of 8.3 % from the prior year. For more information relating to our revenues, profits and financial condition, please refer to “Management’s Discussion and Analysis of Financial Condition and Results of Operations” and our consolidated financial statements included in this Annual Report on Form 10-K.
We believe that we provide our students with the highest quality career-oriented training available for our areas of study in our markets. We offer programs in areas of study that we believe are typically underserved by traditional providers of post-secondary education and for which we believe there exists significant demand among students and employers. Furthermore, we believe our convenient class scheduling, career-focused curricula and emphasis on job placement offer our students valuable advantages that have been neglected by the traditional academic sector. By combining substantial hands-on training with traditional classroom-based training led by experienced instructors, we believe we offer our students a unique opportunity to develop practical job skills in many of the key areas of expected job demand. We believe these job skills enable our students to compete effectively for employment opportunities and to pursue on-going salary and career advancement.
AVAILABLE INFORMATION
Our website is
www.lincolnedu.com
. We make available on this website our Annual Reports on Form 10-K, Quarterly Reports on Form 10-Q, Current Reports on Form 8-K, annual proxy statements on Schedule 14A and amendments to those reports and statements as soon as reasonably practicable after we electronically file or furnish such materials to the Securities and Exchange Commission (the “SEC”). You can access this information on our website, free of charge, by clicking on “Investor Relations.” The information contained on or connected to our website is not a part of this Annual Report on Form 10-K. We will provide paper copies of such filings free of charge upon request. The public may read and copy any materials filed by us with the SEC at the SEC's Public Reference Room at 100 F Street, NE, Washington, D.C. 20549. Information regarding the operation of the SEC's Public Reference Room is available by calling the SEC at 1-800-SEC-0330. In addition, the SEC maintains an Internet site that contains reports, proxy and information statements and other information regarding us, which is available at
www.sec.gov
.
BUSINESS STRATEGY
Our goal is to strengthen our position as a leading provider of career‑oriented post-secondary education by continuing to pursue the following strategy:
Expand Existing Areas of Study and Existing Facilities.
We believe we can leverage our operations to expand our program offerings in existing areas of study and expand into new high-demand areas of study in the Transportation and Skilled Trades segment to capitalize on demand from students and employers in our target markets. Whenever possible, we seek to replicate programs across our campuses.
Maximize Utilization of Existing Facilities.
We are focused on improving capacity utilization of existing facilities through increased enrollments, the introduction of new programs and partnerships with industry.
Expand Market.
We believe that we can enter new markets and broaden the Lincoln brand by partnering with nationally recognized brands to provide the skills needed to train our nation’s workforce. We continue to expand our industry relationships both to attract new students and to offer our graduates more employment opportunities. We continue to establish partnerships with companies like BMW, Chrysler (FCA), Hussmann, Volkswagen and Audi that will enable graduates to receive higher wages. We expect to continue investing in marketing, recruiting and retention resources to increase enrollment.
PROGRAMS AND AREAS OF STUDY
We structure our program offerings to provide our students with a practical, career-oriented education and position them for attractive entry-level job opportunities in their chosen fields. Our diploma/certificate programs typically take between 28 to 136 weeks to complete, with tuition ranging from $6,600 to $38,000. Our associate’s degree programs typically take between 58 to 156 weeks to complete, with tuition ranging from $25,000 to $70,000. Our bachelor’s degree programs typically take between 104 and 208 weeks to complete, with tuition ranging from $40,000 to $80,000. As of December 31, 2017, all of our schools offer diploma and certificate programs, ten of our schools are currently approved to offer associate’s degree programs and one school is approved to offer bachelor’s degree programs. In order to accommodate the schedules of our students and maximize classroom utilization at some of our campuses, we typically offer courses four to five days a week in three shifts per day and start new classes every month. Other campuses are structured more like a traditional college and start classes every quarter. We update and expand our programs frequently to reflect the latest technological advances in the field, providing our students with the specific skills and knowledge required in the current marketplace. Classroom instruction combines lectures and demonstrations by our experienced faculty with comprehensive hands-on laboratory exercises in simulated workplace environments.
The following table lists the programs offered as of December 31, 2017:
|
Current Programs Offered
|
||||||
|
Area of Study
|
Bachelor's
Degree
|
Associate's Degree
|
Diploma and Certificate
|
|||
|
Automotive
|
Automotive Service Management, Collision Repair & Refinishing Service Management, Diesel & Truck Service Management
|
Automotive Mechanics, Automotive Technology, Automotive Technology with Audi, Automotive Technology with BMW FastTrack, Automotive Technology with Mopar X-Press, Automotive Technology with High Performance, Automotive Technology with Volkswagon, Collision Repair and Refinishing Technology, Diesel & Truck Mechanics, Diesel & Truck Technology, Diesel & Truck Technology with Alternate Fuel Teechnology, Diesel & Truck Technology with Transport Refrigeration, Diesel & Truck with Automotive Technology, Heavy Equipment Maintenance Technology, Heavy Equipment and Truck Technology
|
||||
|
Health Sciences
|
Health Information Administration, RN to BSN
|
Medical Assisting Technology, Health Information Technology, Medical Office Management, Mortuary Science, Occupational Therapy Assistant, Dental Hygiene, Dental Administrative Assistant, Nursing
|
Medical Office Assistant, Medical Assistant, Patient Care Technician, Medical Coding & Billing, Dental Assistant, Licensed Practical Nursing
|
|||
|
Skilled Trades
|
Electronic Engineering Technology, HVAC, Electronics Systems Service Management
|
Electrical Technology, Electrical & Electronics Systems Technician, HVAC, Welding Technology, Welding with Introduction to Pipefitting, CNC
|
||||
|
Hospitality Services
|
Culinary Arts, Cosmetology, Aesthetics, International Baking and Pastry, Nail Technolgy, Therapeutic Massage & Bodywork Technician
|
|||||
|
Business and Information Technology
|
Business Management, Criminal Justice, Funeral Service Management
|
Criminal Justice, Business Management, Broadcasting and Communications, Computer Networking and Support, Human Services
|
Criminal Justice, Computer & Network Support Technician
|
|||
Automotive Technology.
Automotive technology, which is our area of study with the largest enrollment, accounted for 43% of our total average student enrollment for the year ended December 31, 2017. Our automotive technology programs are 28 to 136 weeks in length, with tuition rates of $14,000 to $38,000. We believe we are a leading provider of automotive technology education in each of our local markets. Graduates of our programs are qualified to obtain entry level employment ranging from positions as technicians and mechanics to various apprentice level positions. Our graduates are employed by a wide variety of companies, ranging from automotive and diesel dealers, to independent auto body paint and repair shops to trucking and construction companies.
As of December 31, 2017, 12 campuses offered programs in automotive technology and most of these campuses offer other technical programs. Our campuses in East Windsor, Connecticut; Nashville, Tennessee; Grand Prairie, Texas; Indianapolis, Indiana; and Denver, Colorado are destination campuses, attracting students throughout the United States and, in some cases, from abroad.
Health Sciences.
For the year ended December 31, 2017, enrollments in the programs comprising our health sciences area of study represented 27% of our total average student enrollment. Our health science programs are 35 to 208 weeks in length, with tuition rates of $13,000 to $76,000. Graduates of our health sciences programs are qualified to obtain positions such as licensed practical nurse, registered nurse, dental assistant, medical assistant, medical administrative assistant, and claims examiner. Our graduates are employed by a wide variety of employers, including hospitals, laboratories, insurance companies, doctors' offices and pharmacies. Our practical nursing and medical assistant programs are our largest health science programs. As of December 31, 2017, we offered health science programs at 11 of our campuses.
Skilled Trades.
For the year ended December 31, 2017, 22% of our total average student enrollment was in our skilled trades programs. Our skilled trades programs are 28 to 92 weeks in length, with tuition rates of $17,000 to $34,000. Our skilled trades programs include electrical, heating and air conditioning repair, welding, computerized numerical control and electronic & electronic systems technology. Graduates of our skilled trades programs are qualified to obtain entry level employment positions such as electrician, cable installer, welder, wiring and heating, ventilating and air conditioning, or HVAC installer. Our graduates are employed by a wide variety of employers, including residential and commercial construction, telecommunications installation companies and architectural firms. As of December 31, 2017, we offered skilled trades programs at 13 campuses.
Hospitality Services.
For the year ended December 31, 2017, 5% of our total average student enrollment was in our hospitality services programs. Our hospitality services programs are 28 to 66 weeks in length, with tuition rates of $6,600 to $20,000. Our hospitality programs include culinary, therapeutic massage, cosmetology and aesthetics. Graduates work in salons, spas, cruise ships or are self-employed. We offer massage programs at one campus and cosmetology programs at one campus. Our culinary graduates are employed by restaurants, hotels, cruise ships and bakeries. As of December 31, 2017, we offered culinary programs at one campus.
Business and Information Technology.
For the year ended December 31, 2017, 3% of our total average student enrollment was in our business and information technology programs, which include our diploma and degree criminal justice programs. Our business and information technology programs are 40 to 208 weeks in length, with tuition rates of $19,000 to $80,000. We have focused our current information technology, or IT, program offerings on those that are most in demand, such as our computer and network support technician. Our IT and business graduates work in entry level positions for both small and large corporations. Our criminal justice graduates work in the security industry and for various government agencies and departments. As of December 31, 2017, we offered these programs at 8 of our campuses.
MARKETING AND STUDENT RECRUITMENT
We utilize a variety of marketing and recruiting methods to attract students and increase enrollment. Our marketing and recruiting efforts are targeted at prospective students who are high school graduates entering the workforce, or who are currently underemployed or unemployed and require additional training to enter or re-enter the workforce.
Marketing and Advertising.
We utilize a fully integrated marketing approach in our lead generation and admissions process that includes the use of traditional media such as television, radio, billboards, direct mail, a variety of print media and event marketing campaigns. Our digital marketing efforts, which include paid search, search engine optimization, online video and display advertising and social media, have grown significantly in recent years and currently drive the majority of our new student leads and enrollments. Our website’s integrated marketing campaigns direct prospective students to call us or visit the Lincoln website where they will find details regarding our programs and campuses and can request additional information regarding the programs that interest them. Our internal systems enable us to closely monitor and track the effectiveness of each marketing execution on a daily or weekly basis and make adjustments accordingly to enhance efficiency and limit our student acquisition costs. In 2017, we selected a new paid search vendor with the capability to provide enhanced analytics and improved buying efficiencies in our digital initiatives. Unlike our previous paid search vendor, our new paid search vendor is an authorized Google partner agency. We are now able to consolidate our paid search, video, display and retargeting efforts onto a single digital platform to more effectively analyze our results. In 2017, we also began the development of a new creative marketing campaign that will launch during the first quarter of 2018. The new campaign theme will be used across all digital and traditional media channels and will be replacing our previous campaign which had been running for more than three years.
Referrals
.
Referrals from current students, high school counselors and satisfied graduates and their employers have historically represented 15% of our new enrollments. Our school administrators actively work with our current students to encourage them to recommend our programs to prospective students. We continue to build strong relationships with high school guidance counselors and instructors by offering annual seminars at our training facilities to further familiarize these individuals on the strengths of our programs.
Recruiting.
Our recruiting efforts are conducted by a group of approximately 250 campus-based and field representatives who meet directly with prospective students during presentations conducted at high schools, in the prospective students’ homes or during a visit to one of our campuses.
During 2017, we recruited approximately 23% of our students directly out of high school. Field sales continues to be a large part of our business and developing local community relationships is one of our most important functions. In 2017, we added two field representatives to our team who are focused on recruitment of prospectus students from the military in an effort to aid veterans transitioning to the civilian work force when their service commitment is completed.
STUDENT ADMISSIONS, ENROLLMENT AND RETENTION
Admissions.
In order to attend our schools, students must complete an application and pass an entrance assessment. While each of our programs has different admissions criteria, we screen all applications and counsel the students on the most appropriate program to increase the likelihood that our students complete the requisite coursework and obtain and sustain employment following graduation.
Enrollment.
We enroll students continuously throughout the year, with our largest classes enrolling in late summer or early fall following high school graduation. We had 10,159 students enrolled as of December 31, 2017 and our average enrollment for the year ended December 31, 2017 was 10,772 students, a decrease of 9.2% in average enrollment from December 31, 2016. We had 11,235 students enrolled as of December 31, 2016 and our average enrollment for that year was 11,864 students, a decrease of 8.6% in average enrollment from December 31, 2015.
Retention.
To maximize student retention, the staff at each school is trained to recognize the early warning signs of a potential drop and to assist and advise students on academic, financial, employment and personal matters. We monitor our retention rates by instructor, course, program and school. When we become aware that a particular instructor or program is experiencing a higher than normal dropout rate, we quickly seek to determine the cause of the problem and attempt to correct it. When we identify that a student is experiencing difficulty academically, we offer tutoring.
JOB PLACEMENT
We believe that assisting our graduates in securing employment after completing their program of study is critical to our ability to attract high quality students and enhancing our reputation in the industry. In addition, we believe that high job placement rates result in low student loan default rates, an important requirement for continued participation in Title IV of the Higher Education Act of 1965, as amended (“Title IV Programs”). See "Regulatory Environment—Regulation of Federal Student Financial Aid Programs." Accordingly, we dedicate significant resources to maintaining an effective graduate placement program. Our non-destination schools work closely with local employers to ensure that we are training students with skills that employers need. Each school has an advisory council comprised of local employers who provide us with direct feedback on how well we are preparing our students to succeed in the workplace. This enables us to tailor our programs to the marketplace. The placement staff in each of our destination schools maintains databases of potential employers throughout the country, allowing us to more effectively assist our graduates in securing employment in their career field upon graduation. Throughout the year, we hold numerous job fairs at our facilities where we provide the opportunity for our students to meet and interact with potential employers. In addition, many of our schools have internship programs that provide our students with opportunities to work with employers prior to graduation. For example, some of the students in our automotive programs have the opportunity to complete a portion of their hands-on training in an actual work environment. In addition, some of our students in health sciences programs are required to participate in an externship program during which they work in the field as part of their career training. We also assist students with resume writing, interviewing and other job search skills.
FACULTY AND EMPLOYEES
We hire our faculty in accordance with established criteria, including relevant work experience, educational background and accreditation and state regulatory standards. We require meaningful industry experience of our teaching staff in order to maintain the quality of instruction in all of our programs and to address current and industry-specific issues in our course content. In addition, we provide intensive instructional training and continuing education, including quarterly instructional development seminars, annual reviews, technical upgrade training, faculty development plans and weekly staff meetings.
The staff of each school typically includes a school director, a director of graduate placement, an education director, a director of student services, a financial-aid director, an accounting manager, a director of admissions and instructors, all of whom are industry professionals with experience in our areas of study.
As of December 31, 2017, we had approximately 1,980 employees, including 482 full-time faculty and 379 part-time instructors. At six of our campuses, the teaching professionals are represented by unions. These employees are covered by collective bargaining agreements that expire between 2018 and 2022. We believe that we have good relationships with these unions and with our employees.
COMPETITION
The for-profit, post-secondary education industry is highly competitive and highly fragmented with no one provider controlling significant market share. Direct competition between career-oriented schools like ours and traditional four-year colleges or universities is limited. Thus, our main competitors are other for-profit, career-oriented schools, not-for-profit public, private schools, public and private two-year junior and community colleges, most of which are eligible to receive funding under the federal programs of student financial aid authorized by Title IV Programs. Competition is generally based on location, the type of programs offered, the quality of instruction, placement rates, reputation, recruiting and tuition rates. Public institutions are generally able to charge lower tuition than our school, due in part to government subsidies and other financial sources not available to for-profit schools. In addition, some of our other competitors have a more extensive network of schools and campuses than we do, which enables them to recruit students more efficiently from a wider geographic area. Nevertheless, we believe that we are able to compete effectively in our local markets because of the diversity of our program offerings, quality of instruction, the strength of our brands, our reputation and our graduates’ success in securing employment after completing their program of study.
Our competition differs in each market depending on the curriculum that we offer. For example, a school offering automotive, healthcare and skilled trades programs will have a different group of competitors than a school offering healthcare, business/IT and skilled trades programs. Also, because schools can add new programs within six to twelve months, competition can emerge relatively quickly. Moreover, with the introduction of online education, the number of competitors in each market has increased because students can now attend classes from an online institution. On average, each of our schools has at least three direct competitors and at least a dozen indirect competitors.
ENVIRONMENTAL MATTERS
We use hazardous materials at our training facilities and campuses, and generate small quantities of waste such as used oil, antifreeze, paint and car batteries. As a result, our facilities and operations are subject to a variety of environmental laws and regulations governing, among other things, the use, storage and disposal of solid and hazardous substances and waste, and the clean-up of contamination at our facilities or off-site locations to which we send or have sent waste for disposal. We are also required to obtain permits for our air emissions and to meet operational and maintenance requirements. In the event we do not maintain compliance with any of these laws and regulations, or are responsible for a spill or release of hazardous materials, we could incur significant costs for clean-up, damages, and fines or penalties. Climate change has not had and is not expected to have a significant impact on our operations.
REGULATORY ENVIRONMENT
Students attending our schools finance their education through a combination of personal resources, family contributions, private loans and federal financial aid programs. Each of our schools participates in the Title IV Programs, which are administered by the DOE. For the year ended December 31
, 2017,
approximately 78% (calculated based on cash receipts) of our revenues were derived from the Title IV Programs. Students obtain access to federal student financial aid through a DOE prescribed application and eligibility certification process.
In connection with the students' receipt of federal financial aid under the Title IV Programs, our schools are subject to extensive regulation by governmental agencies and licensing and accrediting bodies. In particular, the Higher Education Act of 1965, as amended, and the regulations issued thereafter by the DOE, subject us to significant regulatory scrutiny in the form of numerous standards that each of our schools must satisfy in order to participate in the Title IV Programs. To participate in the Title IV Programs, a school must be authorized to offer its programs of instruction by the applicable state education agencies in the states in which it is physically located, be accredited by an accrediting commission recognized by the DOE and be certified as an eligible institution by the DOE. The DOE defines an eligible institution to consist of both a main campus and its additional locations, if any. Each of our schools is either a main campus or an additional location of a main campus. Each of our schools is subject to extensive regulatory requirements imposed by state education agencies, accrediting commissions, and the DOE. Because the DOE periodically revises its regulations and changes its interpretations of existing laws and regulations, we cannot predict with certainty how Title IV Program requirements will be applied in all circumstances. Our schools also participate in other federal and state financial aid programs that assist students in paying the cost of their education and that impose standards that we must satisfy.
State Authorization
Each of our schools must be authorized by the applicable education agencies in the states in which the school is physically located, and in some cases other states, in order to operate and to grant degrees, diplomas or certificates to its students. State agency authorization is also required in each state in which a school is physically located in order for the school to become and remain eligible to participate in Title IV Programs. If we are found not to be in compliance with the applicable state regulation and a state seeks to restrict one or more of our business activities within its boundaries, we may not be able to recruit or enroll students in that state and may have to stop providing services in that state, which could have a significant impact on our business and results of operations. Currently, each of our schools is authorized by the applicable state education agencies in the states in which the school is physically located and in which it recruits students.
Our schools are subject to extensive, ongoing regulation by each of these states. State laws typically establish standards for instruction, curriculum, qualifications of faculty, location and nature of facilities and equipment, administrative procedures, marketing, recruiting, financial operations, student outcomes and other operational matters. State laws and regulations may limit our ability to offer educational programs and to award degrees, diplomas or certificates. Some states prescribe standards of financial responsibility that are different from, and in certain cases more stringent than, those prescribed by the DOE. Some states require schools to post a surety bond. We have posted surety bonds on behalf of our schools and education representatives with multiple states in a total amount of
approximately $12.7 million.
The DOE published regulations that took effect on July 1, 2011, that expanded the requirements for an institution to be considered legally authorized in the state in which it is physically located for Title IV purposes. In some cases, the regulations required states to revise their current requirements and/or to license schools in order for institutions to be deemed legally authorized in those states and, in turn, to participate in Title IV Programs. If the states do not amend their requirements where necessary and if schools do not receive approvals where necessary that comply with these new requirements, then the institution could be deemed to lack the state authorization necessary to participate in Title IV Programs. The DOE stated when it published the final regulations that it will not publish a list of states that meet, or fail to meet, the requirements, and it is uncertain how the DOE will interpret these requirements in each state.
If any of our schools fail to comply with state licensing requirements, they are subject to the loss of state licensure or authorization. If any one of our schools lost its authorization from the education agency of the state in which the school is located, or failed to comply with the DOE’s state authorization requirements, that school would lose its eligibility to participate in Title IV Programs, the Title IV eligibility of its related additional locations could be affected, the impacted schools would be unable to offer its programs, and we could be forced to close the schools. If one of our schools lost its state authorization from a state other than the state in which the school is located, the school would not be able to recruit students or to operate in that state.
Due to state budget constraints in certain states in which we operate, it is possible that those states may continue to reduce the number of employees in, or curtail the operations of, the state education agencies that oversee our schools. A delay or refusal by any state education agency in approving any changes in our operations that require state approval could prevent us from making such changes or could delay our ability to make such changes. States periodically change their laws and regulations applicable to our schools and such changes could require us to change our practices and could have a significant impact on our business and results of operations.
Accreditation
Accreditation is a non-governmental process through which a school submits to ongoing qualitative and quantitative review by an organization of peer institutions. Accrediting commissions primarily examine the academic quality of the school's instructional programs, and a grant of accreditation is generally viewed as confirmation that the school's programs meet generally accepted academic standards. Accrediting commissions also review the administrative and financial operations of the schools they accredit to ensure that each school has the resources necessary to perform its educational mission.
Accreditation by an accrediting commission recognized by the DOE is required for an institution to be certified to participate in Title IV Programs. In order to be recognized by the DOE, accrediting commissions must adopt specific standards for their review of educational institutions. As of December 31, 2017, 15 of our campuses are accredited by the Accrediting Commission of Career Schools and Colleges, or ACCSC; seven of our campuses are accredited by the Accrediting Council for Independent Colleges and Schools, or ACICS; and one of our campuses is accredited by the New England Association of Schools and Colleges of Technology, or NEASC. The following is a list of the dates on which each campus was accredited by its accrediting commission, the date by which its accreditation must be renewed and the type of accreditation.
Accrediting Commission of Career Schools and Colleges Reaccreditation Dates
|
School
|
Last Accreditation Letter
|
Next Accreditation
|
Type of Accreditation
|
|||
|
Philadelphia, PA
2
|
September 30, 2013
|
May 1, 2018
|
National
|
|||
|
Union, NJ
1
|
May 29, 2014
|
February 1, 2019
|
National
|
|||
|
Mahwah, NJ
1
|
March 11, 2015
|
August 1, 2019
|
National
|
|||
|
Melrose Park, IL
2
|
March 13, 2015
|
November 1, 2019
|
National
|
|||
|
Denver, CO
1
|
June 14, 2016
|
February 1, 2021
|
National
|
|||
|
Columbia, MD
|
March 8, 2017
|
February 1, 2022
|
National
|
|||
|
Grand Prairie, TX
1
|
June 20, 2017
|
August 1, 2021
|
National
|
|||
|
Allentown, PA
2
|
March 8, 2017
|
February 1, 2022
|
National
|
|||
|
Nashville, TN
1
|
September 6, 2017
|
May 1, 2022
|
National
|
|||
|
Indianapolis, IN
|
November 30, 2012
|
November 1, 2017
3
|
National
|
|||
|
New Britain, CT
|
June 5, 2014
|
January 1, 2018
3
|
National
|
|||
|
Shelton, CT
2
|
March 5, 2014
|
September 1, 2018
|
National
|
|||
|
Queens, NY
1
|
June 4, 2013
|
June 1, 2018
|
National
|
|||
|
East Windsor, CT
2
|
October 17, 2017
|
February 1, 2023
|
National
|
|||
|
South Plainfield, NJ
1
|
September 2, 2014
|
August 1, 2019
|
National
|
| 1 |
Branch campus of main campus in Indianapolis, IN
|
| 2 |
Branch campus of main campus in New Britain, CT
|
| 3 |
Campus undergoing re-accreditation. Campus has received written confirmation that it remains accredited pending consideration of its application for reaccreditation.
|
Accrediting Council for Independent Colleges and Schools Reaccreditation Dates*
|
School
|
Last Accreditation Letter
|
Next Accreditation
|
Type of Accreditation
|
|||
|
Lincoln, RI
1
|
August 28, 2014
|
December 31, 2019
|
National
|
|||
|
Somerville, MA
1
|
August 28, 2014
|
December 31, 2019
|
National
|
|||
|
Iselin, NJ
|
December 20, 2016
|
December 31, 2022
|
National
|
|||
|
Marietta, GA
1
|
August 28, 2014
|
December 31, 2019
|
National
|
|||
|
Moorestown, NJ
1
|
December 20, 2016
|
December 31, 2022
|
National
|
|||
|
Paramus, NJ
1
|
December 20, 2016
|
December 31, 2022
|
National
|
|||
|
Las Vegas (Summerlin), NV
1
|
August 29, 2014
|
December 31, 2019
|
National
|
| 1 |
Branch campus of main campus in Iselin, NJ
|
* ACICS accredited institutions currently undergoing initial transitioning accreditation applications with ACCSC.
New England Association of Schools and Colleges of Technology Reaccreditation Dates
|
School
|
Last Accreditation Letter
|
Comprehensive Evaluation
|
Type of Accreditation
|
|||
|
Southington, CT
|
June 29, 2012
|
Fall 2017
1
|
Regional
|
| 1 |
Campus undergoing re-accreditation. Commission considering evaluation of the Southington school at its April 2018 meeting.
|
Our Iselin, New Jersey school and its branch campuses (collectively, the “Iselin school”), participate in Title IV Programs under provisional status. This provisional status results from a December 12, 2016 decision of the Secretary of the DOE to uphold the decision of a senior DOE official to cease recognition of ACICS, as a nationally recognized accrediting agency and to deny ACICS’s petition for DOE recognition based on conclusions that ACICS was in violation of various DOE regulatory criteria. ACICS had served as the accrediting agency for the Iselin school. ACICS has appealed the DOE Secretary’s decision to Federal court; however, unless otherwise directed by the court, the DOE Secretary’s decision is not stayed during the appeal to Federal court and, therefore, ACICS is not a DOE-recognized accrediting agency.
ACICS has also submitted a petition to become a recognized agency with the DOE and its application will be reviewed at the May 2018 meeting of the National Advisory Committee on Institutional Quality and Integrity.
When the DOE withdraws the recognition of an accrediting agency, the DOE may permit a postsecondary educational institution that had accreditation through such accrediting agency to continue its participation in Title IV Programs on a provisional basis for a period not to exceed 18 months from the DOE’s decision to withdraw its recognition of the accrediting agency. Accordingly, in connection with ACICS’s loss of recognition, the DOE has indicated that during an 18-month period of provisional participation commencing on December 12, 2016 an ACICS-accredited institution will be deemed to hold recognized accreditation and, in addition, the institution is required to comply with certain conditions and restrictions, including, but not limited to, that the institution:
| · |
will be restricted from making major changes, such as opening new campuses, increasing the level of academic offerings or adding new educational programs, without DOE approval, and such DOE approval will be granted only in limited circumstances;
|
| · |
must make certain notifications and disclosures, allow students to take a leave of absence and will not be eligible to receive Title IV Program funds for any newly enrolled students if the students become ineligible to sit for any licensing or certification exam as a result of the loss of accreditation;
|
| · |
must make certain notifications and disclosures and will not be eligible to receive Title IV Program funds if the institution loses its authorization to operate and issue postsecondary credentials;
|
| · |
must submit periodic reports to the DOE regarding investigations, lawsuits and arbitrations;
|
| · |
must inform students on how to file complaints they may have previously submitted to the institution’s accrediting agency;
|
| · |
must submit a teach-out plan to the DOE by January 11, 2017; and
|
| · |
must engage its third-party auditor to evaluate certain data and compliance indicators for the institution that would have been monitored by the accrediting agency, including financial information and measures of student achievement.
|
The DOE informed the Company by letter dated August 31, 2017 that we are no longer required to submit periodic reports to the DOE regarding investigations, lawsuits and arbitrations. In addition, the DOE subsequently informed the Company by letter dated August 31, 2017 that we are no longer required to engage its third-party auditor to evaluate certain data and compliance indicators for the institution that would have been monitored by the accrediting agency, including financial information and measures of student achievement. To date, the Company has satisfied all of the above referenced requirements for an institution that has provisional participation status and has not made any major changes.
The DOE also imposed additional requirements on ACICS-accredited institutions that did not meet certain milestones toward accreditation by another recognized accrediting agency. An institution that did not apply for accreditation with another recognized accrediting agency by March 13, 2017 was required to submit a formal teach-out agreement to the DOE and disclose to its students that it did not have an in-process application with another recognized accrediting agency. In addition, any institution that did not have an in-process application with another recognized accrediting agency by June 12, 2017 or had not completed an accrediting agency site visit by February 28, 2018 would no longer be eligible to receive Title IV Program funds for any student that enrolls after that date, would have to make additional disclosures to its students, would have to submit monthly student rosters and a record retention plan to the DOE, and would have to deliver a letter of credit to the DOE in an amount to be determined by the DOE.
Subsequent to the DOE Secretary’s decision with respect to ACICS, on December 19, 2016, the Company and the DOE executed an addendum to the Company’s program participation agreement, in which the Company agreed to comply with the DOE’s conditions and requirements for provisional certification with respect to the Iselin school for a period of up to 18 months ending on June 12, 2018.
We are in the process of applying to ACCSC for accreditation of our ACICS-accredited institution and its campuses. Our efforts to obtain accreditation could be unsuccessful and could result in the loss of the institution’s eligibility to participate in the Title IV Programs. We have met all the milestones established by the DOE, for the continuation in the Title IV Programs for the schools accredited by ACICS.
The Company received a letter dated February 26, 2018 from ACCSC, which indicated that the ACCSC commission required that the Company submit certain additional information to ACCSC to demonstrate that the financial structure of the Company’s system of schools is sound with resources sufficient for the proper operation of its schools and of the discharge of the Company’s obligations to its students. If our Iselin school and its campuses are unable to obtain initial accreditation from ACCSC by June 12, 2018, then the Iselin school and its campuses will be subject to the loss of accreditation or may be placed on probation, warning, or a special monitoring or reporting status which, if the noncompliance with accrediting commission requirements is not resolved, could result in actions by the ACCSC commission including, but not limited to, loss of accreditation or limitations on our ability to initiate a substantive change. Loss of accreditation by any of our main campuses would result in the termination of eligibility of that school and all of its branch campuses to participate in Title IV Programs and could cause us to close the school and its branches, which could have a significant negative impact on our business and operations. The Company is required to submit its response to ACCSC by April 5, 2018. Our application for accreditation for ACCSC will be considered at a May 2018 accrediting commission meeting. The Company believes they will be able to meet all requirements required by the ACCSC commission.
The loss of DOE recognition by an institution’s accrediting agency also could result in a loss of state authorization (and, in turn, Title IV Program eligibility), programmatic accreditation, and/or authorization to participate in certain state or federal financial aid programs if accreditation by a DOE-recognized accrediting agency is required for the impacted campuses of our ACICS-accredited institution to qualify for such state authorization, programmatic accreditation, or state or federal financial aid programs.
We have not identified any state, federal or accrediting agencies that condition approval of our ACICS-accredited campuses on accreditation by a DOE-recognized accrediting body. However, agency requirements are imprecise or unclear in some instances and could be subject to different interpretation by one or more agencies.
If one of our schools fails to comply with accrediting commission requirements, the institution and its main and/or branch campuses are subject to the loss of accreditation or may be placed on probation or a special monitoring or reporting status which, if the noncompliance with accrediting commission requirements is not resolved, could result in loss of accreditation or restrictions on the addition of new locations, new programs, or other substantive changes. If any one of our schools loses its accreditation, students attending that school would no longer be eligible to receive Title IV Program funding, and we could be forced to close that school.
Programmatic accreditation is the process through which specific programs are reviewed and approved by industry and program-specific accrediting entities. Although programmatic accreditation is not generally necessary for Title IV eligibility, such accreditation may be required to allow students to sit for certain licensure exams or to work in a particular profession or career or to meet other requirements. Failure to obtain or maintain such programmatic accreditation may lead to a decline in enrollments in such programs. Under new gainful employment issued by the DOE, institutions may be required to certify that they have programmatic accreditation under certain circumstances. See “—Regulatory Environment – Gainful Employment.”
Nature of Federal and State Support for Post-Secondary Education
The federal government provides a substantial part of the support for post-secondary education through Title IV Programs, in the form of grants and loans to students who can use those funds at any institution that has been certified as eligible by the DOE. Most aid under Title IV Programs is awarded on the basis of financial need, generally defined as the difference between the cost of attending the institution and the expected amount a student and his or her family can reasonably contribute to that cost. A recipient of Title IV Program funds must maintain a satisfactory grade point average and progress in a timely manner toward completion of his or her program of study and must meet other applicable eligibility requirements for the receipt of Title IV funds. In addition, each school must ensure that Title IV Program funds are properly accounted for and disbursed in the correct amounts to eligible students.
Other Financial Assistance Programs
Some of our students receive financial aid from federal sources other than Title IV Programs, such as programs administered by the U.S. Department of Veterans Affairs and under the Workforce Investment Act. In addition, some states also provide financial aid to our students in the form of grants, loans or scholarships. The eligibility requirements for state financial aid and these other federal aid programs vary among the funding agencies and by program. States that provide financial aid to our students are facing significant budgetary constraints. Some of these states have reduced the level of state financial aid available to our students. Due to state budgetary shortfalls and constraints in certain states in which we operate, we believe that the overall level of state financial aid for our students is likely to continue to decrease in the near term, but we cannot predict how significant any such reductions will be or how long they will last. Federal budgetary shortfalls and constraints, or decisions by federal lawmakers to limit or prohibit access by our institutions or their students to federal financial aid, could result in a decrease in the level of federal financial aid for our students.
In addition to Title IV and other government-administered programs, all of our schools participate in alternative loan programs for their students. Alternative loans fill the gap between what the student receives from all financial aid sources and what the student may need to cover the full cost of his or her education. Students or their parents can apply to a number of different lenders for this funding at current market interest rates.
We also extend credit for tuition and fees to many of our students that attend our campuses.
Regulation of Federal Student Financial Aid Programs
To participate in Title IV Programs, an institution must be authorized to offer its programs by the relevant state education agencies in the state in which it is physically located, be accredited by an accrediting commission recognized by the DOE and be certified as eligible by the DOE. The DOE will certify an institution to participate in Title IV Programs only after reviewing and approving an institution’s application to participate in the Title IV Programs. The DOE defines an institution to consist of both a main campus and its additional locations, if any. Under this definition, for DOE
purposes, we had the following five institutions as of December 31, 2017, collectively consisting of five main campuses and 18 additional locations:
|
Main Institution/Campus(es)
|
Additional Location(s)
|
|
|
Iselin, NJ
|
Moorestown, NJ
|
|
|
Paramus, NJ
|
||
|
Somerville, MA
|
||
|
Lincoln, RI
|
||
|
Marietta, GA
|
||
|
Las Vegas, NV (Summerlin)
|
||
|
New Britain, CT
|
Shelton, CT
|
|
|
Philadelphia, PA
|
||
|
East Windsor, CT
|
||
|
Melrose Park, IL
|
||
|
Allentown, PA
|
||
|
Indianapolis, IN
|
Grand Prairie, TX
|
|
|
Nashville, TN
|
||
|
Denver, CO
|
||
|
Union, NJ
|
||
|
Mahwah, NJ
|
||
|
Queens, NY
|
||
|
South Plainfield, NJ
|
||
|
Columbia, MD
|
||
|
Southington, CT
|
Each institution must periodically apply to the DOE for continued certification to participate in Title IV Programs. The institution also must apply for recertification when it undergoes a change in ownership resulting in a change of control. The institution also may come under DOE review when it undergoes a substantive change that requires the submission of an application, such as opening an additional location or raising the highest academic credential it offers. All institutions are recertified on various dates for various amounts of time. The following table sets forth the expiration dates for each of our institutions' current Title IV Program participation agreements:
|
Institution
|
Expiration Date of Current
Program Participation
Agreement
|
|
|
Columbia, MD
|
March 31, 2020
|
|
|
Iselin, NJ
|
June 12, 2018
1
|
|
|
Indianapolis, IN
|
September 30, 2018
1
|
|
|
New Britain, CT
|
March 31, 2020
|
|
|
Southington, CT
|
June 30, 2023
|
| 1 |
Provisionally certified.
|
The DOE typically provides provisional certification to an institution following a change in ownership resulting in a change of control and also may provisionally certify an institution for other reasons, including, but not limited to, noncompliance with certain standards of administrative capability and financial responsibility. Two of our five institutions, namely Iselin (as a result of ACICS’s loss of DOE recognition, as discussed above) and Indianapolis are provisionally certified by the DOE; together, these two institutions generate 66% of the Company’s revenues are provisionally certified. Indianapolis is provisionally certified based on the existence of pending program reviews with DOE (although the Title IV Program review at our Union and Indianapolis schools, which was the basis for provisional certification, have been resolved and are now closed). An institution that is provisionally certified receives fewer due process rights than those received by other institutions in the event the DOE takes certain adverse actions against the institution, is required to obtain prior DOE approvals of new campuses and educational programs, and may be subject to heightened scrutiny by the DOE. However, provisional certification does not otherwise limit an institution’s access to Title IV Program funds. Our Iselin campus also is subject to additional conditions on its Title IV participation based on its accrediting agency’s loss of DOE recognition, as discussed above.
The DOE is responsible for overseeing compliance with Title IV Program requirements. As a result, each of our schools is subject to detailed oversight and review, and must comply with a complex framework of laws and regulations. Because the DOE periodically revises its regulations and changes its interpretation of existing laws and regulations, we cannot predict with certainty how the Title IV Program requirements will be applied in all circumstances.
Significant factors relating to Title IV Programs that could adversely affect us include the following:
Congressional Action.
Political and budgetary concerns significantly affect Title IV Programs. Congress periodically revises the Higher Education Act of 1965, as amended (“HEA”) and other laws governing Title IV Programs. Congress is currently considering reauthorization of Title IV Programs and the House Education and Workforce Committee approved a reauthorization bill on December 13, 2017. The Senate Health, Education, Labor and Pensions Committee has indicated it plans to develop its own reauthorization bill. However, it is not known if or when Congress will pass final legislation that amends the Higher Education Act or other laws affecting U.S. Federal student aid.
In addition, Congress reviews and determines federal appropriations for Title IV Programs on an annual basis. Congress can also make changes in the laws affecting Title IV Programs in the annual appropriations bills and in other laws it enacts between the HEA reauthorizations. Because a significant percentage of our revenues are derived from Title IV Programs, any action by Congress or the DOE that significantly reduces Title IV Program funding,
that limits or restricts the ability of our schools, programs,
or students to receive funding through the Title IV Programs, or
that imposes new restrictions or constraints upon our business or operations
could reduce our student enrollment and our revenues, and could increase our administrative costs and require us to modify our practices in order for our schools to comply fully with Title IV Program requirements.
In addition, current requirements for student or school participation in Title IV Programs may change or one or more of the present Title IV Programs could be replaced by other programs with materially different student or school eligibility requirements. If we cannot comply with the provisions of the HEA, as they may be amended, or if the cost of such compliance is excessive, or if funding is materially reduced, our revenues or profit margin could be materially adversely affected.
Gainful Employment.
In October 2014, the DOE issued final gainful employment regulations requiring each educational program offered by our institutions to achieve threshold rates in at least one of two debt measure categories related to an annual debt to annual earnings ratio and an annual debt to discretionary income ratio. The various formulas are calculated under complex methodologies and definitions outlined in the final regulations and, in some cases, are based on data that may not be readily accessible to institutions, such as income information compiled by the Social Security Administration. The regulations outline various scenarios under which programs could lose Title IV eligibility for failure to achieve threshold rates in one or more measures over certain periods of time ranging from two to four years. The regulations also require an institution to provide warnings to students in programs which may lose Title IV eligibility at the end of an award year. The final regulations also contain other provisions that, among other things, include disclosure, reporting, new program approval, and certification requirements. The certification requirements require each institution to certify to the DOE, among other things, that each gainful employment program is programmatically accredited, if such accreditation is required by a Federal governmental entity or by governmental entity in the state in which the institution is physically located.
The final regulations had a general effective date of July 1, 2015. In January 2017, the DOE issued the first set of gainful employment rates for each of our programs for the debt measure year ended June 30, 2015. Sixty of our programs achieved passing rates, 13 of our programs had rates that are in a category called the “zone,” and five of our programs had failing rates. One of the five failing programs is associated with an institution that is closed as of December 31, 2016. Our programs with rates in the zone are not subject to loss of Title IV eligibility unless they accumulate a combination of zone and failing rates for four consecutive years (or failing rates for two out of any three consecutive years). Each of our programs with failing rates will lose its Title IV eligibility if it receives a failing gainful employment rate for either of the 2016 or 2017 debt measure years. The DOE has yet to begin the process of issuing gainful employment rates for the 2016 debt measure year, although it could begin that process at any time.
Of the four remaining failing programs two were at our Transitional campuses and have been fully taught out as of December 31, 2017. The remaining two failing programs are expected to be fully taught out by June 30, 2018 and we are pending a response from the DOE to the official appeal we submitted on February 1, 2018. If, in fact, we lose the appeal to the DOE the applicable school would need to notify its current students that it may lose Title IV eligibility. Moreover, the potential for one or more of these programs to lose their Title IV eligibility could trigger a requirement to submit a letter of credit or other financial protection to the DOE under the new Borrower Defense to Repayment Regulations that were scheduled to take effect on July 1, 2019 but were subsequently delayed. See “Financial Responsibility Standards.”
The table below provides a summary of the percentage of total student enrollment by gainful employment program classification for each of our reporting segments based on student enrollment as of the debt measure year ended December 31, 2017.
|
Reporting Segment
|
Passing Programs
|
Zone Programs
|
Failing Programs
|
|||||||||
|
Transportation
|
93.6
|
%
|
6.4
|
%
|
-
|
|
||||||
|
HOPS
|
94.6
|
%
|
4.5
|
%
|
0.9
|
%
|
||||||
|
Transitional
|
-
|
|
-
|
|
-
|
|
||||||
The table below provides a summary of estimated yearly revenue related to the programs either in the zone or failing programs for the fiscal year ended December 31, 2017. The Company has implemented program modifications and tuition reductions or is teaching out the program or has appealed the program’s gainful employment rate.
|
Reporting Segment
|
Zone Programs
|
Failing Programs
|
||||||
|
Transportation
|
$
|
6,000,000
|
$
|
- | ||||
|
HOPS
|
$
|
3,200,000
|
$
|
300,000
|
||||
The table below provides a summary of each of the zone or failing programs and the actions implemented by the Company with respect to those particular gainful employment (“GE”) programs.
|
GE Program Code
|
||||||
|
Reporting Segment
|
OPEID
|
CIP Code
|
Credential Level
|
GE Program Name
|
GE Classification
|
Actions implemented
|
|
Transportation
|
007936
|
120503
|
Certificate
|
Culinary Arts/Chef Training
|
Zone
|
Teachout, Program Modification, Tuition Reduction
|
|
Transportation
|
007938
|
470603
|
Certificate
|
Autobody/Collision And Repair
Technology/Technician
|
Zone
|
Program Modification,
Tuition Reducation
|
|
Transportation
|
007936
|
470604
|
Certificate
|
Automobile/Automotive Mechanices
Technology/Technician
|
Zone
|
Program Modification,
Tuition Reducation
|
|
HOPS
|
012461
|
120401
|
Certificate
|
Cosmetology/Cosmetologist General
|
Zone
|
Program Modification
|
|
HOPS
|
007303
|
120503
|
Certificate
|
Culinary Arts/Chef Training
|
Fail
|
Appeal, Teachout, Program Modification,
Tuition Reducation
|
|
HOPS
|
007303
|
120599
|
Certificate
|
Culinary Arts and Related Services, Other
|
Zone
|
Teachout
|
|
HOPS
|
0012461
|
470101
|
Certificate
|
Electrical/ Electronics Equipment Installation
And Repair, General
|
Fail
|
Teachout, Program Modification
|
|
HOPS
|
0012461
|
470101
|
Associate Degree
|
Electrical/ Electronics Equipment Installation
And Repair, General
|
Zone
|
Program Modification
|
|
HOPS
|
0012461
|
510713
|
Associate Degree
|
Medical Insurance Coding Specialist/Coder
|
Zone
|
Teachout
|
|
Transitional
|
0012461
|
120503
|
Certificate
|
Culinary Arts/Chef Training
|
Zone
|
Teachout
|
|
Transitional
|
0012461
|
120503
|
Certificate
|
Culinary Arts/Chef Training
|
Zone
|
Teachout
|
|
Transitional
|
0012461
|
470201
|
Certificate
|
Heating, Air Conditioning, Ventilation
And Refrigeration Maintenance
Technology/Technician
|
Fail
|
Teachout
|
|
Transitional
|
0012461
|
470604
|
Certificate
|
Automobile/Automotive Mechanices
Technology/Technician
|
Fail
|
Teachout
|
|
Transitional
|
0012461
|
470604
|
Associate Degree
|
Automobile/Automotive Mechanics
Technology/Technician
|
Zone
|
Teachout
|
|
Transitional
|
0012461
|
510716
|
Associate Degree
|
Medical Administrative/Executive Assistant
And Medical Secretory
|
Zone
|
Teachout
|
|
Transitional
|
0012461
|
510801
|
Associate Degree
|
Medical/Clinical Assistant
|
Zone
|
Teachout
|
1
Gainful Employment programs are identified by the combination of: (1) the institution’s Office of Postsecondary Education Identification number (“OPEID #”); (2) Program Classification of Instruction (“CIP”); and (3) Credential Level.
On June 15, 2017, the DOE announced its intention to convene a negotiated rulemaking committee to develop proposed regulations to revise the gainful employment regulations. The committee may issue proposed regulations for public comment during the first half of 2018, but the DOE has not established a final schedule for publication of proposed or final regulations. Any regulations published in final form by November 1, 2018 typically would take effect on July 1, 2019, but we cannot provide any assurances as to the timing or content of any such regulations.
On June 30, 2017, the DOE announced the extension of the compliance date for certain gainful employment disclosure requirements from July 1, 2017 to July 1, 2018. The DOE stated that institutions are still required to comply with other gainful employment disclosure requirements by July 1, 2017. On August 18, 2017, the DOE announced new deadlines for submitting notices of intent to file alternate earnings appeals of gainful employment rates and for submitting alternate earnings appeals of those rates. The deadline to file a notice of intent to file an appeal was October 6, 2017 and the deadline to file the alternate earnings appeal was February 1, 2018. The DOE has not announced a delay or suspension in the enforcement of any other gainful employment regulations. However, on August 8, 2017, DOE officials announced that the DOE did not have a timetable for the issuance of student completer lists to schools, which is the first step toward generating the data for calculating new gainful employment rates. Consequently, we cannot predict when the DOE will begin the process of calculating and issuing new draft or final gainful employment rates in the future. We also cannot predict whether the gainful employment rulemaking process or the extension of certain gainful employment deadlines may result in the DOE delaying the issuance of new draft or final gainful employment rates in the future.
Borrower Defense to Repayment Regulations.
In January 2016, the DOE began negotiated rulemaking to develop proposed regulations regarding, among other things, a borrower’s ability to allege acts or omissions by an institution as a defense to the repayment of certain Title IV loans and the consequences to the borrower, the DOE, and the institution. On November 1, 2016, the DOE published in the Federal Register the final version of these regulations with a general effective date of July 1, 2017 and which, among other things, include rules for:
| · |
establishing new processes, and updating existing processes, for enabling borrowers to obtain from the DOE a discharge of some or all of their federal student loans based on circumstances such as certain acts or omissions of the institution and for the DOE to impose and collect liabilities against the institution following the loan discharges;
|
| · |
establishing expanded standards of financial responsibility (see “Regulatory Environment – Financial Responsibility Standards”);
|
| · |
requiring institutions to make disclosures to current and prospective students regarding the existence of certain of the circumstances identified in the expanded standards of financial responsibility;
|
| · |
calculating a loan repayment rate for each proprietary institution under standards established by the regulations and requiring institutions to provide warnings to current and prospective students if the institution has a loan repayment rate below specified thresholds;
|
| · |
prohibiting certain contractual provisions imposed by or on behalf of schools on students regarding arbitration, dispute resolution, and participation in class actions; and
|
| · |
expanding the existing definition of misrepresentations that could result in grounds for discharge of student loans and in liabilities and sanctions against the institution, including, without limitation, potential loss of Title IV eligibility.
|
On January 19, 2017, the DOE issued new regulations that update the Department’s hearing procedures for actions to establish liability against an institution and to establish procedural rules governing recovery proceedings under the DOE’s borrower defense to repayment regulations.
The DOE delayed the effective date of a majority of these regulations until July 1, 2019 to ensure that there is adequate time to conduct negotiated rulemaking and, as necessary, develop revised regulations. The DOE has not established a final schedule. Any regulations published in final form by November 1, 2018 typically would take effect on July 1, 2019, but we cannot provide any assurances as to the timing or content of any such regulations or whether and when the DOE might end the delay in the effective date of the previously published regulations.
We cannot predict how the DOE would interpret and enforce the new borrower defense to repayment rules if they take effect after the delay or how these rules, or any rules that may arise out of the negotiated rulemaking process, may impact our schools’ participation in the Title IV Programs; however, the new rules could have a material adverse effect on our schools’ business and results of operations, and the broad sweep of the rules may, in the future, require our schools to submit a letter of credit based on expanded standards of financial responsibility as indicated above.
The "90/10 Rule."
Under the HEA, a proprietary institution that derives more than 90% of its total revenue from Title IV Programs (its “90/10 Rule percentage”) for two consecutive fiscal years becomes immediately ineligible to participate in Title IV Programs and may not reapply for eligibility until the end of at least two fiscal years. An institution with revenues exceeding 90% for a single fiscal year will be placed on provisional certification and may be subject to other enforcement measures. If an institution violated the 90/10 Rule and became ineligible to participate in Title IV Programs but continued to disburse Title IV Program funds, the DOE would require the institution to repay all Title IV Program funds received by the institution after the effective date of the loss of eligibility.
We have calculated that, for our 2017 fiscal year, our institutions' 90/10 Rule percentages ranged from 76% to 84%. For 2016 and 2015, none of our existing institutions derived more than 90% of their revenues from Title IV Programs. Our calculations are subject to review by the DOE.
If Congress or the DOE were to amend the 90/10 Rule to treat other forms of federal financial aid as Title IV revenue for 90/10 Rule purposes, lower the 90% threshold, or otherwise change the calculation methodology (each of which has been proposed by some Congressional members in proposed legislation), or make other changes to the 90/10 Rule, those changes could make it more difficult for our institutions to comply with the 90/10 Rule. A loss of eligibility to participate in Title IV Programs for any of our institutions would have a significant impact on the rate at which our students enroll in our programs and on our business and results of operations.
Student Loan Defaults.
The HEA limits participation in Title IV Programs by institutions whose former students defaulted on the repayment of federally guaranteed or funded student loans above a prescribed rate (the “cohort default rate”). The DOE calculates these rates based on the number of students who have defaulted, not the dollar amount of such defaults. The cohort default rate is calculated on a federal fiscal year basis and measures the percentage of students who enter repayment of a loan during the federal fiscal year and default on the loan on or before the end of the federal fiscal year or the subsequent two federal fiscal years.
Under the HEA, an institution whose Federal Family Education Loan, or FFEL, and Federal Direct Loan, or FDL, cohort default rate is 30% or greater for three consecutive federal fiscal years loses eligibility to participate in the FFEL, FDL, and Pell programs for the remainder of the federal fiscal year in which the DOE determines that such institution has lost its eligibility and for the two subsequent federal fiscal years. An institution whose FFEL and FDL cohort default rate for any single federal fiscal year exceeds 40% loses its eligibility to participate in the FFEL and FDL programs for the remainder of the federal fiscal year in which the DOE determines that such institution has lost its eligibility and for the two subsequent federal fiscal years.
If an institution’s three-year cohort default rate equals or exceeds 30% in two of the three most recent federal fiscal years for which the DOE has issued cohort default rates, the institution may be placed on provisional certification status and, under new regulations that were scheduled to take effect on July 1, 2017 but were subsequently delayed, could be required to submit a letter of credit to the DOE.
In September 2017, the DOE released the final cohort default rates for the 2014 federal fiscal year. These are the most recent final rates published by the DOE. The rates for our existing institutions for the 2014 federal fiscal year range from 5.2% to 13.6%. None of our institutions had a cohort default rate equal to or greater than 30% for the 2014 federal fiscal year.
In February 2018, the DOE released draft three-year cohort default rates for the 2015 federal fiscal year. The draft cohort default rates are subject to change pending receipt of the final cohort default rates, which the DOE is expected to publish in September 2018. The draft rates for our institutions for the 2015 federal fiscal year range from 7.6% to 13.2%. None of our institutions had draft cohort default rates of 30% or more.
Financial Responsibility Standards.
All institutions participating in Title IV Programs must satisfy specific standards of financial responsibility. The DOE evaluates institutions for compliance with these standards each year, based on the institution's annual audited financial statements, as well as following a change in ownership resulting in a change of control of the institution.
The most significant financial responsibility measurement is the institution's composite score, which is calculated by the DOE based on three ratios:
|
·
|
The equity ratio, which measures the institution's capital resources, ability to borrow and financial viability;
|
| · |
The primary reserve ratio, which measures the institution's ability to support current operations from expendable resources; and
|
| · |
The net income ratio, which measures the institution's ability to operate at a profit.
|
The DOE assigns a strength factor to the results of each of these ratios on a scale from negative 1.0 to positive 3.0, with negative 1.0 reflecting financial weakness and positive 3.0 reflecting financial strength. The DOE then assigns a weighting percentage to each ratio and adds the weighted scores for the three ratios together to produce a composite score for the institution. The composite score must be at least 1.5 for the institution to be deemed financially responsible without the need for further oversight.
If an institution's composite score is below 1.5, but is at least 1.0, it is in a category denominated by the DOE as "the zone." Under the DOE regulations, institutions that are in the zone
typically may be permitted by the DOE to continue to participate in the Title IV Programs by choosing one of two alternatives: 1) the “Zone Alternative” under which an institution is required to make disbursements to students under the Heightened Cash Monitoring 1 (“HCM1”) payment method and to notify the DOE within 10 days after the occurrence of certain oversight and financial events or 2) submit a letter of credit to the DOE equal to 50 percent of the Title IV Program funds received by the institution during its most recent fiscal year. The DOE permits an institution to participate under the “Zone Alternative” for a period of up to three consecutive fiscal years. Under the HCM1 payment method, the institution is required to make Title IV Program disbursements to eligible students and parents before it requests or receives funds for the amount of those disbursements from the DOE. As long as the student accounts are credited before the funding requests are initiated, an institution is permitted to draw down funds through the DOE’s electronic system for grants management and payments for the amount of disbursements made to eligible students. Unlike the Heightened Cash Monitoring 2 (“HCM2”) and reimbursement payment methods, the HCM1 payment method typically does not require schools to submit documentation to the DOE and wait for DOE approval before drawing down Title IV Program funds. Effective July 1, 2016, a school under HCM1, HCM2 or reimbursement payment methods must also pay any credit balances due to a student before drawing down funds for the amount of those disbursements from the DOE, even if the student or parent provides written authorization for the school to hold the credit balance.
If an institution's composite score is below 1.0, the institution is considered by the DOE to lack financial responsibility. If the DOE determines that an institution does not satisfy the DOE's financial responsibility standards, depending on its composite score and other factors, that institution may establish its financial responsibility on an alternative basis by, among other things:
| · |
Posting a letter of credit in an amount equal to at least 50% of the total Title IV Program funds received by the institution during the institution's most recently completed fiscal year; or
|
| · |
Posting a letter of credit in an amount equal to at least 10% of the Title IV Program funds received by the institution during its most recently completed fiscal year accepting provisional certification; complying with additional DOE monitoring requirements and agreeing to receive Title IV Program funds under an arrangement other than the DOE's standard advance funding arrangement
|
The DOE has evaluated the financial responsibility of our institutions on a consolidated basis. We have submitted to the DOE our audited financial statements for the 2016 and 2015 fiscal year reflecting a composite score of 1.5 and 1.9, respectively, based upon our calculations. The DOE reviewed our 2016 composite score and concluded that we were no longer required to operate under the Zone Alternative requirements that we had operated under following the DOE’s review of our 2014 composite score.
For the 2017 fiscal year, we have calculated our composite score to be 1.1. T
his score is subject to determination by the DOE once it receives and reviews our consolidated audited financial statements for the 2017 fiscal year, but we believe it is likely that DOE will determine that our institutions are “in the zone” and that we will be required to operate under the Zone Alternative requirements as well as any other requirements that the DOE might impose in its discretion.
On November 1, 2016, the DOE published new Borrower Defense to Repayment regulations that included expanded standards of financial responsibility that could result in a requirement that we submit to the DOE a substantial letter of credit or other form of financial protection in an amount determined by the DOE, and be subject to other conditions and requirements, based on any one of an extensive list of triggering circumstances. The DOE has delayed the effective date of these regulations until July 1, 2019. If the regulations were not currently delayed, the expanded financial responsibility regulations could result in the DOE recalculating and reducing our composite score to account for DOE estimates of potential losses under some of the circumstances listed above and also could result in requirements to provide financial protection in amounts that are difficult to predict, calculated by the DOE under potentially subjective standards and, in some cases, could be based solely on the existence of proceedings or circumstances that ultimately may lack merit or otherwise not result in liabilities or losses. For example, the currently delayed regulations state that the letter of credit or other form of financial protection required for an institution under the provisional certification alternative must equal 10 percent of the total amount of Title IV Program funds received by the institution during its most recently completed fiscal year plus any additional amount that the DOE determines is necessary to fully cover any estimated losses unless the institution demonstrates that the additional amount is unnecessary to protect, or is contrary to, the Federal interest.
Return of Title IV Program Funds.
An institution participating in Title IV Programs must calculate the amount of unearned Title IV Program funds that have been disbursed to students who withdraw from their educational programs before completing them, and must return those unearned funds to the DOE or the applicable lending institution in a timely manner, which is generally within 45 days from the date the institution determines that the student has withdrawn.
If an institution is cited in an audit or program review for returning Title IV Program funds late for 5% or more of the students in the audit or program review sample or if the regulatory auditor identifies a material weakness in the institution’s report on internal controls relating to the return of unearned Title IV Program funds, the institution may be required to post a letter of credit in favor of the DOE in an amount equal to 25% of the total amount of Title IV Program funds that should have been returned for students who withdrew in the institution's prior fiscal year.
On January 11, 2018, the DOE sent letters to our Columbia, Maryland and Iselin, New Jersey institutions requiring each institution to submit a letter of credit to the DOE based on findings of late returns of Title IV Program funds in the annual Title IV Program compliance audits submitted to the DOE for the fiscal year ended December 31, 2016. Our Iselin institution provided evidence demonstrating that only 3% of the Title IV Program funds returned were late. However, the DOE concluded that a letter of credit would nevertheless be required for each institution because the regulatory auditor included a finding that there was a material weakness in our report on internal controls relating to return of unearned Title IV Program funds. We disagree with the regulatory auditor’s conclusion that a material weakness could exist if the error rate in the expanded audit sample is only 3% or approximately $20,000 and we believe that the regulatory auditor’s conclusion is erroneous. We requested that the DOE reconsider the letter of credit requirement; however, by letter dated February 7, 2018, the DOE maintained that the refund letters of credit were necessary but agreed that the amount of each letter of credit could be based on the returns that were required to be made by each institution in the 2017 fiscal year rather than in the 2016 fiscal year. Accordingly, we submitted letters of credit in the amounts of $0.5 million and $0.1 million to the DOE by the February 23, 2018 deadline and expect that these letters of credit will remain in place for a minimum of two years.
School Acquisitions.
When a company acquires a school that is eligible to participate in Title IV Programs, that school undergoes a change of ownership resulting in a change of control as defined by the DOE. Upon such a change of control, a school's eligibility to participate in Title IV Programs is generally suspended until it has applied for recertification by the DOE as an eligible school under its new ownership, which requires that the school also re-establish its state authorization and accreditation. The DOE may temporarily and provisionally certify an institution seeking approval of a change of control under certain circumstances while the DOE reviews the institution's application. The time required for the DOE to act on such an application may vary substantially. The DOE recertification of an institution following a change of control will be on a provisional basis. Thus, any plans to expand our business through acquisition of additional schools and have them certified by the DOE to participate in Title IV Programs must take into account the approval requirements of the DOE and the relevant state education agencies and accrediting commissions.
Change of Control.
In addition to school acquisitions, other types of transactions can also cause a change of control. The DOE, most state education agencies and our accrediting commissions have standards pertaining to the change of control of schools, but these standards are not uniform. DOE regulations describe some transactions that constitute a change of control, including the transfer of a controlling interest in the voting stock of an institution or the institution's parent corporation. For a publicly traded corporation, DOE regulations provide that a change of control occurs in one of two ways: (a) if a person acquires ownership and control of the corporation so that the corporation is required to file a Current Report on Form 8-K with the Securities and Exchange Commission disclosing the change of control or (b) if the corporation has a shareholder that owns at least 25% of the total outstanding voting stock of the corporation and is the largest shareholder of the corporation, and that shareholder ceases to own at least 25% of such stock or ceases to be the largest shareholder. These standards are subject to interpretation by the DOE.
A significant purchase or disposition of our common stock could be determined by the DOE to be a change of control under this standard.
Most of the states and our accrediting commissions include the sale of a controlling interest of common stock in the definition of a change of control although some agencies could determine that the sale or disposition of a smaller interest would result in a change of control. A change of control under the definition of one of these agencies would require the affected school to reaffirm its state authorization or accreditation. Some agencies would require approval prior to a sale or disposition that would result in a change of control in order to maintain authorization or accreditation. The requirements to obtain such reaffirmation from the states and our accrediting commissions vary widely.
A change of control could occur as a result of future transactions in which the Company or our schools are involved. Some corporate reorganizations and some changes in the board of directors of the Company are examples of such transactions. Moreover, the potential adverse effects of a change of control could influence future decisions by us and our stockholders regarding the sale, purchase, transfer, issuance or redemption of our stock. In addition, the adverse regulatory effect of a change of control also could discourage bids for shares of our common stock and could have an adverse effect on the market price of our shares.
Opening Additional Schools and Adding Educational Programs.
For-profit educational institutions must be authorized by their state education agencies and be fully operational for two years before applying to the DOE to participate in Title IV Programs. However, an institution that is certified to participate in Title IV Programs may establish an additional location and apply to participate in Title IV Programs at that location without reference to the two-year requirement, if such additional location satisfies all other applicable DOE eligibility requirements. Our expansion plans are based, in part, on our ability to open new schools as additional locations of our existing institutions and take into account the DOE's approval requirements.
A student may use Title IV Program funds only to pay the costs associated with enrollment in an eligible educational program offered by an institution participating in Title IV Programs. Generally, unless otherwise required by the DOE, an institution that is eligible to participate in Title IV Programs may add a new educational program without DOE approval if that new program leads to an associate’s level or higher degree and the institution already offers programs at that level, or if that program prepares students for gainful employment in the same or a related occupation as an educational program that has previously been designated as an eligible program at that institution and meets minimum length requirements. Institutions that are provisionally certified may be required to obtain approval of certain educational programs. Two of our institutions (Iselin and Indianapolis) are provisionally certified and required to obtain prior DOE approval of new degree, non-degree, and short-term training educational programs. Our Iselin institution also is subject to prior approval requirements for substantive changes such as new campuses and educational programs as a result of its accrediting agency’s loss of DOE recognition, and the DOE has indicated that such changes only will be approved in limited circumstances. If an institution erroneously determines that an educational program is eligible for purposes of Title IV Programs, the institution would likely be liable for repayment of Title IV Program funds provided to students in that educational program. Our expansion plans are based, in part, on our ability to add new educational programs at our existing schools.
Some of the state education agencies and our accrediting commission also have requirements that may affect our schools' ability to open a new campus, establish an additional location of an existing institution or begin offering a new educational program.
Administrative Capability.
The DOE assesses the administrative capability of each institution that participates in Title IV Programs under a series of separate standards. Failure to satisfy any of the standards may lead the DOE to find the institution ineligible to participate in Title IV Programs or to place the institution on provisional certification as a condition of its participation. These criteria require, among other things, that the institution:
| · |
Comply with all applicable federal student financial aid requirements;
|
| · |
Have capable and sufficient personnel to administer the federal student Title IV Programs;
|
| · |
Administer Title IV Programs with adequate checks and balances in its system of internal controls over financial reporting;
|
| · |
Divide the function of authorizing and disbursing or delivering Title IV Program funds so that no office has the responsibility for both functions;
|
| · |
Establish and maintain records required under the Title IV Program regulations;
|
| · |
Develop and apply an adequate system to identify and resolve discrepancies in information from sources regarding a student’s application for financial aid under the Title IV Program;
|
| · |
Have acceptable methods of defining and measuring the satisfactory academic progress of its students;
|
| · |
Refer to the Office of the Inspector General any credible information indicating that any applicant, student, employee, third party servicer or other agent of the school has been engaged in any fraud or other illegal conduct involving Title IV Programs;
|
| · |
Not be, and not have any principal or affiliate who is, debarred or suspended from federal contracting or engaging in activity that is cause for debarment or suspension;
|
| · |
Provide adequate financial aid counseling to its students;
|
| · |
Submit in a timely manner all reports and financial statements required by the Title IV Program regulations; and
|
| · |
Not otherwise appear to lack administrative capability.
|
Failure by us to satisfy any of these or other administrative capability criteria could cause our institutions to be subject to sanctions or other actions by the DOE or to lose eligibility to participate in Title IV Programs, which would have a significant impact on our business and results of operations.
Restrictions on Payment of Commissions, Bonuses and Other Incentive Payments.
An institution participating in Title IV Programs may not provide any commission, bonus or other incentive payment based directly or indirectly on success in securing enrollments or financial aid to any person or entity engaged in any student recruiting or admission activities or in making decisions regarding the awarding of Title IV Program funds.
The DOE’s regulations established twelve “safe harbors” identifying types of compensation that could be paid without violating the incentive compensation rule. On October 29, 2010, the DOE adopted final rules that took effect on July 1, 2011 and amended the incentive compensation rule by, among other things, eliminating the twelve safe harbors (thereby reducing the scope of permissible compensatory payments under the rule) and expanding the scope of compensatory payments and employees subject to the rule. The DOE has stated that it does not intend to provide private guidance regarding particular compensation structures in the future and will enforce the regulations as written. We cannot predict how the DOE will interpret and enforce the revised incentive compensation rule.
The implementation of the final regulations required us to change our compensation practices and has had and will continue to have a significant impact on the rate at which students enroll in our programs, on the retention of our employees and on our business and results of operations.
Compliance with Regulatory Standards and Effect of Regulatory Violations.
Our schools are subject to audits, program reviews, site visits, and other reviews by various federal and state regulatory agencies, including, but not limited to, the DOE, the DOE's Office of Inspector General, state education agencies and other state regulators, the U.S. Department of Veterans Affairs and other federal agencies, and by our accrediting commissions. In addition, each of our institutions must retain an independent certified public accountant to conduct an annual audit of the institution's administration of Title IV Program funds. The institution must submit the resulting audit report to the DOE for review.
On January 7, 2013, the DOE notified our Columbia, Maryland campus that an on-site Program Review was scheduled to begin on March 4, 2013. The Program Review assessed the institution’s administration of Title IV Programs in which the campus participated for the 2011-2012 and 2012-2013 award years. On June 29, 2015, the DOE issued a Program Review Report that required our Columbia campus to respond to information in the report. On August 2, 2017, the DOE issued its Final Program Review Determination (“FPRD”) letter to our Columbia, Maryland, school that included the DOE’s review of our initial response and corrective actions for the five findings originally noted in the June 29, 2015, program review report. The DOE concluded in its FPRD letter that the school had taken the corrective actions necessary to resolve and close the first four findings. However, with respect to the fifth finding, the DOE concluded that there were violations of the Clery Act, but accepted the school’s response and stated that it now considers the finding closed for program review purposes. However, the DOE reserved the right to impose an administrative action and/or require additional corrective actions by the school in connection with the Clery Act finding in the report. The DOE did not impose any financial liabilities in regard to any of the five findings in the FPRD letter.
On April 26, 2013, the DOE notified our Union, New Jersey campus that an on-site Program Review was scheduled to begin on May 20, 2013. The Program Review assessed the institution’s administration of Title IV Programs in which the campus participated for the 2011-2012 and 2012-2013 award years. On September 30, 2016, the Union, New Jersey campus received a Program Review Report from the DOE. On September 29, 2017, the DOE issued its FPRD that closed the review and indicated that the DOE had determined the Company’s financial liability to the DOE resulting from the FPRD to be $175, which has been paid by the Company to the DOE
.
On July 6, 2017, the DOE notified our Indianapolis, Indiana campus that an on-site Program Review was scheduled to begin on August 14, 2017. The Program Review assessed the institution’s administration of Title IV Programs in which the campus participated for the 2015-2016 and 2016-2017 award years. On February 21, 2018, the Indianapolis school received a Program Review Report from the DOE and the review was closed with no findings. The school continues to be provisionally certified due to this program review.
If one of our schools fails to comply with accrediting or state licensing requirements, such school and its main and/or branch campuses could be subject to the loss of state licensure or accreditation, which in turn could result in a loss of eligibility to participate in Title IV Programs. If the DOE or another agency determined that one of our institutions improperly disbursed Title IV Program funds or violated a provision of the HEA or DOE regulations, the institution could be required to repay such funds and related costs to the DOE and lenders, and could be assessed an administrative fine. The DOE could also place the institution on provisional certification status and/or transfer the institution to the reimbursement or cash monitoring system of receiving Title IV Program funds, under which an institution must disburse its own funds to students and document the students' eligibility for Title IV Program funds before receiving such funds from the DOE. See “Regulatory Environment – Financial Responsibility Standards.”
Significant violations of Title IV Program requirements by the Company or any of our institutions could be the basis for the DOE to limit, suspend or terminate the participation of the affected institution in Title IV Programs or to seek civil or criminal penalties. Generally, such a termination of Title IV Program eligibility extends for 18 months before the institution may apply for reinstatement of its participation. There is no DOE proceeding pending to fine any of our institutions or to limit, suspend or terminate any of our institutions' participation in Title IV Programs.
We and our schools are also subject to claims and lawsuits relating to regulatory compliance brought not only by federal and state regulatory agencies and our accrediting bodies, but also by third parties, such as present or former students or employees and other members of the public. If we are unable to successfully resolve or defend against any such claim or lawsuit, we may be required to pay money damages or be subject to fines, limitations, loss of federal funding, injunctions or other penalties. Moreover, even if we successfully resolve or defend against any such claim or lawsuit, we may have to devote significant financial and management resources in order to reach such a result.
The risk factors described below and other information included elsewhere in this Form 10-K are among the numerous risked faced by our Company and should be carefully considered before deciding to invest in, sell or retain shares of our common stock. The risks and uncertainties described below are not the only ones we face.
RISKS RELATED TO OUR INDUSTRY
Our failure to comply with the extensive regulatory requirements for participation in Title IV Programs and school operations could result in financial penalties, restrictions on our operations and loss of external financial aid funding, which could affect our revenues and impose significant operating restrictions on us.
Our industry is highly regulated by federal and state governmental agencies and by accrediting commissions. In particular, the HEA and DOE regulations specify extensive criteria and numerous standards that an institution must satisfy to establish to participate in the Title IV Programs. For a description of these criteria, see “Regulatory Environment.”
If we are found not to have satisfied the DOE's requirements for Title IV Programs funding, one or more of our institutions, including its additional locations, could be limited in its access to, or lose, Title IV Program funding, which could adversely affect our revenue, as we received approximately 78% of our revenue (calculated based on cash receipts) from Title IV Programs in 2017, and have a significant impact on our business and results of operations. Furthermore, if any of our schools fails to comply with applicable regulatory requirements, the school and its related main campus and/or additional locations could be subject to, among other things, the loss of state licensure or accreditation, the loss of eligibility to participate in and receive funds under the Title IV Programs, the loss of the ability to grant degrees, diplomas and certificates, provisional certification, or the imposition of liabilities or monetary penalties, any of which could adversely affect our revenues and impose significant operating restrictions upon us. In addition, the loss by any of our schools of its accreditation, its state authorization or license, or its eligibility to participate in Title IV Programs would constitute an event of default under our credit agreement with our lender, which could result in the acceleration of all amounts then outstanding with respect to our outstanding loan obligations. The various regulatory agencies applicable to our business periodically revise their requirements and modify their interpretations of existing requirements and restrictions. We cannot predict with certainty how any of these regulatory requirements will be applied or whether each of our schools will be able to comply with these requirements or any additional
requirements instituted in the future.
If we fail to demonstrate "administrative capability" to the DOE, our business could suffer.
DOE regulations specify extensive criteria an institution must satisfy to establish that it has the requisite "administrative capability" to participate in Title IV Programs. For a description of these criteria, see “Regulatory Environment – Administrative Capability.”
If we are found not to have satisfied the DOE's "administrative capability" requirements, or otherwise failed to comply with one or more DOE requirements, one or more of our institutions, including its additional locations, could be limited in its access to, or lose, Title IV Program funding. A loss or decrease in Title IV funding could adversely affect our revenue, as we received approximately 78% of our revenue (calculated based on cash receipts) from Title IV Programs in 2017, which would have a significant impact on our business and results of operations.
Congress and the DOE may make changes to the laws and regulations applicable to, or reduce funding for, Title IV Programs, which could reduce our student population, revenues or profit margin.
Congress periodically revises the HEA and other laws governing Title IV Programs and annually determines the funding level for each Title IV Program. We cannot predict what if any legislative or other actions will be taken or proposed by Congress in connection with the reauthorization of the HEA or with other activities of Congress. See “Regulatory Environment – Congressional Action.” Because a significant percentage of our revenues are derived from the Title IV programs, any action by Congress or the DOE that significantly reduces funding for Title IV Programs or that limits or restricts the ability of our schools, programs, or students to receive funding through those Programs or that imposes new restrictions or constraints upon our business or operations could reduce our student enrollment and our revenues, and could increase our administrative costs and require us to modify our practices in order for our schools to comply fully with Title IV program requirements. In addition, current requirements for student or school participation in Title IV Programs may change or one or more of the present Title IV Programs could be replaced by other programs with materially different student or school eligibility requirements. If we cannot comply with the provisions of the HEA, as they may be revised, or if the cost of such compliance is excessive, or if funding is materially reduced, our revenues or profit margin could be materially adversely affected.
The DOE has changed its regulations, and may make other changes in the future, in a manner which could require us to incur additional costs in connection with our administration of the Title IV Programs, affect our ability to remain eligible to participate in the Title IV Programs, impose restrictions on our participation in the Title IV Programs, affect the rate at which students enroll in our programs, or otherwise have a significant impact on our business and results of operations.
In October 2014, the DOE issued final regulations on gainful employment requiring each educational program to achieve threshold rates in two debt measure categories related to an annual debt to annual earnings ratio and an annual debt to discretionary income ratio. The regulations outline various scenarios under which programs could lose Title IV Program eligibility for failure to achieve threshold rates in one or more measures over certain periods of time ranging from two to four years. The regulations also require an institution to provide warnings to students in programs which may lose Title IV Program eligibility at the end of an award year. The final regulations also contain other provisions that, among other things, include disclosure, reporting, new program approval, and certification requirements. See “Regulatory Environment – Gainful Employment.”
The DOE announced its intent to convene a negotiated rulemaking committee to develop proposed regulations to revise the gainful employment regulations. The DOE has not established a final schedule for publication of proposed or final regulations. Any regulations published in final form by November 1, 2018 typically would take effect in July 1, 2019, but we cannot provide any assurances as to the timing or content of any such regulations.
On June 30, 2017, the DOE announced the extension of the compliance date for certain gainful employment disclosure requirements from July 1, 2017 to July 1, 2018. The DOE stated that institutions are still required to comply with other gainful employment disclosure requirements by July 1, 2017. On August 18, 2017, the DOE announced in the Federal Register
new deadlines for submitting notices of intent to file alternate earnings appeals of gainful employment rates and for submitting alternate earnings appeals of those rates. The deadline to file a notice of intent to file an appeal was October 6, 2017 and the deadline to file the alternate earnings appeal was February 1, 2018. The DOE has not announced a delay or suspension in the enforcement of any other gainful employment regulations. However, on August 8, 2017, DOE officials announced that the DOE did not have a timetable for the issuance of completer lists to schools, which is the first step toward generating the data for calculating new gainful employment rates. Consequently, we cannot predict when the DOE will begin the process of calculating and issuing new draft or final gainful employment rates in the future. We also cannot predict whether the announcement of the intent to initiate gainful employment rulemaking or the extension of certain gainful employment deadlines may result in the DOE delaying the issuance of new draft or final gainful employment rates in the future.
In January 2016, the DOE began negotiated rulemaking to develop proposed regulations regarding a borrower’s ability to allege acts or omissions by an institution as a defense to the repayment of certain Title IV loans and the consequences to the borrower, the DOE, and the institution. See “Regulatory Environment – Borrower Defense to Repayment Regulations.” On November 1, 2016, the DOE published in the Federal Register the final version of these regulations with a general effective date of July 1, 2017 and which, among other things, include rules for:
| · |
establishing new processes, and updating existing processes, for enabling borrowers to obtain from the DOE a discharge of some or all of their federal student loans based on circumstances such as certain acts or omissions of the institution and for the DOE to impose and collect liabilities against the institution following the loan discharges;
|
| · |
establishing expanded standards of financial responsibility (see “Financial Responsibility Standards”);
|
| · |
requiring institutions to make disclosures to current and prospective students regarding the existence of certain of the circumstances identified in the expanded standards of financial responsibility;
|
| · |
calculating a loan repayment rate for each proprietary institution under standards established by the regulations and requiring institutions to provide warnings to current and prospective students if the institution has a loan repayment rate below specified thresholds;
|
| · |
prohibiting certain contractual provisions imposed by or on behalf of schools on students regarding arbitration, dispute resolution, and participation in class actions; and
|
| · |
expanding the existing definition of misrepresentations that could result in grounds for discharge of student loans and in liabilities and sanctions against the institution, including, without limitation, potential loss of Title IV eligibility.
|
On January 19, 2017, the DOE issued new regulations that update the Department’s hearing procedures for actions to establish liability against an institution and to establish procedural rules governing recovery proceedings under the DOE’s borrower defense to repayment regulations.
The DOE has delayed the effective date of a majority of these regulations until July 1, 2019 to ensure that there is adequate time to conduct negotiated rulemaking and, as necessary, develop revised regulations. The DOE intends to issue proposed regulations for public comment during the first half of 2018, but the DOE has not established a final schedule. Any regulations published in final form by November 1, 2018 typically would take effect on July 1, 2019, but we cannot provide any assurances as to the timing or content of any such regulations or whether and when the DOE might end the delay in the effective date of the previously published regulations.
We cannot predict how the DOE would interpret and enforce the new borrower defense to repayment rules if they take effect after the delay or how these rules, or any rules that may arise out of the negotiated rulemaking process or any other rules that DOE may promulgate on this or other topics, may impact our schools’ participation in the Title IV programs; however, the new rules could have a material adverse effect on our schools’ business and results of operations, and the broad sweep of the rules may, in the future, require our schools to submit a letter of credit based on expanded standards of financial responsibility as indicated above.
If we or our eligible institutions do not meet the financial responsibility standards prescribed by the DOE, we may be required to post letters of credit or our eligibility to participate in Title IV Programs could be terminated or limited, which could significantly reduce our student population and revenues.
To participate in Title IV Programs, an eligible institution must satisfy specific measures of financial responsibility prescribed by the DOE or post a letter of credit in favor of the DOE and possibly accept other conditions on its participation in Title IV Programs. The DOE published new regulations, currently delayed until July 1, 2019, that
establish expanded standards of financial responsibility that could result in a requirement that we submit to the DOE a substantial letter of credit or other form of financial protection in an amount determined by the DOE, and be subject to other conditions and requirements, based on any one of an extensive list of triggering circumstances
. See “Regulatory Environment – Financial Responsibility Standards.” Any obligation to post one or more letters of credit would increase our costs of regulatory compliance. Our inability to obtain a required letter of credit or limitations on, or termination of, our participation in Title IV Programs could limit our students' access to various government-sponsored student financial aid programs, which could significantly reduce our student population and revenues.
We are subject to fines and other sanctions if we pay impermissible commissions, bonuses or other incentive payments to individuals involved in certain recruiting, admissions or financial aid activities, which could increase our cost of regulatory compliance and adversely affect our results of operations.
An institution participating in Title IV Programs may not provide any commission, bonus or other incentive payment based directly or indirectly on success in enrolling students or securing financial aid to any person involved in any student recruiting or admission activities or in making decisions regarding the awarding of Title IV Program funds. See “Regulatory Environment --
Restrictions on Payment of Commissions, Bonuses and Other Incentive Payments.”
We cannot predict how the DOE will interpret and enforce the incentive compensation rule. The implementation of these regulations has required us to change our compensation practices and has had and may continue to have a significant impact on the rate at which students enroll in our programs and on our business and results of operations. If we are found to have violated this law, we could be fined or otherwise sanctioned by the DOE or we could face litigation filed under the
qui tam
provisions of the Federal False Claims Act.
If our schools do not maintain their accreditation, they may not participate in Title IV Programs, which could adversely affect our student population and revenues.
An institution must be accredited by an accrediting commission recognized by the DOE in order to participate in Title IV Programs. Our Iselin school and its branch campuses are accredited by an accrediting commission that is no longer recognized by the DOE, and therefore, must obtain accreditation from a new accrediting commission by June 12, 2018 in order to continue participating in Title IV Programs and is subject to additional conditions imposed by the DOE prior to that date. As discussed under the “Regulatory Environment – Accreditation,” we have applied to another accrediting agency, ACCSC, for accreditation of our Iselin school and its branch campuses. If our Iselin school and its campuses are unable to obtain initial accreditation from ACCSC by June 12, 2018, then our Iselin school and its branch campuses would lose Title IV Program eligibility as of that date. If any of our schools fails to comply with accrediting commission requirements, the institution and its main and/or branch campuses are subject to the loss of accreditation or may be placed on probation or a special monitoring or reporting status which, if the noncompliance with accrediting commission requirements is not resolved, could result in loss of accreditation. Loss of accreditation by any of our main campuses would result in the termination of eligibility of that school and all of its branch campuses to participate in Title IV Programs and could cause us to close the school and its branches, which could have a significant adverse impact on our business and operations.
Programmatic accreditation is the process through which specific programs are reviewed and approved by industry- and program-specific accrediting entities. Although programmatic accreditation is not generally necessary for Title IV eligibility, such accreditation may be required to allow students to sit for certain licensure exams or to work in a particular profession or career or to meet other requirements. Failure to obtain or maintain such programmatic accreditation may lead to a decline in enrollments in such programs. Moreover, under new gainful employment regulations issued by the DOE, institutions
are
required to certify that they have programmatic accreditation under certain circumstances. See “Regulatory Environment – Gainful Employment.” Failure to comply with these new requirements could impact the Title IV eligibility of educational programs that are required to maintain such programmatic accreditation.
Our institutions would lose eligibility to participate in Title IV Programs if the percentage of their revenues derived from those programs exceeds 90%, which could reduce our student population and revenues.
Under the HEA reauthorization, a proprietary institution that derives more than 90% of its total revenue from Title IV Programs for two consecutive fiscal years becomes immediately ineligible to participate in Title IV Programs and may not reapply for eligibility until the end of at least two fiscal years. An institution with revenues exceeding 90% for a single fiscal year will be placed on provisional certification and may be subject to other enforcement measures. See “Regulatory Environment – 90/10 Rule.” If any of our institutions loses eligibility to participate in Title IV Programs, that loss would cause an event of default under our credit agreement, would also adversely affect our students’ access to various government-sponsored student financial aid programs, and would have a significant impact on the rate at which our students enroll in our programs and on our business and results of operations.
Our institutions would lose eligibility to participate in Title IV Programs if their former students defaulted on repayment of their federal student loans in excess of specified levels, which could reduce our student population and revenues.
An institution may lose its eligibility to participate in some or all Title IV Programs if the rates at which the institution's current and former students default on their federal student loans exceed specified percentages. See “Regulatory Environment – Student Loan Defaults.” If former students defaulted on repayment of their federal student loans in excess of specified levels, our institutions would lose eligibility to participate in Title IV Programs, would cause an event of default under our credit agreement, would also adversely affect our students’ access to various government-sponsored student financial aid programs, and would have a significant impact on the rate at which our students enroll in our programs and on our business and results of operations. .
We are subject to sanctions if we fail to correctly calculate and timely return Title IV Program funds for students who withdraw before completing their educational program, which could increase our cost of regulatory compliance and decrease our profit margin.
An institution participating in Title IV Programs must correctly calculate the amount of unearned Title IV Program funds that have been credited to students who withdraw from their educational programs before completing them and must return those unearned funds in a timely manner, generally within 45 days of the date the institution determines that the student has withdrawn. If the unearned funds are not properly calculated and timely returned, we may have to post a letter of credit in favor of the DOE or may be otherwise sanctioned by the DOE, which could increase our cost of regulatory compliance and adversely affect our results of operations. Based upon the findings of an annual Title IV Program compliance audit of our Columbia, Maryland and Iselin, New Jersey institutions, the Company submitted letters of credit in the amounts of $0.5 million and $0.1 million to the DOE. We are required to maintain those letters of credit in place for a minimum of two years.
See “Regulatory Environment – Return of Title IV Program Funds.”
Regulatory agencies or third parties may conduct compliance reviews, bring claims or initiate litigation against us. If the results of these reviews or claims are unfavorable to us, our results of operations and financial condition could be adversely affected.
Because we operate in a highly regulated industry, we are subject to compliance reviews and claims of noncompliance and lawsuits by government agencies and third parties. If the results of these reviews or proceedings are unfavorable to us, or if we are unable to defend successfully against third-party lawsuits or claims, we may be required to pay money damages or be subject to fines, limitations on the operations of our business, loss of federal and state funding, injunctions or other penalties. Even if we adequately address issues raised by an agency review or successfully defend a third-party lawsuit or claim, we may have to divert significant financial and management resources from our ongoing business operations to address issues raised by those reviews or defend those lawsuits or claims. Certain of our institutions are subject to ongoing reviews and proceedings. See “Regulatory Environment – State Authorization,” “Regulatory Environment – Accreditation,” and “Regulatory Environment - Compliance with Regulatory Standards and Effect of Regulatory Violations.”
A decline in the overall growth of enrollment in
post-secondary
institutions, or in our core disciplines, could cause us to experience lower enrollment at our schools, which could negatively impact our future growth.
Enrollment in post-secondary institutions over the next ten years is expected to be slower than in the prior ten years. In addition, the number of high school graduates eligible to enroll in post-secondary institutions is expected to fall before resuming a growth pattern for the foreseeable future. In order to increase our current growth rates in degree granting programs, we will need to attract a larger percentage of students in existing markets and expand our markets by creating new academic programs. In addition, if job growth in the fields related to our core disciplines is weaker than expected, as a result of any regional or national economic downturn or otherwise, fewer students may seek the types of diploma or degree granting programs that we offer or seek to offer. Our failure to attract new students, or the decisions by prospective students to seek diploma or degree programs in other disciplines, would have an adverse impact on our future growth.
Our business could be adversely impacted by additional legislation, regulations, or investigations regarding private student lending because students attending our schools rely on private student loans to pay tuition and other institutional charges.
The U.S. Consumer Financial Protection Bureau (“CFPB”), under the Dodd-Frank Wall Street Reform and Consumer Protection Act of 2010, has exercised supervisory authority over private education loan providers. The CFPB has been active in conducting investigations into the private student loan market and issuing several reports with findings that are critical of the private student loan market. The CFPB has initiated investigations into the lending practices of other institutions in the for-profit education sector. The CFPB has issued procedures for further examination of private education loans and published requests for information regarding repayment plans and regarding arrangements between schools and financial institutions. On August 31, 2017, the DOE informed CFPB that it was terminating an information sharing Memorandum of Understanding between the two agencies, in part because the CFPB was acting on student complaints rather than referring them to the DOE for action. The DOE asserted full oversight responsibility for federal student loans, but not with respect to private loans. In late November 2017, new leadership at the CFPB began taking steps to end or pause certain investigations and to restrict or reconsider some its enforcement activities. However, it is unclear the extent to which the CFPB will continue to exercise oversight authority over private education loan providers.
We cannot predict whether any of this activity, or other activities, will result in Congress, the DOE, the CFPB or other regulators adopting new legislation or regulations, or conducting new investigations, into the private student loan market or into the loans received by our students to attend our institutions. Any new legislation, regulations, or investigations regarding private student lending could limit the availability of private student loans to our students, which could have a significant impact on our business and operations.
RISKS RELATED TO OUR BUSINESS
Our success depends in part on our ability to update and expand the content of existing programs and develop new programs in a cost-effective manner and on a timely basis.
Prospective employers of our graduates increasingly demand that their entry-level employees possess appropriate technological skills. These skills are becoming more sophisticated in line with technological advancements in the automotive, diesel, information technology, and skilled trades. Accordingly, educational programs at our schools must keep pace with those technological advancements. The expansion of our existing programs and the development of new programs may not be accepted by our students, prospective employers or the technical education market. Even if we are able to develop acceptable new programs, we may not be able to introduce these new programs as quickly as our competitors or as quickly as employers demand. If we are unable to adequately respond to changes in market requirements due to financial constraints, unusually rapid technological changes or other factors, our ability to attract and retain students could be impaired, our placement rates could suffer and our revenues could be adversely affected.
In addition, if we are unable to adequately anticipate the requirements of the employers we serve, we may offer programs that do not teach skills useful to prospective employers or students seeking a technical or career-oriented education which could affect our placement rates and our ability to attract and retain students, causing our revenues to be adversely affected.
Competition could decrease our market share and cause us to lower our tuition rates.
The post-secondary education market is highly competitive. Our schools compete for students and faculty with traditional public and private two-year and four-year colleges and universities and other proprietary schools, many of which have greater financial resources than we do. Some traditional public and private colleges and universities, as well as other private career-oriented schools, offer programs that may be perceived by students to be similar to ours. Most public institutions are able to charge lower tuition than our schools, due in part to government subsidies and other financial resources not available to for-profit schools. Some of our competitors also have substantially greater financial and other resources than we have which may, among other things, allow our competitors to secure strategic relationships with some or all of our existing strategic partners or develop other high profile strategic relationships, or devote more resources to expanding their programs and their school network, or provide greater financing alternatives to their students, all of which could affect the success of our marketing programs. In addition, some of our competitors have a larger network of schools and campuses than we do, enabling them to recruit students more effectively from a wider geographic area. If we are unable to compete effectively with these institutions for students, our student enrollment and revenues will be adversely affected.
We may be required to reduce tuition or increase spending in response to competition in order to retain or attract students or pursue new market opportunities. As a result, our market share, revenues and operating margin may be decreased. We cannot be sure that we will be able to compete successfully against current or future competitors or that the competitive pressures we face will not adversely affect our revenues and profitability.
Our financial performance depends in part on our ability to continue to develop awareness and acceptance of our programs among high school graduates and working adults looking to return to school.
The awareness of our programs among high school graduates and working adults looking to return to school is critical to the continued acceptance and growth of our programs. Our inability to continue to develop awareness of our programs could reduce our enrollments and impair our ability to increase our revenues or maintain profitability. The following are some of the factors that could prevent us from successfully marketing our programs:
| · |
Student dissatisfaction with our programs and services;
|
| · |
Diminished access to high school student populations;
|
| · |
Our failure to maintain or expand our brand or other factors related to our marketing or advertising practices; and
|
| · |
Our inability to maintain relationships with employers in the automotive, diesel, skilled trades and IT services industries.
|
An increase in interest rates could adversely affect our ability to attract and retain students.
Our students and their families have benefitted from historic lows on student loan interest rates in recent years. Much of the financing our students receive is tied to floating interest rates. Recently, however, student loan interest rates have been edging higher, making borrowing for education more expensive. Increases in interest rates result in a corresponding increase in the cost to our existing and prospective students of financing their education, which could result in a reduction in the number of students attending our schools and could adversely affect our results of operations and revenues. Higher interest rates could also contribute to higher default rates with respect to our students' repayment of their education loans. Higher default rates may in turn adversely impact our eligibility for Title IV Program participation or the willingness of private lenders to make private loan programs available to students who attend our schools, which could result in a reduction in our student population.
A substantial decrease in student financing options, or a significant increase in financing costs for our students, could have a significant impact on our student population, revenues and financial results.
The consumer credit markets in the United States have recently suffered from increases in default rates and foreclosures on mortgages. Adverse market conditions for consumer and federally guaranteed student loans could result in providers of alternative loans reducing the attractiveness and/or decreasing the availability of alternative loans to post-secondary students, including students with low credit scores who would not otherwise be eligible for credit-based alternative loans. Prospective students may find that these increased financing costs make borrowing prohibitively expensive and abandon or delay enrollment in post-secondary education programs. Private lenders could also require that we pay them new or increased fees in order to provide alternative loans to prospective students. If any of these scenarios were to occur, our students’ ability to finance their education could be adversely affected and our student population could decrease, which could have a significant impact on our financial condition, results of operations and cash flows.
In addition, any actions by the U.S. Congress or by states that significantly reduce funding for Title IV Programs or other student financial assistance programs, or the ability of our students to participate in these programs, or establish different or more stringent requirements for our schools to participate in those programs, could have a significant impact on our student population, results of operations and cash flows.
Our total assets include substantial intangible assets. In the event that our schools do not achieve satisfactory operating results, we may be required to write-off a significant portion of unamortized intangible assets which would negatively affect our results of operations.
Our total assets reflect substantial intangible assets. At December 31, 2017, goodwill and identified intangibles, net, associated with our acquisitions increased to approximately 9.4% from 8.9% of total assets at December 31, 2016. On at least an annual basis, we assess whether there has been an impairment in the value of goodwill and other intangible assets with indefinite lives. If the carrying value of the tested asset exceeds its estimated fair value, impairment is deemed to have occurred. In this event, the amount is written down to fair value. Under current accounting rules, this would result in a charge to operating earnings. Any determination requiring the write-off of a significant portion of goodwill or unamortized identified intangible assets would negatively affect our results of operations and total capitalization, which could be material.
We cannot predict our future capital needs, and if we are unable to secure additional financing when needed, our operations and revenues would be adversely affected.
We may need to raise additional capital in the future to fund acquisitions, working capital requirements, expand our markets and program offerings or respond to competitive pressures or perceived opportunities. We cannot be sure that additional financing will be available to us on favorable terms, or at all. If adequate funds are not available when required or on acceptable terms, we may be forced to forego attractive acquisition opportunities, cease our operations and, even if we are able to continue our operations, our ability to increase student enrollment and revenues would be adversely affected.
We may not be able to retain our key personnel or hire and retain the personnel we need to sustain and grow our business.
Our success has depended, and will continue to depend, largely on the skills, efforts and motivation of our executive officers who generally have significant experience within the post-secondary education industry. Our success also depends in large part upon our ability to attract and retain highly qualified faculty, school directors, administrators and corporate management. Due to the nature of our business, we face significant competition in the attraction and retention of personnel who possess the skill sets that we seek. In addition, key personnel may leave us and subsequently compete against us. Furthermore, we do not currently carry "key man" life insurance on any of our employees. The loss of the services of any of our key personnel, or our failure to attract and retain other qualified and experienced personnel on acceptable terms, could have an adverse effect on our ability to operate our business efficiently and to execute our growth strategy.
Strikes by our employees may disrupt our ability to hold classes as well as our ability to attract and retain students, which could materially adversely affect our operations. In addition, we contribute to multiemployer benefit plans that could result in liabilities to us if these plans are terminated or we withdraw from them.
As of December 31, 2017, the teaching professionals at six of our campuses are represented by unions and covered by collective bargaining agreements that expire between 2018 and 2020. Although we believe that we have good relationships with these unions and with our employees, any strikes or work stoppages by our employees could adversely impact our relationships with our students, hinder our ability to conduct business and increase costs.
We also contribute to multiemployer pension plans for some employees covered by collective bargaining agreements. These plans are not administered by us, and contributions are determined in accordance with provisions of negotiated labor contracts. The Employee Retirement Income Security Act of 1974, as amended by the Multiemployer Pension Plan Amendments Act of 1980, imposes certain liabilities upon employers who are contributors to a multiemployer plan in the event of the employer’s withdrawal from, or upon termination of, such plan. We do not routinely review information on the net assets and actuarial present value of the multiemployer pension plans’ unfunded vested benefits allocable to us, if any, and we are not presently aware of any material amounts for which we may be contingently liable if we were to withdraw from any of these plans. In addition, if any of these multiemployer plans enters “critical status” under the Pension Protection Act of 2006, we could be required to make significant additional contributions to those plans.
Anti-takeover provisions in our amended and restated certificate of incorporation, our bylaws and New Jersey law could discourage a change of control that our stockholders may favor, which could negatively affect our stock price.
Provisions in our amended and restated certificate of incorporation and our bylaws and applicable provisions of the New Jersey Business Corporation Act may make it more difficult and expensive for a third party to acquire control of us even if a change of control would be beneficial to the interests of our stockholders. These provisions could discourage potential takeover attempts and could adversely affect the market price of our common stock. For example, applicable provisions of the New Jersey Business Corporation Act may discourage, delay or prevent a change in control by prohibiting us from engaging in a business combination with an interested stockholder for a period of five years after the person becomes an interested stockholder. Furthermore, our amended and restated certificate of incorporation and bylaws:
| · |
authorize the issuance of blank check preferred stock that could be issued by our board of directors to thwart a takeover attempt;
|
| · |
prohibit cumulative voting in the election of directors, which would otherwise allow holders of less than a majority of stock to elect some directors;
|
| · |
require super-majority voting to effect amendments to certain provisions of our amended and restated certificate of incorporation;
|
| · |
limit who may call special meetings of both the board of directors and stockholders;
|
| · |
prohibit stockholder action by non-unanimous written consent and otherwise require all stockholder actions to be taken at a meeting of the stockholders;
|
| · |
establish advance notice requirements for nominating candidates for election to the board of directors or for proposing matters that can be acted upon by stockholders at stockholders' meetings; and
|
| · |
require that vacancies on the board of directors, including newly created directorships, be filled only by a majority vote of directors then in office.
|
We can issue shares of preferred stock without stockholder approval, which could adversely affect the rights of common stockholders.
Our amended and restated certificate of incorporation permits us to establish the rights, privileges, preferences and restrictions, including voting rights, of future series of our preferred stock and to issue such stock without approval from our stockholders. The rights of holders of our common stock may suffer as a result of the rights granted to holders of preferred stock that may be issued in the future. In addition, we could issue preferred stock to prevent a change in control of our Company, depriving common stockholders of an opportunity to sell their stock at a price in excess of the prevailing market price.
The trading price of our common stock may continue to fluctuate substantially in the future.
Our stock price has declined substantially over the past five years and has and may fluctuate significantly as a result of a number of factors, some of which are not in our control. These factors include:
| · |
general economic conditions;
|
| · |
general conditions in the for-profit, post-secondary education industry;
|
| · |
negative media coverage of the for-profit, post-secondary education industry;
|
| · |
failure of certain of our schools or programs to maintain compliance under the gainful employment regulation, 90-10 Rule or with financial responsibility standards;
|
| · |
the impact of DOE rulemaking and other changes in the highly regulated environment in which we operate;
|
| · |
the initiation, pendency or outcome of litigation, accreditation reviews and regulatory reviews, inquiries and investigations;
|
| · |
loss of key personnel;
|
| · |
quarterly variations in our operating results;
|
| · |
our ability to meet or exceed, or changes in, expectations of investors and analysts, or the extent of analyst coverage of us; and
|
| · |
decisions by any significant investors to reduce their investment in our common stock.
|
In addition, the trading volume of our common stock is relatively low. This may cause our stock price to react more to these factors and various other factors and may impact an investor’s ability to sell our common stock at the desired time at a price considered satisfactory. Any of these factors may adversely affect the trading price of our common stock, regardless of our actual operating performance, and could prevent an investor from selling shares of our common stock at or above the price at which the investor purchased them.
System disruptions to our technology infrastructure could impact our ability to generate revenue and could damage the reputation of our institutions.
The performance and reliability of our technology infrastructure is critical to our reputation and to our ability to attract and retain students. We license the software and related hosting and maintenance services for our online platform and our student information system from third-party software providers. Any system error or failure, or a sudden and significant increase in bandwidth usage, could result in the unavailability of systems to us or our students or result in delays and/or errors in processing student financial aid and related disbursements. Any such system disruptions could impact our ability to generate revenue and affect our ability to access information about our students and could also damage the reputation of our institutions.
Any of the cyber-attacks, breaches or other disruptions or damage described above could interrupt our operations, result in theft of our and our students’ data or result in legal claims and proceedings, liability and penalties under privacy laws and increased cost for security and remediation, each of which could adversely affect our business and financial results.
We may be required to expend significant resources to protect against system errors, failures or disruptions or to repair problems caused by any actual errors, disruptions or failures.
We are subject to privacy and information security laws and regulations due to our collection and use of personal information, and any violations of those laws or regulations, or any breach, theft or loss of that information, could adversely affect our reputation and operations.
Our efforts to attract and enroll students result in us collecting, using and storing substantial amounts of personal information regarding applicants, our students, their families and alumni, including social security numbers and financial data. We also maintain personal information about our employees in the ordinary course of our activities. Our services, the services of many of our health plan and benefit plan vendors, and other information can be accessed globally through the Internet. We rely extensively on our network of interconnected applications and databases for day to day operations as well as financial reporting and the processing of financial transactions. Our computer networks and those of our vendors that manage confidential information for us or provide services to our student may be vulnerable to cyber-attacks and breaches, acts of vandalism, ransomware, software viruses and other similar types of malicious activities.
Regular patching of our computer systems and frequent updates to our virus detection and prevention software with the latest virus and malware signatures may not catch newly introduced malware and viruses or “zero-day” viruses, prior to their infecting our systems and potentially disrupting our data integrity, taking sensitive information or affecting financial transactions. While we utilize security and business controls to limit access to and use of personal information, any breach of student or employee privacy or errors in storing, using or transmitting personal information could violate privacy laws and regulations resulting in fines or other penalties. A wide range of high profile data breaches in recent years has led to renewed interest in federal data and cybersecurity legislation that could increase our costs and/or require changes in our operating procedures or systems. A breach, theft or loss of personal information held by us or our vendors, or a violation of the laws and regulations governing privacy could have a material adverse effect on our reputation or result in lawsuits, additional regulation, remediation and compliance costs or investments in additional security systems to protect our computer networks, the costs of which may be substantial.
Changes in U.S. tax laws or adverse outcomes from examination of our tax returns could have an adverse effect upon our financial results.
We are subject to income tax requirements in various jurisdictions in the United States. Legislation or other changes in the tax laws of the jurisdictions where we do business could increase our liability and adversely affect our after-tax profitability. In the United States, the Tax Cuts and Jobs Act, which was enacted on December 22, 2017, could have a significant impact on our effective tax rate, net deferred tax assets and cash tax expenses. The Tax Cuts and Jobs Act, among other things, reduces the U.S. corporate statutory tax rate, repeals the corporate alternative minimum tax, changes how existing corporate alternative minimum tax credits can be realized either to offset regular tax liability or to be refunded, and eliminates or limits deduction of several expenses which were previously deductible. We are currently evaluating the overall impact of the Tax Cuts and Jobs Act on our effective tax rate and balance sheet, but expect that the impact may be significant for our fiscal year 2018 and future periods.
In addition, we are subject to examination of our income tax returns by the Internal Revenue Service and the taxing authorities of various states. We regularly assess the likelihood of adverse outcomes resulting from tax examinations to determine the adequacy of our provision for income taxes and we have accrued tax and related interest for potential adjustments to tax liabilities for prior years. However, there can be no assurance that the outcomes from these tax examinations will not have a material effect, either positive or negative, on our business, financial conditions and results of operation.
None.
As of December 31, 2017, we leased all of our facilities, except for our campuses in Nashville, Tennessee, Grand Prairie, Texas, and Denver, Colorado, and former school properties in Mangonia Park, Palm Beach County, Florida and Suffield, Connecticut, all of which we own. We continue to re-evaluate our facilities to maximize our facility utilization and efficiency and to allow us to introduce new programs and attract more students. As of December 31, 2017, all of our existing leases expire between December 2018 and May 2030.
The following table provides information relating to our facilities as of December 31, 2017, including our corporate office:
|
Location
|
Brand
|
Approximate Square Footage
|
||
|
Henderson, Nevada
|
Euphoria Institute
|
18,000
|
||
|
Las Vegas, Nevada
|
Euphoria Institute
|
19,000
|
||
|
Southington, Connecticut
|
Lincoln College of New England
|
113,000
|
||
|
Columbia, Maryland
|
Lincoln College of Technology
|
110,000
|
||
|
Denver, Colorado
|
Lincoln College of Technology
|
212,000
|
||
|
Grand Prairie, Texas
|
Lincoln College of Technology
|
146,000
|
||
|
Indianapolis, Indiana
|
Lincoln College of Technology
|
189,000
|
||
|
Marietta, Georgia
|
Lincoln College of Technology
|
30,000
|
||
|
Melrose Park, Illinois
|
Lincoln College of Technology
|
88,000
|
||
|
West Palm Beach, Florida
|
|
27,000
|
||
|
Allentown, Pennsylvania
|
Lincoln Technical Institute
|
26,000
|
||
|
East Windsor, Connecticut
|
Lincoln Technical Institute
|
289,000
|
||
|
Iselin, New Jersey
|
Lincoln Technical Institute
|
32,000
|
||
|
Lincoln, Rhode Island
|
Lincoln Technical Institute
|
39,000
|
||
|
Mahwah, New Jersey
|
Lincoln Technical Institute
|
79,000
|
||
|
Moorestown, New Jersey
|
Lincoln Technical Institute
|
35,000
|
||
|
New Britain, Connecticut
|
Lincoln Technical Institute
|
35,000
|
||
|
Paramus, New Jersey
|
Lincoln Technical Institute
|
30,000
|
||
|
Philadelphia, Pennsylvania
|
Lincoln Technical Institute
|
29,000
|
||
|
Queens, New York
|
Lincoln Technical Institute
|
48,000
|
||
|
Shelton, Connecticut
|
Lincoln Technical Institute and Lincoln Culinary Institute
|
47,000
|
||
|
Somerville, Massachusetts
|
Lincoln Technical Institute
|
33,000
|
||
|
South Plainfield, New Jersey
|
Lincoln Technical Institute
|
60,000
|
||
|
Union, New Jersey
|
Lincoln Technical Institute
|
56,000
|
||
|
Nashville, Tennessee
|
Lincoln College of Technology
|
281,000
|
||
|
West Orange, New Jersey
|
Corporate Office
|
52,000
|
||
|
Plymouth Meeting, Pennsylvania
|
Corporate Office
|
6,000
|
||
|
Suffield, Connecticut
|
132,000
|
We believe that our facilities are suitable for their present intended purposes.
In the ordinary conduct of our business, we are subject to periodic lawsuits, investigations and claims, including, but not limited to, claims involving students or graduates and routine employment matters. Although we cannot predict with certainty the ultimate resolution of lawsuits, investigations and claims asserted against us, we do not believe that any currently pending legal proceeding to which we are a party will have a material effect on our business, financial condition, results of operations or cash flows.
Not applicable.
PART II.
| ITEM 5. |
MARKET FOR REGISTRANT’S COMMON EQUITY, RELATED STOCKHOLDER MATTERS AND ISSUER PURCHASES OF EQUITY SECURITIES
|
Market for our Common Stock
Our common stock, no par value per share, is quoted on the Nasdaq Global Select Market under the symbol “LINC”.
The following table sets forth the range of high and low sales prices per share for our common stock, as reported by the Nasdaq Global Select Market, for the periods indicated
|
Price Range of Common Stock
|
||||||||||||
|
High
|
Low
|
Dividend
|
||||||||||
|
Fiscal Year Ended December 31, 2017
|
||||||||||||
|
First Quarter
|
$
|
2.92
|
$
|
1.86
|
$
|
-
|
||||||
|
Second Quarter
|
$
|
3.53
|
$
|
2.74
|
$
|
-
|
||||||
|
Third Quarter
|
$
|
3.36
|
$
|
2.50
|
$
|
-
|
||||||
|
Fourth Quarter
|
$
|
2.56
|
$
|
2.00
|
$
|
-
|
||||||
|
Price Range of Common Stock
|
||||||||||||
|
High
|
Low
|
Dividend
|
||||||||||
|
Fiscal Year Ended December 31, 2016
|
||||||||||||
|
First Quarter
|
$
|
3.05
|
$
|
1.92
|
$
|
-
|
||||||
|
Second Quarter
|
$
|
2.49
|
$
|
1.37
|
$
|
-
|
||||||
|
Third Quarter
|
$
|
2.58
|
$
|
1.37
|
$
|
-
|
||||||
|
Fourth Quarter
|
$
|
2.20
|
$
|
1.58
|
$
|
-
|
||||||
On March 5, 2018, the last reported sale price of our common stock on the Nasdaq Global Select Market was $1.83 per share. As of March 5, 2018, based on the information provided by Continental Stock Transfer & Trust Company, there were 32 stockholders of record of our common stock.
Dividend Policy
On February 27, 2015, our Board of Directors discontinued the quarterly cash dividend.
Share Repurchases
The Company did not repurchase any shares of our common stock during the fourth quarter of the fiscal year ended December 31, 2017.
Stock Performance Graph
This stock performance graph compares our total cumulative stockholder return on our common stock for the five years ended December 31, 2017 with the cumulative return on the Russell 2000 Index and a Peer Issuer Group Index. The peer issuer group consists of the companies identified below, which were selected on the basis of the similar nature of their business. The graph assumes that $100 was invested on December 31, 2012 and any dividends were reinvested on the date on which they were paid.
The information provided under the heading "Stock Performance Graph" shall not be considered "filed" for purposes of Section 18 of the Securities Exchange Act of 1934 or incorporated by reference in any filing under the Securities Act of 1933 or the Securities Exchange Act of 1934, except to the extent that we specifically incorporate it by reference into a filing.
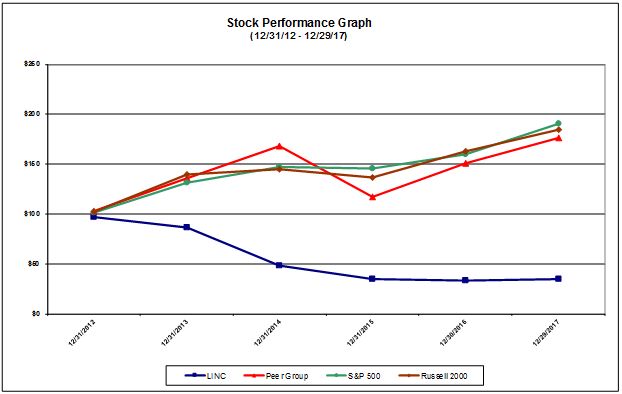
Companies in the Peer Group include Career Education Corp., Adtalem Global Education Inc., ITT Educational Services, Inc., Strayer Education, Inc., Bridgepoint Education, Inc., Apollo Education Group, Inc., Grand Canyon University, Inc. and Universal Technical Institute, Inc.
Equity Compensation Plan Information
We have various equity compensation plans under which equity securities are authorized for issuance. Information regarding these securities as of December 31, 2017 is as follows:
|
Plan Category
|
Number of
Securities to be
issued upon
exercise of
outstanding
options,
warrants and
rights
|
Weighted-
average
exercise
price of
outstanding
options,
warrants and
rights
|
Number of
securities
remaining
available for
future issuance
under equity
compensation
plans (excluding
securities
reflected in
column (a))
|
|||||||||
|
(a)
|
||||||||||||
|
Equity compensation plans approved by security holders
|
167,667
|
$
|
12.11
|
2,186,206
|
||||||||
|
Equity compensation plans not approved by security holders
|
-
|
-
|
-
|
|||||||||
|
Total
|
167,667
|
$
|
12.11
|
2,186,206
|
||||||||
The following table sets forth our selected historical consolidated financial and operating data as of the dates and for the periods indicated. You should read these data together with Item 7 - "Management's Discussion and Analysis of Financial Condition and Results of Operations" and our consolidated financial statements and the notes thereto included elsewhere in this Annual Report on Form 10-K. The selected historical consolidated statement of operations data for each of the years in the three-year period ended December 31, 2017 and historical consolidated balance sheet data at December 31, 2017 and 2016 have been derived from our audited consolidated financial statements which are included elsewhere in this Annual Report on Form 10-K. The selected historical consolidated statements of operations data for the fiscal years ended December 31, 2014 and 2013 and historical consolidated balance sheet data as of December 31, 2015, 2014 and 2013 have been derived from our consolidated financial information not included in this Annual Report on Form 10-K. Our historical results are not necessarily indicative of our future results.
|
2017
|
2016
|
2015
|
2014
|
2013
|
||||||||||||||||
|
(In thousands, except per share amounts)
|
||||||||||||||||||||
|
Statement of Operations Data, Year Ended December 31:
|
||||||||||||||||||||
|
Revenue
|
$
|
261,853
|
$
|
285,559
|
$
|
306,102
|
$
|
325,022
|
$
|
341,512
|
||||||||||
|
Cost and expenses:
|
||||||||||||||||||||
|
Educational services and facilities
|
129,413
|
144,426
|
151,647
|
164,352
|
169,049
|
|||||||||||||||
|
Selling, general and administrative
|
138,779
|
148,447
|
151,797
|
168,441
|
175,978
|
|||||||||||||||
|
(Gain) loss on sale of assets
|
(1,623
|
)
|
233
|
1,738
|
(58
|
)
|
(501
|
)
|
||||||||||||
|
Impairment of goodwill and long-lived assets
|
-
|
21,367
|
216
|
40,836
|
3,908
|
|||||||||||||||
|
Total costs and expenses
|
266,569
|
314,473
|
305,398
|
373,571
|
348,434
|
|||||||||||||||
|
Operating (loss) income
|
(4,716
|
)
|
(28,914
|
)
|
704
|
(48,549
|
)
|
(6,922
|
)
|
|||||||||||
|
Other:
|
||||||||||||||||||||
|
Interest income
|
56
|
155
|
52
|
153
|
37
|
|||||||||||||||
|
Interest expense
|
(7,098
|
)
|
(6,131
|
)
|
(8,015
|
)
|
(5,613
|
)
|
(4,667
|
)
|
||||||||||
|
Other income
|
-
|
6,786
|
4,151
|
297
|
18
|
|||||||||||||||
|
Loss from continuing operations before income taxes
|
(11,758
|
)
|
(28,104
|
)
|
(3,108
|
)
|
(53,712
|
)
|
(11,534
|
)
|
||||||||||
|
(Benefit) provision for income taxes
|
(274
|
)
|
200
|
242
|
(4,225
|
)
|
19,591
|
|||||||||||||
|
Loss from continuing operations
|
(11,484
|
)
|
(28,304
|
)
|
(3,350
|
)
|
(49,487
|
)
|
(31,125
|
)
|
||||||||||
|
Loss from discontinued operations, net of income taxes
|
-
|
-
|
-
|
(6,646
|
)
|
(20,161
|
)
|
|||||||||||||
|
Net loss
|
$
|
(11,484
|
)
|
$
|
(28,304
|
)
|
$
|
(3,350
|
)
|
$
|
(56,133
|
)
|
$
|
(51,286
|
)
|
|||||
|
Basic
|
||||||||||||||||||||
|
Loss per share from continuing operations
|
$
|
(0.48
|
)
|
$
|
(1.21
|
)
|
$
|
(0.14
|
)
|
$
|
(2.17
|
)
|
$
|
(1.38
|
)
|
|||||
|
Loss per share from discontinued operations
|
-
|
-
|
-
|
(0.29
|
)
|
(0.90
|
)
|
|||||||||||||
|
Net loss per share
|
$
|
(0.48
|
)
|
$
|
(1.21
|
)
|
$
|
(0.14
|
)
|
$
|
(2.46
|
)
|
$
|
(2.28
|
)
|
|||||
|
Diluted
|
||||||||||||||||||||
|
Loss per share from continuing operations
|
$
|
(0.48
|
)
|
$
|
(1.21
|
)
|
$
|
(0.14
|
)
|
$
|
(2.17
|
)
|
$
|
(1.38
|
)
|
|||||
|
Loss per share from discontinued operations
|
-
|
-
|
-
|
(0.29
|
)
|
(0.90
|
)
|
|||||||||||||
|
Net loss per share
|
$
|
(0.48
|
)
|
$
|
(1.21
|
)
|
$
|
(0.14
|
)
|
$
|
(2.46
|
)
|
$
|
(2.28
|
)
|
|||||
|
Weighted average number of common shares outstanding:
|
||||||||||||||||||||
|
Basic
|
23,906
|
23,453
|
23,167
|
22,814
|
22,513
|
|||||||||||||||
|
Diluted
|
23,906
|
23,453
|
23,167
|
22,814
|
22,513
|
|||||||||||||||
|
Other Data:
|
||||||||||||||||||||
|
Capital expenditures
|
$
|
4,755
|
$
|
3,596
|
$
|
2,218
|
$
|
7,472
|
$
|
6,538
|
||||||||||
|
Depreciation and amortization from continuing operations
|
8,702
|
11,066
|
14,506
|
19,201
|
21,808
|
|||||||||||||||
|
Number of campuses
|
23
|
28
|
31
|
31
|
33
|
|||||||||||||||
|
Average student population from continuing operations
|
10,772
|
11,864
|
12,981
|
14,010
|
14,804
|
|||||||||||||||
|
Cash dividend declared per common share
|
$
|
-
|
$
|
-
|
$
|
-
|
$
|
0.18
|
$
|
0.28
|
||||||||||
|
Balance Sheet Data, At December 31:
|
||||||||||||||||||||
|
Cash, cash equivalents and restricted cash
|
$
|
54,554
|
$
|
47,715
|
$
|
61,041
|
$
|
42,299
|
$
|
67,386
|
||||||||||
|
Working (deficit) capital (1)
|
(2,766
|
)
|
(1,733
|
)
|
33,818
|
29,585
|
47,041
|
|||||||||||||
|
Total assets
|
155,213
|
163,207
|
210,279
|
213,707
|
305,949
|
|||||||||||||||
|
Total debt (2)
|
52,593
|
41,957
|
58,224
|
65,181
|
90,116
|
|||||||||||||||
|
Total stockholders' equity
|
45,813
|
54,926
|
80,997
|
83,010
|
145,196
|
|||||||||||||||
All amounts have been restated to give effect to the HOPS segments which has been reclassified to continuing operations in 2016, 2015, 2014 and 2013.
(1)
Working (deficit) capital is defined as current assets less current liabilities.
(2)
Total debt consists of long-term debt including current portion, capital leases, auto loans and a finance obligation of $9.7 million for each of the years in the three-year period ended December 31, 2015 incurred in connection with a sale-leaseback transaction.
You should read the following discussion together with the “Selected Financial Data,” “Forward-Looking Statements” and the consolidated financial statements and the related notes thereto included elsewhere in this Annual Report on Form 10-K. This discussion contains forward-looking statements that are based on management’s current expectations, estimates and projections about our business and operations. Our actual results may differ materially from those currently anticipated and expressed in such forward-looking statements as a result of a number of factors, including those we discuss under “Risk Factors” and “Forward-Looking Statements” and elsewhere in this Annual Report on Form 10-K.
GENERAL
Lincoln Educational Services Corporation and its subsidiaries (collectively, the “Company”, “we”, “our” and “us”, as applicable) provide diversified career-oriented post-secondary education to recent high school graduates and working adults. The Company, which currently operates 23 schools in 14 states,
offers programs in automotive technology, skilled trades (which include HVAC, welding and computerized numerical control and electronic systems technology, among other programs), healthcare services (which include nursing, dental assistant, medical administrative assistant and pharmacy technician, among other programs), hospitality services (which include culinary, therapeutic massage, cosmetology and aesthetics) and business and information technology (which includes information technology and criminal justice programs). The schools operate under Lincoln Technical Institute, Lincoln College of Technology, Lincoln College of New England, Lincoln Culinary Institute, and Euphoria Institute of Beauty Arts and Sciences and associated brand names. Most of the campuses serve major metropolitan markets and each typically offers courses in multiple areas of study. Five of the campuses are destination schools, which attract students from across the United States and, in some cases, from abroad. The Company’s other campuses primarily attract students from their local communities and surrounding areas. All of the campuses are nationally or regionally accredited and are eligible to participate in federal financial aid programs by the U.S. Department of Education (the “DOE”) and applicable state education agencies and accrediting commissions which allow students to apply for and access federal student loans as well as other forms of financial aid.
Our business is organized into three reportable business segments: (a) Transportation and Skilled Trades, (b) Healthcare and Other Professions (“HOPS”), and (c) Transitional, which refers to businesses that have been or are currently being taught out. In November 2015, the Board of Directors of the Company approved a plan for the Company to divest the 18 campuses then comprising the HOPS segment due to a strategic shift in the Company’s business strategy. The Company underwent an exhaustive process to divest the HOPS schools which proved successful in attracting various purchasers but, ultimately, did not result in a transaction that our Board believed would enhance shareholder value. By the end of 2017, we had strategically closed seven underperforming campuses leaving a total of 11 campuses remaining under the HOPS segment. The Company believes that the closures of the aforementioned campuses has positioned the HOPS segment and the Company to be more profitable going forward as well as maximizing returns for the Company’s shareholders.
The combination of several factors, including the inability of a prospective buyer of the HOPS segment to close on the purchase, the improvements the Company has implemented in the HOPS segment operations, the closure of seven underperforming campuses and the change in the United States government administration, resulted in the Board reevaluating its divestiture plan and the determination that shareholder value would more likely be enhanced by continuing to operate our HOPS segment as revitalized. Consequently, the Board of Directors has abandoned the plan to divest the HOPS segment and the Company now intends to retain and continue to operate the remaining campuses in the HOPS segment. The results of operations of the campuses included in the HOPS segment are reflected as continuing operations in the consolidated financial statements.
In 2016, the Company completed the teach-out of its Hartford, Connecticut, Fern Park, Florida and Henderson (Green Valley), Nevada campuses, which originally operated in the HOPS segment. In 2017, the Company completed the teach-out of its Northeast Philadelphia, Pennsylvania; Center City Philadelphia, Pennsylvania; West Palm Beach, Florida; Brockton, Massachusetts; and Lowell, Massachusetts schools, which also were originally in our HOPS segment and all of which were
taught out and closed by December 2017 and are included in the Transitional segment as of December 31, 2017.
On August 14, 2017, New England Institute of Technology at Palm Beach, Inc., a wholly-owned subsidiary of the Company, consummated the sale of the real property located at 2400 and 2410 Metrocentre Boulevard East, West Palm Beach, Florida, including the improvements and other personal property located thereon (the “West Palm Beach Property”) to Tambone Companies, LLC (“Tambone”), pursuant to a previously disclosed purchase and sale agreement (the “West Palm Sale Agreement”) entered into on March 14, 2017. Pursuant to the terms of the West Palm Sale Agreement, as subsequently amended, the purchase price for the West Palm Beach Property was $15.8 million. As a result, the Company recorded a gain on the sale in the amount of $1.5 million. As previously disclosed, the West Palm Beach Property served as collateral for a short term loan in the principal amount of $8.0 million obtained by the Company from its lender, Sterling National Bank, on April 28, 2017, which loan matured upon the earlier of the sale of the West Palm Beach Property or October 1, 2017. Accordingly, on August 14, 2017, concurrently with the consummation of the sale of the West Palm Beach Property, the Company repaid the term loan in an aggregate amount of $8.0 million, consisting of principal and accrued interest.
On March 31, 2017, the Company entered into a
new revolving credit facility with
Sterling National Bank in the aggregate principal amount of up to $55 million, which consists of up to $50 million of revolving loans, including a $10 million sublimit for letters of credit, and an additional $5 million non-revolving loan. The proceeds of the $5 million non-revolving loan were held in a pledged account at Sterling National Bank as required by the terms of the new credit facility pending the completion of environmental studies undertaken at certain properties owned by the Company and mortgaged to Sterling National Bank. Upon the completion of environmental studies that revealed that no environmental issues existed at the properties, during the quarter ended June 30, 2017, the $5 million held in the pledged account at Sterling National Bank was released and used to repay the $5 million non-revolving loan. The credit facility was amended on November 29, 2017, to provide the Company with an additional $15 million revolving credit loan, resulting in an increase in the aggregate availability under the credit facility to $65 million. The credit facility was again amended on February 23, 2018, to, among other things, effect certain modifications to the financial covenants and other provisions of the credit facility and to allow the Company to pursue the sale of certain real property assets. The new credit facility requires that revolving loans in excess of $25 million and all letters of credit issued thereunder be cash collateralized dollar for dollar. The new revolving credit facility replaces a term loan facility which was repaid and terminated concurrently with the effectiveness of the new revolving credit facility. The final maturity date for the new revolving credit facility is May 31, 2020. The new revolving credit facility is discussed in further detail under the heading “Liquidity and Capital Resources” below and in Note 7 to the consolidated financial statements included in this report.
On December 22, 2017, the U.S. government enacted comprehensive tax legislation commonly referred to as the Tax Cuts and Jobs Act. The Tax Cuts and Jobs Act, among other things, made broad and complex changes to the U.S. tax code which impacted 2017, including, but not limited to, reducing the U.S. federal corporate tax rate, eliminating the corporate alternative minimum tax and changing how existing corporate alternative minimum tax credits can be realized either to offset regular tax liability or to be refunded. See additional information regarding the impact of the Tax Cuts and Jobs Act in “Management's Discussion and Analysis of Financial Condition and Results of Operations” and Note 10 to our consolidated financial statements included in this Annual Report on Form 10-K.
As of December 31, 2017, we had 10,159 students enrolled at 23 campuses.
Our campuses, a majority of which serve major metropolitan markets, are located throughout the United States. Five of our campuses are destination schools, which attract students from across the United States and, in some cases, from abroad. Our other campuses primarily attract students from their local communities and surrounding areas. All of our schools are either nationally or regionally accredited and are eligible to participate in federal financial aid programs.
Our revenues consist primarily of student tuition and fees derived from the programs we offer. Our revenues are reduced by scholarships granted to our students. We recognize revenues from tuition and one-time fees, such as application fees, ratably over the length of a program, including internships or externships that take place prior to graduation. We also earn revenues from our bookstores, dormitories, cafeterias and contract training services. These non-tuition revenues are recognized upon delivery of goods or as services are performed and represent less than 10% of our revenues.
Our revenues are directly dependent on the average number of students enrolled in our schools and the courses in which they are enrolled. Our average enrollment is impacted by the number of new students starting, re-entering, graduating and withdrawing from our schools. In addition, our diploma/certificate programs range from 28 to 136 weeks, our associate’s degree programs range from 58 to 156 weeks, and our bachelor’s degree programs range from 104 to 208 weeks, and students attend classes for different amounts of time per week depending on the school and program in which they are enrolled. Because we start new students every month, our total student population changes monthly. The number of students enrolling or re-entering our programs each month is driven by the demand for our programs, the effectiveness of our marketing and advertising, the availability of financial aid and other sources of funding, the number of recent high school graduates, the job market and seasonality. Our retention and graduation rates are influenced by the quality and commitment of our teachers and student services personnel, the effectiveness of our programs, the placement rate and success of our graduates and the availability of financial aid. Although similar courses have comparable tuition rates, the tuition rates vary among our numerous programs.
The majority of students enrolled at our schools rely on funds received under various government-sponsored student financial aid programs to pay a substantial portion of their tuition and other education-related expenses. The largest of these programs are Title IV Programs which represented approximately 78% and 79% of our revenue on a cash basis while the remainder is primarily derived from state grants and cash payments made by students during 2017 and 2016, respectively. The Higher Education Act of 1965, as amended (the “HEA”) requires institutions to use the cash basis of accounting when determining its compliance with the 90/10 rule.
We extend credit for tuition and fees to many of our students that attend our campuses. Our credit risk is mitigated through the students’ participation in federally funded financial aid programs unless students withdraw prior to the receipt by us of Title IV Program funds for those students. Under Title IV Programs, the government funds a certain portion of a student’s tuition, with the remainder, referred to as “the gap,” financed by the students themselves under private party loans, including credit extended by us. The gap amount has continued to increase over the last several years as we have raised tuition on average for the last several years by 2-3% per year and restructured certain programs to reduce the amount of financial aid available to students, while funds received from Title IV Programs increased at lower rates.
The additional financing that we are providing to students may expose us to greater credit risk and can impact our liquidity. However, we believe that these risks are somewhat mitigated due to the following:
| · |
Our internal financing is provided to students only after all other funding resources have been exhausted; thus, by the time this funding is available, students have completed approximately two-thirds of their curriculum and are more likely to graduate;
|
| · |
Funding for students who interrupt their education is typically covered by Title IV funds as long as they have been properly packaged for financial aid; and
|
| · |
Creditworthy criteria to demonstrate a student’s ability to pay.
|
The operating expenses associated with an existing school do not increase or decrease proportionally as the number of students enrolled at the school increases or decreases. We categorize our operating expenses as:
| · |
Educational services and facilities.
Major components of educational services and facilities expenses include faculty compensation and benefits, expenses of books and tools, facility rent, maintenance, utilities, depreciation and amortization of property and equipment used in the provision of education services and other costs directly associated with teaching our programs excluding student services which is included in selling, general and administrative expenses.
|
| · |
Selling, general and administrative.
Selling, general and administrative expenses include compensation and benefits of employees who are not directly associated with the provision of educational services (such as executive management and school management, finance and central accounting, legal, human resources and business development), marketing and student enrollment expenses (including compensation and benefits of personnel employed in sales and marketing and student admissions), costs to develop curriculum, costs of professional services, bad debt expense, rent for our corporate headquarters, depreciation and amortization of property and equipment that is not used in the provision of educational services and other costs that are incidental to our operations. Selling, general and administrative expenses also includes the cost of all student services including financial aid and career services. All marketing and student enrollment expenses are recognized in the period incurred.
|
CRITICAL ACCOUNTING POLICIES AND ESTIMATES
Our discussions of our financial condition and results of operations are based upon our consolidated financial statements, which have been prepared in accordance with accounting principles generally accepted in the United States of America, or GAAP. The preparation of financial statements in conformity with GAAP requires management to make estimates and assumptions that affect the reported amounts of assets and liabilities and disclosure of contingent assets and liabilities at the date of the consolidated financial statements and the reported amounts of revenues and expenses during the period. On an ongoing basis, we evaluate our estimates and assumptions, including those related to revenue recognition, bad debts, fixed assets, goodwill and other intangible assets, income taxes and certain accruals. Actual results could differ from those estimates. The critical accounting policies discussed herein are not intended to be a comprehensive list of all of our accounting policies. In many cases, the accounting treatment of a particular transaction is specifically dictated by GAAP and does not result in significant management judgment in the application of such principles. We believe that the following accounting policies are most critical to us in that they represent the primary areas where financial information is subject to the application of management's estimates, assumptions and judgment in the preparation of our consolidated financial statements.
Revenue recognition.
Revenues are derived primarily from programs taught at our schools. Tuition revenues, textbook sales and one-time fees, such as nonrefundable application fees and course material fees, are recognized on a straight-line basis over the length of the applicable program as the student proceeds through the program, which is the period of time from a student’s start date through his or her graduation date, including internships or externships that take place prior to graduation, and we complete the performance of teaching the student which entitles us to the revenue. Other revenues, such as tool sales and contract training revenues are recognized as services are performed or goods are delivered. On an individual student basis, tuition earned in excess of cash received is recorded as accounts receivable, and cash received in excess of tuition earned is recorded as unearned tuition.
We evaluate whether collectability of revenue is reasonably assured prior to the student attending class and reassess collectability of tuition and fees when a student withdraws from a course. We calculate the amount to be returned under Title IV and its stated refund policy to determine eligible charges and, if there is a balance due from the student after this calculation, we expect payment from the student and we have a process to pursue uncollected accounts whereby, based upon the student’s financial means and ability to pay, a payment plan is established with the student to ensure that collectability is reasonable. We continuously monitor our historical collections to identify potential trends that may impact our determination that collectability of receivables for withdrawn students is realizable. If a student withdraws from a program prior to a specified date, any paid but unearned tuition is refunded. Refunds are calculated and paid in accordance with federal, state and accrediting agency standards. Generally, the amount to be refunded to a student is calculated based upon the period of time the student has attended classes and the amount of tuition and fees paid by the student as of his or her withdrawal date. These refunds typically reduce deferred tuition revenue and cash on our consolidated balance sheets as we generally do not recognize tuition revenue in our consolidated statements of income (loss) until the related refund provisions have lapsed. Based on the application of our refund policies, we may be entitled to incremental revenue on the day the student withdraws from one of our schools. We record revenue for students who withdraw from one of our schools when payment is received because collectability on an individual student basis is not reasonably assured. On January 1, 2018, we were required to adopt Accounting Standards Codification Topic 606. The new guidance requires enhanced disclosures, including revenue recognition policies to identify performance obligations to customers and significant judgements in measurement and recognition. See Note 1 to our consolidated financial statements included in this Annual Report on Form 10-K for further discussion.
Allowance for uncollectible accounts.
Based upon experience and judgment, we establish an allowance for uncollectible accounts with respect to tuition receivables. We use an internal group of collectors in our collection efforts. In establishing our allowance for uncollectible accounts, we consider, among other things, current and expected economic conditions, a student's status (in-school or out-of-school), whether or not a student is currently making payments, and overall collection history. Changes in trends in any of these areas may impact the allowance for uncollectible accounts. The receivables balances of withdrawn students with delinquent obligations are reserved for based on our collection history. Although we believe that our reserves are adequate, if the financial condition of our students deteriorates, resulting in an impairment of their ability to make payments, additional allowances may be necessary, which will result in increased selling, general and administrative expenses in the period such determination is made.
Our bad debt expense as a percentage of revenues for the years ended December 31, 2017, 2016 and 2015 was 5.2%, 5.1% and 4.4%, respectively. Our exposure to changes in our bad debt expense could impact our operations. A 1% increase in our bad debt expense as a percentage of revenues for the years ended December 31, 2017, 2016 and 2015 would have resulted in an increase in bad debt expense of $2.6 million, $2.9 million and $3.1 million, respectively.
We do not believe that there is any direct correlation between tuition increases, the credit we extend to students and our loan commitments. Our loan commitments to our students are made on a student-by-student basis and are predominantly a function of the specific student’s financial condition. We only extend credit to the extent there is a financing gap between the tuition and fees charged for the program and the amount of grants, loans and parental loans each student receives. Each student’s funding requirements are unique. Factors that determine the amount of aid available to a student include whether they are dependent or independent students, Pell grants awarded, Federal Direct loans awarded, Plus loans awarded to parents and the student’s personal resources and family contributions. As a result, it is extremely difficult to predict the number of students that will need us to extend credit to them. Our tuition increases have averaged 2-3% annually and have not meaningfully impacted overall funding requirements, since the amount of financial aid funding available to students in recent years has increased at greater rates than our tuition increases.
Because a substantial portion of our revenues are derived from Title IV Programs, any legislative or regulatory action that significantly reduces the funding available under Title IV Programs or the ability of our students or schools to participate in Title IV Programs could have a material effect on the realizability of our receivables.
Goodwill.
We test our goodwill for impairment annually, or whenever events or changes in circumstances indicate an impairment may have occurred, by comparing its fair value to its carrying value. Impairment may result from, among other things, deterioration in the performance of the acquired business, adverse market conditions, adverse changes in applicable laws or regulations, including changes that restrict the activities of the acquired business, and a variety of other circumstances. If we determine that impairment has occurred, we are required to record a write-down of the carrying value and charge the impairment as an operating expense in the period the determination is made. In evaluating the recoverability of the carrying value of goodwill and other indefinite-lived intangible assets, we must make assumptions regarding estimated future cash flows and other factors to determine the fair value of the acquired assets. Changes in strategy or market conditions could significantly impact these judgments in the future and require an adjustment to the recorded balances.
Goodwill represents a significant portion of our total assets. As of December 31, 2017, goodwill was approximately $14.5 million, or 9.4%, of our total assets, which was flat from approximately $14.5 million, or 8.9%, of our total assets at December 31, 2016.
When we test goodwill balances for impairment, we estimate the fair value of each of our reporting units based on projected future operating results and cash flows, market assumptions and/or comparative market multiple methods. Determining fair value requires significant estimates and assumptions based on an evaluation of a number of factors, such as marketplace participants, relative market share, new student interest, student retention, future expansion or contraction expectations, amount and timing of future cash flows and the discount rate applied to the cash flows. Projected future operating results and cash flows used for valuation purposes do reflect improvements relative to recent historical periods with respect to, among other things, modest revenue growth and operating margins. Although we believe our projected future operating results and cash flows and related estimates regarding fair values are based on reasonable assumptions, historically projected operating results and cash flows have not always been achieved. The failure of one of our reporting units to achieve projected operating results and cash flows in the near term or long term may reduce the estimated fair value of the reporting unit below its carrying value and result in the recognition of a goodwill impairment charge. Significant management judgment is necessary to evaluate the impact of operating and macroeconomic changes and to estimate future cash flows. Assumptions used in our impairment evaluations, such as forecasted growth rates and our cost of capital, are based on the best available market information and are consistent with our internal forecasts and operating plans. In addition to cash flow estimates, our valuations are sensitive to the rate used to discount cash flows and future growth assumptions.
At December 31, 2017 and December 31, 2015, we conducted our annual test for goodwill impairment and determined we did not have an impairment. At December 31, 2016, we conducted our annual test for goodwill impairment and determined we had an impairment of $9.9 million. We concluded that as of September 30, 2015 there was an indicator of potential impairment as a result of a decrease in market capitalization and, accordingly, we tested goodwill for impairment. The test indicated that one of our reporting units was impaired, which resulted in a pre-tax non-cash charge of $0.2 million for the three months ended September 30, 2015.
Stock-based compensation.
We currently account for stock-based employee compensation arrangements by using the Black-Scholes valuation model and utilize straight-line amortization of compensation expense over the requisite service period of the grant. We make an estimate of expected forfeitures at the time options are granted.
We measure the value of service and performance-based restricted stock on the fair value of a share of common stock on the date of the grant. We amortize the fair value of service-based restricted stock utilizing straight-line amortization of compensation expense over the requisite service period of the grant.
We amortize the fair value of the performance-based restricted stock based on determination of the probable outcome of the performance condition. If the performance condition is expected to be met, then we amortize the fair value of the number of shares expected to vest utilizing the straight-line basis over the requisite performance period of the grant. However, if the associated performance condition is not expected to be met, then we do not recognize the stock-based compensation expense.
Income taxes.
We
account for income taxes in accordance with ASC Topic 740, “
Income Taxes
” (“ASC 740”). This statement requires an asset and a liability approach for measuring deferred taxes based on temporary differences between the financial statement and tax bases of assets and liabilities existing at each balance sheet date using enacted tax rates for years in which taxes are expected to be paid or recovered.
In accordance with ASC 740, we assess our deferred tax asset to determine whether all or any portion of the asset is more likely than not unrealizable. A valuation allowance is required to be established or maintained when, based on currently available information, it is more likely than not that all or a portion of a deferred tax asset will not be realized. In accordance with ASC 740, our assessment considers whether there has been sufficient income in recent years and whether sufficient income is expected in future years in order to utilize the deferred tax asset. In evaluating the realizability of deferred income tax assets we considered, among other things, historical levels of income, expected future income, the expected timing of the reversals of existing temporary reporting differences, and the expected impact of tax planning strategies that may be implemented to prevent the potential loss of future income tax benefits. Significant judgment is required in determining the future tax consequences of events that have been recognized in our consolidated financial statements and/or tax returns. Differences between anticipated and actual outcomes of these future tax consequences could have a material impact on our consolidated financial position or results of operations. Changes in, among other things, income tax legislation, statutory income tax rates, or future income levels could materially impact our valuation of income tax assets and liabilities and could cause our income tax provision to vary significantly among financial reporting periods.
We recognize accrued interest and penalties related to unrecognized tax benefits in income tax expense. During the years ended December 31, 2017 and 2016, we did not record any interest and penalties expense associated with uncertain tax positions.
On December 22, 2017, the U.S. government enacted comprehensive tax legislation known as the Tax Cuts and Jobs Act (the “Tax Act”). The Tax Act establishes new tax laws that will take effect in 2018, including, but not limited to (1) reduction of the U.S. federal corporate tax rate from a maximum of 35% to 21%; (2) elimination of the corporate alternative minimum tax (AMT); (3) a new limitation on deductible interest expense; (4) the repeal of the domestic production activity deduction; (5) limitations on the deductibility of certain executive compensation; and (6) limitations on net operating losses (NOLs) generated after December 31, 2017, to 80% of taxable income. In addition, certain changes were made to the bonus depreciation rules that will impact fiscal year 2017.
ASC 740 requires the effects of changes in tax laws to be recognized in the period in which the legislation is enacted. However, due to the complexity and significance of the Tax Act's provisions, the staff of the Securities and Exchange Commission issued Staff Accounting Bulletin 118 (“SAB 118”), which provides guidance on accounting for the tax effects of the Tax Act. SAB 118 provides a measurement period that should not extend beyond one year from the Tax Act enactment date for companies to complete the accounting under ASC 740. In accordance with SAB 118, a company must reflect the income tax effects of those aspects of the Tax Act for which the accounting under ASC 740 is complete. To the extent that a company’s accounting for certain income tax effects of the Tax Act is incomplete but it is able to determine a reasonable estimate, it must record a provisional estimate in the financial statements. If a company cannot determine a provisional estimate to be included in the financial statements, it should continue to apply ASC 740 on the basis of the provisions of the tax laws that were in effect immediately before the enactment of the Tax Act.
At December 31, 2017, we have not completed our analysis of the tax effects of enactment of the Tax Act; however, we have made a reasonable estimate of the effects of the Tax Act’s change in the federal rate and revalued our deferred tax assets based on the rates at which they are expected to reverse in the future, which is generally the new 21% federal corporate tax rate plus applicable state tax rate. Based on our initial analysis of the impact, we consequently recorded a decrease related to deferred tax assets of $17.7 million. The expense is offset with a corresponding release of valuation allowance.
In addition, we released the valuation allowance against AMT credits deferred tax asset and recorded a deferred tax provision benefit of $0.4 million.
The Tax Act did not have a material impact on our financial statements because we are under a full valuation allowance and we do not have any significant offshore earnings from which to record the mandatory transition tax.
The Tax Act requires the Company to assess whether its valuation allowance analyses are affected by various aspects of the Tax Act. Since, as discussed herein, we have recorded provisional amounts related to certain portions of the Tax Act, any corresponding determination of the need for or change in a valuation allowance is also provisional. The Company’s valuation allowance position did not change as a result of tax reform except for AMT credits which is discussed above and a reduction related to a change in the deferred tax rate.
Results of Continuing Operations for the Three Years Ended December 31, 2017
The following table sets forth selected consolidated statements of continuing operations data as a percentage of revenues for each of the periods indicated:
|
Year Ended December 31,
|
||||||||||||
|
2017
|
2016
|
2015
|
||||||||||
|
Revenue
|
100.0
|
%
|
100.0
|
%
|
100.0
|
%
|
||||||
|
Costs and expenses:
|
||||||||||||
|
Educational services and facilities
|
49.4
|
%
|
50.6
|
%
|
49.5
|
%
|
||||||
|
Selling, general and administrative
|
53.0
|
%
|
52.0
|
%
|
49.6
|
%
|
||||||
|
(Gain) loss on sale of assets
|
-0.6
|
%
|
0.1
|
%
|
0.6
|
%
|
||||||
|
Impairment of goodwill and long-lived assets
|
0.0
|
%
|
7.5
|
%
|
0.1
|
%
|
||||||
|
Total costs and expenses
|
101.8
|
%
|
110.2
|
%
|
99.8
|
%
|
||||||
|
Operating (loss) income
|
-1.8
|
%
|
-10.2
|
%
|
0.2
|
%
|
||||||
|
Interest expense, net
|
-2.7
|
%
|
-2.0
|
%
|
-2.6
|
%
|
||||||
|
Other income
|
0.0
|
%
|
2.4
|
%
|
1.4
|
%
|
||||||
|
Loss from operations before income taxes
|
-4.5
|
%
|
-9.8
|
%
|
-1.0
|
%
|
||||||
|
(Benefit) provision for income taxes
|
-0.1
|
%
|
0.1
|
%
|
0.1
|
%
|
||||||
|
Net loss
|
-4.4
|
%
|
-9.9
|
%
|
-1.1
|
%
|
||||||
Year Ended December 31, 2017 Compared to Year Ended December 31, 2016
Consolidated Results of Operations
Revenue.
Revenue decreased by $23.7 million, or 8.3%, to $261.9 million for the year ended December 31, 2017 from $285.6 million for the year ended December 31, 2016.
The decrease in revenue is primarily attributable to the campuses in our Transitional segment, which have closed during 2017. This s
egment accounted for approximately $22.1 million, or 93.1% of the revenue decline.
Total student starts decreased by 10.8% to approximately 11,800 from 13,200 for the year ended December 31, 2017 as compared to the prior year comparable period. The suspension of new student starts for the Transitional segment accounted for approximately 92.5% of the decline. The Transportation and Skilled Trades segment starts were slightly down 1.5% and the HOPS segment starts remained essentially flat at 4,200 for the year ended December 31, 2017 as compared to the 2016 fiscal year.
For a general discussion of trends in our student enrollment, see “Seasonality and Outlook” below.
Educational services and facilities expense.
Our educational services and facilities expense decreased by $15.0 million, or 10.4%, to $129.4 million for the year ended December 31, 2017 from $144.4 million in the prior year comparable period. The decrease is mainly due to the Transitional segment, which accounted for approximately $13.9 million, or 92.4% of the decrease. The remainder of the $1.2 million decrease was primarily due to a decrease in facilities expenses slightly offset by increased instructional expenses. Facilities expense decreased due to a decline in depreciation expense of approximately $1.6 million due to fully depreciated assets. Partially, offsetting the decreases are $0.6 million in increased books and tools costs resulting from the addition of laptops for an increasing number of program offerings in the HOPS segment. Educational services and facilities expenses, as a percentage of revenue, decreased to 49.4% for the year ended December 31, 2017 from 50.6% in the prior year comparable period.
Selling, general and administrative expense.
Our selling, general and administrative expense decreased by $9.7 million, or 6.5%, to $138.8 million for the year ended December 31, 2017 from $148.5 million in the prior year comparable period.
The decrease was primarily due to the Transitional segment, which accounted for approximately $13.6 million in cost reductions. Partially offsetting the cost reductions are $2.8 million in additional sales and marketing expense
and
$1.2 million in increased administrative expense.
The $2.8 million increase in sales and marketing expense was the result of strategic marketing spending in an effort to expand our reach in the adult market. The additional spending resulted in an increase in adult starts year over year.
Administrative expense increased primarily due to a $1.2 million increase in bad debt expense and $1.6 million in closed school expenses, offset by $1.3 million in reduced salaries and benefits expense.
The increase in closed school expenses related to the Hartford, Connecticut campus, which closed on December 31, 2016 and was included in the Transitional segment in 2016, but has an apartment lease for student dorms which ends in September 2019.
Bad debt expense as a percentage of revenue was 5.2% for the year ended December 31, 2017, compared to 5.1% for the same period in 2016. The increase in bad debt expense was the result of higher student receivable accounts, primarily driven by lower scholarship recognition and a higher number of institutional loans. During 2017, we made modifications to the institutional loan program which expanded the program’s eligibility base and lessened the student’s affordability challenge. In addition, we experienced higher account write-offs and timing of Title IV funds receipts, which contributed to the increase in bad debt expense.
As of December 31, 2017, we had total outstanding loan commitments to our students of $51.9 million, as compared to $40.0 million at December 31, 2016. The increase was due to a higher number of students packaged with institutional loans as a result of 2017
modifications to the program, which expanded the eligibility base and lessened the affordability obstacle.
Gain on sale of fixed assets.
Gain on sale of fixed assets increased by $1.8 million primarily due to the sale of two real properties located in West Palm Beach, Florida. The sale occurred on August 14, 2017 and resulted in a gain of $1.5 million.
Impairment of goodwill and long-lived assets
.
We tested our goodwill and long-lived assets and determined that as of December 31, 2017 no impairments existed. The fair value of the Company’s reporting units were determined using Level 3 inputs included in its multiple of earnings and discounted cash flow approach. At December 31, 2016, we tested our goodwill and long-lived assets and determined that there was sufficient evidence to conclude that an impairment existed, which resulted in a pre-tax, non-cash charge of $21.4 million.
Net interest expense.
For the year ended December 31, 2017, our net interest expense increased by $1.1 million.
The increase was mainly attributable to a $2.2 million non-cash write-off of previously capitalized deferred financing fees; and a $1.8 million early termination fee. These costs were incurred at March 31, 2017 when the Company entered into a new revolving credit facility with Sterling National Bank. Partially offsetting these increases were reductions in interest expense resulting from lower debt outstanding in combination with more favorable terms under the current credit facility compared to the terms of a prior term loan facility provided to the Company by a former lender.
Income taxes.
Our benefit for income taxes was $0.3 million, or 2.3% of pretax loss, for the year ended December 31, 2017, compared to a provision for income taxes of $0.2 million, or 0.7% of pretax loss, in the prior year comparable period.
On December 22, 2017, the U.S. government enacted comprehensive tax legislation commonly referred to as the Tax Cuts and Jobs Act (the “Tax Act”). The Tax Cuts and Jobs Act, among other things, eliminates the corporate alternative minimum tax (the “AMT”) and changes how existing AMT credits can be realized either to offset regular tax liability or to be refunded. As a result of this change, the Company released the valuation allowance against AMT credits deferred tax asset and recorded a deferred tax provision benefit of $0.4 million. Offsetting this benefit was $0.1 million of income tax expense from various minimal state tax expenses.
At December 31, 2017, we have not completed our analysis of the tax effects of enactment of the Tax Act; however, we have made a reasonable estimate of the effects of the Tax Act’s change in the federal rate and revalued our deferred tax assets based on the rates at which they are expected to reverse in the future, which is generally the new 21% federal corporate tax rate plus applicable state tax rate. Based on our initial analysis of the impact, we recorded a decrease related to deferred tax assets of $17.7 million. The expense is offset with a corresponding release of valuation allowance.
No other federal or state income tax benefit was recognized for the current period loss due to the recognition of a full valuation allowance.
Year Ended December 31, 2016 Compared to Year Ended December 31, 2015
Consolidated Results of Operations
Revenue.
Revenue decreased by $20.5 million, or 6.7%, to $285.6 million for the year ended December 31, 2016 from $306.1 million for the year ended December 31, 2015. The decrease in revenue can mainly be attributed to the closure of campuses in our Transitional segment during 2016, which accounted for $11.8 million, or 57.3% of the total revenue decline, and a lower carry in population, which has been one of the main contributing factors to the declines in revenue over the past several years. We started 2016 with approximately 1,400 fewer students than we had on January 1, 2015, which led to an 8.6% decline in average student population to approximately 11,900 as of December 31, 2016 from 13,000 in the comparable period of 2015.
Partially offsetting the revenue decline from lower student population was a 2.0% increase in average revenue per student mainly attributable to shifts in our program mix.
Student start results decreased by 6.0% to approximately 13,200 from 14,100 for the year ended December 31, 2016 as compared to the prior year comparable period. Excluding the Transitional segment, student starts were down 1.8%. The decline in student starts was mainly a result of the underperformance of one campus. Excluding this one campus and the Transitional segment, our starts for the year ended December 31, 2016 would have remained essentially flat as compared to 2015.
For a general discussion of trends in our student enrollment, see “Seasonality and Outlook” below.
Educational services and facilities expense.
Our educational services and facilities expense decreased by $7.2 million, or 4.8%, to $144.4 million for the year ended December 31, 2016 when compared to $151.6 million in the prior year comparable period. The decrease is mainly due to the Transitional Segment which accounted for approximately $6.6 million, or 90.8% of the decrease year over year. Instructional expense decreased by $2.4 million or 3.8%, primarily resulting from a reduction in salaries and benefits expense of $1.9 million due to historically lower medical claims in 2016 and reductions in salaries expense resulting from the HOPS segment, which was classified as held for sale as of December 31, 2016. Partially offsetting the decrease in instructional expense were increases in books and tools and facilities expense. Books and tools increased by $1.6 million, or 12.1%, due to the purchase of laptops provided to newly enrolled students in certain programs to enhance and expand the students overall learning experience. Facilities expense increased by $0.2 million, primarily resulting from two main factors: a) decreased depreciation expense of $1.8 million resulting from the suspension of depreciations expense for the HOPS segment, which was classified as held for sale for the year ended December 31, 2016; and b) increased rent expense of $1.6 million was the result of the transition of our finance obligation at four of our campuses to operating leases which were previously included in interest expense.
Our educational expenses contain a high fixed cost component and are not as scalable as some of our other expenses. As our student population decreases, we typically experience a reduction in average class size and, therefore, are not always able to align these expenses with the corresponding decrease in population. Educational services and facilities expenses, as a percentage of revenue, increased to 50.6% from 49.5% in the prior year comparable period.
Selling, general and administrative expense.
Our selling, general and administrative expense decreased by $3.4 million, or 2.2%, to $148.4 million for the year ended December 31, 2016 from $151.8 million in the prior year. The decrease was primarily due to our Transitional segment which accounted for approximately $2.0 million, or 60.8% of the decrease year over year.
Administrative expenses decreased by $1.2 primarily resulting from reduced salaries and benefits expense, partially offset by increases in bad debt expense. Student services expense decreased by $0.8 million primarily as a result of reduced salaries and benefits expense. Partially offsetting the cost reductions was an increase in marketing expense of $0.9 million. The increase in marketing expense was the result of additional spending made in an effort to reach more potential students, expand brand awareness, and increase enrollments.
Bad debt expense as a percentage of revenue was 5.1% for the year ended December 31, 2016, compared to 4.4% for the same period in 2015. This increase was mainly the result of incurring additional bad debt expense from increased reserves placed on our newly reclassified Transitional segment campuses.
As a percentage of revenues, selling, general and administrative expense increased to 52.0% for the year ended December 31, 2016 from 49.6% in the comparable prior year period.
As of December 31, 2016, we had total outstanding loan commitments to our students of $40.0 million, as compared to $33.4 million at December 31, 2015. Loan commitments, net of interest that would be due on the loans through maturity, were $30.0 million at December 31, 2016, as compared to $24.8 million at December 31, 2015.
Loss on sale of fixed assets.
Loss on sale of assets decreased by $1.5 million primarily as a result of a non-cash charge in relation to two of our campuses that were previously classified as held for sale in 2014. During 2015, the Company re-classed these campuses out of held for sale and booked catch-up depreciation in the amount of $2.0 million. This was partially offset by a non-cash charge in relation to three of our campuses that were previously classified as held for sale in 2015. During 2016, the Company re-classed these campuses out of held for sale and booked catch-up depreciation in the amount of approximately $0.4 million.
Impairment of goodwill and long-lived assets
.
At December 31, 2016, we tested long-lived assets and determined that there was sufficient evidence to conclude that an impairment existed, which resulted in a pre-tax, non-cash charge of $21.4 million. As of September 30,
2015, we tested goodwill and long-lived assets for impairment and determined that one of the Company’s reporting units relating to goodwill was impaired, which resulted in a pre-tax, non-cash charge of $0.2 million.
Net interest expense.
For the year ended December 31, 2016, our net interest expense decreased by $2.0 million. The decrease in interest expense was primarily the result of the transition of our finance obligation at four of our campuses to operating leases coupled with the termination of the lease termination for our Fern Park, Florida facility, which was previously accounted for as a capital lease. Partially offsetting the reduction in interest expense was interest paid under the Company’s term loan facility entered into on July 31, 2015.
Income taxes.
Our provision for income taxes was $0.2 million, or 0.7% of pretax loss, for the year ended December 31, 2016, compared to $0.2 million, or 7.8% of pretax loss, in the prior year comparable period. No federal or state income tax benefit was recognized for the current period loss due to the recognition of a full valuation allowance. Income tax expense resulted from various minimal state tax expenses.
Segment Results of Operations
The for-profit education industry has been impacted by numerous regulatory changes, the changing economy and an onslaught of negative media attention. As a result of these challenges, student populations have declined and operating costs have increased. Over the past few years, the Company has closed over ten locations and exited its online business. In 2016, the Company ceased operations in Hartford, Connecticut; Fern Park, Florida; and Henderson (Green Valley), Nevada. In 2017, the Company completed the teach-out of its Center City Philadelphia, Pennsylvania; Northeast Philadelphia, Pennsylvania; West Palm Beach, Florida, Brockton, Massachusetts and Lowell, Massachusetts schools. All of these schools were previously included in our HOPS segment and are included in the Transitional segment as of December 31, 2017.
In the past, we offered any combination of programs at any campus. We have shifted our focus to program offerings that create greater differentiation among campuses and promote attainment of excellence to attract more students and gain market share. Also, strategically, we began offering continuing education training to select employers who hire our graduates and this is best achieved at campuses focused on the applicable profession.
As a result of the regulatory environment, market forces and our strategic decisions, we now operate our business in three reportable segments: (a) the Transportation and Skilled Trades segment; (b) the Healthcare and Other Professions segment; and (c) the Transitional segment. Our reportable segments have been determined based on a method by which we now evaluate performance and allocate resources. Each reportable segment represents a group of post-secondary education providers that offer a variety of degree and non-degree academic programs. These segments are organized by key market segments to enhance operational alignment within each segment to more effectively execute our strategic plan. Each of the Company’s schools is a reporting unit and an operating segment. Our operating segments are described below.
Transportation and Skilled Trades –
The
Transportation and Skilled Trades segment offers academic programs mainly in the career-oriented disciplines of transportation and skilled trades (e.g. automotive, diesel, HVAC, welding and manufacturing).
Healthcare and Other Professions –
The Healthcare and Other Professions segment offers academic programs in the career-oriented disciplines of health sciences, hospitality and business and information technology (e.g. dental assistant, medical assistant, practical nursing, culinary arts and cosmetology).
Transitional
– The Transitional segment refers to campuses that are being taught-out and closed and operations that are being phased out. The schools in the Transitional segment employ a gradual teach-out process that enables the schools to continue to operate to allow their current students to complete their course of study. These schools are no longer enrolling new students.
The Company continually evaluates each campus for profitability, earning potential, and customer satisfaction. This evaluation takes several factors into consideration, including the campus’s geographic location and program offerings, as well as skillsets required of our students by their potential employers. The purpose of this evaluation is to ensure that our programs provide our students with the best possible opportunity to succeed in the marketplace with the goals of attracting more students to our programs and, ultimately, to provide our shareholders with the maximum return on their investment. Campuses in the Transitional segment have been subject to this process and have been strategically identified for closure.
We evaluate segment performance based on operating results. Adjustments to reconcile segment results to consolidated results are included under the caption “Corporate,” which primarily includes unallocated corporate activity.
The following table present results for our three reportable segments for the years ended December 31, 2017 and 2016:
|
Twelve Months Ended December 31,
|
||||||||||||
|
2017
|
2016
|
% Change
|
||||||||||
|
Revenue:
|
||||||||||||
|
Transportation and Skilled Trades
|
$
|
177,099
|
$
|
177,883
|
-0.4
|
%
|
||||||
|
Healthcare and Other Professions
|
76,310
|
77,152
|
-1.1
|
%
|
||||||||
|
Transitional
|
8,444
|
30,524
|
-72.3
|
%
|
||||||||
|
Total
|
$
|
261,853
|
$
|
285,559
|
-8.3
|
%
|
||||||
|
Operating Income (Loss):
|
||||||||||||
|
Transportation and Skilled Trades
|
$
|
17,861
|
$
|
21,278
|
-16.1
|
%
|
||||||
|
Healthcare and Other Professions
|
2,318
|
(10,917
|
)
|
121.2
|
%
|
|||||||
|
Transitional
|
(5,379
|
)
|
(15,170
|
)
|
64.5
|
%
|
||||||
|
Corporate
|
(19,516
|
)
|
(24,105
|
)
|
19.0
|
%
|
||||||
|
Total
|
$
|
(4,716
|
)
|
$
|
(28,914
|
)
|
83.7
|
%
|
||||
|
Starts:
|
||||||||||||
|
Transportation and Skilled Trades
|
7,510
|
7,626
|
-1.5
|
%
|
||||||||
|
Healthcare and Other Professions
|
4,157
|
4,148
|
0.2
|
%
|
||||||||
|
Transitional
|
132
|
1,452
|
-90.9
|
%
|
||||||||
|
Total
|
11,799
|
13,226
|
-10.8
|
%
|
||||||||
|
Average Population:
|
||||||||||||
|
Transportation and Skilled Trades
|
6,752
|
6,852
|
-1.5
|
%
|
||||||||
|
Healthcare and Other Professions
|
3,569
|
3,560
|
0.3
|
%
|
||||||||
|
Transitional
|
451
|
1,452
|
-68.9
|
%
|
||||||||
|
Total
|
10,772
|
11,864
|
-9.2
|
%
|
||||||||
|
End of Period Population:
|
||||||||||||
|
Transportation and Skilled Trades
|
6,413
|
6,700
|
-4.3
|
%
|
||||||||
|
Healthcare and Other Professions
|
3,746
|
3,587
|
4.4
|
%
|
||||||||
|
Transitional
|
-
|
948
|
-100.0
|
%
|
||||||||
|
Total
|
10,159
|
11,235
|
-9.6
|
%
|
||||||||
Year Ended December 31, 2017 Compared to Year Ended December 31, 2016
Transportation and Skilled Trades
Student start results decreased by 1.5% to 7,510 for the year ended December 31, 2017 from 7,626 in the prior year comparable period.
Increased marketing spend targeted at the adult demographic has resulted in slightly higher adult start rates for the year ended December 31, 2017 when compared to the prior year comparable period
. However, as previously reported for the second quarter of 2017, there was a decline in starts as a result of a lower than expected high school start rate. Graduating high school students make up approximately 31% of the segment’s starts. In an effort to increase high school enrollments, the Company has made various changes to its processes and organizational structure. These shortfalls in the high school start rate have offset the favorable start rates for the adult start demographic.
Operating income decreased by $3.4 million, or 16.1%, to $17.9 million from $21.3 million mainly driven by the following factors:
| · |
Revenue decreased to $177.1 million for the year ended December 31, 2017, as compared to $177.9 million in the comparable prior year period. The slight decrease in revenue was primarily driven by a 1.5% decrease in average student population, partially offset by a 1.0% increase in average revenue per student.
|
| · |
Educational services and facilities expense decreased by $1.3 million, or 1.6%, mainly due to reductions in depreciation expense attributable to assets that have fully depreciated.
|
| · |
Selling, general and administrative expense increased by $4.0 million, primarily resulting from $1.4 million of additional bad debt expense resulting from higher student accounts, higher account write-off’s, and timing of Title IV Program receipts and a $1.4 million increase in marketing expense. The increase in marketing expense is part of a strategic effort to increase student population and increase brand awareness. As mentioned previously, the increased marketing spend targeted at the adult demographic has resulted in slightly higher starts year over year. This progress has been offset by lower than expected high school starts.
|
Healthcare and Other Professions
Student start results had increased slightly by 0.2% to 4,157 for the year ended December 31, 2017 from 4,148 in the prior year comparable period. This increase represents the first time in approximately three years where student starts have yielded positive results. We believe this achievement is the result of additional marketing spend aimed at increasing student population.
Operating income for the year ended December 31, 2017 was $2.3 million compared to an operating loss of $10.9 million in the prior year comparable period. The $13.2 million change was mainly driven by the following factors:
| · |
Revenue decreased to $76.3 million for the year ended December 31, 2017, as compared to $77.2 million in the comparable prior year period. The decrease in revenue is mainly attributable to a lower carry in population year over year of approximately 90 students and a
1.4% decline in average revenue per student due to tuition decreases at certain campuses.
|
| · |
Educational services and facilities expense increased by $0.2 million to $39.9 million for the year ended December 31, 2017 from $39.7 million in the prior year comparable period. The increase was attributable to a $0.3 million increase in books and tools expense resulting from the introduction of student laptops for an increasing number of program offerings.
|
| · |
Selling, general and administrative expenses increased by $1.9 million, or 5.8%, mainly due to a $1.3 million increase in sales and marketing expense as a result of increased spending in an effort to increase student population and brand awareness and a $0.4 million increase in administrative expense as a result of increased salaries and benefits. Increased salaries and benefits resulted from the addition of administrative staff to accommodate newly transferred students from our Northeast Philadelphia, Pennsylvania and Center City Philadelphia, Pennsylvania campuses, which were closed in August 2017.
|
| · |
Impairment of goodwill and long lived asset decreased by $16.1 million as a result of non-cash, pre-tax charges during the year ended December 31, 2016.
|
Transitional
The following table lists the schools that are categorized in the Transitional segment which are all closed as of December 31, 2017:
|
Campus
|
Date Closed
|
|
Northeast Philadelphia, Pennsylvania
|
September 30, 2017
|
|
Center City Philadelphia, Pennsylvania
|
August 31, 2017
|
|
West Palm Beach, Florida
|
September 30, 2017
|
|
Brockton, Massachusetts
|
December 31, 2017
|
|
Lowell, Massachusetts
|
December 31, 2017
|
|
Fern Park, Florida
|
March 31, 2016
|
|
Hartford, Connecticut
|
December 31, 2016
|
|
Henderson (Green Valley), Nevada
|
December 31, 2016
|
Revenue for the campuses in the above table have been classified in the Transitional segment for comparability for the years ended December 31, 2017 and 2016.
Revenue was $8.4 million for the year ended December 31, 2017 as compared to $30.5 million in the prior year comparable period mainly due to the campus closures.
Operating loss decreased by $9.8 million to $5.4 million for the year ended December 31, 2017 from $15.2 million in the prior year comparable period. The decrease was due to campus closures.
Corporate and Other
This category includes unallocated expenses incurred on behalf of the entire Company. Corporate and other expenses decreased by $4.6 million, or 19.0%, to $19.5 million from $24.1 million in the prior year comparable period. The decrease was primarily driven by a $1.5 million gain resulting from the sale of two properties located in West Palm Beach, Florida on August 14, 2017; a reduction in salaries and benefits expense of approximately $2.5 million; and a $1.4 million non-cash impairment charge in relation to one of our corporate properties that occurred in December 31, 2016. Partially offsetting these reductions were $1.6 million in additional closed school costs. The additional closed school costs related to the closure of the Hartford, Connecticut campus on December 31, 2016. The additional expenses relating to the Hartford, Connecticut campus were due to an apartment lease for student dorms, which will end in September 2019.
The following table present results for our two reportable segments for the years ended December 31, 2016 and 2015.
|
Twelve Months Ended December 31,
|
||||||||||||
|
2016
|
2015
|
% Change
|
||||||||||
|
Revenue:
|
||||||||||||
|
Transportation and Skilled Trades
|
$
|
177,883
|
$
|
183,822
|
-3.2
|
%
|
||||||
|
Healthcare and Other Professions
|
$
|
77,152
|
$
|
79,978
|
-3.5
|
%
|
||||||
|
Transitional
|
30,524
|
42,302
|
-27.8
|
%
|
||||||||
|
Total
|
$
|
285,559
|
$
|
306,102
|
-6.7
|
%
|
||||||
|
Operating Income (Loss):
|
||||||||||||
|
Transportation and Skilled Trades
|
$
|
21,278
|
$
|
26,777
|
-20.5
|
%
|
||||||
|
Healthcare and Other Professions
|
$
|
(10,917
|
)
|
$
|
5,386
|
-302.7
|
%
|
|||||
|
Transitional
|
(15,170
|
)
|
(7,543
|
)
|
-101.1
|
%
|
||||||
|
Corporate
|
(24,105
|
)
|
(23,916
|
)
|
-0.8
|
%
|
||||||
|
Total
|
$
|
(28,914
|
)
|
$
|
704
|
4207.1
|
%
|
|||||
|
Starts:
|
||||||||||||
|
Transportation and Skilled Trades
|
7,626
|
7,794
|
-2.2
|
%
|
||||||||
|
Healthcare and Other Professions
|
4,148
|
4,195
|
-1.1
|
%
|
||||||||
|
Transitional
|
1,452
|
2,080
|
-30.2
|
%
|
||||||||
|
Total
|
13,226
|
14,069
|
-6.0
|
%
|
||||||||
|
Average Population:
|
||||||||||||
|
Transportation and Skilled Trades
|
6,852
|
7,238
|
-5.3
|
%
|
||||||||
|
Healthcare and Other Professions
|
3,560
|
3,827
|
-7.0
|
%
|
||||||||
|
Transitional
|
1,452
|
1,916
|
-24.2
|
%
|
||||||||
|
Total
|
11,864
|
12,981
|
-8.6
|
%
|
||||||||
|
End of Period Population:
|
||||||||||||
|
Transportation and Skilled Trades
|
6,700
|
6,617
|
1.3
|
%
|
||||||||
|
Healthcare and Other Professions
|
3,587
|
3,677
|
-2.4
|
%
|
||||||||
|
Transitional
|
948
|
1,587
|
-40.3
|
%
|
||||||||
|
Total
|
11,235
|
11,881
|
-5.4
|
%
|
||||||||
Year Ended December 31, 2016 Compared to Year Ended December 31, 2015
Transportation and Skilled Trades
Student start results decreased by 2.2% to 7,626 from 7,794 for the year ended December 31, 2016 as compared to the prior year comparable period. The decline in student starts was mainly the result of the underperformance of one campus. Excluding this campus, student starts for the year would have grown 1.3% year over year.
Operating income decreased by $5.5 million, or 20.5%, to $21.3 million from $26.8 million in the prior year mainly driven by the following factors:
| · |
Revenue decreased to $177.9 million for the year ended December 31, 2016, as compared to $183.8 million for the year ended December 31, 2015, primarily driven by a 5.3% decrease in average student population, which decreased to approximately 6,900 from 7,200 in the prior year. The decrease in average population was a result of starting 2016 with approximately 600 fewer students than we had on January 1, 2015. The revenue decline from a lower population was slightly offset by a 2.2% increase in average revenue per student due to a shift in program mix.
|
| · |
Educational services and facilities expense increased by $1.9 million mainly due to a $2.0 million, or 5.9%, increase in facilities expense primarily due to (a) increased rent expense of $1.3 million as a result of a modification of leases for three of our campuses, which were previously accounted for as finance obligations under which rent payments were previously included in interest expense; (b) $0.6 million in additional depreciation expense resulting from the
reclassification of one of our facilities out of held for sale as of December 31, 2015
; and (c) a $1.5 million, or 17.4%, increase in books and tools expenses resulting from the purchase of laptops provided to newly enrolled students in certain programs to enhance and expand their overall learning experience. Partially offsetting the above increases was a $1.6 million, or 4.1%, decrease in instructional expense as a result of realigning our cost structure to meet our population
.
|
| · |
Selling, general and administrative expenses decreased by $0.5 million primarily as a result of a
$1.6 million decrease in administrative and student services expense due to reduced salary and benefits. Partially offsetting the decrease was a $1.1 million increase in marketing expense, which was largely the result of additional spending in a strategic effort to reach more potential students, expand brand awareness and increase enrollments.
|
| · |
Loss on sale of asset decreased by $1.6 million as a result of a one-time charge in relation to one of our campuses that was previously classified as held for sale. During 2015, the company had reclassified this campus out of held for sale and recorded catch-up depreciation in the amount of $1.6 million.
|
| · |
Impairment of goodwill and long lived asset decreased by $0.2 million as a result of one-time charges in relation to one of our campuses during the year ended December 31, 2015.
|
Healthcare and Other Professions
Student starts decreased by 1.1% to 4,148 from 4,195 for the year ended December 31, 2016 as compared to the prior year.
Operating loss increased to $10.9 million for the year ended December 31, 2016 from operating income of $5.4 million in the prior year comparable period mainly driven by the following factors:
| · |
Revenue decreased to $77.2 million for the year ended December 31, 2016, as compared to $80.0 million in the comparable prior year period, primarily driven by a 7.0% decrease in average student population, which decreased to approximately 3,600 from 3,800 in the prior year. The decrease in average population was a result of starting 2016 with approximately 350 fewer students than we had on January 1, 2015. The revenue decline from a lower population was slightly offset by a 3.6% increase in average revenue per student due to a shift in program mix.
|
| · |
Educational services and facilities expense decreased by $2.6 million mainly due to a $1.9 million, or 13.0%, decrease in facilities expense primarily due to the suspension of depreciation expense during the year ended December 31, 2016 as this segment was classified as held for sale.
|
| · |
Selling, general and administrative expenses remained essentially flat at $32.3 million for the year ended December 31, 2016 and 2015.
|
| · |
Impairment of goodwill and long lived assets of $16.1 million at December 31, 2016.
|
Transitional
The following table lists the schools that are categorized in the Transitional segment and their status as of December 31, 2016:
|
Campus
|
Date Closed
|
|
Northeast Philadelphia, Pennsylvania
|
September 30, 2017
|
|
Center City Philadelphia, Pennsylvania
|
August 31, 2017
|
|
West Palm Beach, Florida
|
September 30, 2017
|
|
Brockton, Massachusetts
|
December 31, 2017
|
|
Lowell, Massachusetts
|
December 31, 2017
|
|
Fern Park, Florida
|
March 31, 2016
|
|
Hartford, Connecticut
|
December 31, 2016
|
|
Henderson (Green Valley), Nevada
|
December 31, 2016
|
Revenue for the campuses in the above table have been classified in the Transitional segment for comparability for the year ended December 31, 2016 and 2015.
Revenue was $30.5 million for the year ended December 31, 2016 as compared to $42.3 million in the prior year comparable period mainly due to the campus closures.
Operating loss increased by $7.6 million to $15.2 million for the year ended December 31, 2016 from $7.5 million in the prior year comparable period. The decrease was due to campus closures.
Corporate and Other
This category includes unallocated expenses incurred on behalf of the entire Company. Corporate and other costs increased by $0.2 million, or 0.8%, to $24.1 million for the year ended December 31, 2016 from $23.9 million in the prior year comparable period. This increase was primarily the result of a $1.4 million non-cash impairment charge in relation to one of our corporate properties. Partially offsetting the increase is a $0.6 million decrease in administrative costs resulting from a reduction in salaries and benefits expense and a $0.6 million gain resulting from the sale of certain Company assets for the year ended December 31, 2016.
LIQUIDITY AND CAPITAL RESOURCES
Our primary capital requirements are for facilities expansion and maintenance, and the development of new programs. Our principal sources of liquidity have been cash provided by operating activities and borrowings under our credit facility. The following chart summarizes the principal elements of our cash flow for each of the three years in the period ended December 31, 2017:
|
Cash Flow Summary
Year Ended December 31,
|
||||||||||||
|
2017
|
2016
|
2015
|
||||||||||
|
(In thousands)
|
||||||||||||
|
Net cash (used in) provided by operating activities
|
$
|
(11,321
|
)
|
$
|
(6,107
|
)
|
$
|
14,337
|
||||
|
Net cash provided by (used in) investing activities
|
$
|
9,917
|
$
|
(2,182
|
)
|
$
|
(1,767
|
)
|
||||
|
Net cash (used in) provided by financing activities
|
$
|
(5,097
|
)
|
$
|
(9,067
|
)
|
$
|
13,551
|
||||
The Company had $54.6 million of cash, cash equivalents, and restricted cash at December 31, 2017 ($40.0 million of restricted cash at December 31, 2017) as compared to $47.7 million of cash, cash equivalents, and restricted cash as of December 31, 2016 ($26.7 million of restricted cash at December 31, 2016).
This increase is primarily the result of borrowings under our line of credit facility partially offset by repayment under our previous term loan facility, a net loss during the year ended December 31, 2017 and seasonality of the business.
For the last several years, the Company and the proprietary school sector generally have faced deteriorating earnings growth. Government regulations have negatively impacted earnings by making it more difficult for prospective students to obtain loans, which when coupled with the overall economic environment have hindered prospective students from enrolling in our schools. In light of these factors, we have incurred significant operating losses as a result of lower student population. Despite these events, we believe that our likely sources of cash should be sufficient to fund operations for the next twelve months and thereafter for the foreseeable future.
To fund our business plans, including any anticipated future losses, purchase commitments, capital expenditures and principal and interest payments on borrowings, we leveraged our owned real estate. We are also continuing to take actions to improve cash flow by aligning our cost structure to our student population.
In addition to our current sources of capital that provide short term liquidity, the Company has been making efforts to sell its Mangonia Park, Palm Beach County, Florida property and associated assets originally operated in the HOPS segment, which has been classified as held for sale.
Our primary source of cash is tuition collected from our students. The majority of students enrolled at our schools rely on funds received under various government-sponsored student financial aid programs to pay a substantial portion of their tuition and other education-related expenses. The most significant source of student financing is Title IV Programs, which represented approximately 78% of our cash receipts relating to revenues in 2017. Pursuant to applicable regulations, students must apply for a new loan for each academic period. Federal regulations dictate the timing of disbursements of funds under Title IV Programs and loan funds are generally provided by lenders in two disbursements for each academic year. The first disbursement is usually received approximately 31 days after the start of a student’s academic year and the second disbursement is typically received at the beginning of the sixteenth week from the start of the student's academic year. Certain types of grants and other funding are not subject to a 31-day delay. In certain instances, if a student withdraws from a program prior to a specified date, any paid but unearned tuition or prorated Title IV Program financial aid is refunded according to federal, state and accrediting agency standards.
As a result of the significant amount of Title IV Program funds received by our students, we are highly dependent on these funds to operate our business. Any reduction in the level of Title IV Program funds that our students are eligible to receive or any restriction on our eligibility to receive Title IV Program funds would have a significant impact on our operations and our financial condition. See “Risk Factors” in Item 1A of this Annual Report on Form 10-K for the year ended December 31, 2017.
On January 11, 2018, the DOE sent letters to our Columbia, Maryland and Iselin, New Jersey institutions requiring each institution to submit a letter of credit to the DOE based on findings of late returns of Title IV funds in the annual Title IV compliance audits submitted to the DOE for the fiscal year ended December 31, 2016. Our Iselin institution provided evidence demonstrating that only 3% of the Title IV Program funds returned were late. However, the DOE concluded that a letter of credit would nevertheless be required for each institution because the regulatory auditor included a finding that there was a material weakness in our report on internal controls relating to return of unearned Title IV Program funds. We disagree with the regulatory auditor’s conclusion that a material weakness could exist if the error rate in the expanded audit sample is only 3%
or approximately $20,000
and we believe that the regulatory auditor’s conclusion is erroneous. We requested the DOE to reconsider the letter of credit requirement. By letter dated February 7, 2018, DOE maintained that the refund letters of credit were necessary but agreed that the amount of each letter of credit could be based on the returns that were required to be made by each institution in the 2017 fiscal year rather than the 2016 fiscal year. Accordingly, we submitted letters of credit in the amounts of $0.5 million and $0.1 million by the February 23, 2018 deadline and expect that these letters of credit will remain in place for a minimum of two years.
Operating Activities
Net cash used in operating activities was $11.3 million for the year ended December 31, 2017 compared to $6.1 million for the comparable period of 2016. The increase in cash used in operating activities in the year ended December 31, 2017 as compared to the year ended December 31, 2016 is primarily due to an increased net loss as well as changes in other working capital such as accounts receivable, accounts payable, accrued expenses and unearned tuition.
Investing Activities
Net cash provided by investing activities was $9.9 million for the year ended December 31, 2017 compared to net cash used of $2.2 million in the prior year comparable period. The increase of $12.1 million was primarily the result of the sale of two of our three properties located in West Palm Beach, Florida resulting in cash inflows of $15.5 million. The sale of the two properties occurred on August 14, 2017.
One of our primary uses of cash in investing activities was capital expenditures associated with investments in training technology, classroom furniture, and new program buildouts.
We currently lease a majority of our campuses. We own our schools in Grand Prairie, Texas; Nashville, Tennessee; and Denver, Colorado and our former school properties in Mangonia Park, Palm Beach County, Florida and Suffield, Connecticut.
Capital expenditures are expected to approximate 2% of revenues in 2018. We expect to fund future capital expenditures with cash generated from operating activities, borrowings under our revolving credit facility, and cash from our real estate monetization.
Financing Activities
Net cash used in financing activities was $5.1 million as compared to net cash used of $9.1 million for the years ended December 31, 2017 and 2016, respectively.
The decrease of $4.0 million was primarily due to two main factors: (a) net payments on borrowings of $3.4 million; and (b) $2.9 million in lease termination fees paid in the prior year.
Net borrowings consisted of: (a) total borrowing to date under our secured revolving credit facility of $75.9 million; (b) reclassification of payments of borrowing from restricted cash of $20.3 million; (c) reclassification of proceeds from borrowings to restricted cash of $32.8 million; and (d) $66.8 million in total repayments made by the Company. The noncurrent restricted cash balance of $32.8 million has been repaid in 2018.
Credit Agreement
On March 31, 2017, the Company entered into a secured revolving credit agreement (the “Credit Agreement”) with Sterling National Bank (the “Bank”) pursuant to which the Company obtained a credit facility in the aggregate principal amount of up to $55 million (the “Credit Facility”). The Credit Facility consists of (a) a $30 million loan facility (“Facility 1”), which is comprised of a $25 million revolving loan designated as “Tranche A” and a $5 million non-revolving loan designated as “Tranche B,” which Tranche B was repaid during the quarter ended June 30, 2017 and (b) a $25 million revolving loan facility (“Facility 2”), which includes a sublimit amount for letters of credit of $10 million.
The Credit Agreement was subsequently amended, on November 29, 2017, to provide the Company with an additional $15 million revolving credit
loan (“Facility 3”), resulting in an increase in the aggregate availability under the Credit Facility to $65 million. The Credit Agreement was again amended on February 23, 2018, to, among other things, effect certain modifications to the financial covenants and other provisions of the Credit Agreement and to allow the Company to pursue the sale of certain real property assets. The February 23, 2018 amendment increased the interest rate for borrowings under Tranche A of Facility 1 to a rate per annum equal to the greater of (x) the Bank’s prime rate plus 2.85% and (y) 6.00%. Prior to the most recent amendment of the Credit Agreement, revolving loans outstanding under Tranche A of Facility 1 bore interest at a rate per annum equal to the greater of (x) the Bank’s prime rate plus 2.50% and (y) 6.00%.
The Credit Facility replaces a term loan facility (the “Prior Credit Facility”) which was repaid and terminated concurrently with the effectiveness of the Credit Facility. The term of the Credit Facility is 38 months, maturing on May 31, 2020, except that the term of Facility 3 will mature one year earlier, on May 31, 2019.
The Credit Facility is secured by a first priority lien in favor of the Bank on substantially all of the personal property owned by the Company as well as mortgages on four parcels of real property owned by the Company in Colorado, Tennessee and Texas at which three of the Company’s schools are located, as well as a former school property owned by the Company located in Connecticut.
At the closing of the Credit Facility, the Company drew $25 million under Tranche A of Facility 1, which, pursuant to the terms of the Credit Agreement, was used to repay the Prior Credit Facility and to pay transaction costs associated with closing the Credit Facility. After the disbursements of such amounts, the Company retained approximately $1.8 million of the borrowed amount for working capital purposes.
Also, at closing, $5 million was drawn under Tranche B and, pursuant to the terms of the Credit Agreement, was deposited into an interest-bearing pledged account (the “Pledged Account”) in the name of the Company maintained at the Bank in order to secure payment obligations of the Company with respect to the costs of remediation of any environmental contamination discovered at certain of the mortgaged properties based upon environmental studies undertaken at such properties. During the quarter ended June 30, 2017, the environmental studies were completed and revealed no environmental issues existing at the properties. Accordingly, pursuant to the terms of the Credit Agreement, the $5 million in the Pledged Account was released and used to repay the non-revolving loan outstanding under Tranche B. Upon the repayment of Tranche B, the maximum principal amount of Facility 1 was permanently reduced to $25 million.
Pursuant to the terms of the Credit Agreement, all draws under Facility 2 for letters of credit or revolving loans and all draws under Facility 3 must be secured by cash collateral in an amount equal to 100% of the aggregate stated amount of the letters of credit issued and revolving loans outstanding through draws from Facility 1 or other available cash of the Company.
Accrued interest on each revolving loan will be payable monthly in arrears. Revolving loans under Tranche A of Facility 1 bear interest at a rate per annum equal to the greater of (x) the Bank’s prime rate plus 2.85% and (y) 6.00%. Prior to the February 23, 2018 amendment of the Credit Agreement, the interest rate for revolving loans under Tranche A of Facility 1 was equal to the greater of (x) the Bank’s prime rate plus 2.50% and (y) 6.00%. The amount borrowed under Tranche B of Facility 1 and revolving loans under Facility 2 and Facility 3 will bear interest at a rate per annum equal to the greater of (x) the Bank’s prime rate and (y) 3.50%.
Each issuance of a letter of credit under Facility 2 will require the payment of a letter of credit fee to the Bank equal to a rate per annum of 1.75% on the daily amount available to be drawn under the letter of credit, which fee shall be payable in quarterly installments in arrears. Letters of credit totaling $6.2 million that were outstanding under a $9.5 million letter of credit facility previously provided to the Company by the Bank, which letter of credit facility was set to mature on April 1, 2017, are treated as letters of credit under Facility 2.
The terms of the Credit Agreement provide that the Bank be paid an unused facility fee on the average daily unused balance of Facility 1 at a rate per annum equal to 0.50%, which fee is payable quarterly in arrears. In addition, the Company is required to maintain, on deposit in one or more non-interest bearing accounts, a minimum of $5 million in quarterly average aggregate balances. If in any quarter the required average aggregate account balance is not maintained, the Company is required to pay the Bank a fee of $12,500 for that quarter and, in the event that the Company terminates the Credit Facility or refinances with another lender within 18 months of closing, the Company is required to pay the Bank a breakage fee of $500,000.
In addition to the foregoing, the Credit Agreement contains customary representations, warranties and affirmative and negative covenants, including financial covenants that restrict capital expenditures, prohibit the incurrence of a net loss commencing on December 31, 2018 and require a minimum adjusted EBITDA and a minimum tangible net worth, which is an annual covenant, as well as events of default customary for facilities of this type. As of December 31, 2017, the Company is in compliance with all covenants.
In connection with the Credit Agreement, the Company paid the Bank an origination fee in the amount of $250,000 and other fees and reimbursements that are customary for facilities of this type. In connection with the second amendment of the Credit Agreement, the Company paid to the Bank a modification fee in the amount of $50,000.
The Company incurred an early termination premium of approximately $1.8 million in connection with the termination of the Prior Credit Facility.
On April 28, 2017, the Company entered into an additional secured credit agreement with the Bank, pursuant to which the Company obtained a short term loan in the principal amount of $8 million, the proceeds of which were used for working capital and general corporate purposes. The loan, which had an interest rate equal to the greater of the Bank’s prime rate plus 2.50% or 6.00%, was secured by two real property assets located in West Palm Beach, Florida at which schools operated by the Company were located and matured upon the earlier of October 1, 2017 and the date of the sale of the West Palm Beach, Florida property. The Company sold the two properties located in West Palm Beach, Florida to Tambone
Companies, LLC
in the third quarter of 2017 and subsequently repaid the $8 million.
As of December 31, 2017, the Company had $53.4 million outstanding under the Credit Facility; offset by $0.8 million of deferred finance fees. As of December 31, 2016, the Company had $44.3 million outstanding under the Prior Credit Facility; offset by $2.3 million of deferred finance fees, which were written-off. As of December 31, 2017 and December 31, 2016, there were letters of credit in the aggregate outstanding principal amount of $7.2 million and $6.2 million, respectively.
Long-term debt and lease obligations consist of the following:
|
As of December 31,
|
||||||||
|
2017
|
2016
|
|||||||
|
Credit agreement
|
$
|
53,400
|
$
|
-
|
||||
|
Term loan
|
-
|
44,267
|
||||||
|
Deferred financing fees
|
(807
|
)
|
(2,310
|
)
|
||||
|
Subtotal
|
52,593
|
41,957
|
||||||
|
Less current maturities
|
-
|
(11,713
|
)
|
|||||
|
Total long-term debt
|
$
|
52,593
|
$
|
30,244
|
||||
As of December 31, 2017, we had outstanding loan commitments to our students of $51.9 million, as compared to $40.0 million at December 31, 2016. Loan commitments, net of interest that would be due on the loans through maturity, were $38.5 million at December 31, 2017, as compared to $30.0 million at December 31, 2016.
Climate Change
Climate change has not had and is not expected to have a significant impact on our operations.
Contractual Obligations
Current portion of Long-Term Debt, Long-Term Debt and Lease Commitments.
As of December 31, 2017, our current portion of long-term debt and long-term debt consisted of borrowings under our Credit Facility.
We lease offices, educational facilities and various equipment for varying periods through the year 2030 at basic annual rentals (excluding taxes, insurance, and other expenses under certain leases).
The following table contains supplemental information regarding our total contractual obligations as of December 31, 2017:
|
Payments Due by Period
|
||||||||||||||||||||
|
Total
|
Less than
1 year
|
1-3 years
|
3-5 years
|
More than
5 years
|
||||||||||||||||
|
Credit facility
|
$
|
53,400
|
$
|
-
|
$
|
53,400
|
$
|
-
|
$
|
-
|
||||||||||
|
Operating leases
|
78,408
|
19,347
|
28,994
|
14,207
|
15,860
|
|||||||||||||||
|
Total contractual cash obligations
|
$
|
131,808
|
$
|
19,347
|
$
|
82,394
|
$
|
14,207
|
$
|
15,860
|
||||||||||
OFF-BALANCE SHEET ARRANGEMENTS
We had no off-balance sheet arrangements as of December 31, 2017, except for surety bonds. At December 31, 2017, we posted surety bonds in the total amount of approximately $12.7 million. Cash collateralized letters of credit of $6.5 million are primarily comprised of letters of credit for DOE matters and security deposits in connection with certain of our real estate leases. We are required to post surety bonds on behalf of our campuses and education representatives with multiple states to maintain authorization to conduct our business. These off-balance sheet arrangements do not adversely impact our liquidity or capital resources.
SEASONALITY AND OUTLOOK
Seasonality
Our revenue and operating results normally fluctuate as a result of seasonal variations in our business, principally due to changes in total student population. Student population varies as a result of new student enrollments, graduations and student attrition. Historically, our schools have had lower student populations in our first and second quarters and we have experienced larger class starts in the third quarter and higher student attrition in the first half of the year. Our second half growth is largely dependent on a successful high school recruiting season. We recruit our high school students several months ahead of their scheduled start dates and, thus, while we have visibility on the number of students who have expressed interest in attending our schools, we cannot predict with certainty the actual number of new student enrollments and the related impact on revenue. Our expenses, however, typically do not vary significantly over the course of the year with changes in our student population and revenue. During the first half of the year, we make significant investments in marketing, staff, programs and facilities to meet our second half of the year targets and, as a result, such expenses do not fluctuate significantly on a quarterly basis. To the extent new student enrollments, and related revenue, in the second half of the year fall short of our estimates, our operating results could be negatively impacted. We expect quarterly fluctuations in operating results to continue as a result of seasonal enrollment patterns. Such patterns may change as a result of new school openings, new program introductions, and increased enrollments of adult students and/or acquisitions.
Outlook
Similar to many companies in the proprietary education sector, we have experienced significant deterioration in student enrollments over the last several years. This can be attributed to many factors including the economic environment and numerous regulatory changes such as changes to admissions advisor compensation policies, elimination of “ability-to-benefit,” changes to the 90/10 Rule and cohort default rates, gainful employment and modifications to Title IV Program amounts and eligibility. While the industry has not returned to growth, the trends are far more stable as declines have slowed.
As the economy continues to improve and the unemployment rate continues to decline our student enrollment is negatively impacted due to a portion of our potential student base entering the workforce earlier without obtaining any post-secondary training. Offsetting this short term decline in available students is the fact that an increasing number of individuals in the “baby boom” generation are retiring from the workforce. The retirement of baby boomers coupled with a growing economy has resulted in additional employers looking to us to help solve their workforce needs. With schools in 14 states, we are a very attractive employment solution for large regional and national employers.
To fund our business plans, including any anticipated future losses, purchase commitments, capital expenditures, principal and interest payments on borrowings and to satisfy the DOE financial responsibility standards, we have entered into a new credit facility as described above and continue to have the ability to sell our assets that are classified as held for sale. We are also continuing to take actions to improve cash flow by aligning our cost structure to our student population.
Effect of Inflation
Inflation has not had and is not expected to have a significant impact on our operations.
We are exposed to certain market risks as part of our on-going business operations. On March 31, 2017, the Company repaid in full and terminated a previously existing term loan with the proceeds of a new revolving credit facility (the “Credit Facility”) provided by Sterling National Bank, which currently provides the Company with aggregate availability of $65 million.
The Credit Facility is discussed in further detail under the heading “Liquidity and Capital Resources” in Item 7 of this report and in Note 7 to the consolidated financial statements included in this report.
Our obligations under the Credit Facility are secured by a lien on substantially all of our assets and any assets that we or our subsidiaries may acquire in the future. Outstanding borrowings under the Credit Facility bear interest at the rate of 7.00% as of December 31, 2017. As of December 31, 2017, we had $53.4 million outstanding under the Credit Facility.
Based on our outstanding debt balance as of December 31, 2017, a change of one percent in the interest rate would have caused a change in our interest expense of approximately $0.5 million, or $0.02 per basic share, on an annual basis. Changes in interest rates could have an impact on our operations, which are greatly dependent on our students’ ability to obtain financing and, as such, any increase in interest rates could greatly impact our ability to attract students and have an adverse impact on the results of our operations. The remainder of our interest rate risk is associated with miscellaneous capital equipment leases, which is not significant.
See “Index to Consolidated Financial Statements” on page F-1 of this Annual Report on Form 10-K.
None.
Evaluation of disclosure controls and procedures
Our Chief Executive Officer and Chief Financial Officer, after evaluating, together with management, the effectiveness of our disclosure controls and procedures (as defined in Securities Exchange Act Rule 13a-15(e)) as of December 31, 2017 have concluded that our disclosure controls and procedures are effective to reasonably ensure that material information required to be disclosed by us in the reports that we file or submit under the Securities Exchange Act of 1934, as amended, is recorded, processed, summarized and reported within the time periods specified by Securities and Exchange Commissions’ Rules and Forms and that such information is accumulated and communicated to our management, including our Chief Executive Officer and Chief Financial Officer, as appropriate, to allow timely decisions regarding required disclosure.
Internal Control Over Financial Reporting
During the quarter ended December 31, 2017, there has been no change in our internal control over financial reporting that has materially affected, or is reasonably likely to materially affect, our internal control over financial reporting.
Management’s Annual Report on Internal Control over Financial Reporting
The management of the Company is responsible for establishing and maintaining adequate internal control over financial reporting as defined in Rule 13a-15(f) under the Securities Exchange Act of 1934, as amended. The Company’s internal control system was designed to provide reasonable assurance to the Company’s management and Board of Directors regarding the reliability of financial reporting and the preparation of financial statements for external purposes in accordance with generally accepted accounting principles.
Management assessed the effectiveness of the Company’s internal control over financial reporting as of December 31, 2017, based on the framework set forth by the Committee of Sponsoring Organizations of the Treadway Commission (COSO) in
Internal Control—Integrated Framework (2013)
. Based on its assessment, management believes that, as of December 31, 2017, the Company’s internal control over financial reporting is effective.
Because of its inherent limitations, internal control over financial reporting may not prevent or detect misstatements. Also, projections of any evaluation of effectiveness to future periods are subject to the risk that controls may become inadequate because of changes in conditions, or that the degree of compliance with the policies or procedures may deteriorate.
The Company’s independent auditors, Deloitte & Touche LLP, an independent registered public accounting firm, audited the Company’s internal control over financial reporting as of December 31, 2017, as stated in their report included in this Form 10-K that follows.
None.
PART III.
Directors and Executive Officers
The information required by this item is incorporated herein by reference to our definitive Proxy Statement to be filed in connection with our 2018 Annual Meeting of Shareholders.
Code of Ethics
We have adopted a Code of Conduct and Ethics applicable to our directors, officers and employees and certain other persons, including our Chief Executive Officer and Chief Financial Officer. A copy of our Code of Ethics is available on our website at
www.lincolnedu.com
. If any amendments to or waivers from the Code of Conduct are made, we will disclose such amendments or waivers on our website.
Information required by Item 11 of Part III is incorporated by reference to our definitive Proxy Statement to be filed in connection with our 2018 Annual Meeting of Shareholders.
| ITEM 12. |
SECURITY OWNERSHIP OF CERTAIN BENEFICIAL OWNERS AND MANAGEMENT AND RELATED STOCKHOLDER MATTERS
|
Information required by Item 12 of Part III is incorporated by reference to our definitive Proxy Statement to be filed in connection with our 2018 Annual Meeting of Shareholders.
Information required by Item 13 of Part III is incorporated by reference to our definitive Proxy Statement to be filed in connection with our 2018 Annual Meeting of Shareholders.
Information required by Item 14 of Part III is incorporated by reference to our definitive Proxy Statement to be filed in connection with our 2018 Annual Meeting of Shareholders.
PART IV.
| 1. |
Financial Statements
|
See “Index to Consolidated Financial Statements” on page F-1 of this Annual Report on Form 10-K.
| 2. |
Financial Statement Schedule
|
See “Index to Consolidated Financial Statements” on page F-1 of this Annual Report on Form 10-K.
| 3. |
Exhibits Required by Securities and Exchange Commission Regulation S-K
|
|
Exhibit
Number
|
Description
|
|
2.1
|
Purchase and Sale Agreement, dated March 14, 2017, between New England Institute of Technology at Palm Beach, Inc. and Tambone Companies, LLC, as amended by First Amendment to Purchase and Sale Agreement dated as of April 18, 2017, and as further amended by Second Amendment to Purchase and Sale Agreement dated as of May 12, 2017 (1).
|
|
3.1
|
Amended and Restated Certificate of Incorporation of the Company (2).
|
|
3.2
|
By-laws of the Company (3).
|
|
4.1
|
Management Stockholders Agreement, dated as of January 1, 2002, by and among Lincoln Technical Institute, Inc., Back to School Acquisition, L.L.C. and the Stockholders and other holders of options under the Management Stock Option Plan listed therein (4).
|
|
4.2
|
Assumption Agreement and First Amendment to Management Stockholders Agreement, dated as of December 20, 2007, by and among Lincoln Educational Services Corporation, Lincoln Technical Institute, Inc., Back to School Acquisition, L.L.C. and the Management Investors parties therein (5).
|
|
4.3
|
Registration Rights Agreement, dated as of June 27, 2005, between the Company and Back to School Acquisition, L.L.C. (3).
|
|
4.4
|
Specimen Stock Certificate evidencing shares of common stock (6).
|
|
10.1
|
Credit Agreement, dated as of July 31, 2015, among Lincoln Educational Services Corporation and its wholly-owned subsidiaries, the Lenders and Collateral Agents party thereto, and HPF Service, LLC, as Administrative Agent (7).
|
|
10.2
|
First Amendment to Credit Agreement, dated as of December 31, 2015, among Lincoln Educational Services Corporation and its wholly-owned subsidiaries, the Lenders and Collateral Agents party thereto, and HPF Service, LLC, as Administrative Agent (8).
|
|
10.3
|
Second Amendment to Credit Agreement, dated as of February 29, 2016, among Lincoln Educational Services Corporation and its wholly-owned subsidiaries, the Lenders party thereto, and HPF Service, LLC, as Administrative Agent and Tranche A Collateral Agent (9).
|
|
10.4
|
Credit Agreement, dated as of April 12, 2016, among the Company, Lincoln Technical Institute, Inc. and its subsidiaries, and Sterling National Bank (10).
|
|
10.5
|
Credit Agreement, dated as of March 31, 2017, among the Company, Lincoln Technical Institute, Inc. and its subsidiaries, and Sterling National Bank (11).
|
|
10.6
|
Credit Agreement, dated as of April 28, 2017, among the Company, Lincoln Technical Institute, Inc. and its subsidiaries, and Sterling National Bank (12).
|
|
10.7
|
First Amendment to Credit Agreement, dated as of November 29, 2017, among the Company, Lincoln Technical Institute, Inc. and its subsidiaries, and Sterling National Bank (13)
|
|
10.8
|
Second Amendment to Credit Agreement, dated as of February 23, 2018, among the Company, Lincoln Technical Institute, Inc. and its subsidiaries, and Sterling National Bank (26)
|
|
10.9
|
Purchase and Sale Agreement, dated as of July 1, 2016, between New England Institute of Technology at Palm Beach, Inc. and School Property Development Metrocentre, LLC (14).
|
|
10.10
|
Employment Agreement, dated as of August 23, 2016, between the Company and Scott M. Shaw (15)
|
|
10.11
|
Employment Agreement, dated as of November 8, 2017, between the Company and Scott M. Shaw (16).
|
|
10.12
|
Separation and Release Agreement, dated as of January 15, 2016, between the Company and Kenneth M. Swisstack (17).
|
|
10.13
|
Employment Agreement, dated as of August 23, 2016, between the Company and Brian K. Meyers (15).
|
|
10.14
|
Employment Agreement, dated as of November 8, 2017, between the Company and Brian K. Meyers (16).
|
|
10.15
|
Change in Control Agreement, dated August 31, 2016, between the Company and Deborah Ramentol (18).
|
|
10.16
|
Separation and Release Agreement, dated as of January 24, 2018, between the Company and Deborah Ramentol (19).
|
|
10.17
|
Change in Control Agreement, dated as of November 8, 2017, between the Company and Deborah Ramentol (20).
|
|
10.18
|
Lincoln Educational Services Corporation Amended and Restated 2005 Long-Term Incentive Plan (21).
|
|
10.19
|
Lincoln Educational Services Corporation Amended and Restated 2005 Non-Employee Directors Restricted Stock Plan (22).
|
|
10.20
|
Lincoln Educational Services Corporation 2005 Deferred Compensation Plan (4).
|
|
10.21
|
Lincoln Technical Institute Management Stock Option Plan, effective January 1, 2002 (4).
|
|
10.22
|
Form of Stock Option Agreement, dated January 1, 2002, between Lincoln Technical Institute, Inc. and certain participants (4).
|
|
10.23
|
Form of Stock Option Agreement under our 2005 Long-Term Incentive Plan (23).
|
|
10.24
|
Form of Restricted Stock Agreement under our 2005 Long-Term Incentive Plan (24).
|
|
10.25
|
Form of Performance-Based Restricted Stock Award Agreement under our Amended & Restated 2005 Long-Term Incentive Plan (25).
|
|
10.26
|
Management Stock Subscription Agreement, dated January 1, 2002, among Lincoln Technical Institute, Inc. and certain management investors (4).
|
|
21.1*
|
Subsidiaries of the Company.
|
|
23*
|
Consent of Independent Registered Public Accounting Firm.
|
|
24*
|
Power of Attorney (included on the Signatures page of this Form 10-K).
|
|
31.1 *
|
Certification of Chief Executive Officer pursuant to Section 302 of the Sarbanes-Oxley Act of 2002.
|
|
31.2 *
|
Certification of Chief Financial Officer pursuant to Section 302 of the Sarbanes-Oxley Act of 2002.
|
|
32 *
|
Certification of Chief Executive Officer and Chief Financial Officer pursuant to 18 U.S.C. 1350, as adopted pursuant to Section 906 of the Sarbanes-Oxley Act of 2002.
|
|
101**
|
The following financial statements from Lincoln Educational Services Corporation’s Annual Report on Form 10-K for the year ended December 31, 2017, formatted in XBRL: (i) Consolidated Statements of Operations, (ii) Consolidated Balance Sheets, (iii) Consolidated Statements of Cash Flows, (iv) Consolidated Statements of Comprehensive (Loss) Income, (v) Consolidated Statement of Changes in Stockholders’ Equity and (vi) the Notes to Consolidated Financial Statements, tagged as blocks of text and in detail.
|
| (1) |
Incorporated by reference to the Company’s Form 8-K filed August 16, 2017.
|
| (2) |
Incorporated by reference to the Company’s Registration Statement on Form S-1/A (Registration No. 333-123644) filed June 7, 2005.
|
| (3) |
Incorporated by reference to the Company’s Form 8-K filed June 28, 2005.
|
|
(4)
|
Incorporated by reference to the Company’s Registration Statement on Form S-1 (Registration No. 333-123644) filed March 29, 2005.
|
| (5) |
Incorporated by reference to the Company’s Registration Statement on Form S-3 (Registration No. 333-148406) filed December 28, 2007.
|
| (6) |
Incorporated by reference to the Company’s Registration Statement on Form S-1/A (Registration No. 333-123644) filed June 21, 2005.
|
| (7) |
Incorporated by reference to the Company’s Form 8-K filed August 5, 2015.
|
| (8) |
Incorporated by reference to the Company’s Form 8-K filed January 7, 2016.
|
| (9) |
Incorporated by reference to the Company’s Form 8-K filed March 4, 2016.
|
| (10) |
Incorporated by reference to the Company’s Form 8-K filed April 18, 2016.
|
| (11) |
Incorporated by reference to the Company’s Form 8-K filed April 6, 2017.
|
| (12) |
Incorporated by reference to the Company’s Form 8-K filed May 4, 2017.
|
| (13) |
Incorporated by reference to the Company’s Form 8-K filed December 1, 2017.
|
| (14) |
Incorporated by reference to the Company’s Quarterly Report on Form 10-Q filed August 9, 2016.
|
| (15) |
Incorporated by reference to the Company’s Form 8-K filed August 25, 2016.
|
| (16) |
Incorporated by reference to the Company’s Quarterly Report on Form 10-Q filed November 13, 2017.
|
| (17) |
Incorporated by reference to the Company’s Form 8-K filed January 22, 2016.
|
| (18) |
Incorporated by reference to the Company’s Annual Report on Form 10-K filed March 10, 2017.
|
| (19) |
Incorporated by reference to the Company’s Form 8-K filed January 26, 2018.
|
| (20) |
Incorporated by reference to the Company’s Quarterly Report on Form 10-Q filed November 13, 2017.
|
| (21) |
Incorporated by reference to the Company’s Form 8-K filed May 6, 2013.
|
| (22) |
Incorporated by reference to the Company’s Registration Statement on Form S-8 (Registration No. 333-211213) filed May 6, 2016.
|
| (23) |
Incorporated by reference to the Company’s Annual Report on Form 10-K for the year ended December 31, 2007.
|
| (24) |
Incorporated by reference to the Company’s Annual Report on Form 10-K for the year ended December 31, 2012.
|
| (25) |
Incorporated by reference to the Company’s Form 8-K filed May 5, 2011.
|
| (26) |
Incorporated by reference to the Company’s Form 8-K filed February 26, 2018.
|
| * |
Filed herewith.
|
|
**
|
As provided in Rule 406T of Regulation S-T, this information is furnished and not filed for purposes of Sections 11 and 12 of the Securities Act of 1933 and Section 18 of the Securities Exchange Act of 1934
|
SIGNATURES
Pursuant to the requirements of Section 13 or 15(d) of the Securities Exchange Act of 1934, the registrant has duly caused this report to be signed on its behalf by the undersigned, thereunto duly authorized.
Date: March 9, 2018
|
LINCOLN EDUCATIONAL SERVICES CORPORATION
|
|||
|
By:
|
/s/ Brian Meyers
|
||
|
Brian Meyers
|
|||
|
Executive Vice President, Chief Financial Officer and Treasurer
|
|||
|
(Principal Accounting and Financial Officer)
|
|||
KNOW ALL PERSONS BY THESE PRESENTS, that each of the undersigned constitutes and appoints Scott M. Shaw and Brian K. Meyers, and each of them, as attorneys-in-fact and agents, with full power of substitution and re-substitution, for and in the name, place and stead of the undersigned, in any and all capacities, to sign any and all amendments to this Annual Report on Form 10-K, and to file the same, with all exhibits thereto and all other documents in connection therewith, with the Securities and Exchange Commission, granting unto said attorneys-in-fact and agents full power and authority to do and perform each and every act and thing requisite and necessary to be done in and about the premises, as fully to all intents and purposes as the undersigned might or could do in person, hereby ratifying and confirming all that each of said attorney-in-fact or substitute or substitutes, may lawfully do or cause to be done by virtue hereof.
Pursuant to the requirements of the Securities Exchange Act of 1934, this report has been signed below by the following persons on behalf of the registrant and in the capacities and on the dates indicated.
|
Signature
|
|
Title
|
|
Date
|
|
|
|
|
|
|
|
/s/ Scott M. Shaw
|
|
Chief Executive Officer and Director
|
|
March 9, 2018
|
|
Scott M. Shaw
|
|
|
|
|
|
|
|
|
|
|
|
/s/ Brian K. Meyers
|
|
Executive Vice President, Chief Financial Officer and Treasurer
|
|
March 9, 2018
|
|
Brian K. Meyers
|
|
(Principal Accounting and Financial Officer)
|
|
|
|
|
|
|
|
|
|
/s/ Alvin O. Austin
|
|
Director
|
|
March 9, 2018
|
|
Alvin O. Austin
|
|
|
|
|
|
|
|
|
|
|
|
/s/ Peter S. Burgess
|
|
Director
|
|
March 9, 2018
|
|
Peter S. Burgess
|
|
|
|
|
|
|
|
|
|
|
|
/s/ James J. Burke, Jr.
|
|
Director
|
|
March 9, 2018
|
|
James J. Burke, Jr.
|
|
|
|
|
|
|
|
|
|
|
|
/s/ Celia H. Currin
|
|
Director
|
|
March 9, 2018
|
|
Celia H. Currin
|
|
|
|
|
|
|
|
|
|
|
|
/s/ Ronald E. Harbour
|
|
Director
|
|
March 9, 2018
|
|
Ronald E. Harbour
|
|
|
|
|
|
|
|
|
|
|
|
/s/ J. Barry Morrow
|
|
Director
|
|
March 9, 2018
|
|
J. Barry Morrow
|
INDEX TO CONSOLIDATED FINANCIAL STATEMENTS
|
Page Number
|
||
|
Reports of Independent Registered Public Accounting Firm
|
F-2
|
|
|
Consolidated Balance Sheets as of December 31, 2017 and 2016
|
F-4
|
|
|
Consolidated Statements of Operations for the years ended December 31, 2017, 2016 and 2015
|
F-6
|
|
|
Consolidated Statements of Comprehensive (Loss) Income for the years ended December 31, 2017, 2016 and 2015
|
F-7
|
|
|
Consolidated Statements of Changes in Stockholders' Equity for the years ended December 31, 2017, 2016 and 2015
|
F-8
|
|
|
Consolidated Statements of Cash Flows for the years ended December 31, 2017, 2016 and 2015
|
F-9
|
|
|
Notes to Consolidated Financial Statements
|
F-11
|
|
|
Schedule II-Valuation and Qualifying Accounts
|
F-32
|
REPORT OF INDEPENDENT REGISTERED PUBLIC ACCOUNTING FIRM
To the Stockholders and Board of Directors of Lincoln Educational Services Corporation
Opinion on the Financial Statements
We have audited the accompanying consolidated balance sheets of Lincoln Educational Services Corporation and subsidiaries (the “Company”) as of December 31, 2017 and 2016, and the related consolidated statements of operations, comprehensive (loss) income, changes in stockholders’ equity, and cash flows for each of the three years in the period ended December 31, 2017,
and the related notes and the schedule listed in the Index at Item 15 (collectively referred to as the "financial statements")
.
In our opinion, the financial statements present fairly, in all material respects, the financial position of the Company as of December 31, 2017 and 2016, and the results of its operations and its cash flows for each of the three years in the period ended December 31, 2017, in conformity with accounting principles generally accepted in the United States of America.
We have also audited, in accordance with the standards of the Public Company Accounting Oversight Board (United States) (PCAOB), the Company's internal control over financial reporting as of December 31, 2017, based on criteria established in
Internal Control — Integrated Framework (2013)
issued by the Committee of Sponsoring Organizations of the Treadway Commission and our report dated March 9, 2018
,
expressed an unqualified opinion on the Company's internal control over financial reporting.
Basis for Opinion
These financial statements are the responsibility of the Company's management. Our responsibility is to express an opinion on the Company's financial statements based on our audits. We are a public accounting firm registered with the PCAOB and are required to be independent with respect to the Company in accordance with the U.S. federal securities laws and the applicable rules and regulations of the Securities and Exchange Commission and the PCAOB.
We conducted our audits in accordance with the standards of the PCAOB. Those standards require that we plan and perform the audit to obtain reasonable assurance about whether the financial statements are free of material misstatement, whether due to error or fraud. Our audits included performing procedures to assess the risks of material misstatement of the financial statements, whether due to error or fraud, and performing procedures that respond to those risks. Such procedures included examining, on a test basis, evidence regarding the amounts and disclosures in the financial statements. Our audits also included evaluating the accounting principles used and significant estimates made by management, as well as evaluating the overall presentation of the financial statements. We believe that our audits provide a reasonable basis for our opinion.
/s/ DELOITTE & TOUCHE LLP
Parsippany, New Jersey
March 9, 2018
We have served as the Company’s auditors since 1999.
REPORT OF INDEPENDENT REGISTERED PUBLIC ACCOUNTING FIRM
To the Stockholders and Board of Directors of Lincoln Educational Services Corporation
Opinion on Internal Control over Financial Reporting
We have audited the internal control over financial reporting of Lincoln Educational Services Corporation
and subsidiaries
(the “Company”) as of December 31, 2017, based on criteria established in
Internal Control — Integrated Framework (2013)
issued by the Committee of Sponsoring Organizations of the Treadway Commission (COSO). In our opinion, the Company maintained, in all material respects, effective internal control over financial reporting as of December 31, 2017, based on criteria established in
Internal Control — Integrated Framework (2013)
issued by COSO.
We have also audited, in accordance with the standards of the Public Company Accounting Oversight Board (United States) (PCAOB), the consolidated financial statements as of and for the year ended December 31, 2017, of the Company and our report dated March 9, 2018, expressed an unqualified opinion on those financial statements.
Basis for Opinion
The Company’s management is responsible for maintaining effective internal control over financial reporting and for its assessment of the effectiveness of internal control over financial reporting, included in the accompanying Management’s Report on Internal Control Over Financial Reporting. Our responsibility is to express an opinion on the Company’s internal control over financial reporting based on our audit. We are a public accounting firm registered with the PCAOB and are required to be independent with respect to the Company in accordance with the U.S. federal securities laws and the applicable rules and regulations of the Securities and Exchange Commission and the PCAOB.
We conducted our audit in accordance with the standards of the PCAOB. Those standards require that we plan and perform the audit to obtain reasonable assurance about whether effective internal control over financial reporting was maintained in all material respects. Our audit included obtaining an understanding of internal control over financial reporting, assessing the risk that a material weakness exists, testing and evaluating the design and operating effectiveness of internal control based on the assessed risk, and performing such other procedures as we considered necessary in the circumstances. We believe that our audit provides a reasonable basis for our opinion.
Definition and Limitations of Internal Control over Financial Reporting
A company’s internal control over financial reporting is a process designed to provide reasonable assurance regarding the reliability of financial reporting and the preparation of financial statements for external purposes in accordance with generally accepted accounting principles. A company’s internal control over financial reporting includes those policies and procedures that (1) pertain to the maintenance of records that, in reasonable detail, accurately and fairly reflect the transactions and dispositions of the assets of the company; (2) provide reasonable assurance that transactions are recorded as necessary to permit preparation of financial statements in accordance with generally accepted accounting principles, and that receipts and expenditures of the company are being made only in accordance with authorizations of management and directors of the company; and (3) provide reasonable assurance regarding prevention or timely detection of unauthorized acquisition, use, or disposition of the company’s assets that could have a material effect on the financial statements.
Because of its inherent limitations, internal control over financial reporting may not prevent or detect misstatements. Also, projections of any evaluation of effectiveness to future periods are subject to the risk that controls may become inadequate because of changes in conditions, or that the degree of compliance with the policies or procedures may deteriorate.
/s/ DELOITTE & TOUCHE LLP
Parsippany, New Jersey
March 9, 2018
LINCOLN EDUCATIONAL SERVICES CORPORATION AND SUBSIDIARIES
CONSOLIDATED BALANCE SHEETS
(In thousands, except share amounts)
|
December 31,
|
||||||||
|
2017
|
2016
|
|||||||
|
ASSETS
|
||||||||
|
CURRENT ASSETS:
|
||||||||
|
Cash and cash equivalents
|
$
|
14,563
|
$
|
21,064
|
||||
|
Restricted cash
|
7,189
|
6,399
|
||||||
|
Accounts receivable, less allowance of $12,806 and $12,375 at December 31, 2017 and 2016, respectively
|
15,791
|
15,383
|
||||||
|
Inventories
|
1,657
|
1,687
|
||||||
|
Prepaid income taxes and income taxes receivable
|
207
|
262
|
||||||
|
Assets held for sale
|
2,959
|
16,847
|
||||||
|
Prepaid expenses and other current assets
|
2,352
|
2,894
|
||||||
|
Total current assets
|
44,718
|
64,536
|
||||||
|
PROPERTY, EQUIPMENT AND FACILITIES - At cost, net of accumulated depreciation and amortization of $163,946 and $157,152 at December 31, 2017 and 2016, respectively
|
52,866
|
55,445
|
||||||
|
OTHER ASSETS:
|
||||||||
|
Noncurrent restricted cash
|
32,802
|
20,252
|
||||||
|
Noncurrent receivables, less allowance of $978 and $977 at December 31, 2017 and 2016, respectively
|
8,928
|
7,323
|
||||||
|
Deferred income taxes, net
|
424
|
-
|
||||||
|
Goodwill
|
14,536
|
14,536
|
||||||
|
Other assets, net
|
939
|
1,115
|
||||||
|
Total other assets
|
57,629
|
43,226
|
||||||
|
TOTAL
|
$
|
155,213
|
$
|
163,207
|
||||
See notes to consolidated financial statements.
LINCOLN EDUCATIONAL SERVICES CORPORATION AND SUBSIDIARIES
CONSOLIDATED BALANCE SHEETS
(In thousands, except share amounts)
(Continued)
|
December 31,
|
||||||||
|
2017
|
2016
|
|||||||
|
LIABILITIES AND STOCKHOLDERS' EQUITY
|
||||||||
|
CURRENT LIABILITIES:
|
||||||||
|
Current portion of credit agreement and term loan
|
$
|
-
|
$
|
11,713
|
||||
|
Unearned tuition
|
24,647
|
24,778
|
||||||
|
Accounts payable
|
10,508
|
13,748
|
||||||
|
Accrued expenses
|
11,771
|
15,368
|
||||||
|
Other short-term liabilities
|
558
|
653
|
||||||
|
Total current liabilities
|
47,484
|
66,260
|
||||||
|
NONCURRENT LIABILITIES:
|
||||||||
|
Long-term credit agreement and term loan
|
52,593
|
30,244
|
||||||
|
Pension plan liabilities
|
4,437
|
5,368
|
||||||
|
Accrued rent
|
4,338
|
5,666
|
||||||
|
Other long-term liabilities
|
548
|
743
|
||||||
|
Total liabilities
|
109,400
|
108,281
|
||||||
|
COMMITMENTS AND CONTINGENCIES
|
||||||||
|
STOCKHOLDERS' EQUITY:
|
||||||||
|
Preferred stock, no par value - 10,000,000 shares authorized, no shares issued and outstanding at December 31, 2017 and 2016
|
-
|
-
|
||||||
|
Common stock, no par value - authorized 100,000,000 shares at December 31, 2017 and 2016, issued and outstanding 30,624,407 shares at December 31, 2017 and 30,685,017 shares at December 31, 2016
|
141,377
|
141,377
|
||||||
|
Additional paid-in capital
|
29,334
|
28,554
|
||||||
|
Treasury stock at cost - 5,910,541 shares at December 31, 2017 and 2016
|
(82,860
|
)
|
(82,860
|
)
|
||||
|
Accumulated deficit
|
(37,528
|
)
|
(26,044
|
)
|
||||
|
Accumulated other comprehensive loss
|
(4,510
|
)
|
(6,101
|
)
|
||||
|
Total stockholders' equity
|
45,813
|
54,926
|
||||||
|
TOTAL
|
$
|
155,213
|
$
|
163,207
|
||||
See notes to consolidated financial statements.
LINCOLN EDUCATIONAL SERVICES CORPORATION AND SUBSIDIARIES
CONSOLIDATED STATEMENTS OF OPERATIONS
(In thousands, except per share amounts)
|
Year Ended December 31,
|
||||||||||||
|
2017
|
2016
|
2015
|
||||||||||
|
REVENUE
|
$
|
261,853
|
$
|
285,559
|
$
|
306,102
|
||||||
|
COSTS AND EXPENSES:
|
||||||||||||
|
Educational services and facilities
|
129,413
|
144,426
|
151,647
|
|||||||||
|
Selling, general and administrative
|
138,779
|
148,447
|
151,797
|
|||||||||
|
(Gain) loss on sale of assets
|
(1,623
|
)
|
233
|
1,738
|
||||||||
|
Impairment of goodwill and long-lived assets
|
-
|
21,367
|
216
|
|||||||||
|
Total costs and expenses
|
266,569
|
314,473
|
305,398
|
|||||||||
|
OPERATING (LOSS) INCOME
|
(4,716
|
)
|
(28,914
|
)
|
704
|
|||||||
|
OTHER:
|
||||||||||||
|
Interest income
|
56
|
155
|
52
|
|||||||||
|
Interest expense
|
(7,098
|
)
|
(6,131
|
)
|
(8,015
|
)
|
||||||
|
Other income
|
-
|
6,786
|
4,151
|
|||||||||
|
LOSS BEFORE INCOME TAXES
|
(11,758
|
)
|
(28,104
|
)
|
(3,108
|
)
|
||||||
|
(BENEFIT) PROVISION FOR INCOME TAXES
|
(274
|
)
|
200
|
242
|
||||||||
|
NET LOSS
|
$
|
(11,484
|
)
|
$
|
(28,304
|
)
|
$
|
(3,350
|
)
|
|||
|
Basic
|
||||||||||||
|
Net loss per share
|
$
|
(0.48
|
)
|
$
|
(1.21
|
)
|
$
|
(0.14
|
)
|
|||
|
Diluted
|
||||||||||||
|
Net loss per share
|
$
|
(0.48
|
)
|
$
|
(1.21
|
)
|
$
|
(0.14
|
)
|
|||
|
Weighted average number of common shares outstanding:
|
||||||||||||
|
Basic
|
23,906
|
23,453
|
23,167
|
|||||||||
|
Diluted
|
23,906
|
23,453
|
23,167
|
|||||||||
See notes to consolidated financial statements
LINCOLN EDUCATIONAL SERVICES CORPORATION AND SUBSIDIARIES
CONSOLIDATED STATEMENTS OF COMPREHENSIVE (LOSS) INCOME
(In thousands)
|
December 31,
|
||||||||||||
|
2017
|
2016
|
2015
|
||||||||||
|
Net loss
|
$
|
(11,484
|
)
|
$
|
(28,304
|
)
|
$
|
(3,350
|
)
|
|||
|
Other comprehensive income
|
||||||||||||
|
Employee pension plan adjustments
|
1,591
|
971
|
395
|
|||||||||
|
Comprehensive loss
|
$
|
(9,893
|
)
|
$
|
(27,333
|
)
|
$
|
(2,955
|
)
|
|||
See notes to consolidated financial statements
LINCOLN EDUCATIONAL SERVICES CORPORATION AND SUBSIDIARIES
CONSOLIDATED STATEMENTS OF CHANGES IN STOCKHOLDERS’ EQUITY
(In thousands, except share amounts)
|
Additional
|
Retained
Earnings
|
Accumulated
Other
|
||||||||||||||||||||||||||
|
Common Stock
|
Paid-in
|
Treasury
|
(Accumulated
|
Comprehensive
|
||||||||||||||||||||||||
|
Shares
|
Amount
|
Capital
|
Stock
|
Deficit)
|
Loss
|
Total
|
||||||||||||||||||||||
|
BALANCE - January 1, 2015
|
29,933,086
|
$
|
141,377
|
$
|
26,350
|
$
|
(82,860
|
)
|
$
|
5,610
|
$
|
(7,467
|
)
|
$
|
83,010
|
|||||||||||||
|
Net loss
|
-
|
-
|
-
|
-
|
(3,350
|
)
|
-
|
(3,350
|
)
|
|||||||||||||||||||
|
Employee pension plan adjustments
|
-
|
-
|
-
|
-
|
-
|
395
|
395
|
|||||||||||||||||||||
|
Stock-based compensation expense
|
||||||||||||||||||||||||||||
|
Restricted stock
|
(119,791
|
)
|
-
|
1,095
|
-
|
-
|
-
|
1,095
|
||||||||||||||||||||
|
Stock options
|
-
|
-
|
33
|
-
|
-
|
-
|
33
|
|||||||||||||||||||||
|
Net share settlement for equity-based compensation
|
(85,740
|
)
|
-
|
(186
|
)
|
-
|
-
|
-
|
(186
|
)
|
||||||||||||||||||
|
BALANCE - December 31, 2015
|
29,727,555
|
141,377
|
27,292
|
(82,860
|
)
|
2,260
|
(7,072
|
)
|
80,997
|
|||||||||||||||||||
|
Net loss
|
-
|
-
|
-
|
-
|
(28,304
|
)
|
-
|
(28,304
|
)
|
|||||||||||||||||||
|
Employee pension plan adjustments
|
-
|
-
|
-
|
-
|
-
|
971
|
971
|
|||||||||||||||||||||
|
Stock-based compensation expense
|
||||||||||||||||||||||||||||
|
Restricted stock
|
1,029,267
|
-
|
1,440
|
-
|
-
|
-
|
1,440
|
|||||||||||||||||||||
|
Net share settlement for equity-based compensation
|
(71,805
|
)
|
-
|
(178
|
)
|
-
|
-
|
-
|
(178
|
)
|
||||||||||||||||||
|
BALANCE - December 31, 2016
|
30,685,017
|
141,377
|
28,554
|
(82,860
|
)
|
(26,044
|
)
|
(6,101
|
)
|
54,926
|
||||||||||||||||||
|
Net loss
|
-
|
-
|
-
|
-
|
(11,484
|
)
|
-
|
(11,484
|
)
|
|||||||||||||||||||
|
Employee pension plan adjustments
|
-
|
-
|
-
|
-
|
-
|
1,591
|
1,591
|
|||||||||||||||||||||
|
Stock-based compensation expense
|
||||||||||||||||||||||||||||
|
Restricted stock
|
128,810
|
-
|
1,220
|
-
|
-
|
-
|
1,220
|
|||||||||||||||||||||
|
Net share settlement for equity-based compensation
|
(189,420
|
)
|
-
|
(440
|
)
|
-
|
-
|
-
|
(440
|
)
|
||||||||||||||||||
|
BALANCE - December 31, 2017
|
30,624,407
|
$
|
141,377
|
$
|
29,334
|
$
|
(82,860
|
)
|
$
|
(37,528
|
)
|
$
|
(4,510
|
)
|
$
|
45,813
|
||||||||||||
See notes to consolidated financial statements.
LINCOLN EDUCATIONAL SERVICES CORPORATION AND SUBSIDIARIES
CONSOLIDATED STATEMENTS OF CASH FLOWS
(In thousands)
|
Year Ended December 31,
|
||||||||||||
|
2017
|
2016
|
2015
|
||||||||||
|
CASH FLOWS FROM OPERATING ACTIVITIES:
|
||||||||||||
|
Net loss
|
$
|
(11,484
|
)
|
$
|
(28,304
|
)
|
$
|
(3,350
|
)
|
|||
|
Adjustments to reconcile net loss to net cash (used in) provided by operating activities:
|
||||||||||||
|
Depreciation and amortization
|
8,702
|
11,066
|
14,506
|
|||||||||
|
Amortization of deferred finance costs
|
583
|
949
|
554
|
|||||||||
|
Write-off of deferred finance charges
|
2,161
|
-
|
-
|
|||||||||
|
Deferred income taxes
|
(424
|
)
|
-
|
-
|
||||||||
|
(Gain) loss on disposition of assets
|
(1,622
|
)
|
223
|
1,738
|
||||||||
|
Gain on capital lease termination, net
|
-
|
(6,710
|
)
|
(3,062
|
)
|
|||||||
|
Impairment of goodwill and long-lived assets
|
-
|
21,367
|
216
|
|||||||||
|
Fixed asset donation
|
(19
|
)
|
(123
|
)
|
(20
|
)
|
||||||
|
Provision for doubtful accounts
|
13,720
|
14,592
|
13,583
|
|||||||||
|
Stock-based compensation expense
|
1,220
|
1,440
|
1,128
|
|||||||||
|
Deferred rent
|
(1,312
|
)
|
(489
|
)
|
(638
|
)
|
||||||
|
(Increase) decrease in assets:
|
||||||||||||
|
Accounts receivable
|
(15,733
|
)
|
(15,700
|
)
|
(13,216
|
)
|
||||||
|
Inventories
|
30
|
201
|
9
|
|||||||||
|
Prepaid income taxes and income taxes receivable
|
55
|
87
|
530
|
|||||||||
|
Prepaid expenses and current assets
|
532
|
412
|
444
|
|||||||||
|
Other assets
|
(1,163
|
)
|
(1,701
|
)
|
(1,460
|
)
|
||||||
|
Increase (decrease) in liabilities:
|
||||||||||||
|
Accounts payable
|
(3,193
|
)
|
742
|
1,004
|
||||||||
|
Accrued expenses
|
(3,613
|
)
|
1,195
|
(450
|
)
|
|||||||
|
Unearned tuition
|
(131
|
)
|
(6,854
|
)
|
2,627
|
|||||||
|
Other liabilities
|
370
|
1,500
|
194
|
|||||||||
|
Total adjustments
|
163
|
22,197
|
17,687
|
|||||||||
|
Net cash (used in) provided by operating activities
|
(11,321
|
)
|
(6,107
|
)
|
14,337
|
|||||||
|
CASH FLOWS FROM INVESTING ACTIVITIES:
|
||||||||||||
|
Capital expenditures
|
(4,755
|
)
|
(3,596
|
)
|
(2,218
|
)
|
||||||
|
Restricted cash
|
(790
|
)
|
963
|
-
|
||||||||
|
Proceeds from sale of property and equipment
|
15,462
|
451
|
451
|
|||||||||
|
Net cash provided by (used in) investing activities
|
9,917
|
(2,182
|
)
|
(1,767
|
)
|
|||||||
|
CASH FLOWS FROM FINANCING ACTIVITIES:
|
||||||||||||
|
Proceeds from borrowings
|
75,900
|
-
|
53,500
|
|||||||||
|
Payments on borrowings
|
(66,766
|
)
|
(387
|
)
|
(38,847
|
)
|
||||||
|
Reclassifications of payments from borrowings from restricted cash
|
20,252
|
-
|
30,000
|
|||||||||
|
Reclassifications of proceeds from borrowings to restricted cash
|
(32,802
|
)
|
(4,993
|
)
|
(22,621
|
)
|
||||||
|
Proceeds of borrowings to restricted cash
|
(5,000
|
)
|
-
|
-
|
||||||||
|
Payment of borrowings from restricted cash
|
5,000
|
-
|
-
|
|||||||||
|
Payment of deferred finance fees
|
(1,241
|
)
|
(645
|
)
|
(2,823
|
)
|
||||||
|
Net share settlement for equity-based compensation
|
(440
|
)
|
(178
|
)
|
(186
|
)
|
||||||
|
Payments under capital lease obligations
|
-
|
(2,864
|
)
|
(5,472
|
)
|
|||||||
|
Net cash (used in) provided by financing activities
|
(5,097
|
)
|
(9,067
|
)
|
13,551
|
|||||||
|
NET (DECREASE) INCREASE IN CASH AND CASH EQUIVALENTS
|
(6,501
|
)
|
(17,356
|
)
|
26,121
|
|||||||
|
CASH AND CASH EQUIVALENTS—Beginning of year
|
21,064
|
38,420
|
12,299
|
|||||||||
|
CASH AND CASH EQUIVALENTS—End of year
|
$
|
14,563
|
$
|
21,064
|
$
|
38,420
|
||||||
See notes to consolidated financial statements.
LINCOLN EDUCATIONAL SERVICES CORPORATION AND SUBSIDIARIES
CONSOLIDATED STATEMENTS OF CASH FLOWS
(In thousands)
(Continued)
|
Year Ended December 31,
|
||||||||||||
|
2017
|
2016
|
2015
|
||||||||||
|
SUPPLEMENTAL DISCLOSURES OF CASH FLOW INFORMATION:
|
||||||||||||
|
Cash paid during the year for:
|
||||||||||||
|
Interest
|
$
|
2,790
|
$
|
5,265
|
$
|
7,159
|
||||||
|
Income taxes
|
$
|
139
|
$
|
150
|
$
|
89
|
||||||
|
SUPPLEMENTAL SCHEDULE OF NONCASH INVESTING AND FINANCING ACTIVITIES:
|
||||||||||||
|
Liabilities accrued for or noncash purchases of fixed assets
|
$
|
1,447
|
$
|
2,048
|
$
|
979
|
||||||
See notes to consolidated financial statements.
LINCOLN EDUCATIONAL SERVICES CORPORATION AND SUBSIDIARIES
NOTES TO CONSOLIDATED FINANCIAL STATEMENTS
AS OF DECEMBER 31, 2017 AND 2016 AND FOR THE THREE YEARS ENDED DECEMBER 31, 2017
(In thousands, except share and per share amounts, schools, training sites, campuses and unless otherwise stated)
| 1. |
SUMMARY OF SIGNIFICANT ACCOUNTING POLICIES
|
Business Activities
— Lincoln Educational Services Corporation and its subsidiaries (collectively, the “Company”, “we”, “our” and “us”, as applicable) provide diversified career-oriented post-secondary education to recent high school graduates and working adults. The Company, which currently operates 23 schools in 14 states,
offers programs in automotive technology, skilled trades (which include HVAC, welding and computerized numerical control and electronic systems technology, among other programs), healthcare services (which include nursing, dental assistant, medical administrative assistant and pharmacy technician, among other programs), hospitality services (which include culinary, therapeutic massage, cosmetology and aesthetics) and business and information technology (which includes information technology and criminal justice programs). The schools operate under Lincoln Technical Institute, Lincoln College of Technology, Lincoln College of New England, Lincoln Culinary Institute, and Euphoria Institute of Beauty Arts and Sciences and associated brand names. Most of the campuses serve major metropolitan markets and each typically offers courses in multiple areas of study. Five of the campuses are destination schools, which attract students from across the United States and, in some cases, from abroad. The Company’s other campuses primarily attract students from their local communities and surrounding areas. All of the campuses are nationally or regionally accredited and are eligible to participate in federal financial aid programs by the U.S. Department of Education (the “DOE”) and applicable state education agencies and accrediting commissions which allow students to apply for and access federal student loans as well as other forms of financial aid.
The Company’s business is organized into three reportable business segments: (a) Transportation and Skilled Trades, (b) Healthcare and Other Professions (“HOPS”), and (c) Transitional, which refers to businesses that have been or are currently being taught out. In November 2015, the Board of Directors of the Company approved a plan for the Company to divest the 18 campuses then comprising the HOPS segment due to a strategic shift in the Company’s business strategy. The Company underwent an exhaustive process to divest the HOPS schools which proved successful in attracting various purchasers but, ultimately, did not result in a transaction that our Board believed would enhance shareholder value. By the end of 2017, we had strategically closed seven underperforming campuses leaving a total of 11 campuses remaining under the HOPS segment. The Company believes that the closures of the aforementioned campuses has positioned the HOPS segment and the Company to be more profitable going forward as well as maximizing returns for the Company’s shareholders.
The combination of several factors, including the inability of a prospective buyer of the HOPS segment to close on the purchase, the improvements the Company has implemented in the HOPS segment operations, the closure of seven underperforming campuses and the change in the United States government administration, resulted in the Board reevaluating its divestiture plan and the determination that shareholder value would more likely be enhanced by continuing to operate our HOPS segment as revitalized. Consequently, the Board of Directors has abandoned the plan to divest the HOPS segment and the Company now intends to retain and continue to operate the remaining campuses in the HOPS segment. The results of operations of the campuses included in the HOPS segment are reflected as continuing operations in the consolidated financial statements.
In 2016, the Company completed the teach-out of its Hartford, Connecticut, Fern Park, Florida and Henderson (Green Valley), Nevada campuses, which originally operated in the HOPS segment. In 2017, the Company completed the teach-out of its Northeast Philadelphia, Pennsylvania; Center City Philadelphia, Pennsylvania; West Palm Beach, Florida; Brockton, Massachusetts; and Lowell, Massachusetts schools, which also were originally in our HOPS segment and all of which were
taught out and closed by December 2017 and are included in the Transitional segment as of December 31, 2017.
On August 14, 2017, New England Institute of Technology at Palm Beach, Inc., a wholly-owned subsidiary of the Company, consummated the sale of the real property located at 2400 and 2410 Metrocentre Boulevard East, West Palm Beach, Florida, including the improvements and other personal property located thereon (the “West Palm Beach Property”) to Tambone Companies, LLC (“Tambone”), pursuant to a previously disclosed purchase and sale agreement (the “West Palm Sale Agreement”) entered into on March 14, 2017. Pursuant to the terms of the West Palm Sale Agreement, as subsequently amended, the purchase price for the West Palm Beach Property was $15.8 million. As a result, the Company recorded a gain on the sale in the amount of $1.5 million. As previously disclosed, the West Palm Beach Property served as collateral for a short term loan in the principal amount of $8.0 million obtained by the Company from its lender, Sterling National Bank, on April 28, 2017, which loan matured upon the earlier of the sale of the West Palm Beach Property or October 1, 2017. Accordingly, on August 14, 2017, concurrently with the consummation of the sale of the West Palm Beach Property, the Company repaid the term loan in an aggregate amount of $8.0 million, consisting of principal and accrued interest.
Liquidity
—
For the last several years, the Company and the proprietary school sector have faced deteriorating earnings. Government regulations have negatively impacted earnings by making it more difficult for potential students to obtain loans, which, when coupled with the overall economic environment, have discouraged potential students from enrolling in post-secondary schools. In light of these factors, the Company has incurred significant operating losses as a result of lower student population. Despite these challenges, the Company believes that its likely sources of cash should be sufficient to fund operations for the next twelve months and thereafter for the foreseeable future. At December 31, 2017, the Company’s sources of cash primarily included cash and cash equivalents of $54.5 million (of which $40.0 million is restricted) and $4.4 million of availability under the Company’s revolving loan facility. Refer to Note 7 for more information on the Company’s revolving loan facility. The Company is also continuing to take actions to improve cash flow by aligning its cost structure to its student population.
In addition to the current sources of capital discussed above that provide short term liquidity, the Company has been making efforts to sell its Mangonia Park, Palm Beach County, Florida property and associated assets originally operated in the HOPS segment, which has been classified as held for sale.
Principles of Consolidation
—The accompanying consolidated financial statements include the accounts of Lincoln Educational Services Corporation and its wholly-owned subsidiaries. All intercompany accounts and transactions have been eliminated.
Revenue Recognition
—Revenues are derived primarily from programs taught at our schools. Tuition revenues, textbook sales and one-time fees, such as nonrefundable application fees and course material fees, are recognized on a straight-line basis over the length of the applicable program as the student proceeds through the program, which is the period of time from a student’s start date through his or her graduation date, including internships or externships that take place prior to graduation, and we complete the performance of teaching the student which entitles us to the revenue. Other revenues, such as tool sales and contract training revenues are recognized as services are performed or goods are delivered. On an individual student basis, tuition earned in excess of cash received is recorded as accounts receivable, and cash received in excess of tuition earned is recorded as unearned tuition.
We evaluate whether collectability of revenue is reasonably assured prior to the student attending class and reassess collectability of tuition and fees when a student withdraws from a course. We calculate the amount to be returned under Title IV and its stated refund policy to determine eligible charges and, if there is a balance due from the student after this calculation, we expect payment from the student. We have a process to pursue uncollected accounts whereby, based upon the student’s financial means and ability to pay, a payment plan is established with the student to ensure that collectability is reasonable. We continuously monitor our historical collections to identify potential trends that may impact our determination that collectability of receivables for withdrawn students is realizable. If a student withdraws from a program prior to a specified date, any paid but unearned tuition is refunded. Refunds are calculated and paid in accordance with federal, state and accrediting agency standards. Generally, the amount to be refunded to a student is calculated based upon the period of time the student has attended classes and the amount of tuition and fees paid by the student as of his or her withdrawal date. These refunds typically reduce deferred tuition revenue and cash on our consolidated balance sheets as we generally do not recognize tuition revenue in our consolidated statements of income (loss) until the related refund provisions have lapsed. Based on the application of our refund policies, we may be entitled to incremental revenue on the day the student withdraws from one of our schools. We record revenue for students who withdraw from one of our schools when payment is received because collectability on an individual student basis is not reasonably assured.
Cash and Cash Equivalents
—Cash and cash equivalents include all cash balances and highly liquid short-term investments, which contain original maturities within three months of purchase. Pursuant to the Department of Education’s cash management requirements, the Company retains funds from financial aid programs under Title IV of the Higher Education Act in segregated cash management accounts. The segregated accounts do not require a restriction on use of the cash and, as such, these amounts are classified as cash and cash equivalents on the consolidated balance sheet.
Restricted Cash
—Restricted cash consists of deposits maintained at financial institutions under a cash collateral agreement pursuant to the Company’s credit agreement and cash collateral for letters of credit. The amount of $32.8 million and $20.3 million for the years ended December 31, 2017 and 2016, respectively, of restricted cash is included in long-term assets on the consolidated balance sheet as the restriction is greater than one year. Refer to Note 7 for more information on the Company’s revolving credit facility.
Accounts Receivable
—The Company reports accounts receivable at net realizable value, which is equal to the gross receivable less an estimated allowance for uncollectible accounts. Noncurrent accounts receivable represent amounts due from graduates in excess of 12 months from the balance sheet date.
Allowance for uncollectible accounts
—Based upon experience and judgment, an allowance is established for uncollectible accounts with respect to tuition receivables. In establishing the allowance for uncollectible accounts, the Company considers, among other things, current and expected economic conditions, a student's status (in-school or out-of-school), whether or not a student is currently making payments, and overall collection history. Changes in trends in any of these areas may impact the allowance for uncollectible accounts. The receivables balances of withdrawn students with delinquent obligations are reserved for based on our collection history.
Inventories
—Inventories consist mainly of textbooks, computers, tools and supplies. Inventories are valued at the lower of cost or market on a first-in, first-out basis.
Property, Equipment and Facilities
—
Depreciation and Amortization
—Property, equipment and facilities are stated at cost. Major renewals and improvements are capitalized, while repairs and maintenance are expensed when incurred. Upon the retirement, sale or other disposition of assets, costs and related accumulated depreciation are eliminated from the accounts and any gain or loss is reflected in operating (loss) income. For financial statement purposes, depreciation of property and equipment is computed using the straight-line method over the estimated useful lives of the assets, and amortization of leasehold improvements is computed over the lesser of the term of the lease or its estimated useful life.
Rent Expense
—Rent expense related to operating leases where scheduled rent increases exist, is determined by expensing the total amount of rent due over the life of the operating lease on a straight-line basis. The difference between the rent paid under the terms of the lease and the rent expensed on a straight-line basis is included in accrued rent and other long-term liabilities on the accompanying consolidated balance sheets.
Advertising Costs
—Costs related to advertising are expensed as incurred and approximated $27.0 million, $28.0 million and $28.2 million for the years ended December 31, 2017, 2016 and 2015, respectively. These amounts are included in selling, general and administrative expenses in the consolidated statements of operations.
Goodwill and Other Intangible Assets
— The Company tests its goodwill for impairment annually, or whenever events or changes in circumstances indicate an impairment may have occurred, by comparing its reporting unit’s carrying value to its implied fair value. Impairment may result from, among other things, deterioration in the performance of the acquired business, adverse market conditions, adverse changes in applicable laws or regulations, reductions in market value of the Company, including changes that restrict the activities of the acquired business, and a variety of other circumstances. If the Company determines that an impairment has occurred, it is required to record a write-down of the carrying value and charge the impairment as an operating expense in the period the determination is made. In evaluating the recoverability of the carrying value of goodwill and other indefinite-lived intangible assets, the Company must make assumptions regarding estimated future cash flows and other factors to determine the fair value of the acquired assets. Changes in strategy or market conditions could significantly impact these judgments in the future and require an adjustment to the recorded balances.
When we test goodwill balances for impairment, we estimate the fair value of each of our reporting units based on projected future operating results and cash flows, market assumptions and/or comparative market multiple methods. Determining fair value requires significant estimates and assumptions based on an evaluation of a number of factors, such as marketplace participants, relative market share, new student interest, student retention, future expansion or contraction expectations, amount and timing of future cash flows and the discount rate applied to the cash flows. Projected future operating results and cash flows used for valuation purposes do reflect improvements relative to recent historical periods with respect to, among other things, modest revenue growth and operating margins. Although we believe our projected future operating results and cash flows and related estimates regarding fair values are based on reasonable assumptions, historically projected operating results and cash flows have not always been achieved. The failure of one of our reporting units to achieve projected operating results and cash flows in the near term or long term may reduce the estimated fair value of the reporting unit below its carrying value and result in the recognition of a goodwill impairment charge. Significant management judgment is necessary to evaluate the impact of operating and macroeconomic changes and to estimate future cash flows. Assumptions used in our impairment evaluations, such as forecasted growth rates and our cost of capital, are based on the best available market information and are consistent with our internal forecasts and operating plans. In addition to cash flow estimates, our valuations are sensitive to the rate used to discount cash flows and future growth assumptions.
At December 31, 2017 and December 31, 2015, we conducted our annual test for goodwill impairment and determined we did not have an impairment. At December 31, 2016, we conducted our annual test for goodwill impairment and determined we had an impairment of $9.9 million. We concluded that as of September 30, 2015 there was an indicator of potential impairment as a result of a decrease in market capitalization and, accordingly, we tested goodwill for impairment. The test indicated that one of our reporting units was impaired, which resulted in a pre-tax non-cash charge of $0.2 million for the three months ended September 30, 2015.
Impairment of Long-Lived Assets
—
The Company reviews the carrying value of its long-lived assets and identifiable intangibles for possible impairment whenever events or changes in circumstances indicate that the carrying amounts may not be recoverable. The Company evaluates long-lived assets for impairment by examining estimated future cash flows using Level 3 inputs. These cash flows are evaluated by using weighted probability techniques as well as comparisons of past performance against projections. Assets may also be evaluated by identifying independent market values. If the Company determines that an asset’s carrying value is impaired, it will record a write-down of the carrying value of the asset and charge the impairment as an operating expense in the period in which the determination is made.
The Company concluded that for the year ended December 31, 2017 and December 31, 2015, there was no long-lived asset impairment.
The Company concluded that, for the year ended December 31, 2016, there was sufficient evidence to conclude that there was an impairment of certain long-lived assets which resulted in a pre-tax charge of $11.5 million.
Concentration of Credit Risk
—Financial instruments that potentially subject the Company to concentrations of credit risk consist principally of temporary cash investments. The Company places its cash and cash equivalents with high credit quality financial institutions. The Company's cash balances with financial institutions typically exceed the Federal Deposit Insurance limit of $0.25 million. The Company's cash balances on deposit at December 31, 2017, exceeded the balance insured by the FDIC Corporation (“FDIC”) by approximately $53.9 million. The Company has not experienced any losses to date on its invested cash.
The Company extends credit for tuition and fees to many of its students. The credit risk with respect to these accounts receivable is mitigated through the students' participation in federally funded financial aid programs unless students withdraw prior to the receipt of federal funds for those students. In addition, the remaining tuition receivables are primarily comprised of smaller individual amounts due from students.
With respect to student receivables, the Company had no significant concentrations of credit risk as of December 31, 2017 and 2016.
Use of Estimates in the Preparation of Financial Statements
—The preparation of financial statements in conformity with generally accepted accounting principles in the United States (“GAAP’) requires management to make estimates and assumptions that affect the reported amounts of assets and liabilities and disclosure of contingent assets and liabilities at the date of the consolidated financial statements and the reported amounts of revenues and expenses during the period. On an ongoing basis, the Company evaluates the estimates and assumptions, including those related to revenue recognition, bad debts, impairments, fixed assets, income taxes, benefit plans and certain accruals. Actual results could differ from those estimates.
Stock-Based Compensation Plans
—The Company measures the value of stock options on the grant date at fair value, using the Black-Scholes option valuation model. The Company amortizes the fair value of stock options, net of estimated forfeitures, utilizing straight-line amortization of compensation expense over the requisite service period of the grant.
The Company measures the value of service and performance-based restricted stock on the fair value of a share of common stock on the date of the grant. The Company amortizes the fair value of service-based restricted stock utilizing straight-line amortization of compensation expense over the requisite service period of the grant.
The Company amortizes the fair value of the performance-based restricted stock based on determination of the probable outcome of the performance condition. If the performance condition is expected to be met, then the Company amortizes the fair value of the number of shares expected to vest utilizing straight-line basis over the requisite performance period of the grant. However, if the associated performance condition is not expected to be met, then the Company does not recognize the stock-based compensation expense.
Income Taxes
—
The Company
accounts for income taxes in accordance with ASC Topic 740, “
Income Taxes
” (“ASC 740”). This statement requires an asset and a liability approach for measuring deferred taxes based on temporary differences between the financial statement and tax bases of assets and liabilities existing at each balance sheet date using enacted tax rates for years in which taxes are expected to be paid or recovered.
In accordance with ASC 740, the Company assesses our deferred tax asset to determine whether all or any portion of the asset is more likely than not unrealizable. A valuation allowance is required to be established or maintained when, based on currently available information, it is more likely than not that all or a portion of a deferred tax asset will not be realized. In accordance with ASC 740, our assessment considers whether there has been sufficient income in recent years and whether sufficient income is expected in future years in order to utilize the deferred tax asset. In evaluating the realizability of deferred income tax assets, the Company considered, among other things, historical levels of income, expected future income, the expected timing of the reversals of existing temporary reporting differences, and the expected impact of tax planning strategies that may be implemented to prevent the potential loss of future income tax benefits. Significant judgment is required in determining the future tax consequences of events that have been recognized in our consolidated financial statements and/or tax returns. Differences between anticipated and actual outcomes of these future tax consequences could have a material impact on the Company’s consolidated financial position or results of operations. Changes in, among other things, income tax legislation, statutory income tax rates, or future income levels could materially impact the Company’s valuation of income tax assets and liabilities and could cause our income tax provision to vary significantly among financial reporting periods. See information regarding the impact of the Tax Cuts and Jobs Act in Note 10.
The Company recognizes accrued interest and penalties related to unrecognized tax benefits in income tax expense. During the years ended December 31, 2017 and 2016, we did not record any interest and penalties expense associated with uncertain tax positions.
Start-up Costs
—
Costs related to the start of new campuses are expensed as incurred.
Reclassification
—
During the year ended December 31, 2017, the Company reclassified certain amounts previously included in held for sale to held for use in the 2016 Consolidated Balance Sheet. In addition, during the year ended December 31, 2017, the Company reclassified 2016 and 2015 amounts from discontinued operations to continuing operations in Consolidated Statements of Operations.
New Accounting Pronouncements
The Financial Accounting Standards Board (the “FASB”) has issued Accounting Standards Update (“ASU”) 2017-09, “Compensation—Stock Compensation (Topic 718) — Scope of Modification Accounting.” ASU 2017-09 applies to entities that change the terms or conditions of a share-based payment award. The FASB adopted ASU 2017-09 to provide clarity and reduce diversity in practice as well as cost and complexity when applying the guidance in Topic 718, Compensation—Stock Compensation, to the modification of the terms and conditions of a share-based payment award. The amendments provide guidance on determining which changes to the terms and conditions of share-based payment award require an entity to apply modification accounting under Topic 718. ASU 2017-09 is effective for all entities for annual periods, including interim periods within those annual periods, beginning after December 15, 2017. Early adoption is permitted, including adoption in any interim period, for public business entities for reporting periods for which financial statements have not yet been issued. The adoption of ASU 2017-09 had no impact on the Company’s consolidated financial statements.
In March 2017, the FASB issued ASU 2017-07, "Compensation—Retirement Benefits (Topic 715): Improving the Presentation of Net Periodic Pension Cost and Net Periodic Postretirement Benefit Cost." ASU 2017-07 requires that an employer report the service cost component in the same line item or items as other compensation costs arising from services rendered by the pertinent employees during the period. The other components of net benefit cost are required to be presented in the statement of comprehensive income separately from the service cost component and outside a subtotal of operating income. The ASU is effective for annual periods beginning after December 15, 2017. Early adoption is permitted. The adoption of ASU 2017-07 had no impact on the Company’s consolidated financial statements.
In January 2017, the FASB issued ASU 2017-04, “Simplifying the Test for Goodwill Impairment.” ASU 2017-04 provides amendments to Accounting Standards Code (“ASC”) 350, “Intangibles - Goodwill and Other,” which eliminate Step 2 from the goodwill impairment test. Entities should perform their goodwill impairment tests by comparing the fair value of a reporting unit with its carrying amount and recognize an impairment charge for the amount by which the carrying amount exceeds the reporting unit's fair value. The amendments in this update are effective prospectively during interim and annual periods beginning after December 15, 2019, with early adoption permitted. The Company adopted the provisions of ASU 2017-04 as of April 1, 2017. As fair values for our operating units exceed their carrying values, there has been no impact on our consolidated financial statements.
In November 2016, the FASB issued ASU 2016-18: “Statement of Cash Flows (Topic 230): Restricted Cash.” This guidance was issued to address the disparity that exists in the classification and presentation of changes in restricted cash on the statement of cash flows. The amendments will require that the statement of cash flows explain the change during the period in total cash, cash equivalents and restricted cash. The amendments are effective for financial statements issued for fiscal years beginning after December 15, 2017, and interim periods within those fiscal years. The amendments will be applied using a retrospective transition method to each period presented. The Company anticipates that the adoption will not have a material impact on the Company’s consolidated financial statements.
In August 2016, the FASB issued ASU 2016-15, “Statement of Cash Flows (Topic 230): Classification of Certain Cash Receipts and Cash Payments” to address eight specific cash flow issues with the objective of reducing the existing diversity in practice. The amendments are effective for financial statements issued for fiscal years beginning after December 15, 2017, and interim periods within those fiscal years. The Company anticipates that the adoption will not have a material impact on the Company’s consolidated financial statements.
The Company prospectively adopted ASU 2016-09, “Improvements to Employee Share Based Payment Accounting,” to the consolidated statement of operations for the recognition of tax benefits within the provision for taxes, which previously would have been recorded to additional paid-in capital. The impact for the year ended December 31, 2017 was $0. In addition, the Company retrospectively recognized no tax benefits within operating activities within the consolidated statements of cash flow for the year ended December 31, 2017 and 2016. The presentation requirements for cash flows related to employee taxes paid for withheld shares had no impact to any of the periods presented in the consolidated statements of cash flows, since such cash flows have historically been presented in financing activities. The treatment of forfeitures has not changed as the Company is electing to continue the current process of estimating the number of forfeitures. There was no cumulative effect adjustment required to retained earnings under the prospective method as of the beginning of the year because all tax benefits had been previously recognized when the tax deductions related to stock compensation were utilized to reduce tax payable. The Company is not recording deferred tax assets or tax losses as a result of the adoption of ASU 2016-09.
In May 2014, the FASB issued a comprehensive new revenue recognition standard, ASU 2014-09, “Revenue from Contracts with Customers.” The amendments include ASU 2016-08, “Revenue from Contracts with Customers (Topic 606)—Principal versus Agent Considerations,” issued in March 2016, which clarifies the implementation guidance for principal versus agent considerations in ASU 2014-09, and ASU 2016-10, “Revenue from Contracts with Customers (Topic 606)—Identifying Performance Obligations and Licensing,” issued in April 2016, which amends the guidance in ASU No. 2014-09 related to identifying performance obligations. The new standard will supersede previous existing revenue recognition guidance. The standard creates a five-step model for revenue recognition that requires companies to exercise judgment when considering contract terms and relevant facts and circumstances. The five-step model includes (1) identifying the contract, (2) identifying the separate performance obligations in the contract, (3) determining the transaction price, (4) allocating the transaction price to the separate performance obligations and (5) recognizing revenue when each performance obligation has been satisfied. The standard also requires expanded disclosures surrounding revenue recognition. The standard is effective for fiscal periods beginning after December 15, 2017 and allows for either full retrospective or modified retrospective adoption.
We adopted the new standard effective January 1, 2018 using the modified retrospective approach.
The Company’s revenue streams primarily consist of tuition and related services provided to students over the course of the program as well as other transactional revenue such as tools. Based on the Company's assessment, the analysis of the contract portfolio under Topic 606 results in the revenue for the majority of the Company's student contracts being recognized over time which is consistent with the Company's previous revenue recognition model. For all student contracts, there is continuous transfer of control to the student and the number of performance obligations under Topic 606 is consistent with those identified under the existing standard. The Company determined the impact of the adoption on revenue recognition for student contracts to be immaterial on its consolidated financial statements and disclosures.
In February 2016, the FASB issued guidance requiring lessees to recognize a right-of-use asset and a lease liability on the balance sheet for substantially all leases, with the exception of short-term leases. Leases will be classified as either financing or operating, with classification affecting the pattern of expense recognition in the statements of income. The guidance is effective for annual periods, including interim periods within those periods, beginning after December 15, 2018, with early adoption permitted. We are currently evaluating the impact that the update will have on the Company’s consolidated financial statements.
| 2. |
FINANCIAL AID AND REGULATORY COMPLIANCE
|
Financial Aid
The Company’s schools and students participate in a variety of government-sponsored financial aid programs that assist students in paying the cost of their education. The largest source of such support is the federal programs of student financial assistance under Title IV of the Higher Education Act of 1965, as amended, commonly referred to as the Title IV Programs, which are administered by the U.S. Department of Education (the "DOE"). During the years ended December 31, 2017, 2016 and 2015, approximately 78%, 79% and 80% respectively, of net revenues on a cash basis were indirectly derived from funds distributed under Title IV Programs.
For the years ended December 31, 2017, 2016 and 2015, the Company calculated that no individual DOE reporting entity received more than 90% of its revenue, determined on a cash basis under DOE regulations, from the Title IV Program funds. The Company’s calculations may be subject to review by the DOE. Under DOE regulations, a proprietary institution that derives more than 90% of its total revenue from the Title IV Programs for two consecutive fiscal years becomes immediately ineligible to participate in the Title IV Programs and may not reapply for eligibility until the end of two fiscal years. An institution with revenues exceeding 90% for a single fiscal year, will be placed on provisional certification and may be subject to other enforcement measures. If one of the Company’s institutions violated the 90/10 Rule and became ineligible to participate in Title IV Programs but continued to disburse Title IV Program funds, the DOE would require the institution to repay all Title IV Program funds received by the institution after the effective date of the loss of eligibility.
Regulatory Compliance
To participate in Title IV Programs, a school must be authorized to offer its programs of instruction by relevant state education agencies, be accredited by an accrediting commission recognized by the DOE and be certified as an eligible institution by the DOE. For this reason, the schools are subject to extensive regulatory requirements imposed by all of these entities. After the schools receive the required certifications by the appropriate entities, the schools must demonstrate their compliance with the DOE regulations of the Title IV Programs on an ongoing basis. Included in these regulations is the requirement that the institution must satisfy specific standards of financial responsibility. The DOE evaluates institutions for compliance with these standards each year, based upon the institution’s annual audited financial statements, as well as following a change in ownership resulting in a change of control of the institution. The DOE calculates the institution's composite score for financial responsibility based on its (i) equity ratio, which measures the institution's capital resources, ability to borrow and financial viability; (ii) primary reserve ratio, which measures the institution's ability to support current operations from expendable resources; and (iii) net income ratio, which measures the institution's ability to operate at a profit. This composite score can range from -1 to +3.
The composite score must be at least 1.5 for the institution to be deemed financially responsible without the need for further oversight. If an institution’s composite score is below 1.5, but is at least 1.0, it is in a category denominated by the DOE as “the zone.” Under the DOE regulations, institutions that are in the zone typically may be permitted by the DOE to continue to participate in the Title IV Programs by choosing one of two alternatives: 1) the “Zone Alternative” under which the institution is required to make disbursements to students under the Heightened Cash Monitoring 1 (HCM1) payment method and to notify the DOE within 10 days after the occurrence of certain oversight and financial events or 2) submit a letter of credit to the DOE in an amount determined by the DOE and equal to at least 50 percent of the Title IV Program funds received by the institution during the most recent fiscal year. Under the HCM1 payment method, the institution is required to make Title IV Program disbursements to eligible students and parents before it requests or receives funds for the amount of those disbursements from the DOE. As long as the student accounts are credited before the funding requests are initiated, the institution is permitted to draw down funds through the DOE’s electronic system for grants management and payments for the amount of disbursements made to eligible students. Unlike the Heightened Cash Monitoring 2 (HCM2) and reimbursement payment methods, the HCM1 payment method typically does not require schools to submit documentation to the DOE and wait for DOE approval before drawing down Title IV Program funds. If a Company’s composite score is below 1.5 for three consecutive years an institution may be able to continue to operate under the Zone Alternative; however, this determination is made solely by the DOE. If an institution’s composite score drops below 1.0 in a given year or if its composite score remains between 1.0 and 1.4 for three or more consecutive years, it may be required to meet alternative requirements for continuing to participate in Title IV Programs by submitting a letter of credit, complying with monitoring requirements, disbursing Title IV Program funds under the HCM1, HCM2, or reimbursement payment methods, and complying with other requirements and conditions. Effective July 1, 2016, a school subject to HCM1, HCM2 or reimbursement payment methods must also pay any credit balances due to a student before drawing down funds for the amount of those disbursements from the DOE, even if the student or his or her parent provides written authorization for the school to hold the credit balance. The DOE permits an institution to participate under the “Zone Alternative” for a period of up to three consecutive fiscal years; however, this determination is made solely by the DOE. If an institution’s composite score is between 1.0 and 1.4 after three or more consecutive years with a composite score below 1.5, it may be required to meet alternative requirements for continuing to participate in Title IV Programs by submitting a letter of credit, complying with monitoring requirements, disbursing Title IV Program funds under the HCM1, HCM2, or reimbursement payment methods, and complying with other requirements and conditions.
If an institution's composite score is below 1.0, the institution is considered by the DOE to lack financial responsibility. If the DOE determines that an institution does not satisfy the DOE's financial responsibility standards, depending on its composite score and other factors, that institution may establish its financial responsibility on an alternative basis by, among other things:
| · |
Posting a letter of credit in an amount determined by the DOE equal to at least 50% of the total Title IV Program funds received by the institution during the institution's most recently completed fiscal year;
|
| · |
Posting a letter of credit in an amount determined by the DOE equal to at least 10% of such prior year's Title IV Program funds, accepting provisional certification, complying with additional DOE monitoring requirements and agreeing to receive Title IV Program funds under an arrangement other than the DOE's standard advance funding arrangement.
|
For the 2017 fiscal year, the Company calculated its composite score to be 1.1. T
he score is subject to determination by the DOE once it receives and reviews the Company’s audited financial statements for the 2017 fiscal year.
The DOE has evaluated the financial responsibility of our institutions on a consolidated basis. The Company has submitted to the DOE our audited financial statements for the 2016 and 2015 fiscal year reflecting a composite score of 1.5 and 1.9, respectively, based upon its calculations.
An institution participating in Title IV Programs must calculate the amount of unearned Title IV Program funds that have been disbursed to students who withdraw from their educational programs before completing them, and must return those unearned funds to the DOE or the applicable lending institution in a timely manner, which is generally within 45 days from the date the institution determines that the student has withdrawn.
If an institution is cited in an audit or program review for returning Title IV Program funds late for 5% or more of the students in the audit or program review sample or if the regulatory auditor identifies a material weakness in the institution’s report on internal controls relating to the return of unearned Title IV Program funds, the institution may be required to post a letter of credit in favor of the DOE in an amount equal to 25% of the total amount of Title IV Program funds that should have been timely returned for students who withdrew in the institution's previous fiscal year.
On January 11, 2018, the DOE sent letters to our Columbia, Maryland and Iselin, New Jersey institutions requiring each institution to submit a letter of credit to the DOE based on findings of late returns of Title IV Program funds in the annual Title IV compliance audits submitted to the DOE for the fiscal year ended December 31, 2016. Our Iselin institution provided evidence demonstrating that only 3% of the Title IV Program funds returned were late. However, the DOE concluded that a letter of credit would nevertheless be required for each institution because the regulatory auditor included a finding that there was a material weakness in our report on internal controls relating to return of unearned Title IV Program funds. We disagree with the regulatory auditor’s conclusion that a material weakness could exist if the error rate in the expanded audit sample is only 3% or approximately $20,000 and we believe that the regulatory auditor’s conclusion is erroneous. We requested the DOE to reconsider the letter of credit requirement. However, by letter dated February 7, 2018, DOE maintained that the refund letters of credit were necessary but agreed that the amount of each letter of credit could be based on the returns that were required to be made by each institution in the 2017 fiscal year rather than the 2016 fiscal year. Accordingly, we submitted letters of credit in the amounts of $0.5 million and $0.1 million to the DOE by the February 23, 2018 deadline and expect that these letters of credit will remain in place for a minimum of two years.
| 3. |
WEIGHTED AVERAGE COMMON SHARES
|
The weighted average number of common shares used to compute basic and diluted income per share for the years ended December 31, 2017, 2016 and 2015, respectively were as follows:
|
Year Ended December 31,
|
||||||||||||
|
2017
|
2016
|
2015
|
||||||||||
|
Basic shares outstanding
|
23,906,395
|
23,453,427
|
23,166,977
|
|||||||||
|
Dilutive effect of stock options
|
-
|
-
|
-
|
|||||||||
|
Diluted shares outstanding
|
23,906,395
|
23,453,427
|
23,166,977
|
|||||||||
For the years ended December 31, 2017, 2016 and 2015, options to acquire 570,306; 773,078; and 119,722 shares, respectively, were excluded from the above table because the Company reported a net loss for the year and therefore their impact on reported loss per share would have been antidilutive. For the years ended December 31, 2017, 2016 and 2015, options to acquire 167,667; 218,167; and 391,935 shares; respectively, were excluded from the above table because they have an exercise price that is greater than the average market price of the Company’s common stock and, therefore, their impact on reported loss per share would have been antidilutive.
| 4. |
GOODWILL AND OTHER INTANGIBLES
|
Changes in the carrying amount of goodwill during the years ended December 31, 2017 and 2016 are as follows:
|
Gross
Goodwill
Balance
|
Accumulated
Impairment
Losses
|
Net
Goodwill
Balance
|
||||||||||
|
Balance as of January 1, 2016
|
$
|
117,176
|
$
|
93,881
|
$
|
23,295
|
||||||
|
Impairment
|
-
|
8,759
|
8,759
|
|||||||||
|
Balance as of December 31, 2016
|
117,176
|
102,640
|
14,536
|
|||||||||
|
Adjustments
|
-
|
-
|
-
|
|||||||||
|
Balance as of December 31, 2017
|
$
|
117,176
|
$
|
102,640
|
$
|
14,536
|
||||||
As of December 31, 2017 and 2016 the goodwill balance of $14.5 million is related to the Transportation and Skilled Trades segment.
Intangible assets, which are included in other assets in the accompanying consolidated balance sheets, consisted of the following:
|
Curriculum
|
Total
|
|||||||
|
Gross carrying amount at January 1, 2017
|
$
|
160
|
$
|
160
|
||||
|
Additions
|
-
|
-
|
||||||
|
Gross carrying amount at December 31, 2017
|
160
|
160
|
||||||
|
Accumulated amortization at January 1, 2017
|
128
|
128
|
||||||
|
Amortization
|
16
|
16
|
||||||
|
Accumulated amortization at December 31, 2017
|
144
|
144
|
||||||
|
Net carrying amount at December 31, 2017
|
$
|
16
|
$
|
16
|
||||
|
Weighted average amortization period (years)
|
10
|
|||||||
|
Trade Name
|
Curriculum
|
Total
|
||||||||||
|
Gross carrying amount at January 1, 2016
|
$
|
310
|
$
|
160
|
$
|
470
|
||||||
|
Additions
|
-
|
-
|
-
|
|||||||||
|
Gross carrying amount at December 31, 2016
|
310
|
160
|
470
|
|||||||||
|
Accumulated amortization at January 1, 2016
|
308
|
112
|
420
|
|||||||||
|
Amortization
|
2
|
16
|
18
|
|||||||||
|
Accumulated amortization at December 31, 2016
|
310
|
128
|
438
|
|||||||||
|
Net carrying amount at December 31, 2016
|
$
|
-
|
$
|
32
|
$
|
32
|
||||||
|
Weighted average amortization period (years)
|
7
|
10
|
||||||||||
Amortization of intangible assets for the years ended December 31, 2017, 2016 and 2015 was less than $0.1 million for each of the three years, respectively.
The following table summarizes the estimated future amortization expense:
|
Year Ending December 31,
|
||||
|
2018
|
$
|
16
|
||
| 5. |
PROPERTY, EQUIPMENT AND FACILITIES
|
Property, equipment and facilities consist of the following:
|
Useful life (years)
|
At December 31,
|
|||||||||||
|
2017
|
2016
|
|||||||||||
|
Land
|
-
|
$
|
6,969
|
$
|
6,969
|
|||||||
|
Buildings and improvements
|
1-25
|
127,027
|
124,826
|
|||||||||
|
Equipment, furniture and fixtures
|
1-7
|
81,772
|
79,029
|
|||||||||
|
Vehicles
|
3
|
883
|
848
|
|||||||||
|
Construction in progress
|
-
|
161
|
925
|
|||||||||
|
216,812
|
212,597
|
|||||||||||
|
Less accumulated depreciation and amortization
|
(163,946
|
)
|
(157,152
|
)
|
||||||||
|
$
|
52,866
|
$
|
55,445
|
|||||||||
Depreciation and amortization expense of property, equipment and facilities was $8.7 million, $11.0 million and $10.2 million for the years ended December 31, 2017, 2016 and 2015, respectively.
As discussed in Note 1, the Company sold two real properties in West Palm Beach, Florida in 2017 and the Company has been making efforts to sell its remaining Mangonia Park Palm Beach County, Florida property and associated assets originally operated in the HOPS segment, which has been classified as held for sale.
| 6. |
ACCRUED EXPENSES
|
Accrued expenses consist of the following:
|
At December 31,
|
||||||||
|
2017
|
2016
|
|||||||
|
Accrued compensation and benefits
|
$
|
3,114
|
$
|
7,571
|
||||
|
Accrued rent and real estate taxes
|
|
3,151
|
|
3,365
|
||||
|
Other accrued expenses
|
5,506
|
4,432
|
||||||
|
$
|
11,771
|
$
|
15,368
|
|||||
7.
LONG-TERM DEBT
Long-term debt consist of the following:
|
At December 31,
|
||||||||
|
2017
|
2016
|
|||||||
|
Credit agreement
|
$
|
53,400
|
$
|
-
|
||||
|
Term loan
|
-
|
44,267
|
||||||
|
Deferred financing fees
|
(807
|
)
|
(2,310
|
)
|
||||
|
52,593
|
41,957
|
|||||||
|
Less current maturities
|
-
|
(11,713
|
)
|
|||||
|
$
|
52,593
|
$
|
30,244
|
|||||
On March 31, 2017, the Company entered into a secured revolving credit agreement (the “Credit Agreement”) with Sterling National Bank (the “Bank”) pursuant to which the Company obtained a credit facility in the aggregate principal amount of up to $55 million (the “Credit Facility”). The Credit Facility consists of (a) a $30 million loan facility (“Facility 1”), which is comprised of a $25 million revolving loan designated as “Tranche A” and a $5 million non-revolving loan designated as “Tranche B,” which Tranche B was repaid during the quarter ended June 30, 2017 and (b) a $25 million revolving loan facility (“Facility 2”), which includes a sublimit amount for letters of credit of $10 million.
The Credit Agreement was subsequently amended, on November 29, 2017, to provide the Company with an additional $
15 million revolving credit loan (“Facility 3”), resulting in an increase in the aggregate availability under the Credit Facility to $65 million. The Credit Agreement was again amended on February 23, 2018, to, among other things, effect certain modifications to the financial covenants and other provisions of the Credit Agreement and to allow the Company to pursue the sale of certain real property assets. The February 23, 2018 amendment increased the interest rate for borrowings under Tranche A of Facility 1 to a rate per annum equal to the greater of (x) the Bank’s prime rate plus 2.85% and (y) 6.00%. Prior to the most recent amendment of the Credit Agreement, revolving loans outstanding under Tranche A of Facility 1 bore interest at a rate per annum equal to the greater of (x) the Bank’s prime rate plus 2.50% and (y) 6.00%.
The Credit Facility replaces a term loan facility (the “Prior Credit Facility”) which was repaid and terminated concurrently with the effectiveness of the Credit Facility. The term of the Credit Facility is 38 months, maturing on May 31, 2020, except that the term Facility 3 will mature one year earlier, on May 31, 2019.
The Credit Facility is secured by a first priority lien in favor of the Bank on substantially all of the personal property owned by the Company as well as mortgages on four parcels of real property owned by the Company in Colorado, Tennessee and Texas at which three of the Company’s schools are located, as well as a former school property owned by the Company located in Connecticut.
At the closing of the Credit Facility, the Company drew $25 million under Tranche A of Facility 1, which, pursuant to the terms of the Credit Agreement, was used to repay the Prior Credit Facility and to pay transaction costs associated with closing the Credit Facility. After the disbursements of such amounts, the Company retained approximately $1.8 million of the borrowed amount for working capital purposes.
Also, at closing, $5 million was drawn under Tranche B and, pursuant to the terms of the Credit Agreement, was deposited into an interest-bearing pledged account (the “Pledged Account”) in the name of the Company maintained at the Bank in order to secure payment obligations of the Company with respect to the costs of remediation of any environmental contamination discovered at certain of the mortgaged properties based upon environmental studies undertaken at such properties. During the quarter ended June 30, 2017, the environmental studies were completed and revealed no environmental issues existing at the properties. Accordingly, pursuant to the terms of the Credit Agreement, the $5 million in the Pledged Account was released and used to repay the non-revolving loan outstanding under Tranche B. Upon the repayment of Tranche B, the maximum principal amount of Facility 1 was permanently reduced to $25 million.
Pursuant to the terms of the Credit Agreement, all draws under Facility 2 for letters of credit or revolving loans and all draws under Facility 3 must be secured by cash collateral in an amount equal to 100% of the aggregate stated amount of the letters of credit issued and revolving loans outstanding through draws from Facility 1 or other available cash of the Company.
Accrued interest on each revolving loan will be payable monthly in arrears. Revolving loans under Tranche A of Facility 1 will bear interest at a rate per annum equal to the greater of (x) the Bank’s prime rate plus 2.85% and (y) 6.00%. Prior to the February 23, 2018 amendment of the Credit Agreement, the per annum interest rate for revolving loans outstanding under Tranche A of Facility 1 was equal to the greater of (x) the Bank’s prime rate plus 2.50% and (y) 6.00%. The amount borrowed under Tranche B of Facility 1 and revolving loans under Facility 2 and Facility 3 will bear interest at a rate per annum equal to the greater of (x) the Bank’s prime rate and (y) 3.50%.
Each issuance of a letter of credit under Facility 2 will require the payment of a letter of credit fee to the Bank equal to a rate per annum of 1.75% on the daily amount available to be drawn under the letter of credit, which fee shall be payable in quarterly installments in arrears. Letters of credit totaling $6.2 million that were outstanding under a $9.5 million letter of credit facility previously provided to the Company by the Bank, which letter of credit facility was set to mature on April 1, 2017, are treated as letters of credit under Facility 2.
The terms of the Credit Agreement provide that the Bank be paid an unused facility fee on the average daily unused balance of Facility 1 at a rate per annum equal to 0.50%, which fee is payable quarterly in arrears. In addition, the Company is required to maintain, on deposit in one or more non-interest bearing accounts, a minimum of $5 million in quarterly average aggregate balances. If in any quarter the required average aggregate account balance is not maintained, the Company is required to pay the Bank a fee of $12,500 for that quarter and, in the event that the Company terminates the Credit Facility or refinances with another lender within 18 months of closing, the Company is required to pay the Bank a breakage fee of $500,000.
In addition to the foregoing, the Credit Agreement contains customary representations, warranties and affirmative and negative covenants, including financial covenants that restrict capital expenditures, prohibit the incurrence of a net loss commencing on December 31, 2018 and require a minimum adjusted EBITDA and a minimum tangible net worth, which is an annual covenant, as well as events of default customary for facilities of this type. As of December 31, 2017, the Company is in compliance with all covenants.
In connection with the Credit Agreement, the Company paid the Bank an origination fee in the amount of $250,000 and other fees and reimbursements that are customary for facilities of this type. In connection with the February 23, 2018 amendment of the Credit Agreement, the Company paid to the Bank a modification fee in the amount of $50,000.
The Company incurred an early termination premium of approximately $1.8 million in connection with the termination of the Prior Credit Facility.
On April 28, 2017, the Company entered into an additional secured credit agreement with the Bank, pursuant to which the Company obtained a short term loan in the principal amount of $8 million, the proceeds of which were used for working capital and general corporate purposes. The loan, which had an interest rate equal to the greater of the Bank’s prime rate plus 2.50% or 6.00%, was secured by two real property assets located in West Palm Beach, Florida at which schools operated by the Company were located and matured upon the earlier of October 1, 2017 and the date of the sale of the West Palm Beach, Florida property. The Company sold the two properties located in West Palm Beach, Florida to Tambone
Companies, LLC
in the third quarter of 2017 and subsequently repaid the $8 million.
As of December 31, 2017, the Company had $53.4 million outstanding under the Credit Facility; offset by $0.8 million of deferred finance fees. As of December 31, 2016, the Company had $44.3 million outstanding under the Prior Credit Facility; offset by $2.3 million of deferred finance fees, which were written-off. As of December 31, 2017 and December 31, 2016, there were letters of credit in the aggregate outstanding principal amount of $7.2 million and $6.2 million, respectively.
Scheduled maturities of long-term debt at December 31, 2017 are as follows:
|
Year ending December 31,
|
||||
|
2018
|
$
|
-
|
||
|
2019
|
-
|
|||
|
2020
|
53,400
|
|||
|
2021
|
-
|
|||
|
2022
|
-
|
|||
|
Thereafter
|
-
|
|||
|
$
|
53,400
|
|||
| 8. |
STOCKHOLDERS' EQUITY
|
Restricted Stock
The Company has two stock incentive plans: a Long-Term Incentive Plan (the “LTIP”) and a Non-Employee Directors Restricted Stock Plan
(the “Non-Employee Directors Plan”).
Under the LTIP, certain employees received awards of restricted shares of common stock based on service and performance. The number of shares granted to each employee is based on the fair market value of a share of common stock on the date of grant.
On May 13, 2016, performance-based shares were granted which vest over two years on March 15, 2017 and March 15, 2018 based upon the attainment of a financial responsibility ratio during each fiscal year ending December 31, 2016 and 2017. As of December 31, 2017 half of the shares have vested as the vesting criteria was achieved. There is no restriction on the right to vote or the right to receive dividends with respect to any of the restricted shares.
On December 18, 2014, performance-based shares were granted which vest over four years based upon the attainment of (i) a specified operating income margin during any one or more of the fiscal years in the period beginning January 1, 2015 and ending December 31, 2018 and (ii) the attainment of earnings before interest, taxes, depreciation and amortization targets during each of the fiscal years ended December 31, 2015 through 2018. As of December 31, 2017 half of the shares have vested as the vesting criteria was achieved. There is no restriction on the right to vote or the right to receive dividends with respect to any of the restricted shares.
Pursuant to the Non-Employee Directors Plan, each non-employee director of the Company receives an annual award of restricted shares of common stock on the date of the Company’s annual meeting of shareholders. The number of shares granted to each non-employee director is based on the fair market value of a share of common stock on that date. There is no restriction on the right to vote or the right to receive dividends with respect to any of the restricted shares.
In 2017, 2016 and 2015, the Company completed a net share settlement for 189,420, 71,805 and 85,740 restricted shares and stock options exercised, respectively, on behalf of certain employees that participate in the LTIP upon the vesting of the restricted shares pursuant to the terms of the LTIP or exercise of the stock options. The net share settlement was in connection with income taxes incurred on restricted shares or stock option exercises that vested and were transferred to the employee during 2017, 2016 and/or 2015, creating taxable income for the employee. At the employees’ request, the Company will pay these taxes on behalf of the employees in exchange for the employees returning an equivalent value of restricted shares or shares acquired upon the exercise of stock options to the Company. These transactions resulted in a decrease of approximately $0.4 million, $0.2 million and $0.2 million in 2017, 2016 and 2015, respectively, to equity as the cash payment of the taxes effectively was a repurchase of the restricted shares or shares acquired through the exercise of stock options granted in previous years.
The following is a summary of transactions pertaining to restricted stock:
|
Shares
|
Weighted
Average Grant
Date Fair Value
Per Share
|
|||||||
|
Nonvested restricted stock outstanding at December 31, 2015
|
450,494
|
$
|
3.69
|
|||||
|
Granted
|
1,105,487
|
1.67
|
||||||
|
Cancelled
|
(76,200
|
)
|
2.98
|
|||||
|
Vested
|
(336,182
|
)
|
3.33
|
|||||
|
Nonvested restricted stock outstanding at December 31, 2016
|
1,143,599
|
1.89
|
||||||
|
Granted
|
181,208
|
2.58
|
||||||
|
Cancelled
|
(52,398
|
)
|
5.63
|
|||||
|
Vested
|
(664,415
|
)
|
1.77
|
|||||
|
Nonvested restricted stock outstanding at December 31, 2017
|
607,994
|
1.90
|
||||||
The restricted stock expense for each of the years ended December 31, 2017, 2016 and 2015 was $1.2 million, $1.4 million and $1.1 million, respectively. The unrecognized restricted stock expense as of December 31, 2017 and 2016 was $0.3 million and $1.5 million, respectively. As of December 31, 2017, unrecognized restricted stock expense will be expensed over the weighted-average period of approximately 3 months. As of December 31, 2017, outstanding restricted shares under the LTIP had an aggregate intrinsic value of $1.2 million. For the year ended December 31, 2017 and 2016, respectively, 52,398 and 26,200 shares were cancelled as the performance criteria was not met.
Stock Options
During 2017, 2016 and 2015 there were no new stock option grants. The following is a summary of transactions pertaining to the option plans:
|
Shares
|
Weighted
Average
Exercise Price
Per Share
|
Weighted
Average
Remaining
Contractual
Term
|
Aggregate
Intrinsic Value
|
||||||||||
|
Outstanding January 1, 2015
|
424,167
|
$
|
13.65
|
4.18 years
|
$
|
-
|
|||||||
|
Cancelled
|
(178,000
|
)
|
15.20
|
-
|
|||||||||
|
Outstanding December 31, 2015
|
246,167
|
12.52
|
3.98 years
|
-
|
|||||||||
|
Cancelled
|
(28,000
|
)
|
15.76
|
-
|
|||||||||
|
Outstanding December 31, 2016
|
218,167
|
12.11
|
3.33 years
|
-
|
|||||||||
|
Cancelled
|
(50,500
|
)
|
12.09
|
||||||||||
|
Outstanding December 31, 2017
|
167,667
|
12.11
|
2.97 years
|
-
|
|||||||||
|
Vested as of December 31, 2017
|
167,667
|
12.11
|
2.97 years
|
-
|
|||||||||
|
Exercisable as of December 31, 2017
|
167,667
|
12.11
|
2.97 years
|
-
|
|||||||||
As of December 31, 2017, there are no unrecognized pre-tax compensation expense for unvested stock option awards.
The following table presents a summary of options outstanding at December 31, 2017:
|
At December 31, 2017
|
||||||||||||||||||||||
|
Stock Options Outstanding
|
Stock Options Exercisable
|
|||||||||||||||||||||
|
Range of Exercise Prices
|
Shares
|
Contractual
Weighted
Average life
(years)
|
Weighted
Average Exercise
Price
|
Shares
|
Weighted
Average Exercise
Price
|
|||||||||||||||||
|
$
|
4.00-$13.99
|
119,667
|
3.22
|
$
|
8.79
|
119,667
|
$
|
8.79
|
||||||||||||||
|
$
|
14.00-$19.99
|
17,000
|
1.84
|
19.98
|
17,000
|
19.98
|
||||||||||||||||
|
$
|
20.00-$25.00
|
31,000
|
2.59
|
20.62
|
31,000
|
20.62
|
||||||||||||||||
|
167,667
|
2.97
|
12.11
|
167,667
|
12.11
|
||||||||||||||||||
| 9. |
PENSION PLAN
|
The Company sponsors a noncontributory defined benefit pension plan covering substantially all of the Company's union employees. Benefits are provided based on employees' years of service and earnings. This plan was frozen on December 31, 1994 for non-union employees.
The following table sets forth the plan's funded status and amounts recognized in the consolidated financial statements:
|
Year Ended December 31,
|
||||||||||||
|
2017
|
2016
|
2015
|
||||||||||
|
CHANGES IN BENEFIT OBLIGATIONS:
|
||||||||||||
|
Benefit obligation-beginning of year
|
$
|
22,916
|
$
|
23,341
|
$
|
24,299
|
||||||
|
Service cost
|
29
|
28
|
28
|
|||||||||
|
Interest cost
|
840
|
888
|
884
|
|||||||||
|
Actuarial loss (gain)
|
721
|
(255
|
)
|
(782
|
)
|
|||||||
|
Benefits paid
|
(1,014
|
)
|
(1,086
|
)
|
(1,088
|
)
|
||||||
|
Benefit obligation at end of year
|
23,492
|
22,916
|
23,341
|
|||||||||
|
CHANGE IN PLAN ASSETS:
|
||||||||||||
|
Fair value of plan assets-beginning of year
|
17,548
|
17,792
|
19,000
|
|||||||||
|
Actual return on plan assets
|
2,521
|
842
|
(120
|
)
|
||||||||
|
Benefits paid
|
(1,014
|
)
|
(1,086
|
)
|
(1,088
|
)
|
||||||
|
Fair value of plan assets-end of year
|
19,055
|
17,548
|
17,792
|
|||||||||
|
BENEFIT OBLIGATION IN EXCESS OF FAIR VALUE FUNDED STATUS:
|
$
|
(4,437
|
)
|
$
|
(5,368
|
)
|
$
|
(5,549
|
)
|
|||
For the year ended December 31, 2017, the actuarial loss of $0.7 million was due to the decrease in the discount rate from 3.81% to 3.36%.
Amounts recognized in the consolidated balance sheets consist of:
|
At December 31,
|
||||||||||||
|
2017
|
2016
|
2015
|
||||||||||
|
Noncurrent liabilities
|
$
|
(4,437
|
)
|
$
|
(5,368
|
)
|
$
|
(5,549
|
)
|
|||
Amounts recognized in accumulated other comprehensive loss consist of:
|
Year Ended December 31,
|
||||||||||||
|
2017
|
2016
|
2015
|
||||||||||
|
Accumulated loss
|
$
|
(6,876
|
)
|
$
|
(8,467
|
)
|
$
|
(9,438
|
)
|
|||
|
Deferred income taxes
|
2,366
|
2,366
|
2,366
|
|||||||||
|
Accumulated other comprehensive loss
|
$
|
(4,510
|
)
|
$
|
(6,101
|
)
|
$
|
(7,072
|
)
|
|||
The accumulated benefit obligation was $23.5 million and $22.9 million at December 31, 2017 and 2016, respectively.
The following table provides the components of net periodic cost for the plan:
|
Year Ended December 31,
|
||||||||||||
|
2017
|
2016
|
2015
|
||||||||||
|
COMPONENTS OF NET PERIODIC BENEFIT COST
|
||||||||||||
|
Service cost
|
$
|
29
|
$
|
28
|
$
|
28
|
||||||
|
Interest cost
|
840
|
888
|
884
|
|||||||||
|
Expected return on plan assets
|
(1,058
|
)
|
(1,118
|
)
|
(1,243
|
)
|
||||||
|
Recognized net actuarial loss
|
850
|
991
|
976
|
|||||||||
|
Net periodic benefit cost
|
$
|
661
|
$
|
789
|
$
|
645
|
||||||
The estimated net loss, transition obligation and prior service cost for the plan that will be amortized from accumulated other comprehensive loss into net periodic benefit cost over the next year is $0.7 million.
The following tables present plan assets using the fair value hierarchy as of December 31, 2017 and 2016. The fair value hierarchy has three levels based on the reliability of inputs used to determine fair value. Level 1 refers to fair values determined based on quoted prices in active markets for identical assets. Level 2 refers to fair values estimated using observable prices that are based on inputs not quoted in active markets but observable by market data, while Level 3 includes the fair values estimated using significant non-observable inputs. The level in the fair value hierarchy within which the fair value measurement falls is determined based on the lowest level input that is significant to the fair value measurement in its entirety.
|
Quoted Prices in
Active Markets
for Identical
Assets
(Level 1)
|
Significant Other
Observable Inputs
(Level 2)
|
Significant
Unobservable
Inputs
(Level 3)
|
Total
|
|||||||||||||
|
Equity securities
|
$
|
6,856
|
$
|
-
|
$
|
-
|
$
|
6,856
|
||||||||
|
Fixed income
|
6,818
|
-
|
-
|
6,818
|
||||||||||||
|
International equities
|
3,490
|
-
|
-
|
3,490
|
||||||||||||
|
Real estate
|
1,133
|
-
|
-
|
1,133
|
||||||||||||
|
Cash and equivalents
|
758
|
-
|
-
|
758
|
||||||||||||
|
Balance at December 31, 2017
|
$
|
19,055
|
$
|
-
|
$
|
-
|
$
|
19,055
|
||||||||
|
Quoted Prices in
Active Markets
for Identical
Assets
(Level 1)
|
Significant Other
Observable Inputs
(Level 2)
|
Significant
Unobservable
Inputs
(Level 3)
|
Total
|
|||||||||||||
|
Equity securities
|
$
|
8,509
|
$
|
-
|
$
|
-
|
$
|
8,509
|
||||||||
|
Fixed income
|
6,548
|
-
|
-
|
6,548
|
||||||||||||
|
International equities
|
2,484
|
-
|
-
|
2,484
|
||||||||||||
|
Cash and equivalents
|
7
|
-
|
-
|
7
|
||||||||||||
|
Balance at December 31, 2016
|
$
|
17,548
|
$
|
-
|
$
|
-
|
$
|
17,548
|
||||||||
Fair value of total plan assets by major asset category as of December 31:
|
2017
|
2016
|
2015
|
||||||||||
|
Equity securities
|
36
|
%
|
49
|
%
|
48
|
%
|
||||||
|
Fixed income
|
36
|
%
|
37
|
%
|
33
|
%
|
||||||
|
International equities
|
18
|
%
|
14
|
%
|
19
|
%
|
||||||
|
Real estate
|
6
|
%
|
0
|
%
|
0
|
%
|
||||||
|
Cash and equivalents
|
4
|
%
|
0
|
%
|
0
|
%
|
||||||
|
Total
|
100
|
%
|
100
|
%
|
100
|
%
|
||||||
Weighted-average assumptions used to determine benefit obligations as of December 31:
|
2017
|
2016
|
2015
|
||||||||||
|
Discount rate
|
3.36
|
%
|
3.81
|
%
|
3.94
|
%
|
||||||
|
Rate of compensation increase
|
2.50
|
%
|
2.50
|
%
|
2.50
|
%
|
||||||
Weighted-average assumptions used to determine net periodic pension cost for years ended December 31:
|
2017
|
2016
|
2015
|
||||||||||
|
Discount rate
|
3.36
|
%
|
3.81
|
%
|
3.94
|
%
|
||||||
|
Rate of compensation increase
|
2.50
|
%
|
2.50
|
%
|
2.50
|
%
|
||||||
|
Long-term rate of return
|
6.00
|
%
|
6.25
|
%
|
6.50
|
%
|
||||||
As this plan was frozen to non-union employees on December 31, 1994, the difference between the projected benefit obligation and accumulated benefit obligation is not significant in any year.
The Company invests plan assets based on a total return on investment approach, pursuant to which the plan assets include a diversified blend of equity and fixed income investments toward a goal of maximizing the long-term rate of return without assuming an unreasonable level of investment risk. The Company determines the level of risk based on an analysis of plan liabilities, the extent to which the value of the plan assets satisfies the plan liabilities and the plan's financial condition. The investment policy includes target allocations ranging from 30% to 70% for equity investments, 20% to 60% for fixed income investments and 0% to 10% for cash equivalents. The equity portion of the plan assets represents growth and value stocks of small, medium and large companies. The Company measures and monitors the investment risk of the plan assets both on a quarterly basis and annually when the Company assesses plan liabilities.
The Company uses a building block approach to estimate the long-term rate of return on plan assets. This approach is based on the capital markets assumption that the greater the volatility, the greater the return over the long term. An analysis of the historical performance of equity and fixed income investments, together with current market factors such as the inflation and interest rates, are used to help make the assumptions necessary to estimate a long-term rate of return on plan assets. Once this estimate is made, the Company reviews the portfolio of plan assets and makes adjustments thereto that the Company believes are necessary to reflect a diversified blend of equity and fixed income investments that is capable of achieving the estimated long-term rate of return without assuming an unreasonable level of investment risk. The Company also compares the portfolio of plan assets to those of other pension plans to help assess the suitability and appropriateness of the plan's investments.
The Company does not expect to make contributions to the plan in 2018. However after considering the funded status of the plan, movements in the discount rate, investment performance and related tax consequences, the Company may choose to make additional contributions to the plan in any given year.
The total amount of the Company’s contributions paid under its pension plan was zero for the each of the years ended December 31, 2017 and 2016, respectively.
Information about the expected benefit payments for the plan is as follows:
|
Year Ending December 31,
|
||||
|
2018
|
$
|
1,303
|
||
|
2019
|
1,334
|
|||
|
2020
|
1,347
|
|||
|
2021
|
1,364
|
|||
|
2022
|
1,381
|
|||
|
Years 2023-2027
|
6,969
|
|||
The Company has a 401(k) defined contribution plan for all eligible employees. Employees may contribute up to 25% of their compensation into the plan. The Company may contribute up to an additional 30% of the employee's contributed amount up to 6% of compensation. For the years ended December 31, 2017, 2016 and 2015, the Company's expense for the 401(k) plan amounted to $0.1 million, $0.7 million and $0.7 million, respectively.
| 10. |
INCOME TAXES
|
Components of the provision for income taxes were as follows:
|
Year Ended December 31,
|
||||||||||||
|
2017
|
2016
|
2015
|
||||||||||
|
Current:
|
||||||||||||
|
Federal
|
$
|
-
|
$
|
-
|
$
|
-
|
||||||
|
State
|
150
|
200
|
242
|
|||||||||
|
Total
|
150
|
200
|
242
|
|||||||||
|
Deferred:
|
||||||||||||
|
Federal
|
(424
|
)
|
-
|
-
|
||||||||
|
State
|
-
|
-
|
-
|
|||||||||
|
Total
|
(424
|
)
|
-
|
-
|
||||||||
|
Total (benefit) provision
|
$
|
(274
|
)
|
$
|
200
|
$
|
242
|
|||||
The components of the deferred tax assets are as follows:
|
At December 31,
|
||||||||
|
2017
|
2016
|
|||||||
|
Noncurrent deferred tax assets (liabilities)
|
||||||||
|
Allowance for bad debts
|
$
|
3,792
|
$
|
5,904
|
||||
|
Accrued rent
|
1,723
|
3,191
|
||||||
|
Accrued bonus
|
-
|
1,429
|
||||||
|
Accrued benefits
|
105
|
198
|
||||||
|
Stock-based compensation
|
387
|
557
|
||||||
|
Depreciation
|
15,520
|
20,372
|
||||||
|
Goodwill
|
594
|
1,959
|
||||||
|
Other intangibles
|
291
|
562
|
||||||
|
Pension plan liabilities
|
1,221
|
2,142
|
||||||
|
Net operating loss carryforwards
|
17,367
|
17,846
|
||||||
|
AMT credit
|
424
|
424
|
||||||
|
Total noncurrent deferred tax assets
|
41,424
|
54,584
|
||||||
|
Less valuation allowance
|
(41,000
|
)
|
(54,584
|
)
|
||||
|
Noncurrent deferred tax assets, net of valuation allowance
|
$
|
424
|
$
|
-
|
||||
Management assesses the available positive and negative evidence to estimate if sufficient future taxable income will be generated to use the existing deferred tax assets. A significant piece of objective negative evidence was the cumulative losses incurred by the Company in recent years.
On the basis of this evaluation the Company believes it is not more likely than not that it will realize its net deferred tax assets. As a result, as of December 31, 2017 and 2016, the Company has recorded a valuation allowance of $41.0 million and $54.6 million, respectively, against its net deferred tax assets.
On December 22, 2017, the U.S. government enacted comprehensive tax legislation known as the Tax Cuts and Jobs Act (the “Tax Act”). The Tax Act establishes new tax laws that will take effect in 2018, including, but not limited to (1) reduction of the U.S. federal corporate tax rate from a maximum of 35% to 21%; (2) elimination of the corporate alternative minimum tax (AMT); (3) a new limitation on deductible interest expense; (4) the repeal of the domestic production activity deduction; (5) limitations on the deductibility of certain executive compensation; and (6) limitations on net operating losses (NOLs) generated after December 31, 2017, to 80% of taxable income. In addition, certain changes were made to the bonus depreciation rules that will impact 2017.
ASC 740, Income Taxes requires the effects of changes in tax laws to be recognized in the period in which the legislation is enacted. However, due to the complexity and significance of the Tax Act's provisions, the SEC staff issued Staff Accounting Bulletin 118 (SAB 118), which provides guidance on accounting for the tax effects of the Tax Act. SAB 118 provides a measurement period that should not extend beyond one year from the Tax Act enactment date for companies to complete the accounting under ASC 740. In accordance with SAB 118, a company must reflect the income tax effects of those aspects of the Tax Act for which the accounting under ASC 740 is complete. To the extent that a company’s accounting for certain income tax effects of the Tax Act is incomplete but it is able to determine a reasonable estimate, it must record a provisional estimate in the financial statements. If a company cannot determine a provisional estimate to be included in the financial statements, it should continue to apply ASC 740 on the basis of the provisions of the tax laws that were in effect immediately before the enactment of the Tax Act.
At December 31, 2017, the Company has not completed its accounting for the tax effects of enactment of the Tax Act; however, the Company has made a reasonable estimate of the effects of the Tax Act’s change in the federal rate and revalued its deferred tax assets based on the rates at which they are expected to reverse in the future, which is generally the new 21% federal corporate tax rate plus applicable state tax rate. Based on the Company’s initial analysis of the impact, it consequently recorded a decrease related to deferred tax assets of $17.7 million. The expense is offset with a corresponding release of valuation allowance.
The Tax Act eliminates the corporate AMT and changes how existing corporate AMT credits can be realized either to offset regular tax liability or to be refunded. As a result of this change, the Company released the valuation allowance against corporate AMT credits deferred tax asset and recorded a deferred tax provision benefit of $0.4 million. Offsetting this benefit was $0.1 million of income tax expense from various minimal state tax expenses.
The Tax Act did not have a material impact on our financial statements because we are under a full valuation allowance and we do not have any significant offshore earnings from which to record the mandatory transition tax.
The Tax Act requires the Company to assess whether its valuation allowance analyses are affected by various aspects of the Tax Act. Since, as discussed herein, we have recorded provisional amounts related to certain portions of the Tax Act, any corresponding determination of the need for or change in a valuation allowance is also provisional. The Company’s valuation allowance position did not change as a result of tax reform except for AMT credits which is discussed above and a reduction related to the change in the deferred tax rate.
The difference between the actual tax provision and the tax provision that would result from the use of the Federal statutory rate is as follows:
|
Year Ended December 31,
|
||||||||||||||||||||||||
|
2017
|
2016
|
2015
|
||||||||||||||||||||||
|
Loss before taxes
|
$
|
(11,758
|
)
|
$
|
(28,104
|
)
|
$
|
(3,108
|
)
|
|||||||||||||||
|
Expected tax benefit
|
$
|
(4,115
|
)
|
35.0
|
%
|
$
|
(9,836
|
)
|
35.0
|
%
|
$
|
1,088
|
35.0
|
%
|
||||||||||
|
State tax benefit (net of federal)
|
150
|
(1.3
|
)
|
200
|
(0.7
|
)
|
242
|
7.8
|
||||||||||||||||
|
Valuation allowance
|
(13,920
|
)
|
118.4
|
9,726
|
(34.6
|
)
|
(1,228
|
)
|
(39.5
|
)
|
||||||||||||||
|
Federal tax reform - deferred rate change
|
17,671
|
(150.3
|
)
|
-
|
-
|
-
|
-
|
|||||||||||||||||
|
Other
|
(60
|
)
|
0.5
|
110
|
(0.4
|
)
|
140
|
4.5
|
||||||||||||||||
|
Total
|
$
|
(274
|
)
|
2.3
|
%
|
$
|
200
|
-0.7
|
%
|
$
|
242
|
7.8
|
%
|
|||||||||||
As of December 31, 2017 and 2016, the Company has net operating loss (“NOL”) carryforwards of $57.7 million and $39.7 million, respectively, which, if unused, will expire beginning in 2028 and ending in 2037. Utilization of the NOL carryforwards may be subject to a substantial limitation due to ownership change limitations that may occur in the future, as required by Section 382 of the Internal Revenue Code of 1986, as amended (the “Code”), as well as similar state and foreign provisions. These ownership changes may limit the amount of NOL and tax credit carryforwards that can be utilized annually to offset future taxable income and tax, respectively. In general, an “ownership change” as defined by Section 382 of the Code results from a transaction or series of transactions over a three-year period resulting in an ownership change of more than 50 percentage points of the outstanding stock of a company by certain stockholders or public groups.
As of December 31, 2017, 2016 and 2015, the Company no longer has any liability for uncertain tax positions.
The Company recognizes accrued interest and penalties related to uncertain tax positions in income tax expense.
The Company or one of its subsidiaries files income tax returns in the U.S. federal jurisdiction, and various states. The Company is no longer subject to U.S. federal income tax examinations for years before 2015 and, generally, is no longer subject to state and local income tax examinations by tax authorities for years before 2012.
| 11. |
FAIR VALUE
|
The carrying amount and estimated fair value of the Company’s financial instrument assets and liabilities, which are not measured at fair value on the Consolidated Balance Sheets, are listed in the table below:
|
December 31, 2017
|
||||||||||||||||||||
|
Carrying
|
Quoted Prices in Active Markets for Identical Assets
|
Significant Other Observable Inputs
|
Significant Unobservable Inputs
|
|||||||||||||||||
|
Amount
|
(Level 1)
|
(Level 2)
|
(Level 3)
|
Total
|
||||||||||||||||
|
Financial Assets:
|
||||||||||||||||||||
|
Cash and cash equivalents
|
$
|
14,563
|
$
|
14,563
|
$
|
-
|
$
|
-
|
$
|
14,563
|
||||||||||
|
Restricted cash
|
39,991
|
39,991
|
-
|
-
|
39,991
|
|||||||||||||||
|
Prepaid expenses and other current assets
|
2,352
|
-
|
2,352
|
-
|
2,352
|
|||||||||||||||
|
Financial Liabilities:
|
||||||||||||||||||||
|
Accrued expenses
|
$
|
11,771
|
$
|
-
|
$
|
11,771
|
$
|
-
|
$
|
11,771
|
||||||||||
|
Other short term liabilities
|
558
|
-
|
558
|
-
|
558
|
|||||||||||||||
|
Credit facility
|
52,593
|
-
|
47,200
|
-
|
47,200
|
|||||||||||||||
|
December 31, 2016
|
||||||||||||||||||||
|
Carrying
|
Quoted Prices in Active Markets for Identical Assets
|
Significant Other Observable Inputs
|
Significant Unobservable Inputs
|
|||||||||||||||||
|
Amount
|
(Level 1)
|
(Level 2)
|
(Level 3)
|
Total
|
||||||||||||||||
|
Financial Assets:
|
||||||||||||||||||||
|
Cash and cash equivalents
|
$
|
21,064
|
$
|
21,064
|
$
|
-
|
$
|
-
|
$
|
21,064
|
||||||||||
|
Restricted cash
|
6,399
|
6,399
|
-
|
-
|
6,399
|
|||||||||||||||
|
Prepaid expenses and other current assets
|
2,434
|
-
|
2,434
|
-
|
2,434
|
|||||||||||||||
|
Noncurrent restricted cash
|
20,252
|
20,252
|
-
|
-
|
20,252
|
|||||||||||||||
|
Financial Liabilities:
|
||||||||||||||||||||
|
Accrued expenses
|
$
|
12,815
|
$
|
-
|
$
|
12,815
|
$
|
-
|
$
|
12,815
|
||||||||||
|
Other short term liabilities
|
653
|
-
|
653
|
-
|
653
|
|||||||||||||||
|
Term loan
|
44,267
|
-
|
40,687
|
-
|
40,687
|
|||||||||||||||
We estimate fair value of Facility 1 of the revolving credit facility based on a present value analysis utilizing aggregate market yields obtained from independent pricing sources for similar financial instruments. The carrying value for Facility 2 and Facility 3 of the revolving credit facility approximates fair value due to the fact that the borrowings were made in close proximity to December 31, 2017.
The fair value of the revolving credit facility approximates the carrying amount at December 31, 2017 as the instrument had variable interest rates that reflected current market rates available to the Company. In addition, the Company recently amended the credit facility and, in connection therewith, the interest rates increased slightly.
The fair value of the Term loan is estimated based on a present value analysis utilizing aggregate market yields obtained from independent pricing sources for similar financial instruments.
The carrying amounts reported on the Consolidated Balance Sheets for Cash and cash equivalents, Restricted cash and Noncurrent restricted cash approximate fair value because they are highly liquid.
The carrying amounts reported on the Consolidated Balance Sheets for Prepaid expenses and Other current assets, Accrued expenses and Other short term liabilities approximate fair value due to the short-term nature of these items.
| 12. |
SEGMENT REPORTING
|
The for-profit education industry has been impacted by numerous regulatory changes, the changing economy and an onslaught of negative media attention. As a result of these challenges, student populations have declined and operating costs have increased. Over the past few years, the Company has closed over ten locations and exited its online business. In 2016, the Company ceased operations in Hartford, Connecticut; Fern Park, Florida; and Henderson (Green Valley), Nevada. In 2017, the Company completed the teach-outs of its Center City Philadelphia, Pennsylvania; Northeast Philadelphia, Pennsylvania; West Palm Beach, Florida; Brockton, Massachusetts and Lowell, Massachusetts schools. All of these schools were previously included in our HOPS segment and are included in the Transitional segment as of December 31, 2017.
In the past, we offered any combination of programs at any campus. We have shifted our focus to program offerings that create greater differentiation among campuses and promote attainment of excellence to attract more students and gain market share. Also, strategically, we began offering continuing education training to select employers who hire our graduates and this is best achieved at campuses focused on the applicable profession.
As a result of the regulatory environment, market forces and our strategic decisions, we now operate our business in three reportable segments: (a) the Transportation and Skilled Trades segment; (b) the Healthcare and Other Professions segment; and (c) the Transitional segment.
Our reportable segments have been determined based on a method by which we now evaluate performance and allocate resources. Each reportable segment represents a group of post-secondary education providers that offer a variety of degree and non-degree academic programs. These segments are organized by key market segments to enhance operational alignment within each segment to more effectively execute our strategic plan. Each of the Company’s schools is a reporting unit and an operating segment. Our operating segments are described below.
Transportation and Skilled Trades –
The Transportation and Skilled Trades segment offers academic programs mainly in the career-oriented disciplines of transportation and skilled trades (e.g. automotive, diesel, HVAC, welding and manufacturing).
Healthcare and Other Professions –
The Healthcare and Other Professions segment offers academic programs in the career-oriented disciplines of health sciences, hospitality and business and information technology (e.g. dental assistant, medical assistant, practical nursing, culinary arts and cosmetology).
Transitional
– The Transitional segment refers to campuses that are being taught-out and closed and operations that are being phased out. The schools in the Transitional segment employ a gradual teach-out process that enables the schools to continue to operate to allow their current students to complete their course of study. These schools are no longer enrolling new students.
The Company continually evaluates each campus for profitability, earning potential, and customer satisfaction. This evaluation takes several factors into consideration, including the campus’s geographic location and program offerings, as well as skillsets required of our students by their potential employers. The purpose of this evaluation is to ensure that our programs provide our students with the best possible opportunity to succeed in the marketplace with the goals of attracting more students to our programs and, ultimately, to provide our shareholders with the maximum return on their investment. Campuses in the Transitional segment have been subject to this process and have been strategically identified for closure.
We evaluate segment performance based on operating results. Adjustments to reconcile segment results to consolidated results are included under the caption “Corporate,” which primarily includes unallocated corporate activity.
Summary financial information by reporting segment is as follows:
|
For the Year Ended December 31,
|
||||||||||||||||||||||||||||||||||||
|
Revenue
|
Operating (Loss) Income
|
|||||||||||||||||||||||||||||||||||
|
2017
|
% of
Total
|
2016
|
% of
Total
|
2015
|
% of
Total
|
2017
|
2016
|
2015
|
||||||||||||||||||||||||||||
|
Transportation and Skilled Trades
|
$
|
177,099
|
67.6
|
%
|
$
|
177,883
|
62.3
|
%
|
$
|
183,822
|
60.1
|
%
|
$
|
17,861
|
$
|
21,278
|
$
|
26,777
|
||||||||||||||||||
|
Healthcare and Other Professions
|
76,310
|
29.1
|
%
|
77,152
|
27.0
|
%
|
79,978
|
26.1
|
%
|
2,318
|
(10,917
|
)
|
5,386
|
|||||||||||||||||||||||
|
Transitional
|
8,444
|
3.3
|
%
|
30,524
|
10.7
|
%
|
42,302
|
13.8
|
%
|
(5,379
|
)
|
(15,170
|
)
|
(7,543
|
)
|
|||||||||||||||||||||
|
Corporate
|
-
|
0.0
|
%
|
-
|
0.0
|
%
|
-
|
0.0
|
%
|
(19,516
|
)
|
(24,105
|
)
|
(23,916
|
)
|
|||||||||||||||||||||
|
Total
|
$
|
261,853
|
100
|
%
|
$
|
285,559
|
100
|
%
|
$
|
306,102
|
100
|
%
|
$
|
(4,716
|
)
|
$
|
(28,914
|
)
|
$
|
704
|
||||||||||||||||
|
Total Assets
|
||||||||
|
December 31, 2017
|
December 31, 2016
|
|||||||
|
Transportation and Skilled Trades
|
$
|
81,523
|
$
|
83,320
|
||||
|
Healthcare and Other Professions
|
9,373
|
7,506
|
||||||
|
Transitional
|
3,965
|
18,874
|
||||||
|
Corporate
|
60,352
|
53,507
|
||||||
|
Total
|
$
|
155,213
|
$
|
163,207
|
||||
| 13. |
COMMITMENTS AND CONTINGENCIES
|
Lease Commitments
—The Company leases office premises, educational facilities and various equipment for varying periods through the year 2030 at basic annual rentals (excluding taxes, insurance, and other expenses under certain leases) as follows:
|
Year Ending December 31,
|
Operating Leases
|
|||
|
2018
|
$
|
19,347
|
||
|
2019
|
16,608
|
|||
|
2020
|
12,386
|
|||
|
2021
|
8,185
|
|||
|
2022
|
6,022
|
|||
|
Thereafter
|
15,860
|
|||
|
78,408
|
||||
|
Less amount representing interest
|
-
|
|||
|
$
|
78,408
|
|||
Rent expense, included in operating expenses in the accompanying consolidated statements of operations for the three years ended December 31, 2017, 2016 and 2015 is $17.4 million, $20.7 million and $18.7 million, respectively.
Litigation and Regulatory Matters
—
In the ordinary conduct of our business, we are subject to periodic lawsuits, investigations and claims, including, but not limited to, claims involving students or graduates and routine employment matters. Although we cannot predict with certainty the ultimate resolution of lawsuits, investigations and claims asserted against us, we do not believe that any currently pending legal proceeding to which we are a party will have a material effect on our business, financial condition, results of operations or cash flows.
Student Loans
—
At December 31, 2017, the Company had outstanding net loan commitments to its students to assist them in financing their education of approximately $38.5 million, net of interest.
Vendor Relationship
—
The Company is party to an agreement with Matco Tools (“Matco”), which expires on July 31, 2019. The Company has agreed to grant Matco exclusive access to 12 campuses and its students and instructors. This exclusivity includes but is not limited to, all other tool manufacturers and/or tool distributors, by whatever means, during the term of the agreement. Under the agreement, the Company will be provided, on an advance commission basis, credits which are redeemable in branded tools, tools storage, equipment, and diagnostics products over the term of the contract.
The Company is party to an agreement with Snap-on Industrial (“Snap-on”), which expires on December 31, 2018. The Company has agreed to grant Snap-on exclusive rights to one automotive campus to display advertising and supply certain tools. The Company earns credits that are redeemable for certain tools and equipment based on the sales to students and to the Company.
Executive Employment Agreements
—The Company entered into employment contracts with key executives that provide for continued salary payments if the executives are terminated for reasons other than cause, as defined in the agreements. The future employment contract commitments for such employees were approximately $3.4 million at December 31, 2017.
Change in Control Agreements
—In the event of a change of control several key executives will receive continued salary payments based on their employment agreements.
Surety Bonds
—Each of the Company’s campuses must be authorized by the applicable state education agency in which the campus is located to operate and to grant degrees, diplomas or certificates to its students. The campuses are subject to extensive, ongoing regulation by each of these states. In addition, the Company’s campuses are required to be authorized by the applicable state education agencies of certain other states in which the campuses recruit students. The Company is required to post surety bonds on behalf of its campuses and education representatives with multiple states to maintain authorization to conduct its business. At December 31, 2017, the Company has posted surety bonds in the total amount of approximately $12.7 million.
| 14. |
RELATED PARTY
|
The Company has an agreement with Matco Tools, whereby Matco will provide to the Company, on an advance commission basis, credits in Matco-branded tools, tool storage, equipment, and diagnostics products. The chief executive officer of the parent company of Matco is considered an immediate family member of one of the Company’s board members. The amount of the Company’s purchases from this third party were $2.4 million and $1.0 million for the year ended December 31, 2017 and 2016, respectively. Management believes that its agreement with Matco is an arm’s length transaction and on similar terms as would have been obtained from unaffiliated third parties.
15.
UNAUDITED QUARTERLY FINANCIAL INFORMATION
The following tables have been updated to reflect changes in discontinued operations. Quarterly financial information for 2017 and 2016 is as follows:
|
Quarter
|
||||||||||||||||
|
2017
|
First
|
Second
|
Third
|
Fourth
|
||||||||||||
|
Revenue
|
$
|
65,279
|
$
|
61,865
|
$
|
67,308
|
$
|
67,401
|
||||||||
|
Net (loss) income
|
(10,929
|
)
|
(6,771
|
)
|
(1,490
|
)
|
7,707
|
|||||||||
|
Basic
|
||||||||||||||||
|
Net (loss) earnings per share
|
$
|
(0.46
|
)
|
$
|
(0.28
|
)
|
$
|
(0.06
|
)
|
$
|
0.32
|
|||||
|
Diluted
|
||||||||||||||||
|
Net (loss) earnings per share
|
$
|
(0.46
|
)
|
$
|
(0.28
|
)
|
$
|
(0.06
|
)
|
$
|
0.31
|
|||||
|
Weighted average number of common shares outstanding:
|
||||||||||||||||
|
Basic
|
23,609
|
23,962
|
24,024
|
24,025
|
||||||||||||
|
Diluted
|
23,609
|
23,962
|
24,024
|
24,590
|
||||||||||||
|
Quarter
|
||||||||||||||||
|
2016
|
First
|
Second
|
Third
|
Fourth
|
||||||||||||
|
Revenue
|
$
|
70,644
|
$
|
68,080
|
$
|
74,267
|
$
|
72,568
|
||||||||
|
Net loss
|
(6,068
|
)
|
(3,138
|
)
|
(471
|
)
|
(18,628
|
)
|
||||||||
|
Basic
|
||||||||||||||||
|
Net loss per share
|
$
|
(0.26
|
)
|
$
|
(0.13
|
)
|
$
|
(0.02
|
)
|
$
|
(0.79
|
)
|
||||
|
Diluted
|
||||||||||||||||
|
Net loss per share
|
$
|
(0.26
|
)
|
$
|
(0.13
|
)
|
$
|
(0.02
|
)
|
$
|
(0.79
|
)
|
||||
|
Weighted average number of common shares outstanding:
|
||||||||||||||||
|
Basic
|
23,351
|
23,448
|
23,499
|
23,514
|
||||||||||||
|
Diluted
|
23,351
|
23,448
|
23,499
|
23,514
|
||||||||||||
LINCOLN EDUCATIONAL SERVICES CORPORATION
Schedule II—Valuation and Qualifying Accounts
(in thousands)
|
Description
|
Balance at
Beginning
of Period
|
Charged to
Expense
|
Accounts
Written-off
|
Balance at
End of
Period
|
||||||||||||
|
Allowance accounts for the year ended:
|
||||||||||||||||
|
December 31, 2017 Student receivable allowance
|
$
|
14,794
|
$
|
13,720
|
$
|
(14,730
|
)
|
$
|
13,784
|
|||||||
|
December 31, 2016 Student receivable allowance
|
$
|
14,074
|
$
|
14,592
|
$
|
(13,872
|
)
|
$
|
14,794
|
|||||||
|
December 31, 2015 Student receivable allowance
|
$
|
14,849
|
$
|
13,583
|
$
|
(14,358
|
)
|
$
|
14,074
|
|||||||
|
Exhibit Index
|
|
|
Exhibit
Number
|
Description
|
|
Purchase and Sale Agreement, dated March 14, 2017, between New England Institute of Technology at Palm Beach, Inc. and Tambone Companies, LLC, as amended by First Amendment to Purchase and Sale Agreement dated as of April 18, 2017, and as further amended by Second Amendment to Purchase and Sale Agreement dated as of May 12, 2017 (1).
|
|
|
Amended and Restated Certificate of Incorporation of the Company (2).
|
|
|
By-laws of the Company (3).
|
|
|
Management Stockholders Agreement, dated as of January 1, 2002, by and among Lincoln Technical Institute, Inc., Back to School Acquisition, L.L.C. and the Stockholders and other holders of options under the Management Stock Option Plan listed therein (4).
|
|
|
Assumption Agreement and First Amendment to Management Stockholders Agreement, dated as of December 20, 2007, by and among Lincoln Educational Services Corporation, Lincoln Technical Institute, Inc., Back to School Acquisition, L.L.C. and the Management Investors parties therein (5).
|
|
|
Registration Rights Agreement, dated as of June 27, 2005, between the Company and Back to School Acquisition, L.L.C. (3).
|
|
|
Specimen Stock Certificate evidencing shares of common stock (6).
|
|
|
Credit Agreement, dated as of July 31, 2015, among Lincoln Educational Services Corporation and its wholly-owned subsidiaries, the Lenders and Collateral Agents party thereto, and HPF Service, LLC, as Administrative Agent (7).
|
|
|
First Amendment to Credit Agreement, dated as of December 31, 2015, among Lincoln Educational Services Corporation and its wholly-owned subsidiaries, the Lenders and Collateral Agents party thereto, and HPF Service, LLC, as Administrative Agent (8).
|
|
|
Second Amendment to Credit Agreement, dated as of February 29, 2016, among Lincoln Educational Services Corporation and its wholly-owned subsidiaries, the Lenders party thereto, and HPF Service, LLC, as Administrative Agent and Tranche A Collateral Agent (9).
|
|
|
Credit Agreement, dated as of April 12, 2016, among the Company, Lincoln Technical Institute, Inc. and its subsidiaries, and Sterling National Bank (10).
|
|
|
Credit Agreement, dated as of March 31, 2017, among the Company, Lincoln Technical Institute, Inc. and its subsidiaries, and Sterling National Bank (11).
|
|
|
Credit Agreement, dated as of April 28, 2017, among the Company, Lincoln Technical Institute, Inc. and its subsidiaries, and Sterling National Bank (12).
|
|
|
First Amendment to Credit Agreement, dated as of November 29, 2017, among the Company, Lincoln Technical Institute, Inc. and its subsidiaries, and Sterling National Bank (13)
|
|
|
Second Amendment to Credit Agreement, dated as of February 23, 2018, among the Company, Lincoln Technical Institute, Inc. and its subsidiaries, and Sterling National Bank (26)
|
|
|
Purchase and Sale Agreement, dated as of July 1, 2016, between New England Institute of Technology at Palm Beach, Inc. and School Property Development Metrocentre, LLC (14).
|
|
|
Employment Agreement, dated as of August 23, 2016, between the Company and Scott M. Shaw (15)
|
|
|
Employment Agreement, dated as of November 8, 2017, between the Company and Scott M. Shaw (16).
|
|
|
Separation and Release Agreement, dated as of January 15, 2016, between the Company and Kenneth M. Swisstack (17).
|
|
|
Employment Agreement, dated as of August 23, 2016, between the Company and Brian K. Meyers (15).
|
|
|
Employment Agreement, dated as of November 8, 2017, between the Company and Brian K. Meyers (16).
|
|
|
Change in Control Agreement, dated August 31, 2016, between the Company and Deborah Ramentol (18).
|
|
|
Separation and Release Agreement, dated as of January 24, 2018, between the Company and Deborah Ramentol (19).
|
|
|
Change in Control Agreement, dated as of November 8, 2017, between the Company and Deborah Ramentol (20).
|
|
|
Lincoln Educational Services Corporation Amended and Restated 2005 Long-Term Incentive Plan (21).
|
|
|
Lincoln Educational Services Corporation Amended and Restated 2005 Non-Employee Directors Restricted Stock Plan (22).
|
|
|
Lincoln Educational Services Corporation 2005 Deferred Compensation Plan (4).
|
|
|
Lincoln Technical Institute Management Stock Option Plan, effective January 1, 2002 (4).
|
|
|
Form of Stock Option Agreement, dated January 1, 2002, between Lincoln Technical Institute, Inc. and certain participants (4).
|
|
|
Form of Stock Option Agreement under our 2005 Long-Term Incentive Plan (23).
|
|
|
Form of Restricted Stock Agreement under our 2005 Long-Term Incentive Plan (24).
|
|
|
Form of Performance-Based Restricted Stock Award Agreement under our Amended & Restated 2005 Long-Term Incentive Plan (25).
|
|
|
Management Stock Subscription Agreement, dated January 1, 2002, among Lincoln Technical Institute, Inc. and certain management investors (4).
|
|
|
Subsidiaries of the Company.
|
|
|
Consent of Independent Registered Public Accounting Firm.
|
|
|
Power of Attorney (included on the Signatures page of this Form 10-K).
|
|
|
Certification of Chief Executive Officer pursuant to Section 302 of the Sarbanes-Oxley Act of 2002.
|
|
|
Certification of Chief Financial Officer pursuant to Section 302 of the Sarbanes-Oxley Act of 2002.
|
|
|
Certification of Chief Executive Officer and Chief Financial Officer pursuant to 18 U.S.C. 1350, as adopted pursuant to Section 906 of the Sarbanes-Oxley Act of 2002.
|
|
|
101**
|
The following financial statements from Lincoln Educational Services Corporation’s Annual Report on Form 10-K for the year ended December 31, 2017, formatted in XBRL: (i) Consolidated Statements of Operations, (ii) Consolidated Balance Sheets, (iii) Consolidated Statements of Cash Flows, (iv) Consolidated Statements of Comprehensive (Loss) Income, (v) Consolidated Statement of Changes in Stockholders’ Equity and (vi) the Notes to Consolidated Financial Statements, tagged as blocks of text and in detail.
|
| (1) |
Incorporated by reference to the Company’s Form 8-K filed August 16, 2017.
|
| (2) |
Incorporated by reference to the Company’s Registration Statement on Form S-1/A (Registration No. 333-123644) filed June 7, 2005.
|
| (3) |
Incorporated by reference to the Company’s Form 8-K filed June 28, 2005.
|
| (4) |
Incorporated by reference to the Company’s Registration Statement on Form S-1 (Registration No. 333-123644) filed March 29, 2005.
|
| (5) |
Incorporated by reference to the Company’s Registration Statement on Form S-3 (Registration No. 333-148406) filed December 28, 2007.
|
| (6) |
Incorporated by reference to the Company’s Registration Statement on Form S-1/A (Registration No. 333-123644) filed June 21, 2005.
|
| (7) |
Incorporated by reference to the Company’s Form 8-K filed August 5, 2015.
|
| (8) |
Incorporated by reference to the Company’s Form 8-K filed January 7, 2016.
|
| (9) |
Incorporated by reference to the Company’s Form 8-K filed March 4, 2016.
|
| (10) |
Incorporated by reference to the Company’s Form 8-K filed April 18, 2016.
|
| (11) |
Incorporated by reference to the Company’s Form 8-K filed April 6, 2017.
|
| (12) |
Incorporated by reference to the Company’s Form 8-K filed May 4, 2017.
|
| (13) |
Incorporated by reference to the Company’s Form 8-K filed December 1, 2017.
|
| (14) |
Incorporated by reference to the Company’s Quarterly Report on Form 10-Q filed August 9, 2016.
|
| (15) |
Incorporated by reference to the Company’s Form 8-K filed August 25, 2016.
|
| (16) |
Incorporated by reference to the Company’s Quarterly Report on Form 10-Q filed November 13, 2017.
|
| (17) |
Incorporated by reference to the Company’s Form 8-K filed January 22, 2016.
|
| (18) |
Incorporated by reference to the Company’s Annual Report on Form 10-K filed March 10, 2017.
|
| (19) |
Incorporated by reference to the Company’s Form 8-K filed January 26, 2018.
|
| (20) |
Incorporated by reference to the Company’s Quarterly Report on Form 10-Q filed November 13, 2017.
|
| (21) |
Incorporated by reference to the Company’s Form 8-K filed May 6, 2013.
|
| (22) |
Incorporated by reference to the Company’s Registration Statement on Form S-8 (Registration No. 333-211213) filed May 6, 2016.
|
| (23) |
Incorporated by reference to the Company’s Annual Report on Form 10-K for the year ended December 31, 2007.
|
| (24) |
Incorporated by reference to the Company’s Annual Report on Form 10-K for the year ended December 31, 2012.
|
| (25) |
Incorporated by reference to the Company’s Form 8-K filed May 5, 2011.
|
| (26) |
Incorporated by reference to the Company’s Form 8-K filed February 26, 2018.
|
| * |
Filed herewith.
|
| ** |
As provided in Rule 406T of Regulation S-T, this information is furnished and not filed for purposes of Sections 11 and 12 of the Securities Act of 1933 and Section 18 of the Securities Exchange Act of 1934
|
TABLE OF CONTENTS
Part IItem 1. BusinessItem 1A. Risk FactorsItem 1B. Unresolved Staff CommentsItem 2. PropertiesItem 3. Legal ProceedingsItem 4. Mine Safety DisclosuresPart IIItem 5. Market For Registrant S Common Equity, Related Stockholder Matters and Issuer Purchases Of Equity SecuritiesItem 6. Selected Financial DataItem 7. Management's Discussion and Analysis Of Financial Condition and Results Of OperationsItem 7A. Quantitative and Qualitative Disclosures About Market RiskItem 8. Financial Statements and Supplementary DataItem 9. Changes in and Disagreements with Accountants on Accounting and Financial DisclosureItem 9A. Controls and ProceduresItem 9B. Other InformationPart IIIItem 10. Directors, Executive Officers and Corporate GovernanceItem 11. Executive CompensationItem 12. Security Ownership Of Certain Beneficial Owners and Management and Related Stockholder MattersItem 13. Certain Relationships and Related Transactions, and Director IndependenceItem 14. Principal Accounting Fees and ServicesPart IVItem 15. Exhibits and Financial Statement Schedule