LIVANOVA PLC
10-Ks and 10-Qs
|
|
|
|
|
|
|
|
|
|
|
|
|
|
|
|
|
|
|
|
|
|
|
|
|
|
|
|
|
|
|
|
|
|
|
|
|
|
UNITED STATES
SECURITIES AND EXCHANGE COMMISSION
Washington, D.C. 20549
_____________________
Form 10-K
|
(Mark One)
|
|
|
þ
|
ANNUAL REPORT PURSUANT TO SECTION 13 OR 15(d)
OF THE SECURITIES EXCHANGE ACT OF 1934
|
|
|
|
|
|
For the year ended December 31, 2018
|
|
or
|
|
|
¨
|
TRANSITION REPORT PURSUANT TO SECTION 13 OR 15(d)
OF THE SECURITIES EXCHANGE ACT OF 1934
|
Commission file number: 001-37599

LivaNova PLC
(Exact name of registrant as specified in its charter)
|
|
|
|
England and Wales
|
98-1268150
|
|
(State or other jurisdiction of
incorporation or organization)
|
(I.R.S. Employer
Identification No.)
|
20 Eastbourne Terrace
London, United Kingdom
W2 6LG
(Address of principal executive offices)
(Zip Code)
Registrant’s telephone number, including area code:
44 (0) 20 3325 0660
____________________
Securities registered pursuant to Section 12(b) of the Act:
|
|
|
|
|
Title of Each Class of Stock
|
|
Name of Each Exchange on Which Registered
|
|
Ordinary Shares — £1.00 par value per share
|
|
NASDAQ Global Market
|
Securities registered pursuant to Section 12(g) of the Act: None
_______________________________
Indicate by check mark if the registrant is a well-known seasoned issuer, as defined in Rule 405 of the Securities Act. Yes
þ
No
¨
Indicate by check mark if the registrant is not required to file reports pursuant to Section 13 or Section 15(d) of the Act. Yes
¨
No
þ
Indicate by check mark whether the registrant (1) has filed all reports required to be filed by Section 13 or 15(d) of the Securities Exchange Act of 1934 during the preceding 12 months (or for such shorter period that the registrant was required to file such reports), and (2) has been subject to such filing requirements for the past 90 days. Yes
þ
No
¨
Indicate by check mark whether the registrant has submitted electronically every Interactive Data File required to be submitted pursuant to Rule 405 of Regulation S-T (§232.405 of this chapter) during the preceding 12 months (or for such shorter period that the registrant was required to submit such files). Yes
þ
No
¨
Indicate by check mark if disclosure of delinquent filers pursuant to Item 405 of Regulation S-K (§229.405 of this chapter) is not contained herein, and will not be contained, to the best of registrant’s knowledge, in definitive proxy or information statements incorporated by reference in Part III of this Form 10-K or any amendment to this Form 10-K.
¨
Indicate by check mark whether the registrant is a large accelerated filer, an accelerated filer, a non-accelerated filer, a smaller reporting company, or emerging growth company. See the definitions of “large accelerated filer,” “accelerated filer,” “smaller reporting company,” and “emerging growth company” in Rule 12b-2 of the Exchange Act.
|
Large accelerated filer
|
þ
|
Accelerated filer
|
¨
|
|
Non-accelerated filer
|
¨
|
Smaller reporting company
|
¨
|
|
Emerging growth company
|
¨
|
||
1
If an emerging growth company, indicate by check mark if the registrant has elected not to use the extended transition period for complying with any new or revised financial accounting standards provided pursuant to Section 13(a) of the Exchange Act.
¨
Indicate by check mark whether the registrant is a shell company (as defined in Rule 12b-2 of the Act). Yes
¨
No
þ
The aggregate market value of the voting and non-voting common equity held by non-affiliates of the registrant as of
June 30, 2018
, the last business day of the most recently completed second fiscal quarter, based upon the last sales price reported for such dates on the NASDAQ Global Market was approximately
$4.8 billion
. For purposes of this disclosure, ordinary shares held by persons who hold more than 5% of the outstanding ordinary shares and shares held by executive officers and directors of the registrant have been excluded as such persons may be deemed to be affiliates.
As of
March 14, 2019
,
48,282,993
ordinary shares were outstanding.
DOCUMENTS INCORPORATED BY REFERENCE
Portions of the definitive proxy statement of LivaNova PLC for the
2019 Annual General Meeting of Shareholders
, which will be filed within 120 days of
December 31, 2018
, are incorporated by reference into Part III of this Annual Report on Form 10-K.
2
LIVANOVA PLC
TABLE OF CONTENTS
|
|
PART I
|
PAGE NO.
|
|
|
PART II
|
|
|
|
PART III
|
|
|
|
PART IV
|
|
In this Annual Report on Form 10-K, “LivaNova,” “the Company,” “we,” “us” and “our” refer to LivaNova PLC and its consolidated subsidiaries.
This report may contain references to our proprietary intellectual property, including among others:
|
•
|
Trademarks for our VNS therapy systems, the VNS Therapy
®
System, the VITARIA
®
System and our proprietary pulse generator products: Model 102 (Pulse
®
), Model 102R (Pulse Duo
®
), Model 103 (Demipulse
®
), Model 104 (Demipulse Duo
®
), Model 105 (AspireHC
®
), Model 106 (AspireSR
®
) and Model 1000 (SenTiva
®
).
|
|
•
|
Trademarks for our Cardiopulmonary product systems: S5
®
heart-lung machine, S3
®
heart-lung machine, Inspire™, Heartlink™, XTRA
®
Autotransfusion System, 3T Heater-Cooler
®
Connect™ and Revolution
®
.
|
|
•
|
Trademarks for our line of surgical tissue and mechanical valve replacements and repair products: Mitroflow
®
, Crown PRT
®
, Solo Smart™, Perceval
®
, Top Hat
®
, Reduced Series Aortic Valves™, Carbomedics
®
Carbo-Seal
®
, Carbo-Seal Valsalva
®
, Carbomedics
®
Standard™, Orbis™ and Optiform
®
, MEMO 3D
®
, MEMO 3D
®
Rechord™, MEMO 4D
®
, MEMO 4D
®
ReChord™, AnnuloFlo
®
, AnnuloFlex
®
, Bicarbon Slimline™, Bicarbon Filtline™ and Bicarbon Overline
®
.
|
These trademarks and trade names are the property of LivaNova or the property of our consolidated subsidiaries and are protected under applicable intellectual property laws. Solely for convenience, our trademarks and tradenames referred to in this Annual Report on Form 10-K may appear without the
®
or ™ symbols, but such references are not intended to indicate in any way that we will not assert, to the fullest extent under applicable law, our rights to these trademarks and tradenames.
________________________________________
3
CAUTIONARY STATEMENT ABOUT FORWARD-LOOKING STATEMENTS
Certain statements in this Annual Report on Form 10-K, other than purely historical information, are “forward-looking statements” within the meaning of the Private Securities Litigation Reform Act of 1995, Section 27A of the Securities Act of 1933, as amended (the “Securities Act”) and Section 21E of the Securities Exchange Act of 1934, as amended (the “Exchange Act”). These statements include, but are not limited, to LivaNova’s plans, objectives, strategies, financial performance and outlook, trends, the amount and timing of future cash distributions, prospects or future events and involve known and unknown risks that are difficult to predict. As a result, our actual financial results, performance, achievements or prospects may differ materially from those expressed or implied by these forward-looking statements. In some cases, you can identify forward-looking statements by the use of words such as “may,” “could,” “seek,” “guidance,” “predict,” “potential,” “likely,” “believe,” “will,” “should,” “expect,” “anticipate,” “estimate,” “plan,” “intend,” “forecast,” “foresee” or variations of these terms and similar expressions, or the negative of these terms or similar expressions. Such forward-looking statements are necessarily based on estimates and assumptions that, while considered reasonable by LivaNova and its management based on their knowledge and understanding of the business and industry, are inherently uncertain. These statements are not guarantees of future performance, and stockholders should not place undue reliance on forward-looking statements. There are a number of risks, uncertainties and other important factors, many of which are beyond our control, that could cause our actual results to differ materially from the forward-looking statements contained in this Annual Report on Form 10-K. Such risks, uncertainties and other important factors include, among others: the risks, uncertainties and factors set forth in the “Risk Factors” section of this Annual Report on Form 10-K, previous or future Quarterly Reports on Form 10-Q and Annual or Transitional Reports on Form 10-K as well as other documents that we have filed or will file with the SEC; business and financial risks inherent to the industries in which we operate; our ability to hire and retain key personnel; our ability to attract new customers and retain existing customers in the manner anticipated; our reliance on and integration of information technology systems; changes in legislation or governmental regulations affecting us; changes relating to competitive factors in the industries in which we operate; international, national or local economic, social or political conditions that could adversely affect us, our partners or our customers; conditions in the credit markets; our inability to meet expectations regarding the timing, completion and accounting of tax treatments; reductions in customer spending, a slowdown in customer payments and changes in customer demand for products and services; our international operations, which are subject to the risks of currency fluctuations and foreign exchange controls; and the potential of international unrest, economic downturn or effects of currencies, tax assessments, tax adjustments, anticipated tax rates, raw material costs or availability, benefit or retirement plan costs or other regulatory compliance costs.
These factors are not necessarily all of the important factors that could cause our actual financial results, performance, achievements or prospects to differ materially from those expressed in or implied by any of our forward-looking statements. Other unknown or unpredictable factors also could harm our results. All forward-looking statements attributable to us or persons acting on our behalf are expressly qualified in their entirety by the cautionary statements set forth above. Forward-looking statements speak only as of the date they are made, and we do not undertake or assume any obligation to update publicly any of these forward-looking statements to reflect actual results, new information or future events, changes in assumptions or changes in other factors affecting forward-looking statements, except to the extent required by applicable laws. If we update one or more forward-looking statements, no inference should be drawn that we will make additional updates with respect to those or other forward-looking statements.
The following discussion and analysis should be read in conjunction with and are qualified in their entirety by reference to the discussions included in “Item 1A. Risk Factors,” “Item 7. Management’s Discussion and Analysis of Financial Condition and Results of Operations” and elsewhere in this Annual Report on Form 10-K.
4
PART I
Item 1.
Business
Description of the Business and Background
LivaNova PLC, headquartered in London, (collectively with its subsidiaries, the “Company,” “LivaNova,” “we” or “our”), is a global medical device company focused on the development and delivery of important therapeutic solutions for the benefit of patients, healthcare professionals and healthcare systems throughout the world. Working closely with our global team of medical professionals in the fields of cardiovascular disease and neuromodulation, we design, develop, manufacture and sell innovative therapeutic solutions that are consistent with our mission to improve our patients’ quality of life, increase the skills and capabilities of healthcare professionals and minimize healthcare costs.
We were organized under the laws of England and Wales on February 20, 2015 for the purpose of facilitating the business combination of Cyberonics, Inc., a Delaware corporation, and Sorin S.p.A., a joint stock company organized under the laws of Italy. The business combination became effective in October 2015. LivaNova’s ordinary shares are listed for trading on the NASDAQ Global Market under the symbol “LIVN.”
Business Franchises
LivaNova is comprised of two principal business franchises, which are also our reportable segments: Cardiovascular (“CV”) and Neuromodulation (“NM”), corresponding to our primary therapeutic areas. Other corporate activities include corporate shared service expenses for finance, legal, human resources, information technology and New Ventures. New Ventures is focused on new growth platforms and identification of other opportunities for expansion.
For further information regarding our business segments, historical financial information and our methodology for the presentation of financial results, please refer to “Item 15. Exhibits, Financial Statement Schedules” of this Annual Report on Form 10-K.
Cardiovascular
Our CV business franchise is engaged in the development, production and sale of cardiopulmonary products, heart valves and advanced circulatory support products. Cardiopulmonary products include oxygenators, heart-lung machines, autotransfusion systems, perfusion tubing systems, cannulae and other related accessories. Heart valves include mechanical heart valves, tissue heart valves and related repair products. Advanced circulatory support, which represents our recently acquired TandemLife (“TandemLife”) business, includes temporary life support product kits that can include a combination of pumps, oxygenators and cannulae.
Cardiopulmonary Products
During conventional coronary artery bypass graft procedures and heart valve surgery, the patient’s heart is temporarily stopped, or arrested. The patient is placed on an extracorporeal circulatory support system that temporarily functions as the patient’s heart and lungs and provides blood flow to the body. Our products include systems to enable cardiopulmonary bypass, including heart-lung machines, oxygenators, perfusion tubing sets, cannulae and accessories, as well as related equipment and disposables for autotransfusion and autologous blood washing for neonatal, pediatric and adult patients. Our primary cardiopulmonary products include:
Heart-lung machines
. The heart-lung machine product group includes heart-lung machines, heater coolers, related cardiac surgery equipment and maintenance services.
Oxygenators and perfusion tubing systems
. The oxygenators product group, which includes oxygenators and other disposable devices for extracorporeal circulation, includes the Inspire systems. The Inspire range of products, comprised of 12 models, provides perfusionists with a customizable approach for the benefit of patients.
Autotransfusion systems
. One of the key elements for a complete blood management strategy is autologous blood transfusion, which involves the collection, processing and reinfusion of the patient’s own blood lost at the surgical site during the perioperative period.
Cannulae
. Our cannulae product family, part of the oxygenator product group, is used to connect the extracorporeal circulation to the heart of the patient during cardiac surgery.
Connect
. Connect is our perfusion charting system. Focused on real time and retrospective calculations and trending tools, Connect assists perfusionists with data management during and after cardiopulmonary bypass.
5
Heart Valves and Repair Products
We offer a comprehensive line of products to treat a variety of heart valve disorders, including a complete line of surgical tissue and mechanical valve replacements and repair products for damaged or diseased heart valves. Our heart valves and repair product offerings include:
Self-anchoring tissue heart valves
. Perceval is our sutureless bioprosthetic device designed to replace a diseased native valve or a malfunctioning prosthetic aortic valve using either traditional or minimally invasive heart surgery techniques. Perceval incorporates a unique technology that allows 100% sutureless positioning and anchoring at the implantation site. This, in turn, offers the potential benefit of reducing the time the patient spends in cardiopulmonary bypass.
Tissue heart valves
. Our tissue valves include the Mitroflow aortic pericardial tissue valve with phospholipid reduction treatment (“PRT”), which is designed to mitigate valve calcification, and the Crown PRT and Solo Smart aortic pericardial tissue valves. Our Solo Smart aortic pericardial tissue valve is an innovative, completely biological aortic heart valve with no synthetic material and a removable stent. Solo Smart provides the ease of implantation of a stented valve with the hemodynamic performance of a stentless valve.
Mechanical heart valves
. Our wide range of mechanical valve offerings includes the Carbomedics Standard, Top Hat and Reduced Series Aortic Valves, as well as the Carbomedics Carbo-Seal and Carbo-Seal Valsalva aortic prostheses. We also offer the Carbomedics Standard, Orbis and Optiform mechanical mitral valves and Bicarbon Slimline, Bicarbon Fitline and Bicarbon Overline aortic and mitral valves.
Heart valve repair products
. Mitral valve repair is a well-established solution for patients suffering from a leaky mitral valve, or mitral valve regurgitation (“MR”). We offer a wide range of mitral valve repair products, including the Memo 3D and Memo 3D ReChord, AnnuloFlo and AnnuloFlex.
Advanced Circulatory Support Products
Our recently acquired TandemLife business simplifies temporary extracorporeal cardiopulmonary life support solutions for critically ill patients. Temporary life support kits can include a combination of pumps, oxygenators and cannulae.
Neuromodulation
Our NM business franchise designs, develops and markets NM-based medical devices for the treatment of epilepsy, depression and obstructive sleep apnea. We are also focused on the development and clinical testing of the VITARIA System for treating heart failure through vagus nerve stimulation (“VNS”).
Our seminal NM product, the VNS Therapy System, is an implantable device authorized for the treatment of drug-resistant epilepsy and treatment-resistant depression (“TRD”). The VNS Therapy System consists of: an implantable pulse generator and connective lead that work to stimulate the vagus nerve; surgical equipment to assist with the implant procedure; equipment and instruction manuals enabling a treating physician to set parameters for a patient’s pulse generator; and for epilepsy, magnets to manually suspend or induce nerve stimulation. The VNS Therapy pulse generator and lead are surgically implanted in a subcutaneous pocket in the upper left chest area, generally during an out-patient procedure; the lead, which does not need to be removed to replace a generator with a depleted battery, is connected to the pulse generator and tunneled under the skin to the vagus nerve in the lower left side of the patient’s neck.
Epilepsy
Globally, there are several broad types of treatment available to patients with epilepsy: multiple seizure medications; various forms of the ketogenic diet; vagus nerve stimulation; resective brain surgery; trigeminal nerve stimulation; responsive intracranial neurostimulation; and deep brain stimulation. Seizure medications typically serve as a first-line treatment and are prescribed for virtually all patients diagnosed with epilepsy. After two seizure medications fail to deliver seizure control, the epilepsy is defined as drug-resistant, at which point, adjunctive non-drug options are considered, including VNS therapy, brain surgery and a ketogenic diet.
Our VNS Therapy System was the first medical device treatment approved by the U.S. Food and Drug Administration (“FDA”) in 1997 for refractory, drug-resistant epilepsy in adults and adolescents over 12 years of age and is indicated for use as an adjunctive therapy in reducing the frequency of seizures. In June 2017, the FDA approved our VNS Therapy device for use in patients who are at least four years of age and have partial onset seizures that are refractory to antiepileptic medications. In addition, in June 2017, we received FDA approval, and in August 2017, we received CE Mark approval, for our VNS Therapy device for expanded magnetic resonance imaging (“MRI”) labeling affirming VNS Therapy as the only epilepsy device approved by the FDA for MRI scans. Currently, SenTiva, AspireHC and AspireSR models of VNS Therapy technology provide
6
for this expanded MRI access. Other worldwide regulatory bodies have also approved the VNS Therapy System for the treatment of epilepsy, many without age restrictions or seizure-type limitations.
We sell a number of VNS Therapy System product models for the treatment of epilepsy, including our Model 102 (Pulse), Model 102R (Pulse Duo), Model 103 (Demipulse), Model 104 (Demipulse Duo), Model 105 (AspireHC) and Model 106 (AspireSR) and the Model 1000 (SenTiva) pulse generators. Our AspireSR generator provides the benefits of VNS Therapy, with an additional feature: automatic stimulation in response to detection of changes in heart rate potentially indicative of a seizure. The SenTiva generator is the smallest and lightest device capable of delivering responsive therapy for epilepsy.
Depression
In July 2005, the FDA approved the VNS Therapy System for the adjunctive treatment of chronic or recurrent depression for patients 18 years or older who are experiencing a major depressive episode and have not had an adequate response to four or more antidepressant treatments. In May 2007, the United States (“U.S.”) Centers for Medicare and Medicaid Services (“CMS”) issued a national determination of non-coverage within the U.S. with respect to reimbursement of the VNS Therapy System for patients with TRD, significantly limiting access to this therapeutic option for most patients. In May 2018, CMS published a tracking sheet to reconsider its National Coverage Determination (“NCD”) of our VNS Therapy System for TRD in response to a letter that we submitted to CMS requesting a formal reconsideration of the NCD. We requested this review after a significant body of new evidence emerged about TRD and the role of VNS Therapy in its treatment. On February 15, 2019, we announced that CMS finalized its NCD to expand Medicare coverage for VNS Therapy for TRD. With the decision, CMS initiated coverage for Medicare beneficiaries through Coverage with Evidence Development when offered in a CMS-approved, double-blind, randomized, placebo-controlled trial with a follow-up duration of at least one year, with the possibility of extending the study to a prospective longitudinal study. We intend to commence a clinical study that meet these requirements. Enrollment will likely begin in the third quarter of 2019 and could take as long as 18 months to enroll approximately 500 patients.
Obstructive Sleep Apnea
In January 2018, we acquired ImThera Medical, Inc. (“ImThera”), a privately held emerging-growth company developing an implantable neurostimulation device system for the treatment of obstructive sleep apnea. The NM product line now includes ImThera’s implantable device for the treatment of obstructive sleep apnea that stimulates multiple tongue muscles via the hypoglossal nerve, which opens the airway while a patient is sleeping. ImThera has a commercial presence in the European market, and an FDA pivotal study is ongoing in the U.S.
Corporate Activities and New Ventures
Corporate activities include shared services for finance, legal, human resources and information technology and New Ventures. The New Ventures group evaluates growth opportunities and new potential areas of investment to expand our product portfolio to meet emerging patient needs.
Discontinued Operations
We completed the sale of our Cardiac Rhythm Management (“CRM”) business franchise to MicroPort Cardiac Rhythm B.V. and MicroPort Scientific Corporation (the “CRM Sale”) on April 30, 2018. We previously concluded that the sale of CRM represents a strategic shift in our business that will have a major effect on future operations and financial results. Accordingly, the results of operations of the CRM business franchise are reflected as discontinued operations for all periods presented in this Annual Report on Form 10-K and related assets and liabilities are presented as held for sale at December 31, 2017. For further information, refer to “
Note 5. Discontinued Operations
”
in our consolidated financial statements and accompanying notes, beginning on page F-1 of this Annual Report on Form 10-K.
Research and Development (“R&D”)
The markets in which we participate are subject to rapid technological advances. Product improvement and innovation are necessary to maintain market leadership. Our R&D efforts are directed toward maintaining or achieving technological leadership in each of the markets we serve to help ensure that patients using our devices and therapies receive the most advanced and effective treatment possible. We remain committed to developing technological enhancements and new uses for existing products and less invasive and new technologies for new and emerging markets to address unmet patient needs. That commitment leads us to initiate and participate in many clinical trials each year as the demand for clinical and economic evidence remains high. We also expect our development activities to help reduce patient care costs and the length of hospital stays in the future.
Approximately 16% of our employees work in R&D improving existing products and therapies, expanding their uses and applications and developing new products. We continue to focus on optimizing innovation and assessing the ability of our R&D
7
programs to deliver economic value to the customer. More specifically, our current R&D expenses consist of product design and development efforts, clinical study programs and regulatory activities, which are essential to our strategic portfolio initiatives, including transcatheter mitral valve replacement (“TMVR”), TRD and heart failure.
Acquisitions and Investments
Our strategy of providing a broad range of therapies requires a wide variety of technologies, products and capabilities. The rapid pace of technological development in the medical industry and the specialized expertise required in different areas of medicine make it difficult for one company alone to develop a broad portfolio of technological solutions. In addition to internally generated growth through R&D efforts, we have historically relied, and expect to continue to rely, on acquisitions, investments and alliances to provide access to new technologies in both new and existing markets.
We expect to further our strategic objectives and strengthen our existing businesses by making future acquisitions or investments in areas that we believe we can acquire or stimulate the development of new technologies and products. Mergers and acquisitions of medical technology companies are inherently risky, and no assurance can be given that any of our previous or future acquisitions will be successful or will not materially adversely affect our consolidated operations, financial condition and/or cash flows.
Caisson
Interventional, LLC (“Caisson”)
In May 2017, we acquired the remaining
51%
equity interest in Caisson, a clinical-stage medical device company focused on the design, development and clinical evaluation of a novel TMVR implant device. The device is designed for treating MR through replacement of the native mitral valve using a fully transvenous delivery system.
ImThera
In January 2018, we acquired the remaining 86% outstanding interest in ImThera; we previously held
14%
of ImThera’s outstanding equity. ImThera is focused on neurostimulation for the treatment of obstructive sleep apnea. ImThera manufactures an implantable device that stimulates multiple tongue muscles via the hypoglossal nerve, which opens the airway while a patient is sleeping. The financial results of ImThera are included within NM.
TandemLife
In April 2018, we acquired CardiacAssist, Inc., doing business as TandemLife. TandemLife is focused on the delivery of leading-edge temporary life support systems, including cardiopulmonary and respiratory support solutions. The financial results of TandemLife are included within CV.
Patents and Licenses
We rely on a combination of patents, trademarks, copyrights, trade secrets, and non-disclosure and non-competition agreements to protect our intellectual property. We generally file patent applications in the U.S. and countries where patent protection for our technology is appropriate and available.
As of December 31, 2018
, we held more than 1,200 issued patents worldwide, with approximately 250 pending patent applications that cover various aspects of our technology. Patents typically have a 20-year term from the application filing date. In addition, we hold exclusive and non-exclusive licenses to a variety of third-party technologies covered by patents and pending patent applications. There can be no assurance that pending patent applications will result in the issuance of patents, that patents issued to or licensed by us will not be challenged or circumvented by competitors, or that these patents will be found to be valid or sufficiently broad to protect our technology or to provide us with a competitive advantage. We have also obtained certain trademarks and trade names for our products and maintain certain details about our processes, products and strategies as trade secrets. In the aggregate, these intellectual property assets are considered to be of material importance to our business segments and operations. We regularly review third-party patents and patent applications in an effort to protect our intellectual property and avoid disputes over proprietary rights.
We rely on non-disclosure and non-competition agreements with employees, consultants and other parties to protect, in part, trade secrets and other proprietary technology. There can be no assurance that these agreements will not be breached, that we will have adequate remedies for any breach, that others will not independently develop equivalent proprietary information or that third parties will not otherwise gain access to our trade secrets and proprietary knowledge.
For additional information, please refer to “Item 1A. Risk Factors” of this Annual Report on Form 10-K, under the section entitled “
We are substantially dependent on patent and other proprietary rights and failing to protect such rights or to be successful in litigation related to our rights or the rights of others may result in our payment of significant monetary damages and/or royalty payments, negatively impact our ability to sell current or future products, or prohibit us from enforcing our patent and other proprietary rights against others.
”
8
Markets and Distribution Methods
The three largest markets for our medical devices are
the U.S.
,
Europe
and
Japan
. Emerging markets are an area of increasing focus and opportunity for us. We sell most of our medical devices through direct sales representatives in the U.S. and a combination of direct sales representatives and independent distributors in markets outside the U.S.
Our marketing and sales strategy is focused on rapid, cost-effective delivery of high-quality products to a diverse group of customers worldwide, including perfusionists, neurologists, neurosurgeons and other physicians, hospitals and other medical institutions and healthcare providers. To achieve this objective, we maintain a highly knowledgeable and dedicated sales staff that is able to foster strong relationships with such a broad range of customers. We maintain excellent working relationships with professionals in the medical industry, which provides us with a detailed understanding of therapeutic and diagnostic developments, trends and emerging opportunities, enabling us to respond quickly to the changing needs of providers and patients. We actively participate in medical meetings and conduct comprehensive training and educational activities in an effort to enhance our presence in the medical community, and we believe that these activities also contribute to healthcare professionals’ expertise.
Due to the emphasis on cost-effectiveness in healthcare delivery, the current trend among hospitals and other medical device customers is to consolidate into larger purchasing groups in order to enhance purchasing power. As a result, customer transactions have become increasingly complex. Enhanced purchasing power may also lead to pressure on pricing and an increase in the use of preferred vendors. Our customer base continues to evolve to reflect such economic changes across the geographic markets we serve.
Competition and Industry
We compete in the medical device market in more than
5,000
hospitals in more than
100
countries. This market is characterized by rapid change resulting from technological advances and scientific discoveries. Our competitors across our product portfolio range from large manufacturers with multiple business lines to small manufacturers offering a limited selection of specialized products. In addition, we face competition from providers of alternative medical therapies, such as pharmaceutical companies and providers of cannabis.
Product problems, physician advisories, safety alerts and publications about our products can cause major shifts in industry market share, reflecting the importance of product quality, product efficacy and quality systems in the medical device industry. In addition, because of developments in managed care, economically motivated customers, consolidation among healthcare providers, increased competition and declining reimbursement rates, we may be increasingly required to compete on the basis of price. In order to continue to compete effectively, we must continue to create or acquire advanced technology, incorporate this technology into proprietary products, obtain regulatory approvals in a timely manner, maintain high-quality manufacturing processes and successfully market these products.
Cardiovascular
Our primary medical device competitors in the CV product group are Terumo Medical Corporation, Maquet Medical Systems, Medtronic plc, Haemonetics Corporation, Edwards Lifesciences Corp. and Abbott Laboratories, Inc. (formerly St. Jude Medical, Inc.), although not all competitors are present in all product lines.
Neuromodulation
Our primary medical device competitors in the NM product group are NeuroPace, Inc. and Medtronic plc.
Production, Quality Systems and Raw Materials
We manufacture a majority of our products at
nine
manufacturing facilities located in Italy, Germany, the U.S., Canada, Brazil and Australia. We purchase raw materials and many of the components used in our manufacturing facilities from numerous suppliers in various countries. For quality assurance, sole source availability or cost effectiveness purposes, we may procure certain components and raw materials from a sole supplier. We work closely with our suppliers to ensure continuity of supply while maintaining high quality and reliability. The quality systems we utilize in the design, production, warehousing and distribution of our products are designed to ensure that our products are safe and effective. In addition, we utilize environmental management systems and safety programs to protect the environment and our employees. For additional information related to our manufacturing facilities, refer to “Item 2. Properties” in this Annual Report on Form 10-K.
Government Regulation and Other Considerations
Our medical devices are subject to regulation by numerous government agencies, including the FDA and counterpart agencies outside the U.S. To varying degrees, each of these agencies require us to comply with laws and regulations governing
9
the research, development, testing, manufacturing, labeling, pre-market clearance or approval, marketing, distribution, advertising, promotion, record keeping, reporting, tracking, and importing and exporting of medical devices. Our business is also affected by patient privacy and security laws, cost containment initiatives, and environmental health and safety laws and regulations worldwide.
The laws applicable to us are subject to changing and evolving interpretations. If a governmental authority were to conclude that we are not in compliance with applicable laws and regulations, we and our officers and employees could be subject to severe civil and criminal penalties, including substantial fines and damages, and exclusion from participation as a supplier of product to beneficiaries covered by government programs, among other potential enforcement actions.
Product Approval and Monitoring
Many countries where we sell medical devices subject such medical devices and technologies to their own approval and other regulatory requirements regarding performance, safety and quality of our products. The following provides a brief overview of the oversight and requirements to which we are subject for the commercial distribution of our products in the U.S., Europe and Japan, the largest markets for our medical devices.
Each medical device we seek to distribute commercially in the U.S. must receive 510(k) clearance or pre-market approval (“PMA”) from the FDA, unless specifically exempted by the agency. The first, known as pre-market notification or the 510(k) process, requires us to demonstrate that our new medical device is substantially equivalent to a legally marketed medical device. The second, and more rigorous PMA process, requires us to independently demonstrate that a medical device is safe and effective for its intended use. The PMA process is generally much more time-consuming and expensive than the 510(k) process. One or more clinical studies may be required to support a 510(k) application and are almost always required to support a PMA application.
In the European Union (“EU”), a single regulatory approval process exists, and conformity with the legal requirements is represented by the CE Mark. To obtain a CE Mark, defined products must meet minimum standards of performance, safety and quality (i.e., the essential requirements), and then, according to their classification, comply with one or more of a selection of conformity assessment routes. To demonstrate compliance with the essential requirements, we must undergo a conformity assessment procedure, which varies according to the type of medical device and its classification. As a general rule, demonstration of conformity of medical devices and their manufacturers with the essential requirements must be based, among other things, on the evaluation of clinical data supporting the safety and performance of the products during normal conditions of use. The competent authorities of the EU countries separately regulate the clinical research for medical devices and the market surveillance of products once they are placed on the market and manufacturers with CE marked devices are subject to regular inspections to monitor compliance with the applicable directives and essential requirements. A new Medical Device Regulation (“Reg MDR”) was published by the EU in 2017, which will impose significant additional premarket and postmarket requirements. The regulation has a three-year implementation period. At the end of this transition period, national competent authorities and manufacturers must implement and ensure compliance with the changes enacted in Reg MDR. Among other things, this new regulation imposes additional reporting requirements on manufacturers of high-risk medical devices and provides for more strict clinical evidence requirements. We have initiated activities to ensure compliance with Reg MDR in the applicable timeframe.
To be sold in Japan, our medical devices must undergo thorough safety examinations and demonstrate medical efficacy before they are granted approval. The Japanese government, through the ministry of Health, Labour and Welfare, regulates medical devices under the Pharmaceutical Affairs Law (“PAL”). Penalties for a company’s noncompliance with PAL can be severe, including revocation or suspension of a company’s business license and criminal sanctions. Japanese regulatory bodies also assess the quality management systems of the manufacturer and product conformity to the requirements of PAL. We are subject to compliance investigations by these agencies.
Many countries in which we sell our products (outside of the U.S., the EU and Japan) have their own regulatory requirements for medical devices. Most of these countries require that product approvals be recertified on a regular basis, generally every four to five years. The recertification process requires that we evaluate any device changes and any new regulations or standards relevant to the device and, where needed, conduct appropriate testing to document continued compliance. Where recertification applications are required, they must be approved in order to continue selling our products in those countries.
The global regulatory environment is increasingly stringent and unpredictable. Several countries that did not have regulatory requirements for medical devices have established such requirements in recent years, and other countries have expanded, or plan to expand, their existing regulations. While harmonization of global regulations has been pursued, requirements continue to differ significantly among countries. We expect this global regulatory environment will continue to evolve, which could
10
impact the cost, the time needed to approve, and ultimately, our ability to maintain existing approvals or obtain future approvals for our products.
Promotional Restrictions
Both before and after we release a product for commercial distribution, we have ongoing responsibilities under various laws and regulations governing medical devices. Regulations of the FDA and other regulatory agencies in and outside the U.S. impose extensive compliance and monitoring obligations on our business. These agencies review our design and manufacturing practices, labeling, record keeping, and manufacturers’ required reports of adverse experiences and other information to identify potential problems with marketed medical devices. We are also subject to periodic inspections for compliance with applicable quality system regulations, which govern the methods used in, and the facilities and controls used for, the design, manufacture, packaging and servicing of finished medical devices intended for human use. In addition to FDA regulatory requirements, the FDA and other U.S. regulatory bodies (including the Federal Trade Commission, the Office of the Inspector General of the Department of Health and Human Services, the Department of Justice and various state Attorneys General) monitor the manner in which we promote and advertise our products. Although physicians are permitted to use their medical judgment to employ medical devices for indications other than those cleared or approved by the FDA, we are prohibited from promoting products for such “off-label” uses and can only market our products for cleared or approved uses.
Any adverse regulatory action, depending on its magnitude, may limit our ability to effectively market and sell our products, limit our ability to obtain future premarket approvals or result in a substantial modification to our business practices and operations. For additional information, see "Item 1A. Risk Factors" of this Annual Report on Form 10-K, under the section entitled “
We are subject to costly and complex laws and governmental regulations and any adverse regulatory action may materially adversely affect our financial condition and business operations.
”
Governmental Trade Regulations
The sale and shipment of our products and services across international borders, as well as the purchase of components and products from international sources, subjects us to extensive governmental trade regulations. A variety of laws and regulations apply to the sale, shipment and provision of goods, services and technology across international borders. Many countries control the export and re-export of goods, technology and services for public health, national security, regional stability, antiterrorism and other reasons. Some governments may also impose economic sanctions against certain countries, persons or entities. In certain circumstances, governmental authorities may require that we obtain an approval before we export or re-export goods, technology or services to certain destinations, to certain end-users and for certain end-uses. Because we are subject to extensive regulations in the countries in which we operate, we are subject to the risk that laws and regulations could change in a way that would expose us to additional costs, penalties or liabilities. These laws and regulations govern, among other things, our import and export activities.
We also sell and provide goods, technology and services to agents, representatives and distributors who may export such items to customers and end-users, and if these third parties violate applicable export control and economic sanctions laws and regulations when engaging in transactions involving our products, we may be subject to varying degrees of liability depending on the extent of our participation in the transaction. The activities of these third parties may cause disruption or delays in the distribution and sales of our products or result in restrictions being placed on our international distribution and sales of products, which may materially impact our business activities.
Patient Privacy and Security Laws
We are subject to various laws worldwide that protect the confidentiality of certain patient health information, including patient medical records, and restrict the use and disclosure of patient health information by healthcare providers. Privacy standards in Europe and Asia are becoming increasingly strict, enforcement action and financial penalties related to privacy in the EU are growing, and new laws and restrictions are being passed. The management of cross-border transfers of information among and outside of EU member countries is becoming more complex, which may complicate our clinical research activities, as well as product offerings that involve transmission or use of clinical data. We will continue our efforts to comply with those requirements and to adapt our business processes to those standards.
In the U.S., the Health Insurance Portability and Accountability Act of 1996 (“HIPAA”), as amended by the Health Information Technology and Clinical Health Act (“HITECH”) and their respective implementing regulations impose specified requirements relating to the privacy, security and transmission of individually identifiable health information. Among other things, HITECH makes HIPAA’s privacy and security standards directly applicable to “business associates,” defined as independent contractors or agents of covered entities that create, receive, maintain or transmit protected health information in connection with providing a service for or on behalf of a covered entity. We may be deemed to operate as a business associate to covered entities in a limited number of instances. In those cases, the patient data that we receive may include protected
11
health information, as defined under HIPAA. Enforcement actions can be costly and interrupt regular operations of our business. In addition, state laws govern the privacy and security of health information in certain circumstances, many of which differ from each other in significant ways, thus complicating compliance efforts.
In the EU, Regulation 2016/679 on the protection of natural persons with regard to the processing of personal data and on the free movement of such data (“General Data Protection Regulation” or “GDPR”) came into effect in May 2018. The GDPR replaces Directive 95/46/EC (“Data Protection Directive”). While many of the principles of the GDPR reflect those of the Data Protection Directive, for example in relation to the requirements relating to the privacy, security and transmission of individually identifiable health information, there are a number of changes. In particular: (1) proactive compliance measures are introduced, such as the requirement to carry out a Privacy Impact Assessment and to appoint a Data Protection Officer where health data is processed on a “large scale.” Although “large scale” is not defined, it is likely that clinical trials involving substantial numbers of patients (or healthy volunteers if applicable) would mean that such requirements apply to us; and (2) the administrative fines that can be levied are significantly increased, the maximum being the higher of €20 million (approximately
$22.9 million
), or 4%, of the total worldwide annual turnover of the group in the previous financial year.
Cost Containment Initiatives
Government and private sector initiatives to limit the growth of healthcare costs, including price regulation, competitive pricing, bidding and tender mechanics, coverage and payment policies, comparative effectiveness of therapies, technology assessments and managed-care arrangements are continuing in many countries where we do business. These changes are causing the marketplace to put increased emphasis on the delivery of more cost-effective medical devices and therapies. Government programs, private healthcare insurance and managed-care plans have attempted to control costs by limiting the extent of coverage or amount of reimbursement available for particular procedures or treatments, tying reimbursement to outcomes, shifting to population health management, and other mechanisms designed to constrain utilization and contain costs. Hospitals, which purchase implants, are also seeking to reduce costs through a variety of mechanisms, including, for example, creating centralized purchasing functions that set pricing and, in some cases, limit the number of vendors that can participate in the purchasing program. Hospitals are also aligning their interests with those of physicians through employment and other arrangements, such as gainsharing, whereby a hospital agrees with physicians to share certain realized cost savings resulting from the physicians’ collective change in practice patterns, such as standardization of devices where medically appropriate, and participation in affordable care organizations. Such alignment has created increasing levels of price sensitivity among customers for our products.
Some third-party payers must also approve coverage and set reimbursement levels for new or innovative devices or therapies before they will reimburse healthcare providers who use the medical devices or therapies. Even though a new medical device may be cleared for commercial distribution, we may find limited demand for the device until coverage and sufficient reimbursement levels have been obtained from governmental and private third-party payers. In addition, some private third-party payers require that certain procedures or the use of certain products be authorized in advance as a condition of coverage.
For example, in the U.S., the Patient Protection and Affordable Care Act, as amended by the Health Care and Education Reconciliation Act (collectively, the “Affordable Care Act”), has the potential to substantially change healthcare financing and delivery by both governmental and private insurers, and significantly impact the pharmaceutical and medical device industries. The Affordable Care Act imposed, among other things, an annual excise tax of 2.3% on any entity that manufactures or imports medical devices offered for sale in the U.S. Due to subsequent legislative amendments, the excise tax has been suspended for the period January 1, 2016 to December 31, 2019, and, absent further legislative action, will be reinstated starting January 1, 2020.
International examples of cost containment initiatives and healthcare reforms in markets significant to our business include Japan, where the government reviews reimbursement rate benchmarks every two years. Such reviews may significantly reduce reimbursement for procedures using our medical devices or result in the denial of coverage for those procedures. As a result of our manufacturing efficiencies, cost controls and other cost-savings initiatives, we believe we are well-positioned to respond to changes resulting from this worldwide trend toward cost containment; however, uncertainty remains as to the nature of any future legislation or other reforms, making it difficult for us to predict the potential impact of cost-containment trends on future operating results.
Applicability of Anti-Corruption Laws and Regulations
Our worldwide business is subject to the U.S. Foreign Corrupt Practices Act of 1977 (the “FCPA”), the United Kingdom (the “UK”) Bribery Act of 2010 (the “UK Bribery Act”) and other anti-corruption laws and regulations applicable in the jurisdictions where we operate. The FCPA can be used to prosecute companies in the U.S. for arrangements with physicians or other parties outside the U.S. if the physician or party is a government official of another country and prohibited payments are
12
made to obtain or retain business. The UK Bribery Act prohibits both domestic and international bribery, as well as bribery across both public and private sectors. There are similar laws and regulations applicable to us outside the U.S. and the UK, all of which are subject to evolving interpretations. For additional information, please refer to “Item 1A. Risk Factors” of this Annual Report on Form 10-K, under the section entitled “
The failure to comply with anti-bribery laws could materially adversely affect our business and result in civil and/or criminal sanctions.
”
Health Care Fraud and Abuse Laws
We are also subject to U.S. federal and state government healthcare regulation and enforcement and government regulations in other countries in which we conduct our business.
The U.S. Anti-Kickback Statute (the “Anti-Kickback Statute”) is subject to evolving interpretations. In the past, the U.S. government has enforced the Anti-Kickback Statute to reach large settlements with healthcare companies based on sham consulting and other financial arrangements with physicians. The majority of states in the U.S. also have anti-kickback laws with similar prohibitions, and in some cases may apply to items or services reimbursed by any third-party payor, including commercial insurers.
Additionally, violations of the U.S. False Claims Act (the “False Claims Act”) can result in significant monetary penalties and treble damages. The federal government is using the False Claims Act, and the accompanying threat of significant financial liability, in its investigation and prosecution of device and biotechnology companies throughout the U.S., for example, in connection with the promotion of products for unapproved uses and other sales and marketing practices. The U.S. government has obtained multi-million and multi-billion-dollar settlements under the False Claims Act, in addition to individual criminal convictions under applicable criminal statutes. Given the significant size of actual and potential settlements, we anticipate that the U.S. government will continue to devote substantial resources to investigating healthcare providers’ and manufacturers’ compliance with applicable fraud and abuse laws.
HIPAA includes federal criminal statutes that prohibit, among other actions, knowingly and willfully executing, or attempting to execute, a scheme to defraud any healthcare benefit program, including private third-party payors; knowingly and willfully embezzling or stealing from a healthcare benefit program; willfully obstructing a criminal investigation of a healthcare offense; and knowingly and willfully falsifying, concealing or covering up a material fact or making any materially false, fictitious or fraudulent statement in connection with the delivery of or payment for healthcare benefits, items or services. Similar to the federal Anti-Kickback Statute, a person or entity does not need to have actual knowledge of the statute or specific intent to violate it in order to have committed a violation.
There has also been a recent trend of increased federal and state regulation of payments made to physicians and other healthcare providers. The Affordable Care Act, among other things, imposes additional reporting requirements on certain device manufacturers for payments made by them to physicians and teaching hospitals, as well as ownership and investment interests held by physicians and their immediate family members. Failure to submit required information may result in civil monetary penalties of up to an aggregate of $150,000 per year (or up to an aggregate of $1 million per year for “knowing failures”), for all payments, transfers of value, or ownership or investment interests that are not timely, accurately and completely reported in an annual submission. Device manufacturers must submit reports to the government by the 90th day of each calendar year. Certain states also mandate implementation of compliance programs, impose restrictions on device manufacturer marketing practices and/or require the tracking and reporting of gifts, compensation and other remuneration to physicians.
The shifting commercial compliance environment and the need to build and maintain robust systems to comply with different compliance and/or reporting requirements in multiple jurisdictions increase the possibility that a healthcare company may violate one or more of the requirements. If our operations are found to be in violation of any of such laws or any other governmental regulations that apply to it, we may be subject to penalties, including, without limitation, civil and criminal penalties, damages, fines, the curtailment or restructuring of our operations, and exclusion from participation in federal and state healthcare programs, any of which could adversely affect our ability to operate our business and our financial results.
Environmental Health and Safety Laws
We are also subject to various environmental health and safety laws and regulations worldwide. Like other medical device companies, our manufacturing and other operations involve the use and transportation of substances regulated under environmental health and safety laws including those related to the transportation of hazardous materials. To the best of our knowledge at this time, we do not expect that compliance with environmental protection laws will have a material impact on our consolidated results of operations, financial position or cash flows.
13
Working Capital Practices
Our goal is to carry sufficient levels of inventory to ensure adequate supply of raw materials from suppliers and meet the product delivery needs of our customers. To meet the operational demands of our customers, we also provide payment terms to customers in the normal course of business and rights to return product under warranty.
Disclosure Pursuant to Section 13(r) of the Exchange Act of 1934
Section 13(r) of the Exchange Act requires issuers to disclose in their annual reports certain types of dealings with Iran, including transactions or dealing with government-owned entities, even when those activities are lawful and do not involve U.S. persons. LivaNova has sold medical devices to Iran since we were formed in 2015. Two of our non-U.S. subsidiaries currently sell medical devices, including cardiac surgery and cardiopulmonary products, to privately held distributors in Iran.
We have limited visibility into the identity of these distributors’ customers in Iran. It is possible that their customers include entities, such as government-owned hospitals or sub-distributors, that are owned or controlled directly or indirectly by the Iranian government. To the best of our knowledge at this time, we do not have any contracts or commercial arrangements with the Iranian government.
For the year ended December 31, 2018, our gross revenues and net profits attributable to the above-mentioned Iranian activities were
$10.3 million
and
$3.7 million
, respectively.
We believe our activities are consistent with applicable law, including U.S., EU, and other applicable sanctions laws, though such laws are complex and continue to evolve rapidly. We intend to continue our business in Iran.
Employees
As of December 31, 2018
, we employed approximately
4,000
employees worldwide. Our employees are vital to our success, and we are engaged in an ongoing effort to identify, hire, manage and maintain the talent necessary to meet our business objectives. We believe that we have been successful in attracting and retaining qualified personnel in a highly competitive labor market due, in large part, to our competitive compensation and benefits and our rewarding work environment, fostering employee professional training and development and providing employees with opportunities to contribute to our continued growth and success.
Seasonality
For both of our segments, the number of medical procedures incorporating our products is generally lower during the summer months, particularly in European countries, due to summer vacation schedules.
Available Information
Our executive headquarters are located at 20 Eastbourne Terrace, London, UK W2 6LG. Our website address is
www.livanova.com.
We make available free of charge on or through our website our Proxy Statements on Schedule 14A, Annual Reports on Form 10-K, Quarterly Reports on Form 10-Q, Current Reports on Form 8-K, amendments to those reports filed or furnished pursuant to Section 13(a) or 15(d) of the Exchange Act, and reports relating to beneficial ownership of our securities filed or furnished pursuant to Section 16 of the Exchange Act, as soon as reasonably practicable after electronically filing such material with the SEC. Our website also contains the charters for each standing committee of our Board of Directors and our Code of Business Conduct and Ethics.
We may from time to time provide important disclosures to investors by posting them in the Investor Relations section of our website, as allowed by SEC rules. Information on our website is not incorporated into this Annual Report on Form 10-K.
The SEC also maintains a website at www.sec.gov that contains reports, proxy statements and other information about
SEC registrants, including LivaNova.
14
Item 1A.
Risk Factors
Our business and assets are subject to varying degrees of risk and uncertainty. An investor should carefully consider the risks described below, as well as other information contained in this Annual Report on Form 10-K and in our other filings with the SEC. Based on the information currently known to us, we believe the following information identifies the most significant risk factors affecting us, but the below risks and uncertainties are not the only ones related to our businesses and are not necessarily listed in the order of their significance. Additional risks and uncertainties not presently known to us or that we currently believe to be immaterial may also adversely affect our business.
Industry and Market Risks
Global healthcare policy changes, including U.S. healthcare reform legislation, may have a material adverse effect on us.
In response to perceived increases in healthcare costs, there have been and continue to be proposals by governments, regulators and third-party payers to control these costs. The adoption of some or all of these proposals could have a material adverse effect on our financial position and results of operations. These proposals have resulted in efforts to enact U.S. healthcare system reforms that may lead to pricing restrictions, limits on the amounts of reimbursement available for our products and could limit the acceptance and use of our products.
In the U.S., the federal government enacted legislation, including the Affordable Care Act, to overhaul the nation’s healthcare system. Among other things, the Affordable Care Act:
|
•
|
imposes an annual excise tax of 2.3% on any entity that manufactures or imports medical devices offered for sale in the U.S. Due to subsequent legislative amendments, the excise tax has been suspended for the period January 1, 2016 to December 31, 2019, and absent further legislative action, will be reinstated starting January 1, 2020; and
|
|
•
|
implements payment system reforms including a national pilot program on payment bundling to encourage hospitals, physicians and other providers to improve the coordination, quality and efficiency of certain healthcare services through bundled payment models.
|
The Affordable Care Act also focuses on a number of Medicare provisions aimed at decreasing costs. It is uncertain at this point what unintended consequences these provisions will have on patient access to new technologies. The Medicare provisions include value-based payment programs, increased funding of comparative effectiveness research, reduced hospital payments for avoidable readmissions and hospital-acquired conditions, and pilot programs to evaluate alternative payment methodologies that promote care coordination (such as bundled physician and hospital payments). Additionally, the law includes a reduction in the annual rate of inflation for hospitals and the establishment of an independent payment advisory board to recommend ways of reducing the rate of growth in Medicare spending beginning in 2014. We cannot predict what healthcare programs and regulations will be implemented at the global level or the U.S. federal or state level, or the effect of any future legislation or regulation; however, any changes that lower reimbursement for our products or reduce medical procedure volumes could adversely affect our business and results of operations.
We may be unable to obtain and maintain adequate third-party reimbursement for products, which could have a significant negative impact on our future operating results.
Our ability to commercialize our products is dependent, in large part, on whether third-party payors, including private healthcare insurers, managed care plans, governmental programs and others agree to cover the costs and services associated with our products and related procedures in the U.S. and internationally.
Our products are purchased principally by healthcare providers that typically bill various third-party payors, such as governmental programs (e.g., Medicare and Medicaid in the U.S.) and private insurance plans for the healthcare services provided to their patients. The ability of customers to obtain appropriate reimbursement for their services and the products they provide is critical to the success of medical technology companies. The availability of adequate reimbursement affects the decision as to which procedures are performed, which products are purchased and what prices customers are willing to pay. After we develop a promising new product, we may find limited demand for the product if reimbursement approval is not obtained from private and governmental third-party payors. In addition, periodic changes to reimbursement methodologies could have an adverse impact on our business.
Outside the U.S., reimbursement systems vary significantly by country. Many non-U.S. markets have government-managed healthcare systems that govern reimbursement for medical devices and procedures. Additionally, some non-U.S. reimbursement systems provide for limited payments in a given period and, as a consequence, result in extended payment periods. If adequate levels of reimbursement from third‑party payors outside of the U.S. are not obtained, international sales of our products may decline.
15
We are also subject to risks relating to changes in government and private medical reimbursement programs and policies, and changes in legal regulatory requirements in the U.S. and around the world. Implementation of further legislative or administrative reforms to these reimbursement systems, or adverse decisions relating to coverage of or reimbursement for our products by administrators of these systems, could have an impact on the acceptance of and demand for our products and the prices that our customers are willing to pay for them.
Our failure to comply with rules relating to reimbursement of healthcare goods and services, healthcare fraud and abuse, false claims and other applicable laws or regulations may subject us to penalties and adversely impact our reputation and business operations.
Our devices and therapies are subject to regulation by various governmental agencies worldwide responsible for coverage, reimbursement and regulation of healthcare goods and services. Our devices, products and therapies are purchased principally by hospitals or physicians that typically bill various third-party payers, such as governmental programs (e.g., Medicare, Medicaid and comparable non-U.S. programs), private insurance plans and managed care plans, for the healthcare services provided to their patients. The ability of our customers to obtain appropriate reimbursement for products and services from third-party payers is critical because it affects which products customers purchase and the prices they are willing to pay. As a result, our devices, products and therapies are subject to regulation regarding quality and cost by various U.S. federal entities, as well as comparable state and non-U.S. agencies responsible for reimbursement and regulation of health care goods and services, including laws and regulations related to kickbacks, false claims, self-referrals and health care fraud. Many states have similar laws that apply to reimbursement by state Medicaid and other funded programs as well as in some cases to all payers. In certain circumstances, insurance companies can attempt to bring a private cause of action against a manufacturer for causing a false claim to be filed under the U.S. Racketeer Influenced and Corrupt Organizations Act. In addition, as a manufacturer of FDA-approved devices reimbursable by federal healthcare programs, we are subject to the Physician Payments Sunshine Act, which requires us to annually report certain payments and other transfers of value we make to U.S.-licensed physicians or U.S. teaching hospitals. Any failure to comply with these laws and regulations could subject us or our officers and employees to criminal and civil financial penalties.
The risk of being found in violation of these laws is increased by the fact that many of them have not been fully interpreted by the regulatory authorities or the courts, and their provisions are open to a variety of interpretations. Because of the breadth of these laws and the narrowness of the statutory exceptions and safe harbors available under such laws, it is possible that some of our business activities, including our relationships with surgeons and other healthcare providers, some of whom recommend, purchase and/or prescribe our devices, group purchasing organizations and our independent sales agents and distributors, could be subject to challenge under one or more of such laws.
The success and continuing development of our products depend on maintaining strong relationships with physicians and healthcare professionals.
If we fail to maintain our working relationships with physicians and other healthcare professionals, our products may not be developed and marketed in line with the needs and expectations of the professionals who use and support our products. Physicians assist us as researchers, marketing consultants, product consultants, inventors and public speakers, and we rely on these professionals to provide us with considerable knowledge and experience. If we are unable to maintain these strong relationships, the development and marketing of our products could suffer, which could have a material adverse effect on our consolidated financial condition and results of operations.
Inadequate funding for U.S. federal government agencies and government shutdowns could negatively affect our business, results of operations and financial condition.
The ability of the FDA to review and approve new products can be affected by a variety of factors, including government budget and funding levels, ability to hire and retain key personnel, government shutdowns and statutory, regulatory and policy changes. Disruptions at the FDA and in other U.S. federal agencies may slow the time necessary for new medical devices to be reviewed and/or approved which would adversely affect our business.
In addition, a portion of our revenue is dependent on U.S. federal government healthcare program reimbursement. Any disruption in U.S. federal government operations, including government shutdowns, could have a material adverse effect on our business, results of operations and financial condition.
Patient confidentiality and federal and state privacy and security laws and regulations in the U.S. and around the world may adversely impact our financial position and reputation.
HIPAA establishes federal rules protecting the privacy and security of personal health information. In addition to HIPAA, virtually every U.S. state has enacted laws to safeguard privacy, and these laws vary significantly from state to state and change frequently. The privacy and security rules address the use and disclosure of individual healthcare information and the rights of
16
patients to understand and control how such information is used and disclosed. The operation of our business involves the collection and use of substantial amounts of “protected health information.” If we fail to comply with the applicable regulations, we could suffer civil penalties up to or exceeding $50,000 per violation, with a maximum of $1.5 million for multiple violations of an identical requirement during a calendar year and criminal penalties with fines up to $250,000 and potential imprisonment.
The EU’s GDPR, in force since May 2018, protects the privacy and security of “personally identifiable information” and personal health information relating to individuals within the EU and, like HIPAA, GDPR addresses the use and disclosure of individual healthcare information and the rights of patients to understand and control how such information is used and disclosed. It subjects us to a rigorous proactive compliance scheme and if we fail to comply with the GDPR we could be sued for compensation by individuals who have suffered material or non-material damage and could suffer administrative fines up to the higher of
€20.0 million
(approximately
$22.9 million
), or 4%, of the total worldwide annual revenue of the group in the previous financial year. We may also be subject to criminal sanctions.
We are subject to costly and complex laws and governmental regulations and any adverse regulatory action may materially adversely affect our financial condition and business operations.
Our medical devices and technologies, as well as our business activities, are subject to a complex set of regulations and rigorous enforcement, including by the FDA, U.S. Department of Justice, Health and Human Services - Office of the Inspector General, and numerous other federal, state, and non-U.S. governmental authorities. To varying degrees, each of these agencies requires us to comply with laws and regulations governing the development, testing, manufacturing, labeling, marketing and distribution of our products. As a part of the regulatory process of obtaining marketing clearance for new products and new indications for existing products, we conduct and participate in numerous clinical trials with a variety of study designs, patient populations, and trial endpoints. Unfavorable or inconsistent clinical data from existing or future clinical trials or the market’s or FDA’s perception of this clinical data, may adversely impact our ability to obtain product approvals, our position in, and share of, the markets in which we participate, and our business, financial condition, results of operations and cash flows. We cannot guarantee that we will be able to obtain or maintain marketing clearance for our new products or enhancements or modifications to existing products, and the failure to maintain approvals or obtain approval or clearance could have a material adverse effect on our business, results of operations, financial condition and cash flows. Even if we are able to obtain approval or clearance, it may:
|
•
|
take a significant amount of time;
|
|
•
|
require the expenditure of substantial resources;
|
|
•
|
involve stringent clinical and pre-clinical testing, as well as increased post-market surveillance; and
|
|
•
|
involve modifications, repairs or replacements of our products, and limit the proposed uses of our products.
|
Both before and after a product is commercially released, we have ongoing responsibilities under FDA and other applicable non-U.S. government agency regulations. For instance, many of our facilities and procedures and those of our suppliers are also subject to periodic inspections by the FDA to determine compliance with applicable regulations. The results of these inspections can include inspectional observations on FDA’s Form-483, warning letters, or other forms of enforcement. If the FDA were to conclude that we are not in compliance with applicable laws or regulations, or that any of our medical products are ineffective or pose an unreasonable health risk, the FDA could ban such medical products, detain or seize adulterated or misbranded medical products, order a recall, repair, replacement, or refund of such products, refuse to grant pending PMA applications or require certificates of non-U.S governments for exports, and/or require us to notify health professionals and others that the devices present unreasonable risks of substantial harm to the public health. The FDA and other non-U.S. government agencies may also assess civil or criminal penalties against us, our officers or employees and impose operating restrictions on a company-wide basis. The FDA may also recommend prosecution to the U.S. Department of Justice. Any adverse regulatory action, depending on its magnitude, may restrict us from effectively marketing and selling our products and limit our ability to obtain future pre-market clearances or PMAs, and could result in a substantial modification to our business practices and operations. These potential consequences, as well as any adverse outcome from government investigations, could have a material adverse effect on our business, results of operations, financial condition, and cash flows.
In addition, in the U.S. device manufacturers are prohibited from promoting their products other than for the uses and indications set forth in the approved product labeling, and any failure to comply could subject us to significant civil or criminal exposure, administrative obligations and costs, and/or other potential penalties from, and/or agreements with, the federal government.
Governmental regulations outside the U.S. have, and may continue to, become increasingly stringent and common. In the EU, for example, Reg MDR, when it enters into full force in 2020, will include significant additional premarket and post-
17
market requirements. Penalties for regulatory non-compliance could be severe, including fines and revocation or suspension of a company’s business license, mandatory price reductions and criminal sanctions. Future laws and regulations may also have a material adverse effect on us.
Modifications to our marketed products may require new clearances or approvals, and may require us to cease marketing or recall the modified products until required clearances or approvals are obtained.
An element of our strategy is to continue to upgrade our products, add new features and expand clearance or approval of our current products to new indications. We have made modifications to our products in the past and may make additional modifications in the future that we believe do not or will not require additional clearances or approvals. No assurance can be given that regulators will agree with any of our decisions not to seek clearance or approval.
If regulators require us to cease marketing and to recall a modified device until we obtain a new clearance or approval, our business, financial condition, operating results and future growth prospects could be materially adversely affected. Any recall requirement that we seek additional clearances or approvals could result in significant delays, fines, increased costs associated with modification of a product, loss of revenue and potential operating restrictions imposed by regulators.
If our marketed medical devices are defective or otherwise pose safety risks, the FDA and similar non-U.S. governmental authorities could require their recall, or we may initiate a recall of our products voluntarily.
The FDA and similar non-U.S. governmental authorities may require the recall of commercialized products in the event of material deficiencies or defects in design or manufacture or in the event that a product poses an unacceptable risk to health. Manufacturers, on their own initiative, may recall a product with material deficiency. We have initiated voluntary product recalls in the past. A future recall announcement could harm our reputation with customers and negatively affect our revenue.
A government-mandated recall or voluntary recall by us or one of our sales agencies could occur as a result of an unacceptable risk to health, component failures, manufacturing errors, design or labeling defects or other deficiencies or issues. Recalls of any of our products would divert managerial and financial resources and have an adverse effect on our financial condition and operating results. Any recall could impair our ability to produce our products in a cost-effective and timely manner. We also may be required to bear other costs or take other actions that may have a negative impact on our future revenue and our ability to generate profits. In the future, we may initiate voluntary withdrawal, removal or repair actions that we determine do not require notification as a recall. If the regulating authority disagrees with our determinations, it could require us to report those actions as recalls. In addition, the regulators could take enforcement action for failing to report the recalls when they were conducted.
In addition, depending on the corrective action we take to redress a device’s deficiencies or defects, the regulators may require, or we may decide, that we need to obtain new approvals or clearances for the device before we market or distribute the corrected device. Seeking such approvals or clearances may delay our ability to replace the recalled devices in a timely manner. Moreover, if we do not adequately address problems associated with our devices, we may face additional regulatory enforcement action, including FDA warning letters, product seizure, injunctions, administrative penalties, or civil or criminal fines.
If our products cause or contribute to a death or a serious injury, or malfunction in certain ways, we will be subject to medical device reporting regulations, which can result in voluntary corrective actions or agency enforcement actions.
We are required to report to the FDA any incident in which our products have or may have caused or contributed to a death or serious injury or in which our product malfunctioned and, if the malfunction were to recur, would likely cause or contribute to death or serious injury. If we fail to report these events to the FDA within the required timeframes, or at all, the FDA could take enforcement action against us. Any adverse event involving our products could result in future voluntary corrective actions, such as recalls or customer notifications, or agency action, such as inspection, mandatory recall or other enforcement action. Any corrective action, whether voluntary or involuntary, or litigation, will require the dedication of our time and capital, distract management from operating the business, and may harm our reputation and financial results.
Our products are the subject of clinical studies conducted by us, our competitors, or other third parties, the results of which may be unfavorable, or perceived as unfavorable, and could have a material adverse effect on our business, financial condition, and results of operations.
As a part of the regulatory process of obtaining marketing clearance or approval for new products and modifications to or new indications for existing products, we conduct and participate in numerous clinical studies with a variety of study designs, patient populations, and trial endpoints. Unfavorable or inconsistent clinical data from existing or future clinical studies conducted by us, by our competitors, or by third parties, or the market’s or global regulatory bodies’ perception of this clinical data, may adversely impact our ability to obtain product clearances or approvals, our position in, and share of, the markets in
18
which we participate, and our business, financial condition, and results of operations. Success in pre-clinical testing and early clinical studies does not always ensure that later clinical studies will be successful, and we cannot be sure that later studies will replicate the results of prior studies. Clinical studies must also be conducted in compliance with Good Clinical Practice requirements administered by the FDA and other non-U.S. regulatory authorities, and global regulatory bodies may undertake enforcement action against us based on a failure to adhere to these requirements. Any delay or termination of our clinical studies will delay the filing of product submissions and, ultimately, our ability to commercialize new products or product modifications. It is also possible that patients enrolled in clinical studies will experience adverse side effects that are not currently part of the product’s profile, which could inhibit further marketing and development of such products.
Consolidation in the healthcare industry could have an adverse effect on our revenue and results of operations.
Many healthcare industry companies, including medical device companies, are consolidating to create new companies with greater market power. As the healthcare industry consolidates, competition to provide goods and services to industry participants will become more intense. These industry participants may try to use their market power to negotiate price concessions for medical devices that incorporate components we produce. Increasing pricing pressures as a result of industry consolidation could have an adverse effect on our revenue, results of operations, financial position and cash flows.
The global medical device industry is highly competitive and we may be unable to compete effectively.
We are in highly competitive markets characterized by increasingly complex products that are expensive to develop and manufacture with significant price competition. In the product lines in which we compete, we face a mixture of competitors ranging from large manufacturers with multiple business lines to small manufacturers that offer a limited selection of specialized products. Development by other companies of new or improved products, processes, or technologies, as discussed above, may make our products or proposed products less competitive. In addition, we face competition from providers of alternative medical therapies such as pharmaceutical companies. Competitive factors include:
|
•
|
product quality, reliability and performance;
|
|
•
|
product technology;
|
|
•
|
breadth of product lines and product services;
|
|
•
|
ability to identify new market trends;
|
|
•
|
customer support;
|
|
•
|
price;
|
|
•
|
capacity to recruit engineers, scientists and other qualified employees; and
|
|
•
|
reimbursement approval from governmental payors and private healthcare insurance providers.
|
Shifts in industry market share can occur as a result of product issues, physician advisories, safety alerts, and publications about our products. The importance of product quality, product efficacy, and quality systems in the medical device industry cannot be overstated. In the current environment of managed care, consolidation among healthcare providers, increased competition, and declining reimbursement rates, we are increasingly required to compete on the basis of price. In order to continue to compete effectively, we must continue to create, invest in, or acquire advanced technology, incorporate this technology into our proprietary products, obtain regulatory approvals in a timely manner, and manufacture and successfully market our products. Additionally, we may experience design, manufacturing, marketing or other difficulties that could delay or prevent our development, introduction or marketing of new products or new versions of our existing products. As a result of such difficulties and delays, our development expenses may increase and, as a consequence, our results of operations could suffer.
Operational Risks
The UK’s vote in favor of withdrawing from the EU could lead to increased market volatility and make it more difficult for us to do business in Europe or have other adverse effects on our business.
In June 2016, voters in the UK approved leaving the EU (commonly referred to as “Brexit”). On March 29, 2017, the UK government delivered to the European Council notice of its intention to leave the EU and the effective date of the UK withdrawal from the EU will be March 29, 2019, unless extended by the European Council in agreement with the UK. At the date of this Annual Report on Form 10-K, there is a real possibility that the UK will exit the EU without a withdrawal agreement. If no agreement is reached, there will be a period of considerable uncertainty in the relationship between the UK and the EU. Even if a withdrawal agreement is reached, we anticipate the withdrawal could, among other outcomes, result in the deterioration of economic conditions, volatility in currency exchange rates and increased regulatory complexities.
19
There are many ways in which our business could be affected by this event, only some of which we can identify at this time. Depending on the final terms of Brexit, we could face new regulatory costs and challenges. For instance, the UK could lose access to the single EU market and to the global trade deals negotiated by the EU on behalf of its members which may result in increased trade barriers that could make our doing business worldwide more difficult. A decline in trade could affect the attractiveness of the UK as a global investment center and, as a result, could have a detrimental impact on UK growth. Although we have an international customer base, we could be adversely affected by reduced growth and greater volatility in the UK economy. In addition, currency exchange rates in the Pound Sterling and the Euro with respect to each other and the U.S. dollar have already been adversely affected by Brexit. Should this foreign exchange volatility continue, it could cause volatility in our financial results.
We and several of our wholly-owned subsidiaries that are domiciled either in the UK, various countries in the EU, or in the U.S. are party to intercompany transactions and agreements under which we receive various tax reliefs and exemptions in accordance with applicable international tax laws, treaties and regulations. Material changes in certain treaties applicable to our transactions and agreements, or any other significant changes in the competitive, political, legal, regulatory, reimbursement or economic environment where we conduct international operations may have a material impact on our business and our consolidated financial condition or results of operations.
Cyber-attacks or other disruptions to our information technology systems could lead to reduced revenue, increased costs, liability claims, fines, harm to our competitive position and loss of reputation.
We are increasingly dependent on our own sophisticated information technology systems and those of third parties to operate our business, and certain products of ours include integrated software and information technology. We rely on information technology systems to collect and process customer orders, manage product manufacturing and shipping and support regulatory compliance, and we routinely process, store and transmit large amounts of data, including sensitive personal information, protected health information and confidential business information. Many of our products incorporate software and information technology that allow patients and physicians to be connected and collect data regarding a patient and the therapy he or she is receiving, or that otherwise allow the products or services to operate as intended. The secure processing, maintenance and transmission of this information is critical to our operations but the size and complexity of our products and the information technology systems on which we rely make them vulnerable to cyber-attacks, breakdown, interruptions, destruction, loss or compromise of data, obsolescence or incompatibility among systems or other significant disruptions. Unauthorized persons routinely attempt to access our products or systems in order to disrupt, disable or degrade such products or services, or to obtain proprietary or confidential information. Any such breach could compromise our networks and the information stored there could be accessed, publicly disclosed, lost or stolen. In addition, we continue to grow, in part, through new business acquisitions. As a result of acquisitions, we may face risks due to implementation, modification, or remediation of controls, procedures and policies relating to data privacy and cybersecurity at the acquired company. We continue to consolidate and over time integrate the number of systems we operate, and to upgrade and expand our information system capabilities for stable and secure business operations.
We have programs, processes and technologies in place to attempt to prevent, detect, contain, respond to and mitigate security-related threats and potential incidents. We undertake ongoing improvements to our systems, connected devices and information-sharing products in order to minimize vulnerabilities, in accordance with industry and regulatory standards. The techniques used to obtain unauthorized access change frequently and can be difficult to detect, and because integration from the merger of Sorin and Cyberonics, two global cross-border companies, takes time and entails risks pertaining to the integration of disparate information technology systems, anticipating, identifying or preventing these intrusions or mitigating them if and when they occur is challenging and makes us more vulnerable to cyber-attacks than other companies not similarly situated. There can be no assurance that our process of consolidating, protecting, upgrading and expanding our systems and capabilities, continuing to build security into the design of our products, and developing new systems to keep pace with continuing changes in information processing technology will be successful or that additional systems issues will not arise in the future. Any significant breakdown, intrusion, interruption, corruption or destruction of these systems, as well as any data breaches, could have a material adverse effect on our business.
If we are unable to maintain secure, reliable information technology systems and prevent disruptions, outages, or data breaches, we may suffer regulatory consequences in addition to business consequences. Our worldwide operations mean that we are subject to laws and regulations, including data protection and cyber-security laws and regulations, in many jurisdictions. For example, if we are in breach of the GDPR’s requirement that we ensure a level of security, both in terms of technology and other organizational measures, appropriate to the risk that the confidentiality, integrity or availability of personally identifiable data is compromised, we could be subject to fines and enforcement actions. Despite programs to comply with such laws and regulations, there is no guarantee that we will avoid enforcement actions by governmental bodies. Enforcement actions may be costly and interrupt regular operations of our business. In addition, there is a trend of civil lawsuits and class actions relating to
20
breaches of consumer data or other cyber-attacks. While we have not been named in any such lawsuits, if a substantial breach or loss of data occurs, we could become a target of civil litigation or government enforcement actions.
We are currently involved in litigation that could adversely affect our business and financial results, divert management’s attention from our business, and subject us to significant liabilities.
As described under “
Note 13. Commitments and Contingencies
” in our consolidated financial statements included in this Annual Report on Form 10-K, we are involved in various litigation matters that may adversely affect our financial condition and may require us to devote significant resources to our defense of these claims.
Such litigation involves a class action complaint in the U.S. District Court for the Middle District of Pennsylvania, federal multi-district litigation in the U.S. District Court for the Middle District of Pennsylvania and cases in various state courts and jurisdictions outside the U.S. relating to our 3T heater-cooler product. As of
March 18, 2019
, we are aware of approximately
210
filed and unfiled claims worldwide, with the majority of the claims filed in various federal or state courts throughout the U.S. The complaints generally seek damages and other relief based on theories of strict liability, negligence, breach of express and implied warranties, failure to warn, design and manufacturing defect, fraudulent and negligent misrepresentation/concealment, unjust enrichment and violations of various state consumer protection statutes. In the fourth quarter of the year ended December 31, 2018, we recognized a
$294.0 million
litigation provision related to these claims.
Although we are defending these matters vigorously, we cannot predict with certainty the outcome or effect of any claim or other litigation matter, and there can be no assurance as to the ultimate outcome of any litigation or proceeding. Litigation may have a material adverse effect on us because of potential adverse outcomes, defense costs, the diversion of our management's resources, availability of insurance coverage and loss of reputation.
The failure to comply with anti-bribery laws could materially adversely affect our business and result in civil and/or criminal sanctions.
Our operations are subject to anti-corruption laws, including the UK Bribery Act, FCPA and other anti-corruption laws that apply in countries where we do business. The UK Bribery Act, FCPA and these other laws generally prohibit us and our employees and intermediaries from bribing, being bribed or making other prohibited payments to government officials or other persons to obtain or retain business or gain some other business advantage. Because of the predominance of government-administered healthcare systems in many parts of the world outside the U.S., many of our customer relationships are potentially subject to such laws.
We are, therefore, exposed to the risk that our employees, independent contractors, principal investigators, consultants, vendors, independent sales agents and distributors may engage in fraudulent or other illegal activity in violation of these laws. It is not always possible to identify and deter misconduct by our employees and other third parties, and the precautions we take to detect and prevent this activity may not be effective in controlling unknown or unmanaged risks or losses or in protecting us from governmental investigations or other actions or lawsuits stemming from a failure to be in compliance with such laws or regulations.
Global enforcement of anti-corruption laws has increased substantially in recent years, with more frequent voluntary self-disclosures by companies, aggressive investigations and enforcement proceedings by governmental agencies, and assessment of significant fines and penalties against companies and individuals. In addition, we cannot predict the nature, scope or effect of future regulatory requirements to which our international operations might be subject or the manner in which existing laws might be administered or interpreted. Any alleged or actual violations of these regulations may subject us to government scrutiny, severe criminal or civil sanctions and other liabilities, including exclusion from government contracting or government healthcare programs, and could negatively affect our business, reputation, operating results and financial condition.
Product liability claims could adversely impact our consolidated financial condition and our earnings and impair our reputation.
Our business exposes us to potential product liability risks that are inherent in the design, manufacture and marketing of medical devices. In addition, many of the medical devices we manufacture and sell are designed to be implanted in the human body for long periods of time. Component failures, manufacturing defects, design flaws or inadequate disclosure of product-related risks or product-related information with respect to these or other products we manufacture or sell could result in an unsafe condition or injury to, or death of, a patient. The occurrence of such an event could result in product liability claims or a recall of, or safety alert relating to, one or more of our products. We have elected to self-insure with respect to a significant portion of our product liability risks and also hold global insurance policies to cover a portion of future losses. Product liability claims or product recalls in the future, regardless of their ultimate outcome, could have a material adverse effect on our business and reputation and on our ability to attract and retain customers for our products, and losses from product liability claims in the future could exceed our product liability insurance coverage and lead to a material adverse effect on our financial condition.
21
The amount of potential losses resulting from the 3T heater-cooler litigation is expected to greatly exceed the amount of our product liability insurance coverage and our insurance coverage may also be insufficient to cover future losses.
The amount of potential losses resulting from the 3T heater-cooler litigation matters is likely to greatly exceed the amount of our product liability insurance. In the fourth quarter of the year ended December 31, 2018, we recognized a
$294.0 million
litigation provision related to our 3T heater-cooler litigation as further described under “
Note 13. Commitments and Contingencies
” in our consolidated financial statement in this Annual Report on Form 10-K. Total coverage under our product liability insurance policies is
$32.9 million
, once the self-retention limit of
$11.0 million
is met. To fund the litigation liability provision, on February 25, 2019 we obtained commitment letters from lenders to provide additional aggregate borrowing capacity of
$350 million
, an amount sufficient to cover the litigation liability provision.
If we become subject to any future liability claims, whether related to product liability or other losses, our insurance coverage may not be adequate to cover those claims. Losses from unanticipated claims could have a material adverse impact on our consolidated earnings, financial condition, and/or cash flows.
The recognition of the litigation provision liability raised and future large unanticipated liabilities may also raise substantial doubt about our ability to continue as a going concern.
The recording of a provision and related recognition of the litigation provision liability of
$294.0 million
as of December 31, 2018, represents a condition that raises substantial doubt about our ability to continue as a going concern, as at the date of these financial statements, we do not have sufficient liquidity to meet our current obligations. However, on February 25, 2019, we obtained commitment letters from lenders to provide additional aggregate borrowing capacity of
$350 million
, which when combined with current and anticipated future operating cash flows, alleviates the substantial doubt about our ability to continue as a going concern.
If we become subject to future unanticipated large liability claims that again raise substantial doubt about our ability to continue as a going concern, our reputation, stock price and financial condition may be materially adversely affected.
Quality problems with our processes, goods, and services could harm our reputation for producing high-quality products and erode our competitive advantage, sales, and market share.
Quality is extremely important to us and our customers due to the serious and costly consequences of product failure. Our quality certifications are critical to the marketing success of our goods and services. If we fail to meet these standards, our reputation could be damaged, we could lose customers, and our revenue and results of operations could decline. Aside from specific customer standards, our success depends generally on our ability to manufacture to exact tolerances precision-engineered components, subassemblies, and finished devices from multiple materials. If our components fail to meet these standards or fail to adapt to evolving standards, our reputation as a manufacturer of high-quality components will be harmed, our competitive advantage could be damaged, and we could lose customers and market share.
We are subject to environmental laws and regulations and the risk of environmental liabilities, violations and litigation.
Our operations involve the use of substances regulated under environmental laws, primarily those used in manufacturing and sterilization processes. Certain environmental laws assess liability on current or prior owners or operators of real property for the costs or investigation, removal or remediation of hazardous substance at their properties or at properties on which they have disposed of hazardous substances. In addition, a governmental authority may seek to hold us liable for successor liability violations committed by any companies in which we invest or that we acquire. In addition to cleanup actions brought by governmental authorities, private parties could bring personal injury or other claims due to the presence of, or exposure to, hazardous substances. The ultimate cost of site cleanup and timing or future cash outflows is difficult to predict, given the uncertainties regarding the extent of the required cleanup and the interpretation of applicable laws and regulations. The costs of complying with current or future environmental protection and health and safety laws and regulations, or liabilities arising from past or future releases of, or exposures to, hazardous substances, may exceed our estimates, or have a material adverse effect on our business, results of operations, financial condition and cash flows.
Our R&D efforts rely on investments and investment collaborations, and we cannot guarantee that any previous or future investments or investment collaborations will be successful.
Our strategy to provide a broad range of therapies to restore patients to fuller, healthier lives requires a wide variety of technologies, products and capabilities. The rapid pace of technological development in the medical industry and the specialized expertise required in different areas of medicine make it difficult for one company alone to develop a broad portfolio of technological solutions. As a result, we also rely on investments and investment collaborations to provide us access to new technologies both in areas served by our existing or legacy businesses as well as in new areas.
22
We expect to make future investments where we believe that we can stimulate the development of, or acquire new technologies and products to further our strategic objectives and strengthen our existing businesses. Investments and investment collaborations in and with medical technology companies are inherently risky, and we cannot guarantee that any of our previous or future investments or investment collaborations will be successful or will not materially adversely affect our consolidated earnings, financial condition or cash flows.
We are substantially dependent on patent and other proprietary rights and failing to protect such rights or to be successful in litigation related to our rights or the rights of others may result in our payment of significant monetary damages and/or royalty payments, negatively impact our ability to sell current or future products, or prohibit us from enforcing our patent and other proprietary rights against others.
We rely on a combination of patents, trade secrets, and non-disclosure and non-competition agreements to protect our proprietary intellectual property, and we will continue to do so. Physician customers have historically moved quickly to new products and new technologies, and intellectual property rights, particularly patents and trade secrets, play a significant role in product development and differentiation. We operate in an industry characterized by extensive patent litigation, and intellectual property litigation is inherently complex and unpredictable. Patent litigation can result in significant damage awards and injunctions that could prevent our manufacture and sale of affected products or require us to pay significant royalties in order to continue to manufacture or sell affected products. While we intend to defend against any threats to our intellectual property, these patents, trade secrets, or other agreements may not adequately protect our intellectual property.
Further, pending patent applications may not result in patents being issued to us. Patents issued to or licensed by us in the past or in the future may be challenged or circumvented by competitors and such patents may be found invalid, unenforceable or insufficiently broad to protect our technology and may limit our competitive advantage. Third parties could obtain patents that may require us to negotiate licenses to conduct our business, and the required licenses may not be available on reasonable terms or at all. We also rely on non-disclosure and non-competition agreements with certain employees, consultants and other parties to protect, in part, trade secrets and other proprietary rights. We cannot be certain that these agreements will not be breached, that we will have adequate remedies for any breach, that others will not independently develop substantially equivalent proprietary information, or that third parties will not otherwise gain access to our trade secrets or proprietary knowledge.
The laws of certain countries in which we market some of our products do not protect our intellectual property rights to the same extent as laws in the U.S., which could make it easier for competitors to capture market position in those countries. Competitors also may harm our sales by designing products that mirror the capabilities of our products or technology without infringing our intellectual property rights. If we are unable to protect our intellectual property, it could have a material adverse effect on our business, financial condition, cash flows and reputation.
Risks related to the reduction or interruption in supply and an inability to develop alternative sources for supply may adversely affect our manufacturing operations and related product sales.
We maintain manufacturing operations in
six
countries located throughout the world and purchase many of the components and raw materials used in manufacturing these products from numerous suppliers in various countries. Any problem affecting a supplier (whether due to external or internal causes) could have a negative impact on us.
In a few limited cases, specific components and raw materials are purchased from primary or main suppliers (or in some cases, a single supplier) for reasons related to quality assurance, cost-effectiveness ratio and availability. While we work closely with our suppliers to ensure supply continuity, we cannot guarantee that our efforts will always be successful. Moreover, due to strict standards and regulations governing the manufacture and marketing of our products, we may not be able to quickly locate new supply sources in response to a supply reduction or interruption, with negative effects on our ability to manufacture our products effectively and in a timely fashion.
We are subject to the risks of international economic and political conditions.
We develop, manufacture, distribute and sell our products globally and we intend to continue to pursue growth opportunities worldwide. Our international operations are subject to risks that are inherent in conducting business overseas and under non-U.S. laws, regulations and customs. These risks include possible nationalization, exit from the EU, expropriation, importation limitations, violations of U.S. or local laws, including, but not limited to, the UK Bribery Act, FCPA, pricing restrictions, and other restrictive governmental actions. Our profitability and operations are, and will continue to be, subject to a number of risks and potential costs, including:
|
•
|
local product preferences and product requirements;
|
|
•
|
longer-term receivables than are typical in the EU or the U.S.;
|
|
•
|
difficulty enforcing agreements;
|
23
|
•
|
creditworthiness of customers;
|
|
•
|
less intellectual property protection in some countries outside the EU or the U.S.;
|
|
•
|
trade protection measures and import and export licensing requirements;
|
|
•
|
different labor regulations and workforce instability;
|
|
•
|
higher danger of terrorist activity, war or civil unrest;
|
|
•
|
selling our products through distributors and agents;
|
|
•
|
political and economic instability; and
|
|
•
|
the risks further described above in the section entitled “
The failure to comply with anti-bribery laws could materially adversely affect our business and result in civil and/or criminal sanctions.
”
|
We transact business in numerous countries around the world and expect that a significant portion of our business will continue to take place in international markets. Consolidated financial statements are prepared in our functional currency, while the financial statements of each of our subsidiaries are prepared in the functional currency of that entity. Accordingly, fluctuations in the exchange rate of the functional currencies of our foreign currency entities against our functional currency will impact our results of operations and financial condition. Although we may elect to hedge certain foreign currency exposure, we cannot be certain that the hedging activity will eliminate our currency risk.
In addition, in many of the countries where we operate, employees are covered by various laws and/or collective bargaining agreements that endow them, through their local or national representatives, with the right to be consulted in relation to specific issues, including the downsizing or closing of departments and staff reductions. The laws and/or collective bargaining agreements that are applicable to these agreements could have an impact on our flexibility, as they apply to programs to redefine and/or strategically reposition our activities. Our ability to implement staff downsizing programs or even temporary interruptions of employment relationships is predicated on the approval of government entities and the consent of labor unions. A negative response from a works council or union-organized work stoppages by employees could have a negative impact on our business.
Our debt instruments require us to comply with affirmative covenants and specified financial covenants and ratios.
Certain restrictions and covenants in our debt instruments could affect our ability to operate and may limit our ability to react to market conditions or to take advantage of potential business opportunities as they arise. For example, such restrictions could adversely affect our ability to finance our operations, make strategic acquisitions, investments or alliances, restructure our organization or finance capital needs. Additionally, our ability to comply with these covenants and restrictions may be affected by events beyond our control, such as prevailing economic, financial, regulatory and industry conditions. If any of these restrictions or covenants is breached, we could be in default under one or more of our debt instruments, which, if not cured or waived, could result in acceleration of the indebtedness under such agreements and cross defaults under our other debt instruments. Any such actions could result in the enforcement of our lenders’ security interests and/or force us into bankruptcy or liquidation, which could have a material adverse effect on our financial condition and results of operations.
Our inability to integrate recently acquired businesses or to successfully complete and integrate future acquisitions could limit our future growth or otherwise be disruptive to our ongoing business.
From time to time, we acquire businesses and expect to pursue acquisitions in support of our strategic goals. There can be no assurance that acquisition opportunities will be available on acceptable terms or at all, or that we will be able to obtain necessary financing or regulatory approvals to complete potential acquisitions. The success of any acquisition, investment or alliance may be affected by a number of factors, including our ability to properly assess and value the potential business opportunity or to successfully integrate any businesses we may acquire into our existing business. The integration of the operations of acquired businesses requires significant efforts, including the coordination of information technologies, human resources, R&D, sales and marketing, operations, manufacturing, legal, compliance and finance. These efforts result in additional expenses and involve significant amounts of management’s time that cannot then be dedicated to other projects. Failure to manage and coordinate the growth of the combined company successfully could also have an adverse impact on our business. In addition, we cannot be certain that our investments, alliances and acquired businesses will become profitable or remain so. If our investments, alliances or acquisitions are not successful, we may record unexpected impairment charges.
We have incurred and will continue to incur certain transaction and merger-related costs in connection with the merger between Sorin and Cyberonics.
We have incurred and expect to continue to incur a number of non-recurring direct and indirect costs associated with the merger between Sorin and Cyberonics. These costs and expenses include fees paid to financial, legal and accounting advisers, filing fees, printing expenses and other related charges as well as ongoing expenses related to facilities and systems
24
consolidation costs, severance payments and other potential employment-related costs, including payments remaining to be made to certain Sorin and Cyberonics executives. During the years ended
December 31, 2018
,
2017
and
2016
, we incurred
$24.4 million
,
$15.5 million
and
$20.4 million
in merger and integration expenses, respectively. We expect additional expenses in the future for the integration of the two merged businesses. We have incurred and expect to continue to incur integration expenses related to systems integration, organization structure integration, finance, synergy and tax planning, certain re-branding efforts, and restructuring efforts related to our intent to leverage economies of scale, eliminate overlapping corporate expenses and streamline distributions, logistics and office functions in order to reduce overall costs. While we assumed a certain level of expenses in connection with the transaction, there are many factors beyond our control, including unanticipated costs that could affect the total amount or the timing of these expenses. Although we expect that the benefits of the merger will offset the transaction expenses and implementation costs over time, this net benefit may not be achieved in the near term or at all.
We may incur impairments of intangible assets and goodwill, primarily acquired in acquisitions, including the merger between Sorin and Cyberonics.
During the year ended December 31, 2016, we recorded a pre-tax, non-cash loss on impairment of our Cardiac Rhythm Management reporting unit goodwill, which we acquired in the merger of Sorin and Cyberonics, of $18.3 million, which is included within discontinued operations in our consolidated statement of income (loss). As of
December 31, 2018
, the carrying value of our net intangible assets and goodwill totaled
$1.7 billion
, which represents
67.7%
of our total assets. As of December 31, 2017, the carrying value was
$1.3 billion
, which represented
52.7%
of our total assets.
We review, when circumstances warrant, the carrying amounts of our intangible assets to determine whether those carrying amounts continue to be recoverable in accordance with U.S. generally accepted accounting principles. Significant negative industry or economic trends, disruptions to our businesses, significant unexpected or planned changes in the use of assets, divestitures and market capitalization declines, among other events, may result in impairments to goodwill and other intangible assets. Future impairments could significantly affect reported financial results.
As our shares have been delisted from the London Stock Exchange, the City Code on Takeovers and Mergers (the “City Code”) no longer applies to us and we, and our shareholders, will therefore not have the benefit of the protections that the City Code affords.
In February 2017, we announced that we had made applications (i) to the UK Financial Conduct Authority for the cancellation of the standard listing of our ordinary shares of £1 per share on the Official List of the UK Listing Authority and (ii) to the London Stock Exchange plc (the “LSE”) to cancel the admission to trading of the shares on the main market of the LSE (together, the “Cancellation”). In connection with the Cancellation, we also decided to terminate our UK domestic depositary interest facility. Trading of our shares on the LSE ceased from and after the close of business on April 4, 2017.
The Panel on Takeovers and Mergers determined that the City Code no longer applies to us indicating, among other things, that we and our shareholders would not have the benefit of the protections the City Code affords, including, but not limited to, the requirement that a person who acquires an interest in shares carrying 30% or more of the voting rights in us must make a cash offer to all other shareholders at the highest price paid in the 12 months before the offer was announced.
Changes in tax laws or exposure to additional income tax liabilities could have a material impact on our financial condition and results of operations.
We are subject to income taxes as well as non-income based taxes, in the U.S., the UK, the EU and various other jurisdictions. No assurances can be given as to what our worldwide effective corporate tax rate will be because of, among other things, uncertainty regarding the tax regulations and laws, enactment and enforceability thereof and policies of the jurisdictions where we operate. Our actual effective tax rate may vary from our expectations or from historical trends and that variance may be material. Our effective tax rates could be affected by changes in the mix of earnings in countries with differing statutory tax rates, changes in the valuation of deferred tax assets and liabilities or changes in tax laws or their interpretation. On December 22, 2017, the Tax Cuts and Jobs Act (the “Tax Act”) was signed into U.S. law which provided numerous amendments to the Internal Revenue Code of 1986, as amended (the “IRC”). The Tax Act significantly changed U.S. corporate income tax laws by, among other things, reducing the U.S. corporate income tax rate to 21%, which commenced in 2018. The U.S. Treasury Department has issued proposed regulations with regard to the Tax Act, and further final regulations and state conformity are pending, which may also impact our effective tax rate. We are also subject to ongoing tax audits in various non-U.S. jurisdictions. Tax authorities may disagree with certain positions we have taken and assess additional taxes. We believe that our accruals reflect the probable outcome of known contingencies. However, there can be no assurance that we will accurately predict the outcomes of ongoing audits, and the actual outcomes of these audits could have a material impact on our consolidated statements of income (loss) or financial condition.
25
Risks from Residency and Jurisdiction of Incorporation
The IRS may not agree with the conclusion that we should be treated as a foreign corporation for U.S. federal tax purposes, and we may be required to pay substantial U.S. federal income taxes.
We believe that under current law, we are treated as a foreign corporation for U.S. federal tax purposes because we are a UK incorporated entity. Although we are incorporated in the UK, the U.S. Internal Revenue Service (the “IRS”) may assert that we should be treated as a U.S. corporation (and, therefore, a U.S. tax resident) for U.S. federal tax purposes pursuant to Section 7874 of the IRC (“Section 7874”). For U.S. federal tax purposes, a corporation is considered a tax resident in the jurisdiction of its organization or incorporation, except as provided under Section 7874. Subject to the discussion of Section 7874 below, because we are a UK incorporated entity, we would be classified as a foreign corporation (and, therefore, a non-U.S. tax resident) under these rules. Section 7874 provides an exception under which a foreign incorporated entity may, in certain circumstances, be treated as a U.S. corporation for U.S. federal tax purposes.
For us to be treated as a foreign corporation for U.S. federal tax purposes under Section 7874, in connection with the merger of Sorin and Cyberonics, either (i) the former stockholders of Cyberonics must own (within the meaning of Section 7874) less than 80% (by both vote and value) of our shares by reason of holding shares of Cyberonics common stock, or (ii) we must have substantial business activities in the UK after the merger.
We believe that because the former stockholders of Cyberonics own (within the meaning of Section 7874) less than 80% (by both vote and value) of our shares by reason of holding shares of Cyberonics common stock, the test set forth above to treat us as a foreign corporation was satisfied in connection with the merger. However, the IRS may disagree with the calculation of the percentage of our shares deemed held by former holders of Cyberonics common stock by reason of being former holders of Cyberonics common stock due to the calculation provisions laid out under Section 7874 and accompanying regulations (the “Section 7874 Percentage”). The final regulations relating to calculating the Section 7874 Percentage are new and subject to interpretation and thus it cannot be assured that the IRS will agree that the ownership requirements to treat us as a foreign corporation were met. In addition, there have been legislative proposals to expand the scope of U.S. corporate tax residence, including by potentially causing us to be treated as a U.S. corporation if our management and control and affiliates were determined to be located primarily in the U.S. The applicable U.S. Treasury Regulations were finalized on July 12, 2018, and we continue to believe that we will be treated as a foreign corporation for U.S. federal tax purposes. If we were to be treated as a U.S. corporation for U.S. federal income tax purposes, we could be subject to substantially greater U.S. tax liability than currently contemplated as a non-U.S. corporation.
The IRS may not agree with the conclusion that Section 7874 does not limit Cyberonics’ and its U.S. affiliates’ ability to utilize their U.S. tax attributes and does not impose an excise tax on gain recognized by certain individuals.
If the Section 7874 Percentage is calculated to be at least 60% but less than 80%, Section 7874 imposes a minimum level of tax on any “inversion gain” of a U.S. corporation (and any U.S. person related to the U.S. corporation) after the acquisition. Inversion gain is defined as (i) the income or gain recognized by reason of the transfer of property to a foreign related person during the 10-year period following the Cyberonics merger, and (ii) any income received or accrued during such period by reason of a license of any property by the U.S. corporation to a foreign related person. The effect of this provision is to deny the use of certain U.S. tax attributes (including net operating losses and certain tax credits) to offset U.S. tax liability, if any, attributable to such inversion gain. In addition, the U.S. Treasury Department issued final regulations that further limited benefits of certain post-combination transactions for combinations resulting in a Section 7874 Percentage of at least 60% but less than 80%.
Additionally, if the Section 7874 Percentage is calculated to be at least 60% but less than 80%, Section 7874 and related regulations would impose an excise tax under Section 4985 of the IRC (“Section 4985 Excise Tax”) on the gain recognized by certain “disqualified individuals” (including officers and directors of Cyberonics) on certain Cyberonics stock-based compensation held thereby at a rate equal to 15%. If the Section 4985 Excise Tax is applicable, the compensation committee of the Cyberonics board determined that it is appropriate to provide such individuals with a payment with respect to the excise tax, so that, on a net after-tax basis, they would be in the same position as if no such excise tax had been applied.
We believe the Section 7874 Percentage following the combination of Cyberonics and Sorin was less than 60%. As a result, we believe that (i) Cyberonics and its U.S. affiliates will be able to utilize their U.S. tax attributes to offset their U.S. tax liability, if any, resulting from certain subsequent specified taxable transactions, and (ii) “disqualified individuals” will not be subject to the Section 4985 Excise Tax. However, the final regulations relating to calculating the Section 7874 Percentage are new and subject to interpretation, and thus it cannot be assured that the IRS will agree that the Section 7874 Percentage following the combination of Cyberonics and Sorin was less than 60%.
26
We may not qualify for benefits under the tax treaty entered into between the UK and the U.S.
We believe that we operate in a manner such that we are eligible for benefits under the tax treaty entered into between the UK and the U.S.; however, our ability to qualify for such benefits will depend upon the requirements contained in such treaty. Our failure to qualify for benefits under the tax treaty entered into between the UK and the U.S. could result in adverse tax consequences to us.
The 2016 U.S. Model Income Tax Convention released by the U.S. Treasury Department would reduce potential tax benefits with respect to us if the Section 7874 Percentage is calculated to be at least 60% but less than 80% by imposing full withholding taxes on payments pursuant to certain financing structures, distributions from our U.S. subsidiaries and payments pursuant to certain licensing arrangements. If the proposed treaty is enacted with applicability to us, it would result in material reductions in the benefit of qualifying for a treaty.
We believe that we operate so as to be treated exclusively as a resident of the UK for tax purposes, but the relevant tax authorities may treat us as also being a resident of another jurisdiction for tax purposes.
We are a company incorporated in the UK. Current UK law provides that we will be regarded as being a UK resident for tax purposes from incorporation and shall remain so unless (a) we are concurrently resident in another jurisdiction (applying the tax residence rules of that jurisdiction) that has a double tax treaty with the UK and (b) there is a tiebreaker provision in that tax treaty, which allocates exclusive residence to that other jurisdiction.
Based on our management and organizational structure, we believe that we should be regarded as resident exclusively in the UK from our incorporation for tax purposes. However, because this analysis is highly factual and may depend on future changes in our management and organizational structure, there can be no assurance regarding the final determination of our tax residence. Should we be treated as resident in a country or jurisdiction other than the UK, we could be subject to taxation in that country or jurisdiction on our worldwide income and we may be required to comply with a number of material and formal tax obligations, including withholding tax and/or reporting obligations provided under the relevant tax law, which could result in additional costs and expenses for us, as well as our shareholders, lenders and/or bondholders.
As an English public limited company, certain capital structure decisions will require shareholder approval, which may limit our flexibility to manage our capital structure.
We are a public limited company incorporated under the laws of England and Wales. Under English law, our board of directors may only allot shares with the prior authorization of shareholders. Our articles of association currently authorize the allotment of additional shares for a period of five years up to an aggregate of approximately 9.8 million shares. English law also generally provides shareholders with preemptive rights when new shares are issued for cash; which rights may be excluded by shareholders. Our articles currently exclude preemptive rights in relation to the allotment of shares for cash. In addition, English law also generally prohibits a public company from repurchasing its own shares without the prior approval of shareholders. The approval of the allotment of additional shares, the exemption of statutory preemptive rights and the restriction on repurchase of shares must all be renewed by shareholders at least every five years. We cannot provide any assurance that these authorizations will always be approved, which could limit our ability to issue equity and thereby adversely affect the holders of our securities.
Transfers of our shares, other than ones effected by means of the transfer of book-entry interests in the Depository Trust Company (“DTC”), may be subject to UK stamp duty or UK stamp duty reserve tax (“SDRT”).
Transfers of our shares effected by means of the transfer of book-entry interests in DTC are not subject to UK stamp duty or SDRT. However, if a shareholder holds our shares directly rather than through DTC, any transfer of shares could be subject to UK stamp duty of SDRT at a rate of 0.5% of the consideration paid for the transfer and certain issues or transfers of shares to depositories or into clearance services are charged at a rate of 1.5% of the consideration paid for the transfer. The transferee generally pays the UK stamp duty or SDRT. The potential for UK stamp duty or SDRT could adversely affect the trading price of our shares.
The facilities of DTC are a widely used mechanism that allow for rapid electronic transfers of securities between the participants in the DTC system, which include many large banks and brokerage firms. Our shares are at present, subject to certain conditions, generally eligible for deposit and clearing within the DTC system. However, DTC generally has discretion to cease to act as a depository and clearing agency for our shares. If DTC determines at any time that our shares are not eligible for continued deposit and clearance within its facilities, then we believe that our shares would not be eligible for continued listing on a U.S. securities exchange and trading in our shares would be disrupted. While we would pursue alternative arrangements to preserve the listing and maintain trading, any such disruption could have a material adverse effect on the trading price of our shares.
27
We have identified two material weaknesses in the design of our internal controls relating to access to our primary financial reporting system by certain members of our Information Technology group and those intended to prevent errors in price and quantity during the billing and revenue processes which, if not remediated appropriately or timely, could adversely affect the accuracy and reliability of our financial statements, and our reputation, business and the price of our common stock, as well as lead to a loss of investor confidence.
As a public company, we are required to maintain effective internal control over financial reporting in accordance with Section 404 of the Sarbanes-Oxley Act of 2002. As described in “Item 9A. Controls and Procedures,” we identified two material weaknesses in the design of our controls. We identified a deficiency in the design and maintenance of our controls related to access to our primary financial system by certain members of our Information Technology group and end-users. Specifically, we did not design and maintain user access controls that adequately restrict end-user and privileged access to, and ensure segregation of duties within, our primary financial system and data. In addition, management identified a deficiency in the design and maintenance of our controls, related to the accounting for revenue and related accounts, to ensure accuracy in price and quantity during the billing and revenue processes. This deficiency was impacted by the deficiency related to the design and maintenance of our user access controls.
As a result, we concluded that our disclosure controls and procedures and internal control over financial reporting were not effective as of December 31, 2018. A material weakness is a deficiency, or a combination of deficiencies, in internal control over financial reporting, such that there is a reasonable possibility that a material misstatement of our annual or interim financial statements will not be prevented or detected on a timely basis. Although no material misstatements were identified in our consolidated financial statements, these control deficiencies could result in a material misstatement of our annual or interim consolidated financial statements if any unauthorized or erroneous transactions were not prevented or detected on a timely basis.
We have begun remediation efforts to address the control deficiencies that gave rise to the material weaknesses noted above and, while there can be no assurance that our efforts will be successful, we plan to complete the remediation by the end of 2019. We may identify additional material weaknesses in our internal control over financial reporting in the future. If we are unable to remediate these material weaknesses or we identify additional material weaknesses in our internal control over financial reporting in the future, our ability to analyze, record and report financial information accurately, to prepare our financial statements within the time periods specified by the rules and forms of the SEC and to otherwise comply with our reporting obligations under the federal securities laws, will likely be adversely affected. The occurrence of, or failure to remediate, these material weaknesses and any future material weaknesses in our internal control over financial reporting may adversely affect the accuracy and reliability of our financial statements, and our reputation, business and the price of our common stock, as well as lead to a loss of investor confidence.
28
Item 1B.
Unresolved Staff Comments
None.
Item 2.
Properties
Our principal executive office is located in the UK and is leased by us. Our business franchises, corresponding to our main therapeutic areas: NM and CV have headquarters located in U.S. and
Italy
, respectively. The locations in the U.S. and Italy are owned by us. Manufacturing and research facilities are located in Brazil, Canada, Germany, Italy, Australia and the U.S. Manufacturing and research facilities are approximately
1.2 million
square feet. Approximately
24%
of the manufacturing facilities are located within the U.S. and approximately
90%
are owned by us and the balance is leased.
We also maintain
16
primary administrative offices in
12
countries. Most of these locations are leased. We are using substantially all of our currently available productive space to develop, manufacture and market our products. Our facilities are in good operating condition, suitable for their respective uses and adequate for current needs.
Item 3.
Legal Proceedings
Discussion of our material pending legal and regulatory proceedings and settlements is incorporated herein by reference to “
Note 13. Commitments and Contingencies
” in our consolidated financial statements and accompanying notes, beginning on page F-1 of this Annual Report on Form 10-K and should be considered an integral part of “Item 3 of Part I” of this Annual Report on Form 10-K.
Item 4.
Mine Safety Disclosures
Not applicable.
29
PART II
Item 5.
Market for Registrant’s
Common Equity, Related Stockholder
Matters and Issuer Purchases of Equity Securities
Our ordinary shares are quoted on the NASDAQ Global Market and previously were quoted on the main market of the LSE (as a standard listing) under the symbol “LIVN.” On February 23, 2017, we announced our voluntary cancellation of our standard listing of our shares with the LSE due to the low volume of our share trading on the LSE. Trading ceased on the LSE at the close of business on April 4, 2017.
As of
March 14, 2019
, according to data provided by our transfer agent, there were
22
stockholders of record. However, we believe that the actual number of beneficial holders of our shares may be substantially greater than the stated number of holders of record because a substantial portion of the shares are held in street name.
Recent Sales of Unregistered Securities
During the past fiscal year, we did not issue any securities that were not registered under the Securities Act.
Dividend Policy
As a company organized under the laws of England and Wales, we must have "distributable reserves" to make share repurchases or pay dividends to shareholders. Distributable reserves may be created through the earnings of the UK parent company and, amongst other methods, through a reduction in share capital approved by the English Companies Court. Distributable reserves are not linked to a U.S. GAAP reported amount. In addition to having sufficient distributable reserves, English law requires a public company’s net worth to be at least equal to the amount of its capital. Accordingly, a public company can only make a distribution: (a) if, at the time that the distribution is made, the amount of its net assets (that is, the total excess of assets over liabilities) is not less than the total of its called-up share capital and undistributable reserves; and (b) if, and to the extent that, the distribution itself, at the time that it is made, does not reduce the amount of the net assets to less than that total.
We currently have no intention to declare and pay dividends.
Issuer Purchases of Securities
The table below presents purchases of equity securities by us and our affiliated purchasers during the three months and twelve months ended
December 31, 2018
(in thousands except share data):
|
Period
|
Total Number of Shares Purchased
|
Average Price Paid per Share
(1)
|
Total Number of Shares Purchased as Part of Publicly Announced Plans or Programs
(2)
|
Approximate Dollar Value of Shares that May Yet Be Purchased Under Plans or Programs
(3)
|
||||||||||
|
October 1 - October 31, 2018
|
—
|
|
$
|
—
|
|
—
|
|
$
|
99,993
|
|
||||
|
November 1 - November 30, 2018
|
201,005
|
|
$
|
99.49
|
|
201,005
|
|
$
|
79,992
|
|
||||
|
December 1 - December 31, 2018
|
299,328
|
|
$
|
100.20
|
|
299,328
|
|
$
|
—
|
|
||||
|
Fourth quarter totals
|
500,333
|
|
$
|
99.91
|
|
500,333
|
|
|||||||
|
Year-to-date totals for 2018
|
500,333
|
|
$
|
99.91
|
|
500,333
|
|
|||||||
|
(1)
|
Shares are purchased at market price.
|
|
(2)
|
On August 1, 2016, the Board of Directors of LivaNova approved the authorization of a share repurchase plan (the "Share Repurchase Program") pursuant to an authority granted by shareholders at the 2016 annual general meeting held on June 15, 2016. The Share Repurchase Program was structured to enable us to buy back up to
$150.0 million
of our shares on NASDAQ between September 1, 2016 through December 31, 2016. On November 15, 2016, the Board of Directors approved an amendment (the "Amended Share Repurchase Program") to the Share Repurchase Program. The Amended Share Repurchase Program authorized the Company to repurchase up to
$150.0 million
of our shares between September 1, 2016 and
December 31, 2018
. All repurchased shares were canceled and are no longer considered issued or outstanding.
|
|
(3)
|
No shares may be repurchased under the Share Repurchase Program or the Amended Share Repurchase Program after
December 31, 2018
.
|
30
Stock Performance Graph
The following graph illustrates our 39-month cumulative total return compared with the S&P 500 Index and the S&P Health Care Equipment Index over the same period.
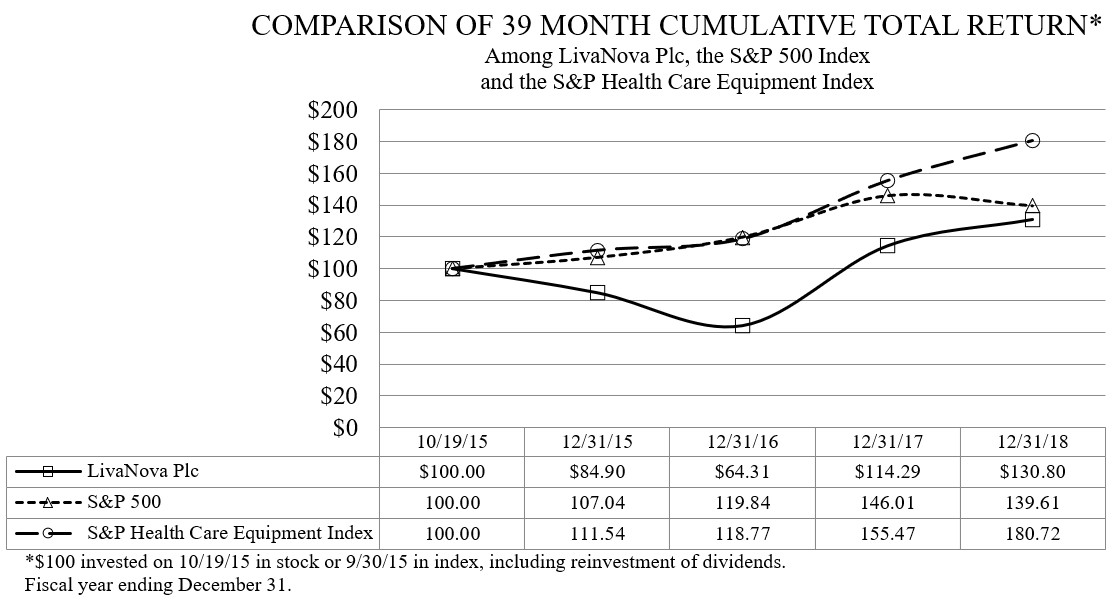
31
Item 6.
Selected
Financial Data
The following table summarizes certain selected financial data and is qualified by reference to, and should be read in conjunction with, the consolidated financial statements and related notes under the section entitled “Item 15. Exhibits, Financial Statement Schedules” included in this Annual Report on Form 10-K. The selected financial data and the related notes for the years ended
December 31, 2018
,
December 31, 2017
and
December 31, 2016
are derived from audited consolidated financial statements that are included in this Annual Report on Form 10-K. The selected financial data and the related notes for the transitional period April 25, 2015 to December 31, 2015, and for the fiscal years ended April 24, 2015 and April 25, 2014, are derived from audited consolidated financial statements that are included in the Annual Report on Form 10-KT for the transitional period ended December 31, 2015.
|
Consolidated Statements of Operations Data
|
||||||||||||||||||||||||
|
(In thousands, except per share data)
|
Year Ended December 31, 2018
|
Year Ended December 31, 2017
|
Year Ended December 31, 2016
|
Transitional Period April 25, 2015 to December 31, 2015
|
Fiscal Year Ended April 24, 2015
|
Fiscal Year Ended April 25, 2014
|
||||||||||||||||||
|
Net sales
|
$
|
1,106,961
|
|
$
|
1,012,277
|
|
$
|
964,858
|
|
$
|
363,237
|
|
$
|
291,558
|
|
$
|
282,014
|
|
||||||
|
Costs and expenses:
|
||||||||||||||||||||||||
|
Cost of sales - exclusive of amortization
|
361,812
|
|
353,192
|
|
367,845
|
|
113,404
|
|
27,311
|
|
27,355
|
|
||||||||||||
|
Product remediation
|
10,680
|
|
7,254
|
|
37,534
|
|
—
|
|
—
|
|
—
|
|
||||||||||||
|
Selling, general and administrative
|
464,967
|
|
380,100
|
|
355,164
|
|
147,025
|
|
123,619
|
|
120,642
|
|
||||||||||||
|
Research and development
|
146,024
|
|
109,516
|
|
82,078
|
|
41,916
|
|
42,245
|
|
45,220
|
|
||||||||||||
|
Merger and integration expenses
|
24,420
|
|
15,528
|
|
20,377
|
|
55,776
|
|
8,692
|
|
—
|
|
||||||||||||
|
Restructuring expenses
|
15,915
|
|
17,056
|
|
37,377
|
|
10,494
|
|
—
|
|
—
|
|
||||||||||||
|
Amortization of intangibles
|
37,194
|
|
33,144
|
|
31,035
|
|
7,030
|
|
1,039
|
|
1,342
|
|
||||||||||||
|
Litigation provision
|
294,021
|
|
—
|
|
—
|
|
—
|
|
—
|
|
7,443
|
|
||||||||||||
|
Operating (loss) income from continuing operations
|
(248,072
|
)
|
96,487
|
|
33,448
|
|
(12,408
|
)
|
88,652
|
|
80,012
|
|
||||||||||||
|
Interest (expense) income, net
|
(8,978
|
)
|
(6,479
|
)
|
(8,918
|
)
|
(1,117
|
)
|
163
|
|
162
|
|
||||||||||||
|
Gain on acquisitions
|
11,484
|
|
39,428
|
|
—
|
|
—
|
|
—
|
|
—
|
|
||||||||||||
|
Impairment of investments
|
—
|
|
(8,565
|
)
|
—
|
|
(5,062
|
)
|
—
|
|
—
|
|
||||||||||||
|
Foreign exchange and other (losses) gains
|
(1,881
|
)
|
267
|
|
1,136
|
|
(7,411
|
)
|
479
|
|
(295
|
)
|
||||||||||||
|
(Loss) income from continuing operations before tax
|
(247,447
|
)
|
121,138
|
|
25,666
|
|
(25,998
|
)
|
89,294
|
|
79,879
|
|
||||||||||||
|
Income tax (benefit) expense
|
(69,629
|
)
|
49,954
|
|
5,113
|
|
(13,501
|
)
|
31,446
|
|
24,989
|
|
||||||||||||
|
Losses from equity method investments
|
(644
|
)
|
(16,719
|
)
|
(18,679
|
)
|
(2,223
|
)
|
—
|
|
—
|
|
||||||||||||
|
Net (loss) income from continuing operations
|
(178,462
|
)
|
54,465
|
|
1,874
|
|
(14,720
|
)
|
57,848
|
|
54,890
|
|
||||||||||||
|
Discontinued Operations:
|
||||||||||||||||||||||||
|
Loss from discontinued operations, net of tax
|
(10,937
|
)
|
(1,271
|
)
|
(64,663
|
)
|
(14,893
|
)
|
—
|
|
—
|
|
||||||||||||
|
Impairment of discontinued operations, net of tax
|
—
|
|
(78,283
|
)
|
—
|
|
—
|
|
—
|
|
—
|
|
||||||||||||
|
Net loss from discontinued operations, net of tax
|
(10,937
|
)
|
(79,554
|
)
|
(64,663
|
)
|
(14,893
|
)
|
—
|
|
—
|
|
||||||||||||
|
Net (loss) income
|
$
|
(189,399
|
)
|
$
|
(25,089
|
)
|
$
|
(62,789
|
)
|
$
|
(29,613
|
)
|
$
|
57,848
|
|
$
|
54,890
|
|
||||||
32
|
Consolidated Statements of Operations Data
|
||||||||||||||||||||||||
|
(In thousands, except per share data)
|
Year Ended December 31, 2018
|
Year Ended December 31, 2017
|
Year Ended December 31, 2016
|
Transitional Period April 25, 2015 to December 31, 2015
|
Fiscal Year Ended April 24, 2015
|
Fiscal Year Ended April 25, 2014
|
||||||||||||||||||
|
Basic (loss) income per share:
|
||||||||||||||||||||||||
|
Continuing operations
|
$
|
(3.68
|
)
|
$
|
1.13
|
|
$
|
0.04
|
|
$
|
(0.45
|
)
|
$
|
2.19
|
|
$
|
2.02
|
|
||||||
|
Discontinued operations
|
(0.23
|
)
|
(1.65
|
)
|
(1.33
|
)
|
(0.45
|
)
|
—
|
|
—
|
|
||||||||||||
|
$
|
(3.91
|
)
|
$
|
(0.52
|
)
|
$
|
(1.29
|
)
|
$
|
(0.90
|
)
|
$
|
2.19
|
|
$
|
2.02
|
|
|||||||
|
Diluted (loss) income per share:
|
||||||||||||||||||||||||
|
Continuing operations
|
$
|
(3.68
|
)
|
$
|
1.12
|
|
$
|
0.04
|
|
$
|
(0.45
|
)
|
$
|
2.17
|
|
$
|
2.00
|
|
||||||
|
Discontinued operations
|
(0.23
|
)
|
(1.64
|
)
|
(1.32
|
)
|
(0.45
|
)
|
—
|
|
—
|
|
||||||||||||
|
$
|
(3.91
|
)
|
$
|
(0.52
|
)
|
$
|
(1.28
|
)
|
$
|
(0.90
|
)
|
$
|
2.17
|
|
$
|
2.00
|
|
|||||||
|
Shares used in computing basic (loss) income per share
|
48,497
|
|
48,157
|
|
48,860
|
|
32,741
|
|
26,391
|
|
27,143
|
|
||||||||||||
|
Shares used in computing diluted (loss) income per share
|
48,497
|
|
48,501
|
|
49,014
|
|
32,741
|
|
26,626
|
|
27,466
|
|
||||||||||||
|
Consolidated Balance Sheet Data:
|
|
|
|
|||||||||||||||||||||
|
Cash, cash equivalent and short-term investments
|
$
|
47,204
|
|
$
|
93,615
|
|
$
|
39,789
|
|
$
|
119,610
|
|
$
|
151,207
|
|
$
|
128,328
|
|
||||||
|
Working capital
|
36,551
|
|
463,842
|
|
462,800
|
|
314,293
|
|
209,272
|
|
190,532
|
|
||||||||||||
|
Total assets
|
2,549,701
|
|
2,503,891
|
|
2,342,631
|
|
2,558,739
|
|
315,944
|
|
294,191
|
|
||||||||||||
|
Long-term debt, net of current portion
|
139,538
|
|
61,958
|
|
75,215
|
|
91,791
|
|
—
|
|
—
|
|
||||||||||||
|
Accumulated (deficit) earnings
|
(251,579
|
)
|
(39,664
|
)
|
(14,575
|
)
|
48,214
|
|
77,827
|
|
19,979
|
|
||||||||||||
|
Stockholders’ equity
|
1,503,738
|
|
1,815,314
|
|
1,706,909
|
|
1,811,462
|
|
276,574
|
|
259,100
|
|
||||||||||||
33
Item 7.
Management’s
Discussion and Analysis of Financial Condition and
Results of Operations
You should read the following discussion and analysis together with the sections entitled “Business” and “Risk Factors” in Part I of this Annual Report on Form 10-K, the matters set forth in “Cautionary Statement About Forward-Looking Statements” and our consolidated financial statements and the related notes included elsewhere in this Annual Report on Form 10-K, as of and for the years ended
December 31, 2018
,
December 31, 2017
(“
2017
”) and
December 31, 2016
(“
2016
”).
Description of the Business
We are a global medical device company focused on the development and delivery of important therapeutic solutions for the benefit of patients, healthcare professionals and healthcare systems throughout the world. Working closely with medical professionals in the fields of CV disease and NM, we design, develop, manufacture and sell innovative therapeutic solutions that are consistent with our mission to improve our patients’ quality of life, increase the skills and capabilities of healthcare professionals and minimize healthcare costs. We are a public limited company organized under the laws of England and Wales, and headquartered in London, England.
Background
We were organized under the laws of England and Wales on February 20, 2015 for the purpose of facilitating the business combination of Cyberonics, Inc., a Delaware corporation, and Sorin S.p.A., a joint stock company organized under the laws of Italy. The business combination became effective in October 2015. LivaNova’s ordinary shares are listed for trading on the NASDAQ Global Market under the symbol “LIVN.”
Business Franchises
LivaNova is comprised of two principal business franchises, which are also our reportable segments: CV and NM, corresponding to our primary therapeutic areas. Other corporate activities include corporate shared service expenses for finance, legal, human resources, information technology and New Ventures.
Cardiovascular Update
Our CV business franchise is engaged in the development, production and sale of cardiopulmonary products, heart valves and advanced circulatory support products. Cardiopulmonary products include oxygenators, heart-lung machines, autotransfusion systems, perfusion tubing systems, cannulae and other related accessories. Heart valves include mechanical heart valves, tissue heart valves and related repair products. Advanced circulatory support, which represents our recently acquired TandemLife business, includes temporary life support product kits that can include a combination of pumps, oxygenators, and cannulae.
Cardiopulmonary
In September 2017, we received FDA 510(k) clearance for the U.S. market launch of our Optiflow Arterial Cannulae Family. Optiflow aortic arch cannulae provide improved hydrodynamics with a novel dispersive tip design that improves blood flow characteristics resulting in reduced wall shear stress (“WSS”) profiles. Optiflow Arterial cannulae feature a unique basket tip with large openings that allow a more physiologically compatible dispersive design. This design has been shown to significantly reduce WSS and turbulence, thereby improving hydrodynamics and potentially reducing ischemic complications from extracorporeal circulation during cardiac surgery.
Product Remediation
FDA Warning Letter
On December 29, 2015, the FDA issued a Warning Letter alleging certain violations of FDA regulations applicable to medical device manufacturers at our Munich, Germany and Arvada, Colorado facilities and issued inspectional observations on FDA’s Form-483 applicable to our Munich, Germany facility.
The Warning Letter further stated that our 3T devices and other devices we manufactured at our Munich facility are subject to refusal of admission into the U.S. until resolution of the issues set forth by the FDA in the Warning Letter. The FDA has informed us that the import alert is limited to the 3T devices, but that the agency reserves the right to expand the scope of the import alert if future circumstances warrant such action. The Warning Letter did not request that existing users cease using the 3T device, and manufacturing and shipment of all of our products other than the 3T device remain unaffected by the import limitation. To help clarify these issues for current customers, we issued an informational Customer Letter in January 2016 and that same month agreed with the FDA on a process for shipping 3T devices to existing U.S. users pursuant to a certificate of medical necessity program.
34
Finally, the Warning Letter stated that premarket approval applications for Class III devices to which certain Quality System regulation deviations identified in the Warning Letter are reasonably related will not be approved until the violations have been corrected; however, this restriction applies only to the Munich and Arvada facilities, which do not manufacture or design devices subject to Class III premarket approval.
We continue to work diligently to remediate the FDA’s inspectional observations for the Munich facility, as well as the additional issues identified in the Warning Letter. We take these matters seriously and intend to respond timely and fully to the FDA’s requests. For further information refer to “
Note 13. Commitments and Contingencies
”
in our consolidated financial statements and accompanying notes, beginning on page F-1 of this Annual Report on Form 10-K.
Centers for Disease Control and Prevention (“CDC”) and FDA Safety Communications, Company Field Safety Notice Update and Product Remediation Plan
On October 13, 2016, the CDC and the FDA separately released safety notifications regarding the 3T devices. The CDC’s Morbidity and Mortality Weekly Report (“MMWR”) and Health Advisory Notice (“HAN”) reported that tests conducted by the CDC and its affiliates indicate that there appears to be genetic similarity between both patient and 3T device strains of the non-tuberculous mycobacterium bacteria
M. chimaera
isolated in hospitals in Iowa and Pennsylvania. Citing the geographic separation between the two hospitals referenced in the investigation, the report asserts that 3T devices manufactured prior to August 18, 2014 could have been contaminated during the manufacturing process. The CDC’s HAN and FDA’s Safety Communication, issued contemporaneously with the MMWR report, each assess certain risks associated with 3T devices and provide guidance for providers and patients. The CDC notification states that the decision to use the 3T device during a surgical operation is to be taken by the surgeon based on a risk approach and on patient need. Both the CDC’s and FDA’s communications confirm that 3T devices are critical medical devices and enable doctors to perform life-saving cardiac surgery procedures.
Also on October 13, 2016, concurrent with the CDC’s HAN and FDA’s Safety Communication, we issued a Field Safety Notice Update for U.S. users of 3T devices to proactively and voluntarily contact facilities to aid in implementation of the CDC and FDA recommendations. In the fourth quarter of 2016, we initiated a program to provide existing 3T device users with a new loaner 3T device at no charge pending regulatory approval and implementation of additional risk mitigation strategies worldwide, including a vacuum canister and internal sealing upgrade program and a deep disinfection service. This loaner program began in the U.S. and is being made available progressively on a global basis, prioritizing and allocating devices to 3T device users based on pre-established criteria. We anticipate that this program will continue until we are able to address customer needs through a broader solution that includes implementation of the risk mitigation strategies described above. We are currently implementing the vacuum and sealing upgrade program in as many countries as possible until all devices are upgraded. On April 12, 2018, the FDA agreed to allow us to move forward with the deep cleaning service in the U.S. adding to the growing list of countries around the world in which we offer this service. On October 11, 2018, after review of information provided by us, the FDA concluded that we could commence the vacuum and sealing upgrade program in the U.S. Furthermore, we continue to offer a no-charge deep disinfection service (deep cleaning service) for 3T device users as we receive the required regulatory approvals.
On December 31, 2016, we recognized a liability for our product remediation plan related to our 3T device. We concluded that it was probable that a liability had been incurred upon management’s approval of the plan and the commitments made by management to various regulatory authorities globally in November and December 2016, and furthermore, the cost associated with the plan was reasonably estimable. At
December 31, 2018
, the product remediation liability was
$14.7 million
. For further information, refer to “
Note 7. Product Remediation Liability
”
in our consolidated financial statements and accompanying notes, beginning on page F-1 of this Annual Report on Form 10-K.
Sale of our Suzhou Industrial Park Facility in Shanghai, China
In March 2017, we committed to a plan to sell our Suzhou Industrial Park facility in Shanghai, China, an emerging market greenfield project for the local manufacture of Cardiopulmonary disposable products. As a result of this exit plan, we recorded an impairment of the building and equipment of
$5.4 million
and accrued
$0.5 million
of additional costs, primarily related to employee severance, during the year ended December 31, 2017, which are included in ‘Restructuring expenses’ in our consolidated statement of income (loss). In addition, the land, building and equipment were recorded as assets held for sale on the consolidated balance sheet, with a carrying value of
$13.6 million
as of
December 31, 2017
. We completed the sale of the Suzhou facility in April 2018 and received cash proceeds from the sale of
$13.3 million
.
35
Heart Valves
In January 2018, we announced that we had started enrollment in our BELIEVE study. This study focuses on the overall incidence of reduced leaflet motion identified by CT imaging in patients receiving our aortic heart valve. We are planning to enroll a minimum of 75 patients at 11 sites in the U.S. and Canada.
In March 2018, we announced that we had started enrollment in PERFECT, a Perceval valve clinical study in China. The study is being conducted to demonstrate the safety and effectiveness of Perceval in the Chinese population. We plan to enroll up to 160 patients at 8 investigational sites.
In June 2018, we announced that Japan’s Ministry of Health, Labour and Welfare approved our Perceval sutureless aortic heart valve to treat aortic valve disease, which will enable us to provide patients and clinicians in Japan with a new option for aortic heart valve replacement. In January 2019, Japan’s Ministry of Health, Labour and Welfare granted national reimbursement.
In June 2018, we announced FDA 510(k) clearance of the MEMO 4D semi-rigid mitral annuloplasty ring and confirmed the first implantation of the device. In October 2018, we received CE mark approval for Memo 4D. This next-generation of the MEMO device family offers several innovations, such as broader range of ring sizes, a new ring design and true semi-rigid stability and flexibility that allows us to reach a larger patient population with MR for treatment with the potential to improve patient outcomes.
Advanced Circulatory Support
In April 2018, we acquired TandemLife, which is focused on the delivery of leading-edge temporary life support products, including cardiopulmonary and respiratory support solutions. For further information, refer to “
Note 4. Business Combinations
”
in our consolidated financial statements and accompanying notes, beginning on page F-1 of this Annual Report on Form 10-K.
Neuromodulation Update
Our NM business franchise designs, develops and markets NM therapy for the treatment of drug-resistant epilepsy, TRD and obstructive sleep apnea. We are also focused on the development and clinical testing of the VITARIA System for treating heart failure through vagus nerve stimulation.
Epilepsy
Our product development efforts are directed toward improving the VNS Therapy System and developing new products that provide additional features and functionality. We are conducting ongoing product development activities to enhance the VNS Therapy System pulse generator, lead and programming software, and we support studies for our product development efforts and to build clinical evidence for the VNS Therapy System.
In June 2017, the FDA approved our VNS Therapy device for use in patients who are at least four years of age and have partial onset seizures that are resistant to antiepileptic medications. VNS Therapy is the first and only FDA-approved device for drug-resistant epilepsy in this pediatric population. Previously, VNS Therapy was approved by the FDA for patients 12 years or older. In addition, in June 2017, we received FDA approval, and in August 2017, we received CE Mark approval, for our VNS Therapy device for expanded MRI labeling affirming VNS Therapy as the only epilepsy device approved by the FDA for MRI scans. Currently, SenTiva, AspireHC and AspireSR models of VNS Therapy technology provide for this expanded MRI access.
In October 2017, we obtained FDA approval and in April 2018, we received CE mark approval for our SenTiva VNS Therapy System, which consists of the SenTiva implantable generator and the next-generation VNS Therapy Programming System. SenTiva is the smallest and lightest responsive therapy for epilepsy. The new VNS Therapy Programming System features a wireless wand and new user interface on a small tablet. Together, these components offer patients with drug-resistant epilepsy a physician-directed, customizable therapy with smart technology that reduces the number of seizures, lessens the duration of seizures and enables a faster recovery.
In March 2018, we announced the launch and enrollment of the first patient in a clinical study to examine the use of our VNS Therapy System using Microburst technology. This feasibility study will determine the initial safety and effectiveness of delivering VNS Therapy using high frequency bursts of stimulation in patients who have drug-resistant epilepsy. The study consists of two cohorts, enrolling up to 40 patients at approximately 15 sites in the U.S. and Europe.
In August 2018, we announced a new cost analysis that found our VNS Therapy System results in lower resource utilization and lower cost for drug-resistant epilepsy patients when compared to continued treatment with anti-epileptic drugs. The analysis showed initial costs for the VNS Therapy device, including placement and programming, were estimated to be offset
1.7 years
post-implant and equated to an estimated net cost savings of
$77,480
per patient over five years. The net cost savings
36
are due primarily to a reduction in seizure-related hospitalizations, resulting in a
21.5%
decrease in costs compared to treatment with anti-epileptic drugs alone.
Depression
In March 2017, the American Journal of Psychiatry published the results of the longest and largest naturalistic study on effective treatments for patients experiencing chronic and severe depression. The findings showed that the addition of VNS Therapy System to traditional treatment methods is effective in reducing symptoms in patients with TRD.
In January 2018, we announced the launch and enrollment of the first patient in our Global RESTORE-LIFE study, which evaluates the use of our VNS Therapy System in patients who have TRD and failed to achieve an adequate response to standard psychiatric management. We expect to enroll up to 500 patients at approximately 80 sites outside of the U.S. We are currently enrolling patients in Germany and will expand to other countries during the remainder of the year.
In July 2005, the FDA approved the VNS Therapy System for the adjunctive treatment of chronic or recurrent depression for patients 18 years or older who are experiencing a major depressive episode and have not had an adequate response to four or more antidepressant treatments. In May 2007, CMS issued a national determination of non-coverage within the U.S. with respect to reimbursement of the VNS Therapy System for patients with TRD, significantly limiting access to this therapeutic option for most patients. In May 2018, CMS published a tracking sheet to reconsider its National Coverage Determination (“NCD”) of our VNS Therapy System for TRD in response to a letter that we submitted to CMS requesting a formal reconsideration of the NCD. We requested this review after a significant body of new evidence emerged about TRD and the role of VNS Therapy in its treatment. On February 15, 2019, we announced that CMS finalized its NCD to expand Medicare coverage for VNS Therapy for TRD. With the decision, CMS initiated coverage for Medicare beneficiaries through Coverage with Evidence Development when offered in a CMS-approved, double-blind, randomized, placebo-controlled trial with a follow-up duration of at least one year, with the possibility of extending the study to a prospective longitudinal study. We intend to commence a clinical study that meets these requirements. Enrollment will likely begin in the third quarter of 2019 and could take as long as 18 months to enroll approximately 500 patients.
Obstructive Sleep Apnea
We have invested in ImThera, a privately held, emerging-growth company developing an implantable neurostimulation device system for the treatment of obstructive sleep apnea, since 2011. On January 16, 2018, we acquired the remaining
86%
outstanding equity interests in ImThera for up to approximately
$225 million
. Up-front costs were approximately
$78 million
with the balance paid on a schedule driven by regulatory and sales milestones. ImThera manufactures an implantable device that stimulates multiple tongue muscles via the hypoglossal nerve, which opens the airway while a patient is sleeping. ImThera has a commercial presence in the European market, and an FDA pivotal study is ongoing in the U.S.
Heart Failure
We are focused on the development and clinical testing of the VITARIA System for treating heart failure through vagus nerve stimulation.
We received CE Mark approval of the VITARIA System in February 2015 for patients who have moderate to severe heart failure (New York Heart Association Class II/III) with left ventricular dysfunction (ejection fraction < 40%) and who remain symptomatic despite stable, optimal heart failure drug therapy. The VITARIA System provides a specific method of VNS called autonomic regulation therapy (“ART”), and it includes the same elements as the VNS Therapy System. We conducted a pilot study, ANTHEM-HF, outside the U.S., which concluded in 2014. The study results support the safety and efficacy of ART delivered by the VITARIA System. During 2014, we also initiated a second pilot study, ANTHEM-HFPEF, to study ART in patients experiencing symptomatic heart failure with preserved ejection fraction. This pilot study is currently underway outside the U.S. The VITARIA System is not approved in the U.S.
In September 2018, we announced the first successful implantation of the VITARIA System in a patient enrolled in the ANTHEM-HFrEF pivotal study. ANTHEM-HFrEF is an international, multi-center, randomized trial to evaluate the VITARIA System for the treatment of advanced heart failure.
Costa Rica Manufacturing Plant Closure
In October 2016, management initiated a plan to exit our Costa Rica manufacturing operations and transfer those activities to Houston, Texas. We recorded an impairment of the building and equipment of $5.7 million, which was included in restructuring expenses in our consolidated statement of income (loss). We completed the sale of the Costa Rica facility during the year ended
December 31, 2017
and received $4.9 million in proceeds from the sale.
37
Discontinued Operations
We completed the sale of our CRM business franchise to MicroPort Cardiac Rhythm B.V. and MicroPort Scientific Corporation (the “CRM Sale”) on April 30, 2018 for total cash proceeds of $195.9 million, less cash transferred of $9.2 million, subject to a closing working capital adjustment. In conjunction with the CRM Sale, we entered into transition services agreements to provide certain support services generally for up to twelve months from the closing date of the sale. We previously concluded that the sale of CRM represents a strategic shift in our business that will have a major effect on future operations and financial results. Accordingly, the results of operations of the CRM business franchise are reflected as discontinued operations for all periods presented in this Annual Report on Form 10-K and related assets and liabilities are presented as held for sale. For further information, refer to “
Note 5. Discontinued Operations
”
in our consolidated financial statements and accompanying notes, beginning on page F-1 of this Annual Report on Form 10-K.
Corporate Activities and New Ventures Update
Corporate activities include shared services for finance, legal, human resources and information technology, corporate business development and New Ventures.
Mitral Valve Regurgitation
MR occurs when the heart’s mitral valve does not close tightly, which allows blood to flow backwards in the heart. This reduces the amount of blood that flows to the rest of the body, making the patient feel tired or out of breath. Treatment depends on the nature and the severity of MR. In certain cases, heart surgery may be needed to repair or replace the valve. Left untreated, severe MR can cause heart failure or heart rhythm problems (arrhythmias).
On
May 2, 2017
, we acquired the remaining
51%
outstanding equity interests in Caisson, a clinical-stage medical device company focused on the design, development and clinical evaluation of a novel TMVR implant device with a fully transvenous delivery system for the treatment of MR for a purchase price of up to
$72.0 million
, in support of our strategic growth initiatives. As a result of our acquisition of Caisson, we began consolidating the results of Caisson as of
May 2, 2017
.
In April 2016, Caisson obtained FDA approval of an Investigational Device Exemption study using its technology for treating MR with TMVR and we are currently executing against a defined clinical data development plan designed to enable commercialization of the Caisson technology.
In August 2018, we announced the conclusion of our PRELUDE feasibility study of the TMVR system. The PRELUDE first-inhuman study evaluated the TMVR system to treat moderate to severe MR using a transseptal approach. This is a less invasive approach using a tube (catheter) through an incision in the groin, instead of an opening in the chest, to replace a patient’s mitral valve. Following the positive patient outcomes from the PRELUDE study, we began enrolling patients in the INTERLUDE CE Mark trial.
During the fourth quarter of 2018, we determined that a pause in enrollment of the INTERLUDE CE Mark trial would result in a delay in commercialization. This delay constituted a triggering event that required evaluation of the goodwill and IPR&D asset arising from the Caisson acquisition for impairment as of December 31, 2018. Based on the assessment performed, we determined that the goodwill and IPR&D asset were not impaired. A further delay or a change in management’s estimates could result in a fair value that is below its carrying amount. We will continue to monitor any changes in circumstances for indicators of impairment.
We are also invested in two mitral valve startups, Cardiosolutions, Inc. (“Cardiosolutions”) and Highlife S.A.S. (“Highlife”). Cardiosolutions, a startup headquartered in the U.S. in which we have held an interest since 2012, is developing an innovative spacer technology for treating MR. Highlife, headquartered in France, is focused on developing devices for treating MR through percutaneous replacement of the native mitral valve. We recognized an impairment of our equity method investment in, and notes receivable from, Highlife during the year ended
December 31, 2017
, due to certain factors including a revision in our investment strategy that indicated that the carrying value of our aggregate investment might not be recoverable and that the decrease in value of our aggregate investment was other than temporary. We, therefore, estimated the fair value of our investment and notes receivable using the market approach and recorded an aggregate impairment of
$13.0 million
. For further information regarding Highlife, refer to “
Note 9. Investments
”
in our consolidated financial statements and accompanying notes, beginning on page F-1 of this Annual Report on Form 10-K.
Central Sleep Apnea
We are invested in Respicardia Inc. (“Respicardia”), a U.S.-based developer of implantable therapies designed to improve Respiratory Rhythm Management and cardiovascular health. Respicardia’s remedē System is an implantable device system designed to restore a more natural breathing pattern during sleep in patients with central sleep apnea by transvenously
38
stimulating the phrenic nerve. The remedē System received CE Mark certification in 2010 and in
October 2017
, Respicardia received U.S. FDA market approval. In
September 2016
, we elected not to exercise our option to purchase the outstanding shares of Respicardia as the investment no longer met our objective for substantial ongoing involvement taken into consideration with our overall portfolio management program. As a result, in September 2016, we recorded an impairment of
$9.2 million
equal to the amount of the carrying value of the option. In addition, we terminated our exclusive distribution agreement with Respicardia in November 2016. In December 2017, certain factors, including an additional round of external financing with a new investor, indicated that the carrying value of our investment might not be recoverable and the decrease in value of our investment was other than temporary. Our estimate of the fair value of our investment using the income approach was below our carrying value and as a result, we recorded an additional impairment of
$5.5 million
. This impairment was recorded in impairment of investments in our consolidated statement of income (loss).
Results of Operations
The following table summarizes our consolidated results for the years ended
December 31, 2018
,
2017
and
2016
(in thousands):
|
Year Ended Year Ended December 31,
|
||||||||||||
|
|
2018
|
2017
|
2016
|
|||||||||
|
Net sales
|
$
|
1,106,961
|
|
$
|
1,012,277
|
|
$
|
964,858
|
|
|||
|
Costs and expenses:
|
||||||||||||
|
Cost of sales - exclusive of amortization
|
361,812
|
|
353,192
|
|
367,845
|
|
||||||
|
Product remediation
|
10,680
|
|
7,254
|
|
37,534
|
|
||||||
|
Selling, general and administrative
|
464,967
|
|
380,100
|
|
355,164
|
|
||||||
|
Research and development
|
146,024
|
|
109,516
|
|
82,078
|
|
||||||
|
Merger and integration expenses
|
24,420
|
|
15,528
|
|
20,377
|
|
||||||
|
Restructuring expenses
|
15,915
|
|
17,056
|
|
37,377
|
|
||||||
|
Amortization of intangibles
|
37,194
|
|
33,144
|
|
31,035
|
|
||||||
|
Litigation provision
|
294,021
|
|
—
|
|
—
|
|
||||||
|
Operating (loss) income from continuing operations
|
(248,072
|
)
|
96,487
|
|
33,448
|
|
||||||
|
Interest income
|
847
|
|
1,318
|
|
1,698
|
|
||||||
|
Interest expense
|
(9,825
|
)
|
(7,797
|
)
|
(10,616
|
)
|
||||||
|
Gain on acquisitions
|
11,484
|
|
39,428
|
|
—
|
|
||||||
|
Impairment of investments
|
—
|
|
(8,565
|
)
|
—
|
|
||||||
|
Foreign exchange and other (losses) gains
|
(1,881
|
)
|
267
|
|
1,136
|
|
||||||
|
(Loss) income from continuing operations before tax
|
(247,447
|
)
|
121,138
|
|
25,666
|
|
||||||
|
Income tax (benefit) expense
|
(69,629
|
)
|
49,954
|
|
5,113
|
|
||||||
|
Losses from equity method investments
|
(644
|
)
|
(16,719
|
)
|
(18,679
|
)
|
||||||
|
Net (loss) income from continuing operations
|
(178,462
|
)
|
54,465
|
|
1,874
|
|
||||||
|
Discontinued Operations:
|
||||||||||||
|
Loss from discontinued operations, net of tax
|
(10,937
|
)
|
(1,271
|
)
|
(64,663
|
)
|
||||||
|
Impairment of discontinued operations, net of tax
|
—
|
|
(78,283
|
)
|
—
|
|
||||||
|
Net loss from discontinued operations, net of tax
|
(10,937
|
)
|
(79,554
|
)
|
(64,663
|
)
|
||||||
|
Net loss
|
$
|
(189,399
|
)
|
$
|
(25,089
|
)
|
$
|
(62,789
|
)
|
|||
39
Net Sales by segments and geographic area:
The tables below present net sales by operating segment and geographic region (in thousands, except for percentages):
|
Year Ended December 31, 2018
|
Year Ended December 31, 2017
|
Year Ended December 31, 2016
|
% Change
2018 vs 2017
|
% Change
2017 vs 2016
|
||||||||||||||
|
Cardiopulmonary
|
||||||||||||||||||
|
United States
|
$
|
161,134
|
|
$
|
152,828
|
|
$
|
154,426
|
|
5.4
|
%
|
(1.0
|
)%
|
|||||
|
Europe
|
141,720
|
|
133,585
|
|
128,471
|
|
6.1
|
%
|
4.0
|
%
|
||||||||
|
Rest of world
|
233,554
|
|
210,911
|
|
191,539
|
|
10.7
|
%
|
10.1
|
%
|
||||||||
|
536,408
|
|
497,324
|
|
474,436
|
|
7.9
|
%
|
4.8
|
%
|
|||||||||
|
Heart Valves
|
||||||||||||||||||
|
United States
|
24,709
|
|
24,977
|
|
27,679
|
|
(1.1
|
)%
|
(9.8
|
)%
|
||||||||
|
Europe
|
44,258
|
|
42,120
|
|
44,301
|
|
5.1
|
%
|
(4.9
|
)%
|
||||||||
|
Rest of world
|
56,989
|
|
71,096
|
|
65,299
|
|
(19.8
|
)%
|
8.9
|
%
|
||||||||
|
125,956
|
|
138,193
|
|
137,279
|
|
(8.9
|
)%
|
0.7
|
%
|
|||||||||
|
Advanced Circulatory Support
|
||||||||||||||||||
|
United States
|
18,588
|
|
—
|
|
—
|
|
—
|
|
—
|
|
||||||||
|
Europe
|
580
|
|
—
|
|
—
|
|
—
|
|
—
|
|
||||||||
|
Rest of world
|
293
|
|
—
|
|
—
|
|
—
|
|
—
|
|
||||||||
|
19,461
|
|
—
|
|
—
|
|
—
|
|
—
|
|
|||||||||
|
Cardiovascular
|
||||||||||||||||||
|
United States
|
204,431
|
|
177,805
|
|
182,105
|
|
15.0
|
%
|
(2.4
|
)%
|
||||||||
|
Europe
|
186,558
|
|
175,705
|
|
172,772
|
|
6.2
|
%
|
1.7
|
%
|
||||||||
|
Rest of world
|
290,836
|
|
282,007
|
|
256,838
|
|
3.1
|
%
|
9.8
|
%
|
||||||||
|
681,825
|
|
635,517
|
|
611,715
|
|
7.3
|
%
|
3.9
|
%
|
|||||||||
|
Neuromodulation
|
||||||||||||||||||
|
United States
|
348,980
|
|
316,916
|
|
298,453
|
|
10.1
|
%
|
6.2
|
%
|
||||||||
|
Europe
|
42,443
|
|
34,765
|
|
31,942
|
|
22.1
|
%
|
8.8
|
%
|
||||||||
|
Rest of world
|
31,567
|
|
23,295
|
|
21,011
|
|
35.5
|
%
|
10.9
|
%
|
||||||||
|
422,990
|
|
374,976
|
|
351,406
|
|
12.8
|
%
|
6.7
|
%
|
|||||||||
|
Other
|
2,146
|
|
1,784
|
|
1,737
|
|
20.3
|
%
|
2.7
|
%
|
||||||||
|
Totals
|
||||||||||||||||||
|
United States
|
553,411
|
|
494,721
|
|
480,558
|
|
11.9
|
%
|
2.9
|
%
|
||||||||
|
Europe
(1)
|
229,001
|
|
210,470
|
|
204,846
|
|
8.8
|
%
|
2.7
|
%
|
||||||||
|
Rest of world
|
324,549
|
|
307,086
|
|
279,454
|
|
5.7
|
%
|
9.9
|
%
|
||||||||
|
Total
|
$
|
1,106,961
|
|
$
|
1,012,277
|
|
$
|
964,858
|
|
9.4
|
%
|
4.9
|
%
|
|||||
|
(1)
|
Includes those countries in Europe where we have a direct sales presence. Countries where sales are made through distributors are included in ‘Rest of world’.
|
40
The table below presents segment (loss) income from continuing operations (in thousands):
|
Year Ended December 31, 2018
|
Year Ended December 31, 2017
|
Year Ended December 31, 2016
|
% Change
2018 vs 2017
|
% Change
2017 vs 2016
|
||||||||||||||
|
Cardiovascular
|
$
|
(258,493
|
)
|
$
|
81,412
|
|
$
|
17,372
|
|
(417.5
|
)%
|
368.6
|
%
|
|||||
|
Neuromodulation
|
184,674
|
|
183,228
|
|
168,070
|
|
0.8
|
%
|
9.0
|
%
|
||||||||
|
Other
|
(96,724
|
)
|
(102,425
|
)
|
(63,205
|
)
|
5.6
|
%
|
(62.1
|
)%
|
||||||||
|
Total reportable segment (loss) income from continuing operations
(1)
|
$
|
(170,543
|
)
|
$
|
162,215
|
|
$
|
122,237
|
|
(205.1
|
)%
|
32.7
|
%
|
|||||
|
(1)
|
For a reconciliation of segment (loss) income from continuing operations to our consolidated (loss) income from continuing operations before tax, refer to “
Note 19. Geographic and Segment Information
”
in our consolidated financial statements and accompanying notes, beginning on page F-1 of this Annual Report on Form 10-K.
|
Cardiovascular
CV segment net sales increased
$46.3 million
, or
7.3%
for the year ended
December 31, 2018
, as compared to the year ended
December 31, 2017
, primarily due to growth of
$39.1 million
in cardiopulmonary product revenue and
$19.5 million
from the acquisition of TandemLife on April 4, 2018, partially offset by a
$12.2 million
decline in heart valve net sales. Cardiopulmonary product sales increased year-over-year primarily due to strong heart-lung machine sales as customers continue to upgrade from our legacy S3 device to our current S5 device and as well as strong sales of the Inspire oxygenator. With respect to heart valves, the expected termination of a manufacturing contract resulted in a decrease in heart valve net sales of $8.4 million for the year ended December 31, 2018 as compared to 2017. Additionally, increased sales of our Perceval sutureless aortic heart valves were more than offset by a non-recurring sales return reserve of $3.4 million recorded during 2018 and continuing global declines in traditional tissue heart valve and mechanical heart valve sales.
CV segment operating income decreased for the year ended
December 31, 2018
as compared to
2017
, primarily due to the
$294.0 million
litigation provision related to our 3T device that was recorded during
2018
. Additionally, positive impacts to operating income associated with the increases in net sales was more than offset by increased sales and marketing expenses related to our efforts to expand market share in international markets, increased R&D investments in support of the next generation heart-lung machine and increased legal costs associated with our 3T litigation. The inclusion of the operating results of TandemLife also resulted in a $10.8 million decrease in operating income for the year ended
December 31, 2018
as compared to
2017
.
CV segment net sales increased
$23.8 million
, or
3.9%
, for the year ended
December 31, 2017
, as compared to the year ended
December 31, 2016
due primarily to growth of
$22.9 million
in cardiopulmonary product revenue. Cardiopulmonary product sales increased year-over-year due to continued progress towards upgrading customers from our S3 heart-lung machines to our current S5 device, strong sales of our Inspire oxygenator and favorable foreign currency exchange rate fluctuations. Heart valve sales increased by
$0.9 million
for the year ended
December 31, 2017
as compared to the year ended
December 31, 2016
, due to favorable foreign currency exchange rate fluctuations, which more than offset continuing global declines in traditional tissue and mechanical heart valves.
CV segment operating income increased by
$64.0 million
for the year ended
December 31, 2017
as compared to the year ended
December 31, 2016
primarily driven by increased sales of
$23.8 million
combined with inventory fair value step-up amortization of $25.2 million that was recognized in 2016. The inventory fair value step-up was fully amortized by September 30, 2016.
Neuromodulation
Effective January 1, 2018, we began to include the results of heart failure within our NM segment for internal reporting purposes in order to manage and evaluate business activities for purposes of allocating resources and assessing performance. Segment results for the years ended
December 31, 2017
and
2016
have been recast to conform to the year ended
December 31, 2018
.
NM segment net sales increased
$48.0 million
or
12.8%
for the year ended December 31, 2018
compared to
2017
primarily due to strong adoption of the SenTiva VNS Therapy System in the U.S. Net sales in 2018 also benefited from increased sales in Europe following the approval and launch of the SenTiva VNS Therapy System in April 2018, and strong growth in the Rest of world region despite the short-term impact of business model changes.
41
NM segment operating income slightly increased
for the year ended December 31, 2018
compared to
2017
primarily due to increased sales, partially offset by increased marketing expenses related to efforts to market direct to consumer, increased R&D expenses for new projects surrounding our SenTiva VNS Therapy System, TRD and heart failure and the inclusion of the operating results of ImThera in
2018
which represented a loss of
$8.8 million
.
NM segment net sales increased
$23.6 million
, or
6.7%
, for the year ended
December 31, 2017
as compared to
2016
, primarily due to strong demand for the AspireSR VNS Therapy System and the launch of the SenTiva VNS Therapy System in October 2017.
The increase in NM segment operating income for the year ended
December 31, 2017
, as compared to
2016
, was primarily driven by increased operating leverage as a result of higher net sales, partially offset by the increased costs associated with sales force expansion and marketing efforts in the U.S.
Costs and Expenses
The table below illustrates our costs and expenses as a percentage of net sales:
|
Year Ended December 31, 2018
|
Year Ended December 31, 2017
|
Year Ended December 31, 2016
|
|||||||
|
Cost of sales - exclusive of amortization
|
32.7
|
%
|
34.9
|
%
|
38.1
|
%
|
|||
|
Product remediation
|
1.0
|
%
|
0.7
|
%
|
3.9
|
%
|
|||
|
Selling, general and administrative
|
42.0
|
%
|
37.5
|
%
|
36.8
|
%
|
|||
|
Research and development
|
13.2
|
%
|
10.8
|
%
|
8.5
|
%
|
|||
|
Merger and integration expenses
|
2.2
|
%
|
1.5
|
%
|
2.1
|
%
|
|||
|
Restructuring expenses
|
1.4
|
%
|
1.7
|
%
|
3.9
|
%
|
|||
|
Amortization of intangibles
|
3.4
|
%
|
3.3
|
%
|
3.2
|
%
|
|||
|
Litigation provision
|
26.6
|
%
|
—
|
%
|
—
|
%
|
|||
Cost of Sales
Cost of sales consisted primarily of direct labor, allocated manufacturing overhead, the acquisition cost of raw materials and components.
Cost of sales as a percentage of net sales was
32.7%
for the year ended
December 31, 2018
, a decrease of
2.2%
as compared to 2017. This decrease was primarily due to product mix, pricing discipline and our focus on cost efficiencies.
Cost of sales as a percentage of net sales was
34.9%
for the year ended
December 31, 2017
, a decrease of
3.2%
as compared to
2016
. This decrease was due to the decrease in amortization of inventory written-up to fair value in the merger of Sorin and Cyberonics related to the CV segment of
$25.2 million
, which accounted for
2.6%
of net sales for 2016. The inventory fair value step-up was fully amortized by September 30, 2016.
Product Remediation
Product remediation as a percentage of net sales was
1.0%
,
0.7%
and
3.9%
for the years ended
December 31, 2018
,
2017
and
2016
, respectively. Product remediation expenses include internal labor costs, costs to remediate certain inspectional observations made by the FDA at our Munich facility and costs associated with the incorporation of the modification of the 3T device design into the next generation heater cooler device. Product remediation expenses for the year ended
December 31, 2016
also include
$37.5 million
for the recognition of the product remediation plan liability.
Selling, General and Administrative (“SG&A”) Expenses
SG&A expenses are comprised of sales, marketing, general and administrative activities. SG&A expenses exclude expenses incurred in connection with the merger between Cyberonics and Sorin, integration costs after the merger and restructuring costs under the restructuring plans initiated after the merger.
SG&A expenses as a percentage of net sales increased
for the year ended December 31, 2018
as compared to
2017
primarily due to key growth driver investments in the U.S., including efforts to market directly to consumers within our NM business, acquisition costs and additional SG&A costs from the acquisitions of TandemLife and ImThera. Increased sales and marketing expenses internationally for general market expansion, increased litigation expenses primarily related to our 3T devices and the overall strengthening of our organizational capabilities to support growth also contributed to the increase in SG&A expenses as a percentage of net sales.
42
SG&A expenses as a percentage of net sales for the year ended
December 31, 2017
increased
0.7%
to
37.5%
as compared to the 2016. This increase was largely attributable to litigation expenses related to our 3T devices, costs associated with acquisitions and other legal matters.
Research and Development Expenses
R&D expenses consist of product design and development efforts, clinical study programs and regulatory activities, which are essential to our strategic portfolio initiatives, including TMVR, TRD, obstructive sleep apnea and heart failure.
R&D expenses as a percentage of net sales increased
for the year ended December 31, 2018
as compared to
2017
primarily due to additional R&D expenses for our development of next generation products, including heart-lung machines, the SenTiva VNS Therapy System and TandemLife and clinical trials and investments in TRD, TMVR, obstructive sleep apnea and heart failure.
R&D expenses as a percentage of net sales for the year ended
December 31, 2017
increased by
2.3%
to
10.8%
as compared to
2016
. The increase was primarily due to the acquisition of Caisson in May 2017, inclusive of
$5.8 million
in post-combination compensation expense recognized concurrent with the acquisition of Caisson, and
$7.2 million
in compensation expense associated with the retention of the employees of Caisson. The additional increase as compared to the prior year was due to increased investment in clinical and registries pertaining to TMVR and heart failure.
Merger and Integration (“M&I”) Expenses
M&I expenses consist primarily of costs associated with computer systems integration efforts, organizational structure integration, synergy and tax planning. M&I expenses as a percentage of net sales increased
0.7%
to
2.2%
for the year ended
December 31, 2018
as compared to
2017
, primarily due to costs associated with efforts to improve and standardize product pricing and procurement strategies.
Restructuring Expenses
Our restructuring plans leverage economies of scale, eliminate duplicate corporate expenses and streamline distributions, logistics and office functions in order to reduce overall costs. Restructuring expenses are detailed in “
Note 6. Restructuring
”
in our consolidated financial statements and accompanying notes, beginning on page F-1 of this Annual Report on Form 10-K.
Our 2015 and 2016 Reorganization Plans (the “Prior Plans”) were initiated in October 2015 and March 2016, respectively, in conjunction with the completion of the merger of Sorin and Cyberonics. The Prior Plans included the Costa Rica manufacturing operation exit plan, initiated in December 2016 and completed during 2017, and the Suzhou, China exit plan, initiated in March 2017 and completed during 2018.
The decline in restructuring expenses for the years ended December 31, 2018 and December 31, 2017 as compared to the prior year was due to a decrease in restructuring activities.
Amortization of Intangibles
Amortization of intangible assets for the years ended
December 31, 2018
and
2017
, consisted primarily of amortization of intellectual property and customer relationships acquired at fair value in the merger of Sorin and Cyberonics on October 19, 2015. Amortization of
$37.2 million
for the year ended
December 31, 2018
increased by
$4.1 million
as compared to
2017
, due primarily to the amortization of intangible assets recognized as part of the acquisition of TandemLife in April 2018.
Litigation Provision
During the year ended
December 31, 2018
, we recognized a
$294.0 million
litigation provision involving our 3T device. For further information, refer to “
Note 13. Commitments and Contingencies
”
in our consolidated financial statements and accompanying notes, beginning on page F-1 of this Annual Report on Form 10-K.
Interest Expense
We incurred interest expense of
$9.8 million
for the year ended
December 31, 2018
, as compared to
$7.8 million
and
$10.6 million
for
2017
and
2016
, respectively. The increase for the year
December 31, 2018
as compared to
2017
was primarily due to increased debt borrowings in
2018
while the decrease noted for the year ended
December 31, 2017
as compared to
2016
was primarily due to a reduction in income tax related interest expense for our inter-company sale of intellectual property for the year ended
December 31, 2017
, as compared to the prior year, as a result of a reduction in the income tax liability.
43
Gain on Acquisitions
On
January 16, 2018
, we acquired the remaining outstanding interest of ImThera. On the acquisition date, we remeasured our existing investment in ImThera at fair value and recognized a pre-tax non-cash gain of
$11.5 million
.
On
May 2, 2017
, we acquired the remaining
51%
equity interests in Caisson. On the acquisition date, we remeasured our notes receivable due from Caisson and our existing investment in Caisson at fair value and recognized a pre-tax non-cash gain of
$1.3 million
and
$38.1 million
, respectively.
Impairment of Investments
In 2017, we impaired our investments in Respicardia and Rainbow Medical Ltd., in the amounts of $5.5 million and $3.0 million, respectively. For further information, refer to “
Note 9. Investments
”
in our consolidated financial statements and accompanying notes, beginning on page F-1 of this Annual Report on Form 10-K.
Foreign Exchange (“FX”) and Other
Due to the global nature of our operations, we are exposed to foreign currency exchange rate fluctuations. Foreign exchange and other losses were
$1.9 million
for the year ended December 31, 2018
, consisting of FX losses associated with intercompany debt and third-party financial assets and liabilities denominated in foreign currencies, net of the impact of foreign currency derivative contracts established to hedge against exchange rate movements.
Foreign exchange and other gains were
$0.3 million
for the year ended
December 31, 2017
, consisting of FX losses of
$2.9 million
offset by a
$3.2 million
gain on the sale of our equity investment in Istituto Europeo di Oncologia S.R.L.
Foreign Exchange and other gains consisted of FX gains of
$1.1 million
for the year ended
December 31, 2016
, primarily as a result of our intercompany debt and third-party financial assets and liabilities denominated in foreign currencies, net of the impact of foreign currency derivative contracts established to hedge against exchange rate movements.
Income Taxes
LivaNova PLC is domiciled and resident in the UK. Our subsidiaries conduct operations and earn income in numerous countries and are subject to the laws of taxing jurisdictions within those countries, and the income tax rates imposed in the tax jurisdictions in which our subsidiaries conduct operations vary. As a result of the changes in the overall level of our income, the earnings mix in various jurisdictions and the changes in tax laws, our consolidated effective income tax rate may vary substantially from one reporting period to another.
Our effective income tax rate from continuing operations
for the year ended December 31, 2018
was
28.1%
compared with
41.2%
for the year ended December 31, 2017. Our effective income tax rate fluctuates based on, among other factors, changes in pretax income in countries with varying statutory tax rates, changes in valuation allowances, changes in tax credits and incentives and changes in unrecognized tax benefits associated with uncertain tax positions.
Compared with the year ended
December 31, 2017
, the decrease in the effective tax rate for 2018 was primarily attributable to the impact of the reduction to the U.S. federal statutory tax rate as a result of the Tax Act enacted on December 22, 2017, the repeal of the U.S. domestic production activity deduction, certain tax law changes in the UK that occurred during the three months ended December 31, 2017, the 2018 acquisitions of Imthera Medical Inc. and CardiacAssist, Inc., the sale of CRM, audit settlements in Italy and Germany and the impact of other discrete tax items.
During the years ended
December 31, 2017
and 2016, we recorded income tax expense from continuing operations of
$50.0 million
and
$5.1 million
, respectively, with effective income tax rates of
41.2%
and
19.9%
, respectively.
Our
41.2%
effective income tax rate for the year ended
December 31, 2017
included the impact of various discrete tax items, including the non-cash net charge of $27.5 million recorded as a result of the Tax Act and the acquisition of Caisson, inclusive of the
$38.1 million
non-taxable gain recognized to re-measure our existing equity investments in Caisson at fair value on the acquisition date.
Our
19.9%
effective income tax rate for the year ended
December 31, 2016
included the impact of various discrete tax items, primarily related to a reduction in valuation allowances in the U.S. related to capital loss carryforwards, partially offset by an increase in tax expense related to an unrecognized tax benefit from a tax position taken in prior years.
U.S. Tax Reform
The Tax Act, which is also commonly referred to as “U.S. tax reform,” significantly changed U.S. corporate income tax laws by, among other things, reducing the U.S. corporate income tax rate to 21%, which commenced in 2018.
44
During the fourth quarter of 2018, we finalized our accounting under Staff Accounting Bulletin No. 118 for the remeasurement of the deferred tax assets and liabilities and impairment of foreign tax credits related to the Tax Act. Our accounting for the remeasurement is complete with a final non-cash net charge of
$21.0 million
.
The Tax Act also established various other new U.S. corporate income tax laws that came into effect in 2018 along with proposed regulations issued in 2018. The extent to which these and other provisions of the Tax Act, or future legislation or final regulations clarifying the Tax Act, could impact our consolidated effective income tax rate in future periods depends on many factors including, but not limited to, the amount of profit generated by our subsidiaries operating in the U.S., the impact of the Company’s current or contemplated tax planning strategies, the impact of new or amended tax laws or regulations by the U.S. and by countries outside the U.S., and other factors beyond our control.
Brexit
On June 23, 2016, the UK held a referendum in which voters approved an exit from the EU, commonly referred to as “Brexit.” On March 29, 2017, the UK government gave formal notice of its intention to leave the EU, formally commencing the negotiations regarding the terms of withdrawal between the UK and the EU. Negotiations between the UK and the EU continue about provisions of the withdrawal agreement. Unless the deadline is extended, the UK will leave the EU on March 29, 2019. Although the long-term effects of Brexit will depend on any agreements the UK makes to retain access to the EU markets, Brexit has created additional uncertainties that may ultimately result in new regulatory costs and challenges for medical device companies and increased restrictions on imports and exports throughout Europe. This could adversely affect our ability to conduct and expand our operations in Europe and may have an adverse effect on our business, financial condition and results of operations.
The notification does not change the application of existing tax laws and does not establish a clear framework for what the ultimate outcome of the negotiations and legislative process will be. Various tax reliefs and exemptions that apply to transactions between EU Member States under existing tax laws may cease to apply to transactions between the UK and EU Member States when the UK ultimately withdraws from the EU. It is unclear at this stage if or when any new tax treaties between the UK and the EU or individual EU Member States will replace those reliefs and exemptions. It is also unclear at this stage what financial, trade and legal implications will ensue from Brexit and how Brexit may ultimately affect us, our customers, suppliers, vendors, or our industry.
We and several of our wholly owned subsidiaries that are domiciled either in the UK, various EU Member States, or in the U.S., are party to intercompany transactions and agreements under which we receive various tax reliefs and exemptions in accordance with applicable international tax laws, treaties and regulations. If certain treaties applicable to our transactions and agreements change materially, Brexit may have a material adverse impact on our future financial results and results of operations. We continue to monitor and assess the potential impact of this event and explore possible tax-planning strategies that may mitigate or eliminate potential adverse impacts.
We will not account for the impact of Brexit in our income tax provisions until changes in tax laws or treaties between the UK and the EU or individual EU Member States with the UK and/or the U.S. are enacted, or the withdrawal becomes effective.
European Union State Aid Challenge
On October 26, 2017, the European Commission (“EC”) announced that an investigation will be opened with respect to the UK’s controlled foreign company (“CFC”) rules. The CFC rules under investigation provide certain tax exceptions to entities controlled by UK parent companies that are subject to lower tax rates if the activities being undertaken by the CFC relate to financing. The EC is investigating whether the exemption is a breach of EU State Aid rules. The investigation is estimated to be completed during the quarter ended March 31, 2019, with an appeal process likely to follow. It is unclear as to whether the UK will be part of the EU once a decision has been finalized due to Brexit and what impact, if any, Brexit will have on the outcome of the investigation or the enforceability of a decision. Due to the many uncertainties related to this matter, including the state of the investigation, the pending Brexit negotiations and political environment and the unknown outcome of the investigation and resulting appeals, no uncertain tax position reserve has been recognized related to this matter and we are unable to reasonably estimate the potential liability.
Losses from Equity Method Investments
Due to an additional investment by a third party during the year ended
December 31, 2018
, our equity interest in Highlife decreased to 7.8% from 24.6%. We determined that we no longer had significant influence over Highlife and, as a result, we began to measure Highlife at cost minus impairment, if any, plus or minus changes resulting from observable price changes in orderly transactions for the identical or similar investment of the same issuer. Losses from equity method investments were
$0.6 million
for the year ended December 31, 2018
, which was attributable to Highlife. Losses
for the year ended December
45
31, 2017
of
$16.7 million
were due primarily to the impairment of our investment in, and notes receivable from, Highlife of $13.0 million.
We recognized losses from equity method investments of
$18.7 million
for the year ended
December 31, 2016
due to investee losses of Caisson, Highlife and Respicardia and the impairment of our investment in Respicardia of $9.2 million. In November 2016, we terminated our distributor agreement with Respicardia. The distributor agreement had been a key component in the determination of whether our influence over Respicardia was significant and, as a result, we determined that we no longer had significant influence over Respicardia.
Results of Discontinued Operations
The table below illustrates the results of discontinued operations (in thousands):
|
|
Year Ended December 31, 2018
|
Year Ended December 31, 2017
|
Year Ended December 31, 2016
|
|||||||||
|
Loss from discontinued operations, net of tax
|
$
|
(10,937
|
)
|
$
|
(1,271
|
)
|
$
|
(64,663
|
)
|
|||
|
Impairment of discontinued operations, net of tax
|
—
|
|
(78,283
|
)
|
—
|
|
||||||
|
Net loss from discontinued operations, net of tax
|
$
|
(10,937
|
)
|
$
|
(79,554
|
)
|
$
|
(64,663
|
)
|
|||
We completed the CRM Sale on April 30, 2018, for total cash proceeds of $195.9 million, less cash transferred of $9.2 million, subject to a closing working capital adjustment. In conjunction with the sale, we entered into transition services agreements to provide certain support services generally for up to twelve months from the closing date of the sale. The services include, among others, accounting, information technology, human resources, quality assurance, regulatory affairs, supply chain, clinical affairs and customer support. For the year ended
December 31, 2018
, we recognized income of $2.8 million for providing these services. Income recognized related to the transition services agreements is recorded as a reduction to the related expenses in the associated expense line items in our consolidated statement of income (loss).
In November 2017, we concluded that the sale of CRM represented a strategic shift in our business that would have a major effect on future operations and financial results. Accordingly, the operating results of CRM are classified as discontinued operations in our consolidated statements of income (loss) for all the periods presented in this Annual Report on Form 10-K. The assets and liabilities of CRM are presented as assets or liabilities of discontinued operations in the consolidated balance sheets at
December 31, 2017
in “
Note 5. Discontinued Operations
”
in our consolidated financial statements and accompanying notes, beginning on page F-1 of this Annual Report on Form 10-K.
Additionally, we tested the long-lived assets of CRM for impairment and recognized an impairment to tangible and intangible assets of
$78.3 million
, net of a
$15.3 million
tax benefit during the year ended
December 31, 2017
.
Significant Accounting Policies and Critical Accounting Estimates
We have adopted various accounting policies to prepare the consolidated financial statements in accordance with accounting principles generally accepted in the U.S. (“U.S. GAAP”). Our most significant accounting policies are disclosed in “
Note 2. Basis of Presentation, Use of Accounting Estimates and Significant Accounting Policies
” in our consolidated financial statements and accompanying notes, beginning on page F-1 of this Annual Report on Form 10-K. New accounting pronouncements are disclosed in “
Note 22. New Accounting Pronouncements
”
in our consolidated financial statements and accompanying notes, beginning on page F-1 of this Annual Report on Form 10-K.
To prepare our consolidated financial statements in conformity with U.S. GAAP, management makes estimates and assumptions that may affect the reported amounts of our assets and liabilities, the disclosure of contingent liabilities as of the date of our consolidated financial statements and the reported amounts of our revenue and expenses during the reporting period. Our actual results may differ from these estimates. We consider estimates to be critical if we are required to make assumptions about material matters that are uncertain at the time of estimation, or if materially different estimates could have been made or it is reasonably likely that the accounting estimate will change from period to period. The following are areas requiring management’s judgment that we consider critical:
Business Combinations and Goodwill
We allocate the amounts we pay for an acquisition to the assets we acquire and liabilities we assume based on their fair values at the date of acquisition, including property, plant and equipment, inventories, accounts receivable, long-term debt, and identifiable intangible assets which either arise from a contractual or legal right or are separable from goodwill. We base the fair value of identifiable intangible assets acquired in a business combination, including IPR&D, on valuations that use
46
information and assumptions provided by management, which consider management’s best estimates of inputs and assumptions that a market participant would use. We allocate any excess purchase price over the fair value of the net tangible and identifiable intangible assets acquired to goodwill. Transaction costs associated with these acquisitions are expensed as incurred and are reported in selling, general and administrative on the consolidated statements of income (loss). We recognize adjustments to the provisional amounts identified during the measurement period with a corresponding adjustment to goodwill in the reporting period in which the adjustment amounts are determined. The effect on earnings of changes in depreciation, amortization or other income effects, if any, as a result of the change to the provisional amounts are recorded in the same period’s consolidated financial statements, calculated as if the accounting had been completed at the acquisition date.
Intangible Assets, Other than Goodwill
Intangible assets shown on the consolidated balance sheets consist of finite-lived and indefinite-lived assets expected to generate future economic benefits and are recorded at their respective fair values as of their acquisition date. Finite-lived intangible assets consist primarily of developed technology and technical capabilities, including patents, related know-how and licensed patent rights, trade names, customer relationships and favorable leases acquired in acquisitions. Customer relationships consist of relationships with hospitals and cardiac surgeons in the countries where we operate. Indefinite-lived intangible assets other than goodwill are composed of IPR&D assets acquired in acquisitions. We estimate the useful lives of our intangible assets, which requires significant management judgment. We amortize our finite-lived intangible assets over their useful lives using the straight-line method.
Amortization expense is disclosed separately on our consolidated statements of income (loss). We evaluate our intangible assets each reporting period to determine whether events and circumstances indicate either a different useful life or impairment. If we change our estimate of the useful life of an asset, we amortize the carrying amount over the revised remaining useful life.
Impairment of Long-Lived Assets and Goodwill
We review, when circumstances warrant, the carrying amounts of our property and equipment and our intangible assets to determine whether such carrying amounts continue to be recoverable. Such changes in circumstance may include, among other items, an expectation of a sale or disposal of a long-lived asset or asset group, adverse changes in market or competitive conditions, an adverse change in legal factors or business climate in the markets in which we operate and operating or cash flow losses. For purposes of impairment testing, long-lived assets are grouped at the lowest level for which cash flows are largely independent of other assets and liabilities, generally at or below the reporting unit level. If the carrying amount of the asset or asset group is greater than the expected undiscounted cash flows to be generated by such asset or asset group, an impairment adjustment is recognized. Such adjustment is measured by the amount that the carrying value of such asset or asset group exceeds its fair value. We generally measure fair value by considering sale prices for similar assets, discounted estimated future cash flows using an appropriate discount rate and/or estimated replacement cost. Assets to be disposed of are carried at the lower of their financial statement carrying amount or fair value less costs to sell.
We evaluate the goodwill and indefinite-lived intangible assets for impairment at least annually on October 1st and whenever other facts and circumstances indicate that the carrying amounts of goodwill and other indefinite-lived intangible assets may not be recoverable. In the case of goodwill, if it is more-likely-than-not that a reporting unit’s fair value is less than its carrying value, we then compare the fair value of the reporting unit to its respective carrying amount. A reporting unit is an operating segment or one level below an operating segment (referred to as a “component”). Our operating segments are deemed to be our reporting units. If the carrying value of a reporting unit were to exceed its fair value, we would then compare the implied fair value of the reporting unit’s goodwill to its carrying amount, and any excess of the carrying amount over the fair value would be charged to operations as an impairment loss. With respect to indefinite-lived intangible assets, if it is more-likely-than-not that the fair value of an indefinite-lived intangible asset is less than its carrying value, we then estimate its fair value and any excess of the carrying value over the fair value of the indefinite-lived intangible asset is also charged to operations as an impairment loss.
Revenue
For the years presented in our
consolidated statements of income (loss)
prior to December 31, 2018, we recognized revenue under the Financial Accounting Standards Board (the “FASB”) Accounting Standards Codification Topi
c
605,
Revenue Recognition.
We recognized revenue when persuasive evidence of a sales arrangement existed, title to the goods and risk of loss transferred to the customer or to an independent distributor, the selling price was fixed or determinable and collectability was reasonably assured. We estimated expected sales returns based on historical data and recorded a reduction of sales with a return reserve. We recorded state and local sales taxes net; that is, we excluded sales tax from revenue. Service related revenue was recognized on the basis of progress of the services, when services were rendered, when collectability was reasonably assured and when the amount was fixed and determinable.
47
In May 2014, the FASB issued ASC Update (“ASU”) No. 2014-09,
Revenue from Contracts with Customers
(Topic 606)
.
Update No. 2014-09 requires an entity to recognize the amount of revenue to which it expects to be entitled for the transfer of promised goods or services to customers and replaces most existing revenue recognition guidance. We adopted the new revenue guidance on January 1, 2018. We elected the cumulative effect transition method; however, we recognized no cumulative effect to the opening balance of retained earnings because the impact on the timing of when revenue is recognized was insignificant.
We generate our revenue through contracts with customers. Our customers are primarily hospitals, healthcare institutions, distributors and other organizations. Revenue is measured based on consideration specified in a contract with a customer, and excludes amounts collected on behalf of third parties, such as sales tax. We measure the consideration based upon the estimated amount to be received. The amount of consideration we ultimately receive varies depending upon the return terms, sales rebates, discounts, and other incentives that we may offer, which are accounted for as variable consideration when estimating the amount of revenue to recognize. The estimate of variable consideration requires significant judgment.
We recognize revenue when a performance obligation is satisfied by transferring the control of a product, or providing service, to a customer. Some of our contracts include the purchase of multiple products and/or services. In such cases, we allocate the transaction price based upon the relative estimated stand-alone price of each product and/or service sold. Typically, our contracts do not have a significant financing component. We have historically experienced a low rate of product returns and the total dollar value of product returns has not been significant to our consolidated financial statements.
We incur incremental commission fees paid to the sales force associated with the sale of products. We elected the practical expedient within ASC 606-10-50-22 and recognize the incremental costs of obtaining a contract as an expense when incurred if the amortization period of the asset the entity would otherwise recognize is one year or less. As a result, no commissions are capitalized as contract costs at
December 31, 2018
.
Income Taxes
We are a UK corporation, and we operate through our various subsidiaries in a number of countries throughout the world. Our provision for income taxes is based on the tax laws and rates applicable in the jurisdictions in which we operate and earn income. We use significant judgment and estimates in accounting for our income taxes. We recognize deferred tax assets and liabilities for the anticipated future tax effects of temporary differences between the financial statements basis and the tax basis of our assets and liabilities, which are measured using enacted tax rates expected to apply to taxable income in the years in which those temporary differences are expected to be recovered or settled.
We file federal and local tax returns in many jurisdictions throughout the world and are subject to income tax examinations for our fiscal year 1998 and subsequent years, with certain exceptions. While we believe that our tax return positions are fully supported, tax authorities may disagree with certain positions we have taken and assess additional taxes and as a result, we may establish reserves for uncertain tax positions, which require a significant degree of management judgment. We regularly assess the likely outcomes of our tax positions in order to determine the appropriateness of our reserves; however, the actual outcome of an audit can be significantly different than our expectations, which could have a material impact on our tax provision. The total amount of unrecognized tax benefit, as of December 31, 2018, if recognized, would reduce our income tax expense by approximately
$19.7 million
. Our tax positions are evaluated for recognition using a more-likely-than-not threshold. Uncertain tax positions requiring recognition are measured as the largest amount of tax benefit that has a greater than 50% likelihood of being realized upon effective settlement with a taxing authority that has full knowledge of all relevant information. Some of the reasons a reserve for an uncertain tax position may be reversed are: completion of a tax audit; a change in applicable tax law including a tax case or legislative guidance; or an expiration of the statute of limitations. We recognize interest and penalties associated with unrecognized tax benefits and record interest in interest expense, and penalties in selling, general and administrative expense, in our consolidated statements of income (loss).
We periodically assess the recoverability of our deferred tax assets by considering whether it is more-likely-than-not that some or all of the actual benefit of those assets will be realized. To the extent that realization does not meet the “more-likely-than-not” criterion, we establish a valuation allowance. We periodically review the adequacy and necessity of the valuation allowance by considering significant positive and negative evidence relative to our ability to recover deferred tax assets and to determine the timing and amount of valuation allowance that should be released. This evidence includes: profitability in the most recent quarters; internal forecasts for the current and next two future years; size of deferred tax asset relative to estimated profitability; the potential effects on future profitability from increasing competition, healthcare reforms and overall economic conditions; limitations and potential limitations on the use of our net operating losses due to ownership changes, pursuant to IRC Section 382; and the implementation of prudent and feasible tax planning strategies, if any.
The Tax Act also established various other new U.S. corporate income tax laws that came into effect in 2018 along with proposed regulations issued in 2018. The extent to which these and other provisions of the Tax Act, or future legislation or final
48
regulations clarifying the Tax Act, could impact our consolidated effective income tax rate in future periods depends on many factors including, but not limited to, the amount of profit generated by our subsidiaries operating in the U.S., the impact of the Company’s current or contemplated tax planning strategies, the impact of new or amended tax laws or regulations by the U.S. and by countries outside the U.S., and other factors beyond our control. During the fourth quarter of 2018, we finalized our accounting under SAB 118 for the remeasurement of the deferred tax assets and liabilities and impairment of foreign tax credits related to the Tax Act. Our accounting for the remeasurement is complete with a final non-cash net charge of
$21.0 million
.
New Accounting Pronouncements
For a discussion of new accounting standards and disclosure requirements, please refer to “
Note 22. New Accounting Pronouncements
”
in our consolidated financial statements and accompanying notes, beginning on page F-1 of this Annual Report on Form 10-K.
Liquidity and Capital Resources
The consolidated financial statements have been prepared on the basis that LivaNova will continue as a going concern. As further discussed in “Note 13. Commitments and Contingencies,” the Company has recorded a $294.1 million litigation provision liability based on managements’ best estimate, of which $161.9 million is anticipated to be paid during 2019 and the majority of the remainder is expected to be paid in the first half of 2020. In connection with our assessment of going concern considerations in accordance with ASU 2014-15, “
Disclosures of Uncertainties about an Entity’s Ability to Continue as a Going Concern,
” the Company determined that collectively the payments of the $294.1 million liability and the $23.3 million of current debt obligations represent a condition that raises substantial doubt about our ability to continue as a going concern as the Company does not have sufficient liquidity to meet its obligations as they come due. However, on February 25, 2019, the Company received $350.0 million in aggregate financing commitments pursuant to a commitment letter from Bank of America Merrill Lynch, Barclays, BNP Paribas and Intesa Sanpaolo for a debt facility (the “Commitment Letter”), the closing of which is subject to certain conditions. Management anticipates the financing to be executed no later than April 26, 2019. Management has concluded that the anticipated execution of the debt facility agreement based on the Commitment Letter, when combined with current and anticipated future operating cash flows, alleviates the substantial doubt about the Company’s ability to continue as a going concern over the 12 month period from the issuance date of these financial statements given management has concluded that it is probable that the financing will be executed.
Pursuant to the Commitment Letter, the Company appoints each of the Banks as a mandated lead arranger, underwriter and bookrunner in respect of a multicurrency term loan facility (the “Facility”) in the aggregate amount of $350 million.
The commitment of the Banks to arrange and underwrite the Facility is made subject to the satisfaction of certain conditions precedent, including, but not limited to the following: (a) compliance by the Company with all the terms of the Commitment Letter, the appended term sheet, and the fee letter in respect of fees owed to the Banks (the “Fee Letter”) (one such condition precedent being the repayment of any funds drawn under the 2018 $70 million revolving facility made available by Barclays Bank PLC), (b) accuracy and completeness of the Company (or group company) representations and warranties required by each of the Commitment Letter, the associated term sheet and the Fee Letter, (c) the execution and delivery of the agreement in respect of the Facility and associated documents no later than April 26, 2019 and (d) satisfactory completion of client identification procedures.
Pursuant to the Fee Letter, the Company is obligated to pay certain fees to the Banks.
Based on our current business plan, we believe that our existing cash and cash equivalents, future cash generated from operations and borrowing under the Commitment Letter will be sufficient to fund our expected operating needs, working capital requirements, R&D opportunities, capital expenditures, obligations anticipated for the litigation involving our 3T device and debt service requirements over the 12-month period beginning from the issuance date of these financial statements. Our liquidity could be adversely impacted by the factors affecting future operating results, including those referred to in “Item 1A. Risk Factors” of this Annual Report on Form 10-K.
49
Cash Flows
Net cash and cash equivalents provided by (used in) operating, investing and financing activities and the net increase (decrease) in the balance of cash and cash equivalents were as follows (in thousands):
|
Year Ended December 31, 2018
|
Year Ended December 31, 2017
|
Year Ended December 31, 2016
|
||||||||||
|
Operating activities
|
$
|
120,489
|
|
$
|
91,339
|
|
$
|
90,151
|
|
|||
|
Investing activities
|
(120,556
|
)
|
(52,855
|
)
|
(44,516
|
)
|
||||||
|
Financing activities
|
(42,348
|
)
|
11,294
|
|
(118,039
|
)
|
||||||
|
Effect of exchange rate changes on cash and cash equivalents
|
(3,996
|
)
|
4,048
|
|
(420
|
)
|
||||||
|
Net (decrease) increase
|
$
|
(46,411
|
)
|
$
|
53,826
|
|
$
|
(72,824
|
)
|
|||
Operating Activities
Cash provided by operating activities
for the year ended December 31, 2018
increased
$29.2 million
as compared to 2017, primarily due to improved working capital management offset by a decrease in net income adjusted for non-cash items.
Cash provided by operating activities for the year ended
December 31, 2017
was
$91.3 million
, primarily due to adjustments to net income of
$220.0 million
for non-cash items, which included a non-cash loss of
$93.6 million
related to the impairment of tangible and intangible assets of our discontinued operations, and depreciation and amortization of $82.9 million, offset by utilization of cash for operating assets and liabilities of
$103.6 million
.
Cash provided by operating activities for the year ended
December 31, 2016
was
$90.2 million
, primarily due to a net loss of
$62.8 million
offset by
$161.3 million
of non-cash items. Non-cash items were principally composed of $85.4 million in depreciation and amortization and $19.6 million in stock-based compensation.
Investing Activities
Cash used in investing activities
during the year ended December 31, 2018
increased
$67.7 million
as compared to 2017. The increase primarily resulted from an increase in cash paid for acquisitions of
$265.5 million
, partially offset by cash received from the sale of CRM of
$186.7 million
and an increase in proceeds from asset sales of
$8.3 million
.
Cash used in investing activities was
$52.9 million
during the year ended
December 31, 2017
. We invested
$34.1 million
in property, plant and equipment. We also utilized cash of
$27.9 million
related to our investments in privately held medical start-up companies, which included the purchase of the 51% of the remaining interest in Caisson utilizing cash of
$14.2 million
, and investments in, and loans to, our equity investees of
$13.7 million
.
Cash used in investing activities was
$44.5 million
during the year ended
December 31, 2016
, primarily due to $38.4 million invested in property, plant and equipment and investments in, and loans to, our equity investees of $14.3 million. These amounts were partially offset by the transfer of
$7.0 million
to cash and cash equivalents from short-term investments.
Financing Activities
Cash used in financing activities
during the year ended December 31, 2018
increased
$53.6 million
as compared to 2017, primarily due to
$50.0 million
in cash used to repurchase shares in 2018 under a publicly announced repurchase plan and a
$13.0 million
payment for deferred consideration related to an acquisition, partially offset by an increase in net borrowings of
$17.3 million
.
Cash provided by financing activities during the year ended
December 31, 2017
was
$11.3 million
, which included $32.4 million in borrowings under our revolving credit facilities and repayment of long-term debt of $22.8 million.
Cash used in financing activities during the year ended
December 31, 2016
was $118.0 million, which included $54.5 million to repurchase shares under a publicly announced repurchase plan, a $33.7 million reduction in revolving credit facilities, repayment of advances on customer receivables of $23.8 million and repayment of long-term debt of $21.1 million. We also borrowed $7.2 million in additional long-term debt.
Debt and Capital
Our capital structure consists of debt and equity.
As of December 31, 2018
, our total debt of
$168.3 million
was
11.2%
of total equity of
$1.5 billion
. At
December 31, 2017
, our total debt of
$146.0 million
was
8.0%
of total equity of
$1.8 billion
.
50
During the year ended
December 31, 2018
, we reduced our outstanding revolving credit facilities by
$50.7 million
, repaid
$23.8 million
of long-term debt obligations and borrowed
$103.6 million
in additional long-term debt.
During the year ended
December 31, 2017
, we increased our outstanding revolving credit facilities by
$32.4 million
, repaid
$22.8 million
of long-term debt obligations and borrowed
$2.0 million
in additional long-term debt.
During the year ended
December 31, 2016
, we reduced our outstanding revolving credit facilities by
$33.7 million
, repaid
$21.1 million
of long-term debt obligations and borrowed
$7.2 million
in additional long-term debt.
Factoring
During the year ended
December 31, 2016
, we reduced our obligation for advances on customer receivables by
$23.8 million
, thereby eliminating this form of financing.
Off-Balance Sheet Arrangements
As of December 31, 2018, we did not have any off-balance sheet arrangements.
Contractual Obligations
We have various contractual commitments that we expect to fund from existing cash, future operating cash flows and borrowings under our revolving credit facilities. The actual timing of the clinical commitment payments may vary based on the completion of milestones which are beyond our control. The following table summarizes our significant contractual obligations
as of December 31, 2018
and the periods in which such obligations are due (in thousands):
|
Less Than One Year
|
One to Three Years
|
Three to Five Years
|
Thereafter
|
Total Contractual Obligations
|
||||||||||||||||
|
Principal payments on debt obligations
|
$
|
28,794
|
|
$
|
63,556
|
|
$
|
35,583
|
|
$
|
40,399
|
|
$
|
168,332
|
|
|||||
|
Interest payments on long-term debt
|
4,436
|
|
7,343
|
|
4,626
|
|
2,269
|
|
18,674
|
|
||||||||||
|
Operating leases
|
11,986
|
|
21,031
|
|
14,998
|
|
20,943
|
|
68,958
|
|
||||||||||
|
Inventory supply contract obligations
|
20,228
|
|
1,620
|
|
—
|
|
—
|
|
21,848
|
|
||||||||||
|
Derivative instruments
|
5,063
|
|
329
|
|
—
|
|
—
|
|
5,392
|
|
||||||||||
|
Contingent consideration
(1)
|
18,530
|
|
94,603
|
|
60,849
|
|
5,929
|
|
179,911
|
|
||||||||||
|
Other commitments
|
631
|
|
28
|
|
2
|
|
1
|
|
662
|
|
||||||||||
|
Total contractual obligations
(2)
|
$
|
89,668
|
|
$
|
188,510
|
|
$
|
116,058
|
|
$
|
69,541
|
|
$
|
463,777
|
|
|||||
|
(1)
|
Includes the fair value of our current and non-current positions of contingent consideration. While it is not certain if and/or when payments will be made, the maturity dates and amounts included in this table reflect our best estimates.
|
|
(2)
|
Contractual obligations above do not include
$16.3 million
of unrecognized tax benefits, inclusive of interest and penalties, included on our consolidated balance sheet
as of December 31, 2018
, because we are unable to specify with certainty the future periods in which we may be obligated to settle such amounts.
|
Guarantees and Other Commitments
We have other commitments that we are contractually obligated to fulfill with cash under certain circumstances. Obligations under these guarantees are not normally called, as we typically comply with underlying performance requirements. As of
December 31, 2018
, no liability has been recorded in the consolidated financial statements associated with these obligations.
The following table summarizes our guarantees
as of December 31, 2018
(in thousands):
|
Less Than One Year
|
One to Three Years
|
Three to Five Years
|
Thereafter
|
Total Guarantees
|
||||||||||||||||
|
Guarantees on government bids
(1)
|
$
|
15,132
|
|
$
|
5,973
|
|
$
|
694
|
|
$
|
686
|
|
$
|
22,485
|
|
|||||
|
Guarantees - commercial
(2)
|
812
|
|
2,246
|
|
595
|
|
603
|
|
4,256
|
|
||||||||||
|
Guarantees to tax authorities
(3)
|
—
|
|
5,268
|
|
3,171
|
|
6,900
|
|
15,339
|
|
||||||||||
|
Guarantees to third-parties
(4)
|
4,573
|
|
—
|
|
—
|
|
—
|
|
4,573
|
|
||||||||||
|
Total guarantees
|
$
|
20,517
|
|
$
|
13,487
|
|
$
|
4,460
|
|
$
|
8,189
|
|
$
|
46,653
|
|
|||||
|
(1)
|
Government bid guarantees include such items as unconditional bank guarantees, irrevocable letters of credit and bid bonds.
|
|
(2)
|
Commercial guarantees include our lease and tenancy guarantees.
|
|
(3)
|
The guarantees to the tax authorities consist primarily of the guarantee issued to the Italian VAT Authority.
|
|
(4)
|
Guarantees to third-parties consist of a guarantee of a third-party loan which expired in January 2019.
|
51
Market Risk
We are exposed to certain market risks as part of our ongoing business operations, including risks from foreign currency exchange rates, interest rate risks and concentration of procurement suppliers that could adversely affect our consolidated financial position, results of operations or cash flows.
We manage these risks through regular operating and financing activities and, at certain times, derivative financial instruments.
Foreign Currency Exchange Rate Risk
Due to the global nature of our operations, we are exposed to foreign currency exchange rate fluctuations. We maintain a foreign currency exchange rate risk management strategy that utilizes derivatives to reduce our exposure to unanticipated fluctuations in forecast revenue and costs and fair values of debt, inter-company debt and accounts receivable caused by changes in foreign currency exchange rates.
We mitigate our credit risk relating to counter-parties of our derivatives through a variety of techniques, including transacting with multiple, high-quality financial institutions, thereby limiting our exposure to individual counter-parties and by entering into International Swaps and Derivatives Association, Inc. (“ISDA”) Master Agreements, which include provisions for a legally enforceable master netting agreement, with almost all of our derivative counter-parties. The terms of the ISDA agreements may also include credit support requirements, cross default provisions, termination events, and set-off provisions. Legally enforceable master netting agreements reduce credit risk by providing protection in bankruptcy in certain circumstances and generally permitting the closeout and netting of transactions with the same counter-party upon the occurrence of certain events.
Interest Rate Risk
We are subject to interest rate risk on our investments and debt. We manage a portion of our interest rate risk with contracts that swap floating-rate interest payments for fixed rate interest payments. If interest rates were to increase or decrease by 0.5%, the effects on our consolidated statement of income (loss) would not be material.
Concentration of Credit Risk
Our trade accounts receivable represent potential concentrations of credit risk. This risk is limited due to the large number of customers and their dispersion across a number of geographic areas, as well as our efforts to control our exposure to credit risk by monitoring our receivables and the use of credit approvals and credit limits. In addition, we have historically had strong collections and minimal write-offs. While we believe that our reserves for credit losses are adequate, essentially all of our trade receivables are concentrated in the hospital and healthcare sectors worldwide, and accordingly, we are exposed to their respective business, economic and country-specific variables. Although we do not currently foresee a concentrated credit risk associated with these receivables, repayment is dependent on the financial stability of these industry sectors and the respective countries’ national economies and healthcare systems.
Factors Affecting Future Operating Results and Share Price
The factors affecting our future operating results and share prices are disclosed in “Item 1A. Risk Factors” of this Annual Report on Form 10-K.
52
Item 7A.
Quantitative
and Qualitative Disclosures About Market Risk
The information required under 7A. has been incorporated by reference to the information contained in “Item 7. Management’s Discussion and Analysis of Financial Condition and Results of Operations” of this Annual Report on Form 10-K under the section entitled “
Market Risk.”
Item 8.
Financial
Statements and Supplementary Data
Our audited consolidated financial statements and notes thereto included in “Item 15. Exhibits, Financial Statement Schedules” of this Annual Report on Form 10-K, beginning on page F-1 of this Annual Report on Form 10-K, are incorporated herein by reference.
Item 9.
Changes
in and Disagreements with Accountants on Accounting and
Financial Disclosure
None.
Item 9A.
Controls
and Procedures
Disclosure Controls and Procedures
(a)
Evaluation of Disclosure Controls and Procedures
We maintain a system of disclosure controls and procedures, as defined in Rule 13a-15(e) under the Exchange Act that are designed to ensure that information required to be disclosed in our reports filed or submitted under the Exchange Act is recorded, processed, summarized and reported within the time periods specified in the SEC’s rules and forms. Disclosure controls and procedures include, without limitation, controls and procedures designed to ensure that information is accumulated and communicated to management, including our Chief Executive Officer (“CEO”) and Chief Financial Officer (“CFO”), as appropriate, to allow timely decisions regarding required disclosure. Our management, under the supervision and with the participation of our CEO and CFO, evaluated the effectiveness of the design and operation of our disclosure controls and procedures as of the end of the period covered by this Annual Report on Form 10-K. Based on that evaluation, our CEO and CFO concluded that our disclosure controls and procedures were not effective as of
December 31, 2018
, because of the material weaknesses in our internal control over financial reporting described below.
(b)
Management’s Report on Internal Control Over Financial Reporting
Our management is responsible for establishing and maintaining adequate internal control over financial reporting as defined in Rule 13a-15(f) under the Exchange Act. Because of its inherent limitations, internal control over financial reporting may not prevent or detect misstatements. Also, projections of any evaluation of effectiveness to future periods are subject to the risk that controls may become inadequate because of changes in conditions, or that the degree of compliance with the policies or procedures may deteriorate.
Management assessed the effectiveness of our internal control over financial reporting as of
December 31, 2018
using the criteria set forth in the
Internal Control - Integrated Framework (2013)
issued by the Committee of Sponsoring Organizations of the Treadway Commission. Management’s assessment included an evaluation of the design and testing of the operational effectiveness of our internal control over financial reporting. Based on this assessment, we concluded that the Company’s internal control over financial reporting was not effective as of December 31, 2018 because of the material weaknesses described below.
A material weakness is a deficiency, or a combination of deficiencies, in internal control over financial reporting such that there is a reasonable possibility that a material misstatement of our annual or interim financial statements will not be prevented or detected on a timely basis.
During the course of completing this assessment, we identified a deficiency in the design and maintenance of our controls related to access to our primary financial system by certain members of our Information Technology group and end-users. Specifically, we did not design and maintain user access controls that adequately restrict end-user and privileged access to, and ensure segregation of duties within, our primary financial system and data.
In addition, management identified a deficiency in the design and maintenance of our controls, related to the accounting for revenue, to ensure accuracy in price and quantity during the billing and revenue processes. This deficiency was impacted by the deficiency related to the design and maintenance of our user access controls.
There have been no misstatements identified in the financial statements as a result of these deficiencies. However, these control deficiencies could result in a material misstatement of our annual or interim consolidated financial statements that
53
would not be prevented or detected on a timely basis. Accordingly, we have concluded that each of the identified deficiencies, constitutes a material weakness in internal control over financial reporting.
The effectiveness of our internal control over financial reporting as of December 31, 2018 has been audited by PricewaterhouseCoopers LLP, an independent registered public accounting firm. Their report is included in “Item 15. Exhibits, Financial Statement Schedules” in this Annual Report on Form 10-K.
(c)
Changes in Internal Control Over Financial Reporting
During our most recent quarter ended December 31, 2018, there have been no changes in our internal control over financial reporting (as defined in Rule 13a-15(f) under the Exchange Act) that have materially affected, or reasonably likely to materially affect, our internal control over financial reporting.
(d)
Remediation of the Material Weaknesses
We have begun remediation efforts to address the control deficiencies identified, which gave rise to the material weaknesses noted above. We have limited the access to our primary financial system and have established new processes for granting and monitoring access. We also are performing a comprehensive review of the financial reporting application in which the control deficiencies were identified in order to further restrict access and improve authorization and review protocols. In addition, we are enhancing the design of controls over the billing process to prevent price and quantity errors, including invoice monitoring and formalizing policies for approval of price deviations. Our objective is to complete remediation efforts by the end of 2019.
Item 9B.
Other
Information
None.
54
PART III
Item 10.
Directors, Executive Officers and Corporate Governance
The information required for this Item 10 is incorporated by reference to the information set forth under the headings “Election of Directors,” “Executive Compensation,” “Corporate Governance,” and “Share Ownership Information” in our Definitive Proxy Statement for the
2019 Annual General Meeting of Shareholders
.
Item 11.
Executive
Compensation
The information required for this Item 11 is incorporated by reference to the information set forth under the heading “Executive Compensation” in our Definitive Proxy Statement for the
2019 Annual General Meeting of Shareholders
.
Item 12.
Security
Ownership of Certain Beneficial Owners and Management
and Related Stockholder Matters
The information required for this Item 12 is incorporated by reference to the information set forth under the headings “Executive Compensation” and “Share Ownership Information” in our Definitive Proxy Statement for the
2019 Annual General Meeting of Shareholders
.
Item 13.
Certain
Relationships and Related Transactions, and Director
Independence
The information required for this Item 13 is incorporated by reference to the information set forth under the heading “Corporate Governance” in our Definitive Proxy Statement for the
2019 Annual General Meeting of Shareholders
.
Item 14.
Principal
Accounting Fees and Services
The information required for this Item 14 is incorporated by reference to the information set forth under the heading “Audit Matters” in our Definitive Proxy Statement for the
2019 Annual General Meeting of Shareholders
.
55
PART IV
Item 15.
Exhibits, Financial Statement Schedules
(1) Financial Statements
The Consolidated Financial Statements of LivaNova PLC and its subsidiaries and the Report of Independent Registered Public Accounting Firms are included in this Annual Report on Form 10-K beginning on page F-1:
|
Description
|
Page No.
|
(2) Financial Statement Schedules
All schedules required by Regulation S-X have been omitted as not applicable or not required, or the information required has been included in the notes to the consolidated financial statements.
(3) Index to Exhibits
The exhibits marked with the asterisk symbol (*) are filed or furnished (in the case of Exhibit 32.1) with this Form 10-K. The exhibits marked with the cross symbol (†) are management contracts or compensatory plans or arrangements filed pursuant to Item 601(b)(10)(iii) of Regulation S-K.
|
Exhibit
Number |
Document Description |
|
Transaction Agreement, dated March 23, 2015, by and among the Company (f/k/a Sand Holdco Limited), Cyberonics, Inc., Sorin S.p.A. and Cypher Merger Sub, Inc., incorporated by reference to Annex A-1 of the Company’s Registration Statement on Form S-4, filed on April 20, 2015, as amended
|
|
|
Letter of Intent, dated as of November 20, 2017, by and among the Company, MicroPort Cardiac Rhythm B.V. and MicroPort Scientific Corporation (including the form of Stock and Asset Purchase Agreement attached as Exhibit A thereto), incorporated by reference to Exhibit 2.1 of the Company’s Current Report on Form 8-K, filed on November 20, 2017
|
|
|
Stock and Asset Purchase Agreement, dated as of March 8, 2018, by and among the Company, MicroPort Cardiac Rhythm B.V. and MicroPort Scientific Corporation (excluding schedules and exhibits, which the Company agrees to furnish supplementally to the Securities and Exchange Commission upon request), incorporated by reference to Exhibit 2.1 of the Company’s Current Report on Form 8-K, filed on March 8, 2018
|
|
|
Amended Articles of Association, incorporated by reference to Exhibit 3.1 of the Company’s Current Report on Form 8-K, filed on June 15, 2018
|
|
|
Amendment and Restatement Agreement, dated October 2, 2015, by and among the Company, Sorin S.p.A., Sorin CRM S.A.S., Sorin Group Italia S.r.l. and the European Investment Bank, incorporated by reference to Exhibit 10.1 of the Company’s Current Report on Form 8-K, filed on October 19, 2015
|
|
|
Amended and Restated Finance Contract, dated October 19, 2015, by and among the Company, Sorin CRM S.A.S., Sorin Group Italia S.r.l. and the European Investment Bank, incorporated by reference to Exhibit 10.2 of the Company’s Current Report on Form 8-K, filed on October 19, 2015
|
|
|
Form of Deed of Indemnification (Directors), each effective October 19, 2015, incorporated by reference to Exhibit 10.3 of the Company’s Current Report on Form 8-K, filed on October 19, 2015
|
|
56
|
Form of Deed of Indemnification (Officers), each effective October 19, 2015, incorporated by reference to Exhibit 10.4 of the Company’s Current Report on Form 8-K, filed on October 19, 2015
|
|
|
2015 Incentive Award Plan and related Sub-Plan for U.K. Participants, adopted on October 16, 2015, incorporated by reference to Exhibit 10.1 of the Company’s Current Report on Form 8-K, filed on October 19, 2015
|
|
|
Form of Stock Appreciation Right Grant Notice and Stock Appreciation Right Agreement under the Company’s 2015 Incentive Award Sub-Plan (Non-U.S. Form), incorporated by reference to Exhibit 10.2 of the Company’s Current Report on Form 8-K12B, filed on October 19, 2015
|
|
|
Form of Stock Appreciation Right Grant Notice and Stock Appreciation Right Agreement under the Company’s 2015 Incentive Award Plan (U.S. Form), incorporated by reference to Exhibit 10.3 of the Company’s Current Report on Form 8-K12B, filed on October 19, 2015
|
|
|
Director Appointment Letters for Non-Employee Directors, dated the dates indicated therein, incorporated by reference to Exhibit 10.5 of the Company’s Current Report on Form 8-K12B, filed on October 19, 2015
|
|
|
Form of Director Restricted Stock Unit Award Grant Notice and Director Restricted Stock Unit Award Agreement under the Company’s 2015 Incentive Award Plan (Non-Employee Directors), incorporated by reference to Exhibit 10.6 of the Company’s Current Report on Form 8-K12B, filed on October 19, 2015
|
|
|
Joint Venture Contract, dated January 9, 2014 between Sorin CRM Holdings SAS and Shanghai MicroPort Medical (Group) Co., Ltd., incorporated by reference to Exhibit 10.20 of the Company’s Annual Report on Form 10-K/T for the transition period from April 25, 2015 to December 31, 2015
|
|
|
Capital Increase and Accession Agreement in relation to MicroPort WeiBo Medical Devices (Shanghai) Co. Ltd., dated January 9, 2014, by and among Shanghai MicroPort Medical (Group) Co., Ltd., Sorin CRM Holdings SAS and MicroPort WeiBo Medical Devices (Shanghai) Co. Ltd., incorporated by reference to Exhibit 10.21 of the Company’s Annual Report on Form 10-K/T for the transition period from April 25, 2015 to December 31, 2015
|
|
|
Amendment Agreement, dated May 19, 2014, to the Joint Venture Contract and Articles of Association in respect of MicroPort Sorin CRM (Shanghai) Co., Ltd., incorporated by reference to Exhibit 10.22 of the Company’s Annual Report on Form 10-K/T for the transition period from April 25, 2015 to December 31, 2015
|
|
|
Amendment Agreement (2), dated 9 January 2014 to the Joint Venture Contract in respect of MicroPort Sorin CRM (Shanghai) Co., Ltd., incorporated by reference to Exhibit 10.23 of the Company’s Annual Report on Form 10-K/T for the transition period from April 25, 2015 to December 31, 2015
|
|
|
Gruppo Sorin R&D Finance Contract, dated May 6, 2014, between the European Investment Bank and Sorin S.p.A., Sorin CRM S.A.S. and Sorin Group Italia S.r.l., incorporated by reference to Exhibit 10.25 of the Company’s Annual Report on Form 10-K/T for the transition period from April 25, 2015 to December 31, 2015
|
|
|
Amendment to Restricted Stock Unit Agreement, dated February 17, 2016, between the Company and André-Michel Ballester, incorporated by reference to Exhibit 10.26 of the Company’s Annual Report on Form 10-K/T for the transition period from April 25, 2015 to December 31, 2015
|
|
|
Cyberonics, Inc. 2009 Stock Plan, as amended, incorporated by reference to Appendix A to Cyberonics, Inc.’s Proxy Statement on Schedule 14A, filed on August 2, 2012
|
|
|
Amended and Restated Cyberonics, Inc. New Employee Equity Inducement Plan, as amended, incorporated by reference to Exhibit 10.3 of Cyberonics, Inc.’s Quarterly Report on Form 10-Q for the fiscal quarter ended October 24, 2008
|
|
|
Letter Agreement dated July 1, 2016 between Douglas Manko and Cyberonics Inc., a wholly owned subsidiary of the Company, incorporated by reference to Exhibit 10.48 of the Company’s Quarterly Report on Form 10-Q for the quarter ended September 30, 2016
|
|
|
Form of Share Repurchase Contract, incorporated by reference to Appendix A of the Company’s Proxy Statement on Schedule 14A, filed on May 16, 2016
|
|
|
Form of Rule 10b5-1 Repurchase Plan, incorporated by reference to Appendix B of the Company’s Proxy Statement on Schedule 14A, filed on May 16, 2016
|
|
|
Board approval of Share Repurchase Programme on August 2, 2016, incorporated by reference to the Company’s Current Report on Form 8-K, filed on August 2, 2016
|
|
|
$40 Million Revolving Facility Agreement between the Company and Barclays Bank PLC, incorporated by reference to Exhibit 10.57 of the Company’s Quarterly Report on Form 10-Q for the quarter ended September 30, 2106
|
|
|
Settlement Agreement between Andre-Michel Ballester and the Company dated December 21, 2016, incorporated by reference to Exhibit 10.58 of the Company’s Annual Report on Form 10-K for the year ended December 31, 2016
|
|
|
Consultancy Agreement between Andre-Michel Ballester and the Company dated December 26, 2016, incorporated by reference to Exhibit 10.59 of the Company’s Annual Report on Form 10-K for the year ended December 31, 2016
|
|
|
Form of the Company’s 2017 Service-Based RSU Agreement, incorporated by reference to Exhibit 10.1 of the Company’s Current Report on Form 8-K, filed on May 11, 2017
|
|
57
|
Form of the Company’s 2017 Performance-Based RSU Agreement, incorporated by reference to Exhibit 10.2 of the Company’s Current Report on Form 8-K, filed on May 11, 2017
|
|
|
CEO Employment Agreement effective January 1, 2017 between the Company and Damien McDonald, incorporated by reference to Exhibit 10.2 of the Company’s Current Report on Form 8-K, filed on February 28, 2017
|
|
|
Side Letter dated January 1, 2017 between the Company and Damien McDonald, incorporated by reference to Exhibit 10.3 of the Company’s Current Report on Form 8-K, filed on February 28, 2017
|
|
|
2017 Short-Term Incentive Plan, incorporated by reference to Exhibit 10.1 of the Company’s Current Report on Form 8-K, filed on February 28, 2017
|
|
|
Description of Payment under the 2016 Bonus Plan, incorporated by reference to the Company’s Current Report on Form 8-K, filed on April 25, 2017
|
|
|
Mutual termination agreement of the employment contract and full settlement, effective February 8, 2017, between the Company - Italian Branch and Brian Sheridan, incorporated by reference to Exhibit 10.67 of the Company’s Quarterly Report on Form 10-Q for the quarter ended March 31, 2017
|
|
|
Consultancy Agreement, effective February 8, 2017, between the Company and Mr. Brian Sheridan, incorporated by reference to Exhibit 10.68 of the Company’s Quarterly Report on Form 10-Q for the quarter ended March 31, 2017
|
|
|
Settlement Agreement effective May 31, 2017 between the Company and Vivid Sehgal, incorporated by reference to Exhibit 10.69 of the Company’s Quarterly Report on Form 10-Q for the quarter ended March 31, 2017
|
|
|
Service Agreement, by and between the Company and Thad Huston, dated April 27, 2017, incorporated by reference to Exhibit 10.1 of the Company’s Current Report on Form 8-K, filed on May 16, 2017
|
|
|
Side Letter dated April 27, 2017 from the Company to Thad Huston, incorporated by reference to Exhibit 10.2 of the Company’s Current Report on Form 8-K, filed on May 16, 2017
|
|
|
LivaNova R&D Finance Contract between the European Investment Bank and the Company and Sorin CRM S.A.S. and Sorin Group Italia S.r.l., effective 29 June 2017, incorporated by reference to Exhibit 10.1 of the Company’s Current Report on Form 8-K, filed on July 6, 2017
|
|
|
Service Agreement effective May 24, 2017, between the Company and Keyna Skeffington, incorporated by reference to Exhibit 10.6 of the Company’s Quarterly Report on Form 10-Q for the quarter ended June 30, 2017
|
|
|
Non-Employee Director Compensation Policy, adopted December 2017, incorporated by reference to Exhibit 10.74 of the Company’s Annual Report on Form 10-K for the year ended December 31. 2017
|
|
|
Form of Share Repurchase Contract, incorporated by reference to Appendix A of the Company’s Proxy Statement on Schedule 14A, filed on May 16, 2017
|
|
|
Form of Rule 10b5-1 Repurchase Plan, incorporated by reference to Appendix B of the Company’s Proxy Statement on Schedule 14A, filed on May 16, 2017
|
|
|
2018 Short-Term Incentive Plan, incorporated by reference to Exhibit 10.1 of the Company’s Current Report on Form 8-K, filed on February 12, 2018
|
|
|
Description of 2018 Long Term Incentive Plan, incorporated by reference to Exhibit 10.1 of the Company’s Current Report on Form 8-K, filed on March 16, 2018
|
|
|
Form of 2018 Long Term Incentive Plan RSU Award Agreement, incorporated by reference to Exhibit 10.2 of the Company’s Current Report on Form 8-K, filed on March 16, 2018
|
|
|
Form of 2018 Long Term Incentive Plan SAR Award Agreement, incorporated by reference to Exhibit 10.3 of the Company’s Current Report on Form 8-K, filed on March 16, 2018
|
|
|
Form of 2018 Long Term Incentive Plan PSU Award Agreement (rTSR condition), incorporated by reference to Exhibit 10.4 of the Company’s Current Report on Form 8-K, filed on March 16, 2018
|
|
|
Form of 2018 Long Term Incentive Plan PSU Award Agreement (FCF condition), incorporated by reference to Exhibit 10.5 of the Company’s Current Report on Form 8-K, filed on March 16, 2018
|
|
|
Consultancy Agreement between the Company (Italian Branch) and Brian Sheridan, dated July 1, 2017, incorporated by reference to Exhibit 10.1 of the Company’s Current Report on Form 8-K, filed on March 26, 2018
|
|
|
Amendment and Restatement Agreement related to Facility Agreement dated October 21, 2016 between the Company and Barclays Bank PLC, dated April 10, 2018, incorporated by reference to Exhibit 10.1 of the Company’s Quarterly Report on Form 10-Q for the quarter ended June 30, 2018
|
|
|
Amendment No. 1, dated April 17, 2018, to the Finance Contract entered into by and between the European Investment Bank, the Company, Sorin CRM and Sorin Group Italia S.r.l., dated June 29, 2017; and Amendment No. 2, dated April 17, 2018, to the Finance Contract entered into by and between the European Investment Bank, the Company, Sorin CRM S.A.S. and Sorin Group Italia S.r.l. on 6 May 2014, as amended and restated on October 2, 2015; and Waiver of Articles 4.03A(3), 6.05 and 6.06 of the aforementioned Amendments, incorporated by reference to Exhibit 10.2 of the Company’s Quarterly Report on Form 10-Q for the quarter ended June 30, 2018
|
|
58
|
2018 Director RSU Agreement, incorporated by reference to Exhibit 10.1 of the Company’s Current Report on Form 8-K, filed on June 15, 2018
|
|
|
General Provisions of the Company’s Global Employee Share Purchase Plan dated 12 June 2018, incorporated by reference to Exhibit 10.4 of the Company’s Quarterly Report on Form 10-Q for the quarter ended June 30, 2018
|
|
|
Form of Letter of Appointment as Non-Executive Director, dated 18 July 2018, incorporated by reference to Exhibit 10.5 of the Company’s Quarterly Report on Form 10-Q for the quarter ended June 30, 2018
|
|
|
Letter from PricewaterhouseCoopers SpA to the Securities and Exchange Commission, dated March 26, 2018, incorporated by reference to Exhibit 16.1 of the Company’s Current Report on Form 8-K, filed on March 26, 2018
|
|
|
List of Subsidiaries of LivaNova PLC
|
|
|
Consent of PricewaterhouseCoopers LLP
|
|
|
Consent of PricewaterhouseCoopers SpA
|
|
|
Certification of the Chief Executive Officer of LivaNova PLC pursuant to Section 302 of the Sarbanes-Oxley Act of 2002
|
|
|
Certification of the Chief Financial Officer of LivaNova PLC pursuant to Section 302 of the Sarbanes-Oxley Act of 2002
|
|
|
Certification of the Chief Executive Officer and of the Chief Financial Officer pursuant to 18 U.S.C. Section 1350, as adopted pursuant to Section 906 of the Sarbanes-Oxley Act of 2002.
|
|
|
101*
|
Interactive Data Files Pursuant to Rule 405 of Regulation S-T: (i) the Consolidated Statements of Income (Loss) for the years ended December 31, 2018, December 31, 2017 and December 31, 2016, (ii) the Consolidated Statements of Comprehensive (Loss) Income for the years ended December 31, 2018, December 31, 2017 and December 31, 2016, (iii) the Consolidated Balance Sheets as of December 31, 2018 and December 31, 2017, (iv) the Consolidated Statements of Stockholders’ Equity for the years ended December 31, 2018, December 31, 2017 and December 31, 2016, (v) the Consolidated Statements of Cash Flows for the years ended December 31, 2018, December 31, 2017 and December 31, 2016, and (vi) the Notes to the Consolidated Financial Statements.
|
59
SIGNATURES
Pursuant to the requirements of Section 13 or 15(d) of the Securities Exchange Act of 1934, the registrant has duly caused this report to be signed on its behalf by the undersigned, thereunto duly authorized.
|
|
LIVANOVA PLC
|
|
|
|
|
|
|
|
By:
|
/s/ DAMIEN MCDONALD
|
|
|
|
Damien McDonald
|
|
|
|
Chief Executive Officer
|
|
|
|
(Principal Executive Officer)
|
|
|
LIVANOVA PLC
|
|
|
|
|
|
|
|
By:
|
/s/ THAD HUSTON
|
|
|
|
Thad Huston
|
|
|
|
Chief Financial Officer
|
|
|
|
(Principal Financial Officer)
|
Date:
March 18, 2019
60
Pursuant to the requirements of the Securities Exchange Act of 1934, this report has been signed below by the following persons on behalf of the registrant and in the capacities and on the dates indicated:
|
Signature
|
Title
|
Date
|
|
|
|
|
|
/s/ DANIEL J. MOORE
Daniel J. Moore |
Chairman of the Board of Directors
|
March 18, 2019
|
|
|
|
|
|
/s/ DAMIEN MCDONALD
Damien McDonald |
Director, Chief Executive Officer
(Principal Executive Officer) |
March 18, 2019
|
|
|
|
|
|
/s/ THAD HUSTON
Thad Huston |
Chief Financial Officer
(Principal Financial Officer) |
March 18, 2019
|
|
|
|
|
|
/s/ DOUG MANKO
Doug Manko |
Chief Accounting Officer
(Principal Accounting Officer) |
March 18, 2019
|
|
/s/ FRANCESCO BIANCHI
Francesco Bianchi |
Director
|
March 18, 2019
|
|
|
|
|
|
/s/ WILLIAM A. KOZY
Willaim A. Kozy |
Director
|
March 18, 2019
|
|
|
|
|
|
/s/ HUGH M. MORRISON
Hugh M. Morrison |
Director
|
March 18, 2019
|
|
|
|
|
|
/s/ ALFRED J. NOVAK
Alfred J. Novak |
Director
|
March 18, 2019
|
|
|
|
|
|
/s/ SHARON O'KANE
Sharon O'Kane, Ph.D. |
Director
|
March 18, 2019
|
|
/s/ ARTHUR L. ROSENTHAL
Arthur L. Rosenthal, Ph.D. |
Director
|
March 18, 2019
|
|
/s/ ANDREA L. SAIA
Andrea L. Saia |
Director
|
March 18, 2019
|
61
Item 16. Form 10-K Summary
None.
62
CONSOLIDATED FINANCIAL STATEMENTS
For the years ended
December 31, 2018
,
December 31, 2017
and
December 31, 2016
F-1
Report of Independent Registered Public Accounting Firm
To the Board of Directors and Stockholders of LivaNova PLC
Opinions on the Financial Statements and Internal Control over Financial Reporting
We have audited the accompanying consolidated balance sheet of LivaNova PLC and its subsidiaries (the “Company”) as of December 31, 2018, and the related consolidated statements of income (loss), comprehensive (loss) income, stockholders’ equity and cash flows for the year then ended, including the related notes (collectively referred to as the “consolidated financial statements”). We also have audited the Company's internal control over financial reporting as of December 31, 2018, based on criteria established in Internal Control - Integrated Framework (2013) issued by the Committee of Sponsoring Organizations of the Treadway Commission (COSO).
In our opinion, the consolidated financial statements referred to above present fairly, in all material respects, the financial position of the Company as of December 31, 2018, and the results of its operations and its cash flows for the year then ended in conformity with accounting principles generally accepted in the United States of America. Also in our opinion, the Company did not maintain, in all material respects, effective internal control over financial reporting as of December 31, 2018, based on criteria established in Internal Control - Integrated Framework (2013) issued by the COSO because material weaknesses in internal control over financial reporting existed as of that date related to ineffective design and maintenance of user access controls to adequately restrict end-user and privileged access to, and ensure segregation of duties within, the primary financial system and data and ineffective design and maintenance of controls to ensure accuracy in price and quantity during the billing and revenue processes.
A material weakness is a deficiency, or a combination of deficiencies, in internal control over financial reporting, such that there is a reasonable possibility that a material misstatement of the annual or interim financial statements will not be prevented or detected on a timely basis. The material weaknesses referred to above are described in Management's Report on Internal Control Over Financial Reporting appearing under Item 9A. We considered these material weaknesses in determining the nature, timing, and extent of audit tests applied in our audit of the 2018 consolidated financial statements, and our opinion regarding the effectiveness of the Company’s internal control over financial reporting does not affect our opinion on those consolidated financial statements.
Change in Accounting Principle
As discussed in Note 22 to the consolidated financial statements, the Company changed the manner in which it accounts for the income tax effects of intra-entity transfers of assets other than inventory in 2018.
Basis for Opinions
The Company's management is responsible for these consolidated financial statements, for maintaining effective internal control over financial reporting, and for its assessment of the effectiveness of internal control over financial reporting included in Management's Report on Internal Control Over Financial Reporting appearing under Item 9A. Our responsibility is to express opinions on the Company’s consolidated financial statements and on the Company's internal control over financial reporting based on our audit. We are a public accounting firm registered with the Public Company Accounting Oversight Board (United States) (PCAOB) and are required to be independent with respect to the Company in accordance with the U.S. federal securities laws and the applicable rules and regulations of the Securities and Exchange Commission and the PCAOB.
We conducted our audit in accordance with the standards of the PCAOB. Those standards require that we plan and perform the audit to obtain reasonable assurance about whether the consolidated financial statements are free of material misstatement, whether due to error or fraud, and whether effective internal control over financial reporting was maintained in all material respects.
Our audit of the consolidated financial statements included performing procedures to assess the risks of material misstatement of the consolidated financial statements, whether due to error or fraud, and performing procedures that respond to those risks. Such procedures included examining, on a test basis, evidence regarding the amounts and disclosures in the consolidated financial statements. Our audit also included evaluating the accounting principles used and significant estimates made by management, as well as evaluating the overall presentation of the consolidated financial statements. Our audit of internal control over financial reporting included obtaining an understanding of internal control over financial reporting, assessing the risk that a material weakness exists, and testing and evaluating the design and operating effectiveness of internal control based on the assessed risk. Our audit also included performing such other procedures as we considered necessary in the circumstances. We believe that our audit provides a reasonable basis for our opinions.
Emphasis of Matter
As discussed in Note 2 to the consolidated financial statements, the Company recorded a $294 million liability in the fourth quarter of 2018 in connection with litigation involving its 3T device. Management’s evaluation of the impact of this litigation provision liability is also discussed in Note 2.
Definition and Limitations of Internal Control over Financial Reporting
A company’s internal control over financial reporting is a process designed to provide reasonable assurance regarding the reliability of financial reporting and the preparation of financial statements for external purposes in accordance with generally accepted accounting principles. A company’s internal control over financial reporting includes those policies and procedures that (i) pertain to the maintenance of records that, in reasonable detail, accurately and fairly reflect the transactions and dispositions of the assets of the company; (ii) provide reasonable assurance that transactions are recorded as necessary to permit preparation of financial statements in accordance with generally accepted accounting principles, and that receipts and expenditures of the company are being made only in accordance with authorizations of management and directors of the company; and (iii) provide reasonable assurance regarding prevention or timely detection of unauthorized acquisition, use, or disposition of the company’s assets that could have a material effect on the financial statements.
Because of its inherent limitations, internal control over financial reporting may not prevent or detect misstatements. Also, projections of any evaluation of effectiveness to future periods are subject to the risk that controls may become inadequate because of changes in conditions, or that the degree of compliance with the policies or procedures may deteriorate.
/s/ PricewaterhouseCoopers LLP
Houston, Texas
March 18, 2019
We have served as the Company’s auditor since 2018.
F-2
Report of Independent Registered Public Accounting Firm
To the Stockholders and Board of Directors of LivaNova PLC
Opinion on the Financial Statements
We have audited the consolidated balance sheet of LivaNova PLC and its subsidiaries (the “Company”) as of December 31, 2017, and the related consolidated statements of income (loss), comprehensive (loss) income, stockholders’ equity and cash flows for each of the two years in the period ended December 31, 2017, including the related notes (collectively referred to as the “consolidated financial statements”). In our opinion, the consolidated financial statements present fairly, in all material respects, the financial position of the Company as of December 31, 2017, and the results of its operations and its cash flows for each of the two years in the period ended December 31, 2017 in conformity with accounting principles generally accepted in the United States of America.
Basis for Opinion
These consolidated financial statements are the responsibility of the Company's management. Our responsibility is to express an opinion on the Company’s consolidated financial statements based on our audits. We are a public accounting firm registered with the Public Company Accounting Oversight Board (United States) (PCAOB) and are required to be independent with respect to the Company in accordance with the U.S. federal securities laws and the applicable rules and regulations of the Securities and Exchange Commission and the PCAOB.
We conducted our audits of these consolidated financial statements in accordance with the standards of the PCAOB. Those standards require that we plan and perform the audit to obtain reasonable assurance about whether the consolidated financial statements are free of material misstatement, whether due to error or fraud.
Our audits included performing procedures to assess the risks of material misstatement of the consolidated financial statements, whether due to error or fraud, and performing procedures that respond to those risks. Such procedures included examining, on a test basis, evidence regarding the amounts and disclosures in the consolidated
financial statements. Our audits also included evaluating the accounting principles used and significant estimates made by management, as well as evaluating the overall presentation of the consolidated
financial statements. We believe that our audits provide a reasonable basis for our opinion.
/s/ PricewaterhouseCoopers SpA
Milan, Italy
February 28, 2018
PricewaterhouseCoopers SpA served as the Company’s auditor from 2015 to 2018.
F-3
LIVANOVA PLC AND SUBSIDIARIES
CONSOLIDATED STATEMENTS OF INCOME (LOSS)
(In thousands, except per share amounts)
|
Year Ended Year Ended December 31,
|
||||||||||||
|
|
2018
|
2017
|
2016
|
|||||||||
|
Net sales
|
$
|
1,106,961
|
|
$
|
1,012,277
|
|
$
|
964,858
|
|
|||
|
Costs and expenses:
|
||||||||||||
|
Cost of sales - exclusive of amortization
|
361,812
|
|
353,192
|
|
367,845
|
|
||||||
|
Product remediation
|
10,680
|
|
7,254
|
|
37,534
|
|
||||||
|
Selling, general and administrative
|
464,967
|
|
380,100
|
|
355,164
|
|
||||||
|
Research and development
|
146,024
|
|
109,516
|
|
82,078
|
|
||||||
|
Merger and integration expenses
|
24,420
|
|
15,528
|
|
20,377
|
|
||||||
|
Restructuring expenses
|
15,915
|
|
17,056
|
|
37,377
|
|
||||||
|
Amortization of intangibles
|
37,194
|
|
33,144
|
|
31,035
|
|
||||||
|
Litigation provision
|
294,021
|
|
—
|
|
—
|
|
||||||
|
Operating (loss) income from continuing operations
|
(248,072
|
)
|
96,487
|
|
33,448
|
|
||||||
|
Interest income
|
847
|
|
1,318
|
|
1,698
|
|
||||||
|
Interest expense
|
(9,825
|
)
|
(7,797
|
)
|
(10,616
|
)
|
||||||
|
Gain on acquisitions
|
11,484
|
|
39,428
|
|
—
|
|
||||||
|
Impairment of investments
|
—
|
|
(8,565
|
)
|
—
|
|
||||||
|
Foreign exchange and other (losses) gains
|
(1,881
|
)
|
267
|
|
1,136
|
|
||||||
|
(Loss) income from continuing operations before tax
|
(247,447
|
)
|
121,138
|
|
25,666
|
|
||||||
|
Income tax (benefit) expense
|
(69,629
|
)
|
49,954
|
|
5,113
|
|
||||||
|
Losses from equity method investments
|
(644
|
)
|
(16,719
|
)
|
(18,679
|
)
|
||||||
|
Net (loss) income from continuing operations
|
(178,462
|
)
|
54,465
|
|
1,874
|
|
||||||
|
Discontinued Operations:
|
||||||||||||
|
Loss from discontinued operations, net of tax
|
(10,937
|
)
|
(1,271
|
)
|
(64,663
|
)
|
||||||
|
Impairment of discontinued operations, net of tax
|
—
|
|
(78,283
|
)
|
—
|
|
||||||
|
Net loss from discontinued operations, net of tax
|
(10,937
|
)
|
(79,554
|
)
|
(64,663
|
)
|
||||||
|
Net loss
|
$
|
(189,399
|
)
|
$
|
(25,089
|
)
|
$
|
(62,789
|
)
|
|||
|
Basic (loss) income per share:
|
||||||||||||
|
Continuing operations
|
$
|
(3.68
|
)
|
$
|
1.13
|
|
$
|
0.04
|
|
|||
|
Discontinued operations
|
(0.23
|
)
|
(1.65
|
)
|
(1.33
|
)
|
||||||
|
$
|
(3.91
|
)
|
$
|
(0.52
|
)
|
$
|
(1.29
|
)
|
||||
|
Diluted (loss) income per share:
|
||||||||||||
|
Continuing operations
|
$
|
(3.68
|
)
|
$
|
1.12
|
|
$
|
0.04
|
|
|||
|
Discontinued operations
|
(0.23
|
)
|
(1.64
|
)
|
(1.32
|
)
|
||||||
|
$
|
(3.91
|
)
|
$
|
(0.52
|
)
|
$
|
(1.28
|
)
|
||||
|
Shares used in computing basic (loss) income per share
|
48,497
|
|
48,157
|
|
48,860
|
|
||||||
|
Shares used in computing diluted (loss) income per share
|
48,497
|
|
48,501
|
|
49,014
|
|
||||||
See accompanying notes to the consolidated financial statements
F-4
LIVANOVA PLC AND SUBSIDIARIES
CONSOLIDATED STATEMENTS OF COMPREHENSIVE (LOSS) INCOME
(In thousands)
|
Year Ended December 31, 2018
|
Year Ended December 31, 2017
|
Year Ended December 31, 2016
|
||||||||||
|
Net loss
|
$
|
(189,399
|
)
|
$
|
(25,089
|
)
|
$
|
(62,789
|
)
|
|||
|
Other comprehensive (loss) income:
|
|
|
||||||||||
|
Unrealized (loss) gain on derivatives
|
(33
|
)
|
(6,413
|
)
|
3,930
|
|
||||||
|
Tax effect
|
8
|
|
1,875
|
|
(1,199
|
)
|
||||||
|
Net of tax
|
(25
|
)
|
(4,538
|
)
|
2,731
|
|
||||||
|
Foreign currency translation adjustment, net of tax
|
(69,764
|
)
|
118,338
|
|
(16,990
|
)
|
||||||
|
Total other comprehensive (loss) income
|
(69,789
|
)
|
113,800
|
|
(14,259
|
)
|
||||||
|
Total comprehensive (loss) income
|
$
|
(259,188
|
)
|
$
|
88,711
|
|
$
|
(77,048
|
)
|
|||
See accompanying notes to the consolidated financial statements
F-5
LIVANOVA PLC AND SUBSIDIARIES
CONSOLIDATED BALANCE SHEETS
(In thousands, except share data)
|
ASSETS
|
December 31, 2018
|
December 31, 2017
|
||||||
|
Current Assets:
|
||||||||
|
Cash and cash equivalents
|
$
|
47,204
|
|
$
|
93,615
|
|
||
|
Accounts receivable, net of allowance of $11,598 and $9,418 at December 31, 2018 and 2017
|
256,135
|
|
282,145
|
|
||||
|
Inventories
|
153,535
|
|
144,470
|
|
||||
|
Prepaid and refundable taxes
|
46,852
|
|
46,274
|
|
||||
|
Assets held for sale
|
—
|
|
13,628
|
|
||||
|
Assets of discontinued operations
|
—
|
|
250,689
|
|
||||
|
Prepaid expenses and other current assets
|
29,571
|
|
39,037
|
|
||||
|
Total Current Assets
|
533,297
|
|
869,858
|
|
||||
|
Property, plant and equipment, net
|
191,400
|
|
192,359
|
|
||||
|
Goodwill
|
956,815
|
|
784,242
|
|
||||
|
Intangible assets, net
|
770,439
|
|
535,397
|
|
||||
|
Investments
|
24,823
|
|
34,492
|
|
||||
|
Deferred tax assets
|
68,146
|
|
11,559
|
|
||||
|
Other assets
|
4,781
|
|
75,984
|
|
||||
|
Total Assets
|
$
|
2,549,701
|
|
$
|
2,503,891
|
|
||
|
LIABILITIES AND STOCKHOLDERS' EQUITY
|
||||||||
|
Current Liabilities:
|
||||||||
|
Current debt obligations
|
$
|
28,794
|
|
$
|
84,034
|
|
||
|
Accounts payable
|
76,735
|
|
85,915
|
|
||||
|
Accrued liabilities and other
|
124,285
|
|
78,942
|
|
||||
|
Current litigation provision liability
|
161,851
|
|
—
|
|
||||
|
Taxes payable
|
22,530
|
|
12,826
|
|
||||
|
Accrued employee compensation and related benefits
|
82,551
|
|
66,224
|
|
||||
|
Liabilities of discontinued operations
|
—
|
|
78,075
|
|
||||
|
Total Current Liabilities
|
496,746
|
|
406,016
|
|
||||
|
Long-term debt obligations
|
139,538
|
|
61,958
|
|
||||
|
Contingent consideration
|
161,381
|
|
33,973
|
|
||||
|
Litigation provision liability
|
132,210
|
|
—
|
|
||||
|
Deferred tax liabilities
|
68,189
|
|
123,342
|
|
||||
|
Long-term employee compensation and related benefits
|
25,264
|
|
28,177
|
|
||||
|
Other long-term liabilities
|
22,635
|
|
35,111
|
|
||||
|
Total Liabilities
|
1,045,963
|
|
688,577
|
|
||||
|
Commitments and contingencies
(Note 13)
|
|
|
||||||
|
Stockholders’ Equity:
|
||||||||
|
Ordinary Shares, £1.00 par value: unlimited shares authorized; 49,323,418 shares issued and 48,205,783 shares outstanding at December 31, 2018; 48,290,276 shares issued and 48,287,346 shares outstanding at December 31, 2017
|
76,144
|
|
74,750
|
|
||||
|
Additional paid-in capital
|
1,705,111
|
|
1,735,048
|
|
||||
|
Accumulated other comprehensive (loss) income
|
(24,476
|
)
|
45,313
|
|
||||
|
Accumulated deficit
|
(251,579
|
)
|
(39,664
|
)
|
||||
|
Treasury stock at cost, 1,117,635 and 2,930 shares at December 31, 2018 and 2017
|
(1,462
|
)
|
(133
|
)
|
||||
|
Total Stockholders’ Equity
|
1,503,738
|
|
1,815,314
|
|
||||
|
Total Liabilities and Stockholders’ Equity
|
$
|
2,549,701
|
|
$
|
2,503,891
|
|
||
See accompanying notes to the consolidated financial statements
F-6
LIVANOVA PLC AND SUBSIDIARIES
CONSOLIDATED STATEMENT OF STOCKHOLDERS’ EQUITY
(In thousands)
|
Ordinary Shares
|
Ordinary Shares - Amount
|
Additional Paid-In Capital
|
Treasury Stock
|
Accumulated Other Comprehensive (Loss) Income
|
Accumulated Deficit
|
Total Stockholders' Equity
|
|||||||||||||||||||||
|
Balance at December 31, 2015
|
48,868
|
|
$
|
75,444
|
|
$
|
1,742,032
|
|
$
|
—
|
|
$
|
(54,228
|
)
|
$
|
48,214
|
|
$
|
1,811,462
|
|
|||||||
|
Stock-based compensation plans
|
282
|
|
391
|
|
26,591
|
|
—
|
|
—
|
|
—
|
|
26,982
|
|
|||||||||||||
|
Share repurchases
|
(993
|
)
|
(1,257
|
)
|
(48,730
|
)
|
(4,500
|
)
|
—
|
|
—
|
|
(54,487
|
)
|
|||||||||||||
|
Net loss
|
—
|
|
—
|
|
—
|
|
—
|
|
—
|
|
(62,789
|
)
|
(62,789
|
)
|
|||||||||||||
|
Other comprehensive loss
|
—
|
|
—
|
|
—
|
|
—
|
|
(14,259
|
)
|
—
|
|
(14,259
|
)
|
|||||||||||||
|
Balance at December 31, 2016
|
48,157
|
|
74,578
|
|
1,719,893
|
|
(4,500
|
)
|
(68,487
|
)
|
(14,575
|
)
|
1,706,909
|
|
|||||||||||||
|
Stock-based compensation plans
|
133
|
|
172
|
|
15,155
|
|
4,367
|
|
—
|
|
—
|
|
19,694
|
|
|||||||||||||
|
Net loss
|
—
|
|
—
|
|
—
|
|
—
|
|
—
|
|
(25,089
|
)
|
(25,089
|
)
|
|||||||||||||
|
Other comprehensive income
|
—
|
|
—
|
|
—
|
|
—
|
|
113,800
|
|
—
|
|
113,800
|
|
|||||||||||||
|
Balance at December 31, 2017
|
48,290
|
|
74,750
|
|
1,735,048
|
|
(133
|
)
|
45,313
|
|
(39,664
|
)
|
1,815,314
|
|
|||||||||||||
|
Adoption of ASU No. 2016-16
|
—
|
|
—
|
|
—
|
|
—
|
|
—
|
|
(22,516
|
)
|
(22,516
|
)
|
|||||||||||||
|
Share issuances
|
1,423
|
|
1,887
|
|
(1,887
|
)
|
—
|
|
|||||||||||||||||||
|
Share repurchases
|
(500
|
)
|
(640
|
)
|
(49,360
|
)
|
—
|
|
—
|
|
—
|
|
(50,000
|
)
|
|||||||||||||
|
Stock-based compensation plans
|
110
|
|
147
|
|
19,423
|
|
558
|
|
—
|
|
—
|
|
20,128
|
|
|||||||||||||
|
Net loss
|
—
|
|
—
|
|
—
|
|
—
|
|
—
|
|
(189,399
|
)
|
(189,399
|
)
|
|||||||||||||
|
Other comprehensive loss
|
—
|
|
—
|
|
—
|
|
—
|
|
(69,789
|
)
|
—
|
|
(69,789
|
)
|
|||||||||||||
|
Balance at December 31, 2018
|
49,323
|
|
$
|
76,144
|
|
$
|
1,705,111
|
|
$
|
(1,462
|
)
|
$
|
(24,476
|
)
|
$
|
(251,579
|
)
|
$
|
1,503,738
|
|
|||||||
See accompanying notes to the consolidated financial statements
F-7
LIVANOVA PLC AND SUBSIDIARIES
CONSOLIDATED STATEMENTS OF
CASH FLOWS
(In thousands)
|
Operating Activities:
|
Year Ended December 31, 2018
|
Year Ended December 31, 2017
|
Year Ended December 31, 2016
|
|||||||||
|
Net loss
|
$
|
(189,399
|
)
|
$
|
(25,089
|
)
|
$
|
(62,789
|
)
|
|||
|
Non-cash items included in net loss:
|
||||||||||||
|
Depreciation
|
32,746
|
|
37,054
|
|
39,852
|
|
||||||
|
Amortization
|
37,194
|
|
45,881
|
|
45,511
|
|
||||||
|
Stock-based compensation
|
26,923
|
|
19,062
|
|
19,569
|
|
||||||
|
Deferred tax benefit
|
(95,050
|
)
|
(9,272
|
)
|
(26,711
|
)
|
||||||
|
Losses from equity method investments
|
1,855
|
|
21,606
|
|
22,612
|
|
||||||
|
Gain on acquisitions
|
(11,484
|
)
|
(39,428
|
)
|
—
|
|
||||||
|
Amortization of income taxes payable on inter-company transfers of property
|
13,370
|
|
31,784
|
|
25,952
|
|
||||||
|
Impairment of property, plant and equipment
|
567
|
|
5,979
|
|
5,971
|
|
||||||
|
Impairment of discontinued operations
|
—
|
|
93,574
|
|
—
|
|
||||||
|
Impairment of investments
|
—
|
|
8,565
|
|
—
|
|
||||||
|
Impairment of goodwill
|
—
|
|
—
|
|
18,348
|
|
||||||
|
Other
|
(1,520
|
)
|
5,240
|
|
10,217
|
|
||||||
|
Changes in operating assets and liabilities:
|
||||||||||||
|
Accounts receivable, net
|
21,181
|
|
(48,934
|
)
|
(16,448
|
)
|
||||||
|
Inventories
|
(10,647
|
)
|
7,187
|
|
26,703
|
|
||||||
|
Other current and non-current assets
|
(12,989
|
)
|
(6,180
|
)
|
(32,686
|
)
|
||||||
|
Restructuring reserve
|
6,504
|
|
(14,557
|
)
|
12,405
|
|
||||||
|
Litigation provision liability
|
294,061
|
|
—
|
|
—
|
|
||||||
|
Accounts payable and accrued current and non-current liabilities
|
7,177
|
|
(41,133
|
)
|
1,645
|
|
||||||
|
Net cash provided by operating activities
|
120,489
|
|
91,339
|
|
90,151
|
|
||||||
|
Investing Activities:
|
||||||||||||
|
Acquisitions, net of cash acquired
|
(279,691
|
)
|
(14,194
|
)
|
—
|
|
||||||
|
Purchases of property, plant and equipment and other
|
(37,997
|
)
|
(34,107
|
)
|
(38,362
|
)
|
||||||
|
Proceeds from the sale of CRM business franchise, net of cash disposed
|
186,682
|
|
—
|
|
—
|
|
||||||
|
Proceeds from asset sales
|
14,220
|
|
5,935
|
|
1,145
|
|
||||||
|
Proceeds from sale of investment
|
—
|
|
3,192
|
|
—
|
|
||||||
|
Purchases of investments
|
(3,770
|
)
|
(6,255
|
)
|
(8,026
|
)
|
||||||
|
Loans to investees
|
—
|
|
(7,426
|
)
|
(6,270
|
)
|
||||||
|
Purchases of short-term investments
|
—
|
|
—
|
|
(7,054
|
)
|
||||||
|
Maturities of short-term investments
|
—
|
|
—
|
|
14,051
|
|
||||||
|
Net cash used in investing activities
|
(120,556
|
)
|
(52,855
|
)
|
(44,516
|
)
|
||||||
|
Financing Activities:
|
||||||||||||
|
Change in short-term borrowing, net
|
(30,745
|
)
|
12,396
|
|
(33,708
|
)
|
||||||
|
Proceeds from short-term borrowing (maturities greater than 90 days)
|
240,000
|
|
20,000
|
|
—
|
|
||||||
|
Repayment of short-term borrowing (maturities greater than 90 days)
|
(260,000
|
)
|
—
|
|
—
|
|
||||||
|
Proceeds from long-term debt obligations
|
103,570
|
|
2,048
|
|
7,231
|
|
||||||
|
Repayment of long-term debt obligations
|
(23,827
|
)
|
(22,755
|
)
|
(21,109
|
)
|
||||||
|
Payment of deferred consideration - acquisition of Caisson Interventional, LLC
|
(12,994
|
)
|
—
|
|
—
|
|
||||||
|
Proceeds from exercise of stock options
|
4,178
|
|
4,973
|
|
8,332
|
|
||||||
|
Shares repurchased from employees for minimum tax withholding
|
(11,611
|
)
|
(4,083
|
)
|
(272
|
)
|
||||||
|
Share repurchases under share repurchase program
|
(50,000
|
)
|
—
|
|
(54,487
|
)
|
||||||
|
Repayment of trade receivable advances
|
—
|
|
—
|
|
(23,779
|
)
|
||||||
|
Other
|
(919
|
)
|
(1,285
|
)
|
(247
|
)
|
||||||
|
Net cash (used in) provided by financing activities
|
(42,348
|
)
|
11,294
|
|
(118,039
|
)
|
||||||
|
Effect of exchange rate changes on cash and cash equivalents
|
(3,996
|
)
|
4,048
|
|
(420
|
)
|
||||||
|
Net (decrease) increase in cash and cash equivalents
|
(46,411
|
)
|
53,826
|
|
(72,824
|
)
|
||||||
|
Cash and cash equivalents at beginning of period
|
93,615
|
|
39,789
|
|
112,613
|
|
||||||
|
Cash and cash equivalents at end of period
|
$
|
47,204
|
|
$
|
93,615
|
|
$
|
39,789
|
|
|||
|
Supplementary Disclosures of Cash Flow Information:
|
||||||||||||
|
Cash paid for interest
|
$
|
9,278
|
|
$
|
7,510
|
|
$
|
7,371
|
|
|||
|
Cash paid for income taxes
|
26,393
|
|
38,974
|
|
47,808
|
|
||||||
See accompanying notes to the consolidated financial statements
F-8
LIVANOVA PLC AND SUBSIDIARIES’
NOTES
TO THE CONSOLIDATED FINANCIAL STATEMENTS
(In thousands, except share and per share amounts)
Note 1. Nature of Operations
Description of the Business
LivaNova PLC, headquartered in London, (collectively with its subsidiaries, the “Company,” “LivaNova,” “we” or “our”) is a global medical device company focused on the development and delivery of important therapeutic solutions for the benefit of patients, healthcare professionals and healthcare systems throughout the world. Working closely with medical professionals in the fields of cardiovascular disease and neuromodulation, we design, develop, manufacture and sell innovative therapeutic solutions that are consistent with our mission to improve our patients’ quality of life, increase the skills and capabilities of healthcare professionals and minimize healthcare costs. We are a public limited company organized under the laws of England and Wales, and headquartered in London, England.
Business Franchises
LivaNova is comprised of
two
principal business franchises, which are also our reportable segments: Cardiovascular (“CV”) and Neuromodulation (“NM”), corresponding to our primary therapeutic areas. Other corporate activities include corporate shared service expenses for finance, legal, human resources, information technology and New Ventures.
Note 2. Basis of Presentation, Use of Accounting Estimates and Significant Accounting Policies
Basis of Presentation
The accompanying consolidated financial statements of LivaNova have been prepared in accordance with generally accepted accounting principles in the United States (“U.S.” and such principles, “U.S. GAAP”) and the instructions to Form 10-K and Article 3 and Article 5 of Regulation S-X.
The consolidated financial statements have been prepared on the basis that LivaNova will continue as a going concern. As further discussed in “Note 13. Commitments and Contingencies,” the Company has recorded a
$294.1 million
litigation provision liability based on managements’ best estimate, of which
$161.9 million
is anticipated to be paid during 2019 and the majority of the remainder is expected to be paid in the first half of 2020. In connection with our assessment of going concern considerations in accordance with ASU 2014-15, “
Disclosures of Uncertainties about an Entity’s Ability to Continue as a Going Concern,
” the Company determined that collectively the payments of the
$294.1 million
liability and the
$23.3 million
of current debt obligations represent a condition that raises substantial doubt about our ability to continue as a going concern as the Company does not have sufficient liquidity to meet its obligations as they come due. However, on February 25, 2019, the Company received
$350 million
in aggregate financing commitments pursuant to a commitment letter from Bank of America Merrill Lynch, Barclays, BNP Paribas and Intesa Sanpaolo for a debt facility (the “Commitment Letter”), the closing of which is subject to certain conditions. Management anticipates the financing to be executed no later than April 26, 2019. Management has concluded that the anticipated execution of the debt facility agreement based on the Commitment Letter, when combined with current and anticipated future operating cash flows, alleviates the substantial doubt about the Company’s ability to continue as a going concern over the 12-month period beginning from the issuance date of these financial statements given management has concluded that it is probable that the financing will be executed.
Consolidation
The accompanying consolidated financial statements for LivaNova include LivaNova’s wholly owned subsidiaries and the LivaNova PLC Employee Benefit Trust (“the Trust”). All intercompany accounts and transactions have been eliminated.
Use of Estimates
The preparation of our consolidated financial statements in conformity with U.S. GAAP requires management to make estimates and assumptions that affect the amounts reported in such financial statements and accompanying notes. These estimates are based on management’s best knowledge of current events and actions we may undertake in the future. Estimates are used in accounting for, among other items, valuation and amortization of intangible assets, goodwill, measurement of deferred tax assets and liabilities, uncertain income tax positions, stock-based compensation, obsolete and slow-moving inventories, models, such as an impairment analysis, and in general, allocations to provisions and the fair value of assets and liabilities recorded in a business combination. Actual results could differ materially from those estimates.
F-9
Reclassifications
We have reclassified certain prior period amounts for comparative purposes. These reclassifications did not have a material effect on our financial condition, results of operations or cash flows.
We reclassified
$34.0 million
to contingent consideration from other long-term liabilities at
December 31, 2017
to conform to the presentation on the consolidated balance sheet at
December 31, 2018
.
Beginning in these consolidated financial statements for the year ended December 31, 2018, the Company no longer presents gross profit within its consolidated statements of income (loss) because gross profit, as previously presented, excluded amortization of certain intangible assets. For the years ended December 31, 2017 and 2016, respectively,
$11.6 million
and
$11.4 million
of such amortization expense should have been included in cost of sales. The Company has determined that this misclassification error was not material to any prior annual or interim periods. For comparability among periods, the Company no longer presents gross profit within its consolidated statements of income (loss) for all periods.
Cash and Cash Equivalents
We consider all highly liquid investments with an original maturity of three months or less, consisting of demand deposit accounts and money market mutual funds, to be cash equivalents. Cash equivalents are carried on the consolidated balance sheet at cost, which approximated their fair value.
Accounts Receivable
Our accounts receivable consisted of trade receivables from direct customers and distributors. We maintain an allowance for doubtful accounts for potential credit losses based on our estimates of the ability of customers to make required payments, historical credit experience, existing economic conditions and expected future trends. We write off uncollectible accounts against the allowance when all reasonable collection efforts have been exhausted.
Inventories
We state our inventories at the lower of cost, using the first-in first-out (“FIFO”) method, or net realizable value. Our calculation of cost includes the acquisition cost of raw materials and components, direct labor and overhead, including depreciation of manufacturing related assets. We reduce the carrying value of inventories for those items that are potentially excess, obsolete or slow moving based on changes in customer demand, technology developments or other economic factors.
Property, Plant and Equipment (“PP&E”)
Assets held and used
PP&E is carried at cost, less accumulated depreciation. Maintenance, repairs and minor replacements are charged to expense as incurred, while significant renewals and improvements are capitalized. We compute depreciation using the straight-line method over estimated useful lives. Leasehold improvements are depreciated over the shorter of the following terms: the useful life of the asset or a term that includes required lease periods and renewals that are deemed to be reasonably assured at the date the leasehold improvements are purchased. Capital improvements to the building are added as building components and depreciated over the useful life of the improvement or the building, whichever is less.
Assets held for sale
We classify long-lived assets as held for sale in the period in which we commit to a plan to sell the asset, the asset is available for immediate sale, the asset is being actively marketed for sale at a price that is reasonable in relation to its current fair value and the sale of the asset is probable within the next twelve months and when actions required to complete the plan indicate that it is unlikely that significant changes to the plan will be made or that the plan will be withdrawn. A long-lived asset classified as held for sale is measured at the lower of its carrying amount or fair value less cost to sell and depreciation is discontinued. We recognize an impairment for any excess of carrying value over the fair value less cost to sell.
Goodwill
We allocate the amounts we pay for an acquisition to the assets we acquire and liabilities we assume based on their fair values at the date of acquisition, including property, plant and equipment, inventories, accounts receivable, long-term debt, and identifiable intangible assets which either arise from a contractual or legal right or are separable from goodwill. We base the fair value of identifiable intangible assets acquired in a business combination, including IPR&D, on valuations that use information and assumptions provided by management, which consider management’s best estimates of inputs and assumptions that a market participant would use. We allocate any excess purchase price over the fair value of the net tangible and identifiable intangible assets acquired to goodwill. Transaction costs associated with these acquisitions are expensed as incurred
F-10
and are reported in selling, general and administrative on the consolidated statements of income (loss). We recognize adjustments to the provisional amounts identified during the measurement period with a corresponding adjustment to goodwill in the reporting period in which the adjustment amounts are determined. The effect on earnings of changes in depreciation, amortization or other income effects, if any, as a result of the change to the provisional amounts are recorded in the same period’s consolidated financial statements, calculated as if the accounting had been completed at the acquisition date.
Intangible Assets, Other than Goodwill
Intangible assets shown on the consolidated balance sheets consist of finite-lived and indefinite-lived assets expected to generate future economic benefits and are recorded at their respective fair values as of their acquisition date. Finite-lived intangible assets consist primarily of developed technology and technical capabilities, including patents, related know-how and licensed patent rights, trade names, customer relationships and favorable leases acquired in acquisitions. Customer relationships consist of relationships with hospitals and cardiac surgeons in the countries where we operate. Indefinite-lived intangible assets other than goodwill are composed of IPR&D assets acquired in acquisitions. We estimate the useful lives of our intangible assets, which requires significant management judgment. We amortize our finite-lived intangible assets over their useful lives using the straight-line method.
Amortization expense is disclosed separately on our consolidated statements of income (loss). We evaluate our intangible assets each reporting period to determine whether events and circumstances indicate either a different useful life or impairment. If we change our estimate of the useful life of an asset, we amortize the carrying amount over the revised remaining useful life.
Impairments of Long-Lived Assets, Investments and Goodwill
Long-lived Assets and Investment Impairment
We evaluate the carrying value of our long-lived assets and investments for impairment when events or changes in circumstances indicate that the carrying value of such assets may not be recoverable. Such changes in circumstance may include, among other items, (i) an expectation of a sale or disposal of a long-lived asset or asset group, (ii) adverse changes in market or competitive conditions, (iii) an adverse change in legal factors or business climate in the markets in which we operate and (iv) operating or cash flow losses.
For PP&E and intangible assets used in our operations, recoverability generally is determined by comparing the carrying value of an asset, or group of assets to their expected undiscounted future cash flows. If the carrying value of an asset (asset group) is not recoverable, the amount of impairment loss is measured as the difference between the carrying value of the asset (asset group) and its estimated fair value. The asset grouping as well as the determination of expected undiscounted cash flow amounts requires significant judgments, estimates, and assumptions, including cash flows generated upon disposition. We measure fair value as the price that would be received if we were to sell the assets in an orderly transaction. Assets to be disposed of are carried at the lower of their financial statement carrying amount or fair value less costs to sell.
We conduct impairment testing of our indefinite-lived intangible assets on October 1st each year. We test indefinite-lived intangible assets for impairment between annual tests if an event occurs or circumstances change that would indicate the carrying amount may be impaired. An impairment loss is recognized when the asset's carrying value exceeds its fair value.
Goodwill Impairment
We conduct impairment testing of our goodwill on October 1st each year. We test goodwill for impairment between annual tests if an event occurs or circumstances change that would more-likely-than-not reduce the fair value of a reporting unit below its carrying amount. Testing is performed at the reporting unit level, which is defined as an operating segment or a component of an operating segment that constitutes a business for which financial information is available and is regularly viewed by management. Our operating segments are deemed to be our reporting units for purposes of goodwill impairment testing.
If we determine that goodwill is more-likely-than-not impaired, we perform the first step of a two-step goodwill impairment test. We first identify potential impairment by comparing the fair value of the reporting unit to its carrying amount, including goodwill. Fair value refers to the price that would be received if we were to sell the unit as a whole in an orderly transaction. If the carrying amount of our reporting unit is greater than zero and its fair value exceeds its carrying amount, goodwill of the reporting unit is considered not impaired and the second step of the impairment test is unnecessary. If the carrying value of the reporting unit exceeds its fair value, we perform step 2 of the goodwill impairment test. An impairment loss is recognized when the carrying amount of the reporting unit’s net assets exceeds the estimated fair value of the reporting unit, up to and including the carrying amount of the goodwill.
If the aggregate fair value of our reporting units exceeds our market capitalization, we evaluate the reasonableness of the implied control premium which includes a comparison to implied control premiums from recent market transactions within our industry or other relevant benchmark data.
F-11
Goodwill impairment evaluations are highly subjective. In most instances, they involve expectations of future cash flows that reflect our judgments and assumptions regarding future industry conditions and operations. The estimates, judgments and assumptions used in the application of our goodwill impairment policies reflect both historical experience and an assessment of current operational, industry, market, economic and political environments. The use of different estimates, judgments, assumptions and expectations regarding future industry and market conditions and operations would likely result in materially different asset carrying values and operating results.
Quantitative factors used to determine the fair value of the reporting units reflect our best estimates, and we believe they are reasonable. Future declines in the reporting units’ operating performance or our anticipated business outlook may reduce the estimated fair value of our reporting units and result in an impairment. Factors that could have a negative impact on the fair value of the reporting units include, but are not limited to:
•
decreases in revenue as a result of the inability of our sales force to effectively market and promote our products;
•
increased competition, patent expirations or new technologies or treatments;
•
declines in anticipated growth rates;
•
the outcome of litigation, legal proceedings, investigations or other claims resulting in significant cash outflows; and
•
increases in the market-participant risk-adjusted Weighted Average Cost of Capital (“WACC”).
Derivatives and Risk Management
U.S. GAAP requires companies to recognize all derivatives as assets and liabilities on the balance sheet and to measure the instruments at fair value through earnings unless the derivative qualifies for hedge accounting. If the derivative qualifies for hedge accounting, depending on the nature of the hedge and hedge effectiveness, changes in the fair value of the derivative will either be recognized immediately in earnings or recorded in other comprehensive income (“OCI”) until the hedged item is recognized in earnings. The changes in the fair value of the derivative are intended to offset the change in fair value of the hedged asset, liability or probable commitment. We evaluate hedge effectiveness at inception and on an ongoing basis. If a derivative is no longer expected to be highly effective, hedge accounting is discontinued. Hedge ineffectiveness, if any, is recorded in earnings. Cash flows from derivative contracts are reported as operating activities on the consolidated statements of cash flows.
We use currency exchange rate derivative contracts and interest rate derivative instruments to manage the impact of currency exchange and interest rate changes on earnings and cash flows. In order to minimize earnings and cash flow volatility resulting from currency exchange rate changes, we enter into derivative instruments, principally forward currency exchange rate contracts. These contracts are designed to hedge anticipated foreign currency transactions and changes in the value of specific assets and liabilities. At inception of the forward contract, the derivative is designated as either a freestanding derivative or a cash flow hedge. We do not enter into currency exchange rate derivative contracts for speculative purposes. All derivative instruments that qualify for hedge accounting are recorded at fair value on the consolidated balance sheets, as assets or liabilities (current or non-current) depending upon the gain or loss position of the contract and contract maturity date.
Forward contracts designated as cash flow hedges are designed to hedge the variability of cash flows associated with forecasted transactions denominated in a foreign currency that will take place in the future. For derivative instruments that are designated and qualify as a cash flow hedge, the effective portion of the gain or loss on the derivative instrument is reported as a component of accumulated other comprehensive income (“AOCI”) and reclassified into earnings to offset exchange differences originated by the hedged item or the current earnings effect of the hedged item. We use freestanding derivative forward contracts to offset exposure to the variability of the value associated with assets and liabilities denominated in a foreign currency. These derivatives are not designated as hedges, and therefore changes in the value of these forward contracts are recognized in earnings, thereby offsetting the current earnings effect of the related change in value of foreign currency denominated assets and liabilities.
We use interest rate derivative instruments designated as cash flow hedges to manage the exposure to interest rate movements and to reduce the risk of increased borrowing costs by converting floating-rate debt into fixed-rate debt. Under these agreements, we agree to exchange, at specified intervals, the difference between fixed and floating interest amounts calculated by reference to agreed-upon notional principal amounts. The interest rate swaps are structured to mirror the payment terms of the underlying loan. The fair value of the interest rate swaps is reported on the consolidated balance sheets as assets or liabilities (current or non-current) depending upon the gain or loss position of the contract and the maturity of the future cash flows of each contract. The effective portion of the gain or loss on these derivatives is reported as a component of AOCI. The non-effective portion is reported in interest expense on the consolidated statements of income (loss).
F-12
Fair Value Measurements
We follow the authoritative guidance on fair value measurements and disclosures with respect to assets and liabilities that are measured at fair value on both a recurring and nonrecurring basis. Under this guidance, fair value is defined as the exit price, or the amount that would be received to sell an asset or paid to transfer a liability in an orderly transaction between market participants as of the measurement date. The authoritative guidance also establishes a hierarchy for inputs used in measuring fair value that maximizes the use of observable inputs and minimizes the use of unobservable inputs by requiring that the most observable inputs be used when available. Observable inputs are inputs market participants would use in valuing the asset or liability, based on market data obtained from sources independent of us. Unobservable inputs are inputs that reflect our assumptions about the factors market participants would use in valuing the asset or liability developed based upon the best information available in the circumstances. The categorization of financial assets and financial liabilities within the valuation hierarchy is based upon the lowest level of input that is significant to the fair value measurement. The hierarchy is broken down into three levels defined as follows:
|
•
|
Level 1 - Inputs are quoted prices in active markets for identical assets or liabilities;
|
|
•
|
Level 2 - Inputs include quoted prices for similar assets or liabilities in active markets, quoted prices for identical or similar assets or liabilities in markets that are not active, and inputs (other than quoted prices) that are observable for the asset or liability, either directly or indirectly; and
|
|
•
|
Level 3 - Inputs are unobservable for the asset or liability.
|
Financial assets and liabilities that are classified as Level 2 include derivative instruments, primarily forward and option currency contracts and interest rate swaps contracts, which are valued using standard calculations and models that use readily observable market data as their basis.
Contingent Consideration
Financial liabilities that are classified as Level 3 include contingent consideration arrangements resulting from acquisitions that involve potential future payment of consideration that is contingent upon the achievement of performance milestones. Contingent consideration is recognized at fair value at the date of acquisition based on the consideration expected to be transferred and estimated as the probability of future cash flows, discounted to present value in accordance with accepted valuation methodologies. The discount rate used is determined at the time of measurement. Contingent consideration is remeasured each reporting period with the change in fair value, including accretion for the passage of time, recorded in earnings. The change in fair value of contingent consideration based on the achievement of regulatory milestones is recorded as research and development expense while the change in fair value of sales-based earnout contingent consideration is recorded as cost of sales.
Investments in Equity Securities
Our investments in equity securities, and related loans, are investments in affiliates that are in varied stages of development and not publicly traded. Our equity investments are reported in investments, and related loans in other assets, on the consolidated balance sheets.
In January 2016, the FASB issued guidance which requires investments in affiliates that do not result in consolidation and are not accounted for under the equity method to be measured at fair value with changes recognized in net income. However, an entity may elect to measure investments that do not have readily determinable fair values, at cost minus impairment, if any, plus or minus changes resulting from observable price changes in orderly transactions for an identical or a similar investment of the same issuer. We made this election beginning January 1, 2018, resulting in no material impact to our consolidated financial statements.
Our investments in affiliates in which we have the ability to exert significant influence over operating and financial policies of the affiliate, but where we do not control the operating and financial policies, are accounted for using the equity method. Our equity method investments are reported under investments on the consolidated balance sheets. Equity securities accounted for under the equity method are initially recorded at the amount of our investment. The cost of our investments accounted for under the equity method may give rise to a difference between the cost of the investment and our share of the investee’s net book value, or a basis difference. A basis difference is assigned to assets and liabilities of the investee with remaining unassigned basis assigned to goodwill. We amortize finite lived basis differences over the life of the asset or liability. We adjust our investment carrying value each period for our share of the investee’s income or loss. We report our share of the investee’s losses and the amortization of basis differences on the consolidated statements of income (loss) as losses from equity method investments. We regularly review our investments for changes in circumstance or the occurrence of events that suggest our investment may not be recoverable, and if an impairment is considered to be other-than-temporary, the loss is recognized on the consolidated statements of income (loss) in the period the determination is made and reported as losses from equity-method investments.
F-13
Warranty Obligation
We offer a warranty on various products. We estimate the costs that may be incurred under warranties and record a liability in the amount of such costs at the time the product is sold. The amount of the reserve recorded is equal to the net costs to repair or otherwise satisfy the claim. We include the warranty obligation in accrued liabilities and other on the consolidated balance sheets. Warranty expense is recorded to cost of goods sold on our consolidated statements of income (loss).
Retirement Benefit Plan Assumptions
We sponsor various retirement benefit plans, including defined benefit pension plans (pension benefits), defined contribution savings plans and termination indemnity plans, covering substantially all U.S. employees and employees outside the U.S. Pension benefit costs include assumptions for the discount rate, retirement age, compensation rate increases and the expected return on plan assets.
Product Liability Accruals
Accruals for product liability claims are recorded when it is probable that a liability has been incurred and the amount of the liability can be reasonably estimated based on existing information. Accruals for product liability claims are adjusted periodically as additional information becomes available. The Company accrues an estimate of the legal defense costs needed to defend each matter when those costs are probable and can be reasonably estimated.
Revenue Recognition
On January 1, 2018, we adopted ASU No 2014-09, Revenue from Contracts with Customers. Refer to “
Note 3. Revenue Recognition
.” We elected the cumulative effect transition method; however, we recognized no cumulative effect to the opening balance of retained earnings because the impact on the timing of when revenue is recognized within our CV segment, specifically related to heart-lung machines and preventative maintenance contracts on cardiopulmonary equipment, was insignificant. The timing of revenue recognition for products and related revenue streams within our NM segment and discontinued operations did not change.
Research and Development
All R&D costs are expensed as incurred. R&D includes costs of basic research activities as well as engineering and technical effort required to develop a new product or make significant improvements to an existing product or manufacturing process. R&D costs also include regulatory and clinical study expenses, including post-market clinical studies.
Leases
We account for leases that transfer substantially all benefits and risks incidental to the ownership of property as an acquisition of an asset and the incurrence of an obligation, and we account for all other leases as operating leases. Certain of our leases provide for tenant improvement allowances that have been recorded as deferred rent and amortized using the straight-line method over the life of the lease as a reduction to rent expense. In addition, scheduled rent increases and rent holidays are recognized on a straight-line basis over the term of the lease.
Stock-Based Compensation
Stock-Based Incentive Awards
We may grant stock-based incentive awards to directors, officers, key employees and consultants. We measure the cost of employee services received in exchange for an award of equity instruments based on the grant date fair market value of the award. We recognize equity-based compensation expense ratably over the period that an employee is required to provide service in exchange for the entire award (all vesting periods). We issue new shares upon stock option exercises, otherwise issuance of stock for vesting of restricted stock, restricted stock units or exercises of stock appreciation rights are issued from treasury shares. We have the right to elect to pay the cash value of vested restricted stock units in lieu of the issuance of new shares.
Stock Appreciation Rights (“SARs”)
A SAR confers upon an employee the contractual right to receive an amount of cash, stock, or a combination of both that equals the appreciation in the company’s stock from an award’s grant date to the exercise date. SARs may be exercised at the employee’s discretion during the exercise period and do not give the employee an ownership right in the underlying stock. SARs do not involve payment of an exercise price. We use the Black-Scholes option pricing methodology to calculate the grant date fair market value of SARs and compensation is expensed ratably over the vesting period. We determine the expected
F-14
volatility of the awards based on historical volatility. Calculation of compensation for stock awards requires estimation of employee turnover and forfeiture rates.
Restricted Stock (“RS”) and Restricted Stock Units (“RSUs”)
We may grant RS and RSUs at no purchase cost to the grantee. The grantees of unvested RSUs have no voting rights or rights to dividends. Sale or transfer of the stock and stock units is restricted until they are vested. The fair market value of service-based RS and RSUs is determined using the market closing price on the grant date, and compensation is expensed ratably over the vesting period. Calculation of compensation for stock awards requires estimation of employee turnover and forfeiture rates.
Income Taxes
We are a UK corporation, and we operate through our various subsidiaries in a number of countries throughout the world. Our provision for income taxes is based on the tax laws and rates applicable in the jurisdictions in which we operate and earn income. We use significant judgment and estimates in accounting for our income taxes. We recognize deferred tax assets and liabilities for the anticipated future tax effects of temporary differences between the financial statements basis and the tax basis of our assets and liabilities, which are measured using enacted tax rates expected to apply to taxable income in the years in which those temporary differences are expected to be recovered or settled.
We periodically assess the recoverability of our deferred tax assets by considering whether it is more-likely-than-not that some or all of the actual benefit of those assets will be realized. To the extent that realization does not meet the “more-likely-than-not” criterion, we establish a valuation allowance. We periodically review the adequacy and necessity of the valuation allowance by considering significant positive and negative evidence relative to our ability to recover deferred tax assets and to determine the timing and amount of valuation allowance that should be released. This evidence includes: profitability in the most recent quarters; internal forecasts for the current and next two future years; size of deferred tax asset relative to estimated profitability; the potential effects on future profitability from increasing competition, healthcare reforms and overall economic conditions; limitations and potential limitations on the use of our net operating losses due to ownership changes, pursuant to IRC Section 382; and the implementation of prudent and feasible tax planning strategies, if any.
We file federal and local tax returns in many jurisdictions throughout the world and are subject to income tax examinations for our fiscal year 1998 and subsequent years, with certain exceptions. While we believe that our tax return positions are fully supported, tax authorities may disagree with certain positions we have taken and assess additional taxes and as a result, we may establish reserves for uncertain tax positions, which require a significant degree of management judgment. We regularly assess the likely outcomes of our tax positions in order to determine the appropriateness of our reserves; however, the actual outcome of an audit can be significantly different than our expectations, which could have a material impact on our tax provision. Our tax positions are evaluated for recognition using a more-likely-than-not threshold. Uncertain tax positions requiring recognition are measured as the largest amount of tax benefit that has a greater than 50% likelihood of being realized upon effective settlement with a taxing authority that has full knowledge of all relevant information. Some of the reasons a reserve for an uncertain tax benefit may be reversed are: completion of a tax audit; a change in applicable tax law including a tax case or legislative guidance; or an expiration of the statute of limitations. We recognize interest and penalties associated with unrecognized tax benefits and record interest in interest expense, and penalties in selling, general and administrative expense, on our consolidated statements of income (loss).
Foreign Currency
Our functional currency is the U.S. dollar; however, a portion of the revenues earned and expenses incurred by certain of our subsidiaries are denominated in currencies other than the U.S. dollar. We determine the functional currency of our subsidiaries that exist and operate in different economic and currency environments based on the primary economic environment in which the subsidiary operates, that is, the currency of the environment in which an entity primarily generates and expends cash. Our significant foreign subsidiaries are located in Europe and the U.S. The functional currency of our significant European subsidiaries is the Euro, and the functional currency of our significant U.S. subsidiaries is the U.S. dollar.
Assets and liabilities of subsidiaries whose functional currency is not the U.S. dollar are translated into U.S. dollars based on a combination of both current and historical exchange rates, while their revenues earned and expenses incurred are translated into U.S. dollars at average period exchange rates. Translation adjustments are included as AOCI on the consolidated balance sheets. Gains and losses arising from transactions denominated in a currency different from an entity’s functional currency are included in foreign exchange and other (losses) gains on our consolidated statements of income (loss). Taxes are not provided on cumulative translation adjustments, as substantially all translation adjustments are related to earnings which are intended to be indefinitely reinvested in the countries where earned.
F-15
Contingencies
We are subject to product liability claims, government investigations and other legal proceedings in the ordinary course of business. Legal fees and other expenses related to litigation are expensed as incurred and included in selling, general and administrative expenses on our consolidated statements of income (loss). Contingent liabilities are recorded when we determine that a loss is both probable and reasonably estimable. Due to the fact that legal proceedings and other contingencies are inherently unpredictable, our assessments involve significant judgment regarding future events.
Note 3. Revenue Recognition
We generate our revenue through contracts with customers that primarily consist of hospitals, healthcare institutions, distributors and other organizations. Revenue is measured based on consideration specified in a contract with a customer, and excludes amounts collected on behalf of third parties. We measure the consideration based upon the estimated amount to be received. The amount of consideration we ultimately receive varies depending upon the return terms, sales rebates, discounts, and other incentives that we may offer, which are accounted for as variable consideration when estimating the amount of revenue to recognize. The estimate of variable consideration requires significant judgment.
We have historically experienced a low rate of product returns and the total dollar value of product returns has not been significant to our consolidated financial statements.
We recognize revenue when a performance obligation is satisfied by transferring the control of a product or providing service to a customer. Some of our contracts include the purchase of multiple products and/or services. In such cases, we allocate the transaction price based upon the relative estimated stand-alone price of each product and/or service sold. We record state and local sales taxes net; that is, we exclude sales tax from revenue. Typically, our contracts do not have a significant financing component.
We incur incremental commission fees paid to the sales force associated with the sale of products. We apply the practical expedient within ASC 606-10-50-22 and have elected to recognize the incremental costs of obtaining a contract as an expense when incurred if the amortization period of the asset the entity would otherwise recognize is one year or less. As a result, no commissions are capitalized as contract costs at
December 31, 2018
.
The following is a description of the principal activities (separated by reportable segments) from which we generate our revenue. For more detailed information about our reportable segments including disaggregated revenue results by major product line and primary geographic markets, see “
Note 19. Geographic and Segment Information
.”
Cardiovascular Products and Services
Our CV segment has
three
primary product lines: cardiopulmonary products, heart valves and advanced circulatory support.
Cardiopulmonary products include oxygenators, heart-lung machines, autotransfusion systems, perfusion tubing systems, cannulae and other related accessories. Heart valves include mechanical heart valves, tissue heart valves and related repair products. Advanced circulatory support, which represents our recently acquired TandemLife business, includes temporary life support product kits that can include a combination of pumps, oxygenators, and cannulae.
Cardiopulmonary products may include performance obligations associated with assembly and installation of equipment. Accordingly, we allocate a portion of the sales prices to installation obligations and recognize that revenue when the service is provided. We recognize revenue for equipment and accessory product sales when control of the equipment or product passes to the customer.
Heart valve revenue is recognized when control passes to the customer, usually at the point of surgery.
Advanced circulatory support revenue is recognized when control passes to the customer, usually at the point of shipment.
Technical services include installation, repair and maintenance of cardiopulmonary equipment under service contracts or upon customer request. Technical service agreements generally provide for upfront payments in advance of rendering services or periodic billing over the contract term. Amounts billed in advance are deferred and recognized as revenue when the performance obligation is satisfied. Technical services are not a significant component of CV revenue and have been presented with the related equipment and accessories revenue.
Neuromodulation Products
NM segment products are comprised of NM therapy systems for the treatment of drug-resistant epilepsy, TRD and obstructive sleep apnea. Our NM product line includes the VNS Therapy System, which consists of an implantable pulse generator, a lead that connects the generator to the vagus nerve, and other accessories. Our NM product line also includes an implantable device for the treatment of obstructive sleep apnea that stimulates multiple tongue muscles via the hypoglossal
F-16
nerve, which opens the airway while a patient is sleeping. We recognize revenue for NM product sales when control passes to the customer.
Contract Balances
Due to the nature of our products and services, revenue producing activities may result in contract assets and contract liabilities which are insignificant to our financial position and results of operations. These activities relate primarily to CV technical services contracts for short-term and multi-year service agreements. Contract assets are primarily comprised of unbilled revenues, which occur when a performance obligation has been completed, but not billed to the customer. Contract liabilities are made up of deferred revenue, which occurs when a customer pays for a service, before a performance obligation has been completed. Contract assets are included within prepaid expenses and other current assets on the consolidated balance sheets and were insignificant at
December 31, 2018
and
December 31, 2017
. As of
December 31, 2018
and
December 31, 2017
, contract liabilities of
$4.8 million
and
$3.8 million
, respectively, are included within accrued liabilities and other and other long-term liabilities on the consolidated balance sheets.
Note 4. Business Combinations
Caisson
Caisson is focused on the design, development and clinical evaluation of a novel TMVR implant device with a fully transvenous delivery system for the treatment of MR.
On May 2, 2017, we acquired the remaining
51%
equity interests in Caisson for a purchase price of up to
$72.0 million
, net of
$6.3 million
of debt forgiveness, consisting of
$18.0 million
paid at closing,
$14.4 million
paid during the year ended December 31, 2018, and contingent consideration of up to
$39.6 million
to be paid on a schedule driven primarily by regulatory approvals and a sales-based earnout.
The following table presents the acquisition date fair-value of the consideration transferred and the fair value of our interest in Caisson prior to the acquisition (in thousands):
|
Cash
(1)
|
$
|
15,660
|
|
|
|
Debt forgiven
(2)
|
6,309
|
|
||
|
Deferred consideration
(1)
|
12,994
|
|
||
|
Contingent consideration
(1)
|
29,303
|
|
||
|
Fair value of consideration transferred
|
64,266
|
|
||
|
Fair value of our interest prior to the acquisition
(2)
|
52,505
|
|
||
|
Fair value of total consideration
|
$
|
116,771
|
|
|
|
(1)
|
Concurrent with the acquisition, we recognized
$5.8 million
of post-combination compensation expense. Of this amount,
$2.4 million
is reflected as a reduction of
$18.0 million
in cash paid at closing of the acquisition, while
$3.4 million
increased the deferred consideration and contingent consideration liabilities recognized at the date of the acquisition to a total of
$14.1 million
and
$31.7 million
, respectively.
|
|
(2)
|
On the acquisition date, we remeasured the notes receivable from Caisson and our existing investment in Caisson at fair value and recognized a pre-tax non-cash gain of
$1.3 million
and
$38.1 million
, respectively, which are included in Gain on acquisitions on our consolidated statement of income (loss) for the year ended December 31, 2017.
|
F-17
The purchase price allocation presented in the following table (in thousands) was finalized during the second quarter of 2018 and there were no adjustments to the preliminary purchase price allocation during the measurement period.
|
Cash and cash equivalents
|
$
|
1,468
|
|
|
|
In-process research and development
(1)
|
89,000
|
|
||
|
Goodwill
|
42,417
|
|
||
|
Other assets
|
918
|
|
||
|
Current liabilities
|
1,023
|
|
||
|
Deferred income tax liabilities, net
(2)
|
16,009
|
|
||
|
Net assets acquired
|
$
|
116,771
|
|
|
|
(1)
|
The fair value of IPR&D was determined using the income approach, which is a valuation technique that provides a fair value estimate based on the market participant expectations of cash flows the asset would generate. The cash flows were discounted commensurate with the level of risk associated with the asset. The discount rates were developed after assigning a probability of success to achieving the projected cash flows based on the current stage of development, inherent uncertainty in reaching certain regulatory milestones and risks associated with commercialization of the product. The IPR&D amount is included in intangible assets, net on the consolidated balance sheet at
December 31, 2018
.
|
|
(2)
|
The amounts are presented net of deferred tax assets acquired.
|
Acquired goodwill of
$9.6 million
is expected to be deductible for tax purposes. Additionally,
$3.0 million
of the initial cash payment was deposited in escrow for future claims indemnification. These escrow deposits were released during 2018.
We recognized acquisition-related expenses of approximately
$1.3 million
for legal and valuation expenses during the year ended December 31, 2017. Additionally, the results of Caisson for the period of
May 2, 2017
through December 31, 2017 added
no
revenue and
$20.1 million
in expenses on our consolidated statements of income (loss). Pro forma financial information, assuming the Caisson acquisition had occurred as of the beginning of the calendar year prior to the year of acquisition, was not material for disclosure purposes.
The contingent consideration arrangements are composed of potential cash payments upon the achievement of certain regulatory milestones and a sales-based earnout associated with sales of products covered by the purchase agreement. The sales-based earnout was valued using projected sales from our internal strategic plans. Both arrangements are Level 3 fair value measurements and include the following significant unobservable inputs (in thousands):
|
Caisson Acquisition
|
Fair value at May 2, 2017
|
Valuation Technique
|
Unobservable Input
|
Ranges
|
||||||
|
Regulatory milestone-based payments
|
$
|
14,883
|
|
Discounted cash flow
|
Discount rate
|
2.6% - 3.4%
|
||||
|
Probability of payment
|
90% - 95%
|
|||||||||
|
Projected payment years
|
2018-2023
|
|||||||||
|
Sales-based earnout
|
16,805
|
|
Monte Carlo simulation
|
Discount rate
|
11.5% - 12.7%
|
|||||
|
Sales volatility
|
36.9%
|
|||||||||
|
Projected years of earnout
|
2019-2033
|
|||||||||
|
$
|
31,688
|
|
||||||||
For a reconciliation of the beginning and ending balance of contingent consideration liabilities refer to “
Note 10. Fair Value Measurements
.”
ImThera
ImThera manufactures an implantable device for the treatment of obstructive sleep apnea that stimulates multiple tongue muscles via the hypoglossal nerve, which opens the airway while a patient is sleeping. ImThera has a commercial presence in the European market, and an FDA pivotal study is ongoing in the U.S.
On January 16, 2018, we acquired the remaining
86%
outstanding interest in ImThera for cash consideration of up to
$225 million
. Cash in the amount of
$78.3 million
was paid at closing with the balance to be paid based on achievement of a certain regulatory milestone and a sales-based earnout.
F-18
The following table presents the acquisition date fair value of the consideration transferred and the fair value of our interest in ImThera prior to the acquisition (in thousands):
|
Cash
|
$
|
78,332
|
|
|
|
Contingent consideration
|
112,744
|
|
||
|
Fair value of our interest in ImThera prior to the acquisition
(1)
|
25,580
|
|
||
|
Fair value of consideration transferred
|
$
|
216,656
|
|
|
|
(1)
|
The fair value of our previously held interest in ImThera was determined based on the fair value of total consideration transferred and application of a discount for lack of control. As a result, we recognized a gain of
$11.5 million
for the fair value in excess of our carrying value of
$14.1 million
. The gain is included in Gain on acquisitions on our consolidated statement of income (loss) for the year ended
December 31, 2018
.
|
The following table presents the purchase price allocation at fair value for the ImThera acquisition including certain measurement period adjustments (in thousands):
|
Initial Purchase Price Allocation
|
Measurement Period Adjustments
(1)
|
Adjusted Purchase Price Allocation
|
||||||||||
|
In-process research and development
(2)
|
$
|
151,605
|
|
$
|
10,677
|
|
$
|
162,282
|
|
|||
|
Developed technology
|
5,661
|
|
(5,661
|
)
|
—
|
|
||||||
|
Goodwill
|
87,063
|
|
(4,467
|
)
|
82,596
|
|
||||||
|
Deferred income tax liabilities, net
(3)
|
27,980
|
|
1,278
|
|
29,258
|
|
||||||
|
Other assets and liabilities, net
|
836
|
|
200
|
|
1,036
|
|
||||||
|
Net assets acquired
|
$
|
217,185
|
|
$
|
(529
|
)
|
$
|
216,656
|
|
|||
|
(1)
|
During the second quarter of 2018, measurement period adjustments were recorded based upon new information obtained about facts and circumstances that existed as of the acquisition date.
|
|
(2)
|
The fair value of IPR&D was determined using the income approach, which is a valuation technique that provides a fair value estimate based on the market participant expectations of cash flows the asset would generate. The cash flows were discounted commensurate with the level of risk associated with the asset. The discount rates were developed after assigning a probability of success to achieving the projected cash flows based on the current stage of development, inherent uncertainty in reaching certain regulatory milestones and risks associated with commercialization of the product. The IPR&D amount is included in intangible assets, net on the consolidated balance sheet at
December 31, 2018
.
|
|
(3)
|
The amounts are presented net of deferred tax assets acquired.
|
Goodwill arising from the ImThera acquisition, which is not deductible for tax purposes, primarily represents the synergies anticipated between ImThera and our existing NM business. The assets acquired, including goodwill, are recognized in our NM segment.
The results of the ImThera acquisition added
$0.3 million
in revenue and
$8.8 million
in operating losses during the year ended December 31, 2018. Additionally, we recognized ImThera acquisition-related expenses of approximately
$0.7 million
for legal and valuation expenses during the year ended December 31, 2018. These expenses are included within “Selling, general and administrative” expenses on our consolidated statement of income (loss). Pro forma financial information, assuming the ImThera acquisition had occurred as of the beginning of the calendar year prior to the year of acquisition, was not material for disclosure purposes.
F-19
The ImThera business combination involved contingent consideration arrangements composed of potential cash payments upon the achievement of a certain regulatory milestone and a sales-based earnout associated with sales of products covered by the purchase agreement. The sales-based earnout was valued using projected sales from our internal strategic plan. Both arrangements are Level 3 fair value measurements and include the following significant unobservable inputs (in thousands):
|
ImThera Acquisition
|
Fair value at January 16, 2018
|
Valuation Technique
|
Unobservable Input
|
Ranges
|
||||||
|
Regulatory milestone-based payment
|
$
|
50,429
|
|
Discounted cash flow
|
Discount rate
|
4.3% - 4.7%
|
||||
|
Probability of payment
|
85% - 95%
|
|||||||||
|
Projected payment years
|
2020 - 2021
|
|||||||||
|
Sales-based earnout
|
62,315
|
|
Monte Carlo simulation
|
Risk-adjusted discount rate
|
11.5%
|
|||||
|
Credit risk discount rate
|
4.7% - 5.8%
|
|||||||||
|
Revenue volatility
|
29.3%
|
|||||||||
|
Probability of payment
|
85% - 95%
|
|||||||||
|
Projected years of earnout
|
2020 - 2025
|
|||||||||
|
$
|
112,744
|
|
||||||||
For a reconciliation of the beginning and ending balance of contingent consideration liabilities refer to “
Note 10. Fair Value Measurements
.”
TandemLife
TandemLife is focused on the delivery of leading-edge temporary life support systems, including cardiopulmonary and respiratory support solutions. TandemLife complements our CV segment portfolio and expands our existing product line of cardiopulmonary products.
On April 4, 2018, we acquired TandemLife for cash consideration of up to
$254 million
. Cash of
$204 million
was paid at closing with up to
$50 million
in contingent consideration based on the achievement of regulatory milestones.
The following table presents the acquisition date fair value of the consideration transferred (in thousands):
|
Cash
|
$
|
203,671
|
|
|
|
Contingent consideration
|
40,190
|
|
||
|
Fair value of consideration transferred
|
$
|
243,861
|
|
|
The following table presents the preliminary purchase price allocation at fair value for the TandemLife acquisition (in thousands):
|
Initial Purchase Price Allocation
|
Measurement Period Adjustments
(1)
|
Adjusted Purchase Price Allocation
|
||||||||||
|
In-process research and development
(2) (3)
|
$
|
110,977
|
|
$
|
(3,474
|
)
|
$
|
107,503
|
|
|||
|
Trade names
(2)
|
11,539
|
|
11,539
|
|
||||||||
|
Developed technology
(2)
|
6,387
|
|
6,387
|
|
||||||||
|
Goodwill
|
118,917
|
|
2,529
|
|
121,446
|
|
||||||
|
Inventory
|
10,296
|
|
(140
|
)
|
10,156
|
|
||||||
|
Other assets and liabilities, net
|
3,632
|
|
242
|
|
3,874
|
|
||||||
|
Deferred income tax liabilities, net
(4)
|
17,887
|
|
(843
|
)
|
17,044
|
|
||||||
|
Net assets acquired
|
$
|
243,861
|
|
$
|
—
|
|
$
|
243,861
|
|
|||
|
(1)
|
During the third quarter of 2018, measurement period adjustments were recorded based upon new information regarding future estimates of R&D expenses that existed as of the acquisition date.
|
|
(2)
|
The amounts are included in intangible assets, net on the consolidated balance sheet at December 31, 2018. Trade names and developed technology are amortized over remaining useful lives of
15
and
2
years, respectively.
|
F-20
|
(3)
|
The fair value of IPR&D was determined using the income approach, which is a valuation technique that provides a fair value estimate based on the market participant expectations of cash flows the asset would generate. The cash flows were discounted commensurate with the level of risk associated with the asset. The discount rates were developed after assigning a probability of success to achieving the projected cash flows based on the current stage of development, inherent uncertainty in reaching certain regulatory milestones and risks associated with commercialization of the product.
|
|
(4)
|
The amounts are presented net of deferred tax assets and include a provisional estimate for deferred tax assets acquired.
|
Goodwill arising from the TandemLife acquisition, which is not deductible for tax purposes, primarily represents the synergies anticipated between TandemLife and our existing CV business. The assets acquired, including goodwill, are recognized in our CV segment.
The results of the TandemLife acquisition added
$19.5 million
in revenue and
$14.0 million
in operating losses during the year ended December 31, 2018. Additionally, we recognized TandemLife acquisition-related expenses of approximately
$2.1 million
for legal and valuation expenses during the year ended December 31, 2018. These expenses are included within Selling, general and administrative expenses on our consolidated statement of income (loss). Pro forma financial information, assuming the TandemLife acquisition had occurred as of the beginning of the calendar year prior to the year of acquisition, was not material for disclosure purposes.
The TandemLife business combination involved a contingent consideration arrangement composed of potential cash payments upon the achievement of certain regulatory milestones. The arrangement is a Level 3 fair value measurement and includes the following significant unobservable inputs (in thousands):
|
TandemLife Acquisition
|
Fair value at April 4, 2018
|
Valuation Technique
|
Unobservable Input
|
Ranges
|
||||||
|
Regulatory milestone-based payments
|
$
|
40,190
|
|
Discounted cash flow
|
Discount rate
|
4.2% - 4.8%
|
||||
|
Probability of payments
|
75% - 95%
|
|||||||||
|
Projected payment years
|
2019 - 2020
|
|||||||||
For a reconciliation of the beginning and ending balance of contingent consideration liabilities refer to “
Note 10. Fair Value Measurements
.”
Note 5. Discontinued Operations
In November 2017, we concluded that the sale of CRM represented a strategic shift in our business that would have a major effect on future operations and financial results. Accordingly, the operating results of CRM are classified as discontinued operations on our consolidated statements of income (loss) for all the periods presented in this Annual Report on Form 10-K. The assets and liabilities of CRM are presented as assets or liabilities of discontinued operations on the consolidated balance sheet at
December 31, 2017
.
We completed the CRM Sale on April 30, 2018 to MicroPort Cardiac Rhythm B.V. and MicroPort Scientific Corporation for total cash proceeds of
$195.9 million
, less cash transferred of
$9.2 million
, subject to a closing working capital adjustment. In conjunction with the sale, we entered into transition services agreements to provide certain support services generally for up to twelve months from the closing date of the sale. The services include, among others, accounting, information technology, human resources, quality assurance, regulatory affairs, supply chain, clinical affairs and customer support. During the year ended
December 31, 2018
we recognized income of
$2.8 million
for providing these services. Income recognized related to the transition services agreements is recorded as a reduction to the related expenses in the associated expense line items on our consolidated statements of income (loss).
F-21
The following table represents assets and liabilities of CRM, which are classified as held for sale and presented as assets and liabilities of discontinued operations on the consolidated balance sheets (in thousands):
|
December 31, 2017
|
||||
|
Accounts receivable, net
|
$
|
64,684
|
|
|
|
Inventories
|
54,097
|
|
||
|
Prepaid taxes
|
14,725
|
|
||
|
Prepaid and other assets
|
3,498
|
|
||
|
Property, plant and equipment, net
|
12,104
|
|
||
|
Deferred tax assets
|
2,517
|
|
||
|
Investments
|
6,098
|
|
||
|
Intangible assets, net
|
92,966
|
|
||
|
Assets of discontinued operations
|
$
|
250,689
|
|
|
|
Accounts payable
|
$
|
26,501
|
|
|
|
Accrued liabilities and other
|
7,669
|
|
||
|
Income taxes payable
|
5,084
|
|
||
|
Accrued employee compensation and benefits
|
30,753
|
|
||
|
Deferred tax liabilities
|
8,068
|
|
||
|
Liabilities of discontinued operations
|
$
|
78,075
|
|
|
The following table represents the financial results of CRM presented as net loss from discontinued operations, net of tax on our consolidated statements of income (loss) (in thousands):
|
Year Ended December 31, 2018
|
Year Ended December 31, 2017
|
Year Ended December 31, 2016
|
||||||||||
|
Revenues
|
$
|
77,366
|
|
$
|
245,171
|
|
$
|
249,067
|
|
|||
|
Costs and expenses:
|
||||||||||||
|
Cost of sales - exclusive of amortization
|
28,028
|
|
92,609
|
|
104,160
|
|
||||||
|
Selling, general and administrative expenses
|
43,382
|
|
105,831
|
|
112,291
|
|
||||||
|
Research and development
|
16,592
|
|
37,936
|
|
39,911
|
|
||||||
|
Merger and integration expenses
|
—
|
|
22
|
|
160
|
|
||||||
|
Restructuring expenses
|
651
|
|
(1,617
|
)
|
18,566
|
|
||||||
|
Amortization of intangibles
|
—
|
|
12,737
|
|
14,476
|
|
||||||
|
Impairment of tangible and intangible assets
|
—
|
|
93,574
|
|
—
|
|
||||||
|
Goodwill impairment
|
—
|
|
—
|
|
18,348
|
|
||||||
|
Revaluation gain on assets and liabilities held for sale
|
(1,213
|
)
|
—
|
|
—
|
|
||||||
|
Loss on sale of CRM
|
214
|
|
—
|
|
—
|
|
||||||
|
Operating loss from discontinued operations
|
(10,288
|
)
|
(95,921
|
)
|
(58,845
|
)
|
||||||
|
Foreign exchange and other gains (losses)
|
102
|
|
(381
|
)
|
130
|
|
||||||
|
Loss from discontinued operations, before tax
|
(10,186
|
)
|
(96,302
|
)
|
(58,715
|
)
|
||||||
|
Income tax (benefit) expense
|
(460
|
)
|
(21,635
|
)
|
2,015
|
|
||||||
|
Losses from equity method investments
|
(1,211
|
)
|
(4,887
|
)
|
(3,933
|
)
|
||||||
|
Net loss from discontinued operations
|
$
|
(10,937
|
)
|
$
|
(79,554
|
)
|
$
|
(64,663
|
)
|
|||
Cash flows attributable to our discontinued operations are included on our consolidated statements of cash flows. For the years ended
December 31, 2018
,
December 31, 2017
and
December 31, 2016
, CRM’s capital expenditures were
$1.0 million
,
$6.1 million
and
$3.8 million
and stock-based compensation expense was
$2.0 million
,
$1.4 million
and
$2.1 million
, respectively. For the years ended
December 31, 2017
and
December 31, 2016
, CRM’s depreciation and amortization was
$18.3
F-22
million
and
$21.8 million
, respectively. Income tax benefit for the year ended
December 31, 2017
includes a
$15.3 million
tax benefit recognized on the impairment of CRM.
Note 6. Restructuring
We initiate restructuring plans to leverage economies of scale, streamline distribution and logistics and strengthen operational and administrative effectiveness in order to reduce overall costs. Costs associated with these plans were reported as restructuring expenses in the operating results of our consolidated statements of income (loss).
Our 2015 and 2016 Reorganization Plans (the “Prior Plans”) were initiated October 2015 and March 2016, respectively, in conjunction with the completion of the merger of Cyberonics, Inc. and Sorin S.p.A. in October 2015. The Prior Plans include the closure of the R&D facility in Meylan, France and consolidation of its R&D capabilities into the Clamart, France facility. In addition, during the year ended
December 31, 2016
, we initiated a plan to exit the Costa Rica manufacturing operation and transfer its operations to Houston, Texas. We completed the exit of the Costa Rica manufacturing operation in the first half of 2017 and substantially completed the Prior Plans during 2018.
Included in Prior Plans was our commitment to sell our Suzhou Industrial Park facility in Shanghai, China, which we announced in March 2017. As a result of this exit plan we recorded an impairment of the building and equipment of
$5.4 million
and accrued
$0.5 million
of additional costs, primarily related to employee severance,
during the year ended December 31, 2017
. In addition, the remaining carrying value of the land, building and equipment, of
$13.6 million
, was reclassified to assets held for sale on the consolidated balance sheet as of
December 31, 2017
. We completed the sale of the Suzhou facility in April 2018 and received cash proceeds from the sale of
$13.3 million
.
In December 2018, we initiated a reorganization plan (the “2018 Plan”) in order to reduce manufacturing and operational costs associated with our CV facilities in Saluggia and Mirandola, Italy and Arvada, Colorado. We estimate that the 2018 Plan will result in a net reduction of approximately
75
personnel and is expected to be completed by the end of 2019.
The following table presents the accruals, inventory obsolescence and other reserves, recorded in connection with our reorganization plans including the balances and activity related to the CRM business franchise (in thousands):
|
|
Employee Severance and Other Termination Costs
|
Other
|
Total
|
|||||||||
|
Balance at December 31, 2015
|
$
|
6,919
|
|
$
|
—
|
|
$
|
6,919
|
|
|||
|
Charges
|
46,678
|
|
9,265
|
|
55,943
|
|
||||||
|
Cash payments / write-downs
|
(32,505
|
)
|
(6,209
|
)
|
(38,714
|
)
|
||||||
|
Balance at December 31, 2016
|
21,092
|
|
3,056
|
|
24,148
|
|
||||||
|
Charges
|
10,076
|
|
5,363
|
|
15,439
|
|
||||||
|
Cash payments / write-downs
|
(27,279
|
)
|
(5,794
|
)
|
(33,073
|
)
|
||||||
|
Balance at December 31, 2017
|
3,889
|
|
2,625
|
|
6,514
|
|
||||||
|
Charges
|
15,641
|
|
925
|
|
16,566
|
|
||||||
|
Cash payments
|
(9,335
|
)
|
(481
|
)
|
(9,816
|
)
|
||||||
|
Balance at December 31, 2018
(1)
|
$
|
10,195
|
|
$
|
3,069
|
|
$
|
13,264
|
|
|||
|
(1)
|
Cumulatively, we have recognized a total of
$99.3 million
in restructuring expense inclusive of discontinued operations.
|
F-23
The following table presents restructuring expense by reportable segment (in thousands):
|
Year Ended December 31, 2018
|
Year Ended December 31, 2017
|
Year Ended December 31, 2016
|
||||||||||
|
Cardiovascular
(1)
|
$
|
11,497
|
|
$
|
8,819
|
|
$
|
11,042
|
|
|||
|
Neuromodulation
(2)
|
1,595
|
|
561
|
|
14,769
|
|
||||||
|
Other
|
2,823
|
|
7,676
|
|
11,566
|
|
||||||
|
Restructuring expense from continuing operations
|
15,915
|
|
17,056
|
|
37,377
|
|
||||||
|
Discontinued operations
|
651
|
|
(1,617
|
)
|
18,566
|
|
||||||
|
Total
|
$
|
16,566
|
|
$
|
15,439
|
|
$
|
55,943
|
|
|||
|
(1)
|
CV restructuring expense for the year ended
December 31, 2018
included
$6.5 million
of 2018 Plan expenses. In addition, CV restructuring expense for the year ended
December 31, 2017
included building and equipment impairment of
$5.4 million
related to the Suzhou, China facility exit plan.
|
|
(2)
|
NM restructuring expense for the year ended
December 31, 2016
included building and equipment impairment of
$5.7 million
related to the Costa Rica exit plan.
|
Note 7. Product Remediation Liability
On December 29, 2015, we received an FDA Warning Letter (the “Warning Letter”) alleging certain violations of FDA regulations applicable to medical device manufacturing at our Munich, Germany and Arvada, Colorado facilities. On October 13, 2016, the CDC and FDA separately released safety notifications regarding 3T Heater-Cooler devices in response to which we issued a Field Safety Notice Update for U.S. users of our 3T Heater-Cooler devices to proactively and voluntarily contact facilities to facilitate implementation of the CDC and FDA recommendations.
At December 31, 2016, we recognized a liability for a product remediation plan related to our 3T Heater-Cooler device (“3T device”). The remediation plan we developed consists primarily of a modification of the 3T device design to include internal sealing and the addition of a vacuum system to new and existing devices. These changes are intended to address regulatory actions and to reduce further the risk of possible dispersion of aerosols from 3T devices in the operating room. We concluded that it was probable that a liability had been incurred upon management’s approval of the plan and the commitments made by management to various regulatory authorities globally in November and December 2016, and furthermore, the cost associated with the plan was reasonably estimable. The deployment of this solution for commercially distributed devices has been dependent upon final validation and verification of the design changes and approval or clearance by regulatory authorities worldwide, including FDA clearance in the U.S. It is reasonably possible that our estimate of the remediation liability could materially change in future periods due to the various significant assumptions involved such as customer behavior, market reaction and the timing of approvals or clearance by regulatory authorities worldwide.
In April 2017, we obtained CE Mark in Europe for the design change of the 3T device, and in May 2017 we completed our first vacuum canister and internal sealing upgrade on a customer-owned device. We are currently implementing the vacuum canister and internal sealing upgrade program in as many countries as possible until all devices are upgraded. On October 11, 2018, after review of information provided by us, the FDA concluded that we could commence the vacuum canister and internal sealing upgrade program in the U.S.
As part of the remediation plan, we continue to offer a no-charge deep disinfection service (deep cleaning service) for 3T device users as we receive the required regulatory approvals. On April 12, 2018, the FDA agreed to allow us to move forward with the deep cleaning service in the U.S., adding to the growing list of countries around the world in which we offer this service. Finally, we are continuing to offer the loaner program for 3T devices, initiated in the fourth quarter of 2016, to provide existing 3T device users with a new loaner 3T device at no charge pending regulatory approval and implementation of the vacuum system addition and deep disinfection service worldwide. This loaner program began in the U.S. and is being made available progressively on a global basis, prioritizing and allocating devices to 3T device users based on pre-established criteria.
F-24
Changes in the carrying amount of the product remediation liability are as follows (in thousands):
|
Balance at December 31, 2015
|
$
|
—
|
|
|
|
Charges
|
37,534
|
|
||
|
Remediation activity
|
(4,047
|
)
|
||
|
Balance at December 31, 2016
|
33,487
|
|
||
|
Adjustments
|
2,452
|
|
||
|
Remediation activity
|
(11,283
|
)
|
||
|
Effect of changes in foreign currency exchange rates
|
2,890
|
|
||
|
Balance at December 31, 2017
|
27,546
|
|
||
|
Adjustments
|
(200
|
)
|
||
|
Remediation activity
|
(12,212
|
)
|
||
|
Effect of changes in foreign currency exchange rates
|
(389
|
)
|
||
|
Balance at December 31, 2018
(1)
|
$
|
14,745
|
|
|
|
(1)
|
At
December 31, 2018
, the product remediation liability balance is included within accrued liabilities and other and other long-term liabilities on the consolidated balance sheet.
|
We recognized product remediation expenses
during the years ended December 31, 2018, 2017 and 2016
of
$10.7 million
,
$7.3 million
and
$37.5 million
, respectively. Product remediation expenses include internal labor costs, costs to remediate certain inspectional observations made by the FDA at our Munich facility and costs associated with the incorporation of the modification of the 3T device design into the next generation 3T device. These costs and related legal costs are expensed as incurred and are not included within the product remediation liability presented above. During the fourth quarter of 2018, we recognized a
$294.1 million
liability related to the litigation involving the 3T device. Our related legal costs are expensed as incurred. For further information, please refer to “
Note 13. Commitments and Contingencies
.”
Note 8. Goodwill and Intangible Assets
Our finite-lived and indefinite-lived intangible assets consisted of the following (in thousands):
|
December 31, 2018
|
December 31, 2017
|
|||||||
|
Finite-lived intangible assets:
|
||||||||
|
Customer relationships
|
$
|
317,292
|
|
$
|
327,496
|
|
||
|
Developed technology
|
176,476
|
|
179,234
|
|
||||
|
Trade names
|
25,260
|
|
14,391
|
|
||||
|
Other intangible assets
|
897
|
|
181
|
|
||||
|
Total gross finite-lived intangible assets
|
519,925
|
|
521,302
|
|
||||
|
Accumulated amortization - Customer relationships
|
57,350
|
|
40,557
|
|
||||
|
Accumulated amortization - Developed technology
|
39,144
|
|
26,489
|
|
||||
|
Accumulated amortization - Trade names
|
11,440
|
|
7,795
|
|
||||
|
Accumulated amortization - Other intangible assets
|
337
|
|
64
|
|
||||
|
Total accumulated amortization
|
108,271
|
|
74,905
|
|
||||
|
Net finite-lived intangible assets
|
$
|
411,654
|
|
$
|
446,397
|
|
||
|
Indefinite-lived intangible assets:
|
||||||||
|
IPR&D
|
$
|
358,785
|
|
$
|
89,000
|
|
||
|
Goodwill
|
956,815
|
|
784,242
|
|
||||
|
Total indefinite-lived intangible assets
|
$
|
1,315,600
|
|
$
|
873,242
|
|
||
During the year ended
December 31, 2018
, we recognized
$269.8 million
of in-process R&D related to the acquisition of ImThera and TandemLife. During the year ended
December 31, 2017
, we recognized
$89.0 million
of in-process R&D related to the acquisition of Caisson.
F-25
Our business consists of
two
operating segments (which are our reporting units for goodwill testing): the CV and NM segments. The carrying amount of goodwill by segment is as follows (in thousands):
|
Cardiovascular
|
Neuromodulation
|
Other
|
Total
|
|||||||||||||
|
December 31, 2016
|
$
|
375,769
|
|
$
|
315,943
|
|
$
|
—
|
|
$
|
691,712
|
|
||||
|
Goodwill as a result of acquisitions
(1)
|
—
|
|
—
|
|
42,417
|
|
42,417
|
|
||||||||
|
Foreign currency adjustments
|
50,113
|
|
—
|
|
—
|
|
50,113
|
|
||||||||
|
December 31, 2017
|
425,882
|
|
315,943
|
|
42,417
|
|
784,242
|
|
||||||||
|
Goodwill as a result of acquisitions
(1)
|
121,446
|
|
82,596
|
|
—
|
|
204,042
|
|
||||||||
|
Foreign currency adjustments
|
(31,469
|
)
|
—
|
|
—
|
|
(31,469
|
)
|
||||||||
|
December 31, 2018
|
$
|
515,859
|
|
$
|
398,539
|
|
$
|
42,417
|
|
$
|
956,815
|
|
||||
|
(1)
|
Goodwill recognized during the year ended
December 31, 2018
was the result of the ImThera and TandemLife acquisitions. Goodwill recognized during the year ended
December 31, 2017
was the result of the Caisson acquisition. Refer to “
Note 4. Business Combinations
.”
|
The amortization periods for our finite-lived intangible assets as of
December 31, 2018
are as follows:
|
Minimum Life in years
|
Maximum Life in years
|
|||
|
Customer relationships
|
17
|
18
|
||
|
Developed technology
|
2
|
19
|
||
|
Trade names
|
4
|
15
|
||
|
Other intangible assets
|
5
|
11
|
||
The estimated future amortization expense based on our finite-lived intangible assets at
December 31, 2018
is as follows (in thousands):
|
2019
|
$
|
37,628
|
|
|
|
2020
|
35,231
|
|
||
|
2021
|
34,431
|
|
||
|
2022
|
34,431
|
|
||
|
2023
|
34,381
|
|
||
|
Thereafter
|
235,552
|
|
||
|
Total
|
$
|
411,654
|
|
|
Indefinite-Lived Intangible Asset Impairment
We performed a quantitative assessment for our CV and NM reporting units as of October 1, 2018. The quantitative impairment assessment was performed using management’s current estimate of future cash flows. We concluded that the fair value of our CV and NM segments were substantially in excess of the carrying value of the respective reporting units, as evidenced by the estimated fair value of our CV and NM reporting units calculated for the purpose of reconciling the fair value of our reporting units to our market capitalization. Therefore, we concluded that our CV and NM reporting units’ goodwill was not impaired.
We also performed a quantitative impairment assessment, as of October 1, 2018, for the goodwill arising from the Caisson acquisition. The quantitative impairment assessment was performed using management’s current estimate of future cash flows, which are based on the expected timing of future regulatory approvals. Based upon the assessment performed, we determined that the goodwill was not impaired.
We performed a quantitative impairment assessment, as of October 1, 2018, for the IPR&D assets arising from the acquisitions of Caisson, ImThera and TandemLife. The quantitative impairment assessment was performed using management’s current estimate of future cash flows. Based on the assessment performed, we determined that the IPR&D assets were not impaired. However, future delays in regulatory approvals or changes in management estimates could result in fair values that are below their carrying amount.
F-26
During the fourth quarter of 2018, we determined that a pause in enrollment of the Caisson INTERLUDE CE Mark trial would result in a delay in commercialization. This delay constituted a triggering event that required evaluation of the goodwill and IPR&D asset arising from the Caisson acquisition for impairment. Based on the assessment performed, we determined that the goodwill and IPR&D asset were not impaired. A further delay or a change in management’s estimates could result in a fair value that is below its carrying amount. We will continue to monitor any changes in circumstances for indicators of impairment.
Note 9. Investments
The following table details the carrying value of our investments in equity securities of non-consolidated affiliates without readily determinable fair values for which we do not exert significant influence over the investee. These equity investments are reported at cost minus impairment, if any, plus or minus changes resulting from observable price changes in orderly transactions for the identical or similar investment of the same issuer. These equity investments are included in investments on the consolidated balance sheets (in thousands):
|
December 31, 2018
|
December 31, 2017
|
|||||||
|
Respicardia Inc.
(1)
|
$
|
17,706
|
|
$
|
17,422
|
|
||
|
Ceribell, Inc.
(2)
|
3,000
|
|
—
|
|
||||
|
Rainbow Medical Ltd.
(3)
|
1,119
|
|
1,172
|
|
||||
|
MD Start II
(4)
|
1,144
|
|
1,199
|
|
||||
|
Highlife S.A.S.
(5)
|
1,084
|
|
—
|
|
||||
|
ImThera Medical, Inc.
(6)
|
—
|
|
12,900
|
|
||||
|
Other
|
770
|
|
17
|
|
||||
|
$
|
24,823
|
|
$
|
32,710
|
|
|||
|
(1)
|
Respicardia Inc. (“Respicardia”) is a privately funded U.S. company developing an implantable device designed to restore a more natural breathing pattern during sleep in patients with central sleep apnea by transvenously stimulating the phrenic nerve. We have a loan outstanding to Respicardia with a carrying amount of
$0.6 million
and
$0.4 million
as of December 31, 2018
, and
December 31, 2017
, respectively, which is included in prepaid expenses and other current assets on the consolidated balance sheet. Refer to the paragraph below for further details regarding this investment.
|
|
(2)
|
On September 7, 2018, we acquired
1,007,319
shares of Series B Preferred Stock of Ceribell, Inc. (“Ceribell”). Ceribell is focused on utilizing electroencephalography to improve the diagnosis and treatment of patients at risk for seizures.
|
|
(3)
|
Rainbow Medical Ltd. (“Rainbow Medical”) is a private Israeli venture capital company that seeds and grows companies developing medical devices in a diverse range of medical fields. Refer to the paragraph below for further details.
|
|
(4)
|
MD Start II is a private venture capital collaboration for the development of medical device technology in Europe.
|
|
(5)
|
Highlife S.A.S. (“Highlife”) is a privately held clinical-stage medical device company located in France and is focused on the development of a unique TMRV replacement system to treat patients with MR. Refer to the paragraph below for further details. At
December 31, 2017
, we accounted for Highlife under the equity method and the carrying value was
$1.8 million
. Due to an additional investment by a third party during the year ended
December 31, 2018
, our equity interest in Highlife decreased to
7.8%
from
24.6%
. We determined that we no longer had significant influence over Highlife and, as a result, we no longer accounted for Highlife under the equity method.
|
|
(6)
|
On January 16, 2018, we acquired the remaining outside interests in ImThera Medical Inc. Refer to “
Note 4. Business Combinations
.”
|
Respicardia Impairment
We recognized an impairment of our investment in Respicardia during the year ended
December 31, 2017
based on the terms of an additional round of financing with a new strategic investor that indicated the carrying value of our aggregate investment might not be recoverable and that the decrease in value of our aggregate investment was other than temporary. The estimated fair value using the income approach was below the carrying value by
$5.5 million
. The impairment was included in impairment of investments on our consolidated statement of income (loss).
Rainbow Medical Impairment
We recognized an impairment of our investment in Rainbow Medical during the year ended
December 31, 2017
. An additional round of financing, which included a new investor, indicated that the carrying value of our investment might not be recoverable and that the decrease in value of our investment was other than temporary. We, therefore, estimated the fair value of our cost-method investment using the income approach. The estimated fair value of our investment was below our carrying value by
$3.0 million
. This impairment was included in impairment of investments on our consolidated statement of income (loss).
F-27
Highlife Impairment
We recognized an impairment of our investment in, and notes receivable from, Highlife, during the year ended
December 31, 2017
. Certain factors, including a revision in our investment strategy and a new strategic investor, indicated that the carrying value of our aggregate investment might not be recoverable and that the decrease in value of our aggregate investment was other than temporary. We, therefore, estimated the fair value of our investment and notes receivable using the market approach. The estimated fair value of our aggregate investment was below our carrying value by
$13.0 million
. This aggregate impairment was included in losses from equity method investments on our consolidated statement of income (loss).
Istituto Europeo di Oncologia S.R.L Sale
During the year ended
December 31, 2017
, we sold our investment in Istituto Europeo di Oncologia S.R.L, for a gain of
$3.2 million
. This gain is included in foreign exchange and other (losses) gains on our consolidated statement of income (loss).
Note 10. Fair Value Measurements
We review the fair value hierarchy classification on a quarterly basis. Changes in the ability to observe valuation inputs may result in a reclassification of levels for certain securities within the fair value hierarchy. There were no transfers between Level 1, Level 2, or Level 3 during the years ended
December 31, 2018
,
2017
or
2016
.
Assets and Liabilities Measured at Fair Value on a Recurring Basis
The following tables provide information by level for assets and liabilities that are measured at fair value on a recurring basis (in thousands):
|
Fair Value as of December 31, 2018
|
Fair
Value Measurements Using Inputs Considered as:
|
|||||||||||||||
|
Level 1
|
Level 2
|
Level 3
|
||||||||||||||
|
Assets:
|
||||||||||||||||
|
Derivative assets - freestanding instruments (foreign currency exchange rate "FX")
|
$
|
236
|
|
$
|
—
|
|
$
|
236
|
|
$
|
—
|
|
||||
|
Total assets
|
$
|
236
|
|
$
|
—
|
|
$
|
236
|
|
$
|
—
|
|
||||
|
Liabilities:
|
||||||||||||||||
|
Derivative liabilities - designated as cash flow hedges FX
|
$
|
1,354
|
|
$
|
—
|
|
$
|
1,354
|
|
$
|
—
|
|
||||
|
Derivative liabilities - designated as cash flow hedges (interest rate swaps)
|
865
|
|
—
|
|
865
|
|
—
|
|
||||||||
|
Derivative liabilities - freestanding instruments FX
|
3,173
|
|
—
|
|
3,173
|
|
—
|
|
||||||||
|
Contingent consideration
(1)
|
179,911
|
|
—
|
|
—
|
|
179,911
|
|
||||||||
|
Total liabilities
|
$
|
185,303
|
|
$
|
—
|
|
$
|
5,392
|
|
$
|
179,911
|
|
||||
|
(1)
|
The contingent consideration liability represents contingent payments related to
four
completed acquisitions: Inversiones Drilltex SAS (“Drillex”), Caisson, ImThera and TandemLife. See the table below for additional information.
|
F-28
|
Fair Value as of December 31, 2017
|
Fair
Value Measurements Using Inputs Considered as:
|
|||||||||||||||
|
Level 1
|
Level 2
|
Level 3
|
||||||||||||||
|
Assets:
|
||||||||||||||||
|
Derivative assets - freestanding instruments FX
|
$
|
519
|
|
$
|
—
|
|
$
|
519
|
|
$
|
—
|
|
||||
|
Total assets
|
$
|
519
|
|
$
|
—
|
|
$
|
519
|
|
$
|
—
|
|
||||
|
Liabilities:
|
||||||||||||||||
|
Derivative liabilities - designated as cash flow hedges FX
|
$
|
460
|
|
$
|
—
|
|
$
|
460
|
|
$
|
—
|
|
||||
|
Derivative liabilities - designated as cash flow hedges (interest rate swaps)
|
1,585
|
|
—
|
|
1,585
|
|
—
|
|
||||||||
|
Contingent consideration
(1)
|
33,973
|
|
—
|
|
—
|
|
33,973
|
|
||||||||
|
Total liabilities
|
$
|
36,018
|
|
$
|
—
|
|
$
|
2,045
|
|
$
|
33,973
|
|
||||
|
(1)
|
The contingent consideration liability represents contingent payments related to
three
completed acquisitions: Cellplex PTY Ltd. (“Cellplex”), Drilltex and Caisson. See the table below for additional information.
|
Our recurring fair value measurements, using significant unobservable inputs (Level 3), relate solely to our contingent consideration liability. The following table provides a reconciliation of the beginning and ending balance of the contingent consideration liability (in thousands):
|
Balance at December 31, 2016
|
$
|
3,890
|
|
|
|
Purchase price - Caisson contingent consideration
(1)
|
31,688
|
|
||
|
Payments
(2)
|
(1,803
|
)
|
||
|
Changes in fair value
|
56
|
|
||
|
Effect of changes in foreign currency exchange rates
|
142
|
|
||
|
Balance at December 31, 2017
|
33,973
|
|
||
|
Purchase price - ImThera contingent consideration
(1)
|
112,744
|
|
||
|
Purchase price - TandemLife contingent consideration
(1)
|
40,190
|
|
||
|
Payments
(2)
|
(2,661
|
)
|
||
|
Changes in fair value
(3)
|
(4,311
|
)
|
||
|
Effect of changes in foreign currency exchange rates
|
(24
|
)
|
||
|
Total contingent consideration liability at December 31, 2018
|
179,911
|
|
||
|
Less current portion of contingent consideration liability at December 31, 2018
|
18,530
|
|
||
|
Long-term portion of contingent consideration liability at December 31, 2018
|
$
|
161,381
|
|
|
|
(1)
|
The acquisitions of, and nature of the contingent consideration liabilities for, Caisson, ImThera and TandemLife are discussed in “
Note 4. Business Combinations
.”
|
|
(2)
|
Payments during the years ended
December 31, 2018
and
December 31, 2017
are for sales-based earnouts for Cellplex and for Drilltex.
|
|
(3)
|
Includes a net decrease of
$2.8 million
during 2018 due to a delay in the timing of anticipated regulatory approval for ImThera.
|
Assets and Liabilities Measured at Fair Value on a Nonrecurring Basis
Our investments in equity securities of non-consolidated affiliates without readily determinable fair values are reported at cost minus impairment, if any, plus or minus changes resulting from observable price changes in orderly transactions for the identical or similar investment of the same issuer. Our investments in non-financial assets such as, goodwill, intangible assets, and PP&E, are measured at fair value if there is an indication of impairment and recorded at fair value only when an impairment is recognized. We classify the measurement input for these assets as Level 3 inputs within the fair value hierarchy.
Other
The carrying values of our cash and cash equivalents, accounts receivable, accounts payable and accrued liabilities approximate their fair values due to the short-term nature of these items.
F-29
The carrying value of our long-term debt including the current portion, as of
December 31, 2018
, was
$162.8 million
, which we believe approximates fair value.
Note 11. Financing Arrangements
The outstanding principal amount of our long-term debt is as follows (in thousands, except interest rates):
|
Principal Amount at December 31, 2018
|
Principal Amount at December 31, 2017
|
Maturity
|
Effective Interest Rate
|
||||||||||
|
2017 European Investment Bank
(1)
|
$
|
103,570
|
|
$
|
—
|
|
June 2026
|
3.79
|
%
|
||||
|
2014 European Investment Bank
(2)
|
47,606
|
|
69,893
|
|
June 2021
|
0.99
|
%
|
||||||
|
Mediocredito Italiano
(3)
|
7,623
|
|
9,118
|
|
December 2023
|
0.50% - 2.98%
|
|
||||||
|
Banca del Mezzogiorno
|
2,718
|
|
5,499
|
|
December 2019
|
0.50% - 3.05%
|
|
||||||
|
Mediocredito Italiano - mortgages and other
|
582
|
|
997
|
|
September 2021 and September 2026
|
0.75% -1.24%
|
|
||||||
|
Region Wallonne
|
742
|
|
845
|
|
December 2023 and June 2033
|
0.00% - 2.45%
|
|
||||||
|
Bpifrance (ex-Oséo)
|
—
|
|
1,450
|
|
—
|
—
|
|
||||||
|
Total long-term facilities
|
162,841
|
|
87,802
|
|
|||||||||
|
Less current portion of long-term debt
|
23,303
|
|
25,844
|
|
|||||||||
|
Total long-term debt
|
$
|
139,538
|
|
$
|
61,958
|
|
|||||||
|
(1)
|
The 2017 European Investment Bank (“2017 EIB”) loan was obtained to support certain product development projects. The interest rate for the 2017 EIB loan is reset by the lender each principal payment date based on LIBOR. Interest payments are paid quarterly and principal payments are paid semi-annually. We borrowed
$103.6 million
under the 2017 EIB loan during the year ended
December 31, 2018
.
|
|
(2)
|
The 2014 European Investment Bank (“2014 EIB”) loan was obtained in
July 2014
to support product development projects. The interest rate for the EIB loan is reset by the lender each quarter based on the Euribor. Interest payments are paid quarterly and principal payments are paid semi-annually.
|
|
(3)
|
We obtained the Mediocredito Italiano Bank loan in
July 2016
as part of the Fondo Innovazione Teconologica program implemented by the Italian Ministry of Education.
|
Contractual annual principal maturities of our long-term debt facilities as of
December 31, 2018
, are as follows (in thousands):
|
2019
|
$
|
23,303
|
|
|
|
2020
|
36,541
|
|
||
|
2021
|
27,015
|
|
||
|
2022
|
17,754
|
|
||
|
2023
|
17,829
|
|
||
|
Thereafter
|
40,399
|
|
||
|
Total
|
$
|
162,841
|
|
|
In connection with the CRM sale, on May 1, 2018, the borrowing capacity of the 2017 EIB loan decreased from
€100.0 million
(approximately
$114.3 million
as of
December 31, 2018
) to
€90.0 million
(approximately
$103 million
as of
December 31, 2018
).
Revolving Credit
The outstanding principal amount of our short-term unsecured revolving credit agreements and other agreements with various banks was
$5.5 million
and
$58.2 million
at
December 31, 2018
and
December 31, 2017
, respectively, with interest rates ranging from
0.50%
to
9.34%
and loan terms ranging from
90 days
to
180 days
.
On April 10, 2018, we entered into an amendment and restatement agreement with Barclays Bank PLC amending the revolving facility agreement originally dated October 21, 2016 (the “Amendment”). The Amendment increases the borrowing capacity under the facility from
$40.0 million
to
$70.0 million
and extends the term of the facility one year, terminating October 20, 2019. Borrowings under the facility bear interest at a rate of LIBOR plus
0.85%
.
F-30
Bridge Facility Agreement
In connection with the April 2018 acquisition of TandemLife, we entered into a bridge facility agreement (the “Bridge Facility Agreement”) providing a term loan facility with the aggregate principal amount of
$190.0 million
. On April 3, 2018, we borrowed
$190.0 million
under the Bridge Facility Agreement to facilitate the initial payment for our acquisition of TandemLife. We used the proceeds from the sale of the CRM business franchise to repay the borrowings under the Bridge Facility Agreement in full during the second quarter of 2018.
Note 12. Derivatives and Risk Management
Due to the global nature of our operations, we are exposed to foreign currency exchange rate fluctuations. In addition, due to certain loans with floating interest rates, we are also subject to the impact of changes in interest rates on our interest payments. We enter into foreign currency exchange rate (“FX”) derivative contracts and interest rate swap contracts to reduce the impact of foreign currency exchange rate and interest rate fluctuations on earnings and cash flow. We measure all outstanding derivatives each period end at fair value and report the fair value as either financial assets or liabilities on the consolidated balance sheets. We do not enter into derivative contracts for speculative purposes. At inception of the contract, the derivative is designated as either a freestanding derivative or a hedge. Derivatives that are not designated as hedging instruments are referred to as freestanding derivatives with changes in fair value included in earnings.
If the derivative qualifies for hedge accounting, depending on the nature of the hedge and hedge effectiveness, changes in the fair value of the derivative will either be recognized immediately in earnings or recorded in AOCI until the hedged item is recognized in earnings upon settlement/termination. FX derivative gains and losses in AOCI are reclassified to our consolidated statements of income (loss) as shown in the tables below and interest rate swap gains and losses in AOCI are reclassified to interest expense on our consolidated statements of income (loss). We evaluate hedge effectiveness at inception and on an ongoing basis. If a derivative is no longer expected to be highly effective, hedge accounting is discontinued. Hedge ineffectiveness, if any, is recorded in earnings. Cash flows from derivative contracts are reported as operating activities on our consolidated statements of cash flows.
Freestanding FX Derivative Contracts
The gross notional amount of FX derivative contracts, not designated as hedging instruments, outstanding at
December 31, 2018
and
December 31, 2017
was
$320.2 million
and
$231.9 million
, respectively. These derivative contracts are designed to offset the FX effects in earnings of various intercompany loans, our 2014 EIB loan and trade receivables. We recorded net gains (losses) for these freestanding derivatives of
$(11.2) million
,
$(11.7) million
and
$11.0 million
for the years ended
December 31, 2018
,
2017
and
2016
, respectively. These gains and losses are included in foreign exchange and other (losses) gains on our consolidated statements of income (loss).
Cash Flow Hedges
Foreign Currency Risk
We utilize FX derivative contracts, designed as cash flow hedges, to hedge the variability of cash flows associated with our
12
-month U.S. dollar forecasts of revenues and costs denominated in British Pound, Japanese Yen, Canadian Dollars and the Euro. We transfer to earnings from AOCI, the gain or loss realized on the FX derivative contracts at the time of invoicing.
There was no FX hedge ineffectiveness and there were no components of the FX derivative contracts excluded in the measurement of hedge effectiveness during the years ended
December 31, 2018
,
2017
or
2016
.
During the years ended
December 31, 2018
and
December 31, 2016
, we discontinued and settled certain of our FX derivative contracts due to changes in our foreign currency revenue forecast that resulted in a (loss) / gain of
$(0.3) million
and
$0.2 million
, respectively, which was reclassified to earnings from AOCI.
Interest Rate Risk
The 2014 EIB loan agreement matures in
June 2021
. The variable interest rate for the 2014 EIB loan is reset by the lender each quarter based on the Euribor. The 2017 EIB loan agreement matures in June 2026. The variable interest rate for the 2017 EIB loan is reset by the lender quarterly based on the LIBOR. To minimize the impact of changes in interest rates we entered into interest rate swap agreement programs to swap the EIB loan’s floating-rate interest payments for fixed-rate interest payments. The interest rate swap contracts qualify for, and are designated as, cash flow hedges.
There was no interest rate swap hedge ineffectiveness, and there were no components of the interest rate swap contracts excluded in the measurement of hedge effectiveness during the years ended
December 31, 2018
, 2017 or 2016.
F-31
Notional amounts of open derivative contracts designated as cash flow hedges are as follows (in thousands):
|
Description of derivative contract:
|
December 31, 2018
|
December 31, 2017
|
||||||
|
FX derivative contracts to be exchanged for British Pounds
|
$
|
9,629
|
|
$
|
16,847
|
|
||
|
FX derivative contracts to be exchanged for Japanese Yen
|
23,985
|
|
32,302
|
|
||||
|
FX derivative contracts to be exchanged for Canadian Dollars
|
7,637
|
|
16,494
|
|
||||
|
FX derivative contracts to be exchanged for Euros
|
29,768
|
|
—
|
|
||||
|
Interest rate swap contracts
|
38,115
|
|
55,965
|
|
||||
|
$
|
109,134
|
|
$
|
121,608
|
|
|||
After-tax net loss associated with derivatives designated as cash flow hedges recorded in the ending balance of AOCI and the amount expected to be reclassified to earnings in the next 12 months are as follows (in thousands):
|
Description of Derivative Contract
|
After-tax net loss in AOCI as of December 31, 2018
|
Amount Expected to be Reclassified to Earnings in Next 12 Months
|
||||||
|
FX derivative contracts
|
$
|
(787
|
)
|
$
|
(787
|
)
|
||
|
Interest rate swap contracts
|
(157
|
)
|
(62
|
)
|
||||
|
$
|
(944
|
)
|
$
|
(849
|
)
|
|||
Pre-tax gains (losses) for derivative contracts designated as cash flow hedges recognized in OCI and the amount reclassified to earnings from AOCI are as follows (in thousands):
|
Year Ended December 31, 2018
|
||||||||||
|
Description of Derivative Contract
|
Location in Earnings of Reclassified Gain or Loss
|
Gains Recognized in OCI
|
Gains (Losses) Reclassified from OCI to Earnings:
|
|||||||
|
FX derivative contracts
|
Foreign Exchange and Other
|
$
|
44
|
|
$
|
2,697
|
|
|||
|
FX derivative contracts
|
SG&A
|
—
|
|
(2,554
|
)
|
|||||
|
Interest rate swap contracts
|
Interest expense
|
—
|
|
(66
|
)
|
|||||
|
Total
|
$
|
44
|
|
$
|
77
|
|
||||
|
Year Ended December 31, 2017
|
||||||||||
|
Description of Derivative Contract
|
Location in Earnings of Reclassified Gain or Loss
|
Losses Recognized in OCI
|
Gains (Losses) Reclassified from OCI to Earnings:
|
|||||||
|
FX derivative contracts
|
Foreign Exchange and Other
|
$
|
(9,861
|
)
|
$
|
(6,471
|
)
|
|||
|
FX derivative contracts
|
SG&A
|
—
|
|
2,084
|
|
|||||
|
Interest rate swap contracts
|
Interest expense
|
—
|
|
939
|
|
|||||
|
$
|
(9,861
|
)
|
$
|
(3,448
|
)
|
|||||
|
Year Ended December 31, 2016
|
||||||||||
|
Description of Derivative Contract
|
Location in Earnings of Reclassified Gain or Loss
|
Gains Recognized in OCI
|
Gains (Losses) Reclassified from OCI to Earnings:
|
|||||||
|
FX derivative contracts
|
Foreign Exchange and Other
|
$
|
2,874
|
|
$
|
3,705
|
|
|||
|
FX derivative contracts
|
SG&A
|
—
|
|
(4,218
|
)
|
|||||
|
Interest rate swap contracts
|
Interest expense
|
85
|
|
(458
|
)
|
|||||
|
Total
|
$
|
2,959
|
|
$
|
(971
|
)
|
||||
F-32
The following tables present the fair value, and the location of, derivative contracts reported on the consolidated balance sheets (in thousands):
|
December 31, 2018
|
Asset Derivatives
|
Liability Derivatives
|
||||||||||
|
Derivatives Designated as Hedging Instruments
|
Balance Sheet Location
|
Fair Value
(1)
|
Balance Sheet Location
|
Fair Value
(1)
|
||||||||
|
Interest rate swap contracts
|
Prepaid expenses and other current assets
|
$
|
—
|
|
Accrued liabilities
|
$
|
536
|
|
||||
|
Interest rate swap contracts
|
Other assets
|
—
|
|
Other long-term liabilities
|
329
|
|
||||||
|
FX derivative contracts
|
Prepaid expenses and other current assets
|
—
|
|
Accrued liabilities
|
1,354
|
|
||||||
|
Total derivatives designated as hedging instruments
|
—
|
|
2,219
|
|
||||||||
|
Derivatives Not Designated as Hedging Instruments
|
||||||||||||
|
FX derivative contracts
|
Prepaid expenses and other current assets
|
236
|
|
Accrued liabilities
|
3,173
|
|
||||||
|
Total derivatives not designated as hedging instruments
|
236
|
|
3,173
|
|
||||||||
|
Total derivatives
|
$
|
236
|
|
$
|
5,392
|
|
||||||
|
December 31, 2017
|
Asset Derivatives
|
Liability Derivatives
|
||||||||||
|
Derivatives Designated as Hedging Instruments
|
Balance Sheet Location
|
Fair Value
(1)
|
Balance Sheet Location
|
Fair Value
(1)
|
||||||||
|
Interest rate swap contracts
|
Prepaid expenses and other current assets
|
$
|
—
|
|
Accrued liabilities
|
$
|
834
|
|
||||
|
Interest rate swap contracts
|
Other assets
|
—
|
|
Other long-term liabilities
|
751
|
|
||||||
|
FX derivative contracts
|
Prepaid expenses and other current assets
|
—
|
|
Accrued liabilities
|
460
|
|
||||||
|
Total derivatives designated as hedging instruments
|
—
|
|
2,045
|
|
||||||||
|
Derivatives Not Designated as Hedging Instruments
|
||||||||||||
|
FX derivative contracts
|
Prepaid expenses and other current assets
|
519
|
|
Accrued liabilities
|
—
|
|
||||||
|
Total derivatives not designated as hedging instruments
|
519
|
|
—
|
|
||||||||
|
Total derivatives
|
$
|
519
|
|
$
|
2,045
|
|
||||||
|
(1)
|
For the classification of input used to evaluate the fair value of our derivatives, refer to “
Note 10. Fair Value Measurements
.”
|
Note 13. Commitments and Contingencies
FDA Warning Letter
On December 29, 2015, the FDA issued a Warning Letter alleging certain violations of FDA regulations applicable to medical device manufacturers at our Munich, Germany and Arvada, Colorado facilities.
F-33
The FDA inspected the Munich facility from August 24, 2015 to August 27, 2015 and the Arvada facility from August 24, 2015 to September 1, 2015. On August 27, 2015, the FDA issued a Form 483 identifying
two
observed non-conformities with certain regulatory requirements at the Munich facility. We did not receive a Form 483 in connection with the FDA’s inspection of the Arvada facility. Following the receipt of the Form 483, we provided written responses to the FDA describing corrective and preventive actions that were underway or to be taken to address the FDA’s observations at the Munich facility. The Warning Letter responded in part to our responses and identified other alleged violations related to the manufacture of our 3T Heater-Cooler device that were not previously included in the Form 483.
The Warning Letter further stated that our 3T devices and other devices we manufactured at our Munich facility are subject to refusal of admission into the U.S. until resolution of the issues set forth by the FDA in the Warning Letter. The FDA has informed us that the import alert is limited to the 3T devices, but that the agency reserves the right to expand the scope of the import alert if future circumstances warrant such action. The Warning Letter did not request that existing users cease using the 3T device, and manufacturing and shipment of all of our products other than the 3T device remain unaffected by the import limitation. To help clarify these issues for current customers, we issued an informational Customer Letter in January 2016 and that same month agreed with the FDA on a process for shipping 3T devices to existing U.S. users pursuant to a certificate of medical necessity program.
Finally, the Warning Letter stated that premarket approval applications for Class III devices to which certain Quality System regulation deviations identified in the Warning Letter are reasonably related will not be approved until the violations have been corrected; however, this restriction applies only to the Munich and Arvada facilities, which do not manufacture or design devices subject to Class III premarket approval.
We continue to work diligently to remediate the FDA’s inspectional observations for the Munich facility, as well as the additional issues identified in the Warning Letter. We take these matters seriously and intend to respond timely and fully to the FDA’s requests.
CDC and FDA Safety Communications and Company Field Safety Notice Update
On October 13, 2016, the CDC and the FDA separately released safety notifications regarding the 3T devices. The CDC’s Morbidity and Mortality Weekly Report (“MMWR”) and Health Advisory Notice (“HAN”) reported that tests conducted by CDC and its affiliates indicate that there appears to be genetic similarity between both patient and 3T device strains of the non-tuberculous mycobacterium (“NTM”) bacteria M. chimaera isolated in hospitals in Iowa and Pennsylvania. Citing the geographic separation between the two hospitals referenced in the investigation, the report asserts that 3T devices manufactured prior to August 18, 2014 could have been contaminated during the manufacturing process. The CDC’s HAN and FDA’s Safety Communication, issued contemporaneously with the MMWR report, each assess certain risks associated with 3T devices and provide guidance for providers and patients. The CDC notification states that the decision to use the 3T device during a surgical operation is to be taken by the surgeon based on a risk approach and on patient need. Both the CDC’s and FDA’s communications confirm that 3T devices are critical medical devices and enable doctors to perform life-saving cardiac surgery procedures.
Also on October 13, 2016, concurrent with the CDC’s HAN and FDA’s Safety Communication, we issued a Field Safety Notice Update for U.S. users of 3T devices to proactively and voluntarily contact facilities to aid in implementation of the CDC and FDA recommendations. In the fourth quarter of 2016, we initiated a program to provide existing 3T device users with a new loaner 3T device at no charge pending regulatory approval and implementation of additional risk mitigation strategies worldwide, including a vacuum canister and internal sealing upgrade program and a deep disinfection service. This loaner program began in the U.S. and is being made available progressively on a global basis, prioritizing and allocating devices to 3T device users based on pre-established criteria. We anticipate that this program will continue until we are able to address customer needs through a broader solution that includes implementation of the risk mitigation strategies described above. We are currently implementing the vacuum and sealing upgrade program in as many countries as possible until all devices are upgraded. On April 12, 2018, the FDA agreed to allow us to move forward with the deep cleaning service in the U.S. adding to the growing list of countries around the world in which we offer this service. On October 11, 2018, after review of information provided by us, the FDA concluded that we could commence the vacuum and sealing upgrade program in the U.S. Furthermore, we continue to offer a no-charge deep disinfection service (deep cleaning service) for 3T device users as we receive the required regulatory approvals.
On December 31, 2016, we recognized a liability for our product remediation plan related to our 3T device. We concluded that it was probable that a liability had been incurred upon management’s approval of the plan and the commitments made by management to various regulatory authorities globally in November and December 2016, and furthermore, the cost associated with the plan was reasonably estimable. At
December 31, 2018
, the product remediation liability was
$14.7 million
. Refer to “
Note 7. Product Remediation Liability
” for additional information.
F-34
Litigation
Product Liability
The Company is currently involved in litigation involving our 3T device. The litigation includes a class action complaint in the U.S. District Court for the Middle District of Pennsylvania, federal multi-district litigation in the U.S. District Court for the Middle District of Pennsylvania, various U.S. state court cases and cases in jurisdictions outside the U.S. As of
March 18, 2019
, we are aware of approximately
210
filed and unfiled claims worldwide, with the majority of the claims in various federal or state courts throughout the United States. The complaints generally seek damages and other relief based on theories of strict liability, negligence, breach of express and implied warranties, failure to warn, design and manufacturing defect, fraudulent and negligent misrepresentation or concealment, unjust enrichment, and violations of various state consumer protection statutes. The class action, filed in February 2016, consists of all Pennsylvania residents who underwent open heart surgery at WellSpan York Hospital and Penn State Milton S. Hershey Medical Center between 2011 and 2015 and who currently are asymptomatic for NTM infection. Members of the class seek declaratory relief that the 3T devices are defective and unsafe for intended uses, medical monitoring, damages, and attorneys’ fees. We have appealed the District Court’s class certification. The class action and cases in federal court have been stayed as a result of the federal multi-district litigation. However, cases in state courts in the U.S. and in jurisdictions outside the U.S continue to progress. As a result of information that we learned in the fourth quarter of 2018, we recognized a
$294.0 million
provision, which represents our best estimate of the Company’s liability for these matters. While the amount accrued represents our best estimate, the actual liability for resolution of these matters remains uncertain and may vary from our estimate.
Total coverage under the Company’s product liability insurance policies is
$32.9 million
, once the self-retention limit of
$11.0 million
is met. While the Company has not currently recorded a receivable for recovery under the insurance policies as of December 31, 2018, the Company intends to pursue recovery under the policies in connection with the future settlement of the litigation involving our 3T device.
Environmental Liability
SNIA Litigation
Our subsidiary, Sorin S.p.A. (“Sorin”) was created as a result of a spin-off (the “Sorin spin-off”) from SNIA S.p.A. (“SNIA”) in January 2004. SNIA subsequently became insolvent and the Italian Ministry of the Environment and the Protection of Land and Sea (the “Italian Ministry of the Environment”), sought compensation from SNIA in an aggregate amount of approximately
$4 billion
for remediation costs relating to the environmental damage at chemical sites previously operated by SNIA’s other subsidiaries.
In September 2011 and July 2014, the Bankruptcy Court of Udine and the Bankruptcy Court of Milan held (in proceedings to which we are not parties) that the Italian Ministry of the Environment and other Italian government agencies (the “Public Administrations”) were not creditors of either SNIA or its subsidiaries in connection with their claims in the Italian insolvency proceedings. The Public Administrations appealed and in January 2016, the Court of Udine rejected the appeal. The Public Administrations have also appealed that decision to the Supreme Court. In addition, the Bankruptcy Court of Milan’s decision has been appealed.
In January 2012, SNIA filed a civil action against Sorin in the Civil Court of Milan asserting joint liability of a parent and a spun-off company. On April 1, 2016, the Court of Milan dismissed all legal actions of SNIA and of the Public Administrations further requiring the Public Administrations to pay Sorin approximately
$338,000
for legal fees. The Public Administrations appealed the 2016 Decision to the Court of Appeal of Milan. On March 5, 2019, the Court of Appeal issued a partial decision on the merits: the Court has declared Sorin/LivaNova jointly liable with SNIA for SNIA’s environmental liabilities in an amount up to the fair value of the net worth received by Sorin because of the Sorin spin-off. Additionally the Court issued a separate order, continuing the proceeding until a Panel of three experts is appointed to identify the environmental damages and the costs that the Public Administrations already has borne for the clean-up of the Sites to allow the Court to decide on the second claim of the Public Administrations, for a refund for the SNIA environmental liabilities.
We have not recognized an expense in connection with this matter because any potential loss is not currently probable or reasonably estimable. In addition, we cannot reasonably estimate a range of potential loss, if any, that may result from this matter.
Environmental Remediation Order
On July 28, 2015, Sorin received an administrative order (the “Remediation Order”) from the Italian Ministry of the Environment directing prompt commencement of environmental remediation at the chemical sites previously operated by SNIA’s other subsidiaries. We challenged the Remediation Order before the Administrative Court of Lazio in Rome (the
F-35
“TAR”), and the TAR annulled the Remediation Order. The Italian Ministry of the Environment appealed to the Council of State. On August 22, 2018, the Council of State confirmed the decision and ordered the Public Administrations to bear court expenses of approximately
$5,000
. The Public Administrations did not appeal the decision within the required time period and the matter is now concluded.
Opposition to Merger Proceedings
On July 28, 2015, the Public Administrations filed an opposition proceeding before the Commercial Courts of Milan to the merger of Sorin and Cyberonics, Inc., the predecessor companies to LivaNova. The Court authorized the merger and the Public Administrations did not appeal that decision. The proceeding then continued as a civil case, with the Public Administrations seeking damages. The Commercial Court of Milan delivered a decision in October 2016, fully rejecting the Public Administrations’ request and awarding us approximately
€400,000
(approximately
$457,000
) in damages for frivolous litigation and legal fees. The Public Administrations appealed to the Court of Appeal of Milan. On May 15, 2018, the Court of Appeal of Milan confirmed its decision authorizing the merger but annulled the penalty for frivolous litigation and reduced the overall contribution to legal fees to
€84,000
(approximately
$96,000
). The Public Administrations subsequently filed an appeal with the Supreme Court against the decision of the Court of Appeal of Milan. The proceedings before the Supreme Court are presently pending, and no decision is expected in 2019. We have not recognized an expense in connection with this matter because any potential loss is not currently probable or reasonably estimable. In addition, we cannot reasonably estimate a range of potential loss, if any, that may result from this matter.
Patent Litigation
On May 11, 2018, Neuro and Cardiac Technologies LLC (“NCT”), a non-practicing entity, filed a complaint in the United States District Court for the Southern District of Texas asserting that the VNS Therapy System, when used with the SenTiva Model 1000 generator, infringes the claims of U.S. Patent No. 7,076,307 owned by NCT. The complaint requests damages that include a royalty, costs, interest, and attorneys’ fees. On September 13, 2018, we petitioned the Patent Trial and Appeal Board of the U. S. Patent and Trademark Office for an
inter partes review
(“IPR”) of the validity of the ‘307 patent. The Court has stayed the litigation pending the outcome of the IPR proceeding. We have not recognized an expense in connection with this matter because any potential loss is not currently probable or reasonably estimable. In addition, we cannot reasonably estimate a range of potential loss, if any, that may result from this matter.
Tax Litigation
In a tax audit report received on October 30, 2009, the Regional Internal Revenue Office of Lombardy (the “Internal Revenue Office”) informed Sorin Group Italia S.r.l. that, among several issues, it was disallowing in part (for a total of
€102.6 million
(approximately
$117.3 million
), related to tax years 2002 through 2006) a tax-deductible write down of the investment in the U.S. company, Cobe Cardiovascular Inc., which Sorin Group Italia S.r.l. recognized in 2002 and deducted in
five
equal installments, beginning in 2002. In December 2009, the Internal Revenue Office issued notices of assessment for 2002, 2003 and 2004. The assessments for 2002 and 2003 were automatically voided for lack of merit. In December 2010 and October 2011, the Internal Revenue Office issued notices of assessment for 2005 and 2006, respectively. We challenged all
three
notices of assessment (for 2004, 2005 and 2006) before the relevant Provincial Tax Courts.
The preliminary challenges filed for 2004, 2005 and 2006 were denied at the first jurisdictional level. We appealed these decisions. The appeal submitted against the first-level decision for 2004 was successful. The Internal Revenue Office appealed this second-level decision to the Italian Supreme Court (Corte di Cassazione) on February 3, 2017. The Italian Supreme Court’s decision is pending.
The appeals submitted against the first-level decisions for 2005 and 2006 were rejected. We appealed these adverse decisions to the Italian Supreme Court. On November 16, 2018, the Supreme Court returned the decisions for years 2005 and 2006 to the previous-level Court (Regional Tax Court) due to lack of substance of the motivation given in the 2
nd
level judgments that were appealed.
In November 2012, the Internal Revenue Office served a notice of assessment for 2007, and in July 2013, served a notice of assessment for 2008. In these matters the Internal Revenue Office claims an increase in taxable income due to a reduction (similar to the previous notices of assessment for 2004, 2005 and 2006) of the losses reported by Sorin Group Italia S.r.l. for the 2002, 2003 and 2004 tax periods, and subsequently utilized in 2007 and 2008. We challenged both notices of assessment. The Provincial Tax Court of Milan has stayed its decision for years 2007 and 2008 pending resolution of the litigation regarding years 2004, 2005, and 2006. The total amount of losses in dispute is
€62.6 million
(approximately
$71.6 million
). We have continuously reassessed our potential exposure in these matters, taking into account the recent, and generally adverse, trend to Italian taxpayers in this type of litigation. Although we believe that our defensive arguments are strong, noting the adverse
F-36
trend in some of the court decisions, we have recognized a reserve for an uncertain tax position of
€17.2 million
(approximately
$19.6 million
) as of
December 31, 2018
.
Other Matters
Additionally, we are the subject of various pending or threatened legal actions and proceedings that arise in the ordinary course of our business. These matters are subject to many uncertainties and outcomes that are not predictable and that may not be known for extended periods of time. Since the outcome of these matters cannot be predicted with certainty, the costs associated with them could have a material adverse effect on our consolidated net income, financial position or liquidity.
Lease Agreements
We have operating leases for facilities, equipment and vehicles. Rent expense from all operating leases amounted to approximately
$24.6 million
,
$18.8 million
and
$15.6 million
, for the years ended
December 31, 2018
,
December 31, 2017
and
December 31, 2016
, respectively.
The future minimum lease payments for operating leases related to continuing operations as of
December 31, 2018
are (in thousands):
|
2019
|
$
|
11,986
|
|
|
|
2020
|
11,933
|
|
||
|
2021
|
9,098
|
|
||
|
2022
|
7,843
|
|
||
|
2023
|
7,155
|
|
||
|
Thereafter
|
20,943
|
|
||
|
Total
|
$
|
68,958
|
|
|
Note 14. Stockholders’ Equity
Share repurchase plans
On August 1, 2016, the Board of Directors of LivaNova approved the authorization of a share repurchase plan (the "Share Repurchase Program") pursuant to an authority granted by shareholders at the 2016 annual general meeting held on June 15, 2016. The repurchase program was structured to enable us to buy back up to
$150.0 million
of our shares on NASDAQ between September 1, 2016 through December 31, 2016. On November 15, 2016, the Board of Directors approved an amendment (the "Amended Share Repurchase Program") to the Share Repurchase Program. The Amended Share Repurchase Program authorized the Company to repurchase up to
$150.0 million
of our shares between September 1, 2016 and December 31, 2018.
For the year ended
December 31, 2016
, we repurchased and canceled
993,339
shares under this plan at a cost of
$50.0 million
and an average price per share of
$50.32
. We did not purchase any additional shares during the year ended
December 31, 2017
. For the year ended
December 31, 2018
, we repurchased and canceled
500,333
shares under this plan at a cost of
$50.0 million
and an average price per share of
$99.91
.
Treasury Stock
For the year ended
December 31, 2018
, we issued
1.4 million
shares to our Employee Benefit Trust (“EBT”). Shares held by the EBT are issued to employees and directors at exercise of stock-based compensation grants. The balance of shares in the EBT are reported as treasury shares.
F-37
Accumulated other comprehensive (loss) income
The table below presents the change in each component of AOCI, net of tax and the reclassifications out of AOCI into net (loss) earnings for the years ended
December 31, 2018
, 2017 and 2016 (in thousands):
|
Change in Unrealized Gain (Loss) on Cash Flow Hedges
|
Foreign Currency Translation Adjustments
(1)
|
Total
|
||||||||||
|
As of December 31, 2015
|
$
|
888
|
|
$
|
(55,116
|
)
|
$
|
(54,228
|
)
|
|||
|
Other comprehensive income (loss) before reclassifications, before tax
|
2,959
|
|
(16,990
|
)
|
(14,031
|
)
|
||||||
|
Tax effect
|
(795
|
)
|
—
|
|
(795
|
)
|
||||||
|
Other comprehensive income (loss) before reclassifications, net of tax
|
2,164
|
|
(16,990
|
)
|
(14,826
|
)
|
||||||
|
Reclassification of loss from accumulated other comprehensive income, before tax
|
971
|
|
—
|
|
971
|
|
||||||
|
Tax effect
|
(404
|
)
|
—
|
|
(404
|
)
|
||||||
|
Reclassification of loss from accumulated other comprehensive income, after tax
|
567
|
|
—
|
|
567
|
|
||||||
|
Net current-period other comprehensive income (loss), net of tax
|
2,731
|
|
(16,990
|
)
|
(14,259
|
)
|
||||||
|
As of December 31, 2016
|
3,619
|
|
(72,106
|
)
|
(68,487
|
)
|
||||||
|
Other comprehensive (loss) income before reclassifications, before tax
|
(9,861
|
)
|
118,338
|
|
108,477
|
|
||||||
|
Tax benefit
|
2,653
|
|
—
|
|
2,653
|
|
||||||
|
Other comprehensive (loss) income before reclassifications, net of tax
|
(7,208
|
)
|
118,338
|
|
111,130
|
|
||||||
|
Reclassification of loss from accumulated other comprehensive income, before tax
|
3,448
|
|
—
|
|
3,448
|
|
||||||
|
Tax effect
|
(778
|
)
|
—
|
|
(778
|
)
|
||||||
|
Reclassification of loss from accumulated other comprehensive income, after tax
|
2,670
|
|
—
|
|
2,670
|
|
||||||
|
Net current-period other comprehensive (loss) income, net of tax
|
(4,538
|
)
|
118,338
|
|
113,800
|
|
||||||
|
As of December 31, 2017
|
(919
|
)
|
46,232
|
|
45,313
|
|
||||||
|
Other comprehensive income (loss) before reclassifications, before tax
|
44
|
|
(69,764
|
)
|
(69,720
|
)
|
||||||
|
Tax expense
|
(11
|
)
|
—
|
|
(11
|
)
|
||||||
|
Other comprehensive income (loss) before reclassifications, net of tax
|
33
|
|
(69,764
|
)
|
(69,731
|
)
|
||||||
|
Reclassification of (gain) loss from accumulated other comprehensive income, before tax
|
(77
|
)
|
—
|
|
(77
|
)
|
||||||
|
Tax effect
|
19
|
|
—
|
|
19
|
|
||||||
|
Reclassification of (gain) loss from accumulated other comprehensive income, after tax
|
(58
|
)
|
—
|
|
(58
|
)
|
||||||
|
Net current-period other comprehensive income (loss), net of tax
|
(25
|
)
|
(69,764
|
)
|
(69,789
|
)
|
||||||
|
As of December 31, 2018
|
$
|
(944
|
)
|
$
|
(23,532
|
)
|
$
|
(24,476
|
)
|
|||
|
(1)
|
Taxes were not provided for foreign currency translation adjustments as translation adjustments are related to earnings that are intended to be reinvested in the countries where earned.
|
Note 15. Stock-Based Incentive Plans
Stock-Based Incentive Plans
Stock-based awards may be granted under the 2015 Incentive Award Plan (the “2015 Plan”) in the form of stock options, SARs, RS, RSUs, other stock-based and cash-based awards. As of
December 31, 2018
, there were approximately
5,380,000
shares available for future grants under the 2015 Plan. During the year ended
December 31, 2018
, we awarded SARs and RSUs
F-38
with service conditions that generally vest ratably over
four
years, subject to forfeiture unless service conditions are met. For certain employees, awards vest at retirement at age
62
or after
10
years of service at age
55
. In addition, during the year ended
December 31, 2018
, we awarded market performance-based awards that cliff vest after
three
years, subject to the rank of our total shareholder return for the
three
-year period ending December 31, 2020 relative to the total shareholder returns for a peer group of companies, and we issued operating performance-based awards that cliff vest after
three
years subject to the achievement of certain thresholds of cumulative adjusted free cash flow for the
three
-year period ending December 31, 2020.
The stock-based compensation tables below include expense and share activity related to discontinued operations.
Stock-Based Compensation
Amounts of stock-based compensation recognized on our consolidated statements of income (loss), by expense category, are as follows (in thousands):
|
Year Ended December 31, 2018
|
Year Ended December 31, 2017
|
Year Ended December 31, 2016
|
||||||||||
|
Cost of goods sold
|
$
|
1,060
|
|
$
|
450
|
|
$
|
709
|
|
|||
|
Selling, general and administrative
|
19,393
|
|
16,118
|
|
15,570
|
|
||||||
|
Research and development
|
4,510
|
|
1,119
|
|
912
|
|
||||||
|
Merger-related expense
(1)
|
—
|
|
—
|
|
271
|
|
||||||
|
Stock-based compensation from continuing operations
|
24,963
|
|
17,687
|
|
17,462
|
|
||||||
|
Stock-based compensation from discontinued operations
|
1,960
|
|
1,375
|
|
2,107
|
|
||||||
|
Total stock-based compensation expense
|
26,923
|
|
19,062
|
|
19,569
|
|
||||||
|
Income tax benefit
|
6,443
|
|
4,236
|
|
4,645
|
|
||||||
|
Total expense, net of income tax benefit
|
$
|
20,480
|
|
$
|
14,826
|
|
$
|
14,924
|
|
|||
|
(1)
|
As a result of the merger of Sorin and Cyberonics in October 2015, certain stock-based grants were modified and a portion of the revised fair value was allocated to post-combination stock-based compensation expense in the year ended December 31, 2016.
|
Amounts of stock-based compensation expense recognized on our consolidated statements of income (loss), by type of arrangement, are as follows (in thousands):
|
Year Ended December 31, 2018
|
Year Ended December 31, 2017
|
Year Ended December 31, 2016
|
||||||||||
|
Service-based stock appreciation rights
|
$
|
8,282
|
|
$
|
6,916
|
|
$
|
7,953
|
|
|||
|
Service-based restricted stock units
|
10,622
|
|
8,223
|
|
9,388
|
|
||||||
|
Market performance-based restricted stock units
|
2,357
|
|
732
|
|
31
|
|
||||||
|
Operating performance-based restricted stock units
|
3,702
|
|
1,816
|
|
90
|
|
||||||
|
Total stock-based compensation expense from continuing operations
|
$
|
24,963
|
|
$
|
17,687
|
|
$
|
17,462
|
|
|||
Unrecognized Stock-Based Compensation
Amounts of stock-based compensation cost not yet recognized related to non-vested awards, including awards assumed or issued, are as follows (in thousands):
|
|
December 31, 2018
|
|||||
|
|
Unrecognized Compensation Cost
|
Weighted Average Remaining Vesting Period (in years)
|
||||
|
Service-based stock appreciation rights
|
$
|
21,771
|
|
2.83
|
||
|
Service-based restricted stock unit awards
|
26,648
|
|
2.88
|
|||
|
Performance-based restricted stock unit awards
|
11,615
|
|
2.14
|
|||
|
Total stock-based compensation cost unrecognized
|
$
|
60,034
|
|
2.72
|
||
F-39
Stock Appreciation Rights and Stock Options
We use the Black-Scholes option pricing methodology to calculate the grant date fair market value of SARs. The following table lists the assumptions we utilized as inputs to the Black-Scholes model:
|
|
Year Ended December 31, 2018
|
Year Ended December 31, 2017
|
Year Ended December 31, 2016
|
|||
|
Dividend yield
(1)
|
—
|
—
|
|
—
|
||
|
Risk-free interest rate
(2)
|
2.5% - 2.9%
|
1.7% - 2.2%
|
|
1.0% - 1.8%
|
||
|
Expected option term - in years
(3)
|
5.0 - 5.1
|
4.6 - 5.2
|
|
4.0 - 5.0
|
||
|
Expected volatility at grant date
(4)
|
29.2% - 29.9%
|
29.6% - 30.4%
|
|
30.8% - 32.4%
|
||
|
(1)
|
We have not paid dividends and no future dividends have been approved.
|
|
(2)
|
We use yield rates on U.S. Treasury securities for a period that approximates the expected term of the awards granted to estimate the risk-free interest rate.
|
|
(3)
|
We estimated the expected term of the awards granted using historic data of actual time elapsed between the date of grant and the exercise or forfeiture of options or SARs for employees.
|
|
(4)
|
We determine the expected volatility of the awards based on historical volatility.
|
The following tables detail the activity for service-based SARs and stock option awards:
|
SARs and Stock Options
|
Number of Optioned Shares
|
Wtd. Avg. Exercise Price per Share
|
Wtd. Avg. Remaining Contractual Term (years)
|
Aggregate Intrinsic Value
(in thousands)
(1)
|
|||||||||
|
Outstanding — at December 31, 2017
|
2,025,122
|
|
$
|
56.82
|
|
|
|
||||||
|
Granted
|
648,184
|
|
91.06
|
|
|
|
|||||||
|
Exercised
|
(599,601
|
)
|
57.45
|
|
|
|
|||||||
|
Forfeited
|
(118,831
|
)
|
68.91
|
|
|
|
|||||||
|
Expired
|
(13,287
|
)
|
54.01
|
|
|
|
|||||||
|
Outstanding — at December 31, 2018
|
1,941,587
|
|
67.33
|
|
7.2
|
$
|
48,285
|
|
|||||
|
Fully vested and exercisable — end of year
|
708,485
|
|
57.78
|
|
4.8
|
$
|
23,860
|
|
|||||
|
Fully vested and expected to vest — end of year
(2)
|
1,907,577
|
|
$
|
67.14
|
|
7.2
|
$
|
47,761
|
|
||||
|
(1)
|
The aggregate intrinsic value of SARs and options is based on the difference between the fair market value of the underlying stock at
December 31, 2018
, using the market closing stock price, and exercise price for in-the-money awards.
|
|
(2)
|
Includes the impact of expected future forfeitures.
|
|
Year Ended December 31, 2018
|
Year Ended December 31, 2017
|
Year Ended December 31, 2016
|
||||||||||
|
Weighted average grant date fair value of SARs granted during the year (per share)
|
$
|
28.13
|
|
$
|
17.19
|
|
$
|
15.03
|
|
|||
|
Aggregate intrinsic value of SARs and stock option exercised during the year (in thousands)
|
$
|
27,281
|
|
$
|
5,462
|
|
$
|
5,033
|
|
|||
Restricted Stock Units Awards
The following tables detail the activity for service-based RSU awards:
|
RSUs
|
Number of Shares
|
Wtd. Avg. Grant Date Fair Value
|
|||||
|
Non-vested shares at December 31, 2017
|
380,108
|
|
$
|
57.07
|
|
||
|
Granted
|
257,004
|
|
95.63
|
|
|||
|
Vested
|
(125,140
|
)
|
59.69
|
|
|||
|
Forfeited
|
(61,675
|
)
|
65.29
|
|
|||
|
Non-vested shares at December 31, 2018
|
450,297
|
|
$
|
78.70
|
|
||
F-40
|
Year Ended December 31, 2018
|
Year Ended December 31, 2017
|
Year Ended December 31, 2016
|
||||||||||
|
Weighted average grant date fair value of service-based RSUs issued during the year (per share)
|
$
|
95.63
|
|
$
|
61.37
|
|
$
|
55.53
|
|
|||
|
Aggregate fair value of RSUs that vested during the year (in thousands)
|
$
|
11,505
|
|
$
|
9,966
|
|
$
|
4,810
|
|
|||
The following tables detail the activity for performance-based and market-based RSU awards:
|
Performance-based and market-based RSUs
|
Number of Shares
|
Wtd. Avg. Grant Date Fair Value
|
|||||
|
Non-vested shares at December 31, 2017
|
341,387
|
|
$
|
41.90
|
|
||
|
Granted
|
86,409
|
|
95.62
|
|
|||
|
Vested
|
(104,887
|
)
|
43.89
|
|
|||
|
Forfeited
|
(27,545
|
)
|
60.20
|
|
|||
|
Non-vested shares at December 31, 2018
|
295,364
|
|
$
|
56.48
|
|
||
|
Year Ended December 31, 2018
|
Year Ended December 31, 2017
|
Year Ended December 31, 2016
|
||||||||||
|
Weighted average grant date fair value of performance and market-based restricted share units granted during the year (per share)
|
$
|
95.62
|
|
$
|
42.11
|
|
$
|
42.01
|
|
|||
|
Aggregate fair value of performance and market-based restricted share units that vested during the year (in thousands)
|
$
|
9,409
|
|
$
|
110
|
|
$
|
—
|
|
|||
Note 16. Employee Retirement Plans
Defined Benefit Plans
We sponsor several defined benefit pension plans, which include plans in the U.S., Italy, Germany, Japan and France. We maintain a frozen cash balance retirement plan in the U.S. that is a contributory, defined benefit plan designed to provide the benefit in terms of a stated account balance dependent on the employer's promised interest-crediting rate. In Italy and France, we maintain a severance pay defined benefit plan that obligates the employer to pay a severance payment in case of resignation, dismissal or retirement. In other jurisdictions, we sponsor non-contributory, defined benefit plans designated to provide a guaranteed minimum retirement benefits to eligible employees.
F-41
The change in benefit obligations and funded status of our U.S. pension benefits is as follows (in thousands):
|
U.S. Pension Benefits
|
||||||||||||
|
Year Ended December 31, 2018
|
Year Ended December 31, 2017
|
Year Ended December 31, 2016
|
||||||||||
|
Accumulated benefit obligations at year end
|
$
|
10,591
|
|
$
|
11,191
|
|
$
|
10,615
|
|
|||
|
Change in projected benefit obligation:
|
||||||||||||
|
Projected benefit obligation at beginning of year
|
$
|
11,001
|
|
$
|
10,425
|
|
$
|
10,218
|
|
|||
|
Interest cost
|
336
|
|
361
|
|
367
|
|
||||||
|
Plan settlement
|
(340
|
)
|
—
|
|
(609
|
)
|
||||||
|
Actuarial loss
|
8
|
|
770
|
|
698
|
|
||||||
|
Benefits paid
|
(414
|
)
|
(555
|
)
|
(249
|
)
|
||||||
|
Projected benefit obligation at end of year
|
$
|
10,591
|
|
$
|
11,001
|
|
$
|
10,425
|
|
|||
|
Change in plan assets:
|
||||||||||||
|
Fair value of plan assets at beginning of year
|
$
|
6,879
|
|
$
|
5,925
|
|
$
|
5,858
|
|
|||
|
Actual return on plan assets
|
(405
|
)
|
444
|
|
277
|
|
||||||
|
Employer contributions
|
1,047
|
|
870
|
|
648
|
|
||||||
|
Plan settlement
|
(340
|
)
|
—
|
|
(609
|
)
|
||||||
|
Benefits paid
|
(414
|
)
|
(360
|
)
|
(249
|
)
|
||||||
|
Fair value of plan assets at end of year
|
$
|
6,767
|
|
$
|
6,879
|
|
$
|
5,925
|
|
|||
|
Funded status at end of year:
|
||||||||||||
|
Fair value of plan assets
|
$
|
6,767
|
|
$
|
6,879
|
|
$
|
5,925
|
|
|||
|
Projected Benefit obligations
|
10,591
|
|
11,001
|
|
10,425
|
|
||||||
|
Underfunded status of the plans
|
3,824
|
|
4,122
|
|
4,500
|
|
||||||
|
Recognized liability
|
$
|
3,824
|
|
$
|
4,122
|
|
$
|
4,500
|
|
|||
|
Amounts recognized on the consolidated balance sheets consist of:
|
||||||||||||
|
Non-current liabilities
|
$
|
3,824
|
|
$
|
4,122
|
|
$
|
4,500
|
|
|||
|
Recognized liability
|
$
|
3,824
|
|
$
|
4,122
|
|
$
|
4,500
|
|
|||
F-42
The change in benefit obligations and funded status of our non-U.S. pension benefits is as follows (in thousands):
|
Non-U.S. Pension Benefits
|
||||||||||||
|
Year Ended December 31, 2018
|
Year Ended December 31, 2017
|
Year Ended December 31, 2016
|
||||||||||
|
Accumulated benefit obligations at year end
|
$
|
18,676
|
|
$
|
23,785
|
|
$
|
27,845
|
|
|||
|
Change in projected benefit obligation:
|
||||||||||||
|
Projected benefit obligation at beginning of year
|
$
|
21,548
|
|
$
|
20,402
|
|
$
|
21,116
|
|
|||
|
Service cost
|
478
|
|
503
|
|
397
|
|
||||||
|
Interest cost
|
289
|
|
291
|
|
376
|
|
||||||
|
Plan curtailments and settlements
(1)
|
—
|
|
—
|
|
(20
|
)
|
||||||
|
Actuarial (gain) loss
|
(818
|
)
|
(27
|
)
|
889
|
|
||||||
|
Benefits paid
|
(1,631
|
)
|
(2,222
|
)
|
(1,911
|
)
|
||||||
|
Foreign currency exchange rate changes and other
|
(891
|
)
|
2,601
|
|
(445
|
)
|
||||||
|
Projected benefit obligation at end of year
|
$
|
18,975
|
|
$
|
21,548
|
|
$
|
20,402
|
|
|||
|
Change in plan assets:
|
||||||||||||
|
Fair value of plan assets at beginning of year
|
$
|
3,075
|
|
$
|
2,898
|
|
$
|
2,689
|
|
|||
|
Actual return on plan assets
|
51
|
|
54
|
|
28
|
|
||||||
|
Employer contributions
|
361
|
|
369
|
|
—
|
|
||||||
|
Employee contributions
|
—
|
|
—
|
|
358
|
|
||||||
|
Benefits paid
|
(156
|
)
|
(393
|
)
|
(238
|
)
|
||||||
|
Foreign currency exchange rate changes
|
10
|
|
147
|
|
61
|
|
||||||
|
Fair value of plan assets at end of year
|
$
|
3,341
|
|
$
|
3,075
|
|
$
|
2,898
|
|
|||
|
Funded status at end of year:
|
||||||||||||
|
Fair value of plan assets
|
$
|
3,341
|
|
$
|
3,075
|
|
$
|
2,898
|
|
|||
|
Projected Benefit obligations
|
18,975
|
|
21,548
|
|
20,402
|
|
||||||
|
Underfunded status of the plans
(2)
|
15,634
|
|
18,473
|
|
17,504
|
|
||||||
|
Recognized liability
|
$
|
15,634
|
|
$
|
18,473
|
|
$
|
17,504
|
|
|||
|
Amounts recognized on the consolidated balance sheets consist of:
|
||||||||||||
|
Non-current liabilities
|
$
|
15,634
|
|
$
|
18,473
|
|
$
|
17,504
|
|
|||
|
Recognized liability
|
$
|
15,634
|
|
$
|
18,473
|
|
$
|
17,504
|
|
|||
|
(1)
|
Benefits to be accumulated in future periods in our French defined benefit plan were curtailed due to our Meylan, French facility restructuring.
|
|
(2)
|
In certain non-U.S. countries, fully funding pension plans is not a common practice. Consequently, certain pension plans have been partially funded.
|
The tables below present net periodic benefit cost of the defined benefit pension plans by component (in thousands):
|
U.S. Pension Benefits
|
||||||||||||
|
Year Ended December 31, 2018
|
Year Ended December 31, 2017
|
Year Ended December 31, 2016
|
||||||||||
|
Interest cost
|
$
|
336
|
|
$
|
361
|
|
$
|
367
|
|
|||
|
Expected return on plan assets
|
(318
|
)
|
(282
|
)
|
(277
|
)
|
||||||
|
Settlement and curtailment loss
|
135
|
|
—
|
|
259
|
|
||||||
|
Amortization of net actuarial loss
|
571
|
|
527
|
|
439
|
|
||||||
|
Net periodic benefit cost
|
$
|
724
|
|
$
|
606
|
|
$
|
788
|
|
|||
F-43
|
Non-U.S. Pension Benefits
|
||||||||||||
|
Year Ended December 31, 2018
|
Year Ended December 31, 2017
|
Year Ended December 31, 2016
|
||||||||||
|
Service cost
|
$
|
478
|
|
$
|
503
|
|
$
|
397
|
|
|||
|
Interest cost
|
289
|
|
291
|
|
376
|
|
||||||
|
Expected return on plan assets
|
(51
|
)
|
(54
|
)
|
(28
|
)
|
||||||
|
Settlement and curtailment gain
|
—
|
|
—
|
|
(20
|
)
|
||||||
|
Amortization of net actuarial (gain) loss
|
(818
|
)
|
(27
|
)
|
889
|
|
||||||
|
Net periodic benefit cost
|
$
|
(102
|
)
|
$
|
713
|
|
$
|
1,614
|
|
|||
To determine the discount rate for our U.S. benefit plan, we used the FTSE Above Median Pension Discount Curve. For the discount rate used for the other non-U.S. benefit plans we consider local market expectations of long-term returns. The resulting discount rates are consistent with the duration of plan liabilities. The expected long-term rate of return on plan assets assumptions are determined using a building block approach, considering historical averages and real returns of each asset class. In certain countries, where historical returns are not meaningful, consideration is given to local market expectations of long-term returns.
Major actuarial assumptions used in determining the benefit obligations and net periodic benefit cost for our significant U.S. benefit plans are presented in the following table:
|
U.S. Pension Benefits
|
||||||
|
December 31, 2018
|
December 31, 2017
|
December 31, 2016
|
||||
|
Weighted-average assumptions used to determine benefit obligation:
|
||||||
|
Discount rate
|
3.97%
|
3.28%
|
3.63%
|
|||
|
Weighted-average assumptions used to determine net periodic benefit cost:
|
||||||
|
Discount rate
|
3.28%
|
3.63%
|
3.04% - 3.79%
|
|||
|
Expected return on plan assets
|
5.00%
|
5.00%
|
5.00%
|
|||
Major actuarial assumptions used in determining the benefit obligations and net periodic benefit cost for our significant non-U.S. benefit plans are presented in the following table:
|
Non-U.S. Pension Benefits
|
||||||
|
December 31, 2018
|
December 31, 2017
|
December 31, 2016
|
||||
|
Weighted-average assumptions used to determine benefit obligation:
|
||||||
|
Discount rate
|
0.20% - 1.55%
|
0.27% - 2.73%
|
0.27% - 1.50%
|
|||
|
Rate of compensation increase
|
2.50% - 3.00%
|
2.50% - 3.00%
|
2.50% - 3.89%
|
|||
|
Weighted-average assumptions used to determine net periodic benefit cost:
|
||||||
|
Discount rate
|
0.27% - 1.55%
|
0.27% - 2.73%
|
3.64%
|
|||
|
Rate of compensation increase
|
2.50% - 3.00%
|
2.50% - 3.00%
|
2.50% - 3.89%
|
|||
Retirement Benefit Plan Investment Strategy
In the U.S., we have an account that holds the defined benefit frozen balance pension plan assets. The Qualified Plan Committee (the “Plan Committee”) sets investment guidelines for U.S. pension plans. The plan assets in the U.S. are invested in accordance with sound investment practices that emphasize long-term fundamentals. The investment objectives for the plan assets in the U.S. are to achieve a positive rate of return that would be expected to close the current funding deficit and so enable us to terminate the frozen pension plan at a reasonable cost. The Plan Committee also oversees the investment allocation process, selects the investment managers, and monitors asset performance. The investment portfolio contains a diversified portfolio of fixed income and equity index funds. Securities are also diversified in terms of domestic and international securities, short- and long-term securities, growth and value styles, large cap and small cap stocks.
F-44
Outside the U.S., pension plan assets are typically managed by decentralized fiduciary committees. There is a significant variation in policy asset allocation from country to country. Local regulations, local funding rules, and local financial and tax considerations are part of the funding and investment allocation process in each country.
The table below presents our U.S. pension plan target allocations by asset category:
|
U.S. Pension Benefits as of December 31, 2018
|
||
|
Equity securities
|
29%
|
|
|
Debt securities
|
70%
|
|
|
Other
|
1%
|
|
Retirement Benefit Fair Values
The following is a description of the valuation methodologies used for retirement benefit plan assets measured at fair value:
Equity Mutual Funds:
Valued based on the year-end net asset values of the investment vehicles. The net asset values of the investment vehicles are based on the fair values of the underlying investments of the partnerships valued at the closing price reported in the active markets in which the individual security is traded. Equity mutual funds have a daily reported net asset value.
Fixed Income Mutual Funds:
Valued based on the year-end net asset values of the investment vehicles. The net asset values of the investment vehicles are based on the fair values of the underlying investments of the partnerships valued based on inputs other than quoted prices that are observable.
Money Markets:
Valued based on quoted prices in active markets for identical assets.
The following tables provide information by level for the retirement benefit plan assets that are measured at fair value, as defined by U.S. GAAP (in thousands):
|
Fair Value as of December 31, 2018
|
Fair Value Measurement Using Inputs Considered as:
|
|||||||||||||||
|
Level 1
|
Level 2
|
Level 3
|
||||||||||||||
|
Equity mutual funds
|
$
|
1,961
|
|
$
|
—
|
|
$
|
1,961
|
|
$
|
—
|
|
||||
|
Fixed income mutual funds
|
4,734
|
|
—
|
|
4,734
|
|
—
|
|
||||||||
|
Money market funds
|
72
|
|
72
|
|
—
|
|
—
|
|
||||||||
|
$
|
6,767
|
|
$
|
72
|
|
$
|
6,695
|
|
$
|
—
|
|
|||||
|
Fair Value as of December 31, 2017
|
Fair Value Measurement Using Inputs Considered as:
|
|||||||||||||||
|
Level 1
|
Level 2
|
Level 3
|
||||||||||||||
|
Equity mutual funds
|
$
|
1,879
|
|
$
|
—
|
|
$
|
1,879
|
|
$
|
—
|
|
||||
|
Fixed income mutual funds
|
4,334
|
|
—
|
|
4,334
|
|
—
|
|
||||||||
|
Money market funds
|
666
|
|
666
|
|
—
|
|
—
|
|
||||||||
|
$
|
6,879
|
|
$
|
666
|
|
$
|
6,213
|
|
$
|
—
|
|
|||||
Refer to “Note 2. Basis of Presentation, Use of Accounting Estimates and Significant Accounting Policies” for discussion of the fair value measurement terms of Levels 1, 2, and 3.
Defined Benefit Retirement Funding
We make the minimum required contribution to fund the U.S. pension plan as determined by MAP - 21 and the Highway and Transportation Funding Act of 2014 (“HAFTA”). We contributed
$1.4 million
,
$1.2 million
and
$0.6 million
to the pension plans (U.S. and non-U.S.) during the years ended
December 31, 2018
, 2017 and 2016, respectively. We anticipate that we will make contributions to the U.S. pension plan of approximately
$0.8 million
during the year ended December 31, 2019.
F-45
Benefit payments, including amounts to be paid from our assets, and reflecting expected future service, as appropriate, are expected to be paid as follows (in thousands):
|
U.S. Plans
|
Non-U.S. Plans
|
|||||||
|
2019
|
$
|
2,242
|
|
$
|
1,789
|
|
||
|
2020
|
1,027
|
|
725
|
|
||||
|
2021
|
790
|
|
828
|
|
||||
|
2022
|
1,046
|
|
870
|
|
||||
|
2023
|
608
|
|
1,097
|
|
||||
|
Thereafter
|
4,878
|
|
13,666
|
|
||||
Severance Indemnity
In Italy, upon termination of employment for any reason, employers are required to pay a termination indemnity (
Trattamento di fine Rapporto
or “TFR”) to all employees as required by Italian Civil Code. The TFR serves as a backup in the event of redundancy or as an additional pension benefit after retirement. The TFR is considered a defined contribution plan with respect to amounts vesting as of January 1, 2007 for employees who have opted for supplementary pensions, or who have chosen to maintain the TFR at the company, for companies with more than 50 employees. We have incurred expenses related to the Italian TFR of approximately
$(0.2) million
,
$0.4 million
and
$1.1 million
for the years ended
December 31, 2018
,
December 31, 2017
and
December 31, 2016
, respectively.
Defined Contribution Plans
We sponsor defined contribution plans in the U.S. including the Cyberonics, Inc. Employee Retirement Savings Plan, which qualifies under Section 401(k) of the IRC covering U.S. employees and the Cyberonics, Inc. Non-Qualified Deferred Compensation Plan (the “Deferred Compensation”), covering certain U.S. middle and senior management. In addition, we sponsor the Belgium Defined Contribution Pension Plan for Cyberonics’ Belgium employees. We incurred expenses for our defined contribution plans of
$12.0 million
,
$13.9 million
and
$13.8 million
for the years ended
December 31, 2018
, 2017 and 2016, respectively.
Note 17. Income Taxes
Earnings Before Income Taxes and Components of Income Tax Provision
The U.S. and non-U.S. components of income (loss) from continuing operations before income taxes and our income tax expense (benefit) from continuing operations are as follows (in thousands):
|
Year Ended December 31, 2018
|
Year Ended December 31, 2017
|
Year Ended December 31, 2016
|
||||||||||
|
Income (loss) from continuing operations before income taxes:
|
|
|||||||||||
|
UK and Non-U.S.
|
$
|
59,528
|
|
$
|
71,980
|
|
$
|
(36,997
|
)
|
|||
|
U.S.
|
(306,975
|
)
|
49,158
|
|
62,663
|
|
||||||
|
|
$
|
(247,447
|
)
|
$
|
121,138
|
|
$
|
25,666
|
|
|||
|
Total income tax expense (benefit) from continuing operations consisted of the following:
|
||||||||||||
|
Current:
|
|
|
||||||||||
|
UK and Non-U.S.
|
$
|
9,645
|
|
$
|
12,771
|
|
$
|
13,876
|
|
|||
|
U.S.
|
1,291
|
|
26,743
|
|
19,706
|
|
||||||
|
|
10,936
|
|
39,514
|
|
33,582
|
|
||||||
|
Deferred:
|
|
|
|
|||||||||
|
UK and Non-U.S.
|
533
|
|
(4,140
|
)
|
(28,607
|
)
|
||||||
|
U.S.
|
(81,098
|
)
|
14,580
|
|
138
|
|
||||||
|
|
(80,565
|
)
|
10,440
|
|
(28,469
|
)
|
||||||
|
Total income tax (benefit) expense from continuing operations
|
$
|
(69,629
|
)
|
$
|
49,954
|
|
$
|
5,113
|
|
|||
F-46
Effective Income Tax Rate Reconciliation
LivaNova PLC is domiciled and resident in the UK. Our subsidiaries conduct operations and earn income in numerous countries and are subject to the laws of taxing jurisdictions within those countries, and the income tax rates imposed in the tax jurisdictions in which our subsidiaries conduct operations vary. As a result of the changes in the overall level of our income, the earnings mix in various jurisdictions and the changes in tax laws, our consolidated effective income tax rate may vary from one reporting period to another.
The following table is a reconciliation of the statutory income tax rate to our effective income tax rate expressed as a percentage of income from continuing operations before income taxes:
|
Year Ended December 31, 2018
|
Year Ended December 31, 2017
|
Year Ended December 31, 2016
|
|||||||
|
Statutory tax rate at UK Rate
|
19.0
|
%
|
19.0
|
%
|
20.0
|
%
|
|||
|
Effect of changes in tax rate
|
0.6
|
|
(19.9
|
)
|
(0.2
|
)
|
|||
|
Deferred tax valuation allowance
|
(0.8
|
)
|
10.6
|
|
5.1
|
|
|||
|
Transaction costs
|
(0.8
|
)
|
2.0
|
|
10.2
|
|
|||
|
Sale of Intellectual Property
|
—
|
|
44.3
|
|
17.6
|
|
|||
|
U.S. state and local tax expense, net of federal benefit
|
4.3
|
|
1.2
|
|
7.9
|
|
|||
|
Foreign tax rate differential
|
3.0
|
|
10.7
|
|
101.5
|
|
|||
|
Notional interest deduction
|
6.1
|
|
(13.5
|
)
|
(68.4
|
)
|
|||
|
U.S. Subpart F
|
(0.5
|
)
|
1.5
|
|
7.9
|
|
|||
|
Research and development tax credits
|
1.1
|
|
(1.6
|
)
|
(4.0
|
)
|
|||
|
Distribution of subsidiary earnings
|
—
|
|
(0.3
|
)
|
(55.1
|
)
|
|||
|
Reserve for uncertain tax positions
|
(0.7
|
)
|
1.2
|
|
8.4
|
|
|||
|
Domestic manufacturing deduction
|
—
|
|
(1.8
|
)
|
(2.8
|
)
|
|||
|
Tax on UK CFC interest pick-up
|
(1.0
|
)
|
0.2
|
|
1.3
|
|
|||
|
Write-off/impairment of investments
|
(1.3
|
)
|
(14.8
|
)
|
(30.3
|
)
|
|||
|
Base erosion anti-abuse tax
|
(1.2
|
)
|
—
|
|
—
|
|
|||
|
Foreign tax withholding credits
|
(0.4
|
)
|
0.6
|
|
—
|
|
|||
|
Other, net
|
0.7
|
|
1.8
|
|
0.8
|
|
|||
|
Effective tax rate
|
28.1
|
%
|
41.2
|
%
|
19.9
|
%
|
|||
U.S. Tax Reform
On December 22, 2017, the U.S. enacted the Tax Act, which significantly changed U.S. corporate income tax laws by, among other things, reducing the U.S. corporate income tax rate to 21%, which commenced in 2018. In addition, the Tax Act created a mandatory deemed repatriation tax (“transition tax”) on previously deferred foreign earnings of non-U.S. subsidiaries controlled by a U.S. corporation, or, in our case, a non-U.S. subsidiary controlled by one of our U.S. subsidiaries. We recorded no transition tax for the year ended December 31, 2017 as we had no previously deferred foreign earnings of U.S. controlled foreign subsidiaries as of the measurement dates. During the fourth quarter of 2018, we finalized our accounting under Staff Accounting Bulletin No. 118 for the remeasurement of the deferred tax assets and liabilities and impairment of foreign tax credits related to the Tax Act . Our accounting for the remeasurement is complete with a final non-cash net charge of
$21.0 million
.
A new provision enacted under Tax Reform called the base erosion and anti-abuse tax (“BEAT”) is effective for 2018. The BEAT provisions provide for a new minimum tax (imposed for certain base erosion payments to Non-U.S. related corporations) if greater than regular tax. For the year ended December 31, 2018, the company was subject to a BEAT of
$2.8 million
.
To determine the full impact of the tax reform provisions, we are awaiting finalization of proposed U.S. Treasury regulations under the Tax Act that were issued during 2018. We will continue to analyze the Tax Act to determine the full effects of the new law as additional regulations are proposed and finalized.
F-47
Deferred Income Tax Assets and Liabilities
The significant components of our deferred tax assets and liabilities are presented in the table below. The components for the year ended December 31, 2018 represent continuing operations; while the components for the year ended December 31, 2017 include the amounts related to discontinued operations (in thousands):
|
December 31, 2018
|
December 31, 2017
|
|||||||
|
Deferred tax assets:
|
||||||||
|
Net operating loss carryforwards
|
$
|
87,406
|
|
$
|
132,615
|
|
||
|
Tax credit carryforwards
|
26,152
|
|
18,585
|
|
||||
|
Deferred compensation
|
5,757
|
|
4,697
|
|
||||
|
Accruals and reserves
|
96,483
|
|
27,146
|
|
||||
|
Inventory
|
3,956
|
|
2,759
|
|
||||
|
Investments
|
492
|
|
3,858
|
|
||||
|
Other
|
5,551
|
|
3,310
|
|
||||
|
Gross deferred tax assets
|
225,797
|
|
192,970
|
|
||||
|
Valuation allowance
|
(40,255
|
)
|
(93,333
|
)
|
||||
|
Net deferred tax assets
|
185,542
|
|
99,637
|
|
||||
|
Deferred tax liabilities:
|
||||||||
|
Gain on sale of intellectual property
|
(59,249
|
)
|
(75,624
|
)
|
||||
|
Investments
|
(3,561
|
)
|
(3,135
|
)
|
||||
|
Property, equipment & intangible assets
|
(122,035
|
)
|
(137,031
|
)
|
||||
|
Other
|
(740
|
)
|
(1,181
|
)
|
||||
|
Gross deferred tax liabilities:
|
(185,585
|
)
|
(216,971
|
)
|
||||
|
Net deferred tax liabilities
|
$
|
(43
|
)
|
$
|
(117,334
|
)
|
||
|
Reported on the consolidated balance sheet as (after valuation allowance and jurisdictional netting):
|
||||||||
|
Net deferred tax assets
|
$
|
68,146
|
|
$
|
14,076
|
|
||
|
Deferred tax liabilities
|
(68,189
|
)
|
(131,410
|
)
|
||||
|
Net deferred tax liabilities
|
$
|
(43
|
)
|
$
|
(117,334
|
)
|
||
Refer to “
Note 5. Discontinued Operations
” for the amounts of deferred tax assets and liabilities included in the above schedule related to discontinued operations for the year ended
December 31, 2017
. The portion of deferred tax assets and liabilities for the year ended December 31, 2017 relating to discontinued operations are reported as held for sale.
As of December 31, 2018, we have
$13.6 million
of foreign tax credits in the U.S., fully offset by valuation allowance,
$6.0 million
of U.S. State tax credits and
$5.9 million
of other tax credits.
Net Operating Loss Carryforwards
Net operating loss (“NOL”) carryforwards as of
December 31, 2018
, which can be used to reduce our income tax payable in future years are as follows (in thousands):
|
Region
|
Gross Amount
|
Gross Amount
with No Expiration |
With Expiration
|
Starting Expiration
Year |
||||||||||
|
Europe
|
$
|
183,729
|
|
$
|
174,125
|
|
$
|
9,604
|
|
2022
|
||||
|
U.S. Federal
|
179,942
|
|
—
|
|
179,942
|
|
2021
|
|||||||
|
U.S. State
|
120,639
|
|
—
|
|
120,639
|
|
2019
|
|||||||
|
Rest of world
|
15,613
|
|
15,596
|
|
17
|
|
2023
|
|||||||
As of
December 31, 2018
, we had a valuation allowance of
$40.3 million
related to continuing operations. As of
December 31, 2017
, we had a valuation allowance of
$93.3 million
, which includes
$48.7 million
related to discontinued operations and
$44.6 million
related to continuing operations. For the years ended
December 31, 2018
and
2017
, the valuation allowances were primarily related to net operating losses in certain jurisdictions and U.S. foreign tax credits.
F-48
As of
December 31, 2016
, we had a valuation allowance of
$51.5 million
, primarily related to net operating losses acquired in the merger of Sorin and Cyberonics. As a result of the business combination during the
transitional period to December 31, 2015
, the historic NOL’s of Sorin U.S. are limited by IRC section 382. The annual limitation is approximately
$14.2 million
, which is sufficient to absorb the U.S. net operating losses prior to their expiration.
In 2016, we consolidated certain of our intangible assets into an entity organized under the laws of England and Wales. Because the intangible assets were sold and purchased inter-company, the tax expense on the inter-company gain was deferred and amortized to current income tax expense on our consolidated statements of income (loss). With our adoption of Accounting Standards Update 2016-16,
Intra-Entity Transfers of Assets Other Than Inventory
on January 1, 2018, we no longer record the income tax on the deferred inter-company gain in prepaid expense and other assets on the consolidated balance sheets; rather, the income tax expense on the gain of the asset sale is recognized in the corresponding jurisdictions for the seller and buyer, refer to “
Note 22. New Accounting Pronouncements
” for further information.
A significant portion of the net deferred tax liability worldwide included above relates to the tax effect of the step-up in value of the assets acquired in the combination with Sorin.
No provision has been made for income taxes on undistributed earnings of foreign subsidiaries as of
December 31, 2018
because it is our intention to indefinitely reinvest undistributed earnings of our foreign subsidiaries. In the event of the distribution of those earnings in the form of dividends, a sale of the subsidiaries, or certain other transactions, we may be liable for income taxes and withholding taxes. As of
December 31, 2018
, it was not practicable to determine the amount of the deferred tax liability related to those investments.
Uncertain Income Tax Positions
The following is a roll-forward of our total gross unrecognized tax benefit (in thousands):
|
Year Ended December 31, 2018
|
Year Ended December 31, 2017
|
Year Ended December 31, 2016
|
||||||||||
|
Balance at beginning of year
|
$
|
26,137
|
|
$
|
22,374
|
|
$
|
20,224
|
|
|||
|
Increases:
|
||||||||||||
|
Tax positions related to current year
|
671
|
|
324
|
|
—
|
|
||||||
|
Tax positions related to prior year
|
3,309
|
|
1,153
|
|
2,548
|
|
||||||
|
Impact of foreign currency exchange rates
|
(892
|
)
|
2,286
|
|
(398
|
)
|
||||||
|
Decreases:
|
||||||||||||
|
Tax positions related to prior years for settlement with tax authorities
|
(3,999
|
)
|
—
|
|
—
|
|
||||||
|
Tax positions related to prior years for lapses of statute of limitations
|
(2,343
|
)
|
—
|
|
—
|
|
||||||
|
Balance at end of year
|
$
|
22,883
|
|
$
|
26,137
|
|
$
|
22,374
|
|
|||
Unrecognized tax benefits of
$11.6 million
,
$12.2 million
and
$10.7 million
at
December 31, 2018
,
2017
and
2016
, respectively, included in the table above are presented in the balance sheet as a reduction to the related deferred tax assets for net operating loss carryforwards.
Accrued interest and penalties totaled
$6.3 million
,
$8.0 million
and
$6.3 million
as of
December 31, 2018
, 2017 and 2016, respectively, and were included in Other long-term liabilities on our consolidated balance sheets.
Tax authorities may disagree with certain positions we have taken and assess additional taxes. We regularly assess the likely outcomes of our tax positions in order to determine the appropriateness of our reserves for uncertain tax positions. However, there can be no assurance that we will accurately predict the outcome of these audits and the actual outcome of an audit could have a material impact on our consolidated results of income, financial position or cash flows. If all of our unrecognized tax benefits as of
December 31, 2018
were recognized,
$19.7 million
would impact our effective tax rate. We believe it is reasonably possible that the amount of gross unrecognized tax benefits could be reduced by up to
$3.4 million
in the next 12 months as a result of the resolution of tax matters in various global jurisdictions and the lapses of statutes of limitations. Refer to “
Note 13. Commitments and Contingencies
” for additional information regarding the status of current tax litigation.
We record accrued interest and penalties related to unrecognized tax benefits in interest expense and foreign exchange and other (losses) gains, respectively, on our consolidated statements of income (loss).
F-49
Brexit
On June 23, 2016, the UK held a referendum in which voters approved an exit from the EU, commonly referred to as “Brexit.” On March 29, 2017, the UK government gave formal notice of its intention to leave the EU, formally commencing the negotiations regarding the terms of withdrawal between the UK and the EU, and on March 19, 2018, the UK and the EU released a draft withdrawal agreement highlighting the progress made between the two parties on the terms of a transition period that will usher the UK out of the EU. Negotiations between the UK and the EU continue about provisions of the withdrawal agreement. Unless the deadline is extended, the UK will leave the EU on March 29, 2019. Although the long-term effects of Brexit will depend on any agreements the UK makes to retain access to the EU markets, Brexit has created additional uncertainties that may ultimately result in new regulatory costs and challenges for medical device companies and increased restrictions on imports and exports throughout Europe. This could adversely affect our ability to conduct and expand our operations in Europe and may have an adverse effect on our business, financial condition and results of operations.
The notification does not change the application of existing tax laws and does not establish a clear framework for what the ultimate outcome of the negotiations and legislative process will be. Various tax reliefs and exemptions that apply to transactions between EU Member States under existing tax laws may cease to apply to transactions between the UK and EU Member States when the UK ultimately withdraws from the EU. It is unclear at this stage if or when any new tax treaties between the UK and the EU or individual EU Member States will replace those reliefs and exemptions. It is also unclear at this stage what financial, trade and legal implications will ensue from Brexit and how Brexit may affect us, our customers, suppliers, vendors, or our industry.
We and several of our wholly owned subsidiaries that are domiciled either in the UK, various EU Member States, or in the U.S., are party to intercompany transactions and agreements under which we receive various tax reliefs and exemptions in accordance with applicable international tax laws, treaties and regulations. If certain treaties applicable to our transactions and agreements are not renegotiated or replaced with new treaties containing terms, conditions and attributes similar to those of the existing treaties, Brexit may have a material adverse impact on our future financial results and results of operations. We continue to monitor and assess the potential impact of this event and explore possible tax-planning strategies that may mitigate or eliminate any such potential adverse impact.
We will not account for the impact of Brexit in our income tax provisions until there are material changes in tax laws or treaties between the UK and other countries.
European Union State Aid Challenge
On October 26, 2017, the European Commission (“EC”) announced that an investigation will be opened with respect to the UK’s controlled foreign company (“CFC”) rules. The CFC rules under investigation provide certain tax exceptions to entities controlled by UK parent companies that are subject to lower tax rates if the activities being undertaken by the CFC relate to financing. The EC is investigating whether the exemption is a breach of EU State Aid rules. The investigation is estimated to be completed during the quarter ended March 31, 2019, with an appeal process likely to follow. It is unclear as to whether the UK will be part of the EU once a decision has been finalized due to Brexit and what impact, if any, Brexit will have on the outcome of the investigation or the enforceability of a decision. Due to the many uncertainties related to this matter, including the state of the investigation, the pending Brexit negotiations and political environment and the unknown outcome of the investigation and resulting appeals, no uncertain tax position reserve has been recognized related to this matter and we are unable to reasonably estimate the potential liability.
The major jurisdictions where we are subject to income tax examinations are as follows:
|
Jurisdiction
|
Earliest Year Open
|
|
|
U.S. - federal and state
|
1998
|
|
|
Italy
|
2014
|
|
|
Germany
|
2011
|
|
|
England and Wales
|
2014
|
|
|
Canada
|
2014
|
|
On October 13, 2016, the U.S. IRS and U.S. Treasury Department released final and temporary regulations under section 385 regarding debt versus equity. In response to comments, the final regulations significantly narrow the scope of the proposed regulations previously issued on April 4, 2016. Like the proposed regulations, the final regulations establish extensive documentation requirements that must be satisfied for a debt instrument to constitute debt for U.S. federal tax purposes and re-characterizes a debt instrument as stock if the instrument is issued in one of a number of specified transactions. Pursuant to a
F-50
2017 Executive Order, the Treasury Department reviewed these regulations and determined that they should be retained subject to further review following the enactment of U.S. tax reform. We are awaiting the U.S. Treasury’s review of the existing section 385 regulations which could impact our internal financings and potential restructuring in future years.
Executive Order 13789, issued in April 2017, ordered the US Treasury to examine tax regulations for excessive cost, complexity or whether such regulation exceeded IRS’s statutory authority, which included IRC Sec. 385.
Note 18. Net Income Per Share
The following table sets forth the basic and diluted weighted-average shares outstanding used in the computation of basic and diluted net income per share (in thousands of shares):
|
Year Ended December 31, 2018
|
Year Ended December 31, 2017
|
Year Ended December 31, 2016
|
|||||||
|
Basic weighted average shares outstanding
|
48,497
|
|
48,157
|
|
48,860
|
|
|||
|
Add effects of stock-based compensation instruments
(1)
|
—
|
|
344
|
|
154
|
|
|||
|
Diluted weighted average shares outstanding
|
48,497
|
|
48,501
|
|
49,014
|
|
|||
|
(1)
|
Excluded from the computation of diluted earnings per share for the years ended
December 31, 2018
,
December 31, 2017
and
December 31, 2016
were
stock options,
SARs
and RSUs t
otaling
2.7 million
,
1.2 million
and
1.3 million
because to include them would have been anti-dilutive under the treasury stock method.
|
Note 19. Geographic and Segment Information
Segment Information
We identify operating segments based on the way we manage, evaluate and internally report our business activities for purposes of allocating resources and assessing performance. We have
two
reportable segments: CV and NM.
The CV segment generates its revenue from the development, production and sale of cardiopulmonary products, heart valves and advanced circulatory support. Cardiopulmonary products include oxygenators, heart-lung machines, autotransfusion systems, perfusion tubing systems, cannulae and other related accessories. Heart valves include mechanical heart valves, tissue heart valves and related repair products. Advanced circulatory support, which represents our recently acquired TandemLife business, includes temporary life support product kits that can include a combination of pumps, oxygenators, and cannulae.
Our NM segment generates its revenue from the design, development and marketing of NM therapy systems for the treatment of drug-resistant epilepsy and TRD. NM products include the VNS Therapy System, which consists of an implantable pulse generator, a lead that connects the generator to the vagus nerve, and other accessories. On January 16, 2018, we acquired the remaining
86%
outstanding interest in ImThera, which is also included in our NM segment. ImThera manufactures an implantable device for the treatment of obstructive sleep apnea that stimulates multiple tongue muscles via the hypoglossal nerve, which opens the airway while a patient is sleeping.
“Other” includes corporate shared service expenses for finance, legal, human resources and information technology and corporate business development and New Ventures.
Effective January 1, 2018, we began to include the results of heart failure within the NM segment for internal reporting purposes in order to manage and evaluate business activities for purposes of allocating resources and assessing performance. Previously, the results of heart failure were reported within “Other.” Segment results for the years ended December 31, 2017 and 2016 have been recast to conform to the current period presentation.
Net sales of our reportable segments include revenues from the sale of products they each develop and manufacture or distribute. We define segment income as operating income before merger and integration, restructuring and amortization and intangibles.
F-51
We operate under
three
geographic regions: U.S., Europe, and Rest of world. The table below presents net sales by operating segment and geographic region (in thousands):
|
Year Ended December 31, 2018
|
Year Ended December 31, 2017
|
Year Ended December 31, 2016
|
||||||||||
|
Cardiopulmonary
|
||||||||||||
|
United States
|
$
|
161,134
|
|
$
|
152,828
|
|
$
|
154,426
|
|
|||
|
Europe
|
141,720
|
|
133,585
|
|
128,471
|
|
||||||
|
Rest of world
|
233,554
|
|
210,911
|
|
191,539
|
|
||||||
|
536,408
|
|
497,324
|
|
474,436
|
|
|||||||
|
Heart Valves
|
||||||||||||
|
United States
|
24,709
|
|
24,977
|
|
27,679
|
|
||||||
|
Europe
|
44,258
|
|
42,120
|
|
44,301
|
|
||||||
|
Rest of world
|
56,989
|
|
71,096
|
|
65,299
|
|
||||||
|
125,956
|
|
138,193
|
|
137,279
|
|
|||||||
|
Advanced Circulatory Support
|
||||||||||||
|
United States
|
18,588
|
|
—
|
|
—
|
|
||||||
|
Europe
|
580
|
|
—
|
|
—
|
|
||||||
|
Rest of world
|
293
|
|
—
|
|
—
|
|
||||||
|
19,461
|
|
—
|
|
—
|
|
|||||||
|
Cardiovascular
|
||||||||||||
|
United States
|
204,431
|
|
177,805
|
|
182,105
|
|
||||||
|
Europe
|
186,558
|
|
175,705
|
|
172,772
|
|
||||||
|
Rest of world
|
290,836
|
|
282,007
|
|
256,838
|
|
||||||
|
681,825
|
|
635,517
|
|
611,715
|
|
|||||||
|
Neuromodulation
|
||||||||||||
|
United States
|
348,980
|
|
316,916
|
|
298,453
|
|
||||||
|
Europe
|
42,443
|
|
34,765
|
|
31,942
|
|
||||||
|
Rest of world
|
31,567
|
|
23,295
|
|
21,011
|
|
||||||
|
422,990
|
|
374,976
|
|
351,406
|
|
|||||||
|
Other
|
2,146
|
|
1,784
|
|
1,737
|
|
||||||
|
Totals
|
||||||||||||
|
United States
|
553,411
|
|
494,721
|
|
480,558
|
|
||||||
|
Europe
(1)
|
229,001
|
|
210,470
|
|
204,846
|
|
||||||
|
Rest of world
|
324,549
|
|
307,086
|
|
279,454
|
|
||||||
|
Total
(2) (3)
|
$
|
1,106,961
|
|
$
|
1,012,277
|
|
$
|
964,858
|
|
|||
|
(1)
|
Europe sales include those countries in which we have a direct sales presence, whereas European countries in which we sell through distributors are included in Rest of world.
|
|
(2)
|
Net sales to external customers includes
$34.8 million
,
$30.8 million
and
$37.3 million
in the United Kingdom, our country of domicile, for the years ended December 31, 2018, 2017 and 2016, respectively.
|
|
(3)
|
No single customer represented over 10% of our consolidated net sales. No country’s net sales exceeded 10% of our consolidated sales except for the U.S.
|
F-52
The table below presents a reconciliation of segment (loss) income from continuing operations to consolidated (loss) income from continuing operations before tax (in thousands):
|
Year Ended December 31, 2018
|
Year Ended December 31, 2017
|
Year Ended December 31, 2016
|
||||||||||
|
Cardiovascular
|
$
|
(258,493
|
)
|
$
|
81,412
|
|
$
|
17,372
|
|
|||
|
Neuromodulation
|
184,674
|
|
183,228
|
|
168,070
|
|
||||||
|
Other
|
(96,724
|
)
|
(102,425
|
)
|
(63,205
|
)
|
||||||
|
Total reportable segment (loss) income from continuing operations
|
(170,543
|
)
|
162,215
|
|
122,237
|
|
||||||
|
Merger and integration expenses
|
24,420
|
|
15,528
|
|
20,377
|
|
||||||
|
Restructuring expenses
|
15,915
|
|
17,056
|
|
37,377
|
|
||||||
|
Amortization of intangibles
|
37,194
|
|
33,144
|
|
31,035
|
|
||||||
|
Operating (loss) income from continuing operations
|
(248,072
|
)
|
96,487
|
|
33,448
|
|
||||||
|
Interest income
|
847
|
|
1,318
|
|
1,698
|
|
||||||
|
Interest expense
|
(9,825
|
)
|
(7,797
|
)
|
(10,616
|
)
|
||||||
|
Gain on acquisitions
|
11,484
|
|
39,428
|
|
—
|
|
||||||
|
Impairment of investments
|
—
|
|
(8,565
|
)
|
—
|
|
||||||
|
Foreign exchange and other (losses) gains
|
(1,881
|
)
|
267
|
|
1,136
|
|
||||||
|
(Loss) income from continuing operations before tax
|
$
|
(247,447
|
)
|
$
|
121,138
|
|
$
|
25,666
|
|
|||
Assets by reportable segment are as follows (in thousands):
|
Assets
|
December 31, 2018
|
December 31, 2017
|
||||||
|
Cardiovascular
|
$
|
1,532,825
|
|
$
|
1,386,032
|
|
||
|
Neuromodulation
|
731,840
|
|
533,067
|
|
||||
|
Other
|
285,036
|
|
334,103
|
|
||||
|
Discontinued operations
|
—
|
|
250,689
|
|
||||
|
Total
|
$
|
2,549,701
|
|
$
|
2,503,891
|
|
||
Capital expenditures by segment are as follows (in thousands):
|
Capital Expenditures
|
December 31, 2018
|
December 31, 2017
|
||||||
|
Cardiovascular
|
$
|
27,621
|
|
$
|
18,985
|
|
||
|
Neuromodulation
|
1,728
|
|
2,504
|
|
||||
|
Other
|
7,630
|
|
7,010
|
|
||||
|
Discontinued operations
|
1,018
|
|
5,608
|
|
||||
|
Total
|
$
|
37,997
|
|
$
|
34,107
|
|
||
Geographic Information
Property, plant, and equipment, net by geographic region are as follows (in thousands):
|
PP&E
|
December 31, 2018
|
December 31, 2017
|
||||||
|
United States
|
$
|
68,862
|
|
$
|
62,154
|
|
||
|
Europe
|
112,376
|
|
119,133
|
|
||||
|
Rest of world
|
10,162
|
|
11,072
|
|
||||
|
Total
|
$
|
191,400
|
|
$
|
192,359
|
|
||
F-53
Note 20. Supplemental Financial Information
Inventories consisted of the following (in thousands):
|
|
December 31, 2018
|
December 31, 2017
|
||||||
|
Raw materials
|
$
|
40,387
|
|
$
|
39,810
|
|
||
|
Work-in-process
|
15,999
|
|
18,206
|
|
||||
|
Finished goods
|
97,149
|
|
86,454
|
|
||||
|
|
$
|
153,535
|
|
$
|
144,470
|
|
||
Inventories are reported net of the provision for obsolescence. The provision, which reflects normal obsolescence and includes components that are phased out or expired, totaled
$11.6 million
and
$10.5 million
, at
December 31, 2018
and
December 31, 2017
, respectively.
PP&E detail consisted of the following (in thousands):
|
December 31, 2018
|
December 31, 2017
|
Lives in Years
|
||||||||
|
Land
|
$
|
15,866
|
|
$
|
16,293
|
|
||||
|
Building and building improvements
|
82,035
|
|
80,280
|
|
3 to 39
|
|||||
|
Equipment, software, furniture and fixtures
|
195,008
|
|
182,968
|
|
2 to 13
|
|||||
|
Other
|
8,298
|
|
6,082
|
|
1 to 15
|
|||||
|
Capital investment in process
|
20,228
|
|
9,944
|
|
||||||
|
Total
|
321,435
|
|
295,567
|
|
||||||
|
Accumulated depreciation
|
(130,035
|
)
|
(103,208
|
)
|
||||||
|
Net
|
$
|
191,400
|
|
$
|
192,359
|
|
||||
Detail of other assets consisted of the following (in thousands):
|
December 31, 2018
|
December 31, 2017
|
|||||||
|
Investments
(1)
|
$
|
2,632
|
|
$
|
2,943
|
|
||
|
Guaranteed deposits
|
973
|
|
725
|
|
||||
|
Taxes payable on inter-company transfers of property
(2)
|
—
|
|
68,127
|
|
||||
|
Loans and notes receivable
|
—
|
|
1,276
|
|
||||
|
Escrow deposit - Caisson
|
—
|
|
1,000
|
|
||||
|
Other
|
1,176
|
|
1,913
|
|
||||
|
|
$
|
4,781
|
|
$
|
75,984
|
|
||
|
(1)
|
Primarily cash surrender value of company owned life insurance policies.
|
|
(2)
|
The income taxes payable on intercompany transfers of property was an asset recognized to defer the income tax effect of an intercompany intellectual property sale pursuant to ASC 810-10-45-8. Pursuant to ASU 2016-16 - Income Taxes - Intra-Entity Transfers of Assets Other than Inventory, we reclassified the balance at December 31, 2017 to retained earnings on January 1, 2018.
|
F-54
Accrued liabilities consisted of the following (in thousands):
|
December 31, 2018
|
December 31, 2017
|
|||||||
|
Contingent consideration
(1)
|
$
|
18,530
|
|
$
|
—
|
|
||
|
CRM purchase price adjustments payable to MicroPort Scientific Corporation
|
14,891
|
|
—
|
|
||||
|
Product remediation
(2)
|
13,945
|
|
16,811
|
|
||||
|
Restructuring related liabilities
(3)
|
9,393
|
|
3,560
|
|
||||
|
Other amounts payable to MicroPort Scientific Corporation
|
9,319
|
|
—
|
|
||||
|
Legal and other administrative costs
|
9,189
|
|
6,082
|
|
||||
|
Derivative contract liabilities
(4)
|
5,063
|
|
1,294
|
|
||||
|
Provisions for agents, returns and other
|
4,934
|
|
8,134
|
|
||||
|
Deferred consideration - Caisson
|
—
|
|
14,300
|
|
||||
|
Other accrued expenses
|
39,021
|
|
28,761
|
|
||||
|
|
$
|
124,285
|
|
$
|
78,942
|
|
||
|
(1)
|
Refer to “
Note 10. Fair Value Measurements
.”
|
|
(2)
|
Refer to “
Note 7. Product Remediation Liability
.”
|
|
(3)
|
Refer to “
Note 6. Restructuring
.”
|
|
(4)
|
Refer to “
Note 12. Derivatives and Risk Management
.”
|
Note 21. Quarterly Financial Information (unaudited)
The tables below present the quarterly results for the years ended
December 31, 2018
and 2017 (in thousands except for share data):
|
Year Ended December 31, 2018
|
First Quarter
|
Second
Quarter
|
Third
Quarter
|
Fourth
Quarter
|
||||||||||||
|
Net sales
|
$
|
250,398
|
|
$
|
287,498
|
|
$
|
272,082
|
|
$
|
296,983
|
|
||||
|
Gross profit
(1)
|
162,085
|
|
193,963
|
|
174,348
|
|
204,073
|
|
||||||||
|
Operating income (loss) from continuing operations
(2)
|
12,530
|
|
21,607
|
|
(5,757
|
)
|
(276,452
|
)
|
||||||||
|
Net income (loss) from continuing operations
(2)
|
17,822
|
|
19,528
|
|
(6,273
|
)
|
(209,539
|
)
|
||||||||
|
Net loss from discontinued operations, net of tax
|
(4,549
|
)
|
(4,462
|
)
|
(904
|
)
|
(1,022
|
)
|
||||||||
|
Net income (loss)
(2)
|
$
|
13,273
|
|
$
|
15,066
|
|
$
|
(7,177
|
)
|
$
|
(210,561
|
)
|
||||
|
Diluted earnings (loss) per share:
|
||||||||||||||||
|
Continuing operations
|
$
|
0.36
|
|
$
|
0.40
|
|
$
|
(0.13
|
)
|
$
|
(4.32
|
)
|
||||
|
Discontinued operations
|
(0.09
|
)
|
(0.09
|
)
|
(0.02
|
)
|
(0.02
|
)
|
||||||||
|
$
|
0.27
|
|
$
|
0.31
|
|
$
|
(0.15
|
)
|
$
|
(4.34
|
)
|
|||||
|
(1)
|
Gross profit excludes amortization of developed technology intangible assets of approximately
$3.6 million
for each quarter in 2018.
|
|
(2)
|
The fourth quarter of 2018 includes a
$294.0 million
litigation provision associated with our 3T devices. For further information, please refer to “
Note 13. Commitments and Contingencies
.”
|
F-55
|
Year Ended December 31, 2017
|
First Quarter
|
Second
Quarter
|
Third
Quarter
|
Fourth
Quarter
|
||||||||||||
|
Net sales
|
$
|
226,825
|
|
$
|
255,843
|
|
$
|
251,253
|
|
$
|
278,356
|
|
||||
|
Gross profit
(1)
|
147,649
|
|
170,097
|
|
161,859
|
|
172,226
|
|
||||||||
|
Operating income from continuing operations
|
19,747
|
|
27,775
|
|
30,022
|
|
18,943
|
|
||||||||
|
Net income (loss) from continuing operations
|
13,227
|
|
45,679
|
|
27,015
|
|
(31,456
|
)
|
||||||||
|
Discontinued Operations:
|
||||||||||||||||
|
(Loss) income from discontinued operations, net of tax
|
(1,956
|
)
|
1,819
|
|
815
|
|
(1,949
|
)
|
||||||||
|
Impairment of discontinued operations, net of tax
|
—
|
|
—
|
|
—
|
|
(78,283
|
)
|
||||||||
|
Net (loss) income from discontinued operations, net of tax
|
(1,956
|
)
|
1,819
|
|
815
|
|
(80,232
|
)
|
||||||||
|
Net income (loss)
|
$
|
11,271
|
|
$
|
47,498
|
|
$
|
27,830
|
|
$
|
(111,688
|
)
|
||||
|
Diluted earnings (loss) per share:
|
||||||||||||||||
|
Continuing operations
|
$
|
0.27
|
|
$
|
0.95
|
|
$
|
0.56
|
|
$
|
(0.65
|
)
|
||||
|
Discontinued operations
|
(0.04
|
)
|
0.03
|
|
0.01
|
|
(1.67
|
)
|
||||||||
|
$
|
0.23
|
|
$
|
0.98
|
|
$
|
0.57
|
|
$
|
(2.32
|
)
|
|||||
|
(1)
|
Gross profit excludes amortization of developed technology intangible assets of approximately
$2.9 million
for each quarter in 2017.
|
Note 22. New Accounting Pronouncements
In May 2014, the FASB issued ASU No. 2014-09,
Revenue from Contracts with Customers
(Topic 606)
.
Update No. 2014-09 requires an entity to recognize the amount of revenue to which it expects to be entitled for the transfer of promised goods or services to customers and replaces most existing revenue recognition guidance. We adopted the new revenue guidance on January 1, 2018. We elected the cumulative effect transition method; however, we recognized no cumulative effect to the opening balance of retained earnings because the impact on the timing of when revenue is recognized within our CV segment, specifically related to heart-lung machines and preventative maintenance contracts on cardiopulmonary equipment was insignificant. The timing of revenue recognition for products and related revenue streams within our NM segment and discontinued operations did not change. Upon adoption of the new standard, we implemented new internal controls related to our accounting policies and procedures, including review controls to ensure contractual terms and conditions that may require consideration under the standard are properly identified and analyzed.
In January 2016, the FASB issued ASU No. 2016-01, Financial Instruments-Overall (Subtopic 825-10): Recognition and Measurement of Financial Assets and Financial Liabilities. Update 2016-01 requires equity investments that do not result in consolidation and are not accounted for under the equity method to be measured at fair value with changes recognized in net income. However, an entity may elect to measure equity investments that do not have readily determinable fair values at cost minus impairment, if any, plus or minus changes resulting from observable price changes in orderly transactions for an identical or a similar investment of the same issuer. We made this election beginning January 1, 2018, resulting in no material impact to our consolidated financial statements.
In February 2016, the FASB issued ASU No. 2016-02,
Leases
and later issued subsequent amendments to the initial guidance, collectively referred to as Topic 842. The standard became effective for us on January 1, 2019 and requires lessees to recognize most leases on the balance sheet as lease liabilities with corresponding right-of-use (“ROU”) assets and to provide enhanced disclosures. The standard will have a material impact on our consolidated balance sheets, but will not have a material impact on our consolidated statements of income (loss) from a lessee perspective. The most significant impact from a lessee perspective will be the recognition of ROU assets and lease liabilities for operating leases. We currently estimate the adoption of the new standard will result in the recognition of ROU assets and lease liabilities between a range of approximately
$60.0 million
to
$70.0 million
as of January 1, 2019. Furthermore, from a lessor perspective, certain of our agreements that allow the customer to use, rather than purchase, our medical devices will meet the criteria of being a lease in accordance with the new standard. While the amount of revenue and expenses recognized over the contract term will not be impacted, the timing of revenue and expense recognition may be impacted depending upon lease classification. The standards provide certain practical expedients including an option to apply transition provisions of the new standard, including its disclosure requirements, at its adoption date instead of at the beginning of the earliest comparative period presented. We have elected the majority of available practical expedients, including the transition provision, implemented lease accounting software and established internal controls to enable the preparation of financial information and related disclosures. The impact of the new standard will be finalized upon adoption in the first quarter of 2019 and is therefore subject to change.
F-56
In June 2016, the FASB issued ASU Update No. 2016-13,
Financial Instruments—Credit Losses
(Topic 326): The amendments in this update require a financial asset (or a group of financial assets) measured at amortized cost basis to be presented at the net amount expected to be collected. The amendments in this update are effective for annual periods beginning after December 15, 2019, including interim periods within those fiscal years. Early adoption is permitted as of the fiscal years beginning after December 15, 2018, including interim periods within those fiscal years. The modified-retrospective approach is generally applicable through a cumulative-effect adjustment to retained earnings as of the beginning of the first reporting period in which the guidance is effective. We are currently evaluating the effect this standard will have on our consolidated financial statements and related disclosures.
In August 2016, the FASB issued ASU No. 2016-15, Statement of Cash Flows (Topic 230): Classification of Certain Cash Receipts and Cash Payments. Update 2016-15 provides guidance on the presentation and classification of certain cash receipts and cash payments in the statement of cash flows. We adopted this update on January 1, 2018 resulting in no material impact to our consolidated statement of cash flows.
In October 2016, the FASB issued ASU No. 2016-16, Income Taxes (Topic 740):
Intra-Entity Transfers of Assets Other Than Inventory
. This update simplifies the accounting for the income tax consequences of transfers of assets from one unit of a corporation to another unit or subsidiary by eliminating an accounting exception that prevents the recognition of current and deferred income tax consequences for such “intra-entity transfers” until the assets have been sold to an outside party.
We adopted this update on January 1, 2018 and recognized the following balance sheet adjustments (in thousands):
|
Balance at December 31, 2017
|
Adjustment due to ASU No. 2016-16
|
Balance at January 1, 2018
|
||||||||||
|
Assets
|
||||||||||||
|
Prepaid expenses and other current assets
|
$
|
39,037
|
|
$
|
(12,604
|
)
|
$
|
26,433
|
|
|||
|
Deferred tax assets
|
11,559
|
|
58,301
|
|
69,860
|
|
||||||
|
Other assets
|
75,984
|
|
(68,127
|
)
|
7,857
|
|
||||||
|
Equity
|
||||||||||||
|
Accumulated deficit
|
$
|
(39,664
|
)
|
$
|
(22,516
|
)
|
$
|
(62,180
|
)
|
|||
In January 2017, the FASB issued ASU No. 2017-01, Business Combinations (Topic 805): Clarifying the Definition of a Business. This update clarifies when a set of assets and activities is a business. We adopted this update on January 1, 2018. The ImThera and TandemLife acquisitions were considered acquisitions of a business. Refer to “Note 4. Business Combinations” for a discussion of our acquisitions of ImThera and TandemLife.
In January 2017, the FASB issued ASU No. 2017-04, Intangibles-Goodwill and Other (Topic 350):
Simplifying the Test for Goodwill Impairment
. This update removes step 2 of the goodwill impairment test that compares the implied fair value of goodwill with its carrying amount. Instead, an impairment test is performed by comparing the fair value of a reporting unit with its carrying amount. An impairment charge will be recorded by the amount a reporting unit’s carrying amount exceeds its fair value. The update is effective for annual periods after December 15, 2019, including interim periods within those annual reporting periods with early adoption permitted.
In March 2017, the FASB issued ASU No. 2017-07, Compensation—Retirement Benefits
(Topic 715):
Improving the Presentation of Net Periodic Pension Cost and Net Periodic Post Retirement Benefit Cost
. This update requires that an employer report the service cost component in the same line item or items as other compensation costs arising from services rendered by the pertinent employees during the period. We adopted this update on January 1, 2018, resulting in an immaterial impact to our consolidated financial statements. The consolidated statements of income (loss) for the years ended
December 31, 2017
and December 31, 2016 have been recast for the adoption of this update.
In June 2018, the FASB issued ASU No. 2018-07, Compensation—Stock Compensation (Topic 718): Improvements to Nonemployee Share-Based Payment Accounting. This update simplifies the accounting for non-employee share-based payment transactions. The amendment specifies that Topic 718 applies to all share-based payment transactions in which a grantor acquires goods or services to be used or consumed in a grantor’s own operations by issuing share-based payment awards. The update is effective for annual periods after December 15, 2018, including interim periods within those annual reporting periods with early adoption permitted. We do not expect the adoption of this update to have a material effect on our consolidated financial statements.
In August 2018, the FASB issued ASU No. 2018-13, Fair Value Measurement (Topic 820): Changes to the Disclosure Requirements for Fair Value Measurement. This update removes, modifies and adds certain disclosure requirements related to fair value measurements. The update is effective for annual periods after December 15, 2019, including interim periods within
F-57
those annual reporting periods with early adoption permitted. We do not expect the adoption of this update to have a material effect on our consolidated financial statements.
In August 2018, the FASB issued ASU No. 2018-14, Compensation—Retirement Benefits—Defined Benefit Plans—General (Subtopic 715-20): Changes to the Disclosure Requirements for Defined Benefit Plans. This update adds and removes certain disclosure requirements related to defined benefit plans. The update is effective for annual periods after December 15, 2020, on a retrospective basis for all periods presented with early adoption permitted. We do not expect the adoption of this update to have a material effect on our consolidated financial statements.
In August 2018, the FASB issued ASU No. 2018-15, Intangibles—Goodwill and Other—Internal-Use Software (Subtopic 350-40): Customer’s Accounting for Implementation Costs Incurred in a Cloud Computing Arrangement That Is a Service Contract. This update clarifies and aligns the accounting for implementation costs for hosting arrangements with the requirements for capitalizing implementation costs incurred to develop or obtain internal-use software. This update is effective for annual periods after December 15, 2019, including interim periods within those annual reporting periods with early adoption permitted and should be applied either retrospectively or prospectively to all implementation costs incurred after the date of adoption. We do not expect the adoption of this update to have a material effect on our consolidated financial statements.
F-58
TABLE OF CONTENTS
Part IItem 1. BusinessNote 5. Discontinued OperationsItem 1A. Risk FactorsNote 13. Commitments and ContingenciesItem 1B. Unresolved Staff CommentsItem 2. PropertiesItem 3. Legal ProceedingsItem 4. Mine Safety DisclosuresPart IIItem 5. Market For Registrant S Common Equity, Related Stockholder Matters and Issuer Purchases Of Equity SecuritiesItem 6. Selected Financial DataItem 7. Management S Discussion and Analysis Of Financial Condition and Results Of OperationsNote 7. Product Remediation LiabilityNote 4. Business CombinationsNote 9. InvestmentsNote 19. Geographic and Segment InformationNote 6. RestructuringNote 2. Basis Of Presentation, Use Of Accounting Estimates and Significant Accounting PoliciesNote 22. New Accounting PronouncementsItem 7A. Quantitative and Qualitative Disclosures About Market RiskItem 8. Financial Statements and Supplementary DataItem 9. Changes in and Disagreements with Accountants on Accounting and Financial DisclosureItem 9A. Controls and ProceduresItem 9B. Other InformationPart IIIItem 10. Directors, Executive Officers and Corporate GovernanceItem 11. Executive CompensationItem 12. Security Ownership Of Certain Beneficial Owners and Management and Related Stockholder MattersItem 13. Certain Relationships and Related Transactions, and Director IndependenceItem 14. Principal Accounting Fees and ServicesPart IVItem 15. Exhibits, Financial Statement SchedulesItem 16. Form 10-k SummaryNote 1. Nature Of OperationsNote 3. Revenue RecognitionNote 10. Fair Value MeasurementsNote 8. Goodwill and Intangible AssetsNote 11. Financing ArrangementsNote 12. Derivatives and Risk ManagementNote 14. Stockholders EquityNote 15. Stock-based Incentive PlansNote 16. Employee Retirement PlansNote 17. Income TaxesNote 18. Net Income Per ShareNote 20. Supplemental Financial InformationNote 21. Quarterly Financial Information (unaudited)