LKQ CORP
10-Ks and 10-Qs
|
|
|
|
|
|
|
|
|
|
|
|
|
|
|
|
|
|
|
|
|
|
|
|
|
|
|
|
|
|
|
|
|
|
|
|
|
|
|
|
|
|
|
|
|
|
|
|
|
|
|
|
|
|
|
|
UNITED STATES
SECURITIES AND EXCHANGE COMMISSION
WASHINGTON, D.C. 20549
________________________________________
FORM 10-K
________________________________________
(Mark One)
|
x
|
ANNUAL REPORT PURSUANT TO SECTION 13 OR 15(d) OF THE SECURITIES EXCHANGE ACT OF 1934
|
For the fiscal year ended
December 31, 2017
OR
|
¨
|
TRANSITION REPORT PURSUANT TO SECTION 13 OR 15(d) OF THE SECURITIES EXCHANGE ACT OF 1934
|
Commission File Number: 000-50404
________________________________________
LKQ CORPORATION
(Exact name of registrant as specified in its charter)
________________________________________
|
Delaware
|
|
36-4215970
|
|
(State or other jurisdiction of
incorporation or organization)
|
|
(I.R.S. Employer
Identification Number)
|
|
500 West Madison Street,
Suite 2800, Chicago, IL
|
|
60661
|
|
(Address of principal executive offices)
|
|
(Zip Code)
|
Registrant’s telephone number, including area code: (312) 621-1950
Securities registered pursuant to Section 12(b) of the Act:
|
Title of Each Class
|
Name of each exchange on which registered
|
|
|
Common Stock, par value $.01 per share
|
NASDAQ Global Select Market
|
|
Securities registered pursuant to Section 12(g) of the Act: None
________________________________________
Indicate by check mark if the registrant is a well-known seasoned issuer, as defined in Rule 405 of the Securities Act. Yes
x
No
¨
Indicate by check mark if the registrant is not required to file reports pursuant to Section 13 or 15(d) of the Act. Yes
¨
No
x
Indicate by check mark whether the registrant: (1) has filed all reports required to be filed by Section 13 or 15(d) of the Securities Exchange Act of 1934 during the preceding 12 months (or for such shorter period that the registrant was required to file such reports), and (2) has been subject to such filing requirements for the past 90 days. Yes
x
No
¨
Indicate by check mark whether the registrant has submitted electronically and posted on its corporate Web site, if any, every Interactive Data File required to be submitted and posted pursuant to Rule 405 of Regulation S-T (§232.405 of this chapter) during the preceding 12 months (or for such shorter period that the registrant was required to submit and post such files). Yes
x
No
¨
Indicate by check mark if disclosure of delinquent filers pursuant to Item 405 of Regulation S-K (§229.405) is not contained herein, and will not be contained, to the best of registrant's knowledge, in definitive proxy or information statements incorporated by reference in Part III of this Form 10-K or any amendment to this Form 10-K.
¨
Indicate by check mark whether the registrant is a large accelerated filer, an accelerated filer, a non-accelerated filer, a smaller reporting company or an emerging growth company. See the definitions of “large accelerated filer,” “accelerated filer,” “smaller reporting company” and "emerging growth company" in Rule 12b-2 of the Exchange Act. (Check one):
|
Large accelerated filer
|
x
|
Accelerated filer
|
¨
|
|
Non-accelerated filer
|
¨
(Do not check if a smaller reporting company)
|
Smaller reporting company
|
¨
|
|
Emerging growth company
|
¨
|
||
If an emerging growth company, indicate by check mark if the registrant has elected not to use the extended transition period for complying with any new or revised financial accounting standards provided pursuant to Section 13(a) of the Exchange Act.
¨
Indicate by check mark whether the registrant is a shell company (as defined in Rule 12b-2 of the Exchange Act). Yes
¨
No
x
As of
June 30, 2017
, the aggregate market value of common stock outstanding held by stockholders who were not affiliates (as defined by regulations of the Securities and Exchange Commission) of the registrant was approximately
$10.1 billion
(based on the closing sale price on the NASDAQ Global Select Market on such date). The number of outstanding shares of the registrant's common stock as of
February 16, 2018
was
309,574,741
.
Documents Incorporated by Reference
Those sections or portions of the registrant's proxy statement for the Annual Meeting of Stockholders to be held on
May 7, 2018
, described in Part III hereof, are incorporated by reference in this report.
SPECIAL NOTE ON FORWARD-LOOKING STATEMENTS
Statements and information in this Annual Report on Form 10-K that are not historical are forward-looking statements within the meaning of the Private Securities Litigation Reform Act of 1995 and are made pursuant to the “safe harbor” provisions of such Act.
Forward-looking statements include, but are not limited to, statements regarding our outlook, guidance, expectations, beliefs, hopes, intentions and strategies. Words such as "may," "will," "plan," "should," "expect," "anticipate," "believe," "if," "estimate," "intend," "project" and similar words or expressions are used to identify these forward-looking statements. These statements are subject to a number of risks, uncertainties, assumptions and other factors including those identified below. All forward-looking statements are based on information available to us at the time the statements are made. We undertake no obligation to update any forward-looking statements, whether as a result of new information, future events or otherwise, except as required by law.
You should not place undue reliance on our forward-looking statements. Actual events or results may differ materially from those expressed or implied in the forward-looking statements. The risks and uncertainties that could cause actual results to differ from the results predicted or implied by our forward-looking statements include the following (not necessarily in order of importance):
|
•
|
changes in economic and political activity in the U.S. and other countries in which we are located or do business, including the U.K. withdrawal from the European Union, and the impact of these changes on our businesses, the demand for our products and our ability to obtain financing for operations;
|
|
•
|
increasing competition in the automotive parts industry (including the potential competitive advantage to OEMs with "connected car" technology);
|
|
•
|
fluctuations in the pricing of new original equipment manufacturer (“OEM”) replacement products;
|
|
•
|
changes in the level of acceptance and promotion of alternative automotive parts by insurance companies and auto repairers;
|
|
•
|
changes to our business relationships with insurance companies or changes by insurance companies to their business practices relating to the use of our products;
|
|
•
|
our ability to identify sufficient acquisition candidates at reasonable prices to maintain our growth objectives;
|
|
•
|
our ability to integrate, realize expected synergies, and successfully operate acquired companies and any companies acquired in the future, and the risks associated with these companies;
|
|
•
|
the implementation of a border tax or tariff on imports and the negative impact on our business due to the amount of inventory we import;
|
|
•
|
restrictions or prohibitions on selling certain aftermarket products to the extent OEMs seek and obtain more design patents than they have in the past and are successful in asserting infringement of these patents and defending their validity;
|
|
•
|
variations in the number of vehicles manufactured and sold, vehicle accident rates, miles driven, and the age profile of vehicles in accidents;
|
|
•
|
the increase of accident avoidance systems being installed in vehicles;
|
|
•
|
the potential loss of sales of certain mechanical parts due to the rise of electric vehicle sales;
|
|
•
|
fluctuations in the prices of fuel, scrap metal and other commodities;
|
|
•
|
changes in laws or regulations affecting our business;
|
|
•
|
higher costs and the resulting potential inability to service our customers to the extent that our suppliers decide to discontinue business relationships with us;
|
|
•
|
price increases, interruptions or disruptions to the supply of vehicle parts from aftermarket suppliers and vehicles from salvage auctions;
|
|
•
|
changes in the demand for our products and the supply of our inventory due to severity of weather and seasonality of weather patterns;
|
|
•
|
the risks associated with operating in foreign jurisdictions, including foreign laws and economic and political instabilities;
|
2
|
•
|
declines in the values of our assets;
|
|
•
|
additional unionization efforts, new collective bargaining agreements, and work stoppages;
|
|
•
|
our ability to develop and implement the operational and financial systems needed to manage our operations;
|
|
•
|
interruptions, outages or breaches of our operational systems, security systems, or infrastructure as a result of attacks on, or malfunctions of, our systems;
|
|
•
|
costs of complying with laws relating to the security of personal information;
|
|
•
|
product liability claims by the end users of our products or claims by other parties who we have promised to indemnify for product liability matters;
|
|
•
|
costs associated with recalls of the products we sell;
|
|
•
|
potential losses of our right to operate at key locations if we are not able to negotiate lease renewals;
|
|
•
|
inaccuracies in the data relating to our industry published by independent sources upon which we rely;
|
|
•
|
currency fluctuations in the U.S. dollar, pound sterling and euro versus other currencies;
|
|
•
|
our ability to obtain financing on acceptable terms to finance our growth;
|
|
•
|
our ability to satisfy our debt obligations and to operate within the limitations imposed by financing arrangements; and
|
|
•
|
changes to applicable U.S. and foreign tax laws, changes to interpretations of tax laws, and changes of our mix of earnings among the jurisdictions in which we operate.
|
Other matters set forth in this Annual Report may also cause our actual results to differ materially from our forward-looking statements, including the risk factors disclosed in Item 1A of this Annual Report.
Copies of our Annual Report on Form 10-K, Quarterly Reports on Form 10-Q, Current Reports on Form 8-K, and amendments to those reports filed or furnished pursuant to Section 13(a) or 15(d) of the Securities Exchange Act of 1934 are available free of charge through our website (www.lkqcorp.com) as soon as reasonably practicable after we electronically file the material with, or furnish it to, the Securities and Exchange Commission.
3
ITEM 1.
BUSINESS
OVERVIEW
LKQ Corporation ("LKQ" or the "Company") is a global distributor of vehicle products, including replacement parts, components, and systems used in the repair and maintenance of vehicles and specialty products and accessories to improve the performance, functionality and appearance of vehicles.
Buyers of vehicle replacement products have the option to purchase from primarily five sources: new products produced by original equipment manufacturers ("OEMs"); new products produced by companies other than the OEMs, which are referred to as aftermarket products; recycled products obtained from salvage vehicles; used products that have been refurbished; and used products that have been remanufactured. Collectively, we refer to the four sources that are not new OEM products as alternative parts. We distribute a variety of products to collision and mechanical repair shops, including aftermarket collision and mechanical products; recycled collision and mechanical products; refurbished collision products such as wheels, bumper covers and lights; and remanufactured engines and transmissions.
We are a leading provider of alternative vehicle collision replacement products and alternative vehicle mechanical replacement products, with our sales, processing, and distribution facilities reaching most major markets in the United States and Canada. We are also a leading provider of alternative vehicle replacement and maintenance products in the United Kingdom, the Benelux region (Belgium, Netherlands, and Luxembourg), Italy, Czech Republic, Switzerland and other Eastern European countries. In addition to our wholesale operations, we operate self service retail facilities across the U.S. that sell recycled automotive products from end-of-life vehicles. We are also a leading distributor of specialty vehicle aftermarket equipment and accessories reaching most major markets in the U.S. and Canada.
We are organized into four operating segments: Wholesale - North America, Europe, Specialty, and Self Service. We aggregate our Wholesale - North America and Self Service operating segments into one reportable segment, North America, resulting in three reportable segments: North America, Europe and Specialty. See Note 14, "Segment and Geographic Information" to the consolidated financial statements in Part II, Item 8 of this Annual Report on Form 10-K for financial information by reportable segment and by geographic region.
HISTORY
We were initially formed in 1998 through the combination of a number of wholesale recycled products businesses located in Florida, Michigan, Ohio and Wisconsin. We subsequently expanded through internal development and approximately 260 acquisitions of aftermarket, recycled, refurbished, and remanufactured product suppliers and manufacturers; self service retail businesses; and specialty vehicle aftermarket equipment and accessories suppliers. Our most significant acquisitions include:
|
•
|
2007 acquisition of Keystone Automotive Industries, Inc., which, at the time of acquisition, was the leading domestic distributor of aftermarket products, including collision replacement products, paint products, refurbished steel bumpers, bumper covers and alloy wheels.
|
|
•
|
2011 acquisition of Euro Car Parts Holdings Limited ("ECP"), a vehicle mechanical aftermarket parts distribution company operating in the United Kingdom. This acquisition served as our entrance into the European automotive aftermarket business, from which we have expanded our European footprint through organic growth and subsequent acquisitions.
|
|
•
|
2013 acquisition of Sator Beheer B.V. ("Sator"), a vehicle mechanical aftermarket parts distribution company based in the Netherlands, with operations in the Netherlands, Belgium and Northern France. This acquisition allowed us to further expand our geographic presence into continental Europe.
|
|
•
|
2014 acquisition of Keystone Automotive Holdings, Inc. (“Keystone Specialty”), which expanded our product offering and increased our addressable market to include specialty vehicle aftermarket equipment and accessories.
|
|
•
|
2016 acquisition of Rhiag-Inter Auto Parts Italia S.p.A. (“Rhiag”), a distributor of aftermarket spare parts for passenger cars and commercial vehicles in Italy, Czech Republic, Slovakia, Switzerland, Hungary, Romania, Ukraine, Bulgaria, Poland and Spain. This acquisition expanded our geographic presence in continental Europe.
|
|
•
|
On December 11, 2017, we announced that we have signed a definitive agreement to acquire Stahlgruber GmbH (“Stahlgruber”) from Stahlgruber Otto Gruber AG. Stahlgruber is a leading European wholesale distributor of aftermarket spare parts for passenger cars, tools, capital equipment and accessories with operations in Germany, Austria, Czech Republic, Italy, Slovenia, and Croatia with further sales to Switzerland. This acquisition will expand our geographic presence in continental Europe as we continue to expand our Pan-European distribution network. The transaction is expected to be completed in the first half of 2018 and is subject to regulatory approvals.
|
4
Further information regarding our recent acquisitions is included in Note 2, "Business Combinations" to the consolidated financial statements in Part II, Item 8 of this Annual Report on Form 10-K.
STRATEGY
Our mission is to be the leading global value-added distributor of vehicle parts and accessories by offering our customers the most comprehensive, available and cost-effective selection of part solutions while building strong partnerships with our employees and the communities in which we operate.
We have four primary pillars of a strategy to build economic value: growth through diversified product offerings; growth through geographic expansion; adaptation to evolving technology; and rationalization of our asset base to enhance margins and return of capital. We believe our supply network, with a broad inventory of quality alternative collision and mechanical repair products and specialty vehicle aftermarket products, high fulfillment rates, and superior customer service, provides us with a competitive advantage. To execute our strategy, we are focused on a number of key areas, including:
|
•
|
Extensive in-place network.
We have invested significant capital to develop a network of alternative and specialty vehicle parts facilities across our operating segments. Additionally, our ability to move inventory throughout our distribution networks increases the availability of our products and helps us to fill a relatively high percentage of our customers’ requests. In order to expand our distribution network, we will continue to seek to enter new markets and to improve penetration through both organic development and acquisitions. We will continue to seek opportunities to leverage the distribution network by delivering more parts through our existing network in our North America and Specialty operations. We believe our North America segment has the largest distribution network of alternative vehicle parts and accessories in the U.S. and Canada. In our Europe segment, we are implementing a strategy similar to our North America operations by establishing a Pan-European distribution network. We currently have operations in 18 different European countries, which we believe represents the broadest and largest footprint in the aftermarket industry in Europe. On a global basis, we have approximately 1,500 locations as part of our distribution network.
|
|
•
|
Acquisitions.
We have focused on growth through acquisitions both domestically and abroad. The primary objective of our acquisitions is to expand our presence to new or adjacent geographic markets and to expand into other product lines and businesses that may benefit from our operating strengths, in each case with the aim of increasing the size of our addressable market. When we identify potential acquisitions, we attempt to target companies with a leading market presence, an experienced management team and workforce that provide a fit with our existing operations, and strong cash flows. After completing an acquisition, we focus on integrating the company with our existing business to provide additional value to the combined entity through cost savings and synergies, such as logistics cost synergies resulting from integration with our existing distribution network, administrative cost savings, shared procurement, and cross-selling opportunities.
|
|
•
|
Strong business relationships.
We have developed business relationships with key constituents, including automobile insurance companies, suppliers and other industry participants in North America and Europe.
|
|
•
|
Broad product offering.
The breadth and depth of our inventory across all of our operating segments reinforces our ability to provide a “one-stop” solution for our customers’ alternative vehicle replacement, maintenance, and specialty vehicle product needs.
|
|
•
|
High fulfillment rates.
We manage local inventory levels to improve delivery and maximize customer service. Improving local order fulfillment rates reduces transfer costs and delivery times, and improves customer satisfaction.
|
|
•
|
Technology driven business processes.
We focus on technology development as a way to support our competitive advantage. We believe that we can more cost effectively leverage our data to make better business decisions than our smaller competitors.
|
|
•
|
Adaptation to evolving technology in the automotive industry.
We are committed to monitoring and adapting our business to the technological changes in the automotive industry. We have recently established a strategy and innovation team that will help us to be more forward-looking and to assess the potential opportunities and risks associated with several areas including, but not limited to, e-commerce, accident avoidance systems, autonomous vehicles, electric vehicles and ride-sharing trends.
|
NORTH AMERICA SEGMENT
Our North America segment is composed of wholesale operations, which consists of aftermarket and salvage operations, and self service retail operations.
5
Wholesale Operations
Inventory
Our wholesale operations in North America sell all five product types (aftermarket, recycled, remanufactured, refurbished and, to a lesser extent, OEM parts) to professional collision and mechanical automobile repair businesses. Our principal aftermarket product types consist of those most frequently damaged in collisions, including bumper covers, automotive body panels, lights and automotive glass products such as windshields. Platinum Plus is our exclusive product line offered under the Keystone brand of aftermarket products. Certain of our products are certified by independent organizations such as the Certified Automotive Parts Association (“CAPA”) and NSF International (“NSF”). CAPA and NSF are associations that evaluate the quality of aftermarket collision replacement products compared to OEM collision replacement products. We also developed a product line called "Value Line" for more value conscious, often self-pay, consumers. Our salvage products include both mechanical and collision parts, including engines; transmissions; door assemblies; sheet metal products such as trunk lids, fenders and hoods; lights; and bumper assemblies.
The aftermarket products we distribute are purchased from independent manufacturers and distributors located primarily in the U.S., Taiwan, and China. In 2017, approximately 39% of our aftermarket purchases were made from our top four vendors, with our largest vendor providing approximately 16% of our annual inventory purchases. We believe we are one of the largest customers of each of these suppliers. Outside of this group, no other supplier provided more than 5% of our supply of aftermarket products in 2017. We purchased approximately 48% of our aftermarket products in 2017 directly from manufacturers in Taiwan and other Asian countries. Approximately 49% of our aftermarket products were purchased from vendors located in the U.S.; however, we believe the majority of these products were manufactured in Taiwan, Mexico or other foreign countries.
Within our wholesale operations, we focus our procurement on products that are in the most demand, based on a number of factors such as historical sales records of vehicles by model and year, customer requests, projections of future supply and demand trends. Because lead times may take 40 days or more on imported aftermarket products, sales volumes and in-stock inventory are important factors in the procurement process.
In our aftermarket operations, we use a third party enterprise management system and other third party software packages to leverage the centralized data and information that a single system provides, such as a data warehouse to conduct enhanced analytics and reporting, an integrated budgeting system, an electronic data interchange tool, and E-commerce tools to enhance our online business-to-business initiatives - OrderKeystone.com and Keyless.
We procure recycled products for our wholesale operations by acquiring total loss vehicles, typically sold at regional salvage auctions, and then dismantling and inventorying the parts. The availability and pricing of the salvage vehicles we procure for our wholesale recycled products operations may be impacted by a variety of factors, including the production level of new vehicles and the portion of damaged vehicles declared total losses. Our bidding specialists are equipped with a proprietary software application that allows them to compare the vehicles at salvage auctions against our current inventory levels, historical demand, and recent average selling prices to arrive at an estimated maximum bid.
Our wholesale recycled product locations in North America operate an internally-developed, proprietary enterprise management system called LKQX. We believe that the use of a single system across all of our wholesale recycled product operations helps facilitate the sales process; allows for continued implementation of standard operating procedures; and yields improved training efficiency, employee transferability, access to our national inventory database, management reporting and data storage. The system also supports an electronic exchange process for identifying and locating parts at other select recyclers and facilitates brokered sales to fill customer orders for items not in stock.
Scrap and Other Materials
Our salvage operations generate scrap metal and other materials that we sell to metals recyclers. Vehicles that have been dismantled for recycled products and "crush only" end-of-life vehicles acquired from other companies are typically crushed using equipment on site. In other cases, we will hire mobile crushing equipment to crush the vehicles before they are transported to shredders and scrap metal processors. Damaged and unusable wheel cores are melted in our aluminum furnace and sold to consumers of aluminum ingot and sow for the production of various automotive products, including wheels. We also extract and sell the precious metals contained in certain of our recycled parts such as catalytic converters.
Customers
We sell our products to wholesale customers that include collision and mechanical repair shops and new and used car dealerships, as well as to retail customers. The majority of these customers tend to be individually-owned small businesses, although the number of independent and dealer-operated collision repair facilities has declined over the last decade, as regional or national multiple-location operators have increased their geographic presence through acquisitions.
6
Automobile insurance companies affect the demand for our collision products; while insurance companies do not pay for our products directly, they ultimately pay for the repair costs of insured vehicles in excess of any deductible amount. As a result, insurance companies often influence the types of products used in a repair. The use of our products provides a direct benefit to insurance companies by lowering the cost of repairs, decreasing the time required to return the repaired vehicle to the customer, and providing a replacement product that is of high quality and comparable performance to the part replaced.
Our sales personnel are encouraged to promote LKQ to customers as a “one-stop shop” by offering comparable options from our other product lines if the desired part is not in stock. To support these efforts, we have provided our sales staff with access to both recycled and aftermarket sales systems, and we have developed sales incentive programs that encourage cross selling throughout our wholesale operations.
To better serve our customers, we take a consolidated approach for the electronic sale of wholesale products in our North America segment. A full suite of E-commerce services is available to approved partners that helps us improve order accuracy, reduce return rate and better fit our customer workflow. Using these services in coordination with our partners, products can be searched, priced and ordered without leaving the customers' own operating systems.
Distribution
We have a distribution network of warehouses and cross dock facilities, which allows us to develop and maintain our service levels with local repair shops while providing fulfillment rates that are made possible by our nationwide presence. Our delivery fleet utilizes a third party software provider to optimize delivery routes, and to track the progress of delivery vehicles throughout their runs. Our local presence allows us to provide daily deliveries as required by our customers, using drivers who routinely deliver to the same customers. Our sales force and local delivery drivers develop and maintain critical personal relationships with the local repair shops that benefit from access to our wide selection of products, which we are able to offer as a result of our regional inventory network. We operate a delivery fleet of medium-sized trucks and smaller trucks and vans, which deliver multiple product types on the same delivery routes to help minimize distribution costs and improve customer service.
Competition
We consider all suppliers of vehicle collision and mechanical products to be competitors, including aftermarket suppliers, recycling businesses, refurbishing operations, parts remanufacturers, OEMs and internet-based suppliers. We compete with alternative parts distributors on the basis of our nationwide distribution system, our product lines and inventory availability, customer service, our relationships with insurance companies, and to a lesser extent, price; we compete with OEMs primarily on the basis of price and, to a lesser extent, on service and product quality. We do not consider retail chains that focus on the do-it-yourself market to be our direct competitors
since many of our wholesale product sales are paid for by insurance companies rather than the end user, and there is limited overlap in the products that we sell.
Self Service Operations
Our self service retail operations, most of which operate under the name “LKQ Pick Your Part,” allow consumers to come directly to the yard to pick parts off of end-of-life vehicles. In addition to revenue from the sale of parts, core, and scrap, we charge a nominal admission fee to access the property.
Inventory
We acquire inventory for our self service retail product operations from a variety of sources, including but not limited to towing companies, auctions, the general public, municipality sales, insurance carriers, and charitable organizations. We typically procure salvage vehicles that are more than seven model years old for our self service retail product operations; these vehicles are generally older and of lower price than the salvage vehicles we purchase for our wholesale recycled product operations. Vehicles are delivered to our locations by the seller, or we arrange for transportation. Once on our property, minimal labor is required to process the vehicle other than removing the battery, fluids, refrigerants, catalytic converters and hazardous materials. The extracted fluids are stored in bulk and subsequently sold to recyclers; in the case of gasoline, the fuel retrieved is primarily used to power our delivery vehicles. Vehicles are then placed in the yard for customers to remove parts. In our self service business, availability of a specific part will depend on which vehicles are currently at the site and to what extent parts may have been previously sold. We usually keep a vehicle at our facility for 30 to 120 days, depending on the capacity of the yard and size of the market, before it is crushed and sold to scrap metal processors.
Scrap and Other Materials
Our self service operations generate scrap metal, alloys and other materials that we sell to recyclers. Vehicles that we no longer make available to the public and "crush only" vehicles acquired from other companies are typically crushed using equipment on site. Damaged and unusable wheel cores are melted in our aluminum furnace and sold to consumers of aluminum
7
ingot and sow for the production of various automotive products, including wheels. We also extract and sell the precious metals contained in certain of our recycled parts such as catalytic converters.
Customers
The customers of our self service yards are frequently do-it-yourself mechanics, small independent repair shops servicing older vehicles, auto rebuilders, and resellers. The scrap from the vehicle hulks, when not processed by us, is sold to metals recyclers, with whom we may also compete when procuring salvage vehicles for our operations.
Competition
There are competitors operating self service businesses in all of the markets in which we operate. In some markets, there are numerous competitors, often operating in close proximity to our operations. We try to differentiate our business by the quality of the inventory and the size and cleanliness of the property. We do not consider retail chains that focus on the do-it-yourself market to be our direct competitors, as there is limited overlap in the products that we sell.
EUROPE SEGMENT
The Europe segment was built on three key acquisitions: ECP (2011), Sator (2013) and Rhiag (2016). Our European strategy is to target platform acquisitions to cover the broad markets initially, then integrate these businesses with our existing operations, and subsequently expand our footprint in these regions through new branch openings and smaller tuck-in acquisitions with the goal of eventually attaining continent-wide coverage. Our acquisitions provide a platform to capitalize on the large and fragmented aftermarket mechanical replacement parts market in Europe, and allow for potential cost savings from the leveraging of our combined purchasing power given the significant overlap in suppliers and product mix. Our pending acquisition of Stahlgruber will further enhance our Pan-European platform, including the creation of future opportunities for logistics and infrastructure optimization. In 2014, we expanded our European segment to include wholesale recycling operations through our acquisition of a business with salvage and vehicle repair facilities in Sweden and Norway. In addition to expanding our geographic presence in Europe, we believe these acquisitions provide us with the opportunity to leverage our experience in operating salvage facilities in a new market and to expand our aftermarket operations to include these countries. In 2016, we acquired an equity investment in Mekonomen AB ("Mekonomen"), the leading independent car parts and service chain in the Nordic region of Europe. Mekonomen is independent of our existing European operations, but we are exploring areas where the companies can work together in a mutually beneficial manner. We have acquired many smaller businesses within these regions and over time, we anticipate further integration of our European operations as we optimize purchasing, warehousing, cataloging, logistics and back-office functions, and align our private label brands across the segment.
Inventory
Our inventory is primarily composed of mechanical aftermarket parts for the repair of vehicles 3 to 15 years old. Our top selling products include brake pads; discs and sensors; clutches; electrical products such as spark plugs and batteries; steering and suspension products; filters; and oil and automotive fluids. In addition to mechanical aftermarket parts, we also sell collision parts in our Europe operations, although these sales represent less than 3% of segment revenue. We believe the historically low alternative collision parts usage percentage in Europe provides an opportunity for us in this segment, particularly as insurance companies look to lower their costs.
In 2017, our top five suppliers represented 22% of our aftermarket inventory purchases, with our top two suppliers each representing approximately 7% of our purchases. No other suppliers comprised more than 5% of our purchases during 2017. The aftermarket products we distribute are purchased from vendors located primarily in the U.K. and continental Europe. In 2017, we purchased 92% of our products from companies in Europe. The remaining 8% of our 2017 purchases were sourced from vendors located primarily in China or Taiwan, some of which also supply collision parts for our Wholesale - North America operations. In 2017, 55%, 31%, and 7% of our total inventory purchases were made in Euros, Pounds Sterling, and U.S. Dollars, respectively.
Our aftermarket operations in Europe use various IT systems, some of which are linked to transfer data between systems, to manage customer orders and inventory movement, and for financial reporting purposes. Certain of our IT systems can interface with our repair shop customers' respective IT systems, which enables them to identify the part required for the repair. We are evaluating our existing European systems to determine the optimal long-term strategy, which we believe will include reducing the number of systems we operate.
In our Nordic operations, we purchase severely damaged or totaled vehicles from insurance companies, which are transferred to our dismantling facilities or sold to other third party dismantlers.
Customers
We primarily operate under a two-step (i.e. direct sales to customers) distribution model in Europe, although certain of our operations, such as Italy and Switzerland, operate under a three-step (i.e. sales to distributors who in turn sell to customers)
8
distribution model. In our two-step operations, we sell the majority of our products to commercial customers primarily consisting of professional repairers, including both independent mechanical repair shops and collision repair shops. In our three-step operations, we sell products to wholesale distributors or jobbers. In addition to our sales to repair shops and wholesale distributors, we generate a portion of our revenue through sales to retail customers from ECP’s e-commerce platform and from counter sales at the branch locations.
Distribution
Our European operations employ a distribution model in which inventory is stored at regional distribution centers or hubs, with fast moving product stored at branch locations or at local warehouse distributors (for some of our Netherlands, Italy, and Czech Republic operations) for timely delivery to the repair shop customers. Product is moved through the distribution network on our vans or via common carrier. In our U.K. operations, we also sometimes employ a third party motorcycle fleet to deliver parts from our branch locations to nearby repair shop customers.
In the U.K., we expanded our distribution capabilities by building a new national distribution center in Tamworth, which was completed in 2017.
Competition
We view all suppliers of replacement repair products as our competitors, including other alternative parts suppliers and OEMs and their dealer networks. While we compete with all alternative parts suppliers, there are few with national distribution networks like ours that can reach the majority of repair shop customers within the required delivery time in their respective markets. We believe we have been able to distinguish ourselves from other alternative parts suppliers primarily through our distribution network, efficient stock management systems and proprietary technology which allows us to deliver our products quickly, as well as through our product lines and inventory availability, pricing, and service. We compete with OEMs primarily on the basis of price, service and availability.
SPECIALTY SEGMENT
Our Specialty operating segment was formed in 2014 with our acquisition of Keystone Specialty, a leading distributor and marketer of specialty vehicle aftermarket products and accessories in North America. Our Specialty operations reach most major markets in the U.S. and Canada and serves the following six product segments: truck and off-road; speed and performance; RV; towing; wheels, tires and performance handling; and miscellaneous accessories. In November 2017, we acquired Warn Industries, Inc. ("Warn"), a leading designer, manufacturer and marketer of high performance vehicle equipment and accessories. We expect the acquisition of Warn to expand our presence in the specialty market and create viable points of entry into related markets.
Inventory
The specialty vehicle aftermarket equipment and accessories we distribute and raw materials for products we manufacture are purchased from suppliers located primarily in the U.S., Canada, and China. Our top selling products are RV appliances & air conditioners, towing hitches, truck bed covers, vehicle protection products, cargo management products, and wheels, tires & suspension products. Specialty aftermarket suppliers are typically small to medium-sized, independent businesses that focus on a narrow product or market niche. Due to the highly fragmented supplier base for specialty vehicle aftermarket products, we have limited supplier concentration. In 2017, approximately 26% of our specialty vehicle aftermarket purchases were made from our top five suppliers, with our largest vendor providing approximately 10% of our annual inventory purchases. No other suppliers comprised more than 5% of our purchases during 2017. With our November 2017 acquisition of Warn, we have internal manufacturing capabilities to source aftermarket winches, hoists, and bumpers.
Our Specialty operations utilize an internally developed inventory management and order entry system that interfaces with third party software systems for accounting, transaction processing, data analytics, and reporting.
Customers
Overall, the specialty vehicle aftermarket parts and accessories market contains a fragmented customer base composed of RV and specialty automotive dealers, installers, jobbers, builders, parts chains, and mail-order businesses. Our customers are principally small, independent businesses. These customers depend on us to provide a broad range of products, rapid delivery, marketing support and technical assistance. In addition to traditional customers, in recent years we have increased sales to several large parts and accessory online retailers. Our Specialty segment also operates retail stores in northeast Pennsylvania.
We promote our products to customers through marketing programs, which include: catalogs, advertising, sponsorships and promotional activities; product level marketing and merchandising support; and online initiatives. Our national footprint allows us to stage trade shows across the U.S., which provide an opportunity to improve sales through the showcasing of new and innovative products from our vendors to our customers.
9
Online sales of our Specialty products take place through our ekeystone.com and viantp.com sites. These sites provide customers (i) the ability to match products with the make and model of car thus allowing the customer to order the right part, (ii) the product information (e.g. pictures, attributes) available for review and (iii) the convenience of searching inventory availability and ordering the product on the site. Additionally, the site can provide sales opportunities by suggesting other parts to purchase based on an inquiry submitted by the customer.
Distribution
Our Specialty segment operations employ a hub-and-spoke distribution model which enables us to transport products from our primary distribution centers to our non-inventory stocking cross docks, a majority of which are co-located with our North America wholesale operations and provide distribution points to key regional markets and synergies with our existing infrastructure. We believe this provides added value to our customers through a broader product offering and more efficient distribution process. We use our delivery routes to provide multi-day per week delivery and returns of our products directly to and from our customers in all 48 continental U.S. states and 9 Canadian provinces, and we ship globally to customers in other countries. Our delivery fleet utilizes a third party software provider to optimize delivery routes, and to track the progress of delivery vehicles throughout their runs.
Competition
Industry participants have a variety of supply choices. Vendors can deliver products to market via warehouse distributors and mail order catalog businesses, or directly to retailers and/or consumers. We view all suppliers of specialty vehicle aftermarket equipment and accessories as our competitors. While we compete with all specialty vehicle aftermarket parts suppliers, there are few with national distribution networks like LKQ’s that can reach the majority of customers within the optimum delivery time. We believe we have been able to distinguish ourselves from other specialty vehicle aftermarket parts and equipment suppliers primarily through our broad product selection, which encompasses both popular and hard-to-find products, our distribution network, and efficient inventory management systems, as well as through our service. We compete on the basis of product breadth and depth, rapid and dependable delivery, marketing initiatives, support services, and price.
INTELLECTUAL PROPERTY
We own various trade names and trademarks as a result of past acquisitions. In addition to acquired trade names and trademarks, we also have technology-based intellectual property that has been both internally developed and obtained through license agreements. We do not believe that our business is materially dependent on any single or group of related trademarks, licenses or registrations, nor would the expiration of any particular intellectual property right or termination of any particular intellectual property license agreement materially affect our business.
EMPLOYEES
As of December 31, 2017, we employed approximately 43,000 persons, of which approximately 22,000 were employed in North America and approximately 21,000 were employed outside of North America. Of our employees in North America, approximately 1,200 were represented by unions. Outside of North America, we have government-mandated collective bargaining agreements and union contracts in certain countries, particularly in Europe where many of our employees are represented by unions and/or works councils. We consider our employee relations to be good.
FACILITIES
As of December 31, 2017, our operations included approximately 1,500 facilities, most of which are leased. Of our total facilities, approximately 550 facilities were located in the U.S. and approximately 950 facilities were located in 24 other countries. Many of our locations stock multiple product types or serve more than one function.
Our corporate headquarters are located at 500 West Madison Street, Chicago, Illinois 60661. We operate a field support center in Nashville, Tennessee that performs certain centralized functions for our North American operations, including accounting, procurement, and information systems support; in 2017, we announced our plans to expand the size of our field support center via construction of a new 100,000 square foot facility in Nashville. Our Specialty operations maintain primary procurement, accounting and finance functions in Exeter, Pennsylvania. Certain back-office support functions for our segments are performed in Bangalore, India. Our European operations maintain procurement, accounting, and finance functions in Wembley, outside of London, England and Tamworth, England; in Schiedam, the Netherlands; in Milan, Italy; and in Prague, Czech Republic. In addition to these offices, we have two national distribution centers in Tamworth totaling 1 million and 500,000 square feet, which house inventory to supply the hubs and branches of our U.K. operations. Additionally, we operate an aftermarket parts warehouse in Taiwan to aggregate inventory for shipment to our locations in North America.
10
REGULATION
Our operations and properties are subject to laws and regulations relating to the protection of the environment in the U.S. and the other countries in which we operate. See the risk factor “We are subject to environmental regulations and incur costs relating to environmental matters” in Part I, Item 1A of this Annual Report on Form 10-K for further information regarding the effects of environmental laws and regulations on us.
SEASONALITY
Our operating results are subject to quarterly variations based on a variety of factors, influenced primarily by seasonal changes in weather patterns. During the winter months, we tend to have higher demand for our vehicle replacement products because there are more weather related repairs. Our specialty vehicle operations typically generate greater revenue and earnings in the first half of the year, when vehicle owners tend to install this equipment. Our aftermarket glass operations typically generate greater revenue and earnings in the second and third quarters, when the demand for glass replacements increases after the winter weather.
Our operating results and financial condition have been and could continue to be adversely affected by the economic and political conditions in the U.S. and elsewhere.
Changes in economic and political conditions in the U.S., Europe and other countries in which we are located or do business could have a material effect on our company. Changes in such conditions have, in some periods, resulted in fewer miles driven, fewer accident claims, and a reduction of vehicle repairs, all of which could negatively affect our business. The number and types of new vehicles produced and sold by manufacturers affects our business. A decrease in the number of vehicles on the road results in a decrease in repairs.
Our sales are also impacted by changes to the economic health of vehicle owners. The economic health of vehicle owners is affected by many factors, including, among others, general business conditions, interest rates, inflation, consumer debt levels, the availability of consumer credit, taxation, fuel prices, unemployment trends and other matters that influence consumer confidence and spending. Many of these factors are outside of our control. If any of these conditions worsen, our business, results of operations, financial condition and cash flows could be adversely affected.
In addition, economic conditions, including decreased access to credit, may result in financial difficulties leading to restructurings, bankruptcies, liquidations and other unfavorable events for our customers, suppliers, logistics and other service providers and financial institutions that are counterparties to our credit facilities and hedge transactions. These unfavorable events affecting our business partners could have an adverse effect on our business, results of operations, financial condition and cash flows.
We have a substantial business presence in Europe, including a significant presence in the United Kingdom. In June 2016, voters in the United Kingdom decided by referendum to withdraw from the European Union. The precise timing and impacts of this action on our businesses in the United Kingdom and other parts of Europe are unknown at this time. Since the vote, we have seen fluctuations in exchange rates leading to pricing pressures and unfavorable translation effects on our sterling denominated earnings. As the details of the United Kingdom’s withdrawal from the European Union are negotiated and implemented, our European businesses could be adversely affected as a result of further fluctuations in exchange rates, disruptions to access to markets by United Kingdom companies, interruptions of the movement of goods and services between countries, a decrease of economic activity in Europe, and political or social unrest.
We face intense competition from local, national, international, and internet-based vehicle products providers, and this competition could negatively affect our business.
The vehicle replacement products industry is highly competitive and is served by numerous suppliers of OEM, recycled, aftermarket, refurbished and remanufactured products. Within each of these categories of suppliers, there are local owner-operated companies, larger regional suppliers, national and international providers, and internet-based suppliers and distributors. Providers of vehicle replacement products that have traditionally sold only certain categories of such products may decide to expand their product offerings into other categories of vehicle replacement products, which may further increase competition. Some of our current and potential competitors may have more operational expertise; greater financial, technical, manufacturing, distribution, and other resources; longer operating histories; lower cost structures; and better relationships in the insurance and vehicle repair industries or with consumers, than we do.
In certain regions of the U.S., local vehicle recycling companies have formed cooperative efforts to compete in the wholesale recycled products industry. Similarly, in Europe, some local companies are part of cooperative efforts to compete in the aftermarket parts industry. As a result of these factors, our competitors may be able to provide products that we are unable to supply, provide their products at lower costs, or supply products to customers that we are unable to serve.
11
We believe that a majority of collision parts by dollar amount are supplied by OEMs, with the balance being supplied by distributors of alternative aftermarket, recycled, refurbished and remanufactured collision parts like us. The OEMs are therefore able to exert pricing pressure in the marketplace. We compete with the OEMs primarily on price and to a lesser extent on service and quality. From time to time, the OEMs have implemented programs seeking to increase their market share in the collision repair parts industry. For example, they have reduced prices on specific products to match the lower prices of alternative products and introduced other rebate programs that may disrupt our sales. The growth of these programs or the introduction of new ones could have a material adverse impact on our business.
In addition, vehicles are being equipped with systems that transmit data to the OEMs wirelessly regarding, among other items, accident incidents, maintenance requirements, location of the vehicle, identification of the closest dealership, and other statistics about the vehicle and its driving history. To the extent that this data is not shared with alternative suppliers, the OEMs will have an advantage with respect to such matters as contacting the vehicle driver, recommending repairs and maintenance, and directing the vehicle owner to an affiliated dealership.
We rely upon our customers and insurance companies to promote the usage of alternative parts.
Our success depends, in part, on the acceptance and promotion of alternative collision parts usage by automotive insurance companies. There can be no assurance that current levels of alternative parts usage will be maintained or will increase in the future.
We also rely on business relationships with insurance companies. These insurance companies encourage vehicle repair facilities to use products we provide. The business relationships include in some cases participation in aftermarket quality and service assurance programs that may result in a higher usage of our aftermarket products than would be the case without the programs. Our arrangements with these companies may be terminated by them at any time, including in connection with their own business concerns relating to the offering, availability, standards or operations of the aftermarket quality and service assurance programs. We rely on these relationships for sales to some collision repair shops, and a termination of these relationships may result in a loss of sales, which could adversely affect our results of operations.
In an Illinois lawsuit involving State Farm Mutual Automobile Insurance Company ("Avery v. State Farm"), a jury decided in October 1999 that State Farm breached certain insurance contracts with its policyholders by using non-OEM replacement products to repair damaged vehicles when use of such products did not restore the vehicle to its "pre-loss condition." The jury found that State Farm misled its customers by not disclosing the use of non-OEM replacement products and the alleged inferiority of those products. The jury assessed damages against State Farm of $456 million, and the judge assessed an additional $730 million of disgorgement and punitive damages for violations of the Illinois Consumer Fraud Act. In April 2001, the Illinois Appellate Court upheld the verdict but reduced the damage award by $130 million because of duplicative damage awards. On August 18, 2005, the Illinois Supreme Court reversed the awards made by the circuit court and found, among other things, that the plaintiffs had failed to establish any breach of contract by State Farm. The U.S. Supreme Court declined to hear an appeal of this case. As a result of this case, some insurance companies reduced or eliminated their use of aftermarket products. Our financial results could be adversely affected if insurance companies modified or terminated the arrangements pursuant to which repair shops buy aftermarket or recycled products from us due to a fear of similar claims.
In addition, to the extent that the collision repair industry continues to consolidate, the buying power of collision repair shop customers may further increase, putting additional pressure on our financial returns.
We may not be able to successfully acquire new businesses or integrate acquisitions, which could cause our business to suffer.
We may not be able to successfully complete potential strategic acquisitions if we cannot reach agreement on acceptable terms, if we do not obtain required antitrust or other regulatory approvals, or for other reasons. Moreover, we may not be able to identify a sufficient number of acquisition candidates at reasonable prices to maintain our growth objectives. Also, over time, we will likely seek to make acquisitions that are relatively larger. Larger acquisition candidates may attract additional competitive buyers, which could increase our cost or could cause us to lose such acquisitions.
If we buy a company or a division of a company, we may experience difficulty integrating that company's or division's personnel and operations, which could negatively affect our operating results. In addition:
|
•
|
the key personnel of the acquired company may decide not to work for us;
|
|
•
|
customers of the acquired company may decide not to purchase products from us;
|
|
•
|
suppliers of the acquired company may decide not to sell products to us;
|
|
•
|
we may experience business disruptions as a result of information technology systems conversions;
|
|
•
|
we may experience additional financial and accounting challenges and complexities in areas such as tax planning, treasury management, and financial reporting;
|
12
|
•
|
we may be held liable for environmental, tax or other risks and liabilities as a result of our acquisitions, some of which we may not have discovered during our due diligence;
|
|
•
|
we may intentionally assume the liabilities of the companies we acquire, which could result in material adverse effects on our business;
|
|
•
|
our existing business may be disrupted or receive insufficient management attention;
|
|
•
|
we may not be able to realize the cost savings or other financial benefits we anticipated, either in the amount or in the time frame that we expect; and
|
|
•
|
we may incur debt or issue equity securities to pay for any future acquisition, the issuance of which could involve the imposition of restrictive covenants or be dilutive to our existing stockholders.
|
Claims by OEMs relating to aftermarket products could adversely affect our business.
OEMs and other manufacturers have attempted to use claims of intellectual property infringement against manufacturers and distributors of aftermarket products to restrict or eliminate the sale of aftermarket products that are the subject of the claims. The OEMs have brought such claims in federal court and with the U.S. International Trade Commission.
To the extent OEMs and other manufacturers are seeking and obtaining more design patents than they have in the past and are successful in asserting infringement of these patents and defending their validity, we could be restricted or prohibited from selling certain aftermarket products, which could have an adverse effect on our business. We will likely incur significant expenses investigating and defending intellectual property infringement claims. In addition, aftermarket products certifying organizations may revoke the certification of parts that are the subject of the claims. Lack of certification may negatively impact us because many major insurance companies recommend or require the use of aftermarket products only if they have been certified by an independent certifying organization.
In December 2005 and May 2008, Ford Global Technologies, LLC filed complaints with the International Trade Commission against us and others alleging that certain aftermarket products imported into the U.S. infringed on Ford design patents. The parties settled these matters in April 2009 pursuant to a patent license arrangement that is currently scheduled to expire in March 2020. In January 2014, Chrysler Group, LLC filed a complaint against us in the U.S. District Court in the Eastern District of Michigan contending that certain aftermarket parts we sell infringe Chrysler design patents. The parties settled this matter in June 2014 pursuant to a patent license arrangement that expires in June 2019. In the event that these license arrangements, or other similar license arrangements with OEMs, are terminated or we are unable to agree upon renewal terms, we may be subject to costs and uncertainties of litigation as well as restrictions on our ability to sell aftermarket parts that replicate parts covered by design patents.
If the number of vehicles involved in accidents declines or the number of cars being repaired declines, or the mix of the types of vehicles in the overall vehicle population changes, our business could suffer.
Our business depends on vehicle accidents, mechanical failures and routine maintenance for both the demand for repairs using our products and the supply of recycled, remanufactured and refurbished parts. To the extent that a relatively higher percentage of damaged vehicles are declared total losses, there will be less demand for our products to repair such vehicles. In addition, our business is impacted by factors which influence the number and/or severity of accidents and mechanical failures including, but not limited to, the number of vehicles on the road, the number of miles driven, the ages of drivers, the occurrence and severity of certain weather conditions, the congestion of traffic, drivers distracted by electronic equipment, the use of alcohol or drugs by drivers, the usage rate and effectiveness of accident avoidance systems in new vehicles, the reliability of new OEM parts, and the condition of roadways. For example, an increase in the acceptance of ride-sharing could reduce the number of vehicles on the road. Additionally, an increase in fuel prices may cause the number of vehicles on the road, the number of miles driven, and the need for mechanical repairs and maintenance to decline, as motorists seek alternative transportation options. Mild weather conditions, particularly during winter months, tend to result in a decrease in vehicle accidents. Moreover, a number of states and municipalities have adopted, or are considering adopting, legislation banning the use of handheld cellular telephones or other electronic devices while driving, and such restrictions could lead to a decline in accidents.
Systems designed to minimize accident frequency and severity are becoming more prevalent and more technologically sophisticated. To the extent OEMs install or are mandated by law to install accident avoidance systems in their vehicles, the number and severity of accidents could decrease, which could have a material adverse effect on our business.
The average number of new vehicles sold annually has fluctuated from year-to-year. Periods of decreased sales could result in a reduction in the number of vehicles on the road and consequently fewer vehicles involved in accidents or in need of mechanical repair or maintenance. Substantial further declines in automotive sales in the future could have a material adverse effect on our business, results of operations and/or financial condition. In addition, if vehicle population trends result in a disproportionately high number of older vehicles on the road, insurance companies may find it uneconomical to repair such
13
vehicles or there could be less costly repairs. If vehicle population trends result in a disproportionately high number of newer vehicles on the road, the demand generally for mechanical repairs and maintenance would likely decline due to the newer, longer-lasting parts in the vehicle population and mechanical failures being covered by OEM warranties for the first years of a vehicle's life. Moreover, alternative collision and mechanical parts are less likely to be used on newer vehicles.
Electric vehicles do not have traditional engines, transmissions, and certain related parts. Engines and transmissions represent our largest revenue generating SKUs in North America, and parts for engines and transmissions represent a significant amount of the revenue of our European operations. Thus, an increase in electric vehicles as a percentage of vehicles sold will have a negative impact on our sales of engines, transmissions, and other related parts.
Fluctuations in the prices of metals and other commodities could adversely affect our financial results.
Our recycling operations generate scrap metal and other metals that we sell. After we dismantle a salvage vehicle for wholesale parts and after vehicles have been processed in our self service retail business, the remaining vehicle hulks are sold to scrap processors and other remaining metals are sold to processors and brokers of metals. In addition, we receive "crush only" vehicles from other companies, including OEMs, which we dismantle and which generate scrap metal and other metals. The prices of scrap and other metals have historically fluctuated, sometimes significantly, due to market factors. In addition, buyers may stop purchasing metals entirely due to excess supply. To the extent that the prices of metals decrease materially or buyers stop purchasing metals, our revenue from such sales will suffer and a write-down of our inventory value could be required.
The cost of our wholesale recycled and our self service retail inventory purchases will change as a result of fluctuating scrap metal and other metals prices. In a period of falling metal prices, there can be no assurance that our inventory purchasing cost will decrease the same amount or at the same rate as the scrap metal and other metals prices decline, and there may be a delay between the scrap metal and other metals price reductions and any inventory cost reductions. The prices of steel, aluminum, and plastics are components of the cost to manufacture products for our aftermarket business. If the prices of commodities rise and result in higher costs to us for products we sell, we may not be able to pass these higher costs on to our customers.
Existing or new laws and regulations may prohibit, restrict or burden the sale of aftermarket, recycled, refurbished or remanufactured products.
Most states have passed laws that prohibit or limit the use of aftermarket products in collision repair work. These laws include requirements relating to consumer disclosure, vehicle owner’s consent regarding the use of aftermarket products in the repair process, and the requirement to have aftermarket products certified by an independent testing organization. Additional legislation of this kind may be introduced in the future. If additional laws prohibiting or restricting the use of aftermarket products are passed, it could have an adverse impact on our aftermarket products business.
Certain organizations test the quality and safety of vehicle replacement products. If these organizations decide not to test a particular vehicle product, or in the event that such organizations decide that a particular vehicle product does not meet applicable quality or safety standards, we may decide to discontinue sales of such product or insurance companies may decide to discontinue authorization of repairs using such product. Such events could adversely affect our business.
Some jurisdictions have enacted laws prohibiting or severely restricting the sale of certain recycled products that we provide, such as airbags. These and other jurisdictions could enact similar laws or could prohibit or severely restrict the sale of additional recycled products. The passage of legislation with prohibitions or restrictions that are more severe than current laws could have a material adverse impact on our business. Additionally, Congress could enact federal legislation restricting the use of aftermarket or recycled automotive products used in the course of vehicle repairs.
The Federal Trade Commission has issued guides which regulate the use of certain terms such as “rebuilt” or “remanufactured” in connection with the sale of automotive parts. Restrictions on the products we are able to sell and on the marketing of such products could decrease our revenue and have an adverse effect on our business and operations.
In 1992, Congress enacted the Anti-Car Theft Act to deter trafficking in stolen vehicles. The purpose of the law is to implement an electronic system to track and monitor vehicle identification numbers and major automotive parts. In January 2009, the U.S. Department of Justice implemented the portion of the system to track and monitor vehicle identification numbers. The portion of the system that would track and monitor major automotive parts would require various entities, including automotive parts recyclers like us, to inspect salvage vehicles for the purpose of collecting the part number for any "covered major part." The Department of Justice has not promulgated rules on this portion of the system, and therefore there has been no progress on the implementation of the system to track and monitor major automotive parts. However, if this system is fully implemented, the requirement to collect the information would place substantial burdens on vehicle recyclers, including us, that otherwise would not normally exist. It would place similar burdens on repair shops, which may discourage the use by such shops of recycled products. There is no pending initiative to implement the parts registration from a law enforcement point of view. However, there is a risk that a heightened legislative concern over safety of parts might precipitate an effort to push for the implementation of such rules.
14
An adverse change in our relationships with our suppliers or a disruption to our supply of inventory could increase our expenses and impede our ability to serve our customers.
Our North American business is dependent on a relatively small number of suppliers of aftermarket products, a large portion of which are sourced from Taiwan. Our European business also acquires product from Asian sources. We incur substantial freight costs to import parts from our suppliers, many of which are located in Asia. If the cost of freight rose, we might not be able to pass the cost increases on to our customers. Furthermore, although alternative suppliers exist for substantially all aftermarket products distributed by us, the loss of any one supplier could have a material adverse effect on us until alternative suppliers are located and have commenced providing products. In addition, we are subject to disruptions from work stoppages and other labor disputes at port facilities through which we import our inventory. We also have the risk that our suppliers could attempt to circumvent us and sell their product directly to our customers.
Moreover, our operations are subject to the customary risks of doing business abroad, including, among other things, natural disasters, transportation costs and delays, political instability, currency fluctuations and the imposition of tariffs, import and export controls and other non-tariff barriers (including changes in the allocation of quotas), as well as the uncertainty regarding future relations between China, Japan and Taiwan. The current U.S. administration has discussed the implementation of a tariff on imports into the U.S., the imposition of which would likely have a negative impact on our business due to the amount of inventory we import.
Because a substantial volume of our sales involves products manufactured from sheet metal, we can be adversely impacted if sheet metal becomes unavailable or is only available at higher prices, which we may not be able to pass on to our customers. Additionally, as OEMs convert to raw materials other than steel, it may be more difficult or expensive to source aftermarket parts made with such materials and it may be more difficult for repair shops to work with such materials in the repair process.
Most of our salvage and a portion of our self service inventory is obtained from vehicles offered at salvage auctions operated by several companies that own auction facilities in numerous locations across the U.S. We do not typically have contracts with the auction companies. According to industry analysts, a small number of companies control a large percentage of the salvage auction market in the U.S. If an auction company prohibited us from participating in its auctions, began competing with us, or significantly raised its fees, our business could be adversely affected through higher costs or the resulting potential inability to service our customers. Moreover, we face competition in the purchase of vehicles from direct competitors, rebuilders, exporters and other bidders. To the extent that the number of bidders increases, it may have the effect of increasing our cost of goods sold for wholesale recycled products. Some states regulate bidders to help ensure that salvage vehicles are purchased for legal purposes by qualified buyers. Auction companies have been actively seeking to reduce, circumvent or eliminate these regulations, which would further increase the number of bidders.
In addition, there is a limited supply of salvage vehicles in the U.S. As we grow and our demand for salvage vehicles increases, the costs of these incremental vehicles could be higher. In some states, when a vehicle is deemed a total loss, a salvage title is issued. Whether states issue salvage titles is important to the supply of inventory for the vehicle recycling industry because an increase in vehicles that qualify as salvage vehicles provides greater availability and typically lowers the price of such vehicles. Currently, these titling issues are a matter of state law. In 1992, the U.S. Congress commissioned an advisory committee to study problems relating to vehicle titling, registration, and salvage. Since then, legislation has been introduced seeking to establish national uniform requirements in this area, including a uniform definition of a salvage vehicle. The vehicle recycling industry will generally favor a uniform definition, since it will avoid inconsistencies across state lines, and will generally favor a definition that expands the number of damaged vehicles that qualify as salvage. However, certain interest groups, including repair shops and some insurance associations, may oppose this type of legislation. National legislation has not yet been enacted in this area, and there can be no assurance that such legislation will be enacted in the future.
We also acquire inventory directly from insurance companies, OEMs, and others. To the extent that these suppliers decide to discontinue these arrangements, our business could be adversely affected through higher costs or the resulting potential inability to service our customers.
In Europe, we acquire product from a wide variety of suppliers. As vehicle technology changes, some parts will become more complex and the design or technology of those parts may be covered by patents or other rights that make it difficult for aftermarket suppliers to produce for sale to companies such as ours. The complexity of the parts may include software or other technical aspects that make it difficult to identify what is wrong with the vehicle. More complex parts may be difficult to repair and may require expensive or difficult to obtain software updates, limiting our ability to compete with the OEMs.
Our annual and quarterly performance may fluctuate.
Our revenue, cost of goods sold, and operating results have fluctuated on a quarterly and annual basis in the past and can be expected to continue to fluctuate in the future as a result of a number of factors, some of which are beyond our control.
15
Future factors that may affect our operating results include, but are not limited to, those listed in the Special Note on Forward-Looking Statements in this Annual Report on Form 10-K. Accordingly, our results of operations may not be indicative of future performance. These fluctuations in our operating results may cause our results to fall below our published financial guidance and the expectations of public markets, which could cause our stock price or the value of our debt instruments to decline.
If we lose our key management personnel, we may not be able to successfully manage our business or achieve our objectives.
Our future success depends in large part upon the leadership and performance of our executive management team and key employees at the operating level. If we lose the services of one or more of our executive officers or key employees, or if one or more of them decides to join a competitor or otherwise compete directly or indirectly with us, we may not be able to successfully manage our business or achieve our business objectives. If we lose the services of any of our key employees at the operating or regional level, we may not be able to replace them with similarly qualified personnel, which could harm our business.
We operate in foreign jurisdictions, which exposes us to foreign exchange and other risks.
We have operations in North America, Europe and Taiwan, and we may expand our operations in the countries in which we do business and into other countries. Our foreign operations expose us to additional risks associated with international business, which could have an adverse effect on our business, results of operations and/or financial condition, including import and export requirements and compliance with anti-corruption laws, such as the U.K. Bribery Act 2010 and the Foreign Corrupt Practices Act. We also incur costs in currencies other than our functional currencies in some of the countries in which we operate. We are thus subject to foreign exchange exposure to the extent that we operate in different currencies, as well as exposure to foreign tax and other foreign and domestic laws. In addition, certain countries in which we operate have a higher level of political instability and criminal activity relative to the U.S. that could affect our operations and the ability to maintain our supply of products.
If we determine that our goodwill or other intangible assets have become impaired, we may incur significant charges to our pre-tax income.
Goodwill represents the excess of cost over the fair market value of net assets acquired in business combinations. In the future, goodwill and intangible assets may increase as a result of acquisitions. Goodwill is reviewed at least annually for impairment. Impairment may result from, among other things, deterioration in the performance of acquired businesses, increases in our cost of capital, adverse market conditions, and adverse changes in applicable laws or regulations, including modifications that restrict the activities of the acquired business. As of December 31, 2017, our total goodwill subject to future impairment testing was
$3.5 billion
. For further discussion of our annual impairment test, see "Goodwill Impairment" in the Critical Accounting Policies and Estimates section of Item 7 in this Annual Report on Form 10-K.
Except for indefinite-lived intangibles, we amortize other intangible assets over the assigned useful lives, each of which is based upon the expected period to be benefited. We review indefinite-lived intangible assets for impairment annually or sooner if events or changes in circumstances indicate that the carrying value may not be recoverable. We review finite-lived intangible assets for possible impairment whenever events or changes in circumstances indicate that the carrying value may not be recoverable. In the event conditions change that affect our ability to realize the underlying cash flows associated with our intangible assets, we may record an impairment charge. As of December 31,
2017,
the value of our other intangible assets, net of accumulated amortization, was
$744 million
.
Our business may be adversely affected by union activities and labor and employment laws.
Certain of our employees are represented by labor unions and other employee representative bodies and work under collective bargaining or similar agreements, which are subject to periodic renegotiation. From time to time, there have been efforts to organize additional portions of our workforce and those efforts can be expected to continue. In addition, legislators and government agencies could adopt new regulations or interpret existing regulations that could make it significantly easier for unionization efforts to be successful. Also, we may in the future be subject to strikes or work stoppages, union and works council campaigns, and other labor disruptions and disputes. Additional unionization efforts, new collective bargaining or similar agreements, and work stoppages could materially increase our costs and reduce revenue and could limit our flexibility in terms of work schedules, reductions in force and other operational matters.
We also are subject to laws and regulations that govern such matters as minimum wage, overtime and other working conditions. Some of these laws are technical in nature and could be subject to interpretation by government agencies and courts different than our interpretations. Efforts to comply with existing laws, changes to such laws and newly-enacted laws may increase our labor costs and limit our flexibility. If we were found not to be in compliance with such laws, we could be subject to fines, penalties and liabilities to our employees or government agencies. In addition, efforts to better protect local markets from foreign workers and decisions of countries to withdraw from treaties and joint economic areas may lead to increased
16
restrictions on the free movement of people and labor and may limit our ability to place key personnel where it could best serve our needs.
We rely on information technology and communication systems in critical areas of our operations and a disruption relating to such technology could harm our business.
In the ordinary course of business, we rely upon information technology networks and systems, some of which are leased from third parties, to process, transmit and store electronic information and to manage and support a variety of business processes and activities. The secure operation of these information technology networks and the processing and maintenance of this information is critical to our business operations and strategy. Despite security measures and business continuity plans, our information technology networks and infrastructure may be vulnerable to damage, disruptions or shutdowns due to attacks by cyber criminals, breaches due to employee error or malfeasance, disruptions during the process of upgrading or replacing computer software or hardware, terminations of business relationships by third party service providers, power outages, computer viruses, telecommunication or utility failures, terrorist acts, natural disasters or other catastrophic events. The occurrence of any of these events could compromise our networks, and the information stored there could be accessed, publicly disclosed, lost or stolen. Any such access, disclosure or loss of information could result in legal claims or proceedings, disruption to our operations and damage to our reputation, any of which could adversely affect our business. In addition, as security threats continue to evolve, we may need to invest additional resources to protect the security of our systems.
In the event that we decide to switch providers or to implement upgrades or replacements to our own systems, we may be unsuccessful in the development of our own systems or we may underestimate the costs and expenses of switching providers or developing and implementing our own systems. Also, our revenue may be hampered during the period of implementing an alternative system, which period could extend longer than we anticipated.
The costs of complying with the requirements of laws pertaining to the privacy and security of personal information and the potential liability associated with the failure to comply with such laws could materially adversely affect our business and results of operations.
We collect personally identifiable information ("PII") and other data as part of our business processes and operations. The legislative and regulatory framework relating to privacy and data protection is rapidly evolving worldwide and is likely to remain uncertain for the foreseeable future. This data is subject to a variety of U.S. and international laws and regulations. Many foreign countries and governmental bodies, including the European Union, Canada and other jurisdictions where we conduct business, have laws and regulations concerning the collection and use of PII and other data obtained from their residents or by businesses operating within their jurisdictions that are more restrictive than those in the U.S. Additionally, the European Union adopted the General Data Protection Regulation ("GDPR") that will impose more stringent data protection requirements for processors and controllers of personal data, including expanded disclosures about how PII is to be used, limitations on retention of PII, mandatory data breach notification requirements, and higher standards for data controllers to demonstrate that they have obtained valid consent for certain data processing activities. The GDPR will become effective in May 2018, and there can be no assurance that we will timely have all processes implemented for full compliance with the regulation. The GDPR provides severe penalties for noncompliance.
Any inability, or perceived inability, to adequately address privacy and data protection issues, even if unfounded, or comply with applicable laws, regulations, policies, industry standards, contractual obligations or other legal obligations (including at newly-acquired companies) could result in additional cost and liability to us, result in governmental investigations and enforcement actions, give rise to civil litigation, damage to our reputation (including the loss of trust by our customers and employees), inhibit sales, and otherwise adversely affect our business. We also may be subject to these adverse effects if other parties with whom we do business, including lenders, suppliers, consultants and advisors, violate applicable laws or contractual obligations or suffer a security breach.
Business interruptions in our distribution centers or other facilities may affect our operations, the function of our computer systems, and/or the availability and distribution of merchandise, which may affect our business.
Weather, terrorist activities, war or other disasters, or the threat of any of them, may result in the closure of our distribution centers or other facilities or may adversely affect our ability to deliver inventory through our system on a timely basis. This may affect our ability to serve our customers, resulting in lost sales or a potential loss of customer loyalty. Some of our merchandise is imported from other countries and these goods could become difficult or impossible to bring into the U.S. or into the other countries in which we operate, and we may not be able to obtain such merchandise from other sources at similar prices. Such a disruption in revenue could potentially have a negative impact on our results of operations and financial condition.
We are subject to environmental regulations and incur costs relating to environmental matters.
We are subject to various environmental protection and health and safety laws and regulations governing, among other things: the emission and discharge of hazardous materials into the ground, air, or water; exposure to hazardous materials;
17
and the generation, handling, storage, use, treatment, identification, transportation, and disposal of industrial by-products, waste water, storm water, and mercury and other hazardous materials. We are also required to obtain environmental permits from governmental authorities for certain of our operations. If we violate or fail to obtain or comply with these laws, regulations, or permits, we could be fined or otherwise sanctioned by regulators or lose our operating permits. We could also become liable if employees or other parties are improperly exposed to hazardous materials. We have an environmental management process designed to facilitate and support our compliance with these requirements. We cannot assure you, however, that we will at all times be in complete compliance with such requirements.
We have made and will continue to make capital and other expenditures relating to environmental matters. Although we presently do not expect to incur any capital or other expenditures relating to environmental controls or other environmental matters in amounts that would be material to us, we may be required to make such expenditures in the future.
Under certain environmental laws, we could be held responsible for all of the costs relating to any contamination at, or migration to or from, our or our predecessors' past or present facilities and at independent waste disposal sites. These laws often impose liability even if the owner or operator did not know of, or was not responsible for, the release of such hazardous substances. Many of our facilities are located on or near properties with a history of industrial use that may have involved hazardous materials. As a result, some of our properties may be contaminated. Some environmental laws hold current or previous owners or operators of real property liable for the costs of cleaning up contamination. These environmental laws also impose liability on any person who disposes of, treats, or arranges for the disposal or treatment of hazardous substances, regardless of whether the affected site is owned or operated by such person, and at times can impose liability on companies deemed under law to be a successor to such person. Third parties may also make claims against owners or operators of properties, or successors to such owners or operators, for personal injuries and property damage associated with releases of hazardous or toxic substances.
Contamination resulting from vehicle recycling processes can include soil and ground water contamination from the release, storage, transportation, or disposal of gasoline, motor oil, antifreeze, transmission fluid, chlorofluorocarbons ("CFCs") from air conditioners, other hazardous materials, or metals such as aluminum, cadmium, chromium, lead, and mercury. Contamination from the refurbishment of chrome plated bumpers can occur from the release of the plating material. Contamination can migrate on-site or off-site which can increase the risk, and the amount, of any potential liability.
When we identify a potential material environmental issue during our acquisition due diligence process, we analyze the risks, and, when appropriate, perform further environmental assessment to verify and quantify the extent of the potential contamination. Furthermore, where appropriate, we have established financial reserves for certain environmental matters. In the event we discover new information or if laws change, we may incur significant liabilities, which may exceed our reserves.
Environmental laws are complex, change frequently, and have tended to become more stringent over time. Our costs of complying with current and future environmental and health and safety laws, and our liabilities arising from past or future releases of, or exposure to, hazardous substances, may adversely affect our business, results of operations, or financial condition.
We could be subject to product liability claims and involved in product recalls.
If customers of repair shops that purchase our products are injured or suffer property damage, we could be subject to product liability claims by such customers. The successful assertion of this type of claim could have an adverse effect on our business, results of operations or financial condition. In addition, we may become involved in the recall of a product that is determined to be defective. More generally, a recall involving alternative parts, even if we did not sell the recalled products, could adversely affect the perceived quality of alternative parts, leading to decreased usage of alternative parts. The expenses of a recall and the damage to our reputation, or the reputation of alternative parts generally, could have an adverse effect on our business, results of operations or financial condition.
We have agreed to defend and indemnify in certain circumstances insurance companies and customers against claims and damages relating to product liability and product recalls. The existence of claims or damages for which we must defend and indemnify these parties could also negatively impact our business, results of operations or financial condition.
Governmental agencies may refuse to grant or renew our operating licenses and permits.
Our operating subsidiaries in our salvage, self-service, and refurbishing operations must obtain licenses and permits from state and local governments to conduct their operations. When we develop or acquire a new facility, we must seek the approval of state and local units of government. Governmental agencies may resist the establishment of a vehicle recycling or refurbishing facility in their communities. There can be no assurance that future approvals or transfers will be granted. In addition, there can be no assurance that we will be able to maintain and renew the licenses and permits our operating subsidiaries currently hold.
18
New regulations related to conflict-free minerals may force us to incur additional expenses and otherwise adversely impact our business
.
In August 2012, as mandated by the Dodd-Frank Wall Street Reform and Consumer Protection Act, the SEC adopted final rules regarding disclosure of the use of certain minerals, known as conflict minerals, originating from the Democratic Republic of Congo or adjoining countries. These new requirements impose significant burdens on U.S. public companies. Compliance with the rules requires substantial due diligence in an effort to determine whether products contain the conflict minerals. The results of such due diligence efforts must be disclosed on an annual basis in a filing with the SEC.
Our supply chain is complex and we may incur significant costs to determine the source of any such minerals used in our products. We may also incur costs with respect to potential changes to products, processes or sources of supply as a consequence of our diligence activities. Further, the implementation of these rules and their effect on customer, supplier and/or consumer behavior could adversely affect the sourcing, supply and pricing of materials used in our products. As there may be only a limited number of suppliers offering products free of conflict minerals in some circumstances, we cannot be sure that we will be able to obtain necessary products from such suppliers in sufficient quantities or at competitive prices. We may face reputational challenges if we determine that certain of our products contain minerals not determined to be conflict-free or if we are unable to sufficiently verify the origins for all conflict minerals used in our products through the procedures we implement. Accordingly, these rules could have a material adverse effect on our business, results of operations and/or financial condition.
If we experience problems with our fleet of trucks and other vehicles, our business could be harmed.
We use a fleet of trucks and other vehicles to deliver the majority of the products we sell. We are subject to the risks associated with providing delivery services, including inclement weather, disruptions in the transportation infrastructure, governmental regulation, availability and price of fuel, liabilities arising from accidents to the extent we are not covered by insurance, and insurance premium increases. In addition, our failure to deliver products in a timely and accurate manner could harm our reputation and brand, which could have a material adverse effect on our business.
We may lose the right to operate at key locations.
We lease most of the properties at which we conduct our businesses. At the end of a lease term, we must negotiate a renewal, exercise a purchase option (to the extent we have that right), or find a new location. There can be no assurance that we will be able to negotiate renewals on terms acceptable to us or that we will find a suitable alternative location, especially with respect to our salvage operations (which have characteristics that are often not attractive to landlords or local governments). In such cases, we may lose the right to operate at key locations.
Our effective tax rate could materially increase as a consequence of various factors, including interpretations and administrative guidance in regard to the Tax Act (defined below), U.S. and/or international tax legislation, mix of earnings by jurisdiction and U.S. and foreign jurisdictional audits.
We are a U.S. based multinational company subject to income taxes in the U.S. and a number of foreign jurisdictions. Therefore, we are subject to changes in tax laws in each of these jurisdictions and such changes could have a material adverse effect on our effective tax rate and cash flows.
On December 22, 2017, the U.S. enacted legislation commonly referred to as the Tax Cuts and Jobs Act (the "Tax Act"). Among other things, the Tax Act reduces the U.S. statutory corporate tax rate from 35% to 21% for tax years beginning after December 31, 2017. Additionally, beginning in 2018, the Tax Act imposes a regime of taxation on foreign subsidiary earnings (Global Intangible Low-Taxed Income, “GILTI”) and on certain related party payments (Base Erosion Anti-abuse Tax, “BEAT”). Other important changes potentially material to the our operations include the full expensing of certain assets placed into service after September 27, 2017, the repeal of the domestic manufacturing deduction, and additional limitations on the deductibility of executive compensation. Finally, as part of the transition of U.S. international taxation from a worldwide tax system to a territorial tax system, the Tax Act imposes a one-time transition tax on the deemed repatriation of historical earnings of foreign subsidiaries as of December 31, 2017. Other than the transition tax and revaluation of deferred tax balances (which are applicable to us for 2017), the provisions will generally be applicable in 2018 and beyond. In accordance with the guidance provided in SEC Staff Accounting Bulletin (“SAB”) No. 118, in the fourth quarter of 2017, we recorded provisional reasonable estimates of the impact of the Tax Act, including $51 million for the transition tax and a deferred tax benefit of $73 million related to the revaluation of deferred tax balances based on the new rate. We are continuing to analyze the Tax Act and plan to finalize the estimate within the measurement period outlined in SAB No.118. The final adjustments may differ from the provisional reasonable estimates (and such difference may be material) if provisions of the Tax Act, and their interaction with other provisions of the U.S. Internal Revenue Code, are interpreted differently than interpretations made by us in determining the estimates, whether through issuance of administrative guidance, or through further review of the Tax Act. Depending upon future interpretations and administrative guidance in respect of the Tax Act’s base broadening provisions, the Tax Act could have a material adverse effect on the Company’s effective tax rate and cash flows.
19
Certain non-U.S. jurisdictions are considering tax legislation based upon recommendations made by the Organization for Economic Co-operation and Development in connection with its Base Erosion and Profit Shifting study. The outcome of these legislative developments could have a material adverse effect on our effective tax rate and cash flows.
The tax rates applicable in the jurisdictions within which we operate vary widely. Therefore, our effective tax rate may be adversely affected by changes in the mix of our earnings by jurisdiction.
We are also subject to ongoing audits of our income tax returns in various jurisdictions both in the U.S. and internationally. While we believe that our tax positions will be sustained, the outcomes of such audits could result in the assessment of additional taxes, which could adversely impact our cash flows and financial results.
Risks Relating to Our Common Stock and Financial Structure
The market price of our common stock may be volatile and could expose us to securities class action litigation.
The stock market and the price of our common stock may be subject to wide fluctuations based upon general economic and market conditions. The market price for our common stock may also be affected by our ability to meet analysts’ expectations. Failure to meet such expectations, even slightly, could have an adverse effect on the market price of our common stock. In addition, stock market volatility has had a significant effect on the market prices of securities issued by many companies for reasons unrelated to the operating performance of these companies. Downturns in the stock market may cause the price of our common stock to decline. Additionally, the market price for our common stock has been in the past, and in the future may be, adversely affected by allegations made or reports issued by short sellers, analysts, activists or others regarding our business model, our management or our financial accounting.
Following periods of volatility in the market price of a company’s securities, securities class action litigation has often been instituted against such companies. If similar litigation were instituted against us, it could result in substantial costs and a diversion of our management’s attention and resources, which could have an adverse effect on our business.
Delaware law, our charter documents and our loan documents may impede or discourage a takeover, which could affect the price of our stock.
The anti-takeover provisions of our certificate of incorporation and bylaws, our loan documents and Delaware law could, together or separately, impose various impediments to the ability of a third party to acquire control of us, even if a change in control would be beneficial to our existing stockholders. Our certificate of incorporation and bylaws have provisions that could discourage potential takeover attempts and make attempts by stockholders to change management more difficult. Our credit agreement provides that a change of control is an event of default. Our incorporation under Delaware law and these provisions could also impede an acquisition, takeover, or other business combination involving us or discourage a potential acquirer from making a tender offer for our common stock, which, under certain circumstances, could reduce the price of our common stock.
Future sales of our common stock or other securities may depress our stock price.
We and our stockholders may sell shares of common stock or other equity, debt or instruments which constitute an element of our debt and equity (collectively, "securities") in the future. We may also issue shares of common stock under our equity incentive plan or in connection with future acquisitions. We cannot predict the size of future issuances of securities or the effect, if any, that future issuances and sales of shares of our common stock or other securities will have on the price of our common stock. Sales of substantial amounts of common stock (including shares issued in connection with an acquisition), the issuance of additional debt securities, or the perception that such sales or issuances could occur, may cause the price of our common stock to fall.
We have a substantial amount of indebtedness, which could have a material adverse effect on our financial condition and our ability to obtain financing in the future and to react to changes in our business.
As of December 3
1, 2017,
we had approximately
$2.1 billion
aggregate principal amount of secured debt outstanding and approximately $1.4 billion of availability under our credit agreement ($1.5 billion of availability reduced by
$71 million
of amounts outstanding under letters of credit). In addition, we had approximately $1.2 billion aggregate principal amount of unsecured debt outstanding comprising
$600 million
aggregate principal amount of
4.75%
senior notes due May 15,
2023
(the "U.S. Notes (2023)") an
d €500 million
(
$600 million
) aggregate principal amount of 3.875% senior notes due
April 1, 2024
(the "Euro Notes (2024)," and together with the U.S. Notes (2023), the "senior notes"). Borrowings under the credit agreement mature in January 2023.
Our significant amount of debt and our debt service obligations could limit our ability to satisfy our obligations, limit our ability to operate our business and impair our competitive position.
For example, our debt and our debt service obligations could:
20
|
•
|
increase our vulnerability to adverse economic and general industry conditions, including interest rate fluctuations, because a portion of our borrowings are and will continue to be at variable rates of interest;
|
|
•
|
require us to dedicate a substantial portion of our cash flow from operations to payments on our debt, which would reduce the availability of our cash flow from operations to fund working capital, capital expenditures or other general corporate purposes;
|
|
•
|
limit our flexibility in planning for, or reacting to, changes in our business and industry;
|
|
•
|
place us at a disadvantage compared to competitors that may have proportionately less debt;
|
|
•
|
limit our ability to obtain additional debt or equity financing due to applicable financial and restrictive covenants in our debt agreements; and
|
|
•
|
increase our cost of borrowing.
|
In addition, if we or our subsidiaries incur additional debt, the risks associated with our substantial leverage and the ability to service such debt would increase.
Our senior notes do not impose any limitations on our ability to incur additional debt or protect against certain other types of transactions.
Although we are subject to our credit agreement for so long as it remains in effect, the indentures governing the senior notes do not restrict the future incurrence of unsecured indebtedness, guarantees or other obligations. The indentures contain certain limitations on our ability to incur liens on assets and engage in sale and leaseback transactions. However, these limitations are subject to important exceptions. In addition, the indentures do not contain many other restrictions, including certain restrictions contained in our credit agreement, including, without limitation, investments or prepaying subordinated indebtedness or engaging in transactions with our affiliates.
Our credit agreement will permit, subject to specified conditions and limitations, the incurrence of a significant amount of additional indebtedness. As of December 31, 2017, we would have been able to incur an additional $1.4 billion of indebtedness under our credit agreement ($1.5 billion of availability reduced by
$71 million
of amounts outstanding under letters of credit). If we or our subsidiaries incur additional debt, the risks associated with our substantial leverage and the ability to service such debt would increase. If we close the acquisition of Stahlgruber, we will incur approximately $1.5 billion of additional debt to partially fund the purchase price; this amount is subject to change, depending on factors such as Stahlgruber's debt at closing and the acquisition date exchange rate.
Our credit agreement imposes significant operating and financial restrictions on us and our subsidiaries, which may prevent us from capitalizing on business opportunities.
Our credit agreement imposes significant operating and financial restrictions on us. These restrictions limit our ability, among other things, to:
|
•
|
incur, assume or permit to exist additional indebtedness (including guarantees thereof);
|
|
•
|
pay dividends or certain other distributions on our capital stock or repurchase our capital stock or prepay subordinated indebtedness;
|
|
•
|
incur liens on assets;
|
|
•
|
make certain investments or other restricted payments;
|
|
•
|
engage in transactions with affiliates;
|
|
•
|
sell certain assets or merge or consolidate with or into other companies;
|
|
•
|
guarantee indebtedness; and
|
|
•
|
alter the business we conduct.
|
As a result of these covenants and restrictions, we will be limited in how we conduct our business and we may be unable to raise additional debt or equity financing to compete effectively or to take advantage of new business opportunities. The terms of any future indebtedness we may incur could include more restrictive covenants. We cannot assure you that we will be able to maintain compliance with these covenants in the future and, if we fail to do so, that we will be able to obtain waivers from the lenders and/or amend the covenants. The failure to comply with any of these covenants would cause a default under the credit agreement. A default, if not waived, could result in acceleration of our debt, in which case the debt would become immediately due and payable. If this occurs, we may not be able to repay our debt or borrow sufficient funds to refinance it. Even if new financing were available, it may be on terms that are less attractive to us than our existing credit facilities or it may be on terms that are not acceptable to us.
21
We may not be able to generate sufficient cash to service all of our indebtedness, and may be forced to take other actions to satisfy our obligations under our indebtedness, which may not be successful.
Our ability to make scheduled payments on or to refinance our debt obligations depends on our financial condition and operating performance, which are subject to prevailing economic and competitive conditions and to certain financial, business and other factors beyond our control. We cannot assure you that we will maintain a level of cash flows from operating activities sufficient to permit us to pay the principal, premium, if any, and interest on our indebtedness. If our cash flows and capital resources are insufficient to fund our debt service obligations, we may be forced to reduce or delay investments and capital expenditures, or to sell assets, seek additional capital or restructure or refinance our indebtedness. These alternative measures may not be successful and may not permit us to meet our scheduled debt service obligations. If our operating results and available cash are insufficient to meet our debt service obligations, we could face substantial liquidity problems and might be required to dispose of material assets or operations to meet our debt service and other obligations. We may not be able to consummate those dispositions or to obtain the proceeds that we could realize from them, and these proceeds may not be adequate to meet any debt service obligations then due. Any future refinancing of our indebtedness could be at higher interest rates and may require us to comply with more onerous covenants which could further restrict our business operations. Additionally, the credit agreement and the indentures that govern our senior notes limit the use of the proceeds from certain dispositions of our assets; as a result, our credit agreement and our senior notes may prevent us from using the proceeds from such dispositions to satisfy all of our debt service obligations.
Our future capital needs may require that we seek to refinance our debt or obtain additional debt or equity financing, events that could have a negative effect on our business.
We may need to raise additional funds in the future to, among other things, refinance existing debt, fund our existing operations, improve or expand our operations, respond to competitive pressures, or make acquisitions. From time to time, we may raise additional funds through public or private financing, strategic alliances, or other arrangements. Funds may not be available or available on terms acceptable to us as a result of different factors, including but not limited to turmoil in the credit markets that results in the tightening of credit conditions and current or future regulations applicable to the financial institutions from whom we seek financing. If adequate funds are not available on acceptable terms, we may be unable to meet our business or strategic objectives or compete effectively. If we raise additional funds by issuing equity securities, stockholders may experience dilution of their ownership interests, and the newly issued securities may have rights superior to those of the common stock. If we raise additional funds by issuing debt, we may be subject to higher borrowing costs and further limitations on our operations. If we refinance or restructure our debt, we may incur charges to write off the unamortized portion of deferred debt issuance costs from a previous financing, or we may incur charges related to hedge ineffectiveness from our interest rate swap obligations. In addition, there are restrictions in the indenture that governs the U.S. Notes (2023) on our ability to refinance such notes prior to May 15, 2018. There are also restrictions in the indenture that governs the Euro Notes (2024) on our ability to refinance such notes prior to January 1, 2024. If we fail to raise capital when needed, our business may be negatively affected.
Our variable rate indebtedness subjects us to interest rate risk, which could cause our indebtedness service obligations to increase significantly and could affect the value of our senior notes.
Certain borrowings under our credit agreement and the borrowing under our accounts receivable securitization facility are at variable rates of interest and expose us to interest rate risk. If interest rates increase, our debt service obligations on the variable rate indebtedness would increase even though the amount borrowed remained the same, and our net income and cash flows, including cash available for servicing our indebtedness, would correspondingly decrease. Moreover, changes in market interest rates could affect the trading value of the notes. Assuming all revolving loans were fully drawn and no interest rate swaps were in place, each one percentage point change in interest rates would result in a $36 million change in annual cash interest expense under our credit agreement and our accounts receivable securitization facility.
Repayment of our indebtedness, including our senior notes, is dependent on cash flow generated by our subsidiaries.
We are a holding company and repayment of our senior notes will be dependent upon cash flow generated by our subsidiaries and their ability to make such cash available to us, by dividend, debt repayment or otherwise. Unless they are borrowers or guarantors of the indebtedness, our subsidiaries do not have any obligation to pay amounts due on the indebtedness or to make funds available for that purpose. Our subsidiaries may not be able to, or be permitted to, make distributions to enable us to make payments in respect of our indebtedness, including the senior notes. Each of our subsidiaries is a distinct legal entity and, under certain circumstances, legal and contractual restrictions may limit our ability to obtain cash from our subsidiaries and, under certain circumstances, distributions from our subsidiaries may be subject to significant taxes that reduce the amount of such distributions available to us. While the indentures governing the senior notes limit the ability of our subsidiaries to restrict the payment of dividends or make other intercompany payments to us, these limitations are subject to certain qualifications and exceptions. In the event that we do not receive distributions from our subsidiaries, we may be unable to make required principal and interest payments on our indebtedness, including the senior notes.
22
A downgrade in our credit rating would impact our cost of capital and could impact the market value of our senior notes.
Credit ratings have an important effect on our cost of capital. Credit rating agencies rate our debt securities on factors that include, among other items, our results of operations, business decisions that we make, their view of the general outlook for our industry, and their view of the general outlook for the economy. Actions taken by the rating agencies can include maintaining, upgrading, or downgrading the current rating or placing us on a watch list for possible future downgrading. We believe our current credit ratings enhance our ability to borrow funds at favorable rates. A downgrade in our current credit rating from a rating agency could adversely affect our cost of capital by causing us to pay a higher interest rate on borrowed funds under our credit facilities. A downgrade could also adversely affect the market price and/or liquidity of our senior notes, preventing a holder from selling the senior notes at a favorable price, as well as adversely affecting our ability to issue new notes in the future or incur other indebtedness upon favorable terms.
The right to receive payments on the senior notes is effectively junior to those lenders who have a security interest in our assets.
Our obligations under our senior notes and our guarantors’ obligations under their guarantees of the senior notes are unsecured, but our and each co-borrower’s obligations under our credit agreement and each guarantor’s obligations under their respective guarantees of the credit agreement are secured by a security interest in substantially all of our domestic tangible and intangible assets, including the stock of most of our wholly-owned United States subsidiaries and the stock of certain of our non-United States subsidiaries. If we are declared bankrupt or insolvent, or if we default under our credit agreement, the lenders could declare all of the funds borrowed thereunder, together with accrued interest, immediately due and payable. If we were unable to repay such indebtedness, the lenders could foreclose on the pledged assets to the exclusion of holders of our senior notes, even if an event of default exists under the applicable indenture governing the senior notes. Furthermore, if the lenders foreclose and sell the pledged equity interests in any subsidiary guarantor under our senior notes, then that guarantor will be released from its guarantee of the senior notes automatically and immediately upon such sale. In any such event, because the senior notes are not secured by any of our assets or the equity interests in subsidiary guarantors, it is possible that there would be no assets remaining from which claims by holders of the senior notes could be satisfied or, if any assets remained, they might be insufficient to satisfy claims fully. As of December
31, 2017,
we had approximately
$2.1 billion
aggregate principal amount of secured debt outstanding and approximately $1.4 billion of availability under the credit agreement ($1.5 billion of availability reduced by
$71 million
of amounts outstanding under letters of credit).
United States federal and state statutes allow courts, under specific circumstances, to void the senior notes
and the guarantees, subordinate claims in respect of the senior notes and the guarantees, and require holders of the senior notes to return payments received from us or the guarantors.
Our direct and indirect domestic subsidiaries that are obligors under the credit agreement guarantee the obligations under our senior notes. In addition, certain subsidiaries of the issuer of the Euro Notes (2024) guarantee the obligations under the Euro Notes (2024). The issuance of our senior notes and the issuance of the guarantees by the guarantors may be subject to review under state and federal laws if a bankruptcy, liquidation or reorganization case or a lawsuit, including in circumstances in which bankruptcy is not involved, were commenced at some future date by, or on behalf of, our unpaid creditors or the unpaid creditors of a guarantor. Under the federal bankruptcy laws of the United States and comparable provisions of state fraudulent transfer laws, a court may avoid or otherwise decline to enforce the senior notes, or a guarantor’s guarantee, or may subordinate the senior notes, or such guarantee, to our or the applicable guarantor’s existing and future indebtedness. While the relevant laws may vary from jurisdiction to jurisdiction, a court might do so if it found that when indebtedness under the senior notes was issued, or when the applicable guarantor entered into its guarantee, or, in some jurisdictions, when payments became due under the senior notes, or such guarantee, the issuer or the applicable guarantor received less than reasonably equivalent value or fair consideration and:
|
•
|
was insolvent or rendered insolvent by reason of such incurrence;
|
|
•
|
was engaged in a business or transaction for which its remaining assets constituted unreasonably small capital; or
|
|
•
|
intended to incur, or believed that it would incur, debts beyond its ability to pay such debts as they mature.
|
A court would likely find that we or a guarantor did not receive reasonably equivalent value or fair consideration for the senior notes or such guarantee if we or such guarantor did not substantially benefit directly or indirectly from the issuance of the senior notes. Thus, if the guarantees were legally challenged, any guarantee could be subject to the claim that, since the guarantee was incurred for our benefit, and only indirectly for the benefit of the guarantor, the obligations of the applicable guarantor were incurred for less than reasonably equivalent value or fair consideration. If a court were to void the issuance of the senior notes or any guarantee, a holder of the senior notes would no longer have any claim against us or the applicable guarantor. In the event of a finding that a fraudulent transfer or conveyance occurred, a holder of the senior notes may not receive any repayment on the senior notes. Further, the avoidance of the senior notes could result in an event of default with respect to our and our subsidiaries’ other debt, which could result in acceleration of that debt. The measures of insolvency for
23
purposes of these fraudulent transfer laws vary depending upon the law applied in any proceeding to determine whether a fraudulent transfer has occurred. Generally, however, an issuer or a guarantor, as applicable, would be considered insolvent if:
|
•
|
the sum of its debts, including contingent liabilities, was greater than the fair value of its assets;
|
|
•
|
the present fair saleable value of its assets was less than the amount that would be required to pay its probable liability on its existing debts, including contingent liabilities, as they become absolute and mature; or
|
|
•
|
it could not pay its debts as they become due.
|
A court might also void the senior notes, or a guarantee, without regard to the above factors, if the court found that the senior notes were incurred or issued or the applicable guarantor entered into its guarantee with actual intent to hinder, delay or defraud its creditors. We cannot give any assurance as to what standard a court would apply in determining whether we or the guarantors were solvent at the relevant time or that a court would agree with our conclusions in this regard, or, regardless of the standard that a court uses, that it would not determine that we or a guarantor were indeed insolvent on that date; that any payments to the holders of the senior notes (including under the guarantees) did not constitute preferences, fraudulent transfers or conveyances on other grounds; or that the issuance of the senior notes and the guarantees would not be subordinated to our or any guarantor’s other debt. In addition, any payment by us or a guarantor pursuant to the senior notes, or its guarantee, could be avoided and required to be returned to us or such guarantor or to a fund for the benefit of our or such guarantor’s creditors, and accordingly the court might direct holders of the senior notes to repay any amounts already received from us or such guarantor. Among other things, under U.S. bankruptcy law, any payment by us pursuant to the senior notes or by a guarantor under a guarantee made at a time we or such guarantor were found to be insolvent could be voided and required to be returned to us or such guarantor or to a fund for the benefit of our or such guarantor’s creditors if such payment is made to an insider within a one-year period prior to a bankruptcy filing or within 90 days for any outside party and such payment would give such insider or outsider party more than such party would have received in a distribution under the Bankruptcy Code in a hypothetical Chapter 7 case. Although each guarantee contains a “savings clause” intended to limit the subsidiary guarantor’s liability to the maximum amount that it could incur without causing the incurrence of obligations under its subsidiary guarantee to be a fraudulent transfer, this provision may not be effective as a legal matter to protect any subsidiary guarantees from being avoided under fraudulent transfer law. In that regard, in
Official Committee of Unsecured Creditors of
TOUSA, Inc. v Citicorp North America, Inc
., the United States Bankruptcy Court in the Southern District of Florida held that a savings clause similar to the savings clause included in our indentures was unenforceable. As a result, the subsidiary guarantees were found to be fraudulent conveyances. The United States Court of Appeals for the Eleventh Circuit subsequently affirmed the liability findings of the Bankruptcy Court without ruling directly on the enforceability of savings clauses generally. If the decision of the bankruptcy court in
TOUSA
were followed by other courts, the risk that the guarantees would be deemed fraudulent conveyances would be significantly increased.
To the extent a court avoids the senior notes or any of the guarantees as fraudulent transfers or holds the senior notes or any of the guarantees unenforceable for any other reason, the holders of the senior notes would cease to have any direct claim against us or the applicable guarantor. If a court were to take this action, our or the applicable guarantor’s assets would be applied first to satisfy our or the applicable guarantor’s other liabilities, if any, and might not be applied to the payment of the senior notes. Sufficient funds to repay the senior notes may not be available from other sources, including the remaining guarantors, if any. In addition, the Euro Notes (2024) and the guarantees may be subject to avoidance under the laws of other foreign jurisdictions, including Italy and Czech Republic, to the extent that we, the issuer of the Euro Notes (2024), or any of the guarantors (as applicable) were to be the subject of an insolvency or related proceeding in such jurisdiction(s).
Not all of our subsidiaries have guaranteed our credit agreement or our senior notes, and the assets of our non-guarantor subsidiaries may not be available to make payments on such obligations.
Not all of our subsidiaries have guaranteed the credit agreement, our U.S. Notes (2023) or our Euro Notes (2024). In the event that any non-guarantor subsidiary becomes insolvent, liquidates, reorganizes, dissolves or otherwise winds up, holders of its indebtedness and its trade creditors generally will be entitled to payment on their claims from the assets of that subsidiary before any of those assets are made available to the lenders under the credit agreement or the holders of the senior notes. Consequently, claims in respect of the credit agreement and the senior notes are structurally subordinated to all of the liabilities of our subsidiaries that are not guarantors of such instruments, including trade payables, and any claims of third party holders of preferred equity interests, if any, in our non-guarantor subsidiaries. For the year ended December 31, 2017, our subsidiaries that are not borrowers under or do not guarantee the credit agreement and our subsidiaries that do not guarantee the U.S. Notes (2023) represented approximately 42% and 26% of our total revenue and operating income, respectively. In addition, these non-guarantor subsidiaries represented approximately 49% and 41% of our total assets and total liabilities, respectively, as of December 31,
2017
(excluding, in each case, intercompany amounts). As of the same date, our subsidiaries that do not guarantee the credit agreement or the U.S. Notes (2023) had approximately $1.3 billion of outstanding indebtedness (which includes $460 million of borrowings under our revolving credit facilities by foreign subsidiaries that are borrowers under the revolving credit facilities but that do not guarantee the U.S. Notes (2023)). The group of subsidiaries that does not guarantee the
24
Euro Notes (2024) is similar to the group that does not guarantee the U.S. Notes (2023), except that, in addition to the issuer of the Euro Notes (2024), there are four subsidiaries in the group that does not guarantee the U.S. Notes (2023) that guarantee the Euro Notes (2024).
We may not be able to repurchase the senior notes upon a change of control or pursuant to an asset sale offer.
Upon a change of control, as defined in the indentures governing the senior notes, the holders of the senior notes will have the right to require us to offer to purchase all of the senior notes then outstanding at a price equal to 101% of their principal amount plus accrued and unpaid interest. Such a change of control would also be an event of default under our credit agreement. In order to obtain sufficient funds to pay amounts due under the credit agreement and the purchase price of the outstanding senior notes, we expect that we would have to refinance our indebtedness. We cannot assure you that we would be able to refinance our indebtedness on reasonable terms, if at all. Our failure to offer to purchase all outstanding senior notes or to purchase all validly tendered senior notes would be an event of default under the indenture. Such an event of default may cause the acceleration of our other debt. Our other debt also may contain restrictions on repayment requirements with respect to specified events or transactions that constitute a change of control under the indenture.
The definition of change of control in the indentures governing the senior notes includes a phrase relating to the sale of “all or substantially all” of our assets. There is no precise established definition of the phrase “substantially all” under applicable law. Accordingly, the ability of a holder of senior notes to require us to repurchase its senior notes as a result of a sale of less than all our assets to another person may be uncertain.
In addition, in certain circumstances as specified in the indentures governing the senior notes, we will be required to commence an asset sale offer, as defined in the indentures governing the senior notes, pursuant to which we will be obligated to purchase certain senior notes at a price equal to 100% of their principal amount plus accrued and unpaid interest with the proceeds we receive from certain asset sales. Our other debt may contain restrictions that would limit or prohibit us from completing any such asset sale offer. In particular, our credit agreement contains provisions that require us, upon the sale of certain assets, to apply all of the proceeds from such asset sale to the prepayment of amounts due under the credit agreement. The mandatory prepayment obligations under the credit agreement will be effectively senior to our obligations to make an asset sale offer with respect to the senior notes under the terms of the indentures governing the senior notes. Our failure to purchase any such senior notes when required under the indentures would be an event of default under the indentures.
Key terms of the senior notes will be suspended if the notes achieve investment grade ratings and no default or event of default has occurred and is continuing.
Many of the covenants in the indentures governing the senior notes will be suspended if the senior notes are rated investment grade by Standard & Poor’s and Moody’s provided at such time no default or event of default has occurred and is continuing, including those covenants that restrict, among other things, our ability to pay dividends, incur liens and to enter into certain other transactions. There can be no assurance that the senior notes will ever be rated investment grade. However, suspension of these covenants would allow us to engage in certain transactions that would not be permitted while these covenants were in force (although provisions under our other debt, like the credit agreement, may continue to restrict us from engaging in these transactions), and the effects of any such transactions will be permitted to remain in place even if the senior notes are subsequently downgraded below investment grade.
The liquidity and market value of the senior notes may change due to a variety of factors.
The liquidity of any trading market in the senior notes, and the market price quoted for the senior notes, may be adversely affected by changes in the overall market for these types of securities, changes in interest rates, changes in our ratings, and changes in our financial performance or prospects or in the prospects for companies in our industries generally.
We rely on an accounts receivable securitization program for a portion of our liquidity.
We have an arrangement whereby we sell an interest in a portion of our accounts receivable to a special purpose vehicle and receive funding through the commercial paper market. This arrangement expires in November 2019. In the event that the market for commercial paper were to close or otherwise become constrained, our cost of credit relative to this program could rise, or credit could be unavailable altogether.
None.
Our properties are described in Item 1 of this Annual Report on Form 10-K, and such description is incorporated by reference into this Item 2. Our properties are sufficient to meet our present needs, and we do not anticipate any difficulty in securing additional space to conduct operations or additional office space, as needed, on terms acceptable to us.
We are from time to time subject to various claims and lawsuits incidental to our business. In the opinion of management, currently outstanding claims and suits will not, individually or in the aggregate, have a material adverse effect on our financial position, results of operations or cash flows.
Not applicable.
25
|
ITEM 5.
|
MARKET FOR REGISTRANT'S COMMON EQUITY, RELATED STOCKHOLDER MATTERS AND ISSUER PURCHASES OF EQUITY SECURITIES
|
Our common stock is traded on the NASDAQ Global Select Market ("NASDAQ") under the symbol "LKQ." At
December 31, 2017
, there were 19 record holders of our common stock. The following table sets forth, for the periods indicated, the range of the high and low sales prices of shares of our common stock on NASDAQ.
|
High
|
Low
|
||||||
|
2017
|
|||||||
|
Fourth Quarter
|
$
|
41.42
|
|
$
|
35.78
|
|
|
|
Third Quarter
|
$
|
36.05
|
|
$
|
31.17
|
|
|
|
Second Quarter
|
$
|
33.09
|
|
$
|
27.85
|
|
|
|
First Quarter
|
$
|
33.17
|
|
$
|
29.03
|
|
|
|
2016
|
|||||||
|
Fourth Quarter
|
$
|
35.58
|
|
$
|
29.57
|
|
|
|
Third Quarter
|
$
|
36.35
|
|
$
|
31.18
|
|
|
|
Second Quarter
|
$
|
34.26
|
|
$
|
29.37
|
|
|
|
First Quarter
|
$
|
32.12
|
|
$
|
23.95
|
|
|
We have not paid any cash dividends on our common stock. We intend to continue to retain our earnings to finance our growth and for general corporate purposes. We do not anticipate paying any cash dividends on our common stock in the foreseeable future. In addition, our senior secured credit agreement and our senior notes indentures contain, and future financing agreements may contain, limitations on payment of cash dividends or other distributions of assets. Based on limitations in effect under our senior secured credit agreement and senior notes indentures, the maximum amount of dividends we could pay as of December 31, 2017 was approximately
$1.4 billion
. The limit on the payment of dividends is calculated using historical financial information and will change from period to period.
The following graph compares the percentage change in the cumulative total returns on our common stock, the Standard & Poor's 500 Stock In
dex ("S&P 500 Index") and the following group of peer companies (the "Peer Group"): Copart, Inc.; O'Reilly Automotive, Inc.; Genuine Parts Company; and Fastenal Co., for the period beginning on
December 31, 2012
and ending on
December 31, 2017
(which was the last day of our
2017
fiscal year). The stock price performance in the graph is not necessarily indicative of future stock price performance. The graph assumes that the value of an investment in each of the Company's common stock, the S&P 500 Index and the Peer Group was $100 on
December 31, 2012
and that all dividends
, where applicable, were reinvested.
26
Comparison of Cumulative Return
Among LKQ Corporation, the S&P 500 Index and the Peer Group
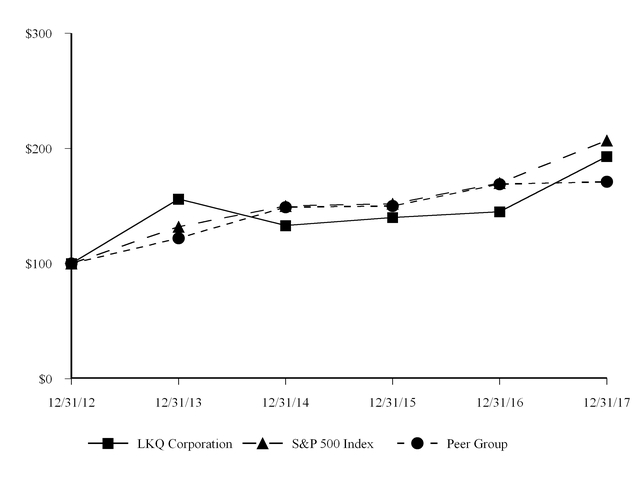
|
12/31/2012
|
12/31/2013
|
12/31/2014
|
12/31/2015
|
12/31/2016
|
12/31/2017
|
||||||||||||||||||
|
LKQ Corporation
|
$
|
100
|
|
$
|
156
|
|
$
|
133
|
|
$
|
140
|
|
$
|
145
|
|
$
|
193
|
|
|||||
|
S&P 500 Index
|
$
|
100
|
|
$
|
132
|
|
$
|
150
|
|
$
|
152
|
|
$
|
170
|
|
$
|
207
|
|
|||||
|
Peer Group
|
$
|
100
|
|
$
|
122
|
|
$
|
149
|
|
$
|
150
|
|
$
|
169
|
|
$
|
171
|
|
|||||
This stock performance information is "furnished" and shall not be deemed to be "soliciting material" or subject to Rule 14A, shall not be deemed "filed" for purposes of Section 18 of the Securities Exchange Act of 1934 or otherwise subject to the liabilities of that section, and shall not be deemed incorporated by reference in any filing under the Securities Act of 1933 or the Securities Exchange Act of 1934, whether made before or after the date of this report and irrespective of any general incorporation by reference language in any such filing, except to the extent that it specifically incorporates the information by reference.
Information about our common stock that may be issued under our equity compensation plans as of
December 31, 2017
included in Part III, Item 12 of this Annual Report on Form 10-K is incorporated herein by reference.
27
The following selected consolidated financial data should be read together with "Management's Discussion and Analysis of Financial Condition and Results of Operations" in Item 7 of this Annual Report on Form 10-K and our consolidated financial statements and related notes included in Item 8 of this Annual Report on Form 10-K.
|
Year Ended December 31,
|
|||||||||||||||||||
|
(in thousands, except per share data)
|
2017
|
2016
|
2015
|
2014
|
2013
|
||||||||||||||
|
(1)
|
(2)
|
(3)
|
(4)
|
(5)
|
|||||||||||||||
|
Statements of Income Data:
|
|||||||||||||||||||
|
Revenue
|
$
|
9,736,909
|
|
$
|
8,584,031
|
|
$
|
7,192,633
|
|
$
|
6,740,064
|
|
$
|
5,062,528
|
|
||||
|
Cost of goods sold
|
5,937,286
|
|
5,232,328
|
|
4,359,104
|
|
4,088,151
|
|
2,987,126
|
|
|||||||||
|
Gross margin
|
3,799,623
|
|
3,351,703
|
|
2,833,529
|
|
2,651,913
|
|
2,075,402
|
|
|||||||||
|
Operating income
|
847,318
|
|
763,398
|
|
704,627
|
|
649,868
|
|
530,180
|
|
|||||||||
|
Other expense (income):
|
|||||||||||||||||||
|
Interest expense
|
101,640
|
|
88,263
|
|
57,860
|
|
64,542
|
|
51,184
|
|
|||||||||
|
Other (income) expense, net
|
(20,949
|
)
|
(2,146
|
)
|
(2,263
|
)
|
(2,562
|
)
|
3,169
|
|
|||||||||
|
Income from continuing operations before provision for income taxes
|
766,627
|
|
677,281
|
|
649,030
|
|
587,888
|
|
475,827
|
|
|||||||||
|
Provision for income taxes
|
235,560
|
|
220,566
|
|
219,703
|
|
204,264
|
|
164,204
|
|
|||||||||
|
Equity in earnings (loss) of unconsolidated subsidiaries
|
5,907
|
|
(592
|
)
|
(6,104
|
)
|
(2,105
|
)
|
—
|
|
|||||||||
|
Income from continuing operations
|
536,974
|
|
456,123
|
|
423,223
|
|
381,519
|
|
311,623
|
|
|||||||||
|
Net (loss) income from discontinued operations
|
(6,746
|
)
|
7,852
|
|
—
|
|
—
|
|
—
|
|
|||||||||
|
Net income
|
530,228
|
|
463,975
|
|
423,223
|
|
381,519
|
|
311,623
|
|
|||||||||
|
Less: net loss attributable to noncontrolling interest
|
(3,516
|
)
|
—
|
|
—
|
|
—
|
|
—
|
|
|||||||||
|
Net income attributable to LKQ stockholders
|
$
|
533,744
|
|
$
|
463,975
|
|
$
|
423,223
|
|
$
|
381,519
|
|
$
|
311,623
|
|
||||
|
Basic earnings per share:
(6)
|
|||||||||||||||||||
|
Income from continuing operations
|
$
|
1.74
|
|
$
|
1.49
|
|
$
|
1.39
|
|
$
|
1.26
|
|
$
|
1.04
|
|
||||
|
Net (loss) income from discontinued operations
|
(0.02
|
)
|
0.03
|
|
—
|
|
—
|
|
—
|
|
|||||||||
|
Net income
|
1.72
|
|
1.51
|
|
1.39
|
|
1.26
|
|
1.04
|
|
|||||||||
|
Less: net loss attributable to noncontrolling interest
|
(0.01
|
)
|
—
|
|
—
|
|
—
|
|
—
|
|
|||||||||
|
Net income attributable to LKQ stockholders
|
$
|
1.73
|
|
$
|
1.51
|
|
$
|
1.39
|
|
$
|
1.26
|
|
$
|
1.04
|
|
||||
|
Diluted earnings per share:
(6)
|
|||||||||||||||||||
|
Income from continuing operations
|
$
|
1.73
|
|
$
|
1.47
|
|
$
|
1.38
|
|
$
|
1.25
|
|
$
|
1.02
|
|
||||
|
Net (loss) income from discontinued operations
|
(0.02
|
)
|
0.03
|
|
—
|
|
—
|
|
—
|
|
|||||||||
|
Net income
|
1.71
|
|
1.50
|
|
1.38
|
|
1.25
|
|
1.02
|
|
|||||||||
|
Less: net loss attributable to noncontrolling interest
|
(0.01
|
)
|
—
|
|
—
|
|
—
|
|
—
|
|
|||||||||
|
Net income attributable to LKQ stockholders
|
$
|
1.72
|
|
$
|
1.50
|
|
$
|
1.38
|
|
$
|
1.25
|
|
$
|
1.02
|
|
||||
|
Weighted average shares outstanding-basic
|
308,607
|
|
306,897
|
|
304,722
|
|
302,343
|
|
299,574
|
|
|||||||||
|
Weighted average shares outstanding-diluted
|
310,649
|
|
309,784
|
|
307,496
|
|
306,045
|
|
304,131
|
|
|||||||||
28
|
Year Ended December 31,
|
|||||||||||||||||||
|
(in thousands)
|
2017
|
2016
|
2015
|
2014
|
2013
|
||||||||||||||
|
(1)
|
(2)
|
(3)
|
(4)
|
(5)
|
|||||||||||||||
|
Other Financial Data:
|
|||||||||||||||||||
|
Net cash provided by operating activities
|
$
|
518,900
|
|
$
|
635,014
|
|
$
|
544,282
|
|
$
|
388,711
|
|
$
|
446,404
|
|
||||
|
Net cash used in investing activities
|
(384,595
|
)
|
(1,709,928
|
)
|
(329,993
|
)
|
(920,994
|
)
|
(505,606
|
)
|
|||||||||
|
Net cash (used in) provided by financing activities
|
(112,567
|
)
|
1,225,737
|
|
(238,537
|
)
|
501,189
|
|
147,593
|
|
|||||||||
|
Capital expenditures
|
179,090
|
|
207,074
|
|
170,490
|
|
140,950
|
|
90,186
|
|
|||||||||
|
Cash paid for acquisitions, net of cash acquired
|
513,088
|
|
1,349,339
|
|
160,517
|
|
775,921
|
|
408,384
|
|
|||||||||
|
Depreciation and amortization
|
230,203
|
|
206,086
|
|
128,192
|
|
125,437
|
|
86,463
|
|
|||||||||
|
Balance Sheet Data:
|
|||||||||||||||||||
|
Total assets
|
$
|
9,366,872
|
|
$
|
8,303,199
|
|
$
|
5,647,837
|
|
$
|
5,475,739
|
|
$
|
4,438,058
|
|
||||
|
Working capital
(7)
|
2,499,410
|
|
2,045,273
|
|
1,588,742
|
|
1,491,169
|
|
1,062,926
|
|
|||||||||
|
Long-term obligations, including current portion
|
3,403,980
|
|
3,341,771
|
|
1,584,702
|
|
1,846,148
|
|
1,287,242
|
|
|||||||||
|
Total Company stockholders' equity
|
4,198,169
|
|
3,442,949
|
|
3,114,682
|
|
2,720,657
|
|
2,350,745
|
|
|||||||||
|
(1)
|
I
ncludes the results of operations of
26
businesses from their respective acquisition dates in 2017.
|
|
(2)
|
Includes the results o
f operations of: (i) Rhiag, from its acquisition effective March 18, 2016; (ii) the aftermarket automotive glass distribution business of Pittsburgh Glass Works LLC ("PGW autoglass"), from its acquisition effective April 21, 2016; and (iii) 13 other businesses from their respective acquisition dates in 2016.
|
|
(3)
|
Includes the results of operations of 18 businesses from their respective acquisition dates in 2015.
|
|
(4)
|
Includes the results of operations of Keystone Specialty from its acquisition effective January 3, 2014 and
22
other businesses from their respective acquisition dates in 2014.
|
|
(5)
|
Includes the results of operations of Sator from its acquisition effective May 1, 2013 and
19
other businesses from their respective acquisition dates in 2013.
|
|
(6)
|
The sum of the individual earnings per share amounts may not equal the total due to rounding.
|
|
(7)
|
Working capital amounts exclude assets and liabilities of discontinued operations.
|
29
|
ITEM 7.
|
MANAGEMENT'S DISCUSSION AND ANALYSIS OF FINANCIAL CONDITION AND RESULTS OF OPERATIONS
|
Overview
We are a global distributor of vehicle products, including replacement parts, components and systems used in the repair and maintenance of vehicles and specialty products and accessories to improve the performance, functionality and appearance of vehicles.
Buyers of vehicle replacement products have the option to purchase from primarily five sources: new products produced by original equipment manufacturers ("OEMs"); new products produced by companies other than the OEMs, which are referred to as aftermarket products; recycled products obtained from salvage vehicles; used products that have been refurbished; and used products that have been remanufactured. We distribute a variety of products to collision and mechanical repair shops, including aftermarket collision and mechanical products; recycled collision and mechanical products; refurbished collision products such as wheels, bumper covers and lights; and remanufactured engines. Collectively, we refer to the four sources that are not new OEM products as alternative parts.
We are a leading provider of alternative vehicle collision replacement products and alternative vehicle mechanical replacement products, with our sales, processing, and distribution facilities reaching most major markets in the United States and Canada. We are also a leading provider of alternative vehicle replacement and maintenance products in Europe. In addition to our wholesale operations, we operate self service retail facilities across the U.S. that sell recycled automotive products from end-of-life-vehicles. We are also a leading distributor of specialty vehicle aftermarket equipment and accessories reaching most major markets in the U.S. and Canada.
We are organized into
four
operating segments: Wholesale – North America; Europe; Specialty and Self Service. We aggregate our Wholesale – North America and Self Service operating segments into one reportable segment, North America, resulting in
three
reportable segments: North America, Europe and Specialty.
Our operating results have fluctuated on a quarterly and annual basis in the past and can be expected to continue to fluctuate in the future as a result of a number of factors, some of which are beyond our control. Please refer to the factors discussed in Forward-Looking Statements in Part I, Item 1 and Risk Factors in Part I, Item 1A of this Annual Report on Form 10-K. Due to these factors and others, which may be unknown to us at this time, our operating results in future periods can be expected to fluctuate. Accordingly, our historical results of operations may not be indicative of future performance.
Acquisitions and Investments
Since our inception in 1998, we have pursued a growth strategy through both organic growth and acquisitions. We have pursued acquisitions that we believe will help drive profitability, cash flow and stockholder value. We target companies that are market leaders, will expand our geographic presence and will enhance our ability to provide a wide array of vehicle products to our customers through our distribution network.
On July 3, 2017, we acquired four aftermarket parts distribution businesses in Belgium. The objective of these acquisitions is to transform the existing three-step distribution model in Belgium to a two-step distribution model to align with our Netherlands operations.
On November 1, 2017, we acquired Warn Industries, Inc. ("Warn"), a leading designer, manufacturer and marketer of high performance vehicle equipment and accessories. We expect the acquisition of Warn to expand LKQ's presence in the specialty market and create viable points of entry into related markets.
In addition to the aftermarket parts distribution businesses acquired in Belgium and the acquisition of Warn, during the year ended December 31, 2017, we completed 21 acquisitions, including 6 wholesale businesses in North America, 12 wholesale businesses in Europe and 3 Specialty vehicle aftermarket businesses.
On December 10, 2017, LKQ and its wholly-owned subsidiary LKQ German Holdings GmbH entered into an agreement to acquire Stahlgruber, a leading European wholesale distributor of aftermarket spare parts for passenger cars, tools, capital equipment and accessories with operations in Germany, Austria, Czech Republic, Italy, Slovenia, and Croatia with further sales to Switzerland. The transaction is expected to be completed in the first half of 2018 and is subject to regulatory approvals. This acquisition will expand LKQ's geographic presence in continental Europe and serve as an additional strategic hub for our European operations. In addition, we believe this acquisition will allow for continued improvement in procurement, logistics and infrastructure optimization.
On March 18, 2016, we acquired Rhiag, a distributor of aftermarket spare parts for passenger cars and commercial vehicles in Italy, Czech Republic, Switzerland, Hungary, Romania, Ukraine, Bulgaria, Slovakia, Poland and Spain. This acquisition expanded LKQ's geographic presence in continental Europe, and we believe the acquisition will generate potential procurement synergies in our Europe segment.
30
On April 21, 2016, we acquired PGW, a leading global distributor and manufacturer of automotive glass products. PGW’s business comprised aftermarket automotive replacement glass distribution services and automotive glass manufacturing. On March 1, 2017, we sold the automotive glass manufacturing component of PGW. Unless otherwise noted, the discussion related to PGW throughout Part II, Item 7 of this annual report on Form 10-K refers to the aftermarket glass distribution operations of PGW, PGW autoglass, which is included within continuing operations. See
Note 3, "Discontinued Operations
" in Item 8 of this annual report on Form 10-K for further information related to our discontinued operations. The acquisition of PGW autoglass expanded our addressable market in North America. Additionally, we believe the acquisition will create potential distribution synergies with our existing network.
In October 2016, we acquired substantially all of the business assets of Andrew Page Limited ("Andrew Page"), a distributor of aftermarket automotive parts in the United Kingdom. The U.K. Competition and Markets Authority ("CMA") concluded its review of this acquisition on October 31, 2017 and determined that we must divest less than 10% of the acquired locations.
In addition to our acquisitions of Rhiag, PGW autoglass, and Andrew Page, we acquired seven wholesale businesses in Europe and five wholesale businesses in North America during the year ended December 31, 2016.
On December 1, 2016, we acquired a 26.5% equity interest in Mekonomen AB ("Mekonomen"), the leading independent car parts and service chain in the Nordic region of Europe, offering a wide range of quality products including spare parts and accessories for cars, and workshop services for consumers and businesses. We are accounting for our interest in Mekonomen using the equity method of accounting, as our investment gives us the ability to exercise significant influence, but not control, over the investee.
During the year ended December 31, 2015, we completed 18 acquisitions, including 4 wholesale businesses in North America and 12 wholesale businesses in Europe, a self service retail operation, and a specialty vehicle aftermarket business. Our wholesale business acquisitions in North America included PartsChannel, Inc. (“Parts Channel”), an aftermarket collision parts distributor. The specialty aftermarket business acquired was The Coast Distribution System, Inc. (“Coast”), a supplier of replacement parts, supplies and accessories for the recreational vehicle ("RV") and outdoor recreation markets. Our European acquisitions included 11 aftermarket parts distribution businesses in the Netherlands, 9 of which were former customers of and distributors for our Netherlands subsidiary, Sator, and were acquired with the objective of expanding our distribution network in the Netherlands. Our other acquisitions completed in 2015 enabled us to expand our geographic presence.
See Note 2, "Business Combinations" to the consolidated financial statements in Part II, Item 8 of this Annual Report on Form 10-K for additional information related to our acquisitions.
Sources of Revenue
We report our revenue in two categories: (i) parts and services and (ii) other. Our parts revenue is generated from the sale of vehicle products including (i) aftermarket, other new and refurbished products and (ii) recycled, remanufactured and related products. Our service revenue is generated primarily from the sale of extended warranties, fees for admission to our self service yards, and processing fees related to the secure disposal of vehicles. During the
year ended
December 31, 2017
, parts and services revenue represented approximately
95%
of our consolidated revenue.
The majority of our parts and services revenue is generated from the sale of vehicle replacement products to collision and mechanical repair shops. In our North America segment, our vehicle replacement products include sheet metal crash parts such as doors, hoods, and fenders; bumper covers; head and tail lamps; automotive glass products such as windshields; mirrors and grills; wheels; and large mechanical items such as engines and transmissions. In our Europe segment, our products include a wide variety of small mechanical products such as filters, belts and hoses, spark plugs, alternators and water pumps, batteries, suspension and brake parts, clutches, and oil and lubricants. The demand for these products is influenced by several factors, including the number of vehicles in operation, the number of miles being driven, the frequency and severity of vehicle accidents, the age profile of vehicles in accidents, seasonal weather patterns and local weather conditions, and the availability and pricing of new OEM parts. With respect to collision related products, automobile insurers exert significant influence over collision repair shops as to how an insured vehicle is repaired and the cost level of the products used in the repair process. Accordingly, we consider automobile insurers to be key demand drivers of our vehicle replacement products in North America. While they are not our direct customers, we do provide insurance carriers services in an effort to promote the increased usage of alternative replacement products in the repair process. Such services include the review of vehicle repair order estimates, direct quotation services to insurance company adjusters and an aftermarket parts quality and service assurance program. We neither charge a fee to the insurance carriers for these services nor adjust our pricing to our customers when we perform these services for insurance carriers. There is no standard price for many of our vehicle replacement products, but rather a pricing structure that varies from day to day based upon such factors as new OEM product prices, product availability, quality, demand, the age and mileage of the vehicle from which the part was obtained (in the case of recycled products), competitor pricing and our product cost.
31
Our revenue from aftermarket, other new and refurbished products also includes revenue generated from the sale of specialty aftermarket vehicle equipment and accessories. These products are primarily sold to a large customer base of specialty vehicle retailers and equipment installers, including mostly independent, single-site operators. Specialty vehicle aftermarket products are typically installed on vehicles within the first three years of ownership to enhance functionality, performance or aesthetics. As a result, the demand for these products is influenced by new and used vehicle sales and the overall economic health of vehicle owners, which may be affected by general business conditions, interest rates, inflation, consumer debt levels and other matters that influence consumer confidence and spending. The prices for our specialty vehicle products are based on manufacturers' suggested retail prices, with discounts applied based on prevailing market conditions, customer volumes and promotions that we may offer from time to time.
For the
year ended
December 31, 2017
, re
venue from other sources represented approximately
5%
of our consolidated sales. These other sources include scrap sales, bulk sales to mechanical manufacturers (including cores) and sales of aluminum ingots and sows from our furnace operations. We derive scrap metal from several sources, including vehicles that have been used in both our wholesale and self service recycling operations and from OEMs and other entities that contract with us for secure disposal of "crush only" vehicles. Other revenue will vary from period to period based on fluctuations in commodity prices and the volume of materials sold.
Cost of Goods Sold
Our cost of goods sold for aftermarket products includes the price we pay for the parts, freight, and overhead costs related to the purchasing, warehousing and distribution of our inventory, including labor, facility and equipment costs and depreciation. Our aftermarket products are acquired from a number of vendors. Our cost of goods sold for refurbished products includes the price we pay for cores, freight, and costs to refurbish the parts, including direct and indirect labor, facility and equipment costs, depreciation and other overhead related to our refurbishing operations.
For recycled products, our cost of goods sold includes the price we pay for the salvage vehicle and, where applicable, auction, towing and storage fees. Prices for salvage vehicles may be impacted by a variety of factors, including the number of buyers competing to purchase the vehicles, the demand and pricing trends for used vehicles, the number of vehicles designated as “total losses” by insurance companies, the production level of new vehicles (which provides the source from which salvage vehicles ultimately come), the age of vehicles at auction and the status of laws regulating bidders or exporters of salvage vehicles. From time to time, we may also adjust our buying strategy to target vehicles with different attributes (for example, age, level of damage, and revenue potential). Due to changes relating to these factors, we have seen the prices we pay for salvage vehicles fluctuate over time. Our cost of goods sold also includes labor and other costs we incur to acquire and dismantle such vehicles. Our labor and labor-related costs related to acquisition and dismantling generally account for between 10% and 15% of our cost of goods sold for vehicles we dismantle. The acquisition and dismantling of salvage vehicles is a manual process and, as a result, energy costs are not material.
Included in our cost of goods sold for remanufactured products is the price we pay for cores; freight; and costs to remanufacture the products, including direct and indirect labor, facility and equipment costs, depreciation and other overhead related to our remanufacturing operations.
Some of our salvage mechanical products are sold with a standard six-month warranty against defects. Additionally, some of our remanufactured engines are sold with a standard three-year warranty against defects. We also provide a limited lifetime warranty for certain of our aftermarket products that is supported by certain of the suppliers of those products. We record the estimated warranty costs at the time of sale using historical warranty claims information to project future warranty claims activity and related expenses.
Other revenue is primarily generated from the hulks and unusable parts of the vehicles we acquire for our wholesale and self service recycled product operations, and therefore, the costs of these sales include the proportionate share of the price we pay for the salvage vehicles as well as the applicable auction, storage and towing fees and internal costs to purchase and dismantle the vehicles. Our cost of goods sold for other revenue will fluctuate based on the prices paid for salvage vehicles, which may be impacted by a variety of factors as discussed above.
Expenses
Our facility and warehouse expenses primarily include our costs to operate our aftermarket warehouses, salvage yards and self service retail facilities. These costs include personnel expenses such as wages, incentive compensation and employee benefits for plant management and facility and warehouse personnel, as well as rent for our facilities and related utilities, property taxes, and repairs and maintenance. The costs included in facility and warehouse expenses do not relate to inventory processing or conversion activities and, as such, are classified below the gross margin line on our Consolidated Statements of Income.
Our distribution expenses primarily include our costs to prepare and deliver our products to our customers. Included in our distribution expense category are personnel costs such as wages, employee benefits and incentive compensation for drivers;
32
third party freight costs; fuel; and expenses related to our delivery and transfer trucks, including vehicle leases, repairs and maintenance, and insurance.
Our selling and marketing expenses primarily include salary, commission and other incentive compensation expenses for sales personnel; advertising, promotion and marketing costs; credit card fees; telephone and other communication expenses; and bad debt expense. Personnel costs account for the vast majority of our selling and marketing expenses. Most of our sales personnel are paid on a commission basis. The number and quality of our sales force is critical to our ability to respond to our customers’ needs and increase our sales volume. Our objective is to continually evaluate our sales force, develop and implement training programs, and utilize appropriate measurements to assess our selling effectiveness.
Our general and administrative expenses primarily include the costs of our corporate offices and field support center, which provide management, treasury, accounting, legal, payroll, business development, human resources and information systems functions. General and administrative expenses include wages, benefits, stock-based compensation and other incentive compensation for corporate, regional and administrative personnel; information systems support and maintenance expenses; and accounting, legal and other professional fees.
Seasonality
Our operating results are subject to quarterly variations based on a variety of factors, influenced primarily by seasonal changes in weather patterns. During the winter months, we tend to have higher demand for our vehicle replacement products because there are more weather related repairs. Our specialty vehicle operations typically generate greater revenue and earnings in the first half of the year, when vehicle owners tend to install this equipment. Our aftermarket glass operations typically generate greater revenue and earnings in the second and third quarters, when the demand for automotive replacement glass increases after the winter weather.
Critical Accounting Policies and Estimates
The discussion and analysis of our financial condition and results of operations are based upon our consolidated financial statements, which have been prepared in accordance with accounting principles generally accepted in the United States of America ("GAAP"). The preparation of these financial statements requires us to make estimates, assumptions and judgments that affect the reported amounts of assets, liabilities, revenue and expenses, and related disclosure of contingent assets and liabilities. On an ongoing basis, we evaluate our estimates, assumptions, and judgments, including those related to revenue recognition, inventory valuation, business combinations and goodwill impairment. We base our estimates on historical experience and on various other assumptions that we believe are reasonable under the circumstances. The results of these estimates form the basis for our judgments about the carrying values of assets and liabilities and our recognition of revenue. Actual results may differ from these estimates.
Revenue Recognition
We recognize and report revenue from the sale of vehicle products when they are shipped to or picked up by the customers and title has transferred, subject to an allowance for estimated returns, discounts and allowances that management estimates based upon historical information. In instances where a product is returned by a customer, the product would ordinarily be returned within a few days of shipment. We analyze historical returns and allowances activity by comparing the items to the original invoice amounts and dates. We use this information to project future returns and allowances on products sold. If actual returns and allowances are higher than our historical experience, there would be an adverse impact on our operating results in the period of occurrence. In addition, our customers may earn discounts for prompt payment or may earn a discount or rebate upon achievement of sales volumes. We analyze historical and current sales volume activity to estimate and record a liability for any discounts or rebates that we e
xpect customers to earn. Any rebates earned are generally applied as a credit to the customer’s receivable account.
We recognize revenue from the sale of scrap metal, other metals, and cores when title has transferred, which typically occurs upon delivery to the customer.
Inventory Accounting
Salvage and Remanufactured Inventory
. Our salvage inventory cost is established based upon the price we pay for a vehicle, including auction, towing and storage fees, as well as expenditures for buying and dismantling vehicles. Inventory carrying value is determined using the average cost to sales percentage at each of our facilities and applying that percentage to the facility's inventory at expected selling prices, the assessment of which incorporates the sales probability based on a part's days in stock and historical demand. The average cost to sales percentage is derived from each facility's historical profitability for salvage vehicles. Remanufactured inventory cost is based upon the price paid for cores, and also includes expenses incurred for freight, direct manufacturing costs and overhead related to our remanufacturing operations.
33
For all inventory, carrying value is recorded at the lower of cost or net realizable value and is reduced to reflect current anticipated demand. If actual demand differs from our estimates, additional reductions to inventory carrying value would be necessary in the period such determination is made.
Business Combinations
We record our acquisitions using the purchase method of accounting, under which the acquisition purchase price is allocated to the assets acquired and liabilities assumed based upon their respective fair values. We utilize management estimates and, in some instances, independent third-party valuation firms to assist in determining the fair values of assets acquired, liabilities assumed and contingent consideration granted. Such estimates and valuations require us to make significant assumptions, including projections of future events and operating performance.
Goodwill Impairment
We are required to test our goodwill for impairment at least annually. When testing goodwill for impairment, we are required to evaluate events and circumstances that may affect the performance of the reporting unit and the extent to which the events and circumstances may impact the future cash flows of the reporting unit to determine whether the fair value of the assets exceed the carrying value. If these assumptions or estimates change in the future, we may be required to record impairment charges for these assets. In response to changes in industry and market conditions, we may be required to strategically realign our resources and consider restructuring, disposing of, or otherwise exiting businesses, which could result in an impairment of goodwill.
We perform goodwill impairment tests annually in the fourth quarter and between annual tests whenever events indicate that an impairment may exist
. During
2017
, we did not identify any events or changes in circumstances that would more likely than not reduce the fair value of our reporting units below their carrying amounts. Therefore, we did not perform any impairment tests other than our annual test in the fourth quarter of
2017
.
As of the date of our annual goodwill impairment test, we were organized into five reporting units: Wholesale - North America, Europe, Specialty, Self Service and Aviation. Our Aviation reporting unit resulted from an acquisition of a small wholesale business in North America completed in 2017.
Our goodwill would be considered impaired if the net book value of a reporting unit exceeded its estimated fair value. The fair value estimates are established using weightings of the results of a discounted cash flow methodology and a comparative market multiples approach. We believe that using two methods to determine fair value limits the chances of an unrepresentative valuation. As of
December 31, 2017
, we had a total of
$3.5 billion
in goodwill subject to future impairment tests. We determined that no adjustments were necessary when we performed our annual impairment testing in the fourth quarter of
2017
on all five reporting units. We noted that the fair value estimate for the Aviation reporting unit exceeded the carrying value by less than 10%. This result aligns with our expectations as there has not been a significant change in the value of the business since the acquisition date in March 2017 while we continue to execute our business plan. All other reporting units had a fair value estimate which exceeded the carrying value by at least 25%. If we were required to recognize goodwill impairments, we would report those impairment losses as part of our operating results.
Recently Issued Accounting Pronouncements
See “Recent Accounting Pronouncements” in
Note 4, "Summary of Significant Accounting Policies
" to the consolidated financial statements in Part II, Item 8 of this Annual Report on Form 10-K for information related to new accounting standards.
Financial Information by Geographic Area
See
Note 14, "Segment and Geographic Information
" to the consolidated financial statements in Part II, Item 8 of this Annual Report on Form 10-K for information related to our revenue and long-lived assets by geographic region.
34
Results of Operations—Consolidated
The following table sets forth statements of income data as a percentage of total revenue for the periods indicated:
|
Year Ended December 31,
|
||||||||
|
|
2017
|
2016
|
2015
|
|||||
|
Revenue
|
100.0
|
%
|
100.0
|
%
|
100.0
|
%
|
||
|
Cost of goods sold
|
61.0
|
%
|
61.0
|
%
|
60.6
|
%
|
||
|
Gross margin
|
39.0
|
%
|
39.0
|
%
|
39.4
|
%
|
||
|
Facility and warehouse expenses
|
8.2
|
%
|
8.0
|
%
|
7.7
|
%
|
||
|
Distribution expenses
|
8.1
|
%
|
8.0
|
%
|
8.4
|
%
|
||
|
Selling, general and administrative expenses
|
11.6
|
%
|
11.5
|
%
|
11.5
|
%
|
||
|
Restructuring and acquisition related expenses
|
0.2
|
%
|
0.4
|
%
|
0.3
|
%
|
||
|
Depreciation and amortization
|
2.3
|
%
|
2.2
|
%
|
1.7
|
%
|
||
|
Operating income
|
8.7
|
%
|
8.9
|
%
|
9.8
|
%
|
||
|
Other expense, net
|
0.8
|
%
|
1.0
|
%
|
0.8
|
%
|
||
|
Income from continuing operations before provision for income taxes
|
7.9
|
%
|
7.9
|
%
|
9.0
|
%
|
||
|
Provision for income taxes
|
2.4
|
%
|
2.6
|
%
|
3.1
|
%
|
||
|
Equity in earnings (loss) of unconsolidated subsidiaries
|
0.1
|
%
|
(0.0
|
)%
|
(0.1
|
)%
|
||
|
Income from continuing operations
|
5.5
|
%
|
5.3
|
%
|
5.9
|
%
|
||
|
Net (loss) income from discontinued operations
|
(0.1
|
)%
|
0.1
|
%
|
—
|
%
|
||
|
Net income
|
5.4
|
%
|
5.4
|
%
|
5.9
|
%
|
||
|
Less: net loss attributable to noncontrolling interest
|
(0.0
|
)%
|
—
|
%
|
—
|
%
|
||
|
Net income attributable to LKQ stockholders
|
5.5
|
%
|
5.4
|
%
|
5.9
|
%
|
||
|
Note: In the table above, the sum of the individual percentages may not equal the total due to rounding.
|
||||||||
Year Ended
December 31, 2017
Compared to Year Ended
December 31, 2016
Revenue.
The following table summarizes the changes in revenue by category (in thousands):
|
Year Ended December 31,
|
Percentage Change in Revenue
|
||||||||||||||||||
|
2017
|
2016
|
Organic
|
Acquisition
|
Foreign Exchange
|
Total Change
|
||||||||||||||
|
Parts & services revenue
|
$
|
9,208,634
|
|
$
|
8,144,645
|
|
4.1
|
%
|
9.1
|
%
|
(0.1
|
)%
|
13.1
|
%
|
|||||
|
Other revenue
|
528,275
|
|
439,386
|
|
19.6
|
%
|
0.7
|
%
|
0.0
|
%
|
20.2
|
%
|
|||||||
|
Total revenue
|
$
|
9,736,909
|
|
$
|
8,584,031
|
|
4.9
|
%
|
8.7
|
%
|
(0.1
|
)%
|
13.4
|
%
|
|||||
|
Note: In the table above, the sum of the individual percentages may not equal the total due to rounding.
|
|||||||||||||||||||
The change in parts and services revenue of 13.1% represented increases in segment revenue of 6.7% in North America, 24.5% in Europe, and 6.7% in Specialty. The increase in other revenue of 20.2% primarily consisted of an $86 million organic increase in other revenue, which was largely attributable to our North America segment. Refer to the discussion of our segment results of operations for factors contributing to the change in revenue by segment during 2017 compared to the prior year.
Cost of Goods Sold
. Cost of goods sold remained flat at 61.0% of revenue for the years ended December 31, 2017 and 2016. Cost of goods sold decreased 0.3% as a result of our North America segment, primarily related to our salvage operations. Offsetting this decrease were roughly equal increases in cost of goods sold in our Europe and Specialty segments. Refer to the discussion of our segment results of operations for factors contributing to the changes in cost of goods sold as a percentage of revenue by segment for the year ended December 31, 2017 compared to the year ended December 31, 2016.
Facility and Warehouse Expenses
. As a percentage of revenue, facility and warehouse expenses increased to 8.2% in 2017 from 8.0% in 2016, primarily as a result of increased personnel costs in our North America segment.
Distribution Expenses.
As a percentage of revenue, distribution expenses increased to 8.1% in 2017 from 8.0% in 2016. The increase reflected a number of individually insignificant fluctuations in distribution expense as a percentage of revenue across all of our segments.
35
Selling, General and Administrative Expenses.
Our, selling, general and administrative ("SG&A") expenses as a percentage of revenue for the
year ended
December 31, 2017 increased to 11.6% in 2017 from 11.5% in 2016, primarily as a result of a 0.3% increase attributable to our Europe segment. Partially offsetting this increase were decreases in SG&A expense as a percentage of revenue in our North America segment and to a lesser extent, our Specialty segment. Refer to the discussion of our segment results of operations for factors contributing to the changes in SG&A expenses as a percentage of revenue by segment for the year ended December 31, 2017 compared to the year ended December 31, 2016.
Restructuring and Acquisition Related Expenses
. The following table summarizes restructuring and acquisition related expenses for the periods indicated (in thousands):
|
Year Ended December 31,
|
|||||||||||
|
2017
|
2016
|
Change
|
|||||||||
|
Restructuring expenses
|
$
|
5,012
|
|
(1)
|
$
|
15,782
|
|
(2)
|
$
|
(10,770
|
)
|
|
Acquisition related expenses
|
14,660
|
|
(3)
|
21,980
|
|
(4)
|
(7,320
|
)
|
|||
|
Total restructuring and acquisition related expenses
|
$
|
19,672
|
|
$
|
37,762
|
|
$
|
(18,090
|
)
|
||
|
(1)
|
Restructuring expenses for the year ended December 31, 2017 included $2 million, $2 million, and $1 million related to the integration of acquired businesses in our North America, Specialty, and Europe segments. These integration activities included the closure of duplicate facilities and termination of employees.
|
|
(2)
|
Restructuring expenses for the year ended December 31, 2016 included $10 million, $3 million, $2 million related to the integration of acquired businesses in our Specialty, North America and Europe segments, respectively. These integration activities included the closure of duplicate facilities and termination of employees.
|
|
(3)
|
Acquisition related expenses for the year ended December 31, 2017 included $5 million of costs for our acquisition of Andrew Page, primarily related to legal and other professional fees associated with the CMA review. The remaining acquisition related costs for the year ended December 31, 2017 consisted of external costs for completed acquisitions; pending acquisitions as of December 31, 2017, including $4 million related to Stahlgruber; and potential acquisitions that were terminated.
|
|
(4)
|
Acquisition related expenses for the year ended December 31, 2016 reflect $11 million and $4 million related to the acquisitions of Rhiag and PGW autoglass, respectively. The remaining $7 million of expense was related to other completed acquisitions and acquisitions that were pending as of December 31, 2016.
|
See
Note 5, "Restructuring and Acquisition Related Expenses
" to the consolidated financial statements in Part II, Item 8 of this Annual Report on Form 10-K for further information on our restructuring and integration plans.
Depreciation and Amortization
. The following table summarizes depreciation and amortization for the periods indicated (in thousands):
|
Year Ended December 31,
|
||||||||||||
|
2017
|
2016
|
Change
|
||||||||||
|
Depreciation
|
$
|
117,859
|
|
$
|
107,945
|
|
$
|
9,914
|
|
(1)
|
||
|
Amortization
|
101,687
|
|
83,488
|
|
18,199
|
|
(2)
|
|||||
|
Total depreciation and amortization
|
$
|
219,546
|
|
$
|
191,433
|
|
$
|
28,113
|
|
|||
|
(1)
|
The increase in depreciation expense primarily reflected increases of $4 million and $2 million for property, plant and equipment recorded for our acquisitions of Andrew Page and Rhiag, respectively. Depreciation expense increased in 2017 for Andrew Page and Rhiag primarily due to both acquisitions having a full year of results in 2017 compared to a partial year in 2016 (from acquisition dates of October 4, 2016 and March 18, 2016, respectively, through December 31, 2016). The remaining change primarily reflected increased levels of property, plant and equipment to support our organic related growth.
|
|
(2)
|
The increase primarily reflected incremental amortization expense of (i) $14 million related to intangibles recorded for our acquisition of Rhiag and (ii) $3 million related to intangibles recorded for acquisitions within our Benelux operations during 2017.
|
Other Expense, Net.
The following table summarizes the components of the year-over-year decrease in other expense, net (in thousands):
36
|
Other expense, net for the year ended December 31, 2016
|
$
|
86,117
|
|
||
|
Increase (decrease) due to:
|
|||||
|
Interest expense
|
13,377
|
|
(1)
|
||
|
Loss on debt extinguishment
|
(26,194
|
)
|
(2)
|
||
|
Gain on foreign exchange contracts - acquisition related
|
18,342
|
|
(3)
|
||
|
Gains on bargain purchases
|
4,337
|
|
(4)
|
||
|
Interest and other income, net
|
(15,288
|
)
|
(5)
|
||
|
Net decrease
|
(5,426
|
)
|
|||
|
Other expense, net for the year ended December 31, 2017
|
$
|
80,691
|
|
||
|
(1)
|
Additional interest primarily related to borrowings used to fund our acquisitions of Rhiag and PGW.
|
|
(2)
|
During the first quarter of 2016, we incurred a $24 million loss on debt extinguishment as a result of our early payment of Rhiag debt assumed as part of the acquisition, and we incurred a $3 million loss on debt extinguishment as a result of our January 2016 amendment to our senior secured credit agreement. We incurred an immaterial loss on debt extinguishment as a result of our December 2017 amendment to our senior secured credit agreement.
|
|
(3)
|
In March 2016, we entered into foreign currency forward contracts to acquire a total of €588 million used to fund the purchase price of the Rhiag acquisition. The rates under the foreign currency forwards were favorable to the spot rate on the date the funds were drawn to complete the acquisition, and as a result, these derivatives contracts generated a gain of $18 million.
|
|
(4)
|
In October 2016, we acquired Andrew Page out of receivership. We recorded a gain on bargain purchase of $8 million in the fourth quarter of 2016, as the fair value of the net assets acquired exceeded the purchase price. During the year ended December 31, 2017, we increased the gain on bargain purchase for this acquisition by $2 million as a result of changes to our estimate of the fair value of net assets acquired. We also recorded a gain on bargain purchase for another acquisition in Europe completed in the second quarter of 2017.
|
|
(5)
|
Interest and other income, net was higher in 2017 primarily due to the impact of foreign currency transaction gains and losses, which had a net $6 million favorable impact compared to the prior year period. This primarily included unrealized gains and losses on foreign currency transactions and unrealized mark-to-market gains and losses on foreign currency forward contracts used to hedge the purchases of inventory in our U.K. operations. Additionally, there was a $4 million gain due to a decrease in the fair value of contingent consideration liabilities. The remaining change related to miscellaneous other income.
|
Provision for Income Taxes
. Our effective income tax rate was
30.7%
for the
year ended
December 31, 2017, compared to 32.6% for the
year ended
December 31, 2016. The following table summarizes the components of our provision for income taxes for the periods indicated (in thousands):
|
Year Ended December 31,
|
||||||||
|
2017
|
2016
|
|||||||
|
Base provision for income taxes
|
$
|
266,403
|
|
$
|
235,355
|
|
(1)
|
|
|
Excess tax benefits from stock-based payments
|
(8,000
|
)
|
(11,441
|
)
|
(2)
|
|||
|
U.S. tax reform deferred tax rate adjustment
|
(72,988
|
)
|
—
|
|
(3)
|
|||
|
U.S. tax reform transition tax on foreign earnings
|
50,800
|
|
—
|
|
(4)
|
|||
|
Other discrete items
|
(655
|
)
|
(3,348
|
)
|
||||
|
Provision for income taxes
|
$
|
235,560
|
|
$
|
220,566
|
|
||
|
(1)
|
Excluding the impact of discrete items, our annual effective tax rate has been close to 35% over the prior two years. We are still evaluating the impact of the Tax Act on our future U.S. tax liability, but at this time, we expect that the overall impact of the Tax Act on our effective tax rate will be a decrease in the rate from previous years.
|
|
(2)
|
Represents a discrete item for excess tax benefits received upon the exercise of stock options or vesting of RSUs.
|
|
(3)
|
Represents the provisional estimate of the revaluation of deferred tax assets and liabilities as a result of the Tax Act which reduced the U.S. federal corporate tax rate.
|
|
(4)
|
Represents the provisional estimate of the one-time transition tax on the mandatory deemed repatriation of cumulative foreign earnings as of December 31, 2017 as a result of the Tax Act.
|
37
For further discussion of the Tax Act, see Note 13, "Income Taxes," included in Part II, Item 8 of this Annual Report on Form 10-K.
Equity in Earnings (Loss) of Unconsolidated Subsidiaries.
Equity in earnings of unconsolidated subsidiaries for the year ended December 31, 2017 primarily related to our investment in Mekonomen.
Foreign Currency Impact.
We translate our statements of income at the average exchange rates in effect for the period. During the year ended December 31, 2017, the pound sterling rate used to translate the 2017 statements of income declined by 4.9%, while both the Canadian dollar rate and euro rate increased by 2.1% compared to the year ended December 31, 2016. The translation effect of the change in these currencies against the U.S. dollar and realized and unrealized currency losses for the year ended December 31, 2017 resulted in a $0.01 negative effect on diluted earnings per share from continuing operations relative to the prior year.
Net (Loss) Income from Discontinued Operations.
During the year ended December 31, 2017 we recorded a loss from discontinued operations, net of tax totaling $7 million, of which $6 million was for the loss on sale of discontinued operations, compared to income from discontinued operations, net of tax totaling $8 million for the year ended December 31, 2016. Discontinued operations for 2017 and 2016 represents the automotive glass manufacturing business of PGW, which we acquired in April 2016 and sold on March 1, 2017.
Net Income Attributable to Noncontrolling Interest.
During the year ended December 31, 2017, we allocated a loss of $4 million to the noncontrolling interest of an immaterial subsidiary.
38
Year Ended December 31, 2016 Compared to Year Ended December 31, 2015
Revenue.
The following table summarizes the changes in revenue by category (amounts in thousands):
|
Year Ended December 31,
|
Percentage Change in Revenue
|
||||||||||||||||||
|
2016
|
2015
|
Organic
|
Acquisition
|
Foreign Exchange
|
Total Change
|
||||||||||||||
|
Parts & services revenue
|
$
|
8,144,645
|
|
$
|
6,713,951
|
|
4.8
|
%
|
19.0
|
%
|
(2.5
|
)%
|
21.3
|
%
|
|||||
|
Other revenue
|
439,386
|
|
478,682
|
|
(11.2
|
)%
|
3.1
|
%
|
(0.2
|
)%
|
(8.2
|
)%
|
|||||||
|
Total revenue
|
$
|
8,584,031
|
|
$
|
7,192,633
|
|
3.7
|
%
|
18.0
|
%
|
(2.4
|
)%
|
19.3
|
%
|
|||||
|
Note: In the table above, the sum of the individual percentages may not equal the total due to rounding.
|
|||||||||||||||||||
The change in parts and services revenue of 21.3% represented increases in segment revenue of 9.9% in North America, 46.4% in Europe and 13.5% in Specialty. The decrease in other revenue of 8.2% primarily consisted of a $53 million organic decline partially offset by $15 million of acquisition related growth. Refer to the discussion of our segment results of operations for factors contributing to revenue change by segment during 2016 compared to the prior year.
Cost of Goods Sold.
Our cost of goods sold increased to 61.0% of revenue in 2016 from 60.6% of revenue in 2015. The increase in cost of goods sold reflected a negative effect of 0.6% from our Rhiag acquisition, which has lower gross margins than our prior year consolidated gross margin. In addition, our cost of goods sold increased 0.2% as a result of mix, as we generated a greater proportion of our revenue in our Specialty operations, which has lower gross margins than our prior year consolidated gross margin. These negative impacts were partially offset by lower cost of goods sold as a percentage of revenue of 0.5% primarily related to our self service and wholesale operations in our North America segment. Refer to the discussion of our segment results of operations for factors contributing to the changes in cost of goods sold as a percentage of revenue by segment for the year ended December 31, 2016 compared to the prior year.
Facility and Warehouse Expenses.
As a percentage of revenue, facility and warehouse expenses for the year ended December 31, 2016 increased to 8.0% from 7.7% in the prior year. The change in facility and warehouse expenses reflected (i) a 0.3% increase as a percentage of revenue in our North America operations related to a realignment of plant manager responsibilities, which shifted these expenses from selling, general and administrative expenses to facility and warehouse expenses and (ii) a 0.2% increase as a percentage of revenue in our Europe operations for branch openings and the addition of facility costs for the partly operational Tamworth, England distribution center. These negative impacts were partially offset by a decrease of 0.3% from our acquisition of Rhiag, which has lower facility and warehouse expenses as a percentage of revenue than our prior year consolidated facility and warehouse expenses.
Distribution Expenses.
As a percentage of revenue, distribution expenses decreased to 8.0% in 2016 from 8.4% in 2015. The decrease in distribution expense reflected a positive impact of 0.4% from our Rhiag acquisition, which has lower distribution expenses as a percentage of revenue than our prior year consolidated distribution expenses.
Selling, General and Administrative Expenses.
Our SG&A expenses for the year ended December 31, 2016 remained flat compared to the prior year at 11.5% of revenue. SG&A expenses increased 0.2% as a result of our Rhiag acquisition, which has higher SG&A expenses than our prior year consolidated SG&A expenses. Offsetting this increase was a 0.2% favorable impact from our Specialty operations as a result of a decline in personnel costs from the realization of integration synergies, a decrease in bad debt expense and other individually insignificant decreases across various SG&A expense categories. Within our North America segment, SG&A personnel expenses were flat as a percentage of revenue, as the decrease in expense as a percentage of revenue related to the realignment of plant manager responsibilities discussed above was offset by increases in other personnel expenses as a percentage of revenue.
Restructuring and Acquisition Related Expenses
. The following table summarizes restructuring and acquisition related expenses for the periods indicated (in thousands):
|
Year Ended December 31,
|
|||||||||||
|
2016
|
2015
|
Change
|
|||||||||
|
Restructuring expenses
|
$
|
15,782
|
|
(1)
|
$
|
13,083
|
|
(1)
|
$
|
2,699
|
|
|
Acquisition related expenses
|
21,980
|
|
(2)
|
6,428
|
|
(3)
|
15,552
|
|
|||
|
Total restructuring and acquisition related expenses
|
$
|
37,762
|
|
$
|
19,511
|
|
$
|
18,251
|
|
||
|
(1)
|
Restructuring expenses of $10 million, $3 million, $2 million for the year ended December 31, 2016 related to the integration of acquired businesses in our Specialty, North America and Europe segments, respectively. Restructuring expenses of $10 million, $2 million, and $1 million for the year ended December 31, 2015 were primarily related to
|
39
the integration of acquired businesses in our Specialty, North America, and Europe segments, respectively. These integration activities included the closure of duplicate facilities and termination of employees.
|
(2)
|
Acquisition related expenses for the year ended December 31, 2016 reflected $11 million and $4 million related to the acquisitions of Rhiag and PGW, respectively. The remaining $7 million of expense was related to other completed acquisitions and acquisitions that were pending as of December 31, 2016.
|
|
(3)
|
Acquisition related expenses for the year ended December 31, 2015 included $2 million for our acquisitions of 11 aftermarket parts distribution businesses in the Netherlands and $1 million related to our North America and Specialty acquisitions during the year. Acquisition related expenses also included $3 million for acquisitions that were pending as of December 31, 2015.
|
See
Note 5, "Restructuring and Acquisition Related Expenses
" to the consolidated financial statements in Part II, Item 8 of this Annual Report on Form 10-K for further information on our restructuring and integration plans.
Depreciation and Amortization
. The following table summarizes depreciation and amortization for the periods indicated (in thousands):
|
Year Ended December 31,
|
||||||||||||
|
2016
|
2015
|
Change
|
||||||||||
|
Depreciation
|
$
|
107,945
|
|
$
|
88,335
|
|
$
|
19,610
|
|
(1)
|
||
|
Amortization
|
83,488
|
|
33,785
|
|
49,703
|
|
(2)
|
|||||
|
Total depreciation and amortization
|
$
|
191,433
|
|
$
|
122,120
|
|
$
|
69,313
|
|
|||
|
(1)
|
The increase in depreciation expense primarily reflected the depreciation expense for property and equipment related to our acquisitions of Rhiag and PGW of $14 million and $2 million, respectively. The remaining change primarily reflected increased levels of property and equipment to support our organic related growth.
|
|
(2)
|
The increase in amortization expense primarily reflected amortization expense for intangible assets related to our acquisitions of Rhiag and PGW of $43 million and $8 million, respectively. These increases were partially offset by a decline in accelerated amortization for intangibles recognized in previous years.
|
Other Expense, Net.
The following table summarizes the components of the year-over-year increase in other expense, net (in thousands):
|
Other expense, net for the year ended December 31, 2015
|
$
|
55,597
|
|
||
|
Increase (decrease) due to:
|
|||||
|
Interest expense
|
30,403
|
|
(1)
|
||
|
Loss on debt extinguishment
|
26,650
|
|
(2)
|
||
|
Gains on foreign exchange contracts - acquisition related
|
(18,342
|
)
|
(3)
|
||
|
Gain on bargain purchase
|
(8,207
|
)
|
(4)
|
||
|
Interest and other income, net
|
16
|
|
|||
|
Net increase
|
30,520
|
|
|||
|
Other expense, net for the year ended December 31, 2016
|
$
|
86,117
|
|
||
|
(1)
|
Additional interest primarily relates to borrowings used to fund the acquisitions of Rhiag and PGW.
|
|
(2)
|
During the first quarter of 2016, we incurred a $24 million loss on debt extinguishment as a result of our early payment of Rhiag debt assumed as part of the acquisition, and we incurred a $3 million loss on debt extinguishment as a result of our January 2016 amendment to our senior secured credit agreement.
|
|
(3)
|
In March 2016, we entered into foreign currency forward contracts to acquire a total of €588 million used to fund the purchase price of the Rhiag acquisition. The rates under the foreign currency forwards were favorable to the spot rate on the date the funds were drawn to complete the acquisition, and as result, these derivatives contracts generated a gain of $18 million.
|
|
(4)
|
In October 2016, we acquired Andrew Page out of receivership. The fair value of the net assets acquired exceeded the purchase price, resulting in a gain on bargain purchase of $8 million.
|
40
Provision for Income Taxes
. Our effective income tax rate was 32.6% for the year ended December 31, 2016, compared to 33.9% for the year ended December 31, 2015. The lower effective income tax rate reflects an $11 million discrete item in 2016 for excess tax benefits from stock-based payments related to the early adoption of Accounting Standards Update 2016-09, "Improvements to Employee Share-Based Payment Accounting" ("ASU 2016-09"). The adoption of ASU 2016-09 reduced the effective tax rate by 1.6% compared to the prior year. Partially offsetting this, our effective tax rate was negatively impacted by an increase in the proportion of earnings generated in the U.S., which had a higher tax rate than our foreign operations, as well as an increase in nondeductible acquisition related costs, primarily related to our Rhiag and PGW acquisitions as well as other potential acquisitions.
Equity in Earnings (Loss) of Unconsolidated Subsidiaries.
During the year ended December 31, 2015, we recorded impairment charges of $2 million related to our equity method investments; no tax benefit was recognized related to these charges. Our share of net operating losses in our equity method investments totaled $4 million for the year ended December 31, 2015. With our divestiture of ACM Parts in February 2016, our share of net operating losses in our equity method investments was nominal for the year ended December 31, 2016. We are reporting our equity in earnings of our investment in Mekonomen on a one quarter lag and therefore, no amounts were recorded for this investment during 2016.
Foreign Currency Impact.
We translate our statements of income at the average exchange rates in effect for the period. Relative to the average rates used in 2015, the pound sterling and Canadian dollar rates used to translate the 2016 statements of income declined by 11.3% and 3.5%, respectively; the Euro remained flat relative to the U.S dollar during 2016. The translation effect of the decline in the pound sterling and Canadian dollar against the U.S. dollar and realized and unrealized currency losses during 2016 resulted in an approximately $0.05 negative effect on diluted earnings per share for continuing operations relative to the prior year.
Net (Loss) Income from Discontinued Operations.
Income from discontinued operations, net of tax totaled $8 million in 2016; we had no discontinued operations in the prior year. Discontinued operations for 2016 represents the glass manufacturing business of PGW, which was acquired in April 2016. The results include a $20 million, net of tax, impairment charge primarily related to property, plant and equipment that was triggered when the assets were classified as held for sale.
Results of Operations—Segment Reporting
We have four operating segments: Wholesale – North America, Europe, Specialty and Self Service. Our Wholesale – North America and Self Service operating segments are aggregated into one reportable segment, North America, because they possess similar economic characteristics and have common products and services, customers, and methods of distribution. Therefore, we present three reportable segments: North America, Europe and Specialty.
We have presented the growth of our revenue and profitability in our operations on both an as reported and a constant currency basis. The constant currency presentation, which is a non-GAAP measure, excludes the impact of fluctuations in foreign currency exchange rates. We believe providing constant currency information provides valuable supplemental information regarding our growth and profitability, consistent with how we evaluate our performance, as this statistic removes the translation impact of exchange rate fluctuations, which are outside of our control and do not reflect our operational performance. Constant currency revenue and Segment EBITDA results are calculated by translating prior year revenue and Segment EBITDA in local currency using the current year's currency conversion rate. This non-GAAP financial measure has important limitations as an analytical tool and should not be considered in isolation or as a substitute for an analysis of our results as reported under GAAP. Our use of this term may vary from the use of similarly-titled measures by other issuers due to potential inconsistencies in the method of calculation and differences due to items subject to interpretation. In addition, not all companies that report revenue or profitability on a constant currency basis calculate such measures in the same manner as we do, and accordingly, our calculations are not necessarily comparable to similarly-named measures of other companies and may not be appropriate measures for performance relative to other companies.
41
The following table presents our financial performance, including third party revenue, total revenue and Segment EBITDA, by reportable segment for the periods indicated (in thousands):
|
Year Ended December 31,
|
|||||||||||||||||
|
|
2017
|
% of Total Segment Revenue
|
2016
(1)
|
% of Total Segment Revenue
|
2015
(1)
|
% of Total Segment Revenue
|
|||||||||||
|
Third Party Revenue
|
|||||||||||||||||
|
North America
|
$
|
4,798,901
|
|
$
|
4,443,886
|
|
$
|
4,118,286
|
|
||||||||
|
Europe
|
3,636,811
|
|
2,920,470
|
|
1,995,385
|
|
|||||||||||
|
Specialty
|
1,301,197
|
|
1,219,675
|
|
1,078,962
|
|
|||||||||||
|
Total third party revenue
|
$
|
9,736,909
|
|
$
|
8,584,031
|
|
$
|
7,192,633
|
|
||||||||
|
Total Revenue
|
|||||||||||||||||
|
North America
|
$
|
4,799,651
|
|
$
|
4,444,625
|
|
$
|
4,119,121
|
|
||||||||
|
Europe
|
3,636,811
|
|
2,920,470
|
|
1,995,455
|
|
|||||||||||
|
Specialty
|
1,305,516
|
|
1,223,723
|
|
1,082,296
|
|
|||||||||||
|
Eliminations
|
(5,069
|
)
|
(4,787
|
)
|
(4,239
|
)
|
|||||||||||
|
Total revenue
|
$
|
9,736,909
|
|
$
|
8,584,031
|
|
$
|
7,192,633
|
|
||||||||
|
Segment EBITDA
|
|||||||||||||||||
|
North America
|
$
|
655,275
|
|
13.7%
|
$
|
589,945
|
|
13.3%
|
$
|
540,650
|
|
13.1%
|
|||||
|
Europe
|
319,156
|
|
8.8%
|
283,608
|
|
9.7%
|
200,563
|
|
10.1%
|
||||||||
|
Specialty
|
142,159
|
|
10.9%
|
131,427
|
|
10.7%
|
113,316
|
|
10.5%
|
||||||||
|
(1)
|
In the first quarter of 2017, we realigned a portion of our North America operations under our Specialty segment. Prior year results have been recast to reflect the shift in reporting structure in order to present segment results on a comparable basis.
|
The key measure of segment profit or loss reviewed by our chief operating decision maker, who is our Chief Executive Officer, is Segment EBITDA. Segment EBITDA includes revenue and expenses that are controllable by the segment. Corporate general and administrative expenses are allocated to the segments based on usage, with shared expenses apportioned based on the segment's percentage of consolidated revenue. We calculate Segment EBITDA as EBITDA excluding restructuring and acquisition related expenses, change in fair value of contingent consideration liabilities, other acquisition related gains and losses and equity in earnings (loss) of unconsolidated subsidiaries. EBITDA, which is the basis for Segment EBITDA, is calculated as net income excluding noncontrolling interest, discontinued operations, depreciation, amortization, interest (which includes loss on debt extinguishment) and income tax expense. See
Note 14, "Segment and Geographic Information
" to the consolidated financial statements in Part II, Item 8 of this Annual Report on Form 10-K for a reconciliation of total Segment EBITDA to net income from continuing operations attributable to LKQ stockholders.
Year Ended
December 31, 2017
Compared to Year Ended
December 31, 2016
North America
Third Party Revenue
. The following table summarizes the changes in third party revenue by category in our North America segment (in thousands):
|
Year Ended December 31,
|
Percentage Change in Revenue
|
|||||||||||||||||||
|
North America
|
2017
|
2016
|
Organic
|
Acquisition
(3)
|
Foreign Exchange
|
Total Change
|
||||||||||||||
|
Parts & services revenue
|
$
|
4,278,531
|
|
$
|
4,009,129
|
|
3.0
|
%
|
(1
|
)
|
3.6
|
%
|
0.1
|
%
|
6.7
|
%
|
||||
|
Other revenue
|
520,370
|
|
434,757
|
|
19.3
|
%
|
(2
|
)
|
0.4
|
%
|
0.0
|
%
|
19.7
|
%
|
||||||
|
Total third party revenue
|
$
|
4,798,901
|
|
$
|
4,443,886
|
|
4.6
|
%
|
3.2
|
%
|
0.1
|
%
|
8.0
|
%
|
||||||
|
Note: In the table above, the sum of the individual percentages may not equal the total due to rounding.
|
||||||||||||||||||||
|
(1)
|
Organic growth in parts and services revenue was largely attributable to increased sales volumes in our wholesale operations, primarily in our salvage operations and, to a lesser extent, our aftermarket operations. Within our salvage
|
42
operations, the favorable volume impact, which was primarily related to mechanical parts, was a result of refinements to our buying algorithms. Also, an emphasis on inventorying more parts off of each car purchased contributed to the increase in the number of parts sold per vehicle. While we were able to increase parts and services revenue over the prior year, we believe the weather conditions in 2017 contributed to a lower growth rate than generated in prior years. Organic revenue growth for our North America segment was also negatively affected by one fewer selling day in 2017 compared to 2016; on a per day basis, organic revenue growth was 3.4%.
|
(2)
|
The $86 million increase in other revenue primarily related to (i) a $57 million increase in revenue from scrap steel and other metals primarily related to higher prices and, to a lesser extent, increased volumes, year over year and (ii) a $25 million increase in revenue from metals found in catalytic converters (platinum, palladium, and rhodium) primarily due to higher prices, year over year.
|
|
(3)
|
Acquisition related growth in 2017 included $92 million, or 2.1%, from our PGW autoglass acquisition. The remainder of our acquired revenue growth reflected revenue from our acquisition of 11 wholesale businesses from the beginning of 2016 up to the one-year anniversary of the acquisition dates.
|
Segment EBITDA
. Segment EBITDA increased $65 million, or 11.1%, in 2017 compared to the prior year. Sequential increases in scrap steel prices in our salvage and self service operations benefited gross margins and had a favorable impact of $12 million on North America Segment EBITDA and approximately a $0.03 positive effect on diluted earnings per share. This favorable impact resulted from the increase in scrap steel prices between the date we purchased a vehicle, which influences the price we pay for a vehicle, and the date we scrapped a vehicle, which influences the price we receive for scrapping a vehicle.
The following table summarizes the changes in Segment EBITDA as a percentage of revenue in our North America segment:
|
North America
|
Percentage of Total Segment Revenue
|
|||
|
Segment EBITDA for the year ended December 31, 2016
|
13.3
|
%
|
||
|
Increase (decrease) due to:
|
||||
|
Change in gross margin
|
0.6
|
%
|
(1)
|
|
|
Change in segment operating expenses
|
(0.3
|
)%
|
(2)
|
|
|
Change in other expense, net
|
0.1
|
%
|
||
|
Segment EBITDA for the year ended December 31, 2017
|
13.7
|
%
|
||
|
Note: In the table above, the sum of the individual percentages may not equal the total due to rounding.
|
||||
|
(1)
|
The improvement in gross margin reflected a 1.1% favorable impact in our salvage operations, primarily attributable to raising revenue per car by a greater rate than car costs. Revenue per car improved due to higher volumes of parts sold per car, which was a result of refinements to our buying algorithms, an emphasis on inventorying more parts off of each car purchased, and an increase in the number of days we hold each car before it is scrapped. This improvement was partially offset by an unfavorable impact of 0.4% attributable to our aftermarket operations. Within our aftermarket operations, we experienced a 0.4% decline in gross margin primarily as a result of higher input costs from suppliers as well as decreases in net prices caused by higher customer discounts. The remaining change in gross margin was attributable to individually insignificant fluctuations in gross margin across our other North America operations.
|
|
(2)
|
The increase in segment operating expenses as a percentage of revenue reflected (i) a 0.3% increase in personnel costs, primarily related to facility and warehouse and SG&A and (ii) a 0.2% increase in freight costs driven by higher use of third party freight to handle increased volumes, partially offset by (iii) a 0.2% decrease in segment operating costs attributable to shared PGW corporate expenses incurred during 2016; these costs, which were primarily SG&A costs, ceased being incurred upon the closing of the sale of the glass manufacturing business on March 1, 2017.
|
43
Europe
Third Party Revenue
. The following table summarizes the changes in third party revenue by category in our Europe segment (in thousands):
|
Year Ended December 31,
|
Percentage Change in Revenue
|
||||||||||||||||||
|
Europe
|
2017
|
2016
|
Organic
(1)
|
Acquisition
(2)
|
Foreign Exchange
(3)
|
Total Change
|
|||||||||||||
|
Parts & services revenue
|
$
|
3,628,906
|
|
$
|
2,915,841
|
|
5.3
|
%
|
19.8
|
%
|
(0.6
|
)%
|
24.5
|
%
|
|||||
|
Other revenue
|
7,905
|
|
4,629
|
|
47.6
|
%
|
24.8
|
%
|
(1.6
|
)%
|
70.8
|
%
|
|||||||
|
Total third party revenue
|
$
|
3,636,811
|
|
$
|
2,920,470
|
|
5.3
|
%
|
19.8
|
%
|
(0.6
|
)%
|
24.5
|
%
|
|||||
|
Note: In the table above, the sum of the individual percentages may not equal the total due to rounding.
|
|||||||||||||||||||
|
(1)
|
Parts and services revenue grew organically across all of our aftermarket business units in Europe from both existing locations and new branches. In Eastern Europe and Western Europe, we added 65 and 23 branches, respectively, since the beginning of the prior year, and organic revenue growth includes revenue from those locations. Revenue at our existing locations grew primarily as a result of increased volumes and, to a lesser extent, increased prices. Organic revenue growth for our Europe segment on a per day basis was 5.7% as there was one fewer selling day in 2017 compared to 2016.
|
|
(2)
|
Acquisition related growth for the year ended December 31, 2017 included $216 million, or 7.4%, from our acquisition of Rhiag and $141 million, or 4.8%, from our acquisition of Andrew Page. The remainder of our acquired revenue growth included revenue from our acquisitions of 23 wholesale businesses in our Europe segment since the beginning of 2016 through the one-year anniversary of the acquisitions.
|
|
(3)
|
Compared to the prior year, exchange rates reduced our revenue growth by $18 million, or 0.6%, primarily due to the stronger U.S. dollar against the pound sterling during 2017 relative to 2016, partially offset by the weaker U.S. dollar against the euro during 2017 relative to 2016.
|
Segment EBITDA
. Segment EBITDA increased $36 million, or 12.5%, in 2017 compared to the prior year. Our Europe Segment EBITDA included a negative year over year impact of $3 million related to the translation of local currency results into U.S. dollars at lower exchange rates than those experienced during 2016. On a constant currency basis (i.e. excluding the translation impact), Segment EBITDA increased by $39 million, or 13.7%, compared to the prior year. Refer to the Foreign Currency Impact discussion within the Results of Operations - Consolidated section above for further detail regarding foreign currency impact on our results for the year ended December 31, 2017.
The following table summarizes the changes in Segment EBITDA as a percentage of revenue in our Europe segment:
|
Europe
|
Percentage of Total Segment Revenue
|
|||
|
Segment EBITDA for the year ended December 31, 2016
|
9.7
|
%
|
||
|
(Decrease) increase due to:
|
||||
|
Change in gross margin
|
(0.4
|
)%
|
(1)
|
|
|
Change in segment operating expenses
|
(0.8
|
)%
|
(2)
|
|
|
Change in other expense, net
|
0.3
|
%
|
(3)
|
|
|
Segment EBITDA for the year ended December 31, 2017
|
8.8
|
%
|
||
|
Note: In the table above, the sum of the individual percentages may not equal the total due to rounding.
|
||||
|
(1)
|
The decline in gross margin was due to (i) a 0.6% decrease due to our U.K. operations primarily as a result of an increase in inventory reserves and incremental costs related to the Tamworth distribution facility, which shifted from operating expenses to cost of goods sold when the facility went live, (ii) a 0.3% decrease due to an unfavorable mix impact as a result of generating a higher proportion of our revenue from our Rhiag operations, which have lower gross margins than our other Europe operations, (iii) a 0.3% decrease due to an acquisition in Eastern Europe during the year which has lower gross margins than our other Europe operations, partially offset by (iv) a 0.6% increase in gross margin in our Benelux operations primarily due to increased private label sales, which have higher gross margins, and (v) a 0.2% increase due to a favorable impact related to an increase in supplier rebates as a result of centralized procurement for our Europe segment. The remaining change in gross margin was attributable to individually
|
44
insignificant fluctuations in gross margin across our other Europe operations.
|
(2)
|
The increase in segment operating expenses as a percentage of revenue reflected (i) an increase of 0.8% in operating expenses as a result of the acquisition of Andrew Page, which has higher operating expenses as a percentage of revenue than our other Europe operations and (ii) an increase of 0.4% in operating expenses in our Benelux operations, primarily due to increased personnel costs related to distribution, partially offset by (iii) a 0.2% favorable mix impact due to our acquisition of Rhiag, which has lower operating expenses as a percentage of revenue than our other Europe operations. The remaining decrease in segment operating expenses reflected a number of individually insignificant fluctuations in operating expenses as a percentage of revenue.
|
|
(3)
|
Approximately half of the decrease in other expense, net was due to the impact of foreign currency transaction gains and losses, primarily due to unrealized mark-to-market gains and losses on foreign currency forward contracts used to hedge the purchases of inventory in our U.K. operations, which were favorable in 2017 relative to the prior year. The remaining decrease in other expense, net reflected a number of individually insignificant fluctuations in other expense, net as a percentage of revenue.
|
Specialty
Third Party Revenue
. The following table summarizes the changes in third party revenue by category in our Specialty segment (in thousands):
|
Year Ended December 31,
|
Percentage Change in Revenue
|
||||||||||||||||||
|
Specialty
|
2017
|
2016
|
Organic
(1)
|
Acquisition
(2)
|
Foreign Exchange
|
Total Change
|
|||||||||||||
|
Parts & services revenue
|
$
|
1,301,197
|
|
$
|
1,219,675
|
|
4.7
|
%
|
1.9
|
%
|
0.1
|
%
|
6.7
|
%
|
|||||
|
Other revenue
|
—
|
|
—
|
|
—
|
%
|
—
|
%
|
—
|
%
|
—
|
%
|
|||||||
|
Total third party revenue
|
$
|
1,301,197
|
|
$
|
1,219,675
|
|
4.7
|
%
|
1.9
|
%
|
0.1
|
%
|
6.7
|
%
|
|||||
|
Note: In the table above, the sum of the individual percentages may not equal the total due to rounding.
|
|||||||||||||||||||
|
(1)
|
Organic growth in parts & services revenue was driven by increased sales volumes of Truck, Towing and RV parts sales. This organic growth was fueled by favorable economic conditions in most of our primary selling regions, as well as increased sales volumes of light trucks and RVs. Organic revenue growth for our Specialty segment on a per day basis was 5.1%, as there was one fewer selling day in 2017 compared to 2016.
|
|
(2)
|
Acquisition related growth in 2017 included $20 million, or 1.7%, from our acquisition of Warn. The remainder of our acquired revenue growth reflected revenue from our acquisition of 3 wholesale businesses from the beginning of 2016 up to the one-year anniversary of the acquisition dates.
|
Segment EBITDA
. Segment EBITDA increased $11 million, or 8.2%, in 2017 compared to the prior year.
The following table summarizes the changes in Segment EBITDA as a percentage of revenue in our Specialty segment:
|
Specialty
|
Percentage of Total Segment Revenue
|
|||
|
Segment EBITDA for the year ended December 31, 2016
|
10.7
|
%
|
||
|
(Decrease) increase due to:
|
||||
|
Change in gross margin
|
(0.5
|
)%
|
(1)
|
|
|
Change in segment operating expenses
|
0.8
|
%
|
(2)
|
|
|
Change in other expense, net
|
(0.1
|
)%
|
||
|
Segment EBITDA for the year ended December 31, 2017
|
10.9
|
%
|
||
|
Note: In the table above, the sum of the individual percentages may not equal the total due to rounding.
|
||||
|
(1)
|
The decline in gross margin primarily reflected a 0.5% decrease due to higher overhead costs in inventory, which is driven by warehouse costs for two new distribution centers that became fully functional in 2016.
|
|
(2)
|
The decrease in segment operating expenses reflected (i) favorable facility and warehouse expenses of 0.7% primarily related to the integration of Coast facilities and (ii) favorable personnel costs of 0.2% in SG&A as a result of synergies realized on the integration of Coast facilities.
|
45
Year Ended
December 31, 2016
Compared to Year Ended
December 31, 2015
North America
Third Party Revenue
. The following table summarizes the changes in third party revenue by category in our North American segment (in thousands):
|
Year Ended December 31,
|
Percentage Change in Revenue
|
||||||||||||||||||
|
North America
|
2016
|
2015
|
Organic
|
Acquisition
(3)
|
Foreign Exchange
(4)
|
Total Change
|
|||||||||||||
|
Parts & services revenue
|
$
|
4,009,129
|
|
$
|
3,643,883
|
|
2.9
|
%
|
(1)
|
7.4
|
%
|
(0.3
|
)%
|
10.0
|
%
|
||||
|
Other revenue
|
434,757
|
|
474,403
|
|
(11.2
|
)%
|
(2)
|
3.0
|
%
|
(0.1
|
)%
|
(8.4
|
)%
|
||||||
|
Total third party revenue
|
$
|
4,443,886
|
|
$
|
4,118,286
|
|
1.3
|
%
|
6.9
|
%
|
(0.2
|
)%
|
7.9
|
%
|
|||||
|
Note: In the table above, the sum of the individual percentages may not equal the total due to rounding.
|
|||||||||||||||||||
|
(1)
|
Organic growth in parts and services revenue was primarily attributable to favorable pricing. Increased pricing in our wholesale operations, primarily in our salvage operations, was a result of shifting our salvage vehicle purchasing to higher quality vehicles, which raised the average revenue per part sold. Organic revenue also grew due to increased sales volumes in our wholesale operations resulting from improved fill rates and in-stock rates, as well as increased purchasing levels, which contributed to a greater volume of parts available for sale. The organic growth was partially offset by a negative mix impact as we saw a smaller percentage of sales from high value salvage part types in 2016. Organic revenue growth in parts and services was also negatively affected by milder winter weather conditions in North America in the first quarter of 2016, which we believe impacted volume for the rest of the year.
|
|
(2)
|
The $40 million decrease in other revenue primarily relates to (i) a $21 million decline in revenue from metals, such as those found in catalytic converters (platinum, palladium, and rhodium), aluminum wheels, and copper wiring, due to lower prices year over year, (ii) a $13 million reduction due to the sale of our precious metals business late in the second quarter of 2015, and (iii) an $8 million decline in revenue from scrap steel and other metals primarily related to lower prices.
|
|
(3)
|
Acquisition related growth in 2016 includes $209 million from our acquisition of PGW autoglass. The remainder of our acquired revenue growth reflects revenue from our acquisition of nine wholesale businesses and a self service retail operation from the beginning of 2015 up to the one year anniversary of the acquisition dates.
|
|
(4)
|
Compared to the prior year, exchange rates reduced our revenue growth by 0.2%, primarily due to the strengthening of the U.S. dollar against the Canadian dollar compared to the prior year.
|
Segment EBITDA
. Segment EBITDA increased $49 million, or 9.1%, in 2016 compared to the prior year. While other revenue decreased from the prior year, sequential increases in scrap steel prices in our salvage and self service operations benefited gross margins and had a favorable impact of $8 million on North America Segment EBITDA and approximately a $0.02 positive effect on diluted earnings per share. This favorable impact resulted from the increase in scrap steel prices between the date we purchased the car, which influences the price we pay for the car, and the date we scrapped the car, which influences the price we receive for scrapping the vehicle.
The following table summarizes the changes in Segment EBITDA as a percentage of revenue in our North America segment:
|
North America
|
Percentage of Total Segment Revenue
|
|||
|
Segment EBITDA for the year ended December 31, 2015
|
13.1
|
%
|
||
|
Increase (decrease) due to:
|
||||
|
Change in gross margin
|
0.7
|
%
|
(1)
|
|
|
Change in segment operating expenses
|
(0.6
|
)%
|
(2)
|
|
|
Change in other expense, net
|
0.1
|
%
|
||
|
Segment EBITDA for the year ended December 31, 2016
|
13.3
|
%
|
||
|
Note: In the table above, the sum of the individual percentages may not equal the total due to rounding.
|
||||
46
|
(1)
|
The improvement in gross margin reflects a 0.8% favorable impact from our self service operations, as car costs decreased by a greater percentage year over year than revenue. Within our wholesale operations, we experienced a 0.5% favorable impact on gross margin as a result of procurement initiatives implemented in our aftermarket operations during 2016, which reduced our product costs. Partially offsetting these increases was an unfavorable impact of 0.4% related to our acquisition of PGW autoglass, which had lower gross margins than our existing North America operations as a result of a non-recurring inventory step-up adjustment recorded upon acquisition and higher cost products sourced from the glass manufacturing side of the business.
|
|
(2)
|
The increase in segment operating expenses as a percentage of revenue reflects (i) an increase in operating expenses of 0.4% related to our PGW autoglass acquisition, which had higher operating expenses as a percentage of revenue than our existing North America operations as a result of incremental costs related to shared PGW corporate expenses that did not reoccur after the sale of the PGW glass manufacturing business, and (ii) a 0.3% increase in personnel costs as a percentage of revenue. These increases were partially offset by a 0.2% improvement in fuel prices as a percentage of revenue.
|
Europe
Third Party Revenue
. The following table summarizes the changes in third party revenue by category in our European segment (in thousands):
|
Year Ended December 31,
|
Percentage Change in Revenue
|
||||||||||||||||||
|
Europe
|
2016
|
2015
|
Organic
(1)
|
Acquisition
(2)
|
Foreign Exchange
(3)
|
Total Change
|
|||||||||||||
|
Parts & services revenue
|
$
|
2,915,841
|
|
$
|
1,991,106
|
|
7.2
|
%
|
47.1
|
%
|
(7.9
|
)%
|
46.4
|
%
|
|||||
|
Other revenue
|
4,629
|
|
4,279
|
|
(0.6
|
)%
|
15.7
|
%
|
(7.0
|
)%
|
8.2
|
%
|
|||||||
|
Total third party revenue
|
$
|
2,920,470
|
|
$
|
1,995,385
|
|
7.2
|
%
|
47.1
|
%
|
(7.9
|
)%
|
46.4
|
%
|
|||||
|
Note: In the table above, the sum of the individual percentages may not equal the total due to rounding.
|
|||||||||||||||||||
|
(1)
|
In our U.K. operations, parts and services revenue grew organically by 8.1%, while in Benelux region operations, parts and services revenue grew organically by 4.5%. Our organic revenue growth in the U.K., which resulted from higher sales volumes, was composed of a 6.6% increase in revenue from stores open more than 12 months and a 1.5% increase in revenue generated by 21 branch openings since the beginning of the prior year through the one-year anniversary of their respective opening dates. Organic revenue growth in our Benelux region was primarily due to a favorable mix impact resulting from a shift in sales to higher price products as well as increased prices; organic revenue also grew as a result of an additional selling day in 2016 compared to the prior year.
|
|
(2)
|
Acquisition related growth for the year-ended December 31, 2016 includes $848 million from our acquisition of Rhiag. The remainder of our acquired revenue growth includes revenue from our acquisitions of 14 distribution companies in the Netherlands, 3 wholesale businesses in our U.K. operations, and 3 salvage businesses in Sweden since the beginning of 2015 through the one-year anniversary of the acquisitions.
|
|
(3)
|
Compared to the prior year, exchange rates reduced our revenue growth by $158 million, or 7.9%, primarily due to the strengthening of the U.S. dollar against the pound sterling relative to 2015.
|
Segment EBITDA
. Segment EBITDA increased $83 million, or 41.4%, in 2016 compared to the prior year. Our Rhiag acquisition contributed $94 million to Segment EBITDA in 2016, while our Andrew Page acquisition generated a loss of $5 million. Our Europe Segment EBITDA includes a negative year over year impact of $18 million related to the translation of local currency results into U.S. dollars at lower exchange rates than those experienced during 2015. On a constant currency basis (i.e. excluding the translation impact), Segment EBITDA increased by $101 million, or 50.2%, compared to the prior year. Refer to the Foreign Currency Impact discussion within the Results of Operations - Consolidated section above for further detail regarding foreign currency impact on our results for the year ended December 31, 2016.
The following table summarizes the changes in Segment EBITDA as a percentage of revenue in our Europe segment:
47
|
Europe
|
Percentage of Total Segment Revenue
|
|||
|
Segment EBITDA for the year ended December 31, 2015
|
10.1
|
%
|
||
|
(Decrease) increase due to:
|
||||
|
Change in gross margin
|
(1.1
|
)%
|
(1)
|
|
|
Change in segment operating expenses
|
0.8
|
%
|
(2)
|
|
|
Change in other expense, net
|
(0.1
|
)%
|
||
|
Segment EBITDA for the year ended December 31, 2016
|
9.7
|
%
|
||
|
Note: In the table above, the sum of the individual percentages may not equal the total due to rounding.
|
||||
|
(1)
|
The decrease in gross margin reflects a 1.3% decline in gross margin due to the acquisition of Rhiag, which has lower gross margins than our other Europe operations.
|
|
(2)
|
The decrease in segment operating expenses as a percentage of revenue reflects (i) a decrease of 1.8% in operating expenses as a result of the acquisition of Rhiag, which has lower operating expenses as a percentage of revenue than our other Europe operations and (ii) a 0.3% decrease in distribution expenses in our U.K. operations due to reduced personnel costs. Partially offsetting these decreases were (i) an increase in facility and warehouse expenses of 0.8% from a 0.5% increase primarily related to the opening of 21 new branches and 6 new hubs since the prior year and 0.3% related to the addition of facility and personnel costs for the Tamworth distribution facility, and (ii) an increase of 0.3% in operating expenses as a result of the acquisition of Andrew Page, which has higher operating expenses as a percentage of revenue than our other Europe operations. While we had closed the Andrew Page acquisition and were consolidating its results, we were not permitted to integrate this acquisition with our existing U.K. operations until we received approval from the U.K. Competition and Markets Authority, which concluded its approval process in October 2017.
|
Specialty
Third Party Revenue
. The following table summarizes the changes in third party revenue by category in our Specialty segment (in thousands):
|
Year Ended December 31,
|
Percentage Change in Revenue
|
||||||||||||||||||
|
Specialty
|
2016
|
2015
|
Organic
(1)
|
Acquisition
(2)
|
Foreign Exchange
(3)
|
Total Change
|
|||||||||||||
|
Parts & services revenue
|
$
|
1,219,675
|
|
$
|
1,078,962
|
|
6.7
|
%
|
6.6
|
%
|
(0.3
|
)%
|
13.0
|
%
|
|||||
|
Other revenue
|
—
|
|
—
|
|
—
|
%
|
—
|
%
|
—
|
%
|
—
|
%
|
|||||||
|
Total third party revenue
|
$
|
1,219,675
|
|
$
|
1,078,962
|
|
6.7
|
%
|
6.6
|
%
|
(0.3
|
)%
|
13.0
|
%
|
|||||
|
Note: In the table above, the sum of the individual percentages may not equal the total due to rounding.
|
|||||||||||||||||||
|
(1)
|
Organic growth in Specialty parts and services revenue reflects an increase in service levels throughout North America as we continued to expand the breadth and depth of our inventory offerings and added delivery capacity to our integrated distribution network to allow us to realize synergies associated with the integration of Coast. Through most of 2016, we also saw growth from favorable macro trends and economic conditions, which increased consumer discretionary spending on automotive and recreational vehicle parts and accessories.
|
|
(2)
|
Acquisition related growth reflects the impact of the Coast acquisition on August 19, 2015 through the one year anniversary of the acquisition.
|
|
(3)
|
Compared to the prior year, exchange rates reduced our revenue growth by $3 million, or 0.3%, primarily due to the strengthening of the U.S dollar against the Canadian dollar relative to 2015.
|
48
Segment EBITDA
. Segment EBITDA increased $18 million, or 16.0%, in 2016 compared to the prior year.
The following table summarizes the changes in Segment EBITDA as a percentage of revenue in our Specialty segment:
|
Specialty
|
Percentage of Total Segment Revenue
|
|||
|
Segment EBITDA for the year ended December 31, 2015
|
10.5
|
%
|
||
|
(Decrease) increase due to:
|
||||
|
Change in gross margin
|
(0.8
|
)%
|
(1)
|
|
|
Change in segment operating expenses
|
1.0
|
%
|
(2)
|
|
|
Segment EBITDA for the year ended December 31, 2016
|
10.7
|
%
|
||
|
Note: In the table above, the sum of the individual percentages may not equal the total due to rounding.
|
||||
|
(1)
|
The decline in gross margin reflects (i) a 0.4% unfavorable impact due to customer volume rebates which have increased along with sales volume, (ii) a 0.3% increase in inventory costs, which were higher due to the stocking of two distribution centers, one of which was not yet operational in the prior year period and one which became operational in the fourth quarter of 2015, and (iii) a decrease in advertising credits of 0.3% due to higher purchase volume in 2015 from the initial stocking of those two new distribution centers. These negative effects were partially offset by a 0.4% improvement due to Coast related freight synergies as more volume went through the existing Specialty network.
|
|
(2)
|
The decrease in segment operating expenses reflects a favorable 0.9% reduction in selling, general and administrative expenses primarily related to (i) a 0.3% decline in personnel costs from the realization of integration synergies, (ii) lower bad debt expense of 0.2% due to increased collection efforts and (iii) individually insignificant decreases across various selling, general and administrative expense categories totaling 0.4%. Favorable distribution expenses of 0.2% due to lower fuel and freight costs were offset by an increase in facilities and warehouse expense primarily related to the higher cost of Coast facilities as well as the addition of two new distribution centers.
|
49
Liquidity and Capital Resources
The following table summarizes liquidity data as of the dates indicated (in thousands):
|
December 31, 2017
|
December 31, 2016
|
||||||
|
Cash and cash equivalents
|
$
|
279,766
|
|
$
|
227,400
|
|
|
|
Total debt
(1)
|
3,428,280
|
|
3,365,687
|
|
|||
|
Current maturities
(2)
|
129,184
|
|
68,414
|
|
|||
|
Capacity under credit facilities
(3)
|
2,850,000
|
|
2,550,000
|
|
|||
|
Availability under credit facilities
(3)
|
1,395,081
|
|
1,019,112
|
|
|||
|
Total liquidity (cash and cash equivalents plus availability under credit facilities)
|
1,674,847
|
|
1,246,512
|
|
|||
|
(1)
|
Debt amounts reflect the gross values to be repaid (excluding debt issuance costs of
$24 million
as of December 31, 2017 and 2016).
|
|
(2)
|
Debt amounts reflect the gross values to be repaid (excluding debt issuance costs of
$3 million
and
$2 million
as of December 31, 2017 and 2016, respectively).
|
|
(3)
|
Capacity under credit facilities includes our revolving credit facilities and our receivables securitization facility. Availability under credit facilities is reduced by our letters of credit.
|
We assess our liquidity in terms of our ability to fund our operations and provide for expansion through both internal development and acquisitions. Our primary sources of liquidity are cash flows from operations and our credit facilities. We utilize our cash flows from operations to fund working capital and capital expenditures, with the excess amounts going towards funding acquisitions or paying down outstanding debt. As we have pursued acquisitions as part of our growth strategy, our cash flows from operations have not always been sufficient to cover our investing activities. To fund our acquisitions, we have accessed various forms of debt financing, including revolving credit facilities, senior notes, and a receivables securitization facility.
As of
December 31, 2017
, we had debt outstanding and additional available sources of financing as follows:
|
•
|
Senior secured credit facilities maturing in January 2023, composed of term loans totaling $750 million (
$705 million
outstanding at December 31, 2017) and $2.75 billion in revolving credit (
$1.3 billion
outstanding at December 31, 2017), bearing interest at variable rates (although a portion of this debt is hedged through interest rate swap contracts), reduced by $71 million of amounts outstanding under letters of credit
|
|
•
|
U.S. Notes (2023) totaling
$600 million
, maturing in May 2023 and bearing interest at a 4.75% fixed rate
|
|
•
|
Euro Notes (2024) totaling $
600 million
(€500 million), maturing in April 2024 and bearing interest at a 3.875% fixed rate
|
|
•
|
Receivables securitization facility with availability up to $100 million (
$100 million
outstanding as of
December 31, 2017
), maturing in November 2019 and bearing interest at variable commercial paper rates
|
From time to time, we may undertake financing transactions to increase our available liquidity, such as our December 2017 and January 2016 amendments to our senior secured credit facilities, the issuance of €500 million of Euro Notes (2024) in April 2016, and the November 2016 amendment to our receivables securitization facility. Our financing structure, which includes our senior secured credit facilities, senior notes, and receivables securitization facility, provides financial flexibility to execute our long-term growth strategy. If we see an attractive acquisition opportunity, we have the ability to use our revolver to move quickly and have certainty of funding up to the amount of our then-available liquidity.
As of
December 31, 2017
, we had approximately
$1.4 billion
available under our credit facilities. Combined with approximately
$280 million
of cash and cash equivalents at
December 31, 2017
, we had approximately
$1.7 billion
in available liquidity, an increase of $428 million over our available liquidity as of
December 31, 2016
. The increase in available liquidity in 2017 is primarily attributable to the net proceeds from the sale of the glass manufacturing business in March for $301 million and the December 2017 amendment to the credit facility, which increased availability by $300 million.
In December 2017, we signed a definitive agreement to acquire Stahlgruber for an enterprise value of €1.5 billion. We intend to finance the acquisition with the proceeds from planned debt offerings, borrowings under our existing revolving credit
50
facility and the direct issuance to Stahlgruber's owner of 8,055,569 newly issued shares of LKQ common stock. The timing of the borrowings and the amounts to be drawn from debt offerings and the revolver are to be determined and will depend on the timing of the expected closing of the transaction and market conditions at such time.
We believe that our current liquidity and cash expected to be generated by operating activities in future periods will be sufficient to meet our current operating and capital requirements, although such sources may not be sufficient for future acquisitions depending on their size. While we believe that we have adequate capacity, from time to time we may need to raise additional funds through public or private financing, strategic relationships or other arrangements, as noted above regarding the pending Stahlgruber transaction. There can be no assurance that additional funding, or refinancing of our credit facilities, if needed, will be available on terms attractive to us, or at all. Furthermore, any additional equity financing may be dilutive to stockholders, and debt financing, if available, may involve restrictive covenants or higher interest costs. Our failure to raise capital if and when needed could have a material adverse impact on our business, operating results, and financial condition.
Borrowings under the credit agreement accrue interest at variable rates which are tied to the London InterBank Offered Rate ("LIBOR") or the Canadian Dollar Offered Rate ("CDOR"), depending on the currency and the duration of the borrowing, plus an applicable margin rate which is subject to change quarterly based on our reported leverage ratio. We hold interest rate swaps to hedge the variable rates on a portion of our credit agreement borrowings, with the effect of fixing the interest rates on the respective notional amounts. In addition, in 2016, we entered into cross currency swaps that contain an interest rate swap component and a foreign currency forward contract component that, when combined with related intercompany financing arrangements, effectively convert variable rate U.S. dollar-denominated borrowings into fixed rate euro-denominated borrowings. These derivative transactions are described in
Note 10, "Derivative Instruments and Hedging Activities
" to the consolidated financial statements in Item 8 of this Annual Report on Form 10-K. After giving effect to these contracts, the weighted average interest rate on borrowings outstanding under our credit agreement at
December 31, 2017
was
2.2%
. Including our senior notes and the borrowings on our receivables securitization program, our overall weighted average interest rate on borrowings was
3.0%
at
December 31, 2017
.
Cash interest payments were
$96 million
for the
year ended
December 31, 2017
, including $50 million in semi-annual interest payments as a result of our U.S. Notes (2023) and our Euro Notes (2024). Interest payments on our U.S. Notes (2023) are made in May and November, and interest payments on our Euro Notes (2024) are scheduled for April and October.
We had outstanding credit agreement borrowings of
$2.0 billion
and
$2.1 billion
at
December 31, 2017
and 2016, respectively. Of these amounts, $18 million and $37 million was classified as current maturities at
December 31, 2017
and 2016, respectively.
The scheduled maturities of long-term obligations outstanding at
December 31, 2017
are as follows (in thousands):
|
Years ending December 31:
|
|||
|
2018
|
$
|
129,184
|
|
|
2019
|
146,262
|
|
|
|
2020
|
40,087
|
|
|
|
2021
|
38,033
|
|
|
|
2022
|
36,769
|
|
|
|
Thereafter
|
3,037,945
|
|
|
|
Total debt
(1)
|
$
|
3,428,280
|
|
|
(1)
|
The total debt amounts presented above reflect the gross values to be repaid (excluding debt issuance costs of
$24 million
as of December 31, 2017).
|
Our credit agreement contains customary covenants that provide limitations and conditions on our ability to enter into certain transactions. The credit agreement also contains financial and affirmative covenants, including limitations on our net leverage ratio and a minimum interest coverage ratio. We were in compliance with all restrictive covenants under our credit agreement as of
December 31, 2017
.
As of
December 31, 2017
, the Company had cash and cash equivalents of
$280 million
, of which $220 million was held by foreign subsidiaries. In general it has been our practice and intention to permanently reinvest the undistributed earnings of our foreign subsidiaries, and that position has not changed following the enactment of the Tax Act and the related imposition of the transition tax. Beginning in 2018, distributions of dividends from our foreign subsidiaries will be generally exempt from further U.S. taxation, either as a result of the new 100% participation exemption under the Tax Act, or due to the previous taxation of foreign earnings under the transition tax. We are still evaluating whether the Tax Act will affect the Company’s existing policy to indefinitely reinvest unremitted foreign earnings.
51
We believe that we have sufficient cash flow and liquidity to meet our financial obligations in the U.S. without resorting to repatriation of foreign earnings. As a result of the Tax Act, we expect to have significantly lower income tax payments in 2018 due to the lower tax rate and the immediate deduction of capital expenditures, partially offset by the first payment with respect to the transition tax.
Year Ended
December 31, 2017
Compared to Year Ended
December 31, 2016
The procurement of inventory is the largest operating use of our funds. We normally pay for aftermarket product purchases at the time of shipment or on standard payment terms, depending on the manufacturer and the negotiated payment terms. We normally pay for salvage vehicles acquired at salvage auctions and under direct procurement arrangements at the time that we take possession of the vehicles.
The following table sets forth a summary of our aftermarket and manufactured inventory procurement for
2017
and
2016
(in thousands):
|
Year Ended December 31,
|
||||||||||||
|
2017
|
2016
|
Change
|
||||||||||
|
North America
|
$
|
1,367,600
|
|
$
|
1,198,556
|
|
$
|
169,044
|
|
(1)
|
||
|
Europe
|
2,355,300
|
|
2,012,804
|
|
342,496
|
|
(2)
|
|||||
|
Specialty
|
1,006,600
|
|
934,119
|
|
72,481
|
|
(3)
|
|||||
|
Total
|
$
|
4,729,500
|
|
$
|
4,145,479
|
|
$
|
584,021
|
|
|||
|
(1)
|
In North America, aftermarket purchases during the year ended December 31, 2017 increased compared to the prior year as we decided to expand our inventory as a result of procurement initiatives to support growth across our operations. The remaining increase is primarily as a result of our acquisition of PGW autoglass in April 2016, which added incremental purchases of $72 million in 2017.
|
|
(2)
|
In our Europe segment, the increase in purchases during the year ended December 31, 2017 is primarily related to our acquisition of Rhiag in March 2016, which added incremental purchases of $181 million in 2017. Purchases for our U.K. operations increased in 2017 compared to the prior year primarily as a result of our acquisition of Andrew Page in October 2016, which added incremental purchases of $107 million in 2017, partially offset by the devaluation of the pound sterling in 2017 compared to the prior year. Purchases for our Benelux operations increased by $71 million in 2017 compared to the prior year primarily as a result of our acquisition of the aftermarket parts distribution businesses in Belgium in July 2017, which had purchases of $46 million in 2017. The remaining increase in our Benelux operations was primarily due to incremental inventory purchases to achieve supplier purchase rebates.
|
|
(3)
|
The increase in Specialty inventory purchases during 2017 compared to the prior year is primarily due to increased sales volumes for Truck, Towing and RV parts. Additionally, the acquisition of Warn in November 2017 added incremental purchases of $11 million, which includes purchases of aftermarket inventory and raw materials used in the manufacturing of specialty products.
|
The following table sets forth a summary of our global salvage and self service procurement for
2017
and
2016
(in thousands):
|
Year Ended December 31,
|
|||||||||
|
2017
|
2016
|
% Change
|
|||||||
|
North America wholesale salvage cars and trucks
|
310
|
|
291
|
|
6.5
|
%
|
(1)
|
||
|
Europe wholesale salvage cars and trucks
|
25
|
|
23
|
|
8.7
|
%
|
|||
|
Self service and "crush only" cars
|
542
|
|
524
|
|
3.4
|
%
|
(2)
|
||
|
(1)
|
The number of salvage cars and trucks purchased during the year ended December 31, 2017 increased primarily due to a decision to increase the number of salvage cars and trucks dismantled compared to the prior year.
|
(2) With the increase in scrap prices compared to the prior year period, we have increased the number of self service and "crush only" vehicles purchased.
52
The following table summarizes the components of the year-over-year decrease in cash provided by operating activities (in millions):
|
Net cash provided by operating activities for the year ended December 31, 2016
|
$
|
635
|
|
|
|
Increase (decrease) due to:
(1)
|
||||
|
Discontinued operations
|
(68
|
)
|
(2)
|
|
|
Operating income
|
84
|
|
(3)
|
|
|
Non-cash depreciation and amortization expense
|
32
|
|
(4)
|
|
|
Cash paid for taxes
|
(43
|
)
|
(5)
|
|
|
Cash paid for interest
|
(10
|
)
|
(6)
|
|
|
Working capital accounts:
(7)
|
||||
|
Inventory
|
(133
|
)
|
(8)
|
|
|
Accounts payable
|
8
|
|
||
|
Accounts receivable
|
27
|
|
||
|
Other operating activities
|
(13
|
)
|
(9)
|
|
|
Net cash provided by operating activities for the year ended December 31, 2017
|
$
|
519
|
|
|
|
(1)
|
Other than discontinued operations, the amounts presented represent increases (decreases) in operating cash flows attributable to our continuing operations only.
|
|
(2)
|
Represents the change in cash flows for our glass manufacturing business, which was acquired in April 2016 and disposed of on March 1, 2017.
|
|
(3)
|
During 2017, our operating income increased compared to the prior year due to both acquisition related growth and organic growth.
|
|
(4)
|
Non-cash depreciation and amortization expense increased compared to the prior year as discussed in the Results of Operations - Consolidated section.
|
|
(5)
|
Cash paid for taxes increased during 2017 compared to the prior year as a result of growth in the business from both organic growth and acquisitions, and the timing of tax payments.
|
|
(6)
|
Cash paid for interest increased compared to the prior year primarily as a result of interest payments related to our Euro Notes (2024), which were issued in April 2016. In the prior year, we made one semi-annual interest payment related to these notes, whereas in 2017 we made two semi-annual interest payments.
|
|
(7)
|
Cash flows related to our primary working capital accounts can be volatile as the purchases, payments and collections can be timed differently from period to period and can be influenced by factors outside of our control. However, we expect that the net change in these working capital items will generally be a cash outflow as we expect to grow our business each year.
|
|
(8)
|
The period over period increase in cash outflows for inventory was primarily related to our North America segment as described in the procurement section above.
|
|
(9)
|
Reflects a number of individually insignificant fluctuations in cash paid for other operating activities.
|
Net cash used in investing activities
totaled
$385 million
for the year ended
December 31, 2017
, compared to
$1.7 billion
in
2016
. We invested
$513 million
of cash, net of cash acquired, in business acquisitions during
2017
compared to
$1.3 billion
in 2016, which included
$601 million
for our Rhiag acquisition and
$662 million
for our PGW acquisition. We received proceeds from the sale of our glass manufacturing business totaling $301 million in 2017; no such proceeds were received in 2016. We paid
$8 million
for investments in unconsolidated subsidiaries in 2017, compared to cash payments of
$186 million
in 2016, primarily related to our investment in Mekonomen. In 2016, we entered into foreign currency contracts to fund the purchase price of the Rhiag acquisition, which generated $18 million of cash proceeds; we had no such contracts in the current year period. Property, plant and equipment purchases were
$179 million
in the year ended
December 31, 2017
compared to
$207 million
in the prior year. The period over period decrease in cash outflows for purchases of property, plant and equipment was primarily related to our discontinued operations (down $21 million compared to the prior year), Europe and Specialty segments, partially offset by an increase in our North America segment.
53
Net cash used in financing activities totaled
$113 million
for the year ended
December 31, 2017
, compared to
$1.2 billion
provided by financing activities during
2016
. During 2017, net repayments under our credit facilities totaled $135 million, as we used the proceeds from the sale of our glass manufacturing business and cash flows from operations to repay outstanding revolver borrowings; during 2016, we had net borrowings of $1.3 billion primarily to fund our acquisitions. In April 2016, we issued the Euro Notes (2024) generating proceeds of $563 million. The proceeds from the Euro Notes (2024) were used to repay a portion of the borrowings on the revolving credit facility. Additionally, we repaid $543 million of Rhiag acquired debt and debt related liabilities during 2016. In connection with our December 2017 amendment of our credit facilities, we paid $4 million of debt issuance costs; in 2016, we paid $17 million of debt issuance costs related to our January and December 2016 amendments of our credit facilities, our April 2016 issuance of the Euro Notes (2024), and our November 2016 amendment to our receivables securitization facility. There were $18 million of cash proceeds from other debt in 2017, compared to $33 million in 2016. Cash provided by other financing activities totaled $7 million in 2017, primarily as a result of proceeds from the sale of noncontrolling interest; no such activity occurred in 2016.
We intend to continue to evaluate markets for potential growth through the internal development of distribution centers, processing and sales facilities, and warehouses, through further integration of our facilities, and through selected business acquisitions. Our future liquidity and capital requirements will depend upon numerous factors, including the costs and timing of our internal development efforts and the success of those efforts, the costs and timing of expansion of our sales and marketing activities, and the costs and timing of future business acquisitions.
54
Year Ended
December 31, 2016
Compared to Year Ended
December 31, 2015
The following table sets forth a summary of our aftermarket inventory procurement for
2016
and
2015
(in thousands):
|
Year Ended December 31,
|
||||||||||||
|
2016
|
2015
|
Change
|
||||||||||
|
North America
|
$
|
1,198,556
|
|
$
|
1,023,400
|
|
$
|
175,156
|
|
(1)
|
||
|
Europe
|
2,012,804
|
|
1,143,668
|
|
869,136
|
|
(2)
|
|||||
|
Specialty
|
934,119
|
|
776,611
|
|
157,508
|
|
(3)
|
|||||
|
Total
|
$
|
4,145,479
|
|
$
|
2,943,679
|
|
$
|
1,201,800
|
|
|||
|
(1)
|
In North America, aftermarket purchases for the year increased primarily as a result of incremental purchases of $141 million related to our April 2016 acquisition of PGW autoglass. Additionally, North America aftermarket inventory purchases increased as a result of our July 2015 acquisition of Parts Channel coupled with lower purchase levels in the first quarter of 2015 due to accelerated purchases in the fourth quarter of 2014 in anticipation of potential labor issues at West Coast ports in the United States.
|
|
(2)
|
In our Europe segment, the increase in purchases was primarily due to our acquisition of Rhiag in March 2016, which added incremental purchases of $710 million during 2016. Purchases for our U.K. operations increased in 2016 compared to the prior year primarily as a result of 21 branch openings since the beginning of the prior year and incremental inventory purchases to stock the Tamworth, England national distribution center. Purchases in our Netherlands operations increased as a result of organic and acquisition related growth. These increases were partially offset by the devaluation of the pound sterling in 2016 compared to the prior year.
|
|
(3)
|
The increase in Specialty aftermarket purchases was primarily due to (i) accelerated inventory purchases to stock two new distribution centers during the first quarter of 2016, (ii) additional purchases to support the increased sales volume as a result of the Coast acquisition, and (iii) additional inventory purchases in 2016 due to stronger than anticipated sales volumes as a result of our annual trade shows.
|
Manufacturing inventory purchases related to our discontinued operations totaled $398 million during 2016, and consisted of raw materials used in PGW's manufacturing and fabrication of automotive glass products.
The following table sets forth a summary of our global salvage and self service procurement for
2016
and
2015
(in thousands):
|
Year Ended December 31,
|
|||||||||
|
2016
|
2015
|
% Change
|
|||||||
|
North America wholesale salvage cars and trucks
|
291
|
|
290
|
|
0.3
|
%
|
|||
|
Europe wholesale salvage cars and trucks
|
23
|
|
20
|
|
15.0
|
%
|
|||
|
Self service and "crush only" cars
|
524
|
|
471
|
|
11.3
|
%
|
(1)
|
||
|
(1)
|
Compared to the prior year, we increased our purchase of lower cost self service and "crush only" cars in 2016 as prices for vehicles came down in certain markets due to the decline in the prices of scrap and other metals, allowing us to purchase higher quality vehicles at favorable prices.
|
55
The following table summarizes the components of the year-over-year increase in cash provided by operating activities (in millions):
|
Net cash provided by operating activities for the year ended December 31, 2015
|
$
|
544
|
|
|
|
Increase (decrease) due to:
(1)
|
||||
|
Discontinued operations
|
64
|
|
(2)
|
|
|
Income from continuing operations before provision for income taxes
|
28
|
|
(3)
|
|
|
Non-cash depreciation and amortization expense
|
70
|
|
(4)
|
|
|
Cash paid for taxes
|
(37
|
)
|
(5)
|
|
|
Working capital accounts:
(6)
|
||||
|
Accounts receivable
|
(80
|
)
|
(7)
|
|
|
Inventory
|
17
|
|
(8)
|
|
|
Accounts payable
|
21
|
|
(9)
|
|
|
Other operating activities
|
8
|
|
||
|
Net cash provided by operating activities for the year ended December 31, 2016
|
$
|
635
|
|
|
|
(1)
|
Other than discontinued operations, the amounts presented represent increases (decreases) in operating cash flows attributable to our continuing operations only.
|
|
(2)
|
Represents cash flows for our glass manufacturing business, which was acquired in April 2016.
|
|
(3)
|
During 2016, our operating income increased compared to the prior year due to both acquisition related growth and organic growth.
|
|
(4)
|
Non-cash depreciation and amortization expense increased compared to the prior year primarily as a result of our Rhiag and PGW acquisitions.
|
|
(5)
|
Cash paid for taxes increased during 2016 compared to the prior year as a result of growth in the business, primarily related to our Rhiag acquisition.
|
|
(6)
|
Cash flows related to our primary working capital accounts can be volatile as the purchases, payments and collections can be timed differently from period to period and can be influenced by factors outside of our control. However, we expect that the net change in these working capital items will generally be a cash outflow as we expect to grow our business each year.
|
|
(7)
|
The increase in cash outflows for accounts receivable is primarily related to our U.K. operations as a result of increased sales; the remaining increase primarily related to our Specialty operations, which experienced larger growth in receivables balances during 2016 than the prior year period from organic and acquisition revenue growth.
|
|
(8)
|
Compared to the prior year, cash outflows related to inventory declined primarily as a result of our North America and Specialty operations. This was partially offset by inventory growth in our U.K. operations as a result of incremental inventory purchases to stock new branches and the Tamworth, England national distribution center.
|
|
(9)
|
Accounts payable represented a $17 million cash inflow in 2016 compared to a $4 million cash outflow in the prior year. The increase is primarily related to a rise in the payables balance in our U.K. operations, partially offset by a decline in the payables balance in our North America and Rhiag operations due to the timing of payments.
|
Net cash used in investing activities totaled $1.7 billion for the year ended December 31, 2016, compared to $330 million in 2015. We invested $1.3 billion of cash, net of cash acquired, in business acquisitions during 2016, which included $601 million for our Rhiag acquisition and $662 million for our PGW acquisition, compared to $161 million for business acquisitions in 2015. Property and equipment purchases were $207 million in the year ended December 31, 2016 compared to $170 million in the prior year. Purchases of property and equipment increased over the prior period primarily as a result of $24 million of purchases in our discontinued operations and a $20 million increase in our North America segment. In 2016, we paid $186 million for investments in unconsolidated subsidiaries, primarily related to our investment in Mekonomen; payments for investments in consolidated subsidiaries were $10 million in 2015. In 2016, we entered into foreign currency contracts to fund the purchase price of the Rhiag acquisition, which generated $18 million of gains; we had no such contracts in the prior year. During 2016, cash provided by other investing activities, net was $14 million, primarily from the
56
proceeds on the sale of our interest in our Australian joint venture, compared to $11 million in 2015 primarily as a result of proceeds from disposals of fixed assets.
Net cash provided by financing activities totaled $1.2 billion for the year ended December 31, 2016, compared to net cash used in financing activities of $239 million in 2015. During 2016, net borrowings under our credit facilities were $1.3 billion compared to net repayments of $187 million in 2015. The increase in borrowings during 2016 is primarily the result of borrowings under our multi-currency revolving credit facility in order to fund the acquisitions of Rhiag and PGW and investment in Mekonomen and repay $543 million of Rhiag acquired debt and debt related liabilities. The increase in borrowings during 2016 also reflects our 2016 amendments of our credit facilities, which generated $339 million in additional term loan borrowings, a portion of which was used to repay outstanding revolver borrowings. In April 2016, we issued the Euro Notes (2024), generating proceeds of $563 million. The proceeds from the Euro Notes (2024) were used to repay a portion of the borrowings on the revolving credit facility. In connection with our January and December 2016 amendments of our credit facilities, our April 2016 issuance of the Euro Notes (2024), and our November 2016 amendment to our receivables securitization facility, we paid $17 million of debt issuance costs during 2016; debt issuance costs incurred in the prior year were minimal.
Off-Balance Sheet Arrangements and Future Commitments
We do not have any off-balance sheet arrangements or undisclosed borrowings or debt that would be required to be disclosed pursuant to Item 303 of Regulation S-K under the Securities Exchange Act of 1934. Additionally, we do not have any synthetic leases.
The following table represents our future commitments under contractual obligations as of
December 31, 2017
(in millions):
|
Total
(6)
|
Less than
1 Year
|
1-3 Years
|
3-5 Years
|
More than
5 Years
|
|||||||||||||||
|
Contractual obligations
|
|
||||||||||||||||||
|
Long-term debt
(1)
|
$
|
3,982.0
|
|
$
|
232.6
|
|
$
|
389.2
|
|
$
|
276.1
|
|
$
|
3,084.1
|
|
||||
|
Capital lease obligations
(2)
|
20.3
|
|
5.2
|
|
7.3
|
|
2.3
|
|
5.5
|
|
|||||||||
|
Operating leases
(3)
|
1,357.1
|
|
235.8
|
|
347.5
|
|
210.9
|
|
562.9
|
|
|||||||||
|
Purchase obligations
(4)
|
678.2
|
|
478.2
|
|
200.0
|
|
—
|
|
—
|
|
|||||||||
|
Other long-term obligations
(5)
|
324.8
|
|
156.2
|
|
68.1
|
|
19.3
|
|
81.2
|
|
|||||||||
|
Total
|
$
|
6,362.4
|
|
$
|
1,108.0
|
|
$
|
1,012.1
|
|
$
|
508.6
|
|
$
|
3,733.7
|
|
||||
|
(1)
|
Our long-term debt under contractual obligations above includes interest of
$572 million
on the balances outstanding as of
December 31, 2017
. The long-term debt balance excludes debt issuance costs, as these expenses have already been paid. Interest on our senior notes, notes payable, and other long-term debt is calculated based on the respective stated rates. Interest on our variable rate credit facilities is calculated based on the weighted average rates, including the impact of interest rate swaps through their respective expiration dates, in effect for each tranche of borrowings as of
December 31, 2017
. Future estimated interest expense for the next year, one to three years, and three to five years is
$108 million
,
$210 million
and
$203 million
, respectively. Estimated interest expense beyond five years is
$51 million
.
|
|
(2)
|
Interest on capital lease obligations of
$10 million
is included based on incremental borrowing or implied rates. Future estimated interest expense for the next year is less than $1 million, while future estimated interest expense for both the next one to three years and three to five years is
$1 million
. Estimated interest expense beyond five years is
$8 million
.
|
|
(3)
|
The operating lease payments above do not include certain tax, insurance and maintenance costs, which are also required contractual obligations under our operating leases but are generally not fixed and can fluctuate from year to year.
|
|
(4)
|
Our purchase obligations include open purchase orders for aftermarket inventory.
|
|
(5)
|
Our other long-term obligations consist of estimated payments for our self insurance reserves of $87 million, outstanding letters of credit of $71 million, and outstanding estimated payments of $51 million on the repatriation of earnings as a result of the Tax Act, with the remaining $116 million representing primarily other asset purchase commitments and payments for deferred compensation and pension plans.
|
57
Additionally, in December 2017, we signed a definitive agreement to acquire Stahlgruber from Stahlgruber Otto Gruber AG, for an enterprise value of €1.5 billion. We will be required to pay a break fee of approximately €75 million if the acquisition of Stahlgruber is not completed. The transaction is expected to be completed in the first half of 2018 and is subject to regulatory approvals. Neither the cash purchase price nor the break fee are included in the table above.
58
|
ITEM 7A.
|
QUANTITATIVE AND QUALITATIVE DISCLOSURES ABOUT MARKET RISK
|
We are exposed to market risks arising from adverse changes in:
|
•
|
foreign exchange rates;
|
|
•
|
interest rates; and
|
|
•
|
commodity prices.
|
Foreign Exchange Rates
Foreign currency fluctuations may impact the financial results we report for the portions of our business that operate in functional currencies other than the U.S. dollar. Our operations outside of the U.S. represented 41.8% and 39.1% of our revenue during 2017 and 2016, respectively. An increase or decrease in the strength of the U.S. dollar against these currencies by 10% would result in a 4.2% change in our consolidated revenue and a 2.6% change in our operating income for the year ended December 31, 2017. See our Results of Operations discussion in Item 7 of this Annual Report on Form 10-K for additional information regarding the impact of fluctuations in exchange rates on our year over year results.
Additionally, we are exposed to foreign currency fluctuations with respect to the purchase of aftermarket products from foreign countries, primarily in Europe and Asia. To the extent that our inventory purchases are not denominated in the functional currency of the purchasing location, we are exposed to exchange rate fluctuations. In several of our operations, we purchase inventory from manufacturers in Taiwan in U.S. dollars, which exposes us to fluctuations in the relationship between the local functional currency and the U.S. dollar, as well as fluctuations between the U.S. dollar and the Taiwan dollar. We hedge our exposure to foreign currency fluctuations related to a portion of inventory purchases in our Europe operations, but the notional amount and fair value of these foreign currency forward contracts at December 31, 2017 were immaterial. We do not currently attempt to hedge foreign currency exposure related to our foreign currency denominated inventory purchases in our North America operations, and we may not be able to pass on any price increases to our customers.
Other than with respect to a portion of our foreign currency denominated inventory purchases, we do not hold derivative contracts to hedge foreign currency risk. Our net investment in foreign operations is partially hedged by the foreign currency denominated borrowings we use to fund foreign acquisitions; however, our ability to use foreign currency denominated borrowings to finance our foreign operations may be limited based on local tax laws. We have elected not to hedge the foreign currency risk related to the interest payments on foreign borrowings as we generate cash flows in the local currencies that can be used to fund debt payments. As of December 31, 2017, we had outstanding borrowings of €500 million
under our Euro Notes (2024), and £124 million, CAD $130 million,
SEK 250 million
, and
€132 million under our revolving credit facilities.
Interest Rates
Our results of operations are exposed to changes in interest rates primarily with respect to borrowings under our credit facilities, where interest rates are tied to the prime rate, LIBOR or CDOR. Therefore, we implemented a policy to manage our exposure to variable interest rates on a portion of our outstanding variable rate debt instruments through the use of interest rate swap contracts. These contracts convert a portion of our variable rate debt to fixed rate debt, matching the currency, effective dates and maturity dates to specific debt instruments. Net interest payments or receipts from interest rate swap contracts are included as adjustments to interest expense. All of our interest rate swap contracts have been executed with banks that we believe are creditworthy (Wells Fargo Bank, N.A.; Bank of America, N.A.; Citizens, N.A.; Fifth Third Bank; HSBC Bank USA, N.A.; and Banco Bilbao Vizcaya Argentaria, S.A.).
As of December 31, 2017, we held ten interest rate swap contracts representing a total of $590 million of U.S. dollar-denominated notional amount debt. Our interest rate swap contracts are designated as cash flow hedges and modify the variable rate nature of that portion of our variable rate debt. These swaps have maturity dates ranging from January 2021 through June 2021. As of December 31, 2017, the fair value of the interest rate swap contracts was an asset of $19 million. The values of such contracts are subject to changes in interest rates.
In addition to these interest rate swaps, as of December 31, 2017 we held three cross currency swap agreements for a total notional amount of $407 million (€385 million) with maturity dates in January 2021. These cross currency swaps contain an interest rate swap component and a foreign currency forward contract component that, combined with related intercompany financing arrangements, effectively convert variable rate U.S. dollar-denominated borrowings into fixed rate euro-denominated borrowings. The swaps are intended to eliminate uncertainty in cash flows in U.S. dollars and euros in connection with intercompany financing arrangements. The cross currency swaps were also executed with banks we believe are creditworthy (Wells Fargo Bank, N.A.; Bank of America, N.A.; and The Bank of Tokyo-Mitsubishi UFJ, Ltd.). As of December 31, 2017, the fair value of the interest rate swap components of the cross currency swaps was an asset of $6 million, and the fair
59
value of the currency forward components was a liability of $61 million. The values of these contracts are subject to changes in interest rates and foreign currency exchange rates.
In total, we had 48% of our variable rate debt under our credit facilities at fixed rates at December 31, 2017 and December 31, 2016. See
Note 9, "Long-Term Obligations
" and
Note 10, "Derivative Instruments and Hedging Activities
" to the consolidated financial statements in Part II, Item 8 of this Annual Report on Form 10-K for additional information.
At December 31, 2017, we had $1.1 billion of variable rate debt that was not hedged. Using sensitivity analysis, a 100 basis point movement in interest rates would change interest expense by $11 million over the next twelve months.
Commodity Prices
We are exposed to market risk related to price fluctuations in scrap metal and other metals. Market prices of these metals affect the amount that we pay for our inventory and the revenue that we generate from sales of these metals. As both our revenue and costs are affected by the price fluctuations, we have a natural hedge against the changes. However, there is typically a lag between the effect on our revenue from metal price fluctuations and inventory cost changes, and there is no guarantee that the vehicle costs will decrease or increase at the same rate as the metals prices. Therefore, we can experience positive or negative gross margin effects in periods of rising or falling metals prices, particularly when such prices move rapidly. Additionally, if market prices were to change at a greater rate than our vehicle acquisition costs, we could experience a positive or negative effect on our operating margin. The average of scrap metal prices for 2017 has increased 31.8% over the average for 2016.
60
*****
INDEX TO FINANCIAL STATEMENTS
|
Page
|
|
|
LKQ CORPORATION AND SUBSIDIARIES
|
|
61
REPORT OF INDEPENDENT REGISTERED PUBLIC ACCOUNTING FIRM
To the Board of Directors and stockholders of LKQ Corporation:
Opinion on the Financial Statements
We have audited the accompanying consolidated balance sheets of LKQ Corporation and subsidiaries (the "Company") as of
December 31, 2017
and
2016
, the related consolidated statements of income, comprehensive income, cash flows, and stockholders' equity, for each of the three years in the period ended
December 31, 2017
, and the related notes and the schedule listed in the index at Item 15 (collectively referred to as the "financial statements"). In our opinion, the financial statements present fairly, in all material respects, the financial position of the Company as of
December 31, 2017
and
2016
, and the results of its operations and its cash flows for each of the three years in the period ended
December 31, 2017
, in conformity with accounting principles generally accepted in the United States of America.
We have also audited, in accordance with the standards of the Public Company Accounting Oversight Board (United States) (PCAOB), the Company's internal control over financial reporting as of
December 31, 2017
, based on criteria established in
Internal Control - Integrated Framework (2013)
issued by the Committee of Sponsoring Organizations of the Treadway Commission and our report dated
February 27, 2018
, expressed an unqualified opinion on the Company's internal control over financial reporting.
Basis for Opinion
These financial statements are the responsibility of the Company's management. Our responsibility is to express an opinion on the Company's financial statements based on our audits. We are a public accounting firm registered with the PCAOB and are required to be independent with respect to the Company in accordance with the U.S. federal securities laws and the applicable rules and regulations of the Securities and Exchange Commission and the PCAOB.
We conducted our audits in accordance with the standards of the PCAOB. Those standards require that we plan and perform the audit to obtain reasonable assurance about whether the financial statements are free of material misstatement, whether due to error or fraud. Our audits included performing procedures to assess the risks of material misstatement of the financial statements, whether due to error or fraud, and performing procedures that respond to those risks. Such procedures included examining, on a test basis, evidence regarding the amounts and disclosures in the financial statements. Our audits also included evaluating the accounting principles used and significant estimates made by management, as well as evaluating the overall presentation of the financial statements. We believe that our audits provide a reasonable basis for our opinion.
|
/s/ DELOITTE & TOUCHE LLP
|
Chicago, Illinois
February 27, 2018
We have served as the Company's auditor since 1998.
62
|
LKQ CORPORATION AND SUBSIDIARIES
(In thousands, except per share data)
|
|||||||||||
|
Year Ended December 31,
|
|||||||||||
|
|
2017
|
2016
|
2015
|
||||||||
|
Revenue
|
$
|
9,736,909
|
|
$
|
8,584,031
|
|
$
|
7,192,633
|
|
||
|
Cost of goods sold
|
5,937,286
|
|
5,232,328
|
|
4,359,104
|
|
|||||
|
Gross margin
|
3,799,623
|
|
3,351,703
|
|
2,833,529
|
|
|||||
|
Facility and warehouse expenses
|
797,388
|
|
688,918
|
|
556,041
|
|
|||||
|
Distribution expenses
|
784,485
|
|
683,812
|
|
602,897
|
|
|||||
|
Selling, general and administrative expenses
|
1,131,214
|
|
986,380
|
|
828,333
|
|
|||||
|
Restructuring and acquisition related expenses
|
19,672
|
|
37,762
|
|
19,511
|
|
|||||
|
Depreciation and amortization
|
219,546
|
|
191,433
|
|
122,120
|
|
|||||
|
Operating income
|
847,318
|
|
763,398
|
|
704,627
|
|
|||||
|
Other expense (income):
|
|||||||||||
|
Interest expense
|
101,640
|
|
88,263
|
|
57,860
|
|
|||||
|
Loss on debt extinguishment
|
456
|
|
26,650
|
|
—
|
|
|||||
|
Gains on foreign exchange contracts - acquisition related
|
—
|
|
(18,342
|
)
|
—
|
|
|||||
|
Gains on bargain purchases
|
(3,870
|
)
|
(8,207
|
)
|
—
|
|
|||||
|
Interest and other income, net
|
(17,535
|
)
|
(2,247
|
)
|
(2,263
|
)
|
|||||
|
Total other expense, net
|
80,691
|
|
86,117
|
|
55,597
|
|
|||||
|
Income from continuing operations before provision for income taxes
|
766,627
|
|
677,281
|
|
649,030
|
|
|||||
|
Provision for income taxes
|
235,560
|
|
220,566
|
|
219,703
|
|
|||||
|
Equity in earnings (loss) of unconsolidated subsidiaries
|
5,907
|
|
(592
|
)
|
(6,104
|
)
|
|||||
|
Income from continuing operations
|
536,974
|
|
456,123
|
|
423,223
|
|
|||||
|
Net (loss) income from discontinued operations
|
(6,746
|
)
|
7,852
|
|
—
|
|
|||||
|
Net income
|
530,228
|
|
463,975
|
|
423,223
|
|
|||||
|
Less: net loss attributable to noncontrolling interest
|
(3,516
|
)
|
—
|
|
—
|
|
|||||
|
Net income attributable to LKQ stockholders
|
$
|
533,744
|
|
$
|
463,975
|
|
$
|
423,223
|
|
||
|
Basic earnings per share:
(1)
|
|||||||||||
|
Income from continuing operations
|
$
|
1.74
|
|
$
|
1.49
|
|
$
|
1.39
|
|
||
|
Net (loss) income from discontinued operations
|
(0.02
|
)
|
0.03
|
|
—
|
|
|||||
|
Net income
|
1.72
|
|
1.51
|
|
1.39
|
|
|||||
|
Less: net loss attributable to noncontrolling interest
|
(0.01
|
)
|
—
|
|
—
|
|
|||||
|
Net income attributable to LKQ stockholders
|
$
|
1.73
|
|
$
|
1.51
|
|
$
|
1.39
|
|
||
|
Diluted earnings per share:
(1)
|
|||||||||||
|
Income from continuing operations
|
$
|
1.73
|
|
$
|
1.47
|
|
$
|
1.38
|
|
||
|
Net (loss) income from discontinued operations
|
(0.02
|
)
|
0.03
|
|
—
|
|
|||||
|
Net income
|
1.71
|
|
1.50
|
|
1.38
|
|
|||||
|
Less: net loss attributable to noncontrolling interest
|
(0.01
|
)
|
—
|
|
—
|
|
|||||
|
Net income attributable to LKQ stockholders
|
$
|
1.72
|
|
$
|
1.50
|
|
$
|
1.38
|
|
||
The accompanying notes are an integral part of the consolidated financial statements.
63
|
LKQ CORPORATION AND SUBSIDIARIES
Consolidated Statements of Comprehensive Income
(In thousands)
|
|||||||||||
|
Year Ended December 31,
|
|||||||||||
|
|
2017
|
2016
|
2015
|
||||||||
|
Net income
|
$
|
530,228
|
|
$
|
463,975
|
|
$
|
423,223
|
|
||
|
Less: net loss attributable to noncontrolling interest
|
(3,516
|
)
|
—
|
|
—
|
|
|||||
|
Net income attributable to LKQ stockholders
|
533,744
|
|
463,975
|
|
423,223
|
|
|||||
|
Other comprehensive income (loss):
|
|||||||||||
|
Foreign currency translation, net of tax
|
200,596
|
|
(175,639
|
)
|
(69,817
|
)
|
|||||
|
Net change in unrecognized gains/losses on derivative instruments, net of tax
|
3,447
|
|
9,023
|
|
2,469
|
|
|||||
|
Net change in unrealized gains/losses on pension plans, net of tax
|
(6,035
|
)
|
4,911
|
|
2,103
|
|
|||||
|
Net change in other comprehensive loss from unconsolidated subsidiaries
|
(1,309
|
)
|
—
|
|
—
|
|
|||||
|
Other comprehensive income (loss)
|
196,699
|
|
(161,705
|
)
|
(65,245
|
)
|
|||||
|
Comprehensive income
|
726,927
|
|
302,270
|
|
357,978
|
|
|||||
|
Less: comprehensive loss attributable to noncontrolling interest
|
(3,516
|
)
|
—
|
|
—
|
|
|||||
|
Comprehensive income attributable to LKQ stockholders
|
$
|
730,443
|
|
$
|
302,270
|
|
$
|
357,978
|
|
||
The accompanying notes are an integral part of the consolidated financial statements.
64
|
LKQ CORPORATION AND SUBSIDIARIES
(In thousands, except share and per share data)
|
|||||||
|
December 31,
|
|||||||
|
2017
|
2016
|
||||||
|
Assets
|
|||||||
|
Current assets:
|
|||||||
|
Cash and cash equivalents
|
$
|
279,766
|
|
$
|
227,400
|
|
|
|
Receivables, net
|
1,027,106
|
|
860,549
|
|
|||
|
Inventories
|
2,380,783
|
|
1,935,237
|
|
|||
|
Prepaid expenses and other current assets
|
134,479
|
|
87,768
|
|
|||
|
Assets of discontinued operations
|
—
|
|
456,640
|
|
|||
|
Total current assets
|
3,822,134
|
|
3,567,594
|
|
|||
|
Property, plant and equipment, net
|
913,089
|
|
811,576
|
|
|||
|
Intangible assets:
|
|||||||
|
Goodwill
|
3,536,511
|
|
3,054,769
|
|
|||
|
Other intangibles, net
|
743,769
|
|
584,231
|
|
|||
|
Equity method investments
|
208,404
|
|
183,467
|
|
|||
|
Other assets
|
142,965
|
|
101,562
|
|
|||
|
Total assets
|
$
|
9,366,872
|
|
$
|
8,303,199
|
|
|
|
Liabilities and Stockholders’ Equity
|
|||||||
|
Current liabilities:
|
|||||||
|
Accounts payable
|
$
|
788,613
|
|
$
|
633,773
|
|
|
|
Accrued expenses:
|
|||||||
|
Accrued payroll-related liabilities
|
143,424
|
|
118,755
|
|
|||
|
Other accrued expenses
|
218,600
|
|
209,101
|
|
|||
|
Other current liabilities
|
45,727
|
|
37,943
|
|
|||
|
Current portion of long-term obligations
|
126,360
|
|
66,109
|
|
|||
|
Liabilities of discontinued operations
|
—
|
|
145,104
|
|
|||
|
Total current liabilities
|
1,322,724
|
|
1,210,785
|
|
|||
|
Long-term obligations, excluding current portion
|
3,277,620
|
|
3,275,662
|
|
|||
|
Deferred income taxes
|
252,359
|
|
199,657
|
|
|||
|
Other noncurrent liabilities
|
307,516
|
|
174,146
|
|
|||
|
Commitments and contingencies
|
|
|
|||||
|
Stockholders’ equity:
|
|||||||
|
Common stock, $0.01 par value, 1,000,000,000 shares authorized, 309,126,386 and 307,544,759 shares issued and outstanding at December 31, 2017 and December 31, 2016, respectively
|
3,091
|
|
3,075
|
|
|||
|
Additional paid-in capital
|
1,141,451
|
|
1,116,690
|
|
|||
|
Retained earnings
|
3,124,103
|
|
2,590,359
|
|
|||
|
Accumulated other comprehensive loss
|
(70,476
|
)
|
(267,175
|
)
|
|||
|
Total Company stockholders' equity
|
4,198,169
|
|
3,442,949
|
|
|||
|
Noncontrolling interest
|
8,484
|
|
—
|
|
|||
|
Total stockholders' equity
|
4,206,653
|
|
3,442,949
|
|
|||
|
Total liabilities and stockholders’ equity
|
$
|
9,366,872
|
|
$
|
8,303,199
|
|
|
The accompanying notes are an integral part of the consolidated financial statements.
65
|
LKQ CORPORATION AND SUBSIDIARIES
(In thousands)
|
|||||||||||
|
Year Ended December 31,
|
|||||||||||
|
|
2017
|
2016
|
2015
|
||||||||
|
CASH FLOWS FROM OPERATING ACTIVITIES:
|
|||||||||||
|
Net income
|
$
|
530,228
|
|
$
|
463,975
|
|
$
|
423,223
|
|
||
|
Adjustments to reconcile net income to net cash provided by operating activities:
|
|||||||||||
|
Depreciation and amortization
|
230,203
|
|
206,086
|
|
128,192
|
|
|||||
|
Stock-based compensation expense
|
22,832
|
|
22,472
|
|
21,336
|
|
|||||
|
Loss on debt extinguishment
|
456
|
|
26,650
|
|
—
|
|
|||||
|
Loss on sale of business
|
10,796
|
|
—
|
|
—
|
|
|||||
|
Impairment on net assets of discontinued operations
|
—
|
|
26,677
|
|
—
|
|
|||||
|
Gains on foreign exchange contracts - acquisition related
|
—
|
|
(18,342
|
)
|
—
|
|
|||||
|
Gains on bargain purchases
|
(3,870
|
)
|
(8,207
|
)
|
—
|
|
|||||
|
Deferred income taxes
|
(46,537
|
)
|
(16,162
|
)
|
22,388
|
|
|||||
|
Other
|
1,301
|
|
19,550
|
|
7,348
|
|
|||||
|
Changes in operating assets and liabilities, net of effects from acquisitions and dispositions:
|
|||||||||||
|
Receivables, net
|
(55,979
|
)
|
(50,801
|
)
|
14,704
|
|
|||||
|
Inventories
|
(203,857
|
)
|
(64,114
|
)
|
(83,188
|
)
|
|||||
|
Prepaid income taxes/income taxes payable
|
8,376
|
|
14,944
|
|
17,474
|
|
|||||
|
Accounts payable
|
45,136
|
|
18,577
|
|
(4,222
|
)
|
|||||
|
Other operating assets and liabilities
|
(20,185
|
)
|
(6,291
|
)
|
(2,973
|
)
|
|||||
|
Net cash provided by operating activities
|
518,900
|
|
635,014
|
|
544,282
|
|
|||||
|
CASH FLOWS FROM INVESTING ACTIVITIES:
|
|||||||||||
|
Purchases of property, plant and equipment
|
(179,090
|
)
|
(207,074
|
)
|
(170,490
|
)
|
|||||
|
Acquisitions, net of cash acquired
|
(513,088
|
)
|
(1,349,339
|
)
|
(160,517
|
)
|
|||||
|
Proceeds from disposals of business/investment
|
301,297
|
|
10,304
|
|
—
|
|
|||||
|
Investments in unconsolidated subsidiaries
|
(7,664
|
)
|
(185,671
|
)
|
(9,682
|
)
|
|||||
|
Proceeds from foreign exchange contracts
|
—
|
|
18,342
|
|
—
|
|
|||||
|
Other investing activities, net
|
13,950
|
|
3,510
|
|
10,696
|
|
|||||
|
Net cash used in investing activities
|
(384,595
|
)
|
(1,709,928
|
)
|
(329,993
|
)
|
|||||
|
CASH FLOWS FROM FINANCING ACTIVITIES:
|
|||||||||||
|
Proceeds from exercise of stock options
|
7,470
|
|
7,963
|
|
8,168
|
|
|||||
|
Taxes paid related to net share settlements of stock-based compensation awards
|
(5,525
|
)
|
(4,438
|
)
|
(7,581
|
)
|
|||||
|
Debt issuance costs
|
(4,267
|
)
|
(16,554
|
)
|
(97
|
)
|
|||||
|
Proceeds from issuance of Euro Notes (2024)
|
—
|
|
563,450
|
|
—
|
|
|||||
|
Borrowings under revolving credit facilities
|
839,171
|
|
2,636,596
|
|
313,142
|
|
|||||
|
Repayments under revolving credit facilities
|
(946,477
|
)
|
(1,748,664
|
)
|
(445,282
|
)
|
|||||
|
Borrowings under term loans
|
—
|
|
582,115
|
|
—
|
|
|||||
|
Repayments under term loans
|
(27,884
|
)
|
(255,792
|
)
|
(22,500
|
)
|
|||||
|
Borrowings under receivables securitization facility
|
11,245
|
|
106,400
|
|
3,858
|
|
|||||
|
Repayments under receivables securitization facility
|
(11,245
|
)
|
(69,400
|
)
|
(35,758
|
)
|
|||||
|
Borrowings (repayments) of other debt, net
|
19,706
|
|
(31,156
|
)
|
(29,696
|
)
|
|||||
|
Payments of Rhiag debt and related payments
|
—
|
|
(543,347
|
)
|
—
|
|
|||||
|
Payments of other obligations
|
(2,077
|
)
|
(1,436
|
)
|
(22,791
|
)
|
|||||
|
Other financing activities, net
|
7,316
|
|
—
|
|
—
|
|
|||||
|
Net cash (used in) provided by financing activities
|
(112,567
|
)
|
1,225,737
|
|
(238,537
|
)
|
|||||
|
Effect of exchange rate changes on cash and cash equivalents
|
23,512
|
|
(3,704
|
)
|
(2,960
|
)
|
|||||
|
Net increase (decrease) in cash and cash equivalents
|
45,250
|
|
147,119
|
|
(27,208
|
)
|
|||||
|
Cash and cash equivalents of continuing operations, beginning of period
|
227,400
|
|
87,397
|
|
114,605
|
|
|||||
|
Add: Cash and cash equivalents of discontinued operations, beginning of period
|
7,116
|
|
—
|
|
—
|
|
|||||
|
Cash and cash equivalents of continuing and discontinued operations, beginning of period
|
234,516
|
|
87,397
|
|
114,605
|
|
|||||
|
Cash and cash equivalents of continuing and discontinued operations, end of period
|
279,766
|
|
234,516
|
|
87,397
|
|
|||||
|
Less: Cash and cash equivalents of discontinued operations, end of period
|
—
|
|
(7,116
|
)
|
—
|
|
|||||
|
Cash and cash equivalents, end of period
|
$
|
279,766
|
|
$
|
227,400
|
|
$
|
87,397
|
|
||
|
Supplemental disclosure of cash paid for:
|
|||||||||||
|
Income taxes, net of refunds
|
$
|
273,019
|
|
$
|
230,036
|
|
$
|
180,126
|
|
||
|
Interest
|
95,707
|
|
86,021
|
|
54,917
|
|
|||||
|
Supplemental disclosure of noncash investing and financing activities:
|
|||||||||||
|
Contingent consideration liabilities
|
$
|
6,234
|
|
$
|
—
|
|
$
|
—
|
|
||
The accompanying notes are an integral part of the consolidated financial statements.
66
|
LKQ CORPORATION AND SUBSIDIARIES
Consolidated Statements of Cash Flows
(In thousands)
|
|||||||||||
|
Notes payable and other financing obligations, including notes issued and debt assumed in connection with business acquisitions
|
59,045
|
|
568,032
|
|
28,348
|
|
|||||
|
Noncash property, plant and equipment additions
|
18,122
|
|
10,715
|
|
8,846
|
|
|||||
|
Notes and other financing receivables in connection with disposals of business/investment
|
4,000
|
|
—
|
|
—
|
|
|||||
The accompanying notes are an integral part of the consolidated financial statements.
67
|
LKQ CORPORATION AND SUBSIDIARIES
Consolidated Statements of Stockholders’ Equity
(In thousands)
|
||||||||||||||||||||||||||
|
LKQ Stockholders
|
||||||||||||||||||||||||||
|
|
Common Stock
|
Additional Paid-In Capital
|
Retained
Earnings
|
Accumulated
Other
Comprehensive (Loss) Income
|
Noncontrolling Interest
|
Total Stockholders' Equity
|
||||||||||||||||||||
|
|
Shares
Issued
|
Amount
|
||||||||||||||||||||||||
|
BALANCE, January 1, 2015
|
303,453
|
|
$
|
3,035
|
|
$
|
1,054,686
|
|
$
|
1,703,161
|
|
$
|
(40,225
|
)
|
$
|
—
|
|
$
|
2,720,657
|
|
||||||
|
Net income
|
—
|
|
—
|
|
—
|
|
423,223
|
|
—
|
|
—
|
|
423,223
|
|
||||||||||||
|
Other comprehensive loss
|
—
|
|
—
|
|
—
|
|
—
|
|
(65,245
|
)
|
—
|
|
(65,245
|
)
|
||||||||||||
|
Restricted stock units vested, net of shares withheld for employee tax
|
840
|
|
8
|
|
(4,349
|
)
|
—
|
|
—
|
|
—
|
|
(4,341
|
)
|
||||||||||||
|
Stock-based compensation expense
|
—
|
|
—
|
|
21,336
|
|
—
|
|
—
|
|
—
|
|
21,336
|
|
||||||||||||
|
Exercise of stock options
|
1,425
|
|
14
|
|
8,849
|
|
—
|
|
—
|
|
—
|
|
8,863
|
|
||||||||||||
|
Tax withholdings related to net share settlements of stock-based compensation awards
|
(144
|
)
|
(2
|
)
|
(3,934
|
)
|
—
|
|
—
|
|
—
|
|
(3,936
|
)
|
||||||||||||
|
Excess tax benefit from stock-based payments
|
—
|
|
—
|
|
14,125
|
|
—
|
|
—
|
|
—
|
|
14,125
|
|
||||||||||||
|
BALANCE, December 31, 2015
|
305,574
|
|
$
|
3,055
|
|
$
|
1,090,713
|
|
$
|
2,126,384
|
|
$
|
(105,470
|
)
|
$
|
—
|
|
$
|
3,114,682
|
|
||||||
|
Net income
|
—
|
|
|
—
|
|
|
—
|
|
|
463,975
|
|
|
—
|
|
—
|
|
|
463,975
|
|
|||||||
|
Other comprehensive loss
|
—
|
|
|
—
|
|
|
—
|
|
|
—
|
|
|
(161,705
|
)
|
—
|
|
|
(161,705
|
)
|
|||||||
|
Restricted stock units vested, net of shares withheld for employee tax
|
847
|
|
|
9
|
|
|
(4,447
|
)
|
|
—
|
|
|
—
|
|
—
|
|
|
(4,438
|
)
|
|||||||
|
Stock-based compensation expense
|
—
|
|
|
—
|
|
|
22,472
|
|
|
—
|
|
|
—
|
|
—
|
|
|
22,472
|
|
|||||||
|
Exercise of stock options
|
1,124
|
|
|
11
|
|
|
7,952
|
|
|
—
|
|
|
—
|
|
—
|
|
|
7,963
|
|
|||||||
|
BALANCE, December 31, 2016
|
307,545
|
|
$
|
3,075
|
|
$
|
1,116,690
|
|
$
|
2,590,359
|
|
$
|
(267,175
|
)
|
$
|
—
|
|
$
|
3,442,949
|
|
||||||
|
Net income
|
—
|
|
—
|
|
—
|
|
533,744
|
|
—
|
|
(3,516
|
)
|
530,228
|
|
||||||||||||
|
Other comprehensive income
|
—
|
|
—
|
|
—
|
|
—
|
|
196,699
|
|
—
|
|
196,699
|
|
||||||||||||
|
Restricted stock units vested, net of shares withheld for employee tax
|
749
|
|
7
|
|
(4,332
|
)
|
—
|
|
—
|
|
—
|
|
(4,325
|
)
|
||||||||||||
|
Stock-based compensation expense
|
—
|
|
—
|
|
22,832
|
|
—
|
|
—
|
|
—
|
|
22,832
|
|
||||||||||||
|
Exercise of stock options
|
867
|
|
9
|
|
7,461
|
|
—
|
|
—
|
|
—
|
|
7,470
|
|
||||||||||||
|
Tax withholdings related to net share settlements of stock-based compensation awards
|
(34
|
)
|
—
|
|
(1,200
|
)
|
—
|
|
—
|
|
—
|
|
(1,200
|
)
|
||||||||||||
|
Sales of subsidiary shares to noncontrolling interest
|
—
|
|
—
|
|
—
|
|
—
|
|
—
|
|
12,000
|
|
12,000
|
|
||||||||||||
|
BALANCE, December 31, 2017
|
309,127
|
|
$
|
3,091
|
|
$
|
1,141,451
|
|
$
|
3,124,103
|
|
$
|
(70,476
|
)
|
$
|
8,484
|
|
$
|
4,206,653
|
|
||||||
The accompanying notes are an integral part of the consolidated financial statements.
68
LKQ CORPORATION AND SUBSIDIARIES
NOTES TO CONSOLIDATED FINANCIAL STATEMENTS
|
Note 1.
|
Business
|
The financial statements presented in this report represent the consolidation of LKQ Corporation, a Delaware corporation, and its subsidiaries. LKQ Corporation is a holding company and all operations are conducted by subsidiaries. When the terms "LKQ," "the Company," "we," "us," or "our" are used in this document, those terms refer to LKQ Corporation and its consolidated subsidiaries.
We are a leading provider of alternative vehicle collision replacement products and alternative vehicle mechanical replacement products, with our sales, processing, and distribution facilities reaching most major markets in the United States and Canada. We are also a leading provider of alternative vehicle replacement and maintenance products in Europe. In addition to our wholesale operations, we operate self service retail facilities across the U.S. that sell recycled automotive products from end-of-life-vehicles. We are also a leading distributor of specialty vehicle aftermarket equipment and accessories reaching most major markets in the U.S. and Canada. In total, we operate approximately
1,500
facilities.
During the year ended December 31, 2017, we completed
26
acquisitions including
6
wholesale businesses in North America,
16
wholesale businesses in Europe and
4
Specialty vehicle aftermarket businesses. Our acquisitions in Europe included the acquisition of
four
aftermarket parts distribution businesses in Belgium in July 2017. Our acquisitions in Specialty included the acquisition of Warn in November 2017.
Total acquisition date fair value of the consideration for these acquisitions was
$542 million
, composed of
$510 million
of cash paid (net of cash acquired),
$6 million
for the estimated value of contingent payments to former owners (with maximum potential payments totaling
$19 million
),
$5 million
of other purchase price obligations (non-interest bearing) and
$20 million
of notes payable. We typically fund our acquisitions using borrowings under our credit facilities or other financing arrangements. During the year ended December 31, 2017, we recorded
$307 million
of goodwill related to these acquisitions, of which we expect
$21 million
to be deductible for income tax purposes. In the period between the acquisition dates and December 31, 2017, these acquisitions generated revenue of
$227 million
and an operating loss of
$2 million
.
On December 10, 2017, we entered into an agreement to acquire Stahlgruber, a leading European wholesale distributor of aftermarket spare parts for passenger cars, tools, capital equipment and accessories with operations in Germany, Austria, Czech Republic, Italy, Slovenia, and Croatia with further sales to Switzerland. The transaction is expected to be completed in the first half of 2018 and is subject to regulatory approvals. This acquisition will expand LKQ's geographic presence in continental Europe and serve as an additional strategic hub for our European operations. In addition, we believe this acquisition will allow for continued improvement in procurement, logistics and infrastructure optimization.
On March 18, 2016, we acquired Rhiag, a distributor of aftermarket spare parts for passenger cars and commercial vehicles in Italy, Czech Republic, Slovakia, Switzerland, Hungary, Romania, Ukraine, Bulgaria, Poland and Spain. This acquisition expanded LKQ's geographic presence in continental Europe, and we believe the acquisition will generate potential purchasing synergies. Total acquisition date fair value of the consideration for our Rhiag acquisition was
€534 million
(
$602 million
), composed of
€534 million
(
$601 million
) of cash paid (net of cash acquired) and
€1 million
(
$1 million
) of intercompany balances considered to be effectively settled as part of the transaction. In addition, we assumed
€489 million
(
$551 million
) of existing Rhiag debt as of the acquisition date. We recorded
$591 million
(
$585 million
in 2016 and
$5 million
in the three months ended March 31, 2017) of goodwill related to our acquisition of Rhiag, which we do not expect to be deductible for income tax purposes.
Related to the funding of the purchase price of the Rhiag acquisition, LKQ entered into foreign currency forward contracts in March 2016 to acquire a total of
€588 million
. The rates locked in under the foreign currency forwards were favorable to the spot rate on the settlement date, and as a result, these derivative contracts generated a gain of
$18 million
during the year ended December 31, 2016. The gain on the foreign currency forwards was recorded in Gains on foreign exchange contracts - acquisition related on our consolidated statement of income for the
year ended
December 31, 2016.
On April 21, 2016, we acquired PGW. At acquisition, PGW’s business comprised aftermarket automotive replacement glass distribution services and automotive glass manufacturing. The acquisition expanded our addressable market in North America. Additionally, the acquisition created distribution synergies with our existing network. Total acquisition date fair value of the consideration for our PGW acquisition was
$662 million
, consisting of cash paid (net of cash acquired). We recorded
$208 million
(
$205 million
in 2016 and
$3 million
in the six months ended June 30, 2017) of goodwill related to our acquisition of PGW, of which we expect
$104 million
to be deductible for income tax purposes.
69
On October 4, 2016, we acquired substantially all of the business assets of Andrew Page, a distributor of aftermarket automotive parts in the U.K., out of receivership. The acquisition was subject to regulatory approval by the CMA in the U.K. The CMA concluded its review on October 31, 2017 and determined that we must divest less than
10%
of the acquired locations. Total acquisition date fair value of the consideration for this acquisition was
£16 million
(
$20 million
). In connection with the acquisition, we recorded a gain on bargain purchase of
$10 million
(
$8 million
recorded in 2016 and
$2 million
recorded in 2017), which is reported on a separate line in our consolidated statements of income. We believe that we were able to acquire the net assets of Andrew Page for less than fair value as a result of (i) Andrew Page's financial difficulties that put the company into receivership prior to our acquisition and (ii) a motivated seller that desired to complete the sale in an expedient manner to ensure continuity of the business.
In addition to our acquisitions of Rhiag, PGW and Andrew Page, we acquired
seven
wholesale businesses in Europe and
five
wholesale businesses in North America during the year ended December 31, 2016. Total acquisition date fair value of the consideration for these acquisitions was
$76 million
, composed of
$68 million
of cash paid (net of cash acquired),
$4 million
of notes payable and
$4 million
of other purchase price obligations (non-interest bearing). During the year ended December 31, 2016, we recorded
$52 million
of goodwill related to these acquisitions and immaterial adjustments to preliminary purchase price allocations related to certain of our 2015 acquisitions. We expect that substantially all of the goodwill recorded for these acquisitions will not be deductible for income tax purposes.
During the year ended December 31, 2015, we completed
18
acquisitions, including four wholesale businesses in North America,
12
wholesale businesses in Europe, a self service retail operation, and a specialty vehicle aftermarket business. Our wholesale business acquisitions in North America included Parts Channel, an aftermarket collision parts distributor. We also acquired Coast, a specialty aftermarket business that distributes replacement parts, supplies and accessories in North America for the RV and outdoor recreation markets. Our European acquisitions included
11
aftermarket parts distribution businesses in the Netherlands, nine of which were former customers of and distributors for our Netherlands subsidiary, Sator, and were acquired with the objective of expanding our distribution network in the Netherlands. Our other acquisitions completed during the year ended December 31, 2015 enabled us to expand our geographic presence. Total acquisition date fair value of the consideration for these acquisitions was $
188 million
, composed of
$161 million
of cash (net of cash acquired),
$4 million
of notes payable,
$21 million
of other purchase price obligations, and
$1 million
of pre-existing balances between us and the acquired entities considered to be effectively settled as a result of the acquisitions. During the year ended December 31, 2015, we recorded
$92 million
of goodwill related to these acquisitions and immaterial adjustments to preliminary purchase price allocations related to certain of our 2014 acquisitions. We expect $
70 million
of the
$92 million
of goodwill recorded to be deductible for income tax purposes.
Our acquisitions are accounted for under the purchase method of accounting and are included in our consolidated financial statements from the dates of acquisition. The purchase prices were allocated to the net assets acquired based upon estimated fair market values at the dates of acquisition. The purchase price allocations for the acquisitions made during the year ended December 31, 2017 are preliminary as we are in the process of determining the following: 1) valuation amounts for certain receivables, inventories and fixed assets acquired; 2) valuation amounts for certain intangible assets acquired; 3) the acquisition date fair value of certain liabilities assumed; and 4) the final estimation of the tax basis of the entities acquired. We have recorded preliminary estimates for certain of the items noted above and will record adjustments, if any, to the preliminary amounts upon finalization of the valuations.
From the date of our preliminary allocation for Rhiag in the first quarter of 2016 through March 31, 2017, we recorded adjustments based on our valuation procedures for our acquisition of Rhiag that resulted in a decrease of
$154 million
to goodwill recorded in 2016, partially offset by a
$5 million
increase to goodwill recorded in 2017. The 2016 adjustments were primarily attributable to an increase in the value allocated to acquired assets, primarily intangible assets and property, plant and equipment; the 2017 adjustments were primarily attributable to a decline in the value allocated to property, plant and equipment. Additionally, from the date of our preliminary allocation for PGW in the second quarter of 2016 through June 30, 2017, we recorded adjustments based on our valuation procedures that resulted in a
$24 million
increase to goodwill recorded, of which
$3 million
was recorded in 2017. These adjustments were primarily attributable to a decline in the value allocated to property, plant and equipment, partially offset by an increase in the value allocated to deferred taxes. Finally, from the date of our preliminary allocations for our acquisitions completed in the first nine months of 2017 through December 31, 2017, we recorded adjustments based on our valuation procedures that resulted in a decrease to goodwill of
$15 million
. This decrease to goodwill was primarily a result of (i) an increase in the value allocated to acquired assets, primarily intangible assets and property, plant and equipment, and (ii) a decrease in our estimate of the acquisition date fair value of the contingent payment liability to the former owners. The income statement effect of these measurement period adjustments for our Rhiag and PGW acquisitions as well as our acquisitions completed in the first nine months of 2017 that would have been recorded in previous reporting periods if the adjustments had been recognized as of the acquisition dates was immaterial. The balance sheet impact and income statement effect of other measurement-period adjustments recorded for acquisitions completed in prior periods were immaterial.
70
The purchase price allocations for the acquisitions completed during the years ended December 31,
2017
and
2016
are as follows (in thousands):
|
|
Year Ended
|
Year Ended
|
|||||||||||||||||
|
December 31, 2017
|
December 31, 2016
|
||||||||||||||||||
|
|
All
Acquisitions
(1)
|
Rhiag
|
PGW
(2)
|
Other
Acquisitions
|
Total
|
||||||||||||||
|
Receivables
|
$
|
73,782
|
|
$
|
230,670
|
|
$
|
136,523
|
|
$
|
13,216
|
|
$
|
380,409
|
|
||||
|
Receivable reserves
|
(7,032
|
)
|
(28,242
|
)
|
(7,135
|
)
|
(794
|
)
|
(36,171
|
)
|
|||||||||
|
Inventories
(3)
|
150,342
|
|
239,529
|
|
169,159
|
|
62,223
|
|
470,911
|
|
|||||||||
|
Prepaid expenses and other current assets
|
(295
|
)
|
10,793
|
|
42,573
|
|
4,445
|
|
57,811
|
|
|||||||||
|
Property
,
plant and equipment
|
41,039
|
|
56,774
|
|
225,645
|
|
17,140
|
|
299,559
|
|
|||||||||
|
Goodwill
|
314,817
|
|
585,415
|
|
205,058
|
|
52,336
|
|
842,809
|
|
|||||||||
|
Other intangibles
|
181,216
|
|
429,360
|
|
37,954
|
|
2,537
|
|
469,851
|
|
|||||||||
|
Other assets
(4)
|
3,257
|
|
2,092
|
|
57,671
|
|
(133
|
)
|
59,630
|
|
|||||||||
|
Deferred income taxes
|
(65,087
|
)
|
(110,791
|
)
|
17,506
|
|
(1,000
|
)
|
(94,285
|
)
|
|||||||||
|
Current liabilities assumed
|
(111,484
|
)
|
(239,665
|
)
|
(168,332
|
)
|
(42,290
|
)
|
(450,287
|
)
|
|||||||||
|
Debt assumed
|
(33,586
|
)
|
(550,843
|
)
|
(4,027
|
)
|
(2,378
|
)
|
(557,248
|
)
|
|||||||||
|
Other noncurrent liabilities assumed
|
(1,917
|
)
|
(23,085
|
)
|
(50,847
|
)
|
(103
|
)
|
(74,035
|
)
|
|||||||||
|
Contingent consideration liabilities
|
(6,234
|
)
|
—
|
|
—
|
|
—
|
|
—
|
|
|||||||||
|
Other purchase price obligations
|
(5,074
|
)
|
—
|
|
—
|
|
(6,698
|
)
|
(6,698
|
)
|
|||||||||
|
Notes issued
|
(20,187
|
)
|
—
|
|
—
|
|
(4,087
|
)
|
(4,087
|
)
|
|||||||||
|
Settlement of pre-existing balances
|
242
|
|
(591
|
)
|
—
|
|
(32
|
)
|
(623
|
)
|
|||||||||
|
Gains on bargain purchases
(5)
|
(3,870
|
)
|
—
|
|
—
|
|
(8,207
|
)
|
(8,207
|
)
|
|||||||||
|
Settlement of other purchase price obligations (non-interest bearing)
|
3,159
|
|
—
|
|
—
|
|
—
|
|
—
|
|
|||||||||
|
Cash used in acquisitions, net of cash acquired
|
$
|
513,088
|
|
$
|
601,416
|
|
$
|
661,748
|
|
$
|
86,175
|
|
$
|
1,349,339
|
|
||||
|
(1)
|
Includes
$6 million
and
$3 million
of adjustments to reduce property
, plant
and equipment and other assets for Rhiag and PGW, respectively.
|
|
(2)
|
Includes both continuing and discontinued operations of PGW. See Note 3, "Discontinued Operations" for further information on our discontinued operations.
|
|
(3)
|
The PGW inventory balance includes the impact of a
$10 million
step-up adjustment to report the inventory at its fair value. The amount for our 2017 acquisitions includes a
$4 million
step-up adjustment related to our Warn acquisition.
|
|
(4)
|
The balance for PGW includes
$24 million
of investments in unconsolidated subsidiaries which relate to the discontinued portion of our PGW operations.
|
|
(5)
|
The amount recorded during the year ended December 31, 2017 includes a
$2 million
increase to the gain on bargain purchase recorded for our Andrew Page acquisition as a result of changes to our estimate of the fair value of the net assets acquired. The remainder of the gain on bargain purchase recorded during the year ended December 31, 2017 is an immaterial amount related to another acquisition in Europe completed in the second quarter of 2017.
|
The fair value of our intangible assets is based on a number of inputs including projections of future cash flows, assumed royalty rates and customer attrition rates, all of which are Level 3 inputs. The fair value of our property
, plant
and equipment is determined using inputs such as market comparables and current replacement or reproduction costs of the asset, adjusted for physical, functional and economic factors; these adjustments to arrive at fair value use unobservable inputs in which little or no market data exists, and therefore, these inputs are considered to be Level 3 inputs. See Note 2, "Fair Value Measurements" for further information regarding the tiers in the fair value hierarchy.
Other noncurrent liabilities recorded for our acquisitions of Rhiag and PGW includes a liability for certain pension and other post-retirement obligations we assumed with the acquisitions. A portion of PGW's liability for pension and post-retirement obligations relates to the glass manufacturing operations business, which was classified as discontinued operations, and was recorded within Liabilities of discontinued operations on our consolidated balance sheet as of December 31, 2016; these amounts were included in the net assets disposed of as part of the sale of the business, which occurred in the first quarter
71
of 2017. Due to the immateriality of our pension plans for our continuing operations, we have not provided the detailed disclosures otherwise prescribed by the accounting guidance on pensions and other post-retirement obligations.
The primary objectives of our acquisitions made during the years ended
December 31, 2017
and
2016
were to create economic value for our stockholders by enhancing our position as a leading source for alternative collision and mechanical repair products and to expand into other product lines and businesses that may benefit from our operating strengths. Certain 2017 acquisitions were completed to enable us to align our distribution model in the Benelux region. Our 2016 acquisition of Rhiag enabled us to expand our market presence in continental Europe. We believe that our Rhiag acquisition will allow for synergies within our European operations, most notably in procurement, and these projected synergies contributed to the goodwill recorded on the Rhiag acquisition. Our acquisition of PGW autoglass enabled us to enter into new product lines and increase the size of our addressable market. In addition, the acquisition of PGW autoglass created distribution synergies with our existing network in North America, which contributed to the goodwill recorded on the acquisition.
When we identify potential acquisitions, we attempt to target companies with a leading market presence, an experienced management team and workforce that provide a fit with our existing operations, and strong cash flows. For certain of our acquisitions, we have identified cost savings and synergies as a result of integrating the company with our existing business that provide additional value to the combined entity. In many cases, acquiring companies with these characteristics will result in purchase prices that include a significant amount of goodwill.
72
The following pro forma summary presents the effect of the businesses acquired during the year ended
December 31, 2017
as though the businesses had been acquired as of
January 1, 2016
, the businesses acquired during the year ended
December 31, 2016
as though they had been acquired as of
January 1, 2015
, and the businesses acquired during the year ended
December 31, 2015
as though they had been acquired as of January 1, 2014. The pro forma adjustments are based upon unaudited financial information of the acquired entities (in thousands, except per share data):
|
Year Ended December 31,
|
|||||||||||
|
2017
|
2016
|
2015
|
|||||||||
|
Revenue, as reported
|
$
|
9,736,909
|
|
$
|
8,584,031
|
|
$
|
7,192,633
|
|
||
|
Revenue of purchased businesses for the period prior to acquisition:
|
|||||||||||
|
Rhiag
|
—
|
|
213,376
|
|
994,903
|
|
|||||
|
PGW
(1)
|
—
|
|
102,540
|
|
339,012
|
|
|||||
|
Other acquisitions
|
333,995
|
|
854,601
|
|
615,140
|
|
|||||
|
Pro forma revenue
|
$
|
10,070,904
|
|
$
|
9,754,548
|
|
$
|
9,141,688
|
|
||
|
Income from continuing operations, as reported
|
$
|
536,974
|
|
$
|
456,123
|
|
$
|
423,223
|
|
||
|
Income (loss) from continuing operations of purchased businesses for the period prior to acquisition, and pro forma purchase accounting adjustments:
|
|||||||||||
|
Rhiag
|
—
|
|
(84
|
)
|
10,310
|
|
|||||
|
PGW
(1),(2)
|
—
|
|
7,574
|
|
3,334
|
|
|||||
|
Other acquisitions
|
15,431
|
|
19,323
|
|
15,266
|
|
|||||
|
Acquisition related expenses, net of tax
(3)
|
5,870
|
|
11,602
|
|
1,830
|
|
|||||
|
Pro forma income from continuing operations
|
$
|
558,275
|
|
$
|
494,538
|
|
$
|
453,963
|
|
||
|
Earnings per share from continuing operations, basic - as reported
|
$
|
1.74
|
|
$
|
1.49
|
|
$
|
1.39
|
|
||
|
Effect of purchased businesses for the period prior to acquisition:
|
|||||||||||
|
Rhiag
|
—
|
|
(0.00)
|
|
0.03
|
|
|||||
|
PGW
(1),(2)
|
—
|
|
0.02
|
|
0.01
|
|
|||||
|
Other acquisitions
|
0.05
|
|
0.06
|
|
0.05
|
|
|||||
|
Acquisition related expenses, net of tax
(3)
|
0.02
|
|
0.04
|
|
0.01
|
|
|||||
|
Pro forma earnings per share from continuing operations, basic
(4)
|
$
|
1.81
|
|
$
|
1.61
|
|
$
|
1.49
|
|
||
|
Earnings per share from continuing operations, diluted - as reported
|
$
|
1.73
|
|
$
|
1.47
|
|
$
|
1.38
|
|
||
|
Effect of purchased businesses for the period prior to acquisition:
|
|||||||||||
|
Rhiag
|
—
|
|
(0.00)
|
|
0.03
|
|
|||||
|
PGW
(1),(2)
|
—
|
|
0.02
|
|
0.01
|
|
|||||
|
Other acquisitions
|
0.05
|
|
0.06
|
|
0.05
|
|
|||||
|
Acquisition related expenses, net of tax
(3)
|
0.02
|
|
0.04
|
|
0.01
|
|
|||||
|
Pro forma earnings per share from continuing operations, diluted
(4)
|
$
|
1.80
|
|
$
|
1.60
|
|
$
|
1.48
|
|
||
|
(1)
|
PGW reflects the results for the continuing aftermarket automotive glass distribution business only.
|
|
(2)
|
Excludes
$18 million
and
$5 million
of corporate costs for 2015 and 2016, respectively, that we do not expect to incur going forward as a result of the sale of our glass manufacturing business.
|
|
(3)
|
Includes expenses related to acquisitions closed in the period and excludes expenses for acquisitions not yet completed.
|
|
(4)
|
The sum of the individual earnings per share amounts may not equal the total due to rounding.
|
Unaudited pro forma supplemental information is based upon accounting estimates and judgments that we believe are reasonable. The unaudited pro forma supplemental information includes the effect of purchase accounting adjustments, such as the adjustment of inventory acquired to fair value, adjustments to depreciation on acquired property
, plant
and equipment, adjustments to rent expense for above or below market leases, adjustments to amortization on acquired intangible assets, adjustments to interest expense, and the related tax effects. The pro forma impact of our acquisitions also reflects the elimination of acquisition related expenses, net of tax. Refer to Note 5, "Restructuring and Acquisition Related Expenses," for
73
further information regarding our acquisition related expenses. These pro forma results are not necessarily indicative of what would have occurred if the acquisitions had been in effect for the periods presented or of future results.
On March 1, 2017, LKQ completed the sale of the glass manufacturing business of its PGW subsidiary to a subsidiary of Vitro S.A.B. de C.V. ("Vitro") for a sales price of
$301 million
, including cash received of
$316 million
, net of cash disposed of
$15 million
. Related to this transaction, the remaining portion of the Glass operating segment was combined with our Wholesale - North America operating segment, which is part of our North America reportable segment, in the first quarter of 2017. See
Note 14, "Segment and Geographic Information
" for further information regarding our segments.
Upon execution of the Stock and Asset Purchase Agreement (the "Vitro Agreement") in December 2016, LKQ concluded that the glass manufacturing business met the criteria to be classified as held for sale in LKQ’s consolidated financial statements. As a result, the assets related to the glass manufacturing business were reflected on the Consolidated Balance Sheet at the lower of the net asset carrying value or fair value less cost to sell as of December 31, 2016. The fair value of the assets was determined using the negotiated sale price as an indicator of fair value, which is considered a Level 2 input as it is observable in a non-active market. See Note 2, "Fair Value Measurements" for further information regarding the tiers in the fair value hierarchy.
As part of the Vitro Agreement, the Company and Vitro entered into a twelve-month Transition Services Agreement commencing on the transaction date with two six-month renewal periods, a three-year Purchase and Supply Agreement, and an Intellectual Property Agreement.
The following table summarizes the operating results of the Company’s discontinued operations related to the sale described above for the years ended December 31, 2017 and 2016, as presented in “Net (loss) income from discontinued operations, net of tax” on the Consolidated Statements of Income (in thousands):
|
Year Ended
December 31,
|
|||||||
|
2017
|
2016
|
||||||
|
Revenue
|
$
|
111,130
|
|
$
|
498,233
|
|
|
|
Cost of goods sold
|
100,084
|
|
424,161
|
|
|||
|
Operating expenses
|
8,369
|
|
22,330
|
|
|||
|
Impairment on net assets of discontinued operations
(1)
|
—
|
|
26,677
|
|
|||
|
Operating income
|
2,677
|
|
25,065
|
|
|||
|
Interest and other income (expense), net
(2)
|
1,204
|
|
(9,136
|
)
|
|||
|
Income from discontinued operations before taxes
|
3,881
|
|
15,929
|
|
|||
|
Provision for income taxes
|
3,598
|
|
8,252
|
|
|||
|
Equity in (loss) earnings of unconsolidated subsidiaries
|
(534
|
)
|
175
|
|
|||
|
(Loss) income from discontinued operations, net of tax
|
(251
|
)
|
7,852
|
|
|||
|
Loss on sale of discontinued operations, net of tax
(3)
|
(6,495
|
)
|
—
|
|
|||
|
Net (loss) income from discontinued operations
|
$
|
(6,746
|
)
|
$
|
7,852
|
|
|
(1) Upon recognition of the glass manufacturing business net assets as held for sale, an impairment test was performed on the net assets of the glass manufacturing business resulting in a pre-tax impairment loss of
$27 million
and a tax benefit of
$7 million
. The impairment represents a
$21 million
impairment on long-lived assets, with the remaining
$6 million
representing a valuation allowance on the current assets held for sale.
(2) The Company elected to allocate interest expense to discontinued operations based on the expected debt to be repaid. Under this approach, allocated interest from January 1, 2017 through the date of sale was
$2 million
and from April 21, 2016 to December 31, 2016 was
$6 million
. The other expenses, net were foreign currency gains and losses.
(3) In the first quarter of 2017, upon closing of the sale and write-off of the net assets of the glass manufacturing business, we recorded a pre-tax loss on sale of
$9 million
, and a
$4 million
tax benefit. The incremental loss primarily reflects a
$6 million
payable for intercompany sales from the glass manufacturing business to the aftermarket automotive glass distribution business incurred prior to closing which was paid by LKQ during the second quarter of 2017 and capital expenditures in 2017 that were not reimbursed by the buyer. During the fourth quarter of 2017, we recorded an additional loss on sale of
$2 million
as a result of post sale net working capital adjustments.
74
Certain tax related matters remain open with Vitro as of December 31, 2017, which when resolved may impact our reported results and cash flows.
The glass manufacturing business had
$4 million
of operating cash outflows,
$4 million
of investing cash outflows mainly consisting of capital expenditures, and
$15 million
of financing cash inflows made up of parent financing for the period from January 1, 2017 through March 1, 2017. The glass manufacturing business had
$64 million
of operating cash inflows,
$29 million
of investing cash outflows mainly consisting of capital expenditures, and
$1 million
of capital lease debt payments for the period from April 21, 2016 through December 31, 2016. The following table summarizes the significant non-cash operating activities, capital expenditures and investments in unconsolidated subsidiaries of the Company's discontinued operations related to the glass manufacturing business (in thousands):
|
Period from January 1
|
Period from April 21
|
||||||
|
to March 1,
|
to December 31,
|
||||||
|
2017
|
2016
|
||||||
|
Non-cash operating activities:
|
|||||||
|
Depreciation and amortization
|
$
|
—
|
|
$
|
7,752
|
|
|
|
Impairment of net assets of discontinued operations
|
—
|
|
26,677
|
|
|||
|
Deferred income taxes
|
—
|
|
(4,516
|
)
|
|||
|
Capital Expenditures
|
(3,598
|
)
|
(24,156
|
)
|
|||
|
Investments in unconsolidated subsidiaries
|
—
|
|
(4,400
|
)
|
|||
The major classes of assets and liabilities related to the glass manufacturing business as of December 31, 2016 were as follows (in thousands):
|
December 31, 2016
|
||||
|
Cash and cash equivalents
|
$
|
7,116
|
|
|
|
Receivables, net
|
77,442
|
|
||
|
Inventories
|
71,952
|
|
||
|
Prepaid expenses and other current assets
|
42,426
|
|
||
|
Property, plant and equipment, net
|
199,136
|
|
||
|
Other assets
|
64,166
|
|
||
|
Valuation allowance
|
(5,598
|
)
|
||
|
Total assets from discontinued operations
|
$
|
456,640
|
|
|
|
Accounts payable
|
$
|
72,696
|
|
|
|
Other current liabilities
|
37,104
|
|
||
|
Long-term obligations
|
1,648
|
|
||
|
Other noncurrent liabilities (includes pension and post-retirement obligations)
|
33,656
|
|
||
|
Total liabilities from discontinued operations
|
145,104
|
|
||
|
Net assets from discontinued operations
|
$
|
311,536
|
|
|
Pursuant to the Purchase and Supply Agreement, our aftermarket automotive glass distribution business will source various products from Vitro's glass manufacturing business annually for a three year period beginning on March 1, 2017. Between January 1, 2017 and the sale date of March 1, 2017, intercompany sales between the glass manufacturing business and the continuing aftermarket automotive glass distribution business of PGW, which were eliminated in consolidation, were
$8 million
. All purchases from Vitro, including those outside of the Purchase and Supply Agreement, for the year ended December 31, 2017, were
$42 million
. For the period from April 21, 2016 through December 31, 2016, intercompany sales between the glass manufacturing business and PGW autoglass, which were eliminated in consolidation, were
$29 million
.
Principles of Consolidation
The accompanying consolidated financial statements include the accounts of LKQ Corporation and its subsidiaries. All intercompany transactions and accounts have been eliminated.
75
Use of Estimates
In preparing our financial statements in conformity with accounting principles generally accepted in the United States of America, we are required to make estimates and assumptions that affect the reported amounts of assets and liabilities and disclosure of contingent assets and liabilities as of the date of the financial statements and the reported amounts of revenue and expenses during the reporting period. Actual results could differ from those estimates.
Revenue Recognition
The majority of our revenue is derived from the sale of vehicle parts. Revenue is recognized when the products are shipped to, delivered to or picked up by customers and title has transferred, subject to an allowance for estimated returns, discounts and allowances that we estimate based upon historical information. We recorded a reserve for estimated returns, discounts and allowances of approximately
$42 million
and
$38 million
at
December 31, 2017 and 2016
, respectively. We present taxes assessed by governmental authorities collected from customers on a net basis. Therefore, the taxes are excluded from revenue on our Consolidated Statements of Income and are shown as a current liability on our Consolidated Balance Sheets until remitted. We recognize revenue from the sale of scrap metal, other metals, and cores when title has transferred, which typically occurs upon delivery to the customer. Revenue also includes amounts billed to customers for shipping and handling. Distribution expenses in the accompanying Consolidated Statements of Income are the costs incurred to prepare and deliver products to customers.
Receivables and Allowance for Doubtful Accounts
In the normal course of business, we extend credit to customers after a review of each customer's credit history. We recorded a reserve for uncollectible accounts of approximately
$58 million
and
$46 million
at
December 31, 2017 and 2016
, respectively. The reserve is based upon the aging of the accounts receivable, our assessment of the collectability of specific customer accounts and historical experience. Receivables are written off once collection efforts have been exhausted. Recoveries of receivables previously written off are recorded when received.
Concentrations of Credit Risk
Financial instruments that potentially subject us to significant concentration of credit risk consist primarily of cash and cash equivalents and accounts receivable. We control our exposure to credit risk associated with these instruments by (i) placing our cash and cash equivalents with several major financial institutions; (ii) holding high-quality financial instruments; and (iii) maintaining strict policies over credit extension that include credit evaluations, credit limits and monitoring procedures. In addition, our overall credit risk with respect to accounts receivable is limited to some extent because our customer base is composed of a large number of geographically diverse customers.
Inventories
We classify our inventory into the following categories: (i) aftermarket and refurbished products, (ii) salvage and remanufactured products, and (iii) manufactured products.
An aftermarket product is a new vehicle product manufactured by a company other than the original equipment manufacturer. For all of our aftermarket products, excluding our aftermarket automotive glass products, cost is established based on the average price we pay for parts; for our aftermarket automotive glass products inventory, cost is established using the first-in first-out method. Inventory cost for all of our aftermarket products includes expenses incurred for freight in and overhead costs; for items purchased from foreign companies, import fees and duties and transportation insurance are also included. Refurbished products are parts that require cosmetic repairs, such as wheels, bumper covers and lights; LKQ will apply new parts, products or materials to these parts in order to produce the finished product. Refurbished inventory cost is based upon the average price we pay for cores. The cost of our refurbished inventory also includes expenses incurred for freight in, labor and other overhead costs.
A salvage product is a recycled vehicle part suitable for sale as a replacement part. Cost is established based upon the price we pay for a vehicle, including auction, storage and towing fees, as well as expenditures for buying and dismantling the vehicle. Inventory carrying value is determined using the average cost to sales percentage at each of our facilities and applying that percentage to the facility's inventory at expected selling prices, the assessment of which incorporates the sales probability based on a part's number of days in stock and historical demand. The average cost to sales percentage is derived from each facility's historical profitability for salvage vehicles. Remanufactured products are used parts that have been inspected, rebuilt, or reconditioned to restore functionality and performance, such as remanufactured engines and transmissions. Remanufactured inventory cost is based upon the price paid for cores, which are recycled automotive parts that are not suitable for sale as a
76
replacement part without further processing, and also includes expenses incurred for freight in, direct manufacturing costs and other overhead costs.
A manufactured product is a new vehicle product. Manufactured product inventory can be a raw material, work-in-process or finished good. Cost is established using the first-in first-out method.
For all inventory, carrying value is recorded at the lower of cost or net realizable value and is reduced to reflect current anticipated demand. If actual demand is lower than our estimates, additional reductions to inventory carrying value would be necessary in the period such determination is made.
Inventories consist of the following (in thousands):
|
December 31,
|
|||||||
|
2017
|
2016
|
||||||
|
Aftermarket and refurbished products
|
$
|
1,877,653
|
|
$
|
1,540,257
|
|
|
|
Salvage and remanufactured products
|
487,108
|
|
394,980
|
|
|||
|
Manufactured products
|
16,022
|
|
—
|
|
|||
|
Total inventories
|
$
|
2,380,783
|
|
$
|
1,935,237
|
|
|
Our acquisitions completed during
2017
contributed
$95 million
of the increase in our aftermarket and refurbished products inventory,
$35 million
of the increase in our salvage and remanufactured products inventory and
$20 million
of the increase in our manufactured inventory. See
Note 2, "Business Combinations
" for further information on our acquisitions. As of December 31, 2017, manufactured products inventory is composed of
$10 million
of raw materials,
$2 million
of work in process, and
$4 million
of finished goods.
Property, Plant and Equipment
Property, plant and equipment are recorded at cost less accumulated depreciation. Expenditures for major additions and improvements that extend the useful life of the related asset are capitalized. As property, plant and equipment are sold or retired, the applicable cost and accumulated depreciation are removed from the accounts and any resulting gain or loss thereon is recognized. Construction in progress consists primarily of building and land improvements at our existing facilities. Depreciation is calculated using the straight-line method over the estimated useful lives or, in the case of leasehold improvements, the term of the related lease and reasonably assured renewal periods, if shorter.
Our estimated useful lives are as follows:
|
Land improvements
|
10-20 years
|
|
Buildings and improvements
|
20-40 years
|
|
Machinery and equipment
|
3-20 years
|
|
Computer equipment and software
|
3-10 years
|
|
Vehicles and trailers
|
3-10 years
|
|
Furniture and fixtures
|
5-7 years
|
77
Property, plant and equipment consists of the following (in thousands):
|
December 31,
|
|||||||
|
2017
|
2016
|
||||||
|
Land and improvements
|
$
|
137,790
|
|
$
|
127,211
|
|
|
|
Buildings and improvements
|
233,078
|
|
209,773
|
|
|||
|
Machinery and equipment
|
521,526
|
|
429,446
|
|
|||
|
Computer equipment and software
|
133,753
|
|
120,316
|
|
|||
|
Vehicles and trailers
|
161,269
|
|
138,263
|
|
|||
|
Furniture and fixtures
|
31,794
|
|
28,405
|
|
|||
|
Leasehold improvements
|
257,506
|
|
152,356
|
|
|||
|
1,476,716
|
|
1,205,770
|
|
||||
|
Less—Accumulated depreciation
|
(606,112
|
)
|
(495,644
|
)
|
|||
|
Construction in progress
|
42,485
|
|
101,450
|
|
|||
|
Total property, plant and equipment, net
|
$
|
913,089
|
|
$
|
811,576
|
|
|
We record depreciation expense within Depreciation and amortization on our Consolidated Statements of Income. Additionally, depreciation expense associated with our refurbishing, remanufacturing, manufacturing and furnace operations as well as our distribution centers is included in Cost of goods sold on the Consolidated Statements of Income. Total depreciation expense for the years ended December 31,
2017
,
2016
and
2015
was
$129 million
,
$115 million
, and
$94 million
, respectively.
Intangible Assets
Intangible assets consist primarily of goodwill (the cost of purchased businesses in excess of the fair value of the identifiable net assets acquired) and other specifically identifiable intangible assets, such as trade names, trademarks, customer and supplier relationships, software and other technology related assets, and covenants not to compete.
Goodwill is tested for impairment at least annually, and we performed annual impairment tests during the fourth quarters of
2017
,
2016
and
2015
. The results of all of these tests indicated that goodwill was not impaired. Goodwill impairment testing may also be performed on an interim basis when events or circumstances arise that may lead to impairment. We noted that the fair value estimate for the Aviation reporting unit exceeded the carrying value by less than
10%
. This result aligns with our expectations as there has not been a significant change in the value of the business, which was acquired in March 2017, since the acquisition date while we continue to execute our business plan.
The changes in the carrying amount of goodwill by reportable segment are as follows (in thousands):
|
North America
(1)
|
Europe
|
Specialty
(1)
|
Total
|
||||||||||||
|
Balance as of January 1, 2015
|
$
|
1,379,681
|
|
$
|
616,819
|
|
$
|
292,395
|
|
$
|
2,288,895
|
|
|||
|
Business acquisitions and adjustments to previously recorded goodwill
|
72,355
|
|
21,217
|
|
(1,397
|
)
|
92,175
|
|
|||||||
|
Exchange rate effects
|
(18,537
|
)
|
(43,554
|
)
|
267
|
|
(61,824
|
)
|
|||||||
|
Balance as of December 31, 2015
|
$
|
1,433,499
|
|
$
|
594,482
|
|
$
|
291,265
|
|
$
|
2,319,246
|
|
|||
|
Business acquisitions and adjustments to previously recorded goodwill
|
226,483
|
|
614,437
|
|
1,889
|
|
842,809
|
|
|||||||
|
Exchange rate effects
|
1,818
|
|
(108,943
|
)
|
(161
|
)
|
(107,286
|
)
|
|||||||
|
Balance as of December 31, 2016
|
$
|
1,661,800
|
|
$
|
1,099,976
|
|
$
|
292,993
|
|
$
|
3,054,769
|
|
|||
|
Business acquisitions and adjustments to previously recorded goodwill
|
39,836
|
|
155,366
|
|
119,615
|
|
314,817
|
|
|||||||
|
Exchange rate effects
|
7,718
|
|
159,556
|
|
(349
|
)
|
166,925
|
|
|||||||
|
Balance as of December 31, 2017
|
$
|
1,709,354
|
|
$
|
1,414,898
|
|
$
|
412,259
|
|
$
|
3,536,511
|
|
|||
|
(1)
|
In the first quarter of 2017, we realigned a portion of our North America operations under our Specialty segment. Prior year amounts have been recast to reflect the shift in reporting structure.
|
78
The components of other intangibles, net are as follows (in thousands):
|
|
December 31, 2017
|
December 31, 2016
|
|||||
|
Intangible assets subject to amortization
|
$
|
664,969
|
|
$
|
584,231
|
|
|
|
Indefinite-lived intangible assets
(1)
|
78,800
|
|
—
|
|
|||
|
Total
|
$
|
743,769
|
|
$
|
584,231
|
|
|
|
(1)
|
Indefinite-lived intangible assets are composed of trademarks.
|
The components of intangible assets subject to amortization are as follows (in thousands):
|
|
December 31, 2017
|
December 31, 2016
|
|||||||||||||||||||||
|
|
Gross
Carrying
Amount
|
Accumulated
Amortization
|
Net
|
Gross
Carrying
Amount
|
Accumulated
Amortization
|
Net
|
|||||||||||||||||
|
Trade names and trademarks
|
$
|
327,332
|
|
$
|
(75,095
|
)
|
$
|
252,237
|
|
$
|
286,008
|
|
$
|
(51,104
|
)
|
$
|
234,904
|
|
|||||
|
Customer and supplier relationships
|
510,113
|
|
(167,532
|
)
|
342,581
|
|
395,284
|
|
(92,079
|
)
|
303,205
|
|
|||||||||||
|
Software and other technology related assets
|
124,049
|
|
(59,081
|
)
|
64,968
|
|
77,329
|
|
(35,648
|
)
|
41,681
|
|
|||||||||||
|
Covenants not to compete
|
14,981
|
|
(9,798
|
)
|
5,183
|
|
11,726
|
|
(7,285
|
)
|
4,441
|
|
|||||||||||
|
Total
|
$
|
976,475
|
|
$
|
(311,506
|
)
|
$
|
664,969
|
|
$
|
770,347
|
|
$
|
(186,116
|
)
|
$
|
584,231
|
|
|||||
The components of other intangibles acquired during the years ended
December 31, 2017
and
2016
include the following (in thousands):
|
Year Ended
|
Year Ended
|
||||||||||||||||||
|
December 31, 2017
|
December 31, 2016
|
||||||||||||||||||
|
All Acquisitions
|
Rhiag
|
PGW
|
Other Acquisitions
|
Total
|
|||||||||||||||
|
Trade names and trademarks
(1)
|
$
|
87,306
|
|
$
|
127,351
|
|
$
|
5,500
|
|
$
|
1,015
|
|
$
|
133,866
|
|
||||
|
Customer and supplier relationships
|
75,450
|
|
291,893
|
|
29,700
|
|
—
|
|
321,593
|
|
|||||||||
|
Software and other technology related assets
|
15,757
|
|
10,116
|
|
1,154
|
|
1,420
|
|
12,690
|
|
|||||||||
|
Covenants not to compete
|
2,703
|
|
—
|
|
1,600
|
|
102
|
|
1,702
|
|
|||||||||
|
Total
|
$
|
181,216
|
|
$
|
429,360
|
|
$
|
37,954
|
|
$
|
2,537
|
|
$
|
469,851
|
|
||||
|
(1)
|
Includes a trademark intangible asset of
$79 million
recorded as part of our acquisition of Warn in 2017. We assigned this trademark an indefinite life.
|
The weighted-average amortization periods for our intangible assets acquired during the years ended
December 31, 2017
and
2016
are as follows (in years):
|
Year Ended
|
Year Ended
|
||||||||||
|
December 31, 2017
|
December 31, 2016
|
||||||||||
|
All Acquisitions
|
Rhiag
|
PGW
|
Other Acquisitions
|
Total
|
|||||||
|
Trade names and trademarks
|
11.2
|
20.0
|
|
20.0
|
20.0
|
|
20.0
|
||||
|
Customer and supplier relationships
|
18.6
|
15.0
|
|
10.0
|
—
|
|
14.5
|
||||
|
Software and other technology related assets
|
11.1
|
5.0
|
|
14.6
|
5.4
|
|
5.7
|
||||
|
Covenants not to compete
|
4.4
|
—
|
|
5.0
|
2.0
|
|
4.8
|
||||
|
Total intangible assets
|
16.5
|
16.2
|
|
11.4
|
11.1
|
|
15.8
|
||||
79
Our estimated useful lives for our finite-lived intangible assets are as follows:
|
Method of Amortization
|
Useful Life
|
||
|
Trade names and trademarks
|
Straight-line
|
4-30 years
|
|
|
Customer and supplier relationships
|
Accelerated
|
6-20 years
|
|
|
Software and other technology related assets
|
Straight-line
|
3-15 years
|
|
|
Covenants not to compete
|
Straight-line
|
2-5 years
|
|
Amortization expense for intangibles was
$102 million
,
$83 million
and
$34 million
during the years ended December 31,
2017
,
2016
and
2015
, respectively. Estimated amortization expense for each of the five years in the period ending December 31, 2022 is
$97 million
,
$81 million
,
$65 million
,
$55 million
and
$48 million
, respectively.
Impairment of Long-Lived Assets
Long-lived assets are reviewed for possible impairment whenever events or circumstances indicate that the carrying amount of such assets may not be recoverable. If such review indicates that the carrying amount of long-lived assets is not recoverable, the carrying amount of such assets is reduced to fair value. Other than the impairment recorded upon recognition of the PGW glass manufacturing business net assets as held for sale as discussed in
Note 3, "Discontinued Operations
," there were no material adjustments to the carrying value of long-lived assets during the years ended
December 31, 2017
,
2016
or
2015
.
Investments in Unconsolidated Subsidiaries
Our investment in unconsolidated subsidiaries was
$208 million
and
$183 million
as of
December 31, 2017
and 2016, respectively. On December 1, 2016, we acquired a
26.5%
equity interest in Mekonomen AB ("Mekonomen") from AxMeko AB, an affiliate of Axel Johnson AB, for an aggregate purchase price of
$181 million
. Headquartered in Stockholm, Sweden, Mekonomen is the leading independent car parts and service chain in the Nordic region of Europe, offering a range of products including spare parts and accessories for cars, and workshop services for consumers and businesses. We are accounting for our interest in Mekonomen using the equity method of accounting, as our investment gives us the ability to exercise significant influence, but not control, over the investee. As of December 31, 2017, the book value of our investment in Mekonomen exceeded our share of the book value of Mekonomen's net assets by
$127 million
; this difference is primarily related to goodwill and the fair value of other intangible assets. We are reporting our equity in the net earnings of Mekonomen on a one quarter lag, and therefore we recorded no equity in earnings for this investment in 2016. For the year ended December 31, 2017, we recorded equity in earnings totaling
$7 million
related to our investment in Mekonomen, which represents our share of the results from the investment date through September 30, 2017, including adjustments to convert the results to GAAP and to recognize the impact of our purchase accounting adjustments. In May 2017, we received a cash dividend of
$7 million
(SEK
67 million
) related to our investment in Mekonomen. The Level 1 fair value of our equity investment in the publicly traded Mekonomen common stock at December 31, 2017 was
$173 million
compared to a carrying value of
$202 million
. We evaluated our investment in Mekonomen for other-than-temporary impairment and concluded the decline in investment value is temporary.
80
Warranty Reserve
Some of our salvage mechanical products are sold with a standard
six
month warranty against defects. Additionally, some of our remanufactured engines are sold with a standard
three
year warranty against defects. We also provide a limited lifetime warranty for certain of our aftermarket products. We record the estimated warranty costs at the time of sale using historical warranty claim information to project future warranty claims activity. Our warranty reserve is recorded within Other accrued expenses and Other noncurrent liabilities on our Consolidated Balance Sheets based on the expected timing of the related payments.
The changes in the warranty reserve are as follows (in thousands):
|
Balance as of January 1, 2016
|
$
|
17,363
|
|
|
Warranty expense
|
32,096
|
|
|
|
Warranty claims
|
(29,825
|
)
|
|
|
Balance as of December 31, 2016
|
$
|
19,634
|
|
|
Warranty expense
|
38,608
|
|
|
|
Warranty claims
|
(35,091
|
)
|
|
|
Balance as of December 31, 2017
|
$
|
23,151
|
|
Self-Insurance Reserves
We self-insure a portion of employee medical benefits under the terms of our employee health insurance program. We purchase certain stop-loss insurance to limit our liability exposure. We also self-insure a portion of our property and casualty risk, which includes automobile liability, general liability, directors and officers liability, workers' compensation, and property coverage, under deductible insurance programs. The insurance premium costs are expensed over the contract periods. A reserve for liabilities associated with these losses is established for claims filed and claims incurred but not yet reported based upon our estimate of ultimate cost, which is calculated using analysis of historical data. We monitor new claims and claim development as well as trends related to the claims incurred but not reported in order to assess the adequacy of our insurance reserves. Total self-insurance reserves were
$94 million
and
$84 million
, of which
$43 million
and
$40 million
was classified as current, as of
December 31, 2017 and 2016
, respectively, and are classified as Other accrued expenses in the Consolidated Balance Sheets. The remaining balances of self-insurance reserves are classified as Other noncurrent liabilities, which reflects management's estimates of when claims will be paid. We had outstanding letters of credit of
$71 million
and
$70 million
at
December 31, 2017 and 2016
, respectively, to guarantee self-insurance claims payments. While we do not expect the amounts ultimately paid to differ significantly from our estimates, our insurance reserves and corresponding expenses could be affected if future claims experience differs significantly from historical trends and assumptions.
Income Taxes
Current income taxes are provided on income reported for financial reporting purposes, adjusted for transactions that do not enter into the computation of income taxes payable in the same year. Deferred income taxes have been provided to show the effect of temporary differences between the tax bases of assets and liabilities and their reported amounts in the financial statements. A valuation allowance is provided for deferred tax assets if it is more likely than not that these items will either expire before we are able to realize their benefit or that future deductibility is uncertain. Provision is made for taxes on undistributed earnings of foreign subsidiaries and related companies to the extent that such earnings are not deemed to be permanently invested.
We recognize the benefits of uncertain tax positions taken or expected to be taken in tax returns in the provision for income taxes only for those positions that are more likely than not to be realized. We follow a two-step approach to recognizing and measuring uncertain tax positions. The first step is to evaluate the tax position for recognition by determining if the weight of available evidence indicates it is more likely than not that the position will be sustained on audit, including resolution of related appeals or litigation processes, if any. The second step is to measure the tax benefit as the largest amount that is more than
50%
likely of being realized upon ultimate settlement. We consider many factors when evaluating and estimating our tax positions and tax benefits, which may require periodic adjustments and which may not accurately forecast actual outcomes. Our policy is to include interest and penalties associated with income tax obligations in income tax expense.
During 2017, new tax legislation was signed into law making significant changes to the Internal Revenue Code. See Note 13, "Income Taxes" for further information regarding the new tax law.
81
Rental Expense
We recognize rental expense on a straight-line basis over the respective lease terms, including reasonably assured renewal periods, for all of our operating leases.
Foreign Currency Translation
For most of our foreign operations, the local currency is the functional currency. Assets and liabilities are translated into U.S. dollars at the period-ending exchange rate. Statements of Income amounts are translated to U.S. dollars using monthly average exchange rates during the period. Translation gains and losses are reported as a component of Accumulated other comprehensive income (loss) in stockholders' equity.
Recent Accounting Pronouncements
Recently Adopted Accounting Pronouncements
In July 2015, the FASB issued Accounting Standards Update 2015-11, "Simplifying the Measurement of Inventory" ("ASU 2015-11"), which requires entities to measure inventory at the lower of cost or net realizable value. Net realizable value is defined as the estimated selling price in the ordinary course of business, less reasonably predictable costs of completion, disposal and transportation. We adopted ASU 2015-11 during the first quarter of 2017 on a prospective basis. Effective January 1, 2017, we are recording our inventory at the lower of cost or net realizable value, including application of the concept in determining our inventory reserves, in accordance with ASU 2015-11. The adoption of ASU 2015-11 did not have a material impact on our recorded inventory value.
In January 2017, the FASB issued Accounting Standards Update No. 2017-04, "Simplifying the Test for Goodwill Impairment" ("ASU 2017-04"), which simplifies the accounting for goodwill impairment by eliminating step 2 from the goodwill impairment test. Under the new guidance, if the carrying value of a reporting unit exceeds the fair value, an impairment loss will be recognized for the amount of that excess, limited to the goodwill allocated to that reporting unit. ASU 2017-04 is effective for fiscal years and any interim impairment tests for periods beginning after December 15, 2019; early adoption is permitted for entities with annual and interim impairment tests occurring after January 1, 2017. We early adopted for the quarter ended June 30, 2017 in order for the guidance to be effective for our annual impairment test performed in the fourth quarter of 2017. Based on the results of our annual impairment test performed during the fourth quarter, the adoption of this standard did not have a material effect on our consolidated financial statements.
In May 2017, the FASB issued Accounting Standards Update No. 2017-09, "Scope of Modification Accounting" ("ASU 2017-09"), which provides guidance on changes to share based payment awards requiring application of modification accounting under FASB Accounting Standards Codification Topic 718, "Compensation - Stock Compensation." Under ASU 2017-09, modification accounting for awards will not be required if the fair value, vesting conditions, and classifications of awards both prior to and after the modification are the same. ASU 2017-09 is effective for fiscal years and interim periods beginning after December 15, 2017; early adoption is permitted with amendments resulting from ASU 2017-09 applied prospectively to awards modified after the effective date. We early adopted for the quarter ended June 30, 2017; the adoption of ASU 2017-09 did not have a material impact on our consolidated financial statements and related disclosures.
82
Recently Issued Accounting Pronouncements
In May 2014, the Financial Accounting Standards Board ("FASB") issued Accounting Standards Update 2014-09, "Revenue from Contracts with Customers" ("ASU 2014-09"). This update outlines a new comprehensive revenue recognition model that supersedes most current revenue recognition guidance and requires companies to recognize revenue to depict the transfer of promised goods or services to customers in an amount that reflects the consideration to which the entity expects to be entitled in exchange for those goods or services. The FASB has issued several updates to ASU 2014-09. ASU 2014-09 will be effective for the Company during the first quarter of our fiscal year 2018. Entities adopting the standard have the option of using either a full retrospective or modified retrospective approach in the application of this guidance. We will be adopting the standard using the modified retrospective approach, with a cumulative effect adjustment recognized in the opening balance of retained earnings in the first quarter of fiscal 2018. As the majority of our revenue transactions generally consist of single performance obligations to transfer promised goods or services, no adjustments were identified related to the majority of our revenue streams. However, we have determined that we will change the presentation of the returns reserves on the balance sheet and the related reserve adjustments on the income statement. A refund liability will be presented on a gross basis as a current liability and a return asset will be presented separately in prepaid expenses and other current assets. The gross amount of changes to the refund liability will be presented as a reduction to revenue and a corresponding reduction to cost of goods sold will be presented for changes in the return asset. If we had presented the 2017 returns reserves on the balance sheet on a gross basis, accounts receivable, prepaid expenses and other current assets, and current liabilities would have increased by
$38 million
,
$45 million
, and
$83 million
, respectively. The impact to the income statement of presenting the changes to the returns reserve on a gross basis is immaterial. We do not expect to record a cumulative effect adjustment to the opening balance of retained earnings, as we do not expect there to be a net impact to the income statement as a result of adoption.
In January 2016, the FASB issued Accounting Standards Update No. 2016-01, “Recognition and Measurement of Financial Assets and Financial Liabilities” (“ASU 2016-01”), which changes how entities will recognize, measure, present and make disclosures about certain financial assets and financial liabilities. ASU 2016-01 is effective for fiscal years, and interim periods within those years, beginning after December 15, 2017; early adoption is permitted. The guidance requires adoption on a prospective basis. We do not expect adoption of ASU 2016-01 to have a significant impact on our financial position, results of operations, cash flows or disclosures.
In February 2016, the FASB issued Accounting Standards Update 2016-02, "Leases" ("ASU 2016-02"), to increase transparency and comparability by recognizing lease assets and lease liabilities on the balance sheet and disclosing key information about leasing arrangements. The main difference between current GAAP and ASU 2016-02 is the recognition of lease assets and lease liabilities by lessees for those leases classified as operating leases under current GAAP. ASU 2016-02 is effective for fiscal years, and interim periods within those years, beginning after December 15, 2018. The standard requires that entities apply the effects of these changes using a modified retrospective approach, which includes a number of optional practical expedients. While we are still in the process of quantifying the impact that the adoption of ASU 2016-02 will have on our consolidated financial statements and related disclosures, we anticipate the adoption will materially affect our consolidated balance sheet and disclosures, as the majority of our operating leases will be recorded on the balance sheet under ASU 2016-02. While we do not anticipate the adoption of this accounting standard to have a material impact on our consolidated statements of income at this time, this conclusion may change as we finalize our assessment. In order to assist in our timely implementation of the new standard, we have purchased new software to track our leases. We have engaged a third party to assist with the implementation of the new software with an expectation to complete the implementation by the end of 2018.
In August 2016, the FASB issued Accounting Standards Update No. 2016-15, "Classification of Certain Cash Receipts and Cash Payments" ("ASU 2016-15"), to add and clarify guidance on the classification of certain cash receipts and payments in the statement of cash flows. ASU 2016-15 includes guidance on classification for the following items: debt prepayment or debt extinguishment costs, settlement of zero coupon bonds, contingent consideration payments made after a business combination, proceeds from the settlement of insurance claims and corporate-owned or bank-owned life insurance policies, distributions received from equity method investees, beneficial interests in securitization transactions, and other separately identifiable cash flows where application of the predominance principle is prescribed. ASU 2016-15 is effective for fiscal years, and interim periods within those years, beginning after December 15, 2017; early adoption is permitted. The guidance requires retrospective application to all periods presented unless it is impracticable to do so. Based on our evaluation of the guidance, we do not expect a material change to our consolidated statement of cash flows upon adoption in the first quarter of our fiscal year 2018.
In August 2017, the FASB issued Accounting Standards Update No. 2017-12, "Targeted Improvements to Accounting for Hedging Activities" ("ASU 2017-12"), which amends the hedge accounting recognition and presentation requirements in ASC 815 ("Derivatives and Hedging"). ASU 2017-12 significantly alters the hedge accounting model by making it easier for an entity to achieve and maintain hedge accounting and provides for accounting that better reflects an entity's risk management activities. ASU 2017-12 is effective for fiscal years and interim periods beginning after December 15, 2018; early adoption is permitted. Entities will adopt the provisions of ASU 2017-12 by applying a modified retrospective approach to existing
83
hedging relationships as of the adoption date. At this time, we are still evaluating the impact of this standard on our financial statements.
In February 2018, the FASB issued Accounting Standards Update No. 2018-02, "Reclassification of Certain Tax Effects from Accumulated Other Comprehensive Income" ("ASU 2018-12"), which allows a reclassification from accumulated other comprehensive income to retained earnings for stranded tax effects resulting from the Tax Act. In addition, under ASU 2018-12, an entity will be required to provide certain disclosures regarding stranded tax effects. ASU 2018-02 is effective for fiscal years and interim periods beginning after December 15, 2018; early adoption is permitted. The amendments in this update should be applied either in the period of adoption or retrospectively to each period (or periods) in which the effect of the change in the U.S. federal corporate income tax rate in the Tax Act is recognized. At this time, we are still evaluating the impact of this standard on our financial statements.
Acquisition Related Expenses
Acquisition related expenses, which include external costs such as legal, accounting and advisory fees, totaled
$15 million
,
$22 million
, and
$6 million
for the years ended
December 31, 2017
,
2016
and
2015
, respectively. Acquisition related expenses for the year ended December 31, 2017 included
$5 million
of costs for our acquisition of Andrew Page, primarily related to legal and other professional fees associated with the CMA review. The remaining acquisition related costs for the year ended December 31, 2017 consisted of external costs for (i) completed acquisitions, (ii) pending acquisitions as of December 31, 2017, including
$4 million
related to Stahlgruber, and (iii) potential acquisitions that were terminated.
Acquisition related expenses for 2016 included
$11 million
related to our Rhiag acquisition,
$4 million
related to our acquisition of PGW, and
$7 million
related to other completed acquisitions and acquisitions that were pending as of December 31, 2016.
Acquisition related expenses for 2015 included $
2 million
related to our Rhiag acquisition, $
2 million
related to our acquisitions of
eleven
aftermarket parts distribution businesses in the Netherlands, $
1 million
related to our acquisition of Coast, and $
1 million
related to other completed acquisitions and acquisitions that were pending as of December 31, 2015.
Acquisition Integration Plans and Restructuring
During the year ended December 31, 2017, we incurred
$5 million
of restructuring expenses. Expenses incurred during the year ended December 31, 2017 were primarily a result of our ongoing integration activities in our North America and Specialty segments. Expenses incurred were primarily related to facility closure and the merger of existing facilities into larger distribution centers.
During the year ended December 31, 2016, we incurred
$16 million
of restructuring expenses. Of this amount,
$10 million
was related to integration activities in our Specialty segment, primarily a result of the integration of our Coast acquisition into our existing Specialty business. Expenses incurred were primarily related to facility closure and relocation costs for duplicate facilities, the merger of existing facilities into larger distribution centers, and the termination of employees. We also incurred
$3 million
and
$2 million
of restructuring expenses, including primarily facility rationalization activities, related to our North America and Europe acquisitions, respectively.
During the
year ended
December 31, 2015, we incurred
$13 million
of restructuring expenses. Expenses incurred were primarily a result of the integration of our Coast acquisition and our October 2014 acquisition of a supplier of parts for recreational vehicles into our Specialty business and the integration of our acquisition of Parts Channel into our existing North America wholesale business. These integration activities included the closure of duplicate facilities, termination of employees in connection with the consolidation of overlapping facilities with our existing business, and moving expenses.
We expect to incur additional expenses related to the integration of certain of our acquisitions into our existing operations in 2018. These integration activities are expected to include the closure of duplicate facilities, rationalization of personnel in connection with the consolidation of overlapping facilities with our existing business, and moving expenses. Future expenses to complete these integration plans are expected to be less than
$15 million
.
84
In order to attract and retain employees, non-employee directors, consultants, and other persons associated with us, we may grant qualified and nonqualified stock options, stock appreciation rights, restricted stock, restricted stock units (“RSUs”), performance shares and performance units under the LKQ Corporation 1998 Equity Incentive Plan (the “Equity Incentive Plan”). The total number of shares approved by our stockholders for issuance under the Equity Incentive Plan is
70 million
shares, subject to antidilution and other adjustment provisions. We have granted RSUs, stock options, and restricted stock under the Equity Incentive Plan. Of the shares approved by our stockholders for issuance under the Equity Incentive Plan,
12 million
shares remained available for issuance as of
December 31, 2017
. We expect to issue new shares of common stock to cover past and future equity grants.
RSUs
RSUs vest over periods of up to
five
years, subject to a continued service condition. Currently outstanding RSUs contain either a time-based vesting condition or a combination of a performance-based vesting condition and a time-based vesting condition, in which case, both conditions must be met before any RSUs vest. For most of the RSUs containing a performance-based vesting condition, the Company must report positive diluted earnings per share, subject to certain adjustments, during any fiscal year period within
five
years following the grant date; we have an immaterial amount of RSUs containing other performance-based vesting conditions. Each RSU converts into one share of LKQ common stock on the applicable vesting date. The grant date fair value of RSUs is based on the market price of LKQ stock on the grant date.
The Compensation Committee approved the grant of
235,537
;
261,851
; and
215,076
RSUs to our executive officers that include both a performance-based vesting condition and a time-based vesting condition in
2017
,
2016
, and
2015
, respectively. The performance-based vesting conditions for the
2017
,
2016
, and
2015
grants to our executive officers have been satisfied.
The fair value of RSUs that vested during the years ended December 31,
2017
,
2016
and
2015
was
$28 million
,
$29 million
and
$28 million
, respectively.
In January 2018, our Board of Directors granted
556,160
RSUs to employees (including executive officers).
The following table summarizes activity related to our RSUs under the Equity Incentive Plan for the year ended December 31, 2017:
|
Number
Outstanding
|
Weighted
Average
Grant Date
Fair Value
|
Weighted Average Remaining Contractual Term
(in years)
|
Aggregate Intrinsic Value
(in thousands)
(1)
|
|||||||||
|
Unvested as of January 1, 2017
|
1,873,737
|
|
$
|
27.58
|
|
|||||||
|
Granted
|
809,708
|
|
$
|
32.15
|
|
|||||||
|
Vested
|
(883,844
|
)
|
$
|
26.80
|
|
|||||||
|
Forfeited / Canceled
|
(175,211
|
)
|
$
|
30.81
|
|
|||||||
|
Unvested as of December 31, 2017
|
1,624,390
|
|
$
|
29.94
|
|
|||||||
|
Expected to vest after December 31, 2017
|
1,523,973
|
|
$
|
29.89
|
|
2.6
|
$
|
61,980
|
|
|||
(1)
The aggregate intrinsic value of expected to vest RSUs represents the total pretax intrinsic value (the fair value of the Company's stock on the last day of each period multiplied by the number of units) that would have been received by the holders had all RSUs vested. This amount changes based on the market price of the Company’s common stock.
Stock Options
Stock options vest over periods of up to
five
years, subject to a continued service condition. Stock options expire either
six
or
ten
years from the date they are granted. No options were granted during
2017
. The total grant-date fair value of options that vested during each of the years ended December 31,
2017
and
2015
was
$1 million
; no options vested during the year ended December 31,
2016
.
85
The following table summarizes activity related to our stock options under the Equity Incentive Plan for the year ended December 31, 2017:
|
Number
Outstanding
|
Weighted
Average Exercise Price
|
Weighted Average Remaining Contractual Term
(in years)
|
Aggregate Intrinsic Value
(in thousands)
(1)
|
|||||||||
|
Balance as of January 1, 2017
|
2,623,217
|
|
$
|
9.19
|
|
|||||||
|
Exercised
|
(866,799
|
)
|
$
|
8.83
|
|
$
|
20,967
|
|
||||
|
Forfeited / Canceled
|
(18,345
|
)
|
$
|
25.26
|
|
|||||||
|
Balance as of December 31, 2017
|
1,738,073
|
|
$
|
9.20
|
|
1.5
|
$
|
54,693
|
|
|||
|
Exercisable as of December 31, 2017
|
1,738,073
|
|
$
|
9.20
|
|
1.5
|
$
|
54,693
|
|
|||
|
Exercisable as of December 31, 2017 and expected to vest thereafter
|
1,738,073
|
|
$
|
9.20
|
|
1.5
|
$
|
54,693
|
|
|||
(1) The aggregate intrinsic value of outstanding, exercisable and expected to vest options represents the total pretax intrinsic value (the difference between the fair value of the Company's stock on the last day of each period and the exercise price, multiplied by the number of options where the fair value exceeds the exercise price) that would have been received by the option holders had all option holders exercised their options as of the last day of the period indicated. This amount changes based on the market price of the Company’s common stock. The aggregate intrinsic value of stock options exercised during the years ended
December 31, 2016
and
2015
was
$28 million
and
$32 million
, respectively.
Stock-Based Compensation Expense
For the RSUs that contain both a performance-based vesting condition and a time-based vesting condition, we recognize compensation expense under the accelerated attribution method, pursuant to which expense is recognized over the requisite service period for each separate vesting tranche of the award. During the years ended
December 31, 2017
,
2016
, and
2015
, we recognized $
7 million
,
$7 million
, and
$8 million
, respectively, of stock based compensation expense related to the RSUs containing a performance-based vesting condition. For all other awards, which are subject to only a time-based vesting condition, we recognize compensation expense on a straight-line basis over the requisite service period of the entire award. Forfeitures are recorded as they occur.
The components of pre-tax stock-based compensation expense for our continuing operations are as follows (in thousands):
|
Year Ended December 31,
|
|||||||||||
|
|
2017
|
2016
|
2015
|
||||||||
|
RSUs
|
$
|
22,826
|
|
$
|
22,183
|
|
$
|
21,058
|
|
||
|
Stock options and other
|
6
|
|
162
|
|
278
|
|
|||||
|
Total stock-based compensation expense
|
$
|
22,832
|
|
$
|
22,345
|
|
$
|
21,336
|
|
||
The following table sets forth the classification of total stock-based compensation expense included in our Consolidated Statements of Income for our continuing operations (in thousands):
|
Year Ended December 31,
|
|||||||||||
|
|
2017
|
2016
|
2015
|
||||||||
|
Cost of goods sold
|
$
|
434
|
|
$
|
407
|
|
$
|
358
|
|
||
|
Facility and warehouse expenses
|
3,338
|
|
3,980
|
|
2,271
|
|
|||||
|
Selling, general and administrative expenses
|
19,060
|
|
17,958
|
|
18,707
|
|
|||||
|
Total stock-based compensation expense
|
22,832
|
|
22,345
|
|
21,336
|
|
|||||
|
Income tax benefit
|
(5,459
|
)
|
(8,268
|
)
|
(8,221
|
)
|
|||||
|
Total stock-based compensation expense, net of tax
|
$
|
17,373
|
|
$
|
14,077
|
|
$
|
13,115
|
|
||
We have not capitalized any stock-based compensation costs during the years ended December 31,
2017
,
2016
or
2015
.
86
As of
December 31, 2017
, unrecognized compensation expense related to unvested RSUs is expected to be recognized as follows (in thousands):
|
RSUs
|
|||
|
2018
|
$
|
14,641
|
|
|
2019
|
9,232
|
|
|
|
2020
|
6,020
|
|
|
|
2021
|
3,249
|
|
|
|
2022
|
345
|
|
|
|
Total unrecognized compensation expense
|
$
|
33,487
|
|
Stock-based compensation expense related to these awards will be different to the extent that forfeitures are realized.
Basic earnings per share are computed using the weighted average number of common shares outstanding during the period. Diluted earnings per share incorporate the incremental shares issuable upon the assumed exercise of stock options and the assumed vesting of RSUs. Certain of our RSUs and stock options were excluded from the calculation of diluted earnings per share because they were antidilutive, but these equity instruments could be dilutive in the future.
The following chart sets forth the computation of earnings per share (in thousands, except per share amounts):
|
Year Ended December 31,
|
|||||||||||
|
|
2017
|
2016
|
2015
|
||||||||
|
Income from continuing operations
|
$
|
536,974
|
|
$
|
456,123
|
|
$
|
423,223
|
|
||
|
Denominator for basic earnings per share—Weighted-average shares outstanding
|
308,607
|
|
306,897
|
|
304,722
|
|
|||||
|
Effect of dilutive securities:
|
|||||||||||
|
RSUs
|
544
|
|
689
|
|
667
|
|
|||||
|
Stock options
|
1,498
|
|
2,198
|
|
2,107
|
|
|||||
|
Denominator for diluted earnings per share—Adjusted weighted-average shares outstanding
|
310,649
|
|
309,784
|
|
307,496
|
|
|||||
|
Basic earnings per share from continuing operations
|
$
|
1.74
|
|
$
|
1.49
|
|
$
|
1.39
|
|
||
|
Diluted earnings per share from continuing operations
|
$
|
1.73
|
|
$
|
1.47
|
|
$
|
1.38
|
|
||
The following table sets forth the number of employee stock-based compensation awards outstanding but not included in the computation of diluted earnings per share because their effect would have been antidilutive for the years ended December 31, 2017, 2016 and 2015 (in thousands):
|
Year Ended December 31,
|
||||||||
|
|
2017
|
2016
|
2015
|
|||||
|
Antidilutive securities:
|
||||||||
|
RSUs
|
37
|
|
57
|
|
230
|
|
||
|
Stock options
|
39
|
|
63
|
|
96
|
|
||
87
The components of Accumulated Other Comprehensive Income (Loss) are as follows (in thousands):
|
|
Foreign
Currency Translation |
Unrealized (Loss) Gain
on Cash Flow Hedges |
Unrealized (Loss) Gain on Pension Plans
|
Other Comprehensive Loss from Unconsolidated Subsidiaries
|
Accumulated
Other Comprehensive (Loss) Income |
|||||||||||||||
|
Balance at January 1, 2015
|
$
|
(27,073
|
)
|
$
|
(3,401
|
)
|
$
|
(9,751
|
)
|
$
|
—
|
|
$
|
(40,225
|
)
|
|||||
|
Pretax (loss) income
|
(69,817
|
)
|
(1,664
|
)
|
2,245
|
|
—
|
|
(69,236
|
)
|
||||||||||
|
Income tax effect
|
—
|
|
538
|
|
(561
|
)
|
—
|
|
(23
|
)
|
||||||||||
|
Reclassification of unrealized loss
|
—
|
|
5,366
|
|
559
|
|
—
|
|
5,925
|
|
||||||||||
|
Reclassification of deferred income taxes
|
—
|
|
(1,771
|
)
|
(140
|
)
|
—
|
|
(1,911
|
)
|
||||||||||
|
Balance at December 31, 2015
|
$
|
(96,890
|
)
|
$
|
(932
|
)
|
$
|
(7,648
|
)
|
$
|
—
|
|
$
|
(105,470
|
)
|
|||||
|
Pretax (loss) income
|
(175,639
|
)
|
12,382
|
|
7,175
|
|
—
|
|
(156,082
|
)
|
||||||||||
|
Income tax effect
|
—
|
|
(4,581
|
)
|
(2,636
|
)
|
—
|
|
(7,217
|
)
|
||||||||||
|
Reclassification of unrealized loss
|
—
|
|
1,789
|
|
496
|
|
—
|
|
2,285
|
|
||||||||||
|
Reclassification of deferred income taxes
|
—
|
|
(567
|
)
|
(124
|
)
|
—
|
|
(691
|
)
|
||||||||||
|
Balance at December 31, 2016
|
$
|
(272,529
|
)
|
$
|
8,091
|
|
$
|
(2,737
|
)
|
$
|
—
|
|
$
|
(267,175
|
)
|
|||||
|
Pretax income (loss)
|
206,451
|
|
(44,550
|
)
|
361
|
|
—
|
|
162,262
|
|
||||||||||
|
Income tax effect
|
(7,366
|
)
|
16,390
|
|
(100
|
)
|
—
|
|
8,924
|
|
||||||||||
|
Reclassification of unrealized loss (gain)
|
—
|
|
50,090
|
|
(3,519
|
)
|
—
|
|
46,571
|
|
||||||||||
|
Reclassification of deferred income taxes
|
—
|
|
(18,483
|
)
|
659
|
|
—
|
|
(17,824
|
)
|
||||||||||
|
Disposal of business, net
|
1,511
|
|
—
|
|
(3,436
|
)
|
—
|
|
(1,925
|
)
|
||||||||||
|
Other comprehensive loss of unconsolidated subsidiaries
|
—
|
|
—
|
|
—
|
|
(1,309
|
)
|
(1,309
|
)
|
||||||||||
|
Balance at December 31, 2017
|
$
|
(71,933
|
)
|
$
|
11,538
|
|
$
|
(8,772
|
)
|
$
|
(1,309
|
)
|
$
|
(70,476
|
)
|
|||||
Net unrealized losses on our interest rate swaps totaling
$2 million
,
$4 million
and
$5 million
were reclassified to Interest expense in our Consolidated Statements of Income during each of the years ended
December 31, 2017
, 2016 and 2015, respectively. In 2017, we also reclassified gains of
$9 million
to Interest expense related to our cross currency swaps. Also related to our cross currency swaps, we reclassified losses of
$57 million
and gains of
$2 million
to Interest and other income, net in our Consolidated Statements of Income during the years ended December 31, 2017 and 2016, respectively; these gains and losses offset the impact of the remeasurement of the underlying contracts. The deferred income taxes related to our cash flow hedges were reclassified from Accumulated other comprehensive income (loss) to provision for income taxes.
Long-term obligations consist of the following (in thousands):
|
December 31,
|
|||||||
|
2017
|
2016
|
||||||
|
Senior secured credit agreement:
|
|||||||
|
Term loans payable
|
$
|
704,800
|
|
$
|
732,684
|
|
|
|
Revolving credit facilities
|
1,283,551
|
|
1,358,220
|
|
|||
|
U.S. Notes (2023)
|
600,000
|
|
600,000
|
|
|||
|
Euro Notes (2024)
|
600,150
|
|
525,850
|
|
|||
|
Receivables securitization facility
|
100,000
|
|
100,000
|
|
|||
|
Notes payable through October 2025 at weighted average interest rates of 1.4% and 2.1%, respectively
|
29,146
|
|
11,808
|
|
|||
|
Other long-term debt at weighted average interest rates of 1.7% and 2.4%, respectively
|
110,633
|
|
37,125
|
|
|||
|
Total debt
|
3,428,280
|
|
3,365,687
|
|
|||
|
Less: long-term debt issuance costs
|
(21,476
|
)
|
(21,611
|
)
|
|||
|
Less: current debt issuance costs
|
(2,824
|
)
|
(2,305
|
)
|
|||
|
Total debt, net of debt issuance costs
|
3,403,980
|
|
3,341,771
|
|
|||
|
Less: current maturities, net of debt issuance costs
|
(126,360
|
)
|
(66,109
|
)
|
|||
|
Long term debt, net of debt issuance costs
|
$
|
3,277,620
|
|
$
|
3,275,662
|
|
|
The scheduled maturities of long-term obligations outstanding at
December 31, 2017
are as follows (in thousands):
|
2018
|
$
|
129,184
|
|
|
2019
|
146,262
|
|
|
|
2020
|
40,087
|
|
|
|
2021
|
38,033
|
|
|
|
2022
|
36,769
|
|
|
|
Thereafter
|
3,037,945
|
|
|
|
Total debt
(1)
|
$
|
3,428,280
|
|
|
(1) The total debt amounts presented above exclude debt issuance costs totaling $24 million as of December 31, 2017.
|
|||
Senior Secured Credit Agreement
On December 1, 2017, LKQ Corporation, LKQ Delaware LLP, and certain other subsidiaries (collectively, the "Borrowers") entered into Amendment No. 2 to the Fourth Amended and Restated Credit Agreement ("Credit Agreement"), which amended the Fourth Amended and Restated Credit Agreement dated January 29, 2016 by modifying certain terms to (1) extend the maturity date by approximately two years to January 29, 2023; (2) increase the total availability under the revolving credit facility's multicurrency component from
$2.45 billion
to
$2.75 billion
; (3) increase the permitted net leverage ratio thresholds, including a temporary step-up in the allowable net leverage ratio in the case of permitted acquisitions; (4) modify the applicable margins and fees in the pricing grid; (5) increase the ability of LKQ and its subsidiaries to incur additional indebtedness; and (6) make other immaterial or clarifying modifications and amendments. The increase in the revolving credit facility's multicurrency component of
$300 million
will be used for general corporate purposes.
Amounts under the revolving credit facility are due and payable upon maturity of the Credit Agreement on January 29, 2023. Term loan borrowings, which totaled
$705 million
as of December 31, 2017, are due and payable in quarterly installments equal to
$4 million
on the last day of each fiscal quarter ending on or after March 31, 2018 and prior to March 31, 2019 and
$9 million
on the last day of each fiscal quarter ending on or after March 31, 2019, with the remaining balance due and payable on January 29, 2023.
88
We are required to prepay the term loan by amounts equal to proceeds from the sale or disposition of certain assets if the proceeds are not reinvested within twelve months. We also have the option to prepay outstanding amounts under the Credit Agreement without penalty.
The Credit Agreement contains customary representations and warranties and customary covenants that provide limitations and conditions on our ability to enter into certain transactions. The Credit Agreement also contains financial and affirmative covenants, including limitations on our net leverage ratio and a minimum interest coverage ratio.
Borrowings under the Credit Agreement bear interest at variable rates, which depend on the currency and duration of the borrowing elected, plus an applicable margin. The applicable margin is subject to change in increments of
0.25%
depending on our net leverage ratio. Interest payments are due on the last day of the selected interest period or quarterly in arrears depending on the type of borrowing. Including the effect of the interest rate swap agreements described in
Note 10, "Derivative Instruments and Hedging Activities
," the weighted average interest rates on borrowings outstanding under the Credit Agreement at
December 31, 2017 and 2016
were
2.2%
and
2.0%
, respectively. We also pay a commitment fee based on the average daily unused amount of the revolving credit facilities. The commitment fee is subject to change in increments of
0.025%
and
0.05%
depending on our net leverage ratio. In addition, we pay a participation commission on outstanding letters of credit at an applicable rate based on our net leverage ratio, and a fronting fee of
0.125%
to the issuing bank, which are due quarterly in arrears.
Of the total borrowings outstanding under the Credit Agreement,
$18 million
and
$37 million
were classified as current maturities at
December 31, 2017 and 2016
, respectively. As of
December 31, 2017
, there were letters of credit outstanding in the aggregate amount of
$71 million
. The amounts available under the revolving credit facilities are reduced by the amounts outstanding under letters of credit, and thus availability under the revolving credit facilities at
December 31, 2017
was
$1.4 billion
.
Related to the execution of Amendment No. 2 to the Fourth Amended and Restated Credit Agreement in December 2017, we incurred
$4 million
of fees, the majority of which were capitalized as an offset to Long-Term Obligations and are amortized over the term of the agreement. The amount recorded as a loss on debt extinguishment in the Consolidated Statement of Income for the year ended December 31, 2017 was primarily related to the write-off of capitalized debt issuance costs related to our Third Amended and Restated Credit Agreement.
U.S. Notes (2023)
In 2013, we issued
$600 million
aggregate principal amount of
4.75%
senior notes due
2023
(the "U.S. Notes (2023)"). The U.S. Notes (2023) are governed by the Indenture dated as of May 9, 2013 among LKQ Corporation, certain of our subsidiaries (the "Guarantors") and U.S. Bank National Association, as trustee. The U.S. Notes (2023) are registered under the Securities Act of 1933.
The U.S. Notes (2023) bear interest at a rate of
4.75%
per year from the most recent payment date on which interest has been paid or provided for. Interest on the U.S. Notes (2023) is payable in arrears on May 15 and November 15 of each year. The U.S. Notes (2023) are fully and unconditionally guaranteed, jointly and severally, by the Guarantors.
The U.S. Notes (2023) and the guarantees are, respectively, LKQ Corporation's and each Guarantor's senior unsecured obligations and are subordinated to all of the Guarantors' existing and future secured debt to the extent of the assets securing that secured debt. In addition, the U.S. Notes (2023) are effectively subordinated to all of the liabilities of our subsidiaries that are not guaranteeing the U.S. Notes (2023) to the extent of the assets of those subsidiaries.
Repayment of Rhiag Acquired Debt and Debt Related Liabilities
On March 24, 2016, LKQ Netherlands B.V., a wholly-owned subsidiary of LKQ Corporation, borrowed
€508 million
under our multi-currency revolving credit facility to repay the debt and debt related liabilities assumed as part of our acquisition of Rhiag. The borrowed funds were passed through an intercompany note to Rhiag and then were used to pay (i)
$520 million
(
€465 million
) for the principal of Rhiag senior note debt assumed with the acquisition, (ii) accrued interest of
$8 million
(
€7 million
) on the notes, (iii) the call premium of
$24 million
(
€21 million
) associated with early redemption of the notes and (iv)
$5 million
(
€4 million
) to terminate Rhiag’s outstanding interest rate swap related to the floating rate portion of the notes. The call premium is recorded as a loss on debt extinguishment in the Consolidated Statements of Income.
Euro Notes (2024)
On April 14, 2016, LKQ Italia Bondco S.p.A. (“LKQ Italia”), an indirect, wholly-owned subsidiary of LKQ Corporation, completed an offering of
€500 million
aggregate principal amount of senior notes due April 1, 2024 (the “Euro Notes (2024)”) in a private placement conducted pursuant to Regulation S and Rule 144A under the Securities Act of 1933. The proceeds from the offering were used to repay a portion of the revolver borrowings under the Credit Agreement and to pay
89
related fees and expenses. The Euro Notes (2024) are governed by the Indenture dated as of April 14, 2016 (the “Indenture”) among the LKQ Italia, LKQ Corporation and certain of our subsidiaries (the “Euro Notes (2024) Subsidiaries”), the trustee, and the paying agent, transfer agent, and registrar.
The Euro Notes (2024) bear interest at a rate of
3.875%
per year from the date of original issuance or from the most recent payment date on which interest has been paid or provided for. Interest on the Euro Notes (2024) is payable in arrears on April 1 and October 1 of each year. The Euro Notes (2024) are fully and unconditionally guaranteed by LKQ Corporation and the Euro Notes (2024) Subsidiaries (the "Euro Notes (2024) Guarantors").
The Euro Notes (2024) and the guarantees are, respectively, the LKQ Italia’s and each Euro Notes (2024) Guarantor’s senior unsecured obligations and are subordinated to all of the LKQ Italia's and the Euro Notes (2024) Guarantors’ existing and future secured debt to the extent of the assets securing that secured debt. In addition, the Euro Notes (2024) are effectively subordinated to all of the liabilities of our subsidiaries that are not guaranteeing the Euro Notes (2024) to the extent of the assets of those subsidiaries. The Euro Notes (2024) have been listed on the ExtraMOT, Professional Segment of the Borsa Italia S.p.A. securities exchange and the Global Exchange Market of the Irish Stock Exchange.
Related to the execution of the Euro Notes (2024) in April 2016, we incurred
$10 million
of fees which were capitalized as an offset to Long-Term Obligations and are amortized over the term of the Euro Notes (2024).
Restricted Payments
Our senior secured credit agreement and our senior notes indentures contain limitations on payment of cash dividends or other distributions of assets. Based on limitations in effect under our senior secured credit agreement and senior notes indentures, the maximum amount of dividends we could pay as of
December 31, 2017
was approximately
$1.4 billion
. The limit on the payment of dividends is calculated using historical financial information and will change from period to period.
Receivables Securitization Facility
On November 29, 2016, we amended the terms of our receivables securitization facility with The Bank of Tokyo-Mitsubishi UFJ, LTD. ("BTMU") to: (i) extend the term of the facility to November 8, 2019; (ii) increase the maximum amount available to
$100 million
; and (iii) make other clarifying and updating changes. Under the facility, LKQ sells an ownership interest in certain receivables, related collections and security interests to BTMU for the benefit of conduit investors and/or financial institutions for cash proceeds. Upon payment of the receivables by customers, rather than remitting to BTMU the amounts collected, LKQ retains such collections as proceeds for the sale of new receivables generated by certain of the ongoing operations of the Company.
The sale of the ownership interest in the receivables is accounted for as a secured borrowing in our Consolidated Balance Sheets, under which the receivables included in the program collateralize the amounts invested by BTMU, the conduit investors and/or financial institutions (the "Purchasers"). The receivables are held by LKQ Receivables Finance Company, LLC ("LRFC"), a wholly owned bankruptcy-remote special purpose subsidiary of LKQ, and therefore, the receivables are available first to satisfy the creditors of LRFC, including the Purchasers. As of
December 31, 2017
and
2016
,
$144 million
and
$140 million
, respectively, of net receivables were collateral for the investment under the receivables facility.
Under the receivables facility, we pay variable interest rates plus a margin on the outstanding amounts invested by the Purchasers. The variable rates are based on (i) commercial paper rates, (ii) the LIBOR, or (iii) base rates, and are payable monthly in arrears. The commercial paper rate is the applicable variable rate unless conduit investors are not available to invest in the receivables at commercial paper rates. In such case, financial institutions will invest at the LIBOR rate or at base rates. We also pay a commitment fee on the excess of the investment maximum over the average daily outstanding investment, payable monthly in arrears. As of
December 31, 2017
, the interest rate under the receivables facility was based on commercial paper rates and was
2.3%
. The outstanding balances of
$100 million
as of both
December 31, 2017
and 2016, were classified as long-term on the Consolidated Balance Sheets because we have the ability and intent to refinance these borrowings on a long-term basis.
We are exposed to market risks, including the effect of changes in interest rates, foreign currency exchange rates and commodity prices. Under our current policies, we use derivatives to manage our exposure to variable interest rates on our senior secured debt and changing foreign exchange rates for certain foreign currency denominated transactions. We do not hold or issue derivatives for trading purposes.
Cash Flow Hedges
We hold interest rate swap agreements to hedge a portion of the variable interest rate risk on our variable rate borrowings under our Credit Agreement, with the objective of minimizing the impact of interest rate fluctuations and stabilizing cash flows. Under the terms of the interest rate swap agreements, we pay the fixed interest rate and receive payment at a variable rate of interest based on LIBOR for the respective currency of each interest rate swap agreement’s notional amount. The effective portion of changes in the fair value of the interest rate swap agreements is recorded in Accumulated Other Comprehensive (Loss) Income and is reclassified to interest expense when the underlying interest payment has an impact on earnings. The ineffective portion of changes in the fair value of the interest rate swap agreements is reported in interest expense. Our interest rate swap contracts have maturity dates ranging from January to June 2021. As of
December 31, 2017
, we held interest rate swap contracts representing
$590 million
of U.S. dollar-denominated debt.
From time to time, we may hold foreign currency forward contracts related to certain foreign currency denominated intercompany transactions, with the objective of minimizing the impact of fluctuating exchange rates on these future cash flows. Under the terms of the foreign currency forward contracts, we will sell the foreign currency in exchange for U.S. dollars at a fixed rate on the maturity dates of the contracts. The effective portion of the changes in fair value of the foreign currency forward contracts is recorded in Accumulated Other Comprehensive (Loss) Income and reclassified to interest and other income, net when the underlying transaction has an impact on earnings.
In 2016, we entered into three cross currency swap agreements for a total notional amount of
$422 million
(
€400 million
). The notional amount steps down by
€15 million
annually through 2020 with the remainder maturing in January 2021. These cross currency swaps contain an interest rate swap component and a foreign currency forward contract component that, combined with related intercompany financing arrangements, effectively convert variable rate U.S. dollar-denominated borrowings into fixed rate euro-denominated borrowings. The swaps are intended to minimize the impact of fluctuating exchange rates and interest rates on the cash flows resulting from the related intercompany financing arrangements. The effective portion of the changes in the fair value of the derivative instruments is recorded in Accumulated Other Comprehensive (Loss) Income and is reclassified to interest expense and interest and other income, net when the underlying transactions have an impact on earnings.
The following table summarizes the notional amounts and fair values of our designated cash flow hedges as of
December 31, 2017
and
2016
(in thousands):
|
Notional Amount
|
Fair Value at December 31, 2017 (USD)
|
Fair Value at December 31, 2016 (USD)
|
||||||||||||||||||||||
|
December 31, 2017
|
December 31, 2016
|
Other Assets
|
Other Noncurrent Liabilities
|
Other Assets
|
Other Noncurrent Liabilities
|
|||||||||||||||||||
|
Interest rate swap agreements
|
||||||||||||||||||||||||
|
USD denominated
|
$
|
590,000
|
|
$
|
590,000
|
|
$
|
19,102
|
|
$
|
—
|
|
$
|
16,421
|
|
$
|
—
|
|
||||||
|
Cross currency swap agreements
|
||||||||||||||||||||||||
|
USD/euro
|
$
|
406,546
|
|
$
|
422,408
|
|
5,504
|
|
61,492
|
|
1,486
|
|
3,128
|
|
||||||||||
|
Total cash flow hedges
|
$
|
24,606
|
|
$
|
61,492
|
|
$
|
17,907
|
|
$
|
3,128
|
|
||||||||||||
While certain derivative instruments executed with the same counterparty are subject to master netting arrangements, we present our cash flow hedge derivative instruments on a gross basis in our Consolidated Balance Sheets. The impact of netting the fair values of these contracts would not have a material effect on our Consolidated Balance Sheets at
December 31, 2017
or
2016
.
The activity related to our cash flow hedges is included in
Note 8, "Accumulated Other Comprehensive Income (Loss)
." Ineffectiveness related to our cash flow hedges was immaterial to our results of operations during
2017
,
2016
and
2015
. We do not expect future ineffectiveness related to our cash flow hedges to have a material effect on our results of operations.
As of
December 31, 2017
, we estimate that less than
$1 million
of derivative losses (net of tax) included in Accumulated Other Comprehensive Income (Loss) will be reclassified into our Consolidated Statements of Income within the next
12
months.
Other Derivative Instruments
We hold other short-term derivative instruments, including foreign currency forward contracts to manage our exposure to variability related to inventory purchases and intercompany financing transactions denominated in a non-functional currency. We have elected not to apply hedge accounting for these transactions, and therefore the contracts are adjusted to fair value
90
through our results of operations as of each balance sheet date, which could result in volatility in our earnings. The notional amount and fair value of these contracts at
December 31, 2017 and 2016
, along with the effect on our results of operations in
2017
,
2016
and
2015
, were immaterial.
Financial Assets and Liabilities Measured at Fair Value
We use the market and income approaches to value our financial assets and liabilities, and during the year ended
December 31, 2017
, there were no significant changes in valuation techniques or inputs related to the financial assets or liabilities that we have historically recorded at fair value. The tiers in the fair value hierarchy include: Level 1, defined as observable inputs such as quoted market prices in active markets; Level 2, defined as inputs other than quoted prices in active markets that are either directly or indirectly observable; and Level 3, defined as unobservable inputs in which little or no market data exists, therefore requiring an entity to develop its own assumptions.
The following tables present information about our financial assets and liabilities measured at fair value on a recurring basis and indicate the fair value hierarchy of the valuation inputs we utilized to determine such fair value as of
December 31, 2017 and 2016
(in thousands):
|
|
Balance as of December 31, 2017
|
Fair Value Measurements as of December 31, 2017
|
|||||||||||||
|
Level 1
|
Level 2
|
Level 3
|
|||||||||||||
|
Assets:
|
|||||||||||||||
|
Cash surrender value of life insurance
|
$
|
45,984
|
|
$
|
—
|
|
$
|
45,984
|
|
$
|
—
|
|
|||
|
Interest rate swaps
|
19,102
|
|
—
|
|
19,102
|
|
—
|
|
|||||||
|
Cross currency swap agreements
|
5,504
|
|
—
|
|
5,504
|
|
—
|
|
|||||||
|
Total Assets
|
$
|
70,590
|
|
$
|
—
|
|
$
|
70,590
|
|
$
|
—
|
|
|||
|
Liabilities:
|
|||||||||||||||
|
Contingent consideration liabilities
|
$
|
2,636
|
|
$
|
—
|
|
$
|
—
|
|
$
|
2,636
|
|
|||
|
Deferred compensation liabilities
|
47,199
|
|
—
|
|
47,199
|
|
—
|
|
|||||||
|
Cross currency swap agreements
|
61,492
|
|
—
|
|
61,492
|
|
—
|
|
|||||||
|
Total Liabilities
|
$
|
111,327
|
|
$
|
—
|
|
$
|
108,691
|
|
$
|
2,636
|
|
|||
|
|
Balance as of December 31, 2016
|
Fair Value Measurements as of December 31, 2016
|
|||||||||||||
|
Level 1
|
Level 2
|
Level 3
|
|||||||||||||
|
Assets:
|
|||||||||||||||
|
Cash surrender value of life insurance
|
$
|
36,131
|
|
$
|
—
|
|
$
|
36,131
|
|
$
|
—
|
|
|||
|
Interest rate swaps
|
16,421
|
|
—
|
|
16,421
|
|
—
|
|
|||||||
|
Cross currency swap agreements
|
1,486
|
|
—
|
|
1,486
|
|
—
|
|
|||||||
|
Total Assets
|
$
|
54,038
|
|
$
|
—
|
|
$
|
54,038
|
|
$
|
—
|
|
|||
|
Liabilities:
|
|||||||||||||||
|
Contingent consideration liabilities
|
$
|
3,162
|
|
$
|
—
|
|
$
|
—
|
|
$
|
3,162
|
|
|||
|
Deferred compensation liabilities
|
36,865
|
|
—
|
|
36,865
|
|
—
|
|
|||||||
|
Cross currency swap agreements
|
3,128
|
|
—
|
|
3,128
|
|
—
|
|
|||||||
|
Total Liabilities
|
$
|
43,155
|
|
$
|
—
|
|
$
|
39,993
|
|
$
|
3,162
|
|
|||
The cash surrender value of life insurance is included in Other assets on our Consolidated Balance Sheets. The current portion of deferred compensation is included in Accrued payroll-related liabilities and the current portion of contingent consideration liabilities is included in Other current liabilities on our Consolidated Balance Sheets; the noncurrent portion of these amounts is included in Other noncurrent liabilities on our Consolidated Balance Sheets based on the expected timing of the related payments. The balance sheet classification of the interest rate swaps and foreign currency forward contracts is presented in
Note 10, "Derivative Instruments and Hedging Activities
."
Our Level 2 assets and liabilities are valued using inputs from third parties and market observable data. We obtain valuation data for the cash surrender value of life insurance and deferred compensation liabilities from third party sources, which determine the net asset values for our accounts using quoted market prices, investment allocations and reportable trades. We value our derivative instruments using a third party valuation model that performs a discounted cash flow analysis based on
91
the terms of the contracts and market observable inputs such as current and forward interest rates and current and forward foreign exchange rates.
Our contingent consideration liabilities are related to our business acquisitions. Under the terms of the contingent consideration agreements, payments may be made at specified future dates depending on the performance of the acquired business subsequent to the acquisition. The liabilities for these payments are classified as Level 3 liabilities because the related fair value measurement, which is determined using an income approach, includes significant inputs not observable in the market.
Financial Assets and Liabilities Not Measured at Fair Value
Our debt is reflected on the Consolidated Balance Sheets at cost. Based on market conditions as of
December 31, 2017 and 2016
, the fair value of our credit agreement borrowings reasonably approximated the carrying value of
$2.0 billion
and
$2.1 billion
, respectively. In addition, based on market conditions, the fair values of the outstanding borrowings under the receivables facility reasonably approximated the carrying values of
$100 million
at
December 31, 2017 and 2016
, respectively. As of
December 31, 2017
and
2016
, the fair values of the U.S. Notes (2023) were approximately
$615 million
and
$599 million
, respectively, compared to a carrying value of $
600 million
. As of
December 31, 2017
and
2016
, the fair values of the Euro Notes (2024) were approximately
$658 million
and
$561 million
compared to carrying values of
$600 million
and
$526 million
, respectively.
The fair value measurements of the borrowings under our credit agreement and receivables facility are classified as Level 2 within the fair value hierarchy since they are determined based upon significant inputs observable in the market, including interest rates on recent financing transactions with similar terms and maturities. We estimated the fair value by calculating the upfront cash payment a market participant would require at
December 31, 2017
to assume these obligations. The fair value of our U.S. Notes (2023) is classified as Level 1 within the fair value hierarchy since it is determined based upon observable market inputs including quoted market prices in an active market. The fair value of our Euro Notes (2024) is determined based upon observable market inputs including quoted market prices in a market that is not active, and therefore is classified as Level 2 within the fair value hierarchy.
92
Operating Leases
We are obligated under noncancelable operating leases for corporate office space, warehouse and distribution facilities, trucks and certain equipment.
In the second quarter of 2017, we entered into a lease for office space to be constructed for our field support center in Nashville, Tennessee. The commencement date is scheduled for the fourth quarter of 2018, with a lease term of
17
years and the option to renew and extend the lease for
three
consecutive renewal terms of
five
years each. Rent will escalate annually by
1.5%
over the prior year's rent. Under the lease, we can exercise an early purchase option after the first year of the lease.
The future minimum lease commitments under these leases at
December 31, 2017
are as follows (in thousands):
|
Years ending December 31:
|
|||
|
2018
|
$
|
235,821
|
|
|
2019
|
192,208
|
|
|
|
2020
|
155,314
|
|
|
|
2021
|
117,564
|
|
|
|
2022
|
93,289
|
|
|
|
Thereafter
|
562,869
|
|
|
|
Future Minimum Lease Payments
|
$
|
1,357,065
|
|
Rental expense for operating leases was approximately
$247 million
,
$212 million
and
$168 million
during the years ended December 31,
2017
,
2016
and
2015
, respectively.
We guarantee the residual values of the majority of our truck and equipment operating leases. The residual values decline over the lease terms to a defined percentage of original cost. In the event the lessor does not realize the residual value when a piece of equipment is sold, we would be responsible for a portion of the shortfall. Similarly, if the lessor realizes more than the residual value when a piece of equipment is sold, we would be paid the amount realized over the residual value. Had we terminated all of our operating leases subject to these guarantees at
December 31, 2017
, our portion of the guaranteed residual value would have totaled approximately
$67 million
. We have not recorded a liability for the guaranteed residual value of equipment under operating leases as the recovery on disposition of the equipment under the leases is expected to approximate the guaranteed residual value.
Litigation and Related Contingencies
We have certain contingencies resulting from litigation, claims and other commitments and are subject to a variety of environmental and pollution control laws and regulations incident to the ordinary course of business. We currently expect that the resolution of such contingencies will not materially affect our financial position, results of operations or cash flows.
93
The provision for income taxes consists of the following components (in thousands):
|
Year Ended December 31,
|
|||||||||||
|
|
2017
|
2016
|
2015
|
||||||||
|
Current:
|
|||||||||||
|
Federal
|
$
|
196,825
|
|
$
|
159,547
|
|
$
|
138,432
|
|
||
|
State
|
27,149
|
|
27,120
|
|
25,952
|
|
|||||
|
Foreign
|
58,123
|
|
45,545
|
|
32,931
|
|
|||||
|
$
|
282,097
|
|
$
|
232,212
|
|
$
|
197,315
|
|
|||
|
Deferred:
|
|||||||||||
|
Federal
|
$
|
(37,486
|
)
|
$
|
1,169
|
|
$
|
22,233
|
|
||
|
State
|
4,044
|
|
2,131
|
|
1,212
|
|
|||||
|
Foreign
|
(13,095
|
)
|
(14,946
|
)
|
(1,057
|
)
|
|||||
|
$
|
(46,537
|
)
|
$
|
(11,646
|
)
|
$
|
22,388
|
|
|||
|
Provision for income taxes
|
$
|
235,560
|
|
$
|
220,566
|
|
$
|
219,703
|
|
||
Income taxes have been based on the following components of income from continuing operations before provision for income taxes (in thousands):
|
Year Ended December 31,
|
|||||||||||
|
|
2017
|
2016
|
2015
|
||||||||
|
Domestic
|
$
|
575,148
|
|
$
|
513,844
|
|
$
|
478,819
|
|
||
|
Foreign
|
191,479
|
|
163,437
|
|
170,211
|
|
|||||
|
$
|
766,627
|
|
$
|
677,281
|
|
$
|
649,030
|
|
|||
The U.S. federal statutory rate is reconciled to the effective tax rate as follows:
|
Year Ended December 31,
|
||||||||
|
|
2017
|
2016
|
2015
|
|||||
|
U.S. federal statutory rate
|
35.0
|
%
|
35.0
|
%
|
35.0
|
%
|
||
|
U.S. federal tax reform - federal deferred tax rate change
|
(9.5
|
)%
|
—
|
%
|
—
|
%
|
||
|
U.S. federal tax reform - transition tax on foreign earnings
|
6.6
|
%
|
—
|
%
|
—
|
%
|
||
|
State income taxes, net of state credits and federal tax impact
|
2.8
|
%
|
2.7
|
%
|
2.9
|
%
|
||
|
Impact of rates on international operations
|
(3.2
|
)%
|
(3.2
|
)%
|
(4.1
|
)%
|
||
|
Notional interest deductions
|
(0.9
|
)%
|
(2.5
|
)%
|
—
|
%
|
||
|
Excess tax benefits from stock-based compensation
(1)
|
(1.0
|
)%
|
(1.6
|
)%
|
—
|
%
|
||
|
Non-deductible expenses
|
1.1
|
%
|
1.3
|
%
|
0.8
|
%
|
||
|
Other, net
|
(0.2
|
)%
|
0.9
|
%
|
(0.7
|
)%
|
||
|
Effective tax rate
|
30.7
|
%
|
32.6
|
%
|
33.9
|
%
|
||
(1) Represents an
$8 million
and
$11 million
discrete item in 2017 and 2016, respectively, for excess tax benefits from stock-based payments.
On December 22, 2017, the U.S. government enacted the Tax Act. The Tax Act introduced broad and complex changes to U.S. income tax laws that impact us, most notably a reduction of the U.S. statutory corporate tax rate from
35%
to
21%
for tax years beginning after December 31, 2017. Additionally, beginning in 2018 the Tax Act imposes a regime of taxation on foreign subsidiary earnings (Global Intangible Low-Taxed Income, “GILTI”) and on certain related party payments (Base Erosion Anti-abuse Tax, “BEAT”). Other important changes potentially material to the Company’s operations include the full expensing of certain assets placed into service after September 27, 2017, the repeal of the domestic manufacturing deduction, and additional limitations on the deductibility of executive compensation. Finally, as part of the transition of U.S. international taxation from a worldwide tax system to a territorial tax system, the Tax Act imposes a one-time transition tax on the deemed repatriation of historical earnings of foreign subsidiaries as of December 31, 2017.
94
On December 22, 2017 the U.S. Securities and Exchange Commission Staff issued Staff Accounting Bulletin 118 (“SAB 118”), which provides guidance on accounting for the tax effects of the Tax Act. SAB 118 provides a measurement period that should not extend beyond one year from the Tax Act enactment date for companies to complete the accounting required under ASC 740,
Income Taxes
. In accordance with SAB 118, a company must reflect the income tax effects of those aspects of the Tax Act for which the accounting under ASC 740 is complete. To the extent that a company’s accounting for certain income tax effects of the Tax Act is incomplete but the company is able to determine a reasonable estimate, it must record a provisional estimate in the financial statements.
Accordingly, we recorded the following provisional estimates of the tax accounting impact of the Tax Act in the consolidated financial statements as of and for the year ended December 31, 2017:
Transition Tax on Foreign Earnings:
We recognized a provisional income tax expense of
$51 million
for the year ended December 31, 2017 related to the one-time transition tax on foreign earnings. The charge is provisional due to the complexity of calculating and supporting such U.S. tax attributes as accumulated foreign earnings and profits, foreign taxes paid, and other components involved in foreign tax credit calculations for a substantial number of prior tax years. Potential adjustments to the provisional amount could be material due to the issuance of regulatory guidance or further legislative action regarding the transition tax, further changes in accounting standards for income taxes or related interpretations in response to the Tax Act, or any updates or changes to the estimates we have utilized to calculate the provisional estimate.
Revaluation of Deferred Tax Assets and Liabilities:
As a result of the Tax Act reduction in the U.S. federal statutory rate from
35%
to
21%
, we recorded a provisional decrease to net deferred tax liabilities and a corresponding provisional U.S. federal deferred tax benefit of
$73 million
. We anticipate that the completion of our 2017 tax returns, as well as anticipated further regulatory guidance and interpretations with respect to the Tax Act, will cause us to further adjust the provisional amounts recorded as of December 31, 2017.
Our accounting for the following elements of the Tax Act is incomplete, and we have not yet been able to make reasonable estimates of the effects of the items described below. Therefore, no provisional amounts have been recorded.
GILTI:
Due to the complexity of the new GILTI tax rules, and the absence to date of comprehensive regulatory guidance, we are continuing to evaluate this provision of the Tax Act and the application of ASC 740 to the GILTI regime. We are permitted to make an accounting policy election to treat taxes due on future inclusions in U.S. taxable income related to GILTI either as a current-period expense when incurred or to factor such amounts into our measurement of deferred taxes. We have not yet completed our analysis of the GILTI tax rules and we are not yet able to reasonably estimate the effect of this provision of the Tax Act or make an accounting policy election for the ASC 740 treatment of the GILTI tax. Therefore, we have not recorded any amounts related to potential GILTI tax in our financial statements and have not yet made a policy decision regarding whether to record deferred taxes on GILTI.
Indefinite Reinvestment Assertion:
Undistributed earnings of our foreign subsidiaries amounted to approximately
$687 million
at December 31, 2017. In general, it has been our practice and intention to permanently reinvest the undistributed earnings of our foreign subsidiaries, and that position has not changed following the enactment of the Tax Act and the related imposition of the transition tax. Beginning in 2018, the Tax Act generally provides a 100% participation exemption from further U.S. taxation of dividends received from 10-percent or more owned foreign corporations held by U.S. corporate shareholders. Although future dividend income is now exempt from U.S. federal tax in the hands of the U.S. corporate shareholders, either as a result of the new participation exemption, or due to the previous taxation of such earnings under the transition tax, companies must still apply the guidance of ASC 740 to account for the tax consequences of outside basis differences and other tax impacts of their investments in non-U.S. subsidiaries. While we have now accrued the provisional transition tax on the deemed repatriated earnings that are indefinitely reinvested, it remains impracticable to determine whether there is any further tax liability under the Tax Act for the remaining outside basis differences or to evaluate how the Tax Act will affect our existing accounting position to indefinitely reinvest unremitted foreign earnings. Therefore, we have not included a provisional amount for this item in our financial statements for the year ended December 31, 2017.
We will complete our analysis of the tax accounting impact of the Tax Act within the one-year measurement period. Any adjustments during this measurement period will be included in net earnings from continuing operations as an adjustment to income tax expense in the reporting period in which such adjustments are determined.
95
The significant components of our deferred tax assets and liabilities are as follows (in thousands):
|
December 31,
|
|||||||
|
2017
|
2016
|
||||||
|
Deferred Tax Assets:
|
|||||||
|
Accrued expenses and reserves
|
$
|
40,317
|
|
$
|
62,059
|
|
|
|
Qualified and nonqualified retirement plans
|
19,074
|
|
36,626
|
|
|||
|
Inventory
|
17,886
|
|
35,565
|
|
|||
|
Accounts receivable
|
16,036
|
|
19,046
|
|
|||
|
Interest deduction carryforwards
|
13,845
|
|
9,806
|
|
|||
|
Stock-based compensation
|
4,963
|
|
9,687
|
|
|||
|
Net operating loss carryforwards
|
11,734
|
|
7,858
|
|
|||
|
Other
|
8,971
|
|
7,699
|
|
|||
|
132,826
|
|
188,346
|
|
||||
|
Less: valuation allowance
|
(21,527
|
)
|
(11,252
|
)
|
|||
|
Total deferred tax assets
|
$
|
111,299
|
|
$
|
177,094
|
|
|
|
Deferred Tax Liabilities:
|
|||||||
|
Goodwill and other intangible assets
|
$
|
192,688
|
|
$
|
222,476
|
|
|
|
Property, plant and equipment
|
67,467
|
|
72,231
|
|
|||
|
Trade name
|
72,233
|
|
59,002
|
|
|||
|
Other
|
16,165
|
|
19,439
|
|
|||
|
Total deferred tax liabilities
|
$
|
348,553
|
|
$
|
373,148
|
|
|
|
Net deferred tax liability
|
$
|
(237,254
|
)
|
$
|
(196,054
|
)
|
|
Deferred tax assets and liabilities are reflected on our Consolidated Balance Sheets as follows (in thousands):
|
December 31,
|
|||||||
|
2017
|
2016
|
||||||
|
Noncurrent deferred tax assets
|
$
|
15,105
|
|
$
|
3,603
|
|
|
|
Noncurrent deferred tax liabilities
|
252,359
|
|
199,657
|
|
|||
The change in our deferred tax balances as compared to December 31, 2016, was materially impacted by a
$73 million
reduction in the net U.S. deferred tax liabilities attributable to the U.S. Federal tax rate reduction from
35%
to
21%
enacted December 22, 2017. Noncurrent deferred tax assets and noncurrent deferred tax liabilities are included in Other Assets and Deferred Income Taxes, respectively, on our Consolidated Balance Sheets.
We had net operating loss carryforwards for federal and certain state tax jurisdictions, the tax benefits of which total approximately
$12 million
and
$8 million
at
December 31, 2017 and 2016
, respectively. At
December 31, 2017 and 2016
, we had foreign, state and local tax credit carryforwards, the tax benefits of which total approximately
$2 million
. At December 31, 2017 and 2016, we had interest deduction carryforwards in Italy of
$14 million
and
$10 million
, respectively. As of
December 31, 2017 and 2016
, valuation allowances of
$22 million
and
$11 million
, respectively, were recorded for a portion of the deferred tax assets related to net operating loss, tax credit carryforwards and interest deduction carryforwards. The
$10 million
net increase in valuation allowances was primarily due to a
$7 million
valuation allowance provided on certain interest deduction carryforwards suspended due to Italy's thin capitalization constraints, and a
$3 million
increase attributable to acquired foreign net operating loss carryforwards.
The net operating loss carryforwards expire over an indefinite period. Foreign tax credit carryforwards expire over the period from 2018 through 2027, while the state and local tax credits generally have no expiration. The interest deduction carryforwards do not expire. Realization of these deferred tax assets is dependent on the generation of sufficient taxable income prior to the expiration dates, where applicable, or in the case of the interest carryforwards, the compliance with limitations under thin capitalization constraints. Based on historical and projected operating results, we believe that it is more likely than not that earnings will be sufficient to realize the deferred tax assets for which valuation allowances have not been provided. While we expect to realize the deferred tax assets, net of valuation allowances, changes in estimates of future taxable income or in tax laws may alter this expectation.
96
A reconciliation of the beginning and ending amount of gross unrecognized tax benefits is as follows (in thousands):
|
|
2017
|
2016
|
2015
|
||||||||
|
Balance at January 1
|
$
|
2,146
|
|
$
|
2,273
|
|
$
|
2,630
|
|
||
|
Additions for acquired tax positions
|
73
|
|
—
|
|
80
|
|
|||||
|
Additions based on tax positions related to the current year
|
5
|
|
5
|
|
302
|
|
|||||
|
Reductions for tax positions of prior years
|
—
|
|
—
|
|
(743
|
)
|
|||||
|
Lapse of statutes of limitations
|
(534
|
)
|
(132
|
)
|
(119
|
)
|
|||||
|
Currency exchange rate fluctuations
|
—
|
|
—
|
|
123
|
|
|||||
|
Balance at December 31
|
$
|
1,690
|
|
$
|
2,146
|
|
$
|
2,273
|
|
||
Included in the balance of unrecognized tax benefits above as of
December 31, 2017
,
2016
and
2015
are
$1 million
of tax benefits that, if recognized, would affect the effective tax rate. The balance of unrecognized tax benefits at
December 31, 2017
,
2016
and
2015
include less than
$1 million
of tax benefits that, if recognized, would result in adjustments to deferred taxes.
The Company recognizes interest and penalties accrued related to unrecognized tax benefits as income tax expense. Attributable to the unrecognized tax benefits noted above, the Company had accumulated interest and penalties of approximately $
1 million
at December 31, 2017, 2016 and 2015. During each of the years ended December 31,
2017
,
2016
, and
2015
, an immaterial amount of interest and penalties were recorded through the income tax provision, prior to any reversals for lapses in the statutes of limitations.
During the
twelve
months beginning January 1, 2018, it is reasonably possible that we will reduce unrecognized tax benefits by up to approximately
$1 million
, all of which would impact our effective tax rate, primarily as a result of the expiration of certain statutes of limitations.
The company and/or its subsidiaries file income tax returns in the U.S. federal jurisdiction, and various states and non-U.S. jurisdictions. With few exceptions, the company is no longer subject to U.S. federal, state and local, or non-U.S. income tax examinations by tax authorities for years before 2014. Adjustments from examinations, if any, are not expected to have a material effect on our consolidated financial statements.
We have
four
operating segments: Wholesale – North America, Europe, Specialty and Self Service. Our Wholesale – North America and Self Service operating segments are aggregated into
one
reportable segment, North America, because they possess similar economic characteristics and have common products and services, customers, and methods of distribution. Our reportable segments are organized based on a combination of geographic areas served and type of product lines offered. The reportable segments are managed separately as each business serves different customers (i.e. geographic in the case of North America and Europe and product type in the case of Specialty) and is affected by different economic conditions. Therefore, we present
three
reportable segments: North America, Europe and Specialty.
97
The following tables present our financial performance by reportable segment for the periods indicated (in thousands):
|
North America
(1)
|
Europe
|
Specialty
(1)
|
Eliminations
|
Consolidated
|
|||||||||||||||
|
Year Ended December 31, 2017
|
|||||||||||||||||||
|
Revenue:
|
|||||||||||||||||||
|
Third Party
|
$
|
4,798,901
|
|
$
|
3,636,811
|
|
$
|
1,301,197
|
|
$
|
—
|
|
$
|
9,736,909
|
|
||||
|
Intersegment
|
750
|
|
—
|
|
4,319
|
|
(5,069
|
)
|
—
|
|
|||||||||
|
Total segment revenue
|
$
|
4,799,651
|
|
$
|
3,636,811
|
|
$
|
1,305,516
|
|
$
|
(5,069
|
)
|
$
|
9,736,909
|
|
||||
|
Segment EBITDA
|
$
|
655,275
|
|
$
|
319,156
|
|
$
|
142,159
|
|
$
|
—
|
|
$
|
1,116,590
|
|
||||
|
Depreciation and amortization
(2)
|
86,303
|
|
120,805
|
|
23,095
|
|
—
|
|
230,203
|
|
|||||||||
|
Year Ended December 31, 2016
|
|||||||||||||||||||
|
Revenue:
|
|||||||||||||||||||
|
Third Party
|
$
|
4,443,886
|
|
$
|
2,920,470
|
|
$
|
1,219,675
|
|
$
|
—
|
|
$
|
8,584,031
|
|
||||
|
Intersegment
|
739
|
|
—
|
|
4,048
|
|
(4,787
|
)
|
—
|
|
|||||||||
|
Total segment revenue
|
$
|
4,444,625
|
|
$
|
2,920,470
|
|
$
|
1,223,723
|
|
$
|
(4,787
|
)
|
$
|
8,584,031
|
|
||||
|
Segment EBITDA
|
$
|
589,945
|
|
$
|
283,608
|
|
$
|
131,427
|
|
$
|
—
|
|
$
|
1,004,980
|
|
||||
|
Depreciation and amortization
(2)
|
80,923
|
|
94,979
|
|
22,432
|
|
—
|
|
198,334
|
|
|||||||||
|
Year Ended December 31, 2015
|
|||||||||||||||||||
|
Revenue:
|
|||||||||||||||||||
|
Third Party
|
$
|
4,118,286
|
|
$
|
1,995,385
|
|
$
|
1,078,962
|
|
$
|
—
|
|
$
|
7,192,633
|
|
||||
|
Intersegment
|
835
|
|
70
|
|
3,334
|
|
(4,239
|
)
|
—
|
|
|||||||||
|
Total segment revenue
|
$
|
4,119,121
|
|
$
|
1,995,455
|
|
$
|
1,082,296
|
|
$
|
(4,239
|
)
|
$
|
7,192,633
|
|
||||
|
Segment EBITDA
|
$
|
540,650
|
|
$
|
200,563
|
|
$
|
113,316
|
|
$
|
—
|
|
$
|
854,529
|
|
||||
|
Depreciation and amortization
(2)
|
69,879
|
|
36,446
|
|
21,867
|
|
—
|
|
128,192
|
|
|||||||||
|
(1)
|
In the first quarter of 2017, we realigned a portion of our North America operations under our Specialty segment. Prior year results have been recast to reflect the shift in reporting structure in order to present segment results on a comparable basis.
|
|
(2)
|
Amounts presented include depreciation and amortization expense recorded within cost of goods sold.
|
The key measure of segment profit or loss reviewed by our chief operating decision maker, who is our Chief Executive Officer, is Segment EBITDA. Segment EBITDA includes revenue and expenses that are controllable by the segment. Corporate general and administrative expenses are allocated to the segments based on usage, with shared expenses apportioned based on the segment's percentage of consolidated revenue. We calculate Segment EBITDA as EBITDA excluding restructuring and acquisition related expenses, change in fair value of contingent consideration liabilities, other acquisition related gains and losses and equity in earnings (loss) of unconsolidated subsidiaries. EBITDA, which is the basis for Segment EBITDA, is calculated as net income excluding noncontrolling interest, discontinued operations, depreciation, amortization, interest (which includes loss on debt extinguishment) and income tax expense.
98
The table below provides a reconciliation of Net Income to Segment EBITDA (in thousands):
|
|
Year Ended December 31,
|
||||||||||
|
2017
|
2016
|
2015
|
|||||||||
|
Net income
|
$
|
530,228
|
|
$
|
463,975
|
|
$
|
423,223
|
|
||
|
Less: net loss attributable to noncontrolling interest
|
(3,516
|
)
|
—
|
|
—
|
|
|||||
|
Net income attributable to LKQ stockholders
|
533,744
|
|
463,975
|
|
423,223
|
|
|||||
|
Subtract:
|
|||||||||||
|
Net (loss) income from discontinued operations
|
(6,746
|
)
|
7,852
|
|
—
|
|
|||||
|
Net income from continuing operations attributable to LKQ stockholders
|
540,490
|
|
456,123
|
|
423,223
|
|
|||||
|
Add:
|
|||||||||||
|
Depreciation and amortization
|
219,546
|
|
191,433
|
|
122,120
|
|
|||||
|
Depreciation and amortization - cost of goods sold
|
10,657
|
|
6,901
|
|
6,072
|
|
|||||
|
Interest expense, net
|
100,620
|
|
87,682
|
|
57,342
|
|
|||||
|
Loss on debt extinguishment
|
456
|
|
26,650
|
|
—
|
|
|||||
|
Provision for income taxes
|
235,560
|
|
220,566
|
|
219,703
|
|
|||||
|
EBITDA
|
1,107,329
|
|
989,355
|
|
828,460
|
|
|||||
|
Subtract:
|
|||||||||||
|
Equity in earnings (loss) of unconsolidated subsidiaries
|
5,907
|
|
(592
|
)
|
(6,104
|
)
|
|||||
|
Gains on foreign exchange contracts - acquisition related
(1)
|
—
|
|
18,342
|
|
—
|
|
|||||
|
Gains on bargain purchases
(2)
|
3,870
|
|
8,207
|
|
—
|
|
|||||
|
Add:
|
|||||||||||
|
Restructuring and acquisition related expenses
(3)
|
19,672
|
|
37,762
|
|
19,511
|
|
|||||
|
Inventory step-up adjustment - acquisition related
(4)
|
3,584
|
|
3,614
|
|
—
|
|
|||||
|
Change in fair value of contingent consideration liabilities
|
(4,218
|
)
|
206
|
|
454
|
|
|||||
|
Segment EBITDA
|
$
|
1,116,590
|
|
$
|
1,004,980
|
|
$
|
854,529
|
|
||
|
(1)
|
Reflects gains on foreign currency forwards used to fix the euro purchase price of Rhiag. See
Note 2, "Business Combinations
," for further information.
|
|
(2)
|
Reflects the gains on bargain purchases related to our acquisitions of Andrew Page and a wholesale business in Europe. See
Note 2, "Business Combinations
," for further information.
|
|
(3)
|
See
|
|
(4)
|
Reflects the impact on Cost of Goods Sold of the step-up adjustments to record acquired inventory at its fair value for Warn and PGW autoglass in 2017 and 2016, respectively.
|
The following table presents capital expenditures by reportable segment (in thousands):
|
|
Year Ended December 31,
|
||||||||||
|
2017
|
2016
|
2015
|
|||||||||
|
Capital Expenditures
|
|||||||||||
|
North America
|
$
|
95,823
|
|
$
|
91,618
|
|
$
|
72,048
|
|
||
|
Europe
|
71,494
|
|
77,689
|
|
79,072
|
|
|||||
|
Specialty
|
8,175
|
|
13,611
|
|
19,370
|
|
|||||
|
Discontinued operations
|
3,598
|
|
24,156
|
|
—
|
|
|||||
|
Total capital expenditures
|
$
|
179,090
|
|
$
|
207,074
|
|
$
|
170,490
|
|
||
99
The following table presents assets by reportable segment (in thousands):
|
December 31,
|
|||||||||||
|
2017
|
2016
(1)
|
2015
(1)
|
|||||||||
|
Receivables, net
|
|||||||||||
|
North America
(2)
|
$
|
379,666
|
|
$
|
351,681
|
|
$
|
313,670
|
|
||
|
Europe
(2)
|
555,372
|
|
443,281
|
|
215,710
|
|
|||||
|
Specialty
|
92,068
|
|
65,587
|
|
60,780
|
|
|||||
|
Total receivables, net
|
1,027,106
|
|
860,549
|
|
590,160
|
|
|||||
|
Inventories
|
|||||||||||
|
North America
(2)
|
1,076,393
|
|
915,244
|
|
845,805
|
|
|||||
|
Europe
(2)
|
964,068
|
|
718,729
|
|
427,323
|
|
|||||
|
Specialty
|
340,322
|
|
301,264
|
|
283,424
|
|
|||||
|
Total inventories
|
2,380,783
|
|
1,935,237
|
|
1,556,552
|
|
|||||
|
Property, Plant and Equipment, net
|
|||||||||||
|
North America
(2)
|
537,286
|
|
505,925
|
|
467,685
|
|
|||||
|
Europe
(2)
|
293,539
|
|
247,910
|
|
175,455
|
|
|||||
|
Specialty
|
82,264
|
|
57,741
|
|
53,427
|
|
|||||
|
Total property, plant and equipment, net
|
913,089
|
|
811,576
|
|
696,567
|
|
|||||
|
Equity Method Investments
|
|||||||||||
|
North America
|
336
|
|
336
|
|
628
|
|
|||||
|
Europe
(3)
|
208,068
|
|
183,131
|
|
2,127
|
|
|||||
|
Total equity method investments
|
208,404
|
|
183,467
|
|
2,755
|
|
|||||
|
Other unallocated assets
|
4,837,490
|
|
4,512,370
|
|
2,801,803
|
|
|||||
|
Total assets
|
$
|
9,366,872
|
|
$
|
8,303,199
|
|
$
|
5,647,837
|
|
||
|
(1)
|
In the first quarter of 2017, we realigned a portion of our North America operations under our Specialty segment. Prior year amounts have been recast to reflect the shift in reporting structure.
|
|
(2)
|
The increase in assets for our North America and Europe segments from
December 31, 2015
to
December 31, 2016
primarily relates to the PGW autoglass and Rhiag acquisitions, respectively. See
|
|
(3)
|
The increase in Europe from
December 31, 2015
to
December 31, 2016
primarily relates to our investment in Mekonomen as described in
|
We report net receivables; inventories; net property
, plant
and equipment; and equity method investments by segment as that information is used by the chief operating decision maker in assessing segment performance. These assets provide a measure for the operating capital employed in each segment. Unallocated assets include cash, prepaid and other current and noncurrent assets, goodwill, other intangibles, assets of discontinued operations and income taxes.
The majority of our operations are conducted in the U.S. Our European operations are located in the U.K., the Netherlands, Belgium, Italy, Czech Republic, Slovakia and other European countries. Our operations in other countries include recycled and aftermarket operations in Canada, engine remanufacturing and bumper refurbishing operations in Mexico, an aftermarket parts freight consolidation warehouse in Taiwan, and administrative support functions in India. Our net sales are attributed to geographic area based on the location of the selling operation.
100
The following table sets forth our revenue by geographic area (in thousands):
|
Year Ended December 31,
|
|||||||||||
|
|
2017
|
2016
|
2015
|
||||||||
|
Revenue
|
|||||||||||
|
United States
|
$
|
5,662,016
|
|
$
|
5,226,918
|
|
$
|
4,831,875
|
|
||
|
United Kingdom
|
1,548,212
|
|
1,390,775
|
|
1,382,432
|
|
|||||
|
Other countries
|
2,526,681
|
|
1,966,338
|
|
978,326
|
|
|||||
|
Total revenue
|
$
|
9,736,909
|
|
$
|
8,584,031
|
|
$
|
7,192,633
|
|
||
The following table sets forth our tangible long-lived assets by geographic area (in thousands):
|
December 31,
|
|||||||||||
|
2017
|
2016
|
2015
|
|||||||||
|
Long-lived Assets
|
|||||||||||
|
United States
|
$
|
583,236
|
|
$
|
531,425
|
|
$
|
493,300
|
|
||
|
United Kingdom
|
178,021
|
|
159,689
|
|
138,546
|
|
|||||
|
Other countries
|
151,832
|
|
120,462
|
|
64,721
|
|
|||||
|
Total long-lived assets
|
$
|
913,089
|
|
$
|
811,576
|
|
$
|
696,567
|
|
||
The following table sets forth our revenue by product category (in thousands):
|
Year Ended December 31,
|
|||||||||||
|
|
2017
|
2016
(1)
|
2015
(1)
|
||||||||
|
Aftermarket and other new products
|
$
|
7,326,049
|
|
$
|
6,363,706
|
|
$
|
5,005,587
|
|
||
|
Recycled, remanufactured and refurbished products and services
|
1,882,585
|
|
1,780,939
|
|
1,708,364
|
|
|||||
|
Other
|
528,275
|
|
439,386
|
|
478,682
|
|
|||||
|
Total revenue
|
$
|
9,736,909
|
|
$
|
8,584,031
|
|
$
|
7,192,633
|
|
||
|
(1)
|
In the fourth quarter of 2017, we realigned our product categories to differentiate products based on the source of the product. Prior year amounts have been recast to reflect the shift in reporting structure; Aftermarket and other new products decreased by
$77 million
and
$111 million
for the years ended December 31, 2016 and 2015, respectively, with a corresponding increase to recycled, remanufactured and refurbished products and services.
|
Our North America reportable segment generates revenue from all of our product categories, while our Europe and Specialty segments generate revenue primarily from the sale of aftermarket products. Revenue from other sources includes scrap sales, bulk sales to mechanical remanufacturers (including cores) and sales of aluminum ingots and sows from our furnace operations.
101
|
Note 15.
|
Selected Quarterly Data (unaudited)
|
The following table presents unaudited selected quarterly financial data for the two years ended
December 31, 2017
. The operating results for any quarter are not necessarily indicative of the results for any future period.
|
Quarter Ended
|
|||||||||||||||
|
(In thousands, except per share data)
|
Dec. 31
|
Sep. 30
|
Jun. 30
|
Mar. 31
|
|||||||||||
|
2017
|
|||||||||||||||
|
Revenue
|
$
|
2,469,855
|
|
$
|
2,465,800
|
|
$
|
2,458,411
|
|
$
|
2,342,843
|
|
|||
|
Gross margin
|
947,645
|
|
956,876
|
|
965,009
|
|
930,093
|
|
|||||||
|
Operating income
|
167,954
|
|
199,099
|
|
244,573
|
|
235,692
|
|
|||||||
|
Income from continuing operations
|
122,870
|
|
122,381
|
|
150,914
|
|
140,809
|
|
|||||||
|
Net loss from discontinued operations
(1)
|
(2,215
|
)
|
—
|
|
—
|
|
(4,531
|
)
|
|||||||
|
Net loss attributable to noncontrolling interest
|
(3,516
|
)
|
—
|
|
—
|
|
—
|
|
|||||||
|
Net income attributable to LKQ stockholders
|
124,171
|
|
122,381
|
|
150,914
|
|
136,278
|
|
|||||||
|
Basic earnings per share from continuing operations
(2)
|
$
|
0.40
|
|
$
|
0.40
|
|
$
|
0.49
|
|
$
|
0.46
|
|
|||
|
Diluted earnings per share from continuing operations
(2)
|
$
|
0.39
|
|
$
|
0.39
|
|
$
|
0.49
|
|
$
|
0.45
|
|
|||
|
Quarter Ended
(3)
|
|||||||||||||||
|
(In thousands, except per share data)
|
Dec. 31
|
Sep. 30
|
Jun. 30
|
Mar. 31
|
|||||||||||
|
2016
|
|||||||||||||||
|
Revenue
|
$
|
2,150,406
|
|
$
|
2,207,343
|
|
$
|
2,304,806
|
|
$
|
1,921,476
|
|
|||
|
Gross margin
|
830,006
|
|
855,444
|
|
905,816
|
|
760,437
|
|
|||||||
|
Operating income
|
161,880
|
|
183,401
|
|
232,445
|
|
185,672
|
|
|||||||
|
Income from continuing operations
|
96,298
|
|
109,844
|
|
137,810
|
|
112,171
|
|
|||||||
|
Net (loss) income from discontinued operations
(1)
|
(9,967
|
)
|
12,844
|
|
4,975
|
|
—
|
|
|||||||
|
Net income
|
86,331
|
|
122,688
|
|
142,785
|
|
112,171
|
|
|||||||
|
Basic earnings per share from continuing operations
(2)
|
$
|
0.31
|
|
$
|
0.36
|
|
$
|
0.45
|
|
$
|
0.37
|
|
|||
|
Diluted earnings per share from continuing operations
(2)
|
$
|
0.31
|
|
$
|
0.35
|
|
$
|
0.45
|
|
$
|
0.36
|
|
|||
|
(1)
|
In the first quarter of 2017, LKQ completed the sale of the glass manufacturing business of its PGW subsidiary and recorded a loss on sale of
$4 million
and an immaterial loss from discontinued operations, net of tax. During the fourth quarter of 2017, we recorded an additional loss on sale of
$2 million
. The remaining amounts presented represent income (loss) from discontinued operations, net of tax for the periods presented. See Note 3, "Discontinued Operations" for further information regarding the disposal of the glass manufacturing business.
|
|
(2)
|
The sum of the quarters may not equal the total of the respective year's earnings per share on either a basic or diluted basis due to changes in weighted average shares outstanding throughout the year.
|
|
(3)
|
The 2016 amounts presented above include the results of operations of Rhiag, from its acquisition effective March 18, 2016, and PGW, from its acquisition effective April 21, 2016.
|
102
|
Note 16.
|
Condensed Consolidating Financial Information
|
LKQ Corporation (the "Parent") issued, and the Guarantors have fully and unconditionally guaranteed, jointly and severally, the U.S. Notes (2023) due on May 15, 2023. A Guarantor's guarantee will be unconditionally and automatically released and discharged upon the occurrence of any of the following events: (i) a transfer (including as a result of consolidation or merger) by the Guarantor to any person that is not a Guarantor of all or substantially all assets and properties of such Guarantor, provided the Guarantor is also released from its obligations with respect to indebtedness under the Credit Agreement or other indebtedness of ours, which obligation gave rise to the guarantee of the U.S. Notes (2023); (ii) a transfer (including as a result of consolidation or merger) to any person that is not a Guarantor of the equity interests of a Guarantor or issuance by a Guarantor of its equity interests such that the Guarantor ceases to be a subsidiary, as defined in the Indenture, provided the Guarantor is also released from its obligations with respect to indebtedness under the Credit Agreement or other indebtedness of ours, which obligation gave rise to the guarantee of the U.S. Notes (2023); (iii) the release of the Guarantor from its obligations with respect to indebtedness under the Credit Agreement or other indebtedness of ours, which obligation gave rise to the guarantee of the U.S. Notes (2023); and (iv) upon legal defeasance, covenant defeasance or satisfaction and discharge of the Indenture, as defined in the Indenture.
Presented below are the condensed consolidating financial statements of the Parent, the Guarantors, the non-guarantor subsidiaries (the "Non-Guarantors"), and the elimination entries necessary to present our financial statements on a consolidated basis as required by Rule 3-10 of Regulation S-X of the Securities Exchange Act of 1934 resulting from the guarantees of the U.S. Notes (2023). Investments in consolidated subsidiaries have been presented under the equity method of accounting. The principal elimination entries eliminate investments in subsidiaries, intercompany balances, and intercompany revenue and expenses. The condensed consolidating financial statements below have been prepared from our financial information on the same basis of accounting as the consolidated financial statements, and may not necessarily be indicative of the financial position, results of operations or cash flows had the Parent, Guarantors and Non-Guarantors operated as independent entities.
103
|
LKQ CORPORATION AND SUBSIDIARIES
Condensed Consolidating Statements of Income
(In thousands)
|
|||||||||||||||||||
|
Year Ended December 31, 2017
|
|||||||||||||||||||
|
|
Parent
|
Guarantors
|
Non-Guarantors
|
Eliminations
|
Consolidated
|
||||||||||||||
|
Revenue
|
$
|
—
|
|
$
|
5,780,904
|
|
$
|
4,116,161
|
|
$
|
(160,156
|
)
|
$
|
9,736,909
|
|
||||
|
Cost of goods sold
|
—
|
|
3,458,304
|
|
2,639,138
|
|
(160,156
|
)
|
5,937,286
|
|
|||||||||
|
Gross margin
|
—
|
|
2,322,600
|
|
1,477,023
|
|
—
|
|
3,799,623
|
|
|||||||||
|
Facility and warehouse expenses
|
—
|
|
521,596
|
|
275,792
|
|
—
|
|
797,388
|
|
|||||||||
|
Distribution expenses
|
—
|
|
491,082
|
|
293,403
|
|
—
|
|
784,485
|
|
|||||||||
|
Selling, general and administrative expenses
|
29,884
|
|
545,248
|
|
556,082
|
|
—
|
|
1,131,214
|
|
|||||||||
|
Restructuring and acquisition related expenses
|
—
|
|
7,352
|
|
12,320
|
|
—
|
|
19,672
|
|
|||||||||
|
Depreciation and amortization
|
118
|
|
96,717
|
|
122,711
|
|
—
|
|
219,546
|
|
|||||||||
|
Operating (loss) income
|
(30,002
|
)
|
660,605
|
|
216,715
|
|
—
|
|
847,318
|
|
|||||||||
|
Other expense (income):
|
|||||||||||||||||||
|
Interest expense
|
66,030
|
|
546
|
|
35,064
|
|
—
|
|
101,640
|
|
|||||||||
|
Intercompany interest (income) expense, net
|
(17,873
|
)
|
(2,383
|
)
|
20,256
|
|
—
|
|
—
|
|
|||||||||
|
Loss on debt extinguishment
|
456
|
|
—
|
|
—
|
|
—
|
|
456
|
|
|||||||||
|
Gains on bargain purchases
|
—
|
|
—
|
|
(3,870
|
)
|
—
|
|
(3,870
|
)
|
|||||||||
|
Interest and other expense (income), net
|
242
|
|
(14,366
|
)
|
(3,411
|
)
|
—
|
|
(17,535
|
)
|
|||||||||
|
Total other expense (income), net
|
48,855
|
|
(16,203
|
)
|
48,039
|
|
—
|
|
80,691
|
|
|||||||||
|
(Loss) income from continuing operations before provision for income taxes
|
(78,857
|
)
|
676,808
|
|
168,676
|
|
—
|
|
766,627
|
|
|||||||||
|
Provision for income taxes
|
28,684
|
|
168,288
|
|
38,588
|
|
—
|
|
235,560
|
|
|||||||||
|
Equity in earnings of unconsolidated subsidiaries
|
—
|
|
—
|
|
5,907
|
|
—
|
|
5,907
|
|
|||||||||
|
Equity in earnings of subsidiaries
|
648,031
|
|
21,836
|
|
—
|
|
(669,867
|
)
|
—
|
|
|||||||||
|
Income from continuing operations
|
540,490
|
|
530,356
|
|
135,995
|
|
(669,867
|
)
|
536,974
|
|
|||||||||
|
Net (loss) income from discontinued operations
|
(6,746
|
)
|
(6,746
|
)
|
2,050
|
|
4,696
|
|
(6,746
|
)
|
|||||||||
|
Net income
|
533,744
|
|
523,610
|
|
138,045
|
|
(665,171
|
)
|
530,228
|
|
|||||||||
|
Less: net loss attributable to noncontrolling interest
|
—
|
|
—
|
|
(3,516
|
)
|
—
|
|
(3,516
|
)
|
|||||||||
|
Net income attributable to LKQ stockholders
|
$
|
533,744
|
|
$
|
523,610
|
|
$
|
141,561
|
|
$
|
(665,171
|
)
|
$
|
533,744
|
|
||||
104
|
LKQ CORPORATION AND SUBSIDIARIES
Condensed Consolidating Statements of Income
(In thousands)
|
|||||||||||||||||||
|
Year Ended December 31, 2016
|
|||||||||||||||||||
|
|
Parent
|
Guarantors
|
Non-Guarantors
|
Eliminations
|
Consolidated
|
||||||||||||||
|
Revenue
|
$
|
—
|
|
$
|
5,467,430
|
|
$
|
3,301,503
|
|
$
|
(184,902
|
)
|
$
|
8,584,031
|
|
||||
|
Cost of goods sold
|
—
|
|
3,313,503
|
|
2,103,727
|
|
(184,902
|
)
|
5,232,328
|
|
|||||||||
|
Gross margin
|
—
|
|
2,153,927
|
|
1,197,776
|
|
—
|
|
3,351,703
|
|
|||||||||
|
Facility and warehouse expenses
|
—
|
|
475,487
|
|
213,431
|
|
—
|
|
688,918
|
|
|||||||||
|
Distribution expenses
|
—
|
|
453,192
|
|
230,620
|
|
—
|
|
683,812
|
|
|||||||||
|
Selling, general and administrative expenses
|
34,163
|
|
521,909
|
|
430,308
|
|
—
|
|
986,380
|
|
|||||||||
|
Restructuring and acquisition related expenses
|
—
|
|
21,162
|
|
16,600
|
|
—
|
|
37,762
|
|
|||||||||
|
Depreciation and amortization
|
132
|
|
94,165
|
|
97,136
|
|
—
|
|
191,433
|
|
|||||||||
|
Operating (loss) income
|
(34,295
|
)
|
588,012
|
|
209,681
|
|
—
|
|
763,398
|
|
|||||||||
|
Other expense (income):
|
|||||||||||||||||||
|
Interest expense
|
59,415
|
|
547
|
|
28,301
|
|
—
|
|
88,263
|
|
|||||||||
|
Intercompany interest (income) expense, net
|
(27,470
|
)
|
17,124
|
|
10,346
|
|
—
|
|
—
|
|
|||||||||
|
Loss on debt extinguishment
|
2,894
|
|
—
|
|
23,756
|
|
—
|
|
26,650
|
|
|||||||||
|
Gains on foreign exchange contracts - acquisition related
|
(18,342
|
)
|
—
|
|
—
|
|
—
|
|
(18,342
|
)
|
|||||||||
|
Gain on bargain purchase
|
—
|
|
—
|
|
(8,207
|
)
|
—
|
|
(8,207
|
)
|
|||||||||
|
Interest and other expense (income), net
|
470
|
|
(3,773
|
)
|
1,056
|
|
—
|
|
(2,247
|
)
|
|||||||||
|
Total other expense, net
|
16,967
|
|
13,898
|
|
55,252
|
|
—
|
|
86,117
|
|
|||||||||
|
(Loss) income from continuing operations before (benefit) provision for income taxes
|
(51,262
|
)
|
574,114
|
|
154,429
|
|
—
|
|
677,281
|
|
|||||||||
|
(Benefit) provision for income taxes
|
(20,498
|
)
|
213,794
|
|
27,270
|
|
—
|
|
220,566
|
|
|||||||||
|
Equity in (loss) earnings of unconsolidated subsidiaries
|
(795
|
)
|
—
|
|
203
|
|
—
|
|
(592
|
)
|
|||||||||
|
Equity in earnings of subsidiaries
|
487,682
|
|
22,314
|
|
—
|
|
(509,996
|
)
|
—
|
|
|||||||||
|
Income from continuing operations
|
456,123
|
|
382,634
|
|
127,362
|
|
(509,996
|
)
|
456,123
|
|
|||||||||
|
Net income from discontinued operations
|
7,852
|
|
7,852
|
|
3,285
|
|
(11,137
|
)
|
7,852
|
|
|||||||||
|
Net income
|
$
|
463,975
|
|
$
|
390,486
|
|
$
|
130,647
|
|
$
|
(521,133
|
)
|
$
|
463,975
|
|
||||
105
|
LKQ CORPORATION AND SUBSIDIARIES
Condensed Consolidating Statements of Income
(In thousands)
|
|||||||||||||||||||
|
Year Ended December 31, 2015
|
|||||||||||||||||||
|
|
Parent
|
Guarantors
|
Non-Guarantors
|
Eliminations
|
Consolidated
|
||||||||||||||
|
Revenue
|
$
|
—
|
|
$
|
4,965,355
|
|
$
|
2,357,655
|
|
$
|
(130,377
|
)
|
$
|
7,192,633
|
|
||||
|
Cost of goods sold
|
—
|
|
3,010,820
|
|
1,478,661
|
|
(130,377
|
)
|
4,359,104
|
|
|||||||||
|
Gross margin
|
—
|
|
1,954,535
|
|
878,994
|
|
—
|
|
2,833,529
|
|
|||||||||
|
Facility and warehouse expenses
|
—
|
|
408,828
|
|
147,213
|
|
—
|
|
556,041
|
|
|||||||||
|
Distribution expenses
|
—
|
|
408,112
|
|
194,785
|
|
—
|
|
602,897
|
|
|||||||||
|
Selling, general and administrative expenses
|
32,946
|
|
490,530
|
|
304,857
|
|
—
|
|
828,333
|
|
|||||||||
|
Restructuring and acquisition related expenses
|
—
|
|
13,962
|
|
5,549
|
|
—
|
|
19,511
|
|
|||||||||
|
Depreciation and amortization
|
154
|
|
82,058
|
|
39,908
|
|
—
|
|
122,120
|
|
|||||||||
|
Operating (loss) income
|
(33,100
|
)
|
551,045
|
|
186,682
|
|
—
|
|
704,627
|
|
|||||||||
|
Other expense (income):
|
|||||||||||||||||||
|
Interest expense
|
47,626
|
|
669
|
|
9,565
|
|
—
|
|
57,860
|
|
|||||||||
|
Intercompany interest (income) expense, net
|
(41,904
|
)
|
28,944
|
|
12,960
|
|
—
|
|
—
|
|
|||||||||
|
Interest and other expense (income), net
|
99
|
|
(7,414
|
)
|
5,052
|
|
—
|
|
(2,263
|
)
|
|||||||||
|
Total other expense, net
|
5,821
|
|
22,199
|
|
27,577
|
|
—
|
|
55,597
|
|
|||||||||
|
(Loss) income from continuing operations before (benefit) provision for income taxes
|
(38,921
|
)
|
528,846
|
|
159,105
|
|
—
|
|
649,030
|
|
|||||||||
|
(Benefit) provision for income taxes
|
(16,054
|
)
|
205,176
|
|
30,581
|
|
—
|
|
219,703
|
|
|||||||||
|
Equity in (loss) earnings of unconsolidated subsidiaries
|
(1,000
|
)
|
59
|
|
(5,163
|
)
|
—
|
|
(6,104
|
)
|
|||||||||
|
Equity in earnings of subsidiaries
|
447,090
|
|
24,632
|
|
—
|
|
(471,722
|
)
|
—
|
|
|||||||||
|
Net income
|
$
|
423,223
|
|
$
|
348,361
|
|
$
|
123,361
|
|
$
|
(471,722
|
)
|
$
|
423,223
|
|
||||
106
|
LKQ CORPORATION AND SUBSIDIARIES
Condensed Consolidating Statements of Comprehensive Income
(In thousands)
|
|||||||||||||||||||
|
Year Ended December 31, 2017
|
|||||||||||||||||||
|
|
Parent
|
Guarantors
|
Non-Guarantors
|
Eliminations
|
Consolidated
|
||||||||||||||
|
Net income
|
$
|
533,744
|
|
$
|
523,610
|
|
$
|
138,045
|
|
$
|
(665,171
|
)
|
$
|
530,228
|
|
||||
|
Less: net loss attributable to noncontrolling interest
|
—
|
|
—
|
|
(3,516
|
)
|
—
|
|
(3,516
|
)
|
|||||||||
|
Net income attributable to LKQ stockholders
|
533,744
|
|
523,610
|
|
141,561
|
|
(665,171
|
)
|
533,744
|
|
|||||||||
|
Other comprehensive income (loss):
|
|||||||||||||||||||
|
Foreign currency translation, net of tax
|
200,596
|
|
16,743
|
|
206,049
|
|
(222,792
|
)
|
200,596
|
|
|||||||||
|
Net change in unrecognized gains/losses on derivative instruments, net of tax
|
3,447
|
|
(133
|
)
|
—
|
|
133
|
|
3,447
|
|
|||||||||
|
Net change in unrealized gains/losses on pension plans, net of tax
|
(6,035
|
)
|
(3,254
|
)
|
(2,781
|
)
|
6,035
|
|
(6,035
|
)
|
|||||||||
|
Net change in other comprehensive loss from unconsolidated subsidiaries
|
(1,309
|
)
|
—
|
|
(1,309
|
)
|
1,309
|
|
(1,309
|
)
|
|||||||||
|
Other comprehensive income
|
196,699
|
|
13,356
|
|
201,959
|
|
(215,315
|
)
|
196,699
|
|
|||||||||
|
|
|
||||||||||||||||||
|
Comprehensive income
|
730,443
|
|
536,966
|
|
340,004
|
|
(880,486
|
)
|
726,927
|
|
|||||||||
|
Less: comprehensive loss attributable to noncontrolling interest
|
—
|
|
—
|
|
(3,516
|
)
|
—
|
|
(3,516
|
)
|
|||||||||
|
Comprehensive income attributable to LKQ stockholders
|
$
|
730,443
|
|
$
|
536,966
|
|
$
|
343,520
|
|
$
|
(880,486
|
)
|
$
|
730,443
|
|
||||
|
LKQ CORPORATION AND SUBSIDIARIES
Condensed Consolidating Statements of Comprehensive Income
(In thousands)
|
|||||||||||||||||||
|
Year Ended December 31, 2016
|
|||||||||||||||||||
|
|
Parent
|
Guarantors
|
Non-Guarantors
|
Eliminations
|
Consolidated
|
||||||||||||||
|
Net income
|
$
|
463,975
|
|
$
|
390,486
|
|
$
|
130,647
|
|
$
|
(521,133
|
)
|
$
|
463,975
|
|
||||
|
Other comprehensive (loss) income:
|
|||||||||||||||||||
|
Foreign currency translation, net of tax
|
(175,639
|
)
|
(48,914
|
)
|
(177,911
|
)
|
226,825
|
|
(175,639
|
)
|
|||||||||
|
Net change in unrecognized gains/losses on derivative instruments, net of tax
|
9,023
|
|
133
|
|
389
|
|
(522
|
)
|
9,023
|
|
|||||||||
|
Net change in unrealized gains/losses on pension plans, net of tax
|
4,911
|
|
3,962
|
|
1,061
|
|
(5,023
|
)
|
4,911
|
|
|||||||||
|
Other comprehensive loss
|
(161,705
|
)
|
(44,819
|
)
|
(176,461
|
)
|
221,280
|
|
(161,705
|
)
|
|||||||||
|
Total comprehensive income (loss)
|
$
|
302,270
|
|
$
|
345,667
|
|
$
|
(45,814
|
)
|
$
|
(299,853
|
)
|
$
|
302,270
|
|
||||
107
|
LKQ CORPORATION AND SUBSIDIARIES
Condensed Consolidating Statements of Comprehensive Income
(In thousands)
|
|||||||||||||||||||
|
Year Ended December 31, 2015
|
|||||||||||||||||||
|
|
Parent
|
Guarantors
|
Non-Guarantors
|
Eliminations
|
Consolidated
|
||||||||||||||
|
Net income
|
$
|
423,223
|
|
$
|
348,361
|
|
$
|
123,361
|
|
$
|
(471,722
|
)
|
$
|
423,223
|
|
||||
|
Other comprehensive (loss) income:
|
|||||||||||||||||||
|
Foreign currency translation, net of tax
|
(69,817
|
)
|
(20,359
|
)
|
(65,878
|
)
|
86,237
|
|
(69,817
|
)
|
|||||||||
|
Net change in unrecognized gains/losses on derivative instruments, net of tax
|
2,469
|
|
—
|
|
294
|
|
(294
|
)
|
2,469
|
|
|||||||||
|
Net change in unrealized gains/losses on pension plans, net of tax
|
2,103
|
|
—
|
|
2,103
|
|
(2,103
|
)
|
2,103
|
|
|||||||||
|
Other comprehensive loss
|
(65,245
|
)
|
(20,359
|
)
|
(63,481
|
)
|
83,840
|
|
(65,245
|
)
|
|||||||||
|
Total comprehensive income
|
$
|
357,978
|
|
$
|
328,002
|
|
$
|
59,880
|
|
$
|
(387,882
|
)
|
$
|
357,978
|
|
||||
108
|
LKQ CORPORATION AND SUBSIDIARIES
Condensed Consolidating Balance Sheets
(In thousands)
|
|||||||||||||||||||
|
December 31, 2017
|
|||||||||||||||||||
|
Parent
|
Guarantors
|
Non-Guarantors
|
Eliminations
|
Consolidated
|
|||||||||||||||
|
Assets
|
|||||||||||||||||||
|
Current assets:
|
|||||||||||||||||||
|
Cash and cash equivalents
|
$
|
34,360
|
|
$
|
35,131
|
|
$
|
210,275
|
|
$
|
—
|
|
$
|
279,766
|
|
||||
|
Receivables, net
|
—
|
|
290,958
|
|
736,148
|
|
—
|
|
1,027,106
|
|
|||||||||
|
Intercompany receivables, net
|
2,669
|
|
3,010
|
|
230
|
|
(5,909
|
)
|
—
|
|
|||||||||
|
Inventories
|
—
|
|
1,334,766
|
|
1,046,017
|
|
—
|
|
2,380,783
|
|
|||||||||
|
Prepaid expenses and other current assets
|
34,136
|
|
44,849
|
|
55,494
|
|
—
|
|
134,479
|
|
|||||||||
|
Total current assets
|
71,165
|
|
1,708,714
|
|
2,048,164
|
|
(5,909
|
)
|
3,822,134
|
|
|||||||||
|
Property, plant and equipment, net
|
910
|
|
563,262
|
|
348,917
|
|
—
|
|
913,089
|
|
|||||||||
|
Intangible assets:
|
|||||||||||||||||||
|
Goodwill
|
—
|
|
2,010,209
|
|
1,526,302
|
|
—
|
|
3,536,511
|
|
|||||||||
|
Other intangibles, net
|
—
|
|
291,036
|
|
452,733
|
|
—
|
|
743,769
|
|
|||||||||
|
Investment in subsidiaries
|
5,952,687
|
|
102,931
|
|
—
|
|
(6,055,618
|
)
|
—
|
|
|||||||||
|
Intercompany notes receivable
|
1,156,550
|
|
782,638
|
|
—
|
|
(1,939,188
|
)
|
—
|
|
|||||||||
|
Equity method investments
|
—
|
|
336
|
|
208,068
|
|
—
|
|
208,404
|
|
|||||||||
|
Other assets
|
70,590
|
|
33,597
|
|
38,778
|
|
—
|
|
142,965
|
|
|||||||||
|
Total assets
|
$
|
7,251,902
|
|
$
|
5,492,723
|
|
$
|
4,622,962
|
|
$
|
(8,000,715
|
)
|
$
|
9,366,872
|
|
||||
|
Liabilities and Stockholders’ Equity
|
|||||||||||||||||||
|
Current liabilities:
|
|||||||||||||||||||
|
Accounts payable
|
$
|
5,742
|
|
$
|
340,951
|
|
$
|
441,920
|
|
$
|
—
|
|
$
|
788,613
|
|
||||
|
Intercompany payables, net
|
—
|
|
230
|
|
5,679
|
|
(5,909
|
)
|
—
|
|
|||||||||
|
Accrued expenses:
|
|||||||||||||||||||
|
Accrued payroll-related liabilities
|
9,448
|
|
65,811
|
|
68,165
|
|
—
|
|
143,424
|
|
|||||||||
|
Other accrued expenses
|
5,219
|
|
95,900
|
|
117,481
|
|
—
|
|
218,600
|
|
|||||||||
|
Other current liabilities
|
282
|
|
27,066
|
|
18,379
|
|
—
|
|
45,727
|
|
|||||||||
|
Current portion of long-term obligations
|
16,468
|
|
1,912
|
|
107,980
|
|
—
|
|
126,360
|
|
|||||||||
|
Total current liabilities
|
37,159
|
|
531,870
|
|
759,604
|
|
(5,909
|
)
|
1,322,724
|
|
|||||||||
|
Long-term obligations, excluding current portion
|
2,095,826
|
|
7,372
|
|
1,174,422
|
|
—
|
|
3,277,620
|
|
|||||||||
|
Intercompany notes payable
|
750,000
|
|
677,708
|
|
511,480
|
|
(1,939,188
|
)
|
—
|
|
|||||||||
|
Deferred income taxes
|
12,402
|
|
116,021
|
|
123,936
|
|
—
|
|
252,359
|
|
|||||||||
|
Other noncurrent liabilities
|
158,346
|
|
101,189
|
|
47,981
|
|
—
|
|
307,516
|
|
|||||||||
|
Stockholders' equity:
|
|||||||||||||||||||
|
Total Company stockholders’ equity
|
4,198,169
|
|
4,058,563
|
|
1,997,055
|
|
(6,055,618
|
)
|
4,198,169
|
|
|||||||||
|
Noncontrolling interest
|
—
|
|
—
|
|
8,484
|
|
—
|
|
8,484
|
|
|||||||||
|
Total stockholders’ equity
|
4,198,169
|
|
4,058,563
|
|
2,005,539
|
|
(6,055,618
|
)
|
4,206,653
|
|
|||||||||
|
Total liabilities and stockholders' equity
|
$
|
7,251,902
|
|
$
|
5,492,723
|
|
$
|
4,622,962
|
|
$
|
(8,000,715
|
)
|
$
|
9,366,872
|
|
||||
109
|
LKQ CORPORATION AND SUBSIDIARIES
Condensed Consolidating Balance Sheets
(In thousands)
|
|||||||||||||||||||
|
December 31, 2016
|
|||||||||||||||||||
|
Parent
|
Guarantors
|
Non-Guarantors
|
Eliminations
|
Consolidated
|
|||||||||||||||
|
Assets
|
|||||||||||||||||||
|
Current assets:
|
|||||||||||||||||||
|
Cash and cash equivalents
|
$
|
33,030
|
|
$
|
35,360
|
|
$
|
159,010
|
|
$
|
—
|
|
$
|
227,400
|
|
||||
|
Receivables, net
|
—
|
|
248,188
|
|
612,361
|
|
—
|
|
860,549
|
|
|||||||||
|
Intercompany receivables, net
|
2,805
|
|
11,237
|
|
8,837
|
|
(22,879
|
)
|
—
|
|
|||||||||
|
Inventories
|
—
|
|
1,149,763
|
|
785,474
|
|
—
|
|
1,935,237
|
|
|||||||||
|
Prepaid expenses and other current assets
|
1,640
|
|
43,165
|
|
42,963
|
|
—
|
|
87,768
|
|
|||||||||
|
Assets of discontinued operations
|
—
|
|
357,788
|
|
98,852
|
|
—
|
|
456,640
|
|
|||||||||
|
Total current assets
|
37,475
|
|
1,845,501
|
|
1,707,497
|
|
(22,879
|
)
|
3,567,594
|
|
|||||||||
|
Property, plant
and equipment, net
|
239
|
|
527,705
|
|
283,632
|
|
—
|
|
811,576
|
|
|||||||||
|
Intangible assets:
|
|||||||||||||||||||
|
Goodwill
|
—
|
|
1,851,274
|
|
1,203,495
|
|
—
|
|
3,054,769
|
|
|||||||||
|
Other intangibles, net
|
—
|
|
153,689
|
|
430,542
|
|
—
|
|
584,231
|
|
|||||||||
|
Investment in subsidiaries
|
5,067,297
|
|
242,032
|
|
—
|
|
(5,309,329
|
)
|
—
|
|
|||||||||
|
Intercompany notes receivable
|
1,510,534
|
|
800,283
|
|
—
|
|
(2,310,817
|
)
|
—
|
|
|||||||||
|
Equity method investments
|
—
|
|
336
|
|
183,131
|
|
—
|
|
183,467
|
|
|||||||||
|
Other assets
|
59,726
|
|
25,177
|
|
22,347
|
|
(5,688
|
)
|
101,562
|
|
|||||||||
|
Total assets
|
$
|
6,675,271
|
|
$
|
5,445,997
|
|
$
|
3,830,644
|
|
$
|
(7,648,713
|
)
|
$
|
8,303,199
|
|
||||
|
Liabilities and Stockholders’ Equity
|
|||||||||||||||||||
|
Current liabilities:
|
|||||||||||||||||||
|
Accounts payable
|
$
|
1,309
|
|
$
|
244,074
|
|
$
|
388,390
|
|
$
|
—
|
|
$
|
633,773
|
|
||||
|
Intercompany payables, net
|
11,237
|
|
8,837
|
|
2,805
|
|
(22,879
|
)
|
—
|
|
|||||||||
|
Accrued expenses:
|
|||||||||||||||||||
|
Accrued payroll-related liabilities
|
6,404
|
|
58,187
|
|
54,164
|
|
—
|
|
118,755
|
|
|||||||||
|
Other accrued expenses
|
5,502
|
|
94,287
|
|
109,312
|
|
—
|
|
209,101
|
|
|||||||||
|
Other current liabilities
|
4,283
|
|
18,456
|
|
15,204
|
|
—
|
|
37,943
|
|
|||||||||
|
Current portion of long-term obligations
|
37,710
|
|
1,097
|
|
27,302
|
|
—
|
|
66,109
|
|
|||||||||
|
Liabilities of discontinued operations
|
—
|
|
110,890
|
|
34,214
|
|
—
|
|
145,104
|
|
|||||||||
|
Total current liabilities
|
66,445
|
|
535,828
|
|
631,391
|
|
(22,879
|
)
|
1,210,785
|
|
|||||||||
|
Long-term obligations, excluding current portion
|
2,371,578
|
|
8,356
|
|
895,728
|
|
—
|
|
3,275,662
|
|
|||||||||
|
Intercompany notes payable
|
750,000
|
|
1,074,218
|
|
486,599
|
|
(2,310,817
|
)
|
—
|
|
|||||||||
|
Deferred income taxes
|
—
|
|
95,765
|
|
109,580
|
|
(5,688
|
)
|
199,657
|
|
|||||||||
|
Other noncurrent liabilities
|
44,299
|
|
90,722
|
|
39,125
|
|
—
|
|
174,146
|
|
|||||||||
|
Total stockholders’ equity
|
3,442,949
|
|
3,641,108
|
|
1,668,221
|
|
(5,309,329
|
)
|
3,442,949
|
|
|||||||||
|
Total liabilities and stockholders' equity
|
$
|
6,675,271
|
|
$
|
5,445,997
|
|
$
|
3,830,644
|
|
$
|
(7,648,713
|
)
|
$
|
8,303,199
|
|
||||
110
|
LKQ CORPORATION AND SUBSIDIARIES
Condensed Consolidating Statements of Cash Flows
(In thousands)
|
|||||||||||||||||||
|
Year Ended December 31, 2017
|
|||||||||||||||||||
|
|
Parent
|
Guarantors
|
Non-Guarantors
|
Eliminations
|
Consolidated
|
||||||||||||||
|
CASH FLOWS FROM OPERATING ACTIVITIES:
|
|||||||||||||||||||
|
Net cash provided by operating activities
|
$
|
243,011
|
|
$
|
481,384
|
|
$
|
95,617
|
|
$
|
(301,112
|
)
|
$
|
518,900
|
|
||||
|
CASH FLOWS FROM INVESTING ACTIVITIES:
|
|||||||||||||||||||
|
Purchases of property, plant and equipment
|
(648
|
)
|
(87,102
|
)
|
(91,340
|
)
|
—
|
|
(179,090
|
)
|
|||||||||
|
Investment and intercompany note activity with subsidiaries
|
57,735
|
|
—
|
|
—
|
|
(57,735
|
)
|
—
|
|
|||||||||
|
Acquisitions, net of cash acquired
|
—
|
|
(335,582
|
)
|
(177,506
|
)
|
—
|
|
(513,088
|
)
|
|||||||||
|
Proceeds from disposals of business/investment
|
—
|
|
305,740
|
|
(4,443
|
)
|
—
|
|
301,297
|
|
|||||||||
|
Investments in unconsolidated subsidiaries
|
—
|
|
(2,750
|
)
|
(4,914
|
)
|
—
|
|
(7,664
|
)
|
|||||||||
|
Other investing activities, net
|
—
|
|
6,490
|
|
7,460
|
|
—
|
|
13,950
|
|
|||||||||
|
Net cash provided by (used in) investing activities
|
57,087
|
|
(113,204
|
)
|
(270,743
|
)
|
(57,735
|
)
|
(384,595
|
)
|
|||||||||
|
CASH FLOWS FROM FINANCING ACTIVITIES:
|
|||||||||||||||||||
|
Proceeds from exercise of stock options
|
7,470
|
|
—
|
|
—
|
|
—
|
|
7,470
|
|
|||||||||
|
Taxes paid related to net share settlements of stock-based compensation awards
|
(5,525
|
)
|
—
|
|
—
|
|
—
|
|
(5,525
|
)
|
|||||||||
|
Debt issuance costs
|
(4,267
|
)
|
—
|
|
—
|
|
—
|
|
(4,267
|
)
|
|||||||||
|
Borrowings under revolving credit facilities
|
558,000
|
|
—
|
|
281,171
|
|
—
|
|
839,171
|
|
|||||||||
|
Repayments under revolving credit facilities
|
(824,862
|
)
|
—
|
|
(121,615
|
)
|
—
|
|
(946,477
|
)
|
|||||||||
|
Repayments under term loans
|
(27,884
|
)
|
—
|
|
—
|
|
—
|
|
(27,884
|
)
|
|||||||||
|
Borrowings under receivables securitization facility
|
—
|
|
—
|
|
11,245
|
|
—
|
|
11,245
|
|
|||||||||
|
Repayments under receivables securitization facility
|
—
|
|
—
|
|
(11,245
|
)
|
—
|
|
(11,245
|
)
|
|||||||||
|
(Repayments) borrowings of other debt, net
|
(1,700
|
)
|
(1,318
|
)
|
22,724
|
|
—
|
|
19,706
|
|
|||||||||
|
Payments of other obligations
|
—
|
|
(1,336
|
)
|
(741
|
)
|
—
|
|
(2,077
|
)
|
|||||||||
|
Investment and intercompany note activity with parent
|
—
|
|
(65,498
|
)
|
7,763
|
|
57,735
|
|
—
|
|
|||||||||
|
Dividends
|
—
|
|
(301,112
|
)
|
—
|
|
301,112
|
|
—
|
|
|||||||||
|
Other financing activities, net
|
—
|
|
—
|
|
7,316
|
|
—
|
|
7,316
|
|
|||||||||
|
Net cash (used in) provided by financing activities
|
(298,768
|
)
|
(369,264
|
)
|
196,618
|
|
358,847
|
|
(112,567
|
)
|
|||||||||
|
Effect of exchange rate changes on cash and cash equivalents
|
—
|
|
706
|
|
22,806
|
|
—
|
|
23,512
|
|
|||||||||
|
Net increase (decrease) in cash and cash equivalents
|
1,330
|
|
(378
|
)
|
44,298
|
|
—
|
|
45,250
|
|
|||||||||
|
Cash and cash equivalents of continuing operations, beginning of period
|
33,030
|
|
35,360
|
|
159,010
|
|
—
|
|
227,400
|
|
|||||||||
|
Add: Cash and cash equivalents of discontinued operations, beginning of period
|
—
|
|
149
|
|
6,967
|
|
—
|
|
7,116
|
|
|||||||||
|
Cash and cash equivalents of continuing and discontinued operations, beginning of period
|
33,030
|
|
35,509
|
|
165,977
|
|
—
|
|
234,516
|
|
|||||||||
|
Cash and cash equivalents, end of period
|
$
|
34,360
|
|
$
|
35,131
|
|
$
|
210,275
|
|
$
|
—
|
|
$
|
279,766
|
|
||||
111
|
LKQ CORPORATION AND SUBSIDIARIES
Condensed Consolidating Statements of Cash Flows
(In thousands)
|
|||||||||||||||||||
|
Year Ended December 31, 2016
|
|||||||||||||||||||
|
|
Parent
|
Guarantors
|
Non-Guarantors
|
Eliminations
|
Consolidated
|
||||||||||||||
|
CASH FLOWS FROM OPERATING ACTIVITIES:
|
|||||||||||||||||||
|
Net cash provided by operating activities
|
$
|
308,299
|
|
$
|
539,318
|
|
$
|
99,894
|
|
$
|
(312,497
|
)
|
$
|
635,014
|
|
||||
|
CASH FLOWS FROM INVESTING ACTIVITIES:
|
|||||||||||||||||||
|
Purchases of property, plant and equipment
|
(36
|
)
|
(120,761
|
)
|
(86,277
|
)
|
—
|
|
(207,074
|
)
|
|||||||||
|
Investment and intercompany note activity with subsidiaries
|
(1,720,732
|
)
|
—
|
|
—
|
|
1,720,732
|
|
—
|
|
|||||||||
|
Acquisitions, net of cash acquired
|
—
|
|
(685,278
|
)
|
(664,061
|
)
|
—
|
|
(1,349,339
|
)
|
|||||||||
|
Proceeds from disposal of business/investment
|
—
|
|
—
|
|
10,304
|
|
—
|
|
10,304
|
|
|||||||||
|
Investments in unconsolidated subsidiaries
|
—
|
|
(4,400
|
)
|
(181,271
|
)
|
—
|
|
(185,671
|
)
|
|||||||||
|
Proceeds from foreign exchange contracts
|
18,342
|
|
—
|
|
—
|
|
—
|
|
18,342
|
|
|||||||||
|
Other investing activities, net
|
3
|
|
1,953
|
|
1,554
|
|
—
|
|
3,510
|
|
|||||||||
|
Net cash used in investing activities
|
(1,702,423
|
)
|
(808,486
|
)
|
(919,751
|
)
|
1,720,732
|
|
(1,709,928
|
)
|
|||||||||
|
CASH FLOWS FROM FINANCING ACTIVITIES:
|
|||||||||||||||||||
|
Proceeds from exercise of stock options
|
7,963
|
|
—
|
|
—
|
|
—
|
|
7,963
|
|
|||||||||
|
Taxes paid related to net share settlements of stock-based compensation awards
|
(4,438
|
)
|
—
|
|
—
|
|
—
|
|
(4,438
|
)
|
|||||||||
|
Debt issuance costs
|
(7,104
|
)
|
—
|
|
(9,450
|
)
|
—
|
|
(16,554
|
)
|
|||||||||
|
Proceeds from issuance of Euro Notes (2024)
|
—
|
|
—
|
|
563,450
|
|
—
|
|
563,450
|
|
|||||||||
|
Borrowings under revolving credit facilities
|
1,744,408
|
|
—
|
|
892,188
|
|
—
|
|
2,636,596
|
|
|||||||||
|
Repayments under revolving credit facilities
|
(654,000
|
)
|
—
|
|
(1,094,664
|
)
|
—
|
|
(1,748,664
|
)
|
|||||||||
|
Borrowings under term loans
|
332,954
|
|
—
|
|
249,161
|
|
—
|
|
582,115
|
|
|||||||||
|
Repayments under term loans
|
(10,898
|
)
|
—
|
|
(244,894
|
)
|
—
|
|
(255,792
|
)
|
|||||||||
|
Borrowings under receivables securitization facility
|
—
|
|
—
|
|
106,400
|
|
—
|
|
106,400
|
|
|||||||||
|
Repayments under receivables securitization facility
|
—
|
|
—
|
|
(69,400
|
)
|
—
|
|
(69,400
|
)
|
|||||||||
|
Borrowings (repayments) of other debt, net
|
653
|
|
(2,935
|
)
|
(28,874
|
)
|
—
|
|
(31,156
|
)
|
|||||||||
|
Payments of Rhiag debt and related payments
|
—
|
|
—
|
|
(543,347
|
)
|
—
|
|
(543,347
|
)
|
|||||||||
|
Payments of other obligations
|
—
|
|
(1,436
|
)
|
|
|
—
|
|
(1,436
|
)
|
|||||||||
|
Investment and intercompany note activity with parent
|
—
|
|
608,270
|
|
1,112,462
|
|
(1,720,732
|
)
|
—
|
|
|||||||||
|
Dividends
|
—
|
|
(312,497
|
)
|
—
|
|
312,497
|
|
—
|
|
|||||||||
|
Net cash provided by financing activities
|
1,409,538
|
|
291,402
|
|
933,032
|
|
(1,408,235
|
)
|
1,225,737
|
|
|||||||||
|
Effect of exchange rate changes on cash and cash equivalents
|
—
|
|
(157
|
)
|
(3,547
|
)
|
—
|
|
(3,704
|
)
|
|||||||||
|
Net increase in cash and cash equivalents
|
15,414
|
|
22,077
|
|
109,628
|
|
—
|
|
147,119
|
|
|||||||||
|
Cash and cash equivalents of continuing operations, beginning of period
|
17,616
|
|
13,432
|
|
56,349
|
|
—
|
|
87,397
|
|
|||||||||
|
Cash and cash equivalents of continuing and discontinued operations, end of period
|
33,030
|
|
35,509
|
|
165,977
|
|
—
|
|
234,516
|
|
|||||||||
|
Less: Cash and cash equivalents of discontinued operations, end of period
|
—
|
|
(149
|
)
|
(6,967
|
)
|
—
|
|
(7,116
|
)
|
|||||||||
|
Cash and cash equivalents, end of period
|
$
|
33,030
|
|
$
|
35,360
|
|
$
|
159,010
|
|
$
|
—
|
|
$
|
227,400
|
|
||||
112
|
LKQ CORPORATION AND SUBSIDIARIES
Condensed Consolidating Statements of Cash Flows
(In thousands)
|
|||||||||||||||||||
|
Year Ended December 31, 2015
|
|||||||||||||||||||
|
|
Parent
|
Guarantors
|
Non-Guarantors
|
Eliminations
|
Consolidated
|
||||||||||||||
|
CASH FLOWS FROM OPERATING ACTIVITIES:
|
|||||||||||||||||||
|
Net cash provided by operating activities
|
$
|
262,812
|
|
$
|
393,422
|
|
$
|
136,361
|
|
$
|
(248,313
|
)
|
$
|
544,282
|
|
||||
|
CASH FLOWS FROM INVESTING ACTIVITIES:
|
|||||||||||||||||||
|
Purchases of property and equipment
|
(1
|
)
|
(85,868
|
)
|
(84,621
|
)
|
—
|
|
(170,490
|
)
|
|||||||||
|
Investment and intercompany note activity with subsidiaries
|
(66,712
|
)
|
—
|
|
—
|
|
66,712
|
|
—
|
|
|||||||||
|
Acquisitions, net of cash acquired
|
—
|
|
(118,963
|
)
|
(41,554
|
)
|
—
|
|
(160,517
|
)
|
|||||||||
|
Other investing activities, net
|
—
|
|
5,446
|
|
(4,432
|
)
|
—
|
|
1,014
|
|
|||||||||
|
Net cash used in investing activities
|
(66,713
|
)
|
(199,385
|
)
|
(130,607
|
)
|
66,712
|
|
(329,993
|
)
|
|||||||||
|
CASH FLOWS FROM FINANCING ACTIVITIES:
|
|||||||||||||||||||
|
Proceeds from exercise of stock options
|
8,168
|
|
—
|
|
—
|
|
—
|
|
8,168
|
|
|||||||||
|
Taxes paid related to net share settlements of stock-based compensation awards
|
(7,581
|
)
|
—
|
|
—
|
|
—
|
|
(7,581
|
)
|
|||||||||
|
Debt issuance costs
|
—
|
|
—
|
|
(97
|
)
|
—
|
|
(97
|
)
|
|||||||||
|
Borrowings under revolving credit facilities
|
212,000
|
|
—
|
|
101,142
|
|
—
|
|
313,142
|
|
|||||||||
|
Repayments under revolving credit facilities
|
(352,000
|
)
|
—
|
|
(93,282
|
)
|
—
|
|
(445,282
|
)
|
|||||||||
|
Repayments under term loans
|
(22,500
|
)
|
—
|
|
—
|
|
—
|
|
(22,500
|
)
|
|||||||||
|
Borrowings under receivables securitization facility
|
—
|
|
—
|
|
3,858
|
|
—
|
|
3,858
|
|
|||||||||
|
Repayments under receivables securitization facility
|
—
|
|
—
|
|
(35,758
|
)
|
—
|
|
(35,758
|
)
|
|||||||||
|
Repayments (borrowings) of other debt, net
|
(31,500
|
)
|
(3,457
|
)
|
5,261
|
|
—
|
|
(29,696
|
)
|
|||||||||
|
Payments of other obligations
|
—
|
|
(21,896
|
)
|
(895
|
)
|
—
|
|
(22,791
|
)
|
|||||||||
|
Investment and intercompany note activity with parent
|
—
|
|
60,910
|
|
5,802
|
|
(66,712
|
)
|
—
|
|
|||||||||
|
Dividends
|
—
|
|
(248,313
|
)
|
—
|
|
248,313
|
|
—
|
|
|||||||||
|
Net cash used in financing activities
|
(193,413
|
)
|
(212,756
|
)
|
(13,969
|
)
|
181,601
|
|
(238,537
|
)
|
|||||||||
|
Effect of exchange rate changes on cash and cash equivalents
|
—
|
|
48
|
|
(3,008
|
)
|
—
|
|
(2,960
|
)
|
|||||||||
|
Net increase (decrease) in cash and cash equivalents
|
2,686
|
|
(18,671
|
)
|
(11,223
|
)
|
—
|
|
(27,208
|
)
|
|||||||||
|
Cash and cash equivalents, beginning of period
|
14,930
|
|
32,103
|
|
67,572
|
|
—
|
|
114,605
|
|
|||||||||
|
Cash and cash equivalents, end of period
|
$
|
17,616
|
|
$
|
13,432
|
|
$
|
56,349
|
|
$
|
—
|
|
$
|
87,397
|
|
||||
113
|
ITEM 9.
|
CHANGES IN AND DISAGREEMENTS WITH ACCOUNTANTS ON ACCOUNTING AND FINANCIAL DISCLOSURE
|
None.
Evaluation of Disclosure Controls and Procedures
As of
December 31, 2017
, the end of the period covered by this report, an evaluation was carried out under the supervision and with the participation of LKQ Corporation's management, including our Chief Executive Officer and our Chief Financial Officer, of our "disclosure controls and procedures" (as defined in Rule 13a-15(e) under the Securities Exchange Act of 1934). Based upon that evaluation, our Chief Executive Officer and Chief Financial Officer concluded that the Company's disclosure controls and procedures were effective to ensure that information required to be disclosed in the reports we file with the Securities and Exchange Commission ("SEC") is recorded, processed, summarized and reported within the time periods specified in the SEC’s rules and forms and that information required to be disclosed is accumulated and communicated to the Company’s management, including our Chief Executive Officer and Chief Financial Officer, as appropriate to allow timely decisions regarding required disclosure.
Report of Management on Internal Control over Financial Reporting dated
February 27, 2018
Management of LKQ Corporation and subsidiaries (the "Company") is responsible for establishing and maintaining adequate internal control over financial reporting as defined in Rules 13a-15(f) and 15d-15(f) under the Securities Exchange Act of 1934. The Company's internal control over financial reporting is a process designed to provide reasonable assurance regarding the reliability of financial reporting and the preparation of financial statements for external purposes in accordance with accounting principles generally accepted in the United States. Internal control over financial reporting includes those policies and procedures that (i) pertain to the maintenance of records that, in reasonable detail, accurately and fairly reflect the transactions and dispositions of the assets of the Company, (ii) provide reasonable assurance that transactions are recorded as necessary to permit preparation of financial statements in accordance with generally accepted accounting principles, and that receipts and expenditures of the Company are being made only in accordance with authorizations of management and directors of the Company, and (iii) provide reasonable assurance regarding prevention or timely detection of unauthorized acquisition, use, or disposition of the Company's assets that could have a material effect on the Company's financial statements.
We have excluded from our assessment the internal control over financial reporting at the following businesses, which were acquired during 2017: aftermarket parts distribution businesses in Belgium and Poland, Warn Industries, Inc. and a wholesale business in North America. The financial statements of these businesses constitute 13% and 8% of net and total assets, respectively, 2% of revenue, and less than 1% of net income of the consolidated financial statement amounts as of and for the year ended December 31, 2017.
Internal control over financial reporting includes the controls themselves, monitoring and internal auditing practices, and actions taken to correct deficiencies as identified. Because of its inherent limitations, internal control over financial reporting may not prevent or detect misstatements. Also, projections of any evaluation of effectiveness to future periods are subject to the risk that controls may become inadequate because of changes in conditions or that the degree of compliance with the policies or procedures may deteriorate.
Management assessed the effectiveness of the Company's internal control over financial reporting as of
December 31, 2017
. Management based this assessment on criteria for effective internal control over financial reporting described in
Internal Control—Integrated Framework (2013)
issued by the Committee of Sponsoring Organizations of the Treadway Commission. Management's assessment included an evaluation of the design of the Company's internal control over financial reporting and testing of the operational effectiveness of its internal control over financial reporting. Management reviewed the results of its assessment with the Audit Committee of the Company's Board of Directors.
Based on this assessment, management determined that, as of
December 31, 2017
, the Company maintained effective internal control over financial reporting. Deloitte & Touche LLP, independent registered public accounting firm, who audited and reported on the consolidated financial statements of the Company included in this report, has issued an attestation report on the effectiveness of our internal control over financial reporting as of
December 31, 2017
.
Changes in Internal Control over Financial Reporting
There was no change in the Company’s internal control over financial reporting that occurred during the Company’s most recently completed fiscal quarter that has materially affected, or is reasonably likely to materially affect, the Company’s internal control over financial reporting.
114
REPORT OF INDEPENDENT REGISTERED PUBLIC ACCOUNTING FIRM
To the Board of Directors and stockholders of LKQ Corporation:
Opinion on Internal Control over Financial Reporting
We have audited the internal control over financial reporting of LKQ Corporation and subsidiaries (the “Company”) as of December 31, 2017, based on criteria established in
Internal Control - Integrated Framework (2013)
issued by the Committee of Sponsoring Organizations of the Treadway Commission (COSO). In our opinion, the Company maintained, in all material respects, effective internal control over financial reporting as of December 31, 2017, based on criteria established in
Internal Control - Integrated Framework (2013)
issued by COSO.
We have also audited, in accordance with the standards of the Public Company Accounting Oversight Board (United States) (PCAOB), the consolidated financial statements as of and for the year ended December 31, 2017, of the Company and our report dated
February 27, 2018
, expressed an unqualified opinion on those financial statements.
As described in the Report of Management on Internal Control over Financial Reporting dated
February 27, 2018
, management excluded from its assessment the internal control over financial reporting at the following businesses, which were acquired during 2017: aftermarket parts distribution businesses in Belgium and Poland, Warn Industries, Inc. and a wholesale business in North America (“the Acquired Businesses”). The aggregate financial statements of the Acquired Businesses constitute 13% and 8% of net and total assets, respectively, 2% of revenue, and less than 1% of net income of the consolidated financial statement amounts as of and for the year ended December 31, 2017. Accordingly, our audit did not include the internal control over financial reporting at the Acquired Businesses.
Basis for Opinion
The Company’s management is responsible for maintaining effective internal control over financial reporting and for its assessment of the effectiveness of internal control over financial reporting, included in the accompanying Report of Management on Internal Control over Financial Reporting. Our responsibility is to express an opinion on the Company’s internal control over financial reporting based on our audit. We are a public accounting firm registered with the PCAOB and are required to be independent with respect to the Company in accordance with the U.S. federal securities laws and the applicable rules and regulations of the Securities and Exchange Commission and the PCAOB.
We conducted our audit in accordance with the standards of the PCAOB. Those standards require that we plan and perform the audit to obtain reasonable assurance about whether effective internal control over financial reporting was maintained in all material respects. Our audit included obtaining an understanding of internal control over financial reporting, assessing the risk that a material weakness exists, testing and evaluating the design and operating effectiveness of internal control based on the assessed risk, and performing such other procedures as we considered necessary in the circumstances. We believe that our audit provides a reasonable basis for our opinion.
Definition and Limitations of Internal Control over Financial Reporting
A company’s internal control over financial reporting is a process designed to provide reasonable assurance regarding the reliability of financial reporting and the preparation of financial statements for external purposes in accordance with generally accepted accounting principles. A company’s internal control over financial reporting includes those policies and procedures that (1) pertain to the maintenance of records that, in reasonable detail, accurately and fairly reflect the transactions and dispositions of the assets of the company; (2) provide reasonable assurance that transactions are recorded as necessary to permit preparation of financial statements in accordance with generally accepted accounting principles, and that receipts and expenditures of the company are being made only in accordance with authorizations of management and directors of the company; and (3) provide reasonable assurance regarding prevention or timely detection of unauthorized acquisition, use, or disposition of the company’s assets that could have a material effect on the financial statements.
Because of its inherent limitations, internal control over financial reporting may not prevent or detect misstatements. Also, projections of any evaluation of effectiveness to future periods are subject to the risk that controls may become inadequate because of changes in conditions, or that the degree of compliance with the policies or procedures may deteriorate.
|
/s/ DELOITTE & TOUCHE LLP
|
Chicago, Illinois
February 27, 2018
115
None.
116
Directors
The information appearing under the caption "Election of our Board of Directors" in our Proxy Statement for the Annual Meeting of Stockholders to be held May 7, 2018 (the "Proxy Statement") is incorporated herein by reference.
Executive Officers
Our executive officers, their ages at
December 31, 2017
, and their positions with us are set forth below. Our executive officers are elected by and serve at the discretion of our Board of Directors.
|
Name
|
Age
|
Position
|
||
|
Dominick Zarcone
|
59
|
President, Chief Executive Officer and Director
|
||
|
Varun Laroyia
|
46
|
Executive Vice President and Chief Financial Officer
|
||
|
John S. Quinn
|
59
|
Chief Executive Officer and Managing Director, LKQ Europe
|
||
|
Victor M. Casini
|
55
|
Senior Vice President, General Counsel and Corporate Secretary
|
||
|
Walter P. Hanley
|
51
|
Senior Vice President - Development
|
||
|
Justin L. Jude
|
41
|
Senior Vice President of Operations - Wholesale Parts Division
|
||
|
Ashley T. Brooks
|
54
|
Senior Vice President and Chief Information Officer
|
||
|
Matthew J. McKay
|
40
|
Senior Vice President - Human Resources
|
||
|
Michael S. Clark
|
43
|
Vice President - Finance and Controller
|
||
Dominick Zarcone
became our President and Chief Executive Officer in May 2017. Mr. Zarcone was our Executive Vice President and Chief Financial Officer from March 2015 to May 2017. Prior to joining our Company, he was the Managing Director and Chief Financial Officer of Baird Financial Group, a capital markets and wealth management company, and certain of its affiliates from April 2011 to March 2015. He also served from April 2011 to March 2015 as Treasurer of Baird Funds, Inc., a family of fixed income and equity mutual funds managed by Robert W. Baird & Co. Incorporated, a registered broker/dealer. From February 1995 to April 2011, Mr. Zarcone was a Managing Director of the Investment Banking department of Robert W. Baird & Co. Incorporated. From February 1986 to February 1995, he was with the investment banking company Kidder, Peabody & Co., Incorporated, most recently as Senior Vice President of Investment Banking. Mr. Zarcone is a member of the Board of Directors of Generac Power Systems, Inc., a designer and manufacturer of power generation equipment and engine-powered products.
Varun Laroyia
became our Executive Vice President and Chief Financial Officer in October 2017. Prior to joining our Company, he was the Chief Financial Officer of CBRE’s Global Workplace Solutions ("GWS") business since 2015, following CBRE’s acquisition of the GWS business from Johnson Controls Inc. (“JCI”), where he was the Chief Financial Officer and Vice President of Information Technology since 2013. From 2006 to 2013, Mr. Laroyia held various positions at JCI including Group Vice President of Global Audit and Vice President of Finance and Administration for its Building Efficiency business across Europe and Africa. From 2000 to 2006, Mr. Laroyia held various positions at Gateway, Inc., including Vice President and Controller based in the U.S. and Finance Director for the United Kingdom and Ireland. Prior to Gateway, he was with General Electric in the U.S. and then GE Capital in London where he served as a Manager of European Corporate Development. Mr. Laroyia started his career at KPMG in London.
John S. Quinn
became our Chief Executive Officer and Managing Director, LKQ Europe in February 2015. Prior to that he was our Executive Vice President and Chief Financial Officer from November 2009. Prior to joining our Company, he was the Senior Vice President, Chief Financial Officer and Treasurer of Casella Waste Systems, Inc., a company in the solid waste management services industry, from January 2009. From January 2001 to January 2009 he held various positions of increasing responsibility with Allied Waste Industries, Inc., a company also in the solid waste management services industry, including Senior Vice President of Finance from January 2005 to January 2009, Controller and Chief Accounting Officer from November 2006 to September 2007 and Vice President Financial Analysis and Planning from January 2003 to January 2005. From August 1987 to January 2001, he held various positions with Waste Management Inc.'s foreign subsidiaries, and Waste Management International, plc. in Canada and the United Kingdom. Prior to working for Waste Management, he worked for Ford Glass Ltd., a subsidiary of Ford Motor Company. In January 2017, he was elected to the Board of Directors of Mekonomen Group, an automotive spare parts chain in the Nordic region, of which we are a 26.5% owner.
Victor M. Casini
has been our Vice President, General Counsel and Corporate Secretary from our inception in February 1998. In March 2008, he was elected Senior Vice President. Mr. Casini was a member of our Board of Directors from May 2010 until
117
May 2012. From July 1992 to December 2011, Mr. Casini was the Executive Vice President and General Counsel of Flynn Enterprises, Inc., a venture capital, hedging and consulting firm. Mr. Casini served as Senior Vice President, General Counsel and Corporate Secretary of Discovery Zone, Inc., an operator and franchiser of family entertainment centers, from July 1992 until May 1995. Prior to July 1992, Mr. Casini practiced corporate and securities law with the law firm of Bell, Boyd & Lloyd LLP (now known as K&L Gates LLP) in Chicago, Illinois for more than five years.
Walter P. Hanley
joined us in December 2002 as our Vice President of Development, Associate General Counsel and Assistant Secretary. In December 2005, he became our Senior Vice President of Development. Mr. Hanley served as Senior Vice President, General Counsel and Secretary of Emerald Casino, Inc., an owner of a license to operate a riverboat casino in the State of Illinois, from June 1999 until August 2002. Mr. Hanley served as Senior Vice President, General Counsel and Secretary of Blue Chip Casino, Inc., an owner and operator of a riverboat gaming vessel in Michigan City, Indiana, from July 1996 until November 1999. Mr. Hanley served as Vice President and Associate General Counsel of Flynn Enterprises, Inc. from May 1995 until February 1998 and as Associate General Counsel of Discovery Zone, Inc. from March 1993 until May 1995. Prior to March 1993, Mr. Hanley practiced corporate and securities law with the law firm of Bell, Boyd & Lloyd LLP (now known as K&L Gates LLP) in Chicago, Illinois.
Justin L. Jude
became our Senior Vice President of Operations—Wholesale Parts Division in July 2015. Mr. Jude has been with us since February 2004 in various roles, including from March 2008 to February 2011 as Vice President - Supply Chain, from February 2011 to May 2014 as Vice President - Information Systems (North America), and from June 2014 to July 2015 as President of Keystone Automotive Operations, Inc., our specialty automotive business. Mr. Jude has been in the Company’s industry for over 19 years.
Ashley T. Brooks
joined us as Senior Vice President—Chief Information Officer in May 2016. Prior to joining us, he held various information technology positions from 1999 to 2016 with Arrow Electronics, Inc., a global provider of products, services and solutions to industrial and commercial users of electronic components and enterprise computing solutions. Mr. Brooks' most recent position with Arrow Electronics was Chief Information Officer, Global Components from April 2012 to May 2016.
Matthew J. McKay
became our Senior Vice President of Human Resources in June 2016. Prior thereto, he served as our Associate General Counsel from December 2007 to May 2016, focusing on employment-related matters. Prior to joining us, Mr. McKay served as a law clerk for Judge William Bauer at the United States Court of Appeals for the Seventh Circuit.
Michael S. Clark
has been our Vice President—Finance and Controller since February 2011. Prior thereto, he served as our Assistant Controller since May 2008. Prior to joining our Company, he was the SEC Reporting Manager of FMC Technologies, Inc., a global provider of technology solutions for the energy industry, from December 2004 to May 2008. Before joining FMC Technologies, Mr. Clark, a certified public accountant, worked in public accounting for more than eight years, leaving as a Senior Manager in the audit practice of Deloitte & Touche.
Code of Ethics
A copy of our Code of Ethics for Financial Officers is available free of charge through our website at
www.lkqcorp.com
. Any amendments to our Code of Ethics for Financial Officers or waivers granted to the applicable financial officers will be posted on our website.
Section 16 Compliance
Information appearing under the caption "Other Information—Section 16(a) Beneficial Ownership Reporting Compliance" in the Proxy Statement is incorporated herein by reference.
Audit Committee
Information appearing under the caption "Corporate Governance—Committees of the Board—Audit Committee" in the Proxy Statement is incorporated herein by reference.
Information appearing under the captions "Director Compensation—Director Compensation Table," "Executive Compensation—Compensation Discussion and Analysis," "Corporate Governance—Compensation Committee Interlocks and Insider Participation" and "Executive Compensation—Compensation Tables" in the Proxy Statement is incorporated herein by reference.
118
|
ITEM 12.
|
SECURITY OWNERSHIP OF CERTAIN BENEFICIAL OWNERS AND MANAGEMENT AND RELATED STOCKHOLDER MATTERS
|
Information appearing under the caption "Other Information—Principal Stockholders" in the Proxy Statement is incorporated herein by reference.
The following table provides information about our common stock that may be issued under our equity compensation plans as of
December 31, 2017
:
Equity Compensation Plan Information
|
Plan Category
|
Number of
securities to be issued
upon exercise of
outstanding options,
warrants, and rights
(a)
|
Weighted-average
exercise price of
outstanding options,
warrants, and rights
(b)
|
Number of securities remaining
available for future
issuance under equity
compensation plans (excluding securities reflected in column (a)) (c) |
|||||||
|
Equity compensation plans approved by stockholders
|
||||||||||
|
Stock options
|
1,738,073
|
|
$
|
9.20
|
|
|||||
|
Restricted stock units
|
1,624,390
|
|
$
|
—
|
|
|||||
|
Total equity compensation plans approved by stockholders
|
3,362,463
|
|
11,672,411
|
|
||||||
|
Equity compensation plans not approved by stockholders
|
—
|
|
$
|
—
|
|
—
|
|
|||
|
Total
|
3,362,463
|
|
11,672,411
|
|
||||||
See
Note 6, "Stock-Based Compensation
," to the consolidated financial statements in Part II, Item 8 of this Annual Report on Form 10-K for further information related to the equity incentive plans listed above.
|
ITEM 13.
|
CERTAIN RELATIONSHIPS AND RELATED TRANSACTIONS, AND DIRECTOR INDEPENDENCE
|
Information appearing under the captions "Other Information—Certain Transactions," "Election of our Board of Directors" and "Corporate Governance - Director Independence" in the Proxy Statement is incorporated herein by reference.
Information appearing under the captions "Ratification of Appointment of Our Independent Registered Public Accounting Firm—Audit Fees and Non-Audit Fees" and "Ratification of Appointment of Our Independent Registered Public Accounting Firm—Policy on Audit Committee Approval of Audit and Non-Audit Services" in the Proxy Statement is incorporated herein by reference.
119
(a)(1) Financial Statements
Reference is made to the information set forth in Part II, Item 8 of this Annual Report on Form 10-K, which information is incorporated herein by reference.
(a)(2) Financial Statement Schedules
Other than as set forth below, all schedules for which provision is made in the applicable accounting regulations of the SEC have been omitted because they are not required under the related instructions, are not applicable, or the information has been provided in the consolidated financial statements or the notes thereto.
Schedule II—Valuation and Qualifying Accounts and Reserves
(in thousands)
|
Description
|
Balance at
Beginning of Period |
Additions
Charged to Costs and Expenses |
Deductions
|
Acquisitions and
Other |
Balance at End
of Period |
|||||||||||||||
|
ALLOWANCE FOR DOUBTFUL ACCOUNTS:
|
||||||||||||||||||||
|
Year ended December 31, 2017
|
$
|
45,608
|
|
$
|
15,387
|
|
$
|
(13,012
|
)
|
$
|
9,626
|
|
$
|
57,609
|
|
|||||
|
Year ended December 31, 2016
|
24,583
|
|
13,280
|
|
(21,829
|
)
|
29,574
|
|
45,608
|
|
||||||||||
|
Year ended December 31, 2015
|
19,426
|
|
13,654
|
|
(9,486
|
)
|
989
|
|
24,583
|
|
||||||||||
|
ALLOWANCE FOR ESTIMATED RETURNS, DISCOUNTS & ALLOWANCES:
|
||||||||||||||||||||
|
Year ended December 31, 2017
|
$
|
38,345
|
|
$
|
1,885,517
|
|
$
|
(1,884,250
|
)
|
$
|
2,713
|
|
$
|
42,325
|
|
|||||
|
Year ended December 31, 2016
|
32,774
|
|
1,670,911
|
|
(1,673,040
|
)
|
7,700
|
|
38,345
|
|
||||||||||
|
Year ended December 31, 2015
|
31,288
|
|
1,387,469
|
|
(1,388,921
|
)
|
2,938
|
|
32,774
|
|
||||||||||
Within the disclosure of our Allowance for Estimated Returns, Discounts and Allowances, we have corrected the 2016 and 2015 amounts under the columns "Additions Charged to Costs and Expenses" and "Deductions," which were previously reported as
$1,088,426
and
($1,090,555)
in 2016, respectively, and
$1,049,987
and
($1,051,439)
in 2015, respectively, due to the omission of certain returns, discounts, and allowances activity. We do not consider these adjustments to be material to any previously issued Schedule II.
120
(a)(3) Exhibits
The exhibits to this Annual Report on Form 10-K are listed in Item 15(b) of this Annual Report on Form 10-K. Included in the exhibits listed therein are the following exhibits which constitute management contracts or compensatory plans or arrangements:
|
LKQ Corporation 401(k) Plus Plan dated August 1, 1999.
|
|
|
Amendment to LKQ Corporation 401(k) Plus Plan.
|
|
|
Trust for LKQ Corporation 401(k) Plus Plan.
|
|
|
LKQ Corporation 401(k) Plus Plan II, as amended and restated effective as of January 1, 2011.
|
|
|
LKQ Corporation 1998 Equity Incentive Plan, as amended.
|
|
|
Form of LKQ Corporation Award Agreement for options granted under the 1998 Equity Incentive Plan.
|
|
|
Form of LKQ Corporation Restricted Stock Unit Agreement for Non-Employee Directors.
|
|
|
Form of LKQ Corporation Restricted Stock Unit Agreement.
|
|
|
Form of LKQ Corporation Performance-Based Restricted Stock Unit Agreement.
|
|
|
LKQ Corporation Amended and Restated Stock Option and Compensation Plan for Non-Employee Directors, as amended.
|
|
|
Form of Indemnification Agreement between directors and officers of LKQ Corporation and LKQ Corporation.
|
|
|
LKQ Corporation Management Incentive Plan.
|
|
|
Form of LKQ Corporation Executive Officer Management Incentive Plan Award Memorandum.
|
|
|
Amended and Restated LKQ Corporation Long Term Incentive Plan.
|
|
|
Form of LKQ Corporation Executive Officer Long Term Incentive Plan Award Memorandum.
|
|
|
Consulting Agreement, as amended and restated, dated as of May 21, 2009 between LKQ Corporation and Joseph M. Holsten.
|
|
|
Amendment Agreement dated as of January 31, 2011 to the Consulting Agreement between LKQ Corporation and Joseph M. Holsten dated as of May 21, 2009.
|
|
|
Change of Control Agreement between LKQ Corporation and John S. Quinn dated as of July 24, 2014.
|
|
|
Change of Control Agreement between LKQ Corporation and Walter P. Hanley dated as of July 24, 2014.
|
|
|
Change of Control Agreement between LKQ Corporation and Victor M. Casini dated as of July 24, 2014.
|
|
|
Change of Control Agreement between LKQ Corporation and Michael S. Clark dated as of July 24, 2014.
|
|
|
Change of Control Agreement between LKQ Corporation and Dominick P. Zarcone dated as of March 30, 2015.
|
|
|
Change of Control Agreement between LKQ Corporation and Justin L. Jude dated as of May 13, 2015.
|
|
|
Change of Control Agreement between LKQ Corporation and Ashley T. Brooks dated as of May 2, 2016.
|
|
|
Change of Control Agreement between LKQ Corporation and Matthew J. McKay dated as of June 1, 2016.
|
|
|
Change of Control Agreement between LKQ Corporation and Varun Laroyia dated as of October 1, 2017.
|
|
|
LKQ Severance Policy for Key Executives.
|
|
|
Offer Letter to John S. Quinn dated February 12, 2015, as amended.
|
|
|
Services Agreement dated as of February 26, 2015 between LKQ Corporation and John S. Quinn.
|
|
|
Offer Letter to Dominick P. Zarcone dated February 12, 2015.
|
|
|
Memorandum dated as of May 25, 2017 from Joseph M. Holsten to Dominick P. Zarcone.
|
|
|
Employee Transition Agreement dated as of May 31, 2017 between LKQ Corporation and Robert L. Wagman.
|
|
|
Offer letter to Varun Laroyia dated September 5, 2017.
|
|
|
Service Agreement between Euro Car Parts Limited and Sukhpal Singh Ahluwalia dated as of September 7, 2017.
|
|
(b) Exhibits
|
Restated Certificate of Incorporation of LKQ Corporation (incorporated herein by reference to Exhibit 3.1 to the Company’s report on Form 10-Q filed with the SEC on October 31, 2014).
|
|
|
Amended and Restated Bylaws of LKQ Corporation, as amended as of March 8, 2017 (incorporated herein by reference to Exhibit 3.1 to the Company's report on Form 8-K filed with the SEC on March 10, 2017).
|
|
121
|
Specimen of common stock certificate (incorporated herein by reference to Exhibit 4.1 to the Company’s Registration Statement on Form S-1/A, Registration No. 333-107417 filed with the SEC on September 12, 2003).
|
|
|
Amendment and Restatement Agreement dated as of January 29, 2016 by and among LKQ Corporation, LKQ Delaware LLP, and certain additional subsidiaries of LKQ Corporation, as borrowers, certain financial institutions, as lenders, and Wells Fargo Bank, National Association, as administrative agent (incorporated herein by reference to Exhibit 4.1 to the Company's report on Form 8-K filed with the SEC on February 2, 2016).
|
|
|
Amendment No. 1 dated as of December 14, 2016 to the Fourth Amended and Restated Credit Agreement, which is Exhibit A to the Amendment and Restatement Agreement dated as of January 29, 2016 by and among LKQ Corporation, LKQ Delaware LLP, and certain additional subsidiaries of LKQ Corporation, as borrowers, certain financial institutions, as lenders, and Wells Fargo Bank, National Association, as administrative agent (incorporated herein by reference to Exhibit 4.3 to the Company's report on Form 10-K filed with the SEC on February 27, 2017).
|
|
|
Amendment No. 2 dated as of December 1, 2017 to the Fourth Amended and Restated Credit Agreement, which is Exhibit A to the Amendment and Restatement Agreement dated as of January 29, 2016 by and among LKQ Corporation, LKQ Delaware LLP, and certain additional subsidiaries of LKQ Corporation, as borrowers, certain financial institutions, as lenders, and Wells Fargo Bank, National Association, as administrative agent.
|
|
|
Indenture dated as of May 9, 2013 among LKQ Corporation, as Issuer, the Guarantors, and U.S. Bank National Association, as Trustee (incorporated herein by reference to Exhibit 4.1 to the Company's report on Form 8-K filed with the SEC on May 10, 2013).
|
|
|
Supplemental Indenture dated as of May 8, 2014 among LKQ Corporation, as Issuer, the Guarantors, and U.S. Bank National Association, as Trustee (incorporated herein by reference to Exhibit 4.1 to the Company’s report on Form 10-Q filed with the SEC on August 1, 2014).
|
|
|
Supplemental Indenture dated as of September 9, 2016 among LKQ Corporation, as Issuer, certain subsidiaries of LKQ Corporation, as Guarantors, and U.S. Bank National Association, as Trustee (incorporated herein by reference to Exhibit 4.11 to the Company's report on Form 10-K filed with the SEC on February 27, 2017).
|
|
|
Supplemental Indenture dated as of July 20, 2017 among LKQ Corporation, as Issuer, certain subsidiaries of LKQ Corporation, as Guarantors, and U.S. Bank National Association, as Trustee.
|
|
|
Supplemental Indenture dated as of November 29, 2017 among LKQ Corporation, as Issuer, certain subsidiaries of LKQ Corporation, as Guarantors, and U.S. Bank National Association, as Trustee.
|
|
|
Indenture dated as of April 14, 2016 among LKQ Italia Bondco S.p.A., as Issuer, LKQ Corporation, certain subsidiaries of LKQ Corporation, the Trustee, and the Paying Agent, Transfer Agent and Registrar (incorporated herein by reference to Exhibit 4.1 to the Company’s report on Form 8-K filed with the SEC on April 18, 2016).
|
|
|
Supplemental Indenture dated as of June 13, 2016 among Auto Kelly a.s., LKQ Corporation, LKQ Italia Bondco S.p.A. and the Trustee (incorporated herein by reference to Exhibit 4.2 to the Company’s report on Form 10-Q filed with the SEC on August 2, 2016).
|
|
|
Supplemental Indenture dated as of June 13, 2016 among ELIT CZ, spol. s r.o., LKQ Corporation, LKQ Italia Bondco S.p.A. and the Trustee (incorporated herein by reference to Exhibit 4.3 to the Company’s report on Form 10-Q filed with the SEC on August 2, 2016).
|
|
|
Supplemental Indenture dated as of June 13, 2016 among Rhiag-Inter Auto Parts Italia S.p.A., LKQ Corporation, LKQ Italia Bondco S.p.A. and the Trustee (incorporated herein by reference to Exhibit 4.4 to the Company’s report on Form 10-Q filed with the SEC on August 2, 2016).
|
|
|
Supplemental Indenture dated as of June 13, 2016 among Bertolotti S.p.A., LKQ Corporation, LKQ Italia Bondco S.p.A. and the Trustee (incorporated herein by reference to Exhibit 4.5 to the Company’s report on Form 10-Q filed with the SEC on August 2, 2016).
|
|
|
Supplemental Indenture dated as of September 9, 2016 among LKQ Corporation, LKQ Italia Bondco S.p.A., as Issuer, certain subsidiaries of LKQ Corporation, as Guarantors, and BNP Paribas Trust Corporation UK Limited, as Trustee (incorporated herein by reference to Exhibit 4.2 to the Company’s report on Form 10-Q filed with the SEC on November 1, 2016).
|
|
|
Supplemental Indenture dated as of July 24, 2017 among LKQ Corporation, LKQ Italia Bondco S.p.A., as Issuer, certain subsidiaries of LKQ Corporation, as Guarantors, and BNP Paribas Trust Corporation UK Limited, as Trustee.
|
|
|
Supplemental Indenture dated as of November 29, 2017 among LKQ Corporation, LKQ Italia Bondco S.p.A., as Issuer, certain subsidiaries of LKQ Corporation, as Guarantors, and BNP Paribas Trust Corporation UK Limited, as Trustee.
|
|
|
LKQ Corporation 401(k) Plus Plan dated August 1, 1999 (incorporated herein by reference to Exhibit 10.23 to the Company’s Registration Statement on Form S-1, Registration No. 333-107417 filed with the SEC on July 28, 2003).
|
|
|
Amendment to LKQ Corporation 401(k) Plus Plan (incorporated herein by reference to Exhibit 10.24 to the Company’s Registration Statement on Form S-1, Registration No. 333-107417 filed with the SEC on July 28, 2003).
|
|
122
|
Trust for LKQ Corporation 401(k) Plus Plan (incorporated herein by reference to Exhibit 10.25 to the Company’s Registration Statement on Form S-1, Registration No. 333-107417 filed with the SEC on July 28, 2003).
|
|
|
LKQ Corporation 401(k) Plus Plan II, as amended and restated effective as of January 1, 2011 (incorporated herein by reference to Exhibit 10.8 to the Company’s report on Form 10-K for the year ended December 31, 2010).
|
|
|
LKQ Corporation 1998 Equity Incentive Plan, as amended (incorporated herein by reference to Exhibit 10.1 to the Company’s report on Form 10-Q filed with the SEC on November 1, 2016).
|
|
|
Form of LKQ Corporation Award Agreement for options granted under the 1998 Equity Incentive Plan (incorporated herein by reference to Exhibit 99.1 to the Company’s report on Form 8-K filed with the SEC on January 11, 2005).
|
|
|
Form of LKQ Corporation Restricted Stock Unit Agreement for Non-Employee Directors.
|
|
|
Form of LKQ Corporation Restricted Stock Unit Agreement (incorporated herein by reference to Exhibit 10.8 to the Company's report on Form 10-K filed with the SEC on February 27, 2017).
|
|
|
Form of LKQ Corporation Performance-Based Restricted Stock Unit Agreement.
|
|
|
LKQ Corporation Amended and Restated Stock Option and Compensation Plan for Non-Employee Directors, as amended (incorporated herein by reference to Exhibit 10.5 to the Company’s report on Form 10-Q filed with the SEC on November 7, 2008).
|
|
|
Form of Indemnification Agreement between directors and officers of LKQ Corporation and LKQ Corporation (incorporated herein by reference to Exhibit 10.30 to the Company’s Registration Statement on Form S-1, Registration No. 333-107417 filed with the SEC on July 28, 2003).
|
|
|
LKQ Corporation Management Incentive Plan (incorporated herein by reference to Exhibit 10.12 to the Company’s report on Form 10-K filed with the SEC on March 2, 2015).
|
|
|
Form of LKQ Corporation Executive Officer Management Incentive Plan Award Memorandum (incorporated herein by reference to Exhibit 10.1 to the Company’s report on Form 8-K filed with the SEC on March 10, 2017).
|
|
|
Amended and Restated LKQ Corporation Long Term Incentive Plan (incorporated herein by reference to Exhibit 10.1 to the Company’s report on Form 8-K filed with the SEC on November 7, 2014).
|
|
|
Form of LKQ Corporation Executive Officer Long Term Incentive Plan Award Memorandum (incorporated herein by reference to Exhibit 10.2 to the Company’s report on Form 8-K filed with the SEC on March 10, 2017).
|
|
|
Consulting Agreement, as amended and restated, dated as of May 21, 2009 between LKQ Corporation and Joseph M. Holsten (incorporated herein by reference to Exhibit 10.2 to the Company’s report on Form 8-K filed with the SEC on May 21, 2009).
|
|
|
Amendment Agreement dated as of January 31, 2011 to the Consulting Agreement between LKQ Corporation and Joseph M. Holsten dated as of May 21, 2009 (incorporated herein by reference to Exhibit 10.1 to the Company’s report on Form 8-K filed with the SEC on February 2, 2011).
|
|
|
Change of Control Agreement between LKQ Corporation and John S. Quinn dated as of July 24, 2014 (incorporated herein by reference to Exhibit 10.3 to the Company’s report on Form 8-K filed with the SEC on July 28, 2014).
|
|
|
Change of Control Agreement between LKQ Corporation and Walter P. Hanley dated as of July 24, 2014 (incorporated herein by reference to Exhibit 10.4 to the Company’s report on Form 8-K filed with the SEC on July 28, 2014).
|
|
|
Change of Control Agreement between LKQ Corporation and Victor M. Casini dated as of July 24, 2014 (incorporated herein by reference to Exhibit 10.5 to the Company’s report on Form 8-K filed with the SEC on July 28, 2014).
|
|
|
Change of Control Agreement between LKQ Corporation and Michael S. Clark dated as of July 24, 2014 (incorporated herein by reference to Exhibit 10.8 to the Company’s report on Form 8-K filed with the SEC on July 28, 2014).
|
|
|
Change of Control Agreement between LKQ Corporation and Dominick P. Zarcone dated as of March 30, 2015 (incorporated herein by reference to Exhibit 10.7 to the Company’s report on Form 10-Q filed with the SEC on May 1, 2015).
|
|
|
Change of Control Agreement between LKQ Corporation and Justin L. Jude dated as of May 13, 2015 (incorporated herein by reference to Exhibit 10.32 to the Company’s report on Form 10-K filed with the SEC on February 25, 2016).
|
|
|
Change of Control Agreement between LKQ Corporation and Ashley T. Brooks dated as of May 2, 2016 (incorporated herein by reference to Exhibit 10.1 to the Company’s report on Form 10-Q filed with the SEC on August 2, 2016).
|
|
|
Change of Control Agreement between LKQ Corporation and Matthew J. McKay dated as of June 1, 2016 (incorporated herein by reference to Exhibit 10.34 to the Company's report on Form 10-K filed with the SEC on February 27, 2017).
|
|
|
Change of Control Agreement between LKQ Corporation and Varun Laroyia dated as of October 1, 2017.
|
|
123
|
LKQ Severance Policy for Key Executives (incorporated herein by reference to Exhibit 10.1 to the Company’s report on Form 8-K filed with the SEC on July 28, 2014).
|
|
|
Receivables Sale Agreement dated as of September 28, 2012 among Keystone Automotive Industries, Inc., as an Originator, Greenleaf Auto Recyclers, LLC, as an Originator, and LKQ Receivables Finance Company, LLC, as Buyer (incorporated herein by reference to Exhibit 10.1 to the Company’s report on Form 8-K filed with the SEC on October 4, 2012).
|
|
|
Receivables Purchase Agreement dated as of September 28, 2012 among LKQ Receivables Finance Company, LLC, as Seller, LKQ Corporation, as Servicer, Victory Receivables Corporation, as a Conduit and The Bank of Tokyo-Mitsubishi UFJ, Ltd., as a Financial Institution, as Administrative Agent and as a Managing Agent (incorporated herein by reference to Exhibit 10.2 to the Company’s report on Form 8-K filed with the SEC on October 4, 2012).
|
|
|
Amendment No. 1 to Receivables Purchase Agreement dated as of September 29, 2014 among LKQ Receivables Finance Company, LLC, as Seller, LKQ Corporation, as Servicer, Victory Receivables Corporation, as a Conduit and The Bank of Tokyo-Mitsubishi UFJ, Ltd., as a Financial Institution, as Administrative Agent and as a Managing Agent (incorporated herein by reference to Exhibit 10.1 to the Company’s report on Form 8-K filed with the SEC on October 3, 2014).
|
|
|
Performance Undertaking, dated as of September 28, 2012 by LKQ Corporation in favor of LKQ Receivables Finance Company, LLC (incorporated herein by reference to Exhibit 10.3 to the Company’s report on Form 8-K filed with the SEC on October 4, 2012).
|
|
|
Amendment No. 2 to Receivables Purchase Agreement dated as of November 28, 2016 among LKQ Receivables Finance Company, LLC, as Seller, LKQ Corporation, as Servicer, the Conduits, the Purchasers, the Managing Agents and The Bank of Tokyo-Mitsubishi UFJ, Ltd., as Administrative Agent (incorporated herein by reference to Exhibit 10.40 to the Company's report on Form 10-K filed with the SEC on February 27, 2017).
|
|
|
Offer Letter to John S. Quinn dated February 12, 2015, as amended (incorporated herein by reference to Exhibit 10.41 to the Company’s report on Form 10-K filed with the SEC on February 25, 2016).
|
|
|
Services Agreement dated as of February 26, 2015 between LKQ Corporation and John S. Quinn (incorporated herein by reference to Exhibit 10.3 to the Company’s report on Form 8-K filed with the SEC on March 3, 2015).
|
|
|
Offer Letter to Dominick P. Zarcone dated February 12, 2015 (incorporated herein by reference to Exhibit 10.4 to the Company’s report on Form 8-K filed with the SEC on March 3, 2015).
|
|
|
Memorandum dated as of May 25, 2017 from Joseph M. Holsten to Dominick P. Zarcone (incorporated herein by reference to Exhibit 10.1 to the Company's report on Form 8-K filed with the SEC on June 5, 2017).
|
|
|
Share Sale and Purchase Agreement dated as of November 27, 2016 between LKQ Corporation and AxMeko AB, an affiliate of Axel Johnson AB (incorporated herein by reference to Exhibit 10.49 to the Company's report on Form 10-K filed with the SEC on February 27, 2017).
|
|
|
Stock and Asset Purchase Agreement dated as of December 18, 2016 among Vitro Automotive Glass LLC and VIMexico, S.A. de C.V., as Buyers, LKQ PGW Holdings, LLC, Pittsburgh Glass Works, LLC, KPGW European Holdco, LLC, and Pittsburgh Glass Works, ULC, as Sellers, PGW Holdings, LLC, as the Company, LKQ Corporation, Vitro S.A.B. de C.V. and Vitro Assets Corp. (incorporated herein by reference to Exhibit 10.50 to the Company's report on Form 10-K filed with the SEC on February 27, 2017).
|
|
|
Employee Transition Agreement dated as of May 31, 2017 between LKQ Corporation and Robert L. Wagman (incorporated herein by reference to Exhibit 10.2 to the Company's report on Form 8-K filed with the SEC on June 5, 2017).
|
|
|
Offer letter to Varun Laroyia dated September 5, 2017 (incorporated herein by reference to Exhibit 10.1 to the Company's report on Form 8-K filed with the SEC on September 6, 2017).
|
|
|
Service Agreement between Euro Car Parts Limited and Sukhpal Singh Ahluwalia dated as of September 7, 2017 (incorporated herein by reference to Exhibit 10.1 to the Company's report on Form 8-K filed with the SEC on September 13, 2017).
|
|
|
Sale and Purchase Agreement dated as of December 20, 2017 among the Company, LKQ German Holdings GmbH, an indirect wholly-owned subsidiary of the Company, and Stahlgruber Otto Gruber AG, the owners of Stahlgruber GmbH, a company incorporated in Germany.
|
|
|
Computation of Ratio of Earnings to Fixed Charges.
|
|
|
LKQ Corporation Code of Ethics (incorporated herein by reference to Exhibit 14.1 to the Company’s report on Form 10-Q filed with the SEC on August 2, 2013).
|
|
|
List of subsidiaries, jurisdictions and assumed names.
|
|
|
Consent of Independent Registered Public Accounting Firm.
|
|
|
Certification of Chief Executive Officer Pursuant to Rule 13a-14(a) or Rule 15d-14(a), as adopted pursuant to Section 302 of the Sarbanes-Oxley Act of 2002.
|
|
|
Certification of Chief Financial Officer Pursuant to Rule 13a-14(a) or Rule 15d-14(a), as adopted pursuant to Section 302 of the Sarbanes-Oxley Act of 2002.
|
|
124
|
Certification of Chief Executive Officer Pursuant to 18 U.S.C. Section 1350, as adopted pursuant to Section 906 of the Sarbanes-Oxley Act of 2002.
|
|
|
Certification of Chief Financial Officer Pursuant to 18 U.S.C. Section 1350, as adopted pursuant to Section 906 of the Sarbanes-Oxley Act of 2002.
|
|
|
101.INS
|
XBRL Instance Document
|
|
101.SCH
|
XBRL Taxonomy Extension Schema Document
|
|
101.CAL
|
XBRL Taxonomy Extension Calculation Linkbase Document
|
|
101.DEF
|
XBRL Taxonomy Extension Definition Linkbase Document
|
|
101.LAB
|
XBRL Taxonomy Extension Label Linkbase Document
|
|
101.PRE
|
XBRL Taxonomy Extension Presentation Linkbase Document
|
125
Not applicable.
126
SIGNATURES
Pursuant to the requirements of Section 13 or 15(d) of the Securities Exchange Act of 1934, the registrant has duly caused this report to be signed on its behalf by the undersigned, thereunto duly authorized, on
February 27, 2018
.
|
LKQ CORPORATION
|
|
|
By:
|
/s/ DOMINICK ZARCONE
|
|
Dominick Zarcone
|
|
|
President and Chief Executive Officer
|
|
Pursuant to the requirements of the Securities Exchange Act of 1934, this report has been signed below by the following persons on behalf of the registrant and in the capacities indicated on
February 27, 2018
.
|
Signature
|
Title
|
|
Principal Executive Officer:
|
|
|
/s/ DOMINICK ZARCONE
|
President and Chief Executive Officer
|
|
Dominick Zarcone
|
|
|
Principal Financial Officer:
|
|
|
/s/ VARUN LAROYIA
|
Executive Vice President and Chief Financial Officer
|
|
Varun Laroyia
|
|
|
Principal Accounting Officer:
|
|
|
/s/ MICHAEL S. CLARK
|
Vice President—Finance and Controller
|
|
Michael S. Clark
|
|
|
A Majority of the Directors:
|
|
|
/s/ SUKHPAL SINGH AHLUWALIA
|
Director
|
|
Sukhpal Singh Ahluwalia
|
|
|
/s/ A. CLINTON ALLEN
|
Director
|
|
A. Clinton Allen
|
|
|
/s/ ROBERT M. HANSER
|
Director
|
|
Robert M. Hanser
|
|
|
/s/ JOSEPH M. HOLSTEN
|
Director
|
|
Joseph M. Holsten
|
|
|
/s/ BLYTHE J. MCGARVIE
|
Director
|
|
Blythe J. McGarvie
|
|
|
/s/ PAUL M. MEISTER
|
Director
|
|
Paul M. Meister
|
|
|
/s/ JOHN F. O'BRIEN
|
Director
|
|
John F. O'Brien
|
|
|
/s/ GUHAN SUBRAMANIAN
|
Director
|
|
Guhan Subramanian
|
|
|
/s/ WILLIAM M. WEBSTER, IV
|
Director
|
|
William M. Webster, IV
|
|
|
/s/ DOMINICK ZARCONE
|
Director
|
|
Dominick Zarcone
|
|
127
TABLE OF CONTENTS
Part IItem 1. BusinessItem 1A. Risk FactorsItem 1B. Unresolved Staff CommentsItem 2. PropertiesItem 3. Legal ProceedingsItem 4. Mine Safety DisclosuresPart IIItem 5. Market For Registrant's Common Equity, Related Stockholder Matters and Issuer Purchases Of Equity SecuritiesItem 6. Selected Financial DataItem 7. Management's Discussion and Analysis Of Financial Condition and Results Of OperationsNote 3, "discontinued OperationsNote 4, "summary Of Significant Accounting PoliciesNote 14, "segment and Geographic InformationNote 5, "restructuring and Acquisition Related ExpensesNote 10, "derivative Instruments and Hedging ActivitiesItem 7A. Quantitative and Qualitative Disclosures About Market RiskNote 9, "long-term ObligationsItem 8. Financial Statements and Supplementary DataNote 1. BusinessNote 2. Business CombinationsNote 3. Discontinued OperationsNote 4. Summary Of Significant Accounting PoliciesNote 2, "business CombinationsNote 5. Restructuring and Acquisition Related ExpensesNote 6. Stock-based CompensationNote 7. Earnings Per ShareNote 8. Accumulated Other Comprehensive Income (loss)Note 9. Long-term ObligationsNote 10. Derivative Instruments and Hedging ActivitiesNote 8, "accumulated Other Comprehensive Income (loss)Note 11. Fair Value MeasurementsNote 12. Commitments and ContingenciesNote 13. Income TaxesNote 14. Segment and Geographic InformationNote 15. Selected Quarterly Data (unaudited)Note 16. Condensed Consolidating Financial InformationItem 9. Changes in and Disagreements with Accountants on Accounting and Financial DisclosureItem 9A. Controls and ProceduresItem 9B. Other InformationPart IIIItem 10. Directors, Executive Officers and Corporate GovernanceItem 11. Executive CompensationItem 12. Security Ownership Of Certain Beneficial Owners and Management and Related Stockholder MattersNote 6, "stock-based CompensationItem 13. Certain Relationships and Related Transactions, and Director IndependenceItem 14. Principal Accountant Fees and ServicesPart IVItem 15. Exhibits and Financial Statement SchedulesItem 16. Form 10-k Summary