ELI LILLY & CO
10-Ks and 10-Qs
|
|
|
|
|
|
|
|
|
|
|
|
|
|
|
|
|
|
|
|
|
|
|
|
|
|
|
|
|
|
|
|
|
|
|
|
|
|
|
|
|
|
|
|
|
|
|
United States
Securities and Exchange Commission
Washington, D.C. 20549
Form 10-K
Annual report pursuant to Section 13 or 15(d) of the Securities Exchange Act of 1934
for the fiscal year ended
December 31, 2014
Commission file number 001-06351
Eli Lilly and Company
|
An Indiana corporation
|
|
I.R.S. employer identification no. 35-0470950
|
|
Lilly Corporate Center, Indianapolis, Indiana 46285
|
||
|
(317) 276-2000
|
||
Securities registered pursuant to Section 12(b) of the Exchange Act:
|
Title of Each Class
|
|
Name of Each Exchange On Which Registered
|
|
Common Stock (no par value)
|
|
New York Stock Exchange
|
|
6.57% Notes Due January 1, 2016
|
|
New York Stock Exchange
|
|
7
1/8% Notes Due June 1, 2025
|
|
New York Stock Exchange
|
|
6.77% Notes Due January 1, 2036
|
|
New York Stock Exchange
|
Securities registered pursuant to Section 12(g) of the Exchange Act: None
Indicate by check mark if the Registrant is a well-known seasoned issuer, as defined in Rule 405 under the Securities Act. Yes
þ
No
¨
Indicate by check mark if the Registrant is not required to file reports pursuant to Section 13 or 15(d) of the Exchange Act. Yes
¨
No
þ
Indicate by check mark whether the Registrant (1) has filed all reports required to be filed by Section 13 or 15(d) of the Exchange Act during the preceding 12 months, and (2) has been subject to such filing requirements for the past 90 days. Yes
þ
No
¨
Indicate by check mark whether the Registrant has submitted electronically and posted on its corporate Web site, if any, every Interactive Data File required to be submitted and posted pursuant to Rule 405 of Regulation S-T during the preceding 12 months (or for such shorter period that the Registrant was required to submit and post such files). Yes
þ
No
¨
Indicate by check mark if disclosure of delinquent filers pursuant to Item 405 of Regulation S-K is not contained herein, and will not be contained, to the best of Registrant’s knowledge, in the definitive proxy statement incorporated by reference in Part III of this Form 10-K or any amendment to this Form 10-K.
¨
Indicate by check mark whether the Registrant is a large accelerated filer, an accelerated filer, a non-accelerated filer, or a smaller reporting company. See the definitions of “large accelerated filer,” “accelerated filer” and “smaller reporting company” in Rule 12b-2 under the Exchange Act. (Check one):
|
Large accelerated filer
þ
|
|
Accelerated filer
¨
|
|
Non-accelerated filer
¨
|
|
Smaller reporting company
¨
|
Indicate by check mark whether the Registrant is a shell company as defined in Rule 12b-2 under the Exchange Act: Yes
¨
No
þ
Aggregate market value of the common equity held by non-affiliates computed by reference to the price at which the common equity was last sold as of the last business day of the Registrant’s most recently completed second fiscal quarter (Common Stock): approximately
$60,777,000,000
Number of shares of common stock outstanding as of
February 13, 2015
:
1,111,103,942
Portions of the Registrant’s Proxy Statement to be filed on or about March 23, 2014 have been incorporated by reference into Part III of this report.
1
Eli Lilly and Company
Form 10-K
For the Year Ended
December 31, 2014
Table of Contents
|
Page
|
||||
2
Forward-Looking Statements
T
his Annual Report on Form 10-K includes forward-looking statements within the meaning of Section 27A of the Securities Act of 1933 and Section 21E of the Securities Exchange Act of 1934 (Exchange Act). Forward-looking statements include all statements that do not relate solely to historical or current facts, and can generally be identified by the use of words such as “may,” “believe,” “will,” “expect,” “project,” “estimate,” “intend,” “anticipate,” “plan,” “continue,” or similar expressions.
In particular, information appearing under “Business,” “Risk Factors” and “Management's Discussion and Analysis of Financial Condition and Results of Operations” includes forward-looking statements. Forward-looking statements inherently involve many risks and uncertainties that could cause actual results to differ materially from those projected in these statements. Where, in any forward-looking statement, we express an expectation or belief as to future results or events, it is based on management's current plans and expectations, expressed in good faith and believed to have a reasonable basis. However, we can give no assurance that any such expectation or belief will result or will be achieved or accomplished. The following include some but not all of the factors that could cause actual results or events to differ materially from those anticipated:
|
•
|
the timing of anticipated regulatory approvals and launches of new products;
|
|
•
|
market uptake of recently launched products;
|
|
•
|
competitive developments affecting current products;
|
|
•
|
the expiration of intellectual property protection for certain of our products;
|
|
•
|
our ability to protect and enforce patents and other intellectual property;
|
|
•
|
the impact of governmental actions regarding pricing, importation, and reimbursement for pharmaceuticals, including U.S. health care reform;
|
|
•
|
regulatory compliance problems or government investigations;
|
|
•
|
regulatory actions regarding currently marketed products;
|
|
•
|
unexpected safety or efficacy concerns associated with our products;
|
|
•
|
issues with product supply stemming from manufacturing difficulties or disruptions;
|
|
•
|
regulatory changes or other developments;
|
|
•
|
changes in patent law or regulations related to data-package exclusivity;
|
|
•
|
litigation involving current or future products as we are self-insured;
|
|
•
|
unauthorized disclosure or misappropriation of trade secrets or other confidential data stored in our information systems and networks;
|
|
•
|
changes in tax law;
|
|
•
|
changes in inflation, interest rates, and foreign currency exchange rates;
|
|
•
|
asset impairments and restructuring charges;
|
|
•
|
changes in accounting standards promulgated by the Financial Accounting Standards Board and the Securities and Exchange Commission (SEC);
|
|
•
|
acquisitions and business development transactions; and
|
|
•
|
the impact of global macroeconomic conditions.
|
Investors should not place undue reliance on forward-looking statements. You should carefully read the factors described in the “Risk Factors” section of this Annual Report on Form 10-K for a description of certain risks that could, among other things, cause our actual results to differ from these forward-looking statements.
All forward-looking statements speak only as of the date of this report and are expressly qualified in their entirety by the cautionary statements included in this report. Except as is required by law, we expressly disclaim any obligation to publicly release any revisions to forward-looking statements to reflect events after the date of this report.
3
|
Item 1.
|
Business
|
Eli Lilly and Company (the “company” or “registrant” or "Lilly") was incorporated in 1901 in Indiana to succeed to the drug manufacturing business founded in Indianapolis, Indiana, in 1876 by Colonel Eli Lilly. We discover, develop, manufacture, and market products in two business segments—human pharmaceutical products and animal health products.
The mission of our human pharmaceutical business is to make medicines that help people live longer, healthier, more active lives. Our vision is to make a significant contribution to humanity by improving global health in the 21st century. Most of the products we sell today were discovered or developed by our own scientists, and our success depends to a great extent on our ability to continue to discover, develop, and bring to market innovative new medicines.
Our animal health business, operating through our Elanco division, develops, manufactures, and markets products for both food animals and companion animals.
We manufacture and distribute our products through facilities in the United States (U.S.), Puerto Rico, and 11 other countries. Our products are sold in approximately 120 countries.
Subsequent Event - Novartis Animal Health Acquisition
On January 1, 2015, we completed our acquisition of Novartis Animal Health (Novartis AH) in an all-cash transaction for approximately $5.4 billion. Novartis AH operates in approximately 40 countries. We acquired Novartis AH’s nine manufacturing sites, six dedicated research and development facilities, a global commercial infrastructure with a portfolio of approximately 600 products, a pipeline with more than 40 projects in development, and more than 3,000 employees. The combined organization is expected to increase our animal health product portfolio, expand our global commercial presence, and augment our animal health manufacturing and research and development. In particular, it is expected to provide Elanco with a greater commercial presence in the companion animal and swine markets, expand Elanco’s presence in equine and vaccines areas, and create an entry into the aquaculture market. As a condition to the clearance of the transaction under the Hart-Scott-Rodino Antitrust Improvement Act, following the closing of the acquisition of Novartis AH, we divested certain companion animal assets in the U.S. related to the Sentinel
®
canine parasiticide franchise to Virbac Corporation for approximately $410 million.
Human Pharmaceutical Products
Our human pharmaceutical products include:
Endocrinology products
, including:
|
•
|
Humalog
®
,
Humalog Mix 75/25
™
,
and
Humalog Mix 50/50
™
, insulin analogs for the treatment of diabetes
|
|
•
|
Humulin
®
,
human insulin of recombinant DNA origin for the treatment of diabetes
|
|
•
|
Trajenta
®
,
for the treatment of type 2 diabetes
|
|
•
|
Jentadueto
®
,
a combination tablet of linagliptin (Trajenta) and metformin hydrochloride for use in the treatment of type 2 diabetes
|
|
•
|
Jardiance
®
, for the treatment of type 2 diabetes (approved in the U.S., Europe, and Japan in 2014)
|
|
•
|
Trulicity
™
, for the treatment of type 2 diabetes (approved in the U.S. and Europe in 2014)
|
|
•
|
Glyxambi
®
, a combination tablet of linagliptin and empagliflozin (Jardiance) for the treatment of type 2 diabetes (approved in the U.S. in January 2015)
|
|
•
|
Forteo
®
,
for the treatment of osteoporosis in postmenopausal women and men at high risk for fracture and for glucocorticoid-induced osteoporosis in men and postmenopausal women
|
4
|
•
|
Evista
®
,
for the prevention and treatment of osteoporosis in postmenopausal women and for the reduction of the risk of invasive breast cancer in postmenopausal women with osteoporosis and postmenopausal women at high risk for invasive breast cancer
|
|
•
|
Humatrope
®
,
for the treatment of human growth hormone deficiency and certain pediatric growth conditions
|
|
•
|
Axiron
®
, a topical solution of testosterone, applied by underarm applicator, for replacement therapy in men for certain conditions associated with a deficiency or absence of testosterone
|
Neuroscience products
, including:
|
•
|
Cymbalta
®
, for the treatment of major depressive disorder, diabetic peripheral neuropathic pain, generalized anxiety disorder, and in the U.S. for the management of fibromyalgia and of chronic musculoskeletal pain due to chronic low back pain or chronic pain due to osteoarthritis
|
|
•
|
Zyprexa
®
,
for the treatment of schizophrenia, acute mixed or manic episodes associated with bipolar I disorder, and bipolar maintenance
|
|
•
|
Strattera
®
,
for the treatment of attention-deficit hyperactivity disorder
|
|
•
|
Prozac
®
,
for the treatment of major depressive disorder, obsessive-compulsive disorder, bulimia nervosa, and panic disorder
|
|
•
|
Amyvid
®
, a radioactive diagnostic agent for positron emission tomography imaging of beta-amyloid neuritic plaques in the brains of adult patients with cognitive impairment who are being evaluated for Alzheimer's disease and other causes of cognitive decline
|
Oncology products
, including:
|
•
|
Alimta
®
,
for the first-line treatment, in combination with another agent, of advanced non-small cell lung cancer (NSCLC) for patients with non-squamous cell histology; for the second-line treatment of advanced non-squamous NSCLC; as monotherapy for the maintenance treatment of advanced non-squamous NSCLC in patients whose disease has not progressed immediately following chemotherapy treatment; and in combination with another agent, for the treatment of malignant pleural mesothelioma
|
|
•
|
Erbitux
®
,
indicated both as a single agent and with another chemotherapy agent for the treatment of certain types of colorectal cancers; and as a single agent or in combination with radiation therapy for the treatment of certain types of head and neck cancers
|
|
•
|
Gemzar
®
,
for the treatment of pancreatic cancer; in combination with other agents, for the treatment of metastatic breast cancer, NSCLC, and advanced or recurrent ovarian cancer; and in the European Union (EU) for the treatment of bladder cancer
|
|
•
|
Cyramza
®
,
approved in 2014 in the U.S. and the EU both as a single agent and in combination with another agent for advanced or metastatic gastric cancer; and approved in 2014 in the U.S. in combination with another agent as a second-line treatment of metastatic NSCLC
|
Cardiovascular products
, including:
|
•
|
Cialis
®
,
for the treatment of erectile dysfunction and benign prostatic hyperplasia
|
|
•
|
Effient
®
, for the reduction of thrombotic cardiovascular events (including stent thrombosis) in patients with acute coronary syndrome who are managed with an artery-opening procedure known as percutaneous coronary intervention (PCI), including patients undergoing angioplasty, atherectomy, or stent placement
|
|
•
|
ReoPro
®
,
for use as an adjunct to PCI for the prevention of cardiac ischemic complications
|
5
Animal Health Products
Our products for food animals include:
|
•
|
Rumensin
®
,
a cattle feed additive that improves feed efficiency and growth and also controls and prevents coccidiosis
|
|
•
|
Posilac
®
, a protein supplement to improve milk productivity in dairy cows
|
|
•
|
Paylean
®
and
Optaflexx
®
,
leanness and performance enhancers for swine and cattle, respectively
|
|
•
|
Tylan
®
,
an antibiotic used to control certain diseases in cattle, swine, and poultry
|
|
•
|
Micotil
®
,
Pulmotil
®
,
and
Pulmotil AC
™
,
antibiotics used to treat respiratory disease in cattle, swine, and poultry, respectively
|
|
•
|
Coban
®
, Monteban
®
,
and
Maxiban
®
, anticoccidial agents for use in poultry
|
|
•
|
Surmax
™
(sold as
Maxus
™
in some countries), a performance enhancer for swine and poultry
|
Our products for companion animals include:
|
•
|
Trifexis
®
,
a monthly chewable tablet for dogs that kills fleas, prevents flea infestations, prevents heartworm disease, and controls intestinal parasite infections
|
|
•
|
Comfortis
®
, a chewable tablet that kills fleas and prevents flea infestations on dogs
|
Recently acquired Novartis AH products include:
|
•
|
Denagard
®
,
an antibiotic for the control and treatment of respiratory and enteric diseases in swine and poultry
|
|
•
|
Milbemax
®
,
a broad spectrum intestinal wormer which, if given monthly, also offers prevention against heartworm
|
|
•
|
Sentinel
(outside the U.S.), a monthly tablet for the prevention of flea populations, the concurrent prevention of heartworm disease and the treatment of roundworms, hookworms, and whipworms in dogs
|
|
•
|
Atopica
®
,
for the treatment of chronic manifestations of atopic dermatitis in dogs and for the symptomatic treatment of chronic allergic dermatitis in cats
|
|
•
|
Fortekor
™
,
for the treatment of congestive heart failure in dogs and reduction of proteinurea associated with chronic kidney disease in cats
|
Marketing
We sell most of our products worldwide. We adapt our marketing methods and product emphasis in various countries to meet local needs.
Human Pharmaceuticals—United States
In the U.S., we distribute human pharmaceutical products principally through independent wholesale distributors, with some sales directly to pharmacies. In 2014, 2013, and 2012, three wholesale distributors in the U.S.—AmerisourceBergen Corporation, McKesson Corporation, and Cardinal Health, Inc.—each accounted for between
8 percent
and
19 percent
of our consolidated total revenue. No other distributor accounted for more than 10 percent of consolidated total revenue in any of those years.
We promote our major human pharmaceutical products in the U.S. through sales representatives who call upon physicians and other health care professionals. We advertise in medical journals, distribute literature and samples of certain products to physicians, and exhibit at medical meetings. In addition, we advertise certain products directly to consumers in the U.S., and we maintain websites with information about our major products. We supplement our employee sales force with contract sales organizations as appropriate to leverage our own resources and the strengths of our partners in various markets.
6
We maintain special business groups to service wholesalers, pharmacy benefit managers, managed care organizations (MCOs), government and long-term care institutions, hospitals, and certain retail pharmacies. We enter into arrangements with these organizations providing for discounts or rebates on our products.
Human Pharmaceuticals—Outside the United States
Outside the U.S, we promote our human pharmaceutical products primarily through sales representatives.
While the products marketed vary from country to country, endocrinology products constitute the largest single group in total revenue. Distribution patterns vary from country to country. In most countries in which we operate, we maintain our own sales organizations, but in some smaller countries we market our products through independent distributors.
Human Pharmaceutical Marketing Collaborations
Certain of our human pharmaceutical products are marketed in arrangements with other pharmaceutical companies, including the following:
|
•
|
Trajenta, Jentadueto, Jardiance, and Glyxambi are being jointly developed and commercialized with us by Boehringer Ingelheim. Our collaboration with Boehringer Ingelheim also covers two potential future diabetes products: our new insulin glargine product and a fixed-dose combination of empagliflozin and metformin hydrochloride.
|
|
•
|
We co-promote Cymbalta in Japan with Shionogi & Co. Ltd.
|
|
•
|
Erbitux is marketed in the U.S. and Canada by Bristol-Myers Squibb. We have the option to co-promote Erbitux in the U.S. and Canada. Outside the U.S. and Canada, Erbitux is commercialized by Merck KGaA. We receive royalties from Bristol-Myers Squibb and Merck KGaA.
|
|
•
|
Effient is co-promoted with us by Daiichi Sankyo or affiliated companies in the U.S., major European markets, Brazil, Mexico, and certain other countries. We retain sole marketing rights in Canada, Australia, Russia, and certain other countries. Daiichi Sankyo retains sole marketing rights in Japan and certain other countries.
|
Animal Health Products
Our Elanco animal health business unit employs field salespeople throughout the U.S. and has an extensive sales force outside the U.S. Elanco sells its products primarily to wholesale distributors. Elanco promotes its products primarily to producers and veterinarians for food animal products and to veterinarians for companion animal products. Elanco also advertises certain companion animal products directly to pet owners.
Competition
Our human pharmaceutical products compete globally with products of many other companies in highly competitive markets. Our animal health products compete globally with products of animal health care companies as well as pharmaceutical, chemical, and other companies that operate animal health businesses.
Important competitive factors for both human pharmaceutical and animal health products include effectiveness, safety, and ease of use; price and demonstrated cost-effectiveness; marketing effectiveness; and research and development of new products, processes, and uses. Most new products that we introduce must compete with other branded or generic products already on the market or products that are later developed by competitors. If competitors introduce new products or delivery systems with therapeutic or cost advantages, our products can be subject to decreased sales, progressive price reductions, or both.
We believe our long-term competitive success depends upon discovering and developing (either alone or in collaboration with others) or acquiring innovative, cost-effective human pharmaceutical and animal health products that provide improved outcomes and deliver value to payers, together with our ability to continuously improve the productivity of our operations in a highly competitive environment. There can be no assurance that our research and development efforts will result in commercially successful products, and it is possible that our products will become uncompetitive from time to time as a result of products developed by our competitors.
7
Generic Pharmaceuticals
One of the biggest competitive challenges we face is from generic pharmaceuticals. In the U.S. and the EU, the regulatory approval process for human pharmaceuticals (other than biological products (biologics)) exempts generics from costly and time-consuming clinical trials to demonstrate their safety and efficacy, allowing generic manufacturers to rely on the safety and efficacy of the innovator product. Therefore, generic manufacturers generally invest far less than we do in research and development and can price their products much lower than our branded products. Accordingly, when a branded non-biologic human pharmaceutical loses its market exclusivity, it normally faces intense price competition from generic forms of the product. Public and private payers typically encourage the use of generics as alternatives to brand-name drugs in their healthcare programs. Laws in the U.S. generally allow, and in many cases require, pharmacists to substitute generic drugs that have been rated under government procedures to be essentially equivalent to a brand-name drug. Where substitution is mandatory, it must be made unless the prescribing physician expressly forbids it. In many countries outside the U.S., intellectual property protection is weak and we must compete with generic or counterfeit versions of our products. Many of our animal health products also compete with generics.
Biosimilars
Several of our current products, including Cyramza, Erbitux, and ReoPro, and many of the new molecular entities (NMEs) in our research pipeline are biologics. Competition for Lilly’s biologics may be affected by the approval of follow-on biologics, also known as biosimilars. A biosimilar is a biologic for which marketing approval is granted based on less than a full safety and efficacy package due to the physical/structural similarity of the biosimilar to an already-approved biologic as well as reliance on the finding of safety and efficacy of the already-approved product. Globally, governments have or are developing regulatory pathways to approve biosimilars as alternatives to innovator-developed biologics, but the patent for the existing, branded product must expire in a given market before biosimilars may enter that market. The extent to which a biosimilar, once approved, will be substituted for the innovator biologic in a way that is similar to traditional generic substitution for non-biologic products, is not yet entirely clear, and will depend on a number of regulatory and marketplace factors that are still developing.
Biosimilars may present both competitive challenges and opportunities. For example, with our partner Boehringer Ingelheim we have developed a new insulin glargine product which has the same amino acid sequence as the currently marketed product. Our product has received marketing approval in the EU and tentative approval in the U.S. We intend to begin European launches later in 2015 following expiration of the compound patent for insulin glargine. See Item 3, "Legal Proceedings," for information on legal proceedings relating to this product.
Managed Care Organizations
The growth of MCOs in the U.S. is also a major factor in the competitive marketplace for human pharmaceuticals. It is estimated that approximately two-thirds of the U.S. population now participates in some version of managed care. MCOs can include medical insurance companies, medical plan administrators, health-maintenance organizations, Medicare Part D prescription drug plans, alliances of hospitals and physicians, and other physician organizations. MCOs have been consolidating into fewer, larger entities, thus enhancing their purchasing strength and importance.
MCOs typically maintain formularies specifying which drugs are covered under their plans. Exclusion of a drug from a formulary can lead to its sharply reduced usage in the MCO patient population. Consequently, pharmaceutical companies compete aggressively to have their branded products included. Where possible, companies compete for inclusion based upon unique features of their products, such as greater efficacy, fewer side effects, or greater patient ease of use. A lower overall cost of therapy is also an important factor. Price is becoming an increasingly important factor in MCO formulary decisions, particularly in treatment areas in which the MCO has taken the position that multiple branded products are therapeutically comparable. As noted above, generic drugs typically have lower costs than brand-name drugs. MCOs often favor generics for this reason.
8
Patents, Trademarks, and Other Intellectual Property Rights
Overview
Intellectual property protection is critical to our ability to successfully commercialize our life sciences innovations and invest in the search for new medicines. We own, have applied for, or are licensed under, a large number of patents in the U.S. and many other countries relating to products, product uses, formulations, and manufacturing processes. In addition, as discussed below, for some products we have additional effective intellectual property protection in the form of data protection under pharmaceutical regulatory laws.
The patent protection anticipated to be of most relevance to human pharmaceuticals is provided by national patents claiming the active ingredient (the compound patent), particularly those in major markets such as the U.S., various European countries, and Japan. These patents may be issued based upon the filing of international patent applications, usually filed under the Patent Cooperation Treaty (PCT). Patent applications covering the compounds are generally filed during the Discovery Research Phase of the drug discovery process, which is described in the “Research and Development” section of Item 1, “Business.” In general, national patents in each relevant country are available for a period of 20 years from the filing date of the PCT application, which is often years prior to the launch of a commercial product. Further patent term adjustments and restorations may extend the original patent term:
|
•
|
Patent term adjustment is a statutory right available to all U.S. patent applicants to provide relief in the event that a patent is delayed during examination by the U.S. Patent and Trademark Office.
|
|
•
|
Patent term restoration is a statutory right provided to U.S. patents that claim inventions subject to review by the U.S. Food and Drug Administration (FDA). A single patent for a human pharmaceutical product may be eligible for patent term restoration to make up for a portion of the time invested in clinical trials and the FDA review process. Patent term restoration is limited by a formula and cannot be calculated until product approval due to uncertainty about the duration of clinical trials and the time it takes the FDA to review an application. There is a five-year cap on any restoration, and no patent may be extended for more than 14 years beyond FDA approval. Some countries outside the U.S. also offer forms of patent term restoration. For example, Supplementary Protection Certificates are sometimes available to extend the life of a European patent up to an additional five years. Similarly, in Japan, Korea, and Australia, patent terms can be extended up to five years, depending on the length of regulatory review and other factors.
|
Loss of effective patent protection for human pharmaceuticals typically results in the loss of effective market exclusivity for the product, which can result in severe and rapid decline in sales of the product. However, in some cases the innovator company may be protected from approval of generic or other follow-on versions of a new medicine beyond the expiration of the compound patent through manufacturing trade secrets, later-expiring patents on methods of use or formulations, or data protection that may be available under pharmaceutical regulatory laws. The primary forms of data protection are as follows:
|
•
|
Regulatory authorities in major markets generally grant data package protection for a period of years following new drug approvals in recognition of the substantial investment required to complete clinical trials. Data package protection prohibits other manufacturers from submitting regulatory applications for marketing approval based on the innovator company’s regulatory submission data for the drug. The base period of data package protection depends on the country. For example, the period is five years in the U.S. (12 years for new biologics as described below), 10 years in the EU, and eight years in Japan. The period begins on the date of product approval and runs concurrently with the patent term for any relevant patent.
|
|
•
|
Under the Biologics Price Competition and Innovation Act (enacted in the U.S. in 2010), the FDA has the authority to approve similar versions (biosimilars) of innovative biologics. A competitor seeking approval of a biosimilar must file an application to show its molecule is highly similar to an approved innovator biologic, address the challenges of biologics manufacturing, and include a certain amount of safety and efficacy data which the FDA will determine on a case-by-case basis. Under the data protection provisions of this law, the FDA cannot approve a biosimilar application until 12 years after initial marketing approval of the innovator biologic, subject to certain conditions.
|
9
|
•
|
In the U.S., the FDA has the authority to grant additional data protection for approved drugs where the sponsor conducts specified testing in pediatric or adolescent populations. If granted, this “pediatric exclusivity” provides an additional six months, which are added to the term of data protection as well as to the term of any relevant patents, to the extent these protections have not already expired.
|
|
•
|
Under the U.S. orphan drug law, a specific use of a drug or biological product can receive "orphan" designation if it is intended to treat a disease or condition affecting fewer than 200,000 people in the U.S., or affecting more than 200,000 people but not reasonably expected to recover its development and marketing costs through U.S. sales. Among other benefits, orphan designation entitles the particular use of the drug to seven years of market exclusivity, meaning that the FDA cannot (with limited exceptions) approve another marketing application for the same drug for the same indication until expiration of the seven-year period. Unlike pediatric exclusivity, the orphan exclusivity period is independent of and runs in parallel with any applicable patents.
|
Outside the major markets, the adequacy and effectiveness of intellectual property protection for human pharmaceuticals varies widely. Under the Trade-Related Aspects of Intellectual Property Agreement (TRIPs) administered by the World Trade Organization, more than 140 countries have agreed to provide non-discriminatory protection for most pharmaceutical inventions and to assure that adequate and effective rights are available to patent owners. Because of TRIPs transition provisions, dispute resolution mechanisms, substantive limitations, and ineffectual implementation, it is difficult to assess when and how much we will benefit commercially from this protection.
Certain of our Elanco animal health products are covered by patents or other forms of intellectual property protection. Historically, upon loss of effective market exclusivity for our animal health products, we have not generally experienced the rapid and severe declines in revenues that are common in the human pharmaceutical segment.
There is no assurance that the patents we are seeking will be granted or that the patents we hold would be found valid and enforceable if challenged. Moreover, patents relating to particular products, uses, formulations, or processes do not preclude other manufacturers from employing alternative processes or marketing alternative products or formulations that compete with our patented products. In addition, competitors or other third parties sometimes may assert claims that our activities infringe patents or other intellectual property rights held by them, or allege a third-party right of ownership in our existing intellectual property.
Our Intellectual Property Portfolio
We consider intellectual property protection for certain products, processes, and uses—particularly those products discussed below—to be important to our operations. For many of our products, in addition to the compound patent, we hold other patents on manufacturing processes, formulations, or uses that may extend exclusivity beyond the expiration of the compound patent.
The most relevant U.S. patent protection or data protection for our larger or recently launched patent-protected marketed products is as follows:
|
•
|
Alimta is protected by a compound patent (2016) plus pediatric exclusivity (2017), and a vitamin dosage regimen patent (2021) plus pediatric exclusivity (2022).
|
|
•
|
Cialis is protected by compound and use patents (2017).
|
|
•
|
Cyramza is protected by biologics data package protection (2026).
|
|
•
|
Effient is protected by a compound patent (2017) and patents covering methods of using Effient with aspirin (2022).
|
|
•
|
Forteo is protected by patents primarily covering its formulation and related processes (2018) and use patents (2019).
|
|
•
|
Jardiance is protected by a compound patent (2025 not including possible patent extension)
|
|
•
|
Strattera is protected by a patent covering its use in treating attention deficit-hyperactivity disorder (2016) plus pediatric exclusivity (2017).
|
10
|
•
|
Trajenta and Jentadueto are protected by a compound patent (2023), and Boehringer Ingelheim has applied for a patent extension to 2025 under the patent restoration laws.
|
|
•
|
Trulicity is protected by a compound patent (2024 not including possible patent extension)
|
Outside the U.S., important patent protection or data protection includes:
|
•
|
Alimta in major European countries (compound patent December 2015, vitamin dosage regimen patent 2021) and Japan (compound patent December 2015, patent covering use to treat cancer concomitantly with vitamins 2021)
|
|
•
|
Cialis in major European countries (compound patent 2017)
|
|
•
|
Cymbalta in Japan (data package protection 2018). In major European countries, our Cymbalta data package protection expired in 2014, and we expect the first entry of generic competitors in 2015.
|
|
•
|
Forteo in Japan (data package protection 2018; patent covering its formulation and related process 2019).
|
|
•
|
Zyprexa in Japan (compound patent December 2015).
|
Necitumumab, our NME that has been submitted for regulatory review, is protected by a compound patent (2025 not including possible patent extension), and upon U.S. approval, would be protected for 12 years by biologics data package protection. See Item 7, "Management’s Discussion and Analysis—Late-Stage Pipeline”, for more information about this molecule.
Worldwide, we sell all of our major products under trademarks that we consider in the aggregate to be important to our operations. Trademark protection varies throughout the world, with protection continuing in some countries as long as the mark is used, and in other countries as long as it is registered. Registrations are normally for fixed but renewable terms.
Patent Licenses
Most of our major products were discovered in our own laboratories and are not subject to significant license agreements. Two of our largest products, Cialis and Alimta, are subject to patent assignments or licenses granted to us by others.
|
•
|
The compound patent for Cialis is the subject of a license agreement with GlaxoSmithKline (Glaxo), which assigns to us exclusively all rights in the compound. The agreement calls for royalties of a single-digit percentage of net sales. The agreement is not subject to termination by Glaxo for any reason other than a material breach by Lilly of the royalty obligation, after a substantial cure period.
|
|
•
|
The compound patent for Alimta is the subject of a license agreement with Princeton University, granting us an irrevocable exclusive worldwide license to the compound patents for the lives of the patents in the respective territories. The agreement calls for royalties of a single-digit percentage of net sales. The agreement is not subject to termination by Princeton for any reason other than a material breach by Lilly of the royalty obligation, after a substantial cure period. Alimta is also the subject of a worldwide, nonexclusive license to certain patents owned by Takeda Pharmaceutical Company Limited. The agreement calls for royalties of a single-digit percentage of net sales in
countries covered by a relevant patent. The agreement is subject to termination for material default and failure to cure by Lilly and in the event that Lilly becomes bankrupt or insolvent.
|
Patent Challenges
In the U.S., the Drug Price Competition and Patent Term Restoration Act of 1984, commonly known as the Hatch-Waxman Act, made a complex set of changes to both patent and new-drug-approval laws for human pharmaceuticals. Before the Hatch-Waxman Act, no drug could be approved without providing the FDA complete safety and efficacy studies, i.e., a complete New Drug Application (NDA). The Hatch-Waxman Act authorizes the FDA to approve generic versions of innovative human pharmaceuticals (other than biologics) without such information by filing an Abbreviated New Drug Application (ANDA). In an ANDA, the generic manufacturer must demonstrate only “bioequivalence” between the generic version and the NDA-approved drug—not safety and efficacy.
11
Absent a patent challenge, the FDA cannot approve an ANDA until after the innovator’s patents expire. However, after the innovator has marketed its product for four years, a generic manufacturer may file an ANDA alleging that one or more of the patents listed in the innovator’s NDA are invalid or not infringed. This allegation is commonly known as a “Paragraph IV certification.” The innovator must then file suit against the generic manufacturer to protect its patents. The FDA is then prohibited from approving the generic company’s application for a 30- to 42-month period (which can be shortened or extended by the trial court judge hearing the patent challenge). If one or more of the NDA-listed patents are challenged, the first filer(s) of a Paragraph IV certification may be entitled to a 180-day period of market exclusivity over all other generic manufacturers.
Generic manufacturers use Paragraph IV certifications extensively to challenge patents on innovative human pharmaceuticals. In addition, generic companies have shown an increasing willingness to launch “at risk,” i.e., after receiving ANDA approval but before final resolution of their patent challenge. For example, we are currently in litigation with numerous generic manufacturers arising from their Paragraph IV certifications challenging the vitamin dosage regimen patent for Alimta. For more information on Hatch-Waxman litigation involving the company, see Item 8, “Financial Statements and Supplementary Data—Note 15, Contingencies” and Item 3, "Legal Proceedings."
Outside the U.S., the legal doctrines and processes by which pharmaceutical patents can be challenged vary widely. In recent years, we have experienced an increase in patent challenges from generic manufacturers in many countries outside the U.S., and we expect this trend to continue. For more information on administrative challenges and litigation involving our Alimta vitamin dosage regimen patents in Europe and Japan, see Item 8, “Financial Statements and Supplementary Data—Note 15, Contingencies.”
Government Regulation
Regulation of Our Operations
Our operations are regulated extensively by numerous national, state, and local agencies. The lengthy process of laboratory and clinical testing, data analysis, manufacturing development, and regulatory review necessary for governmental approvals is extremely costly and can significantly delay product introductions. Promotion, marketing, manufacturing, and distribution of human pharmaceutical and animal health products are extensively regulated in all major world markets. We conduct extensive post-marketing surveillance of the safety of the products we sell. In addition, our operations are subject to complex federal, state, local, and foreign laws and regulations concerning the environment, occupational health and safety, and privacy. Animal health product regulations address the administration of the product in or on the animal, and in the case of food animal products, the impact on humans who consume the food as well as the impact on the environment at the production site. The laws and regulations affecting the manufacture and sale of current products and the discovery, development, and introduction of new products will continue to require substantial effort, expense, and capital investment.
Of particular importance is the FDA in the United States. Pursuant to the Federal Food, Drug, and Cosmetic Act, the FDA has jurisdiction over all of our human pharmaceutical products and certain animal health products in the U.S. and administers requirements covering the testing, safety, effectiveness, manufacturing, quality control, distribution, labeling, marketing, advertising, dissemination of information, and post-marketing surveillance of those products. The U.S. Department of Agriculture and the U.S. Environmental Protection Agency also regulate some animal health products.
The FDA extensively regulates all aspects of manufacturing quality for human pharmaceuticals under its current Good Manufacturing Practices (cGMP) regulations. Outside the U.S., our products and operations are subject to similar regulatory requirements, notably by the European Medicines Agency in the EU and the Ministry of Health, Labor and Welfare in Japan. Specific regulatory requirements vary from country to country. We make substantial investments of capital and operating expenses to implement comprehensive, company-wide quality systems in our manufacturing, product development, and process development operations to ensure sustained compliance with cGMP and similar regulations. However, in the event we fail to adhere to these requirements in the future, we could be subject to interruptions in production, fines and penalties, and delays in new product approvals. Certain of our products are manufactured by third parties, and their failure to comply with these regulations could adversely affect us through failure to supply product to us or delays in new product approvals.
12
The marketing, promotional, and pricing practices of human pharmaceutical manufacturers, as well as the manner in which manufacturers interact with purchasers and prescribers, are subject to various other U.S. federal and state laws, including the federal anti-kickback statute and the False Claims Act and state laws governing kickbacks, false claims, unfair trade practices, and consumer protection. These laws are administered by, among others, the Department of Justice (DOJ), the Office of Inspector General of the Department of Health and Human Services, the Federal Trade Commission, the Office of Personnel Management, and state attorneys general. Over the past several years, the FDA, the DOJ, and many of these other agencies have increased their enforcement activities with respect to pharmaceutical companies and increased the inter-agency coordination of enforcement activities. Several claims brought by these agencies against Lilly and other companies under these and other laws have resulted in corporate criminal sanctions and very substantial civil settlements.
The U.S. Foreign Corrupt Practices Act of 1977 (FCPA) prohibits certain individuals and entities, including U.S. publicly traded companies, from promising, offering, or giving anything of value to foreign officials with the corrupt intent of influencing the foreign official for the purpose of helping the company obtain or retain business or gain any improper advantage. The FCPA also imposes specific recordkeeping and internal controls requirements on U.S. publicly traded companies. As noted above, outside the U.S., our business is heavily regulated and therefore involves significant interaction with foreign officials. Additionally, in many countries outside the U.S., the health care providers who prescribe human pharmaceuticals are employed by the government and the purchasers of human pharmaceuticals are government entities; therefore, our interactions with these prescribers and purchasers are subject to regulation under the FCPA.
In addition to the U.S. application and enforcement of the FCPA, the various jurisdictions in which we operate and supply our products have laws and regulations aimed at preventing and penalizing corrupt and anticompetitive behavior. In recent years, several jurisdictions, including China, Brazil, and the United Kingdom, have enhanced their laws and regulations in this area, increased their enforcement activities, and/or increased the level of cross-border coordination and information sharing.
It is possible that we could become subject to additional administrative and legal proceedings and actions, which could include claims for civil penalties (including treble damages under the False Claims Act), criminal sanctions, and administrative remedies, including exclusion from U.S. federal and other health care programs. It is possible that an adverse outcome in future actions could have a material adverse impact on our consolidated results of operations, liquidity, and financial position.
Regulations Affecting Human Pharmaceutical Pricing, Reimbursement, and Access
In the U.S., we are required to provide rebates to the federal government and respective state governments on their purchases of our human pharmaceuticals under state Medicaid and Medicaid Managed Care programs (minimum of 23.1 percent plus adjustments for price increases over time) and rebates to private payers who cover patients in certain types of health care facilities that serve low-income and uninsured patients (known as 340B facilities). No rebates are required at this time in the Medicare Part B (physician and hospital outpatient) program where reimbursement is set on an "average selling price plus 4.3 percent" formula. Drug manufacturers are required to provide a discount of 50 percent of the cost of branded prescription drugs for Medicare Part D participants who are in the “doughnut hole” (the coverage gap in Medicare prescription drug coverage). Additionally, an annual fee is imposed on pharmaceutical manufacturers and importers that sell branded prescription drugs to specified government programs.
Rebates are also negotiated in the private sector. We give rebates to private payers who provide prescription drug benefits to seniors covered by Medicare and to private payers who provide prescription drug benefits to their customers. These rebates are affected by the introduction of competitive products and generics in the same class.
In most international markets, we operate in an environment of government-mandated cost-containment programs, which may include price controls, international reference pricing (to other countries’ prices), discounts and rebates, therapeutic reference pricing (to other, often generic, pharmaceutical choices), restrictions on physician prescription levels, and mandatory generic substitution.
13
Globally, public and private payers are increasingly restricting access to human pharmaceuticals based on the payers' assessments of comparative effectiveness and value. The U.S. has established the Patient Centered Outcomes Research Institute (PCORI), a federally-funded, private, non-profit corporation empowered to fund and disseminate comparative effectiveness research (CER) and build infrastructure for improved outcomes analysis. While PCORI has no authority to impose formulary changes directly in government-funded health programs, they are expected to drive an increase in CER studies which payers can use for formulary decisions and/or medical societies can use to inform medical guidelines development. Many countries outside of the U.S. use formal health technology assessment processes to determine formulary placement and purchase price.
We cannot predict the extent to which our business may be affected by these or other potential future legislative or regulatory developments. However, in general we expect that state, federal, and international legislative and regulatory developments could have further negative effects on pricing and reimbursement for our human pharmaceutical products.
Research and Development
Our commitment to research and development dates back more than 100 years. We invest heavily in research and development because we believe it is critical to our long-term competitiveness. At the end of
2014
, we employed approximately 8,145 people in human pharmaceutical and animal health research and development activities, including a substantial number of physicians, scientists holding graduate or postgraduate degrees, and highly skilled technical personnel. Our research and development expenses were
$4.73 billion
in
2014
,
$5.53 billion
in
2013
, and
$5.28 billion
in
2012
.
Our internal human pharmaceutical research focuses primarily on our core areas of cancer, diabetes, and neurodegeneration, and two emerging areas, immunology and pain. We are investing in molecules with multi-pathway pharmacological efficacy (e.g., dual-action bi-specific antibodies and antibody-drug conjugates) to expand the potential of our therapeutic portfolio. We have a strong biotechnology research program, with approximately half of our clinical-stage pipeline currently consisting of biologics. In addition to discovering and developing NMEs, we seek to expand the value of existing products through new uses, formulations, and therapeutic approaches that provide additional value to patients. Across all our therapeutic areas, we are increasingly focusing our efforts on tailored therapeutics, seeking to identify and use advanced diagnostic tools and other information to identify specific subgroups of patients for whom our medicines—or potentially those of other companies—will be the best treatment option.
To supplement our internal efforts, we collaborate with others, including academic institutions and research-based pharmaceutical and biotechnology companies. We use the services of physicians, hospitals, medical schools, and other research organizations worldwide to conduct clinical trials to establish the safety and effectiveness of our human pharmaceutical products. We actively seek out external investments in research and technologies that hold the promise to complement and strengthen our own efforts. These investments can take many forms, including licensing arrangements, co-development and co-marketing agreements, co-promotion arrangements, joint ventures, and acquisitions.
Our Elanco animal health innovation strategy is focused on identifying and developing promising technologies and potential products from internal and external sources to meet unmet veterinary needs. Our animal health scientists also leverage discoveries from our human health laboratories to develop products to enhance the health and wellbeing of livestock and pets.
14
Human pharmaceutical development is time-consuming, expensive, and risky. On average, only one out of many thousands of molecules discovered by researchers ultimately becomes an approved medicine. The process from discovery to regulatory approval can take 12 to 15 years or longer. Drug candidates can fail at any stage of the process, and even late-stage drug candidates sometimes fail to receive regulatory approval or achieve commercial success. After approval and launch of a product, we expend considerable resources on post-marketing surveillance and additional clinical studies to collect and understand the benefits and potential risks of medicines as they are used as therapeutics. The following describes in more detail the research and development process for human pharmaceutical products:
Phases of New Drug Development
|
•
|
Discovery Research Phase
|
The earliest phase of new drug research and development, the discovery phase, can take many years. Scientists identify, design, and synthesize promising molecules, screening tens of thousands of molecules for their effect on biological “targets” that appear to play an important role in one or more diseases. Targets can be part of the body, such as a protein, receptor, or gene; or foreign, such as a virus or bacteria. Some targets have been proven to affect disease processes, but often the target is unproven and may later prove to be irrelevant to the disease or to yield insufficient clinical benefit. Molecules that have the desired effect on the target and meet other design criteria become “lead” molecules and move to the next phase of development. The probability of any one such lead molecule becoming a commercial product is extremely low.
|
•
|
Early Development Phase
|
The early development phase involves refining lead molecules, understanding how to manufacture them efficiently, and completing initial testing for safety and efficacy. Safety testing is done first in laboratory tests and animals as necessary, to identify toxicity and other potential safety issues that would preclude use in humans. The first human tests (often referred to as Phase I) are normally conducted in small groups of healthy volunteers to assess safety and find the potential dosing range. After a safe dose has been established, the drug is administered to small populations of patients (Phase II) to look for initial signs of efficacy in treating the targeted disease and to continue to assess safety. In parallel, scientists work to identify safe, effective, and economical manufacturing processes. Long-term animal studies continue to test for potential safety issues. Of the molecules that enter the early development phase, typically less than 10 percent move on to the product phase. The early development phase normally takes several years to complete.
|
•
|
Product Phase
|
Product phase (Phase III) molecules have already demonstrated safety and, typically, shown initial evidence of efficacy. As a result, these molecules generally have a higher likelihood of success. The molecules are tested in much larger patient populations to demonstrate efficacy to a predetermined level of statistical significance and to continue to develop the safety profile. These trials are generally global in nature and are designed to generate the data necessary to submit the molecule to regulatory agencies for marketing approval. The potential new drug is generally compared with existing competitive therapies, placebo, or both. The resulting data is compiled and submitted to regulatory agencies around the world. Phase III testing varies by disease state, but can often last from three to four years.
|
•
|
Submission Phase
|
Once a molecule is submitted to regulatory agencies, the time to final marketing approval can vary from several months to several years, depending on variables such as the disease state, the strength and complexity of the data presented, the novelty of the target or compound, and the time required for the agency(ies) to evaluate the submission. There is no guarantee that a potential medicine will receive marketing approval, or that decisions on marketing approvals or indications will be consistent across geographic areas.
15
We believe our investments in research, both internally and in collaboration with others, have been rewarded by the large number of new molecules and new indications for existing molecules that we have in all stages of development. We currently have approximately
55
drug candidates across all stages of human testing and a larger number of projects in preclinical development. Among our new investigational molecules currently in the product phase of development or awaiting regulatory approval or launch are potential therapies for diabetes, various cancers, Alzheimer’s disease, pain, high-risk vascular disease, rheumatoid arthritis, psoriasis, and psoriatic arthritis. We are studying many other drug candidates in the earlier stages of development, including molecules targeting various cancers, diabetes, neurodegeneration, pain, immunologic diseases, anemia, cardiovascular disease, musculoskeletal disorders, and renal diseases. We are also developing new uses, formulations, or delivery methods for many of these molecules as well as several currently marketed products. See Item 7, "Management's Discussion and Analysis—Late-Stage Pipeline," for more information on certain of our product candidates.
Raw Materials and Product Supply
Most of the principal materials we use in our manufacturing operations are available from more than one source. However, we obtain certain raw materials principally from only one source. In the event one of these suppliers was unable to provide the materials or product, we generally seek to maintain sufficient inventory to supply the market until an alternative source of supply can be implemented. However, in the event of an extended failure of a supplier, it is possible that we could experience an interruption in supply until we established new sources or, in some cases, implemented alternative processes.
The majority of our revenue comes from products produced in our own facilities. Our principal active ingredient manufacturing occurs at four owned sites in the U.S. as well as owned sites in Ireland, Puerto Rico, and the United Kingdom. Finishing operations, including formulation, filling, assembling, delivery device manufacturing, and packaging, take place at a number of sites throughout the world. We utilize third parties for certain active ingredient manufacturing and finishing operations.
We manage our supply chain (including our own facilities, contracted arrangements, and inventory) in a way that should allow us to meet all expected product demand while maintaining flexibility to reallocate manufacturing capacity to improve efficiency and respond to changes in supply and demand. To maintain a stable supply of our products, we take a variety of actions including a company-wide, comprehensive quality system, inventory management, and back-up sites.
However, human pharmaceutical and animal health production processes are complex, highly regulated, and vary widely from product to product. Shifting or adding manufacturing capacity can be a very lengthy process requiring significant capital expenditures, process modifications, and regulatory approvals. Accordingly, if we were to experience extended plant shutdowns at one of our own facilities, extended failure of a contract supplier, or extraordinary unplanned increases in demand, we could experience an interruption in supply of certain products or product shortages until production could be resumed or expanded.
Quality Assurance
Our success depends in great measure upon customer confidence in the quality of our products and in the integrity of the data that support their safety and effectiveness. Product quality arises from a total commitment to quality in all parts of our operations, including research and development, purchasing, facilities planning, manufacturing, distribution, and dissemination of information about our medicines.
Quality of production processes involves strict control of ingredients, equipment, facilities, manufacturing methods, packaging materials, and labeling. We perform tests at various stages of production processes and on the final product to assure that the product meets all regulatory requirements and Lilly standards. These tests may involve chemical and physical chemical analyses, microbiological testing, testing in animals, or a combination. Additional assurance of quality is provided by a corporate quality-assurance group that audits and monitors all aspects of quality related to human pharmaceutical and animal health manufacturing procedures and systems in the parent company, subsidiaries and affiliates, and third-party suppliers.
16
Executive Officers of the Company
The following table sets forth certain information regarding our executive officers. Except as otherwise noted, all executive officers have been employed by the company in management or executive positions during the last five years.
The term of office for each executive officer expires on the date of the annual meeting of the Board of Directors, to be held on May 4, 2015, or on the date his or her successor is chosen and qualified. No director or executive officer has a “family relationship” with any other director or executive officer of the company, as
that term is defined for purposes of this disclosure requirement. There is no understanding between any executive officer and any other person pursuant to which the executive officer was selected.
|
Name
|
Age
|
Offices and Business Experience
|
|
John C. Lechleiter, Ph.D.
|
61
|
Chairman (since January 2009), President (since October 2005), Chief Executive Officer (since April 2008), and a Director (since October 2005)
|
|
Melissa S. Barnes
|
46
|
Senior Vice President, Enterprise Risk Management and Chief Ethics and Compliance Officer (since January 2013)
|
|
Enrique A. Conterno
|
48
|
Senior Vice President and President, Lilly Diabetes (since November 2009)
|
|
Maria A. Crowe
|
55
|
President, Manufacturing Operations (since January 2012)
|
|
Stephen F. Fry
|
49
|
Senior Vice President, Human Resources and Diversity (since February 2011)
|
|
Michael J. Harrington
|
52
|
Senior Vice President and General Counsel (since January 2013)
|
|
Jan M. Lundberg, Ph.D.
|
61
|
Executive Vice President, Science and Technology, and President, Lilly Research Laboratories (since January 2010). From 2002 until he joined Lilly in January 2010, Dr. Lundberg was executive vice president and head of discovery research at AstraZeneca.
|
|
Susan Mahony, Ph.D.
|
50
|
Senior Vice President and President, Lilly Oncology (since February 2011)
|
|
Barton R. Peterson
|
56
|
Senior Vice President, Corporate Affairs and Communications (since June 2009).
|
|
Derica W. Rice
|
50
|
Executive Vice President, Global Services (since January 2010) and Chief Financial Officer (since May 2006)
|
|
David A. Ricks
|
47
|
Senior Vice President and President, Lilly Bio-Medicines (since January 2012)
|
|
Jeffrey N. Simmons
|
47
|
Senior Vice President and President, Elanco Animal Health (since January 2008)
|
|
Fionnuala M. Walsh
|
55
|
Senior Vice President, Global Quality (since July 2007)
|
|
Alfonso Zulueta
|
52
|
Senior Vice President and President, Emerging Markets (since January 2014)
|
Employees
At the end of
2014
, we employed approximately
39,135
people, including approximately 21,920 employees outside the United States. A substantial number of our employees have long records of continuous service.
Financial Information Relating to Business Segments and Classes of Products
You can find financial information relating to our business segments and classes of products in Item 8, "Financial Statements and Supplementary Data—Note 18, Segment Information." That information is incorporated here by reference.
The relative contribution of any particular product to our consolidated revenue changes from year to year. This is due to several factors, including the introduction of new products by us and by other manufacturers and the introduction of generic pharmaceuticals upon patent expirations. Our major product revenues are generally not seasonal.
17
Financial Information Relating to Foreign and Domestic Operations
You can find financial information relating to foreign and domestic operations in Item 8, “Financial Statements and Supplementary Data—Note 18, Segment Information.” That information is incorporated here by reference. To date, our overall operations abroad have not been significantly deterred by local restrictions on the transfer of funds from branches and subsidiaries located abroad, including the availability of U.S. dollar exchange. We cannot predict what effect these restrictions or the other risks inherent in foreign operations, including possible nationalization, might have on our future operations or what other restrictions may be imposed in the future. In addition, changing currency values can either favorably or unfavorably affect our financial position, liquidity, and results of operations. We mitigate foreign exchange risk through various hedging techniques including the use of foreign currency contracts.
Available Information on Our Website
We make available through our company website, free of charge, our company filings with the Securities and Exchange Commission (SEC) as soon as reasonably practicable after we electronically file them with, or furnish them to, the SEC. These include our annual reports on Form 10-K, quarterly reports on Form 10-Q, current reports on Form 8-K, proxy statements, registration statements, and any amendments to those documents. The company website link to our SEC filings is
http://investor.lilly.com/sec.cfm
.
In addition, the Corporate Governance portion of our website includes our corporate governance guidelines, board and committee information (including committee charters), and our articles of incorporation and by-laws. The link to our corporate governance information is
http://www.lilly.com/about/corporate-governance/Pages/corporate-governance.aspx.
We will provide paper copies of our SEC filings free of charge upon request to the company’s secretary at the address listed on the front of this Form 10-K.
|
Item 1A.
|
Risk Factors
|
In addition to the other information contained in this Form 10-K, the following risk factors should be considered carefully in evaluating our company. It is possible that our business, financial condition, liquidity, or results of operations could be materially adversely affected by any of these risks.
|
•
|
Pharmaceutical research and development is very costly and highly uncertain; we may not succeed in developing or acquiring commercially successful products sufficient in number or value to replace revenues of products losing intellectual property protection.
|
There are many difficulties and uncertainties inherent in human pharmaceutical research and development and the introduction of new products. There is a high rate of failure inherent in new drug discovery and development. To bring a drug from the discovery phase to market typically takes over a decade and often costs well in excess of $1 billion. Failure can occur at any point in the process, including late in the process after substantial investment. As a result, most funds invested in research programs will not generate financial returns. New product candidates that appear promising in development may fail to reach the market or may have only limited commercial success because of efficacy or safety concerns, inability to obtain necessary regulatory approvals or payer reimbursement, limited scope of approved uses, difficulty or excessive costs to manufacture, or infringement of the patents or intellectual property rights of others. Regulatory agencies are establishing increasingly high hurdles for the efficacy and safety of new products; delays and uncertainties in drug approval processes can result in delays in product launches and lost market opportunity. In addition, it can be very difficult to predict sales growth rates of new products.
We cannot state with certainty when or whether our products now under development will be approved or launched; whether we will be able to develop, license or otherwise acquire additional product candidates or products; or whether our products, once launched, will be commercially successful. We must maintain a continuous flow of successful new products and successful new indications or brand extensions for existing products sufficient both to cover our substantial research and development costs and to replace sales that
are lost as profitable products lose intellectual property exclusivity or are displaced by competing products or therapies. Failure to do so in the short-term or long-term would have a material adverse effect on our business, results of operations, cash flows, financial position and prospects.
18
|
•
|
We face intense competition from multinational pharmaceutical companies, biotechnology companies, and lower-cost generic and biosimilar manufacturers.
|
We compete with a large number of multinational pharmaceutical companies, biotechnology companies, and generic pharmaceutical companies. To compete successfully, we must continue to deliver to the market innovative, cost-effective products that meet important medical needs. Our product revenues can be adversely affected by the introduction by competitors of branded products that are perceived as superior by the marketplace, by generic or biosimilar versions of our branded products, and by generic or biosimilar versions of other products in the same therapeutic class as our branded products. Our revenues can also be adversely affected by treatment innovations that eliminate or minimize the need for treatment with drugs. See Item 1, “Business—Competition,” for more details.
|
•
|
We depend on products with intellectual property protection for most of our revenues, cash flows, and earnings; we have lost or will lose effective intellectual property protection for many of those products in the next several years, which may result in rapid and severe declines in revenues.
|
A number of our top-selling human pharmaceutical products have recently lost, or will lose in the next several years, significant patent protection and/or data protection in the United States (U.S.) as well as key countries outside the U.S., as illustrated in the tables below:
|
Product
|
U.S. Revenues
(2014)
($ in millions)
|
Percent of Worldwide Revenues
(2014)
|
Patent / Data Protection - U.S.
|
||
|
Alimta
|
$
|
1,229.5
|
|
6%
|
Compound patent plus pediatric exclusivity 2017;
Vitamin dosage regimen patent plus pediatric exclusivity 2022
|
|
Cialis
|
1,039.9
|
|
5%
|
Compound patent 2017
|
|
|
Forteo
|
539.0
|
|
3%
|
Formulation and related process patents 2018; use patents 2019
|
|
|
Strattera
|
452.5
|
|
2%
|
Use patent plus pediatric exclusivity 2017
|
|
|
Effient
|
394.5
|
|
2%
|
Compound patent 2017; use patents 2022
|
|
|
Evista
|
207.2
|
|
1%
|
Use patents March 2014
|
|
|
Product
|
Revenues Outside U.S.
(2014)
($ in millions)
|
Percent of Worldwide Revenues
(2014)
|
Patent / Data Protection - Major Europe / Japan
|
||
|
Alimta
|
$
|
1,562.5
|
|
8%
|
Major European countries: compound patent December 2015, vitamin dosage regimen patent 2021
Japan: compound patent December 2015, use patent to treat cancer concomitantly with vitamins 2021
|
|
Cialis
|
1,251.1
|
|
6%
|
Major European countries: compound patent 2017
|
|
|
Cymbalta
|
1,194.2
|
|
6%
|
Major European countries: data package protection 2014
Japan: data package protection 2018
|
|
|
Zyprexa
|
917.5
|
|
5%
|
Japan: Compound patent December 2015
|
|
|
Forteo
|
783.0
|
|
4%
|
Japan: Data package protection 2018; formulation and related process patent 2019
|
|
Certain other significant products no longer have effective exclusivity through patent protection or data protection. For non-biological products, loss of exclusivity (whether by expiration or as a consequence of litigation) typically results in the entry of one or more generic competitors, leading to a rapid and severe decline in revenues. For biological products (such as Humalog, Humulin, and Erbitux), loss of exclusivity may or may not result in the near-term entry of competitor versions (i.e., biosimilars) due to development timelines, manufacturing challenges, and/or uncertainties in the regulatory pathways for approval of the competitor versions. See Item 7, “Management’s Discussion and Analysis—Executive Overview—Other Matters,” and Item 1, "Business—Patents, Trademarks, and Other Intellectual Property Rights," for more details.
19
|
•
|
Our long-term success depends on intellectual property protection; if our intellectual property rights are invalidated, circumvented, or weakened, our business will be adversely affected.
|
Our long-term success depends on our ability to continually discover, develop, and commercialize innovative new pharmaceutical products. Without strong intellectual property protection, we would be unable to generate the returns necessary to support the enormous investments in research and development and capital as well as other expenditures required to bring new drugs to the market.
Intellectual property protection varies throughout the world and is subject to change over time. In the U.S., the Hatch-Waxman Act provides generic companies powerful incentives to seek to invalidate our human pharmaceutical patents; as a result, we expect that our U.S. patents on major pharmaceutical products will be routinely challenged, and there can be no assurance that our patents will be upheld. We face generic manufacturer challenges to our patents outside the U.S. as well. The entry of generic competitors typically results in rapid and severe declines in sales. In addition, competitors or other third parties may claim that our activities infringe patents or other intellectual property rights held by them. If successful, such claims could result in our being unable to market a product in a particular territory or being required to pay damages for past infringement or royalties on future sales. See Item 1, “Business—Patents, Trademarks, and Other Intellectual Property Rights,” Item 3, "Legal Proceedings," and Item 8, "Financial Statements and Supplementary Data—Note 15, Contingencies," for more details.
|
•
|
Our human pharmaceutical business is subject to increasing government price controls and other public and private restrictions on pricing, reimbursement, and access for our drugs.
|
In the U.S., prices for specialty and brand name pharmaceuticals, congressional investigations into manufacturer’s pricing policies, and the federal budget process continue to drive legislative debate. These policy and political issues increase the risk that taxes, fees, rebates or other federal measures may be enacted. As a result, pharmaceutical companies may see either a reduction in revenue or increase in expenses. President Obama’s fiscal year 2016 budget includes a number of key health legislative proposals affecting biopharmaceuticals, including a reduction in biologic data exclusivity, modifications to Medicare Parts B and D, and new language that would allow the Department of Health and Human Services to negotiate prices for biologics and drugs on the specialty tier in Part D. Savings projected under these proposals are targeted as a means to fund health care expenditures, such as the Medicare Sustainable Growth Rate, and non-health care expenditures. State and federal health care proposals, including price controls, continue to be debated, and if implemented could negatively affect future consolidated results of operations.
In the U.S. private sector, the growth of managed care organizations (MCOs) is also a major factor in the competitive marketplace for human pharmaceuticals. It is estimated that approximately two-thirds of the U.S. now participates in some form of managed care. MCOs have been consolidating into fewer, larger entities, thus enhancing their purchasing strength and importance. MCOs typically maintain formularies specifying which drugs are covered under their plans. Exclusion of a drug from a formulary can lead to its sharply reduced usage in the MCO patient population. Consequently, pharmaceutical companies compete aggressively to have their branded products included. Price is becoming an increasingly important factor in MCO formulary decisions, particularly in treatment areas in which the MCO has taken the position that multiple branded products are therapeutically comparable. These downward pricing pressures could negatively affect future consolidated results of opera
tions.
International operations also are generally subject to extensive price and market regulations. Cost-containment measures exist in a number of countries, including additional price controls and mechanisms to limit reimbursement for our products. Such policies are expected to increase in impact and reach, given the pressures on national and regional health care budgets that come from a growing aging population and ongoing economic challenges. In addition, governments in many emerging markets are becoming increasingly active in expanding health care system offerings. Given the budget challenges of increasing health care coverage for citizens, policies may be proposed that promote generics only and reduce current and future access to human pharmaceutical products.
We expect pricing, reimbursement, and access pressures from both governments and private payers inside and outside the U.S. to become more severe. See Item I, “Business—Regulations Affecting Human Pharmaceutical Pricing, Reimbursement, and Access,” for more details.
20
|
•
|
Unanticipated changes in our tax rates or exposure to additional tax liabilities could increase our income taxes and decrease our net income.
|
We are subject to income taxes in the U.S. and numerous foreign jurisdictions. Changes in the relevant tax laws, regulations, administrative practices, principles, and interpretations could adversely affect our future effective tax rates and results of operations. The U.S. and a number of other countries are actively considering changes in this regard. The Obama administration has proposed changes to the manner in which the U.S. would tax the international income of U.S.-based companies, including unremitted earnings of foreign subsidiaries. There have also been tax proposals under discussion or introduced in the U.S. Congress that could change the manner in which, and rate at which, income of U.S. companies would be taxed. While it is uncertain how the U.S. Congress may address U.S. tax policy matters in the future, reform of U.S. taxation, including taxation of international income, will continue to be a topic of discussion for the U.S. Congress and the Obama administration. Additionally, the Organisation for Economic Co-operation and Development launched and continues to advance an initiative to analyze and potentially influence international tax policy in major countries in which we operate. A significant change to the U.S. or international tax framework, including changes to the taxation of international income, could have a material adverse effect on our results of operations. See Item 8, "Financial Statements and Supplementary Data—Note 13, Income Taxes," for more details.
|
•
|
Changes in foreign currency rates can significantly affect our revenue and income.
|
As a global company with substantial operations outside the U.S., we face foreign currency risk exposure from fluctuating currency exchange rates, primarily the U.S. dollar against the euro, Chinese yuan, and the Japanese yen, and the British pound against the euro. While we manage a portion of these exposures through hedging and other risk management techniques, significant fluctuations in currency rates can have a substantial impact, either positive or negative, on our revenue, cost of sales, and operating expenses.
|
•
|
Regulatory compliance problems could be damaging to the company.
|
The marketing, promotional, and pricing practices of human pharmaceutical manufacturers, as well as the manner in which manufacturers interact with purchasers, prescribers, and patients, are subject to extensive regulation. Many companies, including Lilly, have been subject to claims related to these practices asserted by federal, state and foreign governmental authorities, private payers, and consumers. These claims have resulted in substantial expense and other significant consequences to us. It is possible that we could become subject to such investigations and that the outcome could include criminal charges and fines, penalties, or other monetary or non-monetary remedies, including exclusion from U.S. federal and other health care programs. In addition, regulatory issues concerning compliance with current Good Manufacturing Practices regulations (and comparable foreign regulations) for pharmaceutical products can lead to product recalls and seizures, interruption of production leading to product shortages, and delays in the approvals of new products pending resolution of the issues. See Item 1, “Business—Regulation of our Operations,” for more details.
|
•
|
Pharmaceutical products can develop unexpected safety or efficacy concerns, which could have a material adverse effect on revenues and income.
|
Human pharmaceutical products receive regulatory approval based on data obtained in controlled clinical trials of limited duration. After approval, the products are used for longer periods of time by much larger numbers of patients; we and others (including regulatory agencies and private payers) collect extensive information on the efficacy and safety of our marketed products by continuously monitoring the use of our products in the marketplace. In addition, we or others may conduct post-marketing clinical studies on efficacy and safety of our marketed products. New safety or efficacy data from both market surveillance and post-marketing clinical studies may result in product label changes that could reduce the product's market acceptance and result in declining sales. Serious safety or efficacy issues that arise after approval for marketing could result in voluntary or mandatory product recalls or withdrawals from the market. Safety issues could also result in costly product liability claims.
|
•
|
We face many product liability claims and are self-insured; we could face large numbers of claims in the future, which could adversely affect our business.
|
We are subject to a substantial number of product liability claims involving primarily Byetta
®
, Prozac, and Actos
®
. See Item 8, “Financial Statements and Supplementary Data—Note 15, Contingencies,” and Item 3, “Legal Proceedings,” for more information on our current product liability litigation. Because of the nature of pharmaceutical products, we could become subject to large numbers of product liability claims for these or
21
other products in the future, which could require substantial expenditures to resolve and, if involving marketed products, could adversely affect sales of the product. Due to a very restrictive market for product liability insurance, we are self-insured for product liability losses for all our currently marketed products.
|
•
|
Manufacturing difficulties or disruptions could lead to product supply problems.
|
Pharmaceutical manufacturing is complex and highly regulated. Manufacturing difficulties at our facilities or contracted facilities, or the failure or refusal of a contract manufacturer to supply contracted quantities, could result in product shortages, leading to lost revenue. Such difficulties or disruptions could result from quality or regulatory compliance problems, natural disasters, or inability to obtain sole-source raw or intermediate materials. In addition, given the difficulties in predicting sales of new products and the very long lead times necessary for the expansion and regulatory qualification of pharmaceutical manufacturing capacity, it is possible that we could have difficulty meeting demand for new products. See Item 1, “Business—Raw Materials and Product Supply,” for more details.
|
•
|
We depend on information technology systems and infrastructure to operate our business; system inadequacies or operating failures could harm our business.
|
We rely to a large extent on the efficient and uninterrupted operation of complex information technology systems and networks, some of which are within the company and some of which are outsourced. These systems and networks are potentially vulnerable to damage or interruption from a variety of sources, including energy or telecommunications failures, breakdowns, natural disasters, terrorism, war, computer malware or other malicious intrusions, and random attacks. To date, system interruptions have been infrequent and have not had a material impact on our consolidated results of operations. We have implemented extensive measures to prevent, respond to, and minimize the impact of system interruptions. However, there can be no assurance that these efforts will prevent future interruptions that would have a material adverse effect on our business.
|
•
|
The loss, theft, or inadvertent disclosure of our confidential data could impair our valuable intellectual property, harm our competitive position, and expose us to regulatory penalties and other costs.
|
A great deal of confidential information owned by both Lilly and our alliances is stored in our information systems, networks, and facilities at third parties. This includes valuable trade secrets and intellectual property, corporate strategic plans, marketing plans, customer information, and personally identifiable information (such as employee and patient information). Some of this information is created, accessed, and/or maintained by third parties. The confidentiality of this information may be breached in a variety of ways, including but not limited to negligent or wrongful conduct by employees or others with permitted access to our systems and data, or wrongful conduct by certain governments, hackers, unethical competitors, or former workforce members. The rapid growth of social media exacerbates the risk of information security breaches.
The theft or unauthorized disclosure of confidential information could impair our ability to secure and maintain intellectual property rights, cause damage to company operations and reputation, and cause us to lose other competitive advantages. Unauthorized disclosure of personally identifiable information could expose us to sanctions for violations of data privacy laws and regulations and could damage the public trust in our company. Information security breaches may be very difficult to detect, and once detected, their impact may be very difficult to assess. To date, the information security breaches of which we have become aware have been infrequent in occurrence and, to the extent we have been able to measure their financial impact on our consolidated results of operations, such impact has not been material. We have invested and continue to invest to prevent, monitor, detect, and respond to information security breaches by strengthening our employee awareness and training, information technology systems, and business processes, and strengthening data protection requirements for third parties that handle our confidential information. However, despite these efforts, we expect information security breaches to continue, and there can be no assurance that these efforts will prevent information security breaches that would have a material adverse effect on our business.
|
•
|
Reliance on third-party relationships and outsourcing arrangements could adversely affect our business.
|
We utilize third parties, including suppliers, alliances with other pharmaceutical and biotechnology companies, and third-party service providers, for selected aspects of product development, the manufacture and commercialization of certain products, support for information technology systems, and certain financial
22
transactional processes. For example, we outsource the day-to-day management and oversight of our clinical trials to contract research organizations. Outsourcing these functions involves the risk that the third parties may not perform to our standards or legal requirements, may not produce reliable results, may not perform in a timely manner, may not maintain the confidentiality of our proprietary information, or may fail to perform at all. Failure of these third parties to meet their contractual, regulatory, confidentiality, or other obligations to us could have a material adverse effect on our business.
|
•
|
Our animal health segment faces risks related to increased generic competition, food and animal safety concerns, factors affecting global agricultural markets, and other risks.
|
The animal health operating segment may be impacted by, among other things, increased generic competition; increased sales of companion animal products by non-veterinarian retail outlets; emerging restrictions and bans on the use of antibacterials in food-producing animals; perceived adverse effects on human health linked to the consumption of food derived from animals that utilize our products; increased regulation or decreased governmental support relating to the raising, processing, or consumption of food-producing animals; an outbreak of infectious disease carried by animals; adverse weather conditions and the availability of natural resources; adverse global economic conditions affecting agricultural markets; and failure of the research and development, acquisition, and licensing efforts to generate new products. The failure to manage these risks could have a material adverse effect on our revenues.
|
•
|
Integration of the newly-acquired Novartis Animal Health business could be disruptive to operations, and if not done properly, could lead to a failure to achieve the intended benefits of the acquisition.
|
We are in the process of integrating into our operations the Novartis Animal Health business, which we purchased in January 2015. This global integration is complex and potentially disruptive to the ongoing operations of both the ongoing Elanco business and the acquired Novartis business. Unexpected delays and difficulties in integrating the two businesses could lead to additional expenses, failure to achieve expected operating efficiencies and sales synergies, and disruption to ongoing operating results.
|
•
|
Worsening economic conditions could adversely affect our business and operating results.
|
While human pharmaceuticals have not generally been sensitive to overall economic cycles, prolonged economic slowdowns could lead to decreased utilization of drugs, affecting our sales volume. Declining tax revenues attributable to economic downturns increase the pressure on governments to reduce health care spending, leading to increasing government efforts to control drug prices and utilization. Additionally, some customers, including governments or other entities reliant upon government funding, may be unable to pay in a timely manner for our products. Also, if our customers, suppliers, or collaboration partners experience financial difficulties, we could experience slower customer collections, greater bad debt expense, and performance defaults by suppliers or collaboration partners.
|
Item 1B.
|
Unresolved Staff Comments
|
None.
|
Item 2.
|
Properties
|
Our principal domestic and international executive offices are located in Indianapolis. At
December 31, 2014
, we owned 12 production and distribution sites in the United States (U.S.) and Puerto Rico. Together with the corporate administrative offices, these facilities contain an aggregate of approximately 10.4 million square feet of floor area dedicated to production, distribution, and administration. Major production sites include Indianapolis and Clinton, Indiana; Carolina, Puerto Rico; and Branchburg, New Jersey.
We own production and distribution sites in 11 countries outside the U.S. and Puerto Rico, containing an aggregate of approximately 4.7 million square feet of floor area. Major production sites include facilities in France, the United Kingdom (U.K.), Spain, Ireland, Italy, and China.
In the U.S., our research and development facilities contain an aggregate of approximately 3.9 million square feet of floor area, primarily consisting of owned facilities located in Indianapolis. We also lease smaller sites in San Diego and New York City. Outside the U.S., we own smaller research and development facilities in the U.K. and Spain, and lease smaller sites in China.
23
We believe that none of our properties is subject to any encumbrance, easement, or other restriction that would detract materially from its value or impair its use in the operation of the business. The buildings we own are of varying ages and in good condition.
|
Item 3.
|
Legal Proceedings
|
We are a party to various currently pending legal actions, government investigations, and environmental proceedings, and we anticipate that such actions could be brought against us in the future. The most significant of these matters are described below or, as noted, in Item 8, "Financial Statements and Supplementary Data—Note 15, Contingencies." While it is not possible to determine the outcome of the legal actions, investigations, and proceedings brought against us, we believe that, except as otherwise specifically noted in Item 8—Note 15, the resolution of all such matters will not have a material adverse effect on our consolidated financial position or liquidity, but could be material to our consolidated results of operations in any one accounting period.
Legal Proceedings Described in Note 15 to the Consolidated Financial Statements
See Item 8, "Financial Statements and Supplementary Data—Note 15, Contingencies," for information on various legal proceedings, including but not limited to:
|
•
|
The patent litigation and administrative proceedings involving Alimta and Effient
|
|
•
|
The product liability litigation involving Actos, Byetta, and Prozac
|
|
•
|
The employee litigation in Brazil.
|
That information is incorporated into this Item by reference.
Other Product Liability Litigation
We are currently a defendant in a variety of other product liability lawsuits in the United States (U.S.).
In October 2012, we were named as a defendant in a purported class-action lawsuit in the U.S. District Court for the Central District of California (
Saavedra et al v. Eli Lilly and Company
) involving Cymbalta. The plaintiffs assert claims under the consumer protection statutes of four states and seek declaratory, injunctive, and monetary relief for various alleged economic injuries arising from discontinuing treatment with Cymbalta and purported to represent a class of all persons within the U.S. who purchased and/or paid for Cymbalta. In December 2014, the district court denied the plaintiffs' motion for class certification. Plaintiffs have filed a petition with the 9th Circuit Court of Appeals requesting permission to file an interlocutory appeal of the denial of class certification.
Additionally, we have been named in approximately 45 individual lawsuits filed in various federal courts by claimants alleging injuries arising from discontinuation of treatment with Cymbalta. Counsel for plaintiffs filed a petition seeking to have those cases and an unspecified number of future cases coordinated into a federal multi-district litigation (MDL) in the Central District of California. In December 2014, the Judicial Panel on Multidistrict Litigation denied the plaintiffs' petition for creation of an MDL.
We believe all these Cymbalta lawsuits and claims are without merit and are prepared to defend against them vigorously.
We have been named as a defendant in approximately 105 U.S. product liability lawsuits involving Axiron. In some of the cases other manufacturers of testosterone are named as co-defendants. These lawsuits have been consolidated in a federal MDL in the U.S. District Court for the Northern District of Illinois. The cases generally allege cardiovascular injuries. We believe these claims are without merit and are prepared to defend against them vigorously.
24
Other Patent Litigation
We have filed applications with the U.S. Food and Drug Administration (FDA) and regulators in Europe, Japan, and other countries seeking approval to market our new insulin glargine product following the expiration of the compound patent for insulin glargine (generally May 2015). In January 2014, Sanofi-Aventis U.S. LLC (Sanofi) filed a lawsuit against us in the U.S. District Court for the District of Delaware alleging patent infringement with respect to our product. Sanofi asserts infringement of three U.S. patents relating to pen injector devices and two U.S. patents relating to insulin glargine formulations. Under the Hatch-Waxman Act, the initiation of the lawsuit automatically invoked a stay of final FDA approval for a period of 30 months (until June 2016), which may be shortened in the event of an earlier court decision in our favor. In July 2014, Sanofi filed a second lawsuit against us in the same court alleging infringement of patents relating to the use of our insulin glargine formulation in a cartridge. In August 2014, we received tentative FDA approval for our insulin glargine product under the trade name Basaglar
®
, with final approval subject to the stay described above. Trials have been scheduled in the District of Delaware for September 2015 for the first lawsuit and March 2016 for the second lawsuit.
Legal proceedings are also underway in France, Japan, and Canada related to various patents asserted by Sanofi against our insulin glargine product. Sanofi has also asserted certain device patents against Humalog and Humulin pen devices in France and Japan in these proceedings. Proceedings brought in the U.K., which were related to device patents, were resolved in December 2014 with a declaration of non-infringement in favor of Lilly.
We do not believe our insulin glargine product infringes any valid claim of the asserted patents, and we believe we will prevail in the various proceedings related to the patents.
In Canada, several generic companies challenged the validity of our Zyprexa patent. In September 2012, the Canadian Court of Appeals affirmed the lower court's decision that the patent was invalid for lack of utility. In 2013, our petition for leave to appeal the decision to the Supreme Court of Canada was denied. Two of the generic companies, Apotex Inc. and Teva Canada Limited, pursued claims for damages arising from Lilly’s enforcement of the patent under Canadian regulations. In April 2014, the Supreme Court of Canada dismissed Apotex's damages suit. Teva's claim for damages remains, and the total amount of damages that may be awarded to Teva will be determined through a separate trial, which is scheduled for May 2016.
Marketing Practices Investigations
In August 2003, we received notice that the staff of the Securities and Exchange Commission (SEC) was conducting an investigation into the compliance by Lilly's Polish subsidiary with the U.S. Foreign Corrupt Practices Act of 1977 (FCPA). Subsequently, we were notified that the SEC had expanded its investigation to other countries and that the Department of Justice (DOJ) was conducting a parallel investigation. In December 2012, we announced that we had reached an agreement with the SEC to settle its investigation. The settlement relates to certain activities of Lilly subsidiaries in Brazil, China, Poland, and Russia from 1994 through 2009. Without admitting or denying the allegations, we consented to pay a civil settlement amount of $29.4 million and agreed to have an independent compliance consultant conduct a 60-day review of our internal controls and compliance program related to the FCPA. In January 2015, the DOJ advised us that they have closed their investigation into this matter.
Shareholder Derivative Litigation
In 2011, the company received a letter sent on behalf of shareholder Kim Barovic demanding that the board of directors cause the company to take (1) legal action against certain of its current and former officers and board members for allegedly causing damage to the company by failing to exercise proper oversight over the company’s compliance with the FCPA, and (2) all necessary actions to reform and improve certain corporate governance and internal procedures. The board established a committee of disinterested directors to consider the demands and determine what action, if any, the company should take in response. In February 2013, following its investigation, the committee determined, among other things, that it would not be in the best interests of the company to take any of the actions demanded by Ms. Barovic.
25
In August 2013, Ms. Barovic brought a shareholder derivative suit (
Barovic v. Lechleiter, et al.
), filed in Marion County (Indiana) Superior Court. The suit sought to maintain the action purportedly on behalf of the company against certain current and former directors and officers of the company, alleging breach of fiduciary duty, waste of corporate assets, and unjust enrichment. The company was named in the suit as a nominal defendant. The suit did not seek damages from the company, but instead requested damages in an unspecified amount and certain equitable relief on the company’s behalf.
In September 2014, following submission by the defendants of a motion to dismiss, Ms. Barovic agreed to voluntarily dismiss the suit without prejudice, subject to approval by the Superior Court. In October 2014, the Superior Court ordered the case dismissed without prejudice.
Other Matters
Under the Comprehensive Environmental Response, Compensation, and Liability Act, commonly known as "Superfund," we have been designated as one of several potentially responsible parties with respect to the cleanup of fewer than 10 sites. Under Superfund, each responsible party may be jointly and severally liable for the entire amount of the cleanup.
We are also a defendant in other litigation and investigations, including product liability, patent, employment, and premises liability litigation, of a character we regard as normal to our business.
|
Item 4.
|
Mine Safety Disclosures
|
Not applicable.
26
|
Item 5.
|
Market for the Registrant’s Common Equity, Related Stockholder Matters, and Issuer Purchases of Equity Securities
|
You can find information relating to the principal market for our common stock and related stockholder matters at Item 6, "Selected Financial Data (unaudited)" and Item 8, "Financial Statements and Supplementary Data—Note 19, Selected Quarterly Data (unaudited).” That information is incorporated here by reference.
The following table summarizes the activity related to repurchases of our equity securities during the fourth quarter ended
December 31, 2014
:
|
Period
|
Total Number of
Shares Purchased
(in thousands)
|
Average Price Paid
per Share
|
Total Number of Shares
Purchased as Part of
Publicly Announced
Plans or Programs
(in thousands)
|
Approximate Dollar Value
of Shares that May Yet Be
Purchased Under the
Plans or Programs
(dollars in millions)
|
||||||
|
October 2014
|
1,571.3
|
|
$
|
63.62
|
|
1,571.3
|
|
$
|
3,900.0
|
|
|
November 2014
|
2,972.5
|
|
67.26
|
|
2,972.5
|
|
3,700.0
|
|
||
|
December 2014
|
—
|
|
—
|
|
—
|
|
3,700.0
|
|
||
|
Total
|
4,543.8
|
|
66.00
|
|
4,543.8
|
|
||||
During the fourth quarter of
2014
, we repurchased
$300.0 million
of shares associated with our
$5.00 billion
share repurchase program announced in October 2013.
27
PERFORMANCE GRAPH
This graph compares the return on Lilly stock with that of the Standard & Poor’s 500 Stock Index and our peer group for the years
2010
through
2014
. The graph assumes that, on
December 31, 2009
, a person invested $100 each in Lilly stock, the S&P 500 Stock Index, and the peer groups' common stock. The graph measures total shareholder return, which takes into account both stock price and dividends. It assumes that dividends paid by a company are reinvested in that company’s stock.
Value of $100 Invested on Last Business Day of
2009
Comparison of Five-Year Cumulative Total Return Among Lilly, S&P 500 Stock Index, and Peer Group
(1)
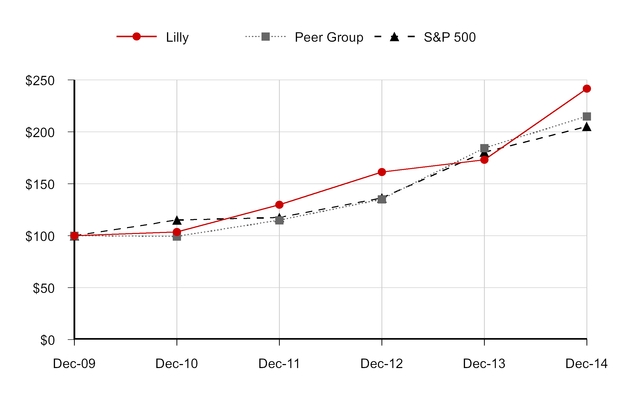
|
Lilly
|
Peer Group
|
S&P 500
|
||||||||||
|
Dec-09
|
$
|
100.00
|
|
$
|
100.00
|
|
$
|
100.00
|
|
|||
|
Dec-10
|
$
|
103.71
|
|
$
|
99.27
|
|
$
|
115.06
|
|
|||
|
Dec-11
|
$
|
129.79
|
|
$
|
114.89
|
|
$
|
117.49
|
|
|||
|
Dec-12
|
$
|
161.29
|
|
$
|
135.23
|
|
$
|
136.30
|
|
|||
|
Dec-13
|
$
|
172.96
|
|
$
|
184.35
|
|
$
|
180.44
|
|
|||
|
Dec-14
|
$
|
241.72
|
|
$
|
214.86
|
|
$
|
205.14
|
|
|||
|
1
|
We constructed the peer group as the industry index for this graph. It comprises the public companies in the pharmaceutical and biotech industries that we used to benchmark the compensation of executive officers for
2014
: Abbott Laboratories; AbbVie Inc.; Allergan Inc.; Amgen Inc.; AstraZeneca PLC; Baxter International Inc.; Biogen Idec Inc.; Bristol-Myers Squibb Company; Celgene Corporation; Gilead Sciences Inc.; GlaxoSmithKline plc; Johnson & Johnson; Medtronic, Inc.; Merck & Co., Inc.; Novartis AG.; Pfizer Inc.; and Sanofi-Aventis.
|
28
|
ELI LILLY AND COMPANY AND SUBSIDIARIES
(Dollars in millions, except revenue per employee and per-share data)
|
2014
|
2013
|
2012
|
2011
|
2010
|
||||||||||||||
|
Operations
|
|||||||||||||||||||
|
Revenue
|
$
|
19,615.6
|
|
$
|
23,113.1
|
|
$
|
22,603.4
|
|
$
|
24,286.5
|
|
$
|
23,076.0
|
|
||||
|
Cost of sales
|
4,932.5
|
|
4,908.1
|
|
4,796.5
|
|
5,067.9
|
|
4,366.2
|
|
|||||||||
|
Research and development
|
4,733.6
|
|
5,531.3
|
|
5,278.1
|
|
5,020.8
|
|
4,884.2
|
|
|||||||||
|
Marketing, selling, and administrative
|
6,620.8
|
|
7,125.6
|
|
7,513.5
|
|
7,879.9
|
|
7,053.4
|
|
|||||||||
|
Other
|
328.4
|
|
(341.2
|
)
|
(392.9
|
)
|
968.4
|
|
247.0
|
|
|||||||||
|
Income before income taxes
|
3,000.3
|
|
5,889.3
|
|
5,408.2
|
|
5,349.5
|
|
6,525.2
|
|
|||||||||
|
Income taxes
|
609.8
|
|
1,204.5
|
|
1,319.6
|
|
1,001.8
|
|
1,455.7
|
|
|||||||||
|
Net income
|
2,390.5
|
|
4,684.8
|
|
4,088.6
|
|
4,347.7
|
|
5,069.5
|
|
|||||||||
|
Net income as a percent of revenue
|
12.2
|
%
|
20.3
|
%
|
18.1
|
%
|
17.9
|
%
|
22.0
|
%
|
|||||||||
|
Net income per share—diluted
|
$
|
2.23
|
|
$
|
4.32
|
|
$
|
3.66
|
|
$
|
3.90
|
|
$
|
4.58
|
|
||||
|
Dividends declared per share
|
1.97
|
|
1.96
|
|
1.96
|
|
1.96
|
|
1.96
|
|
|||||||||
|
Weighted-average number of shares outstanding—diluted (thousands)
|
1,074,286
|
|
1,084,766
|
|
1,117,294
|
|
1,113,967
|
|
1,105,813
|
|
|||||||||
|
Financial Position
|
|||||||||||||||||||
|
Current assets
|
$
|
12,179.8
|
|
$
|
13,104.7
|
|
$
|
13,038.7
|
|
$
|
14,248.2
|
|
$
|
14,840.0
|
|
||||
|
Current liabilities
|
11,207.5
|
|
8,916.6
|
|
8,389.5
|
|
8,930.9
|
|
6,926.9
|
|
|||||||||
|
Property and equipment—net
|
7,963.9
|
|
7,975.5
|
|
7,760.2
|
|
7,760.3
|
|
7,940.7
|
|
|||||||||
|
Total assets
|
37,178.2
|
|
35,248.7
|
|
34,398.9
|
|
33,659.8
|
|
31,001.4
|
|
|||||||||
|
Long-term debt
|
5,367.7
|
|
4,200.3
|
|
5,519.4
|
|
5,464.7
|
|
6,770.5
|
|
|||||||||
|
Total equity
|
15,388.1
|
|
17,640.7
|
|
14,773.9
|
|
13,535.6
|
|
12,412.8
|
|
|||||||||
|
Supplementary Data
|
|||||||||||||||||||
|
Return on total equity
|
13.7
|
%
|
29.5
|
%
|
27.8
|
%
|
31.4
|
%
|
46.1
|
%
|
|||||||||
|
Return on assets
|
6.8
|
%
|
13.8
|
%
|
12.3
|
%
|
13.4
|
%
|
17.7
|
%
|
|||||||||
|
Capital expenditures
|
$
|
1,162.6
|
|
$
|
1,012.1
|
|
$
|
905.4
|
|
$
|
672.0
|
|
$
|
694.3
|
|
||||
|
Depreciation and amortization
|
1,379.0
|
|
1,445.6
|
|
1,462.2
|
|
1,373.6
|
|
1,328.2
|
|
|||||||||
|
Effective tax rate
|
20.3
|
%
|
20.5
|
%
|
24.4
|
%
|
18.7
|
%
|
22.3
|
%
|
|||||||||
|
Revenue per employee
|
$
|
501,000
|
|
$
|
609,000
|
|
$
|
590,000
|
|
$
|
638,000
|
|
$
|
602,000
|
|
||||
|
Number of employees
|
39,135
|
|
37,925
|
|
38,350
|
|
38,080
|
|
38,350
|
|
|||||||||
|
Number of shareholders of record
|
29,300
|
|
31,900
|
|
33,600
|
|
35,200
|
|
36,700
|
|
|||||||||
29
|
Item 7.
|
Management’s Discussion and Analysis of Results of Operations and Financial Condition
|
RESULTS OF OPERATIONS
Executive Overview
This section provides an overview of our financial results, recent product and late-stage pipeline developments, and other matters affecting our company and the pharmaceutical industry. Earnings per share (EPS) data are presented on a diluted basis.
Financial Results
Worldwide total revenue
decreased
15 percent
to
$19.62 billion
in
2014
, primarily as a result of the loss of United States (U.S.) patent exclusivity for Cymbalta
®
in December 2013 and to a lesser extent Evista
®
in March 2014, partially offset by volume growth in several other products. In
2014
, net income
decreased
49 percent
to
$2.39 billion
and EPS
decreased
48 percent
to
$2.23
, compared to
2013
net income and EPS of
$4.68 billion
and
$4.32
, respectively. The decreases were due to lower gross margin, higher asset impairment, restructuring, and other special charges and decreased other income, partially offset by lower marketing, selling, and administrative expenses, research and development expenses, and income tax expense.
The following highlighted items affect comparisons of our
2014
and
2013
financial results:
2014
Acquired In-Process Research & Development (IPR&D) (Notes 3 and 4 to the consolidated financial statements)
|
•
|
We recognized acquired IPR&D charges of
$200.2 million
(pretax), or $0.12 per share, related to acquired IPR&D from collaboration agreements with Adocia, AstraZeneca UK Limited, Boehringer Ingelheim, and Immunocore Limited.
|
Collaborations (Note 4 to the consolidated financial statements)
|
•
|
We recognized income of
$92.0 million
(pretax), or $0.06 per share, related to the transfer of our linagliptin and empagliflozin commercial rights in certain countries to Boehringer Ingelheim.
|
Asset Impairment, Restructuring, and Other Special Charges (Note 5 to the consolidated financial statements)
|
•
|
We recognized charges of
$468.7 million
(pretax), or $0.38 per share, related to severance costs associated with our ongoing cost containment efforts to reduce our cost structure and global workforce and asset impairments primarily associated with the closure of a manufacturing site in Puerto Rico.
|
Other
|
•
|
We recognized a marketing, selling, and administrative expense of $119.0 million (non-tax deductible), or $0.11 per share, for an extra year of the U.S. Branded Prescription Drug Fee (U.S. Drug Fee) due to final regulations issued by the Internal Revenue Service (IRS) which required us to accelerate into 2014 the recording of an expense for the 2015 fee.
|
30
2013
Acquired IPR&D (Note 3 to the consolidated financial statements)
|
•
|
We recognized acquired IPR&D charges of
$57.1 million
(pretax), or $0.03 per share, resulting from our acquisition of rights for a calcitonin gene-related peptide (CGRP) antibody currently being studied as a potential treatment for the prevention of frequent, recurrent migraine headaches, following a successful Phase II proof-of-concept study.
|
Collaborations (Note 4 to the consolidated financial statements)
|
•
|
We recognized income of $495.4 million (pretax), or $0.29 per share, related to the transfer to Amylin Pharmaceuticals, Inc. (Amylin) of exenatide commercial rights in all markets outside the United States.
|
Asset Impairment, Restructuring, and Other Special Charges (Note 5 to the consolidated financial statements)
|
•
|
We recognized charges of
$120.6 million
(pretax), or $0.08 per share, primarily related to severance costs for actions taken to reduce our cost structure and global workforce, as well as asset impairment costs associated with the closure of a packaging and distribution facility in Germany.
|
Late-Stage Pipeline
Our long-term success depends to a great extent on our ability to continue to discover and develop innovative pharmaceutical products and acquire or collaborate on molecules currently in development by other biotechnology or pharmaceutical companies. We currently have approximately
55
potential new drugs in human testing or under regulatory review, and a larger number of projects in preclinical research.
The following new molecular entities (NMEs) have been approved by regulatory authorities in the U.S., Europe, or Japan for use in the disease described. The quarter the NME initially was approved in the U.S., Europe, or Japan for any indication is shown in parentheses:
Dulaglutide* (Trulicity
™
) (Q3 2014)
—a long-acting analog of glucagon-like peptide 1 for the treatment of type 2 diabetes.
Empagliflozin (Jardiance
®
) (Q2 2014)
—a sodium glucose co-transporter-2 inhibitor for the treatment of type 2 diabetes (in collaboration with Boehringer Ingelheim).
New insulin glargine product (Q3 2014)
—a new insulin glargine product for the treatment of type 1 and type 2 diabetes (in collaboration with Boehringer Ingelheim).
Ramucirumab* (Cyramza
®
) (Q2 2014)
—an anti-vascular endothelial growth factor receptor-2 monoclonal antibody for the treatment of gastric cancer and non-small cell lung cancer (NSCLC).
The following NME has been submitted for regulatory review for potential use in the disease described. The quarter the NME initially was submitted for any indication is shown in parentheses:
Necitumumab* (Q4 2014)
—an anti-epidermal growth factor receptor monoclonal antibody for the treatment of squamous NSCLC.
The following NMEs are currently in Phase III clinical trial testing for potential use in the diseases described. The quarter in which each NME initially entered Phase III for any indication is shown in parentheses:
Abemaciclib (Q3 2014)
—a small molecule cell-cycle inhibitor, selective for cyclin-dependent kinases 4 and 6 for the treatment of metastatic breast cancer and NSCLC.
Baricitinib (Q4 2012)
—a Janus tyrosine kinase inhibitor for the treatment of rheumatoid arthritis (in collaboration with Incyte Corporation).
Basal insulin peglispro* (Q4 2011)
—a novel basal insulin for the treatment of type 1 and type 2 diabetes.
Evacetrapib (Q4 2012)
—a cholesteryl ester transfer protein inhibitor for the treatment of high-risk vascular disease.
Ixekizumab* (Q4 2011)
—a neutralizing monoclonal antibody to interleukin-17A for the treatment of psoriasis and psoriatic arthritis.
31
Solanezumab* (Q2 2009)
—an anti-amyloid beta monoclonal antibody for the treatment of mild Alzheimer’s disease.
Tanezumab* (Q3 2008)
—an anti-nerve growth factor monoclonal antibody for the treatment of osteoarthritis pain, chronic low back pain, and cancer pain (in collaboration with Pfizer Inc. (Pfizer)). Tanezumab is currently subject to a partial clinical hold by the U.S. Food and Drug Administration (FDA) (see Note 4 to the consolidated financial statements).
|
*
|
Biologic molecule subject to the U.S. Biologics Price Competition and Innovation Act
|
The following table reflects the status of each NME within our late-stage pipeline including developments since January 1,
2014
:
|
Compound
|
Indication
|
U.S.
|
Europe
|
Japan
|
Developments
|
|
Cardiovascular
|
|||||
|
Evacetrapib
|
High-risk vascular disease
|
Phase III
|
Phase III
|
Phase III
|
Studies are ongoing.
|
|
Endocrinology
|
|||||
|
Basal insulin peglispro
|
Type 1 diabetes
|
Phase III
|
Phase III
|
Phase III
|
Announced in September 2014 top-line results of two clinical trials which met primary endpoints.
|
|
Type 2 diabetes
|
Phase III
|
Phase III
|
Phase III
|
Announced in May 2014 top-line results of three clinical trials which met primary endpoints.
|
|
|
Jardiance
|
Type 2 diabetes
|
Approved
|
Approved
|
Approved
|
Approved in the U.S., Europe and Japan in August, May, and December 2014, respectively. Launched in the U.S. and certain European countries in third quarter of 2014.
Glyxambi
®
, combination tablet of empagliflozin and linagliptin, approved in the U.S. in January 2015. Intend to submit to European regulatory authorities in late 2015.
|
|
New insulin glargine product
|
Type 1 diabetes
|
Tentatively approved
|
Approved
|
Approved
|
FDA tentatively approved in August 2014, determining that it met all regulatory requirements for approval, but approval is subject to automatic stay in the U.S. of up to 30 months as a result of the patent litigation filed by Sanofi. Approved in Europe and Japan in September and December 2014, respectively. We will work with Boehringer Ingelheim to launch in Europe and Japan on dates that do not infringe valid and enforceable patents.
|
|
Type 2 diabetes
|
Tentatively approved
|
Approved
|
Approved
|
||
|
Trulicity
|
Type 2 diabetes
|
Approved
|
Approved
|
Submitted
|
Approved in the U.S. and Europe in September and November 2014, respectively. Launched in the U.S. in October 2014 and in certain European countries in first quarter of 2015. Submitted to regulatory authorities in Japan in third quarter of 2014.
|
32
|
Compound
|
Indication
|
U.S.
|
Europe
|
Japan
|
Developments
|
|
Immunology
|
|||||
|
Baricitinib
|
Rheumatoid arthritis
|
Phase III
|
Phase III
|
Phase III
|
Announced in December 2014 top-line results of RA-BEACON trial which met primary endpoint.
|
|
Ixekizumab
|
Psoriasis
|
Phase III
|
Phase III
|
Phase III
|
Announced in August 2014 top-line results of three trials which met all primary and secondary endpoints. Intend to submit the first application to regulatory authorities in the first half of 2015.
|
|
Psoriatic arthritis
|
Phase III
|
Phase III
|
Phase III
|
Studies are ongoing.
|
|
|
Tabalumab
|
Lupus
|
Terminated
|
Terminated
|
Terminated
|
Announced decision to stop development of tabalumab in October 2014 due to lack of efficacy.
|
|
Neuroscience
|
|||||
|
Solanezumab
|
Mild Alzheimer's disease
|
Phase III
|
Phase III
|
Phase III
|
Studies are ongoing.
|
|
Tanezumab
|
Osteoarthritis pain
|
Phase III
|
Phase III
|
Phase III
|
On partial clinical hold; expect resolution in 2015.
|
|
Chronic low back pain
|
Phase III
|
Phase III
|
Phase III
|
||
|
Cancer pain
|
Phase III
|
Phase III
|
Phase III
|
||
33
|
Compound
|
Indication
|
U.S.
|
Europe
|
Japan
|
Developments
|
|
Oncology
|
|||||
|
Abemaciclib
|
Metastatic breast cancer
|
Phase III
|
Phase III
|
Phase III
|
Initiated Phase III study of abemaciclib in combination with fulvestrant in August 2014.
Initiated Phase III study of abemaciclib in combination with aromatase inhibitors in November 2014.
|
|
NSCLC
|
Phase III
|
Phase III
|
Phase III
|
Initiated Phase III study of abemaciclib in KRAS mutation-positive NSCLC in December 2014.
|
|
|
Cyramza
|
Gastric cancer (first-line)
|
Phase III
|
Phase III
|
Phase III
|
Initiated Phase III study of Cyramza in first-line gastric cancer in January 2015.
|
|
Gastric cancer (second-line)
|
Approved
|
Approved
|
Submitted
|
Approved as monotherapy in the U.S. in April 2014. Launched in the U.S. in second quarter of 2014.
Approved in combination with paclitaxel in the U.S. in November 2014.
In Europe, approved in combination with paclitaxel and as monotherapy in patients for whom treatment in combination with paclitaxel is not appropriate in December 2014. Submitted to Japanese regulatory authorities in third quarter of 2014 with regulatory action anticipated in first half of 2015.
|
|
|
NSCLC (second-line)
|
Approved
|
Submitted
|
Phase III
|
Approved in the U.S. in December 2014. Submitted to European regulatory authorities in first quarter of 2015.
|
|
|
Liver cancer
|
Phase III
|
Phase III
|
Phase III
|
Announced in June 2014 that REACH trial did not meet its primary endpoint.
|
|
|
Metastatic colorectal cancer
|
Phase III
|
Phase III
|
Phase III
|
Announced in September 2014 that RAISE trial met its primary endpoint of overall survival. Intend to submit first application to regulatory authorities in first half of 2015.
|
|
|
Necitumumab
|
Squamous NSCLC
|
Submitted
|
Submitted
|
Phase Ib/II
|
Submitted in the U.S. and Europe in fourth quarter of 2014. Anticipate FDA action in late 2015.
|
There are many difficulties and uncertainties inherent in pharmaceutical research and development (R&D) and the introduction of new products. A high rate of failure is inherent in new drug discovery and development. The process to bring a drug from the discovery phase to regulatory approval can take 12 to 15 years or longer and cost more than $1 billion. Failure can occur at any point in the process, including late in the process after substantial investment. As a result, most research programs will not generate financial returns. New product candidates that appear promising in development may fail to reach the market or may have only limited commercial success. Delays and uncertainties in the regulatory approval processes in the U.S. and in other countries can result in delays in product launches and lost market opportunities. Consequently, it is very difficult to predict which products will ultimately be approved.
We manage R&D spending across our portfolio of molecules, and a delay in, or termination of, any one project will not necessarily cause a significant change in our total R&D spending. Due to the risks and
34
uncertainties involved in the R&D process, we cannot reliably estimate the nature, timing, completion dates, and costs of the efforts necessary to complete the development of our R&D projects, nor can we reliably estimate the future potential revenue that will be generated from a successful R&D project. Each project represents only a portion of the overall pipeline, and none is individually material to our consolidated R&D expense. While we do accumulate certain R&D costs on a project level for internal reporting purposes, we must make significant cost estimations and allocations, some of which rely on data that are neither reproducible nor validated through accepted control mechanisms. Therefore, we do not have sufficiently reliable data to report on total R&D costs by project, by preclinical versus clinical spend, or by therapeutic category.
Other Matters
Subsequent Event - Novartis Animal Health Acquisition
On January 1, 2015, we completed our acquisition of Novartis Animal Health (Novartis AH) in an all-cash transaction for approximately $5.4 billion. Novartis AH operates in approximately 40 countries. We acquired Novartis AH’s nine manufacturing sites, six dedicated research and development facilities, a global commercial infrastructure with a portfolio of approximately 600 products, a pipeline with more than 40 projects in development, and more than 3,000 employees. The combined organization is expected to increase our animal health product portfolio, expand our global commercial presence, and augment our animal health manufacturing and research and development. In particular, it is expected to provide Elanco with a greater commercial presence in the companion animal and swine markets, expand Elanco’s presence in equine and vaccines areas, and create an entry into the aquaculture market. As a condition to the clearance of the transaction under the Hart-Scott-Rodino Antitrust Improvement Act, following the closing of the acquisition of Novartis AH, we divested certain companion animal assets in the U.S. related to the Sentinel
®
canine parasiticide franchise to Virbac Corporation for approximately $410 million. The Novartis AH business we retained generated revenue of approximately $1.1 billion in 2014.
Patent Matters
We depend on patents or other forms of intellectual-property protection for most of our revenues, cash flows, and earnings. The loss of U.S. patent exclusivity for Cymbalta in December 2013 and Evista in March 2014, resulted in the immediate entry of generic competitors and a rapid and severe decline in revenue from the affected products, having a material adverse effect on our consolidated results of operations and cash flows.
We lost our data package protection for Cymbalta in major European countries in 2014 and we anticipate the entry of generic competition in these countries in 2015. We expect that the entry of generic competition for Cymbalta into the markets where it has lost patent protection would cause a rapid and severe decline in revenue, which would have a material adverse effect on our consolidated results of operations and cash flows. We will also lose patent exclusivity in December 2015 for Zyprexa
®
in Japan.
Additionally, as described in Note 15 to the consolidated financial statements, the Alimta
®
vitamin dosage regimen patent, which provides us with patent protection for Alimta through June 2021 in Japan and major European countries, and through May 2022 in the U.S., has been challenged in each of these jurisdictions. Our compound patent for Alimta will expire in the U.S. in January 2017, and in major European countries and Japan in December 2015. We expect that the entry of generic competition for Alimta into the markets where it has lost patent protection would cause a rapid and severe decline in revenue, which would have a material adverse effect on our consolidated results of operations and cash flows.
The U.S. compound patent for Humalog
®
expired in May 2013. Thus far, the loss of compound patent protection for Humalog has not resulted in a rapid and severe decline in revenue. To date, no biosimilar version of Humalog has been approved in the U.S. or Europe; however, we are aware that other manufacturers have efforts underway to develop biosimilar forms of Humalog, and it is difficult to predict the likelihood, timing, and impact of biosimilars entering the market.
35
Foreign Currency Exchange Rates
As a global company with substantial operations outside the U.S., we face foreign currency risk exposure from fluctuating currency exchange rates, primarily the U.S. dollar against the euro, Chinese yuan, and the Japanese yen, and the British pound against the euro. While we manage a portion of these exposures through hedging and other risk management techniques, significant fluctuations in currency rates can have a substantial impact, either positive or negative, on our revenue, cost of sales, and operating expenses. In 2014, we saw significant foreign currency rate fluctuations as the U.S. dollar strengthened compared to other foreign currencies, including the euro and the Japanese yen. While there is uncertainty in the future movements in foreign exchange rates, these fluctuations could negatively impact our future consolidated results of operations.
Trends Affecting Pharmaceutical Pricing, Reimbursement, and Access
United States
Prices for specialty and brand name pharmaceuticals, congressional investigations into manufacturer’s pricing policies, and the federal budget process continue to drive legislative debate. These policy and political issues increase the risk that taxes, fees, rebates or other federal measures may be enacted. As a result, pharmaceutical companies may see either a reduction in revenue or increase in expenses. President Obama’s fiscal year 2016 budget includes a number of key health legislative proposals affecting biopharmaceuticals, including a reduction in biologic data exclusivity, modifications to Medicare Parts B and D, and new language that would allow the Department of Health and Human Services to negotiate prices for biologics and drugs on the specialty tier in Part D. Savings projected under these proposals are targeted as a means to fund health care expenditures, such as the Medicare Sustainable Growth Rate, and non-health care expenditures. State and federal health care proposals, including price controls, continue to be debated, and if implemented could negatively affect future consolidated results of operations.
In the U.S. private sector, the growth of Managed Care Organizations (MCOs) is also a major factor in the competitive marketplace for human pharmaceuticals. It is estimated that approximately two-thirds of the U.S. now participates in some form of managed care. MCO’s have been consolidating into fewer, larger entities, thus enhancing their purchasing strength and importance. MCO’s typically maintain formularies specifying which drugs are covered under their plans. Exclusion of a drug from a formulary can lead to its sharply reduced usage in the MCO patient population. Consequently, pharmaceutical companies compete aggressively to have their branded products included. Price is becoming an increasingly important factor in MCO formulary decisions, particularly in treatment areas in which the MCO has taken the position that multiple branded products are therapeutically comparable. These downward pricing pressures could negatively impact future consolidated results of operations.
In 2014, the main coverage expansion provisions of the Affordable Care Act (ACA) took effect through both the launch of state-based exchanges and the expansion of Medicaid. An emerging trend has been the prevalence of benefit designs containing high out-of-pocket costs for patients, particularly for pharmaceuticals. In addition to the coverage expansions, many employers in the commercial market, driven in part by changes resulting from the ACA, continue to evaluate strategies such as private exchanges and wider use of consumer-driven health plans to reduce their healthcare liabilities over time. At the same time, the broader paradigm shift towards quality-based reimbursement and the launch of several value-based purchasing initiatives have placed demands on the pharmaceutical industry to offer products with proven real-world outcomes data and a favorable economic profile.
International
International operations also are generally subject to extensive price and market regulations. Cost-containment measures exist in a number of countries, including additional price controls and mechanisms to limit reimbursement for our products. Such policies are expected to increase in impact and reach, given the pressures on national and regional health care budgets that come from a growing aging population and ongoing economic challenges. In addition, governments in many emerging markets are becoming increasingly active in expanding health care system offerings. Given the budget challenges of increasing health care coverage for citizens, policies may be proposed that promote generics only and reduce current and future access to human pharmaceutical products.
36
Tax Matters
We are subject to income taxes in the U.S. and numerous foreign jurisdictions. Changes in the relevant tax laws, regulations, administrative practices, principles, and interpretations could adversely affect our future effective tax rates. The U.S. and a number of other countries are actively considering changes in this regard. For example, the Obama administration proposed changes to the manner in which the U.S. would tax the international income of U.S.-based companies, including unremitted earnings of foreign subsidiaries, and other tax proposals under discussion or introduced in the U.S. Congress could change the tax rate and manner in which U.S. companies would be taxed. Additionally, the Organisation for Economic Co-operation and Development launched and continues to advance an initiative to analyze and potentially influence international tax policy in major countries in which we operate. While outcomes of these initiatives are uncertain, changes to key elements of the U.S. or international tax framework could have a material effect on our consolidated operating results and cash flows.
Legal Matters
Information regarding contingencies relating to certain legal proceedings can be found in Note 15 to the consolidated financial statements and is incorporated here by reference.
Operating Results—
2014
Revenue
Our worldwide revenue for
2014
was
$19.62 billion
, a decline of
15 percent
compared with
2013
. This decrease was comprised of
13 percent
due to volume,
2 percent
due to the unfavorable impact of foreign exchange rates and
1 percent
due to lower prices (numbers do not add due to rounding). Total revenue in the U.S.
decreased
29 percent
, to
$9.13 billion
, due to lower demand for Cymbalta and Evista following patent expirations, and to a lesser extent, to wholesaler buying patterns. Revenue outside the U.S.
increased
3 percent
, to
$10.48 billion
, due to increased volume, partially offset by the unfavorable impact of foreign exchange rates.
The following table summarizes our revenue activity in
2014
compared with
2013
:
|
Year Ended
|
Year Ended
|
|||||||||||||||||
|
|
December 31, 2014
|
December 31, 2013
|
Percent
Change from
|
|||||||||||||||
|
Product
|
U.S.
(1)
|
Outside U.S.
|
Total
|
Total
|
2013
|
|||||||||||||
|
|
(Dollars in millions)
|
|||||||||||||||||
|
Alimta
|
$
|
1,229.5
|
|
$
|
1,562.5
|
|
$
|
2,792.0
|
|
$
|
2,703.0
|
|
3
|
|
||||
|
Humalog
|
1,627.6
|
|
1,157.6
|
|
2,785.2
|
|
2,611.2
|
|
7
|
|
||||||||
|
Cialis
®
|
1,039.9
|
|
1,251.1
|
|
2,291.0
|
|
2,159.4
|
|
6
|
|
||||||||
|
Cymbalta
|
420.5
|
|
1,194.2
|
|
1,614.7
|
|
5,084.4
|
|
(68
|
)
|
||||||||
|
Humulin
®
|
713.1
|
|
687.0
|
|
1,400.1
|
|
1,315.8
|
|
6
|
|
||||||||
|
Forteo
®
|
539.0
|
|
783.0
|
|
1,322.0
|
|
1,244.9
|
|
6
|
|
||||||||
|
Zyprexa
|
119.8
|
|
917.5
|
|
1,037.3
|
|
1,194.8
|
|
(13
|
)
|
||||||||
|
Strattera
®
|
452.5
|
|
286.0
|
|
738.5
|
|
709.2
|
|
4
|
|
||||||||
|
Effient
®
|
394.5
|
|
127.7
|
|
522.2
|
|
508.7
|
|
3
|
|
||||||||
|
Evista
|
207.2
|
|
212.6
|
|
419.8
|
|
1,050.4
|
|
(60
|
)
|
||||||||
|
Other pharmaceutical products
|
647.5
|
|
910.3
|
|
1,557.8
|
|
1,672.3
|
|
(7
|
)
|
||||||||
|
Animal health products
|
1,274.4
|
|
1,072.2
|
|
2,346.6
|
|
2,151.5
|
|
9
|
|
||||||||
|
Total net product sales
|
8,665.5
|
|
10,161.7
|
|
18,827.2
|
|
22,405.6
|
|
(16
|
)
|
||||||||
|
Collaboration and other revenue
(2)
|
468.6
|
|
319.8
|
|
788.4
|
|
707.5
|
|
11
|
|
||||||||
|
Total revenue
|
$
|
9,134.1
|
|
$
|
10,481.5
|
|
$
|
19,615.6
|
|
$
|
23,113.1
|
|
(15
|
)
|
||||
|
1
|
U.S. revenue includes revenue in Puerto Rico.
|
|
2
|
Collaboration and other revenue consists primarily of royalties for Erbitux
®
and revenue associated with Trajenta
®
.
|
37
Sales of Alimta, a treatment for various cancers,
increased
2 percent
in the U.S., driven by increased volume. Sales outside the U.S.
increased
5 percent
, driven by increased volume, partially offset by the unfavorable impact of foreign exchange rates and lower prices.
Sales of Humalog, our injectable human insulin analog for the treatment of diabetes,
increased
7 percent
in the U.S., driven by increased demand, partially offset by lower net effective selling prices as a result of payer contracts and greater Medicaid and Medicare utilization, as well as wholesaler buying patterns. Sales outside the U.S.
increased
6 percent
, driven by increased volume and, to a lesser extent, higher prices, partially offset by the unfavorable impact of foreign exchange rates.
Sales of Cialis, a treatment for erectile dysfunction and benign prostatic hyperplasia,
increased
10 percent
in the U.S., driven by higher prices, partially offset by wholesaler buying patterns. Sales outside the U.S.
increased
3 percent
, driven by higher prices and increased volume, partially offset by the unfavorable impact of foreign exchange rates.
Sales of Cymbalta, a product for the treatment of major depressive disorder, diabetic peripheral neuropathic pain, generalized anxiety disorder, and in the U.S. for the treatment of chronic musculoskeletal pain and the management of fibromyalgia,
decreased
89 percent
in the U.S. due to the loss of U.S. patent exclusivity in December 2013. Sales outside the U.S.
increased
6 percent
, driven by increased volume, partially offset by the unfavorable impact of foreign exchange rates.
Sales of Humulin, an injectable human insulin for the treatment of diabetes,
increased
5 percent
in the U.S., primarily driven by increased demand, partially offset by wholesaler buying patterns. Sales outside the U.S.
increased
8 percent
, driven by increased volume, partially offset by the unfavorable impact of foreign exchange rates.
Sales of Forteo, an injectable treatment for osteoporosis in postmenopausal women and men at high risk for fracture and for glucocorticoid-induced osteoporosis in men and postmenopausal women,
increased
5 percent
in the U.S., driven by higher prices, partially offset by decreased volume. Sales outside the U.S.
increased
7 percent
, driven by increased volume, primarily in Japan, partially offset by the unfavorable impact of foreign exchange rates, primarily the Japanese yen.
Sales of Zyprexa, a treatment for schizophrenia, acute mixed or manic episodes associated with bipolar I disorder, and bipolar maintenance,
decreased
3 percent
in the U.S. Sales outside the U.S.
decreased
14 percent
, driven by decreased volume, the unfavorable impact of foreign exchange rates, primarily the Japanese yen, and lower prices. We will lose patent exclusivity for Zyprexa in Japan in December 2015. Zyprexa sales in Japan were approximately $465 million in 2014, compared to approximately $510 million in 2013.
Sales of Strattera, a treatment for attention-deficit hyperactivity disorder,
increased
1 percent
in the U.S., driven by higher prices, partially offset by decreased volume. Sales outside the U.S.
increased
9 percent
, driven by increased volume, primarily in Japan, partially offset by the unfavorable impact of foreign exchange rates, primarily the Japanese yen.
Sales of Effient, a product for the reduction of thrombotic cardiovascular events (including stent thrombosis) in patients with acute coronary syndrome who are managed with an artery-opening procedure known as percutaneous coronary intervention, including patients undergoing angioplasty, atherectomy, or stent placement,
increased
5 percent
in the U.S., driven by higher prices, partially offset by wholesaler buying patterns. Sales outside the U.S.
decreased
3 percent
, driven by lower volume.
Sales of Evista, a product for the prevention and treatment of osteoporosis in postmenopausal women and for reduction of risk of invasive breast cancer in postmenopausal women with osteoporosis and postmenopausal women at high risk for invasive breast cancer,
decreased
73 percent
in the U.S., due to the loss of U.S. patent exclusivity in March 2014. Sales outside the U.S.
decreased
24 percent
, driven primarily by the expiration of a supply agreement in 2013, and to a lesser extent the unfavorable impact of foreign exchange rates.
Animal health product sales in the U.S.
increased
4 percent
, driven by increased volume in food animal products and higher prices, partially offset by decreased volume in companion animal products due to competitive pressure. Sales outside the U.S.
increased
16 percent
, driven by increased volume in food animal products, due in part to the acquisition of Lohmann SE (Lohmann AH) and, to a lesser extent, higher prices, partially offset by the unfavorable impact of foreign exchange rates.
38
Gross Margin, Costs, and Expenses
Gross margin as a percent of total revenue was
74.9 percent
in
2014
, a decrease of
3.9
percentage points compared with
2013
, driven primarily by lower sales of Cymbalta and Evista following U.S. patent expirations.
Research and development expenses
decreased
14 percent
to
$4.73 billion
in
2014
, driven primarily by lower late-stage clinical development costs. Research and development expenses in
2013
included
$97.2 million
of milestone payments made to Boehringer Ingelheim following regulatory submissions for empagliflozin.
Marketing, selling, and administrative expenses
decreased
7 percent
to
$6.62 billion
in
2014
, driven primarily by the reduction in U.S. sales and marketing activities for Cymbalta and Evista, as well as ongoing cost containment efforts, partially offset by an additional $119.0 million charge in
2014
associated with the U.S. Drug Fee, an annual non-tax deductible fee enacted by the Patient Protection and Affordable Care Act that is imposed on us and others engaged in the business of manufacturing or importing branded prescription drugs. The final regulations issued by the IRS in 2014, accelerated the expense recognition criteria for the fee obligation by one year, from the year in which the fee is paid to the year in which the sales used to calculate the fee occur. This change affected all entities conducting covered activities in 2014 and resulted in the need to expense two years of the U.S. Drug Fee in 2014 to account for the fee imposed and paid in 2014 and the fee that will be imposed and paid in 2015.
We recognized acquired IPR&D charges of
$200.2 million
in
2014
resulting from our collaboration agreements with Adocia, AstraZeneca, and Immunocore Limited in addition to charges associated with the transfer of commercial rights to us, from Boehringer Ingelheim, of the new insulin glargine product in certain countries where it is not yet approved. There were
$57.1 million
of acquired IPR&D charges in
2013
related to the acquisition of rights for the CGRP antibody. See Notes 3 and 4 to the consolidated financial statements for additional information.
We recognized asset impairment, restructuring, and other special charges of
$468.7 million
in
2014
. These charges included
$225.5 million
of severance costs related to ongoing efforts to reduce our cost structure and global workforce and
$243.2 million
of asset impairment and other special charges consisting primarily of a
$180.8 million
asset impairment charge related to our decision to close and sell a manufacturing plant located in Puerto Rico. In 2013, we recognized asset impairment, restructuring, and other special charges of
$120.6 million
. These charges included
$30.0 million
of asset impairments primarily associated with the closure of a packaging and distribution facility in Germany, and
$90.6 million
of severance costs to reduce our cost structure and global workforce. See Note 5 to the consolidated financial statements for additional information.
Other—net, (income) expense was income of
$340.5 million
in
2014
, compared with income of
$518.9 million
in
2013
. Other income in
2014
included net gains of $216.4 million on investments and $92.0 million of income related to the transfer of commercial rights to linagliptin and empagliflozin in certain countries from us to Boehringer Ingelheim. Other income in
2013
was primarily comprised of
$495.4 million
related to the termination of the exenatide collaboration with Amylin. See Notes 4 and 17 to the consolidated financial statements for additional information.
Our effective tax rate was
20.3 percent
in
2014
, compared with
20.5 percent
in
2013
. See Note 13 to the consolidated financial statements for additional information.
39
Operating Results—
2013
Financial Results
Worldwide total revenue increased 2 percent to $23.11 billion in 2013, driven by growth in several products, including Cialis, Humalog, Trajenta, Alimta, Forteo, and animal health products, partially offset by the continued erosion of Zyprexa sales following the loss of patent exclusivity in the U.S. and most major markets outside Japan. In 2013, net income increased 15 percent to $4.68 billion and EPS increased 18 percent to $4.32, compared to 2012 net income and EPS of $4.09 billion and $3.66, respectively. The increases were due to higher gross margin, lower marketing, selling, and administrative expenses, and, to a lesser extent, a lower effective tax rate, partially offset by higher research and development expenses and lower other income. EPS in 2013 also benefited from a lower number of shares outstanding as a result of our share repurchase programs.
The 2013 highlighted items are summarized in the "Executive Overview" section. The 2012 highlighted items are summarized as follows:
Collaborations (Note 4 to the consolidated financial statements)
|
•
|
We recognized income of $787.8 million (pretax), or $0.43 per share, related to the early payment of the exenatide revenue-sharing obligation following the completion of Amylin's acquisition by Bristol-Myers Squibb.
|
Asset Impairment, Restructuring, and Other Special Charges (Note 5 to the consolidated financial statements)
|
•
|
We recognized asset impairment, restructuring, and other special charges of $281.1 million (pretax), or $0.16 per share, consisting of an intangible asset impairment related to liprotamase, restructuring charges related to initiatives to reduce our cost structure and global workforce, charges associated with the decision to stop development of a delivery device platform, and charges related to changes in returns reserve estimates for the withdrawal of Xigris
™
.
|
Revenue
Our worldwide revenue for 2013 was $23.11 billion, a 2 percent increase compared with 2012 as an increase of 5 percent due to higher prices was partially offset by a decrease of 2 percent due to the unfavorable impact of foreign exchange rates and a 1 percent decrease due to lower volume. Total revenue in the U.S. increased 5 percent, to $12.89 billion, due to higher prices, partially offset by volume declines for Cymbalta and Zyprexa due to the loss of patent exclusivity. Revenue outside the U.S. decreased 1 percent, to $10.22 billion, due primarily to the unfavorable impact of the continued weakness of the Japanese yen and, to a lesser extent, lower prices, partially offset by increased volume.
40
The following table summarizes our revenue activity in 2013 compared with 2012:
|
Year Ended
|
Year Ended
|
|||||||||||||||||
|
|
December 31, 2013
|
December 31, 2012
|
Percent
Change from
|
|||||||||||||||
|
Product
|
U.S.
(1)
|
Outside U.S.
|
Total
|
Total
|
2012
|
|||||||||||||
|
(Dollars in millions)
|
||||||||||||||||||
|
Cymbalta
|
$
|
3,960.8
|
|
$
|
1,123.6
|
|
$
|
5,084.4
|
|
$
|
4,994.1
|
|
2
|
|
||||
|
Alimta
|
1,209.1
|
|
1,493.9
|
|
2,703.0
|
|
2,594.3
|
|
4
|
|
||||||||
|
Humalog
|
1,521.4
|
|
1,089.8
|
|
2,611.2
|
|
2,395.5
|
|
9
|
|
||||||||
|
Cialis
|
942.8
|
|
1,216.6
|
|
2,159.4
|
|
1,926.8
|
|
12
|
|
||||||||
|
Humulin
|
677.2
|
|
638.6
|
|
1,315.8
|
|
1,239.1
|
|
6
|
|
||||||||
|
Forteo
|
511.4
|
|
733.5
|
|
1,244.9
|
|
1,151.0
|
|
8
|
|
||||||||
|
Zyprexa
|
123.6
|
|
1,071.2
|
|
1,194.8
|
|
1,701.4
|
|
(30
|
)
|
||||||||
|
Evista
|
772.0
|
|
278.4
|
|
1,050.4
|
|
1,010.1
|
|
4
|
|
||||||||
|
Strattera
|
446.3
|
|
262.9
|
|
709.2
|
|
621.4
|
|
14
|
|
||||||||
|
Effient
|
376.9
|
|
131.8
|
|
508.7
|
|
457.2
|
|
11
|
|
||||||||
|
Other pharmaceutical products
|
639.5
|
|
1,032.8
|
|
1,672.3
|
|
1,843.0
|
|
(9
|
)
|
||||||||
|
Animal health products
|
1,226.6
|
|
924.9
|
|
2,151.5
|
|
2,036.5
|
|
6
|
|
||||||||
|
Total net product sales
|
12,407.6
|
|
9,998.0
|
|
22,405.6
|
|
21,970.4
|
|
2
|
|
||||||||
|
Collaboration and other revenue
(2)
|
482.1
|
|
225.4
|
|
707.5
|
|
633.0
|
|
12
|
|
||||||||
|
Total revenue
|
$
|
12,889.7
|
|
$
|
10,223.4
|
|
$
|
23,113.1
|
|
$
|
22,603.4
|
|
2
|
|
||||
|
1
|
U.S. revenue includes revenue in Puerto Rico.
|
|
2
|
Collaboration and other revenue in 2013 consists primarily of royalties for Erbitux and revenue associated with Trajenta. Collaboration and other revenue in 2012 also includes revenue associated with exenatide in the United States.
|
Sales of Cymbalta increased 1 percent in the U.S., driven by higher prices, largely offset by lower demand due to the loss of U.S. patent exclusivity in December 2013. Sales outside the U.S. increased 4 percent, driven primarily by increased volume, partially offset by lower prices and the unfavorable impact of foreign exchange rates.
Sales of Alimta increased 8 percent in the U.S., due to higher prices and increased demand. Sales outside the U.S. increased 1 percent, driven by increased volume, partially offset by the unfavorable impact of foreign exchange rates and lower prices.
Sales of Humalog increased 11 percent in the U.S., driven by higher prices, wholesaler buying patterns, and increased demand. Sales outside the U.S. increased 6 percent, driven by increased volume, partially offset by the unfavorable impact of foreign exchange rates.
Sales of Cialis increased 21 percent in the U.S., driven by higher prices. Sales outside the U.S. increased 6 percent, driven by higher prices and increased volume, partially offset by the unfavorable impact of foreign exchange rates.
Sales of Humulin increased 14 percent in the U.S., driven by higher prices, partially offset by decreased demand. Sales outside the U.S. decreased 1 percent, driven by the unfavorable impact of foreign exchange rates, partially offset by increased volume.
Sales of Forteo increased 5 percent in the U.S., driven primarily by higher prices. Sales outside the U.S. increased 11 percent, due to increased volume, primarily in Japan, partially offset by the unfavorable impact of foreign exchange rates.
Sales of Zyprexa decreased 66 percent in the U.S. due to continued erosion following patent expiration in late 2011. Sales outside the U.S. decreased 20 percent, driven by the unfavorable effect of foreign exchange rates, lower volume in markets outside of Japan, and lower prices.
41
Sales of Evista increased 10 percent in the U.S., driven by higher prices, partially offset by decreased demand. Sales outside the U.S. decreased 10 percent, driven by the unfavorable impact of foreign exchange rates and lower prices, partially offset by increased volume in Japan.
Sales of Strattera increased 16 percent in the U.S., driven primarily by higher prices. Sales outside the U.S. increased 11 percent, driven primarily by increased volume in Japan, partially offset by lower prices and the unfavorable impact of foreign exchange rates.
Sales of Effient increased 11 percent in the U.S., driven primarily by higher prices. Sales outside the U.S. increased 12 percent, driven primarily by increased volume.
Animal health product sales in the U.S. increased 6 percent driven primarily by increased volume for Trifexis
®
and, to a lesser extent, higher prices. Sales outside the U.S. increased 6 percent, driven by increased volume and, to a lesser extent, higher prices, partially offset by the unfavorable impact of foreign exchange rates.
Gross Margin, Costs, and Expenses
Gross margin as a percent of total revenue remained at 78.8 percent in 2013 as higher prices were offset by the adverse impact of foreign exchange rates on international inventories sold, which significantly decreased the cost of sales in 2012.
Marketing, selling, and administrative expenses decreased 5 percent to $7.13 billion in 2013, driven primarily by lower selling and marketing expenses resulting from ongoing cost-containment efforts, including a reduction in U.S. sales and marketing activities in anticipation of the loss of patent exclusivity for Cymbalta and Evista, as well as the impact of foreign exchange rates.
Research and development expenses increased 5 percent to $5.53 billion in 2013, due to higher research and clinical development expenses, including $97.2 million of milestone payments made to Boehringer Ingelheim following regulatory submissions for empagliflozin.
We recognized an acquired IPR&D charge of $57.1 million in 2013 resulting from our acquisition of a CGRP antibody. There were no acquired IPR&D charges in 2012. See Note 3 to the consolidated financial statements for additional information.
We recognized asset impairment, restructuring, and other special charges of $120.6 million in 2013. These charges included $30.0 million of asset impairments primarily associated with the anticipated closure of a packaging and distribution facility in Germany, and $90.6 million of severance costs to reduce our cost structure and global workforce. In 2012, we recognized asset impairment, restructuring, and other special charges of $281.1 million. These charges included $122.6 million related to an intangible asset impairment for liprotamase, $74.5 million related to restructuring to reduce our cost structure and global workforce, $64.0 million related to the asset impairment of a delivery device platform, and $20.0 million related to the withdrawal of Xigris. See Note 5 to the consolidated financial statements for additional information.
Other—net, (income) expense was income of $518.9 million in 2013, compared with income of $674.0 million in 2012. The decrease was driven primarily by lower income related to the termination of the exenatide collaboration with Amylin of $495.4 million in 2013 compared with $787.8 million in 2012, partially offset by milestone payments received from Boehringer Ingelheim for regulatory submissions in the U.S., Europe, and Japan. See Notes 4 and 17 to the consolidated financial statements for additional information.
Our effective tax rate was 20.5 percent in 2013, compared with 24.4 percent in 2012. The 2012 effective tax rate reflected the expiration of the R&D tax credit at the end of 2011 and the tax impact of the payment received from Amylin, partially offset by the tax benefit related to the intangible asset impairment for liprotamase. The decrease in the 2013 effective tax rate reflects the reinstatement of the R&D tax credit in the U.S. effective January 1, 2013 as well as the one-time impact of the reinstatement of the R&D tax credit for 2012 that was recorded in the first quarter of 2013. See Note 13 to the consolidated financial statements for additional information.
FINANCIAL CONDITION
As of
December 31, 2014
, cash and cash equivalents remained essentially unchanged at
$3.87 billion
compared with
$3.83 billion
at
December 31, 2013
. Significant sources of cash included cash flows from
42
operations of
$4.37 billion
, net proceeds from investment transactions of
$3.62 billion
, and net proceeds from the issuance of short- and long-term debt of
$2.64 billion
. Significant uses of cash included dividends paid of
$2.10 billion
, purchases of property and equipment of
$1.16 billion
, share repurchases of
$800.0 million
, and the acquisition of Lohmann AH which amounted to
$551.4 million
. We also held
$5.41 billion
of cash in escrow associated with the pending close of the Novartis AH acquisition which was reflected as restricted cash as of
December 31, 2014
. In January 2015, we completed our acquisition of Novartis AH for approximately $5.4 billion in an all-cash transaction. See "Executive Overview—Other Matters" for additional details.
In addition to our cash and cash equivalents, we held total investments of
$5.52 billion
and
$9.19 billion
as of
December 31, 2014
and
December 31, 2013
, respectively. See Note 7 to the consolidated financial statements for additional details.
As of
December 31, 2014
, total debt was
$8.06 billion
, an increase of
$2.84 billion
compared with
$5.21 billion
at
December 31, 2013
. The increase is due primarily to the increase in short-term commercial paper borrowings of
$2.68 billion
used primarily to finance the acquisition of Novartis AH. At
December 31, 2014
, we had a total of
$3.31 billion
of unused committed bank credit facilities,
$3.20 billion
of which is available to support our commercial paper program. Subject to market conditions, we intend to replace the majority of our commercial paper borrowings with fixed-rate long term notes in the first half of 2015. See Note 10 to the consolidated financial statements for additional details. We believe that amounts accessible through existing commercial paper markets should be adequate to fund short-term borrowing needs.
For the 130th consecutive year, we distributed dividends to our shareholders. Dividends of $1.96 per share were paid in both
2014
and
2013
. In the fourth quarter of
2014
, effective for the dividend to be paid in the first quarter of
2015
, the quarterly dividend was increased t
o $0.50 per share, resulting in an indicated annual rate for
2015
of $2.00 per share.
Capital expenditures of
$1.16 billion
during
2014
were
$150.5 million
more than in
2013
. We expect
2015
capital expenditures to be approximately $1.3 billion.
In
2014
, we repurchased
$800.0 million
of shares under the
$5.00 billion
share repurchase program previously announced in October 2013.
See "Executive Overview—Other Matters" for information regarding recent and upcoming losses of patent protection for Cymbalta (U.S. and Europe), Evista (U.S.), Alimta (U.S., Europe, and Japan), and Zyprexa (Japan).
At
December 31, 2014
, we had an aggregate of
$8.54 billion
of cash and investments at our foreign subsidiaries. A significant portion of this amount would be subject to tax payments if such cash and investments were repatriated to the United States. We record U.S. deferred tax liabilities for certain unremitted earnings, but when foreign earnings are expected to be indefinitely reinvested outside the U.S., no accrual for U.S. income taxes is provided. We believe cash provided by operating activities in the U.S. and planned repatriations of foreign earnings for which tax has been provided should be sufficient to fund our domestic operating needs, dividends paid to shareholders, share repurchases, and capital expenditures. Various risks and uncertainties, including those discussed in "Forward-Looking Statements" and Item 1A, “Risk Factors,” may affect our operating results and cash generated from operations.
Both domestically and abroad, we continue to monitor the potential impacts of the economic environment; the creditworthiness of our wholesalers and other customers, including foreign government-backed agencies and suppliers; the uncertain impact of health care legislation; and various international government funding levels.
In the normal course of business, our operations are exposed to fluctuations in interest rates and currency values. These fluctuations can vary the costs of financing, investing, and operating. We address a portion of these risks through a controlled program of risk management that includes the use of derivative financial instruments. The objective of controlling these risks is to limit the impact on earnings of fluctuations in interest and currency exchange rates. All derivative activities are for purposes other than trading.
Our primary interest rate risk exposure results from changes in short-term U.S. dollar interest rates. In an effort to manage interest rate exposures, we strive to achieve an acceptable balance between fixed and floating rate debt positions and may enter into interest rate derivatives to help maintain that balance. Based on our overall interest rate exposure at
December 31, 2014
and
2013
, including derivatives and other interest
43
rate risk-sensitive instruments, a hypothetical 10 percent change in interest rates applied to the fair value of the instruments as of
December 31, 2014
and
2013
, respectively, would not have a material impact on earnings, cash flows, or fair values of interest rate risk-sensitive instruments over a one-year period.
Our foreign currency risk exposure results from fluctuating currency exchange rates, primarily the U.S. dollar against the euro, Chinese yuan, and the Japanese yen, and the British pound against the euro. We face foreign currency exchange exposures primarily when we enter into transactions, generally on an intercompany basis, denominated in currencies other than the functional currency of the entity. We also face currency exposure that arises from translating the results of our global operations to the U.S. dollar at exchange rates that have fluctuated from the beginning of the period. We may enter into foreign currency forward or option derivative contracts to reduce the effect of fluctuating currency exchange rates (principally the euro, the British pound, and the Japanese yen). Our policy outlines the minimum and maximum hedge coverage of such exposures. Gains and losses on these derivative contracts offset, in part, the impact of currency fluctuations on the existing assets and liabilities. We analyze the fair values of the outstanding foreign currency derivative contracts to determine their sensitivity to changes in foreign exchange rates. A hypothetical 10 percent change in exchange rates (primarily against the U.S. dollar) applied to the fair values of our outstanding foreign currency derivative contracts as of
December 31, 2014
and
2013
, would not have a material impact on earnings, cash flows, or financial position over a one-year period. This sensitivity analysis does not consider the impact that hypothetical changes in exchange rates would have on the underlying foreign currency denominated transactions.
Off-Balance Sheet Arrangements and Contractual Obligations
We have no off-balance sheet arrangements that have a material current effect or that are reasonably likely to have a material future effect on our financial condition, changes in financial condition, revenues or expenses, results of operations, liquidity, capital expenditures, or capital resources. We acquire and collaborate on potential products still in development and enter into research and development arrangements with third parties that often require milestone and royalty payments to the third party contingent upon the occurrence of certain future events linked to the success of the asset in development. Milestone payments may be required contingent upon the successful achievement of an important point in the development life cycle of the pharmaceutical product (e.g., approval for marketing by the appropriate regulatory agency or upon the achievement of certain sales levels). If required by the arrangement, we may make royalty payments based upon a percentage of the sales of the pharmaceutical product in the event that regulatory approval for marketing is obtained. Because of the contingent nature of these payments, they are not included in the table of contractual obligations below.
Individually, these arrangements are not material in any one annual reporting period. However, if milestones for multiple products covered by these arrangements would happen to be reached in the same reporting period, the aggregate charge to expense could be material to the results of operations in that period. See Note 4 to the consolidated financial statements for additional details. These arrangements often give us the discretion to unilaterally terminate development of the product, which would allow us to avoid making the contingent payments; however, we are unlikely to cease development if the compound successfully achieves milestone objectives. We also note that, from a business perspective, we view these payments as positive because they signify that the product is successfully moving through development and is now generating or is more likely to generate cash flows from sales of products.
44
Our current noncancelable contractual obligations that will require future cash payments are as follows (in millions):
|
|
Payments Due by Period
|
||||||||||||||||||
|
Total
|
Less Than
1 Year
|
1-3
Years
|
3-5
Years
|
More Than
5 Years
|
|||||||||||||||
|
Short-term borrowings
|
$
|
2,680.6
|
|
$
|
2,680.6
|
|
$
|
—
|
|
$
|
—
|
|
$
|
—
|
|
||||
|
Long-term debt, including interest payments
(1)
|
8,168.6
|
|
185.9
|
|
1,588.7
|
|
1,143.3
|
|
5,250.7
|
|
|||||||||
|
Capital lease obligations
|
28.8
|
|
10.3
|
|
14.7
|
|
3.8
|
|
—
|
|
|||||||||
|
Operating leases
|
602.4
|
|
138.7
|
|
216.7
|
|
126.3
|
|
120.7
|
|
|||||||||
|
Purchase obligations
(2)
|
11,166.8
|
|
9,957.5
|
|
782.1
|
|
420.6
|
|
6.6
|
|
|||||||||
|
Other long-term liabilities reflected on our balance sheet
(3)
|
3,219.9
|
|
—
|
|
790.7
|
|
291.7
|
|
2,137.5
|
|
|||||||||
|
Total
|
$
|
25,867.1
|
|
$
|
12,973.0
|
|
$
|
3,392.9
|
|
$
|
1,985.7
|
|
$
|
7,515.5
|
|
||||
|
1
|
Our long-term debt obligations include both our expected principal and interest obligations and our interest rate swaps. We used the interest rate forward curve at
December 31, 2014
, to compute the amount of the contractual obligation for interest on the variable rate debt instruments and swaps.
|
|
2
|
We have included the following:
|
|
•
|
Purchase obligations consisting primarily of all open purchase orders as of
December 31, 2014
. Some of these purchase orders may be cancelable; however, for purposes of this disclosure, we have not distinguished between cancelable and noncancelable purchase obligations.
|
|
•
|
Contractual payment obligations with each of our significant vendors, which are noncancelable and are not contingent.
|
|
3
|
We have included long-term liabilities consisting primarily of our nonqualified supplemental pension funding requirements and deferred compensation liabilities. We excluded long-term income taxes payable of $998.5 million, because we cannot reasonably estimate the timing of future cash outflows associated with those liabilities.
|
The contractual obligations table is current as of
December 31, 2014
. We expect the amount of these obligations to change materially over time as new contracts are initiated and existing contracts are completed, terminated, or modified.
APPLICATION OF CRITICAL ACCOUNTING ESTIMATES
In preparing our financial statements in accordance with accounting principles generally accepted in the U.S., we must often make estimates and assumptions that affect the reported amounts of assets, liabilities, revenues, expenses, and related disclosures. Some of those judgments can be subjective and complex, and consequently actual results could differ from those estimates. For any given individual estimate or assumption we make, it is possible that other people applying reasonable judgment to the same facts and circumstances could develop different estimates. We believe that, given current facts and circumstances, it is unlikely that applying any such other reasonable judgment would cause a material adverse effect on our consolidated results of operations, financial position, or liquidity for the periods presented in this report. Our most critical accounting estimates have been discussed with our audit committee and are described below.
Revenue Recognition and Sales Return, Rebate, and Discount Accruals
We recognize revenue from sales of products at the time title of goods passes to the buyer and the buyer assumes the risks and rewards of ownership. Provisions for returns, rebates, and discounts are established in the same period the related sales are recorded.
We regularly review the supply levels of our significant products sold to major wholesalers in the U.S. and in major markets outside the U.S., primarily by reviewing periodic inventory reports supplied by our major wholesalers and available prescription volume information for our products, or alternative approaches. We attempt to maintain U.S. wholesaler inventory levels at an average of approximately one month or less on a consistent basis across our product portfolio. Causes of unusual wholesaler buying patterns include actual or anticipated product-supply issues, weather patterns, anticipated changes in the transportation network,
45
redundant holiday stocking, and changes in wholesaler business operations. In the U.S., the current structure of our arrangements does not provide an incentive for speculative wholesaler buying and provides us with data on inventory levels at our wholesalers. When we believe wholesaler purchasing patterns have caused an unusual increase or decrease in the sales of a major product compared with underlying demand, we disclose this in our product sales discussion if we believe the amount is material to the product sales trend; however, we are not always able to accurately quantify the amount of stocking or destocking in the retail channel. Wholesaler stocking and destocking activity historically has not caused any material changes in the rate of actual product returns.
When sales occur, we estimate a reserve for future product returns related to those sales. This estimate is based on several factors, including: historical return rates, expiration date by product (generally, 24 to 36 months after the initial sale of a product to our customer), and estimated levels of inventory in the wholesale and retail channels, among others, as well as any other specifically-identified anticipated returns due to known factors such as the loss of patent exclusivity, product recalls and discontinuances, or a changing competitive environment. We maintain a returns policy that allows U.S. pharmaceutical customers to return product for dating issues within a specified period prior to and subsequent to the product's expiration date. Following the loss of exclusivity for a patent-dependent product, we expect to experience an elevated level of product returns as product inventory remaining in the wholesale and retail channels expires. Adjustments to the returns reserve may be required in the future based on revised estimates to our assumptions, which would have an impact on our consolidated results of operations. We record the return amounts as a deduction to arrive at our net product sales. Once the product is returned, it is destroyed. Actual product returns have been less than 2 percent of our net sales over the past three years and have not fluctuated significantly as a percentage of sales. We expect the ratio of actual product returns as a percentage of net sales to increase in future periods as we begin to experience elevated return levels for Cymbalta following the recent loss of patent exclusivity in the U.S. market.
We establish sales rebate and discount accruals in the same period as the related sales. The rebate and discount amounts are recorded as a deduction to arrive at our net product sales. Sales rebates and discounts that require the use of judgment in the establishment of the accrual include Medicaid, managed care, Medicare, chargebacks, long-term care, hospital, patient assistance programs, and various other programs. We base these accruals primarily upon our historical rebate and discount payments made to our customer segment groups and the provisions of current rebate and discount contracts.
The largest of our sales rebate and discount amounts are rebates associated with sales covered by Medicaid and managed care contracts. In determining the appropriate accrual amount, we consider our historical Medicaid and managed care rebate payments by product as a percentage of our historical sales as well as any significant changes in sales trends (e.g., patent expiries), an evaluation of the current Medicaid and managed care contracts, the percentage of our products that are sold via Medicaid and managed care contracts, and our product pricing. Although we accrue a liability for Medicaid and managed care rebates at the time we record the sale (when the product is shipped), the Medicaid and managed care rebate related to that sale is typically paid up to six months later. Because of this time lag, in any particular period our rebate adjustments may incorporate revisions of accruals for several periods.
Most of our rebates outside the U.S. are contractual or legislatively mandated and are estimated and recognized in the same period as the related sales. In some large European countries, government rebates are based on the anticipated budget for pharmaceutical payments in the country. A best estimate of these rebates, updated as governmental authorities revise budgeted deficits, is recognized in the same period as the related sale. If our estimates are not reflective of the actual pharmaceutical costs incurred by the government, we adjust our rebate reserves.
We believe that our accruals for sales returns, rebates, and discounts are reasonable and appropriate based on current facts and circumstances. Our global rebate and discount liabilities are included in sales rebates and discounts on our consolidated balance sheet. Our global sales return liability is included in other current liabilities and other noncurrent liabilities on our consolidated balance sheet. As of
December 31, 2014
, a 5 percent change in our global sales return, rebate, and discount liability would lead to an approximate $137 million effect on our income before income taxes.
46
The portion of our global sales return, rebate, and discount liability resulting from sales of our products in the U.S. was 88 percent as of
December 31, 2014
and
2013
.
The following represents a roll-forward of our most significant U.S. sales return, rebate, and discount liability balances, including Medicaid and managed care (in millions):
|
2014
|
2013
|
||||||
|
Sales return, rebate, and discount liabilities, beginning of year
|
$
|
2,215.5
|
|
$
|
1,584.5
|
|
|
|
Reduction of net sales due to sales returns, discounts, and rebates
(1)
|
4,707.8
|
|
4,723.3
|
|
|||
|
Cash payments of discounts and rebates
|
(4,681.9
|
)
|
(4,092.3
|
)
|
|||
|
Sales return, rebate, and discount liabilities, end of year
|
$
|
2,241.4
|
|
$
|
2,215.5
|
|
|
|
1
|
Adjustments of the estimates for these returns, rebates, and discounts to actual results were less than
1.5 percent
of consolidated net sales for each of the years presented.
|
Product Litigation Liabilities and Other Contingencies
Product litigation liabilities and other contingencies are, by their nature, uncertain and are based upon complex judgments and probabilities. The factors we consider in developing our product litigation liability reserves and other contingent liability amounts include the merits and jurisdiction of the litigation, the nature and the number of other similar current and past litigation cases, the nature of the product and the current assessment of the science subject to the litigation, and the likelihood of settlement and current state of settlement discussions, if any. In addition, we accrue for certain product liability claims incurred, but not filed, to the extent we can formulate a reasonable estimate of their costs. We estimate these expenses based primarily on historical claims experience and data regarding product usage. We accrue legal defense costs expected to be incurred in connection with significant product liability contingencies when both probable and reasonably estimable.
We also consider the insurance coverage we have to diminish the exposure for periods covered by insurance. In assessing our insurance coverage, we consider the policy coverage limits and exclusions, the potential for denial of coverage by the insurance company, the financial condition of the insurers, and the possibility of and length of time for collection. Due to a very restrictive market for product liability insurance, we are self-insured for product liability losses for all our currently marketed products. In addition to insurance coverage, we also consider any third-party indemnification we have, including the nature of the indemnification, the financial condition of the indemnifying party, and the possibility of and length of time for collection.
The litigation accruals and environmental liabilities and the related estimated insurance recoverables have been reflected on a gross basis as liabilities and assets, respectively, on our consolidated balance sheets.
Pension and Retiree Medical Plan Assumptions
Pension benefit costs include assumptions for the discount rate, retirement age, and expected return on plan assets. Retiree medical plan costs include assumptions for the discount rate, retirement age, expected return on plan assets, and health-care-cost trend rates. These assumptions have a significant effect on the amounts reported. In addition to the analysis below, see Note 14 to the consolidated financial statements for additional information regarding our retirement benefits.
Annually, we evaluate the discount rate and the expected return on plan assets in our defined benefit pension and retiree health benefit plans. We use an actuarially determined, plan-specific yield curve of high quality, fixed income debt instruments to determine the discount rates. In evaluating the expected rate of return, we consider many factors, with a primary analysis of current and projected market conditions, asset returns and asset allocations (approximately
85 percent
of which are growth investments); and the views of leading financial advisers and economists. We may also review our historical assumptions compared with actual results, as well as the discount rates, expected return on plan assets, and health-care-cost trend rates of other companies, where applicable. In evaluating our expected retirement age assumption, we consider the retirement ages of our past employees eligible for pension and medical benefits together with our expectations of future retirement ages.
47
If the health-care-cost trend rates were to increase by one percentage point, the aggregate of the service cost and interest cost components of the
2014
annual expense would increase by
$7.8 million
. A one-percentage-point decrease would decrease the aggregate of the
2014
service cost and interest cost by
$6.6 million
. If the
2014
discount rate for the U.S. defined benefit pension and retiree health benefit plans (U.S. plans) were to change by a quarter percentage point, income before income taxes would change by
$35.4 million
. If the
2014
expected return on plan assets for U.S. plans were to change by a quarter percentage point, income before income taxes would change by
$21.7 million
. If our assumption regarding the
2014
expected age of future retirees for U.S. plans were adjusted by one year, our income before income taxes would be affected by
$49.9 million
. The U.S. plans, including Puerto Rico, represent approximately
80 percent
of both the total projected benefit obligation and total plan assets at
December 31, 2014
.
Impairment of Indefinite-Lived and Long-Lived Assets
We review the carrying value of long-lived assets (both intangible and tangible) for potential impairment on a periodic basis and whenever events or changes in circumstances indicate the carrying value of an asset may not be recoverable. We determine impairment by comparing the projected undiscounted cash flows to be generated by the asset to its carrying value. If an impairment is identified, a loss is recorded equal to the excess of the asset’s net book value over its fair value, and the cost basis is adjusted.
Goodwill and indefinite-lived intangible assets are reviewed for impairment at least annually and when certain impairment indicators are present. When required, a comparison of fair value to the carrying amount of assets is performed to determine the amount of any impairment.
Several methods may be used to determine the estimated fair value of acquired IPR&D, all of which require multiple assumptions. We utilize the “income method,” which applies a probability weighting that considers the risk of development and commercialization to the estimated future net cash flows that are derived from projected sales revenues and estimated costs. These projections are based on factors such as relevant market size, patent protection, historical pricing of similar products, and expected industry trends. The estimated future net cash flows are then discounted to the present value using an appropriate discount rate. This analysis is performed for each project independently.
For acquired IPR&D assets, the risk of failure has been factored into the fair value measure and there can be no certainty that these assets ultimately will yield a successful product, as discussed previously in the “Late-Stage Pipeline” section. The nature of the pharmaceutical business is high-risk and requires that we invest in a large number of projects to build a successful portfolio of approved products. As such, it is likely that some acquired IPR&D assets will become impaired in the future.
Estimates of future cash flows, based on what we believe to be reasonable and supportable assumptions and projections, require management’s judgment. Actual results could vary from these estimates.
Income Taxes
We prepare and file tax returns based on our interpretation of tax laws and regulations and record estimates based on these judgments and interpretations. In the normal course of business, our tax returns are subject to examination by various taxing authorities, which may result in future tax, interest, and penalty assessments by these authorities. Inherent uncertainties exist in estimates of many tax positions due to changes in tax law resulting from legislation, regulation, and/or as concluded through the various jurisdictions’ tax court systems. We recognize the tax benefit from an uncertain tax position only if it is more likely than not that the tax position will be sustained on examination by the taxing authorities, based on the technical merits of the position. The tax benefits recognized in the financial statements from such a position are measured based on the largest benefit that has a greater than 50 percent likelihood of being realized upon ultimate resolution. The amount of unrecognized tax benefits is adjusted for changes in facts and circumstances. For example, adjustments could result from significant amendments to existing tax law, the issuance of regulations or interpretations by the taxing authorities, new information obtained during a tax examination, or resolution of an examination. We believe our estimates for uncertain tax positions are appropriate and sufficient to pay assessments that may result from examinations of our tax returns. We recognize both accrued interest and penalties related to unrecognized tax benefits in income tax expense.
48
We have recorded valuation allowances against certain of our deferred tax assets, primarily those that have been generated from net operating losses and tax credit carryforwards in certain taxing jurisdictions. In evaluating whether we would more likely than not recover these deferred tax assets, we have not assumed any future taxable income or tax planning strategies in the jurisdictions associated with these carryforwards where history does not support such an assumption. Implementation of tax planning strategies to recover these deferred tax assets or future income generation in these jurisdictions could lead to the reversal of these valuation allowances and a reduction of income tax expense.
As of
December 31, 2014
, a 5 percent change in the amount of the uncertain tax positions and the valuation allowance would result in a change in net income of
$31.9 million
and
$30.1 million
, respectively.
LEGAL AND REGULATORY MATTERS
Information relating to certain legal proceedings can be found in Note 15 to the consolidated financial statements and is incorporated here by reference.
FINANCIAL EXPECTATIONS FOR
2015
For the full year of 2015, we expect EPS to be in the range of $2.40 to $2.50. We anticipate that total revenue will be between $19.5 billion and $20.0 billion. The acquisition of Novartis AH is expected to add significant revenue.
We anticipate that gross margin as a percent of revenue will be approximately 75.0 percent in 2015. Marketing, selling, and administrative expenses are expected to be in the range of $6.5 billion to $6.8 billion. Research and development expenses are expected to be in the range of $4.7 billion to $4.9 billion, reflecting an expected increase in Phase III trial expenses and the inclusion of Novartis AH. Other—net, (income) expense is expected to be in a range between $75 million and $125 million of income.
The 2015 tax rate is expected to be approximately 18.5 percent, assuming a full-year 2015 benefit of the research and development tax credit and other tax provisions up for extension. If these items are not extended, the 2015 tax rate would be approximately 1.5 percentage points higher. The 2015 expected tax rate includes the tax impact of costs associated with the Novartis AH and Lohmann AH acquisitions and amortization of intangibles.
Capital expenditures are expected to be approximately $1.3 billion.
Our 2015 financial guidance does not include a potential charge related to the collaboration with Pfizer to develop and commercialize tanezumab. If the partial clinical hold for the molecule is removed and we and Pfizer move forward with development, we will pay a $200 million upfront fee to Pfizer. This charge would reduce EPS by approximately $0.12 and would cause our tax rate to be approximately 1.0 percentage point lower.
|
Item 7A.
|
Quantitative and Qualitative Disclosures About Market Risk
|
You can find quantitative and qualitative disclosures about market risk (
e.g.,
interest rate risk) in Item 7 at “Management’s Discussion and Analysis—Financial Condition.” That information is incorporated in this report by reference.
49
|
Item 8.
|
Financial Statements and Supplementary Data
|
Consolidated Statements of Operations
|
ELI LILLY AND COMPANY AND SUBSIDIARIES
(Dollars in millions, except per-share data)
|
Year Ended December 31
|
2014
|
2013
|
2012
|
||||||||||
|
Revenue
|
$
|
19,615.6
|
|
$
|
23,113.1
|
|
$
|
22,603.4
|
|
|||||
|
Cost of sales
|
4,932.5
|
|
4,908.1
|
|
4,796.5
|
|
||||||||
|
Research and development
|
4,733.6
|
|
5,531.3
|
|
5,278.1
|
|
||||||||
|
Marketing, selling, and administrative
|
6,620.8
|
|
7,125.6
|
|
7,513.5
|
|
||||||||
|
Acquired in-process research and development (Notes 3 and 4)
|
200.2
|
|
57.1
|
|
—
|
|
||||||||
|
Asset impairment, restructuring, and other special charges
(Note 5)
|
468.7
|
|
120.6
|
|
281.1
|
|
||||||||
|
Other—net, (income) expense (Note 17)
|
(340.5
|
)
|
(518.9
|
)
|
(674.0
|
)
|
||||||||
|
16,615.3
|
|
17,223.8
|
|
17,195.2
|
|
|||||||||
|
Income before income taxes
|
3,000.3
|
|
5,889.3
|
|
5,408.2
|
|
||||||||
|
Income taxes (Note 13)
|
609.8
|
|
1,204.5
|
|
1,319.6
|
|
||||||||
|
Net income
|
$
|
2,390.5
|
|
$
|
4,684.8
|
|
$
|
4,088.6
|
|
|||||
|
Basic earnings per share:
|
||||||||||||||
|
Weighted-average number of common shares outstanding, including incremental shares
|
1,069,932
|
|
1,080,874
|
|
1,113,178
|
|
||||||||
|
Basic earnings per share
|
$
|
2.23
|
|
$
|
4.33
|
|
$
|
3.67
|
|
|||||
|
Diluted earnings per share:
|
||||||||||||||
|
Weighted-average number of common shares outstanding, including incremental shares and stock options
|
1,074,286
|
|
1,084,766
|
|
1,117,294
|
|
||||||||
|
Diluted earnings per share
|
$
|
2.23
|
|
$
|
4.32
|
|
$
|
3.66
|
|
|||||
See notes to consolidated financial statements.
50
Consolidated Statements of Comprehensive Income
|
ELI LILLY AND COMPANY AND SUBSIDIARIES
(Dollars in millions)
|
Year Ended December 31
|
2014
|
2013
|
2012
|
||||||||||
|
Net income
|
$
|
2,390.5
|
|
$
|
4,684.8
|
|
$
|
4,088.6
|
|
|||||
|
Other comprehensive income (loss):
|
||||||||||||||
|
Change in foreign currency translation gains (losses)
|
(961.4
|
)
|
36.2
|
|
160.9
|
|
||||||||
|
Change in net unrealized gains and losses on securities
|
(162.2
|
)
|
204.3
|
|
88.5
|
|
||||||||
|
Change in defined benefit pension and retiree health benefit plans (Note 14)
|
(1,327.6
|
)
|
2,592.2
|
|
(128.6
|
)
|
||||||||
|
Change in effective portion of cash flow hedges
|
(14.5
|
)
|
(123.8
|
)
|
8.7
|
|
||||||||
|
Other comprehensive income (loss) before income taxes
|
(2,465.7
|
)
|
2,708.9
|
|
129.5
|
|
||||||||
|
Provision for income taxes related to other comprehensive income (loss) items
|
476.6
|
|
(914.5
|
)
|
(68.0
|
)
|
||||||||
|
Other comprehensive income (loss) (Note 16)
|
(1,989.1
|
)
|
1,794.4
|
|
61.5
|
|
||||||||
|
Comprehensive income
|
$
|
401.4
|
|
$
|
6,479.2
|
|
$
|
4,150.1
|
|
|||||
See notes to consolidated financial statements.
51
|
ELI LILLY AND COMPANY AND SUBSIDIARIES
(Dollars in millions, shares in thousands)
|
December 31
|
2014
|
2013
|
|||||||
|
Assets
|
||||||||||
|
Current Assets
|
||||||||||
|
Cash and cash equivalents (Note 7)
|
$
|
3,871.6
|
|
$
|
3,830.2
|
|
||||
|
Short-term investments (Note 7)
|
955.4
|
|
1,567.1
|
|
||||||
|
Accounts receivable, net of allowances of
$55.0 (2014)
and $62.2 (2013)
|
3,234.6
|
|
3,434.4
|
|
||||||
|
Other receivables
|
566.7
|
|
588.4
|
|
||||||
|
Inventories (Note 6)
|
2,740.0
|
|
2,928.8
|
|
||||||
|
Prepaid expenses and other
|
811.5
|
|
755.8
|
|
||||||
|
Total current assets
|
12,179.8
|
|
13,104.7
|
|
||||||
|
Other Assets
|
||||||||||
|
Restricted cash (Note 3)
|
5,405.6
|
|
—
|
|
||||||
|
Investments (Note 7)
|
4,568.9
|
|
7,624.9
|
|
||||||
|
Goodwill (Note 8)
|
1,758.1
|
|
1,516.8
|
|
||||||
|
Other intangibles, net (Note 8)
|
2,884.2
|
|
2,814.3
|
|
||||||
|
Sundry
|
2,417.7
|
|
2,212.5
|
|
||||||
|
Total other assets
|
17,034.5
|
|
14,168.5
|
|
||||||
|
Property and equipment, net (Note 9)
|
7,963.9
|
|
7,975.5
|
|
||||||
|
Total assets
|
$
|
37,178.2
|
|
$
|
35,248.7
|
|
||||
|
Liabilities and Equity
|
||||||||||
|
Current Liabilities
|
||||||||||
|
Short-term borrowings and current maturities of long-term debt (Note 10)
|
$
|
2,688.7
|
|
$
|
1,012.6
|
|
||||
|
Accounts payable
|
1,128.1
|
|
1,119.3
|
|
||||||
|
Employee compensation
|
759.0
|
|
943.9
|
|
||||||
|
Sales rebates and discounts
|
2,068.8
|
|
1,941.7
|
|
||||||
|
Dividends payable
|
530.3
|
|
523.5
|
|
||||||
|
Income taxes payable (Note 13)
|
93.5
|
|
254.4
|
|
||||||
|
Deferred income taxes (Note 13)
|
1,466.5
|
|
792.8
|
|
||||||
|
Other current liabilities
|
2,472.6
|
|
2,328.4
|
|
||||||
|
Total current liabilities
|
11,207.5
|
|
8,916.6
|
|
||||||
|
Other Liabilities
|
||||||||||
|
Long-term debt (Note 10)
|
5,367.7
|
|
4,200.3
|
|
||||||
|
Accrued retirement benefits (Note 14)
|
2,562.9
|
|
1,549.4
|
|
||||||
|
Long-term income taxes payable (Note 13)
|
998.5
|
|
1,078.7
|
|
||||||
|
Other noncurrent liabilities
|
1,653.5
|
|
1,863.0
|
|
||||||
|
Total other liabilities
|
10,582.6
|
|
8,691.4
|
|
||||||
|
Commitments and contingencies (Note 15)
|
||||||||||
|
Eli Lilly and Company Shareholders' Equity (Notes 11 and 12)
|
||||||||||
|
Common stock—no par value
Authorized shares: 3,200,000
Issued shares:
1,111,437 (2014)
and 1,117,628 (2013)
|
694.6
|
|
698.5
|
|
||||||
|
Additional paid-in capital
|
5,292.3
|
|
5,050.0
|
|
||||||
|
Retained earnings
|
16,482.7
|
|
16,992.4
|
|
||||||
|
Employee benefit trust
|
(3,013.2
|
)
|
(3,013.2
|
)
|
||||||
|
Accumulated other comprehensive loss (Note 16)
|
(3,991.8
|
)
|
(2,002.7
|
)
|
||||||
|
Cost of common stock in treasury,
810 shares (2014)
and 833 shares (2013)
|
(91.4
|
)
|
(93.6
|
)
|
||||||
|
Total Eli Lilly and Company shareholders' equity
|
15,373.2
|
|
17,631.4
|
|
||||||
|
Noncontrolling interests
|
14.9
|
|
9.3
|
|
||||||
|
Total equity
|
15,388.1
|
|
17,640.7
|
|
||||||
|
Total liabilities and equity
|
$
|
37,178.2
|
|
$
|
35,248.7
|
|
||||
See notes to consolidated financial statements.
52
Consolidated Statements of Shareholders' Equity
|
ELI LILLY AND COMPANY AND SUBSIDIARIES
(Dollars in millions, shares in thousands)
|
Common Stock
|
Additional
Paid-in Capital |
Retained
Earnings |
Accumulated Other Comprehensive Loss
|
Common Stock in Treasury
|
Employee Benefit Trust
|
Shareholders' Equity
|
||||||||||||||||||||||||||
|
Shares
|
Amount
|
Shares
|
Amount
|
||||||||||||||||||||||||||||||
|
Balance at January 1, 2012
|
1,158,644
|
|
$
|
724.1
|
|
$
|
4,886.8
|
|
$
|
14,897.8
|
|
$
|
(3,858.6
|
)
|
853
|
|
$
|
(95.3
|
)
|
$
|
(3,013.1
|
)
|
$
|
13,541.7
|
|
||||||||
|
Net income
|
4,088.6
|
|
|
4,088.6
|
|
||||||||||||||||||||||||||||
|
Other comprehensive income (loss), net of tax
|
61.5
|
|
|
61.5
|
|
||||||||||||||||||||||||||||
|
Cash dividends declared per share: $1.96
|
(2,186.5
|
)
|
|
(2,186.5
|
)
|
||||||||||||||||||||||||||||
|
Retirement of treasury shares
|
(14,912)
|
|
(9.3
|
)
|
|
|
(711.7
|
)
|
(14,912)
|
|
721.1
|
|
|
|
0.1
|
|
|||||||||||||||||
|
Purchase for treasury
|
|
|
|
|
|
|
16,918
|
|
(819.2
|
)
|
|
|
(819.2
|
)
|
|||||||||||||||||||
|
Issuance of stock under employee stock plans-net
|
2,761
|
|
1.8
|
|
(65.2
|
)
|
(9)
|
|
1.0
|
|
|
(62.4
|
)
|
||||||||||||||||||||
|
Stock-based compensation
|
141.5
|
|
|
141.5
|
|
||||||||||||||||||||||||||||
|
Other
|
(0.1
|
)
|
(0.1
|
)
|
|||||||||||||||||||||||||||||
|
Balance at December 31, 2012
|
1,146,493
|
|
716.6
|
|
4,963.1
|
|
16,088.2
|
|
(3,797.1
|
)
|
2,850
|
|
(192.4
|
)
|
(3,013.2
|
)
|
14,765.2
|
|
|||||||||||||||
|
Net income
|
4,684.8
|
|
|
4,684.8
|
|
||||||||||||||||||||||||||||
|
Other comprehensive income (loss), net of tax
|
1,794.4
|
|
|
1,794.4
|
|
||||||||||||||||||||||||||||
|
Cash dividends declared per share: $1.96
|
(2,102.8
|
)
|
|
(2,102.8
|
)
|
||||||||||||||||||||||||||||
|
Retirement of treasury shares
|
(32,406)
|
|
(20.3
|
)
|
(1,677.8
|
)
|
(32,406)
|
|
1,698.1
|
|
|
|
—
|
|
|||||||||||||||||||
|
Purchase for treasury
|
|
|
|
|
30,400
|
|
(1,600.0
|
)
|
|
|
(1,600.0
|
)
|
|||||||||||||||||||||
|
Issuance of stock under employee stock plans-net
|
3,541
|
|
2.2
|
|
(58.0
|
)
|
(11)
|
|
0.7
|
|
|
|
(55.1
|
)
|
|||||||||||||||||||
|
Stock-based compensation
|
|
|
|
|
144.9
|
|
|
144.9
|
|
||||||||||||||||||||||||
|
Balance at December 31, 2013
|
1,117,628
|
|
698.5
|
|
5,050.0
|
|
16,992.4
|
|
(2,002.7
|
)
|
833
|
|
(93.6
|
)
|
(3,013.2
|
)
|
17,631.4
|
|
|||||||||||||||
|
Net income
|
2,390.5
|
|
2,390.5
|
|
|||||||||||||||||||||||||||||
|
Other comprehensive income (loss), net of tax
|
(1,989.1
|
)
|
(1,989.1
|
)
|
|||||||||||||||||||||||||||||
|
Cash dividends declared per share: $1.97
|
(2,108.1
|
)
|
(2,108.1
|
)
|
|||||||||||||||||||||||||||||
|
Retirement of treasury shares
|
(12,579
|
)
|
(7.9
|
)
|
(792.1
|
)
|
(12,579
|
)
|
800.0
|
|
—
|
|
|||||||||||||||||||||
|
Purchase for treasury
|
|
|
|
|
12,579
|
|
(800.0
|
)
|
(800.0
|
)
|
|||||||||||||||||||||||
|
Issuance of stock under employee stock plans-net
|
6,388
|
|
4.0
|
|
86.3
|
|
(23
|
)
|
2.2
|
|
92.5
|
|
|||||||||||||||||||||
|
Stock-based compensation
|
156.0
|
|
156.0
|
|
|||||||||||||||||||||||||||||
|
Balance at December 31, 2014
|
1,111,437
|
|
$
|
694.6
|
|
$
|
5,292.3
|
|
$
|
16,482.7
|
|
$
|
(3,991.8
|
)
|
810
|
|
$
|
(91.4
|
)
|
$
|
(3,013.2
|
)
|
$
|
15,373.2
|
|
||||||||
53
Consolidated Statements of Cash Flows
|
ELI LILLY AND COMPANY AND SUBSIDIARIES
(Dollars in millions)
|
Year Ended December 31
|
2014
|
2013
|
2012
|
||||||||||
|
Cash Flows from Operating Activities
|
||||||||||||||
|
Net income
|
$
|
2,390.5
|
|
$
|
4,684.8
|
|
$
|
4,088.6
|
|
|||||
|
Adjustments to Reconcile Net Income
to Cash Flows from Operating Activities
|
||||||||||||||
|
Depreciation and amortization
|
1,379.0
|
|
1,445.6
|
|
1,462.2
|
|
||||||||
|
Change in deferred income taxes
|
(36.4
|
)
|
285.9
|
|
126.0
|
|
||||||||
|
Stock-based compensation expense
|
156.0
|
|
144.9
|
|
141.5
|
|
||||||||
|
Net realized investment gains
|
(195.1
|
)
|
(41.0
|
)
|
(66.9
|
)
|
||||||||
|
Impairment charges, indefinite lived intangibles
|
—
|
|
—
|
|
205.0
|
|
||||||||
|
Acquired in-process research and development, net of tax
|
130.2
|
|
37.1
|
|
—
|
|
||||||||
|
Income related to termination of the exenatide collaboration with Amylin (Note 4)
|
—
|
|
(495.4
|
)
|
(787.8
|
)
|
||||||||
|
Proceeds from terminations of interest rate swaps
|
340.7
|
|
—
|
|
—
|
|
||||||||
|
Other non-cash operating activities, net
|
241.1
|
|
66.1
|
|
187.4
|
|
||||||||
|
Changes in operating assets and liabilities, net of acquisitions:
|
||||||||||||||
|
Receivables—(increase) decrease
|
117.4
|
|
(152.7
|
)
|
361.8
|
|
||||||||
|
Inventories—(increase) decrease
|
(307.1
|
)
|
(286.5
|
)
|
(307.9
|
)
|
||||||||
|
Other assets—(increase) decrease
|
411.5
|
|
116.5
|
|
231.0
|
|
||||||||
|
Accounts payable and other liabilities—increase (decrease)
|
(260.7
|
)
|
(70.3
|
)
|
(336.1
|
)
|
||||||||
|
Net Cash Provided by Operating Activities
|
4,367.1
|
|
5,735.0
|
|
5,304.8
|
|
||||||||
|
Cash Flows from Investing Activities
|
||||||||||||||
|
Purchases of property and equipment
|
(1,162.6
|
)
|
(1,012.1
|
)
|
(905.4
|
)
|
||||||||
|
Disposals of property and equipment
|
15.3
|
|
179.4
|
|
22.0
|
|
||||||||
|
Cash restricted for pending acquisition (Note 3)
|
(5,405.6
|
)
|
—
|
|
—
|
|
||||||||
|
Proceeds from sales and maturities of short-term investments
|
4,054.1
|
|
3,320.1
|
|
2,547.5
|
|
||||||||
|
Purchases of short-term investments
|
(1,637.8
|
)
|
(1,531.0
|
)
|
(2,172.4
|
)
|
||||||||
|
Proceeds from sales of noncurrent investments
|
11,009.4
|
|
11,235.0
|
|
4,355.7
|
|
||||||||
|
Purchases of noncurrent investments
|
(9,802.7
|
)
|
(14,041.9
|
)
|
(7,618.6
|
)
|
||||||||
|
Purchase of product rights
|
(308.3
|
)
|
(24.1
|
)
|
(138.8
|
)
|
||||||||
|
Purchases of in-process research and development
|
(95.0
|
)
|
(57.1
|
)
|
—
|
|
||||||||
|
Cash paid for acquisitions, net of cash acquired
|
(551.4
|
)
|
(43.7
|
)
|
(199.3
|
)
|
||||||||
|
Proceeds from prepayment of revenue-sharing obligation (Note 4)
|
—
|
|
—
|
|
1,212.1
|
|
||||||||
|
Other investing activities, net
|
(24.5
|
)
|
(97.4
|
)
|
64.4
|
|
||||||||
|
Net Cash Used for Investing Activities
|
(3,909.1
|
)
|
(2,072.8
|
)
|
(2,832.8
|
)
|
||||||||
|
Cash Flows from Financing Activities
|
||||||||||||||
|
Dividends paid
|
(2,101.2
|
)
|
(2,120.7
|
)
|
(2,187.4
|
)
|
||||||||
|
Net change in short-term borrowings
|
2,680.6
|
|
—
|
|
—
|
|
||||||||
|
Proceeds from issuance of long-term debt
|
992.9
|
|
—
|
|
—
|
|
||||||||
|
Repayments of long-term debt
|
(1,034.8
|
)
|
(10.5
|
)
|
(1,511.1
|
)
|
||||||||
|
Purchases of common stock
|
(800.0
|
)
|
(1,698.1
|
)
|
(721.1
|
)
|
||||||||
|
Other financing activities, net
|
187.4
|
|
—
|
|
—
|
|
||||||||
|
Net Cash Used for Financing Activities
|
(75.1
|
)
|
(3,829.3
|
)
|
(4,419.6
|
)
|
||||||||
|
Effect of exchange rate changes on cash and cash equivalents
|
(341.5
|
)
|
(21.5
|
)
|
43.9
|
|
||||||||
|
Net increase (decrease) in cash and cash equivalents
|
41.4
|
|
(188.6
|
)
|
(1,903.7
|
)
|
||||||||
|
Cash and cash equivalents at beginning of year
|
3,830.2
|
|
4,018.8
|
|
5,922.5
|
|
||||||||
|
Cash and Cash Equivalents at End of Year
|
$
|
3,871.6
|
|
$
|
3,830.2
|
|
$
|
4,018.8
|
|
|||||
See notes to consolidated financial statements.
54
Notes to Consolidated Financial Statements
ELI LILLY AND COMPANY AND SUBSIDIARIES
(Tables present dollars in millions, except per-share data)
Basis of presentation
The accompanying consolidated financial statements have been prepared in accordance with accounting principles generally accepted in the United States (GAAP). The accounts of all wholly-owned and majority-owned subsidiaries are included in the consolidated financial statements. Where our ownership of consolidated subsidiaries is less than 100 percent, the noncontrolling shareholders’ interests are reflected as a separate component of equity. All intercompany balances and transactions have been eliminated.
The preparation of financial statements in conformity with GAAP requires management to make estimates and assumptions that affect the reported amounts of assets, liabilities, revenues, expenses, and related disclosures at the date of the financial statements and during the reporting period. Actual results could differ from those estimates. We issued our financial statements by filing with the Securities and Exchange Commission and have evaluated subsequent events up to the time of the filing.
Certain reclassifications have been made to prior periods in the consolidated financial statements and accompanying notes to conform with the current presentation.
All per-share amounts, unless otherwise noted in the footnotes, are presented on a diluted basis, that is, based on the weighted-average number of outstanding common shares plus the effect of dilutive stock options and other incremental shares.
Cash equivalents
We consider all highly liquid investments with a maturity of three months or less from the date of purchase to be cash equivalents. The cost of these investments approximates fair value.
Inventories
We state all inventories at the lower of cost or market. We use the last-in, first-out (LIFO) method for the majority of our inventories located in the continental United States (U.S.). Other inventories are valued by the first-in, first-out (FIFO) method. FIFO cost approximates current replacement cost.
Investments
Substantially all of our investments in debt and marketable equity securities are classified as available-for-sale. Investment securities with maturity dates of less than one year from the date of the balance sheet are classified as short-term. Available-for-sale securities are carried at fair value with the unrealized gains and losses, net of tax, reported in other comprehensive income (loss). The credit portion of unrealized losses on our debt securities considered to be other-than-temporary is recognized in earnings. The remaining portion of the other-than-temporary impairment on our debt securities is then recorded, net of tax, in other comprehensive income (loss). The entire amount of other-than-temporary impairment on our equity securities is recognized in earnings. We do not evaluate cost-method investments for impairment unless there is an indicator of impairment. We review these investments for indicators of impairment on a regular basis. Realized gains and losses on sales of available-for-sale securities are computed based upon specific identification of the initial cost adjusted for any other-than-temporary declines in fair value that were recorded in earnings. Investments in companies over which we have significant influence but not a controlling interest are accounted for using the equity method with our share of earnings or losses reported in other–net, (income) expense. We own no investments that are considered to be trading securities.
Risk-management instruments
Our derivative activities are initiated within the guidelines of documented corporate risk-management policies and offset losses and gains on the assets, liabilities, and transactions being hedged. Management reviews the correlation and effectiveness of our derivatives on a quarterly basis.
55
For derivative contracts that are designated and qualify as fair value hedges, the derivative instrument is marked to market with gains and losses recognized currently in income to offset the respective losses and gains recognized on the underlying exposure. For derivative contracts that are designated and qualify as cash flow hedges, the effective portion of gains and losses on these contracts is reported as a component of accumulated other comprehensive loss and reclassified into earnings in the same period the hedged transaction affects earnings. Hedge ineffectiveness is immediately recognized in earnings. Derivative contracts that are not designated as hedging instruments are recorded at fair value with the gain or loss recognized in current earnings during the period of change.
We may enter into foreign currency forward or option contracts to reduce the effect of fluctuating currency exchange rates (principally the euro, the British pound, and the Japanese yen). Foreign currency derivatives used for hedging are put in place using the same or like currencies and duration as the underlying exposures. Forward and option contracts are principally used to manage exposures arising from subsidiary trade and loan payables and receivables denominated in foreign currencies. These contracts are recorded at fair value with the gain or loss recognized in other–net, (income) expense. We may enter into foreign currency forward and option contracts and currency swaps as fair value hedges of firm commitments. Forward contracts generally have maturities not exceeding
12
months.
In the normal course of business, our operations are exposed to fluctuations in interest rates which can vary the costs of financing, investing, and operating. We address a portion of these risks through a controlled program of risk management that includes the use of derivative financial instruments. The objective of controlling these risks is to limit the impact of fluctuations in interest rates on earnings. Our primary interest-rate risk exposure results from changes in short-term U.S. dollar interest rates. In an effort to manage interest-rate exposures, we strive to achieve an acceptable balance between fixed- and floating-rate debt and investment positions and may enter into interest rate swaps or collars to help maintain that balance.
Interest rate swaps or collars that convert our fixed-rate debt to a floating rate are designated as fair value hedges of the underlying instruments. Interest rate swaps or collars that convert floating-rate debt to a fixed rate are designated as cash flow hedges. Interest expense on the debt is adjusted to include the payments made or received under the swap agreements. Cash proceeds from or payments to counterparties resulting from the termination of interest rate swaps are classified as operating activities in our consolidated statement of cash flows.
We may enter into forward contracts and designate them as cash flow hedges to limit the potential volatility of earnings and cash flow associated with forecasted sales of available-for-sale securities.
Investments in debt securities are subject to different interest rate risks based on their maturities. We may manage the average maturity of our investments in debt securities to achieve economic returns using interest rate contracts, none of which are designated as hedging instruments.
We may enter into forward-starting interest rate swaps, which we designate as cash flow hedges, as part of any anticipated future debt issuances in order to reduce the risk of cash flow volatility from future changes in interest rates. Upon completion of a debt issuance and termination of the swap, the change in fair value of these instruments is recorded as part of other comprehensive income (loss) and is amortized to interest expense over the life of the debt agreement.
Goodwill and other intangibles
Goodwill results from excess consideration in a business combination over the fair value of identifiable net assets acquired. Goodwill is not amortized.
Intangible assets with finite lives are capitalized and are amortized over their estimated useful lives, ranging from
3
to
20
years.
The costs of in-process research and development (IPR&D) projects acquired directly in a transaction other than a business combination are capitalized if the projects have an alternative future use; otherwise, they are expensed immediately. The fair values of IPR&D projects acquired in business combinations are capitalized as other intangible assets. Several methods may be used to determine the estimated fair value of the IPR&D acquired in a business combination. We utilize the “income method,” which applies a probability weighting that considers the risk of development and commercialization to the estimated future net cash flows that are derived from projected revenues and estimated costs. These projections are based on factors such as
56
relevant market size, patent protection, historical pricing of similar products, and expected industry trends. The estimated future net cash flows are then discounted to the present value using an appropriate discount rate. This analysis is performed for each project independently. These assets are treated as indefinite-lived intangible assets until completion or abandonment of the projects, at which time the assets are tested for impairment and amortized over the remaining useful life or written off, as appropriate. For transactions other than a business combination, we also capitalize milestone payments incurred at or after the product has obtained regulatory approval for marketing and generally amortize those amounts over the remaining estimated useful life of the underlying asset.
Goodwill and other indefinite-lived intangible assets are reviewed for impairment at least annually and when impairment indicators are present. When required, a comparison of fair value to the carrying amount of assets is performed to determine the amount of any impairment. When determining the fair value of indefinite-lived IPR&D assets for impairment testing purposes, we utilize the "income method" discussed in the previous paragraph. Finite-lived intangible assets are reviewed for impairment when an indicator of impairment is present.
Property and equipment
Property and equipment is stated on the basis of cost. Provisions for depreciation of buildings and equipment are computed generally by the straight-line method at rates based on their estimated useful lives (
12
to
50
years for buildings and
3
to
25
years for equipment). We review the carrying value of long-lived assets for potential impairment on a periodic basis and whenever events or changes in circumstances indicate the carrying value of an asset may not be recoverable. Impairment is determined by comparing projected undiscounted cash flows to be generated by the asset to its carrying value. If an impairment is identified, a loss is recorded equal to the excess of the asset’s net book value over its fair value, and the cost basis is adjusted.
Litigation and environmental liabilities
Litigation accruals, environmental liabilities, and the related estimated insurance recoverables are reflected on a gross basis as liabilities and assets, respectively, on our consolidated balance sheets. With respect to the product liability claims currently asserted against us, we have accrued for our estimated exposures to the extent they are both probable and reasonably estimable based on the information available to us. We accrue for certain product liability claims incurred but not filed to the extent we can formulate a reasonable estimate of their costs. We estimate these expenses based primarily on historical claims experience and data regarding product usage. Legal defense costs expected to be incurred in connection with significant product liability loss contingencies are accrued when both probable and reasonably estimable. Due to a very restrictive market for product liability insurance, we are self-insured for product liability losses for all our currently marketed products.
Revenue recognition
We recognize revenue from sales of products at the time title of goods passes to the buyer and the buyer assumes the risks and rewards of ownership. Provisions for returns, discounts, and rebates are established in the same period the related sales are recognized.
In arrangements involving the delivery of more than one element (e.g., research and development, marketing and selling, manufacturing, and distribution), each required deliverable is evaluated to determine whether it qualifies as a separate unit of accounting. Our determination is based on whether the deliverable has "standalone value" to the customer. If a deliverable does not qualify as a separate unit of accounting, it is combined with the other applicable undelivered item(s) within the arrangement and these combined deliverables are treated as a single unit of accounting. The arrangement's consideration that is fixed or determinable is then allocated to each separate unit of accounting based on the relative selling price of each deliverable.
Initial fees we receive in collaborative and other similar arrangements from the partnering of our compounds under development are generally deferred and amortized into income through the expected product approval date. Initial fees may also be received for out-licensing agreements that include both an out-license of our marketing rights to commercialized products and a related commitment to supply the products. When we
57
have determined that the marketing rights do not have standalone value, the initial fees received are generally deferred and amortized to income as net product sales over the term of the supply agreement.
Royalty revenue from licensees, which is based on third-party sales of licensed products and technology, is recorded as earned in accordance with the contract terms when third-party sales can be reasonably measured and collection of the funds is reasonably assured. This royalty revenue is included in collaboration and other revenue.
Profit-sharing due from our collaboration partners, which is based upon gross margins reported to us by our partners, is recognized as collaboration and other revenue as earned.
Developmental milestone payments earned by us are generally recorded in other–net, (income) expense. We immediately recognize the full amount of developmental milestone payments due to us upon the achievement of the milestone event if the event is objectively determinable and the milestone is substantive in its entirety. A milestone is considered substantive if the consideration earned 1) relates solely to past performance, 2) is commensurate with the enhancement in the pharmaceutical product's value associated with the achievement of the important event in its development life cycle, and 3) is reasonable relative to all of the deliverables and payment terms within the arrangement. If a milestone payment to us is part of a multiple-element commercialization arrangement and is triggered by the initiation of the commercialization period (e.g., regulatory approval for marketing or launch of the product) or the achievement of a sales-based threshold, we amortize the payment to income as we perform under the terms of the arrangement. See Note 4 for specific agreement details.
Research and development expenses and acquired IPR&D
Research and development expenses include the following:
|
•
|
Research and development costs, which are expensed as incurred.
|
|
•
|
Milestone payment obligations incurred prior to regulatory approval of the product, which are accrued when the event requiring payment of the milestone occurs.
|
Acquired IPR&D expense includes the initial costs of IPR&D projects, acquired directly in a transaction other than a business combination, that do not have an alternative future use.
Income taxes
Deferred taxes are recognized for the future tax effects of temporary differences between financial and income tax reporting based on enacted tax laws and rates. Federal income taxes are provided on the portion of the income of foreign subsidiaries that is expected to be remitted to the U.S. and be taxable. When foreign earnings are expected to be indefinitely reinvested outside the U.S., no accrual for U.S. income taxes is provided.
We recognize the tax benefit from an uncertain tax position only if it is more likely than not that the tax position will be sustained on examination by the taxing authorities, based on the technical merits of the position. The tax benefits recognized in the financial statements from such a position are measured based on the largest benefit that has a greater than 50 percent likelihood of being realized upon ultimate resolution.
Earnings per share
We calculate basic earnings per share (EPS) based on the weighted-average number of common shares outstanding and incremental shares. We calculate diluted EPS based on the weighted-average number of common shares outstanding, including incremental shares and dilutive stock options.
Stock-based compensation
We recognize the fair value of stock-based compensation as expense over the requisite service period of the individual grantees, which generally equals the vesting period. Under our policy, all stock-based awards are approved prior to the date of grant. The compensation committee of the board of directors approves the value of the award and date of grant. Stock-based compensation that is awarded as part of our annual equity grant is made on a specific grant date scheduled in advance.
58
In May 2014, the Financial Accounting Standards Board (FASB) issued a final standard on revenue recognition. Under the new standard, an entity should recognize revenue to depict the transfer of promised goods or services to customers in an amount that reflects the consideration to which the entity expects to be entitled in exchange for those goods or services. In order to do so, an entity would follow the five-step process for in-scope transactions: 1) identify the contract with a customer, 2) identify the separate performance obligations in the contract, 3) determine the transaction price, 4) allocate the transaction price to the separate performance obligations in the contract, and 5) recognize revenue when (or as) the entity satisfies a performance obligation. For public entities, the provisions of the new standard are expected to become effective for annual reporting periods beginning after December 15, 2016 and early adoption is not permitted. An entity can apply the new revenue standard retrospectively to each prior reporting period presented or retrospectively with the cumulative effect of initially applying the standard recognized at the date of initial application in retained earnings. We are in the process of determining our approach to the adoption of this new revenue recognition standard, as well as the anticipated impact to our consolidated financial statements.
In July 2013, the FASB issued a clarification regarding the presentation of an unrecognized tax benefit related to a net operating loss carryforward, a similar tax loss, or a tax credit carryforward. Under this new standard, the liability related to an unrecognized tax benefit, or a portion thereof, should be presented in the financial statements as a reduction to a deferred tax asset if available under the tax law of the applicable jurisdiction to settle any additional income taxes that would result from the disallowance of a tax position. Otherwise, the unrecognized tax benefit should be presented in the financial statements as a separate liability. The assessment is based on the unrecognized tax benefit and deferred tax asset that exist at the reporting date. The provisions of the new standard are effective on a prospective basis beginning in 2014 for annual and interim reporting periods. Adoption of this standard in the first quarter of 2014 resulted in an immaterial impact to our consolidated balance sheet and did not affect our consolidated statements of operations.
During 2014 and 2012, we completed the acquisitions of Lohmann SE (Lohmann AH) and ChemGen Corporation (ChemGen), respectively. These acquisitions were accounted for as business combinations under the acquisition method of accounting. The assets acquired and liabilities assumed were recorded at their respective fair values as of the acquisition date in our consolidated financial statements. The determination of estimated fair value required management to make significant estimates and assumptions. The excess of the purchase price over the fair value of the acquired net assets, where applicable, has been recorded as goodwill. The results of operations of these acquisitions are included in our consolidated financial statements from the date of acquisition. Neither acquisition was material to our consolidated financial statements.
During 2014, we announced an agreement to acquire Novartis Animal Health (Novartis AH), which was subsequently completed in January 2015. Details of our acquisitions of businesses are further discussed below.
In addition to the acquisitions of businesses, we also acquired assets in development in 2014 and 2013 which are further discussed below in Product and Other Acquisitions and in Note 4. Upon acquisition, the acquired IPR&D related to these products was immediately written off as an expense because the products had no alternative future use. For the years ended
December 31, 2014
and 2013, we recorded acquired IPR&D charges of
$200.2 million
and
$57.1 million
, respectively, associated with these transactions. There were
no
acquired IPR&D charges in 2012.
Acquisitions of Businesses
Subsequent Event - Novartis AH Acquisition
Overview of Transaction
On January 1, 2015, we acquired from Novartis AG all of the shares of certain Novartis subsidiaries and all of the assets of other Novartis subsidiaries that are exclusively related to the Novartis AH business in an all-cash transaction for a total purchase price of approximately
$5.4 billion
, subject to working capital and other
59
adjustments. As of December 31, 2014, there was
$5.41 billion
of cash held in escrow for the pending acquisition of Novartis AH. This cash was classified as restricted cash, a noncurrent asset, on our consolidated balance sheet. The accounting for the acquisition and the results of the Novartis AH operations will be included in our financial statements for the period beginning on January 1, 2015.
As a condition to the clearance of the transaction under the Hart-Scott-Rodino Antitrust Improvement Act, following the closing of the acquisition of Novartis AH, we divested certain animal health assets in the U.S. related to the Sentinel
®
canine parasiticide franchise to Virbac Corporation for approximately
$410 million
.
The acquired Novartis AH business consists of the research and development, manufacture, marketing, sale and distribution of veterinary products to prevent and treat diseases in pets, farm animals, and farmed fish. Under the terms of the agreement, we acquired manufacturing sites, research and development facilities, a global commercial infrastructure and portfolio of products, a pipeline of projects in development, and employees.
Assets Acquired and Liabilities Assumed
The initial accounting for this acquisition is incomplete. Significant, relevant information needed to complete the initial accounting is not available because the valuation of the assets acquired and liabilities assumed is not complete. As a result, determining these values is not practicable and we are unable to disclose these values or provide other related disclosures at this time.
Supplemental Pro Forma Information
Our unaudited pro forma consolidated revenue for 2014 is approximately
$20.7 billion
. This amount was determined as if the portion of Novartis AH that we retained after the sale to Virbac had been acquired as of January 1, 2014. This unaudited pro forma consolidated revenue is not necessarily indicative of what our consolidated revenues actually would have been had we completed the acquisition on January 1, 2014.
Lohmann AH Acquisition
On April 30, 2014, we acquired Lohmann AH, a privately-held company headquartered in Cuxhaven, Germany, through a stock purchase for a total purchase price of
$591.2 million
, comprised of
$551.4 million
of net cash plus
$39.8 million
of assumed debt. Lohmann AH is a global leader in poultry vaccines. As part of this transaction, we acquired the rights to a range of vaccines, commercial capabilities, and manufacturing sites in Germany and the United States. Preliminary amounts currently recorded in connection with this acquisition include
$275.4 million
of marketed product assets,
$23.9 million
of other intangible assets,
$89.8 million
of property and equipment,
$243.7 million
of goodwill, and
$92.7 million
of deferred tax liability, with
$51.1 million
of other net assets. The final determination may result in asset and liability fair values that differ from the preliminary estimates, but it is not expected that these differences will be material to our consolidated financial statements. Goodwill associated with this acquisition is not deductible for tax purposes.
ChemGen
On February 17, 2012, we acquired all of the outstanding stock of ChemGen, a privately-held bioscience company specializing in the development and commercialization of innovative feed-enzyme products that improve the efficiency of poultry, egg, and meat production, for total purchase consideration of
$206.9 million
in cash. In connection with this acquisition, we recorded
$151.5 million
of marketed product assets and
$55.4 million
of other net assets.
Product and Other Acquisitions
In connection with the arrangements described below, our partners may be entitled to future royalties based on sales should these products be approved for commercialization and/or milestones based on the successful progress of the drug candidate through the development process.
In July 2014, we entered into a co-discovery and co-development collaboration with Immunocore Limited to research and potentially develop pre-clinical novel T cell-based cancer therapies. Upon entering the agreement, we paid an upfront fee of
$45.0 million
in cash and a related charge was recorded for acquired IPR&D.
60
In September 2014, we entered into a collaboration agreement with AstraZeneca UK Limited (AstraZeneca) for the worldwide co-development and co-commercialization of AstraZeneca’s oral beta-secretase cleaving enzyme inhibitor known as AZD3293, a compound being investigated for the potential treatment of Alzheimer’s disease. At the time of the agreement, AZD3293 had completed Phase I testing in patients with early Alzheimer’s disease. We will be responsible for leading development efforts, while AstraZeneca will be responsible for manufacturing efforts. If successful, both parties will take joint responsibility for commercialization of AZD3293. Under the agreement, both parties will share equally in the ongoing development costs, gross margins and certain other costs associated with the commercialization of the compound. Upon execution of the agreement, we immediately recorded, as an acquired IPR&D charge, our obligation associated with a payment of
$50.0 million
which we will pay to AstraZeneca in 2015.
In December 2014, we entered into a collaboration agreement with Adocia for the worldwide development and commercialization of Adocia's ultra-rapid insulin, known as BioChaperone Lispro, a compound being developed for the treatment of patients with type 1 and type 2 diabetes. BioChaperone Lispro is currently in Phase I studies. We will be responsible for leading development, manufacturing, and commercialization efforts. Upon entering the agreement, we paid an upfront fee of
$50.0 million
in cash and a related charge was recorded for acquired IPR&D.
In December 2013, we acquired for
$57.1 million
in cash, all development and commercial rights for a calcitonin gene-related peptide antibody being studied as a potential treatment for the prevention of frequent, recurrent migraine headaches. At the time of the purchase, the product had completed a successful Phase II proof-of-concept study and a related charge was recorded for acquired IPR&D.
We often enter into collaborative and other similar arrangements to develop and commercialize drug candidates. Collaborative activities may include research and development, marketing and selling (including promotional activities and physician detailing), manufacturing, and distribution. These arrangements often require milestone and royalty or profit-share payments, contingent upon the occurrence of certain future events linked to the success of the asset in development, as well as expense reimbursements or payments to the collaboration partner. Elements within a collaboration are separated into individual units of accounting if they have standalone value from other elements within the arrangement. In these situations, the arrangement consideration is allocated to the elements on a relative selling price basis. Revenues related to products we sell pursuant to these arrangements are included in net product sales, while other sources of revenue (e.g., royalties and profit sharing due from our partner) are included in collaboration and other revenue. For the years ended
December 31, 2014
,
2013
, and
2012
, we recognized collaboration and other revenue of
$788.4 million
,
$707.5 million
, and
$633.0 million
, respectively. Operating expenses for costs incurred pursuant to these arrangements are reported in their respective expense line item, net of any payments due to or reimbursements due from our collaboration partners, with such reimbursements being recognized at the time the party becomes obligated to pay. Each collaboration is unique in nature, and our more significant arrangements are discussed below.
Diabetes Collaboration
We and Boehringer Ingelheim have a global agreement to jointly develop and commercialize a portfolio of diabetes compounds. Currently, the compounds included in the collaboration are Boehringer Ingelheim’s two oral diabetes agents, linagliptin (trade name Trajenta
®
) and empagliflozin (trade name Jardiance
®
), and our new insulin glargine product (trade name Basaglar
®
in the U.S.).
Trajenta was approved in 2011 and launched in the U.S., Japan, certain countries in Europe, and other countries. Jardiance was approved in Europe, the U.S., and Japan in May, August, and December 2014, respectively. The product was launched in certain European countries and the U.S. in the third quarter of 2014. Our new insulin glargine product was approved by the European Commission in Europe in September 2014 and regulatory authorities in Japan in December 2014. Basaglar received tentative approval in the U.S. in August 2014. The U.S. Food and Drug Administration (FDA) has determined that Basaglar meets all regulatory requirements for approval, but final approval is subject to a delay of up to 30 months as a result of patent infringement litigation filed by Sanofi, which makes Lantus
®
, the only currently marketed insulin glargine. Under the Drug Price Competition and Patent Term Restoration Act of 1984 (the Hatch-Waxman
61
Act), the initiation of the lawsuit automatically invoked a stay of final FDA approval for a period of 30 months (until July 2016), which may be shortened in the event of an earlier court decision in our favor.
In connection with the approval of Trajenta in the U.S., Japan, and Europe, we paid
$478.7 million
in success-based regulatory milestones, all of which were capitalized as intangible assets and are being amortized to cost of sales.
In connection with the approval of Jardiance in Europe, the U.S., and Japan, we incurred success-based regulatory milestones of
$300.5 million
, which were capitalized as intangible assets and will be amortized to cost of sales. We incurred milestone-related expenses of
$97.2 million
in connection with regulatory submissions for Jardiance in Europe, the U.S., and Japan during 2013. These regulatory submission milestones were recorded as research and development expenses.
Upon the approval of our new insulin glargine product in Europe and Japan during 2014, we recorded, as deferred revenue,
$62.5 million
in milestones which will be amortized to collaboration and other revenue upon product launch in Europe and Japan through the term of the collaboration (2029). During 2013, we earned
$50.0 million
in milestones for the regulatory submissions of our new insulin glargine product in the U.S., Europe, and Japan. These submission milestones were recorded as income in other–net, (income) expense. In the future, we will be eligible to receive up to
$187.5 million
in success-based regulatory milestones on our new insulin glargine product.
In October 2014, we and Boehringer Ingelheim agreed upon certain changes to the operational and financial structure of our diabetes collaboration. Under the revised agreement the companies will continue their co-promotion work in 17 countries, representing over 90 percent of the collaboration’s anticipated market opportunity. In the other countries, the companies will exclusively commercialize the respective molecules they brought to the collaboration. The modifications became effective at the end of 2014, and will change the financial terms related to the modified countries; however, the financial impact resulting from the revised terms of the agreement in these countries is not anticipated to be material. As a result of these changes, in the fourth quarter of 2014, we recorded a gain of
$92.0 million
related to the transfer to Boehringer Ingelheim of our license rights to co-promote linagliptin and empagliflozin in these countries, which was recorded as income in other–net, (income) expense. We also incurred a charge of
$55.2 million
related to the transfer to us of Boehringer Ingelheim's rights to co-promote our new insulin glargine product in countries where it is not yet approved, which was recorded as acquired IPR&D expense.
With the exception of the countries affected by the amendment to the collaboration agreement, the companies share equally the ongoing development costs and, if successful, commercialization costs and gross margin for any product resulting from the collaboration. We record our portion of the gross margin associated with Boehringer Ingelheim's compounds as collaboration and other revenue, and we record our portion of the commercialization costs as marketing, selling, and administrative expense. Each company will also be entitled to potential performance payments on sales of the molecules they contribute to the collaboration. Our revenue related to Trajenta was
$328.8 million
,
$249.2 million
, and
$88.6 million
for the years ended
December 31, 2014
,
2013
, and
2012
, respectively. Our revenue related to Jardiance was not material for the year ended
December 31, 2014
.
Effient
®
We are in a collaborative arrangement with Daiichi Sankyo Co., Ltd. (Daiichi Sankyo) to develop, market, and promote Effient. We and Daiichi Sankyo co-promote Effient in certain territories (including the U.S. and five major European markets), while we have exclusive marketing rights in certain other territories. Daiichi Sankyo has exclusive marketing rights in Japan and certain other territories. The parties share approximately
50
/50 in the profits, as well as in the costs of development and marketing in the co-promotion territories. A third party manufactures bulk product, and we produce the finished product for our exclusive and co-promotion territories. We record product sales in our exclusive and co-promotion territories. In our exclusive territories, we pay Daiichi Sankyo a royalty specific to these territories. Profit-share payments due to Daiichi Sankyo are recorded as marketing, selling, and administrative expenses. All royalties due to Daiichi Sankyo and the third-party manufacturer are recorded in cost of sales. Effient sales were
$522.2 million
,
$508.7 million
, and
$457.2 million
for the years ended
December 31, 2014
,
2013
, and
2012
, respectively.
62
Erbitux
®
We have several collaborations with respect to Erbitux. The most significant collaborations are in the U.S., Canada, and Japan (Bristol-Myers Squibb Company); and worldwide except the U.S. and Canada (Merck KGaA). Upon expiration of the agreements, all of the rights to Erbitux in the U.S. and Canada return to us and certain rights to Erbitux outside the U.S. and Canada will remain with Merck KGaA (Merck).
The following table summarizes our revenue recognized with respect to Erbitux:
|
2014
|
2013
|
2012
|
|||||||||
|
Net product sales
|
$
|
46.1
|
|
$
|
58.5
|
|
$
|
76.4
|
|
||
|
Collaboration and other revenue
|
327.2
|
|
315.2
|
|
320.6
|
|
|||||
|
Total revenue
|
$
|
373.3
|
|
$
|
373.7
|
|
$
|
397.0
|
|
||
Bristol-Myers Squibb Company
Pursuant to commercial agreements with Bristol-Myers Squibb Company and E.R. Squibb (collectively, BMS), we are co-developing Erbitux in the U.S. and Canada with BMS through September 2018, exclusively, and in Japan with BMS and Merck through 2032. Under these arrangements, Erbitux research and development and other costs are shared by both companies according to a predetermined ratio.
Responsibilities associated with clinical and other ongoing studies are apportioned between the parties under the agreements. Collaborative reimbursements due to us for supply of clinical trial materials; for research and development; and for a portion of marketing, selling, and administrative expenses are recorded as a reduction to the respective expense line items on the consolidated statement of operations. We receive a distribution fee in the form of a royalty from BMS, based on a percentage of net sales in the U.S. and Canada, which is recorded in collaboration and other revenue. Royalties due to third parties are recorded as a reduction of collaboration and other revenue, net of any royalty reimbursements due from third parties.
We are responsible for the manufacture and supply of all requirements of Erbitux in bulk-form active pharmaceutical ingredient (API) for clinical and commercial use in the U.S. and Canada, and BMS will purchase all of its requirements of API for commercial use from us, subject to certain stipulations per the agreement. Sales of Erbitux to BMS for commercial use are reported in net product sales.
Merck KGaA
A development and license agreement grants Merck exclusive rights to market Erbitux outside of the U.S. and Canada, and expires in December 2018. A separate agreement grants co-exclusive rights among Merck, BMS, and us in Japan and expires in 2032.
Merck manufactures Erbitux for supply in its territory as well as for Japan. We receive a royalty on the sales of Erbitux outside of the U.S. and Canada, which is included in collaboration and other revenue as earned. Royalties due to third parties are recorded as a reduction of collaboration and other revenue, net of any royalty reimbursements due from third parties.
Exenatide
In November 2011, we agreed with Amylin Pharmaceuticals, Inc. (Amylin) to terminate our collaborative arrangement for the joint development, marketing, and selling of Byetta
®
(exenatide injection) and other forms of exenatide such as Bydureon
®
(exenatide extended-release for injectable suspension). Under the terms of the termination agreement, Amylin made a one-time, upfront payment to us of
$250.0 million
. Amylin also agreed to make future revenue-sharing payments to us in an amount equal to
15.0 percent
of its global net sales of exenatide products until Amylin made aggregate payments to us of
$1.20 billion
plus interest, which would accrue at
9.5 percent
. Upon completion of the acquisition of Amylin by Bristol-Myers Squibb Company in August 2012, Amylin's obligation of
$1.26 billion
, including accrued interest, was paid in full, with
$1.21 billion
representing a prepayment of the obligation. We will also receive a
$150.0 million
milestone payment contingent upon FDA approval of a once-monthly suspension version of exenatide.
Commercial operations were transferred to Amylin in the U.S. in late 2011. Outside the U.S., we transferred to Amylin exenatide commercial rights and control in all markets during the first quarter of 2013. We were responsible for certain development costs related to certain clinical trials outside the U.S. that we were
63
conducting as of the date of the termination agreement as well as commercialization costs outside the U.S. until the commercial rights were transferred to Amylin.
Payments received from Amylin were allocated
65 percent
to the U.S., which was treated as a contract termination, and
35 percent
to the business outside the U.S., which was treated as the disposition of a business. The allocation was based upon relative fair values. The revenue-sharing income allocated to the U.S. was recognized as collaboration and other revenue, consistent with our policy for royalty revenue, while the income related to the prepayment of Amylin's obligation allocated to the U.S. was recognized in other-net, (income) expense. All income allocated to the business outside the U.S. that was transferred during the first quarter of 2013 was recognized as a gain on the disposition of a business in other–net, (income) expense, net of the goodwill allocated to the business transferred.
Under the terms of our prior arrangement, we reported as net product sales
100 percent
of sales outside the U.S. and our sales of Byetta pen delivery devices to Amylin. We paid Amylin a percentage of the gross margin of exenatide sales outside of the U.S., and these costs were recorded in cost of sales. This arrangement for the commercial operations outside the U.S. continued until those rights were transferred to Amylin during the first quarter of 2013.
Total revenue related to exenatide was insignificant in 2014. The following table summarizes the revenue and other income recognized with respect to exenatide for the years ended December 31, 2013 and 2012:
|
2013
|
2012
|
||||||
|
Net product sales
|
$
|
133.1
|
|
$
|
207.8
|
|
|
|
Collaboration and other revenue
|
—
|
|
70.1
|
|
|||
|
Total revenue
|
$
|
133.1
|
|
$
|
277.9
|
|
|
|
Income related to termination of the exenatide collaboration with Amylin
(1)
|
$
|
495.4
|
|
$
|
787.8
|
|
|
1
Presented in other-net, (income) expense
Solanezumab
We have an agreement with an affiliate of TPG-Axon Capital (TPG) whereby TPG funded a portion of the Phase III development of solanezumab. Under the agreement, TPG’s obligation to fund solanezumab costs ended in 2011. In exchange for their funding, TPG may receive success-based sales milestones totaling approximately
$70 million
and mid-single digit royalties contingent upon the successful development of solanezumab. The royalties would be paid for approximately
10
years after launch of a product.
Baricitinib
We have a worldwide license and collaboration agreement with Incyte Corporation (Incyte) which provides us the development and commercialization rights to its Janus tyrosine kinase inhibitor compound, now known as baricitinib, and certain follow-on compounds, for the treatment of inflammatory and autoimmune diseases. Incyte has the right to receive tiered, double-digit royalty payments on future global sales with rates ranging up to
20 percent
if the product is successfully commercialized. The agreement provides Incyte with options to co-develop these compounds on an indication-by-indication basis by funding
30 percent
of the associated development costs from the initiation of a Phase IIb trial through regulatory approval in exchange for increased tiered royalties ranging up to percentages in the high twenties. In 2010, Incyte exercised its option to co-develop baricitinib in rheumatoid arthritis. The agreement also provides Incyte with an option to co-promote in the U.S. and calls for payments associated with certain development, success-based regulatory, and sales-based milestones. Upon initiation of Phase III trials for the treatment of rheumatoid arthritis in the fourth quarter of 2012, we incurred a milestone-related expense of
$50.0 million
which was recorded as research and development expense. As of
December 31, 2014
, Incyte is eligible to receive up to
$415.0 million
of additional payments from us contingent upon certain development and success-based regulatory milestones as well as an additional
$150.0 million
of potential sales-based milestones.
64
Tanezumab
In October 2013, we entered into a collaboration agreement with Pfizer Inc. to jointly develop and globally commercialize tanezumab for the potential treatment of osteoarthritis pain, chronic low back pain and cancer pain. Tanezumab is currently in Phase III development and is subject to a partial clinical hold by the FDA pending submission of nonclinical data to the FDA. Under the agreement, the companies share equally the ongoing development costs and, if successful, in gross margins and certain commercialization expenses. Contingent upon the parties continuing in the collaboration after receipt of the FDA's response to the submission of the nonclinical data, we will be obligated to pay an upfront fee of
$200.0 million
. This payment would be immediately expensed. In addition to this fee, we may pay up to
$350.0 million
in success-based regulatory milestones and up to
$1.23 billion
in a series of sales-based milestones, contingent upon the commercial success of tanezumab. Both parties have the right to terminate the agreement under certain circumstances.
Summary of Commission and Profit-Share Payments
The aggregate amount of marketing, selling, and administrative expense associated with our commission and profit-sharing obligations for the collaborations and other arrangements described above was
$211.2 million
,
$203.7 million
, and
$188.5 million
for the years ended
December 31, 2014
,
2013
, and
2012
, respectively.
The components of the charges included in asset impairment, restructuring, and other special charges in our consolidated statements of operations are described below. Substantially all of these expenses relate to our human pharmaceutical business segment.
|
2014
|
2013
|
2012
|
|||||||||
|
Severance
|
$
|
225.5
|
|
$
|
90.6
|
|
$
|
74.5
|
|
||
|
Asset impairment and other special charges
|
243.2
|
|
30.0
|
|
206.6
|
|
|||||
|
Asset impairment, restructuring, and other special charges
|
$
|
468.7
|
|
$
|
120.6
|
|
$
|
281.1
|
|
||
Severance costs listed above for all years relate to ongoing cost containment efforts as we continue our initiatives to reduce our cost structure and global workforce. Substantially all of the severance costs incurred during the year ended December 31, 2014 are expected to be paid by the end of 2015, and substantially all of the severance costs incurred during the years ended December 31, 2013 and 2012 have been paid.
For the year ended December 31, 2014, we incurred
$243.2 million
of asset impairment and other special charges consisting primarily of a
$180.8 million
asset impairment charge related to our decision to close and sell a manufacturing plant located in Puerto Rico. The manufacturing plant was written down to its estimated fair value, which was based primarily on recent sales of similar assets.
For the year ended December 31, 2013, we incurred
$30.0 million
of asset impairment and other special charges related primarily to costs associated with the closure of a packaging and distribution facility in Germany.
For the year ended December 31, 2012, we incurred
$206.6 million
of asset impairment and other special charges consisting of
$122.6 million
related to an intangible asset impairment for liprotamase (see Note 8) net of the reduction of the related contingent consideration liability,
$64.0 million
related to the recognition of an asset impairment associated with the decision to stop development of a delivery device platform, and
$20.0 million
resulting from a change in our estimates of returned product related to the withdrawal of Xigris
™
from the market during the fourth quarter of 2011.
65
Inventories at December 31 consisted of the following:
|
2014
|
2013
|
||||||
|
Finished products
|
$
|
838.0
|
|
$
|
968.1
|
|
|
|
Work in process
|
1,715.4
|
|
1,868.3
|
|
|||
|
Raw materials and supplies
|
315.0
|
|
259.0
|
|
|||
|
Total (approximates replacement cost)
|
2,868.4
|
|
3,095.4
|
|
|||
|
Reduction to LIFO cost
|
(128.4
|
)
|
(166.6
|
)
|
|||
|
Inventories
|
$
|
2,740.0
|
|
$
|
2,928.8
|
|
|
Inventories valued under the LIFO method comprised
$1.09 billion
and
$1.02 billion
of total inventories at
December 31, 2014
and
2013
, respectively.
Financial instruments that potentially subject us to credit risk consist principally of trade receivables and interest-bearing investments. Wholesale distributors of life-science products account for a substantial portion of trade receivables; collateral is generally not required. The risk associated with this concentration is mitigated by our ongoing credit-review procedures and insurance. A large portion of our cash is held by a few major financial institutions. We monitor our exposures with these institutions and do not expect any of these institutions to fail to meet their obligations. Major financial institutions represent the largest component of our investments in corporate debt securities. In accordance with documented corporate policies, we monitor the amount of credit exposure to any one financial institution or corporate issuer. We are exposed to credit-related losses in the event of nonperformance by counterparties to risk-management instruments but do not expect any counterparties to fail to meet their obligations given their high credit ratings.
At
December 31, 2014
, we had outstanding foreign currency forward commitments to purchase
330.6 million
U.S. dollars and sell
270.3 million
euro; commitments to purchase
1.18 billion
euro and sell
1.45 billion
U.S. dollars; commitments to purchase
190.4 million
British pounds and sell
242.4 million
euro; and commitments to purchase
332.6 million
U.S. dollars and sell
40.04 billion
Japanese yen, which will all settle within
30 days
.
At
December 31, 2014
, substantially all of our total long-term debt is at a fixed rate. We have converted approximately
55 percent
of our long-term fixed-rate notes to floating rates through the use of interest rate swaps.
At
December 31, 2014
, the total notional amounts of forward-starting interest rate contracts in designated cash flow hedging instruments were
$1.35 billion
, which will all settle within
three months
.
The following effects of risk-management instruments were recognized in other–net, (income) expense:
|
2014
|
2013
|
2012
|
|||||||||
|
Fair value hedges:
|
|||||||||||
|
Effect from hedged fixed-rate debt
|
$
|
156.9
|
|
$
|
(308.2
|
)
|
$
|
51.5
|
|
||
|
Effect from interest rate contracts
|
(156.9
|
)
|
308.2
|
|
(51.5
|
)
|
|||||
|
Cash flow hedges:
|
|||||||||||
|
Effective portion of losses on equity contracts reclassified from accumulated other comprehensive loss
(1)
|
129.0
|
|
—
|
|
—
|
|
|||||
|
Effective portion of losses on interest rate contracts reclassified from accumulated other comprehensive loss
|
9.0
|
|
9.0
|
|
9.0
|
|
|||||
|
Net (gains) losses on foreign currency exchange contracts not designated as hedging instruments
|
(20.4
|
)
|
15.4
|
|
(35.8
|
)
|
|||||
|
Net losses on interest rate contracts not designated as hedging instruments
|
3.4
|
|
—
|
|
—
|
|
|||||
66
|
1
|
Realized gains on the sale of underlying equity securities recognized in other-net, (income) expense were
$260.8 million
during the year ended December 31, 2014. There were
no
realized gains on the sale of underlying equity securities during the years ended December 31, 2013 and 2012.
|
During the years ended
December 31, 2014
,
2013
, and
2012
, net losses related to ineffectiveness, as well as net losses related to the portion of our risk-management hedging instruments, fair value hedges, and cash flow hedges that were excluded from the assessment of effectiveness, were not material.
Fair Value Hedges
During the year ended
December 31, 2014
, we terminated certain interest rate swaps designated as fair value hedges with an aggregate notional amount of
$1.30 billion
. As a result of the termination, we received cash of
$340.7 million
, which represented the fair value of the interest rate swaps at the time of termination. The related fair value adjustment was recorded as an increase to the carrying value of the underlying fixed-rate debt and will be amortized into earnings as a reduction of interest expense over the remaining life of the underlying debt.
Cash Flow Hedges
The effective portion of equity contracts in designated cash flow hedging relationships recorded in other comprehensive income (loss) was
$149.6 million
and
$(149.6) million
during the years ended
December 31, 2014
and
2013
, respectively. There were
no
equity contracts in designated cash flow hedging relationships in 2012. During the year ended
December 31, 2014
, we sold all of the underlying equity securities that had been in designated cash flow hedging relationships. At the time of the sales, we reclassified to earnings the accumulated other comprehensive loss related to the cash flow hedges and the previously unrealized gains on the underlying equity securities.
For forward-starting interest rate swaps in designated cash flow hedging relationships associated with an anticipated debt issuance, the effective portion of net gains (losses) recorded in other comprehensive income (loss) was
$(164.7) million
and
$16.7 million
for the years ended December 31, 2014 and 2013. There were
no
forward-starting interest rate swaps in designated cash flow hedging relationships in 2012.
During the next 12 months, we expect to reclassify from accumulated other comprehensive loss to earnings
$9.0 million
of pretax net losses on cash flow hedges of the variability in expected future interest payments on our floating rate debt.
Non-Hedging Instruments
During the year ended
December 31, 2014
, we settled fixed-rate interest contracts used to manage interest rate risks on our investments in debt securities, which were not designed as hedging instruments. The aggregate notional amount of the settled contracts was
$876.0 million
, and we paid
$3.4 million
of cash to the counterparties upon settlement.
67
Fair Value of Financial Instruments
The following tables summarize certain fair value information at December 31 for assets and liabilities measured at fair value on a recurring basis, as well as the carrying amount and amortized cost of certain other investments:
|
|
|
|
Fair Value Measurements Using
|
|
|||||||||||||||||||
|
Description
|
Carrying
Amount
|
Amortized
Cost
|
Quoted Prices in Active Markets for Identical Assets
(Level 1)
|
Significant
Other
Observable
Inputs
(Level 2)
|
Significant
Unobservable
Inputs
(Level 3)
|
Fair
Value
|
|||||||||||||||||
|
December 31, 2014
|
|||||||||||||||||||||||
|
Cash equivalents
|
$
|
2,443.5
|
|
$
|
2,443.5
|
|
$
|
2,415.5
|
|
$
|
28.0
|
|
$
|
—
|
|
$
|
2,443.5
|
|
|||||
|
Short-term investments:
|
|||||||||||||||||||||||
|
U.S. government and agencies
|
$
|
185.5
|
|
$
|
185.6
|
|
$
|
156.5
|
|
$
|
29.0
|
|
$
|
—
|
|
$
|
185.5
|
|
|||||
|
Corporate debt securities
|
767.4
|
|
766.7
|
|
—
|
|
767.4
|
|
—
|
|
767.4
|
|
|||||||||||
|
Other securities
|
2.5
|
|
2.5
|
|
—
|
|
2.5
|
|
—
|
|
2.5
|
|
|||||||||||
|
Short-term investments
|
$
|
955.4
|
|
$
|
954.8
|
|
|||||||||||||||||
|
Noncurrent investments:
|
|||||||||||||||||||||||
|
U.S. government and agencies
|
$
|
756.7
|
|
$
|
757.5
|
|
$
|
747.5
|
|
$
|
9.2
|
|
$
|
—
|
|
$
|
756.7
|
|
|||||
|
Corporate debt securities
|
2,462.7
|
|
2,468.9
|
|
—
|
|
2,462.7
|
|
—
|
|
2,462.7
|
|
|||||||||||
|
Mortgage-backed
|
217.0
|
|
217.6
|
|
—
|
|
217.0
|
|
—
|
|
217.0
|
|
|||||||||||
|
Asset-backed
|
477.8
|
|
478.0
|
|
—
|
|
477.8
|
|
—
|
|
477.8
|
|
|||||||||||
|
Other securities
|
3.2
|
|
3.2
|
|
—
|
|
3.2
|
|
—
|
|
3.2
|
|
|||||||||||
|
Marketable equity
|
204.8
|
|
44.0
|
|
204.8
|
|
—
|
|
—
|
|
204.8
|
|
|||||||||||
|
Equity method and other investments
(1)
|
446.7
|
|
446.7
|
|
|||||||||||||||||||
|
Noncurrent investments
|
$
|
4,568.9
|
|
$
|
4,415.9
|
|
|||||||||||||||||
|
December 31, 2013
|
|||||||||||||||||||||||
|
Cash equivalents
|
$
|
2,574.7
|
|
$
|
2,574.7
|
|
$
|
2,517.1
|
|
$
|
57.6
|
|
$
|
—
|
|
$
|
2,574.7
|
|
|||||
|
Short-term investments:
|
|||||||||||||||||||||||
|
U.S. government and agencies
|
$
|
276.4
|
|
$
|
276.6
|
|
$
|
276.4
|
|
$
|
—
|
|
$
|
—
|
|
$
|
276.4
|
|
|||||
|
Corporate debt securities
|
931.7
|
|
929.8
|
|
—
|
|
931.7
|
|
—
|
|
931.7
|
|
|||||||||||
|
Other securities
|
2.7
|
|
2.7
|
|
—
|
|
2.7
|
|
—
|
|
2.7
|
|
|||||||||||
|
Marketable equity
|
356.3
|
|
75.0
|
|
356.3
|
|
—
|
|
—
|
|
356.3
|
|
|||||||||||
|
Short-term investments
|
$
|
1,567.1
|
|
$
|
1,284.1
|
|
|
|
|||||||||||||||
|
Noncurrent investments:
|
|||||||||||||||||||||||
|
U.S. government and agencies
|
$
|
1,115.6
|
|
$
|
1,126.1
|
|
$
|
1,035.6
|
|
$
|
80.0
|
|
$
|
—
|
|
$
|
1,115.6
|
|
|||||
|
Corporate debt securities
|
4,940.5
|
|
4,933.7
|
|
—
|
|
4,940.5
|
|
—
|
|
4,940.5
|
|
|||||||||||
|
Mortgage-backed
|
636.0
|
|
652.4
|
|
—
|
|
636.0
|
|
—
|
|
636.0
|
|
|||||||||||
|
Asset-backed
|
490.0
|
|
494.5
|
|
—
|
|
490.0
|
|
—
|
|
490.0
|
|
|||||||||||
|
Other securities
|
7.3
|
|
8.3
|
|
—
|
|
7.3
|
|
—
|
|
7.3
|
|
|||||||||||
|
Marketable equity
|
81.2
|
|
22.8
|
|
81.2
|
|
—
|
|
—
|
|
81.2
|
|
|||||||||||
|
Equity method and other investments
(1)
|
354.3
|
|
354.3
|
|
|||||||||||||||||||
|
Noncurrent investments
|
$
|
7,624.9
|
|
$
|
7,592.1
|
|
|||||||||||||||||
|
1
|
Fair value not applicable
|
68
|
|
Fair Value Measurements Using
|
|
|||||||||||||||||
|
Description
|
Carrying
Amount
|
Quoted Prices in Active Markets for Identical Assets
(Level 1)
|
Significant
Other
Observable
Inputs
(Level 2)
|
Significant
Unobservable
Inputs
(Level 3)
|
Fair
Value
|
||||||||||||||
|
Short-term commercial paper borrowings
|
|||||||||||||||||||
|
December 31, 2014
|
$
|
(2,680.6
|
)
|
$
|
—
|
|
$
|
(2,680.6
|
)
|
$
|
—
|
|
$
|
(2,680.6
|
)
|
||||
|
December 31, 2013
|
—
|
|
—
|
|
—
|
|
—
|
|
—
|
|
|||||||||
|
Long-term debt, including current portion
|
|||||||||||||||||||
|
December 31, 2014
|
$
|
(5,375.8
|
)
|
$
|
—
|
|
$
|
(5,722.1
|
)
|
$
|
—
|
|
$
|
(5,722.1
|
)
|
||||
|
December 31, 2013
|
(5,212.9
|
)
|
—
|
|
(5,490.9
|
)
|
—
|
|
(5,490.9
|
)
|
|||||||||
|
|
Fair Value Measurements Using
|
|
|||||||||||||||||
|
Description
|
Carrying
Amount
|
Quoted Prices in Active Markets for Identical Assets
(Level 1)
|
Significant
Other
Observable
Inputs
(Level 2)
|
Significant
Unobservable
Inputs
(Level 3)
|
Fair
Value
|
||||||||||||||
|
December 31, 2014
|
|||||||||||||||||||
|
Risk-management instruments
|
|||||||||||||||||||
|
Interest rate contracts designated as hedging instruments:
|
|||||||||||||||||||
|
Other receivables
|
$
|
102.5
|
|
$
|
—
|
|
$
|
102.5
|
|
$
|
—
|
|
$
|
102.5
|
|
||||
|
Other current liabilities
|
(149.5
|
)
|
—
|
|
(149.5
|
)
|
—
|
|
(149.5
|
)
|
|||||||||
|
Other noncurrent liabilities
|
(0.7
|
)
|
—
|
|
(0.7
|
)
|
—
|
|
(0.7
|
)
|
|||||||||
|
Foreign exchange contracts not designated as hedging instruments:
|
|||||||||||||||||||
|
Other receivables
|
9.1
|
|
—
|
|
9.1
|
|
—
|
|
9.1
|
|
|||||||||
|
Other current liabilities
|
(14.0
|
)
|
—
|
|
(14.0
|
)
|
—
|
|
(14.0
|
)
|
|||||||||
|
December 31, 2013
|
|||||||||||||||||||
|
Risk-management instruments
|
|||||||||||||||||||
|
Interest rate contracts designated as hedging instruments:
|
|||||||||||||||||||
|
Other receivables
|
$
|
20.1
|
|
$
|
—
|
|
$
|
20.1
|
|
$
|
—
|
|
$
|
20.1
|
|
||||
|
Sundry
|
278.7
|
|
—
|
|
278.7
|
|
—
|
|
278.7
|
|
|||||||||
|
Other noncurrent liabilities
|
(0.9
|
)
|
—
|
|
(0.9
|
)
|
—
|
|
(0.9
|
)
|
|||||||||
|
Foreign exchange contracts not designated as hedging instruments:
|
|||||||||||||||||||
|
Other receivables
|
6.7
|
|
—
|
|
6.7
|
|
—
|
|
6.7
|
|
|||||||||
|
Other current liabilities
|
(7.1
|
)
|
—
|
|
(7.1
|
)
|
—
|
|
(7.1
|
)
|
|||||||||
|
Equity contracts designated as hedging instruments:
|
|||||||||||||||||||
|
Other current liabilities
|
(149.6
|
)
|
—
|
|
(149.6
|
)
|
—
|
|
(149.6
|
)
|
|||||||||
Risk-management instruments above are disclosed on a gross basis. There are various rights of setoff associated with certain of the risk-management instruments above that are subject to an enforceable master netting arrangement or similar agreements. Although various rights of setoff and master netting arrangements or similar agreements may exist with the individual counterparties to the risk-management instruments above, individually, these financial rights are not material.
69
We determine fair values based on a market approach using quoted market values, significant other observable inputs for identical or comparable assets or liabilities, or discounted cash flow analyses. The fair value of equity method investments and other investments is not readily available.
The table below summarizes the contractual maturities of our investments in debt securities measured at fair value as of
December 31, 2014
:
|
|
Maturities by Period
|
||||||||||||||||||
|
|
Total
|
Within
1 Year
|
After 1 Year
Through 5 Years
|
After 5 Years
Through 10 Years
|
After
10 Years
|
||||||||||||||
|
Fair value of debt securities
|
$
|
4,872.8
|
|
$
|
955.4
|
|
$
|
3,462.1
|
|
$
|
230.7
|
|
$
|
224.6
|
|
||||
A summary of the fair value of available-for-sale securities in an unrealized gain or loss position and the amount of unrealized gains and losses (pretax) in accumulated other comprehensive loss follows:
|
2014
|
2013
|
||||||
|
Unrealized gross gains
|
$
|
171.9
|
|
$
|
375.6
|
|
|
|
Unrealized gross losses
|
18.3
|
|
59.8
|
|
|||
|
Fair value of securities in an unrealized gain position
|
1,778.8
|
|
4,982.7
|
|
|||
|
Fair value of securities in an unrealized loss position
|
3,129.2
|
|
3,664.7
|
|
|||
Other-than-temporary impairment losses on investment securities of
$12.5 million
,
$11.3 million
, and
$22.6 million
were recognized in the consolidated statements of operations for the years ended
December 31, 2014
,
2013
, and
2012
, respectively. For fixed-income securities, the amount of credit losses represents the difference between the present value of cash flows expected to be collected on these securities and the amortized cost. Factors considered in assessing the credit loss were the position in the capital structure, vintage and amount of collateral, delinquency rates, current credit support, and geographic concentration.
The securities in an unrealized loss position include fixed-rate debt securities of varying maturities. The value of fixed-income securities is sensitive to changes in the yield curve and other market conditions.
Approximately
90 percent
of the securities in a loss position are investment-grade debt securities. At this time, there is no indication of default on interest or principal payments for debt securities other than those for which an other-than-temporary impairment charge has been recorded. We do not intend to sell, and it is not more likely than not we will be required to sell, the securities in a loss position before the market values recover or the underlying cash flows have been received, and we have concluded that no additional other-than-temporary loss is required to be charged to earnings as of
December 31, 2014
.
Activity related to our investment portfolio, substantially all of which related to available-for-sale securities, was as follows:
|
2014
|
2013
|
2012
|
|||||||||
|
Proceeds from sales
|
$
|
14,609.5
|
|
$
|
13,753.5
|
|
$
|
6,529.8
|
|
||
|
Realized gross gains on sales
|
353.5
|
|
49.5
|
|
82.3
|
|
|||||
|
Realized gross losses on sales
|
29.4
|
|
15.4
|
|
10.9
|
|
|||||
Goodwill and other indefinite-lived intangible assets at December 31 were as follows:
|
2014
|
2013
|
||||||
|
Goodwill (by segment):
|
|||||||
|
Human pharmaceutical products
|
$
|
1,354.3
|
|
$
|
1,354.7
|
|
|
|
Animal health
|
403.8
|
|
162.1
|
|
|||
|
Total goodwill
|
1,758.1
|
|
1,516.8
|
|
|||
|
In-process research and development
|
11.4
|
|
33.6
|
|
|||
|
Total indefinite-lived intangible assets
|
$
|
1,769.5
|
|
$
|
1,550.4
|
|
|
70
The increase in goodwill for the animal health segment in 2014 is a result of the acquisition of Lohmann AH (Note 3).
No
impairments occurred with respect to the carrying value of goodwill for the years ended
December 31, 2014
,
2013
, and
2012
.
IPR&D consists of the acquisition date fair value of products under development acquired in business combinations that have not yet achieved regulatory approval for marketing, adjusted for subsequent impairments, if any. As discussed in Note 1, we use the "income method" to calculate the fair value of the IPR&D assets, which is a Level 3 fair value measurement.
No
material impairments occurred with respect to the carrying value of IPR&D for the years ended
December 31, 2014
and
2013
. In 2012, we recorded impairment charges of
$205.0 million
related to liprotamase as a result of changes in key assumptions used in the valuation, based upon additional communications with the FDA regarding the clinical trial that would be required for resubmission, and our expectations for the product.
The components of finite-lived intangible assets at December 31 were as follows:
|
|
2014
|
2013
|
|||||||||||||||||||||
|
Description
|
Carrying
Amount—
Gross
|
Accumulated
Amortization
|
Carrying
Amount—
Net
|
Carrying
Amount—
Gross
|
Accumulated
Amortization
|
Carrying
Amount—
Net
|
|||||||||||||||||
|
Marketed products
|
$
|
5,684.3
|
|
$
|
(2,915.6
|
)
|
$
|
2,768.7
|
|
$
|
5,136.1
|
|
$
|
(2,447.2
|
)
|
$
|
2,688.9
|
|
|||||
|
Other
|
149.3
|
|
(45.2
|
)
|
104.1
|
|
164.8
|
|
(73.0
|
)
|
91.8
|
|
|||||||||||
|
Total finite-lived intangible assets
|
$
|
5,833.6
|
|
$
|
(2,960.8
|
)
|
$
|
2,872.8
|
|
$
|
5,300.9
|
|
$
|
(2,520.2
|
)
|
$
|
2,780.7
|
|
|||||
Marketed products consist of the amortized cost of the rights to assets acquired in business combinations and approved for marketing in a significant global jurisdiction (U.S., Europe, and Japan) and capitalized milestone payments. Other intangibles consist primarily of the amortized cost of licensed platform technologies that have alternative future uses in research and development, manufacturing technologies, and customer relationships from business combinations.
No
material impairments occurred with respect to the carrying value of finite-lived intangible assets for the years ended
December 31, 2014
,
2013
and
2012
.
See Note 3 for further discussion of intangible assets acquired in recent business combinations and Note 4 for additional discussion of recent capitalized milestone payments.
As of
December 31, 2014
, the remaining weighted-average amortization period for finite-lived intangible assets is approximately
10 years
. Amortization expense was
$535.9 million
,
$555.0 million
, and
$563.0 million
for the years ended
December 31, 2014
,
2013
, and
2012
, respectively. The estimated amortization expense associated with our current finite-lived intangible assets for each of the next five years approximates
$465 million
in
2015
,
$360 million
in
2016
,
$325 million
in
2017
,
$215 million
in
2018
, and
$185 million
in
2019
. These estimated amounts exclude the amortization related to the acquired intangible assets which will be recorded in association with the January 1, 2015 acquisition of Novartis AH. Amortization expense is included in either cost of sales, marketing, selling, and administrative or research and development depending on the nature of the intangible asset being amortized.
71
At December 31, property and equipment consisted of the following:
|
2014
|
2013
|
||||||
|
Land
|
$
|
205.2
|
|
$
|
198.7
|
|
|
|
Buildings
|
6,516.2
|
|
6,489.9
|
|
|||
|
Equipment
|
7,609.7
|
|
7,752.7
|
|
|||
|
Construction in progress
|
1,698.2
|
|
1,205.4
|
|
|||
|
16,029.3
|
|
15,646.7
|
|
||||
|
Less accumulated depreciation
|
(8,065.4
|
)
|
(7,671.2
|
)
|
|||
|
Property and equipment, net
|
$
|
7,963.9
|
|
$
|
7,975.5
|
|
|
Depreciation expense for the years ended
December 31, 2014
,
2013
, and
2012
was
$759.1 million
,
$774.8 million
, and
$754.0 million
, respectively. Capitalized interest costs were not material for the years ended
December 31, 2014
,
2013
, and
2012
, respectively. Total rental expense for all leases, including contingent rentals (not material), amounted to
$227.3 million
,
$227.2 million
, and
$262.2 million
for the years ended
December 31, 2014
,
2013
, and
2012
, respectively. Assets under capital leases included in property and equipment, net on the consolidated balance sheets, capital lease obligations entered into, and future minimum rental commitments are not material.
Debt at December 31 consisted of the following:
|
2014
|
2013
|
||||||
|
Short-term commercial paper borrowings
|
$
|
2,680.6
|
|
$
|
—
|
|
|
|
1.95 to 7.13 percent long-term notes (due 2016-2044)
|
4,887.3
|
|
4,887.3
|
|
|||
|
Other long-term debt, including capitalized leases
|
33.1
|
|
27.1
|
|
|||
|
Fair value adjustment on long-term notes
|
455.4
|
|
298.5
|
|
|||
|
Total debt
|
8,056.4
|
|
5,212.9
|
|
|||
|
Less current portion
|
(2,688.7
|
)
|
(1,012.6
|
)
|
|||
|
Long-term debt
|
$
|
5,367.7
|
|
$
|
4,200.3
|
|
|
At
December 31, 2014
, we had
$2.68 billion
outstanding borrowings under our commercial paper program. There were
no
amounts outstanding under our commercial paper program at December 31, 2013. The weighted-average effective borrowing rate on outstanding commercial paper at
December 31, 2014
was
0.18 percent
.
At
December 31, 2014
, we had a total of
$3.31 billion
of unused committed bank credit facilities. In August 2014, we refinanced our revolving bank credit facilities and entered into a
$1.20 billion
credit facility with a five-year term and a
$2.00 billion
credit facility with a 364-day term, both of which are available to support our commercial paper program. There were
no
amounts outstanding under the revolving credit facility during the year ended
December 31, 2014
. Compensating balances and commitment fees are not material, and there are no conditions that are probable of occurring under which the lines may be withdrawn.
In February 2014, we issued
$600.0 million
of
1.95 percent
and
$400.0 million
of
4.65 percent
fixed-rate notes with interest to be paid semi-annually and maturity dates of March 15, 2019, and June 15, 2044, respectively. Current maturities of long-term notes of
$1.00 billion
were repaid in March 2014.
The aggregate amounts of maturities on long-term debt for the next five years are
$8.1 million
in
2015
,
$208.5 million
in
2016
,
$1.01 billion
in
2017
,
$203.8 million
in
2018
, and
$601.0 million
in
2019
.
We have converted approximately
55 percent
of our long-term fixed-rate notes to floating rates through the use of interest rate swaps. The weighted-average effective borrowing rates based on long-term debt obligations and interest rates at
December 31, 2014
and
2013
, including the effects of interest rate swaps for hedged debt obligations, were
3.69 percent
and
3.10 percent
, respectively.
72
For the years ended
December 31, 2014
,
2013
, and
2012
, cash payments for interest on borrowings totaled
$140.4 million
,
$139.7 million
, and
$171.9 million
, respectively, net of capitalized interest.
In accordance with the requirements of derivatives and hedging guidance, the portion of our fixed-rate debt obligations that is hedged, as a fair value hedge, is reflected in the consolidated balance sheets as an amount equal to the sum of the debt’s carrying value plus the fair value adjustment representing changes in fair value of the hedged debt attributable to movements in market interest rates subsequent to the inception of the hedge.
Stock-based compensation expense of
$156.0 million
,
$144.9 million
, and
$141.5 million
was recognized for the years ended
December 31, 2014
,
2013
, and
2012
, respectively, as well as related tax benefits of
$54.6 million
,
$50.7 million
, and
$49.5 million
, respectively. Our stock-based compensation expense consists of performance awards (PAs), shareholder value awards (SVAs), and restricted stock units (RSUs). We recognize stock-based compensation expense over the requisite service period of the individual grantees, which equals the vesting period. We provide newly issued shares and treasury stock to satisfy stock option exercises and for the issuance of PA, SVA, and RSU shares. We classify tax benefits resulting from tax deductions in excess of the compensation cost recognized for exercised stock options as a financing cash flow in the consolidated statements of cash flows.
At
December 31, 2014
, additional stock-based compensation awards may be granted under the 2002 Lilly Stock Plan for not more than
101.0 million
shares.
Performance Award Program
PAs are granted to officers and management and are payable in shares of our common stock. The number of PA shares actually issued, if any, varies depending on the achievement of certain pre-established earnings-per-share targets over a
two
-year period. PA shares are accounted for at fair value based upon the closing stock price on the date of grant and fully vest at the end of the measurement periods. The fair values of PAs granted for the years ended
December 31, 2014
,
2013
, and
2012
were
$48.81
,
$50.19
, and
$35.74
, respectively. The number of shares ultimately issued for the PA program is dependent upon the earnings achieved during the vesting period. Pursuant to this plan, approximately
0.7 million
shares,
0.7 million
shares, and
1.6 million
shares were issued during the years ended
December 31, 2014
,
2013
, and
2012
, respectively. Approximately
0.5 million
shares are expected to be issued in
2015
. As of
December 31, 2014
, the total remaining unrecognized compensation cost related to nonvested PAs was
$19.8 million
, which will be amortized over the weighted-average remaining requisite service period of
12
months.
Shareholder Value Award Program
SVAs are granted to officers and management and are payable in shares of our common stock at the end of a
three
-year period. The number of shares actually issued, if any, varies depending on our stock price at the end of the
three
-year vesting period compared to pre-established target stock prices. We measure the fair value of the SVA unit on the grant date using a Monte Carlo simulation model. The model utilizes multiple input variables that determine the probability of satisfying the market condition stipulated in the award grant and calculates the fair value of the award. Expected volatilities utilized in the model are based on implied volatilities from traded options on our stock, historical volatility of our stock price, and other factors. Similarly, the dividend yield is based on historical experience and our estimate of future dividend yields. The risk-free interest rate is derived from the U.S. Treasury yield curve in effect at the time of grant. The weighted-average fair values of the SVA units granted during the years ended
December 31, 2014
,
2013
, and
2012
were
$41.97
,
$45.17
, and
$30.35
, respectively, determined using the following assumptions:
|
(Percents)
|
2014
|
2013
|
2012
|
|||||
|
Expected dividend yield
|
3.50
|
%
|
3.50
|
%
|
4.50
|
%
|
||
|
Risk-free interest rate
|
.08-.71
|
|
.08-.43
|
|
.10-.36
|
|
||
|
Range of volatilities
|
18.87-21.56
|
|
18.95-22.37
|
|
22.40-25.64
|
|
||
73
A summary of the SVA activity is presented below:
|
Units Attributable to SVAs (in thousands)
|
2014
|
2013
|
2012
|
|||||
|
Outstanding at January 1
|
6,636
|
|
7,539
|
|
7,036
|
|
||
|
Granted
|
1,987
|
|
1,795
|
|
2,439
|
|
||
|
Issued
|
(2,224
|
)
|
(2,397
|
)
|
(973
|
)
|
||
|
Forfeited or expired
|
(300
|
)
|
(301
|
)
|
(963
|
)
|
||
|
Outstanding at December 31
|
6,099
|
|
6,636
|
|
7,539
|
|
||
Approximately
2.2 million
shares are expected to be issued in
2015
. As of
December 31, 2014
, the total remaining unrecognized compensation cost related to nonvested SVAs was
$53.8 million
, which will be amortized over the weighted-average remaining requisite service period of
20
months.
Restricted Stock Units
RSUs are granted to certain employees and are payable in shares of our common stock. RSU shares are accounted for at fair value based upon the closing stock price on the date of grant. The corresponding expense is amortized over the vesting period, typically
3
years. The fair values of RSU awards granted during the years ended
December 31, 2014
,
2013
, and
2012
were
$52.72
,
$54.10
, and
$39.65
, respectively. The number of shares ultimately issued for the RSU program remains constant with the exception of forfeitures. Pursuant to this plan,
1.2 million
,
1.1 million
, and
1.4 million
shares were granted during the years ended
December 31, 2014
,
2013
, and
2012
, respectively, and approximately
0.9 million
,
0.8 million
, and
0.3 million
shares were issued during the years ended
December 31, 2014
,
2013
, and
2012
, respectively. Approximately
0.8 million
shares are expected to be issued in
2015
. As of
December 31, 2014
, the total remaining unrecognized compensation cost related to nonvested RSUs was
$87.9 million
, which will be amortized over the weighted-average remaining requisite service period of
27
months.
Stock Option Program
Stock options were granted prior to 2007 to officers, management, and board members at exercise prices equal to the fair market value of our stock at the date of grant. Options fully vested
3 years
from the grant date and have a term of
10 years
.
Stock option activity during the year ended
December 31, 2014
is summarized below:
|
Shares of
Common Stock
Attributable to
Options
(in thousands)
|
Weighted-Average
Exercise
Price of Options
|
Weighted-Average
Remaining
Contractual Term
(in years)
|
Aggregate
Intrinsic
Value
|
|||||||||
|
Outstanding at January 1, 2014
|
16,140
|
|
$
|
66.66
|
|
|||||||
|
Exercised
|
(3,670
|
)
|
55.86
|
|
||||||||
|
Forfeited or expired
|
(10,154
|
)
|
72.93
|
|
||||||||
|
Outstanding at December 31, 2014
|
2,316
|
|
56.26
|
|
0.9
|
$
|
29.6
|
|
||||
|
Exercisable at December 31, 2014
|
2,316
|
|
56.26
|
|
0.9
|
29.6
|
|
|||||
The intrinsic value of options exercised during
2014
,
2013
, and
2012
amounted to
$31.2 million
,
$0.5 million
, and
$1.4 million
, respectively. We received cash of
$188.1 million
,
$11.3 million
, and
$1.0 million
from exercises of stock options during
2014
,
2013
, and
2012
, respectively, and recognized related tax benefits of
$8.9 million
,
$0.2 million
, and
$0.5 million
during those same years.
During 2014 and 2013, we repurchased
$800.0 million
and
$500.0 million
, respectively, of shares associated with our
$5.00 billion
share repurchase program announced in 2013. As of
December 31, 2014
, there were
$3.70 billion
of shares remaining in that program. During 2013 and 2012, we repurchased
$1.10 billion
and
$400.0 million
, respectively, of shares, completing our
$1.50 billion
share repurchase program announced in 2012. During 2012, we also repurchased
$419.2 million
of shares to complete our
$3.00 billion
share repurchase program announced in 2000.
74
We have
5.0 million
authorized shares of preferred stock. As of
December 31, 2014
and
2013
,
no
preferred stock has been issued.
We have an employee benefit trust that held
50.0 million
shares of our common stock at both
December 31, 2014
and
2013
, to provide a source of funds to assist us in meeting our obligations under various employee benefit plans. The cost basis of the shares held in the trust was
$3.01 billion
at both
December 31, 2014
and
2013
, and is shown as a reduction in shareholders’ equity. Any dividend transactions between us and the trust are eliminated. Stock held by the trust is not considered outstanding in the computation of EPS. The assets of the trust were not used to fund any of our obligations under these employee benefit plans during the years ended
December 31, 2014
,
2013
, and
2012
.
Following is the composition of income tax expense:
|
2014
|
2013
|
2012
|
|||||||||
|
Current:
|
|||||||||||
|
Federal
|
$
|
168.9
|
|
$
|
259.1
|
|
$
|
596.8
|
|
||
|
Foreign
|
406.2
|
|
553.2
|
|
540.6
|
|
|||||
|
State
|
(2.1
|
)
|
126.3
|
|
56.2
|
|
|||||
|
Total current tax expense
|
573.0
|
|
938.6
|
|
1,193.6
|
|
|||||
|
Deferred:
|
|||||||||||
|
Federal
|
(83.3
|
)
|
297.0
|
|
87.0
|
|
|||||
|
Foreign
|
120.2
|
|
(28.2
|
)
|
29.9
|
|
|||||
|
State
|
(0.1
|
)
|
(2.9
|
)
|
9.1
|
|
|||||
|
Total deferred tax expense
|
36.8
|
|
265.9
|
|
126.0
|
|
|||||
|
Income taxes
|
$
|
609.8
|
|
$
|
1,204.5
|
|
$
|
1,319.6
|
|
||
Significant components of our deferred tax assets and liabilities as of December 31 are as follows:
|
2014
|
2013
|
||||||
|
Deferred tax assets:
|
|||||||
|
Compensation and benefits
|
$
|
897.3
|
|
$
|
639.8
|
|
|
|
Purchases of intangible assets
|
473.3
|
|
418.8
|
|
|||
|
Tax credit carryforwards and carrybacks
|
279.4
|
|
494.6
|
|
|||
|
Tax loss carryforwards and carrybacks
|
265.5
|
|
311.7
|
|
|||
|
Product return reserves
|
241.8
|
|
313.7
|
|
|||
|
Debt
|
176.0
|
|
110.0
|
|
|||
|
Contingencies
|
68.9
|
|
106.0
|
|
|||
|
Intercompany profit in inventories
|
—
|
|
104.5
|
|
|||
|
Other
|
633.3
|
|
595.0
|
|
|||
|
Total gross deferred tax assets
|
3,035.5
|
|
3,094.1
|
|
|||
|
Valuation allowances
|
(601.1
|
)
|
(647.1
|
)
|
|||
|
Total deferred tax assets
|
2,434.4
|
|
2,447.0
|
|
|||
|
Deferred tax liabilities:
|
|||||||
|
Unremitted earnings
|
(737.1
|
)
|
(898.3
|
)
|
|||
|
Inventories
|
(684.6
|
)
|
(685.6
|
)
|
|||
|
Intangibles
|
(582.6
|
)
|
(598.9
|
)
|
|||
|
Property and equipment
|
(424.7
|
)
|
(379.1
|
)
|
|||
|
Prepaid employee benefits
|
(275.8
|
)
|
(446.2
|
)
|
|||
|
Financial instruments
|
(161.5
|
)
|
(109.6
|
)
|
|||
|
Total deferred tax liabilities
|
(2,866.3
|
)
|
(3,117.7
|
)
|
|||
|
Deferred tax liabilities - net
|
$
|
(431.9
|
)
|
$
|
(670.7
|
)
|
|
At
December 31, 2014
and
2013
, no individually significant items were classified as “Other” deferred tax assets.
75
The deferred tax asset and related valuation allowance amounts for U.S. federal and state net operating losses and tax credits shown above have been reduced for differences between financial reporting and tax return filings.
Based on filed tax returns, we have tax credit carryforwards and carrybacks of
$459.9 million
available to reduce future income taxes;
$180.5 million
, if unused, will expire by
2021
. The remaining portion of the tax credit carryforwards is related to federal tax credits of
$80.3 million
, international tax credits of
$104.4 million
, and state tax credits of
$94.7 million
, all of which are substantially reserved.
At
December 31, 2014
, based on filed tax returns we had net operating losses and other carryforwards for international and U.S. income tax purposes of
$493.9 million
:
$74.6 million
will expire by
2019
;
$366.1 million
will expire between
2019
and
2029
; and
$53.2 million
of the carryforwards will never expire. Net operating losses and other carryforwards for international and U.S. federal income tax purposes are partially reserved. Deferred tax assets related to state net operating losses of
$97.0 million
and other state carryforwards of
$8.9 million
are fully reserved.
Domestic and Puerto Rican companies contributed approximately
20 percent
,
60 percent
, and
55 percent
for the years ended
December 31, 2014
,
2013
, and
2012
, respectively, to consolidated income before income taxes. We have a subsidiary operating in Puerto Rico under a tax incentive grant effective through the end of
2016
. A similar, new tax incentive grant will begin in
2017
and will be in effect for
15 years
.
At
December 31, 2014
, U.S. income taxes have not been provided on approximately
$25.7 billion
of unremitted earnings of foreign subsidiaries as we consider these unremitted earnings to be indefinitely invested for continued use in our foreign operations. Additional tax provisions will be required if these earnings are repatriated in the future to the United States. Due to complexities in the tax laws and assumptions that we would have to make, it is not practicable to determine the amount of the related unrecognized deferred income tax liability.
Cash payments of income taxes totaled
$729.7 million
,
$1.26 billion
, and
$992.0 million
, for the years ended
December 31, 2014
,
2013
, and
2012
, respectively.
Following is a reconciliation of the income tax expense applying the U.S. federal statutory rate to income before income taxes to reported income tax expense:
|
2014
|
2013
|
2012
|
|||||||||
|
Income tax at the U.S. federal statutory tax rate
|
$
|
1,050.1
|
|
$
|
2,061.3
|
|
$
|
1,892.9
|
|
||
|
Add (deduct):
|
|||||||||||
|
International operations, including Puerto Rico
|
(344.8
|
)
|
(778.3
|
)
|
(593.8
|
)
|
|||||
|
General business credits
|
(44.3
|
)
|
(175.6
|
)
|
(11.2
|
)
|
|||||
|
Other
|
(51.2
|
)
|
97.1
|
|
31.7
|
|
|||||
|
Income taxes
|
$
|
609.8
|
|
$
|
1,204.5
|
|
$
|
1,319.6
|
|
||
The American Taxpayer Relief Act of 2012, which included the reinstatement of the research tax credit for the year 2012, was enacted in early 2013. Therefore, the research tax credits for the years 2012 and 2013 are both included in 2013 with general business credits.
A reconciliation of the beginning and ending amount of gross unrecognized tax benefits is as follows:
|
2014
|
2013
|
2012
|
|||||||||
|
Beginning balance at January 1
|
$
|
1,136.4
|
|
$
|
1,534.3
|
|
$
|
1,369.3
|
|
||
|
Additions based on tax positions related to the current year
|
126.4
|
|
142.5
|
|
144.8
|
|
|||||
|
Additions for tax positions of prior years
|
132.6
|
|
251.5
|
|
70.1
|
|
|||||
|
Reductions for tax positions of prior years
|
(32.1
|
)
|
(358.2
|
)
|
(38.5
|
)
|
|||||
|
Settlements
|
(4.2
|
)
|
(404.9
|
)
|
(9.2
|
)
|
|||||
|
Lapses of statutes of limitation
|
(3.5
|
)
|
(24.9
|
)
|
(4.6
|
)
|
|||||
|
Changes related to the impact of foreign currency translation
|
(16.8
|
)
|
(3.9
|
)
|
2.4
|
|
|||||
|
Ending balance at December 31
|
$
|
1,338.8
|
|
$
|
1,136.4
|
|
$
|
1,534.3
|
|
||
The total amount of unrecognized tax benefits that, if recognized, would affect our effective tax rate was
$638.8 million
and
$523.3 million
at
December 31, 2014
and
2013
, respectively.
76
We file income tax returns in the U.S. federal jurisdiction and various state, local, and non-U.S. jurisdictions. We are no longer subject to U.S. federal, state and local, or non-U.S. income tax examinations in most major taxing jurisdictions for years before 2007.
During 2013, we reached resolution on the remaining matters related to tax years 2008–2009 that were not settled as part of a previous U.S. examination. Considering the impact of this resolution on periods that have not yet been examined, as well as its impact on tax asset carryforwards, there was an immaterial benefit to our consolidated results of operations. We made cash payments of approximately
$135 million
related to tax years 2008–2009 after application of available tax credit carryforwards and carrybacks. The examination of tax years 2010-2012 commenced during the fourth quarter of 2013. While it is reasonably possible that the U.S. examination of 2010-2012 could conclude within the next 12 months, resolution of certain matters is dependent upon a number of factors, including the potential for formal administrative and legal proceedings. As a result, it is not possible to estimate the range of the reasonably possible changes in unrecognized tax benefits that could occur within the next 12 months related to these years, nor is it possible to reliably estimate the total future cash flows related to these unrecognized tax benefits.
We recognize both accrued interest and penalties related to unrecognized tax benefits in income tax expense. During the years ended
December 31, 2014
,
2013
, and
2012
, we recognized income tax expense (benefit) of
$35.9 million
,
$(10.9) million
, and
$42.3 million
, respectively, related to interest and penalties. At
December 31, 2014
and
2013
, our accruals for the payment of interest and penalties totaled
$207.2 million
and
$161.5 million
, respectively.
77
We use a measurement date of December 31 to develop the change in benefit obligation, change in plan assets, funded status, and amounts recognized in the consolidated balance sheets at December 31 for our defined benefit pension and retiree health benefit plans, which were as follows:
|
|
Defined Benefit
Pension Plans
|
Retiree Health
Benefit Plans
|
|||||||||||||
|
|
2014
|
2013
|
2014
|
2013
|
|||||||||||
|
Change in benefit obligation:
|
|||||||||||||||
|
Benefit obligation at beginning of year
|
$
|
9,976.4
|
|
$
|
10,423.8
|
|
$
|
1,757.2
|
|
$
|
2,337.7
|
|
|||
|
Service cost
|
240.9
|
|
287.1
|
|
33.0
|
|
49.9
|
|
|||||||
|
Interest cost
|
472.6
|
|
437.2
|
|
85.6
|
|
98.1
|
|
|||||||
|
Actuarial (gain) loss
|
1,996.3
|
|
(792.2
|
)
|
293.5
|
|
(642.5
|
)
|
|||||||
|
Benefits paid
|
(421.2
|
)
|
(402.3
|
)
|
(76.1
|
)
|
(79.6
|
)
|
|||||||
|
Plan amendments
|
(2.4
|
)
|
(0.1
|
)
|
(533.6
|
)
|
(4.1
|
)
|
|||||||
|
Foreign currency exchange rate changes and other adjustments
|
(250.2
|
)
|
22.9
|
|
(6.1
|
)
|
(2.3
|
)
|
|||||||
|
Benefit obligation at end of year
|
12,012.4
|
|
9,976.4
|
|
1,553.5
|
|
1,757.2
|
|
|||||||
|
Change in plan assets:
|
|||||||||||
|
Fair value of plan assets at beginning of year
|
9,481.7
|
|
8,286.6
|
|
1,879.6
|
|
1,518.0
|
|
|||
|
Actual return on plan assets
|
813.6
|
|
1,144.6
|
|
157.4
|
|
365.7
|
|
|||
|
Employer contribution
|
127.2
|
|
428.9
|
|
(42.2
|
)
|
75.5
|
|
|||
|
Benefits paid
|
(421.2
|
)
|
(402.3
|
)
|
(76.1
|
)
|
(79.6
|
)
|
|||
|
Foreign currency exchange rate changes and other adjustments
|
(165.6
|
)
|
23.9
|
|
—
|
|
—
|
|
|||
|
Fair value of plan assets at end of year
|
9,835.7
|
|
9,481.7
|
|
1,918.7
|
|
1,879.6
|
|
|||
|
Funded status
|
(2,176.7
|
)
|
(494.7
|
)
|
365.2
|
|
122.4
|
|
|||||||
|
Unrecognized net actuarial loss
|
5,114.9
|
|
3,546.3
|
|
439.5
|
|
178.1
|
|
|||||||
|
Unrecognized prior service (benefit) cost
|
43.5
|
|
50.7
|
|
(666.7
|
)
|
(171.5
|
)
|
|||||||
|
Net amount recognized
|
$
|
2,981.7
|
|
$
|
3,102.3
|
|
$
|
138.0
|
|
$
|
129.0
|
|
|||
|
Amounts recognized in the consolidated balance sheet consisted of:
|
|||||||||||||||
|
Sundry
|
$
|
211.2
|
|
$
|
881.2
|
|
$
|
609.4
|
|
$
|
366.4
|
|
|||
|
Other current liabilities
|
(62.3
|
)
|
(62.8
|
)
|
(6.9
|
)
|
(7.7
|
)
|
|||||||
|
Accrued retirement benefits
|
(2,325.6
|
)
|
(1,313.1
|
)
|
(237.3
|
)
|
(236.3
|
)
|
|||||||
|
Accumulated other comprehensive (income) loss before income taxes
|
5,158.4
|
|
3,597.0
|
|
(227.2
|
)
|
6.6
|
|
|||||||
|
Net amount recognized
|
$
|
2,981.7
|
|
$
|
3,102.3
|
|
$
|
138.0
|
|
$
|
129.0
|
|
|||
The unrecognized net actuarial loss and unrecognized prior service cost (benefit) have not yet been recognized in net periodic pension costs and are included in accumulated other comprehensive loss at
December 31, 2014
.
A change to our U.S. retiree health benefit plan was approved in 2014 and communicated to retirees in January 2015. Beginning in 2016, Medicare-eligible retirees and Medicare-eligible dependents will choose health care coverage from insurance providers through a private Medicare supplement marketplace, while still receiving financial support from Lilly. This change decreased our retiree health benefit obligation and increased our unrecognized prior service benefit as of
December 31, 2014
by
$520.8 million
.
During
2015
, we expect the following components of accumulated other comprehensive loss to be recognized as components of net periodic benefit cost:
78
|
|
Defined Benefit
Pension Plans
|
Retiree Health
Benefit Plans
|
|||||
|
Unrecognized net actuarial loss
|
$
|
387.4
|
|
$
|
37.9
|
|
|
|
Unrecognized prior service (benefit) cost
|
10.3
|
|
(92.1
|
)
|
|||
|
Total
|
$
|
397.7
|
|
$
|
(54.2
|
)
|
|
We do not expect any plan assets to be returned to us in
2015
.
The following represents our weighted-average assumptions as of December 31:
|
|
Defined Benefit
Pension Plans
|
Retiree Health
Benefit Plans
|
|||||||||
|
(Percents)
|
2014
|
2013
|
2012
|
2014
|
2013
|
2012
|
|||||
|
Discount rate for benefit obligation
|
4.0
|
4.9
|
4.3
|
4.1
|
5.0
|
4.3
|
|||||
|
Discount rate for net benefit costs
|
4.9
|
4.3
|
5.0
|
5.0
|
4.3
|
5.1
|
|||||
|
Rate of compensation increase for benefit obligation
|
3.4
|
3.4
|
3.4
|
||||||||
|
Rate of compensation increase for net benefit costs
|
3.4
|
3.4
|
3.7
|
||||||||
|
Expected return on plan assets for net benefit costs
|
8.1
|
8.4
|
8.4
|
8.5
|
8.8
|
8.8
|
|||||
We annually evaluate the expected return on plan assets in our defined benefit pension and retiree health benefit plans. In evaluating the expected rate of return, we consider many factors, with a primary analysis of current and projected market conditions; asset returns and asset allocations; and the views of leading financial advisers and economists. We may also review our historical assumptions compared with actual results, as well as the assumptions and trend rates utilized by similar plans, where applicable. Health-care-cost trend rates are assumed to increase at an annual rate of
6.4 percent
for the year ended
December 31, 2015
, decreasing by approximately
0.2 percent
per year to an ultimate rate of
5.0 percent
by 2023.
The following benefit payments, which reflect expected future service, as appropriate, are expected to be paid as follows:
|
2015
|
2016
|
2017
|
2018
|
2019
|
2020-2024
|
||||||||||||||||||
|
Defined benefit pension plans
|
$
|
428.7
|
|
$
|
439.3
|
|
$
|
452.3
|
|
$
|
467.9
|
|
$
|
487.7
|
|
$
|
2,783.6
|
|
|||||
|
Retiree health benefit plans-gross
|
$
|
91.6
|
|
$
|
75.6
|
|
$
|
77.2
|
|
$
|
79.3
|
|
$
|
81.2
|
|
$
|
430.3
|
|
|||||
|
Medicare rebates
|
(6.5
|
)
|
(2.1
|
)
|
(0.7
|
)
|
(0.7
|
)
|
(0.8
|
)
|
(4.9
|
)
|
|||||||||||
|
Retiree health benefit plans-net
|
$
|
85.1
|
|
$
|
73.5
|
|
$
|
76.5
|
|
$
|
78.6
|
|
$
|
80.4
|
|
$
|
425.4
|
|
|||||
Amounts relating to defined benefit plans with projected benefit obligations in excess of plan assets were as follows at December 31:
|
|
2014
|
2013
|
|||||
|
Projected benefit obligation
|
$
|
10,537.2
|
|
$
|
1,773.6
|
|
|
|
Fair value of plan assets
|
8,149.2
|
|
395.4
|
|
|||
Amounts relating to defined benefit plans with accumulated benefit obligations in excess of plan assets were as follows at December 31:
|
|
2014
|
2013
|
|||||
|
Accumulated benefit obligation
|
$
|
2,179.8
|
|
$
|
1,384.6
|
|
|
|
Fair value of plan assets
|
700.9
|
|
181.8
|
|
|||
The total accumulated benefit obligation for our defined benefit pension plans was
$10.88 billion
and
$9.13 billion
at
December 31, 2014
and
2013
, respectively.
79
Net pension and retiree health benefit expense included the following components:
|
|
Defined Benefit
Pension Plans
|
Retiree Health
Benefit Plans
|
|||||||||||||||||||||
|
|
2014
|
2013
|
2012
|
2014
|
2013
|
2012
|
|||||||||||||||||
|
Components of net periodic benefit cost:
|
|||||||||||||||||||||||
|
Service cost
|
$
|
240.9
|
|
$
|
287.1
|
|
$
|
253.1
|
|
$
|
33.0
|
|
$
|
49.9
|
|
$
|
63.3
|
|
|||||
|
Interest cost
|
472.6
|
|
437.2
|
|
455.1
|
|
85.6
|
|
98.1
|
|
114.9
|
|
|||||||||||
|
Expected return on plan assets
|
(756.6
|
)
|
(701.9
|
)
|
(684.8
|
)
|
(146.4
|
)
|
(130.7
|
)
|
(127.2
|
)
|
|||||||||||
|
Amortization of prior service (benefit) cost
|
3.6
|
|
3.7
|
|
4.2
|
|
(37.6
|
)
|
(35.6
|
)
|
(39.8
|
)
|
|||||||||||
|
Recognized actuarial loss
|
282.3
|
|
414.7
|
|
285.7
|
|
20.7
|
|
100.5
|
|
98.4
|
|
|||||||||||
|
Net periodic benefit cost
|
$
|
242.8
|
|
$
|
440.8
|
|
$
|
313.3
|
|
$
|
(44.7
|
)
|
$
|
82.2
|
|
$
|
109.6
|
|
|||||
If the healthcare-cost trend rates were to be increased by one percentage point, the
December 31, 2014
, accumulated postretirement benefit obligation would increase by
$50.2 million
and the aggregate of the service cost and interest cost components of the
2014
annual expense would increase by
$7.8 million
. A one percentage point decrease in these rates would decrease the
December 31, 2014
, accumulated postretirement benefit obligation by
$52.7 million
, and the aggregate of the
2014
service cost and interest cost by
$6.6 million
.
The following represents the amounts recognized in other comprehensive income (loss) for the year ended
December 31, 2014
:
|
Defined Benefit
Pension Plans |
Retiree Health
Benefit Plans |
||||||
|
Actuarial loss arising during period
|
$
|
(1,939.3
|
)
|
$
|
(282.9
|
)
|
|
|
Plan amendments during period
|
2.4
|
|
533.6
|
|
|||
|
Amortization of prior service (benefit) cost included in net income
|
3.6
|
|
(37.6
|
)
|
|||
|
Amortization of net actuarial loss included in net income
|
282.3
|
|
20.7
|
|
|||
|
Foreign currency exchange rate changes and other
|
89.6
|
|
—
|
|
|||
|
Total other comprehensive income during period
|
$
|
(1,561.4
|
)
|
$
|
233.8
|
|
|
We have defined contribution savings plans that cover our eligible employees worldwide. The purpose of these plans is generally to provide additional financial security during retirement by providing employees with an incentive to save. Our contributions to the plans are based on employee contributions and the level of our match. Expenses under the plans totaled
$153.3 million
,
$147.7 million
, and
$136.3 million
for the years ended
December 31, 2014
,
2013
, and
2012
, respectively.
We provide certain other postemployment benefits primarily related to disability benefits and accrue for the related cost over the service lives of employees. Expenses associated with these benefit plans for the years ended
December 31, 2014
,
2013
, and
2012
were not material.
Benefit Plan Investments
Our benefit plan investment policies are set with specific consideration of return and risk requirements in relationship to the respective liabilities. U.S. and Puerto Rico plans represent approximately
80 percent
of our global investments. Given the long-term nature of our liabilities, these plans have the flexibility to manage an above-average degree of risk in the asset portfolios. At the investment-policy level, there are no specifically prohibited investments. However, within individual investment manager mandates, restrictions and limitations are contractually set to align with our investment objectives, ensure risk control, and limit concentrations.
We manage our portfolio to minimize concentration of risk by allocating funds within asset categories. In addition, within a category we use different managers with various management objectives to eliminate any significant concentration of risk.
Our global benefit plans may enter into contractual arrangements (derivatives) to implement the local investment policy or manage particular portfolio risks. Derivatives are principally used to increase or decrease exposure to a particular public equity, fixed income, commodity, or currency market more rapidly or less expensively than could be accomplished through the use of the cash markets. The plans utilize both
80
exchange-traded and over-the-counter instruments. The maximum exposure to either a market or counterparty credit loss is limited to the carrying value of the receivable, and is managed within contractual limits. We expect all of our counterparties to meet their obligations. The gross values of these derivative receivables and payables are not material to the global asset portfolio, and their values are reflected within the tables below.
The defined benefit pension and retiree health benefit plan allocation for the U.S. and Puerto Rico currently comprises approximately
85 percent
growth investments and
15 percent
fixed-income investments. The growth investment allocation encompasses U.S. and international public equity securities, hedge funds, private equity-like investments, and real estate. These portfolio allocations are intended to reduce overall risk by providing diversification, while seeking moderate to high returns over the long term.
Public equity securities are well diversified and invested in U.S. and international small-to-large companies across various asset managers and styles. The remaining portion of the growth portfolio is invested in private alternative investments.
Fixed-income investments primarily consist of fixed-income securities in U.S. treasuries and agencies, emerging market debt obligations, corporate bonds, mortgage-backed securities, and commercial mortgage-backed obligations.
Hedge funds are privately owned institutional investment funds that generally have moderate liquidity. Hedge funds seek specified levels of absolute return regardless of overall market conditions, and generally have low correlations to public equity and debt markets. Hedge funds often invest substantially in financial market instruments (stocks, bonds, commodities, currencies, derivatives, etc.) using a very broad range of trading activities to manage portfolio risks. Hedge fund strategies focus primarily on security selection and seek to be neutral with respect to market moves. Common groupings of hedge fund strategies include relative value, tactical, and event driven. Relative value strategies include arbitrage, when the same asset can simultaneously be bought and sold at different prices, achieving an immediate profit. Tactical strategies often take long and short positions to reduce or eliminate overall market risks while seeking a particular investment opportunity. Event strategy opportunities can evolve from specific company announcements such as mergers and acquisitions, and typically have little correlation to overall market directional movements. Our hedge fund investments are made through limited partnership interests primarily in fund-of-funds structures to ensure diversification across many strategies and many individual managers. Plan holdings in hedge funds are valued based on net asset values (NAVs) calculated by each fund or general partner, as applicable, and we have the ability to redeem these investments at NAV.
Private equity-like investment funds typically have low liquidity and are made through long-term partnerships or joint ventures that invest in pools of capital invested in primarily non-publicly traded entities. Underlying investments include venture capital (early stage investing), buyout, and special situation investing. Private equity management firms typically acquire and then reorganize private companies to create increased long term value. Private equity-like funds usually have a limited life of approximately 10-15 years, and require a minimum investment commitment from their limited partners. Our private investments are made both directly into funds and through fund-of-funds structures to ensure broad diversification of management styles and assets across the portfolio. Plan holdings in private equity-like investments are valued using the value reported by the partnership, adjusted for known cash flows and significant events through our reporting date. Values provided by the partnerships are primarily based on analysis of and judgments about the underlying investments. Inputs to these valuations include underlying NAVs, discounted cash flow valuations, comparable market valuations, and may also include adjustments for currency, credit, liquidity and other risks as applicable. The vast majority of these private partnerships provide us with annual audited financial statements including their compliance with fair valuation procedures consistent with applicable accounting standards.
Real estate is composed of both public and private holdings. Real estate investments in registered investment companies that trade on an exchange are classified as Level 1 on the fair value hierarchy. Real estate investments in funds measured at fair value on the basis of NAV provided by the fund manager are classified as Level 3. These NAVs are developed with inputs including discounted cash flow, independent appraisal, and market comparable analyses.
Other assets include cash and cash equivalents and mark-to-market value of derivatives.
81
The cash value of the trust-owned insurance contract is invested in investment-grade publicly traded equity and fixed-income securities.
Other than hedge funds, private equity-like investments, and real estate, which are discussed above, we determine fair values based on a market approach using quoted market values, significant other observable inputs for identical or comparable assets or liabilities, or discounted cash flow analyses.
The fair values of our defined benefit pension plan and retiree health plan assets as of
December 31, 2014
by asset category are as follows:
|
|
|
Fair Value Measurements Using
|
|||||||||||||
|
Asset Class
|
Total
|
Quoted Prices in Active Markets for
Identical Assets (Level 1) |
Significant
Observable Inputs (Level 2) |
Significant
Unobservable Inputs (Level 3) |
|||||||||||
|
Defined Benefit Pension Plans
|
|||||||||||||||
|
Public equity securities:
|
|||||||||||||||
|
U.S.
|
$
|
411.4
|
|
$
|
183.8
|
|
$
|
227.6
|
|
$
|
—
|
|
|||
|
International
|
2,337.8
|
|
999.7
|
|
1,338.1
|
|
—
|
|
|||||||
|
Fixed income:
|
|||||||||||||||
|
Developed markets
|
1,230.7
|
|
112.2
|
|
1,118.5
|
|
—
|
|
|||||||
|
Emerging markets
|
374.7
|
|
8.7
|
|
364.2
|
|
1.8
|
|
|||||||
|
Private alternative investments:
|
|||||||||||||||
|
Hedge funds
|
3,277.6
|
|
—
|
|
1,694.5
|
|
1,583.1
|
|
|||||||
|
Equity-like funds
|
1,146.6
|
|
—
|
|
75.2
|
|
1,071.4
|
|
|||||||
|
Real estate
|
569.0
|
|
403.1
|
|
—
|
|
165.9
|
|
|||||||
|
Other
|
487.9
|
|
229.8
|
|
258.1
|
|
—
|
|
|||||||
|
Total
|
$
|
9,835.7
|
|
$
|
1,937.3
|
|
$
|
5,076.2
|
|
$
|
2,822.2
|
|
|||
|
Retiree Health Benefit Plans
|
|||||||||||||||
|
Public equity securities:
|
|||||||||||||||
|
U.S.
|
$
|
39.2
|
|
$
|
17.2
|
|
$
|
22.0
|
|
$
|
—
|
|
|||
|
International
|
158.9
|
|
58.8
|
|
100.1
|
|
—
|
|
|||||||
|
Fixed income:
|
|||||||||||||||
|
Developed markets
|
61.8
|
|
—
|
|
61.8
|
|
—
|
|
|||||||
|
Emerging markets
|
35.5
|
|
—
|
|
35.3
|
|
0.2
|
|
|||||||
|
Private alternative investments:
|
|||||||||||||||
|
Hedge funds
|
282.7
|
|
—
|
|
158.7
|
|
124.0
|
|
|||||||
|
Equity-like funds
|
92.3
|
|
—
|
|
—
|
|
92.3
|
|
|||||||
|
Cash value of trust owned insurance contract
|
1,189.2
|
|
—
|
|
1,189.2
|
|
—
|
|
|||||||
|
Real estate
|
39.0
|
|
39.0
|
|
—
|
|
—
|
|
|||||||
|
Other
|
20.1
|
|
7.6
|
|
12.5
|
|
—
|
|
|||||||
|
Total
|
$
|
1,918.7
|
|
$
|
122.6
|
|
$
|
1,579.6
|
|
$
|
216.5
|
|
|||
No material transfers between Level 1, Level 2, or Level 3 occurred during the year ended
December 31, 2014
.
82
The activity in the Level 3 investments during the year ended
December 31, 2014
was as follows:
|
Fixed Income: Developed Markets
|
Fixed Income: Emerging Markets
|
Hedge
Funds |
Equity-like
Funds |
Real
Estate |
Total
|
||||||||||||||||||
|
Defined Benefit Pension Plans
|
|||||||||||||||||||||||
|
Beginning balance at January 1, 2014
|
$
|
15.9
|
|
$
|
—
|
|
$
|
1,440.4
|
|
$
|
993.5
|
|
$
|
153.4
|
|
$
|
2,603.2
|
|
|||||
|
Actual return on plan assets, including changes in foreign exchange rates:
|
|||||||||||||||||||||||
|
Relating to assets still held at the reporting date
|
(0.4
|
)
|
0.1
|
|
44.6
|
|
108.2
|
|
0.2
|
|
152.7
|
|
|||||||||||
|
Relating to assets sold during the period
|
(0.8
|
)
|
—
|
|
—
|
|
—
|
|
—
|
|
(0.8
|
)
|
|||||||||||
|
Purchases, sales, and settlements, net
|
(3.3
|
)
|
1.7
|
|
98.1
|
|
(30.3
|
)
|
12.3
|
|
78.5
|
|
|||||||||||
|
Transfers into (out of) Level 3
|
(11.4
|
)
|
—
|
|
—
|
|
—
|
|
—
|
|
(11.4
|
)
|
|||||||||||
|
Ending balance at December 31, 2014
|
$
|
—
|
|
$
|
1.8
|
|
$
|
1,583.1
|
|
$
|
1,071.4
|
|
$
|
165.9
|
|
$
|
2,822.2
|
|
|||||
|
Retiree Health Benefit Plans
|
|||||||||||||||||||||||
|
Beginning balance at January 1, 2014
|
$
|
1.6
|
|
$
|
—
|
|
$
|
120.6
|
|
$
|
88.9
|
|
$
|
—
|
|
$
|
211.1
|
|
|||||
|
Actual return on plan assets, including changes in foreign exchange rates:
|
|||||||||||||||||||||||
|
Relating to assets still held at the reporting date
|
(0.1
|
)
|
—
|
|
1.2
|
|
6.0
|
|
—
|
|
7.1
|
|
|||||||||||
|
Relating to assets sold during the period
|
(0.1
|
)
|
—
|
|
—
|
|
—
|
|
—
|
|
(0.1
|
)
|
|||||||||||
|
Purchases, sales, and settlements, net
|
(0.3
|
)
|
0.2
|
|
2.2
|
|
(2.6
|
)
|
—
|
|
(0.5
|
)
|
|||||||||||
|
Transfers into (out of) Level 3
|
(1.1
|
)
|
—
|
|
—
|
|
—
|
|
—
|
|
(1.1
|
)
|
|||||||||||
|
Ending balance at December 31, 2014
|
$
|
—
|
|
$
|
0.2
|
|
$
|
124.0
|
|
$
|
92.3
|
|
$
|
—
|
|
$
|
216.5
|
|
|||||
83
The fair values of our defined benefit pension plan and retiree health plan assets as of
December 31, 2013
by asset category are as follows:
|
|
|
Fair Value Measurements Using
|
|||||||||||||
|
Asset Class
|
Total
|
Quoted Prices in Active Markets for Identical Assets
(Level 1)
|
Significant Observable Inputs
(Level 2)
|
Significant Unobservable Inputs
(Level 3)
|
|||||||||||
|
Defined Benefit Pension Plans
|
|||||||||||||||
|
Public equity securities:
|
|||||||||||||||
|
U.S.
|
$
|
400.3
|
|
$
|
189.2
|
|
$
|
211.1
|
|
$
|
—
|
|
|||
|
International
|
2,483.8
|
|
1,045.8
|
|
1,438.0
|
|
—
|
|
|||||||
|
Fixed income:
|
|||||||||||||||
|
Developed markets
|
1,036.1
|
|
170.2
|
|
850.0
|
|
15.9
|
|
|||||||
|
Emerging markets
|
382.6
|
|
—
|
|
382.6
|
|
—
|
|
|||||||
|
Private alternative investments:
|
|||||||||||||||
|
Hedge funds
|
2,902.3
|
|
—
|
|
1,461.9
|
|
1,440.4
|
|
|||||||
|
Equity-like funds
|
1,069.9
|
|
—
|
|
76.4
|
|
993.5
|
|
|||||||
|
Real estate
|
521.4
|
|
368.0
|
|
—
|
|
153.4
|
|
|||||||
|
Other
|
685.3
|
|
245.2
|
|
440.1
|
|
—
|
|
|||||||
|
Total
|
$
|
9,481.7
|
|
$
|
2,018.4
|
|
$
|
4,860.1
|
|
$
|
2,603.2
|
|
|||
|
Retiree Health Benefit Plans
|
|||||||||||||||
|
Public equity securities:
|
|||||||||||||||
|
U.S.
|
$
|
39.4
|
|
$
|
18.3
|
|
$
|
21.1
|
|
$
|
—
|
|
|||
|
International
|
167.2
|
|
61.6
|
|
105.6
|
|
—
|
|
|||||||
|
Fixed income:
|
|||||||||||||||
|
Developed markets
|
54.7
|
|
—
|
|
53.1
|
|
1.6
|
|
|||||||
|
Emerging markets
|
38.2
|
|
—
|
|
38.2
|
|
—
|
|
|||||||
|
Private alternative investments:
|
|||||||||||||||
|
Hedge funds
|
266.4
|
|
—
|
|
145.8
|
|
120.6
|
|
|||||||
|
Equity-like funds
|
88.9
|
|
—
|
|
—
|
|
88.9
|
|
|||||||
|
Cash value of trust owned insurance contract
|
1,136.8
|
|
—
|
|
1,136.8
|
|
—
|
|
|||||||
|
Real estate
|
36.7
|
|
36.7
|
|
—
|
|
—
|
|
|||||||
|
Other
|
51.3
|
|
18.0
|
|
33.3
|
|
—
|
|
|||||||
|
Total
|
$
|
1,879.6
|
|
$
|
134.6
|
|
$
|
1,533.9
|
|
$
|
211.1
|
|
|||
No material transfers between Level 1, Level 2, or Level 3 occurred during the year ended
December 31, 2013
.
84
The activity in the Level 3 investments during the year ended
December 31, 2013
was as follows:
|
Fixed Income: Developed Markets
|
Hedge
Funds
|
Equity-like
Funds
|
Real
Estate
|
Total
|
|||||||||||||||
|
Defined Benefit Pension Plans
|
|||||||||||||||||||
|
Beginning balance at January 1, 2013
|
$
|
3.7
|
|
$
|
1,218.1
|
|
$
|
910.5
|
|
$
|
142.6
|
|
$
|
2,274.9
|
|
||||
|
Actual return on plan assets, including changes in foreign exchange rates:
|
|||||||||||||||||||
|
Relating to assets still held at the reporting date
|
(3.0
|
)
|
123.4
|
|
155.7
|
|
8.5
|
|
284.6
|
|
|||||||||
|
Relating to assets sold during the period
|
—
|
|
—
|
|
—
|
|
—
|
|
—
|
|
|||||||||
|
Purchases, sales, and settlements, net
|
3.7
|
|
98.9
|
|
(72.7
|
)
|
2.3
|
|
32.2
|
|
|||||||||
|
Transfers into (out of) Level 3
|
11.5
|
|
—
|
|
—
|
|
—
|
|
11.5
|
|
|||||||||
|
Ending balance at December 31, 2013
|
$
|
15.9
|
|
$
|
1,440.4
|
|
$
|
993.5
|
|
$
|
153.4
|
|
$
|
2,603.2
|
|
||||
|
Retiree Health Benefit Plans
|
|||||||||||||||||||
|
Beginning balance at January 1, 2013
|
$
|
0.4
|
|
$
|
99.9
|
|
$
|
81.9
|
|
$
|
—
|
|
$
|
182.2
|
|
||||
|
Actual return on plan assets, including changes in foreign exchange rates:
|
|||||||||||||||||||
|
Relating to assets still held at the reporting date
|
(0.3
|
)
|
10.3
|
|
13.9
|
|
—
|
|
23.9
|
|
|||||||||
|
Relating to assets sold during the period
|
—
|
|
—
|
|
—
|
|
—
|
|
—
|
|
|||||||||
|
Purchases, sales, and settlements, net
|
0.4
|
|
10.4
|
|
(6.9
|
)
|
—
|
|
3.9
|
|
|||||||||
|
Transfers into (out of) Level 3
|
1.1
|
|
—
|
|
—
|
|
—
|
|
1.1
|
|
|||||||||
|
Ending balance at December 31, 2013
|
$
|
1.6
|
|
$
|
120.6
|
|
$
|
88.9
|
|
$
|
—
|
|
$
|
211.1
|
|
||||
In 2015, we expect to contribute approximately
$40 million
to our defined benefit pension plans to satisfy minimum funding requirements for the year, along with approximately
$270 million
of additional discretionary contributions.
We are a party to various legal actions and government investigations. The most significant of these are described below. It is not possible to determine the outcome of these matters, and we cannot reasonably estimate the maximum potential exposure or the range of possible loss in excess of amounts accrued for any of these matters; however, we believe that, except as noted below with respect to the Alimta
®
patent litigation and administrative proceedings, the resolution of all such matters will not have a material adverse effect on our consolidated financial position or liquidity, but could possibly be material to our consolidated results of operations in any one accounting period.
Alimta Patent Litigation and Administrative Proceedings
A number of generic manufacturers are seeking approvals in various countries to market generic forms of Alimta prior to the expiration of our vitamin dosage regimen patents, alleging that those patents are invalid, not infringed, or both. We believe our Alimta vitamin dosage patents are valid and enforceable against these generic manufacturers and we expect to prevail in these proceedings. However, it is not possible to determine the ultimate outcome of the proceedings, and accordingly, we can provide no assurance that we will prevail. An unfavorable outcome could have a material adverse impact on our future consolidated results of operations, liquidity, and financial position. We expect that a loss of exclusivity for Alimta would result in a rapid and severe decline in future revenues in the relevant market.
U.S. Patent Litigation
We are engaged in various U.S. patent litigation matters involving Alimta brought pursuant to procedures set out in the Hatch-Waxman Act. Teva Parenteral Medicines, Inc. (Teva); APP Pharmaceuticals, LLC (APP); Barr Laboratories, Inc. (Barr); Pliva Hrvatska D.O.O. (Pliva); Accord Healthcare Inc. (Accord), Apotex Inc. (Apotex), Sun Pharmaceutical Industries, Ltd. (Sun); Sun Pharma Global FZE (Sun Global); and Glenmark Generics
85
Inc., USA (Glenmark), Nang Kuang Pharmaceutical Co., Ltd. (Nang Kuang), and Sandoz Inc. (Sandoz) each submitted Abbreviated New Drug Applications (ANDAs) seeking approval to market generic versions of Alimta prior to the expiration of our vitamin dosage regimen patent (expiring in 2021 plus pediatric exclusivity expiring in 2022) and alleging the patent is invalid.
In October 2010, we filed a lawsuit in the U.S. District Court for the Southern District of Indiana against Teva, APP, Pliva, and Barr seeking rulings that the U.S. vitamin dosage regimen patent is valid and infringed (the Teva/APP litigation). Teva and APP stipulated to infringement of our vitamin dosage regimen patent, with the contingency that Teva and APP would be permitted to litigate the issue of infringement if the U.S. Supreme Court vacated an en banc decision of the Federal Circuit that dealt with the issues of liability related to infringement (
Akamai v. Limelight Networks
). Thus, the sole issue before the district court was to determine the issue of patent validity.
Trial in the Teva/APP litigation occurred in August 2013. In March 2014, the court ruled that the asserted claims of the vitamin dosage patent are valid. The defendants filed their notice of appeal in April 2014.
In June 2014, the U.S. Supreme Court vacated the
Akamai
decision. In July 2014, the court of appeals in the Teva/APP litigation entered an order remanding the case back to the district court to consider the issue of infringement. A hearing on the question of infringement has been scheduled for February 2015.
In January 2012 and April 2012, we filed similar lawsuits in the U.S. District Court for the Southern District of Indiana against Accord and Apotex, respectively. We filed a second lawsuit against Accord in February 2013. The Accord and Apotex cases have been consolidated and stayed by the court and the parties have agreed to be bound by the outcome of the Teva/APP litigation. In September 2013, we filed a similar lawsuit in the same court against Sun and Sun Global seeking a ruling that our patent is valid and infringed. This case has been stayed, and we and Sun have agreed to be bound by the outcome of the Teva/APP litigation. In January 2014, we filed a similar lawsuit in the same court against Glenmark seeking a ruling that our patent is valid and infringed. That case was amended in March 2014 to add two related Glenmark companies. This case has been stayed, and Lilly and Glenmark have agreed to be bound by the outcome of the Teva/APP litigation. In October 2014, we filed a lawsuit against Nang Kuang in the same court, seeking a ruling that our patents are valid and infringed. In December 2014, Lilly filed a lawsuit against Sandoz in the same court, seeking a ruling that our patent is valid and infringed.
European Patent Litigation and Administrative Proceedings
Generic manufacturers filed an opposition to the European Patent Office's decision to grant us a vitamin dosage regimen patent. The Opposition Division of the European Patent Office upheld the patent and the generic manufacturers lodged an appeal. In addition, in the United Kingdom (U.K.), Actavis Group ehf and other Actavis companies filed litigation asking for a declaratory judgment that commercialization of certain salt forms of pemetrexed (the active ingredient in Alimta) would not infringe the vitamin dosage regimen patents in the U.K., Italy, France, and Spain. This trial occurred in April 2014. In May 2014, the court ruled that the vitamin dosage patents for Alimta would not be infringed by the defendants' commercialization of alternative salt forms of pemetrexed, after expiration of the compound patents in December 2015. We filed a motion to appeal the court's ruling in June 2014, and a hearing is scheduled to occur in March 2015.
We commenced separate infringement proceedings against certain Actavis companies in Germany. The German case was heard by the trial court in March 2014. In April 2014, the German trial court ruled in our favor. The defendants filed their notice of appeal in May 2014, and a hearing is scheduled to occur in March 2015.
Japanese Administrative Proceedings
Sawai Pharmaceutical Company Limited, has filed a demand for invalidation of our vitamin dosage regimen patents with the Japanese Patent Office. A hearing date has been scheduled for February 2015.
Effient Patent Litigation and Administrative Proceedings
We, along with Daiichi Sankyo, Daiichi Sankyo, Inc., and Ube Industries (Ube) are engaged in various U.S. patent litigation matters involving Effient brought pursuant to procedures set out in the Hatch-Waxman Act. Accord Healthcare Inc., USA (Accord USA); Amneal Pharmaceuticals LLC (Amneal); Apotex; Aurobindo Pharma Limited (Aurobindo); Dr. Reddy’s Laboratories, Ltd. and Dr. Reddy’s Laboratories, Inc. (Dr. Reddy’s);
86
First Time US Generics LLC (FTUG); Glenmark; Hetero USA Inc. and Hetero Labs Limited Unit V (Hetero); Mylan Pharmaceuticals Inc. (Mylan); Panacea Biotec, Ltd. (Panacea); Sun Global; Teva Pharmaceuticals USA, Inc. (Teva USA); Watson Laboratories, Inc. (Watson); and Zydus Pharmaceuticals USA, Inc. (Zydus) each submitted ANDAs seeking approval to market generic versions of Effient prior to the expiration of Daiichi Sankyo’s and Ube’s patents (expiring in 2022) covering methods of using Effient with aspirin, and alleging the patents are invalid. The ANDA filed by Mylan also alleges that the compound patent for Effient (expiring in 2017) is invalid.
In March 2014, we filed a lawsuit in the U.S. District Court for the Southern District of Indiana against Accord USA, Amneal, Aurobindo, Dr. Reddy’s, Glenmark, Hetero, Mylan, Sun Global, Teva USA, Watson and Zydus, and their related companies, seeking a ruling that the patents are valid and infringed. We filed similar lawsuits in the same court against Apotex (April 2014), Panacea (June 2014), and FTUG (July 2014). In October 2014, the court consolidated the pending cases. The lawsuits against Aurobindo, Hetero, and FTUG have been stayed, and the parties have agreed to be bound by the outcome of the consolidated litigation.
We believe the Effient patents are valid and enforceable against these generic manufacturers and we expect to prevail in these proceedings. However, it is not possible to determine the outcome of the proceedings, and accordingly, we can provide no assurance that we will prevail. We expect a loss of exclusivity for Effient would result in a rapid and severe decline in future revenues for the product in the relevant market.
Actos
®
Product Liability Litigation
We are named along with Takeda Chemical Industries, Ltd., and Takeda affiliates (collectively, Takeda) as a defendant in approximately
5,275
product liability cases in the U.S. related to the diabetes medication Actos, which we co-promoted with Takeda in the U.S. from 1999 until September 2006. In general, plaintiffs in these actions allege that Actos caused or contributed to their bladder cancer. Almost all of the active cases have been consolidated in federal multi-district litigation in the Western District of Louisiana or are pending in a coordinated state court proceeding in California or a coordinated state court proceeding in Illinois. We believe these lawsuits are without merit, and we and Takeda are prepared to defend against them vigorously.
In April 2014, a jury in the Western District of Louisiana found in favor of the plaintiffs in the case of
Terrence Allen, et al. v. Takeda Pharmaceuticals, et al.,
no. 6:12-md-00064. In September 2014, judgment was entered awarding
$1.3 million
in compensatory damages to plaintiffs (allocated
75 percent
to Takeda and
25 percent
to us) and punitive damages of
$6.00 billion
against Takeda and
$3.00 billion
against us. In October 2014, the judge issued an order substantially reducing the amount of punitive damages awarded to approximately
$28 million
against Takeda and approximately
$9 million
against us. We continue to believe the evidence did not support plaintiffs’ claims and strongly disagree with the verdict. We and Takeda intend to vigorously challenge this outcome through all available legal means. We and Takeda have appealed this judgment and plaintiffs have filed a cross-appeal objecting to the reduction in punitive damages.
Our agreement with Takeda calls for Takeda to defend and indemnify us against our losses and expenses with respect to the U.S. product liability litigation and other related expenses in accordance with the terms of the agreement. After the jury reached its verdict in
Allen
, Takeda notified us that it was reserving its right to challenge its obligations to defend and indemnify us with respect to the
Allen
case. We believe we are entitled to full indemnification of our losses and expenses in
Allen
and all other U.S. cases
;
however, there can be no guarantee we will ultimately be successful in obtaining full indemnification.
We are also named along with Takeda as a defendant in
three
purported product liability class actions in Canada related to Actos, including
one
in Ontario (
Casseres et al. v. Takeda Pharmaceutical North America, Inc., et al
.),
one
in Quebec (
Whyte et al. v. Eli Lilly et al.
), and
one
in Alberta (
Epp v. Takeda Canada et al.
). We promoted Actos in Canada until 2009. We believe these claims are without merit and are prepared to defend against them vigorously.
Byetta Product Liability Litigation
We are named as a defendant in approximately
415
Byetta product liability lawsuits involving approximately
920
plaintiffs. Approximately
95
of these lawsuits, covering about
540
plaintiffs, are filed in California state court and coordinated in a Los Angeles Superior Court. Approximately
310
lawsuits, covering about
350
plaintiffs, are filed in federal court, the majority of which are coordinated in a multi-district litigation in the
87
Southern District of California. The remaining approximately
10
lawsuits, representing about
30
plaintiffs, are in various state courts. Approximately
350
of the lawsuits, involving approximately
540
plaintiffs, contain allegations that Byetta caused or contributed to the plaintiffs' cancer (primarily pancreatic cancer or thyroid cancer). We are aware of approximately
395
additional claimants who have not yet filed suit. The majority of these additional claims allege damages for pancreatitis. We believe these lawsuits and claims are without merit and are prepared to defend against them vigorously.
Prozac
®
Product Liability Litigation
We are named as a defendant in approximately
10
U.S. lawsuits primarily related to allegations that the antidepressant Prozac caused or contributed to birth defects in the children of women who ingested the drug during pregnancy. We are aware of approximately
470
additional claims related to birth defects, which have not yet been filed. We believe these lawsuits and claims are without merit and are prepared to defend against them vigorously.
Brazil–Employee Litigation
Our subsidiary in Brazil, Eli Lilly do Brasil (Lilly Brasil), is named in a lawsuit brought by the Labor Attorney for 15th Region in the Labor Court of Paulinia, State of Sao Paulo, Brazil, alleging possible harm to employees and former employees caused by exposure to heavy metals at a former Lilly manufacturing facility in Cosmopolis, Brazil, operated by the company between 1977 and 2003. The plaintiffs allege that some employees at the facility were exposed to benzene and heavy metals; however, Lilly Brasil maintains that these alleged contaminants were never used in the facility. In May 2014, the labor court judge ruled against Lilly Brasil. The judge's ruling orders Lilly Brasil to undertake several actions of unspecified financial impact, including paying lifetime medical insurance for the employees and contractors who worked at the Cosmopolis facility more than six months during the affected years and their children born during and after this period. While we cannot currently estimate the range of reasonably possible financial losses that could arise in the event we do not ultimately prevail in the litigation, the judge has estimated the total financial impact of the ruling to be approximately
1.0 billion
Brazilian real (approximately
$375 million
as of
December 31, 2014
) plus interest. We strongly disagree with the decision and filed an appeal in May 2014. We are also named in approximately
30
lawsuits filed in the same court by individual former employees making similar claims. We believe these lawsuits are without merit and are prepared to defend against them vigorously.
Product Liability Insurance
Because of the nature of pharmaceutical products, it is possible that we could become subject to large numbers of product liability and related claims in the future. Due to a very restrictive market for product liability insurance, we are self-insured for product liability losses for all our currently marketed products.
88
The following table summarizes the activity related to each component of other comprehensive income (loss):
|
(Amounts presented net of taxes)
|
Foreign Currency Translation Gains (Losses)
|
Unrealized Net Gains (Losses) on Securities
|
Defined Benefit Pension and Retiree Health Benefit Plans
|
Effective Portion of Cash Flow Hedges
|
Accumulated Other Comprehensive Loss
|
||||||||||||||
|
Beginning balance at January 1, 2012
|
$
|
265.9
|
|
$
|
14.8
|
|
$
|
(4,032.2
|
)
|
$
|
(107.1
|
)
|
$
|
(3,858.6
|
)
|
||||
|
Unrealized gain (loss)
|
104.1
|
|
—
|
|
|||||||||||||||
|
Net amount reclassed to net income
|
(46.4
|
)
|
5.9
|
|
|||||||||||||||
|
Net other comprehensive income (loss)
|
160.9
|
|
57.7
|
|
(163.0
|
)
|
5.9
|
|
61.5
|
|
|||||||||
|
Balance at December 31, 2012
|
426.8
|
|
72.5
|
|
(4,195.2
|
)
|
(101.2
|
)
|
(3,797.1
|
)
|
|||||||||
|
Other comprehensive income (loss) before reclassifications
|
36.2
|
|
138.9
|
|
1,387.1
|
|
(86.5
|
)
|
1,475.7
|
|
|||||||||
|
Net amount reclassified from accumulated other comprehensive loss
|
—
|
|
(6.2
|
)
|
319.0
|
|
5.9
|
|
318.7
|
|
|||||||||
|
Net other comprehensive income (loss)
|
36.2
|
|
132.7
|
|
1,706.1
|
|
(80.6
|
)
|
1,794.4
|
|
|||||||||
|
Balance at December 31, 2013
|
463.0
|
|
205.2
|
|
(2,489.1
|
)
|
(181.8
|
)
|
(2,002.7
|
)
|
|||||||||
|
Other comprehensive income (loss) before reclassifications
|
(961.4
|
)
|
105.2
|
|
(1,098.5
|
)
|
(15.2
|
)
|
(1,969.9
|
)
|
|||||||||
|
Net amount reclassified from accumulated other comprehensive loss
|
—
|
|
(210.7
|
)
|
185.6
|
|
5.9
|
|
(19.2
|
)
|
|||||||||
|
Net other comprehensive income (loss)
|
(961.4
|
)
|
(105.5
|
)
|
(912.9
|
)
|
(9.3
|
)
|
(1,989.1
|
)
|
|||||||||
|
Ending Balance at December 31, 2014
|
$
|
(498.4
|
)
|
$
|
99.7
|
|
$
|
(3,402.0
|
)
|
$
|
(191.1
|
)
|
$
|
(3,991.8
|
)
|
||||
The tax effects on the net activity related to each component of other comprehensive income (loss) for the years ended December 31, were as follows:
|
Tax (expense) benefit
|
2014
|
2013
|
2012
|
||||||||
|
Unrealized net gains (losses) on securities
|
$
|
56.7
|
|
$
|
(71.6
|
)
|
$
|
(30.8
|
)
|
||
|
Defined benefit pension and retiree health benefit plans
|
414.7
|
|
(886.1
|
)
|
(34.4
|
)
|
|||||
|
Effective portion of cash flow hedges
|
5.2
|
|
43.2
|
|
(2.8
|
)
|
|||||
|
Provision for income taxes related to other comprehensive income (loss) items
|
$
|
476.6
|
|
$
|
(914.5
|
)
|
$
|
(68.0
|
)
|
||
Income taxes were not provided for foreign currency translation. Generally, the assets and liabilities of foreign operations are translated into U.S. dollars using the current exchange rate. For those operations, changes in exchange rates generally do not affect cash flows; therefore, resulting translation adjustments are made in shareholders' equity rather than in income.
89
|
Reclassifications Out of Accumulated Other Comprehensive Loss
|
||||||||
|
Details about Accumulated Other
Comprehensive Loss Components
|
Year Ended December 31,
|
Affected Line Item in the Consolidated Statements of Operations
|
||||||
|
2014
|
2013
|
|||||||
|
Amortization of defined benefit items:
|
||||||||
|
Prior service benefits, net
|
$
|
(34.0
|
)
|
$
|
(31.9
|
)
|
(1)
|
|
|
Actuarial losses
|
303.0
|
|
515.2
|
|
(1)
|
|||
|
Total before tax
|
269.0
|
|
483.3
|
|
||||
|
Tax benefit
|
(83.4
|
)
|
(164.3
|
)
|
Income taxes
|
|||
|
Net of tax
|
185.6
|
|
319.0
|
|
||||
|
Unrealized gains/losses on available-for-sale securities:
|
||||||||
|
Realized gains, net
|
(324.1
|
)
|
(12.0
|
)
|
Other—net, (income) expense
|
|||
|
Impairment losses
|
—
|
|
2.4
|
|
Other—net, (income) expense
|
|||
|
Total before tax
|
(324.1
|
)
|
(9.6
|
)
|
||||
|
Tax expense
|
113.4
|
|
3.4
|
|
Income taxes
|
|||
|
Net of tax
|
(210.7
|
)
|
(6.2
|
)
|
||||
|
Other, net of tax
|
5.9
|
|
5.9
|
|
Other—net, (income) expense
|
|||
|
Total reclassifications for the period (net of tax)
|
$
|
(19.2
|
)
|
$
|
318.7
|
|
||
|
1
|
These accumulated other comprehensive loss components are included in the computation of net periodic pension cost (see Note 14).
|
Other–net, (income) expense consisted of the following:
|
2014
|
2013
|
2012
|
|||||||||
|
Income related to termination of the exenatide collaboration with Amylin (Note 4)
|
$
|
—
|
|
$
|
(495.4
|
)
|
$
|
(787.8
|
)
|
||
|
Interest expense
|
148.8
|
|
160.1
|
|
177.8
|
|
|||||
|
Interest income
|
(121.0
|
)
|
(119.7
|
)
|
(105.0
|
)
|
|||||
|
Other (income) expense
|
(368.3
|
)
|
(63.9
|
)
|
41.0
|
|
|||||
|
Other–net, (income) expense
|
$
|
(340.5
|
)
|
$
|
(518.9
|
)
|
$
|
(674.0
|
)
|
||
For the year ended
December 31, 2014
, other–net, (income) expense is primarily related to net gains on investments (Note 7) and income related to the transfer to Boehringer Ingelheim of our license rights to co-promote linagliptin and empagliflozin in certain countries (Note 4). For the years ended December 31, 2013 and 2012, other–net, (income) expense primarily consists of income related to the termination of the exenatide collaboration with Amylin, including income recognized from the transfer to Amylin of exenatide commercial rights in all markets outside the U.S. in 2013 and income recognized from the early payment of the exenatide revenue-sharing obligation by Amylin in 2012 (Note 4).
90
We operate in two business segments—human pharmaceutical products and animal health. Our business segments are distinguished by the ultimate end user of the product—humans or animals. Performance is evaluated based on profit or loss from operations before income taxes. The accounting policies of the individual segments are the same as those described in the summary of significant accounting policies in Note 1 to the consolidated financial statements.
Our human pharmaceutical products segment includes the discovery, development, manufacturing, marketing, and sales of human pharmaceutical products worldwide in the following therapeutic areas: endocrinology, neuroscience, oncology, cardiovascular, and other. We lost U.S. patent exclusivity for Cymbalta
®
in December 2013 and Evista
®
in March 2014, which resulted in the immediate entry of generic competitors and a rapid and severe decline in revenue.
Our animal health segment, operating through our Elanco animal health division, includes the development, manufacturing, marketing, and sales of animal health products worldwide for both food and companion animals. Animal health products include Rumensin
®
, Posilac
®
, Tylan
®
, Optaflexx
®
, Maxiban
®
and other products for livestock and poultry, as well as Trifexis
®
, Comfortis
®
, and other products for companion animals.
Most of our pharmaceutical products are distributed through wholesalers that serve pharmacies, physicians and other health care professionals, and hospitals. For the years ended
December 31, 2014
,
2013
, and
2012
, our three largest wholesalers each accounted for between
8 percent
and
19 percent
of consolidated total revenue. Further, they each accounted for between
9 percent
and
18 percent
of accounts receivable as of
December 31, 2014
and
2013
. Animal health products are sold primarily to wholesale distributors.
We manage our assets on a total company basis, not by operating segment, as the assets of the animal health business are intermixed with those of the pharmaceutical products business. Therefore, our chief operating decision maker does not review any asset information by operating segment and, accordingly, we do not report asset information by operating segment.
We are exposed to the risk of changes in social, political, and economic conditions inherent in foreign operations, and our results of operations and the value of our foreign assets are affected by fluctuations in foreign currency exchange rates.
The following table summarizes our revenue activity for the years ended
December 31, 2014
,
2013
, and
2012
:
|
2014
|
2013
|
2012
|
||||||||||||
|
Segment revenue—to unaffiliated customers:
|
||||||||||||||
|
Human pharmaceutical products:
|
||||||||||||||
|
Endocrinology:
|
||||||||||||||
|
Humalog
®
|
$
|
2,785.2
|
|
$
|
2,611.2
|
|
$
|
2,395.5
|
|
|||||
|
Humulin
®
|
1,400.1
|
|
1,315.8
|
|
1,239.1
|
|
||||||||
|
Forteo
®
|
1,322.0
|
|
1,244.9
|
|
1,151.0
|
|
||||||||
|
Evista
|
419.8
|
|
1,050.4
|
|
1,010.1
|
|
||||||||
|
Trajenta
|
328.8
|
|
249.2
|
|
88.6
|
|
||||||||
|
Other Endocrinology
|
683.1
|
|
832.9
|
|
926.6
|
|
||||||||
|
Total Endocrinology
|
6,939.0
|
|
7,304.4
|
|
6,810.9
|
|
||||||||
|
Neuroscience:
|
||||||||||||||
|
Cymbalta
|
1,614.7
|
|
5,084.4
|
|
4,994.1
|
|
||||||||
|
Zyprexa
®
|
1,037.3
|
|
1,194.8
|
|
1,701.4
|
|
||||||||
|
Strattera
®
|
738.5
|
|
709.2
|
|
621.4
|
|
||||||||
|
Other Neuroscience
|
206.0
|
|
227.8
|
|
258.2
|
|
||||||||
|
Total Neuroscience
|
3,596.5
|
|
7,216.2
|
|
7,575.1
|
|
||||||||
91
|
2014
|
2013
|
2012
|
||||||||||||
|
Oncology:
|
||||||||||||||
|
Alimta
|
2,792.0
|
|
2,703.0
|
|
2,594.3
|
|
||||||||
|
Erbitux
|
373.3
|
|
373.7
|
|
397.0
|
|
||||||||
|
Other Oncology
|
227.7
|
|
191.8
|
|
290.3
|
|
||||||||
|
Total Oncology
|
3,393.0
|
|
3,268.5
|
|
3,281.6
|
|
||||||||
|
Cardiovascular:
|
||||||||||||||
|
Cialis
®
|
2,291.0
|
|
2,159.4
|
|
1,926.8
|
|
||||||||
|
Effient
|
522.2
|
|
508.7
|
|
457.2
|
|
||||||||
|
Other Cardiovascular
|
240.3
|
|
255.1
|
|
248.5
|
|
||||||||
|
Total Cardiovascular
|
3,053.5
|
|
2,923.2
|
|
2,632.5
|
|
||||||||
|
Other pharmaceuticals
|
287.0
|
|
249.3
|
|
266.8
|
|
||||||||
|
Total human pharmaceutical products
|
17,269.0
|
|
20,961.6
|
|
20,566.9
|
|
||||||||
|
Animal health
|
2,346.6
|
|
2,151.5
|
|
2,036.5
|
|
||||||||
|
Total segment revenue
|
$
|
19,615.6
|
|
$
|
23,113.1
|
|
$
|
22,603.4
|
|
|||||
|
Segment profits
(1)
:
|
||||||||||||||
|
Human pharmaceutical products
|
$
|
3,132.0
|
|
$
|
5,015.0
|
|
$
|
4,393.4
|
|
|||||
|
Animal health
|
564.2
|
|
556.6
|
|
508.1
|
|
||||||||
|
Total segment profits
|
$
|
3,696.2
|
|
$
|
5,571.6
|
|
$
|
4,901.5
|
|
|||||
|
Reconciliation of total segment profits to consolidated income before taxes:
|
||||||||||||||
|
Segment profits
|
$
|
3,696.2
|
|
$
|
5,571.6
|
|
$
|
4,901.5
|
|
|||||
|
Other profits (losses):
|
||||||||||||||
|
Income related to termination of the exenatide collaboration with Amylin Pharmaceuticals, Inc. (Note 4)
|
—
|
|
495.4
|
|
787.8
|
|
||||||||
|
Income related to transfer of linagliptin and empagliflozin rights in certain countries to Boehringer Ingelheim (Note 4)
|
92.0
|
|
—
|
|
—
|
|
||||||||
|
Acquired in-process research and development (Notes 3 and 4)
|
(200.2
|
)
|
(57.1
|
)
|
—
|
|
||||||||
|
Asset impairment, restructuring, and other special charges (Note 5)
|
(468.7
|
)
|
(120.6
|
)
|
(281.1
|
)
|
||||||||
|
U.S. Branded Prescription Drug Fee
|
(119.0
|
)
|
—
|
|
—
|
|
||||||||
|
Total consolidated income before taxes
|
$
|
3,000.3
|
|
$
|
5,889.3
|
|
$
|
5,408.2
|
|
|||||
|
1
|
Human pharmaceutical products segment profit includes total depreciation and amortization expense of
$1.27 billion
,
$1.35 billion
, and
$1.37 billion
for the years ended
December 31, 2014
,
2013
, and
2012
, respectively. Animal health segment profit includes total depreciation and amortization expense of
$111.5 million
,
$99.4 million
, and
$91.1 million
for the years ended
December 31, 2014
,
2013
, and
2012
, respectively.
|
For internal management reporting presented to the chief operating decision maker, certain costs are fully allocated to our human pharmaceutical products segment and therefore are not reflected in the animal health segment's profit. Such items include costs associated with treasury-related financing, global administrative services, certain acquisition-related transaction costs, and certain manufacturing costs.
92
|
2014
|
2013
|
2012
|
||||||||||||
|
Geographic Information
|
||||||||||||||
|
Revenue—to unaffiliated customers
(1)
:
|
||||||||||||||
|
United States
|
$
|
9,134.1
|
|
$
|
12,889.7
|
|
$
|
12,313.1
|
|
|||||
|
Europe
|
4,506.7
|
|
4,338.4
|
|
4,259.7
|
|
||||||||
|
Japan
|
2,027.1
|
|
2,063.8
|
|
2,246.2
|
|
||||||||
|
Other foreign countries
|
3,947.7
|
|
3,821.2
|
|
3,784.4
|
|
||||||||
|
Revenue
|
$
|
19,615.6
|
|
$
|
23,113.1
|
|
$
|
22,603.4
|
|
|||||
|
Long-lived assets
(2)
:
|
||||||||||||||
|
United States
|
$
|
4,566.2
|
|
$
|
4,649.6
|
|
$
|
5,064.7
|
|
|||||
|
Europe
|
2,401.5
|
|
2,469.7
|
|
2,281.1
|
|
||||||||
|
Japan
|
80.4
|
|
81.1
|
|
101.5
|
|
||||||||
|
Other foreign countries
|
1,499.1
|
|
1,540.9
|
|
1,543.2
|
|
||||||||
|
Long-lived assets
|
$
|
8,547.2
|
|
$
|
8,741.3
|
|
$
|
8,990.5
|
|
|||||
|
1
|
Revenue is attributed to the countries based on the location of the customer.
|
|
2
|
Long-lived assets consist of property and equipment and certain sundry assets.
|
93
|
2014
|
Fourth
|
Third
|
Second
|
First
|
||||||||||||
|
Revenue
|
$
|
5,121.3
|
|
$
|
4,875.6
|
|
$
|
4,935.6
|
|
$
|
4,683.1
|
|
||||
|
Cost of sales
|
1,253.1
|
|
1,267.0
|
|
1,189.7
|
|
1,222.7
|
|
||||||||
|
Operating expenses
(1)
|
2,985.6
|
|
2,915.3
|
|
2,859.3
|
|
2,594.2
|
|
||||||||
|
Acquired IPR&D
|
105.2
|
|
95.0
|
|
—
|
|
—
|
|
||||||||
|
Asset impairment, restructuring, and other special charges
|
401.0
|
|
36.3
|
|
—
|
|
31.4
|
|
||||||||
|
Other—net, (income) expense
|
(137.2
|
)
|
(93.5
|
)
|
(53.8
|
)
|
(56.0
|
)
|
||||||||
|
Income before income taxes
|
513.6
|
|
655.5
|
|
940.4
|
|
890.8
|
|
||||||||
|
Net income
|
428.5
|
|
500.6
|
|
733.5
|
|
727.9
|
|
||||||||
|
Earnings per share—basic
|
0.40
|
|
0.47
|
|
0.68
|
|
0.68
|
|
||||||||
|
Earnings per share—diluted
|
0.40
|
|
0.47
|
|
0.68
|
|
0.68
|
|
||||||||
|
Dividends paid per share
|
0.49
|
|
0.49
|
|
0.49
|
|
0.49
|
|
||||||||
|
Common stock closing prices:
|
||||||||||||||||
|
High
|
72.83
|
|
66.59
|
|
63.10
|
|
59.85
|
|
||||||||
|
Low
|
61.90
|
|
60.35
|
|
58.21
|
|
50.73
|
|
||||||||
|
2013
|
Fourth
|
Third
|
Second
|
First
|
||||||||||||
|
Revenue
|
$
|
5,808.8
|
|
$
|
5,772.6
|
|
$
|
5,929.7
|
|
$
|
5,602.0
|
|
||||
|
Cost of sales
|
1,386.5
|
|
1,198.1
|
|
1,165.2
|
|
1,158.3
|
|
||||||||
|
Operating expenses
(1)
|
3,429.0
|
|
3,029.8
|
|
3,198.0
|
|
3,000.1
|
|
||||||||
|
Acquired IPR&D
|
57.1
|
|
—
|
|
—
|
|
—
|
|
||||||||
|
Asset impairment, restructuring, and other special charges
|
35.4
|
|
—
|
|
63.5
|
|
21.7
|
|
||||||||
|
Other—net, (income) expense
|
(9.1
|
)
|
31.3
|
|
(11.9
|
)
|
(529.2
|
)
|
||||||||
|
Income before income taxes
|
909.9
|
|
1,513.4
|
|
1,514.9
|
|
1,951.1
|
|
||||||||
|
Net income
|
727.5
|
|
1,203.1
|
|
1,206.2
|
|
1,548.0
|
|
||||||||
|
Earnings per share—basic
|
0.68
|
|
1.11
|
|
1.12
|
|
1.42
|
|
||||||||
|
Earnings per share—diluted
|
0.67
|
|
1.11
|
|
1.11
|
|
1.42
|
|
||||||||
|
Dividends paid per share
|
0.49
|
|
0.49
|
|
0.49
|
|
0.49
|
|
||||||||
|
Common stock closing prices:
|
||||||||||||||||
|
High
|
51.34
|
|
54.96
|
|
58.33
|
|
56.79
|
|
||||||||
|
Low
|
47.65
|
|
49.92
|
|
49.06
|
|
49.51
|
|
||||||||
1
Includes research and development, marketing, selling, and administrative expenses
Our common stock is listed on the New York Stock Exchange (NYSE), NYSE Euronext, and SIX Swiss Exchange.
94
Management’s Reports
Management’s Report for Financial Statements—Eli Lilly and Company and Subsidiaries
Management of Eli Lilly and Company and subsidiaries is responsible for the accuracy, integrity, and fair presentation of the financial statements. The statements have been prepared in accordance with generally accepted accounting principles in the United States and include amounts based on judgments and estimates by management. In management’s opinion, the consolidated financial statements present fairly our financial position, results of operations, and cash flows.
In addition to the system of internal accounting controls, we maintain a code of conduct (known as "
The Red Book"
) that applies to all employees worldwide, requiring proper overall business conduct, avoidance of conflicts of interest, compliance with laws, and confidentiality of proprietary information. All employees must take training annually on
The Red Book
and are required to report suspected violations. A hotline number is published in
The Red Book
to enable employees to report suspected violations anonymously. Employees who report suspected violations are protected from discrimination or retaliation by the company. In addition to
The Red Book
, the CEO and all financial management must sign a financial code of ethics, which further reinforces their fiduciary responsibilities.
The consolidated financial statements have been audited by Ernst & Young LLP, an independent registered public accounting firm. Their responsibility is to examine our consolidated financial statements in accordance with generally accepted auditing standards of the Public Company Accounting Oversight Board (United States). Ernst & Young’s opinion with respect to the fairness of the presentation of the statements is included in Item 8 of our annual report on Form 10-K. Ernst & Young reports directly to the audit committee of the board of directors.
Our audit committee includes five nonemployee members of the board of directors, all of whom are independent from our company. The committee charter, which is available on our website, outlines the members’ roles and responsibilities and is consistent with enacted corporate reform laws and regulations. It is the audit committee’s responsibility to appoint an independent registered public accounting firm subject to shareholder ratification, approve both audit and non-audit services performed by the independent registered public accounting firm, and review the reports submitted by the firm. The audit committee meets several times during the year with management, the internal auditors, and the independent public accounting firm to discuss audit activities, internal controls, and financial reporting matters, including reviews of our externally published financial results. The internal auditors and the independent registered public accounting firm have full and free access to the committee.
We are dedicated to ensuring that we maintain the high standards of financial accounting and reporting that we have established. We are committed to providing financial information that is transparent, timely, complete, relevant, and accurate. Our culture demands integrity and an unyielding commitment to strong internal practices and policies. Finally, we have the highest confidence in our financial reporting, our underlying system of internal controls, and our people, who are objective in their responsibilities and operate under a code of conduct and the highest level of ethical standards.
Management’s Report on Internal Control Over Financial Reporting—Eli Lilly and Company and Subsidiaries
Management of Eli Lilly and Company and subsidiaries is responsible for establishing and maintaining adequate internal control over financial reporting as defined in Rules 13a-15(f) and 15d-15(f) under the Securities Exchange Act of 1934. We have global financial policies that govern critical areas, including internal controls, financial accounting and reporting, fiduciary accountability, and safeguarding of corporate assets. Our internal accounting control systems are designed to provide reasonable assurance that assets are safeguarded, that transactions are executed in accordance with management’s authorization and are properly recorded, and that accounting records are adequate for preparation of financial statements and other financial information. A staff of internal auditors regularly monitors, on a worldwide basis, the adequacy and effectiveness of internal accounting controls. The general auditor reports directly to the audit committee of the board of directors.
95
We conducted an evaluation of the effectiveness of our internal control over financial reporting based on the framework in "2013
Internal Control—Integrated Framework"
issued by the Committee of Sponsoring Organizations of the Treadway Commission. Based on our evaluation under this framework, we concluded that our internal control over financial reporting was effective as of
December 31, 2014
. However, because of its inherent limitations, internal control over financial reporting may not prevent or detect misstatements. Also, projections of any evaluation of effectiveness to future periods are subject to the risk that controls may become inadequate because of changes in conditions, or that the degree of compliance with the policies or procedures may deteriorate.
The internal control over financial reporting has been assessed by Ernst & Young LLP as of
December 31, 2014
. Their responsibility is to evaluate whether internal control over financial reporting was designed and operating effectively.
|
John C. Lechleiter, Ph.D.
|
|
Derica W. Rice
|
|
Chairman, President, and Chief Executive Officer
|
|
Executive Vice President, Global Services and Chief Financial Officer
|
February 19, 2015
96
Report of Independent Registered Public Accounting Firm
The Board of Directors and Shareholders of Eli Lilly and Company
We have audited the accompanying consolidated balance sheets of Eli Lilly and Company and subsidiaries as of December 31, 2014 and 2013, and the related consolidated statements of operations, comprehensive income, shareholders’ equity, and cash flows for each of the three years in the period ended December 31, 2014. These financial statements are the responsibility of the Company's management. Our responsibility is to express an opinion on these financial statements based on our audits.
We conducted our audits in accordance with the standards of the Public Company Accounting Oversight Board (United States). Those standards require that we plan and perform the audit to obtain reasonable assurance about whether the financial statements are free of material misstatement. An audit includes examining, on a test basis, evidence supporting the amounts and disclosures in the financial statements. An audit also includes assessing the accounting principles used and significant estimates made by management, as well as evaluating the overall financial statement presentation. We believe that our audits provide a reasonable basis for our opinion.
In our opinion, the financial statements referred to above present fairly, in all material respects, the consolidated financial position of Eli Lilly and Company and subsidiaries at December 31, 2014 and 2013, and the consolidated results of their operations and their cash flows for each of the three years in the period ended December 31, 2014, in conformity with U.S. generally accepted accounting principles.
We also have audited, in accordance with the standards of the Public Company Accounting Oversight Board (United States), Eli Lilly and Company and subsidiaries' internal control over financial reporting as of December 31, 2014, based on criteria established in Internal Control-Integrated Framework issued by the Committee of Sponsoring Organizations of the Treadway Commission (2013 framework), and our report dated February 19, 2015, expressed an unqualified opinion thereon.

|
|
Indianapolis, Indiana
February 19, 2015
97
Report of Independent Registered Public Accounting Firm
The Board of Directors and Shareholders of Eli Lilly and Company
We have audited Eli Lilly and Company and subsidiaries’ internal control over financial reporting as of December 31, 2014, based on criteria established in Internal Control-Integrated Framework issued by the Committee of Sponsoring Organizations of the Treadway Commission (2013 framework) (the COSO criteria). Eli Lilly and Company and subsidiaries’ management is responsible for maintaining effective internal control over financial reporting, and for its assessment of the effectiveness of internal control over financial reporting included in the accompanying Management’s Report on Internal Control Over Financial Reporting. Our responsibility is to express an opinion on the company’s internal control over financial reporting based on our audit.
We conducted our audit in accordance with the standards of the Public Company Accounting Oversight Board (United States). Those standards require that we plan and perform the audit to obtain reasonable assurance about whether effective internal control over financial reporting was maintained in all material respects. Our audit included obtaining an understanding of internal control over financial reporting, assessing the risk that a material weakness exists, testing and evaluating the design and operating effectiveness of internal control based on the assessed risk, and performing such other procedures as we considered necessary in the circumstances. We believe that our audit provides a reasonable basis for our opinion.
A company’s internal control over financial reporting is a process designed to provide reasonable assurance regarding the reliability of financial reporting and the preparation of financial statements for external purposes in accordance with generally accepted accounting principles. A company’s internal control over financial reporting includes those policies and procedures that (1) pertain to the maintenance of records that, in reasonable detail, accurately and fairly reflect the transactions and dispositions of the assets of the company; (2) provide reasonable assurance that transactions are recorded as necessary to permit preparation of financial statements in accordance with generally accepted accounting principles, and that receipts and expenditures of the company are being made only in accordance with authorizations of management and directors of the company; and (3) provide reasonable assurance regarding prevention or timely detection of unauthorized acquisition, use, or disposition of the company’s assets that could have a material effect on the financial statements.
Because of its inherent limitations, internal control over financial reporting may not prevent or detect misstatements. Also, projections of any evaluation of effectiveness to future periods are subject to the risk that controls may become inadequate because of changes in conditions, or that the degree of compliance with the policies or procedures may deteriorate.
In our opinion, Eli Lilly and Company and subsidiaries maintained, in all material respects, effective internal control over financial reporting as of December 31, 2014, based on the COSO criteria.
We also have audited, in accordance with the standards of the Public Company Accounting Oversight Board (United States), the 2014 consolidated financial statements of Eli Lilly and Company and subsidiaries and our report dated February 19, 2015 expressed an unqualified opinion thereon.
|
|
|
Indianapolis, Indiana
February 19, 2015
98
|
Item 9.
|
Changes in and Disagreements with Accountants on Accounting and Financial Disclosure
|
None.
|
Item 9A.
|
Controls and Procedures
|
Disclosure Controls and Procedures
Under applicable SEC regulations, management of a reporting company, with the participation of the principal executive officer and principal financial officer, must periodically evaluate the company’s “disclosure controls and procedures,” which are defined generally as controls and other procedures designed to ensure that information required to be disclosed by the reporting company in its periodic reports filed with the SEC (such as this Form 10-K) is recorded, processed, summarized, and reported on a timely basis.
Our management, with the participation of John C. Lechleiter, Ph.D., chairman, president, and chief executive officer, and Derica W. Rice, executive vice president, global services and chief financial officer, evaluated our disclosure controls and procedures as of
December 31, 2014
, and concluded that they are effective.
Internal Control over Financial Reporting
Dr. Lechleiter and Mr. Rice provided a report on behalf of management on our internal control over financial reporting, in which management concluded that the company’s internal control over financial reporting is effective at
December 31, 2014
. In addition, Ernst & Young LLP, the company’s independent registered public accounting firm, provided an attestation report on the company’s internal control over financial reporting as of
December 31, 2014
. You can find the full text of management’s report and Ernst & Young’s attestation report in Item 8, and both reports are incorporated by reference in this Item.
Changes in Internal Controls
During the fourth quarter of
2014
, there were no changes in our internal control over financial reporting that materially affected, or are reasonably likely to materially affect, our internal control over financial reporting.
|
Item 9B.
|
Other Information
|
Not applicable.
99
|
Item 10.
|
Directors, Executive Officers, and Corporate Governance
|
Directors and Executive Officers
Information relating to our Board of Directors is found in our Proxy Statement to be dated on or about March 23, 2015 (the Proxy Statement) under “Board of Directors” and is incorporated in this report by reference.
Information relating to our executive officers is found at Item 1, "Business—Executive Officers of the Company.”
Code of Ethics
We have adopted a code of ethics that complies with the applicable SEC and New York Stock Exchange requirements. The code is set forth in:
|
•
|
The Red Book,
a comprehensive code of ethical and legal business conduct applicable to all employees worldwide and to our Board of Directors; and
|
|
•
|
Code of Ethical Conduct for Lilly Financial Management
, a supplemental code for our chief executive officer and all members of financial management that focuses on accounting, financial reporting, internal controls, and financial stewardship.
|
Both documents are online on our website at
http://www.lilly.com/about/business-practices/ethics-compliance/Pages/ethics-compliance.aspx
. In the event of any amendments to, or waivers from, a provision of the code affecting the chief executive officer, chief financial officer, chief accounting officer, controller, or persons performing similar functions, we intend to post on the above website within four business days after the event a description of the amendment or waiver as required under applicable SEC rules. We will maintain that information on our website for at least 12 months. Paper copies of these documents are available free of charge upon request to the company’s secretary at the address on the front of this Form 10-K.
Corporate Governance
In our proxy statements, we describe the procedures by which shareholders can recommend nominees to our board of directors. There have been no changes in those procedures since they were last published in our proxy statement of March 24, 2014.
The board has appointed an audit committee consisting entirely of independent directors in accordance with applicable SEC and New York Stock Exchange rules for audit committees. The members of the committee are Michael L. Eskew (chair), Katherine Baicker, Douglas R. Oberhelman, Kathi P. Seifert, and Jackson P. Tai. The board has determined that Messrs. Eskew, Oberhelman, and Tai are audit committee financial experts as defined in the SEC rules.
|
Item 11.
|
Executive Compensation
|
Information on director compensation, executive compensation, and compensation committee matters can be found in the Proxy Statement under “Director Compensation,” "Committees of the Board of Directors -- Compensation Committee," "Compensation Discussion and Analysis," and “Executive Compensation.” That information is incorporated in this report by reference.
100
|
Item 12.
|
Security Ownership of Certain Beneficial Owners and Management and Related Stockholder Matters
|
Security Ownership of Certain Beneficial Owners and Management
Information relating to ownership of the company’s common stock by management and by persons known by the company to be the beneficial owners of more than five percent of the outstanding shares of common stock is found in the Proxy Statement under “Ownership of Company Stock.” That information is incorporated in this report by reference.
Securities Authorized for Issuance Under Equity Compensation Plans
The following table presents information as of
December 31, 2014
, regarding our compensation plans under which shares of Lilly common stock have been authorized for issuance.
|
Plan category
|
(a) Number of securities to be issued upon exercise of outstanding options, warrants, and rights
|
(b) Weighted-average exercise price of outstanding options, warrants, and rights
|
(c) Number of securities remaining available for future issuance under equity compensation plans (excluding securities reflected in column (a))
|
||||
|
Equity compensation plans approved by security holders
|
2,317,010
|
|
$
|
56.26
|
|
101,455,298
|
|
|
Equity compensation plan not approved by security holders
|
—
|
|
—
|
|
—
|
|
|
|
Total
|
2,317,010
|
|
$
|
56.26
|
|
101,455,298
|
|
|
Item 13.
|
Certain Relationships and Related Transactions, and Director Independence
|
Related Person Transactions
Information relating to three related person transactions and the board’s policies and procedures for approval of related person transactions can be found in the Proxy Statement under “Highlights of the Company’s Corporate Governance—Conflicts of Interest and Transactions with Related Persons.” That information is incorporated in this report by reference.
Director Independence
Information relating to director independence can be found in the Proxy Statement under “Director Independence” and is incorporated in this report by reference.
|
Item 14.
|
Principal Accountant Fees and Services
|
Information related to the fees and services of our principal independent accountants, Ernst & Young LLP, can be found in the Proxy Statement under “Item 3. Proposal to Ratify the Appointment of Principal Independent Auditor—Services Performed by the Independent Auditor” and “Independent Auditor Fees.” That information is incorporated in this report by reference.
101
|
Item 15.
|
Exhibits and Financial Statement Schedules
|
(a)1. Financial Statements
The following consolidated financial statements of the company and its subsidiaries are found at Item 8:
|
•
|
Consolidated Statements of Operations—Years Ended December 31, 2014, 2013, and 2012
|
|
•
|
Consolidated Statements of Comprehensive Income—Years Ended December 31, 2014, 2013, and 2012
|
|
•
|
Consolidated Balance Sheets—December 31, 2014 and 2013
|
|
•
|
Consolidated Statements of Shareholders' Equity—Years Ended December 31, 2014, 2013, and 2012
|
|
•
|
Consolidated Statements of Cash Flows—Years Ended December 31, 2014, 2013, and 2012
|
|
•
|
Notes to Consolidated Financial Statements
|
(a)2. Financial Statement Schedules
The consolidated financial statement schedules of the company and its subsidiaries have been omitted because they are not required, are inapplicable, or are adequately explained in the financial statements.
Financial statements of interests of 50 percent or less, which are accounted for by the equity method, have been omitted because they do not, considered in the aggregate as a single subsidiary, constitute a significant subsidiary.
102
(a)3. Exhibits
|
2.1
|
Stock and Asset Purchase Agreement between Novartis AG and Eli Lilly and Company dated as of April 22, 2014
|
|
|
2.2
|
First Amendment to Stock and Asset Purchase Agreement between Novartis AG and Eli Lilly and Company dated as of December 17, 2014
|
|
|
3.1
|
|
Amended Articles of Incorporation
|
|
3.2
|
|
By-laws, as amended
|
|
4.1
|
|
Indenture with respect to Debt Securities dated as of February 1, 1991, between Eli Lilly and Company and Deutsche Bank Trust Company Americas, as successor trustee to Citibank, N.A., Trustee
|
|
4.2
|
|
Agreement dated September 13, 2007 appointing Deutsche Bank Trust Company Americas as Successor Trustee under the Indenture listed above
|
|
10.1
|
|
2002 Lilly Stock Plan, as amended
1
|
|
10.2
|
|
Form of Performance Award under the 2002 Lilly Stock Plan
1
|
|
10.3
|
|
Form of Shareholder Value Award under the 2002 Lilly Stock Plan
1
|
|
10.4
|
|
The Lilly Deferred Compensation Plan, as amended
1
|
|
10.5
|
|
The Lilly Directors’ Deferral Plan, as amended
1
|
|
10.6
|
|
The Eli Lilly and Company Bonus Plan, as amended
1
|
|
10.7
|
|
The Eli Lilly and Company Executive Officer Incentive Plan
1
|
|
10.8
|
|
2007 Change in Control Severance Pay Plan for Select Employees, as amended
1
|
|
10.9
|
|
Guilty Plea Agreement in
The United States District Court for the Eastern District of Pennsylvania, United States of America v. Eli Lilly and Company
|
|
10.10
|
|
Settlement Agreement among the company and the United States of America, acting through the United States Department of Justice, Civil Division, and the United States Attorney’s Office of the Eastern District of Pennsylvania, the Office of the Inspector General of the Department of Health and Human Services, TRICARE Management Activity, and the United States Office of Personnel Management, and certain individual relators
|
|
10.11
|
|
Corporate Integrity Agreement between the company and the Office of Inspector General of the Department of Health and Human Services
|
|
12
|
|
Statement re: Computation of Ratio of Earnings to Fixed Charges
|
|
21
|
|
List of Subsidiaries
|
|
23
|
|
Consent of Independent Registered Public Accounting Firm
|
|
31.1
|
|
Rule 13a-14(a) Certification of John C. Lechleiter, Ph.D., Chairman of the Board, President, and Chief Executive Officer
|
|
31.2
|
|
Rule 13a-14(a) Certification of Derica W. Rice, Executive Vice President, Global Services and Chief Financial Officer
|
|
32
|
|
Section 1350 Certification
|
|
101
|
|
Interactive Data File
|
|
1
|
Indicates management contract or compensatory plan.
|
103
Signatures
Pursuant to the requirements of Section 13 or 15(d) of the Securities Exchange Act of 1934, the Registrant has duly caused this report to be signed on its behalf by the undersigned thereunto duly authorized.
Eli Lilly and Company
|
By
|
|
/s/ John C. Lechleiter
|
|
John C. Lechleiter, Ph.D.
|
||
|
Chairman of the Board, President, and Chief Executive Officer
|
||
February 19, 2015
104
Pursuant to the requirements of the Securities Exchange Act of 1934, this report has been signed below on
February 19, 2015
by the following persons on behalf of the Registrant and in the capacities indicated.
|
Signature
|
|
Title
|
|
/s/ John C. Lechleiter, Ph.D.
|
|
Chairman of the Board, President, and Chief Executive Officer, and a Director (principal executive officer)
|
|
JOHN C. LECHLEITER, Ph.D.
|
|
|
|
/s/ Derica W. Rice
|
|
Executive Vice President, Global Services and Chief Financial Officer (principal financial officer)
|
|
DERICA W. RICE
|
|
|
|
/s/ Donald A. Zakrowski
|
|
Vice President, Finance and Chief Accounting Officer (principal accounting officer)
|
|
DONALD A. ZAKROWSKI
|
|
|
|
/s/ Ralph Alvarez
|
|
Director
|
|
RALPH ALVAREZ
|
|
|
|
/s/ Katherine Baicker, Ph.D.
|
|
Director
|
|
KATHERINE BAICKER, Ph.D.
|
|
|
|
/s/ Michael L. Eskew
|
|
Director
|
|
MICHAEL L. ESKEW
|
|
|
|
/s/ J. Erik Fyrwald
|
|
Director
|
|
J. ERIK FYRWALD
|
|
|
|
/s/ R. David Hoover
|
|
Director
|
|
R. DAVID HOOVER
|
|
|
|
/s/ Karen N. Horn, Ph.D.
|
|
Director
|
|
KAREN N. HORN, Ph.D.
|
|
|
|
/s/ William G. Kaelin, Jr., M.D.
|
Director
|
|
|
WILLIAM G. KAELIN, JR., M.D.
|
||
|
/s/ Ellen R. Marram
|
|
Director
|
|
ELLEN R. MARRAM
|
|
|
|
/s/ Douglas R. Oberhelman
|
|
Director
|
|
DOUGLAS R. OBERHELMAN
|
|
|
|
/s/ Franklyn G. Prendergast, M.D., Ph.D.
|
|
Director
|
|
FRANKLYN G. PRENDERGAST, M.D., Ph.D.
|
|
|
|
/s/ Marschall S. Runge, M.D., Ph.D.
|
Director
|
|
|
MARSCHALL S. RUNGE, M.D., Ph.D.
|
||
|
/s/ Kathi P. Seifert
|
|
Director
|
|
KATHI P. SEIFERT
|
|
|
|
/s/ Jackson P. Tai
|
Director
|
|
|
JACKSON P. TAI
|
||
105
Trademarks Used In This Report
Trademarks or service marks owned by Eli Lilly and Company or its subsidiaries or affiliates, when first used in this report, appear with an initial capital and are followed by the symbol
®
or
™
, as applicable. In subsequent uses of the marks in the report, the symbols may be omitted.
Actos
®
is a trademark of Takeda Pharmaceutical Company Limited.
Bydureon
®
and Byetta
®
are trademarks of Amylin Pharmaceuticals, Inc.
Glyxambi
®
,
Jardiance
®
,
Jentadueto
®
,
and Trajenta
®
are trademarks of Boehringer Ingelheim GmbH.
Lantus
®
is a trademark of Sanofi-Aventis Deutschland GmbH.
Sentinel
®
is a trademark of Virbac Corporation.
Xigris
™
is a trademark of Biocritica, Inc.
106
Index to Exhibits
The following documents are filed as part of this report:
|
Exhibit
|
|
|
|
Location
|
|
2.1
|
Stock and Asset Purchase Agreement between Novartis AG and Eli Lilly and Company dated as of April 22, 2014
|
Incorporated by reference to Exhibit 2 to the Company's Report on Form 10-Q for the quarter ended June 30, 2014
|
||
|
2.2
|
First Amendment to Stock and Asset Purchase Agreement between Novartis AG and Eli Lilly and Company dated as of December 17, 2014 (confidential treatment requested for certain information in this Amendment)
|
Attached
|
||
|
3.1
|
|
Amended Articles of Incorporation
|
|
Incorporated by reference to Exhibit 3.1 to the Company's Report on Form 10-K for the year ended December 31, 2013
|
|
3.2
|
|
By-laws, as amended
|
|
Incorporated by reference to Exhibit 99 to the Company’s Report on Form 8-K filed February 27, 2012
|
|
4.1
|
|
Indenture with respect to Debt Securities dated as of February 1, 1991, between Eli Lilly and Company and Deutsche Bank Trust Company Americas, as successor trustee to Citibank, N.A., Trustee
|
|
Incorporated by reference to Exhibit 4.1 to the Company’s Registration Statement on Form S-3, Registration No. 333-186979
|
|
4.2
|
|
Agreement dated September 13, 2007 appointing Deutsche Bank Trust Company Americas as Successor Trustee under the Indenture listed above
|
|
Incorporated by reference to Exhibit 4.2 to the Company’s Report on Form 10-K for the year ended December 31, 2008 (SEC File No. 001-06351, Film No. 09640420)
|
|
10.1
|
|
2002 Lilly Stock Plan, as amended
|
|
Incorporated by reference to Exhibit 10 to the Company’s Report on Form 10-Q for the quarter ended September 30, 2012
|
|
10.2
|
|
Form of Performance Award under the 2002 Lilly Stock Plan
|
|
Attached
|
|
10.3
|
|
Form of Shareholder Value Award under the 2002 Lilly Stock Plan
|
|
Attached
|
|
10.4
|
|
The Lilly Deferred Compensation Plan, as amended
|
|
Incorporated by reference to Exhibit 10.5 to the Company's Report on Form 10-K for the year ended December 31, 2013
|
|
10.5
|
|
The Lilly Directors’ Deferral Plan, as amended
|
|
Incorporated by reference to Exhibit 10.2 to the Company’s Report on Form 10-Q for the quarter ended September 30, 2009 (SEC File No. 001-06351, Film No. 091147352)
|
|
10.6
|
|
The Eli Lilly and Company Bonus Plan, as amended
|
|
Incorporated by reference to Exhibit 10.7 to the Company's Report on Form 10-K for the year ended December 31, 2013
|
|
10.7
|
|
The Eli Lilly and Company Executive Officer Incentive Plan
|
|
Incorporated by reference to Appendix B to the Company’s proxy statement on Schedule 14A filed March 7, 2011
|
|
10.8
|
|
2007 Change in Control Severance Pay Plan for Select Employees, as amended
|
|
Incorporated by reference to Exhibit 10 to the Company’s Report on Form 10-Q for the quarter ended September 30, 2010
|
107
|
Exhibit
|
|
|
|
Location
|
|
10.9
|
|
Guilty Plea Agreement in The United States District Court for the Eastern District of Pennsylvania, United States of America v. Eli Lilly and Company
|
|
Incorporated by reference to Exhibit 10.15 to the Company’s Report on Form 10-K for the year ended December 31, 2008 (SEC File No. 001-06351, Film No. 09640420)
|
|
10.10
|
|
Settlement Agreement among the company and the United States of America, acting through the U. S. Department of Justice, Civil Division, and the U. S. Attorney’s Office of the Eastern District of Pennsylvania, the Office of the Inspector General of the Department of Health and Human Services, TRICARE Management Activity, and the U. S. Office of Personnel Management, and certain individual relators
|
|
Incorporated by reference to Exhibit 10.16 to the Company’s Report on Form 10-K for the year ended December 31, 2008 (SEC File No. 001-06351, Film No. 09640420)
|
|
10.11
|
|
Corporate Integrity Agreement between the company and the Office of Inspector General of the Department of Health and Human Services
|
|
Incorporated by reference to Exhibit 10.17 to the Company’s Report on Form 10-K for the year ended December 31, 2008 (SEC File No. 001-06351, Film No. 09640420)
|
|
12
|
|
Statement re: Computation of Ratio of Earnings to Fixed Charges
|
|
Attached
|
|
21
|
|
List of Subsidiaries
|
|
Attached
|
|
23
|
|
Consent of Registered Independent Public Accounting Firm
|
|
Attached
|
|
31.1
|
|
Rule 13a-14(a) Certification of John C. Lechleiter, Ph.D., Chairman of the Board, President, and Chief Executive Officer
|
|
Attached
|
|
31.2
|
|
Rule 13a-14(a) Certification of Derica W. Rice, Executive Vice President, Global Services and Chief Financial Officer
|
|
Attached
|
|
32
|
|
Section 1350 Certification
|
|
Attached
|
|
101
|
|
Interactive Data File
|
|
Attached
|
108
TABLE OF CONTENTS
Part IItem 1. BusinessItem 1A. Risk FactorsItem 1B. Unresolved Staff CommentsItem 2. PropertiesItem 3. Legal ProceedingsItem 4. Mine Safety DisclosuresPart IIItem 5. Market For The Registrant S Common Equity, Related Stockholder Matters, and Issuer Purchases Of Equity SecuritiesItem 6. Selected Financial Data (unaudited)Item 7. Management S Discussion and Analysis Of Results Of Operations and Financial ConditionItem 7A. Quantitative and Qualitative Disclosures About Market RiskItem 8. Financial Statements and Supplementary DataNote 1: Summary Of Significant Accounting PoliciesNote 2: Implementation Of New Financial Accounting PronouncementsNote 3: AcquisitionsNote 4: Collaborations and Other ArrangementsNote 5: Asset Impairment, Restructuring, and Other Special ChargesNote 6: InventoriesNote 7: Financial InstrumentsNote 8: Goodwill and Other IntangiblesNote 9: Property and EquipmentNote 10: BorrowingsNote 11: Stock-based CompensationNote 12: Shareholders' EquityNote 13: Income TaxesNote 14: Retirement BenefitsNote 15: ContingenciesNote 16: Other Comprehensive Income (loss)Note 17: Other Net, (income) ExpenseNote 18: Segment InformationNote 19: Selected Quarterly Data (unaudited)Item 9. Changes in and Disagreements with Accountants on Accounting and Financial DisclosureItem 9A. Controls and ProceduresItem 9B. Other InformationPart IIIItem 10. Directors, Executive Officers, and Corporate GovernanceItem 11. Executive CompensationItem 12. Security Ownership Of Certain Beneficial Owners and Management and Related Stockholder MattersItem 13. Certain Relationships and Related Transactions, and Director IndependenceItem 14. Principal Accountant Fees and ServicesItem 15. Exhibits and Financial Statement Schedules