LIMONEIRA CO
10-Ks and 10-Qs
|
|
|
|
|
|
|
|
|
|
|
|
|
|
|
|
|
|
|
|
|
|
|
|
|
|
|
|
|
|
|
|
|
|
|
|
|
|
|
|
|
|
|
|
|
|
|
|
|
|
|
|
|
|
|
|
UNITED STATES SECURITIES AND EXCHANGE COMMISSION
WASHINGTON, D.C. 20549
FORM 10-K
|
þ
|
ANNUAL REPORT PURSUANT TO SECTION 13 OR 15(d) OF THE SECURITIES EXCHANGE ACT OF 1934
|
FOR THE FISCAL YEAR ENDED
OCTOBER 31, 2018
OR
|
¨
|
TRANSITION REPORT PURSUANT TO SECTION 13 OR 15(d) OF THE SECURITIES EXCHANGE ACT OF 1934
|
Commission file number: 001-34755
LIMONEIRA COMPANY
(Exact name of registrant as specified in its charter)
|
Delaware
(State of incorporation)
|
|
77-0260692
(I.R.S. Employer Identification No.)
|
|
1141 Cummings Road, Santa Paula, CA
|
|
93060
|
|
(Address of principal executive offices)
|
|
(Zip code)
|
Registrant’s telephone number, including area code: (805) 525-5541
Securities registered pursuant to Section 12(b) of the Act:
|
|
|
Name of Each Exchange
|
|
Title of Each Class
|
|
On Which Registered
|
|
|
|
|
|
Common Stock, $0.01 par value
|
|
The NASDAQ Stock Market, LLC
|
Securities registered pursuant to Section 12(g) of the Act: None
Indicate by check mark if the registrant is a well-known seasoned issuer, as defined in Rule 405 of the Securities Act. Yes
¨
No
þ
Indicate by check mark if the registrant is not required to file reports pursuant to Section 13 or Section 15(d) of the Act. Yes
¨
No
þ
Indicate by check mark whether the registrant: (1) has filed all reports required to be filed by Section 13 or 15(d) of the Securities Exchange Act of 1934 during the preceding 12 months (or for such shorter period that the registrant was required to file such reports), and (2) has been subject to such filing requirements for the past 90 days. Yes
þ
No
¨
Indicate by check mark whether the registrant has submitted electronically and, if any, every Interactive Data File required to be submitted pursuant to Rule 405 of Regulation S-T (§232.405 of this chapter) during the preceding 12 months (or for such shorter period that the registrant was required to submit such files). Yes
þ
No
¨
Indicate by check mark if disclosure of delinquent filers pursuant to Item 405 of Regulation S-K is not contained herein, and will not be contained, to the best of Registrant’s knowledge, in definitive proxy or information statements incorporated by reference in Part III of this Form 10-K or any amendment to this Form 10-K.
¨
Indicate by check mark whether the registrant is a large accelerated filer, an accelerated filer, a non-accelerated filer, smaller reporting company or an emerging growth company. See the definitions of “large accelerated filer,” “accelerated filer,” “smaller reporting company” and “emerging growth company” in Rule 12b-2 of the Exchange Act. (Check one):
|
Large accelerated filer
¨
|
Accelerated filer
þ
|
Non-accelerated filer
¨
(Do not check if a smaller reporting company)
|
Smaller reporting
company
¨
|
Emerging growth
company
¨
|
If an emerging growth company, indicate by check mark if the registrant has elected not to use the extended transition period for complying with any new or revised financial accounting standards provided pursuant to Section 13(a) of the Exchange Act.
¨
Indicate by check mark if whether the registrant is a shell company (as defined in Rule 12b-2 of the Exchange Act). Yes
¨
No
þ
Based on the closing price as reported on the NASDAQ Global Market, the aggregate market value of the Registrant’s Common Stock held by non-affiliates on April 30,
2018
(the last business day of the Registrant’s most recently completed second fiscal quarter) was approximately
$282.0 million
. Shares of Common Stock held by each executive officer and director and by each stockholder affiliated with a director or an executive officer have been excluded from this calculation because such persons may be deemed to be affiliates. This determination of affiliate status is not necessarily a conclusive determination for other purposes. The number of outstanding shares of the Registrant’s Common Stock as of December 31,
2018
was
17,764,801
.
Documents Incorporated by Reference
Portions of the Registrant’s Proxy Statement for the 2019 Annual Meeting of Stockholders, which we intend to hold on March 26, 2019, are incorporated by reference into Part III of this Annual Report on Form 10-K. The definitive Proxy Statement will be filed within 120 days after
October 31, 2018
.
1
TABLE OF CONTENTS
2
CAUTIONARY STATEMENT
This Annual Report on Form 10-K (this “Annual Report”) contains statements which, to the extent that they do not recite historical fact, constitute forward-looking statements. These statements can be identified by the fact that they do not relate strictly to historical or current facts and may include the words "may," "will," “could," "should," "would," "believe," "expect," "anticipate," "estimate," "intend," "plan" or other words or expressions of similar meaning. We have based these forward-looking statements on our current expectations about future events. The forward-looking statements include statements that reflect management’s beliefs, plans, objectives, goals, expectations, anticipations and intentions with respect to our financial condition, results of operations, future performance and business, including statements relating to our business strategy and our current and future development plans.
The potential risks and uncertainties that could cause our actual financial condition, results of operations and future performance to differ materially from those expressed or implied in this Annual Report include:
|
•
|
changes in laws, regulations, rules, quotas, tariffs and import laws;
|
|
•
|
adverse weather conditions, natural disasters and other adverse natural conditions, including freezes, rains, fires and droughts, that affect the production, transportation, storage, import and export of fresh produce;
|
|
•
|
market responses to industry volume pressures;
|
|
•
|
increased pressure from disease, insects and other pests;
|
|
•
|
disruption of water supplies or changes in water allocations;
|
|
•
|
product and raw materials supplies and pricing;
|
|
•
|
energy supply and pricing;
|
|
•
|
changes in interest and currency exchange rates;
|
|
•
|
availability of financing for development activities;
|
|
•
|
general economic conditions for residential and commercial real estate development;
|
|
•
|
political changes and economic crises;
|
|
•
|
international conflict;
|
|
•
|
acts of terrorism;
|
|
•
|
labor disruptions, strikes, shortages or work stoppages;
|
|
•
|
loss of important intellectual property rights; and
|
|
•
|
other factors disclosed in this Annual Report.
|
In addition, this Annual Report contains industry data related to our business and the markets in which we operate. This data includes projections that are based on a number of assumptions. If these assumptions turn out to be incorrect, actual results could differ from the projections. We urge you to carefully review this Annual Report, particularly the section entitled “Risk Factors,” for a complete discussion of the risks of an investment in our common stock.
Although we believe that the expectations reflected in the forward-looking statements are reasonable, we cannot guarantee future results, level of activity, performance or achievements. Many factors discussed in this Annual Report, some of which are beyond our control, will be important in determining our future performance. Consequently, actual results may differ materially from those that might be anticipated from forward-looking statements. In light of these and other uncertainties, you should not regard the inclusion of a forward-looking statement in this Annual Report as a representation by us that our plans and objectives will be achieved, and you should not place undue reliance on such forward-looking statements. We undertake no obligation to publicly update or revise any forward-looking statements, whether as a result of new information, future events or otherwise, except as required by law.
All references to “we,” “us,” “our,” “our Company,” “the Company,” or “Limoneira” in this Annual Report mean Limoneira Company, a Delaware corporation, and its wholly owned subsidiaries.
3
PART I
Item 1. Business
Limoneira Company was incorporated in Delaware in 1990 as the successor to several businesses with operations in California since 1893. Our business and operations are described below. For detailed financial information with respect to our business and our operations, see our consolidated financial statements and the related notes to consolidated financial statements, which are included in Item 8 in this Annual Report. In addition, general information concerning our Company can be found on our website, the internet address of which is www.limoneira.com. All of our filings with the Securities and Exchange Commission (the “SEC”), including but not limited to, the annual reports on Form 10-K, quarterly reports on Form 10-Q, current reports on Form 8-K, and any amendments thereto, are available free of charge on our website as soon as reasonably practicable after such material is electronically filed with or furnished to the SEC.
Overview
We are an agribusiness and real estate development company founded and based in Santa Paula, California, committed to responsibly using and managing our approximately
14,500
acres of land, water resources and other assets to maximize long-term stockholder value. Our current operations consist of fruit production, sales and marketing, rental operations, real estate development and capital investment activities.
We are one of California’s oldest citrus growers. According to Sunkist Growers, Inc. (“Sunkist”), we are one of the largest growers of lemons in the United States and, according to the California Avocado Commission, one of the largest growers of avocados in the United States. In addition to growing lemons and avocados, we grow oranges and a variety of specialty citrus and other crops. We have agricultural plantings throughout Ventura, Tulare, San Bernardino and San Luis Obispo Counties in California, Yuma County in Arizona and La Serena, Chile, which collectively consist of approximately
5,000
acres of lemons,
900
acres of avocados,
1,600
acres of oranges and
1,000
acres of specialty citrus and other crops. We also operate our own packinghouses in Santa Paula and Oxnard, California and Yuma, Arizona, where we process, pack and sell lemons that we grow, as well as lemons grown by others. We have a 47% interest in Rosales S.A. (“Rosales”), a citrus packing, marketing and sales business, a 90% interest in Fruticola Pan de Azucar S.A. (“PDA”), a lemon and orange orchard and 100% interest in Fruticola San Pablo S.A. ("San Pablo"), a lemon and orange orchard, all of which are located near La Serena, Chile.
Our water resources include water rights, usage rights and pumping rights to the water in aquifers under, and canals that run through, the land we own. Water for our farming operations is sourced from the existing water resources associated with our land, which includes rights to water in the adjudicated Santa Paula Basin (aquifer) and the un-adjudicated Fillmore and Paso Robles Basins (aquifers). We use ground water from the San Joaquin Valley Basin and water from local water and irrigation districts in Tulare County, which is in California’s San Joaquin Valley. We also use ground water from the Cadiz Valley Basin in California’s San Bernardino County and surface water in Arizona from the Colorado River through the Yuma Mesa Irrigation and Drainage District (“YMIDD”). We use ground water provided by wells and surface water for our PDA and San Pablo farming operations in Chile.
For more than 100 years, we have been making strategic investments in California agriculture and real estate development. We currently have three real estate development projects in California. These projects include multi-family housing and single-family homes comprising approximately
260
completed rental units and another approximately
1,500
units in various stages of planning and development.
Fiscal Year
2018
Highlights and Recent Developments
On November 10, 2015, we entered into a joint venture with The Lewis Group of Companies (“Lewis”) for the residential development of our East Area I real estate development project. To consummate the transaction, we formed Limoneira Lewis Community Builders, LLC (the "LLC" or "Joint Venture"). The first phase of the project broke ground to commence mass grading on November 8, 2017. Project plans include approximately
632
residential units in Phase 1. Grading began in November 2017 and Phase 1 site improvements have begun. The Joint Venture has received lot deposits from national homebuilders and initial closings of lot sales are anticipated to begin in the first quarter of calendar year 2019.
In January 2018, the Joint Venture entered into a $45.0 million unsecured Line of Credit Loan Agreement and Promissory Note (the “Loan”) with Bank of America, N.A. to fund early development activities. The Loan matures in January 2020, with an option to extend the maturity date until 2021, subject to certain conditions. The interest rate on the Loan is LIBOR plus 2.85%, payable monthly. The Loan contains certain customary default provisions and the Joint Venture may prepay any amounts outstanding under
4
the Loan without penalty. In February 2018, the obligations under the Loan were guaranteed by certain principals from Lewis and by the Company.
In February 2013, we entered into an option agreement for the purchase of a 7-acre parcel adjacent to its East Area II real estate development project. We made a $75,000 initial option payment in 2013 and four additional annual option payments of $50,000 each from 2014 to 2017. In February 2018, we exercised our option and purchased the property for $3.1 million, by making a cash payment of $1.4 million and issuing a note payable for $1.4 million. The $0.3 million of option payments were applied to the purchase price and we incurred $9,000 of transaction costs. The note payable is due in five years, with interest-only, monthly payments at interest rates ranging from 5.0% to 7.0%.
In August 2017, we entered an agreement to sell the commercial portion of our Sevilla property for approximately $1.5 million. This transaction closed in November 2017, we received net proceeds of $1.4 million and we recognized a gain of approximately $10,000.
In October 2017, we entered an agreement to sell our Centennial Square ("Centennial") property for approximately $3.3 million. This transaction closed December 2017 and we received net proceeds of $0.2 million and issued a $3.0 million promissory note secured by the property for the balance of the purchase price. The promissory note was originally scheduled to mature in June 2018 but provides for potential extensions to December 2019. After transaction costs, the sale resulted in a gain of $0.2 million, most of which has been deferred until repayment of the promissory note. In fiscal year 2018, per the terms of the promissory note, the holder of the note made two nonrefundable $0.1 million payments to us, extending the due date to December 30, 2018. In November 2018, the holder of the note made a nonrefundable $0.1 million payment to us, extending the due date to December 15, 2019.
On December 22, 2017, the Tax Cuts and Jobs Act of 2017 (the “Act”) was signed into law making significant changes to the Internal Revenue Code (“IRC”). Changes include, but are not limited to, a corporate tax rate decrease from 34% to 21% effective for tax years beginning after December 31, 2017, the transition of U.S. international taxation from a worldwide system to a territorial system, and a one-time transition tax on the mandatory deemed repatriation of cumulative foreign earnings as of November 2, 2017 and December 31, 2017. We have calculated our best estimate of the impact of the Act on our year-end income tax provision in accordance with our understanding of the Act and guidance and as a result of the rate reduction, we have decreased our deferred tax liability balance as of October 31, 2018 by approximately
$10.3 million
.
In June 2018, we completed the sale of 3,136,000 shares of common stock, at a price of $22.00 per share to institutional and other investors in a registered offering under our shelf registration statement. The offering represented 18% of our outstanding common stock on an after-issued basis. Upon completion of the offering and issuance of common stock, we had 17,669,000 shares of common stock outstanding. The gross proceeds of the offering totaled $69.0 million and after an underwriting discount of $4.5 million and other offering expenses of $0.4 million, the net proceeds were $64.1 million. In June and July 2018, we used the offering proceeds to pay down debt, purchase the San Pablo ranch, and purchase the Oxnard Lemon Associates, Ltd's ("Oxnard Lemon") packinghouse, related land and certain other assets.
In July 2018, we completed the acquisition of San Pablo ranch and related assets in La Serena, Chile, for $13.1 million. The San Pablo ranch consists of 3,317 total acres on two parcels, including 247 acres producing lemons, 61 acres producing oranges, the opportunity to immediately plant 120 acres for lemon production, as well as the potential for approximately 500 acres of avocado production.
In July 2018, we entered into an agreement to purchase Oxnard Lemon for $25.0 million. Pursuant to the agreement, we acquired certain “hard assets” of Oxnard Lemon, including a packinghouse and related land for a purchase price of $24.7 million on July 26, 2018. Pursuant to the agreement, the closing on the purchase and sale of the “soft assets” of Oxnard Lemon, including trade names, trademarks and copyrights, took place on October 31, 2018, at which point an additional $0.3 million in purchase price was paid. Additionally, the agreement provided that the sellers lease back the “hard assets” from July 26, 2018 until October 31, 2018, pursuant to a lease agreement executed July 26, 2018.
Late in the third quarter of fiscal year 2018, Ventura County experienced record high temperatures. We expect that the effect of these high temperatures will result in lower avocado crop volume in fiscal year 2019 compared to fiscal year 2018.
In October 2018, we sold 50,000 shares of Calavo Growers, Inc. (“Calavo”) common stock at an average price of $94.47 per share. Net proceeds from the sale were $4.7 million and we recognized a gain of $4.2 million. We continue to own 250,000 shares of Calavo common stock.
5
In October 2018, we began negotiations to sell both our The Terraces at Pacific Crest ("Pacific Crest") property and the remaining residential portion of our Sevilla property for $5.2 million. As a result, based on the estimated selling prices, we recorded an impairment charge of
$1.6 million
. As of the date of the filing, these transactions are still in negotiations.
On December 18, 2018, we declared a cash dividend of $0.075 per common share payable on January 15, 2019, in the aggregate amount of $1.3 million to stockholders of record as of December 31, 2018. This represents a 20% increase in our dividend compared to 2018.
Business Division Summary
We have three business divisions: agribusiness, rental operations and real estate development. The agribusiness division is comprised of four reportable segments: fresh lemons, lemon packing, avocados and other agribusiness, and includes our farming, harvesting, lemon packing and sales operations. The rental operations division includes our residential and commercial rentals, leased land operations and organic recycling. The real estate development division includes our real estate projects and development. Financial information and discussion of our six reportable segments, which includes fresh lemons, lemon packing, avocados, other agribusiness, rental operations and real estate development, are contained in the notes to the accompanying consolidated financial statements of this Annual Report.
Agribusiness Division
The agribusiness division is comprised of four of our reportable segments: fresh lemons, lemon packing, avocados and other agribusiness, which represented approximately 96%, 96% and 95% of our fiscal year 2018, 2017 and 2016 consolidated revenues, respectively, of which fresh lemons and lemon packing combined represented approximately 80%, 78% and 76% of our fiscal year 2018, 2017 and 2016 consolidated revenues, respectively.
Farming
We are one of California’s oldest citrus growers and one of the largest growers of lemons and avocados in the United States. In addition to growing lemons and avocados, we grow oranges and a variety of specialty citrus and other crops. We have agricultural plantings throughout Ventura, Tulare, San Bernardino and San Luis Obispo Counties in California, Yuma County in Arizona and La Serena, Chile, which collectively consist of approximately
5,000
acres of lemons,
900
acres of avocados,
1,600
acres of oranges and
1,000
acres of specialty citrus and other crops. With the acquisition of PDA and San Pablo, we have approximately
500
acres of lemon and oranges plantings in Chile. We also operate our own packinghouses in Santa Paula and Oxnard, California and Yuma, Arizona, where we process, pack and sell lemons we grow as well as lemons grown by others.
Lemons.
Our lemon farming is included in our “fresh lemons” and “lemon packing” reportable segments within our financial statements. We market and sell lemons directly to food service, wholesale and retail customers throughout the United States, Canada, Asia, Australia and certain other international markets. We are one of the largest lemon growers in the United States with approximately
5,000
acres of lemons planted primarily in Ventura, Tulare and San Bernardino Counties in California and in Yuma County, Arizona. In California, the lemon growing area stretches from the Coachella Valley to Fresno and Monterey Counties, with the majority of the growing areas being located in the coastal areas from Ventura County to Monterey County. Ventura County is California’s top lemon producing county. Approximately
35%
of our lemons are grown in Ventura County,
25%
are grown in Tulare County,
25%
are grown in Yuma County, Arizona and
10%
are grown in San Bernardino County, California. We also grow approximately
5%
of our lemons near La Serena, Chile.
There are over fifty varieties of lemons, with the Lisbon, Eureka and Genoa being the predominant varieties marketed on a worldwide basis. California-grown lemons are available throughout the year, with peak production periods occurring from January through August. Approximately 85% of our lemon plantings are of the Lisbon and Eureka varieties and approximately 15% are of other varieties such as sweet Meyer lemons, proprietary seedless lemons and pink variegated lemons. The storage life of fresh lemons generally ranges from 1 to 18 weeks, depending upon the maturity of the fruit, the growing methods used and the handling conditions in the distribution chain.
With an average annual production of approximately 800,000 tons of lemons, California accounts for approximately 90% of the United States lemon crop, with Arizona producing the majority of the rest. Approximately 70% of the United States lemon crop is utilized in the fresh market, with the remainder going to the processed market for products such as juice, oils and essences. Most lemons are consumed as either a cooking ingredient, a garnish, or as juice in lemonade or carbonated beverages or other drinks. Demand for lemons is typically highest in the summer, although California producers through various geographical zones are typically able to harvest lemons year-round.
6
Avocados.
Our avocado farming is included in our “avocados” reportable segment within our financial statements. We are one of the largest avocado growers in the United States with approximately
900
acres of avocados planted throughout Ventura County. In California, the avocado growing area stretches from San Diego County to Monterey County, with the majority of the growing areas located approximately 100 miles north and south of Los Angeles County.
Over the last 75 years, the avocado has transitioned from a single specialty fruit to an array of 10 varieties ranging from the green-skinned Zutanos to the black-skinned Hass, which is the predominant avocado variety marketed on a worldwide basis. California-grown avocados are available year-round, with peak production periods occurring between February and September. Other avocado varieties have a more limited picking season and typically command a lower price. Because of superior eating quality, the Hass avocado has contributed greatly to the avocado’s growing popularity through its retail, restaurant and other food service uses. Approximately 95% of our avocado plantings are of the Hass variety. The storage life of fresh avocados generally ranges from one to four weeks, depending upon the maturity of the fruit, the growing methods used and the handling conditions in the distribution chain.
We provide all of our avocado production to Calavo, a packing and marketing company listed on the NASDAQ Global Select Market under the symbol CVGW. Calavo’s customers include many of the largest retail and food service companies in the United States and Canada. Our marketing relationship with Calavo dates back to 2003. Calavo receives fruit from our orchards at its packinghouse located in Santa Paula, California. Calavo’s proximity to our agricultural operations enables us to keep transportation and handling costs to a minimum. Our avocados are packed by Calavo and sold and distributed under its own brands to its customers primarily in the United States and Canada.
Primarily due to differing soil conditions, the care of avocado trees is intensive and during our 75-year history of growing avocados, growing techniques have changed dramatically. The need for more production per acre to compete with foreign sources of supply has required us to take an important lead in the practice of dense planting (typically four times the number of avocado trees per acre versus traditional avocado plantings) and mulching composition to help trees acclimate under conditions that more closely resemble those found in the tropics, a better climate for avocado growth.
Oranges.
Our orange farming is included in our “other agribusiness” reportable segment within our financial statements. While we are primarily known for our high-quality lemons, we also grow oranges. We have approximately
1,600
acres of oranges planted primarily in Tulare County, California. In California, the growing area for oranges stretches from Imperial County to Yolo County. For many decades, the Valencia variety of oranges was grown in Ventura County primarily for export to the Pacific Rim. Throughout the late twentieth century, developing countries began producing the larger, seedless Navel variety of oranges that successfully competed against the smaller Valencia variety. California-grown Navel oranges are available from October to June, with peak production periods occurring between January and April. California-grown Valencia oranges are available from March to October, with peak production periods occurring between June and September. Approximately 95% of our orange plantings are of the Navel variety and approximately 5% are of the Valencia variety.
Navel oranges comprise most of California’s orange crop, accounting for approximately 80% over the past three growing seasons. Valencia oranges account for a vast majority of the remainder of California’s orange crop. While California produces approximately 40% of the nation’s oranges, its crop accounts for approximately 90% of those going to the fresh market. The share of California’s crop going to fresh market, as opposed to the processed market (i.e., juices, oils and essences) varies by season, depending on the quality of the crop. We estimate approximately 70% of our oranges are sold to retail customers and approximately 30% are sold to wholesale customers.
Specialty Citrus and Other Crops.
Our specialty citrus and other crop farming is included in our “other agribusiness” reportable segment within our financial statements. A few decades ago, we began growing specialty citrus varieties and other crops that we believed would appeal to changing North American and worldwide demand. As a result, we currently have approximately
1,000
acres of specialty citrus and other crops planted such as Moro blood oranges, Cara Cara oranges, Minneola tangelos, Star Ruby grapefruit, pummelos, pistachios and wine grapes.
Acreage devoted to specialty citrus and other crops in California has been growing significantly over the past few decades, especially with the popularity of the Clementine, a type of mandarin orange. Similar to our oranges, we utilize third-party packinghouses to process and pack our specialty citrus. A portion of our specialty citrus is marketed and sold under the Sunkist brand by Sunkist and orders are processed by Sunkist-member packinghouses. As an agricultural cooperative, Sunkist coordinates the sales and marketing of the specialty citrus and orders are processed by Sunkist-member packinghouses for direct shipment to customers.
We currently market our other crops, such as pistachios and wine grapes, utilizing processors which are not members of agricultural cooperatives. Our pistachios are harvested and sold to a roaster, packager and marketer of nuts, and our wine grapes are sold to various wine producers.
7
Plantings
We have agricultural plantings on properties located in Ventura, Tulare, San Bernardino and San Luis Obispo Counties in California and in Yuma, Arizona and La Serena, Chile. The following is a description of our agriculture properties:
|
Ranch Name
|
County / State
|
Total
Acres
|
Lemons
|
Avocados
|
Oranges
|
Specialty
Crops
|
Other
|
|||||||||||||
|
Limoneira/Olivelands
|
Ventura, CA
|
1,700
|
|
700
|
|
500
|
|
—
|
|
—
|
|
500
|
|
|||||||
|
Orchard Farm
|
Ventura, CA
|
1,100
|
|
500
|
|
—
|
|
—
|
|
—
|
|
600
|
|
|||||||
|
Teague McKevett
|
Ventura, CA
|
500
|
|
—
|
|
100
|
|
—
|
|
—
|
|
400
|
|
|||||||
|
La Campana
|
Ventura, CA
|
300
|
|
100
|
|
200
|
|
—
|
|
—
|
|
—
|
|
|||||||
|
Rancho La Cuesta
|
Ventura, CA
|
200
|
|
100
|
|
—
|
|
—
|
|
—
|
|
100
|
|
|||||||
|
Limco Del Mar
|
Ventura, CA
|
200
|
|
100
|
|
100
|
|
—
|
|
—
|
|
—
|
|
|||||||
|
Porterville Ranches
|
Tulare, CA
|
1,200
|
|
400
|
|
—
|
|
400
|
|
200
|
|
200
|
|
|||||||
|
Ducor Ranches
|
Tulare, CA
|
1,000
|
|
300
|
|
—
|
|
400
|
|
300
|
|
—
|
|
|||||||
|
Windfall Farms
|
San Luis Obispo, CA
|
700
|
|
—
|
|
—
|
|
—
|
|
300
|
|
400
|
|
|||||||
|
Sheldon Ranches
|
Tulare, CA
|
1,000
|
|
200
|
|
—
|
|
600
|
|
100
|
|
100
|
|
|||||||
|
Lemons 400
|
Tulare, CA
|
800
|
|
400
|
|
—
|
|
—
|
|
—
|
|
400
|
|
|||||||
|
Cadiz
|
San Bernardino, CA
|
800
|
|
600
|
|
—
|
|
—
|
|
—
|
|
200
|
|
|||||||
|
Associated Citrus Packers
|
Yuma, AZ
|
1,300
|
|
1,200
|
|
—
|
|
—
|
|
—
|
|
100
|
|
|||||||
|
PDA & San Pablo
|
La Serena, Chile
|
3,500
|
|
300
|
|
—
|
|
200
|
|
—
|
|
3,000
|
|
|||||||
|
Other agribusiness land
|
Various Counties, CA
|
200
|
|
100
|
|
—
|
|
—
|
|
100
|
|
—
|
|
|||||||
|
Total
|
14,500
|
|
5,000
|
|
900
|
|
1,600
|
|
1,000
|
|
6,000
|
|
||||||||
|
Percentage of Total
|
100
|
%
|
34
|
%
|
6
|
%
|
11
|
%
|
7
|
%
|
42
|
%
|
||||||||
The
Limoneira/Olivelands Ranch
is the original site of our Company. Our headquarters, lemon packing operations and storage facilities are located on this property.
The
Teague McKevett Ranch
is the site of our real estate development project known as East Area I and described below under the “Real Estate Development Division” heading.
Windfall Farms - Creston, California.
Windfall Farms is an approximately 700-acre former thoroughbred breeding farm and equestrian facility located in Creston, California, near Paso Robles, California. During fiscal years 2014 and 2015, we planted approximately 200 acres of vineyards and an additional 100 acres in 2017. Vineyards are generally productive after four years. During the fourth quarter of
2018
, the vineyards produced their third harvest from the 2014 planting and their second harvest from the 2015 planting, generating approximately
600
tons of grapes and
$0.9 million
of revenue in 2018. We expect to sell vineyard production by the ton to various wineries with current per ton prices of approximately
$1,500
depending on the grape variety and other factors.
Limco Del Mar
is owned by a limited partnership of which we are the general partner and own an interest of 28.1%, which is comprised of a 1.3% general partner interest and a 26.8% limited partner interest.
We manage the
Cadiz Ranches
under operating lease arrangements. We purchased substantially all of the
Sheldon Ranches
property in two separate transactions, which closed in September and December 2015. We previously managed the
Sheldon Ranches
under operating lease arrangements.
The other agribusiness land in the table above includes corporate and lemon packing facilities, land leased to other agricultural businesses, rental units, roads, creeks, hillsides and other open land.
Our orchards can maintain production for many years. For financial reporting purposes, we depreciate our orchards from 20 to 40 years depending on the fruit variety with the majority of our orchards depreciated over 20 to 30 years. We regularly evaluate our orchards’ production and growing costs, and based on these and other factors we may decide to redevelop certain orchards. In addition, we may acquire agricultural property with existing productive orchards or without productive orchards, which would require new orchard plantings. The fruit varieties that we grow are typically non-producing for approximately the first four years after planting. Currently, we have
1,200
acres of lemons,
200
acres of oranges and
200
acres of specialty citrus and other crops
8
that are under development. Orchards may continue producing fruit longer than their depreciable lives. The following table presents the number of acres planted by fruit variety and approximate age of our orchards:
|
|
Age of Orchards
|
|||||||||||
|
County, State, Fruit Variety
|
0-4 Years
|
5-25 Years
|
Over 25 Years
|
Total
|
||||||||
|
Ventura, CA
|
||||||||||||
|
Lemons
|
200
|
|
700
|
|
800
|
|
1,700
|
|
||||
|
Avocados
|
—
|
|
500
|
|
400
|
|
900
|
|
||||
|
Total Ventura, CA
|
200
|
|
1,200
|
|
1,200
|
|
2,600
|
|
||||
|
Tulare, CA
|
||||||||||||
|
Lemons
|
300
|
|
400
|
|
500
|
|
1,200
|
|
||||
|
Oranges
|
200
|
|
500
|
|
700
|
|
1,400
|
|
||||
|
Specialty citrus and other
|
—
|
|
600
|
|
100
|
|
700
|
|
||||
|
Total Tulare, CA
|
500
|
|
1,500
|
|
1,300
|
|
3,300
|
|
||||
|
San Bernardino, CA - Lemons
|
300
|
|
300
|
|
—
|
|
600
|
|
||||
|
San Luis Obispo, CA - Wine Grapes
|
200
|
|
100
|
|
—
|
|
300
|
|
||||
|
Yuma, AZ - Lemons
|
400
|
|
800
|
|
—
|
|
1,200
|
|
||||
|
La Serena, Chile
|
||||||||||||
|
Lemons
|
—
|
|
300
|
|
—
|
|
300
|
|
||||
|
Oranges
|
—
|
|
200
|
|
—
|
|
200
|
|
||||
|
Total La Serena, Chile
|
—
|
|
500
|
|
—
|
|
500
|
|
||||
|
Total
|
1,600
|
|
4,400
|
|
2,500
|
|
8,500
|
|
||||
|
Percentage of Total
|
19
|
%
|
52
|
%
|
29
|
%
|
100
|
%
|
||||
|
Summary by Crop
|
||||||||||||
|
Lemons
|
1,200
|
|
2,500
|
|
1,300
|
|
5,000
|
|
||||
|
Avocados
|
—
|
|
500
|
|
400
|
|
900
|
|
||||
|
Oranges
|
200
|
|
700
|
|
700
|
|
1,600
|
|
||||
|
Specialty citrus and other
|
200
|
|
700
|
|
100
|
|
1,000
|
|
||||
|
Total
|
1,600
|
|
4,400
|
|
2,500
|
|
8,500
|
|
||||
Lemon Packing and Sales
We are the oldest continuous lemon packing operation in North America. We pack and sell lemons grown by us as well as lemons grown by others, the operations of which are included in our financial statements under the lemon packing segment. Lemons delivered to our packinghouses in Santa Paula and Oxnard, California and Yuma, Arizona are sized, graded, cooled, ripened and packed for delivery to customers. Our ability to accurately estimate the size, grade and timing of the delivery of the annual lemon crop has a substantial impact on both our costs and the sales price we receive for the fruit.
A significant portion of the costs related to our lemon packing operation is fixed. Our strategy for growing the profitability of our lemon packing operations calls for optimizing the percentage of a crop that goes to the fresh market, or fresh utilization, and procuring a larger percentage of the California and Arizona lemon crop.
We invest considerable time and research into refining and improving our lemon packing through innovation and are continuously in search of new techniques to refine how premium lemons are delivered to our consumers. In the second quarter of fiscal year 2016, our new lemon packing facility became operational, which is expected to double our lemon packing capacity and has increased the efficiency and financial results of these operations.
9
Rental Operations Division
Our rental operations division is provided for in our financial statements as its own reportable segment and includes our residential and commercial rentals, leased land operations and organic recycling. The rental operations division represented approximately 4%, 4% and 5% of our fiscal year 2018, 2017 and 2016 consolidated revenues, respectively.
Residential
We own and maintain approximately
260
residential housing units located in Ventura and Tulare Counties in California that we lease to employees, former employees and non-employees. The December 2017 Southern California wildfires destroyed 14 mobile homes, which cost approximately $60,000 per unit to replace. In fiscal year 2015, we added 65 new agriculture workforce housing units in Santa Paula, California. These properties generate reliable cash flows which we use to partially fund the operating costs of our business and provide affordable housing for many of our employees and the community.
Commercial
We own several commercial office buildings and a multi-use facility consisting of a retail convenience store, gas station, car wash, and quick-serve restaurant. As with our residential housing units, these properties generate reliable cash flows which we use to partially fund the operating costs of our business.
Leased Land
As of
October 31, 2018
, we lease approximately 500 acres of our land to third-party agricultural tenants who grow a variety of row crops such as strawberries, raspberries, celery and cabbage. Our leased land business provides us with a profitable method to diversify the use of our land.
Organic Recycling
With the help of one of our tenants, Agromin, Inc. (“Agromin”), a processor of premium soil products and a green waste recycler located in Oxnard, California, we have implemented an organic recycling program. Agromin provides green waste recycling for cities in Santa Barbara, Los Angeles and Ventura Counties. We worked with Agromin to develop an organic recycling facility on our land in Ventura County, to receive green materials (lawn clipping, leaves, bark and other plant materials) and convert such material into mulch that we spread throughout our agricultural properties to help curb erosion, improve water efficiency, reduce weeds and moderate soil temperatures. We receive a percentage of the gate fees Agromin collects from regional waste haulers and enjoy the benefits of the organic material.
Real Estate Development Division
Our real estate development division is provided for in our financial statements as its own reportable segment and includes our real estate development operations. The real estate development division had no significant revenues in fiscal years 2018, 2017 or 2016.
For more than 100 years, we have been making strategic real estate investments in California agricultural and developable real estate. Our current real estate developments include developable land parcels, multi-family housing and single-family homes with approximately
1,500
units in various stages of planning and development. The following is a summary of each of the strategic agricultural and development real estate investment properties in which we own an interest:
East Area I - Santa Paula, California.
East Area I consists of 523 acres that we have used as agricultural land and is located in Santa Paula approximately ten miles from the City of Ventura and the Pacific Ocean. This property is also known as our Teague McKevett Ranch. We believe East Area I is an ideal location for a master planned community of commercial and residential properties designed to satisfy expected demand in a region that we believe will have few other developments in this coming decade. In 2008, after we completed a process of community planning and environmental review, the citizens of Santa Paula voted to approve the annexation of East Area I into Santa Paula. This vote was a requirement of the Save Open-Space and Agricultural Resources (“SOAR”), ordinance that mandates a public vote of the City of Santa Paula for land use conversion.
On November 10, 2015, we entered into the Joint Venture with Lewis for the residential development of our East Area I real estate development project. To consummate the transaction, we formed Limoneira Lewis Community Builders, LLC as the development entity, contributed our East Area I property to the Joint Venture and sold a 50% interest in the Joint Venture to Lewis for $20.0 million, comprised of a $2.0 million deposit received in September 2015 and $18.0 million received on November 10, 2015. We
10
expect to receive $100.0 million from the Joint Venture over the estimated 7 to 10-year life of the project. The Joint Venture partners will share in capital contributions to fund project costs until loan proceeds and/or revenues are sufficient to fund the project. These funding requirements are currently estimated to total $15.0 to $20.0 million for each Joint Venture partner in the first three to four years of the project and we funded $3.5 million in fiscal year 2018, $7.5 million in fiscal year 2017 and an additional $4.0 million in the first quarter of fiscal year 2019. We also entered into a lease agreement with the Joint Venture to lease back a portion of the contributed property, which allowed us to continue farming the property during the phased build-out of the project. We terminated this lease in December 2018. The first phase of the project broke ground to commence mass grading on November 8, 2017 and Phase 1 site improvements have begun. Project plans include approximately 632 residential units in Phase 1. The Joint Venture has received lot deposits from national homebuilders and initial closings of lot sales are anticipated to begin in the first quarter of calendar year 2019.
East Area II - Santa Paula, California.
We and our design associates are in the process of formulating plans for East Area II, a parcel of approximately 30 acres adjacent to East Area I, also a part of our Teague McKevett Ranch, that we believe is suited to commercial and/or industrial development along the south side of California Highway 126, a heavily traveled corridor that connects Highway 101 at Ventura on the west with Interstate 5 at Santa Clarita on the east. When completed, we expect that the development will contribute to the economic vitality of the region and allow residents to work and shop within close proximity to their homes.
The successful development of East Area II will be partly dependent on the success of East Area I described above. We expect that East Area II could accommodate large retailers, a medium or large employer, a complex of mixed business and retail, or some combination of the foregoing. We are actively cultivating prospects to become future tenants in East Area II and expect that development will closely follow the build-out of East Area I.
Santa Maria - Santa Barbara County, California.
As of
October 31, 2018
, we were invested in two entitled development parcels in Santa Barbara County, California, a county that, in our experience, entitles very few parcels. Located in Santa Maria, each of these parcels offers a residential and/or commercial development opportunity. A brief description of each parcel follows:
|
•
|
Pacific Crest is an approximately 8-acre parcel approved for 112 attached-housing units. In October 2018, we began negotiations to sell our Pacific Crest property.
|
|
•
|
Sevilla is approved for 69 single-family homes adjacent to shopping, transportation, schools, parks and medical facilities, with a parcel of approximately 3 acres zoned for commercial use. We sold the commercial portion of our Sevilla property in November 2017. In October 2018, we began negotiations to sell the residential portion of Sevilla.
|
Competitive Strengths
Agribusiness Division
With agricultural operations dating back to 1893, we are one of California’s oldest citrus growers and one of the largest growers of lemons and avocados in the United States. Consequently, we have developed significant experience with a variety of crops, mainly lemons, avocados and oranges. The following is a brief list of what we believe are our significant competitive strengths with respect to our agribusiness division, which includes our fresh lemons, lemon packing, avocados and other agribusiness segments unless otherwise noted:
|
•
|
Our agricultural properties in Ventura County are located near the Pacific Ocean, which provides an ideal environment for growing lemons, avocados and row crops. Our agricultural properties in Tulare County, which is in the San Joaquin Valley in Central California, and in Yuma, Arizona, are also located in areas that are well-suited for growing citrus crops.
|
|
•
|
Historically, a higher percentage of our crops go to the fresh market, which is commonly referred to as fresh utilization, than that of other growers and packers with which we compete.
|
|
•
|
We have contiguous and nearby land resources that permit us to efficiently use our agricultural land and resources.
|
|
•
|
In all but one of our properties, we are not dependent on State or Federal water projects to support our agribusiness or real estate development operations.
|
|
•
|
We own approximately 95% of our agricultural land and take a long view on our fruit production practices.
|
|
•
|
A significant amount of our agribusiness property was acquired many years ago, which results in a low-cost basis and associated expenses.
|
|
•
|
We have a well-trained and retentive labor force with many employees remaining with us for more than 30 years.
|
11
|
•
|
In our fresh lemons and lemon packing segments, our integrated business model with respect to growing, packing, marketing and selling lemons allows us to better serve our customers.
|
|
•
|
Our lemon packing operations provide marketing opportunities with other citrus companies and their respective products.
|
|
•
|
Since 2010, we have achieved and maintained GLOBALGAP Certification by successfully demonstrating our adherence to specific GLOBALGAP standards. GLOBALGAP is an internationally recognized set of farm standards dedicated to “Good Agricultural Practices” or GAP. We believe that GLOBALGAP Certification differentiates us from our competitors and serves as reassurance to consumers and retailers that food reaches acceptable levels of safety and quality, and has been produced sustainably, respecting the health, safety and welfare of workers and the environment, and in consideration of animal welfare issues.
|
|
•
|
We have made investments in ground-based solar projects that provide us with tangible and intangible non-revenue generating benefits. The electricity generated by these investments provides us with a significant portion of the electricity required to operate our packinghouse and cold storage facilities located in Santa Paula, California and provides a significant portion of the electricity required to operate four deep-water well pumps at one of our ranches in Tulare County, California. Additionally, these investments support our sustainable agricultural practices, reduce our dependence on fossil-based electricity generation and lower our carbon footprint. Moreover, electricity that we generate and do not use is conveyed seamlessly back to the investor-owned utilities operating in these two markets. Finally, over time, we expect that our customers and the end consumers of our fruit will value the investments that we have made in renewable energy as a part of our farming and packing operations, which we believe may help us differentiate our products from similar commodities.
|
|
•
|
We have made various other investments in water rights and mutual water companies. We own shares in the following mutual water companies: Farmers Irrigation Co., Canyon Irrigation Co., San Cayetano Mutual Water Co., Middle Road Mutual Water Co. and Pioneer Water Company, Inc. In 2007, we acquired additional water rights in the adjudicated Santa Paula Basin (aquifer) and in September 2013 we acquired water rights in the YMIDD with our acquisition of Associated Citrus Packers, Inc. (“Associated”). In February 2017, we acquired water rights with our purchase of 90% of PDA and in July 2018, we acquired additional water rights in Chile with our acquisition of San Pablo.
|
Rental Operations Division
With respect to our rental operations division, we believe our competitive advantages are as follows:
|
•
|
Our housing and land rentals provide a consistent, dependable source of cash flow that helps to counter the volatility typically associated with an agricultural business.
|
|
•
|
Our housing rental business allows us to offer a unique benefit to our employees, which in turn helps to provide us with a dependable, long-term employee base.
|
|
•
|
Our leased land business allows us to partner with other agricultural producers that can serve as a profitable alternative to under-producing tree crop acreage.
|
|
•
|
Our organic recycling tenant provides us with a low cost, environmentally friendly solution to weed and erosion control.
|
Real Estate Development Division
With respect to our real estate development division, we believe our competitive advantages are as follows:
|
•
|
Our real estate development activities are primarily focused in coastal areas north of Los Angeles and south of Santa Maria, which we believe have desirable climates for lifestyle families, retirees and athletic and sports enthusiasts.
|
|
•
|
We have entitlements to build approximately 1,500 residential units in our East Area I (Harvest at Limoneira) development.
|
|
•
|
We have partnered with an experienced and financially strong land developer for our East Area I residential master plan development.
|
|
•
|
Several of our agricultural and real estate investment properties are unique and carry longer-term development potential.
|
|
•
|
Our East Area II property has approximately 30 acres of land commercially zoned, which is adjacent to our East Area I property.
|
12
Business Strategy
While each of our business divisions has a separate business strategy, we are an agribusiness and real estate development company that generates annual cash flows to support investments in agricultural and real estate development activities. As our agricultural and real estate development investments are monetized, we intend to seek to expand our agribusiness into new regions and markets and invest in cash-producing residential, commercial and industrial rental assets.
The following describes the key elements of our business strategy for each of our agribusiness, rental operations and real estate development business divisions.
Agribusiness Division
With respect to our agribusiness division, key elements of our strategy are:
|
•
|
Acquire Additional Lemon Producing Properties
. To the extent attractive opportunities arise and our capital availability permits, we intend to consider the acquisition of additional lemon producing properties. In order to be considered, such properties would need to have certain characteristics to provide acceptable returns, such as an adequate source of water, a warm micro-climate and well-drained soils. We anticipate that the most attractive opportunities to acquire lemon producing properties will be in South America and in the San Joaquin Valley near our existing operations in Tulare County, California.
|
|
•
|
Expand our Sources of Lemon Supply.
Peak lemon production occurs at different times of the year depending on geographic region. In addition to our lemon production in California and Arizona and lemons we acquire from third-party growers, we have expanded our lemon supply sources to international markets such as Mexico, Chile and Argentina. Increases in lemons procured from third-party growers and international sources improve our ability to provide our customers with fresh lemons throughout the year.
|
|
•
|
Increase the Volume of our Lemon Packing Operations
. We regularly monitor our costs for redundancies and opportunities for cost reductions. In this regard, cost per carton is a function of throughput. We continually seek to acquire additional lemons from third-party growers to pack through our plants. Third-party growers are only added if we determine their fruit is of good quality and can be cost effective for both us and the grower. Of most importance is the overall fresh utilization rate for our fruit, which is directly related to quality.
|
|
•
|
Expand International Production and Marketing of Lemons
. We estimate that we currently have approximately 5% of the fresh lemon market in the United States and a larger share of the United States lemon export market. We intend to explore opportunities to expand our international production and marketing of lemons. We have the ability to supply a wide range of customers and markets and, because we produce high quality lemons, we can export our lemons to international customers, which many of our competitors are unable to supply.
|
|
•
|
Construction of a New Lemon Packinghouse
. Over the years, new machinery and equipment along with upgrades have been added to our nearly 80-year old packinghouse and cold storage facilities. This, along with an aggressive and proactive maintenance program, has allowed us to operate an efficient, competitive lemon packing facility. A project to double the capacity and increase the efficiency of our lemon packing facilities became operational in fiscal year 2016. We expect that this project will ultimately increase fresh lemon processing capacity and has lowered packing costs by reducing labor and handling inputs.
|
|
•
|
Opportunistically Expand our Plantings of Oranges, Specialty Citrus and Other Crops
. Our plantings of oranges, specialty citrus and other crops have been profitable and have been pursued to diversify our product line. Agricultural land that we believe is not suitable for lemons is typically planted with oranges, specialty citrus or other crops. While we intend to expand our orange, specialty citrus and other crops, we expect to do so on an opportunistic basis in locations that we believe offer a record of historical profitability.
|
|
•
|
Opportunistically Expand our Plantings of Avocados
. We may opportunistically expand our plantings of avocados primarily because our profitability and cash flow realized from our avocados frequently offset occasional losses in other crops we grow and help to diversify our fruit production base.
|
|
•
|
Maintain and Grow our Relationship with Calavo
. Our alignment with and ownership stake in Calavo comprises our current marketing strategy for avocados. Calavo has expanded its sourcing into other regions of the world, including
|
13
Mexico, Chile and Peru, which allows it to supply avocados to its retail and food service customers on a year-round basis. California avocados occupy a unique market window in the year-round supply chain and Calavo has experienced a general expansion of volume as consumption has grown. Thus, we intend to continue to have a strong and viable market for our California avocados as well as an equity participation in Calavo’s overall expansion and profitability.
|
•
|
Diversify our Agribusiness Portfolio with the Development of a Vineyard at Windfall Farms.
Our Windfall Farms property has approximately 500 acres suitable for vineyard development. During fiscal years 2014 and 2015, we planted approximately 200 acres of vineyards and an additional 100 acres in fiscal year 2017. We intend to continue to plant vineyards at the property up to the 500 suitable acres. We believe the vineyards are consistent with our agribusiness strategy and provide diversification to our crop production and operating results.
|
Rental Operations Division
With respect to our rental operations division, key elements of our strategy include the following:
|
•
|
Secure Additional Rental and Housing Units
. Our housing, commercial and land rental operations provide us with a consistent, dependable source of cash flow that helps to fund our overall activities. Additionally, we believe our housing rental operation allows us to offer a unique benefit to our employees. We have built and leased 65 out of a total of 71 approved additional units through infill projects on existing sites and groupings of units on new sites within our owned acreage.
|
|
•
|
Opportunistically Lease Land to Third-Party Crop Farmers
. We regularly monitor the profitability of our fruit-producing acreage to ensure acceptable per acre returns. When we determine that leasing the land to third-party row crop farmers would be more profitable than farming the land, we intend to seek third-party row crop tenants.
|
|
•
|
Opportunistically Expand our Income-Producing Commercial and Industrial Rental Assets
. We intend to redeploy our future financial gains to acquire additional income-producing real estate investments and agricultural properties.
|
Real Estate Development Division
With respect to our real estate development division, key elements of our strategy include:
|
•
|
Selectively and Responsibly Develop our Agricultural Land
. We recognize that long-term strategies are required for successful real estate development activities. We thus intend to maintain our position as a responsible agricultural landowner and major employer in Ventura County while focusing our real estate development activities on those agricultural land parcels that we believe offer the best opportunities to demonstrate our long-term vision for our community.
|
|
•
|
Opportunistically Increase our Real Estate Holdings
. We intend to redeploy our future financial gains to acquire additional income-producing real estate investments and agricultural properties.
|
Customers
With respect to our fresh lemons and lemon packing segments, we have marketed and sold our lemons directly to our food service, wholesale and retail customers in the United States, Canada, Asia, Australia and certain other international markets since 2010. Previously, Sunkist marketed and sold the majority of our lemons. We sold lemons to approximately 200 U.S. and international customers during fiscal year 2018. In terms of our avocado segment, we sell all of our avocados to Calavo. In our other agribusiness segment, our oranges, specialty citrus and other crops are sold through Sunkist and other packinghouses and our wine grapes are sold to wine producers.
Raw Materials
In our fresh lemons and lemon packing segments, paper is considered to be a material raw product for our business because most of our products are packed in cardboard cartons for shipment. Paper is readily available and we have numerous suppliers for such material.
Information about Geographic Areas
During fiscal year 2018, lemon sales were comprised of 81% domestic sales, 16% sales to domestic exporters and 3% international sales. Additionally, in fiscal year 2018, we had approximately $2.8 million of lemon and orange sales in Chile by PDA and San
14
Pablo. During fiscal year 2017, lemon sales were comprised of 73% domestic sales, 23% sales to domestic exporters and 4% international sales. Additionally, in fiscal year 2017, we had approximately $1.1 million of lemon and orange sales in Chile by PDA. During fiscal year 2016, lemon sales were comprised of 77% domestic sales, 20% sales to domestic exporters and 3% international sales. The majority of our avocados, oranges and specialty citrus and other crops are sold to packinghouses and processors located in the United States. Most of our long-lived assets are located within the United States: however, we have 47% interest in Rosales, a citrus packing, marketing and sales business, a 90% interest in PDA, a lemon and orange orchard and 100% interest in San Pablo, a lemon and orange orchard, all of which are located near La Serena, Chile.
Seasonal Nature of Business
As with any agribusiness enterprise, our agribusiness division operations are predominantly seasonal in nature. The harvest and sale of our lemons, avocados, oranges and specialty citrus and other crops occurs in all quarters, but is generally more concentrated during our third quarter. With respect to our fresh lemons and lemon packing segment, our lemons are generally grown and marketed throughout the year. In terms of our avocado segment, our avocados are sold generally throughout the year with the peak months being February through September. In terms of our other agribusiness segment, our Navel oranges are primarily sold from January through April; our Valencia oranges are primarily sold from June through September; our specialty citrus is sold from November through June and our specialty crops, such as pistachios and wine grapes, are sold in September and/or October.
Competition
The agribusiness division crop markets, including those in which all of our agribusiness segments operate, are intensely competitive, but no single producer has any significant market power over any market segments, as is consistent with the production of most agricultural commodities. Generally, there are a large number of global producers that sell through joint marketing organizations and cooperatives. Fruit is also sold to independent packers, both public and private, who then sell to their own customer base. Customers are typically large retail chains, food service companies, industrial manufacturers and distributors who sell and deliver to smaller customers in local markets throughout the world. In the purest sense, our largest competitors in our agribusiness segments are other citrus and avocado producers in California, Mexico, Chile, Argentina and Florida, a number of which are members of cooperatives such as Sunkist or have selling relationships with Calavo similar to that of Limoneira. We also compete with other fruits and vegetables for the share of consumer expenditures devoted to fresh fruit and vegetables: apples, pears, melons, pineapples and other tropical fruit. In our avocado segment specifically, avocado products compete in the supermarket with hummus products and other dips and salsas. U.S. producers of fruit and tree nuts generate approximately $25 billion in revenue from fruit and tree nuts annually, about 20% of which is exported. For our specific crops, the size of the U.S. market is approximately $375 million for lemons, approximately $350 million for avocados, and approximately $1.5 to $2.0 billion for oranges, both fresh and juice. Competition in the various markets in which our agribusiness division operates is affected by reliability of supply, product quality, brand recognition and perception, price and the ability to satisfy changing customer preferences through innovative product offerings.
The sale and leasing of residential, commercial and industrial real estate is very competitive, with competition coming from numerous and varied sources throughout California. Our greatest direct competition for each of our current real estate development properties in Ventura and Santa Barbara Counties comes from other residential and commercial developments in nearby areas.
Intellectual Property
We have numerous trademarks and brands under which we market and sell our fruits, particularly lemons, domestically and internationally, many of which have been owned for decades. In our fresh lemons and lemon packing segment, the brands of Limoneira lemons which are of importance include: Santa®, Paula®, Bridal Veil®, Fountain®, Golden Bowl® and Level®; these examples of trademarks are owned by us and registered with the United States Patent and Trademark Office. We also acquired certain lemon brands with the acquisitions of Associated, including Kiva® and Kachina®, and Oxnard Lemon.
Employees
At
October 31, 2018
, we had 286 employees, 84 of which were salaried and 202 of which were hourly. None of our employees are subject to a collective bargaining agreement. We believe that our relations with our employees are good.
Research and Development
For our agribusiness division, our research and development programs concentrate on sustaining the productivity of our agricultural lands, product quality and value-added product development. Agricultural research is directed toward sustaining and improving product yields and product quality by examining and improving agricultural practices in all phases of production (such as the
15
development of specifically adapted plant varieties, land preparation, fertilization, pest and disease control, post-harvest handling, packing and shipping procedures), and includes on-site technical services and the implementation and monitoring of recommended agricultural practices. Research efforts are also directed towards integrated pest management. We conduct agricultural research at field facilities throughout our growing areas. We also sponsor research related to environmental improvements and the protection of worker and community health. The aggregate amounts we spent on research and development in each of the last three years have not been material in any such year.
Environmental and Regulatory Matters
Our agribusiness and real estate development divisions are subject to a broad range of evolving federal, state and local environmental laws and regulations. For example, the growing, packing, storing and distributing of our products is extensively regulated by various federal and state agencies. The California State Department of Food and Agriculture oversees our packing and processing of lemons and conducts tests for fruit quality and packaging standards. We are also subject to laws and regulations which govern the use of pesticides and other potentially hazardous substances and the treatment, handling, storage and disposal of materials and waste and the remediation of contaminated properties. Advertising of our products is subject to regulation by the Federal Trade Commission and our operations are subject to certain health and safety regulations, including those issued under the Occupational Safety and Health Act.
We seek to comply at all times with all such laws and regulations and to obtain any necessary permits and licenses, and we are not aware of any instances of material non-compliance. We believe our facilities and practices are sufficient to maintain compliance with applicable governmental laws, regulations, permits and licenses. Nevertheless, there is no guarantee that we will be able to comply with any future laws and regulations for necessary permits and licenses. Our failure to comply with applicable laws and regulations or obtain any necessary permits and licenses could subject us to civil remedies including fines, injunctions, recalls or seizures, as well as potential criminal sanctions. These remedies can increase costs, decrease revenues and lead to additional charges to earnings, which may have a material adverse effect on our business, results of operations and financial condition.
Item 1A. Risk Factors
Investing in our common stock involves a high degree of risk. There are numerous and varied risks, known and unknown, that may prevent us from achieving our goals. The risks described below are not the only ones we will face. If any of the following risks or other risks actually occurs, our business, financial condition, results of operations or future prospects could be materially and adversely affected. In such event, the trading price of our common stock could decline and investors in our common stock could lose all or part of their investment.
Risks Related to Our Agribusiness Division
Adverse weather conditions, natural disasters, including earthquakes and wildfires, and other natural conditions, including the effects of climate change, could impose significant costs and losses on our business.
Fresh produce is vulnerable to adverse weather conditions, including windstorms, floods, drought and temperature extremes, which are quite common and may occur with higher frequency or be less predictable in the future due to the effects of climate change. Unfavorable growing conditions can reduce both crop size and crop quality. In extreme cases, entire harvests may be lost in some geographic areas.
All of our crops are subject to damage from frosts and freezes, and this has happened periodically in the recent past. In some cases, the fruit is damaged or ruined; in the case of extended periods of cold, the trees can also be damaged or killed.
Additionally, a significant portion of our agricultural plantings and our corporate headquarters are located in a region of California that is prone to natural disasters such as earthquakes and wildfires. For example, in December 2017, high winds and the related Southern California wildfires caused a brief power outage at our Santa Paula, California packinghouse and destroyed 14 of our 260 farm worker housing units. While our orchards did not suffer significant damage in the wildfire, the potential for significant damage to a substantial amount of our plantings from a natural disaster in the future continues to exist. Furthermore, if a natural disaster or other event occurs that prevents us from using all or a significant portion of our corporate headquarters, as a result of a power outage or otherwise, or that damages critical infrastructure, it may be difficult or, in certain cases, impossible for us to continue our business for a substantial amount of time.
For the foregoing reasons, adverse weather conditions, natural disasters, including earthquakes and wildfires, or other natural conditions, including the effects of climate change, could severely disrupt our operations, and have a material adverse effect on our business, results of operations, financial condition and prospects.
16
Our agricultural plantings are potentially subject to damage from disease and pests, which could impose losses on our business and the prevention of which could impose significant additional costs on us.
Fresh produce is also vulnerable to crop disease and to pests, e.g., Mediterranean Fruit Fly and the Asian Citrus Psyllid (“ACP”), which may vary in severity and effect, depending on the stage of production at the time of infection or infestation, the type of treatment applied and climatic conditions.
One such pest is ACP, an aphid–like insect that is a serious pest to all citrus plants because it can transmit the disease, Huanglongbing (“HLB”), when it feeds on the plants’ leaves and trees. By itself, ACP causes only minor cosmetic damage to citrus trees. HLB, however, is considered to be one of the most devastating diseases of citrus in the world. Trees infected with HLB decline in health, produce inedible fruit and eventually die, usually in 3 to 5 years after becoming infected. Currently, there is no cure for the disease and infected trees must be removed and destroyed to prevent further spreading.
ACP is a federal action quarantine pest subject to interstate and international quarantine restrictions by the United States Department of Agriculture (“USDA”), including a prohibition on the movement of nursery stock out of quarantine areas and a requirement that all citrus fruit be cleaned of leaves and stems prior to movement out of the quarantine area. ACP and HLB exist domestically in Florida, Louisiana, Georgia, South Carolina and Texas and internationally in countries such as Mexico. ACP exists in California, including in our orchards. To date, HLB has also been detected in Los Angeles, Orange, Riverside and San Bernardino Counties in California. There can be no assurance that HLB will not be further detected in the future. Due to the discovery of ACP in our orchards, we have experienced costs related to the quarantine and treatment of ACP and incurred approximately $1.1 million of costs in fiscal year 2018 related to pest control efforts targeted against ACP.
There are a number of registered insecticides known to be effective against ACP. However, certain markets and customer responses to the discovery of ACP and the related quarantine could result in a significant decline in revenue due to restrictions on where our lemons can be sold and lower demand for our lemons. Additional government regulations and other quarantine requirements or customer handling and inspection requirements could increase agribusiness costs to us. Our citrus orchards could be at risk if ACP starts to transmit the HLB disease to our trees. Agribusiness costs could also increase significantly as a result of HLB. For example, a recent study in Florida indicated the presence of HLB has increased citrus production costs by as much as 40%.
The costs to control these diseases and other infestations vary depending on the severity of the damage and the extent of the plantings affected. Moreover, there can be no assurance that available technologies to control such infestations will continue to be effective. These infestations can increase costs, decrease revenues and lead to additional charges to earnings, which may have a material adverse effect on our business, results of operations and financial condition.
Our business is highly competitive and we cannot assure you that we will maintain our current market share.
Many companies compete in our different businesses. However, only a few well-established companies operate on an international, national and regional basis with one or several product lines. We face strong competition from these and other companies in all our product lines.
Important factors with respect to our competitors include the following:
|
•
|
Some of our competitors may have greater operating flexibility and, in certain cases, this may permit them to respond better or more quickly to changes in the industry or to introduce new products and packaging more quickly and with greater marketing support.
|
|
•
|
We cannot predict the pricing or promotional actions of our competitors or whether those actions will have a negative effect on us.
|
There can be no assurance that we will continue to compete effectively with our present and future competitors, and our ability to compete could be materially adversely affected by our debt levels and debt service requirements.
Our strategy of marketing and selling our lemons directly to our food service, wholesale and retail customers may not continue to be successful.
Directly obtaining and retaining customers, particularly chain stores and other large customers, is highly competitive, and the prices or other terms of our sales arrangements may not be sufficient to retain existing business, maintain current levels of profitability or obtain new business. Industry consolidation (horizontally and vertically) and other factors have increased the buying
17
leverage of the major grocery retailers in our markets, which may put further downward pressure on our pricing and volume and could adversely affect our results of operations.
We depend on our relationship with Calavo and their ability to sell our avocados. Any disruption in this relationship could harm our sales.
We sell 100% of the avocados we grow to Calavo and depend on their willingness and ability to market and sell our avocados to consumers. Calavo sources its avocados from many growers and we cannot control who they will purchase from and how large their orders may be. Should there be any change in our current relationship structure, whereby they buy our entire avocado crop, we would need to find replacement buyers to purchase our remaining crop, which could take time and expense and may result in less favorable terms of sale. Any loss of Calavo as a customer on a whole may cause a material loss in our profits, as it may take time to fill any such void.
Our earnings are sensitive to fluctuations in market supply and prices and demand for our products.
Excess supplies often cause severe price competition in our industry. Growing conditions in various parts of the world, particularly weather conditions such as windstorms, floods, droughts and freezes, as well as diseases and pests, are primary factors affecting market prices because of their influence on the supply and quality of product.
Fresh produce is highly perishable and generally must be brought to market and sold soon after harvest. Some items, such as avocados, oranges and specialty citrus, must be sold more quickly, while other items, such as lemons, can be held in cold storage for longer periods of time. The selling price received for each type of produce depends on all of these factors, including the availability and quality of the produce item in the market and the availability and quality of competing types of produce.
In addition, general public perceptions regarding the quality, safety or health risks associated with particular food products could reduce demand and prices for some of our products. To the extent that consumer preferences evolve away from products that we produce for health or other reasons, and we are unable to modify our products or to develop products that satisfy new consumer preferences, there will be a decreased demand for our products. However, even if market prices are unfavorable, produce items which are ready to be, or have been, harvested must be brought to market promptly. A decrease in the selling price received for our products due to the factors described above could have a material adverse effect on our business, results of operations and financial condition.
Our earnings may be subject to seasonal variability.
Our earnings may be affected by seasonal factors, including:
|
•
|
the seasonality of our supplies and consumer demand;
|
|
•
|
the ability to process products during critical harvest periods; and
|
|
•
|
the timing and effects of ripening and perishability.
|
Our lemons are generally grown and marketed throughout the year. Our Navel oranges are sold generally from January through April and our Valencia oranges are sold generally from June through September. Our avocados are sold generally throughout the year with the peak months being February through September. Our specialty citrus is sold generally from November through June and our pistachios and wine grapes are sold generally in September and October.
Currency exchange fluctuation may impact the results of our operations.
We distribute our products both nationally and internationally. Our international sales are transacted in U.S. dollars. Our results of operations are affected by fluctuations in currency exchange rates in both sourcing and selling locations. In the past, periods of a strong U.S. dollar relative to other currencies have led international customers, particularly in Asia, to find alternative sources of fruit.
Increases in commodity or raw product costs, such as fuel and paper, could adversely affect our operating results.
Many factors may affect the cost and supply of fresh produce, including external conditions, commodity market fluctuations, currency fluctuations, changes in governmental laws and regulations, agricultural programs, severe and prolonged weather conditions and natural disasters. Increased costs for purchased fruit have negatively impacted our operating results in the past, and there can be no assurance that they will not adversely affect our operating results in the future.
18
The price of various commodities can significantly affect our costs. The cost of petroleum-based products is volatile and there can be no assurance that there will not be further increases in such costs in the future. If the price of oil rises, the costs of our herbicides and pesticides can be significantly impacted.
The cost of paper is also significant to us because some of our products are packed in cardboard boxes for shipment. If the price of paper increases and we are not able to effectively pass these price increases along to our customers, then our operating income will decrease. Increased costs for paper have negatively impacted our operating income in the past, and there can be no assurance that these increased costs will not adversely affect our operating results in the future.
Increases in labor, personnel and benefits costs could adversely affect our operating results.
We primarily utilize labor contractors to grow, harvest and deliver our fruit to our lemon packinghouse or outside packing facilities. We utilize a combination of employees and labor contractors to process our lemons in our lemon packing facility. Our employees and contractors are in demand by other agribusinesses and other industries. Shortages of labor could delay our harvesting or lemon processing activities or could result in increases in labor costs.
We and our labor contractors are subject to government mandated wage and benefit laws and regulations. For example, the State of California, where a substantial number of our labor contractors are located, passed regulations which increased minimum wage rates from $11.00 per hour to $12.00 per hour, effective January 1, 2019, and will gradually increase to $15.00 per hour by 2022. The State of Arizona also increased minimum wage rates from $10.50 per hour to $11.00 per hour, effective January 1, 2019, and will gradually increase to $12.00 per hour by 2020. In addition, current or future federal or state healthcare legislation and regulation, including the Affordable Care Act, may increase our medical costs or the medical costs of our labor contractors that could be passed on to us.
Changes in immigration laws could impact the ability of Limoneira to harvest its crops.
We engage third parties to provide personnel for our harvesting operations. The availability and number of such workers is subject to decrease if there are changes in U.S. immigration laws. The states in which we operate are considering or have already adopted new immigration laws or enforcement programs, and the U.S. Congress and the Department of Homeland Security from time to time consider and may implement changes to federal immigration laws, regulations or enforcement programs. Immigration laws have recently been an area of considerable focus by the Department of Homeland Security, with enforcement operations taking place across the country, resulting in arrests and detentions of unauthorized workers. Termination of a significant number of personnel who are found to be unauthorized workers or the scarcity of available personnel to harvest our agricultural products could cause harvesting costs to increase or could lead to the loss of product that is not timely harvested, which could have a material adverse effect to our citrus grove operations, financial position, results of operations and cash flows.
The lack of sufficient water would severely impact our ability to produce crops or develop real estate.
The average rainfall in Ventura, Tulare, San Luis Obispo and San Bernardino Counties in California is substantially below amounts required to grow crops and therefore we are dependent on our rights to pump water from underground aquifers. Extended periods of drought in California may put additional pressure on the use and availability of water for agricultural uses, and in some cases governmental authorities have diverted water to other uses. As California has grown, there are increasing and multiple pressures on the use and distribution of water, which many view as a finite resource. Lack of available potable water can also limit real estate development.
Our water resources include water rights, usage rights and pumping rights to the water in aquifers under, and canals that run through, the land we own. Water for our farming operations is sourced from the existing water resources associated with our land, which includes rights to water in the adjudicated Santa Paula Basin (aquifer) and the un-adjudicated Fillmore and Paso Robles Basins (aquifers). We use ground water and water from local water districts in Tulare County and we use ground water in San Bernardino County. Following our acquisition of Associated, we began using federal project water in Arizona from the Colorado River through the YMIDD.
California has historically experienced periods of below average precipitation. Though recent precipitation has brought relief to California’s drought conditions, the last few years have been among the most severe droughts on record. Rainfall, snow levels and water content of snow pack had previously been significantly below historical averages. These conditions resulted in reduced water levels in streams, rivers, lakes, aquifers and reservoirs. The governor of California declared a drought State of Emergency in February 2014, which was lifted in April 2017. Federal officials oversee the Central Valley Project, California’s largest water
19
delivery system and 100% of the contracted amount of water was provided to San Joaquin Valley farmers in 2018 and 2017 compared to 75% in 2016 and zero in 2015 and 2014.
For fiscal year 2018, irrigation costs for our agricultural operations were $0.5 million higher than fiscal year 2017. Costs may increase as we pump more water than our historical averages and federal, state and local water delivery infrastructure costs may increase to access these limited water supplies. We have an ongoing plan for irrigation improvements in fiscal year 2019 that includes drilling new wells and upgrading existing wells and irrigation systems.
We believe we have access to adequate supplies of water for our agricultural operations as well as our real estate development and rental operations segments of our business and currently do not anticipate that future drought conditions will have a material impact on our operating results. However, if future drought conditions are worse than prior drought conditions or if regulatory responses to such conditions limit our access to water, our business could be negatively impacted by these conditions and responses in terms of access to water and/or cost of water.
The use of herbicides, pesticides and other potentially hazardous substances in our operations may lead to environmental damage and result in increased costs to us.
We use herbicides, pesticides and other potentially hazardous substances in the operation of our business. We may have to pay for the costs or damages associated with the improper application, accidental release or use or misuse of such substances. Our insurance may not be adequate to cover such costs or damages or may not continue to be available at a price or under terms that are satisfactory to us. In such cases, payment of such costs or damages could have a material adverse effect on our business, results of operations and financial condition.
Environmental and other regulation of our business, including potential climate change regulation, could adversely impact us by increasing our production cost or restricting our ability to import certain products into the United States.
Our business depends on the use of fertilizers, pesticides and other agricultural products. The use and disposal of these products in some jurisdictions are subject to regulation by various agencies. A decision by a regulatory agency to significantly restrict the use of such products that have traditionally been used in the cultivation of one of our principal products could have an adverse impact on us. Under the Federal Insecticide, Fungicide and Rodenticide Act, the Federal Food, Drug and Cosmetic Act and the Food Quality Protection Act of 1996, the EPA is undertaking a series of regulatory actions relating to the evaluation and use of pesticides in the food industry. Similarly, in the EU, regulation (EC) No. 1107/2009 which became effective on June 14, 2011, fundamentally changed the pesticide approval process from the current risk base to hazard criteria based on the intrinsic properties of the substance. These actions and future actions regarding the availability and use of pesticides could have an adverse effect on us. In addition, if a regulatory agency were to determine that we are not in compliance with a regulation in that agency’s jurisdiction, this could result in substantial penalties and a ban on the sale of part or all of our products in that jurisdiction.
There has been a broad range of proposed and promulgated state, national and international regulation aimed at reducing the effects of climate change. Such regulations apply or could apply in countries where we have interests or could have interests in the future. In the United States, there is a significant possibility that some form of regulation will be enacted at the federal level to address the effects of climate change. Such regulation could take several forms that could result in additional costs in the form of taxes, the restriction of output, investments of capital to maintain compliance with laws and regulations, or required acquisition or trading of emission allowances. Climate change regulation continues to evolve, and while it is not possible to accurately estimate either a timetable for implementation or our future compliance costs relating to implementation, we do not believe that such regulation is reasonably likely to have a material effect in the foreseeable future on our business, results of operations, capital expenditures or financial position.
Global capital and credit market issues affect our liquidity, increase our borrowing costs and may affect the operations of our suppliers and customers.
The global capital and credit markets have experienced increased volatility and disruption over the past several years, making it more difficult for companies to access those markets. We depend in part on stable, liquid and well-functioning capital and credit markets to fund our operations. Although we believe that our operating cash flows and existing credit facilities will permit us to meet our financing needs for the foreseeable future, there can be no assurance that continued or increased volatility and disruption in the capital and credit markets will not impair our liquidity or increase our costs of borrowing. Our business could also be negatively impacted if our suppliers or customers experience disruptions resulting from tighter capital and credit markets or a slowdown in the general economy.
A global economic downturn may have an adverse impact on participants in our industry, which cannot be fully predicted.
20
The full impact of a global economic downturn on customers, vendors and other business partners cannot be anticipated. For example, major customers or vendors may have financial challenges unrelated to us that could result in a decrease in their business with us or, in extreme cases, cause them to file for bankruptcy protection. Similarly, parties to contracts may be forced to breach their obligations under those contracts. Although we exercise prudent oversight of the credit ratings and financial strength of our major business partners and seek to diversify our risk to any single business partner, there can be no assurance that there will not be a bank, insurance company, supplier, customer or other financial partner that is unable to meet its contractual commitments to us. Similarly, stresses and pressures in the industry may result in impacts on our business partners and competitors, which could have wide ranging impacts on the future of the industry.
We are subject to the risk of product contamination and product liability claims.
The sale of food products for human consumption involves the risk of injury to consumers. Such injuries may result from tampering by unauthorized third parties, product contamination or spoilage, including the presence of foreign objects, substances, chemicals, other agents, or residues introduced during the growing, storage, handling or transportation phases. While we are subject to governmental inspection and regulations and believe our facilities comply in all material respects with all applicable laws and regulations, we cannot be sure that consumption of our products will not cause a health-related illness in the future or that we will not be subject to claims or lawsuits relating to such matters. Even if a product liability claim is unsuccessful or is not fully pursued, the negative publicity surrounding any assertion that our products caused illness or injury could adversely affect our reputation with existing and potential customers and our corporate and brand image. Moreover, claims or liabilities of this sort might not be covered by our insurance or by any rights of indemnity or contribution that we may have against others. We maintain product liability insurance however, we cannot be sure that we will not incur claims or liabilities for which we are not insured or that exceed the amount of our insurance coverage.
We are subject to transportation risks.
An extended interruption in our ability to ship our products could have a material adverse effect on our business, financial condition and results of operations. Similarly, any extended disruption in the distribution of our products could have a material adverse effect on our business, financial condition and results of operations. While we believe we are adequately insured and would attempt to transport our products by alternative means if we were to experience an interruption due to strike, natural disasters or otherwise, we cannot be sure that we would be able to do so or be successful in doing so in a timely and cost-effective manner.
Events or rumors relating to LIMONEIRA or our other trademarks and related brands could significantly impact our business.
Consumer and institutional recognition of the LIMONEIRA, Santa®, Paula®, Bridal Veil®, Fountain®, Golden Bowl®, Level®, Kiva® and Kachina® trademarks and related brands and the association of these brands with high quality and safe food products are an integral part of our business. The occurrence of any events or rumors that cause consumers and/or institutions to no longer associate these brands with high quality and safe food products may materially adversely affect the value of our brand names and demand for our products.
We are dependent on key personnel and the loss of one or more of those key personnel may materially and adversely affect our prospects
.
We currently depend heavily on the services of our key management personnel. The loss of any key personnel could materially and adversely affect our results of operations, financial condition, or our ability to pursue land development. Our success will also depend in part on our ability to attract and retain additional qualified management personnel.
Inflation can have a significant adverse effect on our operations.
Inflation can have a major impact on our farming operations. The farming operations are most affected by escalating costs and unpredictable revenues (due to an oversupply of certain crops) and very high irrigation water costs. High fixed water costs related to our farm lands will continue to adversely affect earnings. Prices received for many of our products are dependent upon prevailing market conditions and commodity prices. Therefore, it is difficult for us to accurately predict revenue, just as we cannot pass on cost increases caused by general inflation, except to the extent reflected in market conditions and commodity prices.
System security risks, data protection breaches, cyber-attacks and systems integration issues could disrupt our internal operations or services provided to customers, and any such disruption could reduce our expected revenue, increase our expenses, damage our reputation and adversely affect our stock price.
21
Computer programmers and hackers may be able to penetrate our network security and misappropriate or compromise our confidential information or that of third parties, create system disruptions or cause shutdowns. Computer programmers and hackers also may be able to develop and deploy viruses, worms, and other malicious software programs that attack our products or otherwise exploit any security vulnerabilities of our products. In addition, sophisticated hardware and operating system software and applications that we produce or procure from third parties may contain defects in design or manufacture, including “bugs” and other problems that could unexpectedly interfere with the operation of the system. The costs to us to eliminate or alleviate cyber or other security problems, bugs, viruses, worms, malicious software programs and security vulnerabilities could be significant, and our efforts to address these problems may not be successful and could result in interruptions, delays, cessation of service and loss of existing or potential customers that may impede our sales, packing, distribution or other critical functions.
Portions of our IT infrastructure also may experience interruptions, delays or cessations of service or produce errors in connection with systems integration or migration work that takes place from time to time. We may not be successful in implementing new systems and transitioning data, which could cause business disruptions and be more expensive, time consuming, disruptive and resource-intensive. Such disruptions could adversely impact our ability to fulfill orders and interrupt other processes. Delayed sales, lower margins or lost customers resulting from these disruptions could adversely affect our financial results, stock price and reputation.
Government regulation could increase our costs of production and increase legal and regulatory expenses.
Growing, packaging, storing and distributing food products are activities subject to extensive federal, state and local regulation, as well as foreign regulation. These aspects of our operations are regulated by the U.S. Food and Drug Administration (the “FDA”), the USDA and various state and local public health and agricultural agencies. On January 4, 2011, the FDA Food Safety Modernization Act, which is intended to ensure food safety, was enacted. This Act provides direct recall authority to the FDA and includes a number of other provisions designed to enhance food safety, including increased inspections by the FDA of food facilities. The Federal Perishable Agricultural Commodities Act, which specifies standards for the sale, shipment, inspection and rejection of agricultural products, governs our relationships with our fresh food suppliers with respect to the grading and commercial acceptance of product shipments. Our business is also affected by import and export controls and similar laws and regulations, both in the United States and elsewhere. Issues such as health and safety, which may slow or otherwise restrict imports and exports, could adversely affect our business. In addition, the modification of existing laws or regulations or the introduction of new laws or regulations could require us to make material expenditures or otherwise adversely affect the way that we have historically operated our business.
Our strategy to expand international production and marketing may not be successful and may subject us to risks associated with doing business in corrupt environments.
While we intend to expand our lemon supply sources to international markets and explore opportunities to expand our international production and marketing of lemons, we may not be successful in implementing this strategy. Additionally, in many countries outside of the United States, particularly in those with developing economies, it may be common for others to engage in business practices prohibited by laws and regulations applicable to us, such as the Foreign Corrupt Practices Act or similar local anti-bribery laws. These laws generally prohibit companies and their employees, contractors or agents from making improper payments to government officials for the purpose of obtaining or retaining business. Failure to comply with these laws could subject us to civil and criminal penalties that could materially and adversely affect our financial condition and results of operations.
The acquisition of other businesses could pose risks to our operating income.
We intend to continue to consider acquisition prospects that we think complement our business. While we are not currently a party to any agreement with respect to any acquisitions, we may acquire other businesses in the future. Future acquisitions by us could result in accounting charges, potentially dilutive issuances of equity securities, and increased debt and contingent liabilities, any of which could have a material adverse effect on our business and the market price of our common stock. Acquisitions entail numerous risks, including the integration of the acquired operations, diversion of management’s attention to other business concerns, risks of entering markets in which we have limited prior experience, and potential loss of key employees of acquired organizations. We may be unable to successfully integrate businesses or the personnel of any business that might be acquired in the future, and our failure to do so could have a material adverse effect on our business and on the market price of our common stock.
We depend on our infrastructure to have sufficient capacity to handle our annual lemon production needs.
We have an infrastructure that has sufficient capacity for our lemon production needs, but if we lose machinery or facilities due to natural disasters or mechanical failure, we may not be able to operate at a sufficient capacity to meet our lemon production
22
needs. This could have a material adverse effect on our business, which could impact our results of operations and our financial condition.
Risks Related to Our Indebtedness
We may be unable to generate sufficient cash flow to service our debt obligations.
To service our debt, we require a significant amount of cash. Our ability to generate cash, make scheduled payments or refinance our obligations depends on our successful financial and operating performance. Our financial and operating performance, cash flow and capital resources depend upon prevailing economic conditions and various financial, business and other factors, many of which are beyond our control. These factors include among others:
|
•
|
economic and competitive conditions;
|
|
•
|
changes in laws and regulations;
|
|
•
|
operating difficulties, increased operating costs or pricing pressures we may experience; and
|
|
•
|
delays in implementing any strategic projects.
|
If our cash flow and capital resources are insufficient to fund our debt service obligations, we may be forced to reduce or delay capital expenditures, sell material assets or operations, obtain additional capital or restructure our debt. If we are required to take any actions referred to above, it could have a material adverse effect on our business, financial condition and results of operations. In addition, we cannot assure you that we would be able to take any of these actions on terms acceptable to us, or at all, or that these actions would enable us to continue to satisfy our capital requirements or that these actions would be permitted under the terms of our various debt agreements.
Restrictive covenants in our debt instruments restrict or prohibit our ability to engage in or enter into a variety of transactions, which could adversely restrict our financial and operating flexibility and subject us to other risks.
Our revolving and non-revolving credit and term loan facilities contain various restrictive covenants that limit our ability to take certain actions. In particular, these agreements limit our ability to, among other things:
|
•
|
incur additional indebtedness;
|
|
•
|
make certain investments or acquisitions;
|
|
•
|
create certain liens on our assets;
|
|
•
|
engage in certain types of transactions with affiliates;
|
|
•
|
merge, consolidate or transfer substantially all our assets; and
|
|
•
|
transfer and sell assets.
|
Our revolving and non-revolving credit facility with the Farm Credit West Credit Facility and our Wells Fargo Term Loan contain a financial covenant that requires us to maintain compliance with a specified debt service coverage ratio on an annual basis. At
October 31, 2018
, we were in compliance with such debt service coverage ratio. Our failure to comply with this covenant in the future may result in the declaration of an event of default under our Farm Credit West Credit Facility and Wells Fargo Term Loan.
Any or all of these covenants could have a material adverse effect on our business by limiting our ability to take advantage of financing, merger and acquisition or other corporate opportunities and to fund our operations. Any future debt could also contain financial and other covenants more restrictive than those imposed under our line of credit and term loan facilities. A breach of a covenant or other provision in any credit facility governing our current and future indebtedness could result in a default under that facility and, due to cross-default and cross-acceleration provisions, could result in a default under our other credit facilities. Upon the occurrence of an event of default under any of our credit facilities, the applicable lender(s) could elect to declare all amounts outstanding to be immediately due and payable and, with respect to our revolving credit facility, terminate all commitments to extend further credit. If we were unable to repay those amounts, our lenders could proceed against the collateral granted to them to secure the indebtedness. If the lenders under our current or future indebtedness were to accelerate the payment of the indebtedness, we cannot assure you that our assets or cash flow would be sufficient to repay in full our outstanding indebtedness.
Despite our relatively high current indebtedness levels and the restrictive covenants set forth in agreements governing our indebtedness, we may still incur significant additional indebtedness, including secured indebtedness. Incurring more indebtedness could increase the risks associated with our substantial indebtedness.
23
Subject to the restrictions in our credit facilities, we may incur significant additional indebtedness. If new debt is added to our current debt levels, the related risks that we now face could increase.
Some of our debt is based on variable rates of interest, which could result in higher interest expenses in the event of an increase in the interest rates.
Our Farm Credit West Credit Facility and certain of our term loans that we have with Farm Credit West and its affiliates currently bear interest at variable rates, which will generally change as interest rates change. We bear the risk that the rates we are charged by our lenders will increase faster than the earnings and cash flow of our business, which could reduce profitability, adversely affect our ability to service our debt, cause us to breach covenants contained in our Farm Credit West Credit Facility, or our Farm Credit West Term Loans or our Wells Fargo Term Loan, any of which could materially adversely affect our business, financial condition and results of operations. In addition, while we have entered into interest rate swaps as hedging instruments to fix a substantial portion of the variable component of our indebtedness, such interest rate swaps could also have an adverse impact on the comparative results of our operation if prevailing interest rates remain below fixed rates established in such instruments.
Risks Related to Our Real Estate Development Division
We are involved in a cyclical industry and are affected by changes in general and local economic conditions.
The real estate development industry is cyclical and is significantly affected by changes in general and local economic conditions, including:
|
•
|
employment levels;
|
|
•
|
availability of financing;
|
|
•
|
interest rates;
|
|
•
|
consumer confidence;
|
|
•
|
demand for the developed product, whether residential or industrial;
|
|
•
|
supply of similar product, whether residential or industrial; and
|
|
•
|
local, state and federal government regulation, including eminent domain laws, which may result in taking for less compensation than the owner believes the property is worth.
|
The process of project development and the commitment of financial and other resources occur long before a real estate project comes to market. A real estate project could come to market at a time when the real estate market is depressed. It is also possible in a rural area like ours that no market for the project will develop as projected.
A recession in the global economy, or a downturn in national or regional economic conditions, could adversely impact our real estate development business.
Future economic instability or tightening in the credit markets could lead to another housing market collapse, which could adversely affect our real estate development operations. Our future real estate sales, revenues, financial condition and results of operations could suffer as a result. Our business is especially sensitive to economic conditions in California and Arizona, where our properties are located.
Higher interest rates and lack of available financing can have significant impacts on the real estate industry.
Higher interest rates generally impact the real estate industry by making it harder for buyers to qualify for financing, which can lead to a decrease in the demand for residential, commercial or industrial sites. Any decrease in demand will negatively impact our proposed developments. Since the most recent recession, the U.S. Federal Reserve has taken actions which have resulted in low interest rates prevailing in the marketplace for a historically long period of time. In March, June, September and December 2018, the U.S. Federal Reserve raised its benchmark interest rate by a quarter of a percentage point, respectively. Market interest rates may continue to increase and the increase may materially and negatively affect us. Lack of available credit to finance real estate purchases can also negatively impact demand. Any downturn in the economy or consumer confidence can also be expected to result in reduced housing demand and slower industrial development, which would negatively impact the demand for land we are developing.
We are subject to various land use regulations and require governmental approvals for our developments that could be denied.
24
In planning and developing our land, we are subject to various local, state, and federal statutes, ordinances, rules and regulations concerning zoning, infrastructure design, subdivision of land, and construction. All of our new developments require amending existing general plan and zoning designations, so it is possible that our entitlement applications could be denied. In addition, the zoning that ultimately is approved could include density provisions that would limit the number of homes and other structures that could be built within the boundaries of a particular area, which could adversely impact the financial returns from a given project. In addition, many states, cities and counties (including Ventura County) have in the past approved various “slow growth” or “urban limit line” measures.
If unforeseen regulatory challenges with East Areas I and II occur, we may not be able to develop these projects as planned and the approximately
$107.2 million
investment we have in the projects could be impaired in the future.
Third-party litigation could increase the time and cost of our real estate development efforts.
The land use approval processes we must follow to ultimately develop our projects have become increasingly complex. Moreover, the statutes, regulations and ordinances governing the approval processes provide third parties the opportunity to challenge the proposed plans and approvals. As a result, the prospect of third-party challenges to planned real estate developments provides additional uncertainties in real estate development planning and entitlements. Third-party challenges in the form of litigation would, by their nature, adversely affect the length of time and the cost required to obtain the necessary approvals. In addition, adverse decisions arising from any litigation would increase the costs and length of time to obtain ultimate approval of a project and could adversely affect the design, scope, plans and profitability of a project.
We are subject to environmental regulations and opposition from environmental groups that could cause delays and increase the costs of our real estate development efforts or preclude such development entirely.
Environmental laws that apply to a given site can vary greatly according to the site’s location and condition, the present and former uses of the site, and the presence or absence of sensitive elements like wetlands and endangered species. Environmental laws and conditions may (i) result in delays, (ii) cause us to incur additional costs for compliance, where a significant amount of our developable land is located, mitigation and processing land use applications, or (iii) preclude development in specific areas. In addition, in California, third parties have the ability to file litigation challenging the approval of a project, which they usually do by alleging inadequate disclosure and mitigation of the environmental impacts of the project. While we have worked with representatives of various environmental interests and wildlife agencies to minimize and mitigate the impacts of our planned projects, certain groups opposed to development may oppose our projects vigorously, so litigation challenging their approval could occur. Recent concerns over the impact of development on water availability and global warming increases the breadth of potential obstacles that our developments face.
Our developable land is concentrated entirely in California and Arizona.
All of our developable land is located in California and Arizona, and our business is especially sensitive to the economic conditions within California. Any adverse change in the economic climate of California, Arizona, or our regions of those states, and any adverse change in the political or regulatory climate of California or Arizona, or the counties where our land is located in such states, could adversely affect our real estate development activities. Ultimately, our ability to sell or lease lots may decline as a result of weak economic conditions or restrictive regulations.
If the real estate industry weakens or instability of the mortgage industry and commercial real estate financing exists, it could have an adverse effect on our real estate business.
Our residential housing projects are currently in various stages of planning and entitlement, and therefore they have not been impacted by the downturn in the housing market or the mortgage lending crisis. Recent trends in the housing market have been improving; however, if the residential real estate market weakens or instability of the mortgage industry and commercial real estate financing exists, our residential real estate business could be adversely affected. An excess supply of homes available due to foreclosures or the expectation of deflation in house prices could also have a negative impact on our ability to sell our inventory when it becomes available.
We rely on contractual arrangements with third party advisors to assist us in carrying out our real estate development projects and are subject to risks associated with such arrangements.
We utilize third party contractor and consultant arrangements to assist us in operating our real estate development segment. These contractual arrangements may not be as effective in providing direct control over this business segment. For example, our third-
25
party advisors could fail to take actions required for our real estate development businesses despite its contractual obligation to do so. If the third-party advisors fail to perform under their agreements with us, we may have to rely on legal remedies under the law, which may not be effective. In addition, we cannot assure you that our third-party advisors would always act in our best interests.
If we are unable to complete land development projects within forecasted time and budget expectations, if at all, our financial results may be negatively affected.
We intend to develop land and real estate properties as suitable opportunities arise, taking into consideration the general economic climate. New real estate development projects have a number of risks, including the following:
|
•
|
Construction delays or cost overruns that may increase project costs;
|
|
•
|
Receipt of zoning, occupancy and other required governmental permits and authorizations;
|
|
•
|
Development costs incurred for projects that are not pursued to completion;
|
|
•
|
Earthquakes, hurricanes, floods, fires or other natural disasters that could adversely affect a project;
|
|
•
|
Defects in design or construction that may result in additional costs to remedy or require all or a portion of a property to be closed during the period required to rectify the situation;
|
|
•
|
Our ability to raise capital;
|
|
•
|
The impact of governmental assessments such as park fees or affordable housing requirements;
|
|
•
|
Governmental restrictions on the nature and size of a project or timing of completion; and
|
|
•
|
The potential lack of adequate building/construction capacity for large development projects.
|
If any development project is not completed on time or within budget, our financial results may be negatively affected.
If we are unable to obtain required land use entitlements at reasonable costs, or at all, our operating results would be adversely affected.
The financial performance of our real estate development segment is closely related to our success in obtaining land use entitlements for proposed development projects. Obtaining all of the necessary entitlements to develop a parcel of land is often difficult, costly and may take several years, or more, to complete. In some situations, we may be unable to obtain the necessary entitlements to proceed with a real estate development or may be required to alter our plans for the development. Delays or failures to obtain these entitlements may have a material adverse effect on our financial results.
We could experience a reduction in revenues or reduced cash flows if we are unable to obtain reasonably priced financing to support our real estate development projects and land development activities.
The real estate development industry is capital intensive, and development requires significant up-front expenditures to develop land and begin real estate construction. Accordingly, we have and may continue to incur substantial indebtedness to finance our real estate development and land development activities. Although we believe that internally generated funds and current and available borrowing capacity will be sufficient to fund our capital and other expenditures, including additional land acquisition, development and construction activities, and the amounts available from such sources may not be adequate to meet our needs. If such sources were insufficient, we would seek additional capital in the form of debt from a variety of potential sources, including bank financing. The availability of borrowed funds to be used for additional land acquisition, development and construction may be greatly reduced, and the lending community may require increased amounts of equity to be invested in a project by borrowers in connection with new loans. The failure to obtain sufficient capital to fund our planned expenditures could have a material adverse effect on our business and operations and our results of operations in future periods.
We may encounter risks associated with the real estate joint venture we entered into on November 10, 2015 with the Lewis Group of Companies including:
|
•
|
the joint venture may not perform financially or operationally as expected;
|
|
•
|
land values, project costs, sales absorption or other assumptions included in the development plans may cause the joint venture’s operating results to be less than expected;
|
|
•
|
the joint venture may not be able to obtain project loans on acceptable terms;
|
26
|
•
|
the joint venture partners may not be able to provide capital to the joint venture in the event external financing or project cash flows are not sufficient to finance the joint venture’s operations;
|
|
•
|
the joint venture partners may not manage the project properly; and
|
|
•
|
disagreements could occur between the joint venture partners that could affect the operating results of the joint venture or could result in a sale of a partner’s interest or the joint venture at undesirable values.
|
We may encounter other risks that could impact our ability to develop our land.
We may also encounter other difficulties in developing our land, including:
|
•
|
natural risks, such as geological and soil problems, earthquakes, fire, heavy rains and flooding and heavy winds;
|
|
•
|
shortages of qualified trades people;
|
|
•
|
reliance on local contractors, who may be inadequately capitalized;
|
|
•
|
shortages of materials; and
|
|
•
|
increases in the cost of certain materials.
|
Risks Related to Our Common Stock
The value of our common stock could be volatile.
The overall market and the price of our common stock may fluctuate greatly and we cannot assure you that you will be able to resell shares at or above market price. The trading price of our common stock may be significantly affected by various factors, including:
|
•
|
quarterly fluctuations in our operating results;
|
|
•
|
changes in investors’ and analysts’ perception of the business risks and conditions of our business;
|
|
•
|
our ability to meet the earnings estimates and other performance expectations of financial analysts or investors;
|
|
•
|
unfavorable commentary or downgrades of our stock by equity research analysts;
|
|
•
|
fluctuations in the stock prices of our peer companies or in stock markets in general; and
|
|
•
|
general economic or political conditions.
|
Concentrated ownership of our common stock creates a risk of sudden change in our share price.
As of
October 31, 2018
, directors and members of our executive management team beneficially owned or controlled approximately
3.9%
of our common stock. Investors who purchase our common stock may be subject to certain risks due to the concentrated ownership of our common stock. The sale by any of our large stockholders of a significant portion of that stockholder’s holdings could have a material adverse effect on the market price of our common stock. In addition, the registration of any significant amount of additional shares of our common stock will have the immediate effect of increasing the public float of our common stock and any such increase may cause the market price of our common stock to decline or fluctuate significantly.
Our charter documents contain provisions that may delay, defer or prevent a change of control.
Provisions of our certificate of incorporation and bylaws could make it more difficult for a third party to acquire control of us, even if the change in control would be beneficial to stockholders. These provisions include the following:
|
•
|
division of our board of directors into three classes, with each class serving a staggered three-year term;
|
|
•
|
removal of directors by stockholders by a supermajority of two-thirds of the outstanding shares;
|
|
•
|
ability of the board of directors to authorize the issuance of preferred stock in series without stockholder approval; and
|
|
•
|
prohibitions on our stockholders that prevent them from acting by written consent and limitations on calling special meetings.
|
We incur increased costs as a result of being a publicly traded company.
27
As a Company with publicly traded securities, we have incurred, and will continue to incur, significant legal, accounting and other expenses not historically incurred. In addition, the Sarbanes-Oxley Act of 2002, as well as rules promulgated by the SEC and NASDAQ, require us to adopt corporate governance practices applicable to U.S. public companies. These rules and regulations may increase our legal and financial compliance costs, which could adversely affect the trading price of our common stock.
Item 1B. Unresolved Staff Comments
None.
Item 2. Properties
Real Estate
We own our corporate headquarters in Santa Paula, California. We own approximately
8,700
acres of farm land in California, with approximately
4,100
acres located in Ventura County, approximately
3,900
acres located in Tulare County in the San Joaquin Valley and approximately
700
acres in San Luis Obispo County. Additionally, we own approximately
1,300
acres located in Yuma, Arizona and
3,500
acres in La Serena, Chile. We lease approximately
30
acres of land located in Ventura County, approximately
80
acres in Tulare County and approximately
800
acres in San Bernardino County. We also have an interest in a partnership that owns approximately
200
acres of land in Ventura County. The land used for agricultural plantings consists of approximately
5,000
acres of lemons, approximately
900
acres of avocados, approximately
1,600
acres of oranges and approximately
1,000
acres of specialty citrus and other crops. Our agribusiness land holdings are summarized below as of
October 31, 2018
(in thousands, except per acre amounts):
|
Ranch Name
|
Acres
|
Book Value
|
Acquisition Date
|
Book Value
per Acre
|
|||||||||
|
Limoneira/Olivelands Ranch
|
1,700
|
|
$
|
767
|
|
1907, 1913, 1920
|
$
|
451
|
|
||||
|
La Campana Ranch
|
300
|
|
758
|
|
1964
|
$
|
2,527
|
|
|||||
|
Orchard Farm Ranch
|
1,100
|
|
3,240
|
|
1990
|
$
|
2,945
|
|
|||||
|
Teague McKevett Ranch
|
500
|
|
8,253
|
|
1994
|
$
|
16,506
|
|
|||||
|
Rancho La Cuesta Ranch
|
200
|
|
2,899
|
|
1994
|
$
|
14,495
|
|
|||||
|
Porterville Ranch
|
700
|
|
6,427
|
|
1997
|
$
|
9,181
|
|
|||||
|
Ducor Ranch
|
900
|
|
6,064
|
|
1997
|
$
|
6,738
|
|
|||||
|
Jencks Ranch
|
100
|
|
846
|
|
2007
|
$
|
8,460
|
|
|||||
|
Windfall Farms
|
700
|
|
16,162
|
|
2009
|
$
|
23,089
|
|
|||||
|
Stage Coach Ranch
|
100
|
|
603
|
|
2012
|
$
|
6,030
|
|
|||||
|
Martinez Ranch
|
200
|
|
1,363
|
|
2012
|
$
|
6,815
|
|
|||||
|
Associated Citrus Packers
|
1,300
|
|
15,035
|
|
2013
|
$
|
11,565
|
|
|||||
|
Lemons 400
|
800
|
|
5,180
|
|
2013
|
$
|
6,475
|
|
|||||
|
Sheldon Ranches
|
900
|
|
14,110
|
|
2016
|
$
|
15,678
|
|
|||||
|
Pan de Azucar
|
200
|
|
2,421
|
|
2017
|
$
|
12,105
|
|
|||||
|
San Pablo
|
3,300
|
|
8,208
|
|
2018
|
$
|
2,487
|
|
|||||
|
Other agribusiness land
|
400
|
|
1,296
|
|
various
|
$
|
3,240
|
|
|||||
|
|
13,400
|
|
$
|
93,632
|
|
|
|
|
|||||
The book value of our agribusiness land holdings of
$93.6 million
differs from the land balance of
$93.2 million
included in property plant and equipment in the notes to the consolidated financial statements in Item 8 of this Form 10-K. The table above presents our current land holdings in agribusiness operations and, therefore, excludes Oxnard Lemon land, rental and real estate development land and includes the Teague McKevett Ranch, which is classified as real estate development in the consolidated financial statements because of its planned development as East Areas I and II.
We own our packing facilities located in Santa Paula and Oxnard, California and Yuma, Arizona, where we process and pack our lemons as well as lemons for other growers. We commissioned a new $29.0 million lemon packing facility in the second quarter of 2016 to increase capacity and efficiency of our lemon packing operations. In 2008, we entered into an operating lease agreement and completed the installation of a 5.5 acre, one-megawatt ground-based photovoltaic solar generator, which provides the majority of the power to operate our packing facility. The operating lease agreement terminated and the solar generator was purchased in
28
2018. In 2009, we completed the installation of a one-megawatt solar array also was leased through an operating lease agreement, which provides us with a majority of the electricity required to operate four deep water well pumps at one of our ranches in the San Joaquin Valley. The operating lease agreement terminated and the solar array was purchased in December 2018.
We own approximately
260
residential units in Ventura and Tulare Counties that we lease as part of our rental operations segment to our employees, former employees and outside tenants and we own several commercial office buildings and properties that are leased to various tenants. We have built 65 out of a total approved 71 additional residential rental units in Ventura County, California which we began renting in May 2015.
We own real estate development property in the California counties of Santa Barbara and Ventura. These properties are in various stages of development for up to approximately
1,500
residential units and approximately 811,000 square feet of commercial space.
Water and Mineral Rights
Our water resources include water rights, usage rights and pumping rights to the water in aquifers under, and canals that run through, the land we own. We believe we have adequate supplies of water for our agribusiness segments as well as our rental and real estate development segments of our business and currently do not anticipate that the California drought will have a material impact on our operating results. Water for our farming operations located in Ventura County, California is sourced from the existing water resources associated with our land, which includes approximately 8,600 acre feet of adjudicated water rights in the Santa Paula Basin (aquifer) and the un-adjudicated Fillmore Basin. We use a combination of ground water provided by wells which derive water from the San Joaquin Valley Basin and water from various water districts and irrigation districts in Tulare County, California, which is in the agriculturally productive San Joaquin Valley. We use ground water provided by wells which derive water from the Cadiz Valley Basin at the Cadiz Ranch in San Bernardino County, California. Our Windfall Farms property located in San Luis Obispo County, California obtains water from wells which derive water from the Paso Robles Basin. Our Associated farming operations in Yuma, Arizona source water from the Colorado River through the YMIDD, where we have access to approximately 11,700 acre feet of Class 3 Colorado River water rights. In February 2017, we acquired water rights with our purchase of 90% of PDA. In July 2018, we acquired additional water rights in Chile with our acquisition of San Pablo.
Our rights to extract groundwater from the Santa Paula Basin are governed by the Santa Paula Basin Judgment (the “Judgment”). The Judgment was entered in 1996 by stipulation among the United Water Conservation District, the City of Ventura and various members of the Santa Paula Basin Pumpers Association (the “Association”). The Association is a not-for-profit, mutual benefit corporation, which represents the interests of all overlying landowners with rights to extract groundwater from the Santa Paula Basin and the City of Santa Paula. We are a member of the Association. Membership in the Association is governed by the Association's Bylaws.
The Judgment adjudicated and allocated water rights in the Santa Paula Basin among the Association's members and the City of Ventura. The water rights are established and governed by a seven-year moving average (i.e., production can rise or fall in any particular year so long as the seven-year average is not exceeded). Under California law, the water rights are considered "property." A perpetual right to water, evidenced by the Judgment, can be exchanged for interests in real property under IRS Code Section 1031 and if condemned by a public agency, just compensation must be paid to the rightful owner. Our rights under the Judgment are perpetual and considered very firm and reliable which reflects favorably upon their fair market value.
For ease of administration, the Association is appointed by the Judgment as the trustee of its members’ water rights and is responsible for coordinating and promoting the interests of its members. The Judgment includes provisions for staged reductions in production rights should shortage conditions develop. It also allows the adjudicated water rights to be leased or sold among the parties. The Judgment established a Technical Advisory Committee composed of the United Water Conservation District, the City of Ventura and the Association to assist the Superior Court of the State of California, Ventura County (the “Court”), with the technical aspects of Santa Paula Basin management. Finally, the Judgment reserves continuing jurisdiction to the Court to hear motions for enforcement or modification of the Judgment as necessary.
Our California water resources include approximately 17,000 acre feet of water affiliated with our owned properties, of which approximately 8,600 acre feet are adjudicated. In connection with our September 6, 2013 acquisition of Associated and its property ownership in Yuma, Arizona and its related membership in the YMIDD, we have been allocated approximately 11,700 acre feet of water sourced from the Colorado River. In December 2013, and revised in December 2014 and 2015, Associated entered into an agreement with the YMIDD to participate in a Pilot Fallowing Program in which Associated agreed to forego its water allocation for approximately 300 acres of land in exchange for $750 per acre through December 31, 2016. Additionally, we own shares in five not-for-profit mutual benefit water companies. Our investments in these water companies provide us with the right to receive a proportionate share of water from each of the water companies.
29
We believe water is a natural resource that is critical to economic growth in the western United States and firm, reliable water rights are essential to our sustainable business practices. Consequently, we have long been a private steward and advocate of prudent and efficient water management. We have made substantial investments in securing water and water rights in quantities that are sufficient to support and, we believe will exceed, our long-term business objectives. We strive to follow best management practices for the diversion, conveyance, distribution and use of water. In the future, we intend to continue to provide leadership in the area of, and seek innovation opportunities that promote, increased water use efficiency and the development of new sources of supply for our neighboring communities.
We own oil, gas and mineral rights related to our Ventura County, California properties and in fiscal year 2013 we signed a five-year lease with an oil and gas producer to allow seismic testing on approximately 1,500 acres. In August 2015, the lessee reduced its leased acreage to approximately 30 acres. In 2018, the lease was extended for an additional five years. We will receive a 20% royalty if any oil and gas is extracted.
Item 3. Legal Proceedings
We are from time to time involved in legal proceedings arising in the normal course of business. Other than proceedings incidental to our business, we are not a party to, nor is any of our property the subject of, any material pending legal proceedings, and no such proceedings are, to our knowledge, contemplated by governmental authorities.
Item 4. Mine Safety Disclosures
Not applicable.
30
PART II
Item 5. Market for Registrant’s Common Equity, Related Stockholder Matters and Issuer Purchases of Equity Securities
Market Information
Our common stock is traded on The NASDAQ Stock Market, LLC (“NASDAQ”) under the symbol “LMNR.” There is no assurance that our common stock will continue to be traded on NASDAQ or that any liquidity will exist for our stockholders.
Market Price
The following table shows the high and low per share price quotations of our common stock for the two most recently completed fiscal years as reported on NASDAQ.
|
|
High
|
Low
|
|||||
|
2018
|
|
|
|
|
|||
|
Fourth Quarter Ended October 31, 2018
|
$
|
33.26
|
|
$
|
24.34
|
|
|
|
Third Quarter Ended July 31, 2018
|
$
|
27.26
|
|
$
|
23.23
|
|
|
|
Second Quarter Ended April 30, 2018
|
$
|
24.19
|
|
$
|
19.64
|
|
|
|
First Quarter Ended January 31, 2018
|
$
|
25.36
|
|
$
|
20.77
|
|
|
|
2017
|
|||||||
|
Fourth Quarter Ended October 31, 2017
|
$
|
23.97
|
|
$
|
20.75
|
|
|
|
Third Quarter Ended July 31, 2017
|
$
|
23.63
|
|
$
|
18.35
|
|
|
|
Second Quarter Ended April 30, 2017
|
$
|
20.99
|
|
$
|
16.91
|
|
|
|
First Quarter Ended January 31, 2017
|
$
|
21.58
|
|
$
|
16.65
|
|
|
Holders
On December 31, 2018, there were approximately 224 registered holders of our common stock. The number of registered holders includes banks and brokers who act as nominees, each of whom may represent more than one stockholder.
Dividends
The following table presents cash dividends per common share declared and paid in the periods shown.
|
|
Dividend
|
||
|
2018
|
|||
|
Fourth Quarter Ended October 31, 2018
|
$
|
0.0625
|
|
|
Third Quarter Ended July 31, 2018
|
$
|
0.0625
|
|
|
Second Quarter Ended April 30, 2018
|
$
|
0.0625
|
|
|
First Quarter Ended January 31, 2018
|
$
|
0.0625
|
|
|
2017
|
|||
|
Fourth Quarter Ended October 31, 2017
|
$
|
0.0550
|
|
|
Third Quarter Ended July 31, 2017
|
$
|
0.0550
|
|
|
Second Quarter Ended April 30, 2017
|
$
|
0.0550
|
|
|
First Quarter Ended January 31, 2017
|
$
|
0.0550
|
|
In December 2018, we increased our quarterly dividend to
$0.075
per common share and we expect to continue to pay quarterly dividends at a similar rate to the extent permitted by the financial results of our business and other factors beyond management’s control.
31
Performance Graph
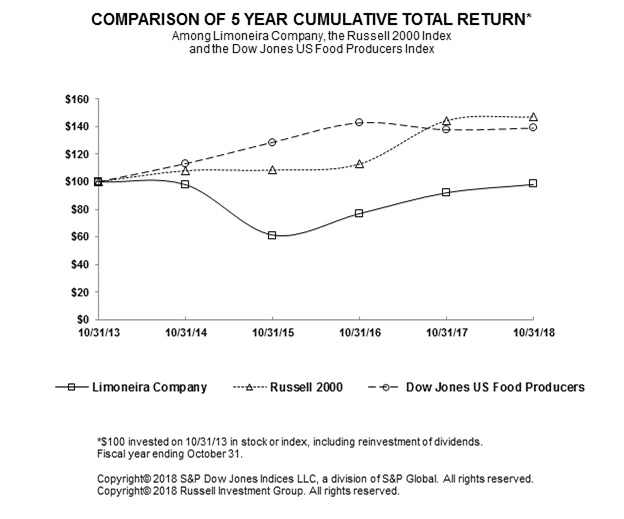
The line graph above compares the percentage change in cumulative total stockholder return of our common stock registered under section 12 of the Securities Exchange Act of 1934, as amended (the “Exchange Act”) with (i) the cumulative total return of the Russell 2000 Index, assuming reinvestment of dividends, and (ii) the cumulative total return of Dow Jones U.S. Food Producers Index, assuming reinvestment of dividends.
Recent Sales of Unregistered Securities
None.
Purchases of Equity Securities by Issuer and Affiliated Purchasers
During the fourth quarter of fiscal year 2018, we purchased shares of our common stock as follows:
|
Period
|
Total Number of Shares Purchased (1)(3)
|
Average Price Paid per Share
|
Total Number of
Shares Purchased as Part of Publicly Announced Plans or Programs(2) |
Maximum Number
(or Approximate Dollar Value) of Shares that May Yet Be Purchased Under the Plans or Programs(2) |
|||||||||
|
August 1, 2018 through August 31, 2018
|
—
|
|
$
|
—
|
|
—
|
|
—
|
|
||||
|
September 1, 2018 through September 30, 2018
|
—
|
|
$
|
—
|
|
—
|
|
—
|
|
||||
|
October 1, 2018 through October 31, 2018
|
22,179
|
|
$
|
11.45
|
|
—
|
|
—
|
|
||||
|
Total
|
22,179
|
|
—
|
|
—
|
|
|||||||
(1) Shares were acquired from our employees in accordance with our stock-based compensation plan as a result of share withholdings to pay income tax
related to the vesting and distribution of a restricted stock award.
(2) We currently have no Company repurchase programs in place.
(3) Includes 15,330 shares repurchased from a retired member of management per the terms of a discontinued stock plan.
32
Item 6. Selected Financial Data
The following selected financial data are derived from our audited consolidated financial statements. The information set forth below should be read in conjunction with "Management's Discussion and Analysis of Financial Condition and Results of Operations,” the financial statements and related notes to consolidated financial statements included elsewhere in this Annual Report (in thousands, except per share amounts).
|
|
Fiscal Years Ended October 31,
|
||||||||||||||||||
|
|
2018
|
2017
|
2016
|
2015
|
2014
|
||||||||||||||
|
Total net revenues
|
$
|
129,392
|
|
$
|
121,309
|
|
$
|
111,789
|
|
$
|
100,311
|
|
$
|
103,462
|
|
||||
|
Operating income
|
$
|
9,486
|
|
$
|
11,863
|
|
$
|
9,188
|
|
$
|
4,583
|
|
$
|
9,893
|
|
||||
|
Net income attributable to Limoneira Company
|
$
|
20,188
|
|
$
|
6,595
|
|
$
|
8,058
|
|
$
|
7,082
|
|
$
|
6,991
|
|
||||
|
Basic net income per common share
|
$
|
1.26
|
|
$
|
0.42
|
|
$
|
0.52
|
|
$
|
0.46
|
|
$
|
0.46
|
|
||||
|
Diluted net income per common share
|
$
|
1.25
|
|
$
|
0.42
|
|
$
|
0.52
|
|
$
|
0.46
|
|
$
|
0.46
|
|
||||
|
Total assets
|
$
|
421,339
|
|
$
|
339,031
|
|
$
|
305,448
|
|
$
|
269,730
|
|
$
|
246,683
|
|
||||
|
Current and long-term debt
|
$
|
80,093
|
|
$
|
105,113
|
|
$
|
90,672
|
|
$
|
89,668
|
|
$
|
68,150
|
|
||||
|
Convertible preferred stock
|
$
|
10,810
|
|
$
|
10,810
|
|
$
|
12,231
|
|
$
|
12,281
|
|
$
|
12,331
|
|
||||
|
Cash dividends declared per share of common stock
|
$
|
0.25
|
|
$
|
0.22
|
|
$
|
0.20
|
|
$
|
0.18
|
|
$
|
0.17
|
|
||||
In June 2018, we completed the sale of 3,136,000 shares of common stock, at a price of $22.00 per share, to institutional and other investors in a registered offering under our shelf registration statement. The gross proceeds of the offering totaled $69.0 million and after an underwriting discount of $4.5 million and other offering expenses of $0.4 million, the net proceeds were $64.1 million. In June and July 2018, we used the offering proceeds to pay down debt, purchase San Pablo ranch for $13.1 million and purchase Oxnard Lemon packinghouse, related land and certain other assets for $25.0 million. We capitalized approximately
$32.7
million of costs related to our East Areas I & II real estate development projects and we contributed
$3.5
million to the Joint Venture for our East Area I real estate development project.
In fiscal year 2017, we completed the acquisition of 90% of the outstanding stock of PDA, a privately-owned Chilean corporation, for $5.7 million in cash. PDA also had approximately $1.7 million in long term debt on the acquisition date, which we assumed in the acquisition. We capitalized approximately $7.9 million of costs related to our East Areas I & II real estate development projects, $5.2 million of costs related to orchard development and $1.9 million of costs related to vineyard development. Additionally, we contributed $7.5 million to the Joint Venture for our East Area I real estate development project.
In fiscal year 2016, we capitalized approximately $3.7 million of costs for the expansion of our lemon packing facility, which became operational in March 2016. We purchased the Sheldon Ranch for approximately $15.1 million and capitalized approximately $6.9 million of costs related to our East Areas I & II real estate development projects. Additionally, we capitalized approximately $5.5 million of costs related to orchard development and $1.0 million of costs related to vineyard development.
In fiscal year 2015, we capitalized approximately $15.6 million of costs for the expansion of our lemon packing facility and capitalized approximately $8.0 million of costs related to our East Areas I & II and Windfall Farms real estate development projects. We capitalized approximately $2.7 million of costs in fiscal year 2015 for our agriculture workforce housing project, which was substantially completed in May 2015. Additionally, in February 2015, we purchased $1.2 million of existing lemon trees and irrigation systems on 200 acres of land we lease from Cadiz.
As further described in notes to consolidated financial statements, during March and April 2014, pursuant to a Series B-2 Stock Purchase Agreement dated March 21, 2014, we issued an aggregate of 9,300 shares of Series B-2, 4% voting preferred stock with a par value of $100 per share (“Series B-2 Preferred Stock”) to WPI-ACP Holdings, LLC (“WPI”), which is affiliated with Water Asset Management, LLC (“WAM”) for total proceeds of $9.3 million.
Certain reclassifications have been made to the Selected Financial Data above to conform to the October 31, 2018 presentation. We reclassified debt issuance costs of $204,000 as of October 31, 2014, from other assets to long-term debt.
33
Item 7. Management’s Discussion and Analysis of Financial Condition and Results of Operations
You should read the following discussion and analysis of our financial condition and results of operations together with “Selected Financial Data” and our consolidated financial statements and notes thereto that appear elsewhere in this Annual Report. This discussion and analysis contains forward-looking statements that involve risks, uncertainties, and assumptions. Actual results may differ materially from those anticipated in these forward-looking statements as a result of various factors, including, but not limited to, those presented under “Risk Factors” included in Item 1A and elsewhere in this Annual Report.
Overview
Limoneira Company was incorporated in Delaware in 1990 as the successor to several businesses with operations in California since 1893. We are an agribusiness and real estate development company founded and based in Santa Paula, California, committed to responsibly using and managing our approximately
14,500
acres of land, water resources and other assets to maximize long-term stockholder value. Our current operations consist of fruit production, sales and marketing, real estate development and capital investment activities.
We are one of California’s oldest citrus growers. According to Sunkist, we are one of the largest growers of lemons in the United States and, according to the California Avocado Commission, one of the largest growers of avocados in the United States. In addition to growing lemons and avocados, we grow oranges and a variety of other specialty citrus and other crops. We have agricultural plantings throughout Ventura, Tulare, San Bernardino and San Luis Obispo Counties in California, Yuma County in Arizona and La Serena, Chile, which collectively consist of approximately
5,000
acres of lemons,
900
acres of avocados,
1,600
acres of oranges and
1,000
acres of specialty citrus and other crops. We also operate our own packinghouses in Santa Paula and Oxnard, California and Yuma, Arizona, where we process and pack lemons that we grow, as well as lemons grown by others. We have a 47% interest in Rosales, a citrus packing, marketing and sales business, a 90% interest in PDA, a lemon and orange orchard and 100% interest in San Pablo, a lemon and orange orchard, all of which are located near La Serena, Chile.
Our water resources include water rights, usage rights and pumping rights to the water in aquifers under, and canals that run through, the land we own. Water for our farming operations is sourced from the existing water resources associated with our land, which includes rights to water in the adjudicated Santa Paula Basin (aquifer) and the un-adjudicated Fillmore and Paso Robles Basins (aquifers). We use ground water from the San Joaquin Valley Basin and water from water districts and irrigation districts in Tulare County, which is in California’s San Joaquin Valley and we use ground water from the Cadiz Valley Basin in San Bernardino County. We also use surface water in Arizona from the Colorado River through the Yuma Mesa Irrigation and Drainage District. We use ground water provided by wells and surface water for our PDA and San Pablo farming operations in Chile.
For more than 100 years, we have been making strategic investments in California agribusiness and real estate development. We currently have three real estate development projects in California. These projects include multi-family housing and single-family homes comprised of approximately 260 completed rental units and another approximately 1,500 units in various stages of planning and development.
We have three business divisions: agribusiness, rental operations and real estate development. Our agribusiness division is comprised of four reportable segments, fresh lemons, lemon packing, avocados and other agribusiness, and currently generates the majority of our revenue from its farming, harvesting and lemon packing and sales operations; our rental operations division generates revenue from our housing, organic recycling and commercial and leased land operations; and our real estate development division primarily generates revenues from the sale of real estate development projects. From a general view, we see our Company as a land and farming company that generates annual cash flows to support its progress into diversified real estate development activities. As real estate developments are monetized, our agriculture business will then be able to expand more rapidly into new regions and markets.
Recent Developments – Refer to Part I, Item 1 “Fiscal Year
2018
Highlights and Recent Developments”
34
Results of Operations
The following table shows the results of operations for ($ in thousands):
|
|
Years Ended October 31,
|
||||||||||||||||
|
|
2018
|
|
2017
|
|
2016
|
|
|||||||||||
|
Net revenues:
|
|
|
|
|
|
|
|
|
|
||||||||
|
Agribusiness
|
$
|
124,344
|
|
96%
|
$
|
115,869
|
|
96%
|
$
|
106,130
|
|
95%
|
|||||
|
Rental operations
|
5,048
|
|
4%
|
5,440
|
|
4%
|
5,603
|
|
5%
|
||||||||
|
Real estate development
|
—
|
|
—
|
—
|
|
—
|
56
|
|
—
|
||||||||
|
Total net revenues
|
129,392
|
|
100%
|
121,309
|
|
100%
|
111,789
|
|
100%
|
||||||||
|
Costs and expenses:
|
|||||||||||||||||
|
Agribusiness
|
98,083
|
|
83%
|
91,162
|
|
83%
|
83,604
|
|
81%
|
||||||||
|
Rental operations
|
4,085
|
|
3%
|
3,932
|
|
4%
|
3,617
|
|
4%
|
||||||||
|
Real estate development
|
127
|
|
—
|
285
|
|
—
|
2,061
|
|
2%
|
||||||||
|
Impairment of real estate development assets
|
1,558
|
|
1%
|
120
|
|
—
|
—
|
|
—
|
||||||||
|
Selling, general and administrative
|
16,053
|
|
13%
|
13,947
|
|
13%
|
13,319
|
|
13%
|
||||||||
|
Total costs and expenses
|
119,906
|
|
100%
|
109,446
|
|
100%
|
102,601
|
|
100%
|
||||||||
|
Operating income:
|
|
|
|
|
|
|
|
|
|
||||||||
|
Agribusiness
|
26,261
|
|
|
24,707
|
|
|
22,526
|
|
|
||||||||
|
Rental operations
|
963
|
|
|
1,508
|
|
|
1,986
|
|
|
||||||||
|
Real estate development
|
(1,685
|
)
|
|
(405
|
)
|
|
(2,005
|
)
|
|
||||||||
|
Selling, general and administrative
|
(16,053
|
)
|
|
(13,947
|
)
|
|
(13,319
|
)
|
|
||||||||
|
Operating income
|
9,486
|
|
|
11,863
|
|
|
9,188
|
|
|
||||||||
|
Other income (expense):
|
|
|
|
||||||||||||||
|
Interest expense, net
|
(1,122
|
)
|
|
(1,778
|
)
|
|
(1,409
|
)
|
|
||||||||
|
Equity in earnings of investments
|
583
|
|
|
49
|
|
|
634
|
|
|
||||||||
|
Gain on sale of stock in Calavo Growers, Inc.
|
4,223
|
|
|
—
|
|
|
3,419
|
|
|
||||||||
|
Gain on sale of conservation easement
|
—
|
|
|
—
|
|
|
995
|
|
|
||||||||
|
Other income, net
|
313
|
|
|
492
|
|
|
498
|
|
|
||||||||
|
Total other income (expense)
|
3,997
|
|
|
(1,237
|
)
|
|
4,137
|
|
|
||||||||
|
Income before income tax benefit (provision)
|
13,483
|
|
|
10,626
|
|
|
13,325
|
|
|
||||||||
|
Income tax benefit (provision)
|
6,729
|
|
|
(4,077
|
)
|
|
(5,267
|
)
|
|
||||||||
|
Net income
|
20,212
|
|
|
6,549
|
|
|
8,058
|
|
|
||||||||
|
(Income) loss attributable to noncontrolling interest
|
(24
|
)
|
|
46
|
|
|
—
|
|
|
||||||||
|
Net income attributable to Limoneira Company
|
$
|
20,188
|
|
|
$
|
6,595
|
|
|
$
|
8,058
|
|
|
|||||
Non-GAAP Financial Measures
Due to significant depreciable assets associated with the nature of our operations and interest costs associated with our capital structure, management believes that earnings before interest, income taxes, depreciation and amortization (“EBITDA”) and adjusted EBITDA, which excludes impairments on real estate development assets when applicable, is an important measure to evaluate our results of operations between periods on a more comparable basis. Such measurements are not prepared in accordance with U.S. generally accepted accounting principles (“GAAP”) and should not be construed as an alternative to reported results determined in accordance with GAAP. The non-GAAP information provided is unique to us and may not be consistent with methodologies used by other companies. EBITDA and adjusted EBITDA are summarized and reconciled to net income attributable to Limoneira Company which management considers to be the most directly comparable financial measure calculated and presented in accordance with GAAP as follows (in thousands):
35
|
|
Years Ended October 31,
|
||||||||||
|
|
2018
|
2017
|
2016
|
||||||||
|
Net income attributable to Limoneira Company
|
$
|
20,188
|
|
$
|
6,595
|
|
$
|
8,058
|
|
||
|
Interest expense, net
|
1,122
|
|
1,778
|
|
1,409
|
|
|||||
|
Income tax (benefit) provision
|
(6,729
|
)
|
4,077
|
|
5,267
|
|
|||||
|
Depreciation and amortization
|
7,275
|
|
6,467
|
|
5,339
|
|
|||||
|
EBITDA
|
21,856
|
|
18,917
|
|
20,073
|
|
|||||
|
Impairments of real estate development assets
|
1,558
|
|
120
|
|
—
|
|
|||||
|
Adjusted EBITDA
|
$
|
23,414
|
|
$
|
19,037
|
|
$
|
20,073
|
|
||
Fiscal Year
2018
Compared to Fiscal Year
2017
Revenues
Total revenue for fiscal year
2018
was
$129.4 million
compared to
$121.3 million
for fiscal year
2017
. The
7%
increase of
$8.1 million
was primarily the result of increased agribusiness revenues, as detailed below ($ in thousands):
|
|
Agribusiness Revenues for the Years Ended October 31,
|
||||||||||||
|
|
2018
|
2017
|
Change
|
||||||||||
|
Lemons
|
$
|
103,830
|
|
$
|
94,199
|
|
$
|
9,631
|
|
10%
|
|||
|
Avocados
|
6,576
|
|
9,522
|
|
(2,946
|
)
|
(31)%
|
||||||
|
Navel and Valencia oranges
|
8,884
|
|
7,099
|
|
1,785
|
|
25%
|
||||||
|
Specialty citrus and other crops
|
5,054
|
|
5,049
|
|
5
|
|
—%
|
||||||
|
Agribusiness revenues
|
$
|
124,344
|
|
$
|
115,869
|
|
$
|
8,475
|
|
7%
|
|||
|
•
|
Lemons: The increase in fiscal year
2018
was primarily the result of higher prices and volume of fresh lemons sold compared to fiscal year
2017
. During fiscal years
2018
and
2017
, fresh lemon sales were $83.9 million and $76.5 million, respectively, on 3.3 million and 3.2 million cartons of fresh lemons sold at average per carton prices of $25.42 and $23.91, respectively. Lemon revenues in fiscal year
2018
include $9.0 million shipping and handling, $4.4 million lemon by-products and $6.5 million other lemon sales. Other lemon sales in fiscal year
2018
include $2.3 million of lemon sales in Chile by PDA and San Pablo and $1.1 million of commissions earned on 0.9 million cartons of brokered fruit sales. Lemon revenues in fiscal year
2017
include $8.8 million shipping and handling, $5.4 million lemon by-products and $3.5 million other lemon sales. Other lemon sales in fiscal year
2017
include $0.8 million of lemon sales in Chile by PDA and $0.3 million of commissions earned on 0.3 million cartons of brokered fruit sales.
|
|
•
|
Avocados: The decrease in fiscal year
2018
was primarily due to lower prices. The California avocado crop typically experiences alternating years of high and low production due to plant physiology. During fiscal years
2018
and
2017
, 6.3 million pounds of avocados were sold each year at average per pound prices of $1.04 and $1.51, respectively. Lower prices in fiscal year
2018
are the result of higher supply of imported fruit in the marketplace.
|
|
•
|
Navel and Valencia oranges: The increase in fiscal year
2018
was primarily due to higher prices for oranges sold partially offset by lower volume. During fiscal years
2018
and
2017
, orange sales were
$8.9 million
and
$7.1 million
, respectively, on 712,000 and 893,000 40-pound carton equivalents of oranges sold at average per carton prices of $12.48 and $7.95, respectively. Orange revenues in fiscal year
2018
and
2017
include $0.5 million and $0.3 million, respectively, of orange sales in Chile.
|
|
•
|
Specialty citrus and other crops: The slight increase in fiscal year
2018
was primarily the result of higher specialty citrus revenues offset by lower volume of pistachios and wine grapes sold compared to fiscal year
2017
. In fiscal year
2018
, we sold approximately
600
tons of wine grapes for
$0.9 million
compared to approximately
800
tons of wine grapes for
$1.2
million in fiscal year
2017
.
|
Rental operations revenue was
$5.0 million
in fiscal year
2018
compared to
$5.4 million
in fiscal year
2017
. The decrease in fiscal year
2018
was primarily due to decreased revenues from land leased to third-party agricultural tenants.
Real estate development revenue was
zero
in both fiscal years
2018
and
2017
.
36
Costs and Expenses
Total costs and expenses for fiscal year
2018
were
$119.9 million
compared to
$109.4 million
for fiscal year
2017
. This
10%
increase of
$10.5 million
was primarily attributable to increases in our agribusiness, real estate development and selling, general and administrative costs and expenses. Costs associated with our agribusiness division include packing costs, harvest costs, growing costs, costs related to the lemons we procure from third-party growers and depreciation expense. These costs are discussed further below ($ in thousands):
|
|
Agribusiness Costs and Expenses for the Years Ended October 31,
|
||||||||||||
|
|
2018
|
2017
|
Change
|
||||||||||
|
Packing costs
|
$
|
23,071
|
|
$
|
23,778
|
|
$
|
(707
|
)
|
(3)%
|
|||
|
Harvest costs
|
13,512
|
|
13,717
|
|
(205
|
)
|
(1)%
|
||||||
|
Growing costs
|
23,523
|
|
21,345
|
|
2,178
|
|
10%
|
||||||
|
Third-party grower costs
|
31,733
|
|
26,833
|
|
4,900
|
|
18%
|
||||||
|
Depreciation
|
6,244
|
|
5,489
|
|
755
|
|
14%
|
||||||
|
Agribusiness costs and expenses
|
$
|
98,083
|
|
$
|
91,162
|
|
$
|
6,921
|
|
8%
|
|||
|
•
|
Packing costs: Packing costs consist of the costs to pack lemons for sale such as labor and benefits, cardboard cartons, fruit treatments, packing and shipping supplies and facility operating costs. Lemon packing costs were
$21.4 million
and
$21.6 million
in fiscal years
2018
and
2017
, respectively. The decrease in fiscal year
2018
was primarily attributable to lower average per carton costs partially offset by higher volume of fresh lemons packed and sold compared to fiscal year
2017
. In fiscal year
2018
, we packed and sold 3.3 million cartons of lemons at average per carton costs of $6.48 compared to 3.2 million cartons of lemons sold at average per carton costs of $6.75 in fiscal year
2017
. Additionally, packing costs include $1.7 million of shipping costs in fiscal year
2018
compared to $1.3 million in fiscal year
2017
. Further, in fiscal year 2017 we incurred $2.2 million of packing service charges from an independent packinghouse to have a portion of our oranges and specialty citrus packed in Limoneira branded cartons.
|
|
•
|
Harvest costs: The decrease in fiscal year
2018
was primarily attributable to decreased volume of Navel oranges and specialty citrus harvested partially offset by increased volume of lemons harvested compared to fiscal year
2017
.
|
|
•
|
Growing costs: Growing costs, also referred to as cultural costs, consist of orchard maintenance costs such as cultivation, fertilization and soil amendments, pest control, pruning and irrigation. The increase in fiscal year
2018
is primarily due to net increased costs of $2.2 million for cultivation, fertilization and soil amendments, and irrigation plus San Pablo growing costs compared to the same period in fiscal year
2017
. These net increases reflect farm management decisions based on weather, harvest timing and crop conditions.
|
|
•
|
Third-party grower costs: We sell lemons that we grow and lemons that we procure from other growers. The cost of procuring lemons from other growers is referred to as third-party grower costs. The increase is primarily due to higher price and volume of third-party grower lemons sold. Of the 3.3 million and 3.2 million cartons sold during fiscal years
2018
and
2017
, respectively, 1.5 million (45%) and 1.4 million (44%) were procured from third-party growers at average per carton prices of $20.89 and $19.02, respectively. Additionally, in fiscal year
2018
we incurred $0.4 million of costs for purchased, packed fruit for resale compared to $0.2 million in fiscal year
2017
.
|
|
•
|
Depreciation expense in fiscal year
2018
was
$0.8 million
higher than fiscal year
2017
primarily due to the acquisitions of San Pablo and Oxnard Lemon and an increase in assets placed into service.
|
Real estate development expenses for fiscal year
2018
were
$1.7 million
compared to
$0.4 million
in fiscal year
2017
. Real estate development costs and expenses in fiscal year
2018
include
$1.6 million
impairment on our Pacific Crest and Sevilla real estate development projects. Real estate development costs and expenses in fiscal year
2017
include $0.1 million impairment on our Pacific Crest real estate development project.
Selling, general and administrative expenses for fiscal year
2018
were
$16.1 million
compared to
$13.9 million
for fiscal year
2017
. This
15%
increase of
$2.1 million
was primarily attributable to the following:
|
•
|
$0.5 million increase in legal, consulting and other administrative expenses primarily associated with our acquisitions in July 2018;
|
37
|
•
|
$0.5 million increase in administrative salaries, benefits and incentive compensation;
|
|
•
|
$0.4 million net increase in lemon selling expenses primarily due to an increase in personnel; and
|
|
•
|
$0.7 million net increase in other selling, general and administrative expenses, including certain corporate overhead expenses.
|
Other (Expense) Income
Other (expense) income, for fiscal year
2018
was
$4.0 million
of income compared to
$1.2 million
of expense for fiscal year
2017
. The
$5.2 million
increase in income is primarily the result of:
|
•
|
$0.7 million
decrease in net interest expense as a result of lower debt levels;
|
|
•
|
$0.5 million
increase in equity in earnings of investments primarily from Limco Del Mar, Ltd. and Rosales; and
|
|
•
|
$4.2 million
gain on the sales of stock in Calavo in fiscal year 2018.
|
Income Taxes
We recorded an income tax benefit of
$6.7 million
for fiscal year
2018
on pre-tax income of
$13.5 million
compared to an income tax provision of
$4.1 million
for fiscal year
2017
on pre-tax income of
$10.6 million
. Our effective tax rate is (
49.9
)% for fiscal year
2018
compared to an effective rate of 38.4% for fiscal year
2017
. The decrease in our effective tax rate in fiscal year
2018
is primarily due to the approximately $10.3 million decrease in deferred tax liabilities related to the change in the federal tax rate from the Tax Cuts and Jobs Act of 2017.
Net Income Attributable to Noncontrolling Interest
Net income attributable to noncontrolling interest represents 10% of the net income of PDA.
Fiscal Year 2017 Compared to Fiscal Year 2016
Revenues
Total revenue for fiscal year 2017 was $121.3 million compared to $111.8 million for fiscal year 2016. The 9% increase of $9.5 million was primarily the result of increased agribusiness revenues, as detailed below ($ in thousands):
|
|
Agribusiness Revenues for the Years Ended October 31,
|
||||||||||||
|
|
2017
|
2016
|
Change
|
||||||||||
|
Lemons
|
$
|
94,199
|
|
$
|
85,267
|
|
$
|
8,932
|
|
10%
|
|||
|
Avocados
|
9,522
|
|
10,767
|
|
(1,245
|
)
|
(12)%
|
||||||
|
Navel and Valencia oranges
|
7,099
|
|
6,143
|
|
956
|
|
16%
|
||||||
|
Specialty citrus and other crops
|
5,049
|
|
3,953
|
|
1,096
|
|
28%
|
||||||
|
Agribusiness revenues
|
$
|
115,869
|
|
$
|
106,130
|
|
$
|
9,739
|
|
9%
|
|||
|
•
|
Lemons: The increase in fiscal year 2017 was primarily the result of increased volume of fresh lemons sold partially offset by lower prices. During fiscal years 2017 and 2016, fresh lemon sales were $76.5 million and $71.7 million, respectively, on 3.2 million and 2.9 million cartons of fresh lemons sold at average per carton prices of $23.91 and $24.72, respectively. The lower average per carton price in fiscal year 2017 compared to fiscal year 2016 was primarily due to less favorable overall market conditions. Lemon revenues in fiscal year 2017 include $8.8 million shipping and handling, $5.4 million lemon by-products and $3.5 million other lemon sales. Other lemon sales in fiscal year 2017 include $0.8 million of lemon sales in Chile by PDA and $0.3 million of commissions earned on 0.3 million cartons of brokered fruit sales. Lemon revenues in fiscal year 2016 include $4.8 million shipping and handling, $5.0 million lemon by-products and $3.8 million other lemon sales. Other lemon sales in fiscal year 2016 include $0.3 million of commissions earned on 0.2 million cartons of brokered fruit sales.
|
|
•
|
Avocados: The decrease in fiscal year 2017 was primarily due to decreased volume partially offset by higher prices. The California avocado crop typically experiences alternating years of high and low production due to plant physiology. During fiscal years 2017 and 2016, 6.3 million and 11.4 million pounds of avocados were sold at average per pound prices of $1.51 and $0.95, respectively. Higher prices in fiscal year 2017 were primarily due to decreased supply in the marketplace.
|
38
|
•
|
Navel and Valencia oranges: The increase in fiscal year 2017 was primarily due to higher prices for oranges sold partially offset by lower volume. During fiscal years 2017 and 2016, orange sales were $7.1 million and $6.1 million, respectively, on 893,000 and 1,049,000 40-pound carton equivalents of oranges sold at average per carton prices of $7.95 and $5.86, respectively. Orange revenues in fiscal year 2017 include $0.3 million of orange sales in Chile by PDA.
|
|
•
|
Specialty citrus and other crops: The increase in fiscal year 2017 was primarily due to higher volume of wine grapes sold compared to fiscal year 2016. In fiscal year 2017, we sold approximately 800 tons of wine grapes for $1.2 million compared to approximately 200 tons of wine grapes for $0.3 million in fiscal year 2016.
|
Rental operations revenue was $5.4 million in fiscal year 2017 compared to $5.6 million in fiscal year 2016. The decrease in fiscal year 2017 was primarily due to decreased revenues from land leased to third-party agricultural tenants.
Real estate development revenue was zero in fiscal year 2017 compared to $0.1 million in fiscal year 2016. Fiscal year 2016 revenue was comprised primarily of incidental alfalfa sales at our Windfall Farms property.
Costs and Expenses
Total costs and expenses for fiscal year 2017 were $109.4 million compared to $102.6 million for fiscal year 2016. This 7% increase of $6.8 million was primarily attributable to increases in our agribusiness costs. Costs associated with our agribusiness division include packing costs, harvest costs, growing costs, costs related to the lemons we procure from third-party growers and depreciation expense. These costs are discussed further below ($ in thousands):
|
|
Agribusiness Costs and Expenses for the Years Ended October 31,
|
||||||||||||
|
|
2017
|
2016
|
Change
|
||||||||||
|
Packing costs
|
$
|
23,778
|
|
$
|
21,939
|
|
$
|
1,839
|
|
8%
|
|||
|
Harvest costs
|
13,717
|
|
13,263
|
|
454
|
|
3%
|
||||||
|
Growing costs
|
21,345
|
|
18,774
|
|
2,571
|
|
14%
|
||||||
|
Third-party grower costs
|
26,833
|
|
25,307
|
|
1,526
|
|
6%
|
||||||
|
Depreciation
|
5,489
|
|
4,321
|
|
1,168
|
|
27%
|
||||||
|
Agribusiness costs and expenses
|
$
|
91,162
|
|
$
|
83,604
|
|
$
|
7,558
|
|
9%
|
|||
|
•
|
Packing costs: Packing costs consist of the costs to pack lemons for sale such as labor and benefits, cardboard cartons, fruit treatments, packing and shipping supplies and facility operating costs. Lemon packing costs were $21.6 million and $21.9 million in fiscal years 2017 and 2016, respectively. The decrease in fiscal year 2017 was primarily attributable to lower average per carton costs partially offset by higher volume of fresh lemons packed and sold compared to fiscal year 2016. In fiscal year 2017, we packed and sold 3.2 million cartons of lemons at average per carton costs of $6.75 compared to 2.9 million cartons of lemons sold at average per carton costs of $7.55 in fiscal year 2016. Lemon packing efficiency has improved primarily as a result of our new facility that became operational in March 2016. Additionally, packing costs include $1.3 million of shipping costs in fiscal year 2017 compared to $1.0 million in fiscal year 2016. Further, in fiscal year 2017 we incurred $2.2 million of packing service charges from an independent packinghouse to have a portion of our oranges and specialty citrus packed in Limoneira branded cartons.
|
|
•
|
Harvest costs: The increase in fiscal year 2017 was primarily attributable to higher lemon and wine grape harvest volumes partially offset by lower avocado harvest volume compared to fiscal year 2016.
|
|
•
|
Growing costs: Growing costs, also referred to as cultural costs, consist of orchard maintenance costs such as cultivation, fertilization and soil amendments, pest control, pruning and irrigation. The increase in fiscal year 2017 is primarily due to the acquisition of PDA in February 2017 and a full year of wine grape production compared to fiscal year 2016.
|
|
•
|
Third-party grower costs: We sell lemons that we grow and lemons that we procure from other growers. The cost of procuring lemons from other growers is referred to as third-party grower costs. The increase is primarily due to higher volume of third-party grower lemons sold, partially offset by lower prices. Of the 3.2 million and 2.9 million cartons sold during fiscal years 2017 and 2016, respectively, 1.4 million (44%) and 1.2 million (42%) were procured from third-party growers at average per carton prices of $19.02 and $20.59, respectively. Additionally, in fiscal year 2017 we incurred $0.2 million of costs for purchased, packed fruit for resale compared to $0.6 million in fiscal year 2016.
|
39
|
•
|
Depreciation expense in fiscal year 2017 was $1.2 million higher than fiscal year 2016 primarily due to the acquisition of PDA in February 2017 and an increase in assets placed into service.
|
Real estate development expenses for fiscal year 2017 were $0.4 million compared to $2.1 million in fiscal year 2016. Real estate development costs and expenses in fiscal year 2017 include $0.1 million impairment on our Pacific Crest real estate development project. Real estate development costs and expenses in fiscal year 2016 include $1.2 million of transaction costs paid upon entering into a Joint Venture with Lewis for the residential development of our East Area I real estate development project.
Selling, general and administrative expenses for fiscal year 2017 were $13.9 million compared to $13.3 million for fiscal year 2016. This 5% increase of $0.6 million was primarily attributable to the following:
|
•
|
$0.3 million increase in lemon selling expenses primarily due to an increase in personnel;
|
|
•
|
$0.3 million net increase in salaries and benefits primarily due to compensation increases;
|
|
•
|
$0.2 million increase in legal and consulting expenses associated with our acquisition of PDA in February 2017; and
|
|
•
|
$0.1 million decrease in incentive compensation primarily due to lower operating results.
|
Other (Expense) Income
Other (expense) income, for fiscal year 2017 was $1.2 million of expense compared to $4.1 million of income for fiscal year 2016. The $5.4 million decrease in income is primarily the result of:
|
•
|
$0.4 million increase in net interest expense;
|
|
•
|
$0.6 million decrease in equity in earnings of investments;
|
|
•
|
$3.4 million gain on the sales of stock in Calavo in fiscal year 2016; and
|
|
•
|
$1.0 million sale of a conservation easement in fiscal year 2016.
|
Income Taxes
We recorded an income tax provision of $4.1 million for fiscal year 2017 on pre-tax income of $10.6 million compared to an income tax provision of $5.3 million for fiscal year 2016 on pre-tax income of $13.3 million. Our effective tax rate is 38.4% for fiscal year 2017 compared to an effective rate of 39.5% for fiscal year 2016. The decrease in our effective tax rate in fiscal year 2017 is primarily attributable to increased Domestic Production Activities Deduction resulting from higher qualified production activities income.
Net Loss Attributable to Noncontrolling Interest
Net loss attributable to noncontrolling interest represents 10% of the net loss of PDA.
Segment Results of Operations
We operate in six reportable operating segments: fresh lemons, lemon packing, avocados, other agribusiness, rental operations and real estate development. Our reportable operating segments are strategic business units with different products and services, distribution processes and customer bases. We evaluate the performance of our operating segments separately to monitor the different factors affecting financial results. Each segment is subject to review and evaluations related to current market conditions, market opportunities and available resources. See Note 25 - Segment Information of the notes to consolidated financial statements included in this Annual Report for additional information regarding our operating segments.
40
Segment information for fiscal year
2018
(in thousands):
|
|
Fresh
Lemons
|
Lemon
Packing
|
Eliminations
|
Avocados
|
Other
Agribusiness
|
Total
Agribusiness
|
Rental
Operations
|
Real Estate
Development
|
Corporate
and Other
|
Total
|
|||||||||||||||||||||||||||||
|
Revenues from external customers
|
$
|
94,840
|
|
$
|
8,990
|
|
$
|
—
|
|
$
|
6,576
|
|
$
|
13,938
|
|
$
|
124,344
|
|
$
|
5,048
|
|
$
|
—
|
|
$
|
—
|
|
$
|
129,392
|
|
|||||||||
|
Intersegment revenue
|
—
|
|
19,971
|
|
(19,971
|
)
|
—
|
|
—
|
|
—
|
|
—
|
|
—
|
|
—
|
|
—
|
|
|||||||||||||||||||
|
Total net revenues
|
94,840
|
|
28,961
|
|
(19,971
|
)
|
6,576
|
|
13,938
|
|
124,344
|
|
5,048
|
|
—
|
|
—
|
|
129,392
|
|
|||||||||||||||||||
|
Costs and expenses
|
74,809
|
|
23,071
|
|
(19,971
|
)
|
4,399
|
|
9,531
|
|
91,839
|
|
3,307
|
|
1,685
|
|
15,800
|
|
112,631
|
|
|||||||||||||||||||
|
Depreciation and amortization
|
—
|
|
—
|
|
—
|
|
—
|
|
—
|
|
6,244
|
|
778
|
|
—
|
|
253
|
|
7,275
|
|
|||||||||||||||||||
|
Operating Income
|
$
|
20,031
|
|
$
|
5,890
|
|
$
|
—
|
|
$
|
2,177
|
|
$
|
4,407
|
|
$
|
26,261
|
|
$
|
963
|
|
$
|
(1,685
|
)
|
$
|
(16,053
|
)
|
$
|
9,486
|
|
|||||||||
Segment information for fiscal year
2017
(in thousands):
|
|
Fresh
Lemons
|
Lemon
Packing
|
Eliminations
|
Avocados
|
Other
Agribusiness
|
Total
Agribusiness
|
Rental
Operations
|
Real Estate
Development
|
Corporate
and Other
|
Total
|
|||||||||||||||||||||||||||||
|
Revenues from external customers
|
$
|
85,439
|
|
$
|
8,760
|
|
$
|
—
|
|
$
|
9,522
|
|
$
|
12,148
|
|
$
|
115,869
|
|
$
|
5,440
|
|
$
|
—
|
|
$
|
—
|
|
$
|
121,309
|
|
|||||||||
|
Intersegment revenue
|
—
|
|
19,156
|
|
(19,156
|
)
|
—
|
|
—
|
|
—
|
|
—
|
|
—
|
|
—
|
|
—
|
|
|||||||||||||||||||
|
Total net revenues
|
85,439
|
|
27,916
|
|
(19,156
|
)
|
9,522
|
|
12,148
|
|
115,869
|
|
5,440
|
|
—
|
|
121,309
|
|
|||||||||||||||||||||
|
Costs and expenses
|
67,414
|
|
21,567
|
|
(19,156
|
)
|
4,136
|
|
11,712
|
|
85,673
|
|
3,170
|
|
405
|
|
13,731
|
|
102,979
|
|
|||||||||||||||||||
|
Depreciation and amortization
|
—
|
|
—
|
|
—
|
|
—
|
|
—
|
|
5,489
|
|
762
|
|
—
|
|
216
|
|
6,467
|
|
|||||||||||||||||||
|
Operating Income
|
$
|
18,025
|
|
$
|
6,349
|
|
$
|
—
|
|
$
|
5,386
|
|
$
|
436
|
|
$
|
24,707
|
|
$
|
1,508
|
|
$
|
(405
|
)
|
$
|
(13,947
|
)
|
$
|
11,863
|
|
|||||||||
Segment information for fiscal year
2016
(in thousands):
|
|
Fresh
Lemons
|
Lemon
Packing
|
Eliminations
|
Avocados
|
Other
Agribusiness
|
Total
Agribusiness
|
Rental
Operations
|
Real Estate
Development
|
Corporate
and Other
|
Total
|
|||||||||||||||||||||||||||||
|
Revenues from external customers
|
$
|
80,437
|
|
$
|
4,830
|
|
$
|
—
|
|
$
|
10,767
|
|
$
|
10,096
|
|
$
|
106,130
|
|
$
|
5,603
|
|
$
|
56
|
|
$
|
—
|
|
$
|
111,789
|
|
|||||||||
|
Intersegment revenue
|
—
|
|
17,123
|
|
(17,123
|
)
|
—
|
|
—
|
|
—
|
|
—
|
|
—
|
|
—
|
|
—
|
|
|||||||||||||||||||
|
Total net revenues
|
80,437
|
|
21,953
|
|
(17,123
|
)
|
10,767
|
|
10,096
|
|
106,130
|
|
5,603
|
|
56
|
|
111,789
|
|
|||||||||||||||||||||
|
Costs and expenses
|
61,742
|
|
21,939
|
|
(17,123
|
)
|
4,619
|
|
8,106
|
|
79,283
|
|
2,885
|
|
2,006
|
|
13,088
|
|
97,262
|
|
|||||||||||||||||||
|
Depreciation and amortization
|
—
|
|
—
|
|
—
|
|
—
|
|
—
|
|
4,321
|
|
732
|
|
55
|
|
231
|
|
5,339
|
|
|||||||||||||||||||
|
Operating Income
|
$
|
18,695
|
|
$
|
14
|
|
$
|
—
|
|
$
|
6,148
|
|
$
|
1,990
|
|
$
|
22,526
|
|
$
|
1,986
|
|
$
|
(2,005
|
)
|
$
|
(13,319
|
)
|
$
|
9,188
|
|
|||||||||
Fiscal Year
2018
Compared to Fiscal Year
2017
The following analysis should be read in conjunction with the previous section “Results of Operations.”
Fresh lemons
Fresh lemons segment revenue is comprised of sales of fresh lemons, lemon by-products and other lemon revenue such as brokerage commissions. For fiscal year
2018
, our fresh lemons segment revenue was
$94.8 million
compared to
$85.4 million
for fiscal year
2017
, an
11%
increase of
$9.4 million
, primarily due to higher price and volume of fresh lemons sold, as discussed earlier.
Costs and expenses associated with our fresh lemons segment include harvest costs, growing costs, cost of fruit we procure from third-party growers and packing service charges incurred from the lemon packing segment to pack lemons for sale. For fiscal year
2018
, our fresh lemon costs and expenses were
$74.8 million
compared to
$67.4 million
for fiscal year
2017
. The
11%
increase of
$7.4 million
primarily consisted of the following:
|
•
|
Harvest costs for fiscal year
2018
were $0.2 million higher than fiscal year
2017
.
|
|
•
|
Growing costs for fiscal year
2018
were $1.5 million higher than fiscal year
2017
.
|
|
•
|
Third-party grower costs for fiscal year
2018
were $4.9 million higher than fiscal year
2017
.
|
|
•
|
Intersegment costs and expenses for fiscal year
2018
were $0.8 million higher than fiscal year
2017
.
|
41
L
emon packing
Lemon packing segment revenue is comprised of intersegment packing revenue and shipping and handling revenue. For fiscal year
2018
, our lemon packing segment revenue was
$29.0 million
compared to
$27.9 million
for fiscal year
2017
, a
4%
increase of
$1.0 million
primarily due to increased volume of lemons packed and increased shipping and handling revenues.
Costs and expenses associated with our lemon packing segment consist of the cost to pack lemons for sale such as labor and benefits, cardboard cartons, fruit treatments, packing and shipping supplies and facility operating costs. For fiscal year
2018
, our lemon packing costs and expenses were
$23.1 million
compared to
$21.6 million
for fiscal year
2017
. The
7%
increase of
$1.5 million
was primarily due to increased volume of lemons packed and increased shipping costs.
Lemon packing segment operating income per carton sold was $1.78 and $1.98 for fiscal years
2018
and
2017
, respectively.
The lemon packing segment included
$20.0 million
and
$19.2 million
of intersegment revenues for fiscal years
2018
and
2017
, respectively, that are charged to the fresh lemons segment to pack lemons for sale. Such intersegment revenues and expenses are eliminated in our consolidated financial statements.
Avocados
For fiscal year
2018
, our avocados segment revenue was
$6.6 million
compared to
$9.5 million
for fiscal year
2017
, a
31%
decrease of
$2.9 million
.
Costs and expenses associated with our avocados segment include harvest costs and growing costs. For fiscal year
2018
, our avocado costs and expenses were
$4.4 million
compared to
$4.1 million
for fiscal year
2017
. The
6%
increase of
$0.3 million
primarily consisted of the following:
|
•
|
Avocado harvest costs for fiscal year
2018
were similar to fiscal year
2017
.
|
|
•
|
Growing costs for fiscal year
2018
were $0.3 million higher than fiscal year
2017
.
|
Other Agribusiness
For fiscal year
2018
, our other agribusiness segment revenue was
$13.9 million
compared to
$12.1 million
for fiscal year
2017
. The
15%
increase of
$1.8 million
primarily consisted of the following:
|
•
|
Navel and Valencia orange revenue in fiscal year
2018
was $1.8 million higher than in fiscal year
2017
.
|
|
•
|
Specialty citrus and other crop revenue for fiscal year
2018
was similar to fiscal year
2017
.
|
Costs and expenses associated with our other agribusiness segment include harvest and growing costs. Our other agribusiness costs and expenses for fiscal year
2018
were
$9.5 million
compared to
$11.7 million
for fiscal year
2017
. The
19%
decrease of
$2.2 million
primarily consisted of the following:
|
•
|
Orange and specialty citrus packing service charges for fiscal year
2018
were zero compared to $2.2 million in fiscal year
2017
. In fiscal year 2017, we contracted with an independent packinghouse to pack a portion of our oranges and specialty citrus in Limoneira branded cartons.
|
|
•
|
Harvest costs for fiscal year
2018
were $0.4 million lower than fiscal year
2017
.
|
|
•
|
Growing costs for fiscal year
2018
were $0.4 million higher than fiscal year
2017
.
|
Fresh lemons, lemon packing, avocados and other agribusiness depreciation and amortization for fiscal year
2018
were
$6.2 million
compared to
$5.5 million
in fiscal year
2017
. The
14%
increase of
$0.8 million
was primarily due to the acquisitions of San Pablo and Oxnard Lemon and an increase in assets placed into service.
Rental Operations
Our rental operations segment had revenues of approximately
$5.0 million
and
$5.4 million
in fiscal years
2018
and
2017
, respectively. The
$0.4 million
decrease in fiscal year
2018
was primarily due to decreased revenues from land leased to third-party agricultural tenants.
42
Costs and expenses in our rental operations segment were approximately
$4.1 million
and
$3.9 million
in fiscal years
2018
and
2017
, respectively. Depreciation expense was similar in fiscal year
2018
compared to fiscal year
2017
at
$0.8 million
.
Real Estate Development
Our real estate development segment had revenues of
zero
for both fiscal years
2018
and
2017
.
Costs and expenses in our real estate development segment were approximately
$1.7 million
and
$0.4 million
in fiscal years
2018
and
2017
, respectively. We recorded an impairment charge of $1.6 million in fiscal year 2018 compared to $0.1 million in fiscal year 2017.
Selling, general and administrative expenses
Selling, general and administrative expenses include corporate and other costs and expenses not allocated to the operating segments. Selling, general and administrative expenses for fiscal year
2018
were
$2.1 million
higher than fiscal year
2017
.
Fiscal Year 2017 Compared to Fiscal Year 2016
The following analysis should be read in conjunction with the previous section “Results of Operations”.
Fresh lemons
Fresh lemons segment revenue is comprised of sales of fresh lemons, lemon by-products and other lemon revenue such as brokerage commissions. For fiscal year 2017, our fresh lemons segment revenue was $85.4 million compared to $80.4 million for fiscal year 2016, a 6% increase of $5.0 million.
Costs and expenses associated with our fresh lemons segment include harvest costs, growing costs, cost of fruit we procure from third-party growers and packing service charges incurred from the lemon packing segment to pack lemons for sale. For fiscal year 2017, our fresh lemon costs and expenses were $67.4 million compared to $61.7 million for fiscal year 2016. The 9% increase of $5.7 million primarily consisted of the following:
|
•
|
Harvest costs for fiscal year 2017 were $0.8 million higher than fiscal year 2016.
|
|
•
|
Growing costs for fiscal year 2017 were $1.3 million higher than fiscal year 2016.
|
|
•
|
Third-party grower costs for fiscal year 2017 were $1.5 million higher than fiscal year 2016.
|
|
•
|
Intersegment packing charges for fiscal year 2017 were $2.1 million higher than fiscal year 2016.
|
L
emon packing
Lemon packing segment revenue is comprised of intersegment packing revenue and shipping and handling revenue. For fiscal year 2017, our lemon packing segment revenue was $27.9 million compared to $22.0 million for fiscal year 2016, a 27% increase of $5.9 million primarily due to increased volume of lemons packed and increased shipping and handling revenues.
Costs and expenses associated with our lemon packing segment consist of the cost to pack lemons for sale such as labor and benefits, cardboard cartons, fruit treatments, packing and shipping supplies and facility operating costs. For fiscal year 2017, our lemon packing costs and expenses were $21.6 million compared to $21.9 million for fiscal year 2016. The 1% decrease of $0.3 million was primarily due to lower average per carton costs partially offset by increased volume of lemons packed.
Lemon packing segment operating income per carton sold was $1.98 and $0.01 for fiscal years 2017 and 2016, respectively.
The lemon packing segment includes $19.2 million and $17.1 million of intersegment revenues for fiscal years 2017 and 2016, respectively, that are charged to the fresh lemons segment to pack lemons for sale. Such intersegment revenues and expenses are eliminated in our consolidated financial statements.
Avocados
For fiscal year 2017, our avocados segment revenue was $9.5 million compared to $10.7 million for fiscal year 2016, a 12% decrease of $1.2 million.
43
Costs and expenses associated with our avocados segment include harvest costs and growing costs. For fiscal year 2017, our avocado costs and expenses were $4.1 million compared to $4.6 million for fiscal year 2016. The 10% decrease of $0.5 million primarily consisted of the following:
|
•
|
Harvest costs for fiscal year 2017 were $0.5 million lower than fiscal year 2016.
|
|
•
|
Growing costs for fiscal year 2017 were similar to fiscal year 2016.
|
Other agribusiness
For fiscal year 2017, our other agribusiness segment revenue was $12.1 million compared to $10.1 million for fiscal year 2016. The 20% increase of $2.1 million primarily consisted of the following:
|
•
|
Navel and Valencia orange revenue in fiscal year 2017 was $1.0 million higher than in fiscal year 2016.
|
|
•
|
Specialty citrus and other crop revenue for fiscal year 2017 was $1.1 million higher than fiscal year 2016.
|
Costs and expenses associated with our other agribusiness segment include harvest and growing costs. Our other agribusiness costs and expenses for fiscal year 2017 were $11.7 million compared to $8.1 million for fiscal year 2016. The 44% increase of $3.6 million primarily consisted of the following:
|
•
|
Orange and specialty citrus packing service charges for fiscal year 2017 were $2.2 million compared to zero in fiscal year 2016. In fiscal year 2017, we contracted with an independent packinghouse to pack a portion of our oranges and specialty citrus in Limoneira branded cartons.
|
|
•
|
Harvest costs for fiscal year 2017 were $0.1 million higher than fiscal year 2016.
|
|
•
|
Growing costs for fiscal year 2017 were $1.3 million higher than fiscal year 2016.
|
Fresh lemons, lemon packing, avocados and other agribusiness depreciation and amortization for fiscal year 2017 were $5.5 million compared to $4.3 million in fiscal year 2016. The 27% increase of $1.2 million was primarily due to the acquisition of PDA in February 2017 and an increase in assets placed into service.
Rental Operations
Our rental operations segment had revenues of approximately $5.4 million and $5.6 million in fiscal years 2017 and 2016, respectively. The $0.2 million decrease in fiscal year 2017 was primarily due to decreased revenues from land leased to third-party agricultural tenants.
Costs and expenses in our rental operations segment were approximately $3.9 million and $3.6 million in fiscal years 2017 and 2016, respectively. Depreciation expense was $0.8 million and $0.7 million in fiscal years 2017 and 2016, respectively.
Real Estate Development
Our real estate development segment had revenues of zero and $0.1 million in fiscal years 2017 and 2016, respectively.
Costs and expenses in our real estate development segment were approximately $0.4 million and $2.1 million in fiscal years 2017 and 2016, respectively.
Selling, general and administrative expenses
Selling, general and administrative expenses include corporate and other costs and expenses not allocated to the operating segments. Selling, general and administrative expenses for fiscal year 2017 were $0.6 million lower than fiscal year 2016.
44
Quarterly Results of Operations
The following table presents our operating results for each of the fiscal quarters in the periods ended
October 31, 2018
and
October 31, 2017
, respectively (in thousands, except per share amounts). The information for each of these quarters is derived from our unaudited interim financial statements and should be read in conjunction with the audited consolidated financial statements included in this Annual Report. All necessary adjustments, which consist only of normal and recurring accruals, have been included to fairly present our unaudited quarterly results. As with any agribusiness enterprise, our agribusiness operations are highly seasonal in nature. The harvest and sale of our lemons, avocados, oranges and specialty citrus and other crops occurs in all quarters, but is generally more concentrated during the third quarter.
|
|
Three Months Ended 2018
|
||||||||||||||
|
Statement of Operations Data:
|
Oct. 31,
|
Jul. 31,
|
Apr. 30,
|
Jan. 31,
|
|||||||||||
|
Revenues
|
$
|
14,714
|
|
$
|
39,950
|
|
$
|
43,135
|
|
$
|
31,593
|
|
|||
|
Costs and expenses
|
24,295
|
|
28,525
|
|
33,755
|
|
33,331
|
|
|||||||
|
Operating (loss) income
|
(9,581
|
)
|
11,425
|
|
9,380
|
|
(1,738
|
)
|
|||||||
|
Other income (loss), net
|
4,728
|
|
(111
|
)
|
(394
|
)
|
(226
|
)
|
|||||||
|
(Loss) income before income tax benefit (provision)
|
(4,853
|
)
|
11,314
|
|
8,986
|
|
(1,964
|
)
|
|||||||
|
Income tax benefit (provision)
|
1,636
|
|
(3,114
|
)
|
(2,380
|
)
|
10,587
|
|
|||||||
|
Net (loss) income
|
(3,217
|
)
|
8,200
|
|
6,606
|
|
8,623
|
|
|||||||
|
(Income) loss attributable to noncontrolling interest
|
(20
|
)
|
1
|
|
(7
|
)
|
2
|
|
|||||||
|
Net (loss) income attributable to Limoneira Company
|
$
|
(3,237
|
)
|
$
|
8,201
|
|
$
|
6,599
|
|
$
|
8,625
|
|
|||
|
Net (loss) income per common share:
|
|||||||||||||||
|
Basic
|
$
|
(0.19
|
)
|
$
|
0.51
|
|
$
|
0.45
|
|
$
|
0.59
|
|
|||
|
Diluted
|
$
|
(0.19
|
)
|
$
|
0.50
|
|
$
|
0.44
|
|
$
|
0.58
|
|
|||
|
Number of shares used in per common share computations:
|
|||||||||||||||
|
Basic
|
17,528
|
|
15,947
|
|
14,379
|
|
14,466
|
|
|||||||
|
Diluted
|
17,528
|
|
16,551
|
|
15,023
|
|
14,984
|
|
|||||||
|
|
Three Months Ended 2017
|
||||||||||||||
|
Statement of Operations Data:
|
Oct. 31,
|
Jul. 31,
|
Apr. 30,
|
Jan. 31,
|
|||||||||||
|
Revenues
|
$
|
15,929
|
|
$
|
40,395
|
|
$
|
36,893
|
|
$
|
28,092
|
|
|||
|
Costs and expenses
|
20,207
|
|
27,227
|
|
30,681
|
|
31,331
|
|
|||||||
|
Operating (loss) income
|
(4,278
|
)
|
13,168
|
|
6,212
|
|
(3,239
|
)
|
|||||||
|
Other loss, net
|
(238
|
)
|
(408
|
)
|
(518
|
)
|
(73
|
)
|
|||||||
|
(Loss) income before income tax benefit (provision)
|
(4,516
|
)
|
12,760
|
|
5,694
|
|
(3,312
|
)
|
|||||||
|
Income tax benefit (provision)
|
1,858
|
|
(5,017
|
)
|
(2,158
|
)
|
1,240
|
|
|||||||
|
Net (loss) income
|
(2,658
|
)
|
7,743
|
|
3,536
|
|
(2,072
|
)
|
|||||||
|
Loss attributable to noncontrolling interest
|
8
|
|
34
|
|
4
|
|
—
|
|
|||||||
|
Net (loss) income attributable to Limoneira Company
|
$
|
(2,650
|
)
|
$
|
7,777
|
|
$
|
3,540
|
|
$
|
(2,072
|
)
|
|||
|
Net (loss) income per common share:
|
|||||||||||||||
|
Basic
|
(0.19
|
)
|
0.53
|
|
0.24
|
|
(0.16
|
)
|
|||||||
|
Diluted
|
(0.19
|
)
|
0.52
|
|
0.24
|
|
(0.16
|
)
|
|||||||
|
Number of shares used in per common share computations:
|
|||||||||||||||
|
Basic
|
14,405
|
|
14,396
|
|
14,269
|
|
14,202
|
|
|||||||
|
Diluted
|
14,405
|
|
14,989
|
|
14,719
|
|
14,202
|
|
|||||||
45
The following information compares our fourth quarter ended
October 31, 2018
to the fourth quarter ended
October 31, 2017
. Information concerning comparisons of our first, second and third quarters can be found in our quarterly reports on Form 10-Q.
|
•
|
Total revenues
decreased
$1.2 million
in the three months ended
October 31, 2018
compared to the three months ended
October 31, 2017
primarily due to decreased lemon and specialty citrus and other crop revenues of $0.4 and $0.6 million, respectively. During the fourth quarter of fiscal year
2018
, we sold 239,000 cartons of fresh lemons, including 150,000 cartons procured from third-party growers, at an average per carton price of $29.71, compared to 414,000 cartons of fresh lemons, including 223,000 cartons procured from third party growers, at an average per carton price of $21.01 in the fourth quarter of fiscal year
2017
. The decrease in specialty citrus and other crop revenues in the fourth quarter of fiscal year
2018
compared to the fourth quarter of fiscal year
2017
is primarily due to lower pistachio and wine grape volumes.
|
|
•
|
Total costs and expenses
increased
$4.1 million
in the three months ended
October 31, 2018
compared to the three months ended
October 31, 2017
primarily due to increases in agribusiness costs of $1.8 million, real estate development impairment charge of $1.6 million, and increases in selling, general and administrative expenses of $0.8 million. The increase in agribusiness costs is primarily due to increased growing, third-party grower and depreciation and amortization costs and expenses of $1.3 million, $0.1 million and $0.4 million, respectively. Growing costs increased primarily as a result of an increase in full-bearing acreage and the acquisition of San Pablo. Third-party grower costs increased primarily due to increased price for fruit procured from third-party growers and depreciation and amortization increased primarily due to the acquisitions of San Pablo and Oxnard Lemon.
|
|
•
|
Total other income
increased
$5.0 million
in the three months ended
October 31, 2018
compared to the three months ended
October 31, 2017
primarily due to the
$4.2 million
gain on the sale of stock in Calavo, increased equity in earnings of our investment in Rosales and a reduction in interest expense from lower debt levels.
|
|
•
|
Income tax benefit
decreased
$0.2 million
in the three months ended
October 31, 2018
compared to the three months ended
October 31, 2017
primarily due to the
increase
in pre-tax loss of
$0.3 million
.
|
Liquidity and Capital Resources
Overview
Our liquidity and capital position fluctuates during the year depending on seasonal production cycles, weather events and demand for our products. Typically, our first and last fiscal quarters coincide with the fall and winter months during which we are growing crops that are harvested and sold in the spring and summer, which are our second and third quarters. To meet working capital demand and investment requirements of our agribusiness and real estate development divisions and to supplement operating cash flows, we utilize our revolving and non-revolving credit facility to fund agricultural inputs and farm management practices until sufficient returns from crops allow us to repay amounts borrowed. Raw materials needed to propagate the various crops grown by us consist primarily of fertilizer, herbicides, insecticides, fuel and water, which are readily available from local sources.
Cash Flows from Operating Activities
For the fiscal years ended
October 31, 2018
,
2017
and
2016
, net cash provided by operating activities was
$18.4 million
,
$18.5 million
and
$14.3 million
, respectively. The significant components of our cash flows provided by operating activities are as follows:
|
•
|
Net income was
$20.2 million
,
$6.5 million
and
$8.1 million
for fiscal years
2018
,
2017
and
2016
, respectively. The components of net income in fiscal year
2018
compared to fiscal year
2017
consist of a decrease in operating income of $2.3 million, an increase in other income of $5.2 million and an increase in income tax benefit of $10.8 million. The components of net income in fiscal year 2017 compared to fiscal year 2016 consist of an increase in operating income of $2.7 million, a decrease in other income of $5.4 million and a decrease in income tax provision of $1.2 million.
|
|
•
|
Depreciation and amortization was
$7.3 million
,
$6.5 million
and
$5.3 million
for fiscal years
2018
,
2017
and
2016
, respectively. The increase in fiscal year
2018
compared to fiscal year
2017
was primarily the result of the acquisitions of San Pablo and Oxnard Lemon in July 2018 and an increase in assets placed in service. The increase in fiscal year 2017 compared to fiscal year 2016 was primarily the result of the acquisition of PDA in February 2017 and an increase in assets placed in service.
|
|
•
|
Non-cash impairments of real estate development assets were
$1.6 million
,
$0.1 million
and
zero
for fiscal years
2018
,
2017
and
2016
, respectively.
|
46
|
•
|
Loss on disposals of fixed assets of
$0.2 million
,
$0.3 million
and
$0.1 million
in fiscal years
2018
,
2017
and
2016
, respectively, were primarily the result of expenses incurred from orchard disposals related to the December 2017 Southern California Wildfires and orchard removals related to real estate development and our on-going orchard redevelopment plans.
|
|
•
|
Non-cash stock compensation expense was
$1.4 million
,
$1.3 million
and
$1.3 million
for fiscal years
2018
,
2017
and
2016
, respectively, which is primarily comprised of expense recognition and vesting of 2015, 2016, 2017 and 2018 grants to management under our stock grant performance bonus program plus the directors’ stock incentive compensation.
|
|
•
|
Equity in earnings of investments of
$0.6 million
,
$49.0 thousand
and
$0.6 million
for fiscal years
2018
,
2017
and
2016
, respectively, is primarily comprised of net earnings from our investments in Limco Del Mar, Ltd. and Rosales.
|
|
•
|
Cash distributions from equity investments of
$0.5 million
,
$0.7 million
and
$0.6 million
in fiscal years
2018
,
2017
and
2016
, respectively, were primarily from our investments in Limco Del Mar, Ltd. and Rosales.
|
|
•
|
We sold 50,000 and 60,000 shares of common stock in Calavo in fiscal years 2018 and 2016, respectively, which resulted in gains of
$4.2 million
and $3.4 million, respectively. No such transactions occurred in fiscal year 2017.
|
|
•
|
We sold a conservation easement for $1.0 million in fiscal year 2016. No such transaction occurred in fiscal years 2018 or 2017.
|
|
•
|
Accounts receivable, net balance at
October 31, 2018
was
$14.1 million
compared to
$11.0 million
at
October 31, 2017
, resulting in a corresponding decrease in operating cash flows of
$3.2 million
for fiscal year
2018
. Accounts receivable, net balance at October 31, 2017 was $11.0 million compared to $9.3 million at October 31, 2016, resulting in a corresponding decrease in operating cash flows of $1.6 million for fiscal year 2017. Accounts receivable, net balance at October 31, 2016 was $9.3 million compared to $7.4 million at October 31, 2015, resulting in a corresponding decrease in operating cash flows of $1.9 million for fiscal year 2016. The decreases in operating cash flows for fiscal years
2018
,
2017
and
2016
are primarily due to fluctuations in price and volume related to agribusiness revenues.
|
|
•
|
Cultural costs used
$0.7 million
of operating cash flows in fiscal year
2018
compared to providing
$0.2 million
of operating cash flows in fiscal year
2017
, primarily due to an initial lower amount of inventory carried at the beginning of fiscal year 2017. Cultural costs provided $0.2 million of operating cash flows in fiscal year 2017 compared to providing $0.1 million of operating cash flows in fiscal year 2016, primarily due to an initial higher amount of inventory carried at the beginning of fiscal year 2017.
|
|
•
|
Prepaid expenses and other current assets provided
$0.1 million
of operating cash flows in fiscal years
2018
, 2017 and 2016.
|
|
•
|
Income taxes receivable balance was
$0.4 million
at
October 31, 2018
compared to
$0.6 million
at
October 31, 2017
resulting in a corresponding increase in operating cash flows of
$0.2 million
for fiscal year
2018
. Income taxes receivable balance was $0.6 million at October 31, 2017 compared to $2.8 million at October 31, 2016 resulting in a corresponding increase in operating cash flows of $2.2 million for fiscal year 2017. Income taxes receivable balance was $2.8 million at October 31, 2016 compared to zero at October 31, 2015 resulting in a corresponding decrease in operating cash flows of $2.8 million for fiscal year 2016.
|
|
•
|
Accounts payable and growers payable provided
$0.7 million
of operating cash flows in fiscal year
2018
, provided
$0.5 million
of operating cash flows in fiscal year
2017
and provided
$0.8 million
of operating cash flows in fiscal year
2016
. The
$0.7 million
of cash provided in fiscal year
2018
was primarily the result of a $1.3 million increase in growers payable offset by a $0.2 million decrease in accounts payable and $0.4 million of capital expenditures accrued but not paid at year-end. The $0.5 million of cash provided in fiscal year 2017 was primarily the result of a $1.0 million increase in accounts payable and growers payable partially offset by $0.4 million of capital expenditures accrued but not paid at year-end. The $0.8 million of cash provided in fiscal year 2016 was primarily the result of a $1.7 million increase in accounts payable and growers payable partially offset by $0.5 million of capital expenditures accrued but not paid at year-end and $0.3 million accrued equity investment contribution. The increases in accounts payable and growers payable in fiscal years 2018, 2017 and 2016 were primarily due to higher operating expenses, resulting in corresponding higher levels of payables at year-end.
|
|
•
|
Accrued liabilities provided operating cash flows of
$2.6 million
in fiscal year
2018
, used operating cash flows of
$1.3 million
in fiscal year
2017
and provided operating cash flows of
$1.2 million
in fiscal year
2016
. The
$2.6 million
of cash provided in fiscal year
2018
is primarily the result of $0.4 million increase in accrued compensation, $0.3 million increase in accrued lease expense and $1.0 million increase in accrued payments to lemon suppliers. The
$1.3 million
of cash used in fiscal year
|
47
2017
is primarily the result of $1.1 million decrease in accrued payments to lemon suppliers. The
$1.2 million
of cash provided in fiscal year
2016
is primarily the result of $0.7 million increase in accrued compensation and $0.5 increase in accrued payments to lemon suppliers.
|
•
|
Other long-term liabilities provided operating cash flows of
$0.1 million
in fiscal year
2018
and consisted of $0.7 million of non-cash pension expense offset by $0.6 million of pension contributions. Other long-term liabilities provided operating cash flows of
$0.2 million
in fiscal year
2017
and consisted of $0.9 million of non-cash pension expense offset by $0.7 million of pension contributions. Other long-term liabilities provided operating cash flows of
$0.1 million
in fiscal year
2016
and consisted of $0.6 million of non-cash pension expense offset by $0.5 million of pension contributions.
|
Cash Flows from Investing Activities
For the years ended
October 31, 2018
,
2017
and
2016
, net cash used in investing activities was
$50.8 million
,
$26.4 million
and
$11.5 million
, respectively, and is primarily comprised of capital expenditures, business acquisitions, sales of assets and investments.
|
•
|
Capital expenditures for fiscal year 2018 were comprised of $12.2 million for property, plant and equipment primarily related to orchard and vineyard development and $1.7 million for real estate development projects. Additionally, in fiscal year 2018, we purchased San Pablo for $13.1 million, Oxnard Lemon for $25.0 million, a real estate development parcel for $1.4 million and contributed $3.5 million to the Joint Venture for the development of our East Area I real estate development project. Further, we sold 50,000 shares of stock in Calavo for $4.7 million and a real estate development parcel for $1.5 million.
|
|
•
|
Capital expenditures for fiscal year 2017 were comprised of $11.6 million for property, plant and equipment primarily related to orchard and vineyard development and $1.3 million for real estate development projects. Additionally, in fiscal year 2017, we purchased PDA for $5.7 million and contributed $7.5 million to the Joint Venture for the development of our East Area I real estate development project.
|
|
•
|
Capital expenditures for fiscal year 2016 were comprised of $12.9 million for property, plant and equipment primarily related to orchard development and construction and equipment purchased for our lemon packing facilities and $3.4 million for real estate development projects. In November 2015, we received $18.0 million for 50% interest in a Joint Venture that will develop our East Area I real estate development project. We contributed $2.3 million to this Joint Venture in fiscal year 2016 and purchased $0.6 million of additional limited partnership units in Limco Del Mar, Ltd. In December 2015, we purchased 757 acres of agriculture property for $15.1 million. We received $4.0 million net proceeds from sale of stock in Calavo and $1.0 million net proceeds from the sale of a conservation easement.
|
Cash Flows from Financing Activities
For the years ended
October 31, 2018
,
2017
and
2016
net cash provided by (used in) financing activities was
$32.5 million
,
$8.4 million
and
$(2.8) million
, respectively.
|
•
|
The
$32.5 million
of cash provided by financing activities for fiscal year
2018
is primarily comprised of net proceeds from our public offering of common stock of $64.1 million partially offset by net repayments of long-term debt in the amount of
$26.4 million
. Additionally, we paid common and preferred dividends, in aggregate, of
$4.5 million
in fiscal year
2018
.
|
|
•
|
The $8.4 million of cash provided by financing activities for fiscal year 2017 is primarily comprised of net borrowings of long-term debt in the amount of $12.5 million partially offset by common and preferred dividends, in aggregate, of $3.7 million in fiscal year 2017.
|
|
•
|
The $2.8 million of cash used in financing activities for fiscal year 2016 is primarily comprised of net borrowings of long-term debt in the amount of $1.0 million partially offset by common and preferred dividends, in aggregate, of $3.5 million in fiscal year 2016.
|
Transactions Affecting Liquidity and Capital Resources
On June 20, 2017, we entered into a Master Loan Agreement (the “Loan Agreement”) with Farm Credit West, FLCA ("Farm Credit West") which includes a Revolving Credit Supplement and a Non-Revolving Credit Supplement (the “Supplements”). Proceeds from the Supplements were used to pay down all the remaining outstanding indebtedness under the revolving credit facility we had with Rabobank, N.A. On January 29, 2018 we amended the Revolving Credit Supplement to increase the borrowing
48
capacity from
$60.0
million to
$75.0
million. The Supplements provide aggregate borrowing capacity of
$115.0
million comprised of
$75.0
million under the Revolving Credit Supplement and
$40.0
million under the Non-Revolving Credit Supplement.
In May 2018, we entered into a Conversion Agreement with Farm Credit West which fixed the interest rate on the Non-Revolving Credit Supplement at
4.77%
effective July 1, 2018. The agreement provides for a fee equal to
0.50%
of any amounts prepaid under the Non-Revolving Credit Supplement. The Company may prepay any amounts under the Revolving Credit Supplement without penalty.
The interest rate for any amount outstanding under the Supplements is based on the one month London Interbank Offered Rate (“LIBOR”) rate plus an applicable margin, which is subject to adjustment on a monthly basis. The applicable margin ranges from
1.60%
to
2.35%
depending on the ratio of current assets plus the remaining available commitment divided by current liabilities. On July 1,
2019
, and on each one-year anniversary thereafter, we have the option to convert the interest rate in use under each Supplement from the preceding LIBOR-based calculation to a variable interest rate, or the reverse, as applicable. Any amounts outstanding under the Supplements are due and payable in full on July 1, 2022.
All indebtedness under the Loan Agreement, including any indebtedness under the Supplements, is secured by a first lien on certain of our agricultural properties in Tulare and Ventura counties in California and certain of our building fixtures and improvements and investments in mutual water companies associated with the pledged agricultural properties. The Loan Agreement includes customary default provisions that provide that should an event of default occur, Farm Credit West, at its option, may declare all or any portion of the indebtedness under the Loan Agreement to be immediately due and payable without demand, notice of non-payment, protest or prior recourse to collateral, and terminate or suspend our right to draw or request funds on any loan or line of credit.
The Loan Agreement subjects us to affirmative and restrictive covenants including, among other customary covenants, financial reporting requirements, requirements to maintain and repair any collateral, restrictions on the sale of assets, restrictions on the use of proceeds, prohibitions on the incurrence of additional debt and restrictions on the purchase or sale of major assets of our business.
We are also subject to a covenant that we will maintain a debt service coverage ratio greater than 1.25:1.0 measured annually at October 31
, with which we were in compliance at
October 31, 2018
.
We finance our working capital and other liquidity requirements primarily through cash from operations and our Farm Credit West Credit Facility. In addition, we have the Farm Credit West Term Loans, the Wells Fargo Term Loan and the Banco de Chile term loan. Additional information regarding the Farm Credit West Credit Facility, the Farm Credit West Term Loans, the Wells Fargo Term Loan, the Banco de Chile term loan and the note payable can be found in the notes to consolidated financial statements included in this Annual Report.
We believe that the cash flows from operations and available borrowing capacity from our existing credit facilities will be sufficient to satisfy our capital expenditures, debt service, working capital needs and other contractual obligations for fiscal year
2019
. In addition, we have the ability to control a portion of our investing cash flows to the extent necessary based on our liquidity demands.
Farm Credit West Credit Facility
As of
October 31, 2018
, our outstanding borrowings under the Farm Credit West Credit Facility were
$50.9 million
and we had
$64.1 million
of availability. The Farm Credit West revolving line of credit balance of $10.9 million currently bears interest at a variable rate equal to the one-month LIBOR plus 1.85%. The interest rate resets on the first of each month and was
4.08%
at
October 31, 2018
. We have the ability to prepay any amounts outstanding under the Farm Credit West revolving line of credit without penalty. The line of credit provides for maximum borrowings of
$115.0 million
and the borrowing capacity based on collateral value was $115.0 million at
October 31, 2018
.
We have the option of fixing the interest rate under the Farm Credit West Credit Facility on any portion of outstanding borrowings using interest rate swaps. Effective July 2013, we fixed the interest rate at 4.30% utilizing an interest rate swap on $40.0 million of the Rabobank Credit Facility. In connection with the paydown of the Rabobank debt noted above, on June 20, 2017, we entered into a novation agreement with Rabobank International, Utrecht and CoBank, ACB (“CoBank”). The agreement provided for the prior interest rate swap agreement with Rabobank to be in place with CoBank. Additional information regarding the interest rate swap can be found in the notes to consolidated financial statements included in this Annual Report. This interest rate swap expired June 30, 2018.
Farm Credit West Term Loans
As of
October 31, 2018
, we had an aggregate of approximately
$19.7 million
outstanding under Farm Credit West Term Loans, which are further discussed here:
49
|
•
|
Term Loan Maturing November 2022.
As of
October 31, 2018
, we had
$2.6 million
outstanding under the Farm Credit West Term Loan that matures in November 2022. This term loan bears interest at a variable rate equal to an internally calculated rate based on Farm Credit West’s internal monthly operations and their cost of funds and generally follows the changes in the 90-day treasury rates in increments divisible by 0.25% and is payable in quarterly installments through November 2022. The interest rate resets monthly and was
4.70%
at
October 31, 2018
. This term loan is secured by certain of our agricultural properties.
|
|
•
|
Term Loan Maturing October 2035.
As of
October 31, 2018
, Windfall had
$1.1 million
outstanding under the Farm Credit West Term Loan that matures in October 2035. This term loan bears interest at a variable rate equal to an internally calculated rate based on Farm Credit West’s internal monthly operations and their cost of funds and generally follows the changes in the 90-day treasury rates in increments divisible by 0.25% and is payable in monthly installments through October 2035. The interest rate resets monthly and was
4.70%
at
October 31, 2018
. This term loan is secured by the Windfall Farms property.
|
|
•
|
Term Loan Maturing March 2036.
As of
October 31, 2018
, we had
$9.2 million
outstanding under the Farm Credit West Term Loan that matures in March 2036. This loan bears interest at a fixed rate of
4.70%
and is payable in monthly installments through March 2036. This term loan is secured by certain of our agricultural properties.
|
|
•
|
Term Loan Maturing March 2036.
As of
October 31, 2018
, we had
$6.8 million
outstanding under the Farm Credit West Term Loan that matures in March 2036. This loan bears interest at a fixed rate of
3.62%
until March 2021, becoming variable for the remainder of the loan at a variable rate equal to an internally calculated rate based on Farm Credit West’s internal monthly operations and their cost of funds and generally follows the changes in the 90-day treasury rates in increments divisible by 0.25%. This term loan is payable in monthly installments through March 2036 and is secured by certain of our agricultural properties.
|
The Farm Credit West Term Loans contain various conditions, covenants and requirements with which our Company and Windfall must comply. In addition, our Company and Windfall are subject to limitations on, among other things, selling, abandoning or ceasing business operations; merging or consolidating with a third party; disposing of a substantial portion of assets by sale, transfer, gifts or lease except for inventory sales in the ordinary course of business; obtaining credit or loans from other lenders other than trade credit customary in the business; becoming a guarantor or surety on or otherwise liable for the debts or obligations of a third party; and mortgaging, pledging, leasing for over a year, or otherwise making or allowing the filing of a lien on any collateral.
Wells Fargo Term Loan
As of
October 31, 2018
, we had
$6.4 million
outstanding under the Wells Fargo Term Loan. This term loan bears interest at a fixed rate of
3.58%
and is payable in monthly installments through January 2023. The loan is secured by certain equipment associated with our new lemon packing facilities. The loan contains affirmative and restrictive covenants including, among other customary covenants, financial reporting requirements, requirements to maintain and repair any collateral, restrictions on the sale of assets, restrictions on the use of proceeds, prohibitions on the incurrence of additional debt and restrictions on the purchase or sale of major assets. The Company is also subject to a covenant that it will maintain a debt service coverage ratio greater than 1.25:1.0 measured annually at October 31, with which we were in compliance at
October 31, 2018
.
Banco de Chile Term Loan
Through the acquisition of PDA in February 2017, we assumed a $1.7 million term loan with Banco de Chile that matures in January 2025. This term loan bears interest at a fixed rate of
6.48%
and is payable in eight annual installments which began in January 2018. This loan is unsecured and contains certain pre-payment limitations.
Note Payable
In February 2018, we exercised an option to purchase a 7-acre parcel adjacent to our East Area II real estate development project. In connection with this purchase, we issued a note payable for
$1.4 million
secured by first deed of trust, payable to the sellers. The note is due in February 2023, with interest-only, monthly payments at interest rates ranging from 5.0% to 7.0% and was
5.0%
at
October 31, 2018
.
50
Public Offering of Common Stock
In June 2018, we completed the sale of an aggregate of 3,136,000 shares of our common stock, at a price of $22.00 per share, to a limited number of institutional and other investors in a registered offering under the shelf registration statement. The offering represented 18% of our outstanding common stock on an after-issued basis as of June 25, 2018. Upon completion of the offering and issuance of common stock, we had 17,669,000 shares of common stock outstanding. The net proceeds from the sale of shares, after deducting underwriting discounts and our expenses related to the offering, were approximately $64.1 million. In June and July 2018, we used the offering proceeds to pay down debt, purchase San Pablo ranch and purchase Oxnard Lemon's packinghouse, related land and certain other assets.
Interest Rate Swap
From time to time we enter into interest rate swap agreements to manage the risks and costs associated with our financing activities. Additional information regarding interest rate swaps that we have entered into historically can be found in the notes to the audited consolidated financial statements included elsewhere in this Annual Report.
Our debt bears interest at fixed and variable rates, ranging from
3.58%
to
6.48%
at
October 31, 2018
. As of October 31, 2018, we had no outstanding interest rate swap agreements.
Real Estate Development Activities and Related Capital Resources
As noted under “Transactions Affecting Liquidity and Capital Resources,” we have the ability to control a portion of our investing cash flows to the extent necessary based upon our liquidity demands. In order for our real estate development operations to reach their maximum potential benefit to us, however, we will need to be successful over time in identifying other third party sources of capital to partner with us to move those development projects forward. While we are frequently in discussions with potential external sources of capital in respect to all of our development projects, current market conditions for California real estate projects, while improving, continue to be challenging and make it difficult to predict the timing and amounts of future capital that will be required to complete the development of our projects.
On November 10, 2015, we entered into the Joint Venture with Lewis for the residential development of our East Area I real estate development project. To consummate the transaction, we formed Limoneira Lewis Community Builders, LLC as the development entity, contributed our East Area I property to the Joint Venture and sold a 50% interest in the Joint Venture to Lewis for $20.0 million, comprised of a $2.0 million deposit received in September 2015 and $18.0 million received on November 10, 2015. We expect to receive $100.0 million from the Joint Venture over the estimated 7 to 10-year life of the project. The Joint Venture partners will share in capital contributions to fund project costs until loan proceeds and or revenues are sufficient to fund the project. These funding requirements are currently estimated to total $15.0 to $20.0 million for each Joint Venture partner in the first three to four years of the project and we funded $3.5 million in fiscal year 2018, $7.5 million in fiscal year 2017 and an additional $4.0 million in first quarter of fiscal year 2019. We also entered to a lease agreement with the Joint Venture to lease back a portion of the contributed property, which allowed us to continue farming the property during the phased build-out of the project. We terminated this lease in December 2018. We are planning approximately 632 units in Phase 1 of the project. Grading began in November 2017 and Phase 1 site improvements have begun. The Joint Venture has received lot deposits from national homebuilders and initial closings of lot sales are anticipated to begin in the first quarter of calendar year 2019.
Trend Information
Agribusiness Division
The worldwide fresh produce industry has historically enjoyed consistent underlying demand and favorable growth dynamics. In recent years, the market for fresh produce has increased faster than the rate of population growth, supported by ongoing trends including greater consumer demand for healthy, fresh and convenient foods, increased retailer square footage devoted to fresh produce, and greater emphasis on fresh produce as a differentiating factor in attracting customers. Health-conscious consumers are driving much of the growth in demand for fresh produce. Over the past several decades, the benefits of natural, preservative-free and organic foods have become an increasingly significant element of the public dialogue on health and nutrition. As a result, consumption of fresh fruit and vegetables has markedly increased. According to the USDA, Americans consumed 37 more pounds of fresh fruit and vegetables per capita in 2008 than they did in 1988.
The USDA reports that U.S. per capita fresh lemon consumption was 4.3 pounds in 2017, and since 2004, has averaged 3.1 pounds per capita versus 2.7 pounds per capita in the 1990s. Approximately 70% of the California crop has gone into the fresh market in the past decade. The fresh market is significantly more profitable than the processed market and the amount of production sold in
51
the fresh market is referred to as fresh utilization. Our fresh utilization has historically been comparable to the California industry average and we expect that our fresh utilization will increase due to increased flexibility to sell lemons directly to food service wholesale and retail customers and increased customer interaction resulting from our direct lemon sales strategy.
According to the USDA, the U.S. per capita consumption of avocados has increased in recent years from 3.1 pounds per capita in 2004 to 7.1 pounds per capita in 2017. A growing Hispanic population, an increasing awareness of healthier foods and the acceptance of mono-unsaturated fats has helped to spur demand for avocados. California is the largest U.S. producer of avocados producing approximately 85% of the nation's avocados. The 2011 crop of 550 million pounds was the second largest in the last ten years and fourth largest in California avocado production history. According to the California Avocado Commission, the 2018 crop produced approximately
338 million
pounds compared to 215 million pounds in 2017 and 393 million pounds in 2016.
Navel oranges comprise most of California’s orange crop, accounting for approximately 80% over the past three growing seasons. Valencia oranges account for a vast majority of the remainder of California’s orange crop. While California produces approximately 40% of the nation’s oranges, its crop accounts for approximately 90% of those going to the fresh market. The share of California’s crop going to fresh market, as opposed to the processed market (i.e., juices, oils and essences) varies by season, depending on the quality of the crop.
Real Estate Development Division
We believe the residential real estate market is recovering in the locations that we own real estate development property following the well-known economic downturn of the recent past. We incurred impairment charges on one of our real estate development projects in fiscal years 2018 and 2017 and future impairment is possible. Due to these factors, we anticipate maintaining a cautious and patient perspective with respect to our real estate development activities. However, interest rates are also at historically low levels, which provide a favorable buying opportunity for potential home buyers. Additionally, we believe that our real estate development properties have certain unique characteristics and are located in desirable locations, particularly East Area I, and as economic or real estate market conditions improve or other factors arise, we will take advantage of such opportunities to develop our properties.
Contractual Obligations and Off-Balance Sheet Arrangements
The following table presents our contractual obligations at
October 31, 2018
for which cash flows are fixed and determinable (in thousands):
|
|
Payments due by Period
|
||||||||||||||||||
|
|
Total
|
< 1 year
|
1-3 years
|
3-5 years
|
5+ years
|
||||||||||||||
|
Fixed rate debt (principal)
|
$
|
65,639
|
|
$
|
2,516
|
|
$
|
4,648
|
|
$
|
43,760
|
|
$
|
14,715
|
|
||||
|
Variable rate debt (principal)
|
14,612
|
|
611
|
|
1,310
|
|
11,812
|
|
879
|
|
|||||||||
|
Operating lease obligations
|
4,199
|
|
522
|
|
991
|
|
594
|
|
2,092
|
|
|||||||||
|
Total contractual obligations
|
$
|
84,450
|
|
$
|
3,649
|
|
$
|
6,949
|
|
$
|
56,166
|
|
$
|
17,686
|
|
||||
|
Interest payments on fixed and variable rate debt
|
$
|
21,056
|
|
$
|
3,625
|
|
$
|
6,967
|
|
$
|
6,429
|
|
$
|
4,035
|
|
||||
We believe that the cash flows from operations and borrowing capacity from existing and available and credit facilities will be sufficient to satisfy our future capital expenditure, debt service, working capital and other contractual obligations for fiscal year
2019
. In addition, we have the ability to control a portion of our investing cash flows to the extent necessary based on our liquidity demands.
Fixed Rate and Variable Rate Debt
Details of amounts included in long-term debt can be found above and in the accompanying notes to consolidated financial statements included in this Annual Report. The table above assumes that long-term debt is held to maturity.
Interest Payments on Fixed and Variable Debt
The above table assumes that our fixed rate and long-term debt is held to maturity and the interest rates on our variable rate debt remains unchanged for the remaining life of the debt from those in effect at
October 31, 2018
.
52
Preferred Stock Dividends
In 1997, in connection with the acquisition of Ronald Michaelis Ranches, Inc., we issued 30,000 shares of Series B Convertible Preferred Stock at $100 par value (the “Series B Stock”), of which 14,790 shares are currently outstanding. The holders of the Series B Stock are entitled to receive cumulative cash dividends at an annual rate of 8.75% of par value. Such dividends are payable quarterly on the first day of January, April, July and October in each year commencing July 1, 1997 and totaled
$0.1 million
,
$0.2 million
and
$0.3 million
for fiscal years
2018
,
2017
and
2016
, respectively.
During March and April 2014, we issued, in aggregate, 9,300 shares of Series B-2 Preferred Stock at $100 par value (the “Series B-2 Preferred Stock”). The holders of the Series B-2 Preferred Stock are entitled to receive cumulative cash dividends at an annual rate of 4% of the liquidation value of $1,000 per share. Such dividends are payable quarterly on the first day of January, April, July and October in each year commencing July 1, 2014 and totaled
$0.4 million
in each of the fiscal years
2018
,
2017
and
2016
, respectively.
Defined Benefit Pension Plan
We have a noncontributory, defined benefit, single employer pension plan (the “Plan”), which provides retirement benefits for all eligible employees of the Company. Effective June 2004, the Company froze the Plan and no additional benefits accrued to participants subsequent to that date. We may make discretionary contributions to the Plan and we may be required to make contributions to adhere to applicable regulatory funding provisions, based in part on the Plan’s asset valuations and underlying actuarial assumptions. We made funding contributions of
$0.6 million
,
$0.7 million
and $0.5 million in fiscal years
2018
,
2017
and
2016
, respectively and we plan to contribute approximately $0.6 million to the Plan in fiscal year 2019.
Operating Lease Obligations
We have numerous operating lease commitments with remaining terms ranging from less than one year to ten years. In fiscal year 2008, we installed a one mega-watt photovoltaic solar array on one of our agricultural properties located in Ventura County that produces a significant portion of the power to run our lemon packinghouse. The construction of this array was financed by Farm Credit Leasing and we had a long-term lease with Farm Credit Leasing for this array. Annual payments for this lease were $0.5 million, the operating lease agreement terminated and the solar generator was purchased in fiscal year 2018 for $1.1 million. In fiscal year 2009, we entered into a similar transaction with Farm Credit Leasing for a second photovoltaic array at one of our agricultural properties located in the San Joaquin Valley to supply a significant portion of the power to operate four deep water well pumps located our property. Annual lease payments for this facility ranged from $0.3 million to $0.8 million, the operating lease agreement terminated and the solar array was purchased in the first quarter of fiscal year 2019 for $1.3 million.
We lease approximately 80 acres of lemons in Lindsay, California at a base rent of $500 per acre plus 50% of the operating profit of the leased acreage as defined in the lease. The lease expires December 2021 and includes four five-year renewal options. Estimated aggregate lease expense is approximately $0.1 million per year.
On July 1, 2013, we entered into a lease agreement with Cadiz, Inc. (“Cadiz”) to develop new lemon orchards on Cadiz’s agricultural property in eastern San Bernardino County, California (the “Cadiz Ranch”). Under the terms of this lease agreement, we have the right to lease and plant up to 1,280 acres of lemons over the next five years at the Cadiz Ranch operations in the Cadiz Valley and have leased 320 acres initially, subject to a mutually agreed upon planting schedule. This lease agreement provides options to plant up to 960 additional acres (320 acres in Option 1 and 640 acres in Option 2) by 2019. The annual rental payment includes a base rent of $200 per planted acre and a lease payment equal to 20% of net cash flow from the harvested crops grown on Cadiz property. Pursuant to the terms of the lease agreement, the annual rental payment will not exceed a total of $1,200 per acre. We incurred approximately $0.1 million of lease expense in fiscal years
2018
,
2017
and
2016
.
On February 3, 2015, we amended our lease agreement with Cadiz. The amendment, among other things; increased by 200 acres the amount of property leased by us under the lease agreement dated July 1, 2013. In connection with the amendment, we paid a total of $1.2 million to acquire existing lemon trees and irrigations systems from Cadiz and a Cadiz tenant. In February 2016, Cadiz assigned this lease to Fenner Valley Farms, LLC, a subsidiary of Water Asset Management, LLC (“WAM”). An entity affiliated with WAM is the holder of 9,300 shares of our Series B-2 convertible preferred stock.
We lease machinery and equipment for our packing operations and other land for our agricultural operations under leases with annual lease commitments that are individually immaterial.
53
Real Estate Development Activities, Capital Expenditures and Related Capital Resources
On November 10, 2015 (the “Transaction Date”), we entered into the Joint Venture with Lewis for the residential development of our East Area I real estate development project. To consummate the transaction, we formed Limoneira Lewis Community Builders, LLC as the development entity, contributed our East Area I property to the Joint Venture and sold a 50% interest in the Joint Venture to Lewis for $20.0 million, comprised of a $2.0 million deposit received in September 2015 and $18.0 million received on the Transaction Date. We received net cash of approximately $18.8 million after transaction costs of approximately $1.2 million, which were expensed in the first quarter of fiscal year 2016. In addition, on the Transaction Date, we incurred a Success Fee with Parkstone Companies, Inc., in the amount of $2.1 million, which was capitalized as a component of our investment in the Joint Venture.
The Joint Venture agreement provides that Lewis will serve as the manager of the Joint Venture with the right to manage, control and conduct its day-to-day business and development activities. Certain major decisions, which are enumerated in the Joint Venture agreement, require approval by an executive committee comprised of two representatives appointed by Lewis and two representatives appointed by Limoneira.
Pursuant to the Joint Venture agreement, the Joint Venture will own, develop, subdivide, entitle, maintain, improve, hold for investment, market and dispose of the Joint Venture’s property in accordance with the business plan and budget approved by the executive committee.
Further, on the Transaction Date, the Joint Venture and Limoneira entered into a lease agreement (the "Lease Agreement"), pursuant to which the Joint Venture leased certain of the contributed East Area I property back to Limoneira for continuation of agricultural operations, and certain other permitted uses, on the property until the Joint Venture required the property for development. The Lease Agreement can terminate in stages corresponding to the Joint Venture's development of the property, which is to occur in stages pursuant to a phased master development plan. The Joint Venture was required to provide Limoneira with written notice 180 days prior to the termination of any portion of the Lease Agreement. Limoneira terminated this Lease Agreement per the agreement in the first quarter of fiscal year 2019.
Limoneira and the Joint Venture entity also entered into a Retained Property Development Agreement on the Transaction Date (the "Retained Property Agreement"). Under the terms of the Retained Property Agreement, the Joint Venture will transfer certain contributed East Area I property, which is entitled for commercial development, back to Limoneira (the "Retained Property") and arrange for the design and construction of certain improvements to the Retained Property, subject to certain reimbursements by Limoneira. In August 2018, the Retained Property was transferred back to Limoneira.
We expect to receive approximately $100.0 million from the Joint Venture over the estimated 7 to 10-year life of the project including $20.0 million received on the consummation of the Joint Venture. The Joint Venture partners will share in capital contributions to fund project costs until project loan proceeds and or revenues are sufficient to fund the project. These funding requirements are currently estimated to total $15.0 to $20.0 million for each Joint Venture partner in the first three to four years of the project. We funded $4.0 million in the first quarter of fiscal year 2019, $3.5 million in fiscal year 2018, $7.5 million in fiscal year 2017 and $2.3 million in fiscal year 2016.
In January 2018, the Joint Venture entered into a $45.0 million unsecured Line of Credit Loan Agreement and Promissory Note (the “Loan”) with Bank of America, N.A. to fund early development activities. The Loan matures in January 2020, with an option to extend the maturity date until 2021, subject to certain conditions. The interest rate on the Loan is LIBOR plus 2.85%, payable monthly. The Loan contains certain customary default provisions and the Joint Venture may prepay any amounts outstanding under the Loan without penalty. In February 2018, the obligations under the Loan were guaranteed by certain principals from Lewis and by the Company. The Joint Venture recorded a $36.2 million outstanding loan balance at October 31, 2018 related to this Loan.
As noted above under “Transactions Affecting Liquidity and Capital Resources,” we have the ability to control the timing of a portion of our investing cash flows to the extent necessary based upon our liquidity demands. In order for our real estate development operations to reach their maximum potential benefit to our Company, however, we will need to be successful over time in identifying other third-party sources of capital to partner with us to move those development projects forward. While we are frequently engaged in discussions with several external sources of capital in respect of all of our development projects, current market conditions for California real estate projects, while improving, continue to be challenging and make it difficult to predict the timing and amounts of future capital that will be required to complete the development of our projects.
54
Off-Balance Sheet Arrangements
As discussed in Note 7 – Real Estate Development and Note 8 – Equity Investments of the notes to consolidated financial statements included in this Annual Report, we have investments in joint ventures and partnerships that are accounted for using the equity method of accounting.
Inflation
Historically, inflation has not had a material effect on our results of operations. However, significant increases in inflation could have an adverse impact on our business, financial condition and results of operations.
Critical Accounting Policies
The preparation of our consolidated financial statements in accordance with GAAP requires us to develop critical accounting policies and make certain estimates and judgments that may affect the reported amounts of assets, liabilities, revenues and expenses. We base our estimates and judgments on historical experience, available relevant data and other information that we believe to be reasonable under the circumstances. Actual results may materially differ from these estimates under different assumptions or conditions as new or additional information become available in future periods. We believe the following critical accounting policies reflect our more significant estimates and judgments used in the preparation of our consolidated financial statements.
Foreign Currency Translation
-
PDA and San Pablo’s functional currency is the Chilean Peso. Their balance sheets are translated to U.S. dollars at exchange rates in effect at the balance sheet date and their income statements are translated at average exchange rates during the reporting period. The resulting foreign currency translation adjustments are recorded as a separate component of accumulated other comprehensive income.
Revenue Recognition
-
As a general policy, revenue and related costs are recognized when (i) persuasive evidence of an arrangement exists, (ii) delivery has occurred, (iii) selling price is fixed or determinable and (iv) collectability is reasonably assured. We record a sales allowance in the period revenue is recognized as a provision for estimated customer discounts and concessions.
Agribusiness Revenue -
Revenue from lemon sales is generally recognized FOB shipping point when the customer takes possession of the fruit from our packinghouse. Revenue from the sales of certain of our agricultural products is recorded based on estimated proceeds provided by certain of our sales and marketing partners (Calavo and other third-party packinghouses) due to the time between when the product is delivered by us and the closing of the pools for such fruits at the end of each month. Calavo and other third-party packinghouses are agricultural cooperatives or function in a similar manner as an agricultural cooperative. As such, we apply specific authoritative agriculture revenue recognition guidance related to transactions between patrons and agriculture marketing cooperatives to record revenue at time of delivery to the packinghouses relating to fruits that are in pools that have not yet closed at month end if (i) the related fruits have been delivered to and accepted by Calavo and other third-party packinghouses (i.e., title has transferred to Calavo and other third-party packinghouses) and (ii) sales price information has been provided by Calavo and other third-party packinghouses (based on the marketplace activity for the related fruit) to estimate with reasonable certainty the final selling price for the fruit upon the closing of the pools. Historically, the revenue that is recorded based on the sales price information provided to us by Calavo and other third-party packinghouses at the time of delivery have not materially differed from the actual amounts that are paid after the monthly pools are closed. We also earn commissions on certain brokered fruit sales, which totaled $1,084,000, $324,000 and $263,000 in fiscal years
2018
,
2017
and
2016
, respectively.
Our avocados, oranges, specialty citrus and other specialty crops are packed and sold by Calavo and other third-party packinghouses. Specifically, we deliver all of our avocado production from our orchards to Calavo. These avocados are then packed by Calavo at its packinghouse, and sold and distributed under Calavo brands to its customers primarily in the United States and Canada. Our arrangements with other third-party packinghouses related to our oranges, specialty citrus and other specialty crops are similar to our arrangement with Calavo.
Our arrangements with third-party packinghouses are such that we are the producer and supplier of the product and the third-party packinghouses are our customers. The revenues we recognize related to the fruits sold to the third-party packinghouses are based on the volume and quality of the fruits delivered, and the market price for such fruit, less the packinghouses’ charges to pack and market the fruit. Such packinghouse charges include the grading, sizing, packing, cooling, ripening and marketing of the related fruit. We bear inventory risk until the product is delivered to the third-party packinghouses at which time title and inventory risk to the product is transferred to the third-party packinghouses and revenue is recognized. Such third-party packinghouse charges are recorded as a reduction of revenue based on the application of specific authoritative revenue recognition guidance related to a “Vendor’s Income Statement Characterization of Consideration Given to a Customer.” The identifiable benefit we receive from
55
the third-party packinghouses for packaging and marketing services cannot be sufficiently separated from the third-party packinghouses’ purchase of our products. In addition, we are not able to reasonably estimate the fair value of the benefit received from the third-party packinghouses for such services and, as such, these costs are characterized as a reduction of revenue in our consolidated statement of operations.
Revenue from crop insurance proceeds is recorded when the amount of and the right to receive the payment can be reasonably determined. We recorded agribusiness revenues from crop insurance proceeds of $54,000, $74,000 and $83,000 in fiscal years
2018
,
2017
and
2016
, respectively.
Rental Revenue -
Minimum rental revenues are generally recognized on a straight-line basis over the respective initial lease term. Contingent rental revenues are contractually defined as to the percentage of rent received by us and are based on fees collected by the lessee. Our rental arrangements generally require payment on a monthly or quarterly basis.
Real Estate Development Revenue -
We recognize revenue on real estate development projects in accordance with FASB ASC 360-20,
Real Estate Sales
, which provides for profit to be recognized in full when real estate is sold, provided that a sale has been consummated and profit is determinable, collection of sales proceeds is estimable with the seller’s receivable not subject to subordination, risks and rewards of ownership have been transferred to the buyer and the earnings process is substantially complete with no significant seller activities or obligations required after the date of sale. To the extent the above conditions are not met, a portion or all of the profit is deferred.
Incidental operations may occur during the holding or development period of real estate development projects to reduce holding or development costs. Incremental revenue from incidental operations in excess of incremental costs from incidental operations is accounted for as a reduction of development costs. Incremental costs from incidental operations in excess of incremental revenue from incidental operations are charged to operations.
Real Estate Development Costs
- We capitalize the planning, entitlement, construction and development costs associated with our various real estate projects. Costs that are not capitalized, which include property maintenance and repairs, general and administrative and marketing expenses, are expensed as incurred. A real estate development project is considered substantially complete upon the cessation of construction and development activities. Once a project is substantially completed, future costs are expensed as incurred. For fiscal year
2018
, we capitalized approximately $32.7 million of costs related to our real estate projects and expensed approximately $1.7 million of costs.
Income Taxes
- Deferred income tax assets and liabilities are computed annually for differences between the financial statement and income tax bases of assets and liabilities that will result in taxable or deductible amounts in the future. Such deferred income tax asset and liability computations are based on enacted tax laws and rates applicable to periods in which the differences are expected to affect taxable income. A valuation allowance is established, when necessary, to reduce deferred income tax assets to the amount expected to be realized.
Tax benefits from an uncertain tax position are only recognized if it is more likely than not that the tax position will be sustained upon examination by the taxing authorities, based on the technical merits of the position. The tax benefits recognized in the financial statements from such a position are measured based on the largest benefit that has a greater than 50% likelihood of being realized upon ultimate settlement.
Business Combinations and Asset Acquisitions
- Business Combinations are accounted for under the acquisition method in accordance with ASC 805,
Business Combinations
. The acquisition method requires identifiable assets acquired and liabilities assumed and any noncontrolling interest in the business acquired be recognized and measured at fair value on the acquisition date, which is the date that the acquirer obtains control of the acquired business. The amount by which the fair value of consideration transferred as the purchase price exceeds the net fair value of assets acquired and liabilities assumed is recorded as goodwill. Acquisitions that do not meet the definition of a business under the ASC are accounted for as asset acquisitions. Asset acquisitions are accounted for by allocating the cost of the acquisition to the individual assets acquired and liabilities assumed on a relative fair value basis. Goodwill is not recognized in an asset acquisition with any consideration in excess of net assets acquired allocated to acquired assets on a relative fair value basis. Transaction costs are expensed in a business combination and are considered a component of the cost of the acquisition in an asset acquisition.
Derivative Financial Instruments
- We use derivative financial instruments for purposes other than trading to manage our exposure to interest rates as well as to maintain an appropriate mix of fixed and floating-rate debt. Contract terms of our hedge instruments closely mirror those of the hedged item, providing a high degree of risk reduction and correlation. Contracts that are effective at meeting the risk reduction and correlation criteria are recorded using hedge accounting. If a derivative instrument is a hedge, depending on the nature of the hedge, changes in the fair value of the instrument will be either offset against the change in the fair
56
value of the hedged assets, liabilities or firm commitments through earnings or be recognized in other comprehensive income until the hedged item is recognized in earnings. The ineffective portion of an instrument’s change in fair value will be immediately recognized in earnings. Instruments that do not meet the criteria for hedge accounting, or contracts for which we have not elected hedge accounting, are valued at fair value with unrealized gains or losses reported in earnings during the period of change.
Impairment of Long-Lived Assets
- We evaluate our long-lived assets including our real estate development projects for impairment when events or changes in circumstances indicate the carrying value of these assets may not be recoverable. As a result of various factors, in recent years, we recorded impairment charges of
$1.6 million
,
$0.1 million
and
zero
in fiscal years
2018
,
2017
and
2016
, respectively.
Defined Benefit Retirement Plan
- As discussed in the notes to our consolidated financial statements, we sponsor a defined benefit retirement plan that was frozen in June 2004, and no future benefits accrued to participants subsequent to that time. Ongoing accounting for this plan under FASB ASC 715 provides guidance as to, among other things, future estimated pension expense, pension liability and minimum funding requirements. This information is provided to us by third-party actuarial consultants. In developing this data, certain estimates and assumptions are used, including among other things, discount rate, long-term rate of return and mortality tables. During 2018, the Society of Actuaries (“SOA”) released a new mortality improvement scale table, referred to as MP-2018, which is believed to better reflect mortality improvements and is to be used in calculating defined benefit pension obligations. In addition, during fiscal year 2018, the assumed discount rate to measure the pension obligation increased to 4.4%. The Company used the latest mortality tables released by the SOA through
October 31, 2018
to measure its pension obligation as of
October 31, 2018
and combined with the assumed discount rate and other demographic assumptions, its pension liability decreased by approximately
$1.5 million
as of
October 31, 2018
. Further changes in any of these estimates could materially affect the amounts recorded that are related to our defined benefit retirement plan.
Recent Accounting Pronouncements
See Note 2, "Summary of Significant Accounting Policies" of the notes to consolidated financial statements included in this Annual Report for information concerning recent accounting pronouncements.
57
Item 7A. Quantitative and Qualitative Disclosures about Market Risk
Interest Rate Risk
Borrowings under the Farm Credit West Credit Facility and Farm Credit West Term Loans are or will be subject to variable interest rates. These variable interest rates subject us to the risk of increased interest costs associated with any upward movements in interest rates. For the Farm Credit West Credit Facility and Farm Credit West Term Loans, our borrowing interest rate is an internally calculated rate based on Farm Credit West’s internal monthly operations and their cost of funds and generally follows the changes in the 90-day treasury rates in increments divisible by 0.25%. At
October 31, 2018
, our total debt outstanding under the Farm Credit West Credit Facility and the Farm Credit West Term Loans was
$50.9 million
and
$19.7 million
, respectively.
From time to time, we manage our exposure to interest rate movements by utilizing interest rate swaps (derivatives). We had fixed $40.0 million of our outstanding borrowings with a “fixed-to-floating” interest rate swap as described in the following table (in thousands):
|
Notional Amount
|
Fair Value Net Liability
|
||||||||||||||
|
October 31, 2018
|
October 31, 2017
|
October 31, 2018
|
October 31, 2017
|
||||||||||||
|
Pay fixed-rate, receive floating-rate interest rate swap, matured June 2018
|
$
|
—
|
|
$
|
40,000
|
|
$
|
—
|
|
$
|
268
|
|
|||
Effective July 2013, we fixed the interest rate on our $40.0 million swap at 4.30%. This interest rate swap expired June 30, 2018. Based on our level of borrowings at
October 31, 2018
a 1% increase in interest rates would increase our interest expense
$0.1
million for fiscal year 2019 and an annual average of
$0.2
million for the three subsequent fiscal years. Additionally, a 1% increase in the interest rate would decrease our net income by
$0.1
million for fiscal year 2019 and an annual average of
$0.1
million for the three subsequent fiscal years. Refer to the “Management’s Discussion and Analysis of Financial Condition and Results of Operations – Liquidity and Capital Resources” for additional information.
58
Item 8. Financial Statements and Supplementary Data
Limoneira Company
Index to Consolidated Financial Statements
|
Management’s Report on Internal Control over Financial Reporting
|
|
|
Report of Independent Registered Public Accounting Firm on Internal Control over Financial Reporting
|
|
|
Report of Independent Registered Public Accounting Firm
|
|
|
Consolidated Financial Statements of Limoneira Company
|
|
|
Consolidated Balance Sheets at October 31, 2018 and 2017
|
|
|
Consolidated Statements of Operations for the years ended October 31, 2018, 2017 and 2016
|
|
|
Consolidated Statements of Comprehensive Income for the years ended October 31, 2018, 2017 and 2016
|
|
|
Consolidated Statements of Stockholders’ Equity and Temporary Equity for the years ended October 31, 2018, 2017 and 2016
|
|
|
Consolidated Statements of Cash Flows for the years ended October 31, 2018, 2017 and 2016
|
|
|
Notes to Consolidated Financial Statements
|
|
All schedules are omitted for the reason that they are not applicable or the required information is included in the Consolidated Financial Statements or the notes thereto.
59
Management’s Report on Internal Control over Financial Reporting
Management of Limoneira Company (the “Company”) is responsible for establishing and maintaining adequate internal control over financial reporting as such term is defined in the Exchange Act Rule 13a-15(f). Internal control over financial reporting is designed to provide reasonable assurance regarding the reliability of financial reporting and the preparation of financial statements for external purposes in accordance with generally accepted accounting principles.
Because of its inherent limitations, internal control over financial reporting may not prevent or detect misstatements. Also, projections of any evaluation of effectiveness to future periods are subject to the risk that controls may become inadequate because of changes in conditions, or that the degree of compliance with the policies or procedures may deteriorate.
The Company’s management, including the principal executive officer and principal financial officer, conducted an evaluation of the effectiveness of Limoneira Company’s internal control over financial reporting, based on the framework in Internal Control—Integrated Framework issued by the Committee of Sponsoring Organizations of the Treadway Commission (2013 framework). Based on this evaluation, management concluded that internal control over financial reporting was effective as of October 31, 2018. Ernst & Young LLP, an independent registered public accounting firm, has audited the effectiveness of the Company’s internal control over financial reporting and has issued a report on internal control over financial reporting, which is included herein.
The Company’s management excluded Oxnard Lemon which was acquired as a business combination on July 24, 2018, from its assessment and management’s report on internal control over financial reporting at October 31, 2018, as they continue to evaluate their respective internal controls. Oxnard Lemons’s total assets and total revenues represent 6% and 0%, respectively, of its related consolidated financial statement amounts as of and for the year ended October 31, 2018. This exclusion is in accordance with the general guidance issued by the Staff of the Securities and Exchange Commission that an assessment of a recent business combination may be omitted from management’s report on internal control over financial reporting in the first year of consolidation.
|
Harold S. Edwards
|
|
|
President and Chief Executive Officer
|
|
|
|
|
|
Mark Palamountain
|
|
|
Chief Financial Officer, Treasurer and Corporate Secretary
|
|
60
Report of Independent Registered Public Accounting Firm
The Stockholders and Board of Directors of Limoneira Company
Opinion on Internal Control over Financial Reporting
We have audited Limoneira Company’s internal control over financial reporting as of October 31, 2018, based on criteria established in Internal Control-Integrated Framework issued by the Committee of Sponsoring Organizations of the Treadway Commission (2013 framework) (the COSO criteria). In our opinion, Limoneira Company (the Company) maintained, in all material respects, effective internal control over financial reporting as of October 31, 2018, based on the COSO criteria.
As indicated in the accompanying Management’s Report on Internal Control over Financial Reporting, management’s assessment of and conclusion on the effectiveness of internal control over financial reporting did not include the internal controls of Oxnard Lemon, which are included in the 2018 consolidated financial statements of the Company and constituted 6% and 6% of total and net assets, respectively, as of October 31, 2018 and 0% and 1% of revenues and net income, respectively, for the year then ended. Our audit of internal control over financial reporting of the Company also did not include an evaluation of the internal control over financial reporting of Oxnard Lemon.
We also have audited, in accordance with the standards of the Public Company Accounting Oversight Board (United States) (PCAOB) the consolidated balance sheets of the Company as of October 31, 2018 and 2017, and the related consolidated statements of operations, comprehensive income, stockholders' equity and temporary equity, and cash flows for each of the three years in the period ended October 31, 2018, and the related notes and our report dated January 14, 2019 expressed an unqualified opinion thereon.
Basis for Opinion
The Company’s management is responsible for maintaining effective internal control over financial reporting and for its assessment of the effectiveness of internal control over financial reporting included in the accompanying Management’s Report on Internal Control Over Financial Reporting. Our responsibility is to express an opinion on the Company’s internal control over financial reporting based on our audit. We are a public accounting firm registered with the PCAOB and are required to be independent with respect to the Company in accordance with the U.S. federal securities laws and the applicable rules and regulations of the Securities and Exchange Commission and the PCAOB.
We conducted our audit in accordance with the standards of the PCAOB. Those standards require that we plan and perform the audit to obtain reasonable assurance about whether effective internal control over financial reporting was maintained in all material respects.
Our audit included obtaining an understanding of internal control over financial reporting, assessing the risk that a material weakness exists, testing and evaluating the design and operating effectiveness of internal control based on the assessed risk, and performing such other procedures as we considered necessary in the circumstances. We believe that our audit provides a reasonable basis for our opinion.
Definition and Limitations of Internal Control Over Financial Reporting
A company’s internal control over financial reporting is a process designed to provide reasonable assurance regarding the reliability of financial reporting and the preparation of financial statements for external purposes in accordance with generally accepted accounting principles. A company’s internal control over financial reporting includes those policies and procedures that (1) pertain to the maintenance of records that, in reasonable detail, accurately and fairly reflect the transactions and dispositions of the assets of the company; (2) provide reasonable assurance that transactions are recorded as necessary to permit preparation of financial statements in accordance with generally accepted accounting principles, and that receipts and expenditures of the company are being made only in accordance with authorizations of management and directors of the company; and (3) provide reasonable assurance regarding prevention or timely detection of unauthorized acquisition, use, or disposition of the company’s assets that could have a material effect on the financial statements.
Because of its inherent limitations, internal control over financial reporting may not prevent or detect misstatements. Also, projections of any evaluation of effectiveness to future periods are subject to the risk that controls may become inadequate because of changes in conditions, or that the degree of compliance with the policies or procedures may deteriorate.
61
|
|
/s/ Ernst & Young LLP
|
|
Los Angeles, California
January 14, 2019
62
Report of Independent Registered Public Accounting Firm
The Stockholders and Board of Directors of Limoneira Company
Opinion on the Financial Statements
We have audited the accompanying consolidated balance sheets of Limoneira Company (the Company) as of October 31, 2018 and 2017, and the related consolidated statements of operations, comprehensive income, stockholders' equity and temporary equity, and cash flows for each of the three years in the period ended October 31, 2018, and the related notes (collectively referred to as the “consolidated financial statements”). In our opinion, the consolidated financial statements present fairly, in all material respects, the financial position of the Company at October 31, 2018 and 2017, and the results of its operations and its cash flows for each of the three years in the period ended October 31, 2018, in conformity with U.S. generally accepted accounting principles.
We also have audited, in accordance with the standards of the Public Company Accounting Oversight Board (United States) (PCAOB), the Company's internal control over financial reporting as of October 31, 2018, based on criteria established in Internal Control-Integrated Framework issued by the Committee of Sponsoring Organizations of the Treadway Commission (2013 framework) and our report dated January 14, 2019 expressed an unqualified opinion thereon.
Basis for Opinion
These financial statements are the responsibility of the Company's management. Our responsibility is to express an opinion on the Company’s financial statements based on our audits. We are a public accounting firm registered with the PCAOB and are required to be independent with respect to the Company in accordance with the U.S. federal securities laws and the applicable rules and regulations of the Securities and Exchange Commission and the PCAOB.
We conducted our audits in accordance with the standards of the PCAOB. Those standards require that we plan and perform the audit to obtain reasonable assurance about whether the financial statements are free of material misstatement, whether due to error or fraud. Our audits included performing procedures to assess the risks of material misstatement of the financial statements, whether due to error or fraud, and performing procedures that respond to those risks. Such procedures included examining, on a test basis, evidence regarding the amounts and disclosures in the financial statements. Our audits also included evaluating the accounting principles used and significant estimates made by management, as well as evaluating the overall presentation of the financial statements. We believe that our audits provide a reasonable basis for our opinion.
|
|
/s/ Ernst & Young LLP
|
|
We have served as the Company’s auditor since 2006.
Los Angeles, California
January 14, 2019
63
LIMONEIRA COMPANY
CONSOLIDATED BALANCE SHEETS
($ in thousands, except share amounts)
|
|
October 31,
|
|||||||
|
|
2018
|
2017
|
||||||
|
Assets
|
|
|
|
|
||||
|
Current assets:
|
|
|
|
|
||||
|
Cash
|
$
|
609
|
|
$
|
492
|
|
||
|
Accounts receivable, net
|
14,116
|
|
10,953
|
|
||||
|
Cultural costs
|
5,413
|
|
4,124
|
|
||||
|
Prepaid expenses and other current assets
|
10,528
|
|
6,981
|
|
||||
|
Income taxes receivable
|
378
|
|
570
|
|
||||
|
Total current assets
|
31,044
|
|
23,120
|
|
||||
|
Property, plant and equipment, net
|
225,681
|
|
188,225
|
|
||||
|
Real estate development
|
107,162
|
|
81,082
|
|
||||
|
Equity in investments
|
18,698
|
|
14,061
|
|
||||
|
Investment in Calavo Growers, Inc.
|
24,250
|
|
22,110
|
|
||||
|
Other assets
|
14,504
|
|
10,433
|
|
||||
|
Total Assets
|
$
|
421,339
|
|
$
|
339,031
|
|
||
|
Liabilities and Stockholders' Equity
|
||||||||
|
Current liabilities:
|
||||||||
|
Accounts payable
|
$
|
6,134
|
|
$
|
6,311
|
|
||
|
Growers payable
|
10,089
|
|
8,828
|
|
||||
|
Accrued liabilities
|
7,724
|
|
5,177
|
|
||||
|
Fair value of derivative instrument
|
—
|
|
268
|
|
||||
|
Current portion of long-term debt
|
3,127
|
|
3,030
|
|
||||
|
Total current liabilities
|
27,074
|
|
23,614
|
|
||||
|
Long-term liabilities:
|
||||||||
|
Long-term debt, less current portion
|
76,966
|
|
102,083
|
|
||||
|
Deferred income taxes
|
25,372
|
|
31,415
|
|
||||
|
Other long-term liabilities
|
3,647
|
|
3,920
|
|
||||
|
Sale-leaseback deferral
|
58,330
|
|
30,396
|
|
||||
|
Total liabilities
|
191,389
|
|
191,428
|
|
||||
|
Commitments and contingencies
|
—
|
|
—
|
|
||||
|
Series B Convertible Preferred Stock – $100.00 par value (50,000 shares authorized: 14,790 shares issued and outstanding at October 31, 2018 and 2017) (8.75% coupon rate)
|
1,479
|
|
1,479
|
|
||||
|
Series B-2 Convertible Preferred Stock – $100.00 par value (10,000 shares authorized: 9,300 shares issued and outstanding at October 31, 2018 and 2017) (4% dividend rate on liquidation value of $1,000 per share)
|
9,331
|
|
9,331
|
|
||||
|
Stockholders' equity:
|
||||||||
|
Series A Junior Participating Preferred Stock – $0.01 par value (20,000 shares authorized: zero issued or outstanding at October 31, 2018 and 2017)
|
—
|
|
—
|
|
||||
|
Common Stock – $0.01 par value (39,000,000 shares authorized: 17,647,135 and 14,405,031 shares issued and outstanding at October 31, 2018 and 2017, respectively)
|
176
|
|
144
|
|
||||
|
Additional paid-in capital
|
159,071
|
|
94,294
|
|
||||
|
Retained earnings
|
50,354
|
|
34,692
|
|
||||
|
Accumulated other comprehensive income
|
8,965
|
|
7,076
|
|
||||
|
Noncontrolling interest
|
574
|
|
587
|
|
||||
|
Total stockholders' equity
|
219,140
|
|
136,793
|
|
||||
|
Total Liabilities and Stockholders' Equity
|
$
|
421,339
|
|
$
|
339,031
|
|
||
See Notes to Consolidated Financial Statements.
64
LIMONEIRA COMPANY
CONSOLIDATED STATEMENTS OF OPERATIONS
($ in thousands, except share amounts)
|
|
Years Ended October 31,
|
|||||||||||
|
|
2018
|
2017
|
2016
|
|||||||||
|
Net revenues:
|
|
|
|
|
|
|
||||||
|
Agribusiness
|
$
|
124,344
|
|
$
|
115,869
|
|
$
|
106,130
|
|
|||
|
Rental operations
|
5,048
|
|
5,440
|
|
5,603
|
|
||||||
|
Real estate development
|
—
|
|
—
|
|
56
|
|
||||||
|
Total net revenues
|
129,392
|
|
121,309
|
|
111,789
|
|
||||||
|
Costs and expenses:
|
||||||||||||
|
Agribusiness
|
98,083
|
|
91,162
|
|
83,604
|
|
||||||
|
Rental operations
|
4,085
|
|
3,932
|
|
3,617
|
|
||||||
|
Real estate development
|
127
|
|
285
|
|
2,061
|
|
||||||
|
Impairment of real estate development assets
|
1,558
|
|
120
|
|
—
|
|
||||||
|
Selling, general and administrative
|
16,053
|
|
13,947
|
|
13,319
|
|
||||||
|
Total cost and expenses
|
119,906
|
|
109,446
|
|
102,601
|
|
||||||
|
Operating income
|
9,486
|
|
11,863
|
|
9,188
|
|
||||||
|
Other income (expense):
|
||||||||||||
|
Interest expense, net
|
(1,122
|
)
|
(1,778
|
)
|
(1,409
|
)
|
||||||
|
Equity in earnings of investments
|
583
|
|
49
|
|
634
|
|
||||||
|
Gain on sale of stock in Calavo Growers, Inc.
|
4,223
|
|
—
|
|
3,419
|
|
||||||
|
Gain on sale of conservation easement
|
—
|
|
—
|
|
995
|
|
||||||
|
Other income, net
|
313
|
|
492
|
|
498
|
|
||||||
|
Total other income (expense)
|
3,997
|
|
(1,237
|
)
|
4,137
|
|
||||||
|
Income before income tax benefit (provision)
|
13,483
|
|
10,626
|
|
13,325
|
|
||||||
|
Income tax benefit (provision)
|
6,729
|
|
(4,077
|
)
|
(5,267
|
)
|
||||||
|
Net income
|
20,212
|
|
6,549
|
|
8,058
|
|
||||||
|
(Income) loss attributable to noncontrolling interest
|
(24
|
)
|
46
|
|
—
|
|
||||||
|
Net income attributable to Limoneira Company
|
20,188
|
|
6,595
|
|
8,058
|
|
||||||
|
Preferred dividends
|
(501
|
)
|
(560
|
)
|
(628
|
)
|
||||||
|
Net income applicable to common stock
|
$
|
19,687
|
|
$
|
6,035
|
|
$
|
7,430
|
|
|||
|
Basic net income per common share
|
$
|
1.26
|
|
$
|
0.42
|
|
$
|
0.52
|
|
|||
|
Diluted net income per common share
|
$
|
1.25
|
|
$
|
0.42
|
|
$
|
0.52
|
|
|||
|
Dividends per common share
|
$
|
0.25
|
|
$
|
0.22
|
|
$
|
0.20
|
|
|||
|
Weighted-average common shares outstanding-basic
|
15,581,000
|
|
14,315,000
|
|
14,168,000
|
|
||||||
|
Weighted-average common shares outstanding-diluted
|
16,209,000
|
|
14,315,000
|
|
14,168,000
|
|
||||||
See Notes to Consolidated Financial Statements.
65
LIMONEIRA COMPANY
CONSOLIDATED STATEMENTS OF COMPREHENSIVE INCOME
(In thousands)
|
|
Years Ended October 31,
|
|||||||||||
|
|
2018
|
2017
|
2016
|
|||||||||
|
Net income
|
$
|
20,212
|
|
$
|
6,549
|
|
$
|
8,058
|
|
|||
|
Other comprehensive income (loss), net of tax:
|
||||||||||||
|
Foreign currency translation adjustments
|
(1,255
|
)
|
2
|
|
—
|
|
||||||
|
Minimum pension liability adjustments, net of tax of $415, $767 and $(443)
|
1,137
|
|
1,175
|
|
(688
|
)
|
||||||
|
Unrealized holding gains on security available for sale, net of tax of $1,956, $1,722 and $1,049
|
4,809
|
|
2,643
|
|
1,619
|
|
||||||
|
Reclassification of unrealized gain on security sold, net of tax of $(1,160), $0 and $(1,111)
|
(2,965
|
)
|
—
|
|
(1,719
|
)
|
||||||
|
Unrealized gains from derivative instruments, net of tax of $79, $330 and $216
|
163
|
|
553
|
|
335
|
|
||||||
|
Total other comprehensive income (loss), net of tax
|
1,889
|
|
4,373
|
|
(453
|
)
|
||||||
|
Comprehensive income
|
22,101
|
|
10,922
|
|
7,605
|
|
||||||
|
Comprehensive (income) loss attributable to noncontrolling interest
|
(13
|
)
|
46
|
|
—
|
|
||||||
|
Comprehensive income attributable to Limoneira Company
|
$
|
22,088
|
|
$
|
10,968
|
|
$
|
7,605
|
|
|||
See Notes to Consolidated Financial Statements.
66
LIMONEIRA COMPANY
CONSOLIDATED STATEMENTS OF STOCKHOLDERS’ EQUITY AND TEMPORARY EQUITY
($ in thousands)
|
|
Stockholders’ Equity
|
|
Temporary Equity
|
||||||||||||||||||||||||||||||||
|
|
Common Stock
|
Additional
Paid-In
|
Retained
|
Accumulated
Other
Comprehensive
|
Noncontrolling
|
|
|
Series B
Preferred
|
Series B-2
Preferred
|
||||||||||||||||||||||||||
|
|
Shares
|
Amount
|
Capital
|
Earnings
|
Income (Loss)
|
Interest
|
Total
|
Stock
|
Stock
|
||||||||||||||||||||||||||
|
Balance at October 31, 2015
|
14,135,080
|
|
$
|
141
|
|
$
|
90,759
|
|
$
|
27,216
|
|
$
|
3,156
|
|
$
|
—
|
|
$
|
121,272
|
|
$
|
2,950
|
|
$
|
9,331
|
|
|||||||||
|
Dividends - common
|
—
|
|
—
|
|
—
|
|
(2,834
|
)
|
—
|
|
—
|
|
(2,834
|
)
|
—
|
|
—
|
|
|||||||||||||||||
|
Dividends - Series B
|
—
|
|
—
|
|
—
|
|
(256
|
)
|
—
|
|
—
|
|
(256
|
)
|
—
|
|
—
|
|
|||||||||||||||||
|
Dividends - Series B-2
|
—
|
|
—
|
|
—
|
|
(372
|
)
|
—
|
|
(372
|
)
|
—
|
|
—
|
|
|||||||||||||||||||
|
Stock compensation
|
49,329
|
|
1
|
|
1,308
|
|
—
|
|
—
|
|
—
|
|
1,309
|
|
—
|
|
—
|
|
|||||||||||||||||
|
Exchange of common stock
|
(12,433
|
)
|
—
|
|
(190
|
)
|
—
|
|
—
|
|
—
|
|
(190
|
)
|
—
|
|
—
|
|
|||||||||||||||||
|
Conversion of Series B preferred stock
|
6,250
|
|
—
|
|
50
|
|
—
|
|
—
|
|
—
|
|
50
|
|
(50
|
)
|
—
|
|
|||||||||||||||||
|
Tax provision of stock grant vesting
|
—
|
|
—
|
|
(86
|
)
|
—
|
|
—
|
|
—
|
|
(86
|
)
|
—
|
|
—
|
|
|||||||||||||||||
|
Net income
|
—
|
|
—
|
|
—
|
|
8,058
|
|
—
|
|
—
|
|
8,058
|
|
—
|
|
—
|
|
|||||||||||||||||
|
Other comprehensive loss, net of tax
|
—
|
|
—
|
|
—
|
|
—
|
|
(453
|
)
|
—
|
|
(453
|
)
|
—
|
|
—
|
|
|||||||||||||||||
|
Balance at October 31, 2016
|
14,178,226
|
|
142
|
|
91,841
|
|
31,812
|
|
2,703
|
|
—
|
|
126,498
|
|
2,900
|
|
9,331
|
|
|||||||||||||||||
|
Dividends - common
|
—
|
|
—
|
|
—
|
|
(3,155
|
)
|
—
|
|
—
|
|
(3,155
|
)
|
—
|
|
—
|
|
|||||||||||||||||
|
Dividends - Series B
|
—
|
|
—
|
|
—
|
|
(188
|
)
|
—
|
|
—
|
|
(188
|
)
|
—
|
|
—
|
|
|||||||||||||||||
|
Dividends - Series B-2
|
—
|
|
—
|
|
—
|
|
(372
|
)
|
—
|
|
—
|
|
(372
|
)
|
—
|
|
—
|
|
|||||||||||||||||
|
Stock compensation
|
63,954
|
|
1
|
|
1,327
|
|
—
|
|
—
|
|
—
|
|
1,328
|
|
—
|
|
—
|
|
|||||||||||||||||
|
Exchange of common stock
|
(14,773
|
)
|
—
|
|
(294
|
)
|
—
|
|
—
|
|
—
|
|
(294
|
)
|
—
|
|
—
|
|
|||||||||||||||||
|
Conversion of Series B preferred stock
|
177,624
|
|
1
|
|
1,420
|
|
—
|
|
—
|
|
—
|
|
1,421
|
|
(1,421
|
)
|
—
|
|
|||||||||||||||||
|
Noncontrolling interest
|
—
|
|
—
|
|
—
|
|
—
|
|
—
|
|
633
|
|
633
|
|
—
|
|
—
|
|
|||||||||||||||||
|
Net income
|
—
|
|
—
|
|
—
|
|
6,595
|
|
—
|
|
(46
|
)
|
6,549
|
|
—
|
|
—
|
|
|||||||||||||||||
|
Other comprehensive income, net of tax
|
—
|
|
—
|
|
—
|
|
—
|
|
4,373
|
|
—
|
|
4,373
|
|
—
|
|
—
|
|
|||||||||||||||||
|
Balance at October 31, 2017
|
14,405,031
|
|
144
|
|
94,294
|
|
34,692
|
|
7,076
|
|
587
|
|
136,793
|
|
1,479
|
|
9,331
|
|
|||||||||||||||||
|
Dividends - common
|
—
|
|
—
|
|
—
|
|
(4,025
|
)
|
—
|
|
—
|
|
(4,025
|
)
|
—
|
|
—
|
|
|||||||||||||||||
|
Dividends - Series B
|
—
|
|
—
|
|
—
|
|
(129
|
)
|
—
|
|
—
|
|
(129
|
)
|
—
|
|
—
|
|
|||||||||||||||||
|
Dividends - Series B-2
|
—
|
|
—
|
|
—
|
|
(372
|
)
|
—
|
|
—
|
|
(372
|
)
|
—
|
|
—
|
|
|||||||||||||||||
|
Stock compensation
|
145,324
|
|
1
|
|
1,367
|
|
—
|
|
—
|
|
—
|
|
1,368
|
|
—
|
|
—
|
|
|||||||||||||||||
|
Exchange of common stock
|
(39,582
|
)
|
—
|
|
(656
|
)
|
—
|
|
—
|
|
—
|
|
(656
|
)
|
—
|
|
—
|
|
|||||||||||||||||
|
Issuance of common stock
|
3,136,362
|
|
31
|
|
64,066
|
|
—
|
|
—
|
|
—
|
|
64,097
|
|
—
|
|
—
|
|
|||||||||||||||||
|
Noncontrolling interest
|
—
|
|
—
|
|
—
|
|
—
|
|
—
|
|
(37
|
)
|
(37
|
)
|
—
|
|
—
|
|
|||||||||||||||||
|
Net income
|
—
|
|
—
|
|
—
|
|
20,188
|
|
—
|
|
24
|
|
20,212
|
|
—
|
|
—
|
|
|||||||||||||||||
|
Other comprehensive income, net of tax
|
—
|
|
—
|
|
—
|
|
—
|
|
1,889
|
|
—
|
|
1,889
|
|
—
|
|
—
|
|
|||||||||||||||||
|
Balance at October 31, 2018
|
17,647,135
|
|
$
|
176
|
|
$
|
159,071
|
|
$
|
50,354
|
|
$
|
8,965
|
|
$
|
574
|
|
$
|
219,140
|
|
$
|
1,479
|
|
$
|
9,331
|
|
|||||||||
See Notes to Consolidated Financial Statements
67
LIMONEIRA COMPANY
CONSOLIDATED STATEMENTS OF CASH FLOWS
(In thousands)
|
|
Years Ended October 31,
|
|||||||||||
|
|
2018
|
2017
|
2016
|
|||||||||
|
Operating activities
|
|
|
|
|
|
|
||||||
|
Net income
|
$
|
20,212
|
|
$
|
6,549
|
|
$
|
8,058
|
|
|||
|
Adjustments to reconcile net income to net cash provided by operating activities:
|
||||||||||||
|
Depreciation and amortization
|
7,275
|
|
6,467
|
|
5,339
|
|
||||||
|
Impairment of real estate development assets
|
1,558
|
|
120
|
|
—
|
|
||||||
|
Loss on disposals of assets
|
178
|
|
300
|
|
125
|
|
||||||
|
Gain on sales of real estate developments assets
|
(25
|
)
|
—
|
|
—
|
|
||||||
|
Stock compensation expense
|
1,368
|
|
1,328
|
|
1,309
|
|
||||||
|
Equity in earnings of investments
|
(583
|
)
|
(49
|
)
|
(634
|
)
|
||||||
|
Cash distributions from equity investments
|
526
|
|
712
|
|
642
|
|
||||||
|
Deferred income taxes
|
(7,307
|
)
|
2,292
|
|
6,195
|
|
||||||
|
Amortization of deferred financing costs
|
30
|
|
90
|
|
49
|
|
||||||
|
Accrued interest on note receivable
|
(192
|
)
|
(23
|
)
|
(23
|
)
|
||||||
|
Gain on sale of stock in Calavo Growers, Inc.
|
(4,223
|
)
|
—
|
|
(3,419
|
)
|
||||||
|
Gain on sale of conservation easement
|
—
|
|
—
|
|
(995
|
)
|
||||||
|
Fair value adjustment of contingent consideration
|
—
|
|
—
|
|
(300
|
)
|
||||||
|
Changes in operating assets and liabilities, net of business combinations:
|
||||||||||||
|
Account receivable, net
|
(3,235
|
)
|
(1,557
|
)
|
(1,880
|
)
|
||||||
|
Cultural costs
|
(746
|
)
|
193
|
|
72
|
|
||||||
|
Prepaid expenses and other current assets
|
99
|
|
138
|
|
78
|
|
||||||
|
Income taxes receivable
|
192
|
|
2,240
|
|
(2,810
|
)
|
||||||
|
Other assets
|
(134
|
)
|
275
|
|
312
|
|
||||||
|
Accounts payable and growers payable
|
707
|
|
471
|
|
808
|
|
||||||
|
Accrued liabilities
|
2,601
|
|
(1,263
|
)
|
1,249
|
|
||||||
|
Other long-term liabilities
|
96
|
|
199
|
|
129
|
|
||||||
|
Net cash provided by operating activities
|
18,397
|
|
18,482
|
|
14,304
|
|
||||||
|
Investing activities
|
||||||||||||
|
Capital expenditures
|
(13,873
|
)
|
(12,901
|
)
|
(16,252
|
)
|
||||||
|
Purchase of real estate development parcel
|
(1,444
|
)
|
—
|
|
—
|
|
||||||
|
Net proceeds from sales of real estate development assets
|
1,543
|
|
—
|
|
—
|
|
||||||
|
Proceeds from sale of LLC Interest
|
—
|
|
—
|
|
18,000
|
|
||||||
|
Agriculture property acquisitions
|
(13,111
|
)
|
—
|
|
(15,098
|
)
|
||||||
|
Business combination
|
(25,000
|
)
|
(5,706
|
)
|
—
|
|
||||||
|
Net proceeds from sale of stock in Calavo Growers, Inc.
|
4,721
|
|
—
|
|
4,019
|
|
||||||
|
Net proceeds from sale of conservation easement
|
—
|
|
—
|
|
995
|
|
||||||
|
Collections of installments on note receivable
|
200
|
|
—
|
|
—
|
|
||||||
|
Equity investment contributions
|
(3,500
|
)
|
(7,450
|
)
|
(2,890
|
)
|
||||||
|
Investments in mutual water companies and water rights
|
(343
|
)
|
(359
|
)
|
(296
|
)
|
||||||
|
Net cash used in investing activities
|
(50,807
|
)
|
(26,416
|
)
|
(11,522
|
)
|
||||||
68
LIMONEIRA COMPANY
CONSOLIDATED STATEMENTS OF CASH FLOWS (CONTINUED)
(In thousands)
|
|
Years Ended October 31,
|
|||||||||||
|
|
2018
|
2017
|
2016
|
|||||||||
|
Financing activities
|
||||||||||||
|
Borrowings of long-term debt
|
$
|
167,356
|
|
$
|
181,429
|
|
$
|
157,423
|
|
|||
|
Repayments of long-term debt
|
(193,723
|
)
|
(168,932
|
)
|
(156,403
|
)
|
||||||
|
Dividends paid - common
|
(4,025
|
)
|
(3,155
|
)
|
(2,834
|
)
|
||||||
|
Dividends paid - preferred
|
(501
|
)
|
(560
|
)
|
(628
|
)
|
||||||
|
Exchange of common stock
|
(656
|
)
|
(294
|
)
|
(190
|
)
|
||||||
|
Issuance of common stock
|
64,097
|
|
—
|
|
—
|
|
||||||
|
Payments of deferred financing costs
|
—
|
|
(108
|
)
|
(65
|
)
|
||||||
|
Tax provision of stock grant vesting
|
—
|
|
—
|
|
(86
|
)
|
||||||
|
Net cash provided by (used in) financing activities
|
32,548
|
|
8,380
|
|
(2,783
|
)
|
||||||
|
Effect of exchange rate changes on cash
|
(21
|
)
|
8
|
|
—
|
|
||||||
|
Net increase (decrease) in cash
|
117
|
|
454
|
|
(1
|
)
|
||||||
|
Cash at beginning of year
|
492
|
|
38
|
|
39
|
|
||||||
|
Cash at end of year
|
$
|
609
|
|
$
|
492
|
|
$
|
38
|
|
|||
|
Supplemental disclosures of cash flow information
|
||||||||||||
|
Cash paid during the year for interest (net of amounts capitalized)
|
$
|
1,585
|
|
$
|
1,641
|
|
$
|
1,405
|
|
|||
|
Cash paid during the year for income taxes, net of (refunds received)
|
$
|
210
|
|
$
|
(540
|
)
|
$
|
2,125
|
|
|||
|
Non-cash investing and financing activities:
|
||||||||||||
|
Unrealized holding gain on Calavo investment
|
$
|
(6,765
|
)
|
$
|
(4,365
|
)
|
$
|
(2,668
|
)
|
|||
|
Increase in real estate development and sale-leaseback deferral
|
$
|
27,934
|
|
$
|
7,047
|
|
$
|
3,349
|
|
|||
|
Increase in equity in investments and other long-term liabilities
|
$
|
1,080
|
|
$
|
—
|
|
$
|
—
|
|
|||
|
Non-cash receipt of note receivable
|
$
|
3,000
|
|
$
|
—
|
|
$
|
—
|
|
|||
|
Non-cash reduction of note receivable
|
$
|
79
|
|
$
|
—
|
|
$
|
—
|
|
|||
|
Reclassification of real estate development to property, plant and equipment
|
$
|
—
|
|
$
|
—
|
|
$
|
26,779
|
|
|||
|
Settlement of lease obligation related to agriculture property acquisition
|
$
|
—
|
|
$
|
—
|
|
$
|
(739
|
)
|
|||
|
Capital expenditures accrued but not paid at year-end
|
$
|
399
|
|
$
|
427
|
|
$
|
594
|
|
|||
|
Accrued equity investment contribution
|
$
|
—
|
|
$
|
—
|
|
$
|
325
|
|
|||
|
Accrued interest on note receivable
|
$
|
192
|
|
$
|
23
|
|
$
|
23
|
|
|||
|
Accrued Series B-2 Convertible Preferred Stock dividends
|
$
|
—
|
|
$
|
—
|
|
$
|
—
|
|
|||
|
Conversion of preferred stock to common stock
|
$
|
—
|
|
$
|
1,421
|
|
$
|
50
|
|
|||
|
Non-cash issuance of notes payable
|
$
|
1,435
|
|
—
|
|
$
|
—
|
|
||||
On July 24, 2018, the Company entered into an agreement to acquire assets from Oxnard Lemon Associates, Ltd. ("Oxnard Lemon") for a purchase price of
$25,000,000
in cash as further described in Note 3 – Acquisitions of the notes to consolidated financial statements included in this Annual Report.
On July 18, 2018, the Company acquired Fruticola San Pablo S.A. (“San Pablo”) ranch for a total purchase price of
$13,111,000
in cash as further described in Note 3 – Acquisitions of the notes to consolidated financial statements included in this Annual Report.
69
In February 2013, the Company entered into an option agreement for the purchase of a
7
-acre parcel adjacent to its East Area II real estate development project. In February 2018, the Company exercised its option and purchased the property for
$3,145,000
, by making a cash payment of
$1,444,000
and issuing a note payable for
$1,435,000
.
In November 2017, the holder of the note receivable from a 2004 sale of property completed the drilling of a water well at the Company’s La Campana Ranch. The fair value of the well drilling services was
$79,000
and the Company recorded a non-cash reduction of the note receivable.
During 2017 and 2016, certain shares of Series B convertible preferred stock were converted into common stock as described in Note 21 – Series B and Series B-2 Preferred Stock of the notes to consolidated financial statements included in this Annual Report.
In October 2017, the Company entered an agreement to sell its Centennial Square (“Centennial”) real estate development property for
$3,250,000
. This transaction closed in December 2017 with the Company receiving net proceeds of
$179,000
and received a
$3,000,000
promissory note secured by the property for the balance of the purchase price.
On June 20, 2017, the Company entered into a Master Loan Agreement with Farm Credit West, FLCA and repaid
$68,572,000
of outstanding debt under the Rabobank revolving credit facility as further described in Note 12 – Long-Term Debt of the notes to consolidated financial statements included in this Annual Report.
On February 24, 2017, the Company acquired
90%
of the outstanding stock of Fruticola Pan de Azucar S.A. ("PDA") for a purchase price of
$5,706,000
in cash as further described in Note 3 – Acquisitions of the notes to consolidated financial statements included in this Annual Report.
See Notes to Consolidated Financial Statements.
70
LIMONEIRA COMPANY
NOTES TO CONSOLIDATED FINANCIAL STATEMENTS
1. Business
Limoneira Company, a Delaware Company (the “Company”), engages primarily in growing citrus and avocados, picking and hauling citrus, and packing, marketing and selling lemons. The Company is also engaged in residential rentals and other rental operations and real estate development activities.
The Company markets and sells lemons directly to food service, wholesale and retail customers throughout the United States, Canada, Asia and other international markets. The Company is a member of Sunkist Growers, Inc. (“Sunkist”), an agricultural marketing cooperative, and sells its oranges, specialty citrus and other crops to Sunkist-licensed and other third-party packinghouses.
The Company sells all of its avocado production to Calavo Growers, Inc. (“Calavo”), a packing and marketing company listed on the NASDAQ Global Select Market under the symbol CVGW. Calavo’s customers include many of the largest retail and food service companies in the United States and Canada. The Company’s avocados are packed by Calavo, which are then sold and distributed under Calavo brands to its customers.
2. Summary of Significant Accounting Policies
Principles of Consolidation
The consolidated financial statements include the accounts of the Company and the accounts of all the subsidiaries and investments in which a controlling interest is held by the Company. The consolidated financial statements represent the consolidated balance sheets, statements of operations, statements of comprehensive income, statements of stockholders’ equity and temporary equity and statements of cash flows of Limoneira Company and its wholly owned subsidiaries. The Company’s material subsidiaries include: Limoneira Mercantile, LLC, Windfall Investors, LLC (“Windfall”), Templeton Santa Barbara, LLC, Associated Citrus Packers, Inc. (“Associated”), Limoneira Chile SpA, Limoneira EA 1 Land, LLC, San Pablo and PDA, in which the Company has a
90%
ownership interest. All significant intercompany balances and transactions have been eliminated in consolidation. The Company considers the criteria established under the Financial Accounting Standards Board (“FASB”) – Accounting Standards Code (“ASC”) 810,
Consolidations,
and the effect of variable interest entities, in its consolidation process.
Use of Estimates
The preparation of financial statements in conformity with U.S. generally accepted accounting principles (“GAAP”) requires management to make estimates and assumptions that affect the reported amounts of assets and liabilities and disclosure of contingent assets and liabilities at the date of the financial statements and the reported amounts of revenues and expenses during the reporting period. Actual results could differ from those estimates.
Accounts Receivable
The Company grants credit in the course of its operations to cooperatives, companies and lessees of the Company’s facilities. The Company performs periodic credit evaluations of its customers’ financial condition and generally does not require collateral. The Company provides allowances on its receivables as required based on accounts receivable aging and other factors. At
October 31, 2018
and
2017
the allowances totaled
$563,000
and
$577,000
, respectively. For fiscal years
2018
,
2017
and
2016
, credit losses were insignificant.
Concentrations
The Company sells all of its avocado production to Calavo. Sales of avocados to Calavo were
$6,576,000
,
$9,522,000
and
$10,767,000
in fiscal years
2018
,
2017
and
2016
, respectively.
Lemons procured from third-party growers were approximately
45%
,
44%
and
42%
, of lemon supply in fiscal years
2018
,
2017
and
2016
, respectively. One third-party grower was
50%
and
43%
of grower payable at
October 31, 2018
and
2017
, respectively.
The Company maintains its cash in federally insured financial institutions. The account balances at these institutions periodically exceed Federal Deposit Insurance Corporation (“FDIC”) insurance coverage and, as a result, there is a concentration of risk related to amounts on deposit in excess of FDIC insurance coverage.
Cultural Costs
Growing costs, also referred to as cultural costs, consist of orchard maintenance costs such as cultivation, fertilization and soil amendments, pest control, pruning and irrigation. Harvest costs are comprised of labor and equipment expenses incurred to harvest and deliver crops to the packinghouses.
71
LIMONEIRA COMPANY
NOTES TO CONSOLIDATED FINANCIAL STATEMENTS (CONTINUED)
2. Summary of Significant Accounting Policies (continued)
Cultural Costs (continued)
Lemons, oranges, specialty citrus and other crops such as pistachio nuts are grown in the Company’s San Joaquin Valley orchards. Additionally, lemons are grown in the Company’s Yuma County, Arizona orchards. These crops have distinct growing periods and distinct harvest and selling periods, each of which lasts approximately four to six months. During the growing period, cultural costs are capitalized as they are associated with benefiting and preparing the crops for the harvest and selling period. During the harvest and selling period, harvest costs and cultural costs are expensed when incurred and capitalized cultural costs are amortized as components of agribusiness costs and expenses.
The Company grows lemons and avocados in its Ventura County orchards. Due to climate, growing conditions and the types of crops grown, the Ventura County orchards may be harvested and sold on a year-round basis. Accordingly, the Company does not capitalize cultural costs associated with its Ventura County orchards and therefore such costs, as well as harvest costs associated with the Ventura County orchards, are expensed to operations when incurred as components of agribusiness costs and expenses.
Most cultural costs, including amortization of capitalized cultural costs, and harvest costs are associated with and charged to specific crops. Certain other costs, such as property taxes, indirect labor including farm supervision and management and irrigation that benefit multiple crops are allocated to crops on a per acre basis.
Income Taxes
Deferred income tax assets and liabilities are computed annually for differences between the financial statement and income tax bases of assets and liabilities that will result in taxable or deductible amounts in the future. Such deferred income tax asset and liability computations are based on enacted tax laws and rates applicable to periods in which the differences are expected to affect taxable income. A valuation allowance is established, when necessary, to reduce deferred income tax assets to the amount expected to be realized.
Tax benefits from an uncertain tax position are only recognized if it is more likely than not that the tax position will be sustained upon examination by the taxing authorities, based on the technical merits of the position. The tax benefits recognized in the financial statements from such a position are measured based on the largest benefit that has a greater than 50% likelihood of being realized upon ultimate settlement.
Property, Plant and Equipment
Property, plant and equipment is stated at original cost, net of accumulated depreciation. Depreciation is computed using the straight-line method at rates based upon the estimated useful lives of the related assets as follows (in years):
|
Land improvements
|
10 – 30
|
|
Buildings and building improvements
|
10 – 50
|
|
Equipment
|
5 – 20
|
|
Orchards
|
20 – 40
|
Costs of planting and developing orchards are capitalized until the orchards become commercially productive. Planting costs consist primarily of the costs to purchase and plant nursery stock. Orchard development costs consist primarily of maintenance costs of orchards such as cultivation, pruning, irrigation, labor, spraying and fertilization, and interest costs during the development period. The Company ceases the capitalization of costs and commences depreciation when the orchards become commercially productive and orchard maintenance costs are accounted for as cultural costs as described above.
Capitalized Interest
Interest is capitalized on real estate development projects and significant construction in progress using the weighted average interest rate during the fiscal year. Interest of
$2,407,000
and
$2,022,000
was capitalized during the years ended
October 31, 2018
and
2017
, respectively, and is included in property, plant, and equipment and real estate development assets in the Company’s consolidated balance sheets.
Real Estate Development Costs
The Company capitalizes the planning, entitlement, construction, development costs and interest associated with its various real estate projects. Costs that are not capitalized, which include property maintenance and repairs, general and administrative and marketing expenses, are expensed as incurred. A real estate development project is considered substantially complete upon the
72
LIMONEIRA COMPANY
NOTES TO CONSOLIDATED FINANCIAL STATEMENTS (CONTINUED)
2. Summary of Significant Accounting Policies (continued)
Real Estate Development Costs (continued)
cessation of construction and development activities. Once a project is substantially completed, future costs are expensed as incurred. The Company capitalized costs related to its real estate projects of
$32,662,000
and
$8,403,000
in fiscal years
2018
and
2017
, respectively.
Equity in Investments
Investments in unconsolidated joint ventures in which the Company has significant influence but less than a controlling interest, or is not the primary beneficiary if the joint venture is determined to be a Variable Interest Entity (“VIE”), are accounted for under the equity method of accounting and, accordingly, are adjusted for capital contributions, distributions and the Company’s equity in net earnings or loss of the respective joint venture.
Marketable Securities
The Company classifies its marketable securities as available-for-sale. The Company’s investments in marketable securities are stated at fair value with unrealized gains (losses), net of tax, reported as a component of accumulated other comprehensive income (loss) in the Company’s consolidated statement of comprehensive income. At
October 31, 2018
and
2017
, marketable securities are comprised of the Company’s investment in Calavo.
Long-Lived Assets
The Company evaluates long-lived assets, including its definite-life intangible assets, for impairment whenever events or changes in circumstances indicate that the carrying value of an asset may not be recoverable. If the estimated undiscounted future cash flows from the use of an asset are less than the carrying value of that asset, a write-down is recorded to reduce the carrying value of the asset to its fair value. Assets held for sale are carried at the lower of cost or fair value less estimated cost to sell.
Intangible Assets
Intangible assets consist primarily of acquired water and mineral rights, a patent and certain customer relationships, trade names and trademarks. Certain of the Company’s trade names and trademarks are being amortized on a straight-line basis over their estimated lives of eight years. The Company evaluates its indefinite-life intangible assets annually or whenever events or changes in circumstances indicate an impairment of the assets’ value may exist.
Goodwill
Goodwill is tested for impairment on an annual basis or when an event or changes in circumstances indicate that its carrying value may not be recoverable. Goodwill impairment is tested at the reporting unit level, which is defined as an operating segment or one level below the operating segment. Goodwill impairment is tested in a two-step process, with the first step performed to determine if there is potential for impairment by comparing the fair value of the reporting unit to its carrying value. If potential impairment is identified as indicated by the carrying value exceeding the fair value of the reporting unit, the second step is performed to measure the amount of impairment to be recognized in the financial statements by comparing the implied fair value of goodwill to its carrying value. If the carrying value of goodwill exceeds its implied fair value, an impairment loss is recognized for the excess amount. Goodwill impairment testing involves significant judgment and estimates. The annual assessment of goodwill impairment was performed as of July 31,
2018
with
no
impairment noted.
Fair Values of Financial Instruments
The fair values of financial instruments are based on level-one indicators within the fair value hierarchy or quoted market prices, where available, or are estimated using the present value or other valuation techniques. Estimated fair values are significantly affected by the assumptions used.
Accounts receivable, note receivable, accounts payable, growers payable and accrued liabilities reported on the Company’s consolidated balance sheets approximate their fair values due to the short-term nature of the instruments.
Based on the borrowing rates currently available to the Company for bank loans with similar terms and maturities, the fair value of long-term debt is approximately equal to its carrying amount as of
October 31, 2018
and
2017
.
Derivative Financial Instruments
The Company uses derivative financial instruments to manage its exposure to interest rates as well as to maintain an appropriate mix of fixed and floating-rate debt. Contract terms of a hedge instrument closely mirror those of the hedged item, providing a high
73
LIMONEIRA COMPANY
NOTES TO CONSOLIDATED FINANCIAL STATEMENTS (CONTINUED)
2. Summary of Significant Accounting Policies (continued)
Derivative Financial Instruments (continued)
degree of risk reduction and correlation. Contracts that are effective at meeting the risk reduction and correlation criteria are recorded using hedge accounting. If a derivative instrument is a hedge, depending on the nature of the hedge, changes in the fair value of the instrument will be either offset against the change in the fair value of the hedged assets, liabilities or firm commitments through earnings or be recognized in other comprehensive income until the hedged item is recognized in earnings. The ineffective portion of an instrument’s change in fair value will be immediately recognized in earnings. Instruments that do not meet the criteria for hedge accounting, or contracts for which the Company has not elected hedge accounting, are valued at fair value with unrealized gains or losses reported in earnings during the period of change.
Comprehensive Income (Loss)
Comprehensive income (loss) represents all changes in a company’s net assets, except changes resulting from transactions with shareholders, and is reported as a component of the Company’s stockholders’ equity.
Foreign Currency Translation
San Pablo and PDA’s functional currency is the Chilean Peso. Their balance sheets are translated to U.S. dollars at exchange rates in effect at the balance sheet date and their income statements are translated at average exchange rates during the reporting period. The resulting foreign currency translation adjustments are recorded as a separate component of accumulated other comprehensive income.
Revenue Recognition
Revenue and related costs are recognized when (i) persuasive evidence of an arrangement exists, (ii) delivery has occurred, (iii) selling price is fixed or determinable and (iv) collectability is reasonably assured. The Company records a sales allowance in the period revenue is recognized as a provision for estimated customer discounts and concessions.
Agribusiness revenue -
Revenue from lemon sales is generally recognized FOB shipping point when the customer takes possession of the fruit from the Company’s packinghouse. Revenue from the sales of certain of the Company’s agricultural products is recorded based on estimated proceeds provided by certain of the Company’s sales and marketing partners (Calavo and other third-party packinghouses) due to the time between when the product is delivered by the Company and the closing of the pools for such fruits at the end of each month. Calavo and other third-party packinghouses are agricultural cooperatives or function in a similar manner as an agricultural cooperative. As such, the Company applies specific authoritative agriculture revenue recognition guidance related to transactions between patrons and agriculture marketing cooperatives to record revenue at time of delivery to the packinghouses relating to fruits that are in pools that have not yet closed at month end if: (a) the related fruits have been delivered to and accepted by Calavo and other third-party packinghouses (i.e., title has transferred to Calavo and other third-party packinghouses) and (b) sales price information has been provided by Calavo and other third-party packinghouses (based on the marketplace activity for the related fruit) to estimate with reasonable certainty the final selling price for the fruit upon the closing of the pools. Historically, the revenue that is recorded based on the sales price information provided to the Company by Calavo and other third-party packinghouses at the time of delivery, have not materially differed from the actual amounts that are paid after the monthly pools are closed. The Company also earns commissions on certain brokered fruit sales, which totaled
$1,084,000
,
$324,000
and
$263,000
in fiscal years
2018
,
2017
and
2016
, respectively.
The Company’s avocados, oranges, specialty citrus and other specialty crops are packed and sold by Calavo and other third-party packinghouses. The Company delivers all of its avocado production from its orchards to Calavo. These avocados are then packed by Calavo at its packinghouse, and sold and distributed under Calavo brands to its customers primarily in the United States and Canada. The Company’s arrangements with other third-party packinghouses related to its oranges, specialty citrus and other specialty crops are similar to its arrangement with Calavo.
The Company’s arrangements with its third-party packinghouses are such that the Company is the producer and supplier of the product and the third-party packinghouses are the Company’s customers. The revenues the Company recognizes related to the fruits sold to the third-party packinghouses are based on the volume and quality of the fruits delivered, the market price for such fruit, less the packinghouses’ charges to pack and market the fruit. Such packinghouse charges include the grading, sizing, packing, cooling, ripening and marketing of the related fruit. The Company bears inventory risk until product is delivered to the third-party packinghouses at which time title and inventory risk to the product is transferred to the third-party packinghouses and revenue is recognized. Such third-party packinghouse charges are recorded as a reduction of revenue based on the application of specific authoritative revenue recognition guidance entitled “Vendor’s Income Statement Characterization of Consideration Given to a
74
LIMONEIRA COMPANY
NOTES TO CONSOLIDATED FINANCIAL STATEMENTS (CONTINUED)
2. Summary of Significant Accounting Policies (continued)
Revenue Recognition (continued)
Customer”. The identifiable benefit the Company receives from the third-party packinghouses for packaging and marketing services cannot be sufficiently separated from the third-party packinghouses’ purchase of the Company’s products. In addition, the Company is not able to reasonably estimate the fair value of the benefit received from the third-party packinghouses for such services and as such, these costs are characterized as a reduction of revenue in the Company’s consolidated statements of operations.
Revenue from crop insurance proceeds is recorded when the amount of and the right to receive the payment can be reasonably determined. The Company recorded agribusiness revenues from crop insurance proceeds of
$54,000
,
$74,000
and
$83,000
in fiscal years
2018
,
2017
and
2016
, respectively.
Rental operations revenue -
Minimum rental revenues are generally recognized on a straight-line basis over the respective initial lease term. Contingent rental revenues are contractually defined as to the percentage of rent received by the Company and are based on fees collected by the lessee. Such revenues are recognized when actual results, based on collected fees reported by the tenant, are received. The Company’s rental arrangements generally require payment on a monthly or quarterly basis.
Real estate development revenue -
The Company recognizes revenue on real estate development projects in accordance with FASB ASC 360-20,
Real Estate Sales
, which provides for profit to be recognized in full when real estate is sold provided that, a sale has been consummated and profit is determinable, collection of sales proceeds is estimable with the seller’s receivable not subject to subordination, risks and rewards of ownership have been transferred to the buyer and the earnings process is substantially complete with no significant seller activities or obligations required after the date of sale. To the extent the above conditions are not met, a portion or all of the profit is deferred.
Incidental operations may occur during the holding or development period of real estate development projects to reduce holding or development costs. Incremental revenue from incidental operations in excess of incremental costs from incidental operations is accounted for as a reduction of development costs. Incremental costs from incidental operations in excess of incremental revenue from incidental operations are charged to operations.
Advertising Expense
Advertising costs are expensed as incurred. Such costs in fiscal years
2018
,
2017
and
2016
were
$107,000
,
$173,000
and
$264,000
, respectively.
Leases
The Company records rent expense for its operating leases on a straight-line basis from the lease commencement date as defined in the lease agreement until the end of the base lease term.
Basic and Diluted Net Income per Share
Basic net income per common share is calculated using the weighted-average number of common shares outstanding during the period without consideration of the dilutive effect of preferred stock. Diluted net income per common share is calculated using the weighted-average number of common shares outstanding plus the dilutive effect of conversion of preferred stock. The Series B and Series B-2 convertible preferred shares were dilutive for fiscal year ended October 31,
2018
and anti-dilutive for fiscal years ended October 31,
2017
and
2016
, respectively.
Unvested stock-based compensation awards that contain non-forfeitable rights to dividends as participating shares are included in computing earnings per share using the two-class method. The Company’s unvested, restricted stock awards qualify as participating shares.
Defined Benefit Retirement Plan
The Company sponsors a defined benefit retirement plan that was frozen in June 2004, and no future benefits have been accrued to participants subsequent to that time. Ongoing accounting for this plan under FASB ASC 715,
Compensation – Retirement Benefits,
provides guidance as to, among other things, future estimated pension expense, pension liability and minimum funding requirements. This information is provided to the Company by third-party actuarial consultants. In developing this data, certain estimates and assumptions are used, including among other things, discount rate, long-term rate of return and mortality tables.
75
LIMONEIRA COMPANY
NOTES TO CONSOLIDATED FINANCIAL STATEMENTS (CONTINUED)
2. Summary of Significant Accounting Policies (continued)
Defined Benefit Retirement Plan (continued)
During 2018, the Society of Actuaries (SOA) released a new mortality improvement scale table, referred to as MP-2018, which is believed to better reflect mortality improvements and is to be used in calculating defined benefit pension obligations. In addition, during fiscal year
2018
, the assumed discount rate to measure the pension obligation increased to
4.4%
. The Company used the latest mortality tables released by the SOA through October
2018
to measure its pension obligation as of
October 31, 2018
and combined with the assumed discount rate and other demographic assumptions, its pension liability decreased by approximately
$1,454,000
as of
October 31, 2018
. Further changes in any of these estimates could materially affect the amounts recorded that are related to our defined benefit retirement plan.
Recent Accounting Pronouncements
FASB ASU 2014-09, Revenue from Contracts with Customers (Topic 606).
In May 2014, the FASB issued ASU 2014-09, “Revenue from Contracts with Customers (Topic 606).” This ASU affects any entity that either enters into contracts with customers to transfer goods or services or enters into contracts for the transfer of nonfinancial assets unless those contracts are within the scope of other standards (e.g., insurance contracts or lease contracts). This ASU will supersede the revenue recognition requirements in Topic 605, Revenue Recognition, and most industry-specific guidance. This ASU also supersedes some cost guidance included in Subtopic 605-35, Revenue Recognition – Construction-Type and Production-Type Contracts. In addition, the existing requirements for the recognition of a gain or loss on the transfer of nonfinancial assets that are not in a contract with a customer (e.g., assets within the scope of Topic 360, Property, Plant, and Equipment, and tangible assets within the scope of Topic 350, Intangibles – Goodwill and Other) are amended to be consistent with the guidance on recognition and measurement (including the constraint on revenue) in this ASU.
The core principle of the guidance is that an entity should recognize revenue to depict the transfer of promised goods or services to customers in an amount that reflects the consideration to which the entity expects to be entitled in exchange for those goods or services. To achieve that core principle, an entity should apply the following steps:
|
•
|
Identify the contract(s) with a customer.
|
|
•
|
Identify the performance obligations in the contract.
|
|
•
|
Determine the transaction price.
|
|
•
|
Allocate the transaction price to the performance obligations in the contract.
|
|
•
|
Recognize revenue when (or as) the entity satisfies a performance obligation.
|
In March 2016, the FASB issued ASU 2016-08 (ASU 2016-08), Revenue from Contracts with Customers (Topic 606): Principal versus Agent Considerations (Reporting Revenue Gross versus Net). ASU 2016-08 clarifies the implementation guidance on principal versus agent considerations.
In April 2016, the FASB issued ASU 2016-10 (ASU 2016-10), Revenue from Contracts with Customers (Topic 606): Identifying Performance Obligations and Licensing. ASU 2016-10 clarifies the implementation guidance on identifying performance obligations. These ASUs apply to all companies that enter into contracts with customers to transfer goods or services.
In May 2016, the FASB issued, ASU 2016-12 (ASU 2016-12), Revenue from Contracts with Customers (Topic 606): Narrow-Scope Improvements and Practical Expedients. ASU 2016-12 provides clarifying guidance in certain narrow areas and adds some practical expedients.
The two permitted transition methods under the new standard are the full retrospective method, in which case the standard would be applied to each prior reporting period presented and the cumulative effect of applying the standard would be recognized at the earliest period shown, or the modified retrospective method, in which case the cumulative effect of applying the standard would be recognized at the date of initial application. The Company will adopt the standard in the first quarter of its fiscal year ending October 31, 2019 and anticipates using the modified retrospective method. The Company has inventoried and evaluated its current revenue streams and related contracts with customers in order to identify material differences, if any, that would result from applying the new requirements to its revenue contracts. Furthermore, the Company has evaluated the principal versus agent considerations as it relates to certain agreements with third parties and has determined that there will be an impact to the presentation of gross or net revenue reporting. The Company continues to evaluate the effect this ASU will have on its consolidated financial statements, however we do not expect the standard to have a material impact on our net consolidated results of operations or financial position and related disclosures.
76
LIMONEIRA COMPANY
NOTES TO CONSOLIDATED FINANCIAL STATEMENTS (CONTINUED)
2. Summary of Significant Accounting Policies (continued)
FASB ASU 2015-11, Inventory (Topic 330): Simplifying the Measurement of Inventory
The amendments in this ASU do not apply to inventory that is measured using last-in, first-out (“LIFO”) or the retail inventory method. The amendments apply to all other inventory, which includes inventory that is measured using first-in, first-out (“FIFO”) or average cost.
An entity should measure in scope inventory at the lower of cost or net realizable value. Net realizable value is the estimated selling prices in the ordinary course of business, less reasonably predictable costs of completion, disposal, and transportation. Subsequent measurement is unchanged for inventory measured using LIFO or the retail inventory method. The Company’s adoption of this ASU had no impact on its consolidated financial statements.
FASB ASU 2016-01, Financial Instruments Overall (Subtopic 825-10): Recognition and Measurement of Financial Assets and Financial Liabilities
The amendments in ASU 2016-01, among other things, require equity investments (except those accounted for under the equity method of accounting, or those that result in consolidation of the investee) to be measured at fair value with changes in fair value recognized in net income. Requires public business entities to use the exit price notion when measuring the fair value of financial instruments for disclosure purposes. Requires separate presentation of financial assets and financial liabilities by measurement category and form of financial assets (i.e., securities or loans and receivables). Eliminates the requirement for public business entities to disclose the method(s) and significant assumptions used to estimate fair value that is required to be disclosed for financial instruments measured at amortized cost.
ASU 2016-01 is effective for public companies for fiscal years beginning after December 15, 2017, including interim periods within those fiscal years. Early adoption is permitted. The Company is evaluating the effect this ASU may have on its consolidated financial statements, but believes the impact could be significant as the changes in the fair value of Calavo common stock will be recorded in the statement of operations.
FASB ASU 2016-02, Leases (Topic 842)
Under the new guidance, lessees will be required to recognize the following for all leases (with the exception of short-term leases) at the commencement date:
|
•
|
A lease liability, which is a lessee’s obligation to make lease payments arising from a lease, measured on a discounted basis; and
|
|
•
|
A right-of-use asset, which is an asset that represents the lessee’s right to use, or control the use of, a specified asset for the lease term.
|
Under the new guidance, lessor accounting is largely unchanged. Certain targeted improvements were made to align, where necessary, lessor accounting with the lessee accounting model and Topic 606, Revenue from Contracts with Customers. The new lease guidance simplified the accounting for sale and leaseback transactions primarily because lessees must recognize lease assets and lease liabilities. Lessees will no longer be provided with a source of off-balance sheet financing.
ASU 2016-02 is effective for fiscal years beginning after December 15, 2018, including interim periods within those fiscal years. Early application is permitted. Lessees (for capital and operating leases) and lessors (for sales-type, direct financing, and operating leases) must apply a modified retrospective transition approach for leases existing at, or entered into after, the beginning of the earliest comparative period presented in the financial statements. The modified retrospective approach would not require any transition accounting for leases that expired before the earliest comparative period presented. Lessees and lessors may not apply a full retrospective transition approach. The ASU will be effective for the Company beginning in the first quarter of its fiscal year ending October 31, 2020. The Company is evaluating the effect this ASU may have on its consolidated financial statements, however it expects to apply the practical expedients provided in the ASU. Note 20 – Commitments and Contingencies – of the notes to consolidated financial statements included in this Annual Report describes its operating lease arrangements as of
October 31, 2018
.
FASB ASU 2017-01, Business Combinations (Topic 805): Clarifying the Definition of a Business
This amendment clarifies the definition of a business. The amendment affects all companies and other reporting organizations that must determine whether they have acquired or sold a business.
The definition of a business affects many areas of accounting including acquisitions, disposals, goodwill, and consolidation. The amendment is intended to help companies and other organizations evaluate whether transactions should be accounted for as acquisitions (or disposals) of assets or businesses.
77
LIMONEIRA COMPANY
NOTES TO CONSOLIDATED FINANCIAL STATEMENTS (CONTINUED)
2. Summary of Significant Accounting Policies (continued)
This amendment is effective for public companies for annual periods beginning after December 15, 2017, including interim periods within those periods. For all other companies and organizations, the amendment is effective for annual periods beginning after December 15, 2018, and interim periods within annual periods beginning after December 15, 2019. The amendment should be applied prospectively as of the beginning of the period of adoption. The Company early adopted this ASU during the quarter ended July 31, 2018 and as a result, the purchase of San Pablo was accounted for as an acquisition of assets.
FASB ASU 2017-07, Compensation — Retirement Benefits (Topic 715): Improving the Presentation of Net Periodic Pension Cost and Net Periodic Postretirement Benefit Cost
The amendment requires that an employer report the service cost component in the same line item or items as other compensation costs arising from services rendered by the pertinent employees during the period. The other components of net benefit cost are required to be presented in the income statement separately from the service cost component and outside a subtotal of income from operations, if one is presented. If a separate line item or items are used to present the other components of net benefit cost, that line item or items must be appropriately described. If a separate line item or items are not used, the line item or items used in the income statement to present the other components of net benefit cost must be disclosed.
The amendment is effective for public business entities for annual periods beginning after December 15, 2017, including interim periods within those annual periods. Early adoption is permitted as of the beginning of an annual period for which financial statements (interim or annual) have not been issued or made available for issuance. The Company is evaluating the effect this ASU may have on its consolidated financial statements.
FASB ASU 2017-12, Derivatives and Hedging (Topic 815): Targeted Improvements to Accounting for Hedging Activities
These amendments refine and expand hedge accounting for both financial and commodity risks. Its provisions create more transparency around how economic results are presented, both on the face of the financial statements and in the footnotes. It also makes certain targeted improvements to simplify the application of hedge accounting guidance.
The amendment is effective for public business entities for fiscal years beginning after December 15, 2018, and interim periods within those fiscal years. Early adoption, including adoption in an interim period, is permitted. The Company is evaluating the effect this ASU may have on its consolidated financial statements.
FASB ASU 2018-02, Income Statement—Reporting Comprehensive Income (Topic 220): Reclassification of Certain Tax Effects from Accumulated Other Comprehensive Income
These amendments provide financial statement preparers with an option to reclassify stranded tax effects within AOCI to retained earnings in each period in which the effect of the change in the U.S. federal corporate income tax rate in the Tax Cuts and Jobs Act of 2017 (or portion thereof) is recorded.
The amendment is effective for all organizations for fiscal years beginning after December 15, 2018, and interim periods within those fiscal years. Early adoption is permitted. Organizations should apply the proposed amendments either in the period of adoption or retrospectively to each period (or periods) in which the effect of the change in the U.S. federal corporate income tax rate in the Tax Cuts and Jobs Act is recognized. The Company is evaluating the effect of this ASU. It could have a significant effect on the Company’s consolidated financial statements due to the deferred tax balances related to the Company’s pension liability and its investment in Calavo.
FASB ASU 2018-13, Fair Value Measurement (Topic 820): Disclosure Framework—Changes to the Disclosure Requirements for Fair Value Measurement
These amendments add, remove, and clarify the disclosure requirements in Topic 820 by removing, modifying and adding requirements. The amendments on changes in unrealized gains and losses, the range and weighted average of significant unobservable inputs used to develop Level 3 fair value measurements, and the narrative description of measurement uncertainty should be applied prospectively for only the most recent interim or annual period presented in the initial fiscal year of adoption. All other amendments should be applied retrospectively to all periods presented upon their effective date.
For all entities, amendments are effective for fiscal years, and interim periods within those fiscal years, beginning after December 15, 2019. Early adoption is permitted. An entity is permitted to early adopt any removed or modified disclosures upon issuance of ASU 2018-13 and delay adoption of the additional disclosures until their effective date. The Company is evaluating the effect this ASU may have on its consolidated financial statements.
78
LIMONEIRA COMPANY
NOTES TO CONSOLIDATED FINANCIAL STATEMENTS (CONTINUED)
2. Summary of Significant Accounting Policies (continued)
FASB ASU 2018-14, Compensation—Retirement Benefits—Defined Benefit Plans—General (Subtopic 715-20): Disclosure Framework—Changes to the Disclosure Requirements for Defined Benefit Plans
These amendments add remove and clarify the disclosure requirements for employers that sponsor defined benefit pension or other postretirement plans.
For public business entities, the amendments are effective for fiscal years ending after December 15, 2020. For all other entities the amendments are effective for fiscal years ending after December 15, 2021. Early adoption is permitted. The Company is evaluating the effect this ASU may have on its consolidated financial statements.
3. Acquisitions
Agriculture Property Acquisition
San Pablo
On July 18, 2018, the Company completed the acquisition of San Pablo ranch and related assets in La Serena, Chile, for
$13,000,000
. The San Pablo ranch consists of
3,317
acres on
two
parcels, including
247
acres producing lemons,
61
acres producing oranges, the opportunity to immediately plant
120
acres for lemon production, as well as the potential for approximately
500
acres of avocado production. This acquisition was accounted for as an asset purchase and is included in property, plant and equipment in the Company’s consolidated balance sheet at October 31, 2018. In addition, transaction costs of
$111,000
were capitalized as part of total acquisition costs.
Below is a summary of the fair value of the net assets acquired on the acquisition date based on a third-party valuation, which is considered a Level 3 fair value measurement under FASB ASC 820, Fair Value Measurements and Disclosures (in thousands):
|
Cultural costs
|
$
|
579
|
|
|
Land and land improvements
|
9,114
|
|
|
|
Buildings and equipment
|
207
|
|
|
|
Orchards
|
2,058
|
|
|
|
Water rights
|
1,153
|
|
|
|
Total assets acquired
|
$
|
13,111
|
|
Revenue of
$552,000
and net loss of
$202,000
of San Pablo are included in the Company’s consolidated statement of operations from the acquisition date to the period ended October 31, 2018. The unaudited, pro forma consolidated statement of operations as if San Pablo had been included in the consolidated results of the Company for the years ended October 31, 2018 and 2017 results in revenue of
$130,262,000
and
$122,283,000
, respectively and net income of
$18,784,577
and
$5,862,000
, respectively.
Business Combinations
Oxnard Lemon
On July 24, 2018, the Company and Oxnard Lemon Associates, Ltd., a California limited partnership (“Seller”), entered into an Asset Purchase Agreement (the “Purchase Agreement”). Pursuant to the Purchase Agreement, on July 26, 2018 (the “Initial Closing Date”), the Company acquired certain “hard assets” of Seller, including a packinghouse and related land (“Oxnard Lemon”), for a purchase price of
$24,750,000
(the “Initial Acquisition”). Pursuant to the Purchase Agreement, the closing on the purchase and sale of the “soft assets” of Seller, including Seller’s trade names, trademarks and copyrights, took place on October 31, 2018 (the “Final Closing Date”), at which point an additional
$250,000
in purchase price was paid to Seller by the Company. The aggregate purchase price for the tangible assets and the intangible assets provided in the Purchase Agreement is
$25,000,000
. Additionally, the Purchase Agreement provides that Seller lease back the tangible assets from the Company until the Final Closing Date, pursuant to a lease executed on the Initial Closing Date. Transaction costs of
$142,000
are included in selling, general and administrative expense.
Below is a summary of the fair value of the net assets acquired on the acquisition date based on a third-party valuation, which is considered a Level 3 fair value measurement under FASB ASC 820, Fair Value Measurements and Disclosures (in thousands):
79
LIMONEIRA COMPANY
NOTES TO CONSOLIDATED FINANCIAL STATEMENTS (CONTINUED)
3. Acquisitions
Business Combinations (continued)
|
Land and land improvements
|
$
|
7,294
|
|
|
Buildings and equipment
|
14,866
|
|
|
|
Customer relationships and trade names
|
2,270
|
|
|
|
Goodwill
|
570
|
|
|
|
Total assets acquired
|
$
|
25,000
|
|
Revenue of
$120,000
and net loss of
$139,000
of Oxnard Lemon are included in the Company’s consolidated statement of operations from the acquisition date to the period ended October 31, 2018. The unaudited, pro forma consolidated statement of operations as if Oxnard Lemon had been included in the consolidated results of the Company for the years ended October 31, 2018 and 2017 results in revenue of
$142,253,000
and
$143,399,000
, respectively and net income of
$19,728,000
and
$7,474,000
, respectively.
PDA
On February 24, 2017 (the “Acquisition Date”), the Company completed the acquisition of
90%
of the outstanding stock of PDA, a privately-owned Chilean corporation, for
$5,800,000
in cash (the “Acquisition”). PDA also had approximately
$1,700,000
in long-term debt on the Acquisition Date, which was assumed by the Company in the Acquisition. A holdback of
10%
of the purchase proceeds to be paid to the seller was withheld for a
six
-month period to allow for potential contingencies as defined in the purchase agreement. PDA is a
200
-acre lemon and orange orchard located near La Serena, Chile. PDA’s total assets of
$9,451,000
on the Acquisition Date included a
13%
equity interest in Rosales S.A. (“Rosales”) in which the Company owns a
35%
equity investment. After the Acquisition, the Company owns
47%
of Rosales and PDA’s
10%
stockholder owns the remaining
53%
of Rosales. Rosales packs and sells all of PDA’s citrus production. PDA had approximately
$450,000
of net income on approximately
$1,900,000
in sales for the year ended December 31, 2016. Transactions costs incurred in connection with the Acquisition in 2017 were approximately
$57,000
, which are included in selling, general and administrative expense.
In August 2017, a third-party valuation of the fair value of the net assets was finalized, which resulted in a
$193,000
increase in the investment in Rosales with a corresponding decrease in goodwill and increase in deferred income taxes. Additionally, a
$94,000
reduction in the purchase price was agreed upon per the terms of the purchase agreement with corresponding decreases in goodwill and noncontrolling interest. The Company received the
$94,000
in August 2017. Below is a summary of the fair value of the net assets acquired on the Acquisition Date based on the third-party valuation, which is considered a Level 3 fair value measurement under FASB ASC 820,
Fair Value Measurements and Disclosures
(in thousands):
|
Cultural costs
|
$
|
473
|
|
|
Other current assets
|
166
|
|
|
|
Land and land improvements
|
2,748
|
|
|
|
Buildings and equipment
|
206
|
|
|
|
Orchards
|
2,876
|
|
|
|
Investment in Rosales
|
1,021
|
|
|
|
Water rights
|
1,120
|
|
|
|
Deposit for land purchase
|
645
|
|
|
|
Goodwill
|
196
|
|
|
|
Total assets acquired
|
9,451
|
|
|
|
|
|||
|
Current liabilities
|
(122
|
)
|
|
|
Current and long-term debt
|
(1,964
|
)
|
|
|
Deferred income taxes
|
(1,026
|
)
|
|
|
Noncontrolling interest
|
(633
|
)
|
|
|
Net cash paid
|
$
|
5,706
|
|
80
LIMONEIRA COMPANY
NOTES TO CONSOLIDATED FINANCIAL STATEMENTS (CONTINUED)
3. Acquisitions
Business Combinations (continued)
Revenue of
$1,059,000
and net loss of
$415,000
of PDA are included in the Company’s consolidated statement of operations from the Acquisition Date to the period ended October 31, 2017.
The unaudited, pro forma consolidated statement of operations as if PDA had been included in the consolidated results of the Company for the years ended October 31, 2017 and 2016 results in revenues of
$121,920,000
and
$113,678,000
, respectively, and net income of
$6,654,000
and
$8,586,000
, respectively.
4. Fair Value Measurements
Under the FASB ASC 820,
Fair Value Measurements and Disclosures
, a fair value measurement is determined based on the assumptions that a market participant would use in pricing an asset or liability. A three-tiered hierarchy draws distinctions between market participant assumptions based on (i) observable inputs such as quoted prices in active markets (Level 1), (ii) inputs other than quoted prices in active markets that are observable either directly or indirectly (Level 2) and (iii) unobservable inputs that require the Company to use present value and other valuation techniques in the determination of fair value (Level 3).
The following table sets forth the Company’s financial assets and liabilities as of
October 31, 2018
and
2017
that are measured on a recurring basis during the period, segregated by level within the fair value hierarchy (in thousands):
|
2018
|
Level 1
|
Level 2
|
Level 3
|
Total
|
|||||||||||
|
Assets at fair value:
|
|
|
|
|
|
|
|
|
|||||||
|
Available-for-sale securities
|
$
|
24,250
|
|
$
|
—
|
|
$
|
—
|
|
$
|
24,250
|
|
|||
|
2017
|
Level 1
|
Level 2
|
Level 3
|
Total
|
|||||||||||
|
Assets at fair value:
|
|
|
|
|
|
|
|
|
|||||||
|
Available-for-sale securities
|
$
|
22,110
|
|
$
|
—
|
|
$
|
—
|
|
$
|
22,110
|
|
|||
|
Liabilities at fair value:
|
|||||||||||||||
|
Derivative
|
$
|
—
|
|
$
|
268
|
|
$
|
—
|
|
$
|
268
|
|
|||
Available-for-sale securities consist of marketable securities in Calavo common stock. At
October 31, 2018
and
2017
, the Company owned
250,000
and
300,000
, respectively, shares representing approximately
1.4%
and
1.7%
of Calavo’s outstanding common stock. These securities are measured at fair value by quoted market prices. Calavo’s stock price at
October 31, 2018
and
2017
was
$97.00
and
$73.70
per share, respectively.The derivative consisted of an interest rate swap, the fair value of which was estimated using industry-standard valuation models. The derivative expired in June 2018.
5. Prepaid Expenses and Other Current Assets
Prepaid expenses and other current assets consist of the following at October 31 (in thousands):
|
|
2018
|
2017
|
|||||
|
Prepaid insurance
|
$
|
647
|
|
$
|
609
|
|
|
|
Prepaid supplies
|
1,196
|
|
806
|
|
|||
|
Lemon supplier advances
|
170
|
|
271
|
|
|||
|
Note receivable
|
2,797
|
|
—
|
|
|||
|
Deferred lease expense and other
|
694
|
|
958
|
|
|||
|
Real estate development held for sale
|
5,024
|
|
4,337
|
|
|||
|
|
$
|
10,528
|
|
$
|
6,981
|
|
|
81
LIMONEIRA COMPANY
NOTES TO CONSOLIDATED FINANCIAL STATEMENTS (CONTINUED)
6. Property, Plant and Equipment
Property, plant and equipment consist of the following at October 31 (in thousands):
|
|
2018
|
2017
|
|||||
|
Land
|
$
|
93,245
|
|
$
|
78,856
|
|
|
|
Land improvements
|
30,134
|
|
26,289
|
|
|||
|
Buildings and building improvements
|
49,814
|
|
38,955
|
|
|||
|
Equipment
|
54,854
|
|
47,223
|
|
|||
|
Orchards
|
44,337
|
|
38,460
|
|
|||
|
Construction in progress
|
20,709
|
|
18,867
|
|
|||
|
|
293,093
|
|
248,650
|
|
|||
|
Less accumulated depreciation
|
(67,412
|
)
|
(60,425
|
)
|
|||
|
|
$
|
225,681
|
|
$
|
188,225
|
|
|
Depreciation expense was
$7,178,000
,
$6,370,000
and
$5,243,000
for fiscal years
2018
,
2017
and
2016
, respectively.
7. Real Estate Development
Real estate development assets are comprised primarily of land and land development costs and consist of the following at October 31 (in thousands):
|
|
2018
|
2017
|
|||||
|
East Areas I and II
|
$
|
107,162
|
|
$
|
74,500
|
|
|
|
Templeton Santa Barbara, LLC
|
—
|
|
6,582
|
|
|||
|
|
$
|
107,162
|
|
$
|
81,082
|
|
|
East Areas I and II
In fiscal year 2005, the Company began capitalizing the costs of
two
real estate development projects east of Santa Paula, California, for the development of
550
acres of land into residential units, commercial buildings and civic facilities. During fiscal years
2018
and
2017
, the Company capitalized
$32,662,000
and
$8,403,000
, respectively, of costs related to these real estate development projects. Additionally, in relation to these projects, the Company incurred expenses of
$23,000
,
$113,000
and
$1,161,000
in fiscal years
2018
,
2017
and
2016
, respectively.
On November 10, 2015 (the “Transaction Date”), the Company entered into a joint venture with The Lewis Group of Companies (“Lewis”) for the residential development of its East Area I real estate development project. To consummate the transaction, the Company formed Limoneira Lewis Community Builders, LLC (the “LLC” or “Joint Venture”) as the development entity, contributed its East Area I property to the LLC and sold a
50%
interest in the LLC to Lewis for
$20,000,000
, comprised of a
$2,000,000
deposit received in September 2015 and
$18,000,000
received on the Transaction Date. The Company received net cash of approximately
$18,800,000
after transaction costs of approximately
$1,200,000
, which were expensed in the first quarter of fiscal year 2016. In addition, on the Transaction Date, the Company incurred a Success Fee with Parkstone Companies, Inc., in the amount of
$2,100,000
, which was paid on January 28, 2016 and capitalized as a component of the Company’s investment in the East Area I property.
On the Transaction Date, the LLC and Lewis also entered into a limited liability company agreement (the “LLC Agreement”) providing for the admittance of Lewis as a
50%
member of the Joint Venture. The LLC Agreement provides that Lewis will serve as the manager of the Joint Venture with the right to manage, control, and conduct its day-to-day business and development activities. Certain major decisions, which are enumerated in the LLC Agreement, require approval by an executive committee comprised of
two
representatives appointed by Lewis and
two
representatives appointed by the Company.
Pursuant to the LLC Agreement, the Joint Venture will own, develop, subdivide, entitle, maintain, improve, hold for investment, market and dispose of the Joint Venture’s property in accordance with the business plan and budget approved by the executive committee.
82
LIMONEIRA COMPANY
NOTES TO CONSOLIDATED FINANCIAL STATEMENTS (CONTINUED)
7. Real Estate Development (continued)
East Areas I and II (continued)
Further, on the Transaction Date, the Joint Venture and the Company entered into a Lease Agreement (the "Lease Agreement"), pursuant to which the Joint Venture leased certain of the contributed East Area I property back to the Company for continuation of agricultural operations, and certain other permitted uses, on the property until the Joint Venture requires the property for development. The Lease terminates in stages corresponding to the Joint Venture's development of the property, which is to occur in stages pursuant to a phased master development plan. In any event, the Lease will terminate
five
years from the Transaction Date.
The Company and the Joint Venture also entered into a Retained Property Development Agreement on the Transaction Date (the "Retained Property Agreement"). Under the terms of the Retained Property Agreement, the Joint Venture will transfer certain contributed East Area I property, which is entitled for commercial development, back to the Company (the "Retained Property") and arrange for the design and construction of certain improvements to the Retained Property, subject to certain reimbursements by the Company. In August 2018, the Retained Property was transferred back to the Company.
The Company’s sale of an interest in the LLC in which the Company’s contributed property comprises the LLC’s primary asset, combined with the Lease Agreement is considered a sale-leaseback transaction under
FASB ASC 840, Leases,
because of the Company’s continuing involvement in the property in the form of its agricultural operations. Accordingly, the property continues to be carried on the consolidated balance sheet as real estate development, rather than being classified as an equity investment and a sale-leaseback deferral has been recorded for the
$20,000,000
payment made by Lewis for the purchase of the LLC interest. Lease expense associated with the Lease Agreement is not required under sale-leaseback accounting since the Company is treated as though it continues to own the property. During the year ended
October 31, 2018
and
2017
, the Company recorded
$27,934,000
and
$7,047,000
, respectively, of real estate development costs and corresponding increases in the sale-leaseback deferral to recognize real estate development costs capitalized by the LLC. There are no repayment requirements for the sale-leaseback deferral and as the Lease Agreement is terminated in connection with the staged development of the property, a corresponding amount of real estate development and the sale-leaseback deferral will be adjusted to equity investments on the consolidated balance sheet. In December 2018, the Company terminated the lease per the terms of the lease agreement.
In connection with the LLC Agreement, the Company was reimbursed
$250,000
by the Joint Venture in January 2018 for Initial Public Safety Facility Payments made to the City of Santa Paula in October 2015. This amount was included in prepaid expenses and other current assets in the consolidated balance sheets as of October 31, 2017. Additionally, the Company leases office space to Lewis and received rental income of
$16,000
,
$16,000
and
$12,000
for the years ended
October 31, 2018
,
2017
and
2016
, respectively.
The Company determined the Joint Venture to be a Variable Interest Entity (“VIE”) under
ASC 810, Consolidation,
because the Joint Venture will require additional subordinated financial support to finance its operations. The Company further determined that it is not the primary beneficiary of the VIE, as the Company and Lewis have joint control over all significant decisions affecting the Joint Venture's economic performance. Accordingly, contributions made by the Company to the LLC, the Company’s proportionate share of Joint Venture’s results of operations and distributions received by the Company from the LLC will be accounted for under the equity method. The Company made contributions of
$3,500,000
and
$7,450,000
for the years ended
October 31, 2018
and
2017
, respectively, and an additional
$4,000,000
in December 2018.
In January 2018, the Joint Venture entered into a
$45,000,000
unsecured Line of Credit Loan Agreement and Promissory Note (the “Loan”) with Bank of America, N.A. to fund early development activities. The Loan matures in January 2020, with an option to extend the maturity date until 2021, subject to certain conditions. The interest rate on the Loan is LIBOR plus
2.85%
, payable monthly. The Loan contains certain customary default provisions and the Joint Venture may prepay any amounts outstanding under the Loan without penalty.
In February 2018, the obligations under the Loan were guaranteed by certain principals from Lewis and by the Company. The guarantee shall continue in effect until all of the Loan obligations are fully paid and the guarantors are jointly and severally liable for all Loan obligations in the event of default by the Joint Venture. The Joint Venture recorded the Loan balance of
$36,243,000
as of October 31, 2018. The
$1,080,000
estimated value of the guarantee was recorded in the Company’s consolidated balance sheets and is included in other long-term liabilities with a corresponding increase in equity in investments. The Company has elected to reduce the guarantee liability upon expiration or settlement of the guarantee. Additionally, a Reimbursement Agreement was executed between the Lewis guarantors and the Company which provides for unpaid liabilities of the Joint Venture to be shared pro-rata by the Lewis guarantors and the Company in proportion to their percentage interest in the Joint Venture.
83
LIMONEIRA COMPANY
NOTES TO CONSOLIDATED FINANCIAL STATEMENTS (CONTINUED)
7. Real Estate Development (continued)
East Areas I and II (continued)
In connection with facilitating the annexation of the East Area I property into the City of Santa Paula, during February 2013, the Company entered into a Capital Improvement Cost Sharing Agreement for Improvements to Santa Paula Creek Channel (the “Cost Sharing Agreement”) with the Ventura County Watershed Protection District (the “District”). The Cost Sharing Agreement requires the Company to reimburse the District
28.5%
of the costs of the improvements, up to a maximum of
$5,000,000
. Additionally, the Company is required to pay the cost of preparing a study to determine a feasible scope of work and budget for the improvements. No cost reimbursements have been incurred to date in relation to the Cost Sharing Agreement.
In February 2013, the Company entered into an option agreement for the purchase of a
7
-acre parcel adjacent to its East Area II real estate development project. The Company made a
$75,000
initial option payment in 2013 and four additional annual option payments of
$50,000
each from 2014 to 2017. In February 2018, the Company exercised its option and purchased the property for
$3,145,000
, by making a cash payment of
$1,444,000
and issuing a note payable for
$1,435,000
. The
$275,000
of option payments were applied to the purchase price and the Company incurred
$9,000
of transaction costs. The note payable is due in
five
years, with interest-only, monthly payments at interest rates ranging from
5.0%
to
7.0%
.
Templeton Santa Barbara, LLC
The real estate development parcels within the Templeton Santa Barbara, LLC project are described as Centennial Square (“Centennial”), The Terraces at Pacific Crest (“Pacific Crest”), and Sevilla. The net carrying values of Pacific Crest and Sevilla as of
October 31, 2018
were
$2,481,000
and
$2,543,000
, respectively. The net carrying values of Centennial, Pacific Crest and Sevilla, as of
October 31, 2017
were
$2,983,000
,
$3,250,000
and
$4,686,000
, respectively. These projects were idle during
2018
and
2017
and, as such, no costs were capitalized. In relation to these projects, the Company incurred expenses of
$104,000
,
$172,000
and
$174,000
in fiscal years
2018
,
2017
and
2016
, respectively. Additionally, the Company recognized impairment charges of
$769,000
and
$789,000
related to Pacific Crest and Sevilla, respectively, in fiscal year 2018 and an impairment charge of
$120,000
related to Pacific Crest in fiscal year 2017.
In March 2017, the Company began negotiations to sell its Centennial property for
$3,200,000
. This transaction was cancelled in October 2017 because the buyer was unsuccessful in arranging financing and the Company recognized
$100,000
of other income from the non-refundable deposit. In October 2017, the Company entered an agreement with another buyer to sell Centennial for
$3,250,000
. This transaction closed in December 2017 with the Company receiving net proceeds of
$179,000
and receiving a
$3,000,000
promissory note secured by the property for the balance of the purchase price. After transaction costs, the sale resulted in a gain of
$194,000
, to be recognized under the installment method, with
$15,000
recognized fiscal year ended October 31, 2018 and
$179,000
deferred until repayment of the promissory note. The promissory note was originally scheduled to mature in June 2018 but provided for three potential extensions to December 2019. In fiscal year 2018, per the terms of the promissory note, the holder of the note made
two
non-refundable
$100,000
payments to the Company, extending the due date to December 30, 2018.
In November 2018, the holder of the note made a non-refundable
$100,000
payment, extending the due date to December 15, 2019. Interest income related to this note was
$172,000
in fiscal year 2018.
In August 2017, the Company entered an agreement to sell the commercial portion of its Sevilla project for
$1,452,000
. This transaction closed in November 2017 with the Company receiving net proceeds of
$1,364,000
. The Company recognized a gain of
$10,000
after transaction costs.
In October 2018, the Company began negotiations to sell its Pacific Crest and Sevilla properties for a combined total price of
$5,200,000
. As a result, the Company recorded impairment charges on Pacific Crest and Sevilla of
$769,000
and
$789,000
, respectively. As of the date of this filing, these transactions are still in negotiations.
At October 31, 2018, the
$2,481,000
carrying value of Pacific Crest and the
$2,543,000
carrying value of Sevilla were classified as held for sale and included in prepaid expenses and other current assets. At October 31, 2017, the
$2,983,000
carrying value of Centennial and the
$1,354,000
carrying value of the commercial portion of Sevilla were classified as held for sale and included in prepaid expenses and other current assets. Additionally, at October 31, 2017, the
$3,250,000
carrying value of Pacific Crest and the
$3,332,000
carrying value of the residential portion of Sevilla were classified as real estate development.
84
LIMONEIRA COMPANY
NOTES TO CONSOLIDATED FINANCIAL STATEMENTS (CONTINUED)
8. Equity Investments
Limco Del Mar, Ltd.
The Company has a
1.3%
interest in Limco Del Mar, Ltd. (“Del Mar”) as a general partner and a
26.8%
interest as a limited partner. In October 2016, the Company purchased
14,468
units of Del Mar for
$940,000
, increasing our prior-year
22.1%
interest as a limited partner. The Company paid
$615,000
in October 2016 and
$325,000
in November 2016 for these additional units. Based on the terms of the partnership agreement, the Company may be removed as general partner without cause from the partnership upon the vote of the limited partners owning an aggregate of
50%
or more interest in the partnership. Since the Company has significant influence, but less than a controlling interest, the Company’s investment in Del Mar is accounted for using the equity method of accounting.
The Company provides Del Mar with farm management, orchard land development and accounting services and received expense reimbursements of
$163,000
,
$146,000
and
$146,000
in fiscal years
2018
,
2017
and
2016
, respectively. Del Mar markets lemons through the Company pursuant to its customary marketing agreements and the amount of lemons procured from Del Mar was
$2,361,000
,
$2,271,000
and
$2,002,000
in fiscal years
2018
,
2017
and
2016
, respectively. Fruit proceeds due to Del Mar were
$709,000
and
$912,000
at
October 31, 2018
and
2017
, respectively, and are included in grower’s payable in the accompanying consolidated balance sheets.
Romney Property Partnership
In May 2007, the Company and an individual formed the Romney Property Partnership (“Romney”) for the purpose of owning and leasing an office building and adjacent lot in Santa Paula, California. The Company paid
$489,000
in 2007 for
75%
interest in Romney. The terms of the partnership agreement affirm the status of the Company as a noncontrolling investor in the partnership since the Company cannot exercise unilateral control over the partnership. Since the Company has significant influence, but less than a controlling interest, the Company’s investment in Romney is accounted for using the equity method of accounting. Net profits, losses and cash flows of Romney are shared by the Company, which receives
75%
and the individual, who receives
25%
.
Rosales S.A.
On August 14, 2014, through its wholly owned subsidiary, Limoneira Chile SpA, the Company invested
$1,750,000
for a
35%
interest in Rosales S.A, (“Rosales”), a citrus packing, marketing and sales business located in La Serena, Chile. The Company’s investment included certain preferred interest provisions through December 31, 2016, including cash distributions of the
50%
and
40%
of the net income of Rosales for the years ending December 31, 2014 and 2015, respectively, as well as a liquidation preference on its investment. In addition, the Company has the right to acquire the interest of the majority shareholder of Rosales upon death or disability of Rosales’ general manager for the fair value of the interest on the date of the event as defined in the shareholders’ agreement. In February 2017, the Company acquired an additional
12%
ownership interest in Rosales with the purchase of PDA as described in Note 3 – Acquisitions of the notes to consolidated financial statements included in this Annual Report. Since the Company has significant influence, but less than a controlling interest, the Company’s investment in Rosales is accounted for using the equity method of accounting.
Rosales’ functional currency is the Chilean Peso. The following financial information has been translated to U.S. dollars. In addition, as a result of the Company’s acquisition of its equity interest, basis differences were identified between the historical cost of the net assets of Rosales and the proportionate fair value of the net assets acquired. Such basis differences aggregated
$1,683,000
on the acquisition date and are primarily comprised of intangible assets, including
$343,000
of equity method goodwill. An additional
$925,000
of basis differences were identified with the February 2017 PDA acquisition, including
$143,000
of equity method goodwill. The
$2,122,000
in basis differences exclusive of goodwill is being amortized over the estimated life of the underlying intangible assets as a reduction in the equity investment and an expense included in equity in earnings (losses) of investments. Amortization amounted to
$337,000
,
$290,000
and
$208,000
for fiscal year
2018
,
2017
and
2016
, respectively, and is estimated to be approximately
$180,000
per year for years ending October 31, 2019 through October 31, 2023.
Limoneira Lewis Community Builders, LLC (the “LLC” or "Joint Venture")
As described in Note 7 – Real Estate Development of the notes to consolidated financial statements included in this Annual Report, on November 10, 2015, the Company entered into a Joint Venture with Lewis for the residential development of its East Area I real estate development project.
85
LIMONEIRA COMPANY
NOTES TO CONSOLIDATED FINANCIAL STATEMENTS (CONTINUED)
8. Equity Investments (continued)
Limoneira Lewis Community Builders, LLC (the “LLC” or "Joint Venture") (continued)
The following is unaudited financial information of the equity method investees for fiscal years
2018
,
2017
and
2016
(in thousands):
|
2018
|
Del Mar
|
Romney
|
Rosales
|
LLC
|
Total
|
||||||||||||||
|
Assets
|
$
|
1,148
|
|
$
|
676
|
|
$
|
6,967
|
|
$
|
125,886
|
|
$
|
134,677
|
|
||||
|
Liabilities
|
$
|
—
|
|
$
|
—
|
|
$
|
5,029
|
|
$
|
56,932
|
|
$
|
61,961
|
|
||||
|
Equity
|
1,148
|
|
676
|
|
1,938
|
|
68,954
|
|
72,716
|
|
|||||||||
|
Total liabilities and equity
|
$
|
1,148
|
|
$
|
676
|
|
$
|
6,967
|
|
$
|
125,886
|
|
$
|
134,677
|
|
||||
|
Revenues
|
$
|
2,893
|
|
$
|
21
|
|
$
|
13,630
|
|
$
|
40
|
|
$
|
16,584
|
|
||||
|
Expenses
|
1,138
|
|
25
|
|
12,387
|
|
194
|
|
13,744
|
|
|||||||||
|
Net income (loss)
|
$
|
1,755
|
|
$
|
(4
|
)
|
$
|
1,243
|
|
$
|
(154
|
)
|
$
|
2,840
|
|
||||
|
2017
|
|||||||||||||||||||
|
Assets
|
$
|
1,269
|
|
$
|
680
|
|
$
|
2,645
|
|
$
|
62,399
|
|
$
|
66,993
|
|
||||
|
Liabilities
|
$
|
—
|
|
$
|
—
|
|
$
|
1,853
|
|
$
|
291
|
|
$
|
2,144
|
|
||||
|
Equity
|
1,269
|
|
680
|
|
792
|
|
62,108
|
|
64,849
|
|
|||||||||
|
Total liabilities and equity
|
$
|
1,269
|
|
$
|
680
|
|
$
|
2,645
|
|
$
|
62,399
|
|
$
|
66,993
|
|
||||
|
Revenues
|
$
|
2,553
|
|
$
|
20
|
|
$
|
10,171
|
|
$
|
—
|
|
$
|
12,744
|
|
||||
|
Expenses
|
966
|
|
29
|
|
10,192
|
|
89
|
|
11,276
|
|
|||||||||
|
Net income (loss)
|
$
|
1,587
|
|
$
|
(9
|
)
|
$
|
(21
|
)
|
$
|
(89
|
)
|
$
|
1,468
|
|
||||
|
2016
|
|||||||||||||||||||
|
Assets
|
$
|
1,244
|
|
$
|
690
|
|
$
|
4,300
|
|
$
|
47,332
|
|
$
|
53,566
|
|
||||
|
Liabilities
|
$
|
—
|
|
$
|
—
|
|
$
|
2,719
|
|
$
|
36
|
|
$
|
2,755
|
|
||||
|
Equity
|
1,244
|
|
690
|
|
1,581
|
|
47,296
|
|
50,811
|
|
|||||||||
|
Total liabilities and equity
|
$
|
1,244
|
|
$
|
690
|
|
$
|
4,300
|
|
$
|
47,332
|
|
$
|
53,566
|
|
||||
|
Revenues
|
$
|
3,452
|
|
$
|
11
|
|
$
|
7,639
|
|
$
|
—
|
|
$
|
11,102
|
|
||||
|
Expenses
|
910
|
|
24
|
|
6,979
|
|
1
|
|
7,914
|
|
|||||||||
|
Net income (loss)
|
$
|
2,542
|
|
$
|
(13
|
)
|
$
|
660
|
|
$
|
(1
|
)
|
$
|
3,188
|
|
||||
86
LIMONEIRA COMPANY
NOTES TO CONSOLIDATED FINANCIAL STATEMENTS (CONTINUED)
8. Equity Investments (continued)
Limoneira Lewis Community Builders, LLC (the “LLC” or "Joint Venture") (continued)
The Company’s investment and equity in earnings (losses) of the equity method investees are as follows (in thousands):
|
|
Del Mar
|
Romney
|
Rosales
|
LLC
|
Total
|
||||||||||||||
|
Investment balance October 31, 2015
|
$
|
1,004
|
|
$
|
531
|
|
$
|
1,512
|
|
$
|
—
|
|
$
|
3,047
|
|
||||
|
Equity earnings (losses)
|
603
|
|
(9
|
)
|
40
|
|
—
|
|
634
|
|
|||||||||
|
Cash distributions
|
(586
|
)
|
—
|
|
(56
|
)
|
—
|
|
(642
|
)
|
|||||||||
|
Investment contributions
|
940
|
|
—
|
|
—
|
|
2,275
|
|
3,215
|
|
|||||||||
|
Investment balance October 31, 2016
|
1,961
|
|
522
|
|
1,496
|
|
2,275
|
|
6,254
|
|
|||||||||
|
Equity earnings (losses)
|
446
|
|
(7
|
)
|
(299
|
)
|
(91
|
)
|
49
|
|
|||||||||
|
Cash distributions
|
(439
|
)
|
—
|
|
(273
|
)
|
—
|
|
(712
|
)
|
|||||||||
|
Investment contributions
|
—
|
|
—
|
|
1,020
|
|
7,450
|
|
8,470
|
|
|||||||||
|
Investment balance October 31, 2017
|
1,968
|
|
515
|
|
1,944
|
|
9,634
|
|
14,061
|
|
|||||||||
|
Equity earnings (losses)
|
493
|
|
(3
|
)
|
247
|
|
(154
|
)
|
583
|
|
|||||||||
|
Cash distributions
|
(526
|
)
|
—
|
|
—
|
|
—
|
|
(526
|
)
|
|||||||||
|
Investment contributions
|
—
|
|
—
|
|
—
|
|
3,500
|
|
3,500
|
|
|||||||||
|
Loan guarantee
|
—
|
|
—
|
|
—
|
|
1,080
|
|
1,080
|
|
|||||||||
|
Investment balance October 31, 2018
|
$
|
1,935
|
|
$
|
512
|
|
$
|
2,191
|
|
$
|
14,060
|
|
$
|
18,698
|
|
||||
9. Investment in Calavo Growers, Inc.
In June 2005, the Company entered into a stock purchase agreement with Calavo. Pursuant to this agreement, the Company purchased
1,000,000
shares, or approximately
6.9%
, of Calavo's common stock for
$10,000,000
and Calavo purchased
1,728,570
shares, or approximately
15.1%
, of the Company’s common stock for
$23,450,000
. Under the terms of the agreement, the Company received net cash consideration of
$13,450,000
. The Company has classified its Calavo investment as available-for-sale.
In fiscal year 2009, the Company sold
335,000
shares of Calavo stock for a total of
$6,079,000
, recognizing a gain of
$2,729,000
. In fiscal year 2013, the Company sold
165,000
shares to Calavo for a total of
$4,788,000
, recognizing a gain of
$3,138,000
. In fiscal year 2015, the Company sold
140,000
shares for a total of
$6,433,000
, recognizing a gain of
$5,033,000
. In June and July 2016, the Company sold
60,000
shares, in aggregate, for a total of
$4,019,000
, recognizing a gain of
$3,419,000
. In fiscal year 2018, the Company sold
50,000
shares for a total of
$4,721,000
, recognizing a gain of
$4,223,000
. These gains are included in other income in the consolidated statements of operations. The Company continues to own
250,000
shares of Calavo's common stock.
Additionally, changes in the fair value of the available-for-sale securities result in unrealized holding gains or losses on shares held by the Company and sales of the available-for-sale securities result in reclassifications of unrealized gains. In fiscal year 2018, the Company recorded unrealized holding gains of
$6,765,000
(
$4,809,000
net of tax) and reclassification of unrealized gain on securities sold of
$4,125,000
(
$2,965,000
net of tax). In fiscal year 2017, the Company recorded unrealized holding gains of
$4,365,000
(
$2,643,000
net of tax). In fiscal year 2016, the Company recorded unrealized holding gains of
$2,668,000
(
$1,619,000
net of tax) and reclassification of unrealized gain on securities sold of
$2,830,000
(
$1,719,000
net of tax).
87
LIMONEIRA COMPANY
NOTES TO CONSOLIDATED FINANCIAL STATEMENTS (CONTINUED)
10. Other Assets
Other assets consist of the following at October 31 (in thousands):
|
|
2018
|
2017
|
|||||
|
Investments in mutual water companies
|
$
|
5,026
|
|
$
|
4,686
|
|
|
|
Acquired water and mineral rights
|
3,783
|
|
2,655
|
|
|||
|
Deposit for land purchase
|
593
|
|
645
|
|
|||
|
Deferred lease assets and other
|
396
|
|
448
|
|
|||
|
Note receivable
|
566
|
|
625
|
|
|||
|
Revolving funds and memberships
|
267
|
|
265
|
|
|||
|
Acquired trade names, trademarks and customer relationships
|
2,442
|
|
233
|
|
|||
|
Goodwill
|
1,431
|
|
876
|
|
|||
|
|
$
|
14,504
|
|
$
|
10,433
|
|
|
Investments in Mutual Water Companies
The Company’s investments in various not-for-profit mutual water companies provide the Company with the right to receive a proportionate share of water from each of the not-for-profit mutual water companies that have been invested in and do not constitute voting shares and/or rights.
Acquired Water and Mineral Rights
Acquired water and mineral rights are indefinite-life intangible assets not subject to amortization.
Deferred Lease Assets and Other
Deferred lease assets and other as of
October 31, 2018
and
2017
includes
$139,000
and
$146,000
of deferred rent assets and prepaid lease amounts on pollination equipment of
$43,000
and
$55,000
, respectively.
In addition, deferred lease assets and other as of
October 31, 2018
and
2017
includes a patent for an agricultural variety with a carrying value of
$71,000
and
$84,000
, respectively, net of accumulated amortization of
$151,000
and
$138,000
, respectively. Amortization expense associated with the patent was
$13,000
for each of the fiscal years
2018
,
2017
and
2016
.
Note Receivable
In fiscal year 2004, the Company sold a parcel of land in Morro Bay, California that the buyers operate as an avocado orchard. The sale was recognized under the installment method and the resulting gain on the sale of
$161,000
was deferred. In connection with the sale, the Company recorded a note receivable of
$4,263,000
. The note is subordinate to bank financing. Principal of
$2,963,000
and interest was paid April 1, 2005 and
$112,000
of the deferred gain was recognized as income at that time. The remaining principal balance of
$1,300,000
and the related accrued interest was initially payable April 1, 2009; however, the Company and the note holder executed a note extension agreement in March 2009 extending the due date of note until April 1, 2014, which was subsequently extended to April 2028.
In fiscal year 2015, an affiliate of the note holder completed drilling five water wells at certain of the Company’s agricultural properties as non-cash payments on the note. The fair value of the well drilling services was
$1,535,000
and the Company recorded a reduction of the note comprised of
$711,000
of principal and
$824,000
in accrued interest. On August 8, 2017, the note holder made a
$10,000
principle payment and the Company and the note holder agreed to extend the maturity date of the note to
April 1, 2028
and modify certain of its terms. The modified terms provide for non-cash payments over the term of the note in the form of well drilling services by the note holder’s affiliate, revising the interest rate from
LIBOR plus 3.5%
to a fixed rate of
4%
and require annual interest payments until the maturity date. Combined principal and accrued interest was
$566,000
and
$625,000
at
October 31, 2018
and
2017
, respectively. Interest income was
$20,000
,
$23,000
, and
$23,000
in fiscal years
2018
,
2017
and
2016
, respectively. The deferred gain was
$22,000
at
October 31, 2018
and
2017
. In December 2017, the note holder’s affiliate completed well drilling services that resulted in a non-cash reduction in the note of
$79,000
.
Revolving Funds and Memberships
Revolving funds and memberships represent the Company’s investments in various cooperative associations.
88
LIMONEIRA COMPANY
NOTES TO CONSOLIDATED FINANCIAL STATEMENTS (CONTINUED)
10. Other Assets (continued)
Acquired Trade Names, Trademarks, Customer Relationships and Goodwill
The Company acquired
$486,000
of trade names and trademarks and
$680,000
of goodwill in its acquisition of Associated in September 2013. Additionally, the Company acquired
$160,000
of customer relationships with the acquisition of the Yuma packinghouse in June 2014. Customer relationships are amortized over
five
to
eight
years and the Company amortized the remaining balance of
$24,000
in fiscal year 2018. Accumulated amortization for trade names, trademarks and customer relationships was
$474,000
and
$390,000
as of
October 31, 2018
and
2017
, respectively. Amortization expense for trade names, trademarks and customer relationships was
$84,000
,
$85,000
and
$83,000
in fiscal years
2018
,
2017
and
2016
, respectively. Additionally, the Company recognized a fair value adjustment to customer relationships and recorded a
$20,000
increase in agribusiness costs and expenses in fiscal year 2016. In February 2017 the Company acquired
$196,000
of goodwill with the purchase of PDA. The Company acquired
$2,270,000
of trade names and customer relationships and
$570,000
of goodwill in its acquisition of Oxnard Lemon in July 2018.
Based on current information, estimated future amortization expense of intangible assets are as follows (in thousands):
|
2019
|
$
|
358
|
|
|
2020
|
358
|
|
|
|
2021
|
348
|
|
|
|
2022
|
297
|
|
|
|
2023
|
297
|
|
|
|
Thereafter
|
855
|
|
|
|
|
$
|
2,513
|
|
11. Accrued Liabilities
Accrued liabilities consist of the following at October 31 (in thousands):
|
|
2018
|
2017
|
|||||
|
Compensation
|
$
|
2,784
|
|
$
|
2,367
|
|
|
|
Property taxes
|
785
|
|
599
|
|
|||
|
Interest
|
297
|
|
327
|
|
|||
|
Deferred rental income and deposits
|
497
|
|
636
|
|
|||
|
Lease expense
|
378
|
|
137
|
|
|||
|
Lemon supplier payables
|
1,214
|
|
166
|
|
|||
|
Capital expenditures, reserves and other
|
1,769
|
|
945
|
|
|||
|
|
$
|
7,724
|
|
$
|
5,177
|
|
|
89
LIMONEIRA COMPANY
NOTES TO CONSOLIDATED FINANCIAL STATEMENTS (CONTINUED)
12. Long-Term Debt
Long-term debt is comprised of the following at October 31 (in thousands):
|
|
2018
|
2017
|
|||||
|
Farm Credit West revolving and non-revolving lines of credit: the interest rate of the revolving line of credit is variable based on the one-month London Interbank Offered Rate (“LIBOR”), which was 2.23% at October 31, 2018, plus 1.85%. On July 1, 2018, the interest rate for the $40.0 million outstanding balance of the non-revolving line of credit was fixed at 4.77%. Interest is payable monthly and the principal is due in full on July 1, 2022.
|
$
|
50,888
|
|
$
|
74,556
|
|
|
|
Farm Credit West term loan: the interest rate is variable and was 4.70% at October 31, 2018. The loan is payable in quarterly installments through November 2022.
|
2,602
|
|
3,155
|
|
|||
|
Farm Credit West term loan: the interest rate is variable and was 4.70% at October 31, 2018. The loan is payable in monthly installments through October 2035.
|
1,122
|
|
1,167
|
|
|||
|
Farm Credit West term loan: the interest rate is fixed at 4.70%. The loan is payable in monthly installments though March 2036.
|
9,172
|
|
9,504
|
|
|||
|
Farm Credit West term loan: the interest rate is fixed at 3.62% until March 2021, becoming variable for the remainder of the loan. The loan is payable in monthly installments through March 2036.
|
6,808
|
|
7,083
|
|
|||
|
Wells Fargo term loan: the interest rate is fixed at 3.58%. The loan is payable in monthly installments through January 2023.
|
6,367
|
|
7,730
|
|
|||
|
Banco de Chile term loan: the interest rate is fixed at 6.48%. The loan is payable in annual installments through January 2025.
|
1,857
|
|
2,106
|
|
|||
|
Note Payable: the interest rate ranges from 5.0% to 7.0% and was 5.0% at October 31, 2018. The loan includes interest-only monthly payments and principal is due in February 2023.
|
1,435
|
|
—
|
|
|||
|
Subtotal
|
80,251
|
|
105,301
|
|
|||
|
Less deferred financing costs
|
158
|
|
188
|
|
|||
|
Total long-term debt, net
|
80,093
|
|
105,113
|
|
|||
|
Less current portion
|
3,127
|
|
3,030
|
|
|||
|
Long-term debt, less current portion
|
$
|
76,966
|
|
$
|
102,083
|
|
|
On June 20, 2017, the Company entered into a Master Loan Agreement (the “Loan Agreement”) with Farm Credit West, FLCA ("Farm Credit West") which includes a Revolving Credit Supplement and a Non-Revolving Credit Supplement (the “Supplements”). Proceeds from the Supplements were used to pay down all the remaining outstanding indebtedness under the revolving credit facility we had with Rabobank, N.A. On January 29, 2018, we amended the Revolving Credit Supplement to increase the borrowing capacity from
$60,000,000
to
$75,000,000
. The Supplements provide aggregate borrowing capacity of
$115,000,000
comprised of
$75,000,000
under the Revolving Credit Supplement and
$40,000,000
under the Non-Revolving Credit Supplement.
In May 2018, the Company entered into a Conversion Agreement with Farm Credit West which fixed the interest rate on the Non-Revolving Credit Supplement at
4.77%
effective July 1, 2018. The agreement provides for a fee equal to
0.50%
of any amounts prepaid under the Non-Revolving Credit Supplement. The Company may prepay any amounts under the Revolving Credit Supplement without penalty.
90
LIMONEIRA COMPANY
NOTES TO CONSOLIDATED FINANCIAL STATEMENTS (CONTINUED)
12. Long-Term Debt (continued)
The interest rate for any amount outstanding under the Supplements is based on the one-month London Interbank Offered Rate (“LIBOR”) rate plus an applicable margin, which is subject to adjustment on a monthly basis. The applicable margin ranges from
1.60%
to
2.35%
depending on the ratio of current assets plus the remaining available commitment divided by current liabilities. On July 1,
2019
, and on each one-year anniversary thereafter, we have the option to convert the interest rate in use under each Supplement from the preceding LIBOR-based calculation to a variable interest rate, or the reverse, as applicable. Any amounts outstanding under the Supplements are due and payable in full on July 1, 2022.
All indebtedness under the Loan Agreement, including any indebtedness under the Supplements, is secured by a first lien on certain of our agricultural properties in Tulare and Ventura counties in California and certain of our building fixtures and improvements and investments in mutual water companies associated with the pledged agricultural properties. The Loan Agreement includes customary default provisions that provide should an event of default occur, Farm Credit West, at its option, may declare all or any portion of the indebtedness under the Loan Agreement to be immediately due and payable without demand, notice of non-payment, protest or prior recourse to collateral, and terminate or suspend our right to draw or request funds on any loan or line of credit.
The Loan Agreement subjects us to affirmative and restrictive covenants including, among other customary covenants, financial reporting requirements, requirements to maintain and repair any collateral, restrictions on the sale of assets, restrictions on the use of proceeds, prohibitions on the incurrence of additional debt and restrictions on the purchase or sale of major assets of our business. The Company is also subject to a covenant that it will maintain a debt service coverage ratio greater than
1.25
:1.0 measured annually at October 31. The Company was in compliance with covenants as of October 31, 2018.
The Supplements provide for maximum borrowings of
$115,000,000
and the borrowing capacity based on collateral value was
$115,000,000
at
October 31, 2018
.
In fiscal year 2017 the Company paid and capitalized debt financing costs of
$108,000
related to the Loan Agreement and expensed
$45,000
of capitalized debt financing costs related to the Rabobank revolving credit facility.
On January 20, 2016, the Company entered into a
$10,000,000
term loan with Wells Fargo Equipment Finance, Inc., which is secured by certain equipment associated with the Company’s new packing facilities. The loan includes a prepayment penalty of
2%
of the unpaid balance for the first eighteen months, with no prepayment penalty thereafter.
On February 16, 2016, the Company entered into a Promissory Note and Loan Agreement with Farm Credit West. The loan agreement provides for a term loan in the amount of
$10,000,000
and a term loan in the amount of
$7,500,000
(the “Term Loans”). The proceeds from the Term Loans were used to repay the Farm Credit West Line of Credit and pay down outstanding indebtedness.
The Banco de Chile term loan was assumed with the acquisition of PDA in February 2017. The interest rate is fixed at
6.48%
. The loan is payable in
eight
annual principal and interest payments that began in January 2018. This loan is unsecured.
In February 2013, the Company entered into an option agreement for the purchase of a
7
-acre parcel adjacent to its East Area II real estate development project. The Company made a
$75,000
initial option payment in 2013 and four additional annual option payments of
$50,000
each from 2014 to 2017. In February 2018, the Company exercised its option and purchased the property for
$3,145,000
, by making a cash payment of
$1,444,000
and issuing a note payable for
$1,435,000
. The
$275,000
of option payments were applied to the purchase price and the Company incurred
$9,000
of transaction costs. The note payable is due in
five
years, with interest-only, monthly payments at interest rates ranging from
5.0%
to
7.0%
.
Interest is capitalized on non-bearing orchards, real estate development projects and significant construction in progress. The Company capitalized interest of
$2,407,000
and
$2,022,000
during the year ended
October 31, 2018
and
2017
, respectively. Capitalized interest is included in property, plant and equipment and real estate development assets in the Company’s consolidated balance sheets.
The Company incurs certain loan fees and costs associated with its new or amended credit arrangements. Such costs are capitalized as deferred financing costs and amortized as interest expense using the straight-line method over the terms of the credit agreements. The balance of deferred financing costs is
$158,000
net of amortization and is included in long-term debt on the Company’s consolidated balance sheet at
October 31, 2018
.
91
LIMONEIRA COMPANY
NOTES TO CONSOLIDATED FINANCIAL STATEMENTS (CONTINUED)
12. Long-Term Debt (continued)
Principal payments on the Company’s long-term debt are due as follows (in thousands):
|
2019
|
$
|
3,127
|
|
|
2020
|
2,923
|
|
|
|
2021
|
3,035
|
|
|
|
2022
|
54,041
|
|
|
|
2023
|
2,967
|
|
|
|
Thereafter
|
14,158
|
|
|
|
$
|
80,251
|
|
|
13. Derivative Instruments and Hedging Activities
Derivative financial instruments consist of the following at October 31 (in thousands):
|
|
Notional Amount
|
Fair Value Liability
|
|||||||||||||
|
|
2018
|
2017
|
2018
|
2017
|
|||||||||||
|
Pay fixed-rate, receive floating-rate forward interest rate swap, beginning July 2013 until June 2018
|
$
|
—
|
|
$
|
40,000
|
|
$
|
—
|
|
$
|
268
|
|
|||
In November 2011, the Company entered into a forward interest rate swap agreement with Rabobank International, Utrecht to fix the interest rate at
4.30%
on
$40,000,000
of its outstanding borrowings under the Rabobank line of credit beginning July 2013 until June 2018. In connection with the paydown of the Rabobank debt noted above, on June 20, 2017 the Company entered into a novation agreement with Rabobank International, Utrecht and CoBank, ACB (“CoBank”). The agreement provided for the prior interest rate swap agreement with Rabobank to be in place with CoBank.
This interest rate swap qualified as a cash flow hedge and the fair value liability was included in fair value of derivative instrument and related accumulated other comprehensive income at October 31, 2017. The interest rate swap expired June 30, 2018.
14. Earnings Per Share
Basic net income per common share is calculated using the weighted-average number of common shares outstanding during the period without consideration of the dilutive effect of conversion of preferred stock. Diluted net income per common share is calculated using the weighted-average number of common shares outstanding during the period plus the dilutive effect of conversion of unvested, restricted stock and preferred stock. The Series B and Series B-2 convertible preferred shares were dilutive for fiscal year ended October 31, 2018 and anti-dilutive for fiscal years ended October 31,
2017
and
2016
. The computations for basic and diluted net income per common share are as follows (in thousands, except per share amounts):
92
LIMONEIRA COMPANY
NOTES TO CONSOLIDATED FINANCIAL STATEMENTS (CONTINUED)
14. Earnings Per Share (continued)
|
|
Year ended October 31,
|
||||||||||
|
|
2018
|
2017
|
2016
|
||||||||
|
Basic net income per common share:
|
|
|
|
|
|
|
|||||
|
Net income applicable to common stock
|
$
|
19,687
|
|
$
|
6,035
|
|
$
|
7,430
|
|
||
|
Effect of unvested, restricted stock
|
(34
|
)
|
—
|
|
—
|
|
|||||
|
Numerator: Net income for basic EPS
|
19,653
|
|
6,035
|
|
7,430
|
|
|||||
|
Denominator: Weighted average common shares-basic
|
15,581
|
|
14,315
|
|
14,168
|
|
|||||
|
Basic net income per common share
|
$
|
1.26
|
|
$
|
0.42
|
|
$
|
0.52
|
|
||
|
Diluted net income per common share:
|
|
|
|
|
|
|
|||||
|
Numerator: Net income for diluted EPS
|
$
|
20,188
|
|
$
|
6,595
|
|
$
|
8,058
|
|
||
|
Denominator: Weighted average common shares-basic
|
15,581
|
|
14,315
|
|
14,168
|
|
|||||
|
Effect of dilutive unvested, restricted stock and preferred stock
|
628
|
|
—
|
|
—
|
|
|||||
|
Weighted average common shares-diluted
|
16,209
|
|
14,315
|
|
14,168
|
|
|||||
|
Diluted net income per common share
|
$
|
1.25
|
|
$
|
0.42
|
|
$
|
0.52
|
|
||
Diluted earnings per common share are computed using the more dilutive method of either the two-class method or the treasury method. Unvested stock-based compensation awards that contain non-forfeitable rights to dividends as participating shares are included in computing earnings per share. The Company’s unvested, restricted stock awards qualify as participating shares. The Company excluded
70,000
, unvested, restricted shares, as calculated under the treasury stock method, from its computation of diluted earnings per common share for the fiscal year ended October 31, 2018. Diluted earnings per common share were calculated under the two-class method for fiscal years ended October 31, 2017 and 2016.
15. Related-Party Transactions
The Company rents certain of its residential housing assets to employees on a month-to-month basis. The Company recorded
$706,000
,
$724,000
and
$749,000
of rental income from employees in fiscal years
2018
,
2017
and
2016
, respectively. There were no rental payments due from employees at
October 31, 2018
and
2017
.
The Company has representation on the boards of directors of the mutual water companies in which the Company has investments. The Company recorded capital contributions and purchased water and water delivery services from such mutual water companies, in aggregate, of
$1,445,000
,
$1,230,000
and
$1,287,000
in fiscal years
2018
,
2017
and
2016
, respectively. Capital contributions are included in other assets in the Company’s consolidated balance sheets and purchased water and water delivery services are included in agribusiness expense in the Company’s consolidated statements of operations. Water payments due to the mutual water companies were, in aggregate,
$142,000
and
$141,000
at
October 31, 2018
and
2017
, respectively.
The Company has representation on the board of directors of a non-profit cooperative association that provides pest control services for the agricultural industry. The Company purchased services and supplies of
$1,869,000
,
$1,843,000
and
$1,659,000
from the association in fiscal years
2018
,
2017
and
2016
, respectively. Such amounts are included in agribusiness expense in the Company’s consolidated statements of operations. Payments due to the cooperative were
$142,000
and
$180,000
at
October 31, 2018
and
2017
, respectively.
The Company has an investment in and representation on the board of directors of Calavo and Calavo has an investment in and representation on the board of directors of the Company. The Company recorded dividend income of
$285,000
,
$270,000
and
$288,000
in fiscal years
2018
,
2017
and
2016
, respectively, on its investment in Calavo, which is included in other income, net, in the Company’s consolidated statements of operations. The Company paid
$432,000
,
$380,000
and
$346,000
of dividends to Calavo in fiscal years
2018
,
2017
and
2016
, respectively. The Company had
$6,576,000
,
$9,522,000
and
$10,767,000
of avocado sales to Calavo in fiscal years
2018
,
2017
and
2016
, respectively. Such amounts are included in agribusiness revenues in the Company’s consolidated statements of operations.
93
LIMONEIRA COMPANY
NOTES TO CONSOLIDATED FINANCIAL STATEMENTS (CONTINUED)
15. Related-Party Transactions (continued)
The Company leases office space to Calavo and received rental income of
$293,000
,
$287,000
, and
$279,000
in fiscal years
2018
,
2017
and
2016
, respectively. Such amounts are included in rental revenues in the Company’s consolidated statements of operations. No amounts were due to the Company from Calavo at
October 31, 2018
or
2017
. The Company purchased
$367,000
,
$276,000
and
$517,000
of storage services, packed avocados and lemons to sell from Calavo in fiscal years
2018
,
2017
and
2016
, respectively. Amounts due to Calavo at
October 31, 2018
and
2017
were
$3,000
and
$163,000
, respectively.
Certain members of the Company’s board of directors market lemons through the Company. During fiscal years
2018
,
2017
and
2016
the aggregate amount of lemons procured from entities owned or controlled by members of the board of directors was
$2,279,000
,
$2,441,000
and
$2,246,000
, respectively, which is included in agribusiness expense in the Company’s consolidated statements of operations. Payments due to these Board members were
$487,000
and
$636,000
at
October 31, 2018
and
2017
, respectively. Additionally, the Company leases approximately
31
acres of orchards from entities affiliated with a member on the board of directors and incurred
$96,000
,
$23,000
and
$135,000
of lease expense related to these leases in fiscal years
2018
,
2017
and
2016
, respectively.
On July 1, 2013, the Company and Cadiz Real Estate, LLC (“Cadiz”), a wholly owned subsidiary of Cadiz, Inc., entered into a long-term lease agreement (the “Lease”) for a minimum of
320
acres, with options to lease up to an additional
960
acres, located within
9,600
zoned agricultural acres owned by Cadiz in eastern San Bernardino County, California. The initial term of the Lease runs for
20 years
and the annual base rental will be equal to the sum of
$200
per planted acre and
20%
of gross revenues from the sale of harvested lemons (less operating expenses) not to exceed
$1,200
per acre per year. During fiscal years
2018
,
2017
and
2016
' respectively,
$129,000
,
$123,000
and
$92,000
of lease expense was incurred in connection with this lease. A member of the Company’s Board of Directors serves as the CEO, President and a member of the board of directors of Cadiz, Inc. Additionally, this board member is an attorney with a law firm that provided services of
$55,000
,
$90,000
and
$30,000
to the Company during the years ended
October 31, 2018
,
2017
and
2016
, respectively. Payments due to the law firm were
$67,000
and
$62,000
at
October 31, 2018
and
2017
, respectively. The Company incurred lease and farming expenses of
$178,000
,
$144,000
and
$120,000
during fiscal years
2018
,
2017
and
2016
, respectively, which are recorded in agribusiness expense in the Company’s consolidated statements of operations.
On February 5, 2015, the Company entered into a Modification of Lease Agreement (the “Amendment”) with Cadiz. The Amendment, among other things, increased by
200
acres the amount of property leased by the Company under the lease agreement dated July 1, 2013. In connection with the Amendment, the Company paid a total of
$1,212,000
to acquire existing lemon trees and irrigations systems from Cadiz and a Cadiz tenant. In February 2016, Cadiz assigned this lease to Fenner Valley Farms, LLC (“Fenner”), a subsidiary of Water Asset Management, LLC (“WAM”). An entity affiliated with WAM is the holder of
9,300
shares of Limoneira Company Series B-2 convertible preferred stock. Amounts due to Fenner were
$100,000
and
$61,000
at
October 31, 2018
and
October 31, 2017
, respectively.
The Company has representation on the board of directors of Colorado River Growers, Inc. (“CRG”), a non-profit cooperative association of fruit growers engaged in the agricultural harvesting business in Yuma County, Arizona. The Company paid harvest expense to CRG of
$3,707,000
,
$3,959,000
and
$4,492,000
for the years ended
October 31, 2018
,
2017
, and
2016
, respectively. Such amounts are included in agribusiness expense in the Company’s consolidated statements of operations. Additionally, Associated provided harvest management and administrative services to CRG in the amount of
$374,000
,
$476,000
, and
$282,000
during the years ended
October 31, 2018
,
2017
, and
2016
, respectively. Such amounts are included in agribusiness revenues in the Company’s consolidated statement of operations. There was
$232,000
and
$209,000
due to Associated from CRG at
October 31, 2018
and
October 31, 2017
, respectively, which is included in accounts receivable in the Company’s consolidated balance sheets.
The Company has representation on the board of directors of Yuma Mesa Irrigation and Drainage District (“YMIDD”). In December 2013, Associated entered into an agreement, as amended in December 2014 and 2015, with YMIDD to participate in a Pilot Fallowing Program in which Associated agreed to forego its water allocation for approximately
300
acres of land in exchange for
$750
per acre through December 31, 2016. In relation to this program the Company recorded revenues of
zero
,
$34,000
and
$201,000
during the years ended
October 31, 2018
,
2017
and
2016
, respectively. These amounts are included in other income, net in the Company’s consolidated statements of operations. Additionally, the Company purchased water in the amount of
$213,000
,
$76,000
and
$132,000
during fiscal years
2018
,
2017
and
2016
, respectively. Such amounts are included in agribusiness expenses in the Company’s consolidated statements of operations. Amounts payable to YMIDD at
October 31, 2018
and
October 31, 2017
were
zero
and
$10,000
, respectively.
94
LIMONEIRA COMPANY
NOTES TO CONSOLIDATED FINANCIAL STATEMENTS (CONTINUED)
15. Related-Party Transactions (continued)
The Company has a
1.3%
interest in Del Mar as a general partner and a
26.8%
interest as a limited partner. The Company provides Del Mar with farm management, orchard land development and accounting services and received expense reimbursements of
$163,000
,
$146,000
and
$146,000
during fiscal years 2018, 2017 and 2016, respectively. The Company procures lemons from Del Mar and fruit proceeds due to Del Mar were
$709,000
and
$912,000
at October 31, 2018 and October 31, 2017, respectively and are included in grower’s payable in the Company’s consolidated balance sheets. The Company received distributions of
$526,000
,
$439,000
and
$586,000
and recorded equity in earnings of this investment of
$493,000
,
$446,000
and
$603,000
during fiscal years 2018, 2017 and 2016, respectively.
On August 14, 2014, the Company’s wholly owned subsidiary, Limoneira Chile SpA, invested approximately
$1,750,000
for a
35%
interest in Rosales, a citrus packing, marketing and sales business located in La Serena, Chile. The Company purchased an additional
12%
interest in Rosales with the February 2017 acquisition of PDA. The Company recognized
$1,009,000
,
$1,038,000
and
$266,000
of lemon sales to Rosales in fiscal years
2018
,
2017
and
2016
, respectively. Additionally, San Pablo recognized
$552,000
of lemon and orange sales to Rosales from the Acquisition Date to October 31, 2018. PDA recognized
$2,288,000
of lemon and orange sales to Rosales in fiscal year 2018. PDA recognized
$1,059,000
of lemon and orange sales to Rosales from the Acquisition Date to the period ended October 31, 2017. Such amounts are recorded in agribusiness revenues in the Company’s consolidated statements of operations. In fiscal years
2018
,
2017
and
2016
, the aggregate amount of lemons and oranges procured from Rosales was
$7,658,000
,
$4,283,000
and
$2,205,000
, respectively. Amounts (payable to) due from Rosales were
$(65,000)
and
$101,000
at
October 31, 2018
and
2017
, respectively. The Company recorded equity in earnings (losses) of this investment of
$584,000
,
$(9,000)
and
$248,000
in fiscal years
2018
,
2017
and
2016
, respectively, and amortization of fair value basis differences of
$337,000
,
$290,000
and
$208,000
in fiscal years
2018
,
2017
and
2016
, respectively. The Company received cash distributions from this equity investment of
zero
,
$273,000
and
$56,000
in fiscal years
2018
,
2017
and
2016
, respectively.
16. Income Taxes
A reconciliation of income before income taxes for domestic and foreign locations for the years ended
October 31, 2018
,
2017
and
2016
are as follows (in thousands):
|
|
2018
|
2017
|
2016
|
||||||||
|
United States
|
$
|
13,099
|
|
$
|
11,386
|
|
$
|
13,285
|
|
||
|
Foreign
|
384
|
|
(760
|
)
|
40
|
|
|||||
|
Income before income taxes
|
$
|
13,483
|
|
$
|
10,626
|
|
$
|
13,325
|
|
||
The components of the provisions for income taxes for fiscal years
2018
,
2017
and
2016
are as follows (in thousands):
|
|
2018
|
2017
|
2016
|
||||||||
|
Current:
|
|
|
|
|
|
|
|||||
|
Federal
|
$
|
35
|
|
$
|
(1,217
|
)
|
$
|
1,736
|
|
||
|
State
|
(444
|
)
|
(527
|
)
|
(749
|
)
|
|||||
|
Foreign
|
(169
|
)
|
(41
|
)
|
(59
|
)
|
|||||
|
Total current (provision) benefit
|
(578
|
)
|
(1,785
|
)
|
928
|
|
|||||
|
Deferred:
|
|||||||||||
|
Federal
|
7,393
|
|
(2,282
|
)
|
(5,942
|
)
|
|||||
|
State
|
(212
|
)
|
(238
|
)
|
(253
|
)
|
|||||
|
Foreign
|
126
|
|
228
|
|
—
|
|
|||||
|
Total deferred benefit (provision)
|
7,307
|
|
(2,292
|
)
|
(6,195
|
)
|
|||||
|
Total benefit (provision)
|
$
|
6,729
|
|
$
|
(4,077
|
)
|
$
|
(5,267
|
)
|
||
95
LIMONEIRA COMPANY
NOTES TO CONSOLIDATED FINANCIAL STATEMENTS (CONTINUED)
16. Income Taxes (continued)
The income tax provision differs from the amount which would result from the statutory federal income tax rate primarily as a result of remeasuring deferred tax assets and liabilities, the dividend exclusion and state income taxes.
Deferred income taxes reflect the net of temporary differences between the carrying amount of the assets and liabilities for financial reporting and income tax purposes. The components of deferred income tax assets (liabilities) at
October 31, 2018
and
2017
are as follows (in thousands):
|
|
2018
|
2017
|
|||||
|
Deferred income tax assets:
|
|
|
|
|
|||
|
Labor accruals
|
$
|
194
|
|
$
|
286
|
|
|
|
State income taxes
|
97
|
|
191
|
|
|||
|
Net operating losses
|
706
|
|
—
|
|
|||
|
Prepaid insurance and other
|
457
|
|
442
|
|
|||
|
Impairments of real estate development assets
|
1,557
|
|
3,186
|
|
|||
|
Derivative instruments
|
—
|
|
105
|
|
|||
|
Minimum pension liability adjustment
|
644
|
|
1,512
|
|
|||
|
Amortization
|
203
|
|
360
|
|
|||
|
Total deferred income tax assets
|
3,858
|
|
6,082
|
|
|||
|
Deferred income tax liabilities:
|
|||||||
|
Property taxes
|
(165
|
)
|
(234
|
)
|
|||
|
Depreciation
|
(13,230
|
)
|
(15,114
|
)
|
|||
|
Book and tax basis difference of acquired assets
|
(9,886
|
)
|
(14,444
|
)
|
|||
|
Unrealized net gain on Calavo investment
|
(5,830
|
)
|
(7,490
|
)
|
|||
|
Other
|
(119
|
)
|
(215
|
)
|
|||
|
Total deferred income tax liabilities
|
(29,230
|
)
|
(37,497
|
)
|
|||
|
Net deferred income tax liabilities
|
$
|
(25,372
|
)
|
$
|
(31,415
|
)
|
|
At
October 31, 2018
, the Company had federal net operating loss carry-forwards of approximately
$3.1 million
. The federal net operating loss is carried forward indefinitely.
The income tax provision differs from that computed using the federal statutory rate applied to income before taxes as follows for fiscal years
2018
,
2017
and
2016
($ in thousands):
|
|
2018
|
2017
|
2016
|
|||||||||||||||||
|
|
Amount
|
%
|
Amount
|
%
|
Amount
|
%
|
||||||||||||||
|
Provision at statutory rates
|
$
|
(3,125
|
)
|
(23.3
|
)%
|
$
|
(3,613
|
)
|
(34.0
|
)%
|
$
|
(4,530
|
)
|
(34.0
|
)%
|
|||||
|
State income tax, net of federal benefit
|
(768
|
)
|
(5.7
|
)%
|
(580
|
)
|
(5.5
|
)%
|
(733
|
)
|
(5.5
|
)%
|
||||||||
|
Dividend exclusion
|
49
|
|
0.4
|
%
|
67
|
|
0.6
|
%
|
72
|
|
0.5
|
%
|
||||||||
|
Production deduction
|
—
|
|
—
|
|
148
|
|
1.4
|
%
|
50
|
|
0.4
|
%
|
||||||||
|
Tax law change
|
10,295
|
|
76.4
|
%
|
—
|
|
—
|
|
—
|
|
—
|
|
||||||||
|
Other permanent items
|
278
|
|
2.1
|
%
|
(99
|
)
|
(0.9
|
)%
|
(126
|
)
|
(0.9
|
)%
|
||||||||
|
Total income tax benefit (provision)
|
$
|
6,729
|
|
49.9
|
%
|
$
|
(4,077
|
)
|
(38.4
|
)%
|
$
|
(5,267
|
)
|
(39.5
|
)%
|
|||||
At
October 31, 2018
and
2017
, the Company had no unrecognized tax benefits. The Company reports accrued interest and penalties related to unrecognized tax benefits in income tax expense.
96
LIMONEIRA COMPANY
NOTES TO CONSOLIDATED FINANCIAL STATEMENTS (CONTINUED)
16. Income Taxes (continued)
The Company files income tax returns in the U.S., California, Arizona and Chile. The Company is no longer subject to significant U.S., state and Chilean income tax examinations for years prior to the statutory periods of three years for federal, four years for state and three years for Chilean tax jurisdictions. The Company recognizes interest expense and penalties related to income tax matters as a component of income tax expense. There was no accrued interest or penalties associated with uncertain tax positions as of
October 31, 2018
.
The Tax Cuts and Jobs Act ("the Tax Act") was enacted on December 22, 2017. The Tax Act includes a number of changes to existing tax laws that impact the Company, most notably it reduces the U.S. federal corporate tax rate from 34% to 21%, requires companies to pay a one-time transition tax on earnings of certain foreign subsidiaries that were previously tax deferred, and accelerates depreciation for certain assets acquired and placed in service after September 27, 2017. The Tax Act also includes prospective changes beginning in 2018, including additional limitations on executive compensation, limitations on the deductibility of interest, and capitalization of research and development expenditures. The Tax Act includes two new U.S. tax base erosion provisions, the global intangible low-taxed income (“GILTI”) provisions and the base-erosion and anti-abuse tax (“BEAT”) provisions. In addition, the Tax Act includes a provision which provides a benefit for foreign derived intangible income (“FDII”). The Tax Act is generally effective January 1, 2018. As a fiscal year U.S. taxpayer, the majority of the provisions will apply to the Company’s 2019 fiscal year. As of October 31, 2018, the Company has made a reasonable estimate of the effects of the Tax Act on its existing deferred tax balances.
In conjunction with the tax law changes, the SEC staff issued Staff Accounting Bulletin No. 118 ("SAB 118") to address the application of U.S. GAAP in situations when a registrant does not have the necessary information available, prepared, or analyzed (including computations) in reasonable detail to complete the accounting for certain income tax effects of the Tax Act. The ultimate impact may differ from these provisional amounts due to, among other things, additional analysis, changes in interpretations and assumptions made, additional regulatory guidance that may be issued, and actions the Company may take as a result of the Tax Act.
Deferred tax assets and liabilities: The Company remeasured certain deferred tax assets and liabilities based on the rates at which they are expected to reverse in the future, which is generally 21%. However, the Company is still analyzing certain aspects of the Tax Act and refining its calculations, which could potentially affect the measurement of these balances or potentially give rise to new deferred tax amounts. The provisional amount recorded related to the remeasurement of the Company's deferred tax balance was
$10,295,000
and is included as a component of income tax expense from continuing operations.
Foreign tax effects: The one-time transition tax is based on the total post-1986 earnings and profits (E&P) previously deferred from U.S. income taxes. In aggregate, the Company has a cumulative deficit in post-1986 E&P from its specified foreign corporations. Accordingly, no provisional amount was recorded as of October 31, 2018.
17. Retirement Plans
The Limoneira Company Retirement Plan (the “Plan”) is a noncontributory, defined benefit, single employer pension plan, which provides retirement benefits for all eligible employees. Benefits paid by the Plan are calculated based on years of service, highest five-year average earnings, primary Social Security benefit and retirement age. Effective June 2004, the Company froze the Plan and no additional benefits accrued to participants subsequent to that date. The Plan is administered by Wells Fargo Bank and Mercer Human Resource Consulting.
The Plan is funded consistent with the funding requirements of federal law and regulations. There were funding contributions of
$600,000
and
$725,000
for fiscal years
2018
and
2017
, respectively. Plan assets are invested in a group trust consisting primarily of pooled funds, mutual funds, short-term investment funds and cash.
The investment policy and strategy has been established to provide a total investment return that will, over time, maintain purchasing power parity for the Plan’s variable benefits and keep the Plan funding at a reasonable level. The long-term target asset allocation ranges are as follows: Domestic Equity
35%
-
40%
; International Equity
10%
-
15%
and Fixed Income
50%
.
97
LIMONEIRA COMPANY
NOTES TO CONSOLIDATED FINANCIAL STATEMENTS (CONTINUED)
17. Retirement Plans (continued)
The following tables set forth the Plan’s net periodic cost, changes in benefit obligation and Plan assets, funded status, amounts recognized in the Company’s consolidated balance sheets, additional year-end information and assumptions used in determining the benefit obligations and net periodic benefit cost.
The components of net periodic benefit cost for the Plan for fiscal years
2018
and
2017
were as follows (in thousands):
|
|
2018
|
2017
|
|||||
|
Administrative expenses
|
$
|
254
|
|
$
|
306
|
|
|
|
Interest cost
|
770
|
|
775
|
|
|||
|
Expected return on plan assets
|
(1,071
|
)
|
(1,053
|
)
|
|||
|
Prior service cost
|
45
|
|
45
|
|
|||
|
Amortization of net loss
|
700
|
|
833
|
|
|||
|
Net periodic benefit cost
|
$
|
698
|
|
$
|
906
|
|
|
Following is a summary of the Plan’s funded status as of
October 31,
(in thousands):
|
|
2018
|
2017
|
|||||
|
Change in benefit obligation:
|
|
|
|
|
|||
|
Benefit obligation at beginning of year
|
$
|
22,268
|
|
$
|
22,439
|
|
|
|
Administrative expenses
|
254
|
|
306
|
|
|||
|
Interest cost
|
770
|
|
775
|
|
|||
|
Benefits paid
|
(1,555
|
)
|
(1,425
|
)
|
|||
|
Actuarial (gain) loss
|
(2,096
|
)
|
173
|
|
|||
|
Benefit obligation at end of year
|
$
|
19,641
|
|
$
|
22,268
|
|
|
|
Change in plan assets:
|
|||||||
|
Fair value of plan assets at beginning of year
|
$
|
18,410
|
|
$
|
16,820
|
|
|
|
Actual return on plan assets
|
(218
|
)
|
2,290
|
|
|||
|
Employer contributions
|
600
|
|
725
|
|
|||
|
Benefits paid
|
(1,555
|
)
|
(1,425
|
)
|
|||
|
Fair value of plan assets at end of year
|
$
|
17,237
|
|
$
|
18,410
|
|
|
|
Reconciliation of funded status:
|
|||||||
|
Fair value of plan assets
|
$
|
17,237
|
|
$
|
18,410
|
|
|
|
Benefit obligations
|
19,641
|
|
22,268
|
|
|||
|
Net plan obligations
|
$
|
(2,404
|
)
|
$
|
(3,858
|
)
|
|
|
Amounts recognized in statements of financial position:
|
|||||||
|
Noncurrent assets
|
$
|
—
|
|
$
|
—
|
|
|
|
Current liabilities
|
—
|
|
—
|
|
|||
|
Noncurrent liabilities
|
(2,404
|
)
|
(3,858
|
)
|
|||
|
Net obligation recognized in statements of financial position
|
$
|
(2,404
|
)
|
$
|
(3,858
|
)
|
|
|
Reconciliation of amounts recognized in statements of financial position:
|
|||||||
|
Prior service cost
|
$
|
(233
|
)
|
$
|
(277
|
)
|
|
|
Net loss
|
(5,418
|
)
|
(6,926
|
)
|
|||
|
Accumulated other comprehensive loss
|
(5,651
|
)
|
(7,203
|
)
|
|||
|
Accumulated contributions in excess of net periodic benefit cost
|
3,247
|
|
3,345
|
|
|||
|
Net deficit recognized in statements of financial position
|
$
|
(2,404
|
)
|
$
|
(3,858
|
)
|
|
98
LIMONEIRA COMPANY
NOTES TO CONSOLIDATED FINANCIAL STATEMENTS (CONTINUED)
17. Retirement Plans (continued)
Presented below are changes in accumulated other comprehensive income, before tax, in the Plan as of
October 31,
(in thousands):
|
|
2018
|
2017
|
|||||
|
Changes recognized in other comprehensive income:
|
|
|
|
|
|||
|
Net gain arising during the year
|
$
|
(807
|
)
|
$
|
(1,064
|
)
|
|
|
Amortization of prior service cost
|
(45
|
)
|
(45
|
)
|
|||
|
Amortization of net loss
|
(700
|
)
|
(833
|
)
|
|||
|
Total recognized in other comprehensive income
|
$
|
(1,552
|
)
|
$
|
(1,942
|
)
|
|
|
Total recognized in net periodic benefit and other comprehensive income
|
$
|
(854
|
)
|
$
|
(1,036
|
)
|
|
Presented below is the
October 31,
year-ended estimated amount that will be amortized from accumulated other comprehensive income over the next fiscal year (in thousands):
|
|
2018
|
||
|
Initial net asset (obligation)
|
$
|
—
|
|
|
Prior service cost
|
(45
|
)
|
|
|
Net loss
|
(402
|
)
|
|
|
Total
|
$
|
(447
|
)
|
The following assumptions, as of
October 31,
were used in determining benefit obligations and net periodic benefit cost ($ in thousands):
|
|
2018
|
2017
|
|||||
|
Weighted-average assumptions used to determine benefit obligations:
|
|
|
|
|
|||
|
Discount rate
|
4.40
|
%
|
3.60
|
%
|
|||
|
Assumptions used to determine net periodic benefit cost:
|
|||||||
|
Discount rate
|
3.60
|
%
|
3.60
|
%
|
|||
|
Expected return on plan assets
|
6.21
|
%
|
6.24
|
%
|
|||
|
Additional year-end information:
|
|||||||
|
Projected benefit obligation
|
$
|
19,641
|
|
$
|
22,268
|
|
|
|
Accumulated benefit obligation
|
$
|
19,641
|
|
$
|
22,268
|
|
|
|
Fair value of plan assets
|
$
|
17,237
|
|
$
|
18,410
|
|
|
Benefit payments are expected to be paid during the following fiscal years (in thousands):
|
2019
|
$
|
1,268
|
|
|
2020
|
1,270
|
|
|
|
2021
|
1,283
|
|
|
|
2022
|
1,301
|
|
|
|
2023
|
1,340
|
|
|
|
2024-2027
|
6,719
|
|
|
|
|
$
|
13,181
|
|
99
LIMONEIRA COMPANY
NOTES TO CONSOLIDATED FINANCIAL STATEMENTS (CONTINUED)
17. Retirement Plans (continued)
The following table sets forth the Plan’s assets as of
October 31, 2018
, segregated by level using the hierarchy established by FASB ASC 820, Fair Value Measurements and Disclosures (in thousands):
|
|
Level 1
|
Level 2
|
Level 3
|
Total
|
|||||||||||
|
Cash and cash equivalents
|
$
|
187
|
|
$
|
—
|
|
$
|
—
|
|
$
|
187
|
|
|||
|
Mutual funds
|
1,245
|
|
—
|
|
—
|
|
1,245
|
|
|||||||
|
Pooled funds
|
—
|
|
15,805
|
|
—
|
|
15,805
|
|
|||||||
|
|
$
|
1,432
|
|
$
|
15,805
|
|
$
|
—
|
|
$
|
17,237
|
|
|||
The Company has a 401(k) plan in which it contributes an amount equal to
4%
of an eligible employee’s annual earnings beginning after one year of employment. Employees may elect to defer up to
100%
of their annual earnings subject to Internal Revenue Code limits. The Company makes an additional matching contribution on these deferrals up to
4%
of the employee’s annual earnings. Employees are 100% vested in the Company’s contribution after six years of employment. Participants vest in any matching contribution at a rate of
20%
per year beginning after one year of employment. During fiscal years
2018
,
2017
and
2016
, the Company contributed to the plan and recognized expenses of
$823,000
,
$774,000
and
$823,000
, respectively.
18. Other Long-Term Liabilities
Other long-term liabilities consist of the following at
October 31,
(in thousands):
|
|
2018
|
2017
|
|||||
|
Minimum pension liability
|
$
|
2,404
|
|
$
|
3,858
|
|
|
|
Loan guarantee
|
1,080
|
|
—
|
|
|||
|
Deferred gain and other
|
163
|
|
62
|
|
|||
|
|
$
|
3,647
|
|
$
|
3,920
|
|
|
19. Operating Lease Income
The Company rents certain of its assets under net operating lease agreements ranging from
one
month to
20 years
. The cost of land subject to agricultural land leases was
$1,275,000
at
October 31, 2018
. The total cost and accumulated depreciation of buildings, equipment and building improvements subject to leases was
$22,474,000
and
$7,559,000
, respectively, at
October 31, 2018
. The Company’s rental operations revenue includes contingent rental revenue of
$324,000
,
$251,000
and
$195,000
for fiscal years
2018
,
2017
and
2016
, respectively.
The future minimum lease payments to be received by the Company related to these net operating lease agreements as of
October 31, 2018
, are as follows (in thousands):
|
2019
|
$
|
1,138
|
|
|
2020
|
453
|
|
|
|
2021
|
313
|
|
|
|
2022
|
323
|
|
|
|
2023
|
278
|
|
|
|
Thereafter
|
569
|
|
|
|
|
$
|
3,074
|
|
20. Commitments and Contingencies
Operating Leases
The Company has operating leases for agricultural land, packinghouse equipment, and photovoltaic generators. Total lease expense for fiscal years
2018
,
2017
and
2016
was
$2,028,000
,
$1,878,000
and
$2,049,000
, respectively, which is included in agribusiness costs and expenses in the Company’s consolidated statements of operations.
100
LIMONEIRA COMPANY
NOTES TO CONSOLIDATED FINANCIAL STATEMENTS (CONTINUED)
20. Commitments and Contingencies (continued)
Operating Leases (continued)
During fiscal year 2008, the Company entered into a contract with Perpetual Power, LLC (“Perpetual”) to install a
1,000
KW photovoltaic generator in order to provide electrical power for the Company’s lemon packinghouse operations. The facility became operational in October 2008. Farm Credit West provided financing for the generator and upon completion of the construction Perpetual sold the generator to Farm Credit West. The Company then signed a
10
-year operating lease agreement with Farm Credit West. In October 2018, the Company purchased the generator from Farm Credit West for
$1,125,000
.
Additionally, in fiscal year 2008, the Company entered into a contract with Perpetual to install a second
1,000
KW photovoltaic generator in order to provide electrical power for the Company’s farming operations in Ducor, California. Farm Credit West provided the financing for the generator and when construction was completed, Perpetual sold the generator to Farm Credit West. The Company then signed a
10
-year operating lease agreement with Farm Credit West for this facility. In December 2018, the Company purchased the generator from Farm Credit West for
$1,275,000
. The generator in Ducor, California became operational in December 2008. Included in prepaid expenses and other current assets in the Company’s consolidated balance sheets is
$17,000
and
$220,000
at
October 31, 2018
and
2017
, respectively of deferred rent assets related to the Company’s Ducor solar lease as the minimum lease payments exceed the straight-line rent expense during the earlier terms of the lease.
In January 2012, the Company entered into a series of operating leases for approximately
1,000
acres of lemon, orange, specialty citrus and other crop orchards in Lindsay, California. Each of the leases is for
ten
-year terms and provides for
four
5
-year renewal options with an aggregate base rent of approximately
$500
per acre. The leases also contain profit share arrangements with the landowners as additional rent on each of the properties and a provision for the potential purchase of the properties by the Company in the future. The Company purchased substantially all of the leased acreage in September and December 2015. The Company incurred lease expense of
$201,000
,
$152,000
and
$202,000
in fiscal years
2018
,
2017
and
2016
.
On July 1, 2013, the Company and Cadiz, entered into a long-term lease agreement for a minimum of
320
acres, with an option to lease up to an additional
960
acres, located within
9,600
zoned agricultural acres owned by Cadiz in eastern San Bernardino County, California. The initial term of the lease runs for
20 years
and the annual base rental will be equal to the sum of
$200
per planted acre and
20%
of gross revenues from the sale of harvested lemons (less operating expenses) and will not exceed
$1,200
per acre per year.
On February 5, 2015, the Company entered into a Modification of Lease Agreement (the “Amendment”) with Cadiz. The Amendment, among other things, increased by
200
acres the amount of property leased by the Company under the lease agreement dated July 1, 2013. In connection with the Amendment, the Company paid a total of
$1,212,000
to acquire existing lemon trees and irrigations systems from Cadiz and a Cadiz tenant. In February 2016, Cadiz assigned this lease to Fenner Valley Farms, LLC (“Fenner”), a subsidiary of Water Asset Management, LLC (“WAM”). An entity affiliated with WAM is the holder of
9,300
shares of Limoneira Company Series B-2 convertible preferred stock. The Company incurred lease expenses of
$129,000
,
$123,000
and
$92,000
in fiscal years
2018
,
2017
and
2016
. Payments due to Fenner were
$100,000
and
$61,000
at
October 31, 2018
and
2017
, respectively.
Minimum future lease payments are as follows (in thousands):
|
2019
|
$
|
522
|
|
|
2020
|
495
|
|
|
|
2021
|
496
|
|
|
|
2022
|
438
|
|
|
|
2023
|
156
|
|
|
|
Thereafter
|
2,092
|
|
|
|
|
$
|
4,199
|
|
Letters of Credit
The Company utilizes standby letters of credit to satisfy workers’ compensation insurance security deposit requirements. At
October 31, 2018
, there was
one
outstanding letter of credit for
$85,000
.
101
LIMONEIRA COMPANY
NOTES TO CONSOLIDATED FINANCIAL STATEMENTS (CONTINUED)
20. Commitments and Contingencies (continued)
Litigation and Legal Proceedings
The Company is from time to time involved in various lawsuits and legal proceedings that arise in the ordinary course of business. At this time, the Company is not aware of any pending or threatened litigation against it that it expects will have a material adverse effect on its business, financial condition, liquidity, or operating results. Legal claims are inherently uncertain, however, and it is possible that the Company’s business, financial condition, liquidity and/or operating results could be adversely affected in the future by legal proceedings.
21. Series B and Series B-2 Preferred Stock
Series B Convertible Preferred Stock
In 1997, in connection with the acquisition of Ronald Michaelis Ranches, Inc., the Company issued
30,000
shares of Series B Convertible Preferred Stock at
$100.00
par value (the “Series B Stock”).
Dividends: The holders of shares of Series B Stock are entitled to receive cumulative cash dividends at an annual rate of
8.75%
of par value. Such dividends are payable quarterly on the first day of January, April, July and October in each year commencing July 1, 1997.
Voting Rights: Each holder of Series B Stock is entitled to
ten
votes on all matters submitted to a vote of the stockholders of the Company.
Redemption: The Company, at the option of the Board of Directors, may redeem the Series B Stock, as a whole or in part, at any time or from time to time on or after August 1, 2017 and before July 31, 2027, at a redemption price equal to the par value thereof, plus accrued and unpaid dividends thereon to the date fixed for redemption. Redemption by the Company of a portion of the Series B Stock totaling
14,790
shares is subject to certain conditions agreed upon between the Company and the holders of this portion of the Series B Stock.
Conversion: The holders of Series B Stock have the right, at their option, to convert such shares into shares of Common Stock of the Company at any time prior to redemption. The conversion price is
$8.00
per share of Common Stock. Pursuant to the terms of the Certificate of Designation, Preferences and Rights of the Series B Stock, the conversion price shall be adjusted to reflect any dividends paid in Common Stock of the Company, the subdivision of the Common Stock of the Company into a greater number of shares of Common Stock of the Company or upon the advice of legal counsel.
Put: The holders of Series B Stock may at any time after July 1, 2017 and before June 31, 2027 cause the Company to repurchase such shares at a repurchase price equal to the par value thereof, plus accrued and unpaid dividends thereon to the date fixed for repurchase. The put features of a portion of the Series B Stock totaling
14,790
shares are subject to certain conditions agreed upon between the Company and the holders of this portion of the Series B Stock.
Because the Series B Stock may be redeemed by holders of the shares at their discretion beginning July 1, 2017, the redemption is outside of the control the Company and accordingly, the Series B Stock has been classified as temporary equity.
In fiscal year 2017, a total of
14,210
shares of Series B preferred stock were converted into
177,624
shares of common stock. In fiscal year 2016,
500
shares of Series B preferred stock were converted into
6,250
shares of common stock. In fiscal year 2015,
500
shares of Series B preferred stock were converted into
6,250
shares of common stock.
Series B-2 Convertible Preferred Stock
During March and April of 2014, pursuant to a Series B-2 Stock Purchase Agreement dated March 21, 2014, the Company issued an aggregate of
9,300
shares of Series B-2,
4%
voting preferred stock with a par value of
$100.00
per share (“Series B-2 Preferred Stock”) to WPI-ACP Holdings, LLC (“WPI”), an entity affiliated with Water Asset Management, LLC (“WAM”) for total proceeds of
$9,300,000
. The transactions were exempt from the registration requirements of the Securities Act of 1933, as amended. The Series B-2 Preferred Stock has the following rights, preferences, privileges, and restrictions:
Conversion: Each share of the Series B-2 Preferred Stock is convertible into common stock at a conversion price equal to the greater of (a) the then-market price of the Company’s common stock based upon the closing price of the Company’s common stock on The NASDAQ Stock Market, LLC or on such other principal market on which the Company’s common stock may then be trading and (b)
$15.00
per share of common stock. Shares of the Series B-2 Preferred Stock may be converted into common stock (i) at any time prior to the redemption thereof, or (ii) in the event the Option Agreement (as defined below) is terminated without all of the shares of Series B-2 Preferred Stock having been redeemed, within
30
calendar days following such termination.
102
LIMONEIRA COMPANY
NOTES TO CONSOLIDATED FINANCIAL STATEMENTS (CONTINUED)
21. Series B and Series B-2 Preferred Stock (continued)
Series B-2 Convertible Preferred Stock (continued)
Dividends: The holder of shares of the Series B-2 Preferred Stock is entitled to receive cumulative cash dividends at an annual rate of
4%
of the liquidation value of
$1,000
per share. Such dividends are payable quarterly on the first day of January, April, July and October in each year commencing July 1, 2014.
Liquidation Rights: In the event of any voluntary or involuntary liquidation, dissolution or winding up of the Company, the holder of shares of the Series B-2 Preferred Stock is entitled to be paid out of the assets available for distribution, before any payment is made to the holders of the Company’s common stock or any other series or class of the Company’s shares ranking junior to the Series B-2 Preferred Stock, an amount equal to the liquidation value of
$1,000
per share, plus an amount equal to all accrued and unpaid dividends.
Voting Rights: Each share of Series B-2 Preferred Stock is entitled to
one
vote on all matters submitted to a vote of the Company’s stockholders.
Redemption: The Company may redeem shares of Series B-2 Preferred Stock only (i) from WPI or its designee and (ii) upon, and to the extent of, an election to exercise the option pursuant to the Option Agreement, described below, at a redemption price equal to the liquidation value of
$1,000
per share plus accrued and unpaid dividends.
Because the Series B-2 Preferred Stock may be redeemed by WPI at its discretion with the exercise of the Option Agreement, the redemption is outside of the control the Company and accordingly, the Series B-2 Preferred Stock has been classified as temporary equity.
In connection with the sale of the Series B-2 Preferred Stock, Associated and another affiliate of WAM (“WPI-ACP”), entered into a series of agreements related to the future ownership and disposition of farmland with associated Colorado River water rights and other real estate that is held by Associated in Yuma, Arizona. The agreements allow the parties to explore strategies that will make the highest and best use of those assets, including but not limited to the sale or lease of assets or the expansion of a fallowing and water savings program in which a portion of Associated’s property is currently enrolled.
The net proceeds of any monetization event would be shared equally by the parties. The agreements entered into include a Water Development Agreement and an Option Agreement. Pursuant to the Water Development Agreement, Associated granted WPI-ACP exclusive rights to develop water assets attributable to the real estate owned by Associated for the mutual benefit of Associated and WAM. Pursuant to the Option Agreement, Associated granted WPI-ACP an option to purchase an undivided interest of up to one-half of the real estate owned by Associated in Yuma County, Arizona (the “Property”) and the water rights associated therewith until January 1, 2026. The purchase price for the Property subject to the Option Agreement will be paid via the redemption by the Company of a proportionate percentage of the Series B-2 Preferred Stock. Unless and until a definitive agreement or definitive agreements with respect to Associated’s real estate and water rights is entered into that would cause the cessation of farming operations, Associated expects to continue farming the Property and recognize all results of operations and retain all proceeds from such operations.
22. Stockholders’ Equity
Series A Junior Participating Preferred Stock and Shareholder Rights Agreement
During fiscal year 2007, the Company entered into a shareholder rights agreement with the Bank of New York acting as rights agent. In connection with this agreement, on October 31, 2006, the Company designated
20,000
shares of preferred stock as Series A Junior Participating Preferred Stock at
$0.01
par value (the “Series A Stock”). Additionally, on October 31, 2006, the Company declared a dividend to be distributed on December 20, 2006, to each holder of record of the Company’s common stock the right to purchase one one-hundredth of a share of Series A Stock. If a triggering event occurred, the Board of Directors had the option to allow rights holders to exercise their rights. The shareholder rights agreement, and the rights thereunder, expired by its terms on December 19, 2016.
Stock-based compensation
The Company has a stock-based compensation plan (the “Stock Plan”) that allows for the grant of common stock of the Company to members of management based on achievement of certain annual financial performance and other criteria. The number of shares granted is based on a percentage of the employee’s base salary divided by the stock price on the grant date. Shares granted under the Stock Plan generally vest over a
2
-year period.
103
LIMONEIRA COMPANY
NOTES TO CONSOLIDATED FINANCIAL STATEMENTS (CONTINUED)
22. Stockholders’ Equity (continued)
Stock-based compensation (continued)
In December 2018,
40,094
shares of common stock with a per share value of
$18.74
were granted to management under the Stock Plan for fiscal year 2018 performance, resulting in total compensation expense of approximately
$751,000
, with
$343,000
recognized in the year ended October 31, 2018 and the balance to be recognized over the next
two
years as the shares vest. In December 2017,
41,291
shares of common stock with a per share value of
$22.86
were granted to management under the Stock Plan for fiscal year 2017 performance, resulting in a total compensation expense of approximately
$944,000
, with
$605,000
recognized in the year ended October 31, 2017 and the balance to be recognized over the next
two
years as the shares vest. In December 2016,
44,688
shares of common stock with a per share value of
$19.92
were granted to management under the Stock Plan for fiscal year 2016 performance, resulting in total compensation expense of approximately
$890,000
, with
$544,000
recognized in the year ended October 31, 2016 and the balance to be recognized over the next
two
years as the shares vest.
Stock-based compensation expense is recognized over the performance and vesting periods as summarized below ($ in thousands):
|
Performance
|
Shares
|
Year Ended October 31,
|
|||||||||||||
|
Year
|
Granted
|
2018
|
2017
|
2016
|
|||||||||||
|
2014
|
42,085
|
|
$
|
—
|
|
$
|
—
|
|
$
|
352
|
|
||||
|
2015
|
27,424
|
|
—
|
|
144
|
|
140
|
|
|||||||
|
2016
|
44,688
|
|
98
|
|
256
|
|
544
|
|
|||||||
|
2017
|
41,291
|
|
219
|
|
605
|
|
—
|
|
|||||||
|
2018
|
130,094
|
|
742
|
|
—
|
|
—
|
|
|||||||
|
$
|
1,059
|
|
$
|
1,005
|
|
$
|
1,036
|
|
|||||||
During fiscal years
2018
,
2017
and
2016
, respectively, members of management exchanged
24,252
,
14,773
and
12,433
shares of common stock with fair value of
$570,000
,
$294,000
and
$190,000
, at the date of the exchanges, for the payment of payroll taxes associated with the vesting of shares under the Company’s stock-based compensation programs. Additionally, in fiscal year 2018, the Company repurchased
15,330
shares from a retired member of management for
$86,000
per the terms of a discontinued stock plan.
During fiscal years
2018
,
2017
and
2016
, respectively,
14,033
,
18,956
and
21,905
shares of common stock were issued to the Company’s non-employee directors under the Company’s stock-based compensation plans. The Company recognized
$309,000
,
$323,000
and
$273,000
of stock-based compensation in fiscal years
2018
,
2017
and
2016
, respectively.
In December 2018, the Company granted
90,000
shares of common stock with a per share price of
$19.84
to key executives under the Stock Plan, resulting in a total compensation expense of approximately
$1,786,000
to be recognized equally over the next
three years
as the shares vest. In December 2017, the Company granted
90,000
shares of common stock with a per share price of
$22.19
to key executives under the Stock Plan, resulting in a total compensation expense of approximately
$1,997,000
to be recognized equally over the next
five
years as the shares vest.
A summary of restricted stock activity, related to the Stock Plan, is as follows ($ thousands, except for grant price amounts):
|
Weighted-Average
|
Aggregate
|
||||||||||
|
Number of Shares
|
Grant Price
|
Intrinsic Value
|
|||||||||
|
Outstanding at October 31, 2017
|
57,477
|
|
$
|
18.83
|
|
||||||
|
Vested
|
(62,056
|
)
|
$
|
19.50
|
|
||||||
|
Forfeited
|
—
|
|
$
|
—
|
|
||||||
|
Granted
|
130,861
|
|
$
|
22.40
|
|
||||||
|
Outstanding at October 31, 2018
|
126,282
|
|
$
|
22.04
|
|
$
|
3,113
|
|
|||
104
LIMONEIRA COMPANY
NOTES TO CONSOLIDATED FINANCIAL STATEMENTS (CONTINUED)
22. Stockholders’ Equity (continued)
Dividend
On December 18, 2018, the Company declared a
$0.075
per share dividend which is to be paid on January 15, 2019 in the aggregate amount of
$1,332,000
to common shareholders of record as of December 31, 2018.
23. Public Offering of Common Stock
In June 2018, the Company completed the sale of an aggregate of
3,136,362
shares of our common stock, at a price of
$22.00
per share, to a limited number of institutional and other investors in a registered offering under the shelf registration statement. The offering represented
18%
of our outstanding common stock on an after-issued basis as of June 25, 2018. Upon completion of the offering and issuance of common stock, the Company had
17,669,314
shares of common stock outstanding. The gross proceeds of the offering totaled
$69,000,000
and after an underwriting discount of
$4,485,000
and other offering expenses of
$418,000
, the net proceeds received by the Company were
$64,097,000
.
24. Fruit Growers Supply Cooperative
The Company is a member of Fruit Growers Supply (“FGS”), a cooperative supply corporation. FGS is the manufacturing and supply affiliate of Sunkist. FGS allocates after-tax earnings derived from non-member business to members. The allocations may then be disbursed to members as dividends no less than five years after allocation. As of
October 31, 2018
, and
2017
, the Company has been allocated
$729,000
; however, the declaration of dividends is subject to approval by the FGS Board of Directors and members may receive amounts less than those originally allocated. The Company records allocations disbursed by FGS as reductions of agribusiness expenses. The Company received
no
dividends in fiscal years
2018
,
2017
or
2016
.
During September 2011, the Company settled a claim with Sunkist in which Sunkist requested a refund of
$586,000
of fiscal year 2010 lemon by-products revenue. The Company assigned
50%
of future dividends it receives from FGS up to the amount of claim in the unconditional settlement of the claim. The balance of the claim as of
October 31, 2018
was
$251,000
.
25. Segment Information
The Company operates in
six
reportable operating segments: fresh lemons, lemon packing, avocados, other agribusiness, rental operations and real estate development. The reportable operating segments of the Company are strategic business units with different products and services, distribution processes and customer bases. The fresh lemons segment includes sales, farming and harvesting expenses and third-party grower costs relative to fresh lemons. The lemon packing segment includes packing revenues and shipping and handling revenues relative to lemon packing. The lemon packing segment expenses are comprised of lemon packing costs. The lemon packing segment revenues include inter-segment revenues between fresh lemons and lemon packing. The inter-segment revenues are included gross in the segment note and a separate line item is shown as an elimination. The avocados segment includes sales, farming and harvest costs. The other agribusiness segment includes sales, farming and harvesting of oranges, specialty citrus and other crops. The rental operations segment includes housing and commercial rental operations, leased land and organic recycling. The real estate development segment includes real estate development operations.
The Company does not separately allocate depreciation and amortization to its fresh lemons, lemon packing, avocados and other agribusiness segments. No asset information is provided for reportable segments as these specified amounts are not included in the measure of segment profit or loss reviewed by the Company’s chief operating decision maker. The Company measures operating performance, including revenues and operating income, of its operating segments and allocates resources based on its evaluation. The Company does not allocate selling, general and administrative expense, other income, interest expense and income taxes, or specifically identify them to its operating segments. The Company earns packing revenue for packing lemons grown on its orchards and lemons procured from third-party growers. Intersegment revenues represent packing revenues related to lemons grown on the Company’s orchards.
Prior to October 31, 2017, the Company combined its fresh lemons and lemon packing segments into one reportable segment called lemon operations. During 2017, following the completion and start-up activities of its new lemon packinghouse in 2016, the Company and its chief operating decision maker have emphasized the strategic importance and financial performance of its lemon packing operations and expanded processing volume with a focus on increasing the quantity of lemons procured from third-party growers. As a result, during the fourth quarter of 2017, the Company separated its lemon operations segment into two segments: fresh lemons and lemon packing. This change was made to align operating segments with the basis that the chief operating decision maker uses to review financial information to make decisions, assess performance, develop strategy and allocate capital resources. Additionally, the Company determined that avocados, which was previously aggregated in the other agribusiness
105
LIMONEIRA COMPANY
NOTES TO CONSOLIDATED FINANCIAL STATEMENTS (CONTINUED)
25. Segment Information (continued)
segment, should be a separate reportable segment based upon the Company’s chief operating decision maker’s review of its operating results. Prior period disclosures have been recast to present results on a comparable basis.
In October 2016, the Company re-purposed Windfall Farms from a real estate development project to an agricultural ranch and reclassified
$26,779,000
of real estate development assets to property, plant and equipment. Windfall Farms was reclassified to the other agribusiness reportable segment from the real estate development segment in October 2016. Windfall Farms had limited real estate development activities prior to October 2016, with operating costs consisting primarily of property maintenance and taxes being the main components of its operating results.
Segment information for fiscal year
2018
(in thousands):
|
|
Fresh
Lemons
|
Lemon
Packing
|
Eliminations
|
Avocados
|
Other
Agribusiness
|
Total
Agribusiness
|
Rental
Operations
|
Real Estate
Development
|
Corporate
and Other
|
Total
|
|||||||||||||||||||||||||||||
|
Revenues from external customers
|
$
|
94,840
|
|
$
|
8,990
|
|
$
|
—
|
|
$
|
6,576
|
|
$
|
13,938
|
|
$
|
124,344
|
|
$
|
5,048
|
|
$
|
—
|
|
$
|
—
|
|
$
|
129,392
|
|
|||||||||
|
Intersegment revenue
|
—
|
|
19,971
|
|
(19,971
|
)
|
—
|
|
—
|
|
—
|
|
—
|
|
—
|
|
—
|
|
—
|
|
|||||||||||||||||||
|
Total net revenues
|
94,840
|
|
28,961
|
|
(19,971
|
)
|
6,576
|
|
13,938
|
|
124,344
|
|
5,048
|
|
—
|
|
—
|
|
129,392
|
|
|||||||||||||||||||
|
Costs and expenses
|
74,809
|
|
23,071
|
|
(19,971
|
)
|
4,399
|
|
9,531
|
|
91,839
|
|
3,307
|
|
1,685
|
|
15,800
|
|
112,631
|
|
|||||||||||||||||||
|
Depreciation and amortization
|
—
|
|
—
|
|
—
|
|
—
|
|
—
|
|
6,244
|
|
778
|
|
—
|
|
253
|
|
7,275
|
|
|||||||||||||||||||
|
Operating Income
|
$
|
20,031
|
|
$
|
5,890
|
|
$
|
—
|
|
$
|
2,177
|
|
$
|
4,407
|
|
$
|
26,261
|
|
$
|
963
|
|
$
|
(1,685
|
)
|
$
|
(16,053
|
)
|
$
|
9,486
|
|
|||||||||
Segment information for fiscal year
2017
(in thousands):
|
|
Fresh
Lemons
|
Lemon
Packing
|
Eliminations
|
Avocados
|
Other
Agribusiness
|
Total
Agribusiness
|
Rental
Operations
|
Real Estate
Development
|
Corporate
and Other
|
Total
|
|||||||||||||||||||||||||||||
|
Revenues from external customers
|
$
|
85,439
|
|
$
|
8,760
|
|
$
|
—
|
|
$
|
9,522
|
|
$
|
12,148
|
|
$
|
115,869
|
|
$
|
5,440
|
|
$
|
—
|
|
$
|
—
|
|
$
|
121,309
|
|
|||||||||
|
Intersegment revenue
|
—
|
|
19,156
|
|
(19,156
|
)
|
—
|
|
—
|
|
—
|
|
—
|
|
—
|
|
—
|
|
—
|
|
|||||||||||||||||||
|
Total net revenues
|
85,439
|
|
27,916
|
|
(19,156
|
)
|
9,522
|
|
12,148
|
|
115,869
|
|
5,440
|
|
—
|
|
121,309
|
|
|||||||||||||||||||||
|
Costs and expenses
|
67,414
|
|
21,567
|
|
(19,156
|
)
|
4,136
|
|
11,712
|
|
85,673
|
|
3,170
|
|
405
|
|
13,731
|
|
102,979
|
|
|||||||||||||||||||
|
Depreciation and amortization
|
—
|
|
—
|
|
—
|
|
—
|
|
—
|
|
5,489
|
|
762
|
|
—
|
|
216
|
|
6,467
|
|
|||||||||||||||||||
|
Operating Income
|
$
|
18,025
|
|
$
|
6,349
|
|
$
|
—
|
|
$
|
5,386
|
|
$
|
436
|
|
$
|
24,707
|
|
$
|
1,508
|
|
$
|
(405
|
)
|
$
|
(13,947
|
)
|
$
|
11,863
|
|
|||||||||
Segment information for fiscal year
2016
(in thousands):
|
|
Fresh
Lemons
|
Lemon
Packing
|
Eliminations
|
Avocados
|
Other
Agribusiness
|
Total
Agribusiness
|
Rental
Operations
|
Real Estate
Development
|
Corporate
and Other
|
Total
|
|||||||||||||||||||||||||||||
|
Revenues from external customers
|
$
|
80,437
|
|
$
|
4,830
|
|
$
|
—
|
|
$
|
10,767
|
|
$
|
10,096
|
|
$
|
106,130
|
|
$
|
5,603
|
|
$
|
56
|
|
$
|
—
|
|
$
|
111,789
|
|
|||||||||
|
Intersegment revenue
|
—
|
|
17,123
|
|
(17,123
|
)
|
—
|
|
—
|
|
—
|
|
—
|
|
—
|
|
—
|
|
—
|
|
|||||||||||||||||||
|
Total net revenues
|
80,437
|
|
21,953
|
|
(17,123
|
)
|
10,767
|
|
10,096
|
|
106,130
|
|
5,603
|
|
56
|
|
111,789
|
|
|||||||||||||||||||||
|
Costs and expenses
|
61,742
|
|
21,939
|
|
(17,123
|
)
|
4,619
|
|
8,106
|
|
79,283
|
|
2,885
|
|
2,006
|
|
13,088
|
|
97,262
|
|
|||||||||||||||||||
|
Depreciation and amortization
|
—
|
|
—
|
|
—
|
|
—
|
|
—
|
|
4,321
|
|
732
|
|
55
|
|
231
|
|
5,339
|
|
|||||||||||||||||||
|
Operating Income
|
$
|
18,695
|
|
$
|
14
|
|
$
|
—
|
|
$
|
6,148
|
|
$
|
1,990
|
|
$
|
22,526
|
|
$
|
1,986
|
|
$
|
(2,005
|
)
|
$
|
(13,319
|
)
|
$
|
9,188
|
|
|||||||||
106
LIMONEIRA COMPANY
NOTES TO CONSOLIDATED FINANCIAL STATEMENTS (CONTINUED)
25. Segment Information (continued)
The following table sets forth revenues by category, by segment for fiscal years
2018
,
2017
and
2016
(in thousands):
|
|
Year Ended October 31,
|
||||||||||
|
|
2018
|
2017
|
2016
|
||||||||
|
Fresh lemon
|
$
|
94,840
|
|
$
|
85,439
|
|
$
|
80,437
|
|
||
|
Lemon packing
|
28,961
|
|
27,916
|
|
21,953
|
|
|||||
|
Intersegment revenue
|
(19,971
|
)
|
(19,156
|
)
|
(17,123
|
)
|
|||||
|
Lemon revenues
|
103,830
|
|
94,199
|
|
85,267
|
|
|||||
|
Avocados
|
6,576
|
|
9,522
|
|
10,767
|
|
|||||
|
Navel and Valencia oranges
|
8,884
|
|
7,099
|
|
6,143
|
|
|||||
|
Specialty citrus and other crops
|
5,054
|
|
5,049
|
|
3,953
|
|
|||||
|
Other agribusiness revenues
|
13,938
|
|
12,148
|
|
10,096
|
|
|||||
|
Agribusiness revenues
|
124,344
|
|
115,869
|
|
106,130
|
|
|||||
|
Residential and commercial rentals
|
3,472
|
|
3,589
|
|
3,555
|
|
|||||
|
Leased land
|
1,252
|
|
1,440
|
|
1,755
|
|
|||||
|
Organic recycling and other
|
324
|
|
411
|
|
293
|
|
|||||
|
Rental operations revenues
|
5,048
|
|
5,440
|
|
5,603
|
|
|||||
|
Real estate development revenues
|
—
|
|
—
|
|
56
|
|
|||||
|
Total revenues
|
$
|
129,392
|
|
$
|
121,309
|
|
$
|
111,789
|
|
||
26. Sale of Conservation Easement
In October 2016, the Company sold a conservation easement on certain of its Ventura County property to The Nature Conservancy. The easement preserves
235
acres along the Santa Clara River in perpetuity from commercial and residential development and provides access to the river by certain groups for environmental study and observation. The sales price was
$995,000
and the gain on the sale was
$995,000
. The Company retains title to the property, the easement allows the Company to continue agriculture and related activities on the property and the post-easement, appraised value of the property exceeds its carrying value.
27. Subsequent Events
The Company has evaluated events subsequent to
October 31, 2018
through the date of this filing, to assess the need for potential recognition or disclosure in this Annual Report. Based upon this evaluation, except as disclosed in the notes to consolidated financial statements, it was determined that no other subsequent events occurred that require recognition or disclosure in the consolidated financial statements.
107
Item 9. Changes in and Disagreements with Accountants on Accounting and Financial Disclosure.
None.
Item 9A. Controls and Procedures
Disclosure Controls and Procedures
. As of
October 31, 2018
, we carried out an evaluation, under the supervision and with the participation of our management, including our Chief Executive Officer and Chief Financial Officer, of the effectiveness of the design and operation of our “disclosure controls and procedures,” as such term is defined in Rule 13a-15(e) promulgated under the Exchange Act. Based upon that evaluation, our Chief Executive Officer and Chief Financial Officer concluded that our disclosure controls and procedures were effective as of the end of the period covered by this Annual Report.
Internal Control over Financial Reporting.
Refer to “Management’s Report on Internal Control over Financial Reporting” on page 60 and “Reports of Independent Registered Public Accounting Firm” on pages 61-63.
Changes in Internal Control over Financial Reporting
. There have been no significant changes in our internal control over financial reporting during the quarter ended
October 31, 2018
or, to our knowledge, in other factors that have materially affected, or are reasonably likely to materially affect, our internal control over financial reporting.
Limitations on the Effectiveness of Controls
. Control systems, no matter how well conceived and operated, are designed to provide a reasonable, but not an absolute, level of assurance that the objectives of the control system are met. Further, the design of a control system must reflect the fact that there are resource constraints, and the benefits of controls must be considered relative to their costs. Because of the inherent limitations in all control systems, no evaluation of controls can provide absolute assurance that all control issues and instances of fraud, if any, within the Company have been detected. Because of the inherent limitations in a cost-effective control system, misstatements due to error or fraud may occur and not be detected.
Acquisition of Oxnard Lemon.
We have excluded Oxnard Lemon's operations from our management’s report on internal control over financial reporting as we continue to evaluate their internal controls. This exclusion is in accordance with the general guidance issued by the Staff of the SEC that an assessment of a recent business combination may be omitted from management’s report on internal control over financial reporting in the first year of consolidation.
Item 9B. Other Information
None.
PART III
Certain information required by Part III is omitted from this Annual Report because we will file a definitive Proxy Statement for the Annual Meeting of Stockholders pursuant to Regulation 14A of the Exchange Act (the “Proxy Statement”), not later than 120 days after the end of the fiscal year covered by this Annual Report, and the applicable information included in the Proxy Statement is incorporated herein by reference.
Item 10. Directors, Executive Officers, and Corporate Governance
The information required by this item is incorporated herein by reference to the Proxy Statement.
Item 11. Executive Compensation
The information required by this Item is incorporated herein by reference to the Proxy Statement.
Item 12. Security Ownership of Certain Beneficial Owners and Management and Related Stockholder Matters
The information required by this Item is incorporated herein by reference to the Proxy Statement.
Item 13. Certain Relationships and Related Transactions, and Director Independence
The information required by this Item is incorporated herein by reference to the Proxy Statement.
Item 14. Principal Accountant's Fees and Services
The information required by this Item is incorporated herein by reference to the Proxy Statement.
108
Part IV
Item 15. Exhibits and Financial Statement Schedules
|
(a)(1)
|
Financial Statements
|
|
|
Management’s Report on Internal Control over Financial Reporting
|
|
|
Report of Independent Registered Public Accounting Firm on Internal Control over Financial Reporting
|
|
|
Report of Independent Registered Public Accounting Firm
|
|
|
Consolidated Balance Sheets at October 31, 2018 and 2017
|
|
|
Consolidated Statements of Operations for the years ended October 31, 2018, 2017 and 2016
|
|
|
Consolidated Statements of Comprehensive Income for the years ended October 31, 2018, 2017 and 2016
|
|
|
Consolidated Statements of Stockholders’ Equity and Temporary Equity for the years ended October 31, 2018, 2017 and 2016
|
|
|
Consolidated Statements of Cash Flows for the years ended October 31, 2018, 2017 and 2016
|
|
|
Notes to Consolidated Financial Statements
|
|
|
|
|
(b)
|
Exhibits
|
|
|
|
|
|
See “Exhibit Index” set forth on page E-1.
|
109
SIGNATURES
Pursuant to the requirements of Section 13 or 15(d) of the Securities Exchange Act of 1934, as amended, the registrant has duly caused this report to be signed on its behalf by the undersigned, thereunto duly authorized, on
January 14, 2019
.
|
|
LIMONEIRA COMPANY
|
|
|
|
|
|
|
|
|
|
By:
|
/s/ Harold S. Edwards
|
|
|
|
|
Harold S. Edwards
|
|
|
|
|
Director, President and
Chief Executive Officer
|
|
Pursuant to the requirements of the Securities Exchange Act of 1934, as amended, this report has been signed below on
January 14, 2019
, by the following persons on behalf of the registrant and in the capacities indicated:
|
Signature
|
|
Title
|
|
|
|
|
|
/s/ Gordon E. Kimball
|
|
Chairman of the Board of Directors
|
|
Gordon E. Kimball
|
|
|
|
|
|
|
|
/s/ Harold S. Edwards
|
|
Director, President and Chief Executive Officer
|
|
Harold S. Edwards
|
|
(Principal Executive Officer)
|
|
|
|
|
|
/s/ Mark Palamountain
|
|
Chief Financial Officer, Treasurer
|
|
Mark Palamountain
|
|
and Corporate Secretary
(Principal Financial and Accounting Officer)
|
|
|
|
|
|
/s/ Elizabeth Blanchard Chess
|
|
Director
|
|
Elizabeth Blanchard Chess
|
|
|
|
|
|
|
|
/s/ John W.H. Merriman
|
|
Director
|
|
John W.H. Merriman
|
|
|
|
|
|
|
|
/s/ Edgar Terry
|
|
Director
|
|
Edgar Terry
|
|
|
|
|
|
|
|
/s/ Donald R. Rudkin
|
|
Director
|
|
Donald R. Rudkin
|
|
|
|
|
|
|
|
/s/ Robert M. Sawyer
|
|
Director
|
|
Robert M. Sawyer
|
|
|
|
|
|
|
|
/s/ Scott S. Slater
|
|
Director
|
|
Scott S. Slater
|
|
|
110
EXHIBIT INDEX
|
Exhibit
No.
|
|
Description
|
|
|
|
|
|
2.1
|
|
|
|
|
|
|
|
2.2
|
|
|
|
|
|
|
|
2.3
|
|
|
|
|
|
|
|
3.1
|
|
|
|
|
|
|
|
3.2
|
|
|
|
|
|
|
|
3.3
|
|
|
|
|
|
|
|
3.4
|
|
|
|
|
|
|
|
3.5
|
|
|
|
|
|
|
|
3.5.1
|
|
|
|
|
|
|
|
3.5.2
|
|
|
|
|
|
|
|
3.5.3
|
|
|
|
|
|
|
|
3.5.4
|
|
|
|
|
|
|
|
4.1
|
|
|
|
|
|
|
|
4.2
|
|
|
111
|
Exhibit
No.
|
|
Description
|
|
|
|
|
|
|
|
|
|
4.3
|
|
|
|
4.4
|
|
|
|
|
|
|
|
4.5
|
|
|
|
|
|
|
|
4.6
|
|
|
|
|
|
|
|
10.1
|
|
|
|
|
|
|
|
10.2
|
|
|
|
|
|
|
|
10.3
|
|
|
|
|
|
|
|
10.4
|
|
|
|
|
|
|
|
10.5
|
|
|
|
|
|
|
|
10.6
|
|
|
|
|
|
|
|
10.7
|
|
|
|
|
|
|
|
10.8
|
|
|
|
|
|
|
112
|
Exhibit
No.
|
|
Description
|
|
|
|
|
|
10.9
|
|
|
|
|
|
|
|
10.10
|
|
|
|
|
|
|
|
10.11
|
|
|
|
10.12
|
|
|
|
|
|
|
|
10.13
|
|
|
|
|
|
|
|
10.14
|
|
|
|
|
|
|
|
10.15
|
|
|
|
|
|
|
|
10.16
|
|
|
|
|
|
|
|
10.17†
|
|
|
|
|
|
|
|
10.18†
|
|
|
|
|
|
|
|
10.19†
|
|
|
|
|
|
|
|
10.20
|
|
|
|
|
|
|
|
10.21
|
|
|
|
|
|
|
113
|
Exhibit
No.
|
|
Description
|
|
|
|
|
|
10.22
|
|
|
|
|
|
|
|
10.23
|
|
|
|
|
|
|
|
10.24
|
|
|
|
|
|
|
|
10.25
|
|
|
|
|
|
|
|
10.26
|
|
|
|
10.27
|
|
|
|
|
|
|
|
10.28
|
|
|
|
|
|
|
|
10.29
|
|
|
|
|
|
|
|
10.30
|
|
|
|
|
|
|
|
10.31
|
|
|
|
|
|
|
|
10.32
|
|
|
|
|
|
|
|
10.33
|
|
|
|
|
|
|
|
10.34
|
|
|
|
|
|
|
114
|
Exhibit
No.
|
|
Description
|
|
|
|
|
|
10.35
|
|
|
|
|
|
|
|
10.36
|
|
|
|
|
|
|
|
10.37
|
|
|
|
|
|
|
|
10.38
|
|
|
|
|
|
|
|
10.39
|
|
|
|
10.40
|
|
|
|
|
|
|
|
10.41
|
|
|
|
|
|
|
|
10.42
|
|
|
|
|
|
|
|
10.43
|
|
|
|
|
|
|
|
10.44
|
|
|
|
|
|
|
|
10.45
|
|
|
|
|
|
|
|
10.46
|
|
|
|
|
|
|
|
10.47†
|
|
|
|
|
|
|
115
|
Exhibit
No.
|
|
Description
|
|
|
|
|
|
10.48
|
|
|
|
|
|
|
|
10.49
|
|
|
|
|
|
|
|
10.50
|
|
|
|
10.51†
|
||
|
10.52
|
||
|
10.53
|
||
|
10.54
|
||
|
10.55
|
||
|
10.56†
|
||
|
10.57
|
||
|
|
|
|
|
21.1*
|
|
|
|
|
|
|
|
23.1*
|
|
|
|
|
|
|
|
31.1*
|
|
|
|
|
|
|
|
31.2*
|
|
|
116
|
Exhibit
No.
|
|
Description
|
|
|
|
|
|
32.1*
|
|
|
|
|
|
|
|
32.2*
|
|
|
|
|
|
|
|
101.INS*
|
|
XBRL Instance Document
|
|
|
|
|
|
101.SCH*
|
|
XBRL Taxonomy Extension Schema Document
|
|
|
|
|
|
101.CAL*
|
|
XBRL Taxonomy Extension Calculation Linkbase Document
|
|
|
|
|
|
101.DEF*
|
|
XBRL Taxonomy Extension Definition Linkbase Document
|
|
|
|
|
|
101.LAB*
|
|
XBRL Taxonomy Extension Label Linkbase Document
|
|
|
|
|
|
101.PRE*
|
|
XBRL Taxonomy Extension Presentation Linkbase Document
|
|
*
|
Filed herewith.
|
|
|
†
|
Denotes management contracts and compensatory plans or arrangements.
|
|
|
#
|
Certain portions have been omitted pursuant to a confidential treatment request. Omitted information has been filed separately with the SEC.
|
|
117
TABLE OF CONTENTS
Part IItem 1. BusinessItem 1A. Risk FactorsItem 1B. Unresolved Staff CommentsItem 2. PropertiesItem 3. Legal ProceedingsItem 4. Mine Safety DisclosuresPart IIItem 5. Market For Registrant S Common Equity, Related Stockholder Matters and Issuer Purchases Of Equity SecuritiesItem 6. Selected Financial DataItem 7. Management S Discussion and Analysis Of Financial Condition and Results Of OperationsItem 7A. Quantitative and Qualitative Disclosures About Market RiskItem 8. Financial Statements and Supplementary DataItem 9. Changes in and Disagreements with Accountants on Accounting and Financial DisclosureItem 9A. Controls and ProceduresItem 9B. Other InformationPart IIIItem 10. Directors, Executive Officers, and Corporate GovernanceItem 11. Executive CompensationItem 12. Security Ownership Of Certain Beneficial Owners and Management and Related Stockholder MattersItem 13. Certain Relationships and Related Transactions, and Director IndependenceItem 14. Principal Accountant's Fees and ServicesPart IVItem 15. Exhibits and Financial Statement Schedules