LOCKHEED MARTIN CORP
10-Ks and 10-Qs
|
|
|
|
|
|
|
|
|
|
|
|
|
|
|
|
|
|
|
|
|
|
|
|
|
|
|
|
|
|
|
|
|
|
|
|
|
|
|
|
|
|
|
|
|
|
|
|
|
|
|
|
|
|
|
|
UNITED STATES
SECURITIES AND EXCHANGE COMMISSION
Washington, D.C. 20549
Form 10-K
ANNUAL REPORT PURSUANT TO SECTION 13 OR 15(d) OF
THE SECURITIES EXCHANGE ACT OF 1934
For the fiscal year ended
December 31, 2018
Commission file number 1-11437
LOCKHEED MARTIN CORPORATION
(Exact name of registrant as specified in its charter)
|
Maryland
|
|
52-1893632
|
|
(State or other jurisdiction of
incorporation or organization)
|
|
(I.R.S. Employer
Identification No.)
|
6801 Rockledge Drive, Bethesda, Maryland 20817-1877 (301/897-6000)
(Address and telephone number of principal executive offices)
Securities registered pursuant to Section 12(b) of the Act:
|
Title of each class
|
|
Name of each exchange on which registered
|
|
Common Stock, $1 par value
|
New York Stock Exchange
|
|
Securities registered pursuant to Section 12(g) of the Act: None
Indicate by check mark if the registrant is a well-known seasoned issuer, as defined in Rule 405 of the Securities Act. Yes
☒
No
☐
Indicate by check mark if the registrant is not required to file reports pursuant to Section 13 or Section 15(d) of the Act. Yes
☐
No
☒
Indicate by check mark whether the registrant (1) has filed all reports required to be filed by Section 13 or 15(d) of the Securities Exchange Act of 1934 during the preceding 12 months (or for such shorter period that the registrant was required to file such reports), and (2) has been subject to such filing requirements for the past 90 days. Yes
☒
No
☐
Indicate by check mark whether the registrant has submitted electronically every Interactive Data File required to be submitted pursuant to Rule 405 of Regulation S-T (§232.405 of this chapter) during the preceding 12 months (or for such shorter period that the registrant was required to submit such files). Yes
☒
No
☐
Indicate by check mark if disclosure of delinquent filers pursuant to Item 405 of Regulation S-K (§229.405 of this chapter) is not contained herein, and will not be contained, to the best of registrant’s knowledge, in definitive proxy or information statements incorporated by reference in Part III of this Form 10-K or any amendment to this Form 10-K.
☒
Indicate by check mark whether the registrant is a large accelerated filer, an accelerated filer, a non-accelerated filer, a smaller reporting company or an emerging growth company. See the definitions of “large accelerated filer,” “accelerated filer,” “smaller reporting company,” and “emerging growth company” in Rule 12b-2 of the Exchange Act.
|
Large accelerated filer
☒
|
Accelerated filer
☐
|
Non-accelerated filer
☐
|
Smaller reporting company
☐
|
Emerging growth company
☐
|
If an emerging growth company, indicate by check mark if the registrant has elected not to use the extended transition period for complying with any new or revised financial accounting standards provided pursuant to Section 13(a) of the Exchange Act.
☐
Indicate by check mark whether the registrant is a shell company (as defined in Rule 12b-2 of the Exchange Act). Yes
☐
No
☒
The aggregate market value of voting and non-voting common stock held by non-affiliates of the registrant computed by reference to the last sales price of such stock, as of the last business day of the registrant’s most recently completed second fiscal quarter, which was June 22, 2018, was approximately
$84.7 billion
.
There were
282,562,534
shares of our common stock, $1 par value per share, outstanding as of
January 25, 2019
.
DOCUMENTS INCORPORATED BY REFERENCE
Portions of Lockheed Martin Corporation’s
2019
Definitive Proxy Statement are incorporated by reference into Part III of this Form 10‑K.
Lockheed Martin Corporation
Form 10-K
For the Year Ended
December 31, 2018
Table of Contents
|
PART I
|
|
Page
|
|
ITEM 1.
|
||
|
ITEM 1A.
|
||
|
ITEM 1B.
|
||
|
ITEM 2.
|
||
|
ITEM 3.
|
||
|
ITEM 4.
|
||
|
ITEM 4(a).
|
||
|
PART II
|
||
|
ITEM 5.
|
||
|
ITEM 6.
|
||
|
ITEM 7.
|
||
|
ITEM 7A.
|
||
|
ITEM 8.
|
||
|
ITEM 9.
|
||
|
ITEM 9A.
|
||
|
ITEM 9B.
|
||
|
PART III
|
||
|
ITEM 10.
|
||
|
ITEM 11.
|
||
|
ITEM 12.
|
||
|
ITEM 13.
|
||
|
ITEM 14.
|
||
|
PART IV
|
||
|
ITEM 15.
|
||
|
ITEM 16.
|
||
|
|
||
PART I
ITEM 1.
Business
General
We are a global security and aerospace company principally engaged in the research, design, development, manufacture, integration and sustainment of advanced technology systems, products and services. We also provide a broad range of management, engineering, technical, scientific, logistics, system integration and cybersecurity services. We serve both U.S. and international customers with products and services that have defense, civil and commercial applications, with our principal customers being agencies of the U.S. Government. In
2018
,
70%
of our
$53.8 billion
in net sales were from the U.S. Government, either as a prime contractor or as a subcontractor (including
60%
from the Department of Defense (DoD)),
28%
were from international customers (including foreign military sales (FMS) contracted through the U.S. Government) and
2%
were from U.S. commercial and other customers. Our main areas of focus are in defense, space, intelligence, homeland security and information technology, including cybersecurity.
We operate in an environment characterized by both complexity in global security and continuing economic pressures in the U.S. and globally. A significant component of our strategy in this environment is to focus on program execution, improving the quality and predictability of the delivery of our products and services, and placing security capability quickly into the hands of our U.S. and international customers at affordable prices. Recognizing that our customers are resource constrained, we are endeavoring to develop and extend our portfolio domestically in a disciplined manner with a focus on adjacent markets close to our core capabilities, as well as growing our international sales. We continue to focus on affordability initiatives. We also expect to continue to innovate and invest in technologies to fulfill new mission requirements for our customers and invest in our people so that we have the technical skills necessary to succeed
.
We operate in four business segments: Aeronautics, Missiles and Fire Control (MFC), Rotary and Mission Systems (RMS) and Space. We organize our business segments based on the nature of the products and services offered.
Aeronautics
In
2018
, our Aeronautics business segment generated net sales of
$21.2 billion
, which represented
40%
of our total consolidated net sales. Aeronautics’ customers include the military services, principally the U.S. Air Force and U.S. Navy, and various other government agencies of the U.S. and other countries. In
2018
, U.S. Government customers accounted for
63%
, international customers accounted for
36%
and U.S. commercial and other customers accounted for
1%
of Aeronautics’ net sales. Net sales from Aeronautics’ combat aircraft products and services represented
32%
,
31%
and
28%
of our total consolidated net sales in
2018
,
2017
and
2016
.
Aeronautics is engaged in the research, design, development, manufacture, integration, sustainment, support and upgrade of advanced military aircraft, including combat and air mobility aircraft, unmanned air vehicles and related technologies. Aeronautics’ major programs include:
|
•
|
F-35 Lightning II Joint Strike Fighter - international multi-role, multi-variant, fifth generation stealth fighter;
|
|
•
|
C-130 Hercules - international tactical airlifter;
|
|
•
|
F-16 Fighting Falcon - low-cost, combat-proven, international multi-role fighter; and
|
|
•
|
F-22 Raptor - air dominance and multi-mission fifth generation stealth fighter.
|
The F-35 program is our largest program, generating
27%
of our total consolidated net sales, as well as
68%
of Aeronautics’ net sales in
2018
. The F-35 program consists of development contracts, multiple production contracts, and sustainment activities. The development contracts are being performed concurrently with the production contracts. Concurrent performance of development and production contracts is used for complex programs to test aircraft, shorten the time to field systems and achieve overall cost savings.
In April 2018, we completed the System Development and Demonstration (SDD) flight testing portion of the development contract and began the next phase of development in support of phased capability improvements and modernization of the F-35 air system. This next phase of development work is being performed separately from the basic SDD contract as part of the Joint Program Office’s Continuous Capability Development and Delivery (C2D2) strategy.
In December 2018, the DoD officially approved the F-35 program to begin the formal Initial Operational Test & Evaluation (IOT&E) phase. Testing is expected to be completed during 2019. The data will be analyzed by the U.S. Government as part of their evaluation to transition the F-35 program from
Low Rate Initial Production (LRIP) into full-rate production at the end of 2019.
Production of the aircraft is expected to continue for many years given the U.S. Government’s current inventory objective of
2,456
aircraft for the U.S. Air Force, U.S. Marine Corps and U.S. Navy; commitments from our eight international partners and
3
three international customers; as well as expressions of interest from other countries. In
2018
, we delivered 91 aircraft, including 37 to international customers, resulting in total deliveries of
357
production aircraft as of
December 31, 2018
. We have
396
production aircraft in backlog as of
December 31, 2018
, including orders from our international partners. For additional information on the F-35 program, see “Status of the F‑35 Program” in Management’s Discussion and Analysis of Financial Condition and Results of Operations.
Aeronautics produces and provides support and sustainment services for the C-130J Super Hercules, as well as upgrades and support services for the legacy C-130 Hercules worldwide fleet. We delivered 25 C-130J aircraft in
2018
, including two to international customers. We have 78 aircraft in our backlog as of
December 31, 2018
with advanced funding from customers for additional C-130J aircraft not currently in backlog. Our C-130J backlog extends into 2022.
In June 2018, we received a contract from the U.S. Government for the sale of new production Block 70 F-16 aircraft for the Royal Bahraini Air Force and in December 2018, Slovakia signed a Letter of Offer and Acceptance (LOA) to procure 14 new production F-16 Block 70/72 aircraft. We are transitioning F-16 production to Greenville, South Carolina to support the production programs and other emerging F-16 production requirements. Additionally, Aeronautics continues to provide service-life extension, modernization and other upgrade programs for our customers’ F‑16 aircraft, with existing contracts continuing for several years. We continue to seek additional international opportunities to deliver additional aircraft.
Aeronautics continues to provide modernization and sustainment activities for the U.S. Air Force’s F-22 aircraft fleet. The modernization program comprises upgrading existing systems requirements, developing new systems requirements, adding capabilities and enhancing the performance of the weapon systems. The sustainment program consists of sustaining the weapon systems of the F-22 fleet, providing training systems, customer support, integrated support planning, supply chain management, aircraft modifications and heavy maintenance, systems engineering and support products.
In addition to the aircraft programs discussed above, Aeronautics is involved in advanced development programs incorporating innovative design and rapid prototype applications. Our Advanced Development Programs (ADP) organization, also known as Skunk Works
®
, is focused on future systems, including unmanned and manned aerial systems and next generation capabilities for advanced strike, intelligence, surveillance, reconnaissance, situational awareness and air mobility. We continue to explore technology advancement and insertion into our existing aircraft. We also are involved in numerous network-enabled activities that allow separate systems to work together to increase effectiveness and we continue to invest in new technologies to maintain and enhance competitiveness in military aircraft design, development and production.
Missiles and Fire Control
In
2018
, our MFC business segment generated net sales of
$8.5 billion
, which represented
16%
of our total consolidated net sales. MFC’s customers include the military services, principally the U.S. Army, and various government agencies of the U.S. and other countries, as well as commercial and other customers. In
2018
, U.S. Government customers accounted for
72%
, international customers accounted for
26%
and U.S. commercial and other customers accounted for
2%
of MFC’s net sales.
MFC provides air and missile defense systems; tactical missiles and air-to-ground precision strike weapon systems; logistics; fire control systems; mission operations support, readiness, engineering support and integration services; manned and unmanned ground vehicles; and energy management solutions. MFC also has contracts with the U.S. Government for various classified programs. MFC’s major programs include:
|
•
|
The Patriot Advanced Capability-3 (PAC-3) and Terminal High Altitude Area Defense (THAAD) air and missile defense programs. PAC-3 is an advanced defensive missile for the U.S. Army and international customers designed to intercept and eliminate incoming airborne threats using kinetic energy. THAAD is a transportable defensive missile system for the U.S. Government and international customers designed to engage targets both within and outside of the Earth’s atmosphere.
|
|
•
|
The Multiple Launch Rocket System (MLRS), Hellfire, Joint Air-to-Surface Standoff Missile (JASSM) and Javelin tactical missile programs. MLRS is a highly mobile, automatic system that fires surface-to-surface rockets and missiles from the M270 and High Mobility Artillery Rocket System platforms produced for the U.S. Army and international customers. Hellfire is an air-to-ground missile used on rotary and fixed-wing aircraft, which is produced for the U.S. Army, Navy, Marine Corps and international customers. JASSM is an air-to-ground missile launched from fixed-wing aircraft, which is produced for the U.S. Air Force and international customers. Javelin is a shoulder-fired anti-armor rocket system, which is produced for the U.S. Army, Marine Corps and international customers.
|
|
•
|
The Apache, SNIPER
®
and Low Altitude Navigation and Targeting Infrared for Night (LANTIRN
®
) fire control systems programs. The Apache fire control system provides weapons targeting capability for the Apache helicopter for the U.S. Army and international customers. SNIPER is a targeting system for several fixed-wing aircraft and LANTIRN is a combined navigation and targeting system for several fixed-wing aircraft. Both SNIPER and LANTIRN are produced for the U.S. Air Force and international customers.
|
4
|
•
|
The Special Operations Forces Global Logistics Support Services (SOF GLSS) program provides logistics support services to the special operations forces of the U.S. military.
|
Rotary and Mission Systems
In
2018
, our RMS business segment generated net sales of
$14.3 billion
, which represented
26%
of our total consolidated net sales. RMS’ customers include the military services, principally the U.S. Navy and Army, and various government agencies of the U.S. and other countries, as well as commercial and other customers. In
2018
, U.S. Government customers accounted for
71%
, international customers accounted for
26%
and U.S. commercial and other customers accounted for
3%
of RMS’ net sales. Net sales from RMS’ Sikorsky helicopter programs represented
10%
in
2018
and
12%
in both
2017
and
2016
of our consolidated net sales.
RMS provides design, manufacture, service and support for a variety of military and commercial helicopters; ship and submarine mission and combat systems; mission systems and sensors for rotary and fixed-wing aircraft; sea and land-based missile defense systems; radar systems; the Littoral Combat Ship (LCS); simulation and training services; and unmanned systems and technologies. In addition, RMS supports the needs of government customers in cybersecurity and delivers communications and command and control capabilities through complex mission solutions for defense applications. RMS’ major programs include:
|
•
|
The Black Hawk
®
and Seahawk
®
helicopters manufactured for U.S. and foreign governments.
|
|
•
|
The Aegis Combat System (Aegis) serves as an air and missile defense system for the U.S. Navy and international customers and is also a sea and land-based element of the U.S. missile defense system.
|
|
•
|
The LCS, a surface combatant ship for the U.S. Navy designed to operate in shallow waters and the open ocean.
|
|
•
|
The CH-53K King Stallion helicopter delivering the next generation heavy lift helicopter for the U.S. Marine Corps.
|
|
•
|
The VH-92A helicopter manufactured for the U.S. Marine One transport mission.
|
|
•
|
The Advanced Hawkeye Radar System, an airborne early warning radar, which RMS provides for the E2-C/E2-D aircraft produced for the U.S. Navy and international customers.
|
|
•
|
The Command, Control, Battle Management and Communications (C2BMC) contract, a program to provide an air operations center for the Ballistic Missile Defense System for the U.S. Government.
|
Space
In
2018
, our Space business segment generated net sales of
$9.8 billion
, which represented
18%
of our total consolidated net sales. Space’s customers include various government agencies of the U.S. and other countries along with commercial customers. In
2018
, U.S. Government customers accounted for
84%
and international customers accounted for
16%
of Space’s net sales. Net sales from Space’s satellite products and services represented
11%
,
12%
and
13%
of our total consolidated net sales in
2018
,
2017
and
2016
.
Space is engaged in the research, design, development, engineering and production of satellites, space transportation systems, and strategic, advanced strike, and defensive systems. Space provides network-enabled situational awareness and integrates complex space and ground global systems to help our customers gather, analyze and securely distribute critical intelligence data. Space is also responsible for various classified systems and services in support of vital national security systems. Space’s major programs include:
|
•
|
The Trident II D5 Fleet Ballistic Missile (FBM), a program with the U.S. Navy for the only submarine-launched intercontinental ballistic missile currently in production in the U.S.
|
|
•
|
The United Kingdom’s nuclear deterrent program operated by the AWE Management Limited (AWE) joint venture.
|
|
•
|
The Orion Multi-Purpose Crew Vehicle (Orion), a spacecraft for the National Aeronautics and Space Administration (NASA) utilizing new technology for human exploration missions beyond low earth orbit.
|
|
•
|
The Space Based Infrared System (SBIRS) and Next Generation Overhead Persistent Infrared (Next Gen OPIR) system programs, which provide the U.S. Air Force with enhanced worldwide missile warning capabilities.
|
|
•
|
Global Positioning System (GPS) III, a program to modernize the GPS satellite system for the U.S. Air Force.
|
|
•
|
The Advanced Extremely High Frequency (AEHF) system, the next generation of highly secure communications satellites for the U.S. Air Force.
|
Competition
Our broad portfolio of products and services competes both domestically and internationally against products and services of other large aerospace and defense companies, as well as numerous smaller competitors. Changes within the industry we operate in, such as vertical integration by our peers, could negatively impact us. We often form teams with our competitors in efforts to provide our customers with the best mix of capabilities to address specific requirements. In some areas of our business, customer
5
requirements are changing to encourage expanded competition. Principal factors of competition include the value of our products and services to the customer; technical and management capability; the ability to develop and implement complex, integrated system architectures; total cost of ownership; our demonstrated ability to execute and perform against contract requirements; and our ability to provide timely solutions. Technological advances in such areas as additive manufacturing, cloud computing, advanced materials, autonomy, robotics, and big data and new business models such as commercial access to space are enabling new factors of competition for both traditional and non-traditional competitors.
The competition for international sales is generally subject to U.S. Government stipulations (e.g., export restrictions, market access, technology transfer, industrial cooperation and contracting practices). We may compete against U.S. and non-U.S. companies (or teams) for contract awards by international governments. International competitions also may be subject to different laws or contracting practices of international governments that may affect how we structure our bid for the procurement. In many international procurements, the purchasing government’s relationship with the U.S. and its industrial cooperation programs are also important factors in determining the outcome of a competition. It is common for international customers to require contractors to comply with their industrial cooperation regulations, sometimes referred to as offset requirements, and we have entered into foreign offset agreements as part of securing some international business. For more information concerning offset agreements, see “Contractual Commitments and Off-Balance Sheet Arrangements” in Management’s Discussion and Analysis of Financial Condition and Results of Operations.
Intellectual Property
We routinely apply for and own a substantial number of U.S. and foreign patents related to the products and services we provide. In addition to owning a large portfolio of patents, we own other intellectual property, including trademarks, copyrights, trade secrets and know-how. Unpatented research, development and engineering skills also make an important contribution to our business. We also license intellectual property to and from third parties. The Federal Acquisition Regulation (FAR) and Defense Federal Acquisition Regulation Supplement (DFARS) provide that the U.S. Government has licenses in our intellectual property and that of our subcontractors and suppliers, including patents, that are developed in performance of government contracts or with government funding, and it may use or authorize others, including competitors, to use such intellectual property, commonly referred to as government use rights. See the discussion of matters related to our intellectual property within Item 1A - Risk Factors. Foreign governments may also have certain rights in patents and other intellectual property developed in performance of foreign government contracts. Although our intellectual property rights in the aggregate are important to the operation of our business, we do not believe that any existing patent, license or other intellectual property right is of such importance that its loss or termination would have a material adverse effect on our business taken as a whole.
Raw Materials and Seasonality
Some of our products require relatively scarce raw materials. Historically, we have been successful in obtaining the raw materials and other supplies needed in our manufacturing processes. We seek to manage raw materials supply risk through long-term contracts and by maintaining an acceptable level of the key materials in inventories.
Aluminum and titanium are important raw materials used in certain of our Aeronautics and Space programs. Long-term agreements have helped enable a continued supply of aluminum and titanium. Carbon fiber is an important ingredient in composite materials used in our Aeronautics programs, such as the F-35 aircraft. We have been advised by some suppliers that pricing and the timing of availability of materials in some commodities markets can fluctuate widely. These fluctuations may negatively affect the price and availability of certain materials. While we do not anticipate material problems regarding the supply of our raw materials and believe that we have taken appropriate measures to mitigate these variations, if key materials become unavailable or if pricing fluctuates widely in the future, it could result in delay of one or more of our programs, increased costs or reduced operating profits.
No material portion of our business is considered to be seasonal. Various factors can affect the distribution of our sales between accounting periods, including the timing of government awards, the availability of government funding, product deliveries and customer acceptance.
Government Contracts and Regulations
Our business is heavily regulated. We contract with numerous U.S. Government agencies and entities, principally all branches of the U.S. military and NASA. We also contract with similar government authorities in other countries and they regulate our international efforts. Additionally, our commercial aircraft products are required to comply with U.S. and international regulations governing production and quality systems, airworthiness and installation approvals, repair procedures and continuing operational safety.
6
We must comply with, and are affected by, laws and regulations relating to the formation, administration and performance of U.S. Government and other governments’ contracts, including foreign governments. These laws and regulations, among other things:
|
•
|
require certification and disclosure of all cost or pricing data in connection with certain types of contract negotiations;
|
|
•
|
impose specific and unique cost accounting practices that may differ from U.S. GAAP;
|
|
•
|
impose acquisition regulations, which may change or be replaced over time, that define which costs can be charged to the U.S. Government, how and when costs can be charged, and otherwise govern our right to reimbursement under certain U.S. Government and foreign contracts;
|
|
•
|
require specific security controls to protect U.S. Government controlled unclassified information and restrict the use and dissemination of information classified for national security purposes and the export of certain products, services and technical data; and
|
|
•
|
require the review and approval of contractor business systems, defined in the regulations as: (i) Accounting System; (ii) Estimating System; (iii) Earned Value Management System, for managing cost and schedule performance on certain complex programs; (iv) Purchasing System; (v) Material Management and Accounting System, for planning, controlling and accounting for the acquisition, use, issuing and disposition of material; and (vi) Property Management System.
|
The U.S. Government and other governments may terminate any of our government contracts and subcontracts either at its convenience or for default based on our performance. If a contract is terminated for convenience, we generally are protected by provisions covering reimbursement for costs incurred on the contract and profit on those costs. If a contract is terminated for default, we generally are entitled to payments for our work that has been accepted by the U.S. Government or other governments; however, the U.S. Government and other governments could make claims to reduce the contract value or recover its procurement costs and could assess other special penalties. For more information regarding the U.S. Government’s and other governments’ right to terminate our contracts, see Item 1A - Risk Factors. For more information regarding government contracting laws and regulations, see Item 1A - Risk Factors as well as “Critical Accounting Policies - Contract Accounting / Sales Recognition” in Management’s Discussion and Analysis of Financial Condition and Results of Operations. For more information on the risks of doing work internationally, see Item 1A - Risk Factors. Additionally, the U.S. Government may also enter into unilateral contract actions. This can affect our ability to negotiate mutually agreeable contract terms.
A portion of our business is classified by the U.S. Government and cannot be specifically described. The operating results of these classified contracts are included in our consolidated financial statements. The business risks and capital requirements associated with classified contracts historically have not differed materially from those of our other U.S. Government contracts. Our internal controls addressing the financial reporting of classified contracts are consistent with our internal controls for our non-classified contracts.
Our operations are subject to and affected by various federal, state, local and foreign environmental protection laws and regulations regarding the discharge of materials into the environment or otherwise regulating the protection of the environment. While the extent of our financial exposure cannot in all cases be reasonably estimated, the costs of environmental compliance have not had, and we do not expect that these costs will have, a material adverse effect on our earnings, financial position and cash flow, primarily because substantially all of our environmental costs are allowable in establishing the price of our products and services under our contracts with the U.S. Government. For information regarding these matters, including current estimates of the amounts that we believe are required for remediation or cleanup to the extent that they are probable and estimable, see “Critical Accounting Policies - Environmental Matters” in Management’s Discussion and Analysis of Financial Condition and Results of Operations and “
Note 14 – Legal Proceedings, Commitments and Contingencies
” included in our Notes to Consolidated Financial Statements. See also the discussion of environmental matters within Item 1A - Risk Factors.
Backlog
At
December 31, 2018
, our backlog was
$130.5 billion
compared with
$105.5 billion
at
December 31, 2017
. Backlog is converted into sales in future periods as work is performed or deliveries are made. We expect to recognize approximately
38%
of our backlog over the next 12 months and approximately
66%
over the next 24 months as revenue, with the remainder recognized thereafter.
Our backlog includes both funded (firm orders for our products and services for which funding has been both authorized and appropriated by the customer) and unfunded (firm orders for which funding has not been appropriated) amounts. We do not include unexercised options or potential orders under indefinite-delivery, indefinite-quantity agreements in our backlog. If any of our contracts with firm orders were to be terminated, our backlog would be reduced by the expected value of the unfilled orders of such contracts. Funded backlog was
$86.4 billion
at
December 31, 2018
, as compared to
$74.1 billion
at
December 31, 2017
. For backlog related to each of our business segments, see “Business Segment Results of Operations” in Management’s Discussion and Analysis of Financial Condition and Results of Operations.
7
Research and Development
We conduct research and development (R&D) activities using our own funds (referred to as company-funded R&D or independent research and development (IR&D)) and under contractual arrangements with our customers (referred to as customer-funded R&D) to enhance existing products and services and to develop future technologies. R&D costs include basic research, applied research, concept formulation studies, design, development, and related test activities. Company-funded R&D costs charged to cost of sales totaled
$1.3 billion
in
2018
,
$1.2 billion
in
2017
and
$988 million
in
2016
. See “
Note 1 – Significant Accounting Policies
” (under the caption “Research and development and similar costs”) included in our Notes to Consolidated Financial Statements.
Employees
At
December 31, 2018
, we had approximately
105,000
employees, about
93%
of whom were located in the U.S. Approximately
21%
of our employees are covered by collective bargaining agreements with various unions. A number of our existing collective bargaining agreements expire in any given year. Historically, we have been successful in negotiating renewals to expiring agreements without any material disruption of operating activities. Management considers employee relations to be good.
Available Information
We are a Maryland corporation formed in 1995 by combining the businesses of Lockheed Corporation and Martin Marietta Corporation. Our principal executive offices are located at 6801 Rockledge Drive, Bethesda, Maryland 20817. Our telephone number is (301) 897-6000 and our website home page is at
www.lockheedmartin.com
. We make our website content available for information purposes only. It should not be relied upon for investment purposes, nor is it incorporated by reference into this Annual Report on Form 10-K (Form 10-K).
Throughout this Form 10-K, we incorporate by reference information from parts of other documents filed with the U.S. Securities and Exchange Commission (SEC). The SEC allows us to disclose important information by referring to it in this manner.
Our annual reports on Form 10-K, quarterly reports on Form 10-Q, current reports on Form 8-K, proxy statements for our annual stockholders’ meetings and amendments to those reports are available free of charge on our website,
www.lockheedmartin.com/investor
, as soon as reasonably practical after we electronically file the material with, or furnish it to, the SEC. In addition, copies of our annual report will be made available, free of charge, upon written request. The SEC also maintains a website at
www.sec.gov
that contains reports, proxy statements and other information regarding SEC registrants, including Lockheed Martin Corporation.
Forward-Looking Statements
This Form 10-K contains statements that, to the extent they are not recitations of historical fact, constitute forward-looking statements within the meaning of the federal securities laws and are based on our current expectations and assumptions. The words “believe,” “estimate,” “anticipate,” “project,” “intend,” “expect,” “plan,” “outlook,” “scheduled,” “forecast” and similar expressions are intended to identify forward-looking statements. These statements are not guarantees of future performance and are subject to risks and uncertainties.
Statements and assumptions with respect to future sales, income and cash flows, program performance, the outcome of litigation, anticipated pension cost and funding, environmental remediation cost estimates, planned acquisitions or dispositions of assets, or the anticipated consequences are examples of forward-looking statements. Numerous factors, including the risk factors described in the following section, could affect our forward-looking statements and actual performance.
Our actual financial results likely will be different from those projected due to the inherent nature of projections. Given these uncertainties, forward-looking statements should not be relied on in making investment decisions. The forward-looking statements contained in this Form 10-K speak only as of the date of its filing. Except where required by applicable law, we expressly disclaim a duty to provide updates to forward-looking statements after the date of this Form 10-K to reflect subsequent events, changed circumstances, changes in expectations, or the estimates and assumptions associated with them. The forward-looking statements in this Form 10-K are intended to be subject to the safe harbor protection provided by the federal securities laws.
8
ITEM 1A. Risk Factors
An investment in our common stock or debt securities involves risks and uncertainties. We seek to identify, manage and mitigate risks to our business, but risk and uncertainty cannot be eliminated or necessarily predicted. The outcome of one or more of these risks could have a material effect on our operating results, financial position, or cash flows. You should carefully consider the following factors, in addition to the other information contained in this Annual Report on Form 10-K, before deciding to purchase our common stock or debt securities.
We depend heavily on contracts with the U.S. Government for a substantial portion of our business.
We derived
70%
of our total net sales from the U.S. Government in
2018
, including
60%
from the Department of Defense (DoD). We expect to continue to derive most of our sales from work performed under U.S. Government contracts. Those contracts are conditioned upon the continuing availability of Congressional appropriations. Congress usually appropriates funds on a fiscal year (FY) basis even though contract performance may extend over many years. Consequently, contracts are often partially funded initially and additional funds are committed only as Congress makes further appropriations. If we incur costs in excess of funds obligated on a contract, we may be at risk for reimbursement of those costs unless and until additional funds are obligated to the contract.
As discussed within “Industry Considerations-U.S. Government Funding” in Management’s Discussion and Analysis of Financial Condition and Results of Operations, on January 25, 2019 Congress passed and the President signed legislation that fully funds the U.S. Government through February 15, 2019, ending a partial government shutdown which did not include our largest customer, the DoD, but did include other customers such as NASA. The underlying budget impasse remains, and it is possible that there will be a further partial shutdown or shutdowns. As noted above, while the corporation’s largest customer, the DoD, is funded through the end of the government FY 2019 and thus would not be affected by another shutdown, limiting the direct impact of any future shutdown or shutdowns on Lockheed Martin, other customers, such as NASA, are not. In the event of future shutdowns, we may continue to work on unfunded contracts to seek to maintain their projected cost and schedule profiles which, although we would anticipate being paid when the shutdown ends, would put us at risk of nonpayment. Further there may be indirect impacts such as the potential diversion of funds from the DoD and the fact that the Departments of State and Commerce cease to timely process export licenses. While in the recent shutdown there were procedures in place to process on an emergency basis licenses involving direct support to the military, humanitarian aid, or other similar emergencies, there was a growing backlog of non-emergency applications. We anticipate that this will occur again in any future shutdown. While the impact on Lockheed Martin of the recent shutdown was not material, were a future shutdown to occur and continue for an extended period, this might not be the case. In addition, the President has not yet submitted a budget proposal for FY 2020 to Congress. If an annual appropriations bill is not enacted for FY 2020 or beyond, the U.S. Government may operate under a continuing resolution, restricting new contract or program starts and additional government shutdowns, which might involve all government agencies, could arise. In addition, continued budget uncertainty and the risk of future sequestration cuts remain unless the Budget Control Act is repealed or significantly modified.
The F-35 is our largest program and represented
27%
of our total net sales in
2018
and is expected to represent a higher percentage of our sales in future years. A decision to cut spending or reduce planned orders would have an adverse impact on our business and results of operations. Given the size and complexity of the F-35 program, we anticipate that there will be continual reviews related to aircraft performance, program schedule, cost, and requirements as part of the DoD, Congressional, and international partners’ oversight and budgeting processes. Current program challenges include, but are not limited to, supplier and partner performance (including the potential that a decision by the U.S. Government not to allow deliveries of aircraft to Turkey could disrupt the substantial supplier activity in our Turkish supply chain), software development, receiving funding for production contracts on a timely basis, executing future flight tests and findings resulting from testing and operating the aircraft, level of cost associated with life-cycle operations and sustainment and warranties and continuing to reduce the unit cost of producing aircraft and achieve cost targets.
Based upon our diverse range of defense, homeland security and information technology products and services, generally we believe that this makes it less likely that cuts in any specific contract or program will have a long-term effect on our business. However, termination of multiple or large programs or contracts could adversely affect our business and future financial performance. Potential changes in funding priorities may afford new or additional opportunities for our businesses in terms of existing, follow-on or replacement programs. While we would expect to compete and be well positioned as the incumbent on existing programs, we may not be successful or the replacement programs may be funded at lower levels.
9
We are subject to a number of procurement laws and regulations. Our business and reputation could be adversely affected if we fail to comply with these laws.
We must comply with and are affected by laws and regulations relating to the award, administration and performance of U.S. Government contracts. Government contract laws and regulations affect how we do business with our customers and impose certain risks and costs on our business. A violation of specific laws and regulations, by us, our employees, others working on our behalf, a supplier or a venture partner, could harm our reputation and result in the imposition of fines and penalties, the termination of our contracts, suspension or debarment from bidding on or being awarded contracts, loss of our ability to export products or services and civil or criminal investigations or proceedings.
In some instances, these laws and regulations impose terms or rights that are different from those typically found in commercial transactions. For example, the U.S. Government may terminate any of our government contracts and subcontracts either at its convenience or for default based on our performance. Upon termination for convenience of a fixed-price type contract, typically we are entitled to receive the purchase price for delivered items, reimbursement for allowable costs for work-in-process and an allowance for profit on the contract or adjustment for loss if completion of performance would have resulted in a loss.
Upon termination for convenience of a cost-reimbursable contract, we normally are entitled to reimbursement of allowable costs plus a portion of the fee where allowable costs include our cost to terminate agreements with our suppliers and subcontractors. The amount of the fee recovered, if any, is related to the portion of the work accomplished prior to termination and is determined by negotiation. We attempt to ensure that adequate funds are available by notifying the customer when its estimated costs, including those associated with a possible termination for convenience, approach levels specified as being allotted to its programs. As funds are typically appropriated on a fiscal year basis and as the costs of a termination for convenience may exceed the costs of continuing a program in a given fiscal year, occasionally programs do not have sufficient funds appropriated to cover the termination costs if the government were to terminate them for convenience. Under such circumstances, the U.S. Government could assert that it is not required to appropriate additional funding.
A termination arising out of our default may expose us to liability and have a material adverse effect on our ability to compete for future contracts and orders. In addition, on those contracts for which we are teamed with others and are not the prime contractor, the U.S. Government could terminate a prime contract under which we are a subcontractor, notwithstanding the quality of our services as a subcontractor. In the case of termination for default, the U.S. Government could make claims to reduce the contract value or recover its procurement costs and could assess other special penalties. However, under such circumstances we have rights and remedial actions under laws and the Federal Acquisition Regulation (FAR).
In addition, certain of our U.S. Government contracts span one or more base years and multiple option years. The U.S. Government generally has the right not to exercise option periods and may not exercise an option period for various reasons. However, the U.S. Government may exercise option periods, even for contracts for which it is expected that our costs may exceed the contract price or ceiling.
U.S. Government agencies, including the Defense Contract Audit Agency, the Defense Contract Management Agency and various agency Inspectors General, routinely audit and investigate government contractors. These agencies review a contractor’s performance under its contracts, its cost structure, its business systems and compliance with applicable laws, regulations and standards. The U.S. Government has the ability to decrease or withhold certain payments when it deems systems subject to its review to be inadequate. Additionally, any costs found to be misclassified may be subject to repayment. We have unaudited and/or unsettled incurred cost claims related to past years, which places risk on our ability to issue final billings on contracts for which authorized and appropriated funds may be expiring.
If an audit or investigation uncovers improper or illegal activities, we may be subject to civil or criminal penalties and administrative sanctions, including reductions of the value of contracts, contract modifications or terminations, forfeiture of profits, suspension of payments, penalties, fines and suspension, or prohibition from doing business with the U.S. Government. In addition, we could suffer serious reputational harm if allegations of impropriety were made against us. Similar government oversight exists in most other countries where we conduct business.
Our profitability and cash flow may vary based on the mix of our contracts and programs, our performance, our ability to control costs and evolving U.S. Government procurement policies.
Our profitability and cash flow may vary materially depending on the types of government contracts undertaken, the nature of products produced or services performed under those contracts, the costs incurred in performing the work, the achievement of other performance objectives and the stage of performance at which the right to receive fees is determined, particularly under award and incentive-fee contracts. Our backlog includes a variety of contract types and represents the sales we expect to recognize for our products and services in the future. Contract types primarily include fixed-price and cost-reimbursable contracts.
10
Under fixed-price contracts, we agree to perform the specified work for a pre-determined price. To the extent our actual costs vary from the estimates upon which the price was negotiated, we will generate more or less profit or could incur a loss. Some fixed-price contracts have a performance-based component under which we may earn incentive payments or incur financial penalties based on our performance.
Cost-reimbursable contracts provide for the payment of allowable costs incurred during performance of the contract plus a fee up to a ceiling based on the amount that has been funded. Typically, we enter into three types of cost-reimbursable contracts: cost-plus-award-fee, cost-plus-incentive-fee, and cost-plus-fixed-fee. Cost-plus-award-fee contracts provide for an award fee that varies within specified limits based on the customer’s assessment of our performance against a predetermined set of criteria, such as targets based on cost, quality, technical and schedule criteria. Cost-plus-incentive-fee contracts provide for reimbursement of costs plus a fee, which is adjusted by a formula based on the relationship of total allowable costs to total target costs (i.e., incentive based on cost) or reimbursement of costs plus an incentive to exceed stated performance targets (i.e., incentive based on performance). The fixed-fee in a cost-plus-fixed-fee contract is negotiated at the inception of the contract and that fixed-fee does not vary with actual costs.
Contracts for development programs with complex design and technical challenges are typically cost-reimbursable. In these cases, the associated financial risks primarily relate to a reduction in fees and the program could be canceled if cost, schedule or technical performance issues arise. Other contracts in backlog are for the transition from development to production (e.g., Low Rate Initial Production (LRIP) contracts), which includes the challenge of starting and stabilizing a manufacturing production and test line while the final design is being validated. These generally are cost-reimbursable or fixed-price incentive-fee contracts. Generally, if our costs exceed the contract target cost or are not allowable under the applicable regulations, we may not be able to obtain reimbursement for all costs and may have our fees reduced or eliminated. There are also contracts for production, as well as operations and maintenance of the delivered products, that have the challenge of achieving a stable production and delivery rate, while maintaining operability of the product after delivery. These contracts are mainly fixed-price.
The failure to perform to customer expectations and contract requirements may result in reduced fees or losses and affect our financial performance in that period. Under each type of contract, if we are unable to control costs, our operating results could be adversely affected, particularly if we are unable to justify an increase in contract value to our customers. Cost overruns or the failure to perform on existing programs also may adversely affect our ability to retain existing programs and win future contract awards.
The U.S. Government could implement policies that could negatively impact our profitability. Changes in procurement policy favoring more incentive-based fee arrangements, different award fee criteria or government contract negotiation offers based upon the customer’s view of what our costs should be (as compared to our actual costs) may affect the predictability of our profit rates. Our customers also may pursue non-traditional contract provisions in negotiation of contracts. In some circumstances, the U.S. Government is proposing positions that are inconsistent with the FAR and existing practice.
The DoD is currently seeking the views of experts and interested parties within the U.S. Government and the private sector regarding revising policies and procedures for contract financing, performance incentives, and associated regulations for DoD contracts and we have no assurance regarding what changes will be proposed, if any, and their impact on our working capital and cash flow. Earlier changes proposed by the DoD and later withdrawn would have had a negative impact on the timing of our cash flows.
Additionally, the U.S. Government is taking increasingly aggressive positions under the FAR and Defense Federal Acquisition Regulation Supplement (DFARS) both as to what intellectual property they believe government use rights apply and to acquire broad license rights. If the U.S. Government is successful in these efforts, this could affect our ability to compete and to obtain access to and use certain supplier intellectual property.
Increased competition and bid protests in a budget-constrained environment may make it more difficult to maintain our financial performance and customer relationships.
A substantial portion of our business is awarded through competitive bidding. The U.S. Government increasingly has relied upon competitive contract award types, including indefinite-delivery, indefinite-quantity and other multi-award contracts, which have the potential to create pricing pressure and increase our cost by requiring that we submit multiple bids and proposals. Multi-award contracts require that we make sustained efforts to obtain task orders under the contract. Additionally, recent competitive bids have not contained cost realism evaluation criteria leading to our competitors taking aggressive pricing positions. The competitive bidding process entails substantial costs and managerial time to prepare bids and proposals for contracts that may not be awarded to us or may be split among competitors. Additionally, the U.S. Government may fail to award us large competitive contracts in an effort to maintain a broader industrial base. Following award, we may encounter significant expenses, delays, contract modifications or bid protests from unsuccessful bidders on new program awards. Unsuccessful bidders may protest in
11
the hope of being awarded a subcontract for a portion of the work in return for withdrawing the protest. Bid protests could result in significant expenses to us, contract modifications or even loss of the contract award. Even where a bid protest does not result in the loss of a contract award, the resolution can extend the time until the contract activity can begin and, as a result, delay our recognizing sales. We also may not be successful in our efforts to protest or challenge any bids for contracts that were not awarded to us and we could incur significant time and expense in such efforts.
We are experiencing increased competition while, at the same time, many of our customers are facing budget pressures, trying to do more with less by cutting costs, identifying more affordable solutions, performing certain work internally rather than hiring a contractor, and reducing product development cycles. Recent acquisitions in our industry, particularly vertical integration by tier-1 prime contractors, could also result in increased competition. Therefore, it is critical we maintain strong customer relationships and seek to understand the priorities of their requirements in this price competitive environment.
In international sales, we face substantial competition from both U.S. manufacturers and international manufacturers whose governments sometime provide research and development assistance, marketing subsidies and other assistance for their products. Additionally, our competitors are also focusing on increasing their international sales. To remain competitive, we consistently must maintain strong customer relationships and provide superior performance, advanced technology solutions and service at an affordable cost and with the agility that our customers require to satisfy their mission objectives.
We are the prime contractor on most of our contracts and if our subcontractors, suppliers or teaming agreement or venture partners fail to perform their obligations, our performance and our ability to win future business could be harmed.
For most of our contracts we rely on other companies to provide materials, major components and products, and to perform a portion of the services that we provide to our customers. Such arrangements may involve subcontracts, teaming arrangements, ventures or supply agreements with other companies upon which we rely (contracting parties). There is a risk that the contracting party does not perform and we may have disputes with our contracting parties, including disputes regarding the quality and timeliness of work performed, the workshare provided to that party, customer concerns about the other party’s performance, our failure to extend existing task orders or issue new task orders, or our hiring the personnel of a subcontractor, teammate or venture partner or vice versa. In addition, changes in the economic environment, including defense budgets, trade sanctions and constraints on available financing, may adversely affect the financial stability of our contracting parties and their ability to meet their performance requirements or to provide needed supplies on a timely basis as might their inability to perform profitably in the current highly competitive and budget constrained environment. We could also be adversely affected by reputational issues experienced by our teammates that are outside of our control, which could adversely affect our ability to compete for contract awards. A failure, for whatever reason, by one or more of our contracting parties to provide the agreed-upon supplies or perform the agreed-upon services on a timely basis, according to specifications, or at all, may affect our ability to perform our obligations and require that we transition the work to other companies. Contracting party performance deficiencies may result in additional costs or delays in product deliveries and affect our operating results and could result in a customer terminating our contract for default or convenience. A default termination could expose us to liability and affect our ability to compete for future contracts and orders. Additionally, our efforts to increase the efficiency of our operations and improve the affordability of our products and services could negatively impact our ability to attract and retain suppliers.
International sales may pose different risks.
In
2018
,
28%
of our total net sales were from international customers. We have a strategy to continue to grow international sales, inclusive of sales of F-35 aircraft to our international partners and other countries. International sales are subject to numerous political and economic factors, regulatory requirements, significant competition, taxation, and other risks associated with doing business in foreign countries. Our exposure to such risks may further increase if our international sales grow as we anticipate.
Our international business is conducted through foreign military sales (FMS) to international customers or by direct commercial sales (DCS) to such customers. In
2018
, approximately
63%
of our sales to international customers were FMS and about
37%
were DCS. These transaction types differ as FMS transactions entail agreements between the U.S. Government and our international customers through which the U.S. Government purchases products or services from us on behalf of the foreign customer with our contract with the U.S. Government being subject to the FAR and the DFARS. In contrast, DCS transactions represent sales by us directly to international customers and are not subject to the FAR or the DFARS. All sales to international customers are subject to U.S. and foreign laws and regulations, including, without limitation, import-export control, technology transfer restrictions, investments, taxation, repatriation of earnings, exchange controls, the Foreign Corrupt Practices Act and other anti-corruption laws and regulations, and the anti-boycott provisions of the U.S. Export Administration Act. While we have stringent policies in place to comply with such laws and regulations, failure by us, our employees or others working on our behalf to comply with these laws and regulations could result in administrative, civil, or criminal liabilities, including suspension, debarment from bidding for or performing government contracts, or suspension of our export privileges, which could have a material adverse effect on us. We frequently team with international subcontractors and suppliers who are also exposed to similar risks.
12
While international sales, whether contracted as FMS or DCS, present risks that are different and potentially greater than those encountered in our U.S. business, DCS with international customers may impose even greater risks. DCS transactions involve direct commercial relationships with parties with whom we have less familiarity and where there may be significant cultural differences. Additionally, international procurement rules and regulations, contract laws and regulations, and contractual terms differ from those in the U.S. and are less familiar to us and may treat as criminal matters issues, which in the U.S. would be civil. International regulations may be interpreted by foreign courts less bound by precedent and with more discretion; these interpretations frequently have terms less favorable to us than the FAR. Export and import and currency risk also may be increased for DCS with international customers. While these risks are potentially greater than those encountered in our U.S. business, we seek to price our products and services commensurate with the risk profile on DCS with international customers.
Our international business is highly sensitive to changes in regulations (including tariffs, sanctions, embargoes, export and import controls and other trade restrictions), political environments or security risks that may affect our ability to conduct business outside of the U.S., including those regarding investment, procurement, taxation and repatriation of earnings. We continue to evaluate the potential effect of the United Kingdom’s (UK) planned departure from the European Union (EU) (commonly referred to as Brexit) on our business operations and financial results, including the impacts if the UK fails to reach an agreement with the EU on Brexit by the March 29, 2019 deadline. We anticipate that the most probable near-term effects are likely to reflect the pressure Brexit is placing on the UK government, which may influence the government’s ability to make decisions on large complex programs of the type we perform. Brexit may also have adverse tax effects on movement of products or sustainment activities between the UK and EU. Additionally, Brexit may impact the value of the pound sterling. If the pound sterling were to remain depressed against the U.S. dollar, this could negatively impact the ability of the UK government to afford our products. Currently, we do not anticipate that Brexit will have a material impact on our operations or our financial results. While we have operations in the UK, these operations have little activity between the UK and the EU (e.g., sales, supply chain, or reliance on personnel). Additionally, our practice is to substantially hedge all of our currency exposure. Therefore, we do not have material currency exposure to the pound sterling or the euro.
Additionally, Congress may act to prevent or impose conditions upon the sale or delivery of our products, such as F-35 aircraft to Turkey, and discussions in Congress may result in sanctions on the Kingdom of Saudi Arabia. Our international business also may be impacted by changes in foreign national priorities, foreign government budgets, global economic conditions, and fluctuations in foreign currency exchange rates. Sales of military products are also affected by defense budgets and U.S. foreign policy, including trade restrictions, and there could be significant delays or other issues in reaching definitive agreements for announced programs and international customer priorities could change. Additionally, the timing of orders from our international customers can be less predictable than for our U.S. customers and may lead to fluctuations in the amount reported each year for our international sales.
In conjunction with defense procurements, some international customers require contractors to comply with industrial cooperation regulations, including entering into industrial cooperation agreements, sometimes referred to as offset agreements. Recently, certain customers have increased their demands for greater offset commitment levels and higher-value content, including the transfer of technologies and local production and economic development. Expectations as to offset commitments may exceed existing local technical capability. Offset agreements may require in-country purchases, technology transfers, local manufacturing support, investments in foreign joint ventures and financial support projects as an incentive or as a condition to a contract award. In some countries, these offset agreements may require the establishment of a venture with a local company, which must control the venture. The costs to satisfy our offset obligations are included in the estimates of our total costs to complete the contract and may impact our profitability and cash flows. The ability to recover investments that we make is generally dependent upon the successful operation of ventures that we do not control and may involve products and services that are dissimilar to our business activities. In these and other situations, we could be liable for violations of law for actions taken by these entities such as laws related to anti-corruption, import and export, taxation, and anti-boycott restrictions. Offset agreements generally extend over several years and may provide for penalties in the event we fail to perform in accordance with the offset requirements which are typically subjective and can be outside our control.
Our efforts to minimize the likelihood and impact of adverse cybersecurity incidents and to protect data and intellectual property may not be successful and our business could be negatively affected by cyber or other security threats or other disruptions.
We routinely experience various cybersecurity threats, threats to our information technology infrastructure, unauthorized attempts to gain access to our company sensitive information, and denial-of-service attacks as do our customers, suppliers, subcontractors and venture partners. We have a Computer Incident Response Team (CIRT) which has among its responsibilities defending against such attacks. Additionally, we conduct regular periodic training of our employees as to the protection of sensitive
13
information which includes training intended to prevent the success of “phishing” attacks. We experience similar security threats at customer sites that we operate and manage.
The threats we face vary from attacks common to most industries to more advanced and persistent, highly organized adversaries, including nation states, which target us and other defense contractors because we protect national security information. If we are unable to protect sensitive information, including complying with evolving data privacy regulations, our customers or governmental authorities could question the adequacy of our threat mitigation and detection processes and procedures, and depending on the severity of the incident, our customers’ data, our employees’ data, our intellectual property, and other third party data (such as teammates, venture partners, subcontractors, suppliers and vendors) could be compromised. As a consequence of their persistence, sophistication and volume, we may not be successful in defending against all such attacks. Due to the evolving nature of these security threats and the national security aspects of much of the data we protect, the impact of any future incident cannot be predicted.
In addition to cyber threats, we experience threats to the security of our facilities and employees and threats from terrorist acts as do our customers, suppliers, subcontractors, venture partners and entities we acquire with whom we typically work cooperatively to seek to minimize the impact of cyber threats, other security threats or business disruptions. However, we must rely on the safeguards put in place by these entities, as well as other entities, which we do not control, who have access to our information, and may affect the security of our information. These entities have varying levels of cybersecurity expertise and safeguards, and their relationships with government contractors, such as Lockheed Martin, may increase the likelihood that they are targeted by the same cyber threats we face. We have approximately 16,000 direct suppliers and even more indirect suppliers with a wide variety of systems and cybersecurity capabilities and we may not be successful in preventing adversaries from exploiting possible weak links in our supply chain. We also must rely on this supply chain for detecting and reporting cyber incidents, which could affect our ability to report or respond to cybersecurity incidents in a timely manner.
The costs related to cyber or other security threats or disruptions may not be fully insured or indemnified by other means. Additionally, some cyber technologies we develop under contract for our customers, particularly those related to homeland security, may raise potential liabilities related to intellectual property and civil liberties, including privacy concerns, which may not be fully insured or indemnified by other means or involve reputational risk. Our enterprise risk management program includes threat detection and cybersecurity mitigation plans, and our disclosure controls and procedures address cybersecurity and include elements intended to ensure that there is an analysis of potential disclosure obligations arising from security breaches. We also maintain compliance programs to address the potential applicability of restrictions on trading while in possession of material, nonpublic information generally and in connection with a cybersecurity breach.
If we fail to manage acquisitions, divestitures, equity investments and other transactions successfully or if acquired entities or equity investments fail to perform as expected, our financial results, business and future prospects could be harmed.
In pursuing our business strategy, we routinely conduct discussions, evaluate companies, and enter into agreements regarding possible acquisitions, divestitures, ventures and other investments. We seek to identify acquisition or investment opportunities that will expand or complement our existing products and services or customer base, at attractive valuations. We often compete with other companies for the same opportunities. To be successful, we must conduct due diligence to identify valuation issues and potential loss contingencies; negotiate transaction terms; complete and close complex transactions; integrate acquired companies and employees; and realize anticipated operating synergies efficiently and effectively. Acquisition, divestiture, venture and investment transactions often require substantial management resources and have the potential to divert our attention from our existing business. Unidentified or identified but un-indemnified pre-closing liabilities could affect our future financial results, particularly successor liability under procurement laws and regulations such as the False Claims Act or Truth in Negotiations Act, anti-corruption, tax, import-export and technology transfer laws which provide for civil and criminal penalties and the potential for debarment. We also may incur unanticipated costs or expenses, including post-closing asset impairment charges, expenses associated with eliminating duplicate facilities, employee retention, transaction-related or other litigation, and other liabilities. Any of the foregoing could adversely affect our business and results of operations.
Ventures and other noncontrolling investments operate under shared control with other parties. Depending on our rights and percentage of ownership, we may consolidate the financial results of such entities or account for our interests under the equity method. Under the equity method of accounting for nonconsolidated ventures and investments, we recognize our share of the operating profit or loss of these ventures in our results of operations. Our operating results may be affected by the performance of businesses over which we do not exercise control, which includes the inability to prevent strategic decisions that may adversely affect our business, financial condition and results of operations. As a result, we may not be successful in achieving the growth or other intended benefits of strategic investments. Our joint ventures face many of the same risks and uncertainties as we do. The most significant impact of our equity investments is in our Space business segment where approximately
20%
of its
2018
operating profit was derived from its share of earnings from equity method investees, particularly that in United Launch Alliance (ULA).
14
During 2018, we recognized a non-cash asset impairment charge of
$110 million
related to our equity method investee, Advanced Military Maintenance, Repair and Overhaul Center LLC (AMMROC). We are continuing to monitor this investment, in light of ongoing performance, business base and economic issues and we may have to record our portion of additional charges, or an impairment of our investment, or both, should the carrying value of our investment exceed its fair value. See “
Note 1 – Significant Accounting Policies
” included in our Notes to Consolidated Financial Statements for additional information.
Additionally, through our Lockheed Martin Ventures Fund, we make investments in companies (both within the U.S. and in other countries) that we believe are developing disruptive technologies applicable to our core businesses and new initiatives important to Lockheed Martin. These investments may be in the forms of common or preferred stock, convertible debt securities or investments in funds. Typically, we hold a non-controlling interest and, therefore, are unable to influence strategic decisions by these companies and may have limited visibility into their activities, which may result in our not realizing the intended benefits of the investments. We have also begun investing in funds we believe invest in such companies. We have less influence and visibility as a non-controlling investor in a fund.
There can be no assurance that we will continue to increase our dividend or to repurchase shares of our common stock at current levels.
The payment of cash dividends and share repurchases is subject to limitations under applicable laws and the discretion of our Board of Directors and is determined after considering current conditions, including earnings, other operating results and capital requirements. Our payment of dividends and share repurchases could vary from historical practices or our stated expectations. Decreases in asset values or increases in liabilities, including liabilities associated with benefit plans and assets and liabilities associated with taxes, can reduce net earnings and stockholders’ equity. A deficit in stockholders’ equity could limit our ability to pay dividends and make share repurchases under Maryland state law in the future. In addition, the timing and amount of share repurchases under board approved share repurchase plans is within the discretion of management and will depend on many factors, including results of operations, capital requirements and applicable law.
Our business involves significant risks and uncertainties that may not be covered by indemnity or insurance.
A significant portion of our business relates to designing, developing and manufacturing advanced defense and technology products and systems. New technologies may be untested or unproven. Failure of some of these products and services could result in extensive loss of life or property damage. Accordingly, we may incur liabilities that are unique to our products and services. In some but not all circumstances, we may be entitled to certain legal protections or indemnifications from our customers, either through U.S. Government indemnifications under Public Law 85-804 or the Price-Anderson Act, qualification of our products and services by the Department of Homeland Security under the SAFETY Act provisions of the Homeland Security Act of 2002, contractual provisions or otherwise. We endeavor to obtain insurance coverage from established insurance carriers to cover these risks and liabilities. The amount of insurance coverage that we maintain may not be adequate to cover all claims or liabilities. Existing coverage may be canceled while we remain exposed to the risk and it is not possible to obtain insurance to protect against all operational risks, natural hazards and liabilities. For example, we are limited in the amount of insurance we can obtain to cover certain natural hazards such as earthquakes, fires or extreme weather conditions. We have significant operations in geographic areas prone to these risks, such as in California, Florida and Texas. Even if insurance coverage is available, we may not be able to obtain it at a price or on terms acceptable to us. Additionally, disputes with insurance carriers over coverage terms or the insolvency of one or more of our insurance carriers may significantly affect the amount or timing of our cash flows.
Substantial costs resulting from an accident; failure of or defect in our products or services; natural catastrophe or other incident; or liability arising from our products and services in excess of any legal protection, indemnity, and our insurance coverage (or for which indemnity or insurance is not available or not obtained) could adversely impact our financial condition, cash flows, or operating results. Any accident, failure of, or defect in our products or services, even if fully indemnified or insured, could negatively affect our reputation among our customers and the public and make it more difficult for us to compete effectively. It also could affect the cost and availability of adequate insurance in the future.
Pension funding and costs are dependent on several economic assumptions which if changed may cause our future earnings and cash flow to fluctuate significantly as well as affect the affordability of our products and services.
Many of our employees are covered by defined benefit pension plans, retiree medical and life insurance plans, and other postemployment plans (collectively, postretirement benefit plans). The impact of these plans on our earnings may be volatile in that the amount of expense we record for our postretirement benefit plans may materially change from year to year because the calculations are sensitive to changes in several key economic assumptions including interest rates and rates of return on plan assets, other actuarial assumptions including participant longevity (also known as mortality) and employee turnover, as well as the timing of cash funding. Changes in these factors, including actual returns on plan assets, may also affect our plan funding, cash flow and
15
stockholders’ equity. In addition, the funding of our plans and recovery of costs on our contracts, as described below, may also be subject to changes caused by legislative or regulatory actions.
With regard to cash flow, we make substantial cash contributions to our plans as required by the Employee Retirement Income Security Act of 1974 (ERISA), as amended by the Pension Protection Act of 2006 (PPA). We generally are able to recover these contributions related to our plans as allowable costs on our U.S. Government contracts, including FMS. During 2017, the revision to U.S. Government Cost Accounting Standards (CAS) rules to harmonize the measurement and period assignment of the pension cost allocable to government contracts with the PPA was fully transitioned. However, there is still a lag between the time when we contribute cash to our plans under pension funding rules and when we recover pension costs under CAS.
For more information on how these factors could impact earnings, financial position, cash flow and stockholders’ equity, see “Critical Accounting Policies - Postretirement Benefit Plans” in Management’s Discussion and Analysis of Financial Condition and Results of Operations and “
Note 11 – Postretirement Benefit Plans
” included in our Notes to Consolidated Financial Statements.
Environmental costs could affect our future earnings as well as the affordability of our products and services.
Our operations are subject to and affected by a variety of federal, state, local and foreign environmental protection laws and regulations. We are involved in environmental remediation at some of our facilities, some of our former facilities, and at third-party-owned sites where we have been designated a potentially responsible party. In addition, we could be affected by future regulations imposed or claims asserted in response to concerns over climate change, other aspects of the environment or natural resources. We have an ongoing, comprehensive sustainability program to reduce the effects of our operations on the environment.
We manage and have managed various U.S. Government-owned facilities on behalf of the U.S. Government. At such facilities, environmental compliance and remediation costs historically have been the responsibility of the U.S. Government. We have relied, and continue to rely with respect to past practices, upon U.S. Government funding to pay such costs, notwithstanding efforts by some U.S. Government representatives to limit this responsibility. Although the U.S. Government remains responsible for capital and operating costs associated with environmental compliance, responsibility for fines and penalties associated with environmental noncompliance typically is borne by either the U.S. Government or the contractor, depending on the contract and the relevant facts. Some environmental laws include criminal provisions. An environmental law conviction could affect our ability to be awarded future or perform under existing U.S. Government contracts.
We have incurred and will continue to incur liabilities under various federal, state, local and foreign statutes for environmental protection and remediation. The extent of our financial exposure cannot in all cases be reasonably estimated at this time. Among the variables management must assess in evaluating costs associated with these cases and remediation sites generally are the status of site assessment, extent of the contamination, impacts on natural resources, changing cost estimates, evolution of technologies used to remediate the site, continually evolving environmental standards and cost allowability issues, including varying efforts by the U.S. Government to limit allowability of our costs in resolving liability at third party-owned sites. For information regarding these matters, including current estimates of the amounts that we believe are required for environmental remediation to the extent probable and estimable, see “Critical Accounting Policies - Environmental Matters” in Management’s Discussion and Analysis of Financial Condition and Results of Operations and “
Note 14 – Legal Proceedings, Commitments and Contingencies
” included in our Notes to Consolidated Financial Statements.
We are involved in a number of legal proceedings. We cannot predict the outcome of litigation and other contingencies with certainty.
Our business may be adversely affected by the outcome of legal proceedings and other contingencies that cannot be predicted with certainty. As required by GAAP, we estimate loss contingencies and establish reserves based on our assessment of contingencies where liability is deemed probable and reasonably estimable in light of the facts and circumstances known to us at a particular point in time. Subsequent developments in legal proceedings may affect our assessment and estimates of the loss contingency recorded as a liability or as a reserve against assets in our financial statements. For a description of our current legal proceedings, see Item 3 - Legal Proceedings along with “
Note 14 – Legal Proceedings, Commitments and Contingencies
” included in our Notes to Consolidated Financial Statements.
Our success depends, in part, on our ability to develop new products and technologies, efficiently produce existing products and maintain a qualified workforce.
Many of the products and services we provide are highly engineered and involve sophisticated technologies with related complex manufacturing and system integration processes. Our customers’ requirements change and evolve regularly. Accordingly, our future performance depends, in part, on our ability to adapt to changing customer needs rapidly, identify emerging technological trends, develop and manufacture innovative products and services and bring those offerings to market quickly at cost-effective
16
prices. Due to the complex nature of the products and services we offer, we may experience technical difficulties during the development of new products or technologies. These technical difficulties could result in delays and higher costs, which may negatively impact our financial results, until such products or technologies are fully developed. See “
Note 1 – Significant Accounting Policies
” included in our Notes to Consolidated Financial Statements for further details about losses incurred on certain development programs. Additionally, there can be no assurance that our developmental projects will be successful or meet the needs of our customer.
Additionally, our competitors may develop new technology, or offerings, or more efficient ways to produce existing products that could cause our existing offerings to become obsolete. If we fail in our development projects or if our new products or technologies fail to achieve customer acceptance, our ability to procure new contracts could be unsuccessful and this could negatively impact our financial results.
Due to the specialized nature of our business, our future performance is highly dependent upon our ability to maintain a workforce with the requisite skills in multiple areas including: engineering, science, manufacturing, information technology, cybersecurity, business development and strategy and management. Our operating performance is also dependent upon personnel who hold security clearances and receive substantial training in order to work on certain programs or tasks. Additionally, as we expand our operations internationally, it is increasingly important to hire and retain personnel with relevant experience in local laws, regulations, customs, traditions and business practices.
We face a number of challenges that may affect personnel retention such as our endeavors to increase the efficiency of our operations and improve the affordability of our products and services such as workforce reductions and consolidating and relocating certain operations. Additionally, a substantial portion of our workforce (including personnel in leadership positions) are retirement-eligible or nearing retirement. We previously amended certain of our defined benefit pension plans for non-union employees to freeze future retirement benefits. The freeze, which will be completed January 1, 2020, may encourage retirement-eligible personnel (generally age 55 or older) to choose to retire earlier than anticipated.
To the extent that we lose experienced personnel, it is critical that we develop other employees, hire new qualified personnel, and successfully manage the transfer of critical knowledge. Competition for personnel is intense, and we may not be successful in hiring or retaining personnel with the requisite skills or clearances. We increasingly compete with commercial technology companies outside of the aerospace and defense industry for qualified technical, cyber and scientific positions as the number of qualified domestic engineers is decreasing and the number of cyber professionals is not keeping up with demand. To the extent that these companies grow at a faster rate or face fewer cost and product pricing constraints, they may be able to offer more attractive compensation and other benefits to candidates or our existing employees. To the extent that the demand for skilled personnel exceeds supply, we could experience higher labor, recruiting or training costs in order to attract and retain such employees; we could experience difficulty in performing our contracts if we were unable to do so. We also must manage leadership development and succession planning throughout our business. While we have processes in place for management transition and the transfer of knowledge, the loss of key personnel, coupled with an inability to adequately train other personnel, hire new personnel or transfer knowledge, could significantly impact our ability to perform under our contracts.
Approximately
21%
of our employees are covered by collective bargaining agreements with various unions. Historically, where employees are covered by collective bargaining agreements with various unions, we have been successful in negotiating renewals to expiring agreements without any material disruption of operating activities. However, this does not assure that we will be successful in our efforts to negotiate renewals of our existing collective bargaining agreements in the future. If we encounter difficulties with renegotiations or renewals of collective bargaining arrangements or are unsuccessful in those efforts, we could incur additional costs and experience work stoppages. Union actions at suppliers can also affect us. Any delays or work stoppages could adversely affect our ability to perform under our contracts, which could negatively impact our results of operations, cash flows, and financial condition.
Our estimates and projections may prove to be inaccurate and certain of our assets may be at risk of future impairment.
The accounting for some of our most significant activities is based on judgments and estimates, which are complex and subject to many variables. For example, accounting for sales using the percentage-of-completion method requires that we assess risks and make assumptions regarding schedule, cost, technical and performance issues for thousands of contracts, many of which are long-term in nature. Additionally, we initially allocate the purchase price of acquired businesses based on a preliminary assessment of the fair value of identifiable assets acquired and liabilities assumed. For significant acquisitions we may use a one-year measurement period to analyze and assess a number of factors used in establishing the asset and liability fair values as of the acquisition date and could result in adjustments to asset and liability balances.
We have
$10.8 billion
of goodwill assets recorded on our consolidated balance sheet as of
December 31, 2018
from previous acquisitions, which represents approximately
24%
of our total assets. These goodwill assets are subject to annual impairment
17
testing and more frequent testing upon the occurrence of certain events or significant changes in circumstances that indicate goodwill may be impaired. If we experience changes or factors arise that negatively affect the expected cash flows of a reporting unit, we may be required to write off all or a portion of the reporting unit’s related goodwill assets. The carrying value and fair value of our Sikorsky reporting unit are closely aligned. Therefore, any business deterioration, contract cancellations or terminations, or market pressures could cause our sales, earnings and cash flows to decline below current projections and could cause goodwill and intangible assets to be impaired. Additionally, Sikorsky may not perform as expected, or demand for its products may be adversely affected by global economic conditions, including oil and gas trends that are outside of our control.
Future changes in U.S. or foreign tax laws, including those with retroactive effect, and audits by tax authorities could result in unanticipated increases in our tax expense and affect profitability and cash flows.
The amount of net deferred tax assets will change periodically based on several factors, including the measurement of our postretirement benefit plan obligations, actual cash contributions to our postretirement benefit plans, and future changes in tax laws.
Actual financial results could differ from our judgments and estimates. See “Critical Accounting Policies” in Management’s Discussion and Analysis of Financial Condition and Results of Operations and “
Note 1 – Significant Accounting Policies
” included in our Notes to Consolidated Financial Statements for a complete discussion of our significant accounting policies and use of estimates.
ITEM 1B. Unresolved Staff Comments
None.
ITEM 2.
Properties
At
December 31, 2018
, we owned or leased building space (including offices, manufacturing plants, warehouses, service centers, laboratories and other facilities) at approximately 380 locations primarily in the U.S. Additionally, we manage or occupy approximately 15 government-owned facilities under lease and other arrangements. At
December 31, 2018
, we had significant operations in the following locations:
|
•
|
Aeronautics
- Palmdale, California; Marietta, Georgia; Greenville, South Carolina; and Fort Worth, Texas.
|
|
•
|
Missiles and Fire Control
- Camden, Arkansas; Ocala and Orlando, Florida; Lexington, Kentucky; and Grand Prairie, Texas.
|
|
•
|
Rotary and Mission Systems
- Colorado Springs, Colorado; Shelton and Stratford, Connecticut; Orlando and Jupiter, Florida; Moorestown/Mt. Laurel, New Jersey; Owego and Syracuse, New York; Manassas, Virginia; and Mielec, Poland.
|
|
•
|
Space
- Sunnyvale, California; Denver, Colorado; Valley Forge, Pennsylvania; and Reading, England.
|
|
•
|
Corporate activities
- Bethesda, Maryland.
|
The following is a summary of our square feet of floor space owned, leased, or utilized by business segment at
December 31, 2018
(in millions):
|
Owned
|
Leased
|
Government-
Owned
|
Total
|
|||||||||||||
|
Aeronautics
|
5.0
|
|
2.2
|
|
14.4
|
|
21.6
|
|
||||||||
|
Missiles and Fire Control
|
6.4
|
|
2.8
|
|
1.8
|
|
11.0
|
|
||||||||
|
Rotary and Mission Systems
|
11.1
|
|
6.5
|
|
0.5
|
|
18.1
|
|
||||||||
|
Space
|
8.7
|
|
2.0
|
|
5.4
|
|
16.1
|
|
||||||||
|
Corporate activities
|
2.6
|
|
0.9
|
|
—
|
|
3.5
|
|
||||||||
|
Total
|
33.8
|
|
14.4
|
|
22.1
|
|
70.3
|
|
||||||||
We believe our facilities are in good condition and adequate for their current use. We may improve, replace or reduce facilities as considered appropriate to meet the needs of our operations.
18
ITEM 3.
Legal Proceedings
We are a party to or have property subject to litigation and other proceedings that arise in the ordinary course of our business, including matters arising under provisions relating to the protection of the environment and are subject to contingencies related to certain businesses we previously owned. These types of matters could result in fines, penalties, compensatory or treble damages or non-monetary sanctions or relief. We believe the probability is remote that the outcome of each of these matters
will have a material adverse effect on the corporation as a whole, notwithstanding that the unfavorable resolution of any matter may have a material effect on our net earnings in any particular interim reporting period.
We cannot predict the outcome of legal or other proceedings with certainty.
We are subject to federal, state, local and foreign requirements for protection of the environment, including those for discharge of hazardous materials and remediation of contaminated sites. Due in part to the complexity and pervasiveness of these requirements, we are a party to or have property subject to various lawsuits, proceedings and remediation obligations. The extent of our financial exposure cannot in all cases be reasonably estimated at this time.
For information regarding the matters discussed above, including current estimates of the amounts that we believe are required for remediation or clean-up to the extent estimable, see “Critical Accounting Policies - Environmental Matters” in Management’s Discussion and Analysis of Financial Condition and Results of Operations and “
Note 14 – Legal Proceedings, Commitments and Contingencies
” included in our Notes to Consolidated Financial Statements.
As a U.S. Government contractor, we are subject to various audits and investigations by the U.S. Government to determine whether our operations are being conducted in accordance with applicable regulatory requirements. U.S. Government investigations of us, whether relating to government contracts or conducted for other reasons, could result in administrative, civil, or criminal liabilities, including repayments, fines or penalties being imposed upon us, suspension, proposed debarment, debarment from eligibility for future U.S. Government contracting, or suspension of export privileges. Suspension or debarment could have a material adverse effect on us because of our dependence on contracts with the U.S. Government. U.S. Government investigations often take years to complete and many result in no adverse action against us. We also provide products and services to customers outside of the U.S., which are subject to U.S. and foreign laws and regulations and foreign procurement policies and practices. Our compliance with local regulations or applicable U.S. Government regulations also may be audited or investigated.
ITEM 4. Mine Safety Disclosures
Not applicable.
19
ITEM 4(a). Executive Officers of the Registrant
Our executive officers as of
February 8, 2019
are listed below, with their ages on that date, positions and offices currently held, and principal occupation and business experience during at least the last five years. There were no family relationships among any of our executive officers and directors. All officers serve at the discretion of the Board of Directors.*
Richard F. Ambrose (age 60), Executive Vice President - Space
Mr. Ambrose has served as Executive Vice President of Space since April 2013.
Dale P. Bennett (age 62), Executive Vice President - Rotary and Mission Systems
Mr. Bennett has served as Executive Vice President of Rotary and Mission Systems since December 2012.
Brian P. Colan (age 58), Vice President, Controller, and Chief Accounting Officer
Mr. Colan has served as Vice President, Controller, and Chief Accounting Officer since August 2014. He previously served as Vice President and Controller, Missiles and Fire Control from January 2013 to August 2014.
Michele A. Evans (age 53), Executive Vice President - Aeronautics
Ms. Evans has served as Executive Vice President of Aeronautics since October 2018. She previously served as Deputy Executive Vice President of Aeronautics from June 2018 to September 2018. Prior to that, she served as Vice President and General Manager, Integrated Warfare Systems and Sensors business in our Rotary and Missions Systems (RMS) segment from November 2016 to June 2018; and Vice President and General Manager, Undersea Systems business in our RMS segment from December 2013 to November 2016.
Marillyn A. Hewson (age 65), Chairman, President and Chief Executive Officer
Ms. Hewson has served as Chairman, President and Chief Executive Officer of Lockheed Martin since January 2014. Prior to that, she has served over 30 years at Lockheed Martin in roles of increasing responsibility.
Maryanne R. Lavan (age 59), Senior Vice President, General Counsel and Corporate Secretary
Ms. Lavan has served as Senior Vice President and General Counsel since June 2010 and Corporate Secretary since September 2010.
John W. Mollard (age 61), Vice President and Treasurer
Mr. Mollard has served as Vice President and Treasurer since April 2016. He previously served as Vice President, Corporate Financial Planning and Analysis from 2003 to April 2016.
Frank St. John (age 52), Executive Vice President - Missiles and Fire Control
Mr. St. John has served as Executive Vice President of Missiles and Fire Control since January 2018. He previously served as Executive Vice President and Deputy, Programs at our Missiles and Fire Control (MFC) segment from June 2017 to January 2018. Prior to that, he served as Vice President, Orlando Operations and Tactical Missiles/Combat Maneuver Systems business in our MFC segment from 2011 to May 2017.
Bruce L. Tanner (age 59), Executive Vice President and Chief Financial Officer
Mr. Tanner has served as Executive Vice President and Chief Financial Officer since September 2007.
|
*
|
As previously announced, Bruce L. Tanner is retiring from Lockheed Martin Corporation in 2019. Effective February 11, 2019, Kenneth R. Possenriede will become Executive Vice President and Chief Financial Officer. Mr. Possenriede (age 59) has served as Vice President of Finance and Program Management at Aeronautics since April 2016. Prior to that, he served as Vice President and Treasurer from July 2011 through April 2016.
|
20
PART II
|
ITEM 5.
|
Market for Registrant’s Common Equity, Related Stockholder Matters and Issuer Purchases of Equity Securities
|
At January 25, 2019, we had 26,812 holders of record of our common stock, par value $1 per share. Our common stock is traded on the New York Stock Exchange (NYSE) under the symbol LMT. Information concerning dividends paid on Lockheed Martin common stock during the past two years is as follows:
Common Stock - Dividends Paid Per Share
|
|
Dividends Paid Per Share
|
|||||||
|
Quarter
|
2018
|
|
2017
|
|
||||
|
First
|
$
|
2.00
|
|
$
|
1.82
|
|
||
|
Second
|
2.00
|
|
1.82
|
|
||||
|
Third
|
2.00
|
|
1.82
|
|
||||
|
Fourth
|
2.20
|
|
2.00
|
|
||||
|
Year
|
$
|
8.20
|
|
$
|
7.46
|
|
||
Stockholder Return Performance Graph
The following graph compares the total return on a cumulative basis of $100 invested in Lockheed Martin common stock on December 31,
2013
to the Standard and Poor’s (S&P) 500 Index and the S&P Aerospace & Defense Index.
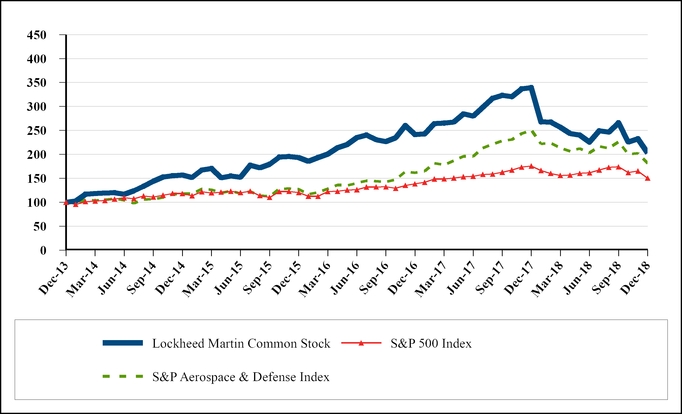
The S&P Aerospace & Defense Index comprises Arconic Inc., General Dynamics Corporation, Harris Corporation, Huntington Ingalls Industries, L3 Technologies, Inc., Lockheed Martin Corporation, Northrop Grumman Corporation, Raytheon Company, Textron Inc., The Boeing Company, Transdigm Group Inc., and United Technologies Corporation. The stockholder return performance indicated on the graph is not a guarantee of future performance.
21
This graph is not deemed to be “filed” with the U.S. Securities and Exchange Commission or subject to the liabilities of Section 18 of the Securities Exchange Act of 1934 (the Exchange Act), and should not be deemed to be incorporated by reference into any of our prior or subsequent filings under the Securities Act of 1933 or the Exchange Act.
Purchases of Equity Securities
There were no sales of unregistered equity securities during the quarter ended
December 31, 2018
.
The following table provides information about our repurchases of our common stock registered pursuant to Section 12 of the Exchange Act during the quarter ended
December 31, 2018
.
|
Period
(a)
|
Total
Number of
Shares
Purchased
|
Average
Price Paid
Per Share
|
Total Number of
Shares Purchased
as Part of Publicly
Announced Plans
or Programs
(b)
|
Amount
Available for
Future Share
Repurchases
Under the
Plans or
Programs (b) |
||||||||||
|
|
|
|
(in millions)
|
|||||||||||
|
October 1, 2018 – October 28, 2018
|
688,729
|
|
$
|
323.55
|
|
688,579
|
|
$
|
3,454
|
|
||||
|
October 29, 2018 – November 25, 2018
|
1,125,685
|
|
$
|
294.14
|
|
1,125,665
|
|
$
|
3,123
|
|
||||
|
November 26, 2018 – December 31, 2018
|
401,685
|
|
$
|
286.52
|
|
392,420
|
|
$
|
3,010
|
|
||||
|
Total
|
2,216,099
|
|
(c)
|
$
|
301.90
|
|
2,206,664
|
|
|
|
||||
|
(a)
|
We close our books and records on the last Sunday of each month to align our financial closing with our business processes, except for the month of December, as our fiscal year ends on December 31. As a result, our fiscal months often differ from the calendar months. For example, October 29,
2018
was the first day of our November
2018
fiscal month.
|
|
(b)
|
In October 2010, our Board of Directors approved a share repurchase program pursuant to which we are authorized to repurchase our common stock in privately negotiated transactions or in the open market at prices per share not exceeding the then-current market prices. From time to time, our Board of Directors authorizes increases to our share repurchase program. The total remaining authorization for future common share repurchases under our share repurchase program was
$3.0 billion
as of
December 31, 2018
. Under the program, management has discretion to determine the dollar amount of shares to be repurchased and the timing of any repurchases in compliance with applicable law and regulation. This includes purchases pursuant to Rule 10b5-1 plans, including accelerated share repurchases. The program does not have an expiration date.
|
|
(c)
|
During the quarter ended
December 31, 2018
, the total number of shares purchased included 9,435 shares that were transferred to us by employees in satisfaction of tax withholding obligations associated with the vesting of restricted stock units. These purchases were made pursuant to a separate authorization by our Board of Directors and are not included within the program.
|
22
ITEM 6.
Selected Financial Data
|
(In millions, except per share data)
|
2018
|
|
2017
|
|
2016
|
|
2015
|
|
2014
|
|
||||||||||
|
Operating results
(a)
|
||||||||||||||||||||
|
Net sales
|
$
|
53,762
|
|
$
|
49,960
|
|
$
|
47,290
|
|
$
|
40,536
|
|
$
|
39,946
|
|
|||||
|
Operating profit
(b)(c)(d)
|
7,334
|
|
6,744
|
|
5,888
|
|
5,233
|
|
5,445
|
|
||||||||||
|
Net earnings from continuing operations
(b)(c)(d)(e)
|
5,046
|
|
1,890
|
|
3,661
|
|
3,126
|
|
3,253
|
|
||||||||||
|
Net earnings from discontinued operations
(f)
|
—
|
|
73
|
|
1,512
|
|
479
|
|
361
|
|
||||||||||
|
Net earnings
(c)(d)(e)
|
5,046
|
|
1,963
|
|
5,173
|
|
3,605
|
|
3,614
|
|
||||||||||
|
Earnings from continuing operations per common share
|
||||||||||||||||||||
|
Basic
(b)(c)(d)(e)
|
17.74
|
|
6.56
|
|
12.23
|
|
10.07
|
|
10.27
|
|
||||||||||
|
Diluted
(b)(c)(d)(e)
|
17.59
|
|
6.50
|
|
12.08
|
|
9.93
|
|
10.09
|
|
||||||||||
|
Earnings from discontinued operations per common share
|
||||||||||||||||||||
|
Basic
|
—
|
|
0.26
|
|
5.05
|
|
1.55
|
|
1.14
|
|
||||||||||
|
Diluted
|
—
|
|
0.25
|
|
4.99
|
|
1.53
|
|
1.12
|
|
||||||||||
|
Earnings per common share
|
||||||||||||||||||||
|
Basic
(c)(d)(e)
|
17.74
|
|
6.82
|
|
17.28
|
|
11.62
|
|
11.41
|
|
||||||||||
|
Diluted
(c)(d)(e)
|
17.59
|
|
6.75
|
|
17.07
|
|
11.46
|
|
11.21
|
|
||||||||||
|
Cash dividends declared per common share
|
$
|
8.20
|
|
$
|
7.46
|
|
$
|
6.77
|
|
$
|
6.15
|
|
$
|
5.49
|
|
|||||
|
Balance sheet
(a)(g)
|
||||||||||||||||||||
|
Cash, cash equivalents and short-term investments
(c)
|
$
|
772
|
|
$
|
2,861
|
|
$
|
1,837
|
|
$
|
1,090
|
|
$
|
1,446
|
|
|||||
|
Total current assets
(h)
|
16,103
|
|
17,505
|
|
14,780
|
|
14,573
|
|
10,684
|
|
||||||||||
|
Goodwill
(i)
|
10,769
|
|
10,807
|
|
10,764
|
|
10,695
|
|
7,964
|
|
||||||||||
|
Total assets
(c)(h)(i)
|
44,876
|
|
46,620
|
|
47,560
|
|
49,304
|
|
37,190
|
|
||||||||||
|
Total current liabilities
(h)
|
14,398
|
|
12,913
|
|
12,456
|
|
13,918
|
|
10,954
|
|
||||||||||
|
Total debt, net
(j)
|
14,104
|
|
14,263
|
|
14,282
|
|
15,261
|
|
6,142
|
|
||||||||||
|
Total liabilities
(c)(h)(j)
|
43,427
|
|
47,396
|
|
46,083
|
|
46,207
|
|
33,790
|
|
||||||||||
|
Total equity (deficit)
(c)(e)
|
1,449
|
|
(776
|
)
|
1,477
|
|
3,097
|
|
3,400
|
|
||||||||||
|
Common shares in stockholders’ equity at year-end
|
281
|
|
284
|
|
289
|
|
303
|
|
314
|
|
||||||||||
|
Cash flow information
|
||||||||||||||||||||
|
Net cash provided by operating activities
(c)(k)
|
$
|
3,138
|
|
$
|
6,476
|
|
$
|
5,189
|
|
$
|
5,101
|
|
$
|
3,866
|
|
|||||
|
Net cash used for investing activities
(l)
|
(1,075
|
)
|
(1,147
|
)
|
(985
|
)
|
(9,734
|
)
|
(1,723
|
)
|
||||||||||
|
Net cash (used for) provided by financing activities
(m)
|
(4,152
|
)
|
(4,305
|
)
|
(3,457
|
)
|
4,277
|
|
(3,314
|
)
|
||||||||||
|
Backlog
(a)(n)
|
$
|
130,468
|
|
$
|
105,493
|
|
$
|
103,458
|
|
$
|
94,756
|
|
$
|
74,500
|
|
|||||
|
(a)
|
Amounts for 2015 and 2014 do not reflect the impact of the adoption of Accounting Standards Update (ASU) 2014-09,
Revenue from Contracts with Customers (Topic 606)
, as amended, in the first quarter of 2018 (see “
Note 1 – Significant Accounting Policies
” included in our Notes to Consolidated Financial Statements).
|
|
(b)
|
Our operating profit and net earnings from continuing operations and earnings per share from continuing operations were affected by severance and restructuring charges of $96 million ($76 million, or $0.26 per share, after tax) in 2018, severance charges of $80 million ($52 million or $0.17 per share, after tax) in 2016; severance charges of $82 million ($53 million or $0.17 per share, after tax) in 2015. See “
Note 15 – Severance and Restructuring Charges
” included in our Notes to Consolidated Financial Statements for a discussion of 2018 and 2016 severance and restructuring charges.
|
|
(c)
|
The impact of our postretirement benefit plans can cause our operating profit, net earnings, cash flows and certain amounts recorded on our consolidated balance sheets to fluctuate. Accordingly, our net earnings were affected by a net FAS/CAS pension adjustment of
$1.0 billion
in
2018
,
$876 million
in
2017
,
$902 million
in
2016
, $400 million in
2015
, and $317 million in
2014
. We made pension contributions of $5.0 billion in 2018, $46 million in 2017, $23 million in 2016, $5 million in 2015 (for our Sikorsky plan) and $2.0 billion in 2014 (for our legacy plans), and these contributions caused fluctuations in our operating cash flows and cash balance between each of those years. See “Critical Accounting Policies - Postretirement Benefit Plans” in Management’s Discussion and Analysis of Financial Condition and Results of Operations for more information.
|
|
(d)
|
In 2017, we recorded a previously deferred non-cash gain of
$198 million
related to properties sold in 2015 as a result of completing our remaining obligations, which increased net earnings from continuing operations by
$122 million
(
$0.42
per share).
|
|
(e)
|
In 2017, we recorded a net one-time tax charge of
$2.0 billion
(
$6.77
per share)
, substantially all of which was non-cash, primarily related to the estimated impact of the
Tax Cuts and Jobs Act (see “
Note 9 – Income Taxes
” included in our Notes to Consolidated Financial Statements). This charge along with our annual re-measurement adjustment related to our postretirement benefit plans of $1.4 billion resulted in a deficit in our total equity as of December 31, 2017.
|
23
|
(f)
|
Our net earnings from discontinued operations includes a $1.2 billion net gain in 2016 related to the divestiture of our IS&GS business.
|
|
(g)
|
Certain prior period amounts have been reclassified to conform to current year presentation.
|
|
(h)
|
Included in total current assets are assets of discontinued operations of $1.0 billion in 2015 and $900 million in 2014. Included in total current liabilities are liabilities of discontinued operations of $900 million in both 2015 and 2014. Included in total assets are assets of discontinued operations of $4.1 billion in 2015 and $4.2 billion in 2014. Included in total liabilities are liabilities of discontinued operations of $1.2 billion in both 2015 and 2014.
|
|
(i)
|
The increase in our goodwill and total assets from 2014 to 2015 was primarily attributable to the Sikorsky acquisition, which resulted in an increase in goodwill and total assets as of December 31, 2015 of $2.8 billion and $11.7 billion, respectively.
|
|
(j)
|
The increase in our total debt and total liabilities from 2014 to 2015 was primarily a result of the debt incurred to fund the Sikorsky acquisition, as well as the issuance of debt in February of 2015 for general corporate purposes.
|
|
(k)
|
The fluctuations in our net cash provided by operating activities between years
2014
to
2018
were due to changes in pension contributions, working capital and tax payments made. See “Liquidity and Cash Flows” in Management’s Discussion and Analysis of Financial Condition and Results of Operations for more information.
|
|
(l)
|
The increase in our cash used for investing activities in 2015 was attributable to acquisitions of businesses, including the $9.0 billion acquisition of Sikorsky in 2015, net of cash acquired.
|
|
(m)
|
The increase in our cash provided by financing activities in 2015 was primarily a result of the debt incurred to fund the Sikorsky acquisition.
|
|
(n)
|
Backlog at December 31, 2015 includes approximately $15.6 billion related to Sikorsky and excludes backlog at December 31, 2015 and 2014 of $4.8 billion and $6.0 billion related to our IS&GS business, which we divested in 2016.
|
24
ITEM 7.
Management’s Discussion and Analysis of Financial Condition and Results of Operations
Business Overview
We are a global security and aerospace company principally engaged in the research, design, development, manufacture, integration and sustainment of advanced technology systems, products and services. We also provide a broad range of management, engineering, technical, scientific, logistics, system integration and cybersecurity services. We serve both U.S. and international customers with products and services that have defense, civil and commercial applications, with our principal customers being agencies of the U.S. Government. In
2018
,
70%
of our
$53.8 billion
in net sales were from the U.S. Government, either as a prime contractor or as a subcontractor (including
60%
from the Department of Defense (DoD)),
28%
were from international customers (including foreign military sales (FMS) contracted through the U.S. Government) and
2%
were from U.S. commercial and other customers. Our main areas of focus are in defense, space, intelligence, homeland security and information technology, including cybersecurity.
We operate in four business segments: Aeronautics, Missiles and Fire Control (MFC), Rotary and Mission Systems (RMS) and Space. We organize our business segments based on the nature of the products and services offered.
We operate in an environment characterized by both complexity in global security and continuing economic pressures in the U.S. and globally. A significant component of our strategy in this environment is to focus on program execution, improving the quality and predictability of the delivery of our products and services, and placing security capability quickly into the hands of our U.S. and international customers at affordable prices. Recognizing that our customers are resource constrained, we are endeavoring to develop and extend our portfolio domestically in a disciplined manner with a focus on adjacent markets close to our core capabilities, as well as growing our international sales. We continue to focus on affordability initiatives. We also expect to continue to innovate and invest in technologies to fulfill new mission requirements for our customers and invest in our people so that we have the technical skills necessary to succeed
without limiting our ability to return a substantial portion of our free cash flow to our investors in the form of dividends and share repurchases. We define free cash flow as cash from operations as determined under U.S. generally accepted accounting principles (GAAP), less capital expenditures as presented on our consolidated statements of cash flows.
2019
Financial Trends
We expect our 2019 net sales to increase in the mid-single digit range from 2018 levels. The projected growth is driven by increased production and sustainment on the F-35 program at Aeronautics and key contract awards and increased volume in the tactical and strike missiles business at MFC. Total business segment operating profit margin in 2019 is expected to be approximately 10.8%; and cash from operations is expected to be greater than or equal to $7.4 billion. The preliminary outlook for 2019 assumes the U.S. Government continues to support and fund our key programs. Changes in circumstances may require us to revise our assumptions, which could materially change our current estimate of 2019 net sales, operating margin and cash flows.
We expect the net 2019 FAS/CAS pension benefit to be approximately
$1.5
billion based on a
4.25%
discount rate (a 62.5 basis point increase from the end of 2017), a negative
5.00%
return on plan assets in 2018, a 7.00% expected long-term rate of return on plan assets in future years (a 50 basis point decrease from the end of 2017), and the revised longevity assumptions released during the fourth quarter of 2018 by the Society of Actuaries. As a result of our $5.0 billion in contributions to our qualified defined benefit pension plans in 2018, we do not expect to make contributions to our qualified defined benefit pension plans in 2019.
Portfolio Shaping Activities
We continuously strive to strengthen our portfolio of products and services to meet the current and future needs of our customers. We accomplish this in part by our independent research and development activities and through acquisition, divestiture and internal realignment activities.
We selectively pursue the acquisition of businesses and investments at attractive valuations that will expand or complement our current portfolio and allow access to new customers or technologies. We also may explore the divestiture of businesses that no longer meet our needs or strategy or that could perform better outside of our organization. In pursuing our business strategy, we routinely conduct discussions, evaluate targets and enter into agreements regarding possible acquisitions, divestitures, ventures and equity investments.
25
Divestiture of the Information Systems & Global Solutions Business
On August 16, 2016, we divested our former Information Systems & Global Solutions (IS&GS) business, which merged with Leidos Holdings, Inc. (Leidos), in a Reverse Morris Trust transaction (the “Transaction”).
As a result of the Transaction, we recognized a net gain of approximately
$1.3 billion
, including
$1.2 billion
recognized in 2016. In 2017, we recognized an additional gain of
$73 million
, which reflects certain post-closing adjustments, including certain tax adjustments and the final determination of net working capital.
For additional information, see “
Note 3 – Acquisition and Divestitures
” included in our Notes to Consolidated Financial Statements.
Consolidation of AWE Management Limited
On August 24, 2016, we increased our ownership interest in the AWE Management Limited (AWE) joint venture, which operates the United Kingdom’s nuclear deterrent program, from
33%
to
51%
. Consequently, we began consolidating AWE and our operating results include
100%
of AWE’s sales and
51%
of its operating profit. Prior to increasing our ownership interest, we accounted for our investment in AWE using the equity method of accounting. Under the equity method, we recognized only
33%
of AWE’s earnings or losses and
no
sales. Accordingly, prior to August 24, 2016, the date we obtained control, we recorded
33%
of AWE’s net earnings in our operating results and subsequent to August 24, 2016, we recognized 100% of AWE’s sales and 51% of its operating profit.
For additional information, see “
Note 3 – Acquisition and Divestitures
” included in our Notes to Consolidated Financial Statements.
Industry Considerations
U.S. Government Funding
For the first time in nearly a decade, the DoD began the government fiscal year (FY) with a full-year appropriation. Congress passed, and the President signed into law an appropriation act that provides $685 billion in funding for the DoD for FY 2019, which is comprised of $617 billion in base funding and $68 billion for the Overseas Contingency Operations (OCO) account to support the Global War on Terrorism (GWOT). The appropriation adheres to the Bipartisan Budget Act of 2018 (BBA of 2018), which provided an additional $80 billion for national defense over two years in FY 2018 and FY 2019. However, the U.S. Government has not yet passed full-year appropriations for all agencies. A majority of U.S. Government agencies operated under continuing resolution funding measures through December 21, 2018. Congress was unable to reach an agreement on full-year appropriations prior to its expiration. Consequently, a majority of U.S. Government agencies were shutdown through January 25, 2019 when an agreement was reached to provide funding under a continuing resolution funding measure through February 15, 2019. These agencies may be subject to future shutdowns if new appropriations are not passed prior to the expiration of the current continuing resolution.
The President has not yet submitted the budget proposal for FY 2020 to Congress due to administrative delays associated with the partial government shutdown that began on December 22, 2018 and ended on January 25, 2019. Once submitted, Congress must approve or revise the President’s FY 2020 budget proposal through enactment of appropriations bills and other policy legislation, which would then require final approval from the President.
Currently, U.S. defense spending in FY 2020 and FY 2021 remains subject to statutory spending limits established by the Budget Control Act of 2011 (Budget Control Act). The Budget Control Act spending limits were modified for fiscal years 2013 through 2019 by the American Taxpayer Relief Act of 2012, the Bipartisan Budget Act of 2013, the Bipartisan Budget Act of 2015, and most recently the BBA of 2018. However, these acts do not alter the spending limits beyond FY 2019. As currently enacted, the Budget Control Act limits defense spending to $576 billion (including approximately $550 billion for DoD) for FY 2020 with a modest increase to $590 billion (including approximately $563 billion for DoD) in 2021. The President’s defense budget estimates for FY 2020 and beyond exceed the spending limits established by the Budget Control Act. As a result, continued budget uncertainty and the risk of future sequestration cuts remain unless the Budget Control Act is repealed or significantly modified. See also the discussion of U.S. Government funding risks within Item 1A - Risk Factors.
26
International Business
A key component of our strategic plan is to grow our international sales. To accomplish this growth, we continue to focus on strengthening our relationships internationally through partnerships and joint technology efforts. We conduct business with international customers through each of our business segments through either FMS or direct sales to international customers.
International customers accounted for
36%
of Aeronautics’
2018
net sales. There continues to be strong international interest in the F-35 program, which includes commitments from the U.S. Government and eight international partner countries and four international customers, as well as expressions of interest from other countries. The U.S. Government and the eight partner countries continue to work together on the design, testing, production, and sustainment of the F-35 program. The international commitment to the program continues to grow. During 2018, the government of Belgium announced its decision to purchase 34 F-35 aircraft. Additionally in 2018, we finalized the Low Rate Initial Production (LRIP) 11 contract with the DoD at $11.5 billion of funding for the production of 141 F-35 aircraft. This award includes international F-35 partners and FMS customers. Other areas of international expansion at our Aeronautics business segment include the F-16 program. During 2018, we received a $1.1 billion contract from the U.S. Government to produce 16 new production F-16 Block 70 aircraft for the Royal Bahraini Air Force. The Undefinitized Contract Action (UCA) award represents the first F-16 Block 70 sale and the first F-16 production program to be performed in Greenville, South Carolina. Additionally, in December 2018, Slovakia signed a Letter of Offer and Acceptance (LOA) to procure 14 new production F-16 Block 70/72 aircraft and we were awarded a contract to upgrade 84 F-16 aircraft for the Greek Ministry of Defence.
In
2018
, international customers accounted for
26%
of MFC’s net sales. Our MFC business segment continues to generate significant international interest, most notably in the air and missile defense product line, which produces the Patriot Advanced Capability-3 (PAC-3) and Terminal High Altitude Area Defense (THAAD) systems. The PAC-3 is an advanced missile defense system designed to intercept incoming airborne threats. We have ongoing PAC-3 programs for production and sustainment activities in the Kingdom of Saudi Arabia, UAE, Qatar, the Republic of Korea, Japan and Taiwan. Additionally during 2018, the U.S. and Swedish officials formalized an agreement to provide PAC-3 missiles to Sweden. THAAD is an integrated system designed to protect against high altitude ballistic missile threats. UAE is an international customer for THAAD, and other countries in the Middle East, Europe and the Asia-Pacific region have also expressed interest in our air and missile defense systems, including the Kingdom of Saudi Arabia. Additionally, we continue to see international demand for our tactical missile and fire control products, where we received orders for Hellfire missile systems from the Netherlands and Japan, precision fires systems from Romania, as well as interest from Poland, where we will be submitting a proposal for a Multiple Launch Rocket System (MLRS). Other MFC international customers include the United Kingdom, Germany, India, Kuwait, and Bahrain.
In
2018
, international customers accounted for
26%
of RMS’ net sales. Our RMS business segment continues to experience international interest in the Aegis Ballistic Missile Defense System. We perform activities in the development, production, modernization, ship integration, test and lifetime support for ships of international customers such as Japan, Spain, Republic of Korea, and Australia. We have ongoing programs in Canada and Chile for combat systems equipment upgrades on Halifax-class and Type 23 frigates. In our training and logistics solutions portfolio, we have active programs and pursuits in the United Kingdom, the Kingdom of Saudi Arabia, Canada, Egypt, Singapore, and Australia. In addition, Sikorsky adds a significant international component to the RMS business segment with an installed base of over 1,000 aircraft internationally. We have active development, production, and sustainment support of the S-70i Black Hawk
®
and MH-60 Seahawk
®
aircraft to foreign military customers, including Chile, Australia, Denmark, Taiwan, the Kingdom of Saudi Arabia and Colombia. Commercial aircraft are sold to customers in the oil and gas industry, emergency medical evacuation, search and rescue fleets, and VIP customers in over 30 countries.
International customers accounted for
16%
of Space’s
2018
net sales. Our Space business segment includes the operations of AWE, which operates the United Kingdom’s nuclear deterrent program. The work at AWE covers the entire life cycle, from initial concept, assessment and design, through component manufacture and assembly, in-service support and decommissioning and disposal. In addition, Space has international contracts with the Kingdom of Saudi Arabia and Japan to design and manufacture geostationary communication satellites using the A2100 satellite platform.
27
Status of the F-35 Program
The F-35 program primarily consists of production contracts, sustainment activities, and new development efforts. Production of the aircraft is expected to continue for many years given the U.S. Government’s current inventory objective of
2,456
aircraft for the U.S. Air Force, U.S. Marine Corps, and U.S. Navy; commitments from our eight international partners and three international customers; as well as expressions of interest from other countries.
During 2018, the F-35 program completed several milestones both domestically and internationally. The U.S. Government continued testing the aircraft, including ship trials, mission and weapons systems evaluations, and the F-35 fleet recently surpassed 175,000 flight hours.
In April 2018, we completed the System Development and Demonstration (SDD) flight testing portion of the development contract and began the next phase of development in support of phased capability improvements and modernization of the F-35 air system. This next phase of development work is being performed separately from the basic SDD contract as part of the Joint Program Office’s Continuous Capability Development and Delivery (C2D2) strategy.
On June 11, we delivered the 300
th
production F-35 aircraft, demonstrating the F-35 program’s continued progress and longevity. The first 300 F-35 aircraft delivered to U.S. and international customers include 197 F-35A variants, 75 F-35B variants, and 28 F-35C variants.
In December 2018, the DoD officially approved the F-35 program to begin the formal Initial Operational Test & Evaluation (IOT&E) phase. Testing is expected to be completed during 2019. The data will be analyzed by the U.S. Government as part of their evaluation to transition the F-35 program from
LRIP into full-rate production at the end of 2019.
Several milestones were also achieved with our U.S. Government and international customers. First, United Kingdom’s F-35B carried out the first trials with UK-built weapons. This represents a key part of the work-up toward Initial Operating Capability efforts. Second, F-35Cs’ participated in Integrated Flight Operations aboard the USS Abraham Lincoln. Third, a U.S. Marine Corps F-35B conducted the first combat strike in the U.S. Central Command area of responsibility in support of Operation Freedom’s Sentinel in Afghanistan on September 27. Fourth, the Royal Navy landed the F-35B on the HMS Queen Elizabeth.
On September 28, we finalized the LRIP 11 contract with the DoD at $11.5 billion for the production and delivery of 141 F-35 aircraft at the lowest per aircraft price in program history. In November 2018, the U.S. Government awarded an aggregate $22.7 billion UCA Block Buy for the production of 252 F-35 aircraft in order to provide greater production efficiency, stability and cost savings. As of
December 31, 2018
, we have delivered
357
production aircraft to our U.S. and international partners, and we have
396
production aircraft in backlog, including orders from our international partners.
Given the size and complexity of the F-35 program, we anticipate that there will be continual reviews related to aircraft performance, program schedule, cost, and requirements as part of the DoD, Congressional, and international partners’ oversight and budgeting processes. Current program challenges include, but are not limited to, supplier and partner performance, software development, level of cost associated with life cycle operations and sustainment and warranties, receiving funding for production contracts on a timely basis, executing future flight tests, findings resulting from testing and operating the aircraft.
28
Consolidated Results of Operations
Since our operating cycle is primarily long term and involves many types of contracts for the design, development and manufacture of products and related activities with varying delivery schedules, the results of operations of a particular year, or year-to-year comparisons of sales and profits, may not be indicative of future operating results. The following discussions of comparative results among years should be reviewed in this context. All per share amounts cited in these discussions are presented on a “per diluted share” basis, unless otherwise noted. Our consolidated results of operations were as follows (in millions, except per share data):
|
2018
|
|
2017
|
|
2016
|
|
|||||||
|
Net sales
|
$
|
53,762
|
|
$
|
49,960
|
|
$
|
47,290
|
|
|||
|
Cost of sales
|
(46,488
|
)
|
(43,589
|
)
|
(41,889
|
)
|
||||||
|
Gross profit
|
7,274
|
|
6,371
|
|
5,401
|
|
||||||
|
Other income, net
|
60
|
|
373
|
|
487
|
|
||||||
|
Operating profit
(a)
|
7,334
|
|
6,744
|
|
5,888
|
|
||||||
|
Interest expense
|
(668
|
)
|
(651
|
)
|
(663
|
)
|
||||||
|
Other non-operating expense, net
|
(828
|
)
|
(847
|
)
|
(471
|
)
|
||||||
|
Earnings from continuing operations before income taxes
|
5,838
|
|
5,246
|
|
4,754
|
|
||||||
|
Income tax expense
(b)
|
(792
|
)
|
(3,356
|
)
|
(1,093
|
)
|
||||||
|
Net earnings from continuing operations
|
5,046
|
|
1,890
|
|
3,661
|
|
||||||
|
Net earnings from discontinued operations
|
—
|
|
73
|
|
1,512
|
|
||||||
|
Net earnings
|
$
|
5,046
|
|
$
|
1,963
|
|
$
|
5,173
|
|
|||
|
Diluted earnings per common share
|
||||||||||||
|
Continuing operations
|
$
|
17.59
|
|
$
|
6.50
|
|
$
|
12.08
|
|
|||
|
Discontinued operations
|
—
|
|
0.25
|
|
4.99
|
|
||||||
|
Total diluted earnings per common share
|
$
|
17.59
|
|
$
|
6.75
|
|
$
|
17.07
|
|
|||
|
(a)
|
For the year ended December 31, 2018, operating profit includes
a non-cash asset impairment charge of
$110 million
related to our equity method investee
, Advanced Military Maintenance, Repair and Overhaul Center LLC (AMMROC). For the year ended December 31, 2017, operating profit includes a
$64 million
charge, which represents our portion of a non-cash asset impairment charge recorded by AMMROC
(see “
Note 1 – Significant Accounting Policies
” included in our Notes to Consolidated Financial Statements for more information). For the year ended December 31, 2017, operating profit includes a previously deferred non-cash gain of approximately
$198 million
related to properties sold in 2015 (see “
Note 8 – Property, Plant and Equipment, net
” included in our Notes to Consolidated Financial Statements for more information). For the year ended December 31, 2016, operating profit includes a non-cash gain on the step acquisition of AWE of approximately
$104 million
(see “
Note 3 – Acquisition and Divestitures
” included in our Notes to Consolidated Financial Statements for more information).
|
|
(b)
|
In 2017, we recorded a net one-time tax charge of
$2.0 billion
(
$6.77
per share)
, substantially all of which was non-cash, primarily related to the estimated impact of the
Tax Cuts and Jobs Act. See “Income Tax Expense” section below and “
Note 9 – Income Taxes
” included in our Notes to Consolidated Financial Statements for additional information.
|
Certain amounts reported in other income, net, primarily our share of earnings or losses from equity method investees, are included in the operating profit of our business segments. Accordingly, such amounts are included in our discussion of our business segment results of operations.
29
Net Sales
We generate sales from the delivery of products and services to our customers. Our consolidated net sales were as follows (in millions):
|
2018
|
|
2017
|
|
2016
|
|
||||||||||
|
Products
|
$
|
45,005
|
|
$
|
42,502
|
|
$
|
40,081
|
|
||||||
|
% of total net sales
|
83.7
|
|
%
|
85.1
|
|
%
|
84.8
|
|
%
|
||||||
|
Services
|
8,757
|
|
7,458
|
|
7,209
|
|
|||||||||
|
% of total net sales
|
16.3
|
|
%
|
14.9
|
|
%
|
15.2
|
|
%
|
||||||
|
Total net sales
|
$
|
53,762
|
|
$
|
49,960
|
|
$
|
47,290
|
|
||||||
Substantially all of our contracts are accounted for using the percentage-of-completion cost-to-cost method. Under the percentage-of-completion cost-to-cost method, we record net sales on contracts over time based upon our progress towards completion on a particular contract, as well as our estimate of the profit to be earned at completion. The following discussion of material changes in our consolidated net sales should be read in tandem with the subsequent discussion of changes in our consolidated cost of sales and our business segment results of operations because changes in our sales are typically accompanied by a corresponding change in our cost of sales due to the nature of the percentage-of-completion cost-to-cost method.
Product Sales
Product sales
increased
$2.5 billion
, or
6%
, in
2018
as compared to
2017
. The increase was primarily due to higher product sales of about
$1.2 billion
at Aeronautics,
$1.0 billion
at MFC and
$315 million
at RMS. Higher product sales at Aeronautics was primarily due to higher production volume for the F-35 program and higher volume on modernization contracts for the F-16 program. The increase at MFC was primarily due to increased volume for tactical and strike missiles programs (primarily classified programs and precision fires). The increase at RMS was primarily due to increased production volume for integrated warfare systems and sensors (IWSS) programs (primarily radar surveillance systems).
Product sales increased $2.4 billion, or 6%, in 2017 as compared to 2016. The increase was primarily due to higher product sales of about $1.9 billion at Aeronautics and $340 million at MFC. The increase in product sales at Aeronautics was primarily attributable to higher sales for the F-35 program due to increased production volume and higher sales for the C-130 program due to increased production volume and aircraft configuration mix, partially offset by a decrease in sales for the C-5 program due to lower production volume. Higher product sales at MFC was primarily due to an increase in sales for air and missile defense programs due to higher volume (primarily Terminal High Altitude Area Defense (THAAD)), higher sales for tactical and strike missile programs due to product configuration mix (primarily precision fires) and increased volume (primarily classified programs), and higher sales for sensor and global sustainment programs due to increased volume (primarily Low Altitude Navigation and Targeting Infrared for Night (LANTIRN
®
) and SNIPER
®
).
Service Sales
Service sales
increased
$1.3 billion
, or
17%
, in
2018
as compared to
2017
, primarily due to an increase in service sales of about
$605 million
at Aeronautics,
$270 million
at RMS, and
$245 million
at Space. The increase in service sales at Aeronautics was primarily due to higher sustainment volume for the F-35 and F-22 programs. Higher service sales at RMS was primarily due to increased volume for C6ISR (command, control, communications, computers, cyber, combat systems, intelligence, surveillance, and reconnaissance) and IWSS programs. The increase in service sales at Space was primarily due to increased volume on government satellite services.
Service sales increased $249 million, or 3%, in 2017 as compared to 2016, primarily due to an increase in service sales of about $200 million at Aeronautics, $155 million at MFC and $70 million at RMS. These increases were partially offset by a decrease in service sales of about $180 million at Space. The increase in service sales at Aeronautics was primarily due to increased volume on sustainment activities (primarily the F-35 and C-130 programs). Higher service sales at MFC was primarily attributable to increased volume on sustainment activities (primarily Patriot Advanced Capability-3 (PAC-3) and Special Operations Forces Contractor Logistics Support Services (SOF CLSS)). Higher service sales at RMS was primarily due to increased volume on sustainment activities at Sikorsky. The decrease in service sales at Space was primarily due to lower launch related volume for space transportation programs, partially offset by increased volume for government satellite services.
30
Cost of Sales
Cost of sales, for both products and services, consist of materials, labor, subcontracting costs, an allocation of indirect costs (overhead and general and administrative), as well as the costs to fulfill our industrial cooperation agreements, sometimes referred to as offset agreements, required under certain contracts with international customers. For each of our contracts, we monitor the nature and amount of costs at the contract level, which form the basis for estimating our total costs to complete the contract. Our consolidated cost of sales were as follows (in millions):
|
2018
|
|
2017
|
|
2016
|
|
||||||||||
|
Cost of sales – products
|
$
|
(40,293
|
)
|
$
|
(38,417
|
)
|
$
|
(36,394
|
)
|
||||||
|
% of product sales
|
89.5
|
|
%
|
90.4
|
|
%
|
90.8
|
|
%
|
||||||
|
Cost of sales – services
|
(7,738
|
)
|
(6,673
|
)
|
(6,423
|
)
|
|||||||||
|
% of service sales
|
88.4
|
|
%
|
89.5
|
|
%
|
89.1
|
|
%
|
||||||
|
Severance and restructuring charges
|
(96
|
)
|
—
|
|
(80
|
)
|
|||||||||
|
Other unallocated, net
|
1,639
|
|
1,501
|
|
1,008
|
|
|||||||||
|
Total cost of sales
|
$
|
(46,488
|
)
|
$
|
(43,589
|
)
|
$
|
(41,889
|
)
|
||||||
The following discussion of material changes in our consolidated cost of sales for products and services should be read in tandem with the preceding discussion of changes in our consolidated net sales and our business segment results of operations. We have not identified any developing trends in cost of sales for products and services that would have a material impact on our future operations.
Product Costs
Product costs
increased
approximately
$1.9 billion
, or
5%
, in
2018
as compared to
2017
. The increase was primarily due to increased product costs of about
$1.2 billion
at Aeronautics and
$820 million
at MFC. Higher product costs at Aeronautics was primarily due to higher production volume for the F-35 program and higher volume on modernization contracts for the F-16 program. The increase in product costs at MFC was primarily due to increased volume for tactical and strike missiles programs (primarily classified programs and precision fires).
Product costs increased approximately $2.0 billion, or 6%, in 2017 as compared to 2016. The increase was primarily due to increased product costs of about $1.5 billion at Aeronautics and $315 million at MFC. The increase in product costs at Aeronautics was primarily due to increased volume on aircraft production for the F-35 program and higher cost for the C-130 program due to increased production volume and aircraft configuration mix, partially offset by a decrease in cost for the C-5 program due to lower production volume. Higher product costs at MFC was primarily attributable to an increase in cost for tactical and strike missile programs due to product configuration mix (primarily precision fires) and increased volume (classified programs) and higher product costs for air and missile defense programs due to contract mix (primarily PAC-3) and higher volume (primarily THAAD).
Service Costs
Service costs
increased
approximately
$1.1 billion
, or
16%
, in
2018
compared to
2017
, primarily due to increased service costs of about
$535 million
at Aeronautics,
$215 million
at RMS, and
$170 million
at Space. The increase in service costs at Aeronautics was primarily due to higher sustainment volume for the F-35 and F-22 programs. Higher service costs at RMS were primarily due to increased volume for various C6ISR and IWSS programs. The increase in service costs at Space was primarily due to increased volume on government satellite services.
Service costs increased approximately $250 million, or 4%, in 2017 compared to 2016, primarily due to increased service costs of about $230 million at Aeronautics and $150 million at MFC. These increases were partially offset by a decrease of about$135 million at Space. Higher service costs at Aeronautics was primarily due to increased volume on sustainment activities (primarily the F-35 and C-130 programs). Higher service costs at MFC was primarily attributable to higher volume on sustainment activities (primarily PAC-3 and SOF CLSS). The decrease in service costs at Space was primarily due to lower launch related volume for space transportation programs, partially offset by increased volume for government satellite services.
31
Restructuring Charges
2018 Actions
During 2018, we recorded charges totaling
$96 million
(
$76 million
, or
$0.26
per share, after tax) related to certain severance and restructuring actions at our RMS business segment. These charges consist of
$75 million
of severance costs for the planned elimination of certain positions through either voluntary or involuntary actions and
$21 million
of asset impairment charges associated with our decision to consolidate certain operations. Upon separation, terminated employees will receive lump-sum severance payments primarily based on years of service, a majority of which we expect to pay by the end of 2019. These actions resulted from a strategic review of our RMS business segment and are intended to improve the efficiency of our operations and better align our organization and cost structure with changing economic conditions. We expect to recover a portion of the severance and restructuring charges through the pricing of our products and services to the U.S. Government and other customers in future periods, which will be included in RMS’ operating results. During 2018, we paid approximately
$33 million
in severance payments associated with these actions.
2016 Actions
During 2016, we recorded severance charges totaling approximately
$80 million
related to our Aeronautics business segment. The charges consisted of severance costs associated with the planned elimination of certain positions through either voluntary or involuntary actions. Upon separation, terminated employees receive lump-sum severance payments primarily based on years of service, the majority of which are expected to be paid over the next several quarters. As of the end of the first quarter of 2017, we had substantially paid the severance costs associated with these actions.
Other Unallocated, Net
Other unallocated, net primarily includes the FAS/CAS operating adjustment as described in the “Business Segment Results of Operations” section below, stock-based compensation and other corporate costs. These items are not allocated to the business segments and, therefore, are excluded from the cost of sales for products and services. Other unallocated, net was a net reduction to expense of
$1.6 billion
in
2018
,
$1.5 billion
in
2017
and
$1.0 billion
in
2016
.
The increase in net reduction in expense from
2018
to
2017
and
2017
to
2016
was primarily attributable to fluctuations in the FAS/CAS operating adjustment of
$1.8 billion
in
2018
,
$1.6 billion
in
2017
and
$1.3 billion
in
2016
, partially offset by fluctuations in other costs associated with various corporate items, none of which were individually significant. The increase in the FAS/CAS operating adjustment over the periods was primarily attributable to an increase in U.S. Government Cost Accounting Standards (CAS) pension cost due to the impact of phasing in CAS Harmonization. See “Critical Accounting Policies - Postretirement Benefit Plans” discussion below for more information on our CAS pension cost. Additionally, the increase in net reduction to expense in
2017
as compared to
2016
was driven by corporate overhead costs reclassified during 2016 from our former IS&GS business to other unallocated, net. See “
Note 3 – Acquisition and Divestitures
” included in our Notes to Consolidated Financial Statements for additional information about costs reclassified to other unallocated, net.
Other Income, Net
Other income, net primarily includes our share of earnings or losses from equity method investees and gains or losses for acquisitions and divestitures. Other income, net in
2018
was
$60 million
, compared to
$373 million
in
2017
and
$487 million
in
2016
. The decrease in
2018
compared to
2017
was primarily attributable to the recognition in 2018 of
a non-cash asset impairment charge of
$110 million
(
$83 million
, or
$0.29
per share, after tax)
related to our equity method investee
, AMMROC
, decreased earnings generated by equity method investees, and the recognition in 2017 of a previously deferred non-cash gain of approximately
$198 million
related to properties sold in 2015. The decrease in
2017
compared to
2016
was primarily attributable to decreased earnings generated by equity method investees and recognition in
2017
of our portion of a non-cash asset impairment charge recorded by our equity method investee, AMMROC. These decreases were partially offset by the recognition in
2017
of a previously deferred non-cash gain of approximately
$198 million
related to properties sold in 2015, which was greater than the net gain of
$104 million
recognized in the third quarter of
2016
on the step acquisition of AWE.
32
Interest Expense
Interest expense in
2018
was
$668 million
, compared to
$651 million
in
2017
and
$663 million
in
2016
. The slight increase in interest expense in
2018
resulted primarily from increased interest expense on interest rate swaps and commercial paper, partially offset by our scheduled repayment of $750 million of debt during
2018
. The decrease in interest expense in
2017
resulted primarily from our scheduled repayment of $952 million of debt during
2016
. See “Capital Structure, Resources and Other” included within “Liquidity and Cash Flows” discussion below and “
Note 10 – Debt
” included in our Notes to Consolidated Financial Statements for a discussion of our debt.
Other Non-Operating Expense, Net
Other non-operating expense, net primarily includes the non-service cost components of FAS pension and other postretirement benefit plan expense (i.e., interest cost, expected return on plan assets, net actuarial gains or losses, and amortization of prior service cost or credits) related to our postretirement benefit plans. Other non-operating expense, net in
2018
decreased slightly compared to
2017
primarily due to fluctuations in other costs associated with various items, none of which were individually significant. Other non-operating expense, net
increased
$376 million
from
2016
to
2017
primarily due to higher non-service cost components of FAS expense related to a lower discount rate and lower expected long-term rate of return on plan assets.
Income Tax Expense
Our effective income tax rate from continuing operations was
13.6%
for
2018
,
64.0%
for
2017
, and
23.0%
for
2016
. On December 22, 2017, the President signed the Tax Cuts and Jobs Act (the “Tax Act”). The Tax Act, among other things, lowered the U.S. corporate income tax rate from 35% to 21% effective January 1, 2018. Consequently, we wrote down our net deferred tax assets as of December 31, 2017 by
$2.0 billion
to reflect the estimated impact of the Tax Act. We recorded a corresponding net one-time charge of
$2.0 billion
(
$6.77
per share), substantially all of which was non-cash, primarily related to enactment of the Tax Act, the re-measurement of certain net deferred tax assets using the lower U.S. corporate income tax rate (approximately
$1.9 billion
), a deemed repatriation tax (approximately $43 million), and a reduction in the U.S. manufacturing benefit (approximately $81 million) as a result of our decision to accelerate contributions to our pension fund in 2018 in order to receive a tax deduction in 2017. The net one-time charge related to the Tax Act increased our 2017 effective income tax rate by 37.5 percentage points. Our effective income tax rate and cash tax payments in years after 2017 are expected to benefit materially from the enactment of the Tax Act.
As of December 22, 2018, we completed our accounting for all of the enactment-date income tax effects of the Tax Act and did not identify any material changes to the provisional, net, one-time charge for the year ended December 31, 2017, related to the Tax Act.
We recognized a new tax benefit in 2018 of
$61 million
related to the deduction for foreign derived intangible income enacted by the Tax Act, which reduced our effective income tax rate by
1.0
percentage point. We also recognized a tax benefit of
$61 million
in 2018, which reduced our effective income tax rate by
1.0
percentage point, from our change in a tax accounting method reflecting a 2012 Court of Federal Claims decision, which held that the tax basis in certain assets should be increased and realized upon the assets’ disposition.
The rates for all periods benefited from tax deductions for dividends paid to our defined contribution plans with an employee stock ownership plan feature, and the U.S. research and development (R&D) tax credit. The Tax Act repealed the U.S. manufacturing benefit for years after 2017. The U.S. manufacturing benefit for
2017
was insignificant, compared to a reduction of our effective tax rate by
2.5
percentage points for
2016
. The 2017 benefit was reduced by $81 million because of our 2017 decision after enactment of the Tax Act to make accelerated contributions of cash in 2018 to our defined benefit pension plans. The R&D tax credit reduced our effective tax rate by
2.4
percentage points in
2018
and
2.2
percentage points in both
2017
and
2016
. The rate for 2016 also benefited from the nontaxable gain recorded in connection with the consolidation of AWE.
In addition, the rates for
2018
,
2017
, and
2016
benefited from tax benefits related to employee share-based payment awards, which are now recorded in earnings as income tax benefit or expense, effective with the adoption of an accounting standard update during 2016. Accordingly, we recognized additional income tax benefits of
$55 million
,
$106 million
, and
$152 million
during the years ended
December 31, 2018
,
2017
, and
2016
, which reduced our effective income tax rate by
0.9
percentage points,
2.0
percentage points, and
3.2
percentage points.
Future changes in tax laws could significantly impact our provision for income taxes, the amount of taxes payable, our deferred tax asset and liability balances, and stockholders’ equity.
The amount of net deferred tax assets will change periodically based on several factors, including the measurement of our postretirement benefit plan obligations, actual cash contributions to our postretirement benefit plans, and future changes in tax laws.
33
Net Earnings from Continuing Operations
We reported net earnings from continuing operations of
$5.0 billion
(
$17.59
per share) in
2018
,
$1.9 billion
(
$6.50
per share) in
2017
and
$3.7 billion
(
$12.08
per share) in
2016
. Both net earnings and earnings per share from continuing operations were affected by the factors mentioned above. Earnings per share also benefited from a net decrease of approximately 3.0 million common shares outstanding from
December 31, 2017
to
December 31, 2018
as a result of share repurchases, partially offset by share issuance under our stock-based awards and certain defined contribution plans. From
December 31, 2016
to
December 31, 2017
earnings per share benefited from a decrease of approximately 5.0 million common shares outstanding as a result of share repurchases, partially offset by share issuance under our stock-based awards and certain defined contribution plans.
Net Earnings from Discontinued Operations
We reported net earnings from discontinued operations related to the 2016 divestiture of the IS&GS business of
$73 million
(
$0.25
per share) in
2017
and
$1.5 billion
(
$4.99
per share) in
2016
. Net earnings from discontinued operations in 2017 reflects certain post-closing adjustments, including final working capital and tax adjustments. Net earnings from discontinued operations in 2016 included an initial net gain of approximately
$1.2 billion
recognized as a result of the divestiture of the IS&GS business.
Net Earnings
We reported net earnings of
$5.0 billion
(
$17.59
per share) in
2018
,
$2.0 billion
(
$6.75
per share) in
2017
and
$5.2 billion
(
$17.07
per share) in
2016
.
Business Segment Results of Operations
We operate in
four
business segments: Aeronautics, MFC, RMS and Space. We organize our business segments based on the nature of the products and services offered.
The financial information in the following tables includes the results of businesses we have acquired from their respective dates of acquisition and excludes businesses included in discontinued operations (see “
Note 3 – Acquisition and Divestitures
” included in our Notes to Consolidated Financial Statements) for all years presented. Net sales of our business segments exclude intersegment sales as these activities are eliminated in consolidation.
Operating profit of our business segments includes our share of earnings or losses from equity method investees because the operating activities of the equity method investees are closely aligned with the operations of our business segments. United Launch Alliance (ULA), results of which are included in our Space business segment, is one of our largest equity method investees. Operating profit of our business segments excludes the FAS/CAS operating adjustment for our qualified defined benefit pension plans (described below); the adjustment from CAS to the FAS service cost component for all other postretirement benefit plans; expense for stock-based compensation; the effects of items not considered part of management’s evaluation of segment operating performance, such as charges related to goodwill impairments (see “
Note 1 – Significant Accounting Policies
” included in our Notes to Consolidated Financial Statements) and significant severance and restructuring actions (see “
Note 15 – Severance and Restructuring Charges
” included in our Notes to Consolidated Financial Statements); gains or losses from significant divestitures (see “
Note 3 – Acquisition and Divestitures
” included in our Notes to Consolidated Financial Statements); the effects of certain legal settlements; corporate costs not allocated to our business segments; and other miscellaneous corporate activities. These items are included in the reconciling item “Unallocated items” between operating profit from our business segments and our consolidated operating profit.
Our business segments’ results of operations include pension expense only as calculated under U.S. Government Cost Accounting Standards, which we refer to as CAS pension cost. We recover CAS pension cost through the pricing of our products and services on U.S. Government contracts and, therefore, the CAS pension cost is recognized in each of our business segments’ net sales and cost of sales. Our consolidated operating profit in our consolidated financial statements must present the service cost component of FAS pension and other postretirement benefit plan expense calculated in accordance with FAS requirements under U.S. GAAP. The operating portion of the net FAS/CAS operating adjustment represents the difference between the service cost component of FAS pension expense and the CAS pension cost recorded in our business segments’ results of operations. The non-service FAS pension and other postretirement benefit plan cost component is included in other non-operating expenses, net on our consolidated statement of earnings. As a result, to the extent that CAS pension cost exceeds the service cost component of FAS pension expense, which occurred for
2018
,
2017
and
2016
, we have a favorable FAS/CAS operating adjustment.
34
Summary operating results for each of our business segments were as follows (in millions):
|
2018
|
|
2017
|
|
2016
|
|
|||||||
|
Net sales
|
||||||||||||
|
Aeronautics
|
$
|
21,242
|
|
$
|
19,410
|
|
$
|
17,293
|
|
|||
|
Missiles and Fire Control
|
8,462
|
|
7,282
|
|
6,789
|
|
||||||
|
Rotary and Mission Systems
|
14,250
|
|
13,663
|
|
13,595
|
|
||||||
|
Space
|
9,808
|
|
9,605
|
|
9,613
|
|
||||||
|
Total net sales
|
$
|
53,762
|
|
$
|
49,960
|
|
$
|
47,290
|
|
|||
|
Operating profit
|
||||||||||||
|
Aeronautics
|
$
|
2,272
|
|
$
|
2,176
|
|
$
|
1,845
|
|
|||
|
Missiles and Fire Control
|
1,248
|
|
1,034
|
|
1,004
|
|
||||||
|
Rotary and Mission Systems
|
1,302
|
|
902
|
|
845
|
|
||||||
|
Space
(a)
|
1,055
|
|
980
|
|
1,288
|
|
||||||
|
Total business segment operating profit
|
5,877
|
|
5,092
|
|
4,982
|
|
||||||
|
Unallocated items
|
||||||||||||
|
FAS/CAS operating adjustment
(b)
|
1,803
|
|
1,613
|
|
1,250
|
|
||||||
|
Stock-based compensation
|
(173
|
)
|
(158
|
)
|
(149
|
)
|
||||||
|
Severance and restructuring charges
(c)
|
(96
|
)
|
—
|
|
(80
|
)
|
||||||
|
Other, net
(d)
|
(77
|
)
|
197
|
|
(115
|
)
|
||||||
|
Total unallocated, net
|
1,457
|
|
1,652
|
|
906
|
|
||||||
|
Total consolidated operating profit
|
$
|
7,334
|
|
$
|
6,744
|
|
$
|
5,888
|
|
|||
|
(a)
|
On August 24, 2016, our ownership interest in the AWE joint venture increased from
33%
to
51%
and we were required to change our accounting for this investment from the equity method to consolidation. As a result of the increased ownership interest, we recognized a non-cash gain of
$127 million
at our Space business segment, which increased net earnings from continuing operations by
$104 million
(
$0.34
per share) in 2016. See “
Note 3 – Acquisition and Divestitures
”
included in our Notes to Consolidated Financial Statements for more information).
|
|
(b)
|
The FAS/CAS operating adjustment represents the difference between the service cost component of FAS pension expense and total pension costs recoverable on U.S. Government contracts as determined in accordance with CAS. For a detail of the FAS/CAS operating adjustment and the total net FAS/CAS pension adjustment, see the table below.
|
|
(c)
|
See “Consolidated Results of Operations – Restructuring Charges” discussion above
for information on charges related to certain severance actions at our business segments. Severance and restructuring charges for initiatives that are not significant are included in business segment operating profit.
|
|
(d)
|
Other, net in 2018 includes
a non-cash asset impairment charge of
$110 million
related to our equity method investee
, AMMROC
(see “
Note 1 – Significant Accounting Policies
”
included in our Notes to Consolidated Financial Statements for more information).
Other, net in 2017 includes a previously deferred non-cash gain of
$198 million
related to properties sold in 2015 as a result of completing our remaining obligations
(see “
Note 8 – Property, Plant and Equipment, net
” included in our Notes to Consolidated Financial Statements for more information) and a
$64 million
charge, which represents our portion of a non-cash asset impairment charge recorded by AMMROC
(see “
Note 1 – Significant Accounting Policies
” included in our Notes to Consolidated Financial Statements for more information).
|
35
Total net FAS/CAS pension adjustments, including the service and non-service cost components of FAS pension expense, were as follows (in millions):
|
2018
|
|
2017
|
|
2016
|
|
|||||||
|
Total FAS expense and CAS costs
|
||||||||||||
|
FAS pension expense
|
$
|
(1,431
|
)
|
$
|
(1,372
|
)
|
$
|
(1,019
|
)
|
|||
|
Less: CAS pension cost
|
2,433
|
|
2,248
|
|
1,921
|
|
||||||
|
Net FAS/CAS pension adjustment
|
$
|
1,002
|
|
$
|
876
|
|
$
|
902
|
|
|||
|
Service and non-service cost reconciliation
|
||||||||||||
|
FAS pension service cost
|
(630
|
)
|
(635
|
)
|
(671
|
)
|
||||||
|
Less: CAS pension cost
|
2,433
|
|
2,248
|
|
1,921
|
|
||||||
|
FAS/CAS operating adjustment
|
1,803
|
|
1,613
|
|
1,250
|
|
||||||
|
Non-operating FAS pension expense
(a)
|
(801
|
)
|
(737
|
)
|
(348
|
)
|
||||||
|
Net FAS/CAS pension adjustment
|
$
|
1,002
|
|
$
|
876
|
|
$
|
902
|
|
|||
|
(a)
|
We record the non-service cost components of net periodic benefit cost as part of other non-operating expense, net in the consolidated statement of earnings. The non-service cost components in the table above relate only to our qualified defined benefit pension plans. We incurred total non-service costs for our qualified defined benefit pension plans in the table above, along with similar costs for our other postretirement benefit plans of
$67 million
,
$109 million
, and
$123 million
for the years ended 2018, 2017 and 2016.
|
We recover CAS pension cost through the pricing of our products and services on U.S. Government contracts and, therefore, recognize CAS pension cost in each of our business segment’s net sales and cost of sales. Our consolidated financial statements must present FAS pension and other postretirement benefit plan expense calculated in accordance with FAS requirements under U.S. GAAP. The operating portion of the net FAS/CAS pension adjustment represents the difference between the service cost component of FAS pension expense and CAS pension cost. The non-service FAS pension cost component is included in other non-operating expense, net on our consolidated statements of earnings. The net FAS/CAS pension adjustment increases or decreases CAS pension cost to equal total FAS pension expense (both service and non-service).
The following segment discussions also include information relating to backlog for each segment. Backlog was approximately
$130.5 billion
,
$105.5 billion
and
$103.5 billion
at
December 31, 2018
,
2017
and
2016
. These amounts included both funded backlog (firm orders for which funding has been both authorized and appropriated by the customer) and unfunded backlog (firm orders for which funding has not yet been appropriated). Backlog does not include unexercised options or task orders to be issued under indefinite-delivery, indefinite-quantity contracts. Funded backlog was approximately
$86.4 billion
at
December 31, 2018
.
Management evaluates performance on our contracts by focusing on net sales and operating profit and not by type or amount of operating expense. Consequently, our discussion of business segment performance focuses on net sales and operating profit, consistent with our approach for managing the business. This approach is consistent throughout the life cycle of our contracts, as management assesses the bidding of each contract by focusing on net sales and operating profit and monitors performance on our contracts in a similar manner through their completion.
We regularly provide customers with reports of our costs as the contract progresses. The cost information in the reports is accumulated in a manner specified by the requirements of each contract. For example, cost data provided to a customer for a product would typically align to the subcomponents of that product (such as a wing-box on an aircraft) and for services would align to the type of work being performed (such as aircraft sustainment). Our contracts generally allow for the recovery of costs in the pricing of our products and services. Most of our contracts are bid and negotiated with our customers under circumstances in which we are required to disclose our estimated total costs to provide the product or service. This approach for negotiating contracts with our U.S. Government customers generally allows for the recovery of our costs. We also may enter into long-term supply contracts for certain materials or components to coincide with the production schedule of certain products and to ensure their availability at known unit prices.
Many of our contracts span several years and include highly complex technical requirements. At the outset of a contract, we identify and monitor risks to the achievement of the technical, schedule and cost aspects of the contract and assess the effects of those risks on our estimates of total costs to complete the contract. The estimates consider the technical requirements (e.g., a newly-developed product versus a mature product), the schedule and associated tasks (e.g., the number and type of milestone events) and costs (e.g., material, labor, subcontractor, overhead and the estimated costs to fulfill our industrial cooperation agreements required under certain contracts with international customers). The initial profit booking rate of each contract considers risks surrounding the ability to achieve the technical requirements, schedule and costs in the initial estimated total costs to complete the contract. Profit booking rates may increase during the performance of the contract if we successfully retire risks surrounding
36
the technical, schedule and cost aspects of the contract which decreases the estimated total costs to complete the contract. Conversely, our profit booking rates may decrease if the estimated total costs to complete the contract increase. All of the estimates are subject to change during the performance of the contract and may affect the profit booking rate.
We have a number of programs that are designated as classified by the U.S. Government which cannot be specifically described. The operating results of these classified programs are included in our consolidated and business segment results and are subjected to the same oversight and internal controls as our other programs.
Our net sales are primarily derived from long-term contracts for products and services provided to the U.S. Government as well as FMS contracted through the U.S. Government. We recognize revenue as performance obligations are satisfied and the customer obtains control of the products and services. For performance obligations to deliver products with continuous transfer of control to the customer, revenue is recognized based on the extent of progress towards completion of the performance obligation, generally using the percentage-of-completion cost-to-cost measure of progress for our contracts because it best depicts the transfer of control to the customer as we incur costs on our contracts. For performance obligations in which control does not continuously transfer to the customer, we recognize revenue at the point in time in which each performance obligation is fully satisfied.
Changes in net sales and operating profit generally are expressed in terms of volume. Changes in volume refer to increases or decreases in sales or operating profit resulting from varying production activity levels or service levels on individual contracts. Volume changes in segment operating profit are typically based on the current profit booking rate for a particular contract.
In addition, comparability of our segment sales, operating profit and operating margins may be impacted favorably or unfavorably by changes in profit booking rates on our contracts accounted for using the percentage-of-completion method of accounting. Increases in the profit booking rates, typically referred to as risk retirements, usually relate to revisions in the estimated total costs that reflect improved conditions on a particular contract. Conversely, conditions on a particular contract may deteriorate, resulting in an increase in the estimated total costs to complete and a reduction in the profit booking rate. Increases or decreases in profit booking rates are recognized in the current period and reflect the inception-to-date effect of such changes. Segment operating profit and margins may also be impacted favorably or unfavorably by other items. Favorable items may include the positive resolution of contractual matters, cost recoveries on restructuring charges, insurance recoveries and gains on sales of assets. Unfavorable items may include the adverse resolution of contractual matters; severance and restructuring charges, except for significant severance actions, which are excluded from segment operating results; reserves for disputes; asset impairments; and losses on sales of certain assets. Segment operating profit and items such as risk retirements, reductions of profit booking rates or other matters are presented net of state income taxes.
As previously disclosed, we have a program, EADGE-T, to design, integrate, and install an air missile defense command, control, communications, computers – intelligence (C4I) system for an international customer that has experienced performance matters and for which we have periodically accrued reserves. In
2017
, we revised our estimated costs to complete the EADGE-T contract as a consequence of ongoing performance matters and recorded an additional charge of
$120 million
(
$74 million
or
$0.25
per share, after tax) at our RMS business segment, which resulted in cumulative losses of approximately
$260 million
on this program. As of
December 31, 2018
, cumulative losses remained at approximately
$260 million
. We continue to monitor program requirements and our performance. At this time, we do not anticipate additional charges that would be material to our operating results or financial condition.
We have two commercial satellite programs, for the delivery of three satellites in total, to international customers at our Space business segment, for which we have experienced performance issues related to the development and integration of a modernized LM 2100 satellite platform. These programs require the development of new satellite technology to enhance the LM 2100’s power, propulsion and electronics, among other items. The enhanced LM 2100 satellite platform is expected to benefit other commercial and government satellite programs. We have periodically revised our estimated costs to complete these developmental commercial programs. We have recorded cumulative losses of approximately
$380 million
through
December 31, 2018
. In
2018
, we recorded losses of approximately
$75 million
(
$56 million
, or
$0.20
per share, after tax). While these losses reflect our estimated total losses on the programs, we will continue to incur general and administrative costs each period until we complete these programs. These programs remain developmental and further challenges in the delivery and integration of new satellite technology, anomalies discovered during system testing requiring repair or rework, further schedule delays and potential penalties could require that we record additional loss reserves which could be material to our operating results. We previously disclosed that, as we did not meet the July 2018 delivery requirement for two satellites, the customer could seek to exercise termination rights. One of the satellites has now been launched, eliminating this risk. As the other is expected to launch in the first half of 2019, we believe it unlikely that the customer will seek to do so. Were the customer to seek to exercise a termination right and be successful in this effort, we would have to refund the payments we have received and pay certain penalties. On the third satellite, we currently anticipate delivery before the date upon which the customer could seek to exercise a termination right although we may have to pay certain penalties and have sought to address this possibility in our reserves.
37
We are responsible for designing, developing and installing an upgraded turret for the Warrior Capability Sustainment Program. In
2018
, we revised our estimated costs to complete the program as a consequence of performance issues, and recorded a charge of approximately
$85 million
(
$64 million
, or
$0.22
per share, after tax) at our
MFC
business segment, which resulted in cumulative losses of approximately
$140 million
on this program as of
December 31, 2018
.
We may continue to experience issues related to customer requirements and our performance under this contract and have to record additional charges. However, based on the losses already recorded and our current estimate of the sales and costs to complete the program, at this time we do not anticipate that additional losses, if any, would be material to our operating results or financial condition.
Our consolidated net adjustments not related to volume, including net profit booking rate adjustments and other items, net of state income taxes, increased segment operating profit by approximately
$1.9 billion
in
2018
,
$1.6 billion
in
2017
and
$1.4 billion
in
2016
. The increase in consolidated net adjustments in
2018
compared to
2017
was primarily due to increases in profit booking rate adjustments at our MFC, RMS, and Space business segments, partially offset by a decrease at our Aeronautics business segment. The increase in our consolidated net adjustments in
2017
compared to
2016
was primarily due to an increases in profit booking rate adjustments at our Aeronautics and Space business segments, partially offset by a decrease at our RMS business segment. The consolidated net adjustments for
2018
are inclusive of approximately
$900 million
in unfavorable items, which include reserves for performance matters on the Warrior Capability Sustainment Program at MFC, various programs at RMS, and commercial satellite programs at Space. The consolidated net adjustments for
2017
are inclusive of approximately
$800 million
in unfavorable items, which include reserves for performance matters on the EADGE-T contract, Vertical Launching System (VLS) program and other programs at RMS and on commercial satellite programs at Space. The consolidated net adjustments for
2016
are inclusive of approximately
$535 million
in unfavorable items, which include reserves for performance matters on the EADGE-T contract at RMS and on commercial satellite programs at Space.
Aeronautics
Our Aeronautics business segment is engaged in the research, design, development, manufacture, integration, sustainment, support and upgrade of advanced military aircraft, including combat and air mobility aircraft, unmanned air vehicles and related technologies. Aeronautics’ major programs include the F-35 Lightning II Joint Strike Fighter, C‑130 Hercules, F-16 Fighting Falcon and F-22 Raptor. Aeronautics’ operating results included the following (in millions):
|
2018
|
|
2017
|
|
2016
|
|
||||||||||
|
Net sales
|
$
|
21,242
|
|
$
|
19,410
|
|
$
|
17,293
|
|
||||||
|
Operating profit
|
2,272
|
|
2,176
|
|
1,845
|
|
|||||||||
|
Operating margin
|
10.7
|
|
%
|
11.2
|
|
%
|
10.7
|
|
%
|
||||||
|
Backlog at year-end
|
$
|
55,601
|
|
$
|
35,692
|
|
$
|
34,999
|
|
||||||
2018
compared to
2017
Aeronautics’ net sales in
2018
increased
$1.8 billion
, or
9%
, compared to
2017
. The increase was primarily attributable to higher net sales of approximately $1.5 billion for the F-35 program due to increased volume on production and sustainment, partially offset by lower volume on development activities; about $300 million for other programs due to higher volume (primarily ADP); about $210 million for the F-16 program due to increased volume on modernization contracts; and about $110 million for the F-22 program due to increased sustainment volume. These increases were partially offset by a decrease of approximately $130 million for the C-130 program primarily due to lower volume on sustainment activities and about $130 million for the C-5 program due to lower volume as deliveries under the current production modernization program were completed in the third quarter of 2018.
Aeronautics’ operating profit in
2018
increased
$96 million
, or
4%
, compared to
2017
. Operating profit increased approximately $250 million for the F-35 program due to increased volume on higher margin production contracts and new development activities and better performance on sustainment. This increase was partially offset by a decrease of about $65 million for the C-130 program due to lower risk retirements and lower sustainment volume; about $60 million for the F-16 program due to lower risk retirements; and about $35 million for the C-5 program due to lower risk retirements and lower production volume. Adjustments not related to volume, primarily net profit booking rate adjustments, were about $175 million lower in
2018
compared to
2017
.
2017
compared to
2016
Aeronautics’ net sales in
2017
increased
$2.1 billion
, or
12%
, compared to
2016
. The increase was primarily attributable to higher net sales of approximately $2.0 billion for the F-35 program due to increased volume on production and sustainment; about $155 million for the C-130 program primarily due to increased production volume and due to aircraft configuration mix; and about
38
$95 million for the F-22 program due to higher volume on aircraft modernization programs. These increases were partially offset by a decrease of approximately $195 million for the C-5 program due to lower production volume.
Aeronautics’ operating profit in
2017
increased
$331 million
, or
18%
, compared to
2016
. Operating profit increased approximately $300 million for the F-35 program due to increased volume on aircraft production and sustainment activities and higher risk retirements and about $85 million for the F-16 program due to higher risk retirements partially offset by lower volume on aircraft modernization programs. These increases were partially offset by a decrease of about $30 million due to lower equity earnings from an investee. Adjustments not related to volume, primarily net profit booking rate adjustments, were about $245 million higher in
2017
compared to
2016
.
Backlog
Backlog increased in
2018
compared to
2017
and in
2017
compared to
2016
primarily due to higher orders on F-35 production and sustainment programs.
Trends
We currently expect Aeronautics’ 2019 net sales to increase in the high-single digit percentage range as compared to 2018 driven by the increased volume on the F-35 program. Operating profit is also expected to increase in the high-single digit percentage range, resulting in comparable operating profit margins in 2019 as compared to 2018.
Missiles and Fire Control
Our MFC business segment provides air and missile defense systems; tactical missiles and air-to-ground precision strike weapon systems; logistics; fire control systems; mission operations support, readiness, engineering support and integration services; manned and unmanned ground vehicles; and energy management solutions. MFC’s major programs include PAC‑3, THAAD, MLRS, Hellfire, JASSM, Javelin, Apache, SNIPER
®
, LANTIRN
®
and Special Operations Forces Global Logistics Support Services (SOF GLSS). MFC’s operating results included the following (in millions):
|
2018
|
|
2017
|
|
2016
|
|
||||||||||
|
Net sales
|
$
|
8,462
|
|
$
|
7,282
|
|
$
|
6,789
|
|
||||||
|
Operating profit
|
1,248
|
|
1,034
|
|
1,004
|
|
|||||||||
|
Operating margin
|
14.7
|
|
%
|
14.2
|
|
%
|
14.8
|
|
%
|
||||||
|
Backlog at year-end
|
$
|
21,363
|
|
$
|
17,729
|
|
$
|
14,204
|
|
||||||
2018
compared to
2017
MFC’s net sales in
2018
increased
$1.2 billion
, or
16%
, compared to the same period in
2017
. The increase was primarily attributable to higher net sales of approximately $925 million for tactical and strike missile programs due to increased volume (primarily classified programs and precision fires); and about $185 million for sensors and global sustainment programs due to increased volume (primarily LANTIRN, SNIPER, and Apache).
MFC’s operating profit in
2018
increased
$214 million
, or
21%
, compared to
2017
. Operating profit increased approximately $140 million for tactical and strike missile programs due to reserves which were recorded in 2017 but did not recur in 2018 (primarily Joint Air to Ground Missile (JAGM)), higher risk retirements (primarily precision fires and Hellfire) and higher volume (primarily precision fires); and about $50 million for sensors and global sustainment programs due to higher risk retirements and higher volume (primarily LANTIRN, SNIPER, and Apache), after charges of approximately $85 million previously recorded in 2018 for performance matters on the Warrior Capability Sustainment Program. Adjustments not related to volume, including net profit booking rate adjustments and other items, were about $200 million higher in
2018
compared to
2017
.
2017
compared to
2016
MFC’s net sales in
2017
increased
$493 million
, or
7%
, compared to
2016
. The increase was attributable to higher net sales of approximately $205 million for integrated air and missile defense programs due to contract mix on certain programs (primarily PAC-3) and increased volume on certain programs (primarily THAAD); and about $135 million for sensors and global sustainment programs due to increased volume (primarily SOF GLSS and LANTIRN
and SNIPER); and about $110 million for tactical and strike missile programs due to product configuration mix (primarily precision fires) and increased volume (primarily classified programs).
39
MFC’s operating profit in
2017
increased
$30 million
, or
3%
, compared to
2016
. Operating profit increased about $85 million for integrated air and missile defense programs due to increased volume (primarily THAAD), contract mix (primarily PAC-3), and a reserve recorded in fiscal year 2016 for a contractual matter that did not recur in 2017; and about $85 million for sensors and global sustainment programs due to increased risk retirements and higher volume (primarily LANTIRN and SNIPER). These increases were partially offset by a decrease of approximately $120 million for tactical and strike missile programs due to lower risk retirements (primarily precision fires and Hellfire) and the establishment of a reserve on a program. Adjustments not related to volume, including net profit booking rate adjustments and other items, were about $10 million higher in
2017
compared to
2016
.
Backlog
Backlog
increased
in
2018
compared to
2017
primarily due to higher orders on PAC-3, precision fires, and other tactical missiles programs. Backlog
increased
in
2017
compared to
2016
primarily due to higher orders on Hellfire, precision fires and PAC-3.
Trends
We currently expect MFC’s net sales to increase in the low-double digit percentage range in 2019 as compared to 2018 driven by key contract awards in 2018 and higher volume in the tactical and strike missiles business. Operating profit is expected to increase in the high-single digit percentage range in 2019 as compared to 2018 driven by the increase in sales volume. Operating profit margin for 2019 is expected to be slightly lower than 2018 levels.
Rotary and Mission Systems
Our RMS business segment provides design, manufacture, service and support for a variety of military and commercial helicopters; ship and submarine mission and combat systems; mission systems and sensors for rotary and fixed-wing aircraft; sea and land-based missile defense systems; radar systems; the Littoral Combat Ship (LCS); simulation and training services; and unmanned systems and technologies. In addition, RMS supports the needs of government customers in cybersecurity and delivers communication and command and control capabilities through complex mission solutions for defense applications. RMS’ major programs include Black Hawk and Seahawk helicopters, Aegis Combat System (Aegis), LCS, CH-53K King Stallion helicopter, VH-92A helicopter program, Advanced Hawkeye Radar System, and the Command, Control, Battle Management and Communications (C2BMC) contract. Additionally, during the fourth quarter of 2017, we realigned certain programs within the RMS business segment to align with changes in management structure. RMS’ operating results included the following (in millions):
|
2018
|
|
2017
|
|
2016
|
|
||||||||||
|
Net sales
|
$
|
14,250
|
|
$
|
13,663
|
|
$
|
13,595
|
|
||||||
|
Operating profit
|
1,302
|
|
902
|
|
845
|
|
|||||||||
|
Operating margin
|
9.1
|
|
%
|
6.6
|
|
%
|
6.2
|
|
%
|
||||||
|
Backlog at year-end
|
$
|
31,320
|
|
$
|
30,030
|
|
$
|
29,029
|
|
||||||
2018
compared to
2017
RMS’ net sales in
2018
increased
$587 million
, or
4%
, compared to
2017
. The increase was primarily attributable to higher net sales of approximately $525 million for IWSS programs due to higher volume (primarily radar surveillance systems programs and Multi Mission Surface Combatant); and about $250 million for C6ISR programs due to higher volume on multiple programs. These increases were partially offset by a decrease of approximately $270 million for Sikorsky helicopter programs, which reflect lower volume for Black Hawk production, partially offset by higher volume for CH-53K King Stallion development and for mission systems programs.
RMS’ operating profit in
2018
increased
$400 million
, or
44%
, compared to
2017
. Operating profit increased approximately $185 million for C6ISR programs due to charges of $120 million for performance matters on the EADGE-T contract, recorded in 2017 but which did not recur in 2018, and due to higher risk retirements (primarily undersea systems programs); about $155 million for Sikorsky helicopter programs due to better cost performance across the Sikorsky portfolio and better cost performance on the Multi-Year IX contract; and about $105 million for IWSS programs due to higher risk retirements and higher volume (primarily Aegis). Adjustments not related to volume, including net profit booking rate adjustments and other items, were about $185 million higher in
2018
compared to
2017
.
40
2017
compared to
2016
RMS’ net sales in
2017
increased
$68 million
, or
1%
, compared to
2016
. The increase was primarily attributable to approximately $85 million for training and logistics services programs due to higher volume; about $55 million for IWSS programs due to higher volume (primarily Aegis); and about $40 million for Sikorsky helicopter programs due to certain adjustments recorded in 2016 required to account for the acquisition, partially offset by lower volume on certain helicopter programs. These increases were partially offset by a decrease of about $100 million for C6ISR programs due to lower volume.
RMS’ operating profit in
2017
increased
$57 million
, or
7%
, compared to
2016
. Operating profit increased about $120 million for Sikorsky helicopter programs due to certain adjustments recorded in 2016 required to account for the acquisition; and about $30 million for IWSS programs due to higher volume and increased risk retirements, partially offset by a $20 million charge for performance matters on the Vertical Launching System (VLS) program. This increase was offset by a decrease of $105 million for C6ISR programs primarily due to a net $95 million increase for charges for performance matters on the EADGE-T contract. Adjustments not related to volume, including net profit booking rate adjustments and other items, were about $45 million lower in
2017
compared to
2016
.
Backlog
Backlog
increased
in
2018
compared to
2017
primarily due to higher orders on IWSS and C6ISR programs. Backlog
increased
in
2017
compared to
2016
primarily due to a new multi-year award at Sikorsky.
Trends
We currently expect RMS’ net sales to be slightly above 2018 levels. Operating profit is also expected to be slightly above 2018 levels resulting in similar operating profit margins in 2019 as compared to 2018.
Space
Our Space business segment is engaged in the research and development, design, engineering and production of satellites, strategic and defensive missile systems and space transportation systems. Space provides network-enabled situational awareness and integrates complex space and ground-based global systems to help our customers gather, analyze, and securely distribute critical intelligence data. Space is also responsible for various classified systems and services in support of vital national security systems. Space’s major programs include the Trident II D5 Fleet Ballistic Missile (FBM), AWE, Orion Multi-Purpose Crew Vehicle (Orion), Space Based Infrared System (SBIRS) and Next Generation Overhead Persistent Infrared (Next Gen OPIR) system, Global Positioning System (GPS) III, Advanced Extremely High Frequency (AEHF), and The Mobile User Objective System (MUOS). Operating profit for our Space business segment includes our share of earnings for our investment in ULA, which provides expendable launch services to the U.S. Government. Space’s operating results included the following (in millions):
|
2018
|
|
2017
|
|
2016
|
|
||||||||||
|
Net sales
|
$
|
9,808
|
|
$
|
9,605
|
|
$
|
9,613
|
|
||||||
|
Operating profit
|
1,055
|
|
980
|
|
1,288
|
|
|||||||||
|
Operating margin
|
10.8
|
|
%
|
10.2
|
|
%
|
13.4
|
|
%
|
||||||
|
Backlog at year-end
|
$
|
22,184
|
|
$
|
22,042
|
|
$
|
25,226
|
|
||||||
2018
compared to
2017
Space’s net sales in
2018
increased
$203 million
, or
2%
, compared to
2017
. The increase was primarily attributable to higher net sales of approximately $225 million for strategic and missile defense programs due to higher volume (primarily AWE and FBM) and about $65 million for the Orion program due to higher volume. These increases were partially offset by a decrease of approximately $70 million for commercial satellite programs due to lower volume and about $25 million for government satellite programs due to lower volume.
Space’s operating profit in
2018
increased
$75 million
, or
8%
, compared to
2017
. Operating profit increased approximately $40 million for commercial satellite programs, which reflect a lower amount of charges recorded for performance matters on certain programs; and about $30 million for government satellite programs primarily due to higher volume and higher risk retirements for government satellite services. Adjustments not related to volume, including net profit booking rate adjustments and other items, were about $30 million higher in
2018
compared to
2017
.
41
2017
compared to
2016
Space’s net sales in
2017
were comparable with
2016
. The slight decrease was attributable to a decrease of approximately $300 million for space transportation programs due to a reduction in launch-related events; about $245 million for government satellite programs (primarily AEHF and SBIRS) due to lower volume; approximately $190 million across other programs (including the Orion program) due to lower volume; and about $90 million for commercial satellite programs due to lower volume. These decreases were partially offset by an increase of approximately $810 million due to a full year of net sales from AWE in 2017 compared to four months of sales in 2016, which we began consolidating during the third quarter of 2016.
Space’s operating profit in
2017
decreased
$308 million
, or
24%
, compared to
2016
. Operating profit decreased $127 million due to the pre-tax gain recorded in 2016 related to the consolidation of AWE; about $95 million for lower equity earnings from ULA; about $30 million for space transportation programs due to a reduction in launch-related events; about $35 million for government satellite programs (primarily SBIRS and AEHF) due to a charge for performance matters and lower volume; and a net decrease of about $35 million related to charges recorded in 2017 for performance matters on certain commercial satellite programs. Adjustments not related to volume, including net profit booking rate adjustments and other items, were about $20 million higher in
2017
compared to
2016
.
Equity earnings
Total equity earnings recognized by Space (primarily ULA) represented approximately
$210 million
,
$205 million
and
$325 million
, or
20%
,
21%
and
25%
of this business segment’s operating profit during
2018
,
2017
and
2016
.
Backlog
Backlog
increased
in
2018
compared to
2017
primarily due to new orders on government satellite programs, specifically Next Gen OPIR and GPS III. Backlog
decreased
in
2017
compared to
2016
primarily due to lower orders for government satellite programs, partially offset by higher orders on the Orion program.
Trends
We currently expect Space's 2019 net sales to be comparable to 2018 levels. Operating profit in 2019 is expected to decrease in the low-double digit percentage range as compared to 2018 driven by lower equity earnings in 2019 compared to 2018. As a result, operating profit margin in 2019 is expected to decrease from 2018 levels.
Liquidity and Cash Flows
We have a balanced cash deployment strategy to enhance stockholder value and position ourselves to take advantage of new business opportunities when they arise. Consistent with that strategy, we have continued to invest in our business, including capital expenditures, independent research and development and, selective business acquisitions and investments, while returning cash to stockholders through dividends and share repurchases, and managing our debt levels, maturities and interest rates and pension obligations.
We have generated strong operating cash flows, which have been the primary source of funding for our operations, capital expenditures, debt service and repayments, dividends, share repurchases and postretirement benefit plan contributions. Our strong operating cash flows enabled our Board of Directors to approve two key cash deployment initiatives in September 2018. First, we increased our dividend rate in the fourth quarter by
10%
to
$2.20
per share. Second, the Board of Directors approved a
$1.0 billion
increase to our share repurchase program. Inclusive of this increase, the total remaining authorization for future common share repurchases under our program was
$3.0 billion
as of
December 31, 2018
.
We expect our cash from operations will continue to be sufficient to support our operations and anticipated capital expenditures for the foreseeable future. However, we expect to continue to issue commercial paper backed by our
$2.5 billion
revolving credit facility to manage the timing of cash flows. We also have additional access to credit markets, if needed, for liquidity or general corporate purposes, and letters of credit to support customer advance payments and for other trade finance purposes such as guaranteeing our performance on particular contracts. See our “Capital Structure, Resources and Other” section below for a discussion on available financial resources.
We made contributions of
$5.0 billion
to our qualified defined benefit pension plans in
2018, including required and discretionary contributions. As a result of these contributions, we do not expect to make contributions to our qualified defined benefit pension plans in 2019. We funded these contributions in 2018 using a mix of cash on hand and commercial paper.
42
During 2016, we received a one-time, tax-free special cash payment of approximately $1.8 billion as a result of the divestiture of the IS&GS business in the third quarter of 2016. We used the proceeds to repay $500 million of long-term notes at their scheduled maturity and paid $484 million in dividends with a portion of this cash. The remainder was used for share repurchases.
Cash received from customers, either from the payment of invoices for work performed or for advances in excess of costs incurred, is our primary source of cash. We generally do not begin work on contracts until funding is appropriated by the customer. However, we may determine to fund customer programs ourselves pending government appropriations and are doing so with increased frequency. If we incur costs in excess of funds obligated on the contract, we may be at risk for reimbursement of the excess costs.
Billing timetables and payment terms on our contracts vary based on a number of factors, including the contract type. We generally bill and collect cash more frequently under cost-reimbursable contracts, which represent approximately
38%
of the sales we recorded in
2018
, as we are authorized to bill as the costs are incurred. A number of our fixed-price contracts may provide for performance-based payments, which allow us to bill and collect cash as we perform on the contract. The amount of performance-based payments and the related milestones are encompassed in the negotiation of each contract. The timing of such payments may differ from our incurrence of costs related to our contract performance, thereby affecting our cash flows.
The U.S. Government has indicated that it would consider progress payments as the baseline for negotiating payment terms on fixed-price contracts, rather than performance-based payments. In contrast to negotiated performance-based payment terms, progress payment provisions correspond to a percentage of the amount of costs incurred during the performance of the contract. While the total amount of cash collected on a contract is the same, performance-based payments have had a more favorable impact on the timing of our cash flows. In addition, our cash flows may be affected if the U.S. Government decides to withhold payments on our billings. While the impact of withholding payments delays the receipt of cash, the cumulative amount of cash collected during the life of the contract will not vary.
The majority of our capital expenditures for
2018
and those planned for
2019
are for equipment, facilities infrastructure and information technology. Expenditures for equipment and facilities infrastructure are generally incurred to support new and existing programs across all of our business segments. For example, we have projects underway in our Aeronautics business segment for facilities and equipment to support higher production of the F-35 combat aircraft, and we have projects underway to modernize certain of our facilities. We also incur capital expenditures for information technology to support programs and general enterprise information technology infrastructure, inclusive of costs for the development or purchase of internal-use software.
The following table provides a summary of our cash flow information followed by a discussion of the key elements (in millions):
|
2018
|
|
2017
|
|
2016
|
|
|||||||
|
Cash and cash equivalents at beginning of year
|
$
|
2,861
|
|
$
|
1,837
|
|
$
|
1,090
|
|
|||
|
Operating activities
|
||||||||||||
|
Net earnings
|
5,046
|
|
1,963
|
|
5,173
|
|
||||||
|
Non-cash adjustments
|
1,186
|
|
4,530
|
|
(35
|
)
|
||||||
|
Changes in working capital
|
(1,401
|
)
|
(427
|
)
|
(826
|
)
|
||||||
|
Other, net
|
(1,693
|
)
|
410
|
|
877
|
|
||||||
|
Net cash provided by operating activities
|
3,138
|
|
6,476
|
|
5,189
|
|
||||||
|
Net cash used for investing activities
|
(1,075
|
)
|
(1,147
|
)
|
(985
|
)
|
||||||
|
Net cash used for financing activities
|
(4,152
|
)
|
(4,305
|
)
|
(3,457
|
)
|
||||||
|
Net change in cash and cash equivalents
|
(2,089
|
)
|
1,024
|
|
747
|
|
||||||
|
Cash and cash equivalents at end of year
|
$
|
772
|
|
$
|
2,861
|
|
$
|
1,837
|
|
|||
Operating Activities
2018
compared to
2017
Net cash provided by operating activities
decreased
$3.3 billion
in
2018
compared to
2017
primarily due to contributions of
$5.0 billion
to our qualified defined benefit pension plans in 2018 and an increase in cash used for working capital of
$974 million
, partially offset by an increase in net earnings and a decrease in income tax payments. The increase in cash used for working capital was largely driven by the timing of cash collections for the F-35 program and Sikorsky helicopter programs. We received net income tax refunds of
$41 million
during the year ended
December 31, 2018
compared to making net income tax payments of
$1.1 billion
during the year ended December 31,
2017
. Net refunds in 2018 were primarily the result a 2017 net operating loss carryback arising from our accelerated pension contributions. Our effective income tax rate and cash tax payments in 2018 benefited
43
materially from the enactment of the Tax Act in 2017. We made interest payments of approximately
$635 million
and approximately
$610 million
during the years ended
December 31, 2018
and
2017
.
2017
compared to
2016
Net cash provided by operating activities increased
$1.3 billion
in
2017
compared to
2016
primarily due to a decrease in cash used for working capital, a reduction in cash paid for income taxes and a reduction in cash paid for severance. The decrease in cash used for working capital was largely driven by timing of cash collections (primarily PAC-3, THAAD, LANTIRN and SNIPER, and Sikorsky helicopter programs). We made net income tax payments of $1.1 billion and $1.3 billion during the years ended December 31, 2017 and 2016. We made interest payments of approximately $610 million and approximately $600 million during the years ended December 31, 2017 and 2016. In addition, cash provided by operating activities during the year ended December 31, 2016 included cash generated by IS&GS of approximately $310 million as we retained this cash as part of the divestiture.
Investing Activities
Net cash used for investing activities
decreased
$72 million
in
2018
compared to
2017
, primarily due to approximately $105 million of cash received as part of the final settlement of net working capital in connection with the 2016 divestiture of our IS&GS business and cash received for various other items, none of which were individually significant, partially offset by
higher
capital expenditures. Net cash used for investing activities increased
$162 million
in
2017
compared to
2016
, primarily due to higher capital expenditures and cash proceeds received in 2016 related to properties sold.
Capital expenditures amounted to
$1.3 billion
in
2018
,
$1.2 billion
in
2017
and
$1.1 billion
in
2016
. The majority of our capital expenditures were for equipment and facilities infrastructure that generally are incurred to support new and existing programs across all of our business segments. We also incur capital expenditures for information technology to support programs and general enterprise information technology infrastructure, inclusive of costs for the development or purchase of internal-use-software.
Financing Activities
Net cash used for financing activities
decreased
$153 million
in
2018
compared to
2017
primarily due to
$600 million
of net proceeds from the issuance of commercial paper and a reduction in cash used for repurchases of common stock, partially offset by the repayment of long-term debt in 2018 and an increase in dividend payments.
Net cash used for financing activities increased
$848 million
in
2017
compared to
2016
primarily due to the receipt of a one-time special cash payment in 2016 from the divestiture of the IS&GS business and higher dividend payments in 2017, partially offset by the repayment of long-term debt in 2016 and a reduction in cash used for repurchases of common stock.
In November 2018, we repaid
$750 million
of long-term notes with a fixed interest rate of
1.85%
according to their scheduled maturities.
In September 2016, we repaid
$500 million
of long-term notes with a fixed interest rate of
2.13%
according to their scheduled maturities. In May 2016, we repaid
$452 million
of long-term notes with a fixed interest rate of
7.65%
according to their scheduled maturities.
For additional information about our debt financing activities see the “Capital Structure, Resources and Other” discussion below and “
Note 10 – Debt
” included in our Notes to Consolidated Financial Statements.
We paid dividends totaling
$2.3 billion
(
$8.20
per share) in
2018
,
$2.2 billion
(
$7.46
per share) in
2017
and
$2.0 billion
(
$6.77
per share) in
2016
.
We paid quarterly dividends of
$2.00
per share during each of the first three quarters of
2018
and
$2.20
per share during the fourth quarter of
2018
;
$1.82
per share during each of the first three quarters of
2017
and
$2.00
per share during the fourth quarter of
2017
; and
$1.65
per share during each of the first three quarters of
2016
and
$1.82
per share during the fourth quarter of
2016
.
We paid
$1.5 billion
,
$2.0 billion
and
$2.1 billion
to repurchase
4.7 million
,
7.1 million
and
8.9 million
shares of our common stock during
2018
,
2017
and
2016
.
44
Capital Structure, Resources and Other
At
December 31, 2018
, we held cash and cash equivalents of
$772 million
that was generally available to fund ordinary business operations without significant legal, regulatory, or other restrictions.
Our outstanding debt, net of unamortized discounts and issuance costs, amounted to
$14.1 billion
at
December 31, 2018
and is mainly in the form of publicly-issued notes that bear interest at fixed rates.
As of
December 31, 2018
, we had
$1.5 billion
of short-term borrowings due within one year, of which approximately
$900 million
was composed of scheduled debt maturity due in November 2019 and approximately
$600 million
was composed of commercial paper borrowings with a weighted-average rate of
2.89%
. During
2017
, we borrowed and fully repaid amounts under our commercial paper programs. There were no commercial paper borrowings outstanding as of
December 31, 2017
.
As of
December 31, 2018
, we were in compliance with all covenants contained in our debt and credit agreements.
We actively seek to finance our business in a manner that preserves financial flexibility while minimizing borrowing costs to the extent practicable. We review changes in financial market and economic conditions to manage the types, amounts and maturities of our indebtedness. We may at times refinance existing indebtedness, vary our mix of variable-rate and fixed-rate debt or seek alternative financing sources for our cash and operational needs.
On occasion, our customers may seek deferred payment terms to purchase our products. In connection with these transactions, we may, at our customer’s request, enter into arrangements for the non-recourse sale of customer receivables to unrelated third–party financial institutions. For accounting purposes, these transactions are not discounted and are treated as a sale of receivables as we have no continuing involvement. The sale proceeds from the financial institutions are reflected in our operating cash flows on the statement of cash flows.
We sold approximately
$532 million
in
2018
and
$698 million
in
2017
of customer receivables. There were
no
gains or losses related to sales of these receivables.
Revolving Credit Facilities
On August 24, 2018, we entered into a new
$2.5 billion
revolving credit facility (the 5-year Facility) with various banks and concurrently terminated our existing
$2.5 billion
revolving credit facility.
The 5‑year Facility has an expiration date of August 24, 2023 and is available for general corporate purposes. The undrawn portion of the 5-year Facility is also available to serve as a backup facility for the issuance of commercial paper. We may request and the banks may grant, at their discretion, an increase in the borrowing capacity under the 5-year Facility of up to an additional
$500 million
.
There were
no
borrowings outstanding under the 5-year Facility as of
December 31, 2018
and
2017
.
Borrowings under the 5-year Facility are unsecured and bear interest at rates based, at our option, on a Eurodollar Rate or a Base Rate, as defined in the 5-year Facility’s agreement. Each bank’s obligation to make loans under the 5-year Facility is subject to, among other things, our compliance with various representations, warranties, and covenants, including covenants limiting our ability and certain of our subsidiaries’ ability to encumber assets and a covenant not to exceed a maximum leverage ratio, as defined in the 5‑year Facility agreement.
Long-Term Debt
In November 2018, we repaid
$750 million
of long-term notes with a fixed interest rate of
1.85%
according to their scheduled maturities.
In September 2017, we issued notes totaling approximately
$1.6 billion
with a fixed interest rate of
4.09%
maturing in September 2052 (the New Notes) in exchange for outstanding notes totaling approximately
$1.4 billion
with fixed interest rates ranging from
4.70%
to
8.50%
maturing
2029
to
2046
(the Old Notes). In connection with the exchange of principal, we paid a premium of
$237 million
, substantially all of which was in the form of New Notes. This premium will be amortized as additional interest expense over the term of the New Notes using the effective interest method. We may, at our option, redeem some or all of the New Notes at any time by paying the principal amount of notes being redeemed plus a make-whole premium and accrued and unpaid interest. Interest on the New Notes is payable on March 15 and September 15 of each year and began on March 15, 2018. The New Notes are unsecured senior obligations and rank equally in right of payment with all of our existing and future unsecured and unsubordinated indebtedness.
In September 2016, we repaid
$500 million
of long-term notes with a fixed interest rate of
2.13%
according to their scheduled maturities. In May 2016, we repaid
$452 million
of long-term notes with a fixed interest rate of
7.65%
according to their scheduled maturities.
We also had related variable interest rate swaps with a notional amount of
$450 million
mature, which did not have a significant impact on net earnings or comprehensive income.
45
We have an effective shelf registration statement on Form S-3 on file with the U.S. Securities and Exchange Commission to provide for the issuance of an indeterminate amount of debt securities.
Total Equity
Our total equity was
$1.4 billion
at
December 31, 2018
compared to a deficit of
$776 million
at
December 31, 2017
. The increase in equity was primarily due to net earnings of
$5.0 billion
, recognition of previously deferred postretirement benefit plan amounts of
$1.2 billion
, and employee stock activity of
$406 million
(including the impacts of stock option exercises, ESOP activity and stock-based compensation), partially offset by the annual December 31 re-measurement adjustment related to our postretirement benefit plans of
$501 million
, the repurchase of
4.7 million
common shares for
$1.5 billion
; and dividends declared of
$2.3 billion
during the year.
As we repurchase our common shares, we reduce common stock for the $1 of par value of the shares repurchased, with the excess purchase price over par value recorded as a reduction of additional paid-in capital. If additional paid-in capital is reduced to zero, we record the remainder of the excess purchase price over par value as a reduction of retained earnings. Due to the volume of repurchases made under our share repurchase program, additional paid-in capital was reduced to zero, with the remainder of the excess purchase price over par value of
$1.1 billion
recorded as a reduction of retained earnings in
2018
.
Contractual Commitments and Off-Balance Sheet Arrangements
At
December 31, 2018
, we had contractual commitments to repay debt, make payments under operating leases, settle obligations related to agreements to purchase goods and services and settle tax and other liabilities. Capital lease obligations were not material. Payments due under these obligations and commitments are as follows (in millions):
|
|
Payments Due By Period
|
|||||||||||||||||||
|
Total
|
Less Than
1 Year
|
Years
2 and 3
|
Years
4 and 5
|
After
5 Years
|
||||||||||||||||
|
Total debt
(a)
|
$
|
15,299
|
|
$
|
1,500
|
|
$
|
2,150
|
|
$
|
625
|
|
$
|
11,024
|
|
|||||
|
Interest payments
|
9,885
|
|
609
|
|
1,110
|
|
1,009
|
|
7,157
|
|
||||||||||
|
Other liabilities
|
2,773
|
|
259
|
|
536
|
|
382
|
|
1,596
|
|
||||||||||
|
Operating lease obligations
|
1,297
|
|
305
|
|
331
|
|
202
|
|
459
|
|
||||||||||
|
Purchase obligations:
|
|
|||||||||||||||||||
|
Operating activities
|
50,784
|
|
22,862
|
|
22,745
|
|
3,422
|
|
1,755
|
|
||||||||||
|
Capital expenditures
|
487
|
|
392
|
|
95
|
|
—
|
|
—
|
|
||||||||||
|
Total contractual cash obligations
|
$
|
80,525
|
|
$
|
25,927
|
|
|
$
|
26,967
|
|
|
$
|
5,640
|
|
|
$
|
21,991
|
|
||
|
(a)
|
Total debt includes scheduled principal payments and the repayment of commercial paper and excludes approximately $13 million of debt issued by a consolidated joint venture as we do not guarantee the debt.
|
The table above excludes estimated minimum funding requirements for our qualified defined benefit pension plans. For additional information about our future minimum contributions for these plans, see “
Note 11 – Postretirement Benefit Plans
” included in our Notes to Consolidated Financial Statements. Amounts related to other liabilities represent the contractual obligations for certain long-term liabilities recorded as of
December 31, 2018
. Such amounts mainly include expected payments under non-qualified pension plans, environmental liabilities and deferred compensation plans.
Purchase obligations related to operating activities include agreements and contracts that give the supplier recourse to us for cancellation or nonperformance under the contract or contain terms that would subject us to liquidated damages. Such agreements and contracts may, for example, be related to direct materials, obligations to subcontractors and outsourcing arrangements. Total purchase obligations for operating activities in the preceding table include approximately $45.9 billion related to contractual commitments entered into as a result of contracts we have with our U.S. Government customers. The U.S. Government generally would be required to pay us for any costs we incur relative to these commitments if they were to terminate the related contracts “for convenience” under the Federal Acquisition Regulation (FAR), subject to available funding. This also would be true in cases where we perform subcontract work for a prime contractor under a U.S. Government contract. The termination for convenience language also may be included in contracts with foreign, state and local governments. We also have contracts with customers that do not include termination for convenience provisions, including contracts with commercial customers.
Purchase obligations in the preceding table for capital expenditures generally include facilities infrastructure, equipment and information technology.
46
We also may enter into industrial cooperation agreements, sometimes referred to as offset agreements, as a condition to obtaining orders for our products and services from certain customers in foreign countries. These agreements are designed to enhance the social and economic environment of the foreign country by requiring the contractor to promote investment in the country. Offset agreements may be satisfied through activities that do not require us to use cash, including transferring technology, providing manufacturing and other consulting support to in-country projects and the purchase by third parties (e.g.
,
our vendors) of supplies from in-country vendors. These agreements also may be satisfied through our use of cash for such activities as purchasing supplies from in-country vendors, providing financial support for in-country projects, establishment of ventures with local companies and building or leasing facilities for in-country operations. We typically do not commit to offset agreements until orders for our products or services are definitive. The amounts ultimately applied against our offset agreements are based on negotiations with the customer and typically require cash outlays that represent only a fraction of the original amount in the offset agreement. Satisfaction of our offset obligations are included in the estimates of our total costs to complete the contract and may impact our sales, profitability and cash flows. Our ability to recover investments on our consolidated balance sheet that we make to satisfy offset obligations is generally dependent upon the successful operation of ventures that we do not control and may involve products and services that are dissimilar to our business activities. At
December 31, 2018
, the notional value of remaining obligations under our outstanding offset agreements totaled approximately $12.1 billion, which primarily relate to our Aeronautics, MFC and RMS business segments, most of which extend through 2044. To the extent we have entered into purchase or other obligations at
December 31, 2018
that also satisfy offset agreements, those amounts are included in the preceding table. Offset programs usually extend over several years and may provide for penalties, estimated at approximately $1.5 billion at
December 31, 2018
, in the event we fail to perform in accordance with offset requirements. While historically we have not been required to pay material penalties, resolution of offset requirements are often the result of negotiations and subjective judgments.
In connection with our
50%
ownership interest of ULA, we and The Boeing Company (Boeing) were previously required to provide ULA an additional capital contribution if ULA was unable to make required payments under its inventory supply agreement with Boeing. In the fourth quarter of 2018, ULA fully satisfied its obligations under this inventory supply agreement and we no longer have any obligation to provide ULA an additional capital contribution under this agreement.
We have entered into standby letters of credit and surety bonds issued on our behalf by financial institutions, and directly issued guarantees to third parties primarily relating to advances received from customers and the guarantee of future performance on certain contracts. Letters of credit and surety bonds generally are available for draw down in the event we do not perform. In some cases, we may guarantee the contractual performance of third parties such as venture partners.
At
December 31, 2018
, we had the following outstanding letters of credit, surety bonds and third-party guarantees (in millions):
|
|
Commitment Expiration By Period
|
|||||||||||||||||||
|
Total
Commitment
|
Less Than
1 Year
|
Years
2 and 3
|
Years
4 and 5
|
After
5 Years
|
||||||||||||||||
|
Standby letters of credit
(a)
|
$
|
2,284
|
|
$
|
1,302
|
|
$
|
707
|
|
$
|
247
|
|
$
|
28
|
|
|||||
|
Surety bonds
|
425
|
|
414
|
|
11
|
|
—
|
|
—
|
|
||||||||||
|
Third-party Guarantees
|
850
|
|
185
|
|
270
|
|
2
|
|
393
|
|
||||||||||
|
Total commitments
|
$
|
3,559
|
|
$
|
1,901
|
|
$
|
988
|
|
$
|
249
|
|
$
|
421
|
|
|||||
|
(a)
|
Approximately $925 million of standby letters of credit in the “Less Than 1 Year” category, $357 million in the “Years 2 and 3” category and $24 million in the “Years 4 and 5” category are expected to renew for additional periods until completion of the contractual obligation.
|
At
December 31, 2018
, third-party guarantees totaled
$850 million
, of which approximately
65%
related to guarantees of contractual performance of ventures to which we currently are or previously were a party. This amount represents our estimate of the maximum amount we would expect to incur upon the contractual non-performance of the venture, venture partners or divested businesses. Generally, we also have cross-indemnities in place that may enable us to recover amounts that may be paid on behalf of a venture partner.
In determining our exposures, we evaluate the reputation, performance on contractual obligations, technical capabilities and credit quality of our current and former venture partners and the transferee under novation agreements all of which include a guarantee as required by the FAR. There were no material amounts recorded in our financial statements related to third-party guarantees or novation agreements.
47
Critical Accounting Policies
Contract Accounting / Sales Recognition
The majority of our net sales are generated from long-term contracts with the U.S. Government and international customers (including foreign military sales (FMS) contracted through the U.S. Government) for the research, design, development, manufacture, integration and sustainment of advanced technology systems, products and services. We provide our products and services under fixed-price and cost-reimbursable contracts.
Under fixed-price contracts, we agree to perform the specified work for a pre-determined price. To the extent our actual costs vary from the estimates upon which the price was negotiated, we will generate more or less profit or could incur a loss. Some fixed-price contracts have a performance-based component under which we may earn incentive payments or incur financial penalties based on our performance.
Cost-reimbursable contracts provide for the payment of allowable costs incurred during performance of the contract plus a fee up to a ceiling based on the amount that has been funded. Typically, we enter into
three
types of cost-reimbursable contracts: cost-plus-award-fee, cost-plus-incentive-fee, and cost-plus-fixed-fee. Cost-plus-award-fee contracts provide for an award fee that varies within specified limits based on the customer’s assessment of our performance against a predetermined set of criteria, such as targets based on cost, quality, technical and schedule criteria. Cost-plus-incentive-fee contracts provide for reimbursement of costs plus a fee, which is adjusted by a formula based on the relationship of total allowable costs to total target costs (i.e., incentive based on cost) or reimbursement of costs plus an incentive to exceed stated performance targets (i.e., incentive based on performance). The fixed-fee in a cost-plus-fixed-fee contract is negotiated at the inception of the contract and that fixed-fee does not vary with actual costs.
We account for a contract after it has been approved by all parties to the arrangement, the rights of the parties are identified, payment terms are identified, the contract has commercial substance and collectability of consideration is probable.
We assess each contract at its inception to determine whether it should be combined with other contracts. When making this determination, we consider factors such as whether two or more contracts were negotiated and executed at or near the same time or were negotiated with an overall profit objective. If combined, we treat the combined contracts as a single contract for revenue recognition purposes.
We evaluate the products or services promised in each contract at inception to determine whether the contract should be accounted for as having one or more performance obligations. The products and services in our contracts are typically not distinct from one another due to their complex relationships and the significant contract management functions required to perform under the contract. Accordingly, our contracts are typically accounted for as one performance obligation. In limited cases, our contracts have more than one distinct performance obligation, which occurs when we perform activities that are not highly complex or interrelated or involve different product lifecycles. Significant judgment is required in determining performance obligations, and these decisions could change the amount of revenue and profit recorded in a given period. We classify net sales as products or services on our consolidated statements of earnings based on the predominant attributes of the performance obligations.
We determine the transaction price for each contract based on the consideration we expect to receive for the products or services being provided under the contract. For contracts where a portion of the price may vary we estimate variable consideration at the most likely amount, which is included in the transaction price to the extent it is probable that a significant reversal of cumulative revenue recognized will not occur. We analyze the risk of a significant revenue reversal and if necessary constrain the amount of variable consideration recognized in order to mitigate this risk.
At the inception of a contract we estimate the transaction price based on our current rights and do not contemplate future modifications (including unexercised options) or follow-on contracts until they become legally enforceable. Contracts are often subsequently modified to include changes in specifications, requirements or price, which may create new or change existing enforceable rights and obligations. Depending on the nature of the modification, we consider whether to account for the modification as an adjustment to the existing contract or as a separate contract. Generally, modifications to our contracts are not distinct from the existing contract due to the significant integration and interrelated tasks provided in the context of the contract. Therefore, such modifications are accounted for as if they were part of the existing contract and recognized as a cumulative adjustment to revenue.
For contracts with multiple performance obligations, we allocate the transaction price to each performance obligation based on the estimated standalone selling price of the product or service underlying each performance obligation. The standalone selling price represents the amount we would sell the product or service to a customer on a standalone basis (i.e., not bundled with any other products or services). Our contracts with the U.S. Government, including FMS contracts, are subject to the Federal Acquisition
48
Regulations (FAR) and the price is typically based on estimated or actual costs plus a reasonable profit margin. As a result of these regulations, the standalone selling price of products or services in our contracts with the U.S. Government and FMS contracts are typically equal to the selling price stated in the contract.
For non-U.S. Government contracts with multiple performance obligations, we evaluate whether the stated selling prices for the products or services represent their standalone selling prices. We primarily sell customized solutions unique to a customer’s specifications. When it is necessary to allocate the transaction price to multiple performance obligations, we typically use the expected cost plus a reasonable profit margin to estimate the standalone selling price of each product or service. We occasionally sell standard products or services with observable standalone sales transactions. In these situations, the observable standalone sales transactions are used to determine the standalone selling price.
We recognize revenue as performance obligations are satisfied and the customer obtains control of the products and services. In determining when performance obligations are satisfied, we consider factors such as contract terms, payment terms and whether there is an alternative future use of the product or service. Substantially all of our revenue is recognized over time as we perform under the contract because control of the work in process transfers continuously to the customer. For contracts with the U.S. Government and FMS contracts, this continuous transfer of control of the work in process to the customer is supported by clauses in the contract that allow the customer to unilaterally terminate the contract for convenience, pay us for costs incurred plus a reasonable profit, and take possession of any work in process. Our non-U.S. Government contracts, primarily international direct commercial contracts, typically do not include termination for convenience provisions. However, continuous transfer of control to our customer is supported and, if our customer were to terminate the contract for reasons other than our non-performance, we would have the right to recover damages which would include, among other potential damages, the right to payment for our work performed to date plus a reasonable profit to deliver products or services that do not have an alternative use to us.
For performance obligations to deliver products with continuous transfer of control to the customer, revenue is recognized based on the extent of progress towards completion of the performance obligation, generally using the percentage-of-completion cost-to-cost measure of progress for our contracts because it best depicts the transfer of control to the customer as we incur costs on our contracts. Under the percentage-of-completion cost-to-cost measure of progress, the extent of progress towards completion is measured based on the ratio of costs incurred to date to the total estimated costs to complete the performance obligation(s). For performance obligations to provide services to the customer, revenue is recognized over time based on costs incurred or the right to invoice method (in situations where the value transferred matches our billing rights) as our customer receives and consumes the benefits.
For performance obligations in which control does not continuously transfer to the customer, we recognize revenue at the point in time in which each performance obligation is fully satisfied. This coincides with the point in time the customer obtains control of the product or service, which typically occurs upon customer acceptance or receipt of the product or service, given that we maintain control of the product or service until that point.
Significant estimates and assumptions are made in estimating contract sales and costs, including the profit booking rate. At the outset of a long-term contract, we identify and monitor risks to the achievement of the technical, schedule and cost aspects of the contract, as well as variable consideration, and assess the effects of those risks on our estimates of sales and total costs to complete the contract. The estimates consider the technical requirements (e.g., a newly-developed product versus a mature product), the schedule and associated tasks (e.g., the number and type of milestone events) and costs (e.g., material, labor, subcontractor, overhead, general and administrative and the estimated costs to fulfill our industrial cooperation agreements, sometimes referred to as offset or localization agreements, required under certain contracts with international customers). The initial profit booking rate of each contract considers risks surrounding the ability to achieve the technical requirements, schedule and costs in the initial estimated total costs to complete the contract. Profit booking rates may increase during the performance of the contract if we successfully retire risks surrounding the technical, schedule and cost aspects of the contract, which decreases the estimated total costs to complete the contract or may increase the variable consideration we expect to receive on the contract. Conversely, our profit booking rates may decrease if the estimated total costs to complete the contract increase or our estimates of variable consideration we expect to receive decrease. All of the estimates are subject to change during the performance of the contract and may affect the profit booking rate. When estimates of total costs to be incurred on a contract exceed total estimates of the transaction price, a provision for the entire loss is determined at the contract level and is recorded in the period in which the loss is determined.
Comparability of our segment sales, operating profit and operating margin may be impacted favorably or unfavorably by changes in profit booking rates on our contracts for which we recognize revenue over time using the percentage-of-completion cost-to-cost method to measure progress towards completion. Increases in the profit booking rates, typically referred to as risk retirements, usually relate to revisions in the estimated total costs to fulfill the performance obligations that reflect improved conditions on a particular contract. Conversely, conditions on a particular contract may deteriorate, resulting in an increase in the estimated total costs to fulfill the performance obligations and a reduction in the profit booking rate. Increases or decreases in profit booking rates are recognized in the current period and reflect the inception-to-date effect of such changes. Segment operating
49
profit and margin may also be impacted favorably or unfavorably by other items, which may or may not impact sales. Favorable items may include the positive resolution of contractual matters, cost recoveries on severance and restructuring charges, insurance recoveries and gains on sales of assets. Unfavorable items may include the adverse resolution of contractual matters; restructuring charges, except for significant severance actions, which are excluded from segment operating results; reserves for disputes; certain asset impairments; and losses on sales of certain assets.
Other Contract Accounting Considerations
The majority of our sales are driven by pricing based on costs incurred to produce products or perform services under contracts with the U.S. Government. Cost-based pricing is determined under the FAR. The FAR provides guidance on the types of costs that are allowable in establishing prices for goods and services under U.S. Government contracts. For example, costs such as those related to charitable contributions, interest expense and certain advertising and public relations activities are unallowable and, therefore, not recoverable through sales. In addition, we may enter into advance agreements with the U.S. Government that address the subjects of allowability and allocability of costs to contracts for specific matters. For example, most of the environmental costs we incur for environmental remediation related to sites operated in prior years are allocated to our current operations as general and administrative costs under FAR provisions and supporting advance agreements reached with the U.S. Government.
We closely monitor compliance with and the consistent application of our critical accounting policies related to contract accounting. Costs incurred and allocated to contracts are reviewed for compliance with U.S. Government regulations by our personnel and are subject to audit by the Defense Contract Audit Agency.
Postretirement Benefit Plans
Overview
Many of our employees participate in qualified and nonqualified defined benefit pension plans, retiree medical and life insurance plans and other postemployment plans (collectively, postretirement benefit plans - see “
Note 11 – Postretirement Benefit Plans
” included in our Notes to Consolidated Financial Statements). The majority of our accrued benefit obligations relate to our qualified defined benefit pension plans and retiree medical and life insurance plans. We recognize on a plan-by-plan basis the net funded status of these postretirement benefit plans under GAAP as either an asset or a liability on our consolidated balance sheets. The GAAP funded status represents the difference between the fair value of each plan’s assets and the benefit obligation of the plan. The GAAP benefit obligation represents the present value of the estimated future benefits we currently expect to pay to plan participants based on past service.
In June 2014, we amended certain of our qualified and nonqualified defined benefit pension plans for non-union employees, comprising the majority of our benefit obligations, to freeze future retirement benefits. The calculation of retirement benefits under the affected defined benefit pension plans is determined by a formula that takes into account the participants’ years of credited service and average compensation. The freeze takes effect in two stages. On January 1, 2016, the pay-based component of the formula used to determine retirement benefits was frozen so that future pay increases, annual incentive bonuses or other amounts earned for or related to periods after December 31, 2015 are not used to calculate retirement benefits. On January 1, 2020, the service-based component of the formula used to determine retirement benefits will also be frozen so that participants will no longer earn further credited service for any period after December 31, 2019. When the freeze is complete, the majority of our salaried employees will have transitioned to an enhanced defined contribution retirement savings plan.
Additionally, in recent years we have taken other actions to mitigate the effect of our defined benefit pension plan on our financial results. For example, in December 2018, a Lockheed Martin qualified defined benefit pension plan purchased two contracts from insurance companies covering $2.6 billion of our outstanding defined benefit pension obligations.
First, in
December 2018, an upfront cash payment of
$810 million
was made to an insurance company in exchange for a contract (referred to as a buy-in contract) that will reimburse the plan for all future benefit payments related to
$770 million
of the plan’s outstanding defined benefit pension obligations for approximately
9,000
U.S. retirees and beneficiaries. On December 31, 2018, the approximately 9,000 retirees and beneficiaries and the buy-in contract were spun-off to another plan, with the buy-in contract the sole asset of that plan. Under the arrangement, the plan remains responsible for paying the benefits for the covered retirees and beneficiaries and the insurance company will reimburse the plan as those benefits are paid. As a result, there is no net ongoing cash flow to the plan for the covered retirees and beneficiaries as the cost of providing the benefits is funded by the buy-in contract, effectively locking in the cost of the benefits and eliminating future volatility of the benefit obligation. The buy-in contract was purchased using assets from the pension trust and is accounted for at fair value as an investment of the trust. This transaction had no impact on our 2018 FAS pension expense or CAS pension cost. The difference of approximately
$40 million
between the amount paid to the insurance company and the amount of the pension obligations funded by the buy-in contract was recognized through the re-measurement of the related benefit obligations in other comprehensive loss in equity and will be amortized
50
to FAS pension expense in future periods. We intend to begin the termination process for this plan during 2019, and at conclusion convert the buy-in contract to a buy-out contract, thus relieving us of liability for the pension obligations related to the covered population. The buy-out conversion, expected to occur as early as 2020, will require recognition of a settlement loss in earnings at that time, which we currently estimate will be approximately
$350 million
. A subsequent cash recovery is anticipated from the U.S. Government.
Also, during December 2018, we purchased an irrevocable group annuity contract from an insurance company (referred to as a buy-out contract) for
$1.82 billion
to settle
$1.76 billion
of our outstanding defined benefit pension obligations related to certain U.S. retirees and beneficiaries. The group annuity contract was purchased using assets from the pension trust. As a result of this transaction, we were relieved of all responsibility for these pension obligations and the insurance company is now required to pay and administer the retirement benefits owed to approximately
32,000
U.S. retirees and beneficiaries, with no change to the amount, timing or form of monthly retirement benefit payments. Although the transaction was treated as a settlement for accounting purposes, we did not recognize a loss on the settlement in earnings associated with the transaction because total settlements during 2018 for this plan were less than this plan’s service and interest cost in 2018. Accordingly, the transaction had no impact on our 2018 FAS pension expense or CAS pension cost, and the difference of approximately
$60 million
between the amount paid to the insurance company and the amount of the pension obligations settled was recognized in other comprehensive loss and will be amortized to FAS pension expense in future periods.
Notwithstanding these actions, the impact of these plans and benefits on our earnings may be volatile in that the amount of expense we record and the funded status for our postretirement benefit plans may materially change from year to year because those calculations are sensitive to funding levels as well as changes in several key economic assumptions, including interest rates, actual rates of return on plan assets and other actuarial assumptions including participant longevity and employee turnover, as well as the timing of cash funding.
Actuarial Assumptions
The plan assets and benefit obligations are measured at the end of each year or more frequently, upon the occurrence of certain events such as a significant plan amendment, settlement or curtailment. The amounts we record are measured using actuarial valuations, which are dependent upon key assumptions such as discount rates, the expected long-term rate of return on plan assets, participant longevity, employee turnover and the health care cost trend rates for our retiree medical plans. The assumptions we make affect both the calculation of the benefit obligations as of the measurement date and the calculation of net periodic benefit cost in subsequent periods. When reassessing these assumptions we consider past and current market conditions and make judgments about future market trends. We also consider factors such as the timing and amounts of expected contributions to the plans and benefit payments to plan participants.
We continue to use a single weighted average discount rate approach when calculating our consolidated benefit obligations related to our defined benefit pension plans resulting in
4.250%
at
December 31, 2018
, compared to
3.625%
at
December 31, 2017
and
4.125%
at
December 31, 2016
. We utilized a single weighted average discount rate of
4.250%
when calculating our benefit obligations related to our retiree medical and life insurance plans at
December 31, 2018
, compared to
3.625%
at
December 31, 2017
and
4.00%
at
December 31, 2016
. We evaluate several data points in order to arrive at an appropriate single weighted average discount rate, including results from cash flow models, quoted rates from long-term bond indices and changes in long-term bond rates over the past year. As part of our evaluation, we calculate the approximate average yields on corporate bonds rated AA or better selected to match our projected postretirement benefit plan cash flows.
We utilized an expected long-term rate of return on plan assets of
7.00%
at
December 31, 2018
compared to
7.50%
for both
December 31, 2017
and
December 31, 2016
. The long-term rate of return assumption represents the expected long-term rate of return on the funds invested or to be invested, to provide for the benefits included in the benefit obligations. This assumption is based on several factors including historical market index returns, the anticipated long-term allocation of plan assets, the historical return data for the trust funds, plan expenses and the potential to outperform market index returns. The difference between the long-term rate of return on plan assets assumption we select and the actual return on plan assets in any given year affects both the funded status of our benefit plans and the calculation of FAS pension expense in subsequent periods. Although the actual return in any specific year likely will differ from the assumption, the average expected return over a long-term future horizon should be approximately equal to the assumption. Any variance in a given year should not, by itself, suggest that the assumption should be changed. Patterns of variances are reviewed over time, and then combined with expectations for the future. As a result, changes in this assumption are less frequent than changes in the discount rate.
In both October
2018
and
2017
, the Society of Actuaries published revised longevity assumptions that refined its prior studies. We used the revised assumptions indicating a shortened longevity in our
December 31, 2018
and
December 31, 2017
re-measurements of benefit obligation. The publications were a refinement to assumptions the Society of Actuaries published in previous years, beginning in 2014.
51
Our stockholders’ equity has been reduced cumulatively by
$14.3 billion
from the annual year-end measurements of the funded status of postretirement benefit plans. The cumulative non-cash, after-tax reduction primarily represents net actuarial losses resulting from declines in discount rates, investment losses and updated longevity. A market-related value of our plan assets, determined using actual asset gains or losses over the prior three year period, is used to calculate the amount of deferred asset gains or losses to be amortized. These cumulative actuarial losses will be amortized to expense using the corridor method, where gains and losses are recognized to the extent they exceed 10% of the greater of plan assets or benefit obligations, over the average future service period of employees expected to receive benefits under the plans of approximately nine years as of
December 31, 2018
. This amortization period is expected to extend (approximately double) in 2020 when our non-union pension plans are completely frozen to use the average remaining life expectancy of the participants instead of average future service. During
2018
,
$1.2 billion
of these amounts was recognized as a component of postretirement benefit plans expense and about $908 million is expected to be recognized as expense in
2019
.
The discount rate and long-term rate of return on plan assets assumptions we select at the end of each year are based on our best estimates and judgment. A change of plus or minus 25 basis points in the
4.250%
discount rate assumption at
December 31, 2018
, with all other assumptions held constant, would have decreased or increased the amount of the qualified pension benefit obligation we recorded at the end of
2018
by approximately $1.4 billion, which would result in an after-tax increase or decrease in stockholders’ equity at the end of the year of approximately $1.1 billion. If the
4.250%
discount rate at
December 31, 2018
that was used to compute the expected
2019
FAS pension expense for our qualified defined benefit pension plans had been 25 basis points higher or lower, with all other assumptions held constant, the amount of FAS pension expense projected for
2019
would be lower or higher by approximately $120 million. If the
7.00%
expected long-term rate of return on plan assets assumption at
December 31, 2018
that was used to compute the expected
2019
FAS pension expense for our qualified defined benefit pension plans had been 25 basis points higher or lower, with all other assumptions held constant, the amount of FAS pension expense projected for
2019
would be lower or higher by approximately $85 million. Each year, differences between the actual plan asset return and the expected long-term rate of return on plan assets impacts the measurement of the following year’s FAS expense. Every 100 basis points difference in return during
2018
between our negative actual rate of return of approximately
5.00%
and our expected long-term rate of return of
7.50%
impacted
2019
expected FAS pension expense by approximately $20 million.
Funding Considerations
We made contributions of $5.0 billion to our qualified defined benefit pension plans in 2018. There were no material contributions to our qualified defined benefit pension plans in 2017 and 2016. Funding of our qualified defined benefit pension plans is determined in a manner consistent with CAS and in accordance with the Employee Retirement Income Security Act of 1974 (ERISA), as amended by the Pension Protection Act of 2006 (PPA).
Contributions to our defined benefit pension plans are recovered over time through the pricing of our products and services on U.S. Government contracts, including FMS, and are recognized in our cost of sales and net sales. CAS govern the extent to which our pension costs are allocable to and recoverable under contracts with the U.S. Government, including FMS. We recovered $2.4 billion in
2018
, $2.2 billion in
2017
, and $2.0 billion in
2016
as CAS pension costs. Effective February 27, 2012 and fully transitioned to in 2017, the CAS rules were revised to better align the recovery of pension costs, including prepayment credits, on U.S. Government contracts with the minimum funding requirements of the PPA (referred to as CAS Harmonization).
Pension cost recoveries under CAS occur in different periods from when pension contributions are made under the PPA. Amounts contributed in excess of the CAS pension costs recovered under U.S. Government contracts are considered to be prepayment credits under the CAS rules. As of
December 31, 2018
, our prepayment credits were approximately $8.5 billion as compared to $6.3 billion at
December 31, 2017
. The increase was due to our cash contributions of $5.0 billion in 2018 compared to our $2.4 billion in CAS recoveries. Cash contributions in excess of the recovery of CAS pension costs under U.S. Government contracts increases the prepayment credit balance. The prepayment credit balance will also increase or decrease based on our actual investment return on plan assets.
Trends
We made contributions of
$5.0 billion
to our qualified defined benefit pension plans in
2018
, including required and discretionary contributions. As a result of these contributions, we do not expect to make contributions to our qualified defined benefit pension plans in 2019.
We anticipate recovering approximately $2.6 billion of CAS pension cost in
2019
allowing us to recuperate a portion of our CAS prepayment credits.
We expect our
2019
FAS pension expense to be $1.1 billion; compared to our
2018
FAS pension expense of
$1.4 billion
. The impact of the higher FAS discount rate of
4.25%
for
2019
versus
3.625%
for
2018
was partly offset by our negative actual rate of investment return in
2018
of approximately
5.00%
versus our expected long-term rate of return of
7.50%
. We expect a FAS/CAS
52
pension benefit in
2019
of about
$1.5
billion, as compared to
$1.0 billion
in
2018
, due to the lower
2019
FAS pension expense and higher 2019 CAS pension cost as compared to
2018
.
Environmental Matters
We are a party to various agreements, proceedings and potential proceedings for environmental remediation issues, including matters at various sites where we have been designated a potentially responsible party (PRP). At
December 31, 2018
and
2017
, the total amount of liabilities recorded on our consolidated balance sheet for environmental matters was
$864 million
and
$920 million
. We have recorded receivables totaling
$750 million
and
$799 million
at
December 31, 2018
and
2017
for the portion of environmental costs that are probable of future recovery in pricing of our products and services for agencies of the U.S. Government, as discussed below. The amount that is expected to be allocated to our non-U.S. Government contracts or that is determined to not be recoverable under U.S. Government contracts has been expensed through cost of sales. We project costs and recovery of costs over approximately
20 years
.
We enter into agreements (e.g.
,
administrative consent orders, consent decrees) that document the extent and timing of some of our environmental remediation obligations. We also are involved in environmental remediation activities at sites where formal agreements either do not exist or do not quantify the extent and timing of our obligations. Environmental remediation activities usually span many years, which makes estimating the costs more judgmental due to, for example, changing remediation technologies. To determine the costs related to clean up sites, we have to assess the extent of contamination, effects on natural resources, the appropriate technology to be used to accomplish the remediation, and evolving environmental standards.
We perform quarterly reviews of environmental remediation sites and record liabilities and receivables in the period it becomes probable that a liability has been incurred and the amounts can be reasonably estimated (see the discussion under “Environmental Matters” in “
Note 1 – Significant Accounting Policies
” and “
Note 14 – Legal Proceedings, Commitments and Contingencies
” included in our Notes to Consolidated Financial Statements). We consider the above factors in our quarterly estimates of the timing and amount of any future costs that may be required for environmental remediation activities, which results in the calculation of a range of estimates for a particular environmental remediation site. We do not discount the recorded liabilities, as the amount and timing of future cash payments are not fixed or cannot be reliably determined. Given the required level of judgment and estimation, it is likely that materially different amounts could be recorded if different assumptions were used or if circumstances were to change (e.g.
,
a change in environmental standards or a change in our estimate of the extent of contamination).
Under agreements reached with the U.S. Government, most of the amounts we spend for environmental remediation are allocated to our operations as general and administrative costs. Under existing U.S. Government regulations, these and other environmental expenditures relating to our U.S. Government business, after deducting any recoveries received from insurance or other PRPs, are allowable in establishing prices of our products and services. As a result, most of the expenditures we incur are included in our net sales and cost of sales according to U.S. Government agreement or regulation, regardless of the contract form (e.g. cost-reimbursable, fixed-price). We continually evaluate the recoverability of our environmental receivables by assessing, among other factors, U.S. Government regulations, our U.S. Government business base and contract mix, our history of receiving reimbursement of such costs, and recent efforts by some U.S. Government representatives to limit such reimbursement.
In addition to the proceedings and potential proceedings discussed above, California previously established a maximum level of the contaminant hexavalent chromium in drinking water of 10 parts per billion (ppb). This standard was successfully challenged by the California Manufacturers and Technology Association (CMTA) for failure to conduct the required economic feasibility analysis. In response to the court’s ruling, the State Water Resources Control Board (State Board), a branch of the California Environmental Protection Agency, withdrew the hexavalent chromium standard from the published regulations, leaving only the 50 ppb standard for total chromium. The State Board has indicated it will work to re-establish a hexavalent chromium standard. If the standard for hexavalent chromium is re‑established at 10 ppb or above, it will not have a material impact on our existing environmental remediation costs in California. Further, the U.S. Environmental Protection Agency (U.S. EPA) is considering whether to regulate hexavalent chromium.
California is also reevaluating its existing drinking water standard of 6 ppb for perchlorate, and the U.S. EPA is taking steps to regulate perchlorate in drinking water. If substantially lower standards are adopted, in either California or at the federal level for perchlorate or for hexavalent chromium, we expect a material increase in our estimates for environmental liabilities and the related assets for the portion of the increased costs that are probable of future recovery in the pricing of our products and services for the U.S. Government. The amount that would be allocable to our non-U.S. Government contracts or that is determined not to be recoverable under U.S. Government contracts would be expensed, which may have a material effect on our earnings in any particular interim reporting period.
As disclosed above, we may record changes in the amount of environmental remediation liabilities as a result of our quarterly reviews of the status of our environmental remediation sites, which would result in a change to the corresponding environmental
53
remediation receivables and a charge to earnings. For example, if we were to determine that the liabilities should be increased by $100 million, the corresponding receivables would be increased by approximately $87 million, with the remainder recorded as a charge to earnings. This allocation is determined annually, based upon our existing and projected business activities with the U.S. Government.
We cannot reasonably determine the extent of our financial exposure at all environmental remediation sites with which we are involved. There are a number of former operating facilities we are monitoring or investigating for potential future environmental remediation. In some cases, although a loss may be probable, it is not possible at this time to reasonably estimate the amount of any obligation for remediation activities because of uncertainties (e.g., assessing the extent of the contamination). During any particular quarter, such uncertainties may be resolved, allowing us to estimate and recognize the initial liability to remediate a particular former operating site. The amount of the liability could be material. Upon recognition of the liability, a portion will be recognized as a receivable with the remainder charged to earnings, which may have a material effect in any particular interim reporting period.
If we are ultimately found to have liability at those sites where we have been designated a PRP, we expect that the actual costs of environmental remediation will be shared with other liable PRPs. Generally, PRPs that are ultimately determined to be responsible parties are strictly liable for site remediation and usually agree among themselves to share, on an allocated basis, the costs and expenses for environmental investigation and remediation. Under existing environmental laws, responsible parties are jointly and severally liable and, therefore, we are potentially liable for the full cost of funding such remediation. In the unlikely event that we were required to fund the entire cost of such remediation, the statutory framework provides that we may pursue rights of cost recovery or contribution from the other PRPs. The amounts we record do not reflect the fact that we may recover some of the environmental costs we have incurred through insurance or from other PRPs, which we are required to pursue by agreement and U.S. Government regulation.
Goodwill
The assets and liabilities of acquired businesses are recorded under the acquisition method of accounting at their estimated fair values at the date of acquisition. Goodwill represents costs in excess of fair values assigned to the underlying identifiable net assets of acquired businesses.
Our goodwill balance was
$10.8 billion
at
December 31, 2018
and
2017
. We perform an impairment test of our goodwill at least annually in the fourth quarter or more frequently whenever events or changes in circumstances indicate the carrying value of goodwill may be impaired. Such events or changes in circumstances may include a significant deterioration in overall economic conditions, changes in the business climate of our industry, a decline in our market capitalization, operating performance indicators, competition, reorganizations of our business, U.S. Government budget restrictions or the disposal of all or a portion of a reporting unit. Our goodwill has been allocated to and is tested for impairment at a level referred to as the reporting unit, which is our business segment level or a level below the business segment. The level at which we test goodwill for impairment requires us to determine whether the operations below the business segment constitute a self-sustaining business for which discrete financial information is available and segment management regularly reviews the operating results.
We may use both qualitative and quantitative approaches when testing goodwill for impairment. For selected reporting units where we use the qualitative approach, we perform a qualitative evaluation of events and circumstances impacting the reporting unit to determine the likelihood of goodwill impairment. Based on that qualitative evaluation, if we determine it is more likely than not that the fair value of a reporting unit exceeds its carrying amount, no further evaluation is necessary. Otherwise we perform a quantitative impairment test. We perform quantitative tests for most reporting units at least once every three years. However, for certain reporting units we may perform a quantitative impairment test every year.
To perform the quantitative impairment test, we compare the fair value of a reporting unit to its carrying value, including goodwill. If the fair value of a reporting unit exceeds its carrying value, goodwill of the reporting unit is not impaired. If the carrying value of the reporting unit, including goodwill, exceeds its fair value, a goodwill impairment loss is recognized in an amount equal to that excess. We generally estimate the fair value of each reporting unit using a combination of a discounted cash flow (DCF) analysis and market-based valuation methodologies such as comparable public company trading values and values observed in recent business acquisitions. Determining fair value requires the exercise of significant judgments, including the amount and timing of expected future cash flows, long-term growth rates, discount rates and relevant comparable public company earnings multiples and relevant transaction multiples. The cash flows employed in the DCF analysis are based on our best estimate of future sales, earnings and cash flows after considering factors such as general market conditions, U.S. Government budgets, existing firm orders, expected future orders, contracts with suppliers, labor agreements, changes in working capital, long term business plans and recent operating performance. The discount rates utilized in the DCF analysis are based on the respective reporting unit’s weighted average cost of capital, which takes into account the relative weights of each component of capital structure (equity and debt) and represents the expected cost of new capital, adjusted as appropriate to consider the risk inherent
54
in future cash flows of the respective reporting unit. The carrying value of each reporting unit includes the assets and liabilities employed in its operations, goodwill and allocations of amounts held at the business segment and corporate levels.
In the fourth quarter of
2018
, we performed our annual goodwill impairment test for each of our reporting units. The results of that test indicated that for each of our reporting units, including Sikorsky, no impairment existed. As of the date of our annual impairment test, the carrying value of our Sikorsky reporting unit includes goodwill of
$2.7 billion
and exceeds its fair value by a margin of approximately 20%. The carrying value and fair value of our Sikorsky reporting unit is closely aligned. Therefore, any business deterioration, changes in timing of orders, contract cancellations or terminations, or negative changes in market factors could cause our sales, earnings and cash flows to decline below current projections. Similarly, market factors utilized in the impairment analysis, including long-term growth rates, discount rates and relevant comparable public company earnings multiples and transaction multiples, could negatively impact the fair value of our reporting units. Based on our assessment of these circumstances, we have determined that goodwill at our Sikorsky reporting unit is at risk for impairment should there be deterioration of projected cash flows, negative changes in market factors or a significant increase in the carrying value of the reporting unit.
Impairment assessments inherently involve management judgments regarding a number of assumptions such as those described above. Due to the many variables inherent in the estimation of a reporting unit’s fair value and the relative size of our recorded goodwill, differences in assumptions could have a material effect on the estimated fair value of one or more of our reporting units and could result in a goodwill impairment charge in a future period.
Intangible Assets
Intangible assets from acquired businesses are recognized at their estimated fair values at the date of acquisition and consist of customer programs, trademarks, customer relationships, technology and other intangible assets. Customer programs include values assigned to major programs of acquired businesses and represent the aggregate value associated with the customer relationships, contracts, technology and trademarks underlying the associated program and are amortized on a straight-line basis over a period of expected cash flows used to measure the fair value, which ranges from
nine
to
20
years. Acquired intangibles deemed to have indefinite lives are not amortized, but are subject to annual impairment testing. This testing compares carrying value to fair value and, when appropriate, the carrying value of these assets is reduced to fair value. Finite-lived intangibles are amortized to expense over the applicable useful lives, ranging from
three
to
20
years, based on the nature of the asset and the underlying pattern of economic benefit as reflected by future net cash inflows. We perform an impairment test of finite-lived intangibles whenever events or changes in circumstances indicate their carrying value may be impaired.
Should events or changes in circumstances indicate the carrying value of a finite-lived intangible may be impaired, the sum of the undiscounted future cash flows expected to result from the use of the asset group would be compared to the asset group’s carrying value. Should the asset group’s carrying amount exceed the sum of the undiscounted future cash flows, we would determine the fair value of the asset group and record an impairment loss in net earnings.
The carrying value of our Sikorsky business includes an indefinite-lived trademark intangible asset of
$887 million
as of
December 31, 2018
. In the fourth quarter of
2018
, we performed the annual impairment test for the Sikorsky indefinite-lived trademark intangible asset and the results indicated that no impairment existed. As of the date of our annual impairment test, the Sikorsky trademark exceeded its carrying value by a margin of approximately 5%. Additionally, our Sikorsky business has finite-lived customer program intangible assets with carrying values of
$2.4 billion
as of
December 31, 2018
. Any business deterioration, contract cancellations or terminations, or negative changes in market factors could cause our sales to decline below current projections. Based on our assessment of these circumstances, we have determined that our Sikorsky intangible assets are at risk for impairment should there be any business deterioration, contract cancellations or terminations, or negative changes in market factors.
Recent Accounting Pronouncements
See “
Note 1 – Significant Accounting Policies
” included in our Notes to Consolidated Financial Statements (under the caption “Recent Accounting Pronouncements”).
55
ITEM 7A.
Quantitative and Qualitative Disclosures About Market Risk
We maintain active relationships with a broad and diverse group of U.S. and international financial institutions. We believe that they provide us with sufficient access to the general and trade credit we require to conduct our business. We continue to closely monitor the financial market environment and actively manage counterparty exposure to minimize the potential impact from adverse developments with any single credit provider while ensuring availability of, and access to, sufficient credit resources.
Our main exposure to market risk relates to interest rates, foreign currency exchange rates and market prices on certain equity securities. Our financial instruments that are subject to interest rate risk principally include fixed-rate long-term debt and commercial paper. The estimated fair value of our outstanding debt was
$15.4 billion
at
December 31, 2018
and the outstanding principal amount was
$15.3 billion
, excluding unamortized discounts and issuance costs of
$1.2 billion
. A 10% change in the level of interest rates would not have a material impact on the fair value of our outstanding debt at
December 31, 2018
.
We use derivative instruments principally to reduce our exposure to market risks from changes in foreign currency exchange rates and interest rates. We do not enter into or hold derivative instruments for speculative trading purposes. We transact business globally and are subject to risks associated with changing foreign currency exchange rates. We enter into foreign currency hedges such as forward and option contracts that change in value as foreign currency exchange rates change. Our most significant foreign currency exposures relate to the British pound sterling, the euro, the Canadian dollar and the Australian dollar. These contracts hedge forecasted foreign currency transactions in order to mitigate fluctuations in our earnings and cash flows associated with changes in foreign currency exchange rates. As a result, we do not have material foreign currency exposure, including exposure to the pound sterling or euro should there be material foreign currency fluctuations due to the United Kingdom departing from the European Union (commonly referred to as Brexit). We designate foreign currency hedges as cash flow hedges. We also are exposed to the impact of interest rate changes primarily through our borrowing activities. For fixed rate borrowings, we may use variable interest rate swaps, effectively converting fixed rate borrowings to variable rate borrowings indexed to LIBOR in order to reduce the amount of interest paid. These swaps are designated as fair value hedges. For variable rate borrowings, we may use fixed interest rate swaps, effectively converting variable rate borrowings to fixed rate borrowings in order to mitigate the impact of interest rate changes on earnings. These swaps are designated as cash flow hedges. We also may enter into derivative instruments that are not designated as hedges and do not qualify for hedge accounting, which are intended to mitigate certain economic exposures.
The classification of gains and losses resulting from changes in the fair values of derivatives is dependent on our intended use of the derivative and its resulting designation. Adjustments to reflect changes in fair values of derivatives attributable to the effective portion of hedges are either reflected in earnings and largely offset by corresponding adjustments to the hedged items or reflected net of income taxes in accumulated other comprehensive loss until the hedged transaction is recognized in earnings. Changes in the fair value of the derivatives that are attributable to the ineffective portion of the hedges, or of derivatives that are not considered to be highly effective hedges, if any, are immediately recognized in earnings. The aggregate notional amount of our outstanding interest rate swaps at
December 31, 2018
and
2017
was
$1.3 billion
and
$1.2 billion
. The aggregate notional amount of our outstanding foreign currency hedges at
December 31, 2018
and
2017
was
$3.5 billion
and
$4.1 billion
. At
December 31, 2018
and
2017
, the net fair value of our derivative instruments was not material (see “
Note 16 – Fair Value Measurements
” included in our Notes to Consolidated Financial Statements). A 10% unfavorable exchange rate movement of our foreign currency contracts would not have a material impact on the aggregate net fair value of such contracts or our consolidated financial statements. Additionally, as we enter into foreign currency contract to hedge foreign currency exposure on underlying transactions we believe that any movement on our foreign currency contracts would be offset by movement on the underlying transactions and, therefore, when taken together do not create material risk.
We evaluate the credit quality of potential counterparties to derivative transactions and only enter into agreements with those deemed to have acceptable credit risk at the time the agreements are executed. Our foreign currency exchange hedge portfolio is diversified across several banks. We periodically monitor changes to counterparty credit quality as well as our concentration of credit exposure to individual counterparties. We do not hold or issue derivative financial instruments for trading or speculative purposes.
We maintain a separate trust that includes investments to fund certain of our non-qualified deferred compensation plans. As of
December 31, 2018
, investments in the trust totaled
$1.3 billion
and are reflected at fair value on our consolidated balance sheet in other noncurrent assets. The trust holds investments in marketable equity securities and fixed-income securities that are exposed to price changes and changes in interest rates. A portion of the liabilities associated with the deferred compensation plans supported by the trust is also impacted by changes in the market price of our common stock and certain market indices. Changes in the value of the liabilities have the effect of partially offsetting the impact of changes in the value of the trust. Both the change in the fair value of the trust and the change in the value of the liabilities are recognized on our consolidated statements of earnings in other unallocated, net and were not material for the year ended
December 31, 2018
.
56
ITEM 8.
Financial Statements and Supplementary Data
Report of Independent Registered Public Accounting Firm
on the Audited Consolidated Financial Statements
Board of Directors and Stockholders
Lockheed Martin Corporation
Opinion on the Financial Statements
We have audited the accompanying consolidated balance sheets of Lockheed Martin Corporation (the Corporation) as of December 31, 2018 and 2017, the related consolidated statements of earnings, comprehensive income, equity and cash flows for each of the three years in the period ended December 31, 2018, and the related notes (collectively referred to as the “consolidated financial statements”). In our opinion, the consolidated financial statements present fairly, in all material respects, the consolidated financial position of the Corporation at December 31, 2018 and 2017, and the consolidated results of its operations and its cash flows for each of the three years in the period ended December 31, 2018, in conformity with U.S. generally accepted accounting principles.
We also have audited, in accordance with the standards of the Public Company Accounting Oversight Board (United States) (PCAOB), the Corporation’s internal control over financial reporting as of December 31, 2018, based on criteria established in
Internal Control-Integrated Framework
issued by the Committee of Sponsoring Organizations of the Treadway Commission (2013 framework) and our report dated February 8, 2019 expressed an unqualified opinion thereon.
Adoption of Accounting Standards Update (ASU) No. 2014-09,
Revenue from Contracts with Customers (Topic 606)
As discussed in Note 1 to the consolidated financial statements, the Corporation changed its method for accounting for revenue from contracts with customers in the consolidated financial statements due to the adoption of ASU No. 2014-09,
Revenue from Contracts with Customers (Topic 606)
, as amended, using the full retrospective adoption method.
Basis for Opinion
These financial statements are the responsibility of the Corporation’s management. Our responsibility is to express an opinion on the Corporation’s financial statements based on our audits. We are a public accounting firm registered with the PCAOB and are required to be independent with respect to the Corporation in accordance with the U.S. federal securities laws and the applicable rules and regulations of the Securities and Exchange Commission and the PCAOB.
We conducted our audits in accordance with the standards of the PCAOB. Those standards require that we plan and perform the audit to obtain reasonable assurance about whether the financial statements are free of material misstatement, whether due to error or fraud. Our audits included performing procedures to assess the risks of material misstatement of the financial statements, whether due to error or fraud, and performing procedures that respond to those risks. Such procedures included examining, on a test basis, evidence regarding the amounts and disclosures in the financial statements. Our audits also included evaluating the accounting principles used and significant estimates made by management, as well as evaluating the overall presentation of the financial statements. We believe that our audits provide a reasonable basis for our opinion.
/s/ Ernst & Young LLP
We have served as the Corporation’s auditor since 1994.
Tysons, Virginia
February 8, 2019
57
Lockheed Martin Corporation
Consolidated Statements of Earnings
(in millions, except per share data)
|
|
Years Ended December 31,
|
|||||||||||
|
2018
|
|
2017
|
|
2016
|
|
|||||||
|
Net sales
|
||||||||||||
|
Products
|
$
|
45,005
|
|
$
|
42,502
|
|
$
|
40,081
|
|
|||
|
Services
|
8,757
|
|
7,458
|
|
7,209
|
|
||||||
|
Total net sales
|
53,762
|
|
49,960
|
|
47,290
|
|
||||||
|
Cost of sales
|
||||||||||||
|
Products
|
(40,293
|
)
|
(38,417
|
)
|
(36,394
|
)
|
||||||
|
Services
|
(7,738
|
)
|
(6,673
|
)
|
(6,423
|
)
|
||||||
|
Severance and restructuring charges
|
(96
|
)
|
—
|
|
(80
|
)
|
||||||
|
Other unallocated, net
|
1,639
|
|
1,501
|
|
1,008
|
|
||||||
|
Total cost of sales
|
(46,488
|
)
|
(43,589
|
)
|
(41,889
|
)
|
||||||
|
Gross profit
|
7,274
|
|
6,371
|
|
5,401
|
|
||||||
|
Other income, net
|
60
|
|
373
|
|
487
|
|
||||||
|
Operating profit
|
7,334
|
|
6,744
|
|
5,888
|
|
||||||
|
Interest expense
|
(668
|
)
|
(651
|
)
|
(663
|
)
|
||||||
|
Other non-operating expense, net
|
(828
|
)
|
(847
|
)
|
(471
|
)
|
||||||
|
Earnings from continuing operations before income taxes
|
5,838
|
|
5,246
|
|
4,754
|
|
||||||
|
Income tax expense
|
(792
|
)
|
(3,356
|
)
|
(1,093
|
)
|
||||||
|
Net earnings from continuing operations
|
5,046
|
|
1,890
|
|
3,661
|
|
||||||
|
Net earnings from discontinued operations
|
—
|
|
73
|
|
1,512
|
|
||||||
|
Net earnings
|
$
|
5,046
|
|
$
|
1,963
|
|
$
|
5,173
|
|
|||
|
Earnings per common share
|
||||||||||||
|
Basic
|
||||||||||||
|
Continuing operations
|
$
|
17.74
|
|
$
|
6.56
|
|
$
|
12.23
|
|
|||
|
Discontinued operations
|
—
|
|
0.26
|
|
5.05
|
|
||||||
|
Basic earnings per common share
|
$
|
17.74
|
|
$
|
6.82
|
|
$
|
17.28
|
|
|||
|
Diluted
|
||||||||||||
|
Continuing operations
|
$
|
17.59
|
|
$
|
6.50
|
|
$
|
12.08
|
|
|||
|
Discontinued operations
|
—
|
|
0.25
|
|
4.99
|
|
||||||
|
Diluted earnings per common share
|
$
|
17.59
|
|
$
|
6.75
|
|
$
|
17.07
|
|
|||
The accompanying notes are an integral part of these consolidated financial statements.
58
Lockheed Martin Corporation
Consolidated Statements of Comprehensive Income
(in millions)
|
|
Years Ended December 31,
|
|||||||||||
|
2018
|
|
2017
|
|
2016
|
|
|||||||
|
Net earnings
|
$
|
5,046
|
|
$
|
1,963
|
|
$
|
5,173
|
|
|||
|
Other comprehensive income (loss), net of tax
|
||||||||||||
|
Postretirement benefit plans
|
||||||||||||
|
Net other comprehensive loss recognized during the period, net of tax benefit of $136 million in 2018, $375 million in 2017 and $668 million in 2016
|
(501
|
)
|
(1,380
|
)
|
(1,232
|
)
|
||||||
|
Amounts reclassified from accumulated other comprehensive loss, net of tax expense of $327 million in 2018, $437 million in 2017 and $382 million in 2016
|
1,202
|
|
802
|
|
699
|
|
||||||
|
Reclassifications from divestiture of IS&GS business
|
—
|
|
—
|
|
(134
|
)
|
||||||
|
Other, net
|
(75
|
)
|
141
|
|
9
|
|
||||||
|
Other comprehensive income (loss), net of tax
|
626
|
|
(437
|
)
|
(658
|
)
|
||||||
|
Comprehensive income
|
$
|
5,672
|
|
$
|
1,526
|
|
$
|
4,515
|
|
|||
The accompanying notes are an integral part of these consolidated financial statements.
59
Lockheed Martin Corporation
Consolidated Balance Sheets
(in millions, except par value)
|
|
December 31,
|
|||||||
|
2018
|
|
2017
|
|
|||||
|
Assets
|
||||||||
|
Current assets
|
||||||||
|
Cash and cash equivalents
|
$
|
772
|
|
$
|
2,861
|
|
||
|
Receivables, net
|
2,444
|
|
2,265
|
|
||||
|
Contract assets
|
9,472
|
|
7,992
|
|
||||
|
Inventories
|
2,997
|
|
2,878
|
|
||||
|
Other current assets
|
418
|
|
1,509
|
|
||||
|
Total current assets
|
16,103
|
|
17,505
|
|
||||
|
Property, plant and equipment, net
|
6,124
|
|
5,775
|
|
||||
|
Goodwill
|
10,769
|
|
10,807
|
|
||||
|
Intangible assets, net
|
3,494
|
|
3,797
|
|
||||
|
Deferred income taxes
|
3,208
|
|
3,156
|
|
||||
|
Other noncurrent assets
|
5,178
|
|
5,580
|
|
||||
|
Total assets
|
$
|
44,876
|
|
$
|
46,620
|
|
||
|
Liabilities and equity
|
||||||||
|
Current liabilities
|
||||||||
|
Accounts payable
|
$
|
2,402
|
|
$
|
1,467
|
|
||
|
Contract liabilities
|
6,491
|
|
7,028
|
|
||||
|
Salaries, benefits and payroll taxes
|
2,122
|
|
1,785
|
|
||||
|
Current maturities of long-term debt and commercial paper
|
1,500
|
|
750
|
|
||||
|
Other current liabilities
|
1,883
|
|
1,883
|
|
||||
|
Total current liabilities
|
14,398
|
|
12,913
|
|
||||
|
Long-term debt, net
|
12,604
|
|
13,513
|
|
||||
|
Accrued pension liabilities
|
11,410
|
|
15,703
|
|
||||
|
Other postretirement benefit liabilities
|
704
|
|
719
|
|
||||
|
Other noncurrent liabilities
|
4,311
|
|
4,548
|
|
||||
|
Total liabilities
|
43,427
|
|
47,396
|
|
||||
|
Stockholders’ equity
|
||||||||
|
Common stock, $1 par value per share
|
281
|
|
284
|
|
||||
|
Additional paid-in capital
|
—
|
|
—
|
|
||||
|
Retained earnings
|
15,434
|
|
11,405
|
|
||||
|
Accumulated other comprehensive loss
|
(14,321
|
)
|
(12,539
|
)
|
||||
|
Total stockholders’ equity (deficit)
|
1,394
|
|
(850
|
)
|
||||
|
Noncontrolling interests in subsidiary
|
55
|
|
74
|
|
||||
|
Total equity (deficit)
|
1,449
|
|
(776
|
)
|
||||
|
Total liabilities and equity
|
$
|
44,876
|
|
$
|
46,620
|
|
||
The accompanying notes are an integral part of these consolidated financial statements.
60
Lockheed Martin Corporation
Consolidated Statements of Cash Flows
(in millions)
|
|
Years Ended December 31,
|
|||||||||||
|
2018
|
|
2017
|
|
2016
|
|
|||||||
|
Operating activities
|
||||||||||||
|
Net earnings
|
$
|
5,046
|
|
$
|
1,963
|
|
$
|
5,173
|
|
|||
|
Adjustments to reconcile net earnings to net cash provided by operating activities
|
||||||||||||
|
Depreciation and amortization
|
1,161
|
|
1,195
|
|
1,215
|
|
||||||
|
Stock-based compensation
|
173
|
|
158
|
|
149
|
|
||||||
|
Deferred income taxes
|
(244
|
)
|
3,448
|
|
(193
|
)
|
||||||
|
Severance and restructuring charges
|
96
|
|
—
|
|
99
|
|
||||||
|
Gain on property sale
|
—
|
|
(198
|
)
|
—
|
|
||||||
|
Gain on divestiture of IS&GS business
|
—
|
|
(73
|
)
|
(1,201
|
)
|
||||||
|
Gain on step acquisition of AWE
|
—
|
|
—
|
|
(104
|
)
|
||||||
|
Changes in assets and liabilities
|
||||||||||||
|
Receivables, net
|
(179
|
)
|
(902
|
)
|
598
|
|
||||||
|
Contract assets
|
(1,480
|
)
|
390
|
|
(1,246
|
)
|
||||||
|
Inventories
|
(119
|
)
|
(79
|
)
|
173
|
|
||||||
|
Accounts payable
|
914
|
|
(189
|
)
|
(188
|
)
|
||||||
|
Contract liabilities
|
(537
|
)
|
353
|
|
(163
|
)
|
||||||
|
Postretirement benefit plans
|
(3,574
|
)
|
1,316
|
|
1,028
|
|
||||||
|
Income taxes
|
1,077
|
|
(1,210
|
)
|
146
|
|
||||||
|
Other, net
|
804
|
|
304
|
|
(297
|
)
|
||||||
|
Net cash provided by operating activities
|
3,138
|
|
6,476
|
|
5,189
|
|
||||||
|
Investing activities
|
||||||||||||
|
Capital expenditures
|
(1,278
|
)
|
(1,177
|
)
|
(1,063
|
)
|
||||||
|
Other, net
|
203
|
|
30
|
|
78
|
|
||||||
|
Net cash used for investing activities
|
(1,075
|
)
|
(1,147
|
)
|
(985
|
)
|
||||||
|
Financing activities
|
||||||||||||
|
Repurchases of common stock
|
(1,492
|
)
|
(2,001
|
)
|
(2,096
|
)
|
||||||
|
Dividends paid
|
(2,347
|
)
|
(2,163
|
)
|
(2,048
|
)
|
||||||
|
Proceeds from issuance of commercial paper, net
|
600
|
|
—
|
|
—
|
|
||||||
|
Special cash payment from divestiture of IS&GS business
|
—
|
|
—
|
|
1,800
|
|
||||||
|
Repayments of long-term debt
|
(750
|
)
|
—
|
|
(952
|
)
|
||||||
|
Other, net
|
(163
|
)
|
(141
|
)
|
(161
|
)
|
||||||
|
Net cash used for financing activities
|
(4,152
|
)
|
(4,305
|
)
|
(3,457
|
)
|
||||||
|
Net change in cash and cash equivalents
|
(2,089
|
)
|
1,024
|
|
747
|
|
||||||
|
Cash and cash equivalents at beginning of year
|
2,861
|
|
1,837
|
|
1,090
|
|
||||||
|
Cash and cash equivalents at end of year
|
$
|
772
|
|
$
|
2,861
|
|
$
|
1,837
|
|
|||
The accompanying notes are an integral part of these consolidated financial statements.
61
Lockheed Martin Corporation
Consolidated Statements of Equity
(in millions, except per share data)
|
Common
Stock
|
Additional
Paid-In
Capital
|
Retained
Earnings
|
Accumulated
Other
Comprehensive
Loss
|
Total
Stockholders’
Equity
(Deficit)
|
Noncontrolling
Interests in
Subsidiary
|
Total
Equity
(Deficit)
|
|||||||||||||||||||
|
Balance at December 31, 2015
|
$
|
303
|
|
$
|
—
|
|
$
|
14,238
|
|
$
|
(11,444
|
)
|
$
|
3,097
|
|
$
|
—
|
|
$
|
3,097
|
|
||||
|
Net earnings
|
—
|
|
—
|
|
5,173
|
|
—
|
|
5,173
|
|
—
|
|
5,173
|
|
|||||||||||
|
Other comprehensive (loss), net of tax
|
—
|
|
—
|
|
—
|
|
(658
|
)
|
(658
|
)
|
—
|
|
(658
|
)
|
|||||||||||
|
Shares exchanged and retired in connection with divestiture of IS&GS business
|
(9
|
)
|
—
|
|
(2,488
|
)
|
—
|
|
(2,497
|
)
|
—
|
|
(2,497
|
)
|
|||||||||||
|
Repurchases of common stock
|
(9
|
)
|
(395
|
)
|
(1,692
|
)
|
—
|
|
(2,096
|
)
|
—
|
|
(2,096
|
)
|
|||||||||||
|
Dividends declared ($6.77 per share)
|
—
|
|
—
|
|
(2,036
|
)
|
—
|
|
(2,036
|
)
|
—
|
|
(2,036
|
)
|
|||||||||||
|
Stock-based awards, ESOP activity and other
|
4
|
|
395
|
|
—
|
|
—
|
|
399
|
|
—
|
|
399
|
|
|||||||||||
|
Net increase in noncontrolling interests in subsidiary
|
—
|
|
—
|
|
—
|
|
—
|
|
—
|
|
95
|
|
95
|
|
|||||||||||
|
Balance at December 31, 2016
|
289
|
|
—
|
|
13,195
|
|
(12,102
|
)
|
1,382
|
|
95
|
|
1,477
|
|
|||||||||||
|
Net earnings
|
—
|
|
—
|
|
1,963
|
|
—
|
|
1,963
|
|
—
|
|
1,963
|
|
|||||||||||
|
Other comprehensive (loss), net of tax
|
—
|
|
—
|
|
—
|
|
(437
|
)
|
(437
|
)
|
—
|
|
(437
|
)
|
|||||||||||
|
Repurchases of common stock
|
(7
|
)
|
(398
|
)
|
(1,596
|
)
|
—
|
|
(2,001
|
)
|
—
|
|
(2,001
|
)
|
|||||||||||
|
Dividends declared ($7.46 per share)
|
—
|
|
—
|
|
(2,157
|
)
|
—
|
|
(2,157
|
)
|
—
|
|
(2,157
|
)
|
|||||||||||
|
Stock-based awards, ESOP activity and other
|
2
|
|
398
|
|
—
|
|
—
|
|
400
|
|
—
|
|
400
|
|
|||||||||||
|
Net decrease in noncontrolling interests in subsidiary
|
—
|
|
—
|
|
—
|
|
—
|
|
—
|
|
(21
|
)
|
(21
|
)
|
|||||||||||
|
Balance at December 31, 2017
|
284
|
|
—
|
|
11,405
|
|
(12,539
|
)
|
(850
|
)
|
74
|
|
(776
|
)
|
|||||||||||
|
Net earnings
|
—
|
|
—
|
|
5,046
|
|
—
|
|
5,046
|
|
—
|
|
5,046
|
|
|||||||||||
|
Other comprehensive income, net of tax
|
—
|
|
—
|
|
—
|
|
626
|
|
626
|
|
—
|
|
626
|
|
|||||||||||
|
Repurchases of common stock
|
(5
|
)
|
(404
|
)
|
(1,083
|
)
|
—
|
|
(1,492
|
)
|
—
|
|
(1,492
|
)
|
|||||||||||
|
Dividends declared ($8.20 per share)
|
—
|
|
—
|
|
(2,342
|
)
|
—
|
|
(2,342
|
)
|
—
|
|
(2,342
|
)
|
|||||||||||
|
Stock-based awards, ESOP activity and other
|
2
|
|
404
|
|
—
|
|
—
|
|
406
|
|
—
|
|
406
|
|
|||||||||||
|
Reclassification of income tax effects from tax reform
|
—
|
|
—
|
|
2,408
|
|
(2,408
|
)
|
—
|
|
—
|
|
—
|
|
|||||||||||
|
Net decrease in noncontrolling interests in subsidiary
|
—
|
|
—
|
|
—
|
|
—
|
|
—
|
|
(19
|
)
|
(19
|
)
|
|||||||||||
|
Balance at December 31, 2018
|
$
|
281
|
|
$
|
—
|
|
$
|
15,434
|
|
$
|
(14,321
|
)
|
$
|
1,394
|
|
$
|
55
|
|
$
|
1,449
|
|
||||
The accompanying notes are an integral part of these consolidated financial statements.
62
Lockheed Martin Corporation
Notes to Consolidated Financial Statements
Note 1 –
Significant Accounting Policies
Organization
– We are a global security and aerospace company principally engaged in the research, design, development, manufacture, integration and sustainment of advanced technology systems, products and services. We also provide a broad range of management, engineering, technical, scientific, logistics, system integration and cybersecurity services. We serve both U.S. and international customers with products and services that have defense, civil and commercial applications, with our principal customers being agencies of the U.S. Government.
Basis of presentation
– Our consolidated financial statements include the accounts of subsidiaries we control and variable interest entities if we are the primary beneficiary. We eliminate intercompany balances and transactions in consolidation. Our receivables, inventories, customer advances and amounts in excess of costs incurred and certain amounts in other current liabilities primarily are attributable to long-term contracts or programs in progress for which the related operating cycles are longer than one year. In accordance with industry practice, we include these items in current assets and current liabilities. Unless otherwise noted, we present all per share amounts cited in these consolidated financial statements on a “per diluted share” basis. Certain prior period amounts have been reclassified to conform with current year presentation. The discussion and presentation of the operating results of our business segments have been impacted by the following recent events.
Effective January 1, 2018, we adopted Accounting Standards Update (ASU) 2014-09,
Revenue from Contracts with Customers (Topic 606)
, as amended (commonly referred to as ASC 606), which changed the way we recognize revenue for certain contracts and significantly expanded disclosures about revenue recognition. In addition, effective January 1, 2018, we adopted ASU 2017-07,
Compensation-Retirement Benefits (715): Improving the Presentation of Net Periodic Pension Cost and Net Periodic Postretirement Benefit Cost
, which changed the statement of earnings presentation of certain components of pension and other postretirement benefit plan expense. The amounts for all periods presented in this Form 10-K have been adjusted to reflect these new methods of accounting.
On August 16, 2016, we completed the divestiture of the Information Systems & Global Solutions (IS&GS) business, which merged with a subsidiary of Leidos Holdings, Inc. (Leidos) in a Reverse Morris Trust transaction. Accordingly, the operating results of the IS&GS business have been classified as discontinued operations on our consolidated statements of earnings for all prior periods presented. However, the 2016 cash flows of the IS&GS business have not been reclassified in our consolidated statements of cash flows as we retained the cash as part of the Transaction. See “
Note 3 – Acquisition and Divestitures
” for additional information about the divestiture of the IS&GS business.
On August 24, 2016, we increased our ownership interest in the AWE Management Limited (AWE) joint venture, which operates the United Kingdom’s nuclear deterrent program, from
33%
to
51%
. Consequently, we began consolidating AWE and our operating results include
100%
of AWE’s sales and
51%
of its operating profit. Prior to increasing our ownership interest, we accounted for our investment in AWE using the equity method of accounting. Under the equity method, we recognized only
33%
of AWE’s earnings or losses and
no
sales. Accordingly, prior to August 24, 2016, the date we obtained control, we recorded
33%
of AWE’s net earnings in our operating results and subsequent to August 24, 2016, we recognized 100% of AWE’s sales and 51% of its operating profit.
See “
Note 3 – Acquisition and Divestitures
” for additional information about the change in ownership of AWE.
Use of estimates
– We prepare our consolidated financial statements in conformity with U.S. generally accepted accounting principles (GAAP). In doing so, we are required to make estimates and assumptions that affect the amounts reported in the consolidated financial statements and accompanying notes. We base these estimates on historical experience and on various other assumptions that we believe are reasonable under the circumstances, the results of which form the basis for making judgments about the carrying amounts of assets and liabilities that are not readily apparent from other sources. Our actual results may differ materially from these estimates. Significant estimates inherent in the preparation of our consolidated financial statements include, but are not limited to, accounting for sales and cost recognition, postretirement benefit plans, environmental receivables and liabilities, evaluation of goodwill and other assets for impairment, income taxes including deferred income taxes, fair value measurements and contingencies.
Revenue Recognition
–
The majority of our net sales are generated from long-term contracts with the U.S. Government and international customers (including foreign military sales (FMS) contracted through the U.S. Government) for the research, design, development, manufacture, integration and sustainment of advanced technology systems, products and services. We provide our products and services under fixed-price and cost-reimbursable contracts.
63
Under fixed-price contracts, we agree to perform the specified work for a pre-determined price. To the extent our actual costs vary from the estimates upon which the price was negotiated, we will generate more or less profit or could incur a loss. Some fixed-price contracts have a performance-based component under which we may earn incentive payments or incur financial penalties based on our performance.
Cost-reimbursable contracts provide for the payment of allowable costs incurred during performance of the contract plus a fee up to a ceiling based on the amount that has been funded. Typically, we enter into
three
types of cost-reimbursable contracts: cost-plus-award-fee, cost-plus-incentive-fee, and cost-plus-fixed-fee. Cost-plus-award-fee contracts provide for an award fee that varies within specified limits based on the customer’s assessment of our performance against a predetermined set of criteria, such as targets based on cost, quality, technical and schedule criteria. Cost-plus-incentive-fee contracts provide for reimbursement of costs plus a fee, which is adjusted by a formula based on the relationship of total allowable costs to total target costs (i.e., incentive based on cost) or reimbursement of costs plus an incentive to exceed stated performance targets (i.e., incentive based on performance). The fixed-fee in a cost-plus-fixed-fee contract is negotiated at the inception of the contract and that fixed-fee does not vary with actual costs.
We account for a contract after it has been approved by all parties to the arrangement, the rights of the parties are identified, payment terms are identified, the contract has commercial substance and collectability of consideration is probable.
We assess each contract at its inception to determine whether it should be combined with other contracts. When making this determination, we consider factors such as whether two or more contracts were negotiated and executed at or near the same time or were negotiated with an overall profit objective. If combined, we treat the combined contracts as a single contract for revenue recognition purposes.
We evaluate the products or services promised in each contract at inception to determine whether the contract should be accounted for as having one or more performance obligations. The products and services in our contracts are typically not distinct from one another due to their complex relationships and the significant contract management functions required to perform under the contract. Accordingly, our contracts are typically accounted for as one performance obligation. In limited cases, our contracts have more than one distinct performance obligation, which occurs when we perform activities that are not highly complex or interrelated or involve different product lifecycles. Significant judgment is required in determining performance obligations, and these decisions could change the amount of revenue and profit recorded in a given period. We classify net sales as products or services on our consolidated statements of earnings based on the predominant attributes of the performance obligations.
We determine the transaction price for each contract based on the consideration we expect to receive for the products or services being provided under the contract. For contracts where a portion of the price may vary we estimate variable consideration at the most likely amount, which is included in the transaction price to the extent it is probable that a significant reversal of cumulative revenue recognized will not occur. We analyze the risk of a significant revenue reversal and if necessary constrain the amount of variable consideration recognized in order to mitigate this risk.
At the inception of a contract we estimate the transaction price based on our current rights and do not contemplate future modifications (including unexercised options) or follow-on contracts until they become legally enforceable. Contracts are often subsequently modified to include changes in specifications, requirements or price, which may create new or change existing enforceable rights and obligations. Depending on the nature of the modification, we consider whether to account for the modification as an adjustment to the existing contract or as a separate contract. Generally, modifications to our contracts are not distinct from the existing contract due to the significant integration and interrelated tasks provided in the context of the contract. Therefore, such modifications are accounted for as if they were part of the existing contract and recognized as a cumulative adjustment to revenue.
For contracts with multiple performance obligations, we allocate the transaction price to each performance obligation based on the estimated standalone selling price of the product or service underlying each performance obligation. The standalone selling price represents the amount we would sell the product or service to a customer on a standalone basis (i.e., not bundled with any other products or services). Our contracts with the U.S. Government, including FMS contracts, are subject to the Federal Acquisition Regulations (FAR) and the price is typically based on estimated or actual costs plus a reasonable profit margin. As a result of these regulations, the standalone selling price of products or services in our contracts with the U.S. Government and FMS contracts are typically equal to the selling price stated in the contract.
For non-U.S. Government contracts with multiple performance obligations, we evaluate whether the stated selling prices for the products or services represent their standalone selling prices. We primarily sell customized solutions unique to a customer’s specifications. When it is necessary to allocate the transaction price to multiple performance obligations, we typically use the expected cost plus a reasonable profit margin to estimate the standalone selling price of each product or service. We occasionally
64
sell standard products or services with observable standalone sales transactions. In these situations, the observable standalone sales transactions are used to determine the standalone selling price.
We recognize revenue as performance obligations are satisfied and the customer obtains control of the products and services. In determining when performance obligations are satisfied, we consider factors such as contract terms, payment terms and whether there is an alternative future use of the product or service. Substantially all of our revenue is recognized over time as we perform under the contract because control of the work in process transfers continuously to the customer. For contracts with the U.S. Government and FMS contracts, this continuous transfer of control of the work in process to the customer is supported by clauses in the contract that allow the customer to unilaterally terminate the contract for convenience, pay us for costs incurred plus a reasonable profit, and take possession of any work in process. Our non-U.S. Government contracts, primarily international direct commercial contracts, typically do not include termination for convenience provisions. However, continuous transfer of control to our customer is supported and, if our customer were to terminate the contract for reasons other than our non-performance, we would have the right to recover damages which would include, among other potential damages, the right to payment for our work performed to date plus a reasonable profit to deliver products or services that do not have an alternative use to us.
For performance obligations to deliver products with continuous transfer of control to the customer, revenue is recognized based on the extent of progress towards completion of the performance obligation, generally using the percentage-of-completion cost-to-cost measure of progress for our contracts because it best depicts the transfer of control to the customer as we incur costs on our contracts. Under the percentage-of-completion cost-to-cost measure of progress, the extent of progress towards completion is measured based on the ratio of costs incurred to date to the total estimated costs to complete the performance obligation(s). For performance obligations to provide services to the customer, revenue is recognized over time based on costs incurred or the right to invoice method (in situations where the value transferred matches our billing rights) as our customer receives and consumes the benefits.
For performance obligations in which control does not continuously transfer to the customer, we recognize revenue at the point in time in which each performance obligation is fully satisfied. This coincides with the point in time the customer obtains control of the product or service, which typically occurs upon customer acceptance or receipt of the product or service, given that we maintain control of the product or service until that point.
Backlog (i.e., unfulfilled or remaining performance obligations) represents the sales we expect to recognize for our products and services for which control has not yet transferred to the customer. For our cost-reimbursable and fixed-priced-incentive contracts, the estimated consideration we expect to receive pursuant to the terms of the contract may exceed the contractual award amount. The estimated consideration is determined at the outset of the contract and is continuously reviewed throughout the contract period. In determining the estimated consideration, we consider the risks related to the technical, schedule and cost impacts to complete the contract and an estimate of any variable consideration. Periodically, we review these risks and may increase or decrease backlog accordingly. As the risks on such contracts are successfully retired, the estimated consideration from customers may be reduced, resulting in a reduction of backlog without a corresponding recognition of sales. As of
December 31, 2018
, our ending backlog was
$130.5 billion
. We expect to recognize approximately
38%
of our backlog over the next 12 months and approximately
66%
over the next 24 months as revenue, with the remainder recognized thereafter.
For arrangements with the U.S. Government and FMS contracts, we generally do not begin work on contracts until funding is appropriated by the customer. Billing timetables and payment terms on our contracts vary based on a number of factors, including the contract type. Typical payment terms under fixed-price contracts with the U.S. Government provide that the customer pays either performance-based payments (PBPs) based on the achievement of contract milestones or progress payments based on a percentage of costs we incur. For the majority of our international direct commercial contracts to deliver complex systems, we typically receive advance payments prior to commencement of work, as well as milestone payments that are paid in accordance with the terms of our contract as we perform. We recognize a liability for payments in excess of revenue recognized, which is presented as a contract liability on the balance sheet. The portion of payments retained by the customer until final contract settlement is not considered a significant financing component because the intent is to protect the customer from our failure to adequately complete some or all of the obligations under the contract. Payments received from customers in advance of revenue recognition are not considered to be significant financing components because they are used to meet working capital demands that can be higher in the early stages of a contract.
For fixed-price and cost-reimbursable contracts, we present revenues recognized in excess of billings as contract assets on the balance sheet. Amounts billed and due from our customers under both contract types are classified as receivables on the balance sheet.
Significant estimates and assumptions are made in estimating contract sales and costs, including the profit booking rate. At the outset of a long-term contract, we identify and monitor risks to the achievement of the technical, schedule and cost aspects of the contract, as well as variable consideration, and assess the effects of those risks on our estimates of sales and total costs to
65
complete the contract. The estimates consider the technical requirements (e.g., a newly-developed product versus a mature product), the schedule and associated tasks (e.g., the number and type of milestone events) and costs (e.g., material, labor, subcontractor, overhead, general and administrative and the estimated costs to fulfill our industrial cooperation agreements, sometimes referred to as offset or localization agreements, required under certain contracts with international customers). The initial profit booking rate of each contract considers risks surrounding the ability to achieve the technical requirements, schedule and costs in the initial estimated total costs to complete the contract. Profit booking rates may increase during the performance of the contract if we successfully retire risks surrounding the technical, schedule and cost aspects of the contract, which decreases the estimated total costs to complete the contract or may increase the variable consideration we expect to receive on the contract. Conversely, our profit booking rates may decrease if the estimated total costs to complete the contract increase or our estimates of variable consideration we expect to receive decrease. All of the estimates are subject to change during the performance of the contract and may affect the profit booking rate. When estimates of total costs to be incurred on a contract exceed total estimates of the transaction price, a provision for the entire loss is determined at the contract level and is recorded in the period in which the loss is determined.
Comparability of our segment sales, operating profit and operating margin may be impacted favorably or unfavorably by changes in profit booking rates on our contracts for which we recognize revenue over time using the percentage-of-completion cost-to-cost method to measure progress towards completion. Increases in the profit booking rates, typically referred to as risk retirements, usually relate to revisions in the estimated total costs to fulfill the performance obligations that reflect improved conditions on a particular contract. Conversely, conditions on a particular contract may deteriorate, resulting in an increase in the estimated total costs to fulfill the performance obligations and a reduction in the profit booking rate. Increases or decreases in profit booking rates are recognized in the current period and reflect the inception-to-date effect of such changes. Segment operating profit and margin may also be impacted favorably or unfavorably by other items, which may or may not impact sales. Favorable items may include the positive resolution of contractual matters, cost recoveries on severance and restructuring charges, insurance recoveries and gains on sales of assets. Unfavorable items may include the adverse resolution of contractual matters; restructuring charges, except for significant severance actions, which are excluded from segment operating results; reserves for disputes; certain asset impairments; and losses on sales of certain assets.
Our consolidated net adjustments not related to volume, including net profit booking rate adjustments and other items, increased segment operating profit by approximately
$1.9 billion
,
$1.6 billion
, and
$1.4 billion
in
2018
,
2017
and
2016
. These adjustments increased net earnings by approximately
$1.5 billion
(
$5.23
per share),
$1.1 billion
(
$3.79
per share), and
$910 million
(
$3.00
per share) in
2018
,
2017
and
2016
. We recognized net sales from performance obligations satisfied in prior periods of approximately
$2.0 billion
,
$1.8 billion
and
$1.4 billion
in
2018
,
2017
and
2016
, which primarily relate to changes in profit booking rates that impacted revenue.
As previously disclosed, we have a program, EADGE-T, to design, integrate, and install an air missile defense command, control, communications, computers – intelligence (C4I) system for an international customer that has experienced performance matters and for which we have periodically accrued reserves. In
2017
, we revised our estimated costs to complete the EADGE-T contract as a consequence of ongoing performance matters and recorded an additional charge of
$120 million
(
$74 million
or
$0.25
per share, after tax) at our Rotary and Mission Systems (RMS) business segment, which resulted in cumulative losses of approximately
$260 million
on this program. As of
December 31, 2018
, cumulative losses remained at approximately
$260 million
. We continue to monitor program requirements and our performance. At this time, we do not anticipate additional charges that would be material to our operating results or financial condition.
We have two commercial satellite programs, for the delivery of three satellites in total, to international customers at our Space business segment, for which we have experienced performance issues related to the development and integration of a modernized LM 2100 satellite platform. These programs require the development of new satellite technology to enhance the LM 2100’s power, propulsion and electronics, among other items. The enhanced LM 2100 satellite platform is expected to benefit other commercial and government satellite programs. We have periodically revised our estimated costs to complete these developmental commercial programs. We have recorded cumulative losses of approximately
$380 million
through
December 31, 2018
. In
2018
, we recorded losses of approximately
$75 million
(
$56 million
, or
$0.20
per share, after tax). While these losses reflect our estimated total losses on the programs, we will continue to incur general and administrative costs each period until we complete these programs. These programs remain developmental and further challenges in the delivery and integration of new satellite technology, anomalies discovered during system testing requiring repair or rework, further schedule delays and potential penalties could require that we record additional loss reserves which could be material to our operating results. We previously disclosed that, as we did not meet the July 2018 delivery requirement for two satellites, the customer could seek to exercise termination rights. One of the satellites has now been launched, eliminating this risk. As the other is expected to launch in the first half of 2019, we believe it unlikely that the customer will seek to do so. Were the customer to seek to exercise a termination right and be successful in this effort, we would have to refund the payments we have received and pay certain penalties. On the third satellite, we currently anticipate delivery before the date upon which the customer could seek to exercise a termination right although we may have to pay certain penalties and have sought to address this possibility in our reserves.
66
We are responsible for designing, developing and installing an upgraded turret for the Warrior Capability Sustainment Program. In
2018
, we revised our estimated costs to complete the program as a consequence of performance issues, and recorded a charge of approximately
$85 million
(
$64 million
, or
$0.22
per share, after tax) at our
Missiles and Fire Control (MFC)
business segment, which resulted in cumulative losses of approximately
$140 million
on this program as of
December 31, 2018
.
We may continue to experience issues related to customer requirements and our performance under this contract and have to record additional charges. However, based on the losses already recorded and our current estimate of the sales and costs to complete the program, at this time we do not anticipate that additional losses, if any, would be material to our operating results or financial condition.
Research and development and similar costs
– We conduct research and development (R&D) activities using our own funds (referred to as company-funded R&D or independent research and development (IR&D)) and under contractual arrangements with our customers (referred to as customer-funded R&D) to enhance existing products and services and to develop future technologies. R&D costs include basic research, applied research, concept formulation studies, design, development, and related test activities. Company-funded R&D costs are allocated to customer contracts as part of the general and administrative overhead costs and generally recoverable on our customer contracts with the U.S. Government. Customer-funded R&D costs are charged directly to the related customer contract. Substantially all R&D costs are charged to cost of sales as incurred. Company-funded R&D costs charged to cost of sales totaled
$1.3 billion
in
2018
,
$1.2 billion
in
2017
and
$988 million
in
2016
.
Stock-based compensation
– Compensation cost related to all share-based payments is measured at the grant date based on the estimated fair value of the award. We generally recognize the compensation cost ratably over a
three
-year vesting period, net of estimated forfeitures. At each reporting date, the number of shares is adjusted to the number ultimately expected to vest.
Income taxes
– We calculate our provision for income taxes using the asset and liability method, under which deferred tax assets and liabilities are recognized based on the future tax consequences attributable to temporary differences that exist between the financial statement carrying amount of assets and liabilities and their respective tax bases, as well as from operating loss and tax credit carry-forwards. We measure deferred tax assets and liabilities using enacted tax rates that will apply in the years in which we expect the temporary differences to be recovered or paid.
We periodically assess our tax exposures related to periods that are open to examination. Based on the latest available information, we evaluate our tax positions to determine whether the position will more likely than not be sustained upon examination by the Internal Revenue Service (IRS) or other taxing authorities. If we cannot reach a more-likely-than-not determination, no benefit is recorded. If we determine that the tax position is more likely than not to be sustained, we record the largest amount of benefit that is more likely than not to be realized when the tax position is settled. We record interest and penalties related to income taxes as a component of income tax expense on our consolidated statements of earnings. Interest and penalties were not material.
Cash and cash equivalents
– Cash equivalents include highly liquid instruments with original maturities of 90 days or less.
Receivables
– Receivables, net represent our unconditional right to consideration under the contract and include amounts billed and currently due from customers. The amounts are stated at their net estimated realizable value. There were
no
significant impairment losses related to our receivables in
2018
,
2017
, or
2016
.
On occasion, our customers may seek deferred payment terms to purchase our products. In connection with these transactions, we may, at our customer’s request, enter into arrangements for the non-recourse sale of customer receivables to unrelated third–party financial institutions. For accounting purposes, these transactions are not discounted and are treated as a sale of receivables as we have no continuing involvement. The sale proceeds from the financial institutions are reflected in our operating cash flows on the statement of cash flows.
We sold approximately
$532 million
in
2018
and
$698 million
in
2017
of customer receivables. There were
no
gains or losses related to sales of these receivables.
Contract assets
– Contract assets include unbilled amounts typically resulting from sales under contracts when the percentage-of-completion cost-to-cost method of revenue recognition is utilized and revenue recognized exceeds the amount billed to the customer. The amounts may not exceed their estimated net realizable value. Contract assets are classified as current based on our contract operating cycle.
Inventories
– We record inventories at the lower of cost or estimated net realizable value. If events or changes in circumstances indicate that the utility of our inventories have diminished through damage, deterioration, obsolescence, changes in price or other causes, a loss is recognized in the period in which it occurs. We capitalize labor, material, subcontractor and overhead costs as work-in-process for contracts where control has not yet passed to the customer. In addition, we capitalize costs incurred to fulfill a contract in advance of contract award in inventories as work-in-process if we determine that contract award is probable. We determine the costs of other product and supply inventories by using the first-in first-out or average cost methods.
67
Contract liabilities
– Contract liabilities (formerly referred to as customer advances and amounts in excess of costs incurred) include advance payments and billings in excess of revenue recognized. Contract liabilities are classified as current based on our contract operating cycle and reported on a contract-by-contract basis, net of revenue recognized, at the end of each reporting period.
Property, plant and equipment
– We record property, plant and equipment at cost. We provide for depreciation and amortization on plant and equipment generally using accelerated methods during the first half of the estimated useful lives of the assets and the straight-line method thereafter. The estimated useful lives of our plant and equipment generally range from
10
to
40
years for buildings and
five
to
15
years for machinery and equipment. No depreciation expense is recorded on construction in progress until such assets are placed into operation. Depreciation expense related to plant and equipment was
$759 million
in
2018
,
$760 million
in
2017
, and
$747 million
in
2016
.
We review the carrying amounts of long-lived assets for impairment if events or changes in the facts and circumstances indicate that their carrying amounts may not be recoverable. We assess impairment by comparing the estimated undiscounted future cash flows of the related asset grouping to its carrying amount. If an asset is determined to be impaired, we recognize an impairment charge in the current period for the difference between the fair value of the asset and its carrying amount.
Capitalized software
– We capitalize certain costs associated with the development or purchase of internal-use software. The amounts capitalized are included in other noncurrent assets on our consolidated balance sheets and are amortized on a straight-line basis over the estimated useful life of the resulting software, which ranges from
two
to
six
years. As of
December 31, 2018
and
2017
, capitalized software totaled
$447 million
and
$424 million
, net of accumulated amortization of
$2.1 billion
and
$2.0 billion
. No amortization expense is recorded until the software is ready for its intended use. Amortization expense related to capitalized software was
$106 million
in
2018
,
$123 million
in
2017
and
$136 million
in
2016
.
Goodwill
– The assets and liabilities of acquired businesses are recorded under the acquisition method of accounting at their estimated fair values at the date of acquisition. Goodwill represents costs in excess of fair values assigned to the underlying identifiable net assets of acquired businesses.
Our goodwill balance was
$10.8 billion
at both
December 31, 2018
and
2017
. We perform an impairment test of our goodwill at least annually in the fourth quarter or more frequently whenever events or changes in circumstances indicate the carrying value of goodwill may be impaired. Such events or changes in circumstances may include a significant deterioration in overall economic conditions, changes in the business climate of our industry, a decline in our market capitalization, operating performance indicators, competition, reorganizations of our business, U.S. Government budget restrictions or the disposal of all or a portion of a reporting unit. Our goodwill has been allocated to and is tested for impairment at a level referred to as the reporting unit, which is our business segment level or a level below the business segment. The level at which we test goodwill for impairment requires us to determine whether the operations below the business segment constitute a self-sustaining business for which discrete financial information is available and segment management regularly reviews the operating results.
We may use either a qualitative or quantitative approach when testing a reporting unit’s goodwill for impairment. For selected reporting units where we use the qualitative approach, we perform a qualitative evaluation of events and circumstances impacting the reporting unit to determine the likelihood of goodwill impairment. Based on that qualitative evaluation, if we determine it is more likely than not that the fair value of a reporting unit exceeds its carrying amount, no further evaluation is necessary. Otherwise we perform a quantitative impairment test. We perform quantitative tests for most reporting units at least once every three years. However, for certain reporting units we may perform a quantitative impairment test every year.
For the quantitative impairment test we compare the fair value of a reporting unit to its carrying value, including goodwill. If the fair value of a reporting unit exceeds its carrying value, goodwill of the reporting unit is not impaired. If the carrying value of the reporting unit, including goodwill, exceeds its fair value, a goodwill impairment loss is recognized in an amount equal to that excess. We generally estimate the fair value of each reporting unit using a combination of a discounted cash flow (DCF) analysis and market-based valuation methodologies such as comparable public company trading values and values observed in recent business acquisitions. Determining fair value requires the exercise of significant judgments, including the amount and timing of expected future cash flows, long-term growth rates, discount rates and relevant comparable public company earnings multiples and relevant transaction multiples. The cash flows employed in the DCF analysis are based on our best estimate of future sales, earnings and cash flows after considering factors such as general market conditions, U.S. Government budgets, existing firm orders, expected future orders, contracts with suppliers, labor agreements, changes in working capital, long term business plans and recent operating performance. The discount rates utilized in the DCF analysis are based on the respective reporting unit’s weighted average cost of capital, which takes into account the relative weights of each component of capital structure (equity and debt) and represents the expected cost of new capital, adjusted as appropriate to consider the risk inherent in future cash flows of the respective reporting unit. The carrying value of each reporting unit includes the assets and liabilities employed in its operations, goodwill and allocations of certain assets and liabilities held at the business segment and corporate levels.
68
During the fourth quarters of
2018
,
2017
and
2016
, we performed our annual goodwill impairment test for each of our reporting units. The results of our annual impairment tests of goodwill indicated that no impairment existed.
Intangible assets
–
Intangible assets from acquired businesses are recognized at their estimated fair values at the date of acquisition and consist of customer programs, trademarks, customer relationships, technology and other intangible assets. Customer programs include values assigned to major programs of acquired businesses and represent the aggregate value associated with the customer relationships, contracts, technology and trademarks underlying the associated program and are amortized on a straight-line basis over a period of expected cash flows used to measure the fair value, which ranges from
nine
to
20
years. Acquired intangibles deemed to have indefinite lives are not amortized, but are subject to annual impairment testing. This testing compares carrying value to fair value and, when appropriate, the carrying value of these assets is reduced to fair value. Finite-lived intangibles are amortized to expense over the applicable useful lives, ranging from
three
to
20
years, based on the nature of the asset and the underlying pattern of economic benefit as reflected by future net cash inflows. We perform an impairment test of finite-lived intangibles whenever events or changes in circumstances indicate their carrying value may be impaired.
Postretirement benefit plans
– Many of our employees are covered by defined benefit pension plans and we provide certain health care and life insurance benefits to eligible retirees (collectively, postretirement benefit plans). GAAP requires that the amounts we record related to our postretirement benefit plans be computed, based on service to date, using actuarial valuations that are based in part on certain key economic assumptions we make, including the discount rate, the expected long-term rate of return on plan assets and other actuarial assumptions including participant longevity (also known as mortality), health care cost trend rates and employee turnover, each as appropriate based on the nature of the plans.
A market-related value of our plan assets, determined using actual asset gains or losses over the prior three year period, is used to calculate the amount of deferred asset gains or losses to be amortized. These asset gains or losses, along with those resulting from adjustments to our benefit obligation, will be amortized to expense using the corridor method, where gains and losses are recognized to the extent they exceed
10%
of the greater of plan assets or benefit obligations, over the average future service period of employees expected to receive benefits under the plans of approximately
nine
years as of
December 31, 2018
. This amortization period is expected to extend (approximately double) in 2020 when our non-union pension plan is frozen to use the average remaining life expectancy of the participants instead of average future service.
We recognize on a plan-by-plan basis the funded status of our postretirement benefit plans under GAAP as either an asset recorded within other noncurrent assets or a liability recorded within noncurrent liabilities on our consolidated balance sheets. The GAAP funded status is measured as the difference between the fair value of the plan’s assets and the benefit obligation of the plan. The funded status under the Employee Retirement Income Security Act of 1974 (ERISA), as amended by the Pension Protection Act of 2006 (PPA), is calculated on a different basis than under GAAP.
Environmental matters
– We record a liability for environmental matters when it is probable that a liability has been incurred and the amount can be reasonably estimated. The amount of liability recorded is based on our estimate of the costs to be incurred for remediation at a particular site. We do not discount the recorded liabilities, as the amount and timing of future cash payments are not fixed or cannot be reliably determined. Our environmental liabilities are recorded on our consolidated balance sheets within other liabilities, both current and noncurrent. We expect to include a substantial portion of environmental costs in our net sales and cost of sales in future periods pursuant to U.S. Government agreement or regulation. At the time a liability is recorded for future environmental costs, we record a receivable for estimated future recovery considered probable through the pricing of products and services to agencies of the U.S. Government, regardless of the contract form (e.g., cost-reimbursable, fixed-price). We continuously evaluate the recoverability of our environmental receivables by assessing, among other factors, U.S. Government regulations, our U.S. Government business base and contract mix, our history of receiving reimbursement of such costs, and recent efforts by some U.S. Government representatives to limit such reimbursement. We include the portion of those environmental costs expected to be allocated to our non-U.S. Government contracts, or that is determined to not be recoverable under U.S. Government contracts, in our cost of sales at the time the liability is established. Our environmental receivables are recorded on our consolidated balance sheets within other assets, both current and noncurrent. We project costs and recovery of costs over approximately
20
years.
Investments in marketable securities
– Investments in marketable securities consist of debt and equity securities which are recorded at fair value. As of
December 31, 2018
and
2017
, the fair value of our investments totaled
$1.3 billion
and
$1.4 billion
and was included in other noncurrent assets on our consolidated balance sheets. Our investments are held in a separate trust, which includes investments to fund our deferred compensation plan liabilities. Net losses on these securities were
$67 million
in
2018
compared to net gains on these securities of
$150 million
in
2017
and
$66 million
in
2016
. Gains and losses on these investments are included in other unallocated, net within cost of sales on our consolidated statements of earnings in order to align the classification of changes in the market value of investments held for the plan with changes in the value of the corresponding plan liabilities.
69
Equity method investments
– Investments where we have the ability to exercise significant influence, but do not control, are accounted for under the equity method of accounting and are included in other noncurrent assets on our consolidated balance sheets. Significant influence typically exists if we have a 20% to 50% ownership interest in the investee. Under this method of accounting, our share of the net earnings or losses of the investee is included in operating profit in other income, net on our consolidated statements of earnings since the activities of the investee are closely aligned with the operations of the business segment holding the investment. We evaluate our equity method investments for impairment whenever events or changes in circumstances indicate that the carrying amounts of such investments may be impaired. If a decline in the value of an equity method investment is determined to be other than temporary, a loss is recorded in earnings in the current period. As of
December 31, 2018
and
2017
, our equity method investments totaled
$1.2 billion
and
$1.4 billion
, which primarily are composed of our investment in the United Launch Alliance (ULA) joint venture, and the Advanced Military Maintenance, Repair and Overhaul Center (AMMROC) joint venture. Our share of net earnings related to our equity method investees was
$119 million
in
2018
,
$207 million
in
2017
and
$443 million
in
2016
, of which approximately
$210 million
,
$205 million
and
$325 million
was included in our Space business segment operating profit.
During the year ended December 31, 2018, equity earnings included
a non-cash asset impairment charge of
$110 million
(
$83 million
, or
$0.29
per share, after tax)
related to our equity method investee
, AMMROC
. During the year ended December 31, 2017, equity earnings included a charge recorded in the first quarter of 2017 of approximately
$64 million
(
$40 million
, or
$0.14
per share, after tax), which represented our portion of a non-cash asset impairment related to certain long-lived assets held by AMMROC. We are continuing to monitor this investment in light of ongoing performance, business base and economic issues and we may have to record our portion of additional charges, or an impairment of our investment, or both, should the carrying value of our investment exceed its fair value. These charges could adversely affect our results of operations.
Derivative financial instruments
– We use derivative instruments principally to reduce our exposure to market risks from changes in foreign currency exchange rates and interest rates. We do not enter into or hold derivative instruments for speculative trading purposes. We transact business globally and are subject to risks associated with changing foreign currency exchange rates. We enter into foreign currency hedges such as forward and option contracts that change in value as foreign currency exchange rates change. These contracts hedge forecasted foreign currency transactions in order to mitigate fluctuations in our earnings and cash flows associated with changes in foreign currency exchange rates. We designate foreign currency hedges as cash flow hedges. We also are exposed to the impact of interest rate changes primarily through our borrowing activities. For fixed rate borrowings, we may use variable interest rate swaps, effectively converting fixed rate borrowings to variable rate borrowings in order to reduce the amount of interest paid. These swaps are designated as fair value hedges. For variable rate borrowings, we may use fixed interest rate swaps, effectively converting variable rate borrowings to fixed rate borrowings in order to mitigate the impact of interest rate changes on earnings. These swaps are designated as cash flow hedges. We also may enter into derivative instruments that are not designated as hedges and do not qualify for hedge accounting, which are intended to mitigate certain economic exposures.
We record derivatives at their fair value. The classification of gains and losses resulting from changes in the fair values of derivatives is dependent on our intended use of the derivative and its resulting designation. Adjustments to reflect changes in fair values of derivatives attributable to the effective portion of hedges are either reflected in earnings and largely offset by corresponding adjustments to the hedged items or reflected net of income taxes in accumulated other comprehensive loss until the hedged transaction is recognized in earnings. Changes in the fair value of the derivatives that are attributable to the ineffective portion of the hedges or of derivatives that are not considered to be highly effective hedges, if any, are immediately recognized in earnings. The aggregate notional amount of our outstanding interest rate swaps at
December 31, 2018
and
2017
was
$1.3 billion
and
$1.2 billion
. The aggregate notional amount of our outstanding foreign currency hedges at
December 31, 2018
and
2017
was
$3.5 billion
and
$4.1 billion
. The fair values of our outstanding interest rate swaps and foreign currency hedges at
December 31, 2018
and
2017
were not significant. Derivative instruments did not have a material impact on net earnings and comprehensive income during the years ended December 31,
2018
,
2017
and
2016
. The impact of derivative instruments on our consolidated statements of cash flows is included in net cash provided by operating activities. Substantially all of our derivatives are designated for hedge accounting. See “
Note 16 – Fair Value Measurements
” for more information on the fair value measurements related to our derivative instruments.
Recent Accounting Pronouncements
Revenue from Contracts with Customers
Effective January 1, 2018, we adopted ASC 606, which replaces existing revenue recognition guidance and outlines a single set of comprehensive principles for recognizing revenue under GAAP. Among other things, ASC 606 requires entities to assess the products or services promised in contracts with customers at contract inception to determine the appropriate unit at which to record revenues, which is referred to as a performance obligation. Revenue is recognized when control of the promised products or services is transferred to customers at an amount that reflects the consideration to which the entity expects to be entitled to in
70
exchange for those products or services. Prior to the adoption of ASC 606, we recognized the majority of our revenues using the percentage-of-completion method of accounting. Based on the nature of products provided or services performed, revenue was recorded as costs were incurred (the percentage-of-completion cost-to-cost method) or as units were delivered (the percentage-of-completion units-of-delivery method). For most of our contracts, the customer obtains control or receives benefits as we perform on the contract. As a result, under ASC 606 revenue is recognized over time utilizing the percentage-of-completion cost-to-cost method. This change generally results in an acceleration of revenue for contracts that were historically accounted for using the percentage-of-completion units-of-delivery method as revenues are now recognized earlier in the performance period as we incur costs. For more information on our policy for recognizing revenue under ASC 606, see “
Note 1 – Significant Accounting Policies
” Significant programs impacted by these changes include the C-130J and C-5 programs in our Aeronautics business segment; tactical missile programs (Hellfire and Joint Air-to-Surface Standoff Missile (JASSM)), Patriot Advanced Capability-3 (PAC-3), and fire control programs (LANTIRN
®
and SNIPER
®
) in our MFC business segment; the Black Hawk
®
and Seahawk
®
helicopter programs in our RMS business segment; and commercial satellite programs in our Space business segment.
We adopted ASC 606 using the full retrospective method, which means we applied the new standard to each prior year presented in our financial statements going back to January 1, 2016, with a cumulative effect adjustment to retained earnings as of January 1, 2016 for contracts that were in process at that point in time. Accordingly, the amounts for all periods presented in this Form 10‑K have been adjusted to reflect the impacts of ASC 606.
Compensation-Retirement Benefits
Effective January 1, 2018, we also adopted ASU 2017-07, which changed the income statement presentation of certain components of net periodic benefit cost related to defined benefit pension and other postretirement benefit plans. ASU 2017-07 requires entities to record only the service cost component of FAS pension and other postretirement benefit plan expense in operating profit and the non-service cost components of FAS pension and other postretirement benefit plan expense (i.e., interest cost, expected return on plan assets, net actuarial gains or losses, and amortization of prior service cost or credits) as part of non-operating expense. Previously, we recorded all components of net periodic benefit cost in operating profit as part of cost of sales. We adopted ASU 2017-07 using the retrospective method, which means we applied the new standard to each prior period presented in our financial statements going back to January 1, 2016.
71
The following tables summarize the effects of adopting ASC 606 and ASU 2017-07 on our consolidated statement of earnings for the years ended December 31,
2017
and
2016
:
|
Adjustments for
|
||||||||||||||||||||
|
2017
Historical
|
ASC 606
|
ASU 2017-07
|
2017
Adjusted
|
|||||||||||||||||
|
Net sales
|
||||||||||||||||||||
|
Products
|
$
|
43,875
|
|
$
|
(1,373
|
)
|
$
|
—
|
|
$
|
42,502
|
|
||||||||
|
Services
|
7,173
|
|
285
|
|
—
|
|
7,458
|
|
||||||||||||
|
Total net sales
|
51,048
|
|
(1,088
|
)
|
—
|
|
49,960
|
|
||||||||||||
|
Cost of sales
|
||||||||||||||||||||
|
Products
|
(39,750
|
)
|
1,333
|
|
—
|
|
(38,417
|
)
|
||||||||||||
|
Services
|
(6,405
|
)
|
(268
|
)
|
—
|
|
(6,673
|
)
|
||||||||||||
|
Other unallocated, net
|
655
|
|
—
|
|
846
|
|
1,501
|
|
||||||||||||
|
Total cost of sales
|
(45,500
|
)
|
1,065
|
|
846
|
|
(43,589
|
)
|
||||||||||||
|
Gross profit
|
5,548
|
|
(23
|
)
|
846
|
|
6,371
|
|
||||||||||||
|
Other income, net
|
373
|
|
—
|
|
—
|
|
373
|
|
||||||||||||
|
Operating profit
|
5,921
|
|
(23
|
)
|
846
|
|
6,744
|
|
||||||||||||
|
Interest expense
|
(651
|
)
|
—
|
|
—
|
|
(651
|
)
|
||||||||||||
|
Other non-operating expense, net
|
(1
|
)
|
—
|
|
(846
|
)
|
(847
|
)
|
||||||||||||
|
Earnings before income taxes
|
5,269
|
|
(23
|
)
|
—
|
|
5,246
|
|
||||||||||||
|
Income tax expense
|
(3,340
|
)
|
(16
|
)
|
—
|
|
(3,356
|
)
|
||||||||||||
|
Net earnings from continuing operations
|
1,929
|
|
(39
|
)
|
—
|
|
1,890
|
|
||||||||||||
|
Net earnings from discontinued operations
|
73
|
|
—
|
|
—
|
|
73
|
|
||||||||||||
|
Net earnings
|
$
|
2,002
|
|
$
|
(39
|
)
|
$
|
—
|
|
$
|
1,963
|
|
||||||||
|
Earnings per common share
|
||||||||||||||||||||
|
Basic
|
||||||||||||||||||||
|
Continuing operations
|
$
|
6.70
|
|
$
|
(0.14
|
)
|
$
|
—
|
|
$
|
6.56
|
|
||||||||
|
Discontinued operations
|
0.26
|
|
—
|
|
—
|
|
0.26
|
|
||||||||||||
|
Basic earnings per common share
|
$
|
6.96
|
|
$
|
(0.14
|
)
|
$
|
—
|
|
$
|
6.82
|
|
||||||||
|
Diluted
|
||||||||||||||||||||
|
Continuing operations
|
$
|
6.64
|
|
$
|
(0.14
|
)
|
$
|
—
|
|
$
|
6.50
|
|
||||||||
|
Discontinued operations
|
0.25
|
|
—
|
|
—
|
|
0.25
|
|
||||||||||||
|
Diluted earnings per common share
|
$
|
6.89
|
|
$
|
(0.14
|
)
|
$
|
—
|
|
$
|
6.75
|
|
||||||||
72
|
Adjustments for
|
||||||||||||||||||||
|
2016
Historical
|
ASC 606
|
ASU 2017-07
|
2016
Adjusted
|
|||||||||||||||||
|
Net sales
|
||||||||||||||||||||
|
Products
|
$
|
40,365
|
|
$
|
(284
|
)
|
$
|
—
|
|
$
|
40,081
|
|
||||||||
|
Services
|
6,883
|
|
326
|
|
—
|
|
7,209
|
|
||||||||||||
|
Total net sales
|
47,248
|
|
42
|
|
—
|
|
47,290
|
|
||||||||||||
|
Cost of sales
|
||||||||||||||||||||
|
Products
|
(36,616
|
)
|
222
|
|
—
|
|
(36,394
|
)
|
||||||||||||
|
Services
|
(6,040
|
)
|
(383
|
)
|
—
|
|
(6,423
|
)
|
||||||||||||
|
Severance charges
|
(80
|
)
|
—
|
|
—
|
|
(80
|
)
|
||||||||||||
|
Other unallocated, net
|
550
|
|
(13
|
)
|
471
|
|
1,008
|
|
||||||||||||
|
Total cost of sales
|
(42,186
|
)
|
(174
|
)
|
471
|
|
(41,889
|
)
|
||||||||||||
|
Gross profit
|
5,062
|
|
(132
|
)
|
471
|
|
5,401
|
|
||||||||||||
|
Other income, net
|
487
|
|
—
|
|
—
|
|
487
|
|
||||||||||||
|
Operating profit
|
5,549
|
|
(132
|
)
|
471
|
|
5,888
|
|
||||||||||||
|
Interest expense
|
(663
|
)
|
—
|
|
—
|
|
(663
|
)
|
||||||||||||
|
Other non-operating expense, net
|
—
|
|
—
|
|
(471
|
)
|
(471
|
)
|
||||||||||||
|
Earnings before income taxes
|
4,886
|
|
(132
|
)
|
—
|
|
4,754
|
|
||||||||||||
|
Income tax expense
|
(1,133
|
)
|
40
|
|
—
|
|
(1,093
|
)
|
||||||||||||
|
Net earnings from continuing operations
|
3,753
|
|
(92
|
)
|
—
|
|
3,661
|
|
||||||||||||
|
Net earnings from discontinued operations
|
1,549
|
|
(37
|
)
|
—
|
|
1,512
|
|
||||||||||||
|
Net earnings
|
$
|
5,302
|
|
$
|
(129
|
)
|
$
|
—
|
|
$
|
5,173
|
|
||||||||
|
Earnings per common share
|
||||||||||||||||||||
|
Basic
|
||||||||||||||||||||
|
Continuing operations
|
$
|
12.54
|
|
$
|
(0.31
|
)
|
$
|
—
|
|
$
|
12.23
|
|
||||||||
|
Discontinued operations
|
5.17
|
|
(0.12
|
)
|
—
|
|
5.05
|
|
||||||||||||
|
Basic earnings per common share
|
$
|
17.71
|
|
$
|
(0.43
|
)
|
$
|
—
|
|
$
|
17.28
|
|
||||||||
|
Diluted
|
||||||||||||||||||||
|
Continuing operations
|
$
|
12.38
|
|
$
|
(0.30
|
)
|
$
|
—
|
|
$
|
12.08
|
|
||||||||
|
Discontinued operations
|
5.11
|
|
(0.12
|
)
|
—
|
|
4.99
|
|
||||||||||||
|
Diluted earnings per common share
|
$
|
17.49
|
|
$
|
(0.42
|
)
|
$
|
—
|
|
$
|
17.07
|
|
||||||||
As a result of our adoption of ASC 606, our comprehensive income for the years ended December 31,
2017
and
2016
decreased by
$38 million
to
$1.5 billion
and by
$129 million
to
$4.5 billion
.
73
The following table summarizes the effects of adopting ASC 606 on our consolidated balance sheet as of December 31,
2017
(the adoption of ASU 2017-07 had no impact on our consolidated balance sheet):
|
Adjustments for
|
|||||||||||||||
|
Historical
|
ASC 606
|
Adjusted
|
|||||||||||||
|
Assets
|
|||||||||||||||
|
Current assets
|
|||||||||||||||
|
Cash and cash equivalents
|
$
|
2,861
|
|
$
|
—
|
|
$
|
2,861
|
|
||||||
|
Receivables, net
|
8,603
|
|
(6,338
|
)
|
2,265
|
|
|||||||||
|
Contract assets
|
—
|
|
7,992
|
|
7,992
|
|
|||||||||
|
Inventories
|
4,487
|
|
(1,609
|
)
|
2,878
|
|
|||||||||
|
Other current assets
|
1,510
|
|
(1
|
)
|
1,509
|
|
|||||||||
|
Total current assets
|
17,461
|
|
44
|
|
17,505
|
|
|||||||||
|
Property, plant and equipment, net
|
5,775
|
|
—
|
|
5,775
|
|
|||||||||
|
Goodwill
|
10,807
|
|
—
|
|
10,807
|
|
|||||||||
|
Intangible assets, net
|
3,797
|
|
—
|
|
3,797
|
|
|||||||||
|
Deferred income taxes
|
3,111
|
|
45
|
|
3,156
|
|
|||||||||
|
Other noncurrent assets
|
5,570
|
|
10
|
|
5,580
|
|
|||||||||
|
Total assets
|
$
|
46,521
|
|
$
|
99
|
|
$
|
46,620
|
|
||||||
|
Liabilities and equity
|
|||||||||||||||
|
Current liabilities
|
|||||||||||||||
|
Accounts payable
|
$
|
1,467
|
|
$
|
—
|
|
$
|
1,467
|
|
||||||
|
Contract liabilities
(a)
|
6,752
|
|
276
|
|
7,028
|
|
|||||||||
|
Salaries, benefits and payroll taxes
|
1,785
|
|
—
|
|
1,785
|
|
|||||||||
|
Current maturities of long-term debt
|
750
|
|
—
|
|
750
|
|
|||||||||
|
Other current liabilities
|
1,883
|
|
—
|
|
1,883
|
|
|||||||||
|
Total current liabilities
|
12,637
|
|
276
|
|
12,913
|
|
|||||||||
|
Long-term debt, net
|
13,513
|
|
—
|
|
13,513
|
|
|||||||||
|
Accrued pension liabilities
|
15,703
|
|
—
|
|
15,703
|
|
|||||||||
|
Other postretirement benefit liabilities
|
719
|
|
—
|
|
719
|
|
|||||||||
|
Other noncurrent liabilities
|
4,558
|
|
(10
|
)
|
4,548
|
|
|||||||||
|
Total liabilities
|
47,130
|
|
266
|
|
47,396
|
|
|||||||||
|
Stockholders’ equity
|
|||||||||||||||
|
Common stock, $1 par value per share
|
284
|
|
—
|
|
284
|
|
|||||||||
|
Additional paid-in capital
|
—
|
|
—
|
|
—
|
|
|||||||||
|
Retained earnings
|
11,573
|
|
(168
|
)
|
11,405
|
|
|||||||||
|
Accumulated other comprehensive loss
|
(12,540
|
)
|
1
|
|
(12,539
|
)
|
|||||||||
|
Total stockholders’ deficit
|
(683
|
)
|
(167
|
)
|
(850
|
)
|
|||||||||
|
Noncontrolling interests in subsidiary
|
74
|
|
—
|
|
74
|
|
|||||||||
|
Total deficit
|
(609
|
)
|
(167
|
)
|
(776
|
)
|
|||||||||
|
Total liabilities and equity
|
$
|
46,521
|
|
$
|
99
|
|
$
|
46,620
|
|
||||||
|
(a)
|
Formerly referred to as customer advances and amounts in excess of costs incurred.
|
74
The following tables summarize the effects of adopting ASC 606 on certain components within our net cash provided by operations for the years ended December 31,
2017
and
2016
(the adoption of ASC 606 had no impact on total operating cash flows or cash flows from investing and financing activities):
|
2017
|
Adjustments for
|
2017
|
|||||||||||||
|
Historical
|
ASC 606
|
Adjusted
|
|||||||||||||
|
Operating activities
|
|||||||||||||||
|
Net earnings
|
$
|
2,002
|
|
$
|
(39
|
)
|
$
|
1,963
|
|
||||||
|
Adjustments to reconcile net earnings to net cash provided by operating activities
|
|||||||||||||||
|
Depreciation and amortization
|
1,195
|
|
—
|
|
1,195
|
|
|||||||||
|
Stock-based compensation
|
158
|
|
—
|
|
158
|
|
|||||||||
|
Deferred income taxes
|
3,432
|
|
16
|
|
3,448
|
|
|||||||||
|
Gain on property sale
|
(198
|
)
|
—
|
|
(198
|
)
|
|||||||||
|
Gain on divestiture of IS&GS business
|
(73
|
)
|
—
|
|
(73
|
)
|
|||||||||
|
Changes in assets and liabilities
|
|||||||||||||||
|
Receivables, net
|
(401
|
)
|
(501
|
)
|
(902
|
)
|
|||||||||
|
Contract assets
|
—
|
|
390
|
|
390
|
|
|||||||||
|
Inventories
|
183
|
|
(262
|
)
|
(79
|
)
|
|||||||||
|
Accounts payable
|
(189
|
)
|
—
|
|
(189
|
)
|
|||||||||
|
Contract liabilities
(a)
|
(24
|
)
|
377
|
|
353
|
|
|||||||||
|
Postretirement benefit plans
|
1,316
|
|
—
|
|
1,316
|
|
|||||||||
|
Income taxes
|
(1,210
|
)
|
—
|
|
(1,210
|
)
|
|||||||||
|
Other, net
|
285
|
|
19
|
|
304
|
|
|||||||||
|
Net cash provided by operating activities
|
$
|
6,476
|
|
$
|
—
|
|
$
|
6,476
|
|
||||||
|
(a)
|
Formerly referred to as customer advances and amounts in excess of costs incurred.
|
|
2016
|
Adjustments for
|
2016
|
|||||||||||||
|
Historical
|
ASC 606
|
Adjusted
|
|||||||||||||
|
Operating activities
|
|||||||||||||||
|
Net earnings
|
$
|
5,302
|
|
$
|
(129
|
)
|
$
|
5,173
|
|
||||||
|
Adjustments to reconcile net earnings to net cash provided by operating activities
|
|||||||||||||||
|
Depreciation and amortization
|
1,215
|
|
—
|
|
1,215
|
|
|||||||||
|
Stock-based compensation
|
149
|
|
—
|
|
149
|
|
|||||||||
|
Deferred income taxes
|
(152
|
)
|
(41
|
)
|
(193
|
)
|
|||||||||
|
Severance and restructuring charges
|
99
|
|
—
|
|
99
|
|
|||||||||
|
Gain on divestiture of IS&GS business
|
(1,242
|
)
|
41
|
|
(1,201
|
)
|
|||||||||
|
Gain on step acquisition of AWE
|
(104
|
)
|
—
|
|
(104
|
)
|
|||||||||
|
Changes in assets and liabilities
|
|||||||||||||||
|
Receivables, net
|
(811
|
)
|
1,409
|
|
598
|
|
|||||||||
|
Contract assets
|
—
|
|
(1,246
|
)
|
(1,246
|
)
|
|||||||||
|
Inventories
|
(46
|
)
|
219
|
|
173
|
|
|||||||||
|
Accounts payable
|
(188
|
)
|
—
|
|
(188
|
)
|
|||||||||
|
Contract liabilities
(a)
|
3
|
|
(166
|
)
|
(163
|
)
|
|||||||||
|
Postretirement benefit plans
|
1,028
|
|
—
|
|
1,028
|
|
|||||||||
|
Income taxes
|
146
|
|
—
|
|
146
|
|
|||||||||
|
Other, net
|
(210
|
)
|
(87
|
)
|
(297
|
)
|
|||||||||
|
Net cash provided by operating activities
|
$
|
5,189
|
|
$
|
—
|
|
$
|
5,189
|
|
||||||
|
(a)
|
Formerly referred to as customer advances and amounts in excess of costs incurred.
|
75
Income Statement - Reporting Comprehensive Income
Effective January 1, 2018, we also adopted ASU 2018-02,
Income Statement - Reporting Comprehensive Income (Topic 220): Reclassification of Certain Tax Effects from Accumulated Other Comprehensive Income,
which provides entities an option to reclassify certain tax effects as a result of the Tax Act from accumulated other comprehensive income or loss to retained earnings. The adoption of ASU 2018-02 increased our AOCL at January 1, 2018 by
$2.4 billion
with a corresponding increase to retained earnings by the same amount with zero impact to total equity. The reclassification was primarily related to the impact of U.S. tax reform on deferred tax assets associated with net actuarial losses (and prior service credits) resulting from our defined benefit pension and other postretirement benefit plans that were originally recorded in AOCL within equity. Those amounts were originally recorded net of deferred tax benefits based on the federal statutory income tax rate in effect at the time they were recorded. GAAP requires entities to remeasure deferred tax assets and liabilities as a result of a change in tax laws or rates, with the impacts reflected in earnings. Accordingly, in the fourth quarter of 2017, we remeasured the deferred tax assets associated with our AOCL using the lower U.S. corporate income tax rate under the Tax Act, with the impacts of the remeasurement recorded as a one-time charge to earnings. Prior to ASU 2018-02, GAAP required the original deferred tax amount recorded in accumulated other comprehensive income or loss, to remain at the old tax rate despite the fact that its related deferred tax asset or liability was remeasured as a result of the Tax Act. ASU 2018-02 allows entities to record a one-time reclassification of these tax effects between accumulated other comprehensive income or loss and retained earnings. We reclassify the impact of the income tax effects of tax reform from AOCL in the period in which they occur.
Compensation—Retirement Benefits—Defined Benefit Plans—General
In August 2018, the FASB issued ASU 2018-14,
Compensation—Retirement Benefits—Defined Benefit Plans—General (Topic 715-20): Disclosure Framework—Changes to the Disclosure Requirements For Defined Benefit Plans
. The new standard modifies the disclosure requirements for employers that sponsor defined benefit pension or other postretirement plans by removing and adding certain disclosures for these plans. The effective date is our fiscal year ending December 31, 2020 with early adoption permitted and requires application on a retrospective basis. The adoption will not have a material effect on the Company’s consolidated financial statements
Derivatives and Hedging
In August 2017, the FASB issued ASU No. 2017-12,
Derivatives and Hedging (Topic 815)
, which eliminates the requirement to separately measure and report hedge ineffectiveness. The guidance is effective for fiscal years beginning after December 15, 2018, with early adoption permitted. We adopted the new standard on January 1, 2019. We do not expect a significant impact to our consolidated assets and liabilities, net earnings, or cash flows as a result of adopting this new standard.
Leases
In February 2016, the FASB issued ASU 2016-02,
Leases (Topic 842)
, which requires lessees to recognize a right-of-use asset and lease liability on the balance sheet for most lease arrangements and expands disclosures about leasing arrangements for both lessees and lessors, among other items. The new standard is effective for fiscal years beginning after December 15, 2018, which makes the new standard effective for us on January 1, 2019. We may apply the transition provisions of ASU 2016-02, as amended, either at the beginning of the earliest period presented in our fiscal year 2019 Form 10-K, which would be January 1, 2017, or on the effective date of adoption, which would be January 1, 2019. Among other requirements, the transition provisions require the lessee to recognize a right-of-use asset and liability for most existing lease arrangements on the date the transition provisions are applied. We have elected to apply the transition provisions of this new standard on January 1, 2019. Therefore, periods prior to the effective date of adoption will continue to be reported using current GAAP (ASC 840).
We commenced our evaluation of the impact of the new lease accounting standard in late 2016 by evaluating its impact on selected contracts. With this baseline understanding, we developed a project plan to evaluate numerous contracts across our corporation, develop processes and tools to implement the new standard and identify and design changes to internal controls by January 1, 2019. We have successfully identified and classified our lease population and we continued to perform under this project plan through the end of 2018. The majority of our existing lease arrangements are classified as operating leases, which will continue to be classified as operating under the new standard. Upon adoption of the new standard on January 1, 2019, we will record a right-of-use asset and lease liability, both with an approximate balance of
$1.1 billion
, on our balance sheet for all of our lease arrangements. We do not anticipate that adoption of the new standard will have a significant impact on our net earnings or cash flows.
76
Note 2 –
Earnings Per Share
The weighted average number of shares outstanding used to compute earnings per common share were as follows (in millions):
|
2018
|
|
2017
|
|
2016
|
|
||||
|
Weighted average common shares outstanding for basic computations
|
284.5
|
|
287.8
|
|
299.3
|
|
|||
|
Weighted average dilutive effect of equity awards
|
2.3
|
|
2.8
|
|
3.8
|
|
|||
|
Weighted average common shares outstanding for diluted computations
|
286.8
|
|
290.6
|
|
303.1
|
|
|||
We compute basic and diluted earnings per common share by dividing net earnings by the respective weighted average number of common shares outstanding for the periods presented. Our calculation of diluted earnings per common share also includes the dilutive effects for the assumed vesting of outstanding restricted stock units (RSUs), performance stock units (PSUs) and exercise of outstanding stock options based on the treasury stock method. There were
no
significant anti-dilutive equity awards for the years ended
December 31, 2018
,
2017
and
2016
.
Note 3 –
Acquisition and Divestitures
Consolidation of AWE Management Limited
On August 24, 2016, we increased our ownership interest in the AWE joint venture, which operates the United Kingdom’s nuclear deterrent program, from
33%
to
51%
. Consequently, we began consolidating AWE and our operating results include
100%
of AWE’s sales and
51%
of its operating profit. Prior to increasing our ownership interest, we accounted for our investment in AWE using the equity method of accounting. Under the equity method, we recognized only
33%
of AWE’s earnings or losses and
no
sales. Accordingly, prior to August 24, 2016, the date we obtained control, we recorded
33%
of AWE’s net earnings in our operating results and subsequent to August 24, 2016, we recognized 100% of AWE’s sales and 51% of its operating profit.
We accounted for this transaction as a “step acquisition” (as defined by U.S. GAAP), which requires us to consolidate and record the assets and liabilities of AWE at fair value. Accordingly, we recorded intangible assets of
$243 million
related to customer relationships,
$32 million
of net liabilities, and noncontrolling interests of
$107 million
. The intangible assets are being amortized over a period of
eight
years in accordance with the underlying pattern of economic benefit reflected by the future net cash flows. In 2016, we recognized a non-cash net gain of
$104 million
associated with obtaining a controlling interest in AWE, which consisted of a
$127 million
pretax gain recognized in the operating results of our Space business segment and
$23 million
of tax-related items at our corporate office. The gain represented the fair value of our
51%
interest in AWE, less the carrying value of our previously held investment in AWE and deferred taxes. The gain was recorded in other income, net on our consolidated statements of earnings. The fair value of AWE (including the intangible assets), our controlling interest, and the noncontrolling interests were determined using the income approach.
Divestiture of the Information Systems & Global Solutions Business
On August 16, 2016, we divested our former IS&GS business, which merged with Leidos, in a Reverse Morris Trust transaction (the “Transaction”). The Transaction was completed in a multi-step process pursuant to which we initially contributed the IS&GS business to Abacus Innovations Corporation (Abacus), a wholly owned subsidiary of Lockheed Martin created to facilitate the Transaction, and the common stock of Abacus was distributed to participating Lockheed Martin stockholders through an exchange offer. Under the terms of the exchange offer, Lockheed Martin stockholders had the option to exchange shares of Lockheed Martin common stock for shares of Abacus common stock. At the conclusion of the exchange offer, all shares of Abacus common stock were exchanged for
9,369,694
shares of Lockheed Martin common stock held by Lockheed Martin stockholders that elected to participate in the exchange. The shares of Lockheed Martin common stock that were exchanged and accepted were retired, reducing the number of shares of our common stock outstanding by approximately
3%
. Following the exchange offer, Abacus merged with a subsidiary of Leidos, with Abacus continuing as the surviving corporation and a wholly-owned subsidiary of Leidos. As part of the merger, each share of Abacus common stock was automatically converted into one share of Leidos common stock. We did not receive any shares of Leidos common stock as part of the Transaction and do not hold any shares of Leidos or Abacus common stock following the Transaction. Based on an opinion of outside tax counsel, subject to customary qualifications and based on factual representations, the exchange offer and merger will qualify as tax-free transactions to Lockheed Martin and its stockholders, except to the extent that cash was paid to Lockheed Martin stockholders in lieu of fractional shares.
In connection with the Transaction, Abacus borrowed an aggregate principal amount of approximately
$1.84 billion
under term loan facilities with third party financial institutions, the proceeds of which were used to make a one-time special cash payment of
$1.80 billion
to Lockheed Martin and to pay associated borrowing fees and expenses. The entire special cash payment was used to repay debt, pay dividends and repurchase stock during the third and fourth quarters of 2016. The obligations under the Abacus term loan facilities were guaranteed by Leidos as part of the Transaction.
77
As a result of the Transaction, we recognized a net gain of approximately
$1.3 billion
, including
$1.2 billion
recognized in 2016. The net gain represents the
$2.5 billion
fair value of the shares of Lockheed Martin common stock exchanged and retired as part of the exchange offer, plus the
$1.8 billion
one-time special cash payment, less the net book value of the IS&GS business of about
$3.0 billion
at August 16, 2016 and other adjustments of about
$100 million
. In 2017, we recognized an additional gain of
$73 million
, which reflects certain post-closing adjustments, including certain tax adjustments and the final determination of net working capital.
We classified the operating results of our former IS&GS business as discontinued operations in our consolidated financial statements in accordance with U.S. GAAP, as the divestiture of this business represented a strategic shift that had a major effect on our operations and financial results. However, the cash flows generated by the IS&GS business have not been reclassified in our consolidated statements of cash flows as we retained this cash as part of the Transaction.
The operating results, prior to the August 16, 2016 divestiture date, of the IS&GS business that have been reflected within net earnings from discontinued operations for the year ended December 31, 2016 are as follows (in millions):
|
Net sales
|
$
|
3,410
|
|
||
|
Cost of sales
|
(2,953
|
)
|
|||
|
Severance charges
|
(19
|
)
|
|||
|
Gross profit
|
438
|
|
|||
|
Other income, net
|
16
|
|
|||
|
Operating profit
|
454
|
|
|||
|
Earnings from discontinued operations before income taxes
|
454
|
|
|||
|
Income tax expense
|
(147
|
)
|
|||
|
Net gain on divestiture of discontinued operations
|
1,205
|
|
|||
|
Net earnings from discontinued operations
|
$
|
1,512
|
|
||
The operating results of the IS&GS business reported as discontinued operations are different than the results previously reported for the IS&GS business segment. Results reported within net earnings from discontinued operations only include costs that were directly attributable to the IS&GS business and exclude certain corporate overhead costs that were previously allocated to the IS&GS business. As a result, we reclassified
$82 million
in 2016 of corporate overhead costs from the IS&GS business to other unallocated, net on our consolidated statement of earnings.
Additionally, we retained all assets and obligations related to the pension benefits earned by former IS&GS business salaried employees through the date of divestiture. Therefore, the non-service portion of net pension costs (e.g., interest cost, actuarial gains and losses and expected return on plan assets) for these plans have been reclassified from the operating results of the IS&GS business segment and reported as a reduction to the FAS/CAS pension adjustment. These net pension costs were
$54 million
for the year ended December 31, 2016. The service portion of net pension costs related to IS&GS business’s salaried employees that transferred to Leidos were included in the operating results of the IS&GS business classified as discontinued operations because such costs are no longer incurred by us.
Significant severance charges related to the IS&GS business were historically recorded at the Lockheed Martin corporate office. These charges have been reclassified into the operating results of the IS&GS business, classified as discontinued operations, and excluded from the operating results of our continuing operations. The amount of severance charges reclassified were
$19 million
in 2016.
Financial information related to cash flows generated by the IS&GS business, such as depreciation and amortization, capital expenditures, and other non-cash items, included in our consolidated statement of cash flows for the years ended December 31, 2016 were not significant.
78
Note 4 –
Goodwill and Acquired Intangibles
Changes in the carrying amount of goodwill by segment were as follows (in millions):
|
Aeronautics
|
|
MFC
|
|
RMS
|
|
Space
|
|
Total
|
|
|||||||||||
|
Balance at December 31, 2016
|
$
|
171
|
|
$
|
2,260
|
|
$
|
6,748
|
|
$
|
1,585
|
|
$
|
10,764
|
|
|||||
|
Other
|
—
|
|
5
|
|
36
|
|
2
|
|
43
|
|
||||||||||
|
Balance at December 31, 2017
|
171
|
|
2,265
|
|
6,784
|
|
1,587
|
|
10,807
|
|
||||||||||
|
Other
|
—
|
|
(3
|
)
|
(33
|
)
|
(2
|
)
|
(38
|
)
|
||||||||||
|
Balance at December 31, 2018
|
$
|
171
|
|
$
|
2,262
|
|
$
|
6,751
|
|
$
|
1,585
|
|
$
|
10,769
|
|
|||||
The gross carrying amounts and accumulated amortization of our acquired intangible assets consisted of the following (in millions):
|
|
2018
|
2017
|
|||||||||||||||||||||||||
|
Gross
Carrying
Amount
|
Accumulated
Amortization
|
Net
Carrying
Amount
|
Gross
Carrying
Amount
|
Accumulated
Amortization
|
Net
Carrying
Amount
|
||||||||||||||||||||||
|
Finite-Lived:
|
|||||||||||||||||||||||||||
|
Customer programs
|
$
|
3,184
|
|
$
|
(735
|
)
|
$
|
2,449
|
|
$
|
3,184
|
|
$
|
(503
|
)
|
$
|
2,681
|
|
|||||||||
|
Customer relationships
|
344
|
|
(199
|
)
|
145
|
|
352
|
|
(140
|
)
|
212
|
|
|||||||||||||||
|
Other
|
53
|
|
(40
|
)
|
13
|
|
71
|
|
(54
|
)
|
17
|
|
|||||||||||||||
|
Total finite-lived intangibles
|
3,581
|
|
(974
|
)
|
2,607
|
|
3,607
|
|
(697
|
)
|
2,910
|
|
|||||||||||||||
|
Indefinite-Lived:
|
|||||||||||||||||||||||||||
|
Trademark
|
887
|
|
—
|
|
887
|
|
887
|
|
—
|
|
887
|
|
|||||||||||||||
|
Total acquired intangibles
|
$
|
4,468
|
|
$
|
(974
|
)
|
$
|
3,494
|
|
$
|
4,494
|
|
$
|
(697
|
)
|
$
|
3,797
|
|
|||||||||
Acquired finite-lived intangible assets are amortized to expense primarily on a straight-line basis over the following estimated useful lives: customer programs, from
nine
to
20 years
; customer relationships, from
four
to
10 years
; and other intangibles, from
three
to
10 years
.
Amortization expense for acquired finite-lived intangible assets was
$296 million
,
$312 million
and
$284 million
in
2018
,
2017
and
2016
. Estimated future amortization expense is as follows:
$285 million
in
2019
;
$263 million
in
2020
;
$256 million
in
2021
;
$253 million
in
2022
;
$250 million
in
2023
and
$1.3 billion
thereafter.
With the acquisition of Sikorsky Aircraft Corporation (Sikorsky), we recorded customer contractual obligations of
$507 million
. Customer contractual obligations represent liabilities on certain development programs where the expected costs exceed the expected sales under contract. These liabilities are liquidated in accordance with the underlying economic pattern of the contractual obligations, as reflected by the estimated future net cash outflows incurred on the associated contracts. As of
December 31, 2018
, we have recognized approximately
$325 million
in net sales related to customer contractual obligations. As of
December 31, 2018
, the estimated liquidation of the customer contractual obligation is approximated as follows:
$70 million
in
2019
,
$45 million
in
2020
,
$15 million
in
2021
,
$30 million
in
2022
,
$5 million
in
2023
and
$17 million
thereafter.
79
Note 5 –
Information on Business Segments
We operate in
four
business segments: Aeronautics, MFC, RMS and Space. We organize our business segments based on the nature of the products and services offered.
Following is a brief description of the activities of our business segments:
|
•
|
Aeronautics
– Engaged in the research, design, development, manufacture, integration, sustainment, support and upgrade of advanced military aircraft, including combat and air mobility aircraft, unmanned air vehicles and related technologies.
|
|
•
|
Missiles and Fire Control
– Provides air and missile defense systems; tactical missiles and air-to-ground precision strike weapon systems; logistics; fire control systems; mission operations support, readiness, engineering support and integration services; manned and unmanned ground vehicles; and energy management solutions.
|
|
•
|
Rotary and Mission Systems
– Provides design, manufacture, service and support for a variety of military and commercial helicopters; ship and submarine mission and combat systems; mission systems and sensors for rotary and fixed-wing aircraft; sea and land-based missile defense systems; radar systems; the Littoral Combat Ship (LCS); simulation and training services; and unmanned systems and technologies. In addition, RMS supports the needs of customers in cybersecurity and delivers communications and command and control capability through complex mission solutions for defense applications.
|
|
•
|
Space
– Engaged in the research and development, design, engineering and production of satellites, space transportation systems, and strategic, advanced strike, and defensive systems. Space provides network-enabled situational awareness and integrates complex space and ground global systems to help our customers gather, analyze and securely distribute critical intelligence data. Space is also responsible for various classified systems and services in support of vital national security systems. Prior to August 24, 2016, the date we obtained control of AWE we accounted for the venture using the equity method of accounting with
33%
of AWE’s earnings or losses recognized by Space. Subsequent to August 24, 2016, we obtained control of AWE and
100%
of AWE’s sales and
51%
of AWE’s earnings have been included in our consolidated results of operations. Accordingly, the consolidated results of operations for the year ended December 31, 2016 do not reflect a full year of AWE operations. Operating profit for our Space business segment also includes our share of earnings for our investment in ULA, which provides expendable launch services to the U.S. Government.
|
The financial information in the following tables includes the results of businesses we have acquired from their respective dates of acquisition and excludes businesses included in discontinued operations (see “
Note 3 – Acquisition and Divestitures
”) for all years presented. Net sales of our business segments exclude intersegment sales as these activities are eliminated in consolidation.
Operating profit of our business segments includes our share of earnings or losses from equity method investees as the operating activities of the equity method investees are closely aligned with the operations of our business segments. ULA, results of which are included in our Space business segment, is our primary equity method investee. Operating profit of our business segments excludes the FAS/CAS operating adjustment for our qualified defined benefit pension plans (described below); the adjustment from CAS to FAS service cost component for all other postretirement benefit plans; expense for stock-based compensation; the effects of items not considered part of management’s evaluation of segment operating performance, such as charges related to significant severance and restructuring actions (see “
Note 15 – Severance and Restructuring Charges
”) and goodwill impairments; gains or losses from significant divestitures; the effects of certain legal settlements; corporate costs not allocated to our business segments; and other miscellaneous corporate activities. These items are included in the reconciling item “Unallocated items” between operating profit from our business segments and our consolidated operating profit. See “
Note 1 – Significant Accounting Policies
” (under the caption “Use of Estimates”) for a discussion related to certain factors that may impact the comparability of net sales and operating profit of our business segments.
Our business segments’ results of operations include pension expense only as calculated under U.S. Government Cost Accounting Standards (CAS), which we refer to as CAS pension cost. We recover CAS pension cost through the pricing of our products and services on U.S. Government contracts and, therefore, the CAS pension cost is recognized in each of our business segments’ net sales and cost of sales. Our consolidated operating profit in our consolidated financial statements must present the service cost component of FAS pension and other postretirement benefit plan expense calculated in accordance with FAS requirements under U.S. GAAP. The operating portion of the net FAS/CAS operating adjustment represents the difference between the service cost component of FAS pension expense and the CAS pension cost recorded in our business segments’ results of operations. The non-service FAS pension and other postretirement benefit plan cost component is included in other non-operating expenses, net on our consolidated statement of earnings.
80
Selected Financial Data by Business Segment
Summary operating results for each of our business segments were as follows (in millions):
|
2018
|
|
2017
|
|
2016
|
|
|||||||
|
Net sales
|
||||||||||||
|
Aeronautics
|
$
|
21,242
|
|
$
|
19,410
|
|
$
|
17,293
|
|
|||
|
Missiles and Fire Control
|
8,462
|
|
7,282
|
|
6,789
|
|
||||||
|
Rotary and Mission Systems
|
14,250
|
|
13,663
|
|
13,595
|
|
||||||
|
Space
|
9,808
|
|
9,605
|
|
9,613
|
|
||||||
|
Total net sales
|
$
|
53,762
|
|
$
|
49,960
|
|
$
|
47,290
|
|
|||
|
Operating profit
|
||||||||||||
|
Aeronautics
|
$
|
2,272
|
|
$
|
2,176
|
|
$
|
1,845
|
|
|||
|
Missiles and Fire Control
|
1,248
|
|
1,034
|
|
1,004
|
|
||||||
|
Rotary and Mission Systems
|
1,302
|
|
902
|
|
845
|
|
||||||
|
Space
(a)
|
1,055
|
|
980
|
|
1,288
|
|
||||||
|
Total business segment operating profit
|
5,877
|
|
5,092
|
|
4,982
|
|
||||||
|
Unallocated items
|
||||||||||||
|
FAS/CAS operating adjustment
(b)
|
1,803
|
|
1,613
|
|
1,250
|
|
||||||
|
Stock-based compensation
|
(173
|
)
|
(158
|
)
|
(149
|
)
|
||||||
|
Severance and restructuring charges
(c)
|
(96
|
)
|
—
|
|
(80
|
)
|
||||||
|
Other, net
(d)
|
(77
|
)
|
197
|
|
(115
|
)
|
||||||
|
Total unallocated, net
|
1,457
|
|
1,652
|
|
906
|
|
||||||
|
Total consolidated operating profit
|
$
|
7,334
|
|
$
|
6,744
|
|
$
|
5,888
|
|
|||
|
(a)
|
On August 24, 2016, our ownership interest in the AWE joint venture increased from
33%
to
51%
and we were required to change our accounting for this investment from the equity method to consolidation. As a result of the increased ownership interest, we recognized a non-cash gain of
$127 million
at our Space business segment, which increased net earnings from continuing operations by
$104 million
(
$0.34
per share) in 2016. See “
Note 3 – Acquisition and Divestitures
”
for more information.
|
|
(b)
|
The FAS/CAS operating adjustment represents the difference between the service cost component of FAS pension expense and total pension costs recoverable on U.S. Government contracts as determined in accordance with CAS. For a detail of the FAS/CAS operating adjustment and the total net FAS/CAS pension adjustment, see the table below.
|
|
(c)
|
See “
Note 15 – Severance and Restructuring Charges
”
for information on charges related to certain severance actions at our business segments. Severance and restructuring charges for initiatives that are not significant are included in business segment operating profit.
|
|
(d)
|
Other, net in 2018 includes
a non-cash asset impairment charge of
$110 million
related to our equity method investee
, AMMROC
(see “
Note 1 – Significant Accounting Policies
”
).
Other, net in 2017 includes a previously deferred non-cash gain of
$198 million
related to properties sold in 2015 as a result of completing our remaining obligations
(see “
Note 8 – Property, Plant and Equipment, net
”) and a
$64 million
charge, which represents our portion of a non-cash asset impairment charge recorded by AMMROC
(see “
Note 1 – Significant Accounting Policies
”).
|
81
Total net FAS/CAS pension adjustments, including the service and non-service cost components of FAS pension expense, were as follows (in millions):
|
2018
|
|
2017
|
|
2016
|
|
|||||||
|
Total FAS expense and CAS costs
|
||||||||||||
|
FAS pension expense
|
$
|
(1,431
|
)
|
$
|
(1,372
|
)
|
$
|
(1,019
|
)
|
|||
|
Less: CAS pension cost
|
2,433
|
|
2,248
|
|
1,921
|
|
||||||
|
Net FAS/CAS pension adjustment
|
$
|
1,002
|
|
$
|
876
|
|
$
|
902
|
|
|||
|
Service and non-service cost reconciliation
|
||||||||||||
|
FAS pension service cost
|
(630
|
)
|
(635
|
)
|
(671
|
)
|
||||||
|
Less: CAS pension cost
|
2,433
|
|
2,248
|
|
1,921
|
|
||||||
|
FAS/CAS operating adjustment
|
1,803
|
|
1,613
|
|
1,250
|
|
||||||
|
Non-operating FAS pension expense
(a)
|
(801
|
)
|
(737
|
)
|
(348
|
)
|
||||||
|
Net FAS/CAS pension adjustment
|
$
|
1,002
|
|
$
|
876
|
|
$
|
902
|
|
|||
|
(a)
|
We record the non-service cost components of net periodic benefit cost as part of other non-operating expense, net in the consolidated statement of earnings. The non-service cost components in the table above relate only to our qualified defined benefit pension plans. We incurred total non-service costs for our qualified defined benefit pension plans in the table above, along with similar costs for our other postretirement benefit plans of
$67 million
,
$109 million
, and
$123 million
for the years ended 2018, 2017 and 2016.
|
We recover CAS pension cost through the pricing of our products and services on U.S. Government contracts and, therefore, recognize CAS pension cost in each of our business segment’s net sales and cost of sales. Our consolidated financial statements must present FAS pension and other postretirement benefit plan expense calculated in accordance with FAS requirements under U.S. GAAP. The operating portion of the net FAS/CAS pension adjustment represents the difference between the service cost component of FAS pension expense and CAS pension cost. The non-service FAS pension cost component is included in other non-operating expense, net on our consolidated statements of earnings. The net FAS/CAS pension adjustment increases or decreases CAS pension cost to equal total FAS pension expense (both service and non-service).
|
2018
|
|
2017
|
|
2016
|
|
|||||||
|
Intersegment sales
|
||||||||||||
|
Aeronautics
|
$
|
120
|
|
$
|
122
|
|
$
|
142
|
|
|||
|
Missiles and Fire Control
|
423
|
|
355
|
|
299
|
|
||||||
|
Rotary and Mission Systems
|
2,026
|
|
2,020
|
|
1,854
|
|
||||||
|
Space
|
237
|
|
111
|
|
110
|
|
||||||
|
Total intersegment sales
|
$
|
2,806
|
|
$
|
2,608
|
|
$
|
2,405
|
|
|||
|
Depreciation and amortization
|
||||||||||||
|
Aeronautics
|
$
|
304
|
|
$
|
311
|
|
$
|
299
|
|
|||
|
Missiles and Fire Control
|
105
|
|
99
|
|
105
|
|
||||||
|
Rotary and Mission Systems
|
458
|
|
468
|
|
476
|
|
||||||
|
Space
|
229
|
|
245
|
|
212
|
|
||||||
|
Total business segment depreciation and amortization
|
1,096
|
|
1,123
|
|
1,092
|
|
||||||
|
Corporate activities
|
65
|
|
72
|
|
75
|
|
||||||
|
Total depreciation and amortization
(a)
|
$
|
1,161
|
|
$
|
1,195
|
|
$
|
1,167
|
|
|||
|
Capital expenditures
|
||||||||||||
|
Aeronautics
|
$
|
460
|
|
$
|
371
|
|
$
|
358
|
|
|||
|
Missiles and Fire Control
|
244
|
|
156
|
|
167
|
|
||||||
|
Rotary and Mission Systems
|
255
|
|
308
|
|
271
|
|
||||||
|
Space
|
255
|
|
179
|
|
183
|
|
||||||
|
Total business segment capital expenditures
|
1,214
|
|
1,014
|
|
979
|
|
||||||
|
Corporate activities
|
64
|
|
163
|
|
75
|
|
||||||
|
Total capital expenditures
(b)
|
$
|
1,278
|
|
$
|
1,177
|
|
$
|
1,054
|
|
|||
|
(a)
|
Total depreciation and amortization in the table above excludes
$48 million
for the year ended December 31, 2016 related to the former IS&GS business segment. These amounts are included in depreciation and amortization in our consolidated statement of cash flows as we did not reclassify our cash flows to exclude the IS&GS business segment. See “
Note 3 – Acquisition and Divestitures
” for more information.
|
|
(b)
|
Total capital expenditures in the table above excludes
$9 million
for the year ended December 31, 2016 related to the former IS&GS business segment. These amounts are included in capital expenditures in our consolidated statement of cash flows as we did not reclassify our cash flows to exclude the IS&GS business segment. See “
Note 3 – Acquisition and Divestitures
” for more information.
|
82
Net Sales by Type
Net sales by total products and services, contract type, customer category and geographic region for each of our business segments were as follows (in millions):
|
2018
|
||||||||||||||||||||
|
Aeronautics
|
MFC
|
RMS
|
Space
|
Total
|
||||||||||||||||
|
Net sales
|
||||||||||||||||||||
|
Products
|
$
|
18,207
|
|
$
|
6,945
|
|
$
|
11,714
|
|
$
|
8,139
|
|
$
|
45,005
|
|
|||||
|
Services
|
3,035
|
|
1,517
|
|
2,536
|
|
1,669
|
|
8,757
|
|
||||||||||
|
Total net sales
|
$
|
21,242
|
|
$
|
8,462
|
|
$
|
14,250
|
|
$
|
9,808
|
|
$
|
53,762
|
|
|||||
|
Net sales by contract type
|
||||||||||||||||||||
|
Fixed-price
|
$
|
15,719
|
|
$
|
5,653
|
|
$
|
9,975
|
|
$
|
1,892
|
|
$
|
33,239
|
|
|||||
|
Cost-reimbursable
|
5,523
|
|
2,809
|
|
4,275
|
|
7,916
|
|
20,523
|
|
||||||||||
|
Total net sales
|
$
|
21,242
|
|
$
|
8,462
|
|
$
|
14,250
|
|
$
|
9,808
|
|
$
|
53,762
|
|
|||||
|
Net sales by customer
|
||||||||||||||||||||
|
U.S. Government
|
$
|
13,321
|
|
$
|
6,088
|
|
$
|
10,083
|
|
$
|
8,224
|
|
$
|
37,716
|
|
|||||
|
International
(a)
|
7,735
|
|
2,190
|
|
3,693
|
|
1,538
|
|
15,156
|
|
||||||||||
|
U.S. commercial and other
|
186
|
|
184
|
|
474
|
|
46
|
|
890
|
|
||||||||||
|
Total net sales
|
$
|
21,242
|
|
$
|
8,462
|
|
$
|
14,250
|
|
$
|
9,808
|
|
$
|
53,762
|
|
|||||
|
Net sales by geographic region
|
||||||||||||||||||||
|
United States
|
$
|
13,507
|
|
$
|
6,272
|
|
$
|
10,557
|
|
$
|
8,270
|
|
$
|
38,606
|
|
|||||
|
Asia Pacific
|
3,335
|
|
427
|
|
1,433
|
|
85
|
|
5,280
|
|
||||||||||
|
Europe
|
2,837
|
|
321
|
|
829
|
|
1,416
|
|
5,403
|
|
||||||||||
|
Middle East
|
1,380
|
|
1,404
|
|
781
|
|
37
|
|
3,602
|
|
||||||||||
|
Other
|
183
|
|
38
|
|
650
|
|
—
|
|
871
|
|
||||||||||
|
Total net sales
|
$
|
21,242
|
|
$
|
8,462
|
|
$
|
14,250
|
|
$
|
9,808
|
|
$
|
53,762
|
|
|||||
|
(a)
|
International sales include foreign military sales contracted through the U.S. Government, direct commercial sales with international governments and commercial and other sales to international customers.
|
|
2017
|
||||||||||||||||||||
|
Aeronautics
|
MFC
|
RMS
|
Space
|
Total
|
||||||||||||||||
|
Net sales
|
||||||||||||||||||||
|
Products
|
$
|
16,981
|
|
$
|
5,940
|
|
$
|
11,398
|
|
$
|
8,183
|
|
$
|
42,502
|
|
|||||
|
Services
|
2,429
|
|
1,342
|
|
2,265
|
|
1,422
|
|
7,458
|
|
||||||||||
|
Total net sales
|
$
|
19,410
|
|
$
|
7,282
|
|
$
|
13,663
|
|
$
|
9,605
|
|
$
|
49,960
|
|
|||||
|
Net sales by contract type
|
||||||||||||||||||||
|
Fixed-price
|
$
|
13,828
|
|
$
|
5,102
|
|
$
|
10,059
|
|
$
|
2,058
|
|
$
|
31,047
|
|
|||||
|
Cost-reimbursable
|
5,582
|
|
2,180
|
|
3,604
|
|
7,547
|
|
18,913
|
|
||||||||||
|
Total net sales
|
$
|
19,410
|
|
$
|
7,282
|
|
$
|
13,663
|
|
$
|
9,605
|
|
$
|
49,960
|
|
|||||
|
Net sales by customer
|
||||||||||||||||||||
|
U.S. Government
|
$
|
12,609
|
|
$
|
4,467
|
|
$
|
9,715
|
|
$
|
8,088
|
|
$
|
34,879
|
|
|||||
|
International
(a)
|
6,641
|
|
2,672
|
|
3,575
|
|
1,446
|
|
14,334
|
|
||||||||||
|
U.S. commercial and other
|
160
|
|
143
|
|
373
|
|
71
|
|
747
|
|
||||||||||
|
Total net sales
|
$
|
19,410
|
|
$
|
7,282
|
|
$
|
13,663
|
|
$
|
9,605
|
|
$
|
49,960
|
|
|||||
|
Net sales by geographic region
|
||||||||||||||||||||
|
United States
|
$
|
12,769
|
|
$
|
4,610
|
|
$
|
10,088
|
|
$
|
8,159
|
|
$
|
35,626
|
|
|||||
|
Asia Pacific
|
2,823
|
|
516
|
|
1,344
|
|
92
|
|
4,775
|
|
||||||||||
|
Europe
|
2,331
|
|
305
|
|
927
|
|
1,270
|
|
4,833
|
|
||||||||||
|
Middle East
|
1,316
|
|
1,798
|
|
572
|
|
81
|
|
3,767
|
|
||||||||||
|
Other
|
171
|
|
53
|
|
732
|
|
3
|
|
959
|
|
||||||||||
|
Total net sales
|
$
|
19,410
|
|
$
|
7,282
|
|
$
|
13,663
|
|
$
|
9,605
|
|
$
|
49,960
|
|
|||||
|
(a)
|
International sales include foreign military sales contracted through the U.S. Government, direct commercial sales with international governments and commercial and other sales to international customers.
|
83
|
2016
|
||||||||||||||||||||
|
Aeronautics
|
MFC
|
RMS
|
Space
|
Total
|
||||||||||||||||
|
Net sales
|
||||||||||||||||||||
|
Products
|
$
|
15,066
|
|
$
|
5,602
|
|
$
|
11,401
|
|
$
|
8,012
|
|
$
|
40,081
|
|
|||||
|
Services
|
2,227
|
|
1,187
|
|
2,194
|
|
1,601
|
|
7,209
|
|
||||||||||
|
Total net sales
|
$
|
17,293
|
|
$
|
6,789
|
|
$
|
13,595
|
|
$
|
9,613
|
|
$
|
47,290
|
|
|||||
|
Net sales by contract type
|
||||||||||||||||||||
|
Fixed-price
|
$
|
11,926
|
|
$
|
4,926
|
|
$
|
9,871
|
|
$
|
2,324
|
|
$
|
29,047
|
|
|||||
|
Cost-reimbursable
|
5,367
|
|
1,863
|
|
3,724
|
|
7,289
|
|
18,243
|
|
||||||||||
|
Total net sales
|
$
|
17,293
|
|
$
|
6,789
|
|
$
|
13,595
|
|
$
|
9,613
|
|
$
|
47,290
|
|
|||||
|
Net sales by customer
|
||||||||||||||||||||
|
U.S. Government
|
$
|
11,265
|
|
$
|
4,304
|
|
$
|
9,350
|
|
$
|
8,516
|
|
$
|
33,435
|
|
|||||
|
International
(a)
|
5,825
|
|
2,344
|
|
3,791
|
|
719
|
|
12,679
|
|
||||||||||
|
U.S. commercial and other
|
203
|
|
141
|
|
454
|
|
378
|
|
1,176
|
|
||||||||||
|
Total net sales
|
$
|
17,293
|
|
$
|
6,789
|
|
$
|
13,595
|
|
$
|
9,613
|
|
$
|
47,290
|
|
|||||
|
Net sales by geographic region
|
||||||||||||||||||||
|
United States
|
$
|
11,468
|
|
$
|
4,445
|
|
$
|
9,804
|
|
$
|
8,894
|
|
$
|
34,611
|
|
|||||
|
Asia Pacific
|
2,077
|
|
341
|
|
1,194
|
|
98
|
|
3,710
|
|
||||||||||
|
Europe
|
2,020
|
|
237
|
|
1,045
|
|
475
|
|
3,777
|
|
||||||||||
|
Middle East
|
1,423
|
|
1,739
|
|
429
|
|
146
|
|
3,737
|
|
||||||||||
|
Other
|
305
|
|
27
|
|
1,123
|
|
—
|
|
1,455
|
|
||||||||||
|
Total net sales
|
$
|
17,293
|
|
$
|
6,789
|
|
$
|
13,595
|
|
$
|
9,613
|
|
$
|
47,290
|
|
|||||
|
(a)
|
International sales include foreign military sales contracted through the U.S. Government, direct commercial sales with international governments and commercial and other sales to international customers.
|
Our Aeronautics business segment includes our largest program, the F-35 Lightning II Joint Strike Fighter, an international multi-role, multi-variant, stealth fighter aircraft. Net sales for the F-35 program represented approximately
27%
,
26%
and
23%
of our total consolidated net sales during
2018
,
2017
and
2016
.
Total assets for each of our business segments were as follows (in millions):
|
2018
|
|
2017
|
|
|||||
|
Assets
(a)
|
||||||||
|
Aeronautics
|
$
|
8,435
|
|
$
|
7,713
|
|
||
|
Missiles and Fire Control
|
5,017
|
|
4,577
|
|
||||
|
Rotary and Mission Systems
|
18,333
|
|
18,292
|
|
||||
|
Space
|
5,445
|
|
5,240
|
|
||||
|
Total business segment assets
|
37,230
|
|
35,822
|
|
||||
|
Corporate assets
(b)
|
7,646
|
|
10,798
|
|
||||
|
Total assets
|
$
|
44,876
|
|
$
|
46,620
|
|
||
|
(a)
|
We have no long-lived assets with material carrying values located in foreign countries.
|
|
(b)
|
Corporate assets primarily include cash and cash equivalents, deferred income taxes, environmental receivables and investments held in a separate trust.
|
Note 6 –
Receivables, net, Contract Assets and Contract Liabilities
Receivables, net, contract assets and contract liabilities were as follows (in millions):
|
2018
|
|
2017
|
|
|||||
|
Receivables, net
|
$
|
2,444
|
|
$
|
2,265
|
|
||
|
Contract assets
|
9,472
|
|
7,992
|
|
||||
|
Contract liabilities
|
6,491
|
|
7,028
|
|
||||
Receivables, net consist of approximately
$1.9 billion
from the U.S. Government and
$578 million
from other governments and commercial customers as of
December 31, 2018
.
84
Contract assets are net of
$30.2 billion
and
$19.9 billion
of customer advances and progress payments as of
December 31, 2018
and
2017
. Contract assets
increased
$1.5 billion
during
2018
, primarily due to the recognition of revenue related to the satisfaction or partial satisfaction of performance obligations during
2018
for which we have not yet billed. There were
no
significant impairment losses related to our contract assets during
2018
and
2017
. We expect to bill our customers for the majority of the
December 31, 2018
contract assets during
2019
.
Contract liabilities
decreased
$537 million
during 2018, primarily due to revenue recognized in excess of payments received on these performance obligations. During
2018
, we recognized
$3.9 billion
of our contract liabilities at
December 31, 2018
as revenue. During
2017
, we recognized
$3.3 billion
of our contract liabilities at December 31,
2017
as revenue. During
2016
, we recognized
$3.7 billion
of our contract liabilities at December 31,
2016
as revenue.
Note 7 –
Inventories
Inventories consisted of the following (in millions):
|
2018
|
|
2017
|
|
|||||
|
Materials, spares and supplies
|
$
|
446
|
|
$
|
563
|
|
||
|
Work-in-process
|
2,161
|
|
1,823
|
|
||||
|
Finished goods
|
390
|
|
492
|
|
||||
|
Total inventories
|
$
|
2,997
|
|
$
|
2,878
|
|
||
Work-in-process inventories at
December 31, 2018
and
2017
included general and administrative costs of
$53 million
and
$112 million
. General and administrative costs incurred and recorded in inventories totaled
$1.9 billion
in
2018
,
$2.0 billion
in
2017
and
$1.9 billion
in
2016
. General and administrative costs charged to cost of sales from inventories totaled
$2.0 billion
in both
2018
and
2017
and
$1.9 billion
in
2016
.
Costs incurred to fulfill a contract in advance of the contract being awarded are included in inventories as work-in-process if we determine that those costs relate directly to a contract or to an anticipated contract that we can specifically identify and contract award is probable, the costs generate or enhance resources that will be used in satisfying performance obligations, and the costs are recoverable (referred to as pre-contract costs). Pre-contract costs that are initially capitalized in inventory are generally recognized as cost of sales consistent with the transfer of products and services to the customer upon the receipt of the anticipated contract. All other pre-contract costs, including start-up costs, are expensed as incurred. As of
December 31, 2018
and
2017
,
$443 million
and
$466 million
of pre-contract costs were included in inventories.
Note 8 –
Property, Plant and Equipment, net
Property, plant and equipment, net consisted of the following (in millions):
|
2018
|
|
2017
|
|
|||||
|
Land
|
$
|
135
|
|
$
|
131
|
|
||
|
Buildings
|
6,553
|
|
6,401
|
|
||||
|
Machinery and equipment
|
7,871
|
|
7,624
|
|
||||
|
Construction in progress
|
1,530
|
|
1,205
|
|
||||
|
Total property, plant and equipment
|
16,089
|
|
15,361
|
|
||||
|
Less: accumulated depreciation and amortization
|
(9,965
|
)
|
(9,586
|
)
|
||||
|
Total property, plant and equipment, net
|
$
|
6,124
|
|
$
|
5,775
|
|
||
Land Sales
In 2017, we recognized a previously deferred non-cash gain in other income, net in our consolidated statement of earnings of
$198 million
(
$122 million
or
$0.42
per share, after tax) related to properties sold in 2015 as a result of completing our remaining obligations.
85
Note 9 –
Income Taxes
Our provision for federal and foreign income tax expense for continuing operations consisted of the following (in millions):
|
2018
|
|
2017
|
|
2016
|
|
|||||||
|
Federal income tax expense (benefit):
|
||||||||||||
|
Current
|
||||||||||||
|
Operations
|
$
|
975
|
|
$
|
(189
|
)
|
$
|
1,327
|
|
|||
|
One-time charge due to tax legislation
(a)
|
(6
|
)
|
43
|
|
—
|
|
||||||
|
Deferred
|
||||||||||||
|
Operations
|
(194
|
)
|
1,607
|
|
(261
|
)
|
||||||
|
One-time charge due to tax legislation
(a)
|
(37
|
)
|
1,843
|
|
—
|
|
||||||
|
Total federal income tax expense
|
738
|
|
3,304
|
|
1,066
|
|
||||||
|
Foreign income tax expense (benefit):
|
||||||||||||
|
Current
|
67
|
|
53
|
|
56
|
|
||||||
|
Deferred
|
(13
|
)
|
(1
|
)
|
(29
|
)
|
||||||
|
Total foreign income tax expense
|
54
|
|
52
|
|
27
|
|
||||||
|
Total income tax expense
|
$
|
792
|
|
$
|
3,356
|
|
$
|
1,093
|
|
|||
|
(a)
|
Represents one-time charge in 2017 primarily due to the re-measurement of certain net deferred tax assets using the lower U.S. corporate income tax rate and a deemed repatriation tax, and true-up to this charge in 2018.
|
On December 22, 2017, the President signed the Tax Cuts and Jobs Act (the “Tax Act”). The Tax Act, among other things, lowered the U.S. corporate income tax rate from
35%
to
21%
effective January 1, 2018. Consequently, we wrote down our net deferred tax assets as of December 31, 2017 by
$2.0 billion
to reflect the estimated impact of the Tax Act. We recorded a corresponding net one-time charge of
$2.0 billion
(
$6.77
per share), substantially all of which was non-cash, primarily related to enactment of the Tax Act, the re-measurement of certain net deferred tax assets using the lower U.S. corporate income tax rate, a deemed repatriation tax, and a reduction in the U.S. manufacturing benefit as a result of our decision to accelerate contributions to our pension fund in 2018 in order to receive a tax deduction in 2017.
We applied the guidance in Staff Accounting Bulletin 118 when accounting for the enactment-date effects of the Tax Act in 2017 and throughout 2018. At December 31, 2017, we had substantially completed our provisional analysis of the income tax effects of the Tax Act and recorded a reasonable estimate in 2017 of such effects. During 2018, we refined our calculations, evaluated changes in interpretations and assumptions that we had made, applied additional guidance issued by the U.S. Government, and evaluated actions and related accounting policy decisions we have made.
As of December 22, 2018, we completed our accounting for all of the enactment-date income tax effects of the Tax Act and did not identify any material changes to the provisional, net, one-time charge for the year ended December 31, 2017, related to the Tax Act.
State income taxes are included in our operations as general and administrative costs and, under U.S. Government regulations, are allowable costs in establishing prices for the products and services we sell to the U.S. Government. Therefore, a substantial portion of state income taxes is included in our net sales and cost of sales. As a result, the impact of certain transactions on our operating profit and of other matters presented in these consolidated financial statements is disclosed net of state income taxes. Our total net state income tax expense was
$83 million
for
2018
,
$103 million
for
2017
, and
$112 million
for
2016
.
86
Our reconciliation of the U.S. federal statutory income tax rate (
21%
in 2018 and
35%
in 2017 and 2016) to actual income tax expense for continuing operations is as follows (dollars in millions):
|
|
2018
|
2017
|
2016
|
||||||||||||||||||
|
Amount
|
Rate
|
Amount
|
Rate
|
Amount
|
Rate
|
||||||||||||||||
|
Income tax expense at the U.S. federal statutory tax rate
|
$
|
1,226
|
|
21.0
|
%
|
$
|
1,836
|
|
35.0
|
%
|
$
|
1,664
|
|
35.0
|
%
|
||||||
|
Research and development tax credit
|
(138
|
)
|
(2.4
|
)
|
(115
|
)
|
(2.2
|
)
|
(107
|
)
|
(2.2
|
)
|
|||||||||
|
Foreign derived intangible income deduction
|
(61
|
)
|
(1.0
|
)
|
—
|
|
—
|
|
—
|
|
—
|
|
|||||||||
|
Tax deductible dividends
|
(59
|
)
|
(1.0
|
)
|
(94
|
)
|
(1.8
|
)
|
(92
|
)
|
(1.9
|
)
|
|||||||||
|
Excess tax benefits for share-based payment awards
|
(55
|
)
|
(0.9
|
)
|
(106
|
)
|
(2.0
|
)
|
(152
|
)
|
(3.2
|
)
|
|||||||||
|
Deferred tax write-down and transition tax
(a)
|
(43
|
)
|
(0.7
|
)
|
1,886
|
|
35.9
|
|
—
|
|
—
|
|
|||||||||
|
U.S. manufacturing deduction benefit
(b)
|
—
|
|
—
|
|
(7
|
)
|
(0.1
|
)
|
(117
|
)
|
(2.5
|
)
|
|||||||||
|
Tax accounting method change
(c)
|
(61
|
)
|
(1.0
|
)
|
—
|
|
—
|
|
—
|
|
—
|
|
|||||||||
|
Other, net
|
(17
|
)
|
(0.4
|
)
|
(44
|
)
|
(0.8
|
)
|
(103
|
)
|
(2.2
|
)
|
|||||||||
|
Income tax expense
|
$
|
792
|
|
13.6
|
%
|
$
|
3,356
|
|
64.0
|
%
|
$
|
1,093
|
|
23.0
|
%
|
||||||
|
(a)
|
Includes a deferred tax re-measurement and transition tax true-up in 2018 and one-time charge in 2017 primarily due to the re-measurement of certain net deferred tax assets using the lower U.S. corporate income tax rate and a deemed repatriation tax.
|
|
(b)
|
Includes a reduction in our 2017 manufacturing benefit as a result of our decision to accelerate contributions to our pension funds in 2018. The Tax Act repealed the manufacturing benefit for years after 2017.
|
|
(c)
|
Recognized tax benefit of
$61 million
in 2018 from our change in a tax accounting method related to restoration of tax basis.
|
Tax benefits from U.S. research and development (R&D) tax credits were
$138 million
in 2018,
$115 million
in 2017, and
$107 million
in 2016.
We recognized a new tax benefit of
$61 million
in 2018 from the deduction for foreign derived intangible income enacted by the Tax Act. The Tax Act repealed the U.S. manufacturing deduction for years after 2017. Therefore, there was no U.S. manufacturing benefit in 2018. Tax benefits from the U.S. manufacturing deduction were
$7 million
in
2017
and
$117 million
in
2016
.
We receive a tax deduction for dividends paid on shares of our common stock held by certain of our defined contribution plans with an employee stock ownership plan feature. The benefit of the tax deduction has declined, principally due to the lower tax rate in 2018.
In 2016, we adopted the accounting standard update for employee share-based payment awards on a prospective basis. Accordingly, we recognized additional income tax benefits of
$55 million
in
2018
,
$106 million
in
2017
, and
$152 million
in
2016
.
We also recognized a tax benefit of
$61 million
in 2018 from our change in a tax accounting method reflecting a 2012 Court of Federal Claims decision, which held that the tax basis in certain assets should be increased and realized upon the assets’ disposition. The 2016 income tax rate also benefited from the nontaxable gain recorded in connection with the consolidation of AWE.
We participate in the IRS Compliance Assurance Process program. Examinations of the years
2017
and
2018
remain under IRS review.
87
The primary components of our federal and foreign deferred income tax assets and liabilities at December 31 were as follows (in millions):
|
2018
|
|
2017
(a)
|
|
|||||
|
Deferred tax assets related to:
|
||||||||
|
Accrued compensation and benefits
|
$
|
584
|
|
$
|
595
|
|
||
|
Pensions
(b)
|
2,623
|
|
2,495
|
|
||||
|
Other postretirement benefit obligations
|
148
|
|
153
|
|
||||
|
Contract accounting methods
|
539
|
|
531
|
|
||||
|
Foreign company operating losses and credits
|
38
|
|
27
|
|
||||
|
Other
|
160
|
|
154
|
|
||||
|
Valuation allowance
(c)
|
(20
|
)
|
(20
|
)
|
||||
|
Deferred tax assets, net
|
4,072
|
|
3,935
|
|
||||
|
Deferred tax liabilities related to:
|
||||||||
|
Goodwill and purchased intangibles
|
296
|
|
266
|
|
||||
|
Property, plant and equipment
|
296
|
|
239
|
|
||||
|
Exchanged debt securities and other
|
294
|
|
303
|
|
||||
|
Deferred tax liabilities
|
886
|
|
808
|
|
||||
|
Net deferred tax assets
|
$
|
3,186
|
|
$
|
3,127
|
|
||
|
(a)
|
Components of our federal and foreign deferred income tax assets and liabilities at December 31, 2017 after taking into account the estimated impacts of the Tax Act and related items.
|
|
(b)
|
The increase in 2018 is primarily due to lower tax deductions for pension contributions resulting from our 2017 decision to accelerate pension contributions to our pension fund in order to receive a deduction in 2017.
|
|
(c)
|
A valuation allowance was provided against certain foreign company deferred tax assets arising from carryforwards of unused tax benefits.
|
As of December 31,
2018
,
2017
, and
2016
, our liabilities associated with unrecognized tax benefits were
not
material.
We and our subsidiaries file income tax returns in the U.S. federal jurisdiction and various foreign jurisdictions. With few exceptions, the statute of limitations is no longer open for U.S. federal or non-U.S. income tax examinations for the years before
2015
, other than with respect to refunds.
We received net federal and foreign income tax refunds of
$41 million
in
2018
, primarily due to a 2017 net operating loss carryback arising from our accelerated pension contributions. Our federal and foreign income tax payments, net of refunds received, were
$1.1 billion
in
2017
and
$1.3 billion
in
2016
.
88
Note 10 –
Debt
Our total debt consisted of the following (in millions):
|
2018
|
|
2017
|
|
|||||
|
Notes
|
||||||||
|
1.85% due 2018
|
$
|
—
|
|
$
|
750
|
|
||
|
4.25% due 2019
|
900
|
|
900
|
|
||||
|
2.50% due 2020
|
1,250
|
|
1,250
|
|
||||
|
3.35% due 2021
|
900
|
|
900
|
|
||||
|
3.10% due 2023
|
500
|
|
500
|
|
||||
|
2.90% due 2025
|
750
|
|
750
|
|
||||
|
3.55% due 2026
|
2,000
|
|
2,000
|
|
||||
|
3.60% due 2035
|
500
|
|
500
|
|
||||
|
4.50% and 6.15% due 2036
|
1,054
|
|
1,054
|
|
||||
|
4.07% due 2042
|
1,336
|
|
1,336
|
|
||||
|
3.80% due 2045
|
1,000
|
|
1,000
|
|
||||
|
4.70% due 2046
|
1,326
|
|
1,326
|
|
||||
|
4.09% due 2052
|
1,578
|
|
1,578
|
|
||||
|
Other notes with rates from 4.85% to 8.50%, due 2023 to 2041
|
1,618
|
|
1,654
|
|
||||
|
Commercial paper
|
600
|
|
—
|
|
||||
|
Total debt
|
15,312
|
|
15,498
|
|
||||
|
Less: unamortized discounts and issuance costs
|
(1,208
|
)
|
(1,235
|
)
|
||||
|
Total debt, net
|
14,104
|
|
14,263
|
|
||||
|
Less: current portion
|
(1,500
|
)
|
(750
|
)
|
||||
|
Long-term debt, net
|
$
|
12,604
|
|
$
|
13,513
|
|
||
Revolving Credit Facilities
On August 24, 2018, we entered into a new
$2.5 billion
revolving credit facility (the 5-year Facility) with various banks and concurrently terminated our existing
$2.5 billion
revolving credit facility.
The 5‑year Facility has an expiration date of August 24, 2023 and is available for general corporate purposes. The undrawn portion of the 5-year Facility is also available to serve as a backup facility for the issuance of commercial paper. We may request and the banks may grant, at their discretion, an increase in the borrowing capacity under the 5-year Facility of up to an additional
$500 million
.
There were
no
borrowings outstanding under the 5-year Facility as of
December 31, 2018
and
2017
.
Borrowings under the 5-year Facility are unsecured and bear interest at rates based, at our option, on a Eurodollar Rate or a Base Rate, as defined in the 5-year Facility’s agreement. Each bank’s obligation to make loans under the 5-year Facility is subject to, among other things, our compliance with various representations, warranties, and covenants, including covenants limiting our ability and certain of our subsidiaries’ ability to encumber assets and a covenant not to exceed a maximum leverage ratio, as defined in the 5‑year Facility agreement.
As of
December 31, 2018
and
2017
, we were in compliance with all covenants contained in the
5
-year Facility agreement, as well as in our debt agreements.
Long-Term Debt
In November 2018, we repaid
$750 million
of long-term notes with a fixed interest rate of
1.85%
according to their scheduled maturities.
In September 2017, we issued notes totaling approximately
$1.6 billion
with a fixed interest rate of
4.09%
maturing in September 2052 (the New Notes) in exchange for outstanding notes totaling approximately
$1.4 billion
with fixed interest rates ranging from
4.70%
to
8.50%
maturing
2029
to
2046
(the Old Notes). In connection with the exchange of principal, we paid a premium of
$237 million
, substantially all of which was in the form of New Notes. This premium will be amortized as additional interest expense over the term of the New Notes using the effective interest method. We may, at our option, redeem some or all of the New Notes at any time by paying the principal amount of notes being redeemed plus a make-whole premium and accrued and unpaid interest. Interest on the New Notes is payable on March 15 and September 15 of each year and began on March 15,
89
2018. The New Notes are unsecured senior obligations and rank equally in right of payment with all of our existing and future unsecured and unsubordinated indebtedness.
We made interest payments of approximately
$635 million
,
$610 million
and
$600 million
during the years ended
December 31, 2018
,
2017
and
2016
, respectively.
In September 2016, we repaid
$500 million
of long-term notes with a fixed interest rate of
2.13%
according to their scheduled maturities. In May 2016, we repaid
$452 million
of long-term notes with a fixed interest rate of
7.65%
according to their scheduled maturities.
We also had related variable interest rate swaps with a notional amount of
$450 million
mature, which did not have a significant impact on net earnings or comprehensive income.
Short-Term Debt and Commercial Paper
As of
December 31, 2018
, we had
$1.5 billion
of short-term borrowings due within one year, of which approximately
$900 million
was composed of scheduled debt maturity due in November 2019 and approximately
$600 million
was composed of commercial paper borrowings with a weighted-average rate of
2.89%
. During
2017
, we borrowed and fully repaid amounts under our commercial paper programs. There were no commercial paper borrowings outstanding as of
December 31, 2017
.
We expect to continue to issue commercial paper backed by our
$2.5 billion
5‑year Facility to manage the timing of cash flows.
Note 11 –
Postretirement Benefit Plans
Defined Benefit Pension Plans and Retiree Medical and Life Insurance Plans
Many of our employees are covered by qualified defined benefit pension plans and we provide certain health care and life insurance benefits to eligible retirees (collectively, postretirement benefit plans). We also sponsor nonqualified defined benefit pension plans to provide for benefits in excess of qualified plan limits. Non-union employees hired after December 2005 do not participate in our qualified defined benefit pension plans, but are eligible to participate in a qualified defined contribution plan in addition to our other retirement savings plans. They also have the ability to participate in our retiree medical plans, but we do not subsidize the cost of their participation in those plans as we do with employees hired before January 1, 2006. Over the last few years, we have negotiated similar changes with various labor organizations such that new union represented employees do not participate in our defined benefit pension plans.
In June 2014, we amended certain of our qualified and nonqualified defined benefit pension plans for non-union employees, comprising the majority of our benefit obligations, to freeze future retirement benefits. The calculation of retirement benefits under the affected defined benefit pension plans is determined by a formula that takes into account the participants’ years of credited service and average compensation. The freeze takes effect in two stages. On January 1, 2016, the pay-based component of the formula used to determine retirement benefits was frozen so that future pay increases, annual incentive bonuses or other amounts earned for or related to periods after December 31, 2015 are not used to calculate retirement benefits. On January 1, 2020, the service-based component of the formula used to determine retirement benefits will also be frozen so that participants will no longer earn further credited service for any period after December 31, 2019. When the freeze is complete, the majority of our salaried employees will have transitioned to an enhanced defined contribution retirement savings plan.
We have made contributions to trusts established to pay future benefits to eligible retirees and dependents, including Voluntary Employees’ Beneficiary Association trusts and 401(h) accounts, the assets of which will be used to pay expenses of certain retiree medical plans. We use December 31 as the measurement date. Benefit obligations as of the end of each year reflect assumptions in effect as of those dates. Net periodic benefit cost is based on assumptions in effect at the end of the respective preceding year.
The rules related to accounting for postretirement benefit plans under GAAP require us to recognize on a plan-by-plan basis the funded status of our postretirement benefit plans as either an asset or a liability on our consolidated balance sheets. The funded status is measured as the difference between the fair value of the plan’s assets and the benefit obligation of the plan.
90
The net periodic benefit cost recognized each year included the following (in millions):
|
|
Qualified Defined
Benefit Pension Plans
(a)
|
Retiree Medical and
Life Insurance Plans
|
|||||||||||||||||||||||
|
2018
|
|
2017
|
|
2016
|
|
2018
|
|
2017
|
|
2016
|
|
||||||||||||||
|
Service cost
|
$
|
630
|
|
$
|
635
|
|
$
|
671
|
|
$
|
19
|
|
$
|
19
|
|
$
|
23
|
|
|||||||
|
Interest cost
|
1,740
|
|
1,835
|
|
1,890
|
|
91
|
|
103
|
|
120
|
|
|||||||||||||
|
Expected return on plan assets
|
(2,395
|
)
|
(2,249
|
)
|
(2,539
|
)
|
(135
|
)
|
(128
|
)
|
(138
|
)
|
|||||||||||||
|
Recognized net actuarial losses
|
1,777
|
|
1,506
|
|
1,359
|
|
5
|
|
19
|
|
34
|
|
|||||||||||||
|
Amortization of net prior service (credit) cost
(b)
|
(321
|
)
|
(355
|
)
|
(362
|
)
|
15
|
|
15
|
|
22
|
|
|||||||||||||
|
Total net periodic benefit cost
|
$
|
1,431
|
|
$
|
1,372
|
|
$
|
1,019
|
|
$
|
(5
|
)
|
$
|
28
|
|
$
|
61
|
|
|||||||
|
(a)
|
Total net periodic benefit cost associated with our qualified defined benefit plans represents pension expense calculated in accordance with GAAP (FAS pension expense). We are required to calculate pension expense in accordance with both GAAP and CAS rules, each of which results in a different calculated amount of pension expense. The CAS pension cost is recovered through the pricing of our products and services on U.S. Government contracts and, therefore, is recognized in net sales and cost of sales for products and services. We include the difference between FAS pension service cost and CAS pension cost, referred to as the FAS/CAS operating adjustment, as a component of other unallocated, net on our consolidated statements of earnings (see
Note 5 – Information on Business Segments
).
|
|
(b)
|
Net of the reclassification for discontinued operations presentation of pension benefits related to former IS&GS salaried employees (
$14 million
in
2016
).
|
The following table provides a reconciliation of benefit obligations, plan assets and unfunded status related to our qualified defined benefit pension plans and our retiree medical and life insurance plans (in millions):
|
|
Qualified Defined
Benefit Pension Plans
|
Retiree Medical and
Life Insurance Plans
|
|||||||||||||||
|
2018
|
|
2017
|
|
2018
|
|
2017
|
|
||||||||||
|
Change in benefit obligation
|
|||||||||||||||||
|
Beginning balance
|
$
|
48,686
|
|
$
|
45,064
|
|
$
|
2,602
|
|
$
|
2,649
|
|
|||||
|
Service cost
|
630
|
|
635
|
|
19
|
|
19
|
|
|||||||||
|
Interest cost
|
1,740
|
|
1,835
|
|
91
|
|
103
|
|
|||||||||
|
Benefits paid
|
(2,379
|
)
|
(2,310
|
)
|
(224
|
)
|
(232
|
)
|
|||||||||
|
Settlements
|
(1,821
|
)
|
—
|
|
—
|
|
—
|
|
|||||||||
|
Actuarial losses (gains)
|
(3,281
|
)
|
3,536
|
|
(311
|
)
|
23
|
|
|||||||||
|
Changes in longevity assumptions
(a)
|
(162
|
)
|
(352
|
)
|
(8
|
)
|
(24
|
)
|
|||||||||
|
Plan amendments and curtailments
(b)
|
(108
|
)
|
278
|
|
101
|
|
—
|
|
|||||||||
|
Medicare Part D subsidy
|
—
|
|
—
|
|
9
|
|
—
|
|
|||||||||
|
Participants’ contributions
|
—
|
|
—
|
|
69
|
|
64
|
|
|||||||||
|
Ending balance
|
$
|
43,305
|
|
$
|
48,686
|
|
$
|
2,348
|
|
$
|
2,602
|
|
|||||
|
Change in plan assets
|
|||||||||||||||||
|
Beginning balance at fair value
|
$
|
33,095
|
|
$
|
31,417
|
|
$
|
1,883
|
|
$
|
1,787
|
|
|||||
|
Actual return on plan assets
|
(1,893
|
)
|
3,942
|
|
(94
|
)
|
224
|
|
|||||||||
|
Benefits paid
|
(2,379
|
)
|
(2,310
|
)
|
(224
|
)
|
(232
|
)
|
|||||||||
|
Settlements
|
(1,821
|
)
|
—
|
|
—
|
|
—
|
|
|||||||||
|
Company contributions
|
5,000
|
|
46
|
|
1
|
|
40
|
|
|||||||||
|
Medicare Part D subsidy
|
—
|
|
—
|
|
9
|
|
—
|
|
|||||||||
|
Participants’ contributions
|
—
|
|
—
|
|
69
|
|
64
|
|
|||||||||
|
Ending balance at fair value
|
$
|
32,002
|
|
$
|
33,095
|
|
$
|
1,644
|
|
$
|
1,883
|
|
|||||
|
Unfunded status of the plans
|
$
|
(11,303
|
)
|
$
|
(15,591
|
)
|
$
|
(704
|
)
|
$
|
(719
|
)
|
|||||
|
(a)
|
As published by the Society of Actuaries
|
|
(b)
|
The 2018 qualified defined benefit pension plan includes a
$119 million
curtailment gain.
|
91
In
December 2018, an upfront cash payment of
$810 million
was made to an insurance company in exchange for a contract (referred to as a buy-in contract) that will reimburse the plan for all future benefit payments related to
$770 million
of the plan’s outstanding defined benefit pension obligations for approximately
9,000
U.S. retirees and beneficiaries. On December 31, 2018, the approximately 9,000 retirees and beneficiaries and the buy-in contract were spun-off to another plan, with the buy-in contract the sole asset of that plan. Under the arrangement, the plan remains responsible for paying the benefits for the covered retirees and beneficiaries and the insurance company will reimburse the plan as those benefits are paid. As a result, there is no net ongoing cash flow to the plan for the covered retirees and beneficiaries as the cost of providing the benefits is funded by the buy-in contract, effectively locking in the cost of the benefits and eliminating future volatility of the benefit obligation. The buy-in contract was purchased using assets from the pension trust and is accounted for at fair value as an investment of the trust. This transaction had no impact on our 2018 FAS pension expense or CAS pension cost. The difference of approximately
$40 million
between the amount paid to the insurance company and the amount of the pension obligations funded by the buy-in contract was recognized through the re-measurement of the related benefit obligations in other comprehensive loss in equity and will be amortized to FAS pension expense in future periods. We intend to begin the termination process for this plan during 2019, and at conclusion convert the buy-in contract to a buy-out contract, thus relieving us of liability for the pension obligations related to the covered population. The buy-out conversion, expected to occur as early as 2020, will require recognition of a settlement loss in earnings at that time, which we currently estimate will be approximately
$350 million
. A subsequent cash recovery is anticipated from the U.S. Government.
Also, during December 2018, we purchased an irrevocable group annuity contract from an insurance company (referred to as a buy-out contract) for
$1.82 billion
to settle
$1.76 billion
of our outstanding defined benefit pension obligations related to certain U.S. retirees and beneficiaries. The group annuity contract was purchased using assets from the pension trust. As a result of this transaction, we were relieved of all responsibility for these pension obligations and the insurance company is now required to pay and administer the retirement benefits owed to approximately
32,000
U.S. retirees and beneficiaries, with no change to the amount, timing or form of monthly retirement benefit payments. Although the transaction was treated as a settlement for accounting purposes, we did not recognize a loss on the settlement in earnings associated with the transaction because total settlements during 2018 for this plan were less than this plan’s service and interest cost in 2018. Accordingly, the transaction had no impact on our 2018 FAS pension expense or CAS pension cost, and the difference of approximately
$60 million
between the amount paid to the insurance company and the amount of the pension obligations settled was recognized in other comprehensive loss and will be amortized to FAS pension expense in future periods.
The following table provides amounts recognized on our consolidated balance sheets related to our qualified defined benefit pension plans and our retiree medical and life insurance plans (in millions):
|
|
Qualified Defined
Benefit Pension Plans |
Retiree Medical and
Life Insurance Plans
|
|||||||||||||||
|
2018
|
|
2017
|
|
2018
|
|
2017
|
|
||||||||||
|
Prepaid pension asset
|
$
|
107
|
|
$
|
112
|
|
$
|
—
|
|
$
|
—
|
|
|||||
|
Accrued postretirement benefit liabilities
|
(11,410
|
)
|
(15,703
|
)
|
(704
|
)
|
(719
|
)
|
|||||||||
|
Accumulated other comprehensive loss (pre-tax) related to:
|
|||||||||||||||||
|
Net actuarial losses
|
19,117
|
|
20,169
|
|
236
|
|
331
|
|
|||||||||
|
Prior service (credit) cost
|
(1,931
|
)
|
(2,263
|
)
|
167
|
|
81
|
|
|||||||||
|
Total
(a)
|
$
|
17,186
|
|
$
|
17,906
|
|
$
|
403
|
|
$
|
412
|
|
|||||
|
(a)
|
Accumulated other comprehensive loss related to postretirement benefit plans, after tax, of
$14.3 billion
and
$12.6 billion
at
December 31, 2018
and
2017
(see “
Note 12 – Stockholders’ Equity
”) includes
$17.2 billion
(
$13.5 billion
, net of tax) and
$17.9 billion
(
$11.8 billion
, net of tax) for qualified defined benefit pension plans,
$403 million
(
$316 million
, net of tax) and
$412 million
(
$252 million
, net of tax) for retiree medical and life insurance plans and
$542 million
(
$428 million
, net of tax) and
$705 million
(
$479 million
, net of tax) for other plans.
|
The accumulated benefit obligation (ABO) for all qualified defined benefit pension plans was
$43.3 billion
and
$48.5 billion
at
December 31, 2018
and
2017
, of which
$43.3 billion
and
$48.5 billion
related to plans where the ABO was in excess of plan assets. The ABO represents benefits accrued without assuming future compensation increases to plan participants.
92
Certain key information related to our qualified defined benefit pension plans as of
December 31, 2018
and
2017
is as follows (in millions):
|
2018
(a)
|
|
2017
|
|
|||||
|
Plans where ABO was in excess of plan assets
|
||||||||
|
Projected benefit obligation
|
$
|
42,444
|
|
$
|
48,628
|
|
||
|
Less: fair value of plan assets
|
31,034
|
|
32,925
|
|
||||
|
Unfunded status of plans
(b)
|
(11,410
|
)
|
(15,703
|
)
|
||||
|
Plans where ABO was less than plan assets
|
||||||||
|
Projected benefit obligation
|
51
|
|
58
|
|
||||
|
Less: fair value of plan assets
|
158
|
|
170
|
|
||||
|
Funded status of plans
(c)
|
$
|
107
|
|
$
|
112
|
|
||
|
(a)
|
Benefit obligation and plan assets in the table above exclude
$810 million
for one pension plan with plan assets valued equal to the benefit obligation.
|
|
(b)
|
Represents accrued pension liabilities, which are included on our consolidated balance sheets.
|
|
(c)
|
Represents prepaid pension assets, which are included on our consolidated balance sheets in other noncurrent assets.
|
We also sponsor nonqualified defined benefit plans to provide benefits in excess of qualified plan limits. The aggregate liabilities for these plans at
December 31, 2018
and
2017
were
$1.2 billion
and
$1.3 billion
, which also represent the plans’ unfunded status. We have set aside certain assets totaling
$425 million
and
$530 million
as of
December 31, 2018
and
2017
in a separate trust which we expect to be used to pay obligations under our nonqualified defined benefit plans. In accordance with GAAP, those assets may not be used to offset the amount of the benefit obligation similar to the postretirement benefit plans in the table above. The unrecognized net actuarial losses at
December 31, 2018
and
2017
were
$505 million
and
$646 million
. The unrecognized prior service credit at
December 31, 2018
and
2017
were
$48 million
and
$61 million
. The expense associated with these plans totaled
$123 million
in
2018
,
$126 million
in
2017
and
$125 million
in
2016
. We also sponsor a small number of other postemployment plans and foreign benefit plans. The aggregate liability for the other postemployment plans was
$46 million
and
$60 million
as of
December 31, 2018
and
2017
. The expense for the other postemployment plans, as well as the liability and expense associated with the foreign benefit plans, was not material to our results of operations, financial position or cash flows. The actuarial assumptions used to determine the benefit obligations and expense associated with our nonqualified defined benefit plans and postemployment plans are similar to those assumptions used to determine the benefit obligations and expense related to our qualified defined benefit pension plans and retiree medical and life insurance plans as described below.
The following table provides the amounts recognized in other comprehensive income (loss) related to postretirement benefit plans, net of tax, for the years ended
December 31, 2018
,
2017
and
2016
(in millions):
|
|
Incurred but Not Yet
Recognized in Net
Periodic Benefit Cost
|
Recognition of
Previously
Deferred Amounts
|
|||||||||||||||||||||||
|
2018
|
|
2017
|
|
2016
|
|
2018
|
|
2017
|
|
2016
|
|
||||||||||||||
|
|
Gains (losses)
|
(Gains) losses
|
|||||||||||||||||||||||
|
Actuarial gains and losses
|
|||||||||||||||||||||||||
|
Qualified defined benefit pension plans
|
$
|
(570
|
)
|
$
|
(1,172
|
)
|
$
|
(1,236
|
)
|
$
|
1,396
|
|
$
|
974
|
|
$
|
879
|
|
|||||||
|
Retiree medical and life insurance plans
|
71
|
|
77
|
|
94
|
|
4
|
|
12
|
|
22
|
|
|||||||||||||
|
Other plans
|
83
|
|
(66
|
)
|
(62
|
)
|
55
|
|
44
|
|
37
|
|
|||||||||||||
|
|
(416
|
)
|
(1,161
|
)
|
(1,204
|
)
|
1,455
|
|
1,030
|
|
938
|
|
|||||||||||||
|
|
Credit (cost)
|
(Credit) cost
(a)
|
|||||||||||||||||||||||
|
Net prior service credit and cost
|
|||||||||||||||||||||||||
|
Qualified defined benefit pension plans
|
(6
|
)
|
(219
|
)
|
(54
|
)
|
(255
|
)
|
(229
|
)
|
(235
|
)
|
|||||||||||||
|
Retiree medical and life insurance plans
|
(79
|
)
|
—
|
|
27
|
|
12
|
|
10
|
|
14
|
|
|||||||||||||
|
Other plans
|
—
|
|
—
|
|
(1
|
)
|
(10
|
)
|
(9
|
)
|
(9
|
)
|
|||||||||||||
|
|
(85
|
)
|
(219
|
)
|
(28
|
)
|
(253
|
)
|
(228
|
)
|
(230
|
)
|
|||||||||||||
|
|
$
|
(501
|
)
|
$
|
(1,380
|
)
|
$
|
(1,232
|
)
|
$
|
1,202
|
|
$
|
802
|
|
$
|
708
|
|
|||||||
|
(a)
|
Reflects the reclassification for discontinued operations presentation of benefits related to former IS&GS salaried employees (
$9 million
in
2016
). In addition, we recognized
$134 million
in 2016 of prior service credits from the divestiture of our IS&GS business, which were reclassified as discontinued operations.
|
93
We expect that approximately
$1.2 billion
, or about
$908 million
net of tax, of actuarial losses and net prior service credit related to postretirement benefit plans included in accumulated other comprehensive loss at the end of
2018
to be recognized in net periodic benefit cost during
2019
. Of this amount,
$1.1 billion
, or
$841 million
net of tax, relates to our qualified defined benefit plans and is included in our expected
2019
pension expense of
$1.1 billion
.
Actuarial Assumptions
The actuarial assumptions used to determine the benefit obligations at December 31 of each year and to determine the net periodic benefit cost for each subsequent year, were as follows:
|
|
Qualified Defined Benefit
Pension Plans
|
Retiree Medical and
Life Insurance Plans
|
|||||||||||||||||
|
2018
|
|
2017
|
|
2016
|
|
2018
|
|
2017
|
|
2016
|
|
||||||||
|
Weighted average discount rate
|
4.250
|
%
|
3.625
|
%
|
4.125
|
%
|
4.250
|
%
|
3.625
|
%
|
4.000
|
%
|
|||||||
|
Expected long-term rate of return on assets
|
7.00
|
%
|
7.50
|
%
|
7.50
|
%
|
7.00
|
%
|
7.50
|
%
|
7.50
|
%
|
|||||||
|
Rate of increase in future compensation levels (for applicable bargained pension plans)
|
4.50
|
%
|
4.50
|
%
|
4.50
|
%
|
|||||||||||||
|
Health care trend rate assumed for next year
|
8.25
|
%
|
8.50
|
%
|
8.75
|
%
|
|||||||||||||
|
Ultimate health care trend rate
|
5.00
|
%
|
5.00
|
%
|
5.00
|
%
|
|||||||||||||
|
Year that the ultimate health care trend rate is reached
|
|
|
|
2032
|
|
2032
|
|
2032
|
|
||||||||||
The increase in the discount rate from
December 31, 2017
to
December 31, 2018
resulted in a decrease in the projected benefit obligations of our qualified defined benefit pension plans of approximately
$3.5 billion
at
December 31, 2018
. The decrease in the discount rate from
December 31, 2016
to
December 31, 2017
resulted in an increase in the projected benefit obligations of our qualified defined benefit pension plans of approximately
$2.9 billion
at
December 31, 2017
.
The long-term rate of return assumption represents the expected long-term rate of earnings on the funds invested, or to be invested, to provide for the benefits included in the benefit obligations. That assumption is based on several factors including historical market index returns, the anticipated long-term allocation of plan assets, the historical return data for the trust funds, plan expenses and the potential to outperform market index returns.
Plan Assets
Investment policies and strategies
– Lockheed Martin Investment Management Company (LMIMCo), our wholly-owned subsidiary, has the fiduciary responsibility for making investment decisions related to the assets of our postretirement benefit plans. LMIMCo’s investment objectives for the assets of these plans are (1) to minimize the net present value of expected funding contributions; (2) to ensure there is a high probability that each plan meets or exceeds our actuarial long-term rate of return assumptions; and (3) to diversify assets to minimize the risk of large losses. The nature and duration of benefit obligations, along with assumptions concerning asset class returns and return correlations, are considered when determining an appropriate asset allocation to achieve the investment objectives. Investment policies and strategies governing the assets of the plans are designed to achieve investment objectives within prudent risk parameters. Risk management practices include the use of external investment managers; the maintenance of a portfolio diversified by asset class, investment approach and security holdings; and the maintenance of sufficient liquidity to meet benefit obligations as they come due.
LMIMCo’s investment policies require that asset allocations of postretirement benefit plans be maintained within the following approximate ranges:
|
Asset Class
|
Asset Allocation
Ranges
|
|
Cash and cash equivalents
|
0-20%
|
|
Equity
|
15-65%
|
|
Fixed income
|
10-60%
|
|
Alternative investments:
|
|
|
Private equity funds
|
0-15%
|
|
Real estate funds
|
0-10%
|
|
Hedge funds
|
0-20%
|
|
Commodities
|
0-15%
|
94
Fair value measurements
– The rules related to accounting for postretirement benefit plans under GAAP require certain fair value disclosures related to postretirement benefit plan assets, even though those assets are not separately presented on our consolidated balance sheets. The following table presents the fair value of the assets (in millions) of our qualified defined benefit pension plans and retiree medical and life insurance plans by asset category and their level within the fair value hierarchy, which has three levels based on the uncertainty of the inputs used to determine fair value. Level 1 refers to fair values determined based on quoted prices in active markets for identical assets, Level 2 refers to fair values estimated using significant other observable inputs and Level 3 includes fair values estimated using significant unobservable inputs. Certain other investments are measured at their Net Asset Value (NAV) per share and do not have readily determined values and are thus not subject to leveling in the fair value hierarchy. The NAV is the total value of the fund divided by the number of the fund’s shares outstanding. We recognize transfers between levels of the fair value hierarchy as of the date of the change in circumstances that causes the transfer.
|
|
December 31, 2018
|
December 31, 2017
|
||||||||||||||||||||||||||||||
|
Total
|
|
Level 1
|
|
Level 2
|
|
Level 3
|
|
Total
|
|
Level 1
|
|
Level 2
|
|
Level 3
|
|
|||||||||||||||||
|
Investments measured at fair value
|
||||||||||||||||||||||||||||||||
|
Cash and cash equivalents
(a)
|
$
|
1,727
|
|
$
|
1,727
|
|
$
|
—
|
|
$
|
—
|
|
$
|
1,419
|
|
$
|
1,419
|
|
$
|
—
|
|
$
|
—
|
|
||||||||
|
Equity
(a)
:
|
|
|||||||||||||||||||||||||||||||
|
U.S. equity securities
|
3,936
|
|
3,927
|
|
3
|
|
6
|
|
4,922
|
|
4,905
|
|
14
|
|
3
|
|
||||||||||||||||
|
International equity securities
|
5,406
|
|
5,400
|
|
—
|
|
6
|
|
5,370
|
|
5,355
|
|
13
|
|
2
|
|
||||||||||||||||
|
Commingled equity funds
|
3,587
|
|
1,436
|
|
2,151
|
|
—
|
|
4,453
|
|
1,493
|
|
2,960
|
|
—
|
|
||||||||||||||||
|
Fixed income
(a)
:
|
|
|||||||||||||||||||||||||||||||
|
Corporate debt securities
|
4,890
|
|
—
|
|
4,888
|
|
2
|
|
4,910
|
|
—
|
|
4,905
|
|
5
|
|
||||||||||||||||
|
U.S. Government securities
|
3,399
|
|
—
|
|
3,399
|
|
—
|
|
3,775
|
|
—
|
|
3,775
|
|
—
|
|
||||||||||||||||
|
U.S. Government-sponsored enterprise securities
|
571
|
|
—
|
|
571
|
|
—
|
|
817
|
|
—
|
|
817
|
|
—
|
|
||||||||||||||||
|
Other fixed income investments
(b)
|
2,926
|
|
—
|
|
1,988
|
|
938
|
|
2,414
|
|
—
|
|
2,403
|
|
11
|
|
||||||||||||||||
|
Total
|
$
|
26,442
|
|
$
|
12,490
|
|
$
|
13,000
|
|
$
|
952
|
|
$
|
28,080
|
|
$
|
13,172
|
|
$
|
14,887
|
|
$
|
21
|
|
||||||||
|
Investments measured at NAV
(c)
|
||||||||||||||||||||||||||||||||
|
Commingled equity funds
|
144
|
|
99
|
|
||||||||||||||||||||||||||||
|
Other fixed income investments
|
29
|
|
68
|
|
||||||||||||||||||||||||||||
|
Private equity funds
|
4,014
|
|
4,334
|
|
||||||||||||||||||||||||||||
|
Real estate funds
|
2,117
|
|
1,611
|
|
||||||||||||||||||||||||||||
|
Hedge funds
|
828
|
|
|
|
|
718
|
|
|
|
|
||||||||||||||||||||||
|
Total investments measured at NAV
|
7,132
|
|
|
|
|
6,830
|
|
|
|
|
||||||||||||||||||||||
|
Receivables, net
|
72
|
|
|
|
|
68
|
|
|
|
|
||||||||||||||||||||||
|
Total
|
$
|
33,646
|
|
|
|
|
$
|
34,978
|
|
|
|
|
||||||||||||||||||||
|
(a)
|
Cash and cash equivalents, equity securities and fixed income securities included derivative assets and liabilities whose fair values were not material as of
December 31, 2018
and
2017
. LMIMCo’s investment policies restrict the use of derivatives to either establish long or short exposures for purposes consistent with applicable investment mandate guidelines or to hedge risks to the extent of a plan’s current exposure to such risks. Most derivative transactions are settled on a daily basis.
|
|
(b)
|
Level 3 investments include
$810 million
related to the buy-in contract discussed above.
|
|
(c)
|
Certain investments that are valued using the NAV per share (or its equivalent) as a practical expedient have not been classified in the fair value hierarchy and are included in the table to permit reconciliation of the fair value hierarchy to the aggregate postretirement benefit plan assets.
|
As of
December 31, 2018
and
2017
, the assets associated with our foreign defined benefit pension plans were not material and have not been included in the table above. Excluding the December 2018 purchase of the buy-in contract discussed above, changes in the fair value of plan assets categorized as Level 3 during
2018
and
2017
were insignificant.
95
Valuation techniques
– Cash equivalents are mostly comprised of short-term money-market instruments and are valued at cost, which approximates fair value.
U.S. equity securities and international equity securities categorized as Level 1 are traded on active national and international exchanges and are valued at their closing prices on the last trading day of the year. For U.S. equity securities and international equity securities not traded on an active exchange, or if the closing price is not available, the trustee obtains indicative quotes from a pricing vendor, broker or investment manager. These securities are categorized as Level 2 if the custodian obtains corroborated quotes from a pricing vendor or categorized as Level 3 if the custodian obtains uncorroborated quotes from a broker or investment manager.
Commingled equity funds categorized as Level 1 are traded on active national and international exchanges and are valued at their closing prices on the last trading day of the year. For commingled equity funds not traded on an active exchange, or if the closing price is not available, the trustee obtains indicative quotes from a pricing vendor, broker or investment manager. These securities are categorized as Level 2 if the custodian obtains corroborated quotes from a pricing vendor.
Fixed income investments categorized as Level 2 are valued by the trustee using pricing models that use verifiable observable market data (e.g., interest rates and yield curves observable at commonly quoted intervals and credit spreads), bids provided by brokers or dealers or quoted prices of securities with similar characteristics. Fixed income investments are categorized as Level 3 when valuations using observable inputs are unavailable. The trustee typically obtains pricing based on indicative quotes or bid evaluations from vendors, brokers or the investment manager. In addition, certain other fixed income investments categorized as Level 3 are valued using a discounted cash flow approach. Significant inputs include projected annuity payments and the discount rate applied to those payments.
Certain commingled equity funds, consisting of equity mutual funds, are valued using the NAV. The NAV valuations are based on the underlying investments and typically redeemable within
90 days
.
Private equity funds consist of partnership and co-investment funds. The NAV is based on valuation models of the underlying securities, which includes unobservable inputs that cannot be corroborated using verifiable observable market data. These funds typically have redemption periods between
eight
and
12 years
.
Real estate funds consist of partnerships, most of which are closed-end funds, for which the NAV is based on valuation models and periodic appraisals. These funds typically have redemption periods between
eight
and
10 years
.
Hedge funds consist of direct hedge funds for which the NAV is generally based on the valuation of the underlying investments. Redemptions in hedge funds are based on the specific terms of each fund, and generally range from a minimum of
one month
to several months.
Contributions and Expected Benefit Payments
The funding of our qualified defined benefit pension plans is determined in accordance with ERISA, as amended by the PPA, and in a manner consistent with CAS and Internal Revenue Code rules.
We made contributions of
$5.0 billion
to our qualified defined benefit pension plans in
2018
, including required and discretionary contributions. As a result of these contributions, we do not expect to make contributions to our qualified defined benefit pension plans in 2019.
The following table presents estimated future benefit payments, which reflect expected future employee service, as of
December 31, 2018
(in millions):
|
2019
|
|
2020
|
|
2021
|
|
2022
|
|
2023
|
|
2024 – 2028
|
|
|||||||||||||
|
Qualified defined benefit pension plans
|
$
|
2,350
|
|
$
|
2,390
|
|
$
|
2,470
|
|
$
|
2,550
|
|
$
|
2,610
|
|
$
|
13,670
|
|
||||||
|
Retiree medical and life insurance plans
|
170
|
|
180
|
|
180
|
|
180
|
|
170
|
|
810
|
|
||||||||||||
Defined Contribution Plans
We maintain a number of defined contribution plans, most with 401(k) features, that cover substantially all of our employees. Under the provisions of our 401(k) plans, we match most employees’ eligible contributions at rates specified in the plan documents. Our contributions were
$658 million
in
2018
,
$613 million
in
2017
and
$617 million
in
2016
, the majority of which were funded using our common stock. Our defined contribution plans held approximately
33.3 million
and
35.5 million
shares of our common stock as of
December 31, 2018
and
2017
.
96
Note 12 –
Stockholders’ Equity
At
December 31, 2018
and
2017
, our authorized capital was composed of
1.5 billion
shares of common stock and
50 million
shares of series preferred stock. Of the
283 million
shares of common stock issued and outstanding as of
December 31, 2018
,
281 million
shares were considered outstanding for consolidated balance sheet presentation purposes; the remaining shares were held in a separate trust. Of the
285 million
shares of common stock issued and outstanding as of
December 31, 2017
,
284 million
shares were considered outstanding for consolidated balance sheet presentation purposes; the remaining shares were held in a separate trust.
No
shares of preferred stock were issued and outstanding at
December 31, 2018
or
2017
.
Repurchases of Common Stock
During
2018
, we repurchased
4.7 million
shares of our common stock for
$1.5 billion
. During
2017
and
2016
, we paid
$2.0 billion
and
$2.1 billion
to repurchase
7.1 million
and
8.9 million
shares of our common stock.
On
September 27, 2018
, our Board of Directors approved a
$1.0 billion
increase to our share repurchase program.
Inclusive of this increase, the total remaining authorization for future common share repurchases under our program was
$3.0 billion
as of
December 31, 2018
. As we repurchase our common shares, we reduce common stock for the
$1
of par value of the shares repurchased, with the excess purchase price over par value recorded as a reduction of additional paid-in capital. If additional paid-in capital is reduced to zero, we record the remainder of the excess purchase price over par value as a reduction of retained earnings. Due to the volume of repurchases made under our share repurchase program, additional paid-in capital was reduced to
zero
, with the remainder of the excess purchase price over par value of
$1.1 billion
,
$1.6 billion
and
$1.7 billion
recorded as a reduction of retained earnings in
2018
,
2017
and
2016
.
Dividends
We paid dividends totaling
$2.3 billion
(
$8.20
per share) in
2018
,
$2.2 billion
(
$7.46
per share) in
2017
and
$2.0 billion
(
$6.77
per share) in
2016
.
We paid quarterly dividends of
$2.00
per share during each of the first three quarters of
2018
and
$2.20
per share during the fourth quarter of
2018
;
$1.82
per share during each of the first three quarters of
2017
and
$2.00
per share during the fourth quarter of
2017
; and
$1.65
per share during each of the first three quarters of
2016
and
$1.82
per share during the fourth quarter of
2016
.
97
Accumulated Other Comprehensive Loss
Changes in the balance of AOCL, net of income taxes, consisted of the following (in millions):
|
Postretirement
Benefit Plans
(a)
|
Other, net
|
|
AOCL
|
|
||||||||
|
Balance at December 31, 2015
|
$
|
(11,314
|
)
|
$
|
(130
|
)
|
$
|
(11,444
|
)
|
|||
|
Other comprehensive loss before reclassifications
|
(1,232
|
)
|
—
|
|
(1,232
|
)
|
||||||
|
Amounts reclassified from AOCL
|
|
|||||||||||
|
Recognition of net actuarial losses
|
938
|
|
—
|
|
938
|
|
||||||
|
Amortization of net prior service credits
|
(239
|
)
|
—
|
|
(239
|
)
|
||||||
|
Recognition of net prior service credits from divestiture of IS&GS segment
(b)
|
(134
|
)
|
—
|
|
(134
|
)
|
||||||
|
Other
|
—
|
|
9
|
|
9
|
|
||||||
|
Total reclassified from AOCL
|
565
|
|
9
|
|
574
|
|
||||||
|
Total other comprehensive (loss) income
|
(667
|
)
|
9
|
|
(658
|
)
|
||||||
|
Balance at December 31, 2016
|
(11,981
|
)
|
(121
|
)
|
(12,102
|
)
|
||||||
|
Other comprehensive (loss) income before reclassifications
|
(1,380
|
)
|
120
|
|
(1,260
|
)
|
||||||
|
Amounts reclassified from AOCL
|
|
|||||||||||
|
Recognition of net actuarial losses
|
1,030
|
|
—
|
|
1,030
|
|
||||||
|
Amortization of net prior service credits
|
(228
|
)
|
—
|
|
(228
|
)
|
||||||
|
Other
|
—
|
|
21
|
|
21
|
|
||||||
|
Total reclassified from AOCL
|
802
|
|
21
|
|
823
|
|
||||||
|
Total other comprehensive (loss) income
|
(578
|
)
|
141
|
|
(437
|
)
|
||||||
|
Balance at December 31, 2017
|
(12,559
|
)
|
20
|
|
(12,539
|
)
|
||||||
|
Other comprehensive loss before reclassifications
|
(501
|
)
|
(105
|
)
|
(606
|
)
|
||||||
|
Amounts reclassified from AOCL
|
|
|||||||||||
|
Recognition of net actuarial losses
|
1,455
|
|
—
|
|
1,455
|
|
||||||
|
Amortization of net prior service credits
|
(253
|
)
|
—
|
|
(253
|
)
|
||||||
|
Other
|
—
|
|
30
|
|
30
|
|
||||||
|
Total reclassified from AOCL
|
1,202
|
|
30
|
|
1,232
|
|
||||||
|
Total other comprehensive income (loss)
|
701
|
|
(75
|
)
|
626
|
|
||||||
|
Reclassification of income tax effects from tax reform
(c)
|
(2,396
|
)
|
(12
|
)
|
(2,408
|
)
|
||||||
|
Balance at December 31, 2018
|
$
|
(14,254
|
)
|
$
|
(67
|
)
|
$
|
(14,321
|
)
|
|||
|
(a)
|
AOCL related to postretirement benefit plans is shown net of tax benefits of
$3.9 billion
at
December 31, 2018
and
$6.5 billion
at both
December 31, 2017
and
2016
. These tax benefits include amounts recognized on our income tax returns as current deductions and deferred income taxes, which will be recognized on our tax returns in future years. See “
Note 9 – Income Taxes
” and “
Note 11 – Postretirement Benefit Plans
” for more information on our income taxes and postretirement benefit plans.
|
|
(b)
|
Associated with the 2016 divestiture of the IS&GS business and included in net gain on divestiture of discontinued operations.
|
|
(c)
|
During 2018, we reclassified the impact of the income tax effects related to the Tax Cuts and Jobs Act of 2017 (the Tax Act) from AOCL to retained earnings by the same amount with zero impact to total equity. See “
Note 1 – Significant Accounting Policies
” for more information on the adoption of
Income Statement - Reporting Comprehensive Income
.
|
98
Note 13 –
Stock-Based Compensation
During
2018
,
2017
and
2016
, we recorded non-cash stock-based compensation expense totaling
$173 million
,
$158 million
and
$149 million
, which is included as a component of other unallocated, net on our consolidated statements of earnings. The net impact to earnings for the respective years was
$137 million
,
$103 million
and
$97 million
.
As of
December 31, 2018
, we had
$101 million
of unrecognized compensation cost related to nonvested awards, which is expected to be recognized over a weighted average period of
1.8 years
. We received cash from the exercise of stock options totaling
$43 million
,
$71 million
and
$106 million
during
2018
,
2017
and
2016
. In addition, our income tax liabilities for
2018
,
2017
and
2016
were reduced by
$75 million
,
$203 million
and
$219 million
due to recognized tax benefits on stock-based compensation arrangements.
Stock-Based Compensation Plans
Under plans approved by our stockholders, we are authorized to grant key employees stock-based incentive awards, including options to purchase common stock, stock appreciation rights, RSUs, PSUs or other stock units. The exercise price of options to purchase common stock may not be less than the fair market value of our stock on the date of grant. No award of stock options may become fully vested prior to the third anniversary of the grant and no portion of a stock option grant may become vested in less than one year. The minimum vesting period for restricted stock or stock units payable in stock is
three
years. Award agreements may provide for shorter or pro-rated vesting periods or vesting following termination of employment in the case of death, disability, divestiture, retirement, change of control or layoff. The maximum term of a stock option or any other award is
10 years
.
At
December 31, 2018
, inclusive of the shares reserved for outstanding stock options, RSUs and PSUs, we had approximately
nine million
shares reserved for issuance under the plans. At
December 31, 2018
, approximately
five million
of the shares reserved for issuance remained available for grant under our stock-based compensation plans. We issue new shares upon the exercise of stock options or when restrictions on RSUs and PSUs have been satisfied.
RSUs
The following table summarizes activity related to nonvested RSUs:
|
Number
of RSUs
(In thousands)
|
Weighted Average
Grant-Date Fair
Value Per Share
|
||||||||
|
Nonvested at December 31, 2015
|
1,236
|
|
$
|
134.87
|
|
||||
|
Granted
|
679
|
|
206.69
|
|
|||||
|
Vested
|
(1,009
|
)
|
137.62
|
|
|||||
|
Forfeited
|
(118
|
)
|
203.65
|
|
|||||
|
Nonvested at December 31, 2016
|
788
|
|
$
|
183.00
|
|
||||
|
Granted
|
519
|
|
254.58
|
|
|||||
|
Vested
|
(624
|
)
|
201.65
|
|
|||||
|
Forfeited
|
(32
|
)
|
223.23
|
|
|||||
|
Nonvested at December 31, 2017
|
651
|
|
$
|
220.21
|
|
||||
|
Granted
|
406
|
|
353.99
|
|
|||||
|
Vested
|
(470
|
)
|
271.50
|
|
|||||
|
Forfeited
|
(24
|
)
|
282.07
|
|
|||||
|
Nonvested at December 31, 2018
|
563
|
|
$
|
271.23
|
|
||||
In
2018
, we granted certain employees approximately
0.4 million
RSUs with a weighted average grant-date fair value of
$353.99
per RSU. The grant-date fair value of these RSUs is equal to the closing market price of our common stock on the grant date less a discount to reflect the delay in payment of dividend-equivalent cash payments that are made only upon vesting, which is generally
three
years from the grant date. We recognize the grant-date fair value of RSUs, less estimated forfeitures, as compensation expense ratably over the requisite service period, which is shorter than the vesting period if the employee is retirement eligible on the date of grant or will become retirement eligible before the end of the vesting period.
99
Stock Options
We generally recognize compensation cost for stock options ratably over the
three
-year vesting period. At
December 31, 2018
and
2017
, there were
1.8 million
(weighted average exercise price of
$79.76
) and
2.2 million
(weighted average exercise price of
$82.71
) stock options outstanding. All of the stock options outstanding are vested as of
December 31, 2018
and have a weighted average remaining contractual life of approximately
1.9 years
and an aggregate intrinsic value of
$326 million
. There were
0.4 million
(weighted average exercise price of
$94.63
) stock options exercised during
2018
. We have not granted stock options to employees since 2012. The intrinsic value of all stock options exercised was
$104 million
,
$139 million
, and
$172 million
in
2018
,
2017
and
2016
.
PSUs
In
2018
, we granted certain employees PSUs with an aggregate target award of approximately
0.1 million
shares of our common stock. The PSUs vest
three
years from the grant date based on continuous service, with the number of shares earned (
0%
to
200%
of the target award) depending upon the extent to which we achieve certain financial and market performance targets measured over the period from January 1,
2018
through December 31,
2020
. About half of the PSUs were valued at
$354.60
per PSU in a manner similar to RSUs mentioned above as the financial targets are based on our operating results. We recognize the grant-date fair value of these PSUs, less estimated forfeitures, as compensation expense ratably over the vesting period based on the number of awards expected to vest at each reporting date. The remaining PSUs were valued at
$420.75
per PSU using a Monte Carlo model as the performance target is related to our total shareholder return relative to our peer group. We recognize the grant-date fair value of these awards, less estimated forfeitures, as compensation expense ratably over the vesting period.
Note 14 –
Legal Proceedings, Commitments and Contingencies
We are a party to or have property subject to litigation and other proceedings that arise in the ordinary course of our business, including matters arising under provisions relating to the protection of the environment and are subject to contingencies related to certain businesses we previously owned. These types of matters could result in fines, penalties, compensatory or treble damages or non-monetary sanctions or relief. We believe the probability is remote that the outcome of each of these matters
, including the legal proceedings described below,
will have a material adverse effect on the corporation as a whole, notwithstanding that the unfavorable resolution of any matter may have a material effect on our net earnings in any particular interim reporting period.
Among the factors that we consider in this assessment are the nature of existing legal proceedings and claims, the asserted or possible damages or loss contingency (if estimable), the progress of the case, existing law and precedent, the opinions or views of legal counsel and other advisers, our experience in similar cases and the experience of other companies, the facts available to us at the time of assessment and how we intend to respond to the proceeding or claim. Our assessment of these factors may change over time as individual proceedings or claims progress.
Although we cannot predict the outcome of legal or other proceedings with certainty, where there is at least a reasonable possibility that a loss may have been incurred, GAAP requires us to disclose an estimate of the reasonably possible loss or range of loss or make a statement that such an estimate cannot be made. We follow a thorough process in which we seek to estimate the reasonably possible loss or range of loss, and only if we are unable to make such an estimate do we conclude and disclose that an estimate cannot be made. Accordingly, unless otherwise indicated below in our discussion of legal proceedings, a reasonably possible loss or range of loss associated with any individual legal proceeding cannot be estimated.
Legal Proceedings
As a result of our acquisition of Sikorsky, we assumed the defense of and any potential liability for
two
civil False Claims Act lawsuits pending in the U.S. District Court for the Eastern District of Wisconsin. In October 2014, the U.S. Government filed a complaint in intervention in the first suit, which was brought by qui tam relator Mary Patzer, a former Derco Aerospace (Derco) employee. In May 2017, the U.S. Government filed a complaint in intervention in the second suit, which was brought by qui tam relator Peter Cimma, a former Sikorsky Support Services, Inc. (SSSI) employee. In November 2017, the Court consolidated the cases into a single action for discovery and trial.
The U.S. Government alleges that Sikorsky and
two
of its wholly-owned subsidiaries, Derco and SSSI, violated the civil False Claims Act and the Truth in Negotiations Act in connection with a contract the U.S. Navy awarded to SSSI in June 2006 to support the Navy’s T-34 and T-44 fixed-wing turboprop training aircraft. SSSI subcontracted with Derco, primarily to procure and manage spare parts for the training aircraft. The U.S. Government contends that SSSI overbilled the Navy on the contract as the result of Derco’s use of prohibited cost-plus-percentage-of-cost pricing to add profit and overhead costs as a percentage of the price of the spare parts that Derco procured and then sold to SSSI. The U.S. Government also alleges that Derco’s claims to SSSI, SSSI’s claims to the Navy, and SSSI’s yearly Certificates of Final Indirect Costs from 2006 through 2012 were false and that SSSI
100
submitted inaccurate cost or pricing data in violation of the Truth in Negotiations Act for a sole-sourced, follow-on “bridge” contract. The U.S. Government’s complaints assert common law claims for breach of contract and unjust enrichment.
The U.S. Government further alleged violations of the Anti-Kickback Act and False Claims Act based on a monthly “chargeback,” through which SSSI billed Derco for the cost of certain SSSI personnel, allegedly in exchange for SSSI’s permitting a pricing arrangement that was “highly favorable” to Derco. On January 12, 2018, the Corporation filed a partial motion to dismiss intended to narrow the U.S. Government’s claims, including by seeking dismissal of the Anti-Kickback Act allegations. The Corporation also moved to dismiss Cimma as a party under the False Claims Act’s first-to-file rule, which permits only the first relator to recover in a pending case. The District Court granted these motions, in part, on July 20, 2018, dismissing the Government’s claims under the Anti-Kickback Act and dismissing Cimma as a party to the litigation.
Before the District Court’s July 20, 2018 ruling, the U.S. Government sought damages of approximately
$52 million
, subject to trebling, plus statutory penalties. We do not know what effect, if any, the ruling will have on the U.S. Government’s calculation of damages. We believe that we have legal and factual defenses to the U.S. Government’s remaining claims. Although we continue to evaluate our liability and exposure, we do not currently believe that it is probable that we will incur a material loss. If, contrary to our expectations, the U.S. Government prevails in this matter and proves damages at or near
$52 million
and is successful in having such damages trebled, the outcome could have an adverse effect on our results of operations in the period in which a liability is recognized and on our cash flows for the period in which any damages are paid.
On April 24, 2009, we filed a declaratory judgment action against the New York Metropolitan Transportation Authority and its Capital Construction Company (collectively, the MTA) asking the U.S. District Court for the Southern District of New York to find that the MTA is in material breach of our agreement based on the MTA’s failure to provide access to sites where work must be performed and the customer-furnished equipment necessary to complete the contract. The MTA filed an answer and counterclaim alleging that we breached the contract and subsequently terminated the contract for alleged default. The primary damages sought by the MTA are the costs to complete the contract and potential re-procurement costs. While we are unable to estimate the cost of another contractor to complete the contract and the costs of re-procurement, we note that our contract with the MTA had a total value of
$323 million
, of which
$241 million
was paid to us, and that the MTA is seeking damages of approximately
$190 million
. We dispute the MTA’s allegations and are defending against them. Additionally, following an investigation, our sureties on a performance bond related to this matter, who were represented by independent counsel, concluded that the MTA’s termination of the contract was improper. Finally, our declaratory judgment action was later amended to include claims for monetary damages against the MTA of approximately
$95 million
. This matter was taken under submission by the District Court in December 2014, after a five-week bench trial and the filing of post-trial pleadings by the parties. We continue to await a decision from the District Court. Although this matter relates to our former IS&GS business, we retained the litigation when we divested IS&GS in 2016.
As previously disclosed, on August 16, 2016, we divested our former IS&GS business segment to Leidos Holdings, Inc. (Leidos) in a transaction which resulted in IS&GS, now known as Leidos Innovations Corporation (Leidos Innovations), becoming a wholly owned subsidiary of Leidos (the Transaction). In the Transaction, Leidos acquired IS&GS’ interest in Mission Support Alliance, LLC (MSA), a joint venture that holds a prime contract to provide infrastructure support services at the Department of Energy’s Hanford facility and the liabilities related to Lockheed Martin’s participation in MSA. Included within the liabilities assumed were those associated with ongoing investigations by the Department of Energy and the Department of Justice (DOJ) related to work performed at Hanford (the Investigations). In the Transaction, Lockheed Martin transferred to Leidos a reserve slightly in excess of
$38 million
Lockheed Martin had established with respect to its potential liability and that of its affiliates arising out of the Investigations and agreed to indemnify Leidos Innovations with respect to the liabilities assumed for damages to Leidos Innovations and an enumerated list of subsidiaries of Leidos Innovations related to the Investigations for
100%
of amounts in excess of this reserve up to
$64 million
and
50%
of amounts in excess of
$64 million
.
In the Investigations, DOJ issued a number of Civil Investigative Demands to MSA, Lockheed Martin and the subsidiary of Lockheed Martin that performed information technology services for MSA, as well as current and former employees of each of these entities. The Investigations relate primarily to information technology services performed by a subsidiary of Lockheed Martin under a subcontract to MSA. DOJ recently stated that they are preparing to file a complaint alleging Civil False Claims Act violations. We cannot reasonably estimate our exposure at this time, but it is possible that a settlement or judgment against any of the parties being investigated could implicate Lockheed Martin’s indemnification obligations as described above. At present, in view of what we believe to be the strength of the defenses, Leidos’ assumption of the liabilities and structure of the indemnity, we do not believe it probable that we will incur a material loss.
Environmental Matters
We are involved in proceedings and potential proceedings relating to soil, sediment, surface water, and groundwater contamination, disposal of hazardous waste, and other environmental matters at several of our current or former facilities and at third-party sites where we have been designated as a potentially responsible party (PRP). A substantial portion of environmental
101
costs will be included in our net sales and cost of sales in future periods pursuant to U.S. Government regulations. At the time a liability is recorded for future environmental costs, we record a receivable for estimated future recovery considered probable through the pricing of products and services to agencies of the U.S. Government, regardless of the contract form (e.g., cost-reimbursable, fixed-price). We continually evaluate the recoverability of our environmental receivables by assessing, among other factors, U.S. Government regulations, our U.S. Government business base and contract mix, our history of receiving reimbursement of such costs, and efforts by some U.S. Government representatives to limit such reimbursement. We include the portion of those environmental costs expected to be allocated to our non-U.S. Government contracts, or that is determined not to be recoverable under U.S. Government contracts, in our cost of sales at the time the liability is established.
At
December 31, 2018
and
2017
, the aggregate amount of liabilities recorded relative to environmental matters was
$864 million
and
$920 million
, most of which are recorded in other noncurrent liabilities on our consolidated balance sheets. We have recorded receivables totaling
$750 million
and
$799 million
at
December 31, 2018
and
2017
, most of which are recorded in other noncurrent assets on our consolidated balance sheets, for the estimated future recovery of these costs, as we consider the recovery probable based on the factors previously mentioned. We project costs and recovery of costs over approximately
20 years
.
Environmental remediation activities usually span many years, which makes estimating liabilities a matter of judgment because of uncertainties with respect to assessing the extent of the contamination as well as such factors as changing remediation technologies and changing regulatory environmental standards. There are a number of former and present operating facilities that we are monitoring or investigating for potential future remediation. We perform quarterly reviews of the status of our environmental remediation sites and the related liabilities and receivables. Additionally, in our quarterly reviews, we consider these and other factors in estimating the timing and amount of any future costs that may be required for remediation activities, and record a liability when it is probable that a loss has occurred and the loss can be reasonably estimated. The amount of liability recorded is based on our estimate of the costs to be incurred for remediation at a particular site. We do not discount the recorded liabilities, as the amount and timing of future cash payments are not fixed or cannot be reliably determined. We reasonably cannot determine the extent of our financial exposure in all cases as, although a loss may be probable or reasonably possible, in some cases it is not possible at this time to estimate the loss or reasonably possible loss or range of loss.
We also pursue claims for recovery of costs incurred or for contribution to site cleanup costs against other PRPs, including the U.S. Government, and are conducting remediation activities under various consent decrees, orders, and agreements relating to soil, groundwater, sediment, or surface water contamination at certain sites of former or current operations. Under agreements related to certain sites in California and New York, the U.S. Government reimburses us an amount equal to a percentage, specific to each site, of expenditures for certain remediation activities in the U.S. Government’s capacity as a PRP under the Comprehensive Environmental Response, Compensation and Liability Act (CERCLA).
In addition to the proceedings and potential proceedings discussed above, California previously established a maximum level of the contaminant hexavalent chromium in drinking water of 10 parts per billion (ppb). This standard was successfully challenged by the California Manufacturers and Technology Association (CMTA) for failure to conduct the required economic feasibility analysis. In response to the court’s ruling, the State Water Resources Control Board (State Board), a branch of the California Environmental Protection Agency, withdrew the hexavalent chromium standard from the published regulations, leaving only the 50 ppb standard for total chromium. The State Board has indicated it will work to re-establish a hexavalent chromium standard. If the standard for hexavalent chromium is re‑established at 10 ppb or above, it will not have a material impact on our existing environmental remediation costs in California. Further, the U.S. Environmental Protection Agency (U.S. EPA) is considering whether to regulate hexavalent chromium.
California is also reevaluating its existing drinking water standard of 6 ppb for perchlorate, and the U.S. EPA is taking steps to regulate perchlorate in drinking water. If substantially lower standards are adopted, in either California or at the federal level for perchlorate or for hexavalent chromium, we expect a material increase in our estimates for environmental liabilities and the related assets for the portion of the increased costs that are probable of future recovery in the pricing of our products and services for the U.S. Government. The amount that would be allocable to our non-U.S. Government contracts or that is determined not to be recoverable under U.S. Government contracts would be expensed, which may have a material effect on our earnings in any particular interim reporting period.
Operating Leases
We rent certain equipment and facilities under operating leases. Certain major plant facilities and equipment are furnished by the U.S. Government under short-term or cancelable arrangements. Our total rental expense under operating leases was
$247 million
,
$169 million
and
$202 million
for
2018
,
2017
and
2016
. Future minimum lease commitments at
December 31, 2018
for long-term non-cancelable operating leases were
$1.3 billion
(
$305 million
in
2019
,
$184 million
in
2020
,
$147 million
in
2021
,
$114 million
in
2022
,
$88 million
in
2023
and
$459 million
in later years).
102
Letters of Credit, Surety Bonds and Third-Party Guarantees
We have entered into standby letters of credit and surety bonds issued on our behalf by financial institutions, and directly issued guarantees to third parties primarily relating to advances received from customers and the guarantee of future performance on certain contracts. Letters of credit and surety bonds generally are available for draw down in the event we do not perform. In some cases, we may guarantee the contractual performance of third parties such as venture partners.
We had total outstanding letters of credit, surety bonds and third-party guarantees aggregating
$3.6 billion
at
December 31, 2018
and
$3.3 billion
at
December 31, 2017
. Third-party guarantees do not include guarantees of subsidiaries and other consolidated entities.
At
December 31, 2018
and
2017
, third-party guarantees totaled
$850 million
and
$750 million
, of which approximately
65%
and
62%
related to guarantees of contractual performance of ventures to which we currently are or previously were a party. This amount represents our estimate of the maximum amount we would expect to incur upon the contractual non-performance of the venture, venture partners or divested businesses. Generally, we also have cross-indemnities in place that may enable us to recover amounts that may be paid on behalf of a venture partner.
In determining our exposures, we evaluate the reputation, performance on contractual obligations, technical capabilities and credit quality of our current and former venture partners and the transferee under novation agreements all of which include a guarantee as required by the FAR. There were no material amounts recorded in our financial statements related to third-party guarantees or novation agreements.
United Launch Alliance
In connection with our
50%
ownership interest of ULA, we and The Boeing Company (Boeing) were previously required to provide ULA an additional capital contribution if ULA was unable to make required payments under its inventory supply agreement with Boeing. In the fourth quarter of 2018, ULA fully satisfied its obligations under this inventory supply agreement and we no longer have any obligation to provide ULA an additional capital contribution under this agreement.
Our share of ULA’s net earnings are reported as equity in net earnings (losses) of equity investees in other income, net on our consolidated statements of earnings. Our investment in ULA totaled
$687 million
and
$794 million
at
December 31, 2018
and
2017
.
Note 15 –
Severance and Restructuring Charges
2018 Actions
During 2018, we recorded charges totaling
$96 million
(
$76 million
, or
$0.26
per share, after tax) related to certain severance and restructuring actions at our RMS business segment. These charges consist of
$75 million
of severance costs for the planned elimination of certain positions through either voluntary or involuntary actions and
$21 million
of asset impairment charges associated with our decision to consolidate certain operations. Upon separation, terminated employees will receive lump-sum severance payments primarily based on years of service, a majority of which we expect to pay by the end of 2019. These actions resulted from a strategic review of our RMS business segment and are intended to improve the efficiency of our operations and better align our organization and cost structure with changing economic conditions. We expect to recover a portion of the severance and restructuring charges through the pricing of our products and services to the U.S. Government and other customers in future periods, which will be included in RMS’ operating results. During 2018, we paid approximately
$33 million
in severance payments associated with these actions.
2016 Actions
During 2016, we recorded severance charges totaling approximately
$80 million
related to our Aeronautics business segment. The charges consisted of severance costs associated with the planned elimination of certain positions through either voluntary or involuntary actions. Upon separation, terminated employees receive lump-sum severance payments primarily based on years of service, the majority of which are expected to be paid over the next several quarters. As of the end of the first quarter of 2017, we had substantially paid the severance costs associated with these actions.
103
Note 16 –
Fair Value Measurements
Assets and liabilities measured and recorded at fair value on a recurring basis consisted of the following (in millions):
|
|
December 31, 2018
|
December 31, 2017
|
||||||||||||||||||||||
|
Total
|
|
Level 1
|
|
Level 2
|
|
Total
|
|
Level 1
|
|
Level 2
|
|
|||||||||||||
|
Assets
|
||||||||||||||||||||||||
|
Mutual funds
|
$
|
978
|
|
$
|
978
|
|
$
|
—
|
|
$
|
917
|
|
$
|
917
|
|
$
|
—
|
|
||||||
|
U.S. Government securities
|
105
|
|
—
|
|
105
|
|
116
|
|
—
|
|
116
|
|
||||||||||||
|
Other securities
|
144
|
|
28
|
|
116
|
|
209
|
|
39
|
|
170
|
|
||||||||||||
|
Derivatives
|
22
|
|
—
|
|
22
|
|
23
|
|
—
|
|
23
|
|
||||||||||||
|
Liabilities
|
||||||||||||||||||||||||
|
Derivatives
|
61
|
|
—
|
|
61
|
|
106
|
|
—
|
|
106
|
|
||||||||||||
|
Assets measured at NAV
|
||||||||||||||||||||||||
|
Other commingled funds
|
18
|
|
19
|
|
||||||||||||||||||||
Substantially all assets measured at fair value, other than derivatives, represent investments held in a separate trust to fund certain of our non-qualified deferred compensation plans and are recorded in other noncurrent assets on our consolidated balance sheets. The fair values of mutual funds and certain other securities are determined by reference to the quoted market price per unit in active markets multiplied by the number of units held without consideration of transaction costs. The fair values of U.S. Government and other securities are determined using pricing models that use observable inputs (e.g., interest rates and yield curves observable at commonly quoted intervals), bids provided by brokers or dealers or quoted prices of securities with similar characteristics. The fair values of derivative instruments, which consist of foreign currency exchange forward and interest rate swap contracts, primarily are determined based on the present value of future cash flows using model-derived valuations that use observable inputs such as interest rates, credit spreads and foreign currency exchange rates.
In addition to the financial instruments listed in the table above, we hold other financial instruments, including cash and cash equivalents, receivables, accounts payable and debt and commercial paper. The carrying amounts for cash and cash equivalents, receivables and accounts payable approximated their fair values. The estimated fair value of our outstanding debt and commercial paper was
$15.4 billion
and
$16.8 billion
at
December 31, 2018
and
2017
. The outstanding principal amount was
$15.3 billion
and
$15.5 billion
at
December 31, 2018
and
2017
, excluding
$1.2 billion
of unamortized discounts and issuance costs. The estimated fair values of our outstanding debt were determined based on quoted prices for similar instruments in active markets (Level 2).
104
Note 17 –
Summary of Quarterly Information (Unaudited)
A summary of quarterly information is as follows (in millions, except per share data):
|
|
2018 Quarters
|
|||||||||||||||
|
First
|
|
Second
(b)
|
|
Third
|
|
Fourth
(c)
|
|
|||||||||
|
Net sales
|
$
|
11,635
|
|
$
|
13,398
|
|
$
|
14,318
|
|
$
|
14,411
|
|
||||
|
Operating profit
|
1,725
|
|
1,795
|
|
1,963
|
|
1,851
|
|
||||||||
|
Net earnings
|
1,157
|
|
1,163
|
|
1,473
|
|
1,253
|
|
||||||||
|
Basic earnings per common share
(a)
|
4.05
|
|
4.08
|
|
5.18
|
|
4.43
|
|
||||||||
|
Diluted earnings per common share
(a)
|
4.02
|
|
4.05
|
|
5.14
|
|
4.39
|
|
||||||||
|
|
2017 Quarters
|
|||||||||||||||
|
First
(d)
|
|
Second
|
|
Third
|
|
Fourth
(e)(f)
|
|
|||||||||
|
Net sales
|
$
|
11,212
|
|
$
|
12,563
|
|
$
|
12,341
|
|
$
|
13,844
|
|
||||
|
Operating profit
|
1,402
|
|
1,716
|
|
1,677
|
|
1,949
|
|
||||||||
|
Net earnings (loss) from continuing operations
|
789
|
|
955
|
|
963
|
|
(817
|
)
|
||||||||
|
Net earnings from discontinued operations
|
—
|
|
—
|
|
—
|
|
73
|
|
||||||||
|
Net earnings (loss)
|
789
|
|
955
|
|
963
|
|
(744
|
)
|
||||||||
|
Earnings (loss) per common share from continuing operations
(a)
:
|
||||||||||||||||
|
Basic
|
2.72
|
|
3.31
|
|
3.35
|
|
(2.85
|
)
|
||||||||
|
Diluted
|
2.69
|
|
3.28
|
|
3.32
|
|
(2.85
|
)
|
||||||||
|
Earnings per common share from discontinued operations:
|
||||||||||||||||
|
Basic
|
—
|
|
—
|
|
—
|
|
0.25
|
|
||||||||
|
Diluted
|
—
|
|
—
|
|
—
|
|
0.25
|
|
||||||||
|
Basic earnings (loss) per common share
(a)
|
2.72
|
|
3.31
|
|
3.35
|
|
(2.60
|
)
|
||||||||
|
Diluted earnings (loss) per common share
(a)
|
2.69
|
|
3.28
|
|
3.32
|
|
(2.60
|
)
|
||||||||
|
(a)
|
The sum of the quarterly earnings per share amounts do not equal the earnings per share amounts included on our consolidated statements of earnings. The difference in
2018
relates to the timing of our share repurchases. In addition to the timing of our share repurchases, the difference in 2017 was primarily due to the net loss in the fourth quarter causing any potentially dilutive securities to have an anti-dilutive effect, which resulted in the weighted average shares outstanding for basic and dilutive earnings per share being equivalent.
|
|
(b)
|
The second quarter of 2018 includes a
$96 million
(
$76 million
or
$0.26
per share, after tax) severance and restructuring charge (see “
Note 15 – Severance and Restructuring Charges
”).
|
|
(c)
|
The fourth quarter of 2018 includes
a non-cash asset impairment charge of
$110 million
(
$83 million
, or
$0.29
per share, after tax)
related to our equity method investee
, AMMROC
(see “
Note 1 – Significant Accounting Policies
”).
|
|
(d)
|
The first quarter of 2017 includes a
$120 million
(
$74 million
or
$0.25
per share, after tax) charge on our EADGE-T program and a
$64 million
(
$40 million
or
$0.14
per share, after tax) charge, which represents our portion of a non-cash asset impairment charge recorded by our equity method investee, AMMROC (see “
Note 1 – Significant Accounting Policies
”).
|
|
(e)
|
In the fourth quarter of 2017, we recorded a net one-time tax charge of
$2.0 billion
(
$6.88
per share in the fourth quarter)
, substantially all of which was non-cash, primarily related to the estimated impact of the
Tax Act (see “
Note 9 – Income Taxes
”). In addition, the fourth quarter of 2017 includes a previously deferred non-cash gain of
$198 million
(
$122 million
or
$0.43
per share, after tax)
related to properties sold in 2015 as a result of completing our remaining obligations
.
|
|
(f)
|
The fourth quarter of 2017 includes a net gain of
$73 million
, reported in net earnings from discontinued operations, related to the 2016 divestiture of our former IS&GS business.
|
105
ITEM 9.
Changes in and Disagreements with Accountants on Accounting and Financial Disclosure
None.
ITEM 9A.
Controls and Procedures
Evaluation of Disclosure Controls and Procedures
We performed an evaluation of the effectiveness of our disclosure controls and procedures as of
December 31, 2018
. The evaluation was performed with the participation of senior management of each business segment and key corporate functions, under the supervision of the Chief Executive Officer (CEO) and Chief Financial Officer (CFO). Based on this evaluation, the CEO and CFO concluded that our disclosure controls and procedures were effective as of
December 31, 2018
.
Management’s Report on Internal Control Over Financial Reporting
Our management is responsible for establishing and maintaining adequate internal control over financial reporting. Our internal control system is designed to provide reasonable assurance to our management and Board of Directors regarding the reliability of financial reporting and the preparation of consolidated financial statements for external purposes.
Our management conducted an assessment of the effectiveness of our internal control over financial reporting as of
December 31, 2018
. This assessment was based on the criteria set forth by the Committee of Sponsoring Organizations of the Treadway Commission in Internal Control-Integrated Framework (2013 framework). Based on this assessment, management concluded that our internal control over financial reporting was effective as of
December 31, 2018
.
Our independent registered public accounting firm has issued a report on the effectiveness of our internal control over financial reporting, which is below.
Changes in Internal Control Over Financial Reporting
There were no changes in our internal control over financial reporting identified in connection with the evaluation required by Rules 13a-15(d) and 15d‑15(d) of the Exchange Act that occurred during the quarter ended
December 31, 2018
that materially affected, or are reasonably likely to materially affect, our internal control over financial reporting.
106
Report of Independent Registered Public Accounting Firm
Regarding Internal Control Over Financial Reporting
Board of Directors and Stockholders
Lockheed Martin Corporation
Opinion on Internal Control over Financial Reporting
We have audited Lockheed Martin Corporation’s internal control over financial reporting as of December 31, 2018, based on criteria established in
Internal Control-Integrated Framework
issued by the Committee of Sponsoring Organizations of the Treadway Commission (2013 framework) (the COSO criteria). In our opinion, Lockheed Martin Corporation (the Corporation) maintained, in all material respects, effective internal control over financial reporting as of December 31, 2018, based on the COSO criteria.
We also have audited, in accordance with the standards of the Public Company Accounting Oversight Board (United States) (PCAOB), the consolidated balance sheets of the Corporation as of December 31, 2018 and 2017, the related consolidated statements of earnings, comprehensive income, equity and cash flows for each of the three years in the period ended December 31, 2018, and the related notes and our report dated February 8, 2019 expressed an unqualified opinion thereon.
Basis for Opinion
The Corporation’s management is responsible for maintaining effective internal control over financial reporting and for its assessment of the effectiveness of internal control over financial reporting included in the accompanying Management’s Report on Internal Control Over Financial Reporting. Our responsibility is to express an opinion on the Corporation’s internal control over financial reporting based on our audit. We are a public accounting firm registered with the PCAOB and are required to be independent with respect to the Corporation in accordance with the U.S. federal securities laws and the applicable rules and regulations of the Securities and Exchange Commission and the PCAOB.
We conducted our audit in accordance with the standards of the PCAOB. Those standards require that we plan and perform the audit to obtain reasonable assurance about whether effective internal control over financial reporting was maintained in all material respects.
Our audit included obtaining an understanding of internal control over financial reporting, assessing the risk that a material weakness exists, testing and evaluating the design and operating effectiveness of internal control based on the assessed risk, and performing such other procedures as we considered necessary in the circumstances. We believe that our audit provides a reasonable basis for our opinion.
Definition and Limitations of Internal Control Over Financial Reporting
A company’s internal control over financial reporting is a process designed to provide reasonable assurance regarding the reliability of financial reporting and the preparation of financial statements for external purposes in accordance with generally accepted accounting principles. A company’s internal control over financial reporting includes those policies and procedures that (1) pertain to the maintenance of records that, in reasonable detail, accurately and fairly reflect the transactions and dispositions of the assets of the company; (2) provide reasonable assurance that transactions are recorded as necessary to permit preparation of financial statements in accordance with generally accepted accounting principles, and that receipts and expenditures of the company are being made only in accordance with authorizations of management and directors of the company; and (3) provide reasonable assurance regarding prevention or timely detection of unauthorized acquisition, use, or disposition of the company’s assets that could have a material effect on the financial statements.
Because of its inherent limitations, internal control over financial reporting may not prevent or detect misstatements. Also, projections of any evaluation of effectiveness to future periods are subject to the risk that controls may become inadequate because of changes in conditions, or that the degree of compliance with the policies or procedures may deteriorate.
/s/ Ernst & Young LLP
Tysons, Virginia
February 8, 2019
107
ITEM 9B.
Other Information
None.
PART III
ITEM 10. Directors, Executive Officers and Corporate Governance
The information concerning directors required by Item 401 of Regulation S-K is included under the caption “Proposal 1 - Election of Directors” in our definitive Proxy Statement to be filed pursuant to Regulation 14A (the
2019
Proxy Statement), and that information is incorporated by reference in this Annual Report on Form 10-K (Form 10-K). Information concerning executive officers required by Item 401 of Regulation S-K is located under Part I, Item 4(a) of this Form 10-K. The information required by Item 405 of Regulation S-K is included under the caption “Section 16(a) Beneficial Ownership Reporting Compliance” in the
2019
Proxy Statement, and that information is incorporated by reference in this Form 10-K. The information required by Items 407(c)(3), (d)(4) and (d)(5) of Regulation S-K is included under the captions “Committees of the Board of Directors” and “Audit Committee Report” in the
2019
Proxy Statement, and that information is incorporated by reference in this Form 10-K.
We have had a written code of ethics in place since our formation in 1995.
Setting the Standard
, our Code of Ethics and Business Conduct, applies to all our employees, including our principal executive officer, principal financial officer, and principal accounting officer and controller, and to members of our Board of Directors. A copy of our Code of Ethics and Business Conduct is available on our investor relations website: www.lockheedmartin.com/investor. Printed copies of our Code of Ethics and Business Conduct may be obtained, without charge, by contacting Investor Relations, Lockheed Martin Corporation, 6801 Rockledge Drive, Bethesda, Maryland 20817. We are required to disclose any change to, or waiver from, our Code of Ethics and Business Conduct for our Chief Executive Officer and senior financial officers. We use our website to disseminate this disclosure as permitted by applicable SEC rules.
ITEM 11.
Executive Compensation
The information required by Item 402 of Regulation S-K is included in the text and tables under the captions “Executive Compensation” and “Director Compensation” in the
2019
Proxy Statement and that information is incorporated by reference in this Annual Report on Form 10-K (Form 10-K). The information required by Item 407(e)(5) of Regulation S-K is included under the caption “Compensation Committee Report” in the
2019
Proxy Statement, and that information is furnished by incorporation by reference in this Form 10-K.
108
ITEM 12.
Security Ownership of Certain Beneficial Owners and Management and Related Stockholder Matters
The information required by Item 12 is included under the heading “Security Ownership of Management and Certain Beneficial Owners” in the
2019
Proxy Statement, and that information is incorporated by reference in this Annual Report on Form 10-K.
Equity Compensation Plan Information
The following table provides information about our equity compensation plans that authorize the issuance of shares of Lockheed Martin common stock to employees and directors. The information is provided as of
December 31, 2018
.
|
Plan category
|
Number of securities to be issued upon exercise of outstanding options, warrants and rights
(a)
|
Weighted-average exercise price of outstanding options, warrants and rights
(b)
|
Number of securities remaining available for future issuance under equity compensation plans (excluding securities reflected in column (a))
(c)
|
|||||||
|
Equity compensation plans approved by security holders
(1)
|
3,971,657
|
|
$
|
79.76
|
|
5,114,770
|
|
|||
|
Equity compensation plans not approved by security holders
(2)
|
883,972
|
|
—
|
|
2,481,953
|
|
||||
|
Total
|
4,855,629
|
|
$
|
79.76
|
|
7,596,723
|
|
|||
|
(1)
|
Column (a) includes, as of
December 31, 2018
: 1,411,295 shares that have been granted as restricted stock units (RSUs), 651,636 shares that could be earned pursuant to grants of performance stock units (PSUs) (assuming the maximum number of PSUs are earned and payable at the end of the three-year performance period) and 1,773,965 shares granted as options under the Lockheed Martin Corporation 2011 Incentive Performance Award Plan (2011 IPA Plan) or predecessor plans and 19,660 shares granted as options and 115,101 stock units payable in stock or cash under the Lockheed Martin Corporation Amended and Restated Directors Equity Plan (Directors Plan) or predecessor plans for non-employee directors. Column (c) includes, as of
December 31, 2018
, 4,706,450 shares available for future issuance under the 2011 IPA Plan as options, stock appreciation rights, restricted stock awards, RSUs or PSUs and 408,320 shares available for future issuance under the Directors Plan as stock options and stock units. Of the 408,320 shares available for grant under the Directors Plan on
December 31, 2018
, 5,172 are units issuable pursuant to grants made on January 31, 2019, which vest 50 percent on June 30 and 50 percent on December 31 following the grant date. Vested stock units are payable to directors upon their termination of service from our Board, except that directors who have satisfied the stock ownership guidelines may elect to have payment of awards made after January 1, 2018 beginning on March 31 following the vesting of the award. The weighted average price does not take into account shares issued pursuant to RSUs or PSUs.
|
|
(2)
|
The shares represent annual incentive bonuses and Long-Term Incentive Performance (LTIP) payments earned and voluntarily deferred by employees. The deferred amounts are payable under the Deferred Management Incentive Compensation Plan (DMICP). Deferred amounts are credited as phantom stock units at the closing price of our stock on the date the deferral is effective. Amounts equal to our dividend are credited as stock units at the time we pay a dividend. Following termination of employment, a number of shares of stock equal to the number of stock units credited to the employee’s DMICP account are distributed to the employee. There is no discount or value transfer on the stock distributed. Distributions may be made from newly issued shares or shares purchased on the open market. Historically, all distributions have come from shares held in a separate trust and, therefore, do not further dilute our common shares outstanding. As a result, these shares also were not considered in calculating the total weighted average exercise price in the table. Because the DMICP shares are outstanding, they should be included in the denominator (and not the numerator) of a dilution calculation.
|
109
ITEM 13.
Certain Relationships and Related Transactions and Director Independence
The information required by this Item 13 is included under the captions “Corporate Governance - Related Person Transaction Policy,” “Corporate Governance - Certain Relationships and Related Person Transactions of Directors, Executive Officers and 5 Percent Stockholders,” and “Corporate Governance - Director Independence” in the
2019
Proxy Statement, and that information is incorporated by reference in this Annual Report on Form 10-K.
ITEM 14.
Principal Accountant Fees and Services
The information required by this Item 14 is included under the caption “Proposal 2 - Ratification of Appointment of Independent Auditors” in the
2019
Proxy Statement, and that information is incorporated by reference in this Annual Report on Form 10-K.
110
PART IV
ITEM 15. Exhibits and Financial Statement Schedules
List of financial statements filed as part of this Form 10-K
The following financial statements of Lockheed Martin Corporation and consolidated subsidiaries are included in Item 8 of this Annual Report on Form 10-K (Form 10-K) at the page numbers referenced below:
|
|
Page
|
The report of Lockheed Martin Corporation’s independent registered public accounting firm with respect to the above-referenced financial statements and their report on internal control over financial reporting are included in Item 8 and Item 9A of this Form 10-K at the page numbers referenced below. Their consent appears as Exhibit 23 of this Form 10-K.
List of financial statement schedules filed as part of this Form 10-K
All schedules have been omitted because they are not applicable, not required or the information has been otherwise supplied in the consolidated financial statements or notes to consolidated financial statements.
Exhibits
|
2.1
|
||
|
2.2
|
||
|
2.3
|
||
|
2.4
|
||
|
3.1
|
||
|
3.2
|
||
111
|
4.1
|
||
|
4.2
|
||
|
4.3
|
||
|
4.4
|
||
|
4.5
|
||
|
4.6
|
||
|
4.7
|
||
|
See also Exhibits 3.1 and 3.2.
|
||
|
No instruments defining the rights of holders of long-term debt that is not registered are filed because the total amount of securities authorized under any such instrument does not exceed 10% of the total assets of Lockheed Martin Corporation on a consolidated basis. Lockheed Martin Corporation agrees to furnish a copy of such instruments to the SEC upon request.
|
||
|
10.1
|
||
|
10.2
|
||
|
10.3
|
||
|
10.4
|
||
|
10.5
|
||
|
10.6
|
||
|
10.7
|
||
|
10.8
|
||
|
10.9
|
||
112
|
10.10
|
||
|
10.11
|
||
|
10.12
|
||
|
10.13
|
||
|
10.14
|
||
|
10.15
|
||
|
10.16
|
||
|
10.17
|
||
|
10.18
|
||
|
10.19
|
||
|
10.20
|
||
|
10.21
|
||
|
10.22
|
||
|
10.23
|
||
|
10.24
|
||
|
10.25
|
||
|
10.26
|
||
|
10.27
|
||
|
10.28
|
||
113
|
10.29
|
||
|
10.30
|
||
|
21
|
||
|
23
|
||
|
24
|
||
|
31.1
|
||
|
31.2
|
||
|
32
|
||
|
101.INS
|
XBRL Instance Document
|
|
|
101.SCH
|
XBRL Taxonomy Extension Schema Document
|
|
|
101.CAL
|
XBRL Taxonomy Extension Calculation Linkbase Document
|
|
|
101.DEF
|
XBRL Taxonomy Extension Definition Linkbase Document
|
|
|
101.LAB
|
XBRL Taxonomy Extension Label Linkbase Document
|
|
|
101.PRE
|
XBRL Taxonomy Extension Presentation Linkbase Document
|
|
|
*
|
Exhibits
10.2
through
10.30
constitute management contracts or compensatory plans or arrangements.
|
ITEM 16.
Form 10-K Summary
None.
114
SIGNATURES
Pursuant to the requirements of Section 13 or 15(d) of the Securities Exchange Act of 1934, the registrant has duly caused this report to be signed on its behalf by the undersigned, thereunto duly authorized.
|
|
|
Lockheed Martin Corporation
|
||
|
(Registrant)
|
||||
|
Date: February 8, 2019
|
By:
|
|
/s/ Brian P. Colan
|
|
|
|
Brian P. Colan
|
|||
|
|
Vice President, Controller, and Chief Accounting Officer
|
|||
Pursuant to the requirements of the Securities Exchange Act of 1934, this report has been signed below by the following persons on behalf of the registrant and in the capacities and on the dates indicated.
|
Signatures
|
|
|
Titles
|
Date
|
||
|
/s/ Marillyn A. Hewson
|
|
|
Chairman, President and Chief Executive Officer (Principal Executive Officer)
|
February 8, 2019
|
||
|
Marillyn A. Hewson
|
||||||
|
/s/ Bruce L. Tanner
|
|
|
Executive Vice President and Chief Financial Officer (Principal Financial Officer)
|
February 8, 2019
|
||
|
Bruce L. Tanner
|
||||||
|
/s/ Brian P. Colan
|
|
|
Vice President, Controller, and Chief Accounting Officer (Principal Accounting Officer)
|
February 8, 2019
|
||
|
Brian P. Colan
|
||||||
|
*
|
|
|
Director
|
February 8, 2019
|
||
|
Daniel F. Akerson
|
||||||
|
*
|
|
|
Director
|
February 8, 2019
|
||
|
Nolan D. Archibald
|
||||||
|
*
|
|
|
Director
|
February 8, 2019
|
||
|
David B. Burritt
|
||||||
|
*
|
|
|
Director
|
February 8, 2019
|
||
|
Bruce A. Carlson
|
||||||
|
*
|
|
|
Director
|
February 8, 2019
|
||
|
James O. Ellis, Jr.
|
||||||
|
*
|
|
|
Director
|
February 8, 2019
|
||
|
Thomas J. Falk
|
||||||
|
*
|
|
|
Director
|
February 8, 2019
|
||
|
Ilene S. Gordon
|
||||||
|
*
|
|
|
Director
|
February 8, 2019
|
||
|
Vicki A. Hollub
|
||||||
|
*
|
|
|
Director
|
February 8, 2019
|
||
|
Jeh C. Johnson
|
||||||
|
*
|
|
|
Director
|
February 8, 2019
|
||
|
Joseph W. Ralston
|
||||||
|
*
|
|
|
Director
|
February 8, 2019
|
||
|
James D. Taiclet, Jr.
|
||||||
*By Maryanne R. Lavan pursuant to a Power of Attorney executed by the Directors listed above, which has been filed with this Annual Report on Form 10-K.
|
Date: February 8, 2019
|
By:
|
|
/s/ Maryanne R. Lavan
|
|
|
|
Maryanne R. Lavan
|
|||
|
|
Attorney-in-fact
|
|||
115
TABLE OF CONTENTS
Part IItem 1. BusinessNote 14 Legal Proceedings, Commitments and ContingenciesNote 1 Significant Accounting PoliciesItem 1A. Risk FactorsNote 11 Postretirement Benefit PlansItem 1B. Unresolved Staff CommentsItem 2. PropertiesItem 3. Legal ProceedingsItem 4. Mine Safety DisclosuresItem 4(a). Executive Officers Of The RegistrantPart IIItem 5. Market For Registrant S Common Equity, Related Stockholder Matters and Issuer Purchases Of Equity SecuritiesItem 6. Selected Financial DataNote 15 Severance and Restructuring ChargesNote 9 Income TaxesItem 7. Management S Discussion and Analysis Of Financial Condition and Results Of OperationsNote 3 Acquisition and DivestituresNote 8 Property, Plant and Equipment, NetNote 10 DebtItem 7A. Quantitative and Qualitative Disclosures About Market RiskNote 16 Fair Value MeasurementsItem 8. Financial Statements and Supplementary DataNote 2 Earnings Per ShareNote 4 Goodwill and Acquired IntangiblesNote 5 Information on Business SegmentsNote 6 Receivables, Net, Contract Assets and Contract LiabilitiesNote 7 InventoriesNote 12 Stockholders EquityNote 13 Stock-based CompensationNote 17 Summary Of Quarterly Information (unaudited)Item 9. Changes in and Disagreements with Accountants on Accounting and Financial DisclosureItem 9A. Controls and ProceduresItem 9B. Other InformationPart IIIItem 10. Directors, Executive Officers and Corporate GovernanceItem 11. Executive CompensationItem 12. Security Ownership Of Certain Beneficial Owners and Management and Related Stockholder MattersItem 13. Certain Relationships and Related Transactions and Director IndependenceItem 14. Principal Accountant Fees and ServicesPart IVItem 15. Exhibits and Financial Statement SchedulesItem 16. Form 10-k Summary